UNITED STATES SECURITIES AND EXCHANGE COMMISSION
Washington, D.C. 20549
FORM 10-K
(Mark One)
| X | ANNUAL REPORT PURSUANT TO SECTION 13 OR 15(d) OF THE SECURITIES EXCHANGE ACT OF 1934 |
| | For the Fiscal Year ended December 31, 20112014 |
OR
| | TRANSITION REPORT PURSUANT TO SECTION 13 OR 15(d) OF THE SECURITIES EXCHANGE ACT OF 1934 |
| | Commission File Number 1-7908 |
ADAMS RESOURCES & ENERGY, INC.
(Exact name of registrant as specified in its charter)
| Delaware | 74-1753147 | 17 South Briar Hollow Lane SteSuite 100 | 77027 |
| | | Houston, Texas | |
| (State of Incorporation) | (I.R.S. Employer Identification No.) | (Address of Principal executive offices) | (Zip Code) |
Registrant'sRegistrant’s telephone number, including area code: (713) 881-3600
Securities registered pursuant to Section 12(b) of the Act:
| Title of each class | Name of each exchange on which registered |
| Common Stock, $.10 Par Value | NYSE AmexMKT |
Indicate by check mark whether the Registrant is a well-known seasoned issuer, as defined in Rule 405 of the Securities Act. YES ___NO _X X___
Indicate by check mark whether the registrant is not required to file reports pursuant to Section 13 or Section 15(d) of the Exchange Act.YES ____ NO _X_
Indicate by check mark whether the Registrant (1) has filed all reports required to be filed by Section 13 or 15(d) of the Securities Exchange Act of 1934 during the preceding 12 months (or for such shorter period that the registrant was required to file such reports,reports) and (2) has been subject to the filing requirements for the past 90 days. YES_YES X_X NO ___
Indicate by check mark whether the registrant has submitted electronically and posted on its corporate Web site, if any, every Interactive Data File required to be submitted and posted pursuant to Rule 405 of Regulation S-T (§232.405 of this chapter) during the preceding 12 months (or for such shorter period that the registrant was required to submit and post such files). YES_
X_YES X NO ___
Indicate by check mark if disclosure of delinquent filers pursuant to Item 405 of Regulation S-K is not contained herein, and will not be contained, to the best of registrant’s knowledge, in definitive proxy or information statements incorporated by reference in Part III of this Form 10-K or any amendment to this Form 10-K. _X_ X
Indicate by check mark whether the registrant is a large accelerated filer, an accelerated filer, or a non-accelerated filer, or a smaller reporting company. See definition of “large‟large accelerated filer”, ‟accelerated filer” and “accelerated filer and smaller‟smaller reporting company” in Rule 12b-2 of the Exchange Act.
Large accelerated filer ____ Accelerated filer ____ X
Non-accelerated filer _X_____ Smaller reporting company _____
Indicate by check mark whether the registrant is a shell company (as defined by Rule 12b-2 of the Act).
YES ___NO _X_
The aggregate market value of the voting and non-voting common equity held by non-affiliates as of the close of business on June 30, 20112014 was $52,992,199$172,042,728 based on the closing price of $25.34$78.13 per one share of common stock as reported on the NYSE AMEX ExchangeMKT for such date. A total of 4,217,596 shares of Common Stock were outstanding at March 10, 2012.1, 2015.
DOCUMENTS INCORPORATED BY REFERENCE
Portions of the Proxy Statement for the Annual Meeting of Stockholders to be held May 16, 201214, 2015 are incorporated by reference into Part III of this report.
PART I
Forward-Looking Statements –Safe Harbor Provisions
This annual report on Form 10-K for the year ended December 31, 2014 contains certain forward-looking statements covered by the safe harbors provided under federal securities law and regulations. To the extent such statements are not recitations of historical fact, such forward-looking statements involve risks and uncertainties. In particular, statements under the captions (a) Production and Reserve Information, (b) Regulatory Status and Potential Environmental Liability, (c) Management’s Discussion and Analysis of Financial Condition and Results of Operations, (d) Critical Accounting Policies and Use of Estimates, (e) Quantitative and Qualitative Disclosures about Market Risk, (f) Income Taxes, (g) Concentration of Credit Risk, (h) Price Risk Management Activities, and (i) Commitments and Contingencies, among others, contain forward-looking statements. Where the Company expresses an expectation or belief regarding future results or events, such expression is made in good faith and believed to have a reasonable basis in fact. However, there can be no assurance that such expectation or belief will actually result or be achieved.
With the uncertainties of forward looking statements in mind, the reader should consider the risks discussed elsewhere in this report and other documents filed by the Company with the Securities and Exchange Commission (the ‟SEC”) from time to time and the important factors described under ‟Item 1A. Risk Factors” that could cause actual results to differ materially from those expressed in any forward-looking statement made by or on behalf of the Company.
Items 1 and 2. BUSINESS AND PROPERTIES
Forward-Looking Statements –Safe Harbor Provisions
This annual report on Form 10-K for the year ended December 31, 2011 contains certain forward-looking statements covered by the safe harbors provided under Federal securities law and regulations. To the extent such statements are not recitations of historical fact, forward-looking statements involve risks and uncertainties. In particular, statements under the captions (a) Production and Reserve Information, (b) Regulatory Status and Potential Environmental Liability, (c) Management’s Discussion and Analysis of Financial Condition and Results of Operations, (d) Critical Accounting Policies and Use of Estimates, (e) Quantitative and Qualitative Disclosures about Market Risk, (f) Income Taxes, (g) Concentration of Credit Risk, (h) Price Risk Management Activities, and (i) Commitments and Contingencies, among others, contain forward-looking statements. Where the Company expresses an expectation or belief regarding future results or events, such expression is made in good faith and believed to have a reasonable basis in fact. However, there can be no assurance that such expectation or belief will actually result or be achieved.
With the uncertainties of forward looking statements in mind, the reader should consider the risks discussed elsewhere in this report and other documents filed by the Company with the Securities and Exchange Commission from time to time and the important factors described under “Item 1A. Risk Factors” that could cause actual results to differ materially from those expressed in any forward-looking statement made by or on behalf of the Company.
Business Activities
Adams Resources & Energy, Inc. (“(‟ARE”), a Delaware corporation organized in 1973, and its subsidiaries (collectively, the "Company"‟Company”), are engaged in the business of marketing crude oil natural gas and petroleum products,marketing, tank truck transportation of liquid chemicals, and oil and gas exploration and production. Adams Resources & Energy, Inc. is a Delaware corporation organized in 1973. The Company’s headquarters are located in 23,450 square feet of office space located at 17 South Briar Hollow Lane Suite 100, Houston, Texas 77027 and the telephone number of that address is (713) 881-3600. The revenues, operating results and identifiable assets of each industry segment for the three years ended December 31, 20112014 are set forth in Note 8 of Notes(8) to the Consolidated Financial Statements included elsewhere herein.
Marketing Segment SubsidiariesSubsidiary
Gulfmark Energy, Inc. (“(‟Gulfmark”), a subsidiary of ARE, purchases crude oil and arranges sales and deliveries to refiners and other customers. Activity is concentrated primarily onshore in Texas and Louisiana with additional operations in Michigan and New Mexico. During 2011,North Dakota. Gulfmark purchased approximately 81,600 barrels per day of crude oil at the wellhead or lease level. Gulfmark also operates 148205 tractor-trailer rigs and maintains over 54121 pipeline inventory locations or injection stations. Gulfmark has the ability to barge oil from threefour oil storage facilities along the intercoastal waterway of Texas and Louisiana and maintains 180,000400,000 barrels of storage capacity at certain of the dock facilities in order to access waterborne markets for its products. During 2014, Gulfmark purchased approximately 117,100 barrels per day of crude oil at the field (wellhead) level. Gulfmark delivers physical supplies to refiner customers or enters into commodity exchange transactions with third parties when the cost of theto exchange is less than the alternate cost incurred in transportingto transport or storingstore the crude oil. During 2011,2014, Gulfmark had sales to fourtwo customers that comprised 18.220.3 percent 15.4 percent, 13.4 percent, and 11.314.0 percent, respectively, of total Company wide revenues. Management believes that a loss of any of these customers would not have a material adverse effect on the Company’s operations. See alsodiscussion under ‟Concentration of Credit Risk” in Note 3 of Notes(3) to Consolidated Financial Statements.
Adams Resources Marketing, Ltd. (“ARM”), a subsidiary of ARE, operates as a wholesale purchaser, distributor and marketer of natural gas. ARM’s focus is onOperating results for the purchase of natural gas at the producer level. During 2011, ARM purchased approximately 208,000 million british thermal units (“mmbtu’s”) of natural gas per day at the wellhead and pipeline pooling points. Business is concentrated among approximately 60 independent producers with the primary production areas being the Louisiana and Texas Gulf Coast and the offshore Gulf of Mexico region. ARM provides value added services to its customers by providing access to common carrier pipelines and handling daily volume balancing requirements as well as risk management services.
Ada Resources, Inc. (“Ada”), a subsidiary of ARE, marketed branded and unbranded refined petroleum products such as motor fuels and lubricants. In February 2012, the Company sold substantially all equipment, inventory and contracts associated with this operation. The company retained Ada’s former distribution and warehousing facility located on 5.5 Company-owned acres in Houston, Texas. See Note (10) of Notes to Financial Statements for additional discussion.
Operating resultsmarketing segment are sensitive to a number of factors. Such factors include commodity location, grades of product, individual customer demand for grades or location of product, localized market price structures, availability of transportation facilities, actual delivery volumes that vary from expected quantities, and the timing and costs to deliver the commodity to the customer.
Transportation Segment Subsidiary
Service Transport Company (“(‟STC”), a subsidiary of ARE, transports liquid chemicals on a "for hire"‟for hire” basis throughout the continental United States and Canada. Transportation service is provided to over 400 customers under multiple load contracts in addition to loads covered under STC’s standard price list. Pursuant to regulatory requirements, STC holds a Hazardous Materials Certificate of Registration issued by the United States.States Department of Transportation (“(‟DOT”). STC operates 285308 truck tractors of which 12285 are Company owned with 23 independent owner-operator unitsunits. The Company also owns and maintains 447operates 509 tank trailers. In addition, STC maintainsoperates truck terminals in Houston, Corpus Christi, and Nederland, Texas as well as Baton Rouge (St. Gabriel), Louisiana and Mobile (Saraland), Alabama. Transportation operations are headquartered at a terminal facility situated on 22 Company-owned acres in Houston, Texas. This property includes maintenance facilities, an office building, tank wash rack facilities and a water treatment system. The St. Gabriel, Louisiana terminal is situated on 11.5 Company-owned acres and includes an office building, maintenance bays and tank cleaning facilities.
STC is compliant with International Organization for Standardization (“(‟ISO”) 9001:2000 Standard. The scope of this Quality System Certificate covers the carriage of bulk liquids throughout STC’s area of operations as well as the tank trailer cleaning facilities and equipment maintenance. STC’s quality management process is one of its major assets. The practice of using statistical process control covering safety, on-time performance and customer satisfaction aids continuous improvement in all areas of quality service. In addition to its ISO 9001:2000 practices, the American Chemistry Council recognizes STC as a Responsible CareÓ Partner. Responsible Care Partners serve the chemical industry and implement and monitor the seven Codes of Management Practices. The seven codes address compliance and continuing improvement in (1) Community Awareness and Emergency Response, (2) Pollution Prevention, (3) Process Safety, (4) Distribution, (5) Employee Health and Safety, (6) Product Stewardship, and (7) Security.
Oil and Gas Segment Subsidiary
Adams Resources Exploration Corporation (“(‟AREC”), a subsidiary of ARE, is actively engaged in the exploration and development of domestic oil and natural gas properties primarily in Texas and the south central region of the United States. AREC’s offices are maintained in Houston and the Company holds an interest in 405514 producing wells of which 4129 are Company operated.
Producing Wells--The following table sets forth the Company'sCompany’s gross and net productive wells as of December 31, 2011.2014. Gross wells are the total number of wells in which the Company has an interest, while net wells are the sum of the fractional interests owned.
| | | | | | | | | | |
| | | | | | | | | | | | | | | | | | | |
| Texas | | | 247 | | | | 8.11 | | | | 149 | | | | 11.46 | | | | 396 | | | | 19.57 | |
| Other | | | 93 | | | | 3.42 | | | | 25 | | | | .61 | | | | 118 | | | | 4.03 | |
| | | | 340 | | | | 11.53 | | | | 174 | | | | 12.07 | | | | 514 | | | | 23.60 | |
| | | | | | | | | | |
| | | | | | | | | | | | | | | | | | | |
| Texas | | | 99 | | | | 9.80 | | | | 158 | | | | 12.35 | | | | 257 | | | | 22.15 | |
| Other | | | 94 | | | | 4.32 | | | | 54 | | | | 5.42 | | | | 148 | | | | 9.74 | |
| | | | 193 | | | | 14.12 | | | | 212 | | | | 17.77 | | | | 405 | | | | 31.89 | |
Acreage--The following table sets forth the Company'sCompany’s gross and net developed and undeveloped acreage as of December 31, 2011.2014. Gross acreage represents the Company’s direct ownership and net acreage represents the sum of the fractional interests owned. The Company’s developed acreage is held by current production while undeveloped acreage is held by oil and gas leases with various remaining terms, production from six months to three years.non-owned shallow wells, or other contractual provisions delaying termination of leasehold rights. The Company’s ownership in undeveloped acreage is substantially all in the form of a non-operated minority interest. As such, the Company relies on the third party operator to manage the lease holdings.
| | | | | | | | | | | | | |
| | | | | | | | | | | | | | | | | | | | | | | | | |
| Texas | | | 122,884 | | | | 10,924 | | | | 217,802 | | | | 17,849 | | | | 128,780 | | | | 10,556 | | | | 118,731 | | | | 13,911 | |
| Kansas | | | 150 | | | | 15 | | | | 18,157 | | | | 1,815 | | | | 1,018 | | | | 51 | | | | 14,784 | | | | 739 | |
| North Dakota | | | | - | | | | - | | | | 13,000 | | | | 1,300 | |
| Other | | | 8,202 | | | | 1,072 | | | | 1,701 | | | | 675 | | | | 3,478 | | | | 339 | | | | 6,065 | | | | 2,120 | |
| | | | 131,236 | | | | 12,011 | | | | 237,660 | | | | 20,339 | | | | 133,276 | | | | 10,946 | | | | 152,580 | | | | 18,070 | |
Drilling Activity--The following table sets forth the Company'sCompany’s drilling activity for each of the three years ended December 31, 2011.2014. All drilling activity was onshore in Texas, Louisiana Arkansas and Kansas.
| | | | | | | | | | | | | | | | | | | |
| | | Gross | | | Net | | | Gross | | | Net | | | Gross | | | Net | | | Gross | | | Net | | | Gross | | | Net | | | Gross | | | Net | |
| Exploratory wells drilled | | | | | | | | | | | | | | | | | | | | | | | | | | | | | | | | | | | | |
| - Productive | | | - | | | | - | | | | - | | | | - | | | | 2 | | | | .10 | | | | - | | | | - | | | | - | | | | - | | | | - | | | | - | |
| - Dry | | | 8 | | | | .87 | | | | 12 | | | | .67 | | | | 7 | | | | .94 | | | | 4 | | | | .40 | | | | 3 | | | | .38 | | | | - | | | | - | |
| | | | | | | | | | | | | | | | | | | | | | | | | | | | | | | | | | | | | | | | | | | | | | | | | |
| Development wells drilled | | | | | | | | | | | | | | | | | | | | | | | | | | | | | | | | | | | | | | | | | | | | | | | | |
| - Productive | | | 75 | | | | 2.10 | | | | 41 | | | | 1.77 | | | | 24 | | | | 1.35 | | | | 46 | | | | .83 | | | | 77 | | | | 1.40 | | | | 109 | | | | 2.40 | |
| - Dry | | | 3 | | | | .18 | | | | - | | | | - | | | | 2 | | | | .10 | | | | 3 | | | | .43 | | | | - | | | | - | | | | - | | | | - | |
| | | | 86 | | | | 3.15 | | | | 53 | | | | 2.44 | | | | 35 | | | | 2.49 | | | | 53 | | | | 1.66 | | | | 80 | | | | 1.78 | | | | 109 | | | | 2.40 | |
Production and Reserve Information--The Company'sCompany’s estimated net quantities of proved oil and natural gas reserves and the standardized measure of discounted future net cash flows, calculated at a 10% discount rate, for the three years ended December 31, 2011,2014, are presented in the table below (in thousands):
| | | | | | | |
| | | | | | | | | | | | | | | | | | | |
| Crude oil (thousands of barrels) | | | 292 | | | | 267 | | | | 242 | | | | 318 | | | | 368 | | | | 307 | |
| Natural gas (thousands of mcf) | | | 9,661 | | | | 7,794 | | | | 7,248 | | | | 5,611 | | | | 6,286 | | | | 8,837 | |
| Standardized measure of discounted future | | | | | | | | | | | | | |
| net cash flows from oil and natural gas reserves | | $ | 20,931 | | | $ | 16,672 | | | $ | 9,305 | | |
| Standardized measure of oil and gas reserves | | | $ | 15,744 | | | $ | 17,836 | | | $ | 16,355 | |
The estimated value of oil and natural gas reserves and future net revenues from oil and natural gas reserves was made by the Company'sCompany’s independent petroleum engineers. The reserve value estimates provided at each of December 31, 2011, 20102014, 2013 and 20092012 are based on market prices of $95.85, $76.14$89.60, $94.99 and $58.43$93.85 per barrel for crude oil and $5.42, $4.69 $5.26 and $4.05$3.51 per mcfthousand cubic feet (‟mcf”) for natural gas, respectively. For 2011 and 2010, suchSuch prices were based on the unweighted arithmetic average of the prices in effect on the first day of the month for each month of the respective twelve month periods as required by Security and Exchange Commission (“SEC”)SEC regulations. For 2009,The prices reported in the price reflects the market price on December 31, 2009. The price reportedreserve disclosures for natural gas includesinclude the value of associated natural gas liquids. Hydrocarbon prices declined significantly during the fourth quarter of 2014. Realized domestic crude oil prices averaged in the $54 per barrel range during the month of December with additional price declines continuing into 2015.
Reserve estimates are based on many subjective factors. The accuracy of reservethese estimates depends on the quantity and quality of geological data, production performance data, and reservoir engineering data, the pricing assumptions utilized as well as the skill and judgment of petroleum engineers in interpreting such data. The process of estimating reserves requires frequent revision of estimates as additional information is made available through drilling, testing, reservoir studies and acquiring historical pressure and production data. In addition, the discounted present value of estimated future net revenues should not be construed as the fair market value of oil and natural gas producing properties. Such estimatesreserve valuations do not necessarily portray a realistic assessment of current value or future performance of such properties. Such revenueThese calculations are based on estimates as to the timing of oil and natural gas production, and there is no assurance that the actual timing of production will conform to or approximate such estimates.calculations. Also, certain assumptions have been made with respect to pricing. The estimates assume prices will remain constant from the date of the engineer's estimates,engineer’s assessment, except for changes reflected under natural gas sales contracts. There can be no assurance that actual future prices will not vary as industry conditions, governmental regulation and other factors impact the market price for oil and natural gas.
The Company'sCompany’s net oil and natural gas production for the three years ended December 31, 20112014 was as follows:
| Years Ended | | Crude Oil | | | Natural | |
December 31, | | (barrels) | | | Gas (mcf) | |
| 2011 | | | 61,500 | | | | 1,895,000 | |
| 2010 | | | 54,000 | | | | 1,365,000 | |
| 2009 | | | 49,500 | | | | 1,304,000 | |
| Years Ended | | Crude Oil | | | Natural | |
December 31, | | (barrels) | | | Gas (mcf) | |
| 2014 | | | 127,300 | | | | 1,133,000 | |
| 2013 | | | 102,300 | | | | 1,608,000 | |
| 2012 | | | 98,100 | | | | 2,608,000 | |
Certain financial information relating to the Company'sCompany’s crude oil and natural gas exploration division revenues and earnings is summarized as follows:
| | | | | | | |
| | | | | | | | | | | | | | | | | | | |
| Average oil and condensate | | | | | | | | | | | | | | | | | | |
sales price per barrel | | $ | 93.23 | | | $ | 77.09 | | | $ | 58.10 | | | $ | 63.64 | | | $ | 79.15 | | | $ | 84.39 | |
| Average natural gas | | | | | | | | | | | | | | | | | | | | | | | | |
| sales price per mcf | | $ | 4.39 | | | $ | 5.02 | | | $ | 4.43 | | | $ | 4.65 | | | $ | 3.75 | | | $ | 2.94 | |
| Average production cost, per equivalent | | | | | | | | | | | | | | | | | | | | | | | | |
| barrel, charged to expense | | $ | 16.79 | | | $ | 13.99 | | | $ | 13.25 | | | $ | 21.42 | | | $ | 15.54 | | | $ | 13.14 | |
(1) Average oil and condensate prices include the value of associated natural gas liquids.
The Company has had no reports to federal authorities or agencies of estimated oil and gas reserves. The Company is not obligated to provide any fixed and determinable quantities of oil or gas in the future under existing contracts or agreements associated with its oil and gas exploration and production segment.
Environmental Compliance and Regulation
The Company is subject to an extensive variety of evolving United States federal, state and local laws, rules and regulations governing the storage, transportation, manufacture, use, discharge, release and disposal of product and contaminants into the environment, or otherwise relating to the protection of the environment. Presented below is a non-exclusive listing of the environmental laws that potentially impact the Company’s activities.
| - | The Solid Waste Disposal Act, as amended by the Resource Conservation and Recovery Act of 1976, as amended. |
| - | Comprehensive Environmental Response, Compensation and Liability Act of 1980 ("CERCLA"(‟CERCLA” or "Superfund"‟Superfund”), as amended. |
| - | The Clean Water Act of 1972, as amended. |
| - | Federal Oil Pollution Act of 1990, as amended. |
| - | The Clean Air Act of 1970, as amended. |
| - | The Toxic Substances Control Act of 1976, as amended. |
| - | The Emergency Planning and Community Right-to-Know Act. |
| - | The Occupational Safety and Health Act of 1970, as amended. |
| - | Texas Solid Waste Disposal Act. |
| - | Texas Oil Spill Prevention and Response Act of 1991, as amended. |
Railroad Commission of Texas (“(‟RRC”)--The RRC regulates, among other things, the drilling and operation of oil and natural gas wells, the operation of oil and gas pipelines, the disposal of oil and natural gas production wastes, and certain storage of unrefined oil and gas. RRC regulations govern the generation, management and disposal of waste from such oil and natural gas operations and provide for the clean up of contamination from oil and natural gas operations. The RRC has promulgated regulations that provide for civil and/or criminal penalties and/or injunctive relief for violations of the RRC regulations.
Louisiana Office of Conservation--This agency has primary statutory responsibility for regulation and conservation of oil, gas, and other natural resources in the State of Louisiana. Their objectives are to (i) regulate the exploration and production of oil, natural gas and other hydrocarbons;hydrocarbons, (ii) control and allocate energy supplies and distribution thereof, and (iii) protect public safety and the State’s environment from oilfield waste, including the regulation of underground injection and disposal practices.
State and Local Government Regulation--Many states are authorized by the United States Environmental Protection Agency (“(‟EPA”) to enforce regulations promulgated under various federal statutes. In addition, there are numerous other state and local authorities that regulate the environment, some of which impose more stringent environmental standards than federal laws and regulations. The penalties for violations of state law vary, but typically include injunctive relief and recovery of damages for injury to air, water or property andas well as fines for non-compliance.
Oil and Gas Operations--The Company'sCompany’s oil and gas drilling and production activities are subject to laws and regulations relating to environmental quality and pollution control. One aspect of the Company'sCompany’s oil and gas operation is the disposal of used drilling fluids, saltwater, and crude oil sediments. In addition, low-level naturally occurring radiation may, at times, occur with the production of crude oil and natural gas. The Company'sCompany’s policy is to comply with environmental regulations and industry standards. Environmental compliance has become more stringent and the Company, from time to time, may be required to remediate past practices. Management believes that such required remediation in the future, if any, will not have a material adverse impact on the Company'sCompany’s financial position or results of operations.
All states in which the Company owns producing oil and gas properties have statutory provisions regulating the production and sale of crude oil and natural gas. Regulations typically require permits for the drilling of wells and regulate the spacing of wells, the prevention of waste, protection of correlative rights, the rate of production, prevention and clean-up of pollution, and other matters.
Marketing OperationsTrucking Activities--The Company'sCompany’s marketing facilities are subject to a number of state and federal environmental statutes and regulations, including the regulation of underground fuel storage tanks. While the Company has not owned or operated underground tanks for more than 10 years, historically the Company was an owner and operator of underground storage tanks. The EPA's Office of Underground Tanks and applicable state laws establish regulations requiring owners or operators of underground fuel tanks to demonstrate evidence of financial responsibility for the costs of corrective action and the compensation of third parties for bodily injury and property damage caused by sudden and non-sudden accidental releases arising from operating underground tanks. In addition, the EPA requires the installation of leak detection devices and stringent monitoring of the ongoing condition of underground tanks. Should leakage develop in an underground tank, the operator is obligated for clean up costs. During the period when the Company operated underground tanks, it secured insurance covering both third party liability and clean up costs.
Transportation Operations--The Company's tanktransportation businesses operate truck operations are conductedfleets pursuant to authority of the DOT and various state regulatory authorities. The Company's transportationTrucking operations must also be conducted in accordance with various laws relating to pollution and environmental control. Interstate motor carrier operations are subject tocontrol as well as safety requirements prescribed by states and the DOT. Matters such as weight and dimension of equipment are also subject to federal and state regulations. DOTThese regulations also require mandatory drug testing of drivers and require certain tests for alcohol levels in drivers and other safety personnel. The trucking industry is subject to possible regulatory and legislative changes such as increasingly stringent environmental regulationsrequirements or limits on vehicle weight and size. Regulatory change may affect the economics of the industry by requiring changes in operating practices or by changing the demand for private and common or contract carrier services or the cost of providing truckload services. In addition, the Company’s tank wash facilities are subject to increasingly stringent local, state and federal environmental regulations.
The Company has implemented security procedures for drivers and terminal facilities. Satellite tracking transponders installed in the power units are used to communicate en route emergencies to the Company and to maintain constant information as to the unit’s location. If necessary, the Company’s terminal personnel will notify local law enforcement agencies. In addition, the Company is able to advise a customer of the status and location of their loads. Remote cameras and better lighting coverage in the staging and parking areas have augmented terminal security.
Regulatory Status and Potential Environmental Liability--The operations and facilities of the Company are subject to numerous federal, state, and local environmental laws and regulations including those described above, as well as associated permitting and licensing requirements. The Company regards compliance with applicable environmental regulations as a critical component of its overall operation, and devotes significant attention to providing quality service and products to its customers, protecting the health and safety of its employees, and protecting the Company’s facilities from damage. Management believes the Company has obtained or applied for all permits and approvals required under existing environmental laws and regulations to operate its current business. Management has reported that the Company is not subject to any pending or threatened environmental litigation or enforcement actions which could materially and adversely affect the Company'sCompany’s business. The Company has, where appropriate, implemented operating procedures at each of its facilities designed to assure compliance with environmental laws and regulation. However, given the nature of the Company’s business, the Company is subject to environmental risks and the possibility remains that the Company'sCompany’s ownership of its facilities and its operations and activities could result in civil or criminal enforcement and public as well as private actions against the Company, which may necessitate or generate mandatory clean up activities, revocation of required permits or licenses, denial of application for future permits, and/or significant fines, penalties or damages, any and all of which could have a material adverse effect on the Company. See “Item 1A. Risk Factors – Environmental liabilities and environmental regulations may have an adverse effect on the Company.” At December 31, 2011,2014, the Company is unaware of any unresolved environmental issues for which additional accounting accruals are necessary.
Employees
At December 31, 20112014, the Company employed 780870 persons, 1514 of whom were employed in the exploration and production of oil and gas, 345401 in the marketing of crude oil, natural gas and petroleum products, 399436 in transportation operations, and 2119 in administrative capacities. None of the Company'sCompany’s employees are represented by a union. Management believes its employee relations are satisfactory.
Federal and State Taxation
The Company is subject to the provisions of the Internal Revenue Code of 1986, as amended (the “Code”‟Code”). In accordance with the Code, the Company computes its income tax provision based on a 35 percent tax rate. The Company'sCompany’s operations are, in large part, conducted within the State of Texas. Texas operations are subject to a one-half percent state tax on its revenues net of cost of goods sold as defined by the state. Oil and gas activities are also subject to state and local income, severance, property and other taxes. Management believes the Company is currently in compliance with all federal and state tax regulations.
On February 27, 2012, the Company completed the sale of certain assets previously associated with the Company’s refined products marketing segment. Assets sold included equipment, tanks and trucks, as well as all refined petroleum product inventories and substantially all supplier and customer contracts associated with this business segment. With the consummation of this transaction, the Company exited the refined petroleum products marketing business. The Company’s former refined petroleum products operation was active in the distribution and sale of lube oils and motor fuels such as gasoline and diesel. Sales proceeds totaled $2,000,000 plus the market value of inventories. The Company will continue to collect any outstanding accounts receivable and satisfy all account payable obligations associated with this business. See discussion under “Subsequent Event” in Note 10 to the Consolidated Financial Statements.
Available Information
The Company is required to file periodic reports as well as other information with the Securities and Exchange Commission (“SEC”)SEC within established deadlines. Any document filed with the SEC may be viewed or copied at the SEC’s Public Reference Room at 100 F Street, N.E., Washington, D.C. 20549. Additional information regarding the Public Reference Room can be obtained by calling the SEC at (800) SEC-0330. The Company’s SEC filings are also available to the public through the SEC’s web site located at http://www.sec.gov.
The Company maintains a corporate website at http://www.adamsresources.com, on which investors may access free of charge the annual report on Form 10-K, quarterly reports on Form 10-Q, current reports on Form 8-K, and amendments to those reports as soon as is reasonably practicable after filing or furnishing such material with the SEC. Additionally, the Company has adopted and posted on its website a Code of Business Ethics designed to reflect requirements of the Sarbanes-Oxley Act of 2002, NYSE AmexMKT Exchange rules and other applicable laws, rules and regulations. The Code of Business Ethics applies to all of the Company’s directors, officers and employees. Any amendment to the Code of Business Ethics will be posted promptly on the Company’s website. The information contained on or accessible from the Company’s website does not constitute a part of this report and is not incorporated by reference herein. The Company will provide a printed copy of any of these aforementioned documents free of charge upon request by calling ARE at (713)-881-3600 881-3600 or by writing to:
Adams Resources & Energy, Inc.
ATTN: Richard B. Abshire
17 South Briar Hollow Lane, SteSuite 100
Houston, Texas 77027
Item 1A. RISK FACTORS
Economic developments could damage operations and materially reduce profitability and cash flows.
Potential disruptions in the credit markets and concerns about global economic growth could have a significant adverse impact on global financial markets and commodity prices. Such factors could contribute to a decline in the Company’s stock price and corresponding market capitalization. Should commodity prices experience a period of rapid decline, future earnings will be reduced. Since the Company has noneither bank debt obligations nor covenants tied to its stock price, potential declines in the Company’s stock price do not affect the Company’s liquidity or overall financial condition. Should the capital and credit markets experience volatility and the availability of funds remainsbecome limited, the Company’s customers and suppliers may incur increased costs associated with issuing commercial paper and/or other debt instruments and this, in turn, could adversely affect the Company’s ability to secure supply and make profitable sales.
General economic conditions could reduce demand for chemical based trucking services.
Customer demand for the Company’s products and services is substantially dependent upon the general economic conditions for the United States which are cyclical in nature. In particular, demand for liquid chemical truck transportation services is dependent on activity within the petrochemical sector of the U. S.U.S. economy. Chemical sector demand typically varies with the housing and auto markets as well as the relative strength of the U. S.U.S. dollar to foreign currencies. A relatively strong U.S. dollar exchange rate may be adverse to the Company’s transportation operation since it tends to suppress export demand for petrochemicals which is adverse to the Company’s transportation operation.petrochemicals. Conversely, a weak U. S.U.S. dollar exchange rate tends to stimulate export demand for petrochemicals.
The Company’s business is dependent on the ability to obtain trade and other credit.
The Company’s future development and growth depends, in part, on its ability to successfully obtain credit from suppliers and other parties. Trade credit arrangements are relied upon as a significant source of liquidity for capital requirements not satisfied by operating cash flow.
Should global financial markets and economic conditions disrupt and reduce stability in general, and the solvency of creditors specifically, the availability of funding from credit markets would be reduced as many lenders and institutional investors would enact tighter lending standards, refuse to refinance existing debt on terms similar to current debt or, in some cases, cease to provide funding to borrowers. These issues coupled with weak economic conditions would make it more difficult for the Company and its suppliers and customers to obtain funding.
If the Company is unable to obtain trade or other forms of credit on reasonable and competitive terms, itsthe ability to continue its marketing and exploration businesses, pursue improvements, and continue future growth will be limited. There is no assurance that the Company will be able to maintain future credit arrangements on commercially reasonable terms.
The financial soundness of customers could affect the Company’s business and operating results
Constraints in the financial markets and other macro-economic challenges that might affect the economy of the United States and other parts of the world could cause the Company’s customers to experience cash flow concerns. As a result, if customers’ operating and financial performance deteriorates, or if they are unable to make scheduled payments or obtain credit, customers would not be able to pay, or may delay payment of, accounts receivable owed to the Company. Any inability of current and/or potential customers to pay for services may adversely affect the Company’s financial condition and results of operations.
Counterparty credit default could have an adverse effect on the Company.
The Company’s revenues are generated under contracts with various counterparties. Resultscounterparties and results of operations wouldcould be adversely affected as a result ofby non-performance by any of these counterparties of their contractual obligations under the various contracts. A counterparty’s default or non-performance could be caused by factors beyond the Company’s control. A default could occur as a result of circumstances relating directly to the counterparty, or due to circumstances caused by other market participants having a direct or indirect relationship with such counterparty. The Company seeks to mitigate the risk of default by evaluating the financial strength of potential counterparties; however, despite mitigation efforts, contractual defaults by counterparties may occur from time to time.
Escalating diesel fuel prices could have an adverse effect on the Company
As an integral part of the Company’s marketing and transportation businesses, the Company operates a fleet of over 400approximately 500 truck-tractors and diesel fuel costs are a significant component of operating expense. Such costs generally fluctuate with increasing and decreasing world crude oil prices. While the Company attempts to recoup rising diesel fuel costs through the pricing of its services, to the extent such costs escalate, operating earnings will generally be adversely affected.
Fluctuations in oil and gas prices could have an adverse effect on the Company.
The Company’s future financial condition, revenues, results of operations and future rate of growth are materially affected by oil and natural gas prices. Oil and natural gas prices that historically have been volatile and are likely to continue to be volatile in the future. Moreover, oil and natural gas prices depend on factors outside the control of the Company. These factors include:
| · | supply and demand for oil and gas and expectations regarding supply and demand; |
| · | political conditions in other oil-producing countries, including the possibility of insurgency or war in such areas; |
| · | economic conditions in the United States and worldwide; |
| · | governmental regulations and taxation; |
| · | impact of energy conservation efforts; |
| · | the price and availability of alternative fuel sources; |
| · | availability of local, interstate and intrastate transportation systems; and |
Revenues are generated under contracts that must be renegotiated periodically.
Substantially all of the Company’s revenues are generated under contracts which expire periodically or which must be frequently renegotiated, extended or replaced. Whether these contracts are renegotiated, extended or replaced is often subject to factors beyond the Company’s control. Such factors include sudden fluctuations in oil and gas prices, counterparty ability to pay for or accept the contracted volumes and, most importantly, an extremely competitive marketplace for the services offered by the Company. There is no assurance that the costs and pricing of the Company’s services can remain competitive in the marketplace or that the Company will be successful in renegotiating its contracts.
Anticipated or scheduled volumes will differ from actual or delivered volumes.
The Company’s crude oil and natural gas marketing operation purchases initial production of crude oil and natural gas at the wellhead under contracts requiring the Company to accept the actual volume produced. The resale of such production is generally under contracts requiring a fixed volume to be delivered. The Company estimates its anticipated supply and matches such supply estimate for both volume and pricing formulas with committed sales volumes. Since actual wellhead volumes produced will never equal anticipated supply, the Company’s marketing margins may be adversely impacted. In many instances, any losses resulting from the difference between actual supply volumes compared to committed sales volumes must be absorbed by the Company.
Environmental liabilities and environmental regulations may have an adverse effect on the Company.
The Company’s business is subject to environmental hazards such as spills, leaks or any discharges of petroleum products and hazardous substances. These environmental hazards could expose the Company to material liabilities for property damage, personal injuries, and/or environmental harms, including the costs of investigating and rectifying contaminated properties.
Environmental laws and regulations govern many aspects of the Company’s business, such as drilling and exploration, production, transportation and waste management. Compliance with environmental laws and regulations can require significant costs or may require a decrease in production. Moreover, noncompliance with these laws and regulations could subject the Company to significant administrative, civil, and/or criminal fines and/or penalties.
Operations could result in liabilities that may not be fully covered by insurance.
Transportation of hazardous materials and the exploration and production of crude oil and natural gas business involves certain operating hazards such as well blowouts, automobile accidents, explosions, fires and pollution. Any of these operating hazards could cause serious injuries, fatalities or property damage, which could expose the Company to liability. The payment of any of these liabilities could reduce, or even eliminate, the funds available for exploration, development, and acquisition, or could result in a loss of the Company’s properties and may even threaten survival of the enterprise.
Consistent with the industry standard, the Company’s insurance policies provide limited coverage for losses or liabilities relating to pollution, with broader coverage provided for sudden and accidental occurrences. Insurance might be inadequate to cover all liabilities. Moreover, from time to time, obtaining insurance for the Company’s line of business can become difficult and costly. Typically, when insurance cost escalates, the Company may reduce its level of coverage and more risk may be retained to offset cost increases. If substantial liability is incurred and damages are not covered by insurance or exceed policy limits, the Company’s operation and financial condition could be materially adversely affected.
Changes in tax laws or regulations could adversely affect the Company.
The Internal Revenue Service, the United States Treasury Department, and Congress and the states frequently review federal or state income tax legislation. The Company cannot predict whether, when, or to what extent new federal or state tax laws, regulations, interpretations or rulings will be adopted. Any such legislative action may prospectively or retroactively modify tax treatment and, therefore, may adversely affect taxation of the Company.
The Company’s business is subject to changing government regulations.
Federal, state or local government agencies may impose environmental, labor or other regulations that increase costs and/or terminate or suspend operations. The Company’s business is subject to federal, state and local laws and regulations. These regulations relate to, among other things, the exploration, development, production and transportation of oil and natural gas. Existing laws and regulations could be changed, and any changes could increase costs of compliance and costs of operations.
Several proposals are before state legislators and the U.S. Congress that, if implemented, would either prohibit the practice of hydraulic fracturing or subject the process to regulation under state regulation or the Safe Drinking Water Act. The Company routinely participates in wells where fracturing techniques are utilized to expand the available space for natural gas and oil to migrate toward the well-bore. ItThis is typically done at substantial depths in very tight formations. Although it is not possible at this time to predict the final outcome of the legislation regarding hydraulic fracturing, any new state or federal restrictions could result in increased compliance costs or additional operating restrictions.
Estimating reserves, production and future net cash flow is difficult.
Estimating oil and natural gas reserves is a complex process that involvesrequiring significant interpretations and assumptions. It requires interpretation of technical data and assumptions relating to economic factors such as future commodity prices, production costs, severance and excise taxes, capital expenditures and remedial costs, and the assumed effect of governmental regulation. As a result, actual results may differ from the Company’s estimates. Also, the use of a 10 percent discount factor for reporting purposes, as prescribed by the SEC, may not necessarily represent the most appropriate discount factor, given actual interest rates and risks to which the Company’s business is subject. Any significant variations from the Company’s valuations could cause the estimated quantities and net present value of the Company’s reserves to differ materially.
The reserve data included in this report is only an estimate. The reader should not assume that the present values referred to in this report represent the current market value of the Company’s estimated oil and natural gas reserves. The timing of the production and the expenses from development and production of oil and natural gas properties will affect both the timing of actual future net cash flows from the Company’s proved reserves and their present value.
The Company’s business isexploration operations are dependent on the ability to replace reserves.
Future success depends in part on the Company’s ability to find, develop and acquire additional oil and natural gas reserves. WithoutAbsent ongoing successful acquisition or exploration activities, reserves and revenues will decline as a result of current reserves being depleted by production. The successful acquisition, development or exploration of oil and natural gas properties requiresis dependent upon an assessment of recoverable reserves, future oil and natural gas prices and operating costs, potential environmental and other liabilities, and other factors. These assessmentsfactors are necessarily inexact. As a result, the Company may not recover the purchase price and/or the development costs of a property from the sale of production from the property, or may not recognize an acceptable return from properties acquired. In addition, exploration and development operations may not result in any increases in reserves. Exploration or development may be delayed or cancelled as a result of inadequate capital, compliance with governmental regulations, or price controls or mechanical difficulties. In the future, the cost to find or acquire additional reserves may become prohibitive.
RevenuesOil and gas segment revenues are dependent on the ability to successfully complete drilling activity.
Drilling and exploration are one of the main methods of replacing reserves. However, drilling and exploration operations may not result in any increases in reserves for various reasons. Drilling and exploration may be curtailed, delayed or cancelled as a result of:
| · | lack of acceptable prospective acreage; |
| · | inadequate capital resources; |
| · | compliance with governmental regulations; and |
| · | mechanical difficulties. |
Moreover, the costs of drilling and exploration may greatly exceed initial estimates. In such a case, the Company would be required to make additional expenditures to develop its drilling projects. Such additional and unanticipated expenditures could adversely affect the Company’s financial condition and results of operations.
Security issues exist relating to drivers, equipment and terminal facilitiesfacilities.
The Company transports liquid combustible materials such as gasoline andincluding petrochemicals, and such materials may be a target for terrorist attacks. While the Company employs a variety of security measures to mitigate the risk of such eventsrisks, no assurance can be given that such events will not occur.
Current and future litigation could have an adverse effect on the Company.
The Company is currently involved in severalcertain administrative and civil legal proceedings inas part of the ordinary course of its business. Moreover, as incidental to operations, the Company sometimes becomes involved in various lawsuits and/or disputes. Lawsuits and other legal proceedings can involve substantial costs, including the costs associated with investigation, litigation and possible settlement, judgment, penalty or fine. Although insurance is maintained to mitigate these costs, there can be no assurance that costs associated with lawsuits or other legal proceedings will not exceed the limits of insurance policies. The Company’s results of operations could be adversely affected if a judgment, penalty or fine is not fully covered by insurance.
The Company is subject to risks associated with climate change.
Potential climate change and costs associated with its impact and efforts to regulate “greenhouse‟greenhouse gas” (“GHG's”(‟GHG”) emissions have the potential to adversely affect the Company’s business including negatively impacting (i) the costs it incurs in providing its products and services, including costs to operate and maintain its facilities, install new emission controls on its facilities, acquire allowances to authorize its GHG emissions, pay any taxes related to GHG emissions, administer and manage a GHG emissions program, pay higher insurance premiums or accept greater risk of loss in areas affected by adverse weather and coastal regions in the event of rising sea levels, (ii)levels. In addition, the demand for and consumption of its products and services (due to change in both costs and weather patterns), and (iii) the economic health of the regions in which itthe Company operates, all of which could have a material adverse effect on the Company’s business, financial condition, results of operations and cash flows.
The Company is subject to risks related to cybersecurity.
The Company is subject to cybersecurity risks and may incur increasing costs in connection with its efforts to enhance and ensure security and in response to actual or attempted cybersecurity attacks.
Substantial aspects of the Company’s business depend on the secure operation of its computer systems and websites. Security breaches could expose the Company to a risk of loss, misuse, or interruption of sensitive and critical information and functions, including its own proprietary information and that of its customers, suppliers and employees and functions that affect the operation of the business.employees. Such lossesbreaches could result in operational impacts, reputational harm, competitive disadvantage, litigation, regulatory enforcement actions, and liability. While the Company devotes substantial resources to maintaining adequate levels of cybersecurity, there can be no assurance that it will be able to prevent all of the rapidly evolving types of cyber attacks. Actual or anticipated attacks and risks may cause the Company to incur increasing costs for technology, personnel and services to enhance security or to respond to occurrences.
If the Company’s security measures are circumvented, proprietary information may be misappropriated, its operations may be disrupted, and its computers or those of its customers or other third parties may be damaged. Compromises of the Company’s security may result in an interruption of operations, violation of applicable privacy and other laws, significant legal and financial exposure, damage to its reputation, and a loss of confidence in its security measures.
Item 1B1B. UNRESOLVED STAFF COMMENTS
None.
Item 3. LEGAL PROCEEDINGS
AREC is named as a defendant in a number of Louisiana based suits involving alleged environmental contamination from prior drilling operations. Such suits typically allege improper disposal of oilfield wastes in earthen pits with one suit alleging subsidence contributing of the formation of a sink hole. AREC is currently involved in three such suits. The suits are styled LePetit Chateau Deluxe v. Adams Resources Exploration Corporation dated March 2004, Gustave J. LaBarre, Jr., et. al. v. Adams Resources Exploration Corporation et al dated October 2012 and Henning Management, LLC v. Adams Resources Exploration Corporation dated November 2013. Each suit involves multiple industry defendants with substantially larger proportional interest in the properties except all the larger defendants have settled their claims in the LePetit Chateau Deluxe matter. The plaintiffs in each of these matters are seeking unspecified compensatory and punitive damages. In August 2014, AREC was dismissed from a similar suit styled Edward Conner, et al v. Adams Resources Exploration Corporation dated October 2013. While management does not believe that a material adverse effect will result from the claims, significant attorney fees will be incurred to defend these items. As of December 31, 2014 and 2013, the Company has accrued $500,000 and $200,000, respectively, of future legal and/or settlement costs for these matters.
From time to time as incident to its operations, the Company may becomebecomes involved in various accidents, lawsuits and/or disputes. Primarily as an operator of an extensive trucking fleet, the Company is a party to motor vehicle accidents, worker compensation claims andor other items of general liability as would beare typical for the industry. ManagementIn addition, the Company has extensive operations that must comply with a wide variety of tax laws, environmental laws and labor laws, among others. Should an incident occur, management evaluates the claim based on its nature, the facts and circumstances and the applicability of insurance coverage. To the extent management believes that such event may impact the financial condition of the Company, is presently unawaremanagement will estimate the monetary value of any claims against the Company that are either outsideclaim and make appropriate accruals or disclosure as provided in the scope of insurance coverage, or that may exceed the level of insurance coverage, and could potentially represent a material adverse effect on the Company’s financial position or results of operations.appropriate accounting literature guidelines.
Item 4. MINE SAFETY DISCLOSURES
Not ApplicableApplicable.
PART II
| Item 5. | MARKET FOR THE REGISTRANT'SREGISTRANT’S COMMON STOCK, RELATED SECURITY HOLDERSTOCKHOLDER MATTERS, AND ISSUER REPURCHASEPURCHASES OF EQUITY SECURITIES |
The Company'sCompany’s common stock is traded on the NYSE Amex, formerly known as the American Stock Exchange,MKT under the ticker symbol “AE”‟AE”. The following table sets forth the high and low sales prices of the common stock as reported by the NYSE AmexMKT for each calendar quarter since January 1, 2010.2013.
| | | | | | | |
| | | | | | | | | | | | | |
| 2011 | | | | | | | |
| 2014 | | | | | | | |
| First Quarter | | $ | 31.30 | | | $ | 22.46 | | | $ | 90.28 | | | $ | 57.19 | |
| Second Quarter | | | 30.50 | | | | 22.51 | | | | 81.50 | | | | 56.08 | |
| Third Quarter | | | 29.07 | | | | 18.73 | | | | 79.61 | | | | 44.26 | |
| Fourth Quarter | | | 29.50 | | | | 18.90 | | | | 50.54 | | | | 38.58 | |
| | | | | | | | | | | | | | | | | |
| 2010 | | | | | | | | | |
| 2013 | | | | | | | | | |
| First Quarter | | $ | 23.39 | | | $ | 17.40 | | | $ | 55.82 | | | $ | 33.75 | |
| Second Quarter | | | 19.95 | | | | 15.25 | | | | 70.80 | | | | 43.00 | |
| Third Quarter | | | 21.49 | | | | 16.00 | | | | 71.77 | | | | 54.86 | |
| Fourth Quarter | | | 24.95 | | | | 17.86 | | | | 70.01 | | | | 47.46 | |
At March 12, 2012 there were approximately 235 shareholders of record of the Company's common stock and the closing stock price was $45.71 per share. The Company has no securities authorized for issuance under equity compensation plans. The Company made no repurchases of its stock during 20112014 and 2010.2013.
OnDuring each of March, June, September and December 15, 2011,2014 the Company paid an annualto its common shareholders a quarterly cash dividend of $.57$.22 per common share. In each of June, September and December 2013 the Company paid a quarterly cash dividend of $.22 per common share to its common stockholders of record on December 1, 2011. On December 15, 2010, the Company paid an annual cash dividend of $.54 per common share to common stockholders of record on December 1, 2010.stockholders. Such dividends totaled $2,404,000$3,711,544 and $2,277,540$2,783,658 for each of 20112014 and 2010,2013, respectively.
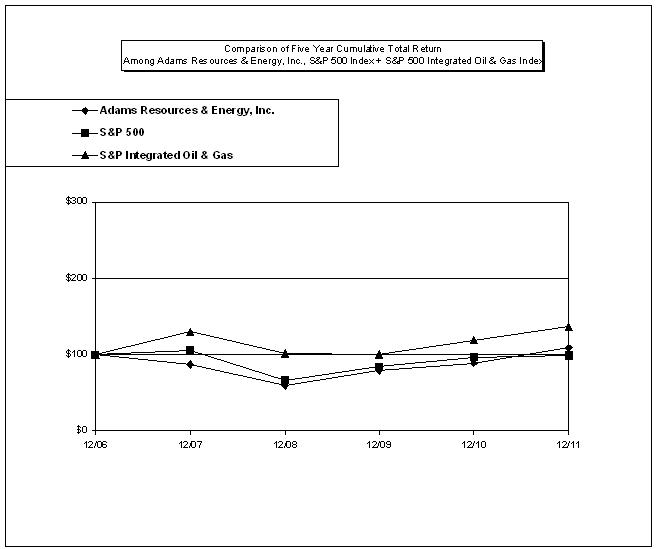
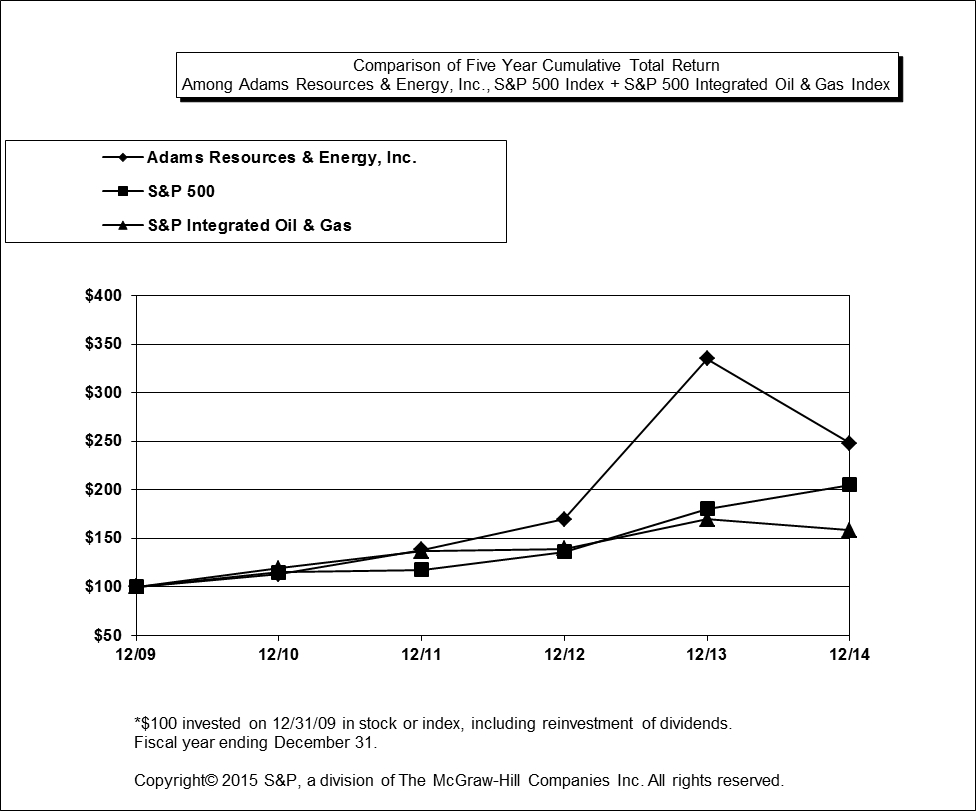
Performance Graph
The performance graph shown below was prepared under the applicable rules of the SEC based on data supplied by Research Data Group. The purpose of the graph is to show comparative total stockholder returns for the Company versus other investment options for a specified period of time. The graph was prepared based upon the following assumptions:
| 1. | $100.00 was invested on December 31, 20062009 in the Company’s common stock, the S&P 500 Index, and the S&P 500 Integrated Oil and Gas Index. |
| 2. | Dividends are reinvested on the ex-dividend dates. |
Note: The stock price performance shown on the graph below is not necessarily indicative of future price performance.
| | Dec06 | Dec07 | Dec08 | Dec09 | Dec10 | Dec11 | 12/09 | 12/10 | 12/11 | 12/12 | 12/13 | 12/14 |
| | | |
| Adams Resources & Energy, Inc. | 100.00 | 86.99 | 59.46 | 78.90 | 89.03 | 108.97 | 100.00 | 112.83 | 138.10 | 169.55 | 334.76 | 247.79 |
| S&P 500 | 100.00 | 105.49 | 66.46 | 84.05 | 96.71 | 98.75 | 100.00 | 115.06 | 117.49 | 136.30 | 180.44 | 205.14 |
| S&P Integrated Oil & Gas | 100.00 | 129.85 | 101.56 | 100.25 | 119.14 | 136.73 | 100.00 | 118.84 | 136.39 | 139.41 | 169.42 | 158.02 |
Item 6. SELECTED FINANCIAL DATA
FIVE YEAR REVIEW OF SELECTED FINANCIAL DATA
| | | | | | | |
| | | | | | | | | | | | | | | | | | | | | | | | | | | | | | | |
| | | (In thousands, except per share data) | | | (In thousands, except per share data) | |
| Revenues: | | | | | | |
| Marketing | | $ | 3,136,838 | | | $ | 2,144,082 | | | $ | 1,889,583 | | | $ | 4,074,677 | | | $ | 2,558,545 | | | $ | 4,050,497 | | | $ | 3,863,057 | | | $ | 3,292,948 | | | $ | 2,961,176 | | | $ | 2,005,301 | |
| Transportation | | | 63,501 | | | | 56,867 | | | | 44,895 | | | | 67,747 | | | | 63,894 | | | | 68,968 | | | | 68,783 | | | | 67,183 | | | | 63,501 | | | | 56,867 | |
| Oil and natural gas | | | 14,060 | | | | 11,021 | | | | 8,650 | | | | 17,248 | | | | 13,783 | | | | 13,361 | | | | 14,129 | | | | 15,954 | | | | 14,060 | | | | 11,021 | |
| | | $ | 3,214,399 | | | $ | 2,211,970 | | | $ | 1,943,128 | | | $ | 4,159,672 | | | $ | 2,636,222 | | | $ | 4,132,826 | | | $ | 3,945,969 | | | $ | 3,376,085 | | | $ | 3,038,737 | | | $ | 2,073,189 | |
| Operating earnings (loss): | | | | | | | | | | | | | | | | | | | | | | | | | | | | | | | | | | | | | | | | |
| Marketing | | $ | 50,596 | | | $ | 16,724 | | | $ | 17,487 | | | $ | (2,704 | ) | | $ | 20,152 | | | $ | 20,854 | | | $ | 40,369 | | | $ | 46,145 | | | $ | 49,237 | | | $ | 13,530 | |
| Transportation | | | 8,521 | | | | 6,623 | | | | 2,128 | | | | 4,245 | | | | 5,504 | | | | 4,750 | | | | 5,180 | | | | 10,253 | | | | 8,521 | | | | 6,623 | |
| Oil and gas operations | | | (16,794 | ) | | | (1,757 | ) | | | (3,625 | ) | | | (3,348 | ) | | | (2,853 | ) | | | (10,038 | ) | | | (2,113 | ) | | | (5,835 | ) | | | (16,797 | ) | | | (1,801 | ) |
| Oil and gas property sale | | | 2,923 | | | | - | | | | - | | | | - | | | | 12,078 | | | | 2,528 | | | | - | | | | 2,203 | | | | 2,923 | | | | - | |
| General and administrative | | | (9,713 | ) | | | (9,044 | ) | | | (9,589 | ) | | | (9,667 | ) | | | (10,974 | ) | | | (8,613 | ) | | | (9,060 | ) | | | (8,810 | ) | | | (8,678 | ) | | | (7,858 | ) |
| | | | 35,533 | | | | 12,546 | | | | 6,401 | | | | (11,474 | ) | | | 23,907 | | | | 9,481 | | | | 34,376 | | | | 43,956 | | | | 35,206 | | | | 10,494 | |
| Other income (expense): | | | | | | | | | | | | | | | | | | | | | | | | | | | | | | | | | | | | | | | | |
| Interest income | | | 237 | | | | 191 | | | | 125 | | | | 1,103 | | | | 1,741 | | | | 301 | | | | 198 | | | | 190 | | | | 237 | | | | 191 | |
| Interest expense | | | (8 | ) | | | (36 | ) | | | (25 | ) | | | (187 | ) | | | (134 | ) | | | (2 | ) | | | (24 | ) | | | (10 | ) | | | (8 | ) | | | (36 | ) |
| Earnings (loss) from continuing operations | | | | | | | | | | | | | | | | | | | | | | | | | | | | | | | | | | | | | | | | |
| before income taxes | | | 35,762 | | | | 12,701 | | | | 6,501 | | | | (10,558 | ) | | | 25,514 | | | | 9,780 | | | | 34,550 | | | | 44,136 | | | | 35,435 | | | | 10,649 | |
| | | | | | | | | | | | | | | | | | | | | | | | | | | | | | | | | | | | | | | | | |
| Income tax (provision) benefit | | | (12,831 | ) | | | (4,070 | ) | | | (2,352 | ) | | | 4,986 | | | | (8,458 | ) | |
| Income tax (provision) | | | | (3,561 | ) | | | (12,429 | ) | | | (16,664 | ) | | | (12,717 | ) | | | (3,352 | ) |
| | | | | | | | | | | | | | | | | | | | | | | | | | | | | | | | | | | | | | | | | |
| Net earnings (loss) | | $ | 22,931 | | | $ | 8,631 | | | $ | 4,149 | | | $ | (5,572 | ) | | $ | 17,056 | | |
| Earnings from continuing | | | | | | | | | | | | | | | | | | | | | |
| Operations | | | | 6,219 | | | | 22,121 | | | | 27,472 | | | | 22,718 | | | | 7,297 | |
| Earnings (loss) from discontinued | | | | | | | | | | | | | | | | | | | | | |
| operations, net of taxes | | | | 304 | | | | (511 | ) | | | 319 | | | | 213 | | | | 1,334 | |
| | | | | | | | | | | | | | | | | | | | | | |
| Net earnings | | | $ | 6,523 | | | $ | 21,610 | | | $ | 27,791 | | | $ | 22,931 | | | $ | 8,631 | |
| | | | | | | | | | | | | | | | | | | | | | | | | | | | | | | | | | | | | | | | | |
| Earnings (Loss) Per Share | | | | | | | | | | | | | | | | | | | | | | | | | | | | | | | | | | | | | | | | |
| Basic and diluted earnings (loss) per share | | $ | 5.44 | | | $ | 2.05 | | | $ | .98 | | | $ | (1.32 | ) | | $ | 4.04 | | |
| From continuing operations | | | | 1.48 | | | | 5.24 | | | | 6.51 | | | | 5.39 | | | | 1.73 | |
| From discontinued operations | | | | .07 | | | | (.12 | ) | | | .08 | | | | (.05 | ) | | | .32 | |
| Basic and diluted earnings per share | | | $ | 1.55 | | | $ | 5.12 | | | $ | 6.59 | | | $ | 5.34 | | | $ | 2.05 | |
| | | | | | | | | | | | | | | | | | | | | | | | | | | | | | | | | | | | | | | | | |
| Dividends per common share | | $ | .57 | | | $ | .54 | | | $ | .50 | | | $ | .50 | | | $ | .47 | | | $ | .88 | | | $ | .66 | | | $ | .62 | | | $ | .57 | | | $ | .54 | |
| | | | | | | | | | | | | | | | | | | | | | | | | | | | | | | | | | | | | | | | | |
| Financial Position | | | | | | | | | | | | | | | | | | | | | | | | | | | | | | | | | | | | | | | | |
| Cash | | $ | 37,066 | | | $ | 29,032 | | | $ | 16,806 | | | $ | 18,208 | | | $ | 23,697 | | | $ | 80,184 | | | $ | 60,733 | | | $ | 47,239 | | | $ | 37,066 | | | $ | 29,032 | |
| Net working capital | | | 48,871 | | | | 39,978 | | | | 38,372 | | | | 41,559 | | | | 50,572 | | | | 82,342 | | | | 79,561 | | | | 58,474 | | | | 48,871 | | | | 39,978 | |
| Total assets | | | 378,840 | | | | 301,305 | | | | 249,401 | | | | 210,926 | | | | 357,075 | | | | 340,814 | | | | 448,082 | | | | 419,501 | | | | 378,840 | | | | 301,305 | |
| Long-term debt | | | - | | | | - | | | | - | | | | - | | | | - | | | | - | | | | - | | | | - | | | | - | | | | - | |
| Shareholders’ equity | | | 110,682 | | | | 90,155 | | | | 83,801 | | | | 81,761 | | | | 89,442 | | | | 157,497 | | | | 154,685 | | | | 135,858 | | | | 110,682 | | | | 90,155 | |
| Dividends on common shares | | | 2,404 | | | | 2,277 | | | | 2,109 | | | | 2,109 | | | | 1,982 | | | | 3,711 | | | | 2,783 | | | | 2,615 | | | | 2,404 | | | | 2,277 | |
Notes:
- | In 2014, 2012 and 2011, and 2007, certain oil and natural gas producing properties were sold for $4.1 million, $3.6 million and $6.6 million and $14.9 million producing net gains of $2.5 million, $2.2 million and $2.9 million and $12.1 million, respectively. |
The 2014, 2013, 2012 and 2011 oil and gas operating losses include property impairments totaling $8.0 million, $2.6 million, $4.7 million and $14.8 million, respectively. These impairments were recorded following declining crude oil prices in 2014, unfavorable drilling results in 2013 and declining natural gas prices in 2012 and 2011.
- | The 2011 oil and gas operating loss primarily resulted from property impairments totaling $14.8 million recorded as a result of declining natural gas prices. |
| Item 7. MANAGEMENT'SItem 7. MANAGEMENT’S DISCUSSION AND ANALYSIS OF FINANCIAL CONDITION AND RESULTS OF OPERATIONS |
Results of Operations
- Marketing
Marketing Crude oil marketing revenues, operating earnings, depreciation and depreciationcertain costs are as follows (in thousands):
| | | | | | | | | | |
| Revenues | | | | | | | | | |
| Crude oil | | $ | 2,961,176 | | | $ | 2,005,301 | | | $ | 1,770,600 | |
| Natural gas | | | 6,251 | | | | 10,592 | | | | 14,232 | |
| Refined products | | | 169,411 | | | | 128,189 | | | | 104,751 | |
| Total | | $ | 3,136,838 | | | $ | 2,144,082 | | | $ | 1,889,583 | |
| | | | | | | | | | | | | |
| Operating Earnings (loss) | | | | | | | | | | | | |
| Crude oil | | $ | 49,237 | | | $ | 13,530 | | | $ | 15,404 | |
| Natural gas | | | 2,147 | | | | 3,073 | | | | 2,749 | |
| Refined products | | | (788 | ) | | | 121 | | | | (666 | ) |
| Total | | $ | 50,596 | | | $ | 16,724 | | | $ | 17,487 | |
| | | | | | | | | | | | | |
| Depreciation | | | | | | | | | | | | |
| Crude oil | | $ | 3,724 | | | $ | 2,320 | | | $ | 1,997 | |
| Natural gas | | | 3 | | | | 44 | | | | 166 | |
| Refined products | | | 375 | | | | 503 | | | | 533 | |
| Total | | $ | 4,102 | | | $ | 2,867 | | | $ | 2,696 | |
| | | | | | | | | | |
| | | | | | | | | | |
| Revenues | | $ | 4,050,497 | | | $ | 3,863,057 | | | $ | 3,292,948 | |
| | | | | | | | | | | | | |
| Operating earnings | | $ | 20,854 | | | $ | 40,369 | | | $ | 46,145 | |
| | | | | | | | | | | | | |
| Depreciation | | $ | 9,626 | | | $ | 7,682 | | | $ | 5,945 | |
| | | | | | | | | | | | | |
| Driver commissions | | $ | 21,744 | | | $ | 19,478 | | | $ | 15,151 | |
| | | | | | | | | | | | | |
| Insurance | | $ | 7,446 | | | $ | 7,659 | | | $ | 5,241 | |
| | | | | | | | | | | | | |
| Fuel | | $ | 14,851 | | | $ | 13,808 | | | $ | 11,617 | |
Supplemental volume and price information is:information:
| | | | | | | | | | | | | | | | | | | |
Field Level Purchases per day (1) | | | | | | | | | | | | | | | | | | |
| Crude Oil – barrels | | | 81,600 | | | | 69,000 | | | | 66,100 | | | | 117,100 | | | | 106,000 | | | | 89,200 | |
| Natural Gas – mmbtu’s | | | 208,000 | | | | 258,000 | | | | 363,000 | | |
| | | | | | | | | | | | | | | | | | | | | | | | | |
| Average Purchase Price | | | | | | | | | | | | | | | | | | | | | | | | |
| Crude Oil – per barrel | | $ | 96.77 | | | $ | 77.20 | | | $ | 58.32 | | | $ | 89.40 | | | $ | 99.57 | | | $ | 99.66 | |
| Natural Gas – per mmbtu | | $ | 3.93 | | | $ | 4.28 | | | $ | 3.75 | | |
| | (1) Reflects the volume purchased from third parties at the oil and natural gas field level and pipeline pooling points.of operations. |
Comparison 2011 to 2010
CrudeIncreasing crude oil revenues grewin 2014 and 2013 relative to 2012 resulted from increased field level purchase volumes partially offset by 47 percentreduced average prices in 2011 due to both volume and price increases. Average crude oil prices increased 25 percent and crude oil lease level volumes improved by 18 percent2014, as shown in the table above. The field level purchase volume growth was a result ofVolume increases stemmed from new production from expanded drilling activityestablished by the Company’s customer base in the Eagle Ford shale trend of South Texas.Texas beginning in 2011, coupled with new operations established during 2013 in the Bakken field of North Dakota. While revenues were increasing during 2014, the Company’s accounts receivable balance as of December 31, 2014 was reduced by 41 percent relative to December 31, 2013. This apparent contradiction results because year-end accounts receivable balances are substantially based on crude oil sales activity for the month of December only. Crude oil prices declined significantly in December 2014 leading to the reduced accounts receivable balance. By comparison, crude oil supply prices in December 2014 were in the $54 per barrel range versus $93 per barrel in December 2013. Reported amounts and values for crude oil inventories as of December 31, 2014 were similarly affected relative to such reported amounts for 2013.
| - | Field Level Operating Earnings (Non GAAP Measure) |
CrudeTwo significant factors affecting comparative crude oil segment operating earnings increased significantly in 2011 due to widening unit gross margins. This result stems from South Texas sourcedare inventory valuations and forward commodity contract (derivatives or mark-to-market) valuations. As a purchaser and shipper of crude oil, selling at a discount to world oil prices due to its relative abundance in relation to the infrastructure available to deliver such oil to market. In addition, during the second quarter of 2011, the Company completed constructionholds inventory in storage tanks and third-party pipelines. Inventory sales turnover occurs approximately every three days, but the quantity held in stock at the end of a barge terminal facility at the Portgiven period is reasonably consistent. As a result, during periods of Victoria, Texas. This facility allows the Company to increase margins on its gathered production in the area by barging it to more advantageous markets.
Increasingincreasing crude oil prices, also boosted operating earnings during 2011. The average acquisition price of crude oil moved from $88 per barrel at the beginning of the year to $98 per barrel for December 2011, resulting inCompany recognizes inventory liquidation gains totaling $3,021,000. Similarly,while during 2010,periods of falling prices, the Company recognizes inventory liquidation and valuation losses. Over time, these gains and losses tend to offset and have limited impact on cash flow. While crude oil prices rose fromfluctuated during 2014, 2013 and 2012, the $75 per barrel range in January to the $88 per barrel range by December 2010 producing a $2,272,000net impact yielded inventory liquidation gain.valuation losses totaling $14,247,000, $3,824,000 and $1,596,000, respectively. As of December 31, 2011,2014, the Company held 182,728292,355 barrels of crude oil inventory at ana composite average price of $98.36$46.11 per barrel. As of December 31, 2013, the Company held 303,633 barrels of crude oil inventory at a composite average price of $90.06 per barrel.
Diesel fuel expense which tends to fluctuate in tandem withCrude oil marketing operating earnings are also affected by the valuations of the Company’s forward month commodity contracts (derivative instruments) as of the various report dates. Such non-cash valuations are calculated and recorded at each period end based on the underlying data existing as of such date. The Company generally enters into these derivative contracts as part of a pricing strategy based on crude oil prices also has a significant impact on operating earnings. A relatively low levelpurchases at the wellhead (field level). Only those contracts qualifying as derivative instruments are accorded fair value treatment while the companion contracts to purchase crude oil at the wellhead (field level) are not subject to fair value treatment. For derivative instruments, the recognition of diesel fuel costs during 2009, served to improve comparative operating earnings for such year relative to 2010. Diesel fuel cost were elevated in 2011 due to increased prices‟mark-to-market” gains and an approximate 50 unit expansion of the truck fleet engaged to handle added volumes. losses is required at each period end.
The impact on crude oil segment operating earnings fromof inventory liquidation gainsliquidations and diesel fuel costderivative valuations is summarized as followsin the following reconciliation from a GAAP to a non-GAAP measure (in thousands):
| | | | | | | | | | |
| | | | | | | | | | |
| As reported segment operating earnings | | $ | 20,854 | | | $ | 40,369 | | | $ | 46,145 | |
| Add (less) - | | | | | | | | | | | | |
| Inventory liquidation (gains) losses | | | 14,247 | | | | 3,824 | | | | 1,596 | |
| Derivative valuation (gains) losses | | | (312 | ) | | | 193 | | | | 2,001 | |
| | | | | | | | | | | | | |
Field level operating earnings(1) | | $ | 34,789 | | | $ | 44,386 | | | $ | 49,742 | |
| | | | | | | | | | |
| As reported operating earnings | | $ | 49,237 | | | $ | 13,530 | | | $ | 15,404 | |
| Inventory liquidation (gains) | | | (3,021 | ) | | | (2,272 | ) | | | (5,780 | ) |
| | | | | | | | | | | | | |
| | | $ | 46,216 | | | $ | 11,258 | | | $ | 9,624 | |
| | | | | | | | | | | | | |
| | | | | | | | | | | | | |
| Diesel fuel expense | | $ | 9,982 | | | $ | 6,001 | | | $ | 4,612 | |
| (1) | Such designation is unique to the Company and is not comparable to any similar measures developed by industry participants. The Company utilizes such data to evaluate the profitability of its operations. |
Natural gas sales are reported net of underlying natural gas purchase costsField level operating earnings and thus reflect gross margin. As shown above, gross margins were reduced during 2011 as average field level purchase volumes were off 19 percent(see earlier table) depict the Company’s day-to-day operation of acquiring crude oil at the wellhead, transporting the material, and delivering it to market sales points. Comparative field level operating earnings decreased in 2014 relative to 2013 and in 2013 relative to 2012 as competition and additional industry infrastructure development progressed in the region. Previously a key factor in unit margins was the value difference between the value of crude oil supply in the mid-continent region of the United States versus crude oil supply costs in the eastern region of the United States. The Company was able to capture some of this value difference by shipping crude oil from the Texas Gulf Coast to points east. Due to competitive pressures during 2014, the opportunities for the period. Current volumes declined because the Company’s natural gas suppliers do not operateCompany to capture this location based unit value difference evaporated which reduced earnings. Further, driver commission rates increased in the shale areas2014 and therefore curtailed drilling activity due to declining natural gas prices. The Company’s primary source2013 and a combination of natural gas supply is the non-shale areas of Texas, Louisianahigher mileage and the Gulf of Mexico. In addition to volume declines, development of the nation’s natural gas infrastructure including more diverse areas of production and expanded pipeline and storage capacity have served to reduce purchase opportunities and per unit margins.higher accident frequency increased insurance costs in beginning 2013.
Operating earnings forRecent declines in crude oil prices are expected to slow the refined products segment continuedvolume growth from South Texas and North Dakota sourced production as these regions become less economic to underperform following the downturn in the domestic economy which began during the third quarter of 2008. Due to customer slow payment patterns, refined product operating earnings were additionally impacted in 2011 and 2009 when the bad debt provision was increased by approximately $947,000 and $560,000, respectively. develop. As a result, of its recent market performance, in February 2012 the Company sold substantially all contracts, equipment and inventories associated with its refined products segment and is completing an orderly wind-down of this business. Cash proceeds from the sale totaled $2 million plus the fair market value of refined product inventories and the Company will record a gain of approximately $1 milliondoes not anticipate significant volume growth during the first quarter of 2012.
2015. Historically, prices received for crude oil and natural gas have been volatile and unpredictable with price volatility expected to continue. See discussion under Item‟Item 1A, Risk Factors.
Factors – Fluctuations in oil and gas prices could have an adverse effect on the Company”.
- Transportation
The transportation segment revenues and operating earnings were as follows (in thousands):
| | | | | | | | | | | | | | | | | | | |
| | | Amount | | | Change(1) | | | Amount | | | Change(1) | | | Amount | | | Change(1) | | | Amount | | | Change(1) | | | Amount | | | Change(1) | | | Amount | | | Change(1) | |
| | | | | | | | | | | | | | | | | | | | | | | | | | | | | | | | | | | | | |
| Revenues | | $ | 63,501 | | | | 12 | % | | $ | 56,867 | | | | 27 | % | | $ | 44,895 | | | | (34 | )% | | $ | 68,968 | | | | .3 | % | | $ | 68,783 | | | | 2 | % | | $ | 67,183 | | | | 6 | % |
| | | | | | | | | | | | | | | | | | | | | | | | | | | | | | | | | | | | | | | | | | | | | | | | | |
| Operating earnings | | $ | 8,521 | | | | 29 | % | | $ | 6,623 | | | | 211 | % | | $ | 2,128 | | | | (50 | )% | | $ | 4,750 | | | | (8.3 | )% | | $ | 5,180 | | | | (49 | )% | | $ | 10,253 | | | | 20 | % |
| | | | | | | | | | | | | | | | | | | | | | | | | | | | | | | | | | | | | | | | | | | | | | | | | |
| Depreciation | | $ | 3,912 | | | | (9 | )% | | $ | 4,288 | | | | 8 | % | | $ | 3,970 | | | | 3 | % | | $ | 7,416 | | | | 4.5 | % | | $ | 7,099 | | | | 20 | % | | $ | 5,921 | | | | 51 | % |
| | | | | | | | | | | | | | | | | | | | | | | | | | |
| Driver commissions | | | $ | 13,428 | | | | 2.1 | % | | $ | 13,152 | | | | 3 | % | | $ | 12,773 | | | | 3 | % |
| | | | | | | | | | | | | | | | | | | | | | | | | | |
| Insurance | | | $ | 5,574 | | | | (6.1 | )% | | $ | 5,937 | | | | 20 | % | | $ | 4,933 | | | | 2 | % |
| | | | | | | | | | | | | | | | | | | | | | | | | | |
| Diesel fuel | | | $ | 13,487 | | | | (9.0 | )% | | $ | 14,813 | | | | 2 | % | | $ | 14,516 | | | | - | |
| | | | | | | | | | | | | | | | | | | | | | | | | | |
| Maintenance Expense | | | $ | 6,143 | | | | 12.4 | % | | $ | 5,464 | | | | 24.6 | % | | $ | 4,386 | | | | (8 | )% |
______________
| (1) | Represents the percentage increase (decrease) from the prior year. |
RevenuesTransportation segment revenues were consistent and operating results improvedstrong for the transportation segmentcomparative periods due to consistent customer demand. Operating earnings for 2014 and 2013 were adversely impacted by increased depreciation, insurance and maintenance costs as shown above. Maintenance expense increased beginning in both 2011 and 20102013 in large part due to increased customer demand.environmental compliance costs. Diesel fuel costs began to recede during the fourth quarter of 2014 following crude oil price declines. The impact on margins is mitigated however due to the fuel surcharge provision in chemical hauling contracts.
Transportation segment depreciation increased beginning in 2013 as older fully depreciated tractor units were replaced with new model year vehicles. During 2014, the Company replaced 40 truck-tractors with new equipment while also purchasing 30 trailers to add to the fleet. During 2013, the Company purchased 35 new trailers with 17 serving as replacements. Over the course of the year 2012, the Company replaced 125 truck-tractors and one trailer. Operating earnings for 2014 and 2012 benefitted in 2011 from $1.2gains totaling $432,000 and $2.6 million, in gainsrespectively, from the sale of used equipment following the purchase of new truck replacements. Such sales did not occur in 2013 within the transportation segment.
The Company’s customers predominately consist of the domestic petrochemical industry and demand for such products has substantially recovered from the slow down occurring in 2009. Servingindustry. Contributing to improve customer demand was a recovering United States economy, relativelyis low natural gas prices (a basic feedstock cost for the petrochemical industry) and improvedhigh export demand for petrochemicals. In addition, during the previous economic downturn, the trucking industry reduced capacity by retiring older units without replacement. With strengthening demand, improvement, industry capacity has been strained allowing for rate increases and improved overallan opportunity for increased profitability. However, an industry wide shortage of qualified drivers has affected the Company by suppressing current year revenues and results of operations. In addition, the recent strengthening of the U. S. dollar relative to foreign currency may weaken demand for U. S. sourced petrochemical products. As transportation revenues increase or decrease, operating earnings will typically increase or decrease at an accelerated rate. This trend exists because the fixed cost components of the Company’s operation do not vary with changing revenues. As currently configured, operating earnings project atachieve break-even levels when annual revenues average approximately $50$54 million. Above that level, operating earnings will grow and below that level, losses result.
Transportation segment depreciation increased for 2011 and 2010 relative to 2009 as older fully depreciated tractor units were replaced with new model year vehicles with a portion of the 2011increase offset by certain in-service trailers becoming fully depreciated during the periods. During 2011 the Company replaced 115 older model tractor units and added 10 new units to the fleet. Tractor replacement for 2010 and 2009 totaled 50 units and 75 units, respectively. In addition 25 trailers were added to the fleet during 2011.
Oil and gas segment revenues and operating earnings are primarily derived froma function of crude oil and natural gas production volumes and prices. Comparative amounts for revenues, operating earnings and depreciation and depletion were as follows (in thousands):
| | | | | | | | | | | | | | | | | | | |
| | | Amount | | | Change(1) | | | Amount | | | Change(1) | | | Amount | | | Change(1) | | | Amount | | | Change(1) | | | Amount | | | Change(1) | | | Amount | | | Change(1) | |
| Revenues | | $ | 14,060 | | | | 28 | % | | $ | 11,021 | | | | 27 | % | | $ | 8,650 | | | | (50 | )% | | $ | 13,361 | | | | (5.4 | )% | | $ | 14,129 | | | | (11 | )% | | $ | 15,954 | | | | 13 | % |
| | | | | | | | | | | | | | | | | | | | | | | | | | | | | | | | | | | | | | | | | | | | | | | | | |
Operating earnings (loss)(2) | | | (16,794 | ) | | | 856 | % | | | (1,757 | ) | | | 51 | % | | | (3,625 | ) | | | 8 | % | | | (7,510 | ) | | | 181.4 | % | | | (2,113 | ) | | | 42 | % | | | (3,632 | ) | | | (74 | )% |
| | | | | | | | | | | | | | | | | | | | | | | | | | | | | | | | | | | | | | | | | | | | | | | | | |
| Depreciation and depletion | | | 8,246 | | | | 77 | % | | | 4,662 | | | | 28 | % | | | 3,654 | | | | (46 | )% | | | 7,573 | | | | 1.1 | % | | | 7,494 | | | | (15 | )% | | | 8,848 | | | | 7 | % |
| | | | | | | | | | | | | | | | | | | | | | | | | | | | | | | | | | | | | | | | | | | | | | | | | |
| Producing property impairments | | | 7,105 | | | | 651 | % | | | 946 | | | | (30 | )% | | | 1,350 | | | | (56 | )% | | | (4,001 | ) | | | 77.6 | % | | | 1,373 | | | | (71 | )% | | | 4,699 | | | | (34 | )% |
______________
| (1) | Represents the percentage increase (decrease) from the prior year. |
| (2) | ExcludesIncludes gains from property sales of $2.5 million and $2.2 million in 2014 and 2012, respectively. |
The revenue improvement forAs shown in the oil and gas segment during 2011 and 2010 is primarily attributable totable below, declining crude oil prices and natural gas volumes increasesacted to reduce oil and gas earnings for the comparative years presented. Such volume decrease resulted from normal production declines as shownpersistently low prices curtailed the development of natural gas properties in the table below. Volumes improved with the results of recent drilling efforts. Operating earnings declined dueyears. Contributing to increased charges for depreciation, depletion andoperating losses were producing property impairments as well as increased exploration andprospect impairment expensesexpense as shown above and in the second table below. Depreciation and depletion expense increased in both 2011 and 2010 with increased volumes and as the depreciable property basis grew from capital expenditures. Producing and non-producing propertyProperty impairments resulted in 20112014 following a significant December 2011fourth quarter decline in crude oil prices while impairments in 2013 followed adverse drilling results and the 2012 impairments followed declines in the then current and forward price for natural gas.
Comparative volumes and prices were as follows:
| | | 2014 | | | | 2013 | | | | 2012 | | |
| | | | | | | | | | | | | |
| Production Volumes | | | | | | | | | | | | |
| - Crude oil | | | 127,300 | | Bbls | | | 102,300 | | Bbls | | | 98,100 | | Bbls |
| - Natural gas | | | 1,133,000 | | Mcf | | | 1,608,000 | | Mcf | | | 2,608,000 | | Mcf |
| | | | | | | | | | | | | | | | |
| Average Price | | | | | | | | | | | | | | | |
- Crude oil(1) | | $ | 63.64 | | Bbls | | $ | 79.15 | | Bbls | | $ | 84.39 | | Bbls |
| - Natural gas | | $ | 4.65 | | Mcf | | $ | 3.75 | | Mcf | | $ | 2.94 | | Mcf |
| | | 2011 | | | | 2010 | | | | 2009 | | |
| | | | | | | | | | | | | |
| Production Volumes | | | | | | | | | | | | |
| - Crude Oil | | | 61,500 | | bbls | | | 54,000 | | bbls | | | 49,500 | | bbls |
| - Natural Gas | | | 1,895,000 | | mcf | | | 1,365,000 | | mcf | | | 1,304,000 | | mcf |
| | | | | | | | | | | | | | | | |
| Average Price | | | | | | | | | | | | | | | |
| - Crude Oil | | $ | 93.23 | | bbls | | $ | 77.09 | | bbls | | $ | 58.10 | | bbls |
| - Natural Gas | | $ | 4.39 | | mcf | | $ | 5.02 | | mcf | | $ | 4.43 | | mcf |
| (1) | Crude oil prices and volumes include the sale of associated natural gas liquids production. |
Comparative exploration and prospect impairment costs were as follows (in thousands):
| | | | | | | | | | | | | | | | | | | |
| Dry hole expense | | $ | 1,212 | | | $ | 1,894 | | | $ | 661 | | | $ | 1,034 | | | $ | 233 | | | $ | 43 | |
| Prospect impairment | | | 7,644 | | | | 1,277 | | | | 2,423 | | | | 4,008 | | | | 1,257 | | | | 856 | |
| Seismic and geological | | | 310 | | | | 62 | | | | 734 | | | | 12 | | | | 129 | | | | 252 | |
| | | | | | | | | | | | | | | | | | | | | | | | | |
| Total | | $ | 9,166 | | | $ | 3,233 | | | $ | 3,818 | | | $ | 5,054 | | | $ | 1,619 | | | $ | 1,151 | |
During 2011,2014, the Company participated in the drilling of 8653 wells with 75 successful and 11seven dry holes. Additionally, the Company had 4025 wells in process on December 31, 20112014 with ultimate evaluation anticipatedcompletion of two such wells being held pending crude oil price improvements while completion of the other 23 wells should occur during 2012.2015. Converting natural gas volumes to equate with crude oil volumes at a ratio of six to one, oil and gas production volumes and proved reserve changes summarizedsummarize as follows, on an equivalent barrel (Eq. Bbls) basis:
| | | | | | | | | | | |
| | | (Eq. Bbls.) | | | (Eq. Bbls.) | | | (Eq. Bbls.) | | | | | | | | | | |
| | | | | | | | | | | | (Eq. Bbls.) | | | (Eq. Bbls.) | | | (Eq. Bbls.) | |
| Proved reserves – beginning of year | | | 1,566,000 | | | | 1,450,000 | | | | 1,304,000 | | | | 1,416,000 | | | | 1,779,000 | | | | 1,907,000 | |
| Estimated reserve additions | | | 1,209,000 | | | | 536,000 | | | | 439,000 | | | | 131,000 | | | | 267,000 | | | | 537,000 | |
| Production volumes | | | (377,000 | ) | | | (282,000 | ) | | | (267,000 | ) | | | (316,000 | ) | | | (370,000 | ) | | | (533,000 | ) |
| Producing properties sold | | | (385,000 | ) | | | - | | | | - | | | | (104,000 | ) | | | (5,000 | ) | | | (71,000 | ) |
| Revisions of previous estimates | | | (106,000 | ) | | | (138,000 | ) | | | (26,000 | ) | | | 126,000 | | | | (255,000 | ) | | | (61,000 | ) |
| | | | | | | | | | | | | | |
| Proved reserves - end of year | | | 1,907,000 | | | | 1,566,000 | | | | 1,450,000 | | | | 1,253,000 | | | | 1,416,000 | | | | 1,779,000 | |
During 2011For 2014 and in total for the three year period ended December 31, 2011,2014, estimated reserve additions represented 32041 percent and 23577 percent, respectively, of production volumes. Such reserve additions resulted from active drilling efforts during the periods presented.
The Company’s current drilling and exploration efforts are primarily focused as follows:
Eastin West Texas Project
In 2005,where the Company joined with its partners in acquiring exploration acreage in Nacogdoches and Shelby Counties, Texas. This was subsequently expanded to include acreage in Angelina County, due south of Nacogdoches County. This investment holds potential in the Haynesville/Bossier shale formations. Subsequent drilling determined that a “sweet spot” existed. A total of 86 wells were drilled to date with 66 wells on production and 20 wells currently in the completion stage. The Company’s interest in this project varies from two percent to five percent with an average 2.7 percent ownership in the properties and wells. Production is dry gas and due to current low prices, only 24 wells are planned for 2012 to secure the Company’s acreage position. Approximately 64,000 gross acres are now held by production with 11,700 additional acres under option to earn through drilling. In-field development of this property will resume when justified by higher natural gas prices.
West Texas Project
In 2008, the Company participated with an approximate two2 percent working interest in the acquisition of approximately 49,015 gross acres located in Irion and Crockett Counties, Texas for the purpose of developing the Wolfcamp shale. An aggressive horizontal drilling program is now underway.Shale. A total of 54234 wells have been drilled through December 31, 2014 with 38222 wells on production and 1512 wells being completed. Drilling is expected to accelerate in 2012 with 72 wells scheduled to spud.awaiting completion. Production from the Wolfcamp in this area is oil-rich with large amounts of gas and natural gas liquids. With the present low price environment for both crude oil and natural gas, a reduced level of Wolfcamp drilling is anticipated in 2015 with seven wells scheduled for drilling during the year.
SouthIn addition to the continued, but reduced, Wolfcamp development effort, the Company believes that conventional oil and gas drilling opportunities may materialize during 2015 in Texas, Project
This project includes two approved prospectsKansas, Wyoming and North Dakota. The Company also holds an interest in the Eagle Ford trend of Southapproximately 46,000 acres in Fayette and Lavaca Counties, Texas with approximately 31,000 acres currently under lease. Thea goal of this investment is to extendextending the productiveproducing area of the Eagle Ford trend north in Fayette and Lavaca Counties, Texas. The first core well has been drilled and indications are positive with petrochemical data showingShale trend. However, given the projectcurrent price environment, significant development of this property is on the gas condensate window. Drilling plans initially call for the first horizontal test well to spud during the second quarter of 2012.not likely at present. The Company holdsalso maintains a five percent workingfractional interest in 98 wells on approximately 76,157 acres in the East Texas – Haynesville trend. The Haynesville program is a natural gas development play with all acreage currently held by production.�� Further development of this project.property is contingent on increased natural gas prices.
| | - | Oil and gas property sales |
In January 2011,During 2014, the Company completed the salesold, to third parties, its interest in certain Oklahoma and Texas properties for proceeds totaling $2,553,000 and half of its interest in certain producingSouth Texas (Lavaca County) properties for proceeds totaling $1,509,000. Combined, the Company recorded a $2,528,000 pre-tax gain from these transactions. The Company retained an interest in the South Texas properties as development of such project continues, although the Company chose to reduce its level of risk associated with the development. The other Texas and Oklahoma properties were sold because they were nearing the end of their economic life.
In 2012, the Company sold, to third parties, its interest in two separate oil and gas properties located in the on-shore Gulf Coast region of Texas. Proceeds from the sale totaled $6.2 million and the pre-tax gain from this transaction totaled $2,708,000. Total proved reserves sold were approximately 26,000 barrels of crude oil and 2,148,000 mcf of natural gas. Sales negotiations were conducted by the third party operatorproducing properties. One of the properties on behalf of all working interest owners andwas located on-shore in Texas with the transaction was completed with a separate third party investment entity. The Company’s proportionate interestsecond property located in the transaction was approximately 5 percentfederal waters offshore Louisiana. Proceeds from these two sales totaled $3,049,000 and the Company elected to participaterecorded a $1,728,000 pre-tax gain. Because both properties had depleted substantially from their initial productive period, the sales were consummated before the properties lost further value. Additionally in the sale due to attractive pricing. Also during the first quarter of 2011,2012, the Company sold to a portionthird party fifty percent of its interest in certain non-producingKansas oil and gas properties located in West Texas.order to spur further development on the properties. Total proceeds from the sale were $329,000$578,000 and the Company recorded a $125,000$475,000 pre-tax gain fromon this transaction. Proceeds from the sales were used for general working capital purposes and the Company is continuing with oil and gas exploration operations in the vicinity of the properties sold. In October 2011, the Company sold an interest in certain non-producing properties for $90,000 in proceeds and gain.
sale.
| - | General and administrative expense, interest income and income tax |
General and administrative expenses and interest income were generally consistent during the three year review period ending December 31, 2011 except during 2011 such costs were elevated due to employee bonuses. Interest income declined for 2011, 2010 and 2009 as interest rates on overnight deposits declined to near zero following the significant turmoil that occurred in the financial markets during the fall of 2008.periods presented. The provision for income taxes is based on Federalfederal and Statestate tax rates and variations are consistent with taxable income in the respective accounting periods.
During 2012, the Company sold contracts, inventory and certain equipment associated with its former refined products marketing segment and discontinued that operation. A 2012 pre-tax gain totaling $808,000 net of wind-down costs, resulted from this sale. In 2014, the Company sold the warehouse and real estate used by this former operation for $664,000 in cash resulting in a pre-tax gain on sale of $533,000, with such gain reported in discontinued operations for 2014. Additionally, effective October 31, 2013 the Company completed an orderly wind-down and closure of its natural gas marketing segment due to inadequate earnings. The Company incurred employee severance and other shut-down costs totaling $416,000 as a result of this event. All obligations were satisfied and no further matters are anticipated. See also Note (9) – ‟Discontinued Operations” to Consolidated Financial Statements.
The short-term outlook presumes continued volume and margin strength withinRecent declines in crude oil prices could adversely impact the crude oil marketing operation. Industry competitorsoperations as the Company’s suppliers curtail drilling efforts. Although the goal is to at least maintain current supply volumes. such effort may be at the expense of reduced unit margins. Demand for transportation services remains strong but driver shortages and Company suppliers are aware of the present opportunity, however, and are actively seeking to capture such advantage and unit marginspersistently high operating costs have begun to shrink. Over the course of the mid-term time horizon (3 - 6 months from current date) management anticipates crude oil marketing margins will return to their approximate historical levels. Transportation results slowed in late 2011 but generally look to be stable for 2012. Withinlimited profitability within this segment. For the oil and gas segment,production business, declining natural gasvolumes and reduced prices will suppress earnings. However, the periodic charges for depletion and amortization expenses will be reduced in all likelihood, offset volume increases from2015 following the new wells coming on linewrite-down of oil and gas property costs in 2012. However, absent further declines in commodity prices, the recurrence of property impairment charges is unlikely in 2012. In contrast, should recent escalation in diesel fuel costs continue, 2012 marketing and transportation earnings could be adversely affected to some extent.2014.
The Company has the following major objectives for 2012:2015:
| - | MaintainManage declining marketing segment unit margins to maintain operating earnings at the $28$25 million level exclusive of inventory valuation gains or losses. |
| - | MaintainSolve the driver shortage problem and establish transportation segment operating earnings at the $6$5 million level excluding gains fromlevel. This initiative may be aided by the sale of used equipment.expected slowdown in the 2015 demand for oil and gas field services. |
| - | ReturnRestrict oil and gas segment operating earningsactivity to limited development drilling and only those projects that are economically viable in the current low price scenario. Given the present low price environment, an operating loss at the $2 million level and replace 2011 production with current reserve additions.is anticipated in 2015 for this segment. |
Liquidity and Capital Resources
The Company’s liquidity primarily derives from net cash provided from operating activities, which was $55,815,000, $36,928,000$47,133,000, $43,976,000 and $22,285,000$54,494,000 for each of 2011, 20102014, 2013 and 2009,2012, respectively. As of December 31, 20112014 and 2010,2013, the Company had no bank debt or other forms of debenture obligations. Cash and cash equivalents totaled $37,066,000$80,184,000 as of December 31, 2011,2014, and such balances are maintained in order to meet the timing of day-to-day cash needs. Working capital, the excess of current assets over current liabilities, totaled $48,808,000$82,342,000 as of December 31, 2011.2014. The Company relies on its ability to obtain open-line trade credit from its suppliers especially with respect to its crude oil marketing operation. In this regard, the Company generally maintains substantial cash balances and avoids debt obligations. Cash balances were increased during the current period from $60,733,000 as of year-end 2013 when the Company was able to reduce prepayments and early payments for crude oil supply consistent with the reduced year-end 2014 commodity value for crude oil.
Capital expendituresAt various times during 2011 included $27,802,000 for marketing and transportation equipment additions, primarily consisting of truck-tractors, and $24,580,000 in property additions associated with oil and gas exploration and production activities. For 2012,each month, the Company anticipates expending an additional approximately $19 million on oil and gas development and exploration projects. In addition, approximately $17 million will be expended during 2012 formakes cash prepayments and/or early payments in advance of the purchase of 167 truck-tractors for the transportation segment and approximately $5.3 million will be expended for the purchase of 31 truck-tractors and 18 trailers for the marketing segment with funding for such purchase from available cash flow. These units will serve to replace older units and to increase the marketing fleet. Funding for these 2012 projects will be from operating cash flow and available working capital. Within certain constraints, the proposed projects can be delayed or cancelled should funding become unavailable.
From time to time, the Company may make cash prepaymentsnormal due date to certain suppliers of crude oil and natural gas forwithin the Company’s marketing operations. SuchCrude oil supply prepayments totaled $6,521,000$7,872,000 as of December 31, 20112014 and such amounts will be recouped and advanced from month to month as the suppliers deliver product to the Company. In addition, in order to secure crude oil supply, the Company may also ‟early pay” its suppliers in advance of the normal payment due date of the twentieth of the month following the month of production. Such ‟early payments” reduce cash and accounts payable as of the balance sheet date and totaled $35,500,000 as of December 31, 2014. The Company also requires certain counterparties to make similar early payments or to post cash collateral with the Company in order to support their purchasepurchases from the Company. SuchEarly payments and cash collateral received from customers increases cash and reduces accounts receivable as of the balance sheet date. Early payments received totaled $57,404,000 and cash collateral held by the Company totaled $721,000$8,594,000 as of December 31, 2011. 2014, respectively.
The Company also maintains a stand-by letter of credit facility with Wells Fargo Bank to provide for the issuance of up to $60 million in stand-by letters of credit to the Company’s suppliers of crude oil and natural gas (see Note 1 to Financial Statements).oil. The issuance of stand-by letters of credit enables the Company to avoid posting cash collateral when procuring crude oil and natural gas supply. As of December 31, 2011,2014, letters of credit outstanding totaled $38.9$15.3 million. The issued stand-by letters of credit are cancelled as the underlying purchase obligations are satisfied by cash payment when due. Management believes current cash balances, together with expected cash generated from future operations, and the ease of financing truck and trailer additions through leasing arrangements (should the need arise) will be sufficient to meet short-term and long-term liquidity needs.
The Company utilizes cash from operations to make discretionary investments in its oilmarketing, transportation and natural gas exploration marketing and transportation businesses, which comprise substantially all of the Company’s investing cash outflows for each of the periods in this filing. The Company does not look to proceeds from property sales to fund its cash flow needs. Except for an approximate $10.7 million commitment for transportation equipment, operating leases andcommitments totaling $18,273,000 associated with barge affreightment contracts, storage tank terminal arrangements and office lease space, the Company’s future commitments and planned investments can be readily curtailed if operating cash flows contract.
Capital expenditures during 2014 included $22,592,000 for marketing and transportation equipment additions, primarily consisting of truck-tractors, and $7,931,000 in property additions associated with oil and gas exploration and production activities. For 2015, the Company anticipates expending approximately $3.5 million on oil and gas development and exploration projects and approximately $4.6 million within the transportation segment for facilities expansion and upgrades. Capital expenditures in 2015 for the marketing segment will in large part depend on the evolving situation for crude oil prices. Opportunities exist for expansion of both the trucking and barging aspects of the Company’s marketing business and such capital expenditure decision will be made at the time of implementation. Funding for 2015 projects will be from operating cash flow and available working capital.
Historically, the Company payspaid an annual dividend in the fourth quarter of each year, and the Company paid a $.57$.62 per common share dividend or $2,404,000$2,615,000 was paid to shareholders of record as of December 1, 2011.
3, 2012. On June 17, 2013, the Company initiated a quarterly dividend of $.22 per common share or $928,000. Quarterly dividends of $.22 per common share or $928,000 were also paid during both the third and fourth quarters of 2013 and during each of the four quarters of 2014. The most significant item affecting future increases or decreases in liquidity is earnings from operations and such earnings are dependent on the success of future operations (see Item‟Item 1A. Risk Factors in this annual report of Form 10-K)Factors”).
Off-balance Sheet Arrangements
The Company maintains certain operating lease arrangements primarily with independent truck owner-operators in order to provide truck-tractorfor use of their equipment for the Company’s fleet. Any commitments with independent truck owner-operators areand driver services on a month-to-month basis. In addition, the Company has entered into certain lease and terminal access contracts in order to provide tank storage and dock access for its crude oil marketing business. Such contracts require certain minimum monthly payments for the term of the contracts. All operating lease commitments qualify for off-balance sheet treatment. Rental expense for the years ended December 31, 2011, 2010,2014, 2013, and 20092012 was $7,621,000, $5,870,000$9,755,000, $8,281,000 and $6,898,000,$8,110,000, respectively. As of December 31, 2011,2014, rental commitments under long-term non-cancelable operating leases and terminal arrangements for the next five years are payable as follows: 2012 - $3,059,000; 2013 - $2,148,000; 2014 - $1,468,000; 2015 - $1,201,000;$6,075,000; 2016 - $6,118,000; 2017 - $4,106,000; 2018 - $1,666,000; 2019 – $1,181,000$308,000 and $1,602,000none thereafter.
Contractual Cash Obligations
The Company has no capital lease obligations. The Company has entered into certain operating lease arrangements and terminal access agreements for tankage, truck-tractors, trailersbarges and office space. Funding for these obligations will be from general working capital. A summary of the lease payment periods for contractual cash obligations is as follows (in thousands):
| | | | | | | | | | | | | | | | | | | | | | |
| | | | | | | | | | | | | | | | | | | | | | |
| Lease payments | | $ | 3,059 | | | $ | 2,148 | | | $ | 1,468 | | | $ | 1,201 | | | $ | 1,181 | | | $ | 1,602 | | | $ | 10,659 | |
| | | | | | | | | | | | | | | | | | | |
| | | | | | | | | | | | | | | | | | | | |
| $ | 6,075 | | | $ | 6,118 | | | $ | 4,106 | | | $ | 1,666 | | | $ | 308 | | | $ | - | | | $ | 18,273 | |
In addition to its lease financing obligations, the Company is also committed to purchase certain quantities of crude oil and natural gas in connection with its marketing activities. Such commodity purchase obligations are the basis for commodity sales, which generate the cash flow necessary to meet such purchase obligations. Approximate commodity purchase obligations as of December 31, 20112014 are as follows (in thousands):
| | | January | | | Remaining | | | | | | | | | | | | | |
| | | | | | | | | | | | | | | | | | | |
| Crude Oil | | $ | 242,942 | | | $ | 1,473 | | | $ | - | | | $ | - | | | $ | - | | | $ | 244,415 | |
| Natural Gas | | | 8,622 | | | | 260 | | | | - | | | | - | | | | - | | | | 8,882 | |
| | | $ | 251,564 | | | $ | 1,733 | | | $ | - | | | $ | - | | | $ | - | | | $ | 253,297 | |
| January | | | Remaining | | | | | | | | | | | | | |
| | | | | | | | | | | | | | | | |
| $ | 172,883 | | | $ | 420 | | | $ | - | | | $ | - | | | $ | - | | | $ | 173,303 | |
Insurance
From time to time, the marketplace for all forms of insurance enters into periods of severe cost increases. In the past, during such cyclical periods, the Company has seen costs escalate to the point where desired levels of insurance were either unavailable or unaffordable. The Company’s primary insurance needs are worker’sworkers’ compensation, automobile and umbrella coverage for its trucking fleet and medical insurance for its employees. During each of 2011, 20102014, 2013 and 2009,2012, insurance costs were consistent with activity and totaled $11.2$14.8 million, $10$14.9 million and $10.5$11.5 million, respectively.respectively with 2013 costs elevated due to adverse claims experience. Insurance costcosts may experience renewed rate increases during 20122015 subject to market conditions. Sinceconditions and claims experience. Because the Company is generally unable to pass on such cost increases, any increase will need tomust be absorbed by existing operations.
Competition
In all phases of its operations, the Company encounters strong competition from a number of entities. Many of these competitors possess financial resources substantially in excess of those of the Company. The Company faces competition principally in establishing trade credit, pricing of available materials and quality of service. In its oil and gas operation, the Company also competesservice, as well as for the acquisition of mineral properties. The Company'sCompany’s marketing division competes with major oil companies and other large industrial concerns that own or control significant refining and marketing facilities. These major oil companies may offer their products to others on more favorable terms than those available to the Company. From time to time in recent years, there have been supply imbalances for crude oil and natural gas in the marketplace. This in turn has led to significant fluctuations in prices for crude oil and natural gas. As a result, there is a high degree of uncertainty regarding both the future market price for crude oil and natural gas and the available margin spread between wholesale acquisition costs and sales realization.
Critical Accounting Policies and Use of Estimates
Fair Value Accounting
The Company enters into certain forward commodity contracts that are required to be recorded at fair value and such contracts are recorded as either an asset or liability measured at its fair value. Changes in fair value are recognized immediately in earnings unless the derivatives qualify for, and the Company elects, cash flow hedge accounting. The Company had no contracts designated for hedge accounting during 2011, 20102014, 2013 and 2009.2012.
The Company utilizes a market approach to valuing its commodity contracts. On a contract by contract, forward month by forward month basis, the Company obtains observable market data for valuing its contracts. Such contracts that typically have durations that areof less than 18 months. As of December 31, 2011,2014, all of the Company’s market value measurements were based on either quoted prices in active markets (Level 1 inputs) or from inputs based on observable market data (Level 2 inputs). See discussion under “Fair‟Fair Value Measurements” in Note 1(1) to the Consolidated Financial Statements.
The Company’s fair value contracts give rise to market risk, which represents the potential loss that may result from a change in the market value of a particular commitment. The Company monitors and manages its exposure to market risk to ensure compliance with the Company’s risk management policies. Such policies are regularly assessed to ensure their appropriateness given management’s objectives, strategies and current market conditions.
Trade Accounts
Accounts receivable and accounts payable typically represent the most significant assets and liabilities of the Company. Particularly within the Company’s energy marketing, oil and gas exploration, and production operations, there is a high degree of interdependence with and reliance upon third parties (including transaction counterparties) to provide adequate information for the proper recording of amountsaccounts receivable or payable. Substantially all such third parties are larger firms providing the Company with the source documents for recording trade activity. It is commonplace for these entities to retroactively adjust or correct such documents. This typically requires the Company to absorb, benefit from, or pass along such corrections to another third party.
Due to the volume of and complexity of transactions and the high degree of interdependence with third parties, this is a difficult area to control and manage. The Company manages this process by participating in a monthly settlement process with each of its counterparties. Ongoing account balances are monitored monthly and the Company attempts to gain the cooperation of such counterparties to reconcile outstanding balances. The Company also places great emphasis on collecting cash balances due and paying only bonafide and properly supported claims. In addition, the Company maintains and monitors its bad debt allowance. Nevertheless a degree of risk remains due to the custom and practices of the industry.
Oil and Gas Reserve Estimate
The value of the capitalized cost of oil and natural gas exploration and production related assets are dependent on underlying oil and natural gas reserve estimates. Reserve estimates are based on many subjective factors. The accuracy of reservethese estimates depends on the quantity and quality of geological data, production performance data, and reservoir engineering data, the pricing assumptions utilized as well as the skill and judgment of petroleum engineers in interpreting such data. The process of estimating reserves requires frequent revision of estimates (usually on an annual basis) as additional information becomes available. Calculations of estimated future oil and natural gas revenues are also based on estimates of the timing of oil and natural gas production, and there are no assurances that the actual timing of production will conform to or approximate such estimates. Also, certain assumptions must be made with respect to pricing. The Company’s estimatescalculations assume prices will remain constant from the date of the engineer’s estimates, except for changes reflected under natural gas sales contracts. There can be no assurance that actual future prices will not vary as industry conditions, governmental regulation, political conditions, economic conditions, weather conditions, market uncertainty, and other factors, impact the market price for oil and natural gas.
The Company follows the successful efforts method of accounting, so only costs (including development dry hole costs) associated with producing oil and natural gas wells are capitalized. Estimated oil and natural gas reserve quantities are the basis for the rate of amortization under the Company’s units of production method for depreciating, depleting and amortizing of oil and natural gas properties. Estimated oil and natural gas reserve values also provide the standard for the Company’s periodic review of oil and natural gas properties for impairment.
ContingenciesAREC is named as a defendant in a number of Louisiana based lawsuits involving alleged environmental contamination from prior drilling operations. Such suits typically allege improper disposal of oilfield wastes in earthen pits with one suit alleging oil and gas production subsidence contributing to the formation of a sink hole. AREC is currently named as a defendant in three such suits. While management does not believe that a material adverse effect will result from the claims, significant attorney fees will be incurred to defend these items. As of December 31, 2014 and 2013, the Company has accrued $500,000 and $200,000, respectively, of future legal and/or settlement costs for these matters.
From time to time as incident to its operations, the Company becomes involved in various accidents, lawsuits and/or disputes. Primarily as an operator of an extensive trucking fleet, the Company is a party to motor vehicle accidents, worker compensation claims or other items of general liability as are typical for the industry. In addition, the Company has extensive operations that must comply with a wide variety of tax laws, environmental laws and labor laws, among others. Should an incident occur, management evaluates the claim based on its nature, the facts and circumstances and the applicability of insurance coverage. To the extent management believes that such event may impact the financial condition of the Company, management will estimate the monetary value of the claim and make appropriate accruals or disclosure as provided in the appropriate accounting literature guidelines.
Revenue Recognition
The Company’s crude oil natural gas and refined products marketing customers are invoiced daily or monthly based on contractually agreed upon terms. Revenue is recognized in the month in which the physical product is delivered to the customer. Where required, the Company also recognizes fair value or mark-to-market gains and losses related to its commodity activities. See discussion under Revenue Recognition policy‟Revenue Recognition” in Note 1 of(1) to the Consolidated Financial Statements.
Transportation segment customers are invoiced, and the related revenue is recognized as the service is provided. Oil and natural gas revenue from the Company’s interests in producing wells is recognized as title and physical possession of the oil and natural gas passes to the purchaser.
Recent Accounting Pronouncements
In January 2010,April 2014, the Financial Accounting Standards Board (“(‟FASB”) issued FASB Accounting Standards Update (ASU) No. 2010-03, “Oilupdated guidance changing the criteria for reporting discontinued operations including enhanced disclosure requirements. Under the new guidance, only activities representing a strategic shift in operations are presented as discontinued operations. Such strategic shifts are those having a major effect on the organization’s operations and Gas Reserve Estimations and Disclosures” (ASU No. 2010-03). This update aligns the current oil and gas reserve estimation and disclosure requirements of the Extractive Industries – Oil and Gas topic of the ASC (ASC Topic 932) with the changes required by the SEC final rule, “Modernization of Oil and Gas Reporting,” as discussed above. ASU No. 2010-03 expands the disclosures required for equity method investments, revises the definition of oil and gas producing activities to include nontraditional resources in reserves unless not intended to be upgraded into synthetic oil or gas, amends the definition of proved oil and gas reserves to require 12-month average pricing in estimating reserves, amends and adds definitions in the Master Glossary that is used in estimating proved oil and gas quantities and provides guidance on geographic area with respect to disclosure of information about significant reserves. ASU No. 2010-03 must be applied prospectively as a change in accounting principle that is inseparable from a change in accounting estimate.financial results. The Company adopted ASU No. 2010-03the new guidance effective December 31, 2009.July 1, 2014 and the adoption did not have a material effect on the Company’s Consolidated Financial Statements.
In May 2011,2014, the FASB amended the existing accounting standards for revenue recognition. The amendments are based on the principle that revenue should be recognized to depict the transfer of promised goods or services to customers in an amount that reflects the consideration to which the entity expects to be entitled in exchange for those goods or services. The new guidance is effective January 1, 2017. Early adoption is not permitted. The amendments may be applied retrospectively to each prior period presented or retrospectively with the cumulative effect recognized as of the date of initial application. Management is currently evaluating the impact of these amendments on the Company’s Consolidated Financial Statements and the transition alternatives.
In August 2014, the FASB issued ASU 2011-04, which further amends the Fair Value Measurementsguidance requiring management to perform interim and Disclosures topicannual assessments of an entity’s ability to continue as a going concern within one year of the Accounting Standards Codification. Among other provisions, ASU 2011-04 expands and modifies certain principles and requirements for measuring fair value and disclosing fair value measurement information. ASU 2011-04 is effective for interim and fiscal periods beginning after December 15, 2011. The adoption of ASU 2011-04 is not expected to have a material impact ondate the Company’s financial statements but may resultare issued. The standard also provides guidance on determining when and how to disclose going-concern uncertainties in additional disclosures regarding fair value measurements.
In December 2011, the FASB issued FASB Accounting Standards Update (ASU) 2011-11. This update requires additional disclosures about an entity’s right of setoff and related arrangements associated with its financial and derivative instruments.statements. The ASU requires a tabular presentation that reflects the gross, net and setoff amounts associated with such assets and liabilities among other requirements. The expanded disclosure requirements arenew guidance is effective for the annual reportingperiod ending after December 15, 2016, and interim periods beginning on January 1, 2013. Thethereafter, with early adoption permitted. Management does not expect the adoption of ASU 2011-11 is not expectedthis guidance to result in significant additional disclosures.
have an impact on the Consolidated Financial Statements.
Management believes the impact of other recently issued standards and updates, which are not yet effective, will not have a material impact on the Company’s consolidated financial position, results of operations, or cash flows upon adoption.
Item 7A. QUANTITATIVE AND QUALITATIVE DISCLOSURES ABOUT MARKET RISK
The Company’s exposure to market risk includes potential adverse changes in interest rates and commodity prices.
Interest Rate Risk
The Company had no long-term debt outstanding at December 31, 20112014 and 2010.2013. A hypothetical ten percent adverse change in the floating rate would not have a material effect on the Company’s results of operations for the fiscal year ended December 31, 2011.2014.
Commodity Price Risk
The Company’s major market risk exposure is in the pricing applicable to its marketing and production of crude oil and natural gas. Realized pricing is primarily driven by the prevailing spot prices applicable to oil and gas. Commodity price risk in the Company’s marketing operations represents the potential loss that may result from a change in the market value of an asset or a commitment. From time to time, the Company enters into forward contracts to minimize or hedge the impact of market fluctuations on its purchases of crude oil and natural gas. The Company may also enter into price support contracts with certain customers to secure a floor price on the purchase of certain supply. In each instance, the Company locks in a separate matching price support contract with a third party in order to minimize the risk of these financial instruments. Substantially all forward contracts fall within a six-month to eighteen-month term with no contracts extending longer than two years in duration.
Certain forward contracts are recorded at fair value, depending on management’s assessments of numerous accounting standards and positions that comply with generally accepted accounting principles in the United States. The fair value of such contracts is reflected in the balance sheet as fair value assets and liabilities and any revaluation is recognized on a net basis in the Company’s results of operations. See discussion under “Fair‟Fair Value Measurements” in Note 1 to the Consolidated Financial Statements.
Historically, prices received for oil and natural gas sales have been volatile and unpredictable with price volatility expected to continue. From January 1, 20102013 through December 31, 2011 natural gas price realizations2014, the Company’s crude oil monthly average wholesale purchase costs ranged from a monthly low of $3.42 per mmbtu to a monthly high of $5.80 per mmbtu. Crude oil prices ranged from a monthlyan average low of $70.90$54.60 per barrel to a monthly average high of $109.94$105.44 per barrel during the same period. A hypothetical ten percent additional adverse change in average natural gas and crude oilhydrocarbon prices, assuming no changes in volume levels, would have reduced earnings by approximately $3,252,000$2,684,000 and $2,393,000$4,173,000 for the comparative years ended December 31, 20112014 and 2010,2013, respectively.
ITEM 8. FINANCIAL STATEMENTS AND SUPPLEMENTARY DATA
ADAMS RESOURCES & ENERGY, INC. AND SUBSIDIARIES
INDEX TO FINANCIAL STATEMENTS
| | | Page | |
| | | |
| REPORT OF INDEPENDENT REGISTERED PUBLIC ACCOUNTING FIRM | | | 2931
| |
| | | | |
| FINANCIAL STATEMENTS: | | | | |
| | | | |
Consolidated Balance Sheets as of December 31, 20112014 and 20102013 | | | 3032
| |
| | | | |
| Consolidated Statements of Operations for the Years Ended | | | | |
December 31, 2011, 20102014, 2013 and 20092012 | | | 3133
| |
| | | | |
| Consolidated Statements of Shareholders’ Equity for the Years Ended | | | | |
December 31, 2011, 20102014, 2013 and 20092012 | | | 3234
| |
| | | | |
| Consolidated Statements of Cash Flows for the Years Ended | | | | |
December 31, 2011, 20102014, 2013 and 20092012 | | | 3335
| |
| | | | |
| Notes to Consolidated Financial Statements | | | 3436
| |
REPORT OF INDEPENDENT REGISTERED PUBLIC ACCOUNTING FIRM
To the Board of Directors and Stockholders of
Adams Resources & Energy, Inc.Inc
Houston, Texas
We have audited the accompanying consolidated balance sheets of Adams Resources & Energy, Inc. and subsidiaries (the “Company”"Company") as of December 31, 20112014 and 2010,2013, and the related consolidated statements of operations, shareholders’shareholders' equity, and cash flows for each of the three years in the period ended December 31, 2011.2014. These financial statements are the responsibility of the Company’sCompany's management. Our responsibility is to express an opinion on these financial statements based on our audits.
We conducted our audits in accordance with the standards of the Public Company Accounting Oversight Board (United States). Those standards require that we plan and perform the audit to obtain reasonable assurance about whether the financial statements are free of material misstatement. The Company is not required to have, nor were we engaged to perform, an audit of its internal control over financial reporting. Our audits included consideration of internal control over financial reporting as a basis for designing audit procedures that are appropriate in the circumstances, but not for the purpose of expressing an opinion on the effectiveness of the Company’s internal control over financial reporting. Accordingly, we express no such opinion. An audit also includes examining, on a test basis, evidence supporting the amounts and disclosures in the financial statements,statements. An audit also includes assessing the accounting principles used and significant estimates made by management, as well as evaluating the overall financial statement presentation. We believe that our audits provide a reasonable basis for our opinion.
In our opinion, such consolidated financial statements present fairly, in all material respects, the financial position of Adams Resources & Energy, Inc. and subsidiaries as ofat December 31, 20112014 and 2010,2013, and the results of their operations and their cash flows for the each of the three years in the period ended December 31, 2011,2014, in conformity with accounting principles generally accepted in the United States of America.
As discussedWe have also audited, in Note 1 toaccordance with the Consolidated Financial Statements,standards of the Public Company changed its methodAccounting Oversight Board (United States), the Company's internal control over financial reporting as of accounting for oil and natural gas reserves and disclosures on December 31, 2009.2014, based on the criteria established in Internal Control—Integrated Framework (2013) issued by the Committee of Sponsoring Organizations of the Treadway Commission and our report dated March 13, 2015, expressed an unqualified opinion on the Company's internal control over financial reporting.
/s/DELOITTE Deloitte & TOUCHETouche LLP
Houston, Texas
March 22, 201213, 2015
ADAMS RESOURCES & ENERGY, INC. AND SUBSIDIARIES
CONSOLIDATED BALANCE SHEETS
(In thousands)
| | | | | | | |
| ASSETS | | | | | | | | | | | | |
| CURRENT ASSETS: | | | | | | | | | | | | |
| Cash and cash equivalents | | $ | 37,066 | | | $ | 29,032 | | | $ | 80,184 | | | $ | 60,733 | |
| Accounts receivable, net of allowance for doubtful accounts of | | | | | | | | | | | | | | | | |
| $2,205 and $1,064, respectively | | | 234,515 | | | | 190,169 | | |
| $179 and $252, respectively | | | | 144,434 | | | | 243,930 | |
| Inventories | | | 20,189 | | | | 14,591 | | | | 13,481 | | | | 27,616 | |
| Fair value contracts | | | 2,064 | | | | 2,764 | | | | 936 | | | | 395 | |
| Income tax receivable | | | 480 | | | | 2,316 | | | | 970 | | | | 2,097 | |
| Prepayments | | | 10,651 | | | | 8,104 | | | | 10,940 | | | | 16,779 | |
| Current assets of discontinued operations | | | | - | | | | 180 | |
| | | | | | | | | | | | | | | | | |
| Total current assets | | | 304,965 | | | | 246,976 | | | | 250,945 | | | | 351,730 | |
| | | | | | | | | | | | | | | | | |
| PROPERTY AND EQUIPMENT: | | | | | | | | | | | | | | | | |
| Marketing | | | 38,467 | | | | 25,407 | | | | 65,865 | | | | 52,996 | |
| Transportation | | | 54,359 | | | | 43,131 | | | | 63,239 | | | | 59,185 | |
| Oil and gas (successful efforts method) | | | 81,668 | | | | 73,011 | | | | 88,661 | | | | 98,947 | |
| Other | | | 1,553 | | | | 188 | | | | 186 | | | | 1,305 | |
| | | | 176,047 | | | | 141,737 | | | | 217,951 | | | | 212,433 | |
| | | | | | | | | | | | | | | | | |
| Less – Accumulated depreciation, depletion and amortization | | | (106,812 | ) | | | (94,148 | ) | | | (133,080 | ) | | | (120,568 | ) |
| | | | 69,235 | | | | 47,589 | | | | 84,871 | | | | 91,865 | |
| OTHER ASSETS: | | | | | | | | | | | | | | | | |
| Oil and gas property held for sale | | | - | | | | 3,389 | | |
| Deferred income tax asset | | | 473 | | | | 374 | | |
| Cash deposits and other | | | 4,167 | | | | 2,977 | | | | 4,998 | | | | 4,487 | |
| | | $ | 378,840 | | | $ | 301,305 | | | $ | 340,814 | | | $ | 448,082 | |
| LIABILITIES AND SHAREHOLDERS’ EQUITY | | | | | | | | | | | | | | | | |
| | | | | | | | | | | | | | | | | |
| CURRENT LIABILITIES: | | | | | | | | | | | | | | | | |
| Accounts payable | | $ | 248,656 | | | $ | 200,763 | | | $ | 160,743 | | | $ | 266,099 | |
| Accounts payable – related party | | | 58 | | | | 9 | | | | 51 | | | | 38 | |
| Fair value contracts | | | 681 | | | | 1,478 | | | | 943 | | | | - | |
| Accrued and other liabilities | | | 6,194 | | | | 3,894 | | | | 6,208 | | | | 5,583 | |
| Current deferred income taxes | | | 505 | | | | 854 | | | | 658 | | | | 358 | |
| Current liabilities of discontinued operations | | | | - | | | | 91 | |
| Total current liabilities | | | 256,094 | | | | 206,998 | | | | 168,603 | | | | 272,169 | |
| | | | | | | | | | | | | | | | | |
| LONG-TERM DEBT | | | - | | | | - | | | | - | | | | - | |
| | | | | | | | | | | | | | | | | |
| OTHER LIABILITIES: | | | | | | | | | | | | | | | | |
| Asset retirement obligations | | | 1,568 | | | | 1,390 | | | | 2,464 | | | | 2,564 | |
| Deferred taxes and other liabilities | | | 10,496 | | | | 2,762 | | | | 12,250 | | | | 18,664 | |
| | | | 268,158 | | | | 211,150 | | | | 183,317 | | | | 293,397 | |
| COMMITMENTS AND CONTINGENCIES (NOTE 6) | | | | | | | | | | | | | | | | |
| | | | | | | | | | | | | | | | | |
| SHAREHOLDERS’ EQUITY: | | | | | | | | | | | | | | | | |
| Preferred stock, $1.00 par value, 960,000 shares authorized, | | | | | | | | | | | | | | | | |
| none outstanding | | | - | | | | - | | | | - | | | | - | |
| Common stock, $.10 par value, 7,500,000 shares authorized, | | | | | | | | | | | | | | | | |
| 4,217,596 issued and outstanding | | | 422 | | | | 422 | | | | 422 | | | | 422 | |
| Contributed capital | | | 11,693 | | | | 11,693 | | | | 11,693 | | | | 11,693 | |
| Retained earnings | | | 98,567 | | | | 78,040 | | | | 145,382 | | | | 142,570 | |
| Total shareholders’ equity | | | 110,682 | | | | 90,155 | | | | 157,497 | | | | 154,685 | |
| | | $ | 378,840 | | | $ | 301,305 | | | $ | 340,814 | | | $ | 448,082 | |
The accompanying notes are an integral part of these consolidated financial statements.
ADAMS RESOURCES & ENERGY, INC. AND SUBSIDIARIES
CONSOLIDATED STATEMENTS OF OPERATIONS
(In thousands, except per share data)
| | | | |
| | | | | | | | | | |
| REVENUES: | | | | | | | | | |
| Marketing | | $ | 3,136,838 | | | $ | 2,144,082 | | | $ | 1,889,583 | |
| Transportation | | | 63,501 | | | | 56,867 | | | | 44,895 | |
| Oil and natural gas | | | 14,060 | | | | 11,021 | | | | 8,650 | |
| | | | 3,214,399 | | | | 2,211,970 | | | | 1,943,128 | |
| COSTS AND EXPENSES: | | | | | | | | | | | | |
| Marketing | | | 3,082,140 | | | | 2,124,491 | | | | 1,869,400 | |
| Transportation | | | 51,068 | | | | 45,956 | | | | 38,797 | |
| Oil and gas operations | | | 22,608 | | | | 8,116 | | | | 8,621 | |
| Oil and gas property sale (gain) | | | (2,923 | ) | | | - | | | | - | |
| General and administrative | | | 9,713 | | | | 9,044 | | | | 9,589 | |
| Depreciation, depletion and amortization | | | 16,260 | | | | 11,817 | | | | 10,320 | |
| | | | 3,178,866 | | | | 2,199,424 | | | | 1,936,727 | |
| | | | | | | | | | | | | |
| Operating Earnings | | | 35,533 | | | | 12,546 | | | | 6,401 | |
| | | | | | | | | | | | | |
| Other Income (Expense): | | | | | | | | | | | | |
| Interest income | | | 237 | | | | 191 | | | | 125 | |
| Interest expense | | | (8 | ) | | | (36 | ) | | | (25 | ) |
| | | | | | | | | | | | | |
| Earnings before income taxes | | | 35,762 | | | | 12,701 | | | | 6,501 | |
| | | | | | | | | | | | | |
| Income Tax (Provision) Benefit: | | | | | | | | | | | | |
| Current | | | (5,523 | ) | | | (371 | ) | | | (1,280 | ) |
| Deferred | | | (7,308 | ) | | | (3,699 | ) | | | (1,072 | ) |
| | | | (12,831 | ) | | | (4,070 | ) | | | (2,352 | ) |
| | | | | | | | | | | | | |
| Net Earnings | | $ | 22,931 | | | $ | 8,631 | | | $ | 4,149 | |
| | | | | | | | | | | | | |
| EARNINGS PER SHARE: | | | | | | | | | | | | |
| Basic and diluted net earnings per share | | $ | 5.44 | | | $ | 2.05 | | | $ | .98 | |
| | | | |
| | | | | | | | | | |
| REVENUES: | | | | | | | | | |
| Marketing | | $ | 4,050,497 | | | $ | 3,863,057 | | | $ | 3,292,948 | |
| Transportation | | | 68,968 | | | | 68,783 | | | | 67,183 | |
| Oil and natural gas | | | 13,361 | | | | 14,129 | | | | 15,954 | |
| | | | 4,132,826 | | | | 3,945,969 | | | | 3,376,085 | |
| COSTS AND EXPENSES: | | | | | | | | | | | | |
| Marketing | | | 4,020,017 | | | | 3,815,006 | | | | 3,240,858 | |
| Transportation | | | 56,802 | | | | 56,504 | | | | 51,009 | |
| Oil and natural gas operations | | | 15,826 | | | | 8,748 | | | | 12,941 | |
| Oil and natural gas property sale (gain) | | | (2,528 | ) | | | - | | | | (2,203 | ) |
| General and administrative | | | 8,613 | | | | 9,060 | | | | 8,810 | |
| Depreciation, depletion and amortization | | | 24,615 | | | | 22,275 | | | | 20,714 | |
| | | | 4,123,345 | | | | 3,911,593 | | | | 3,332,129 | |
| | | | | | | | | | | | | |
| Operating Earnings | | | 9,481 | | | | 34,376 | | | | 43,956 | |
| | | | | | | | | | | | | |
| Other Income (Expense): | | | | | | | | | | | | |
| Interest income | | | 301 | | | | 198 | | | | 190 | |
| Interest expense | | | (2 | ) | | | (24 | ) | | | (10 | ) |
| | | | | | | | | | | | | |
| Earnings from continuing operations before income taxes | | | 9,780 | | | | 34,550 | | | | 44,136 | |
| | | | | | | | | | | | | |
| Income Tax (Provision) Benefit: | | | | | | | | | | | | |
| Current | | | (9,712 | ) | | | (9,269 | ) | | | (11,286 | ) |
| Deferred | | | 6,151 | | | | (3,160 | ) | | | (5,378 | ) |
| | | | (3,561 | ) | | | (12,429 | ) | | | (16,664 | ) |
| Earnings from continuing operations | | | 6,219 | | | | 22,121 | | | | 27,472 | |
| Earnings (loss) from discontinued operations net of tax | | | | | | | | | | | | |
| (provision) benefit of $(163), $275 and $(172) respectively | | | 304 | | | | (511 | ) | | | 319 | |
| | | | | | | | | | | | | |
| Net Earnings | | $ | 6,523 | | | $ | 21,610 | | | $ | 27,791 | |
| | | | | | | | | | | | | |
EARNINGS PER SHARE: | | | | | | | | | | | | |
| From continuing operations | | | 1.48 | | | | 5.24 | | | | 6.51 | |
| From discontinued operations | | | .07 | | | | (.12 | ) | | | .08 | |
| Basic and diluted net earnings per share | | $ | 1.55 | | | $ | 5.12 | | | $ | 6.59 | |
| | | | | | | | | | | | | |
| Dividends declared per common share | | $ | .88 | | | $ | .66 | | | $ | .62 | |
The accompanying notes are an integral part of these consolidated financial statements.
ADAMS RESOURCES & ENERGY, INC. AND SUBSIDIARIES
CONSOLIDATED STATEMENTS OF SHAREHOLDERS'SHAREHOLDERS’ EQUITY
(In thousands)
| | | | | | | | | | | | Total | | | | | | | | | | | | Total | |
| | | Common | | | Contributed | | | Retained | | | Shareholders’ | | | Common | | | Contributed | | | Retained | | | Shareholders’ | |
| | | Stock | | | Capital | | | Earnings | | | Equity | | | Stock | | | Capital | | | Earnings | | | Equity | |
| | | | | | | | | | | | | | | | | | | | | | | | | |
| BALANCE, January 1, 2009 | | $ | 422 | | | $ | 11,693 | | | $ | 69,646 | | | $ | 81,761 | | |
| BALANCE, January 1, 2012 | | | $ | 422 | | | $ | 11,693 | | | $ | 98,567 | | | $ | 110,682 | |
| Net earnings | | | - | | | | - | | | | 4,149 | | | | 4,149 | | | | - | | | | - | | | | 27,791 | | | | 27,791 | |
| Dividends paid on common stock | | | - | | | | - | | | | (2,109 | ) | | | (2,109 | ) | | | - | | | | - | | | | (2,615 | ) | | | (2,615 | ) |
| BALANCE, December 31, 2009 | | $ | 422 | | | $ | 11,693 | | | $ | 71,686 | | | $ | 83,801 | | |
| BALANCE, December 31, 2012 | | | $ | 422 | | | $ | 11,693 | | | | 123,743 | | | | 135,858 | |
| Net earnings | | | - | | | | - | | | | 8,631 | | | | 8,631 | | | | - | | | | - | | | | 21,610 | | | | 21,610 | |
| Dividends paid on common stock | | | - | | | | - | | | | (2,277 | ) | | | (2,277 | ) | | | - | | | | - | | | | (2,783 | ) | | | (2,783 | ) |
| BALANCE, December 31, 2010 | | $ | 422 | | | $ | 11,693 | | | $ | 78,040 | | | $ | 90,155 | | |
| BALANCE, December 31, 2013 | | | $ | 422 | | | $ | 11,693 | | | $ | 142,570 | | | $ | 154,685 | |
| Net earnings | | | - | | | | - | | | | 22,931 | | | | 22,931 | | | | - | | | | - | | | | 6,523 | | | | 6,523 | |
| Dividends paid on common stock | | | - | | | | - | | | | (2,404 | ) | | | (2,404 | ) | | | - | | | | - | | | | (3,711 | ) | | | (3,711 | ) |
| BALANCE, December 31, 2011 | | $ | 422 | | | $ | 11,693 | | | $ | 98,567 | | | $ | 110,682 | | |
| BALANCE, December 31, 2014 | | | $ | 422 | | | $ | 11,693 | | | $ | 145,382 | | | $ | 157,497 | |
The accompanying notes are an integral part of these consolidated financial statements.
ADAMS RESOURCES & ENERGY, INC. AND SUBSIDIARIES
CONSOLIDATED STATEMENTS OF CASH FLOWS
(In thousands)
| | | | | | | |
| | | | | | | | | | | | | | | | | | | |
| CASH PROVIDED BY OPERATIONS: | | | | | | | | | | | | | | | | | | |
| Net earnings | | $ | 22,931 | | | $ | 8,631 | | | $ | 4,149 | | | $ | 6,523 | | | $ | 21,610 | | | $ | 27,791 | |
| Adjustments to reconcile net earnings to net cash | | | | | | | | | | | | | | | | | | | | | | | | |
| from operating activities- | | | | | | | | | | | | | | | | | | | | | | | | |
| Depreciation, depletion and amortization | | | 16,260 | | | | 11,817 | | | | 10,320 | | | | 24,615 | | | | 22,275 | | | | 20,714 | |
| Property sale (gains) losses | | | (4,394 | ) | | | 94 | | | | (177 | ) | |
| Property sales (gains) oil and gas | | | | (2,528 | ) | | | - | | | | (2,203 | ) |
| Property sale (gains) other | | | | (1,028 | ) | | | (683 | ) | | | (4,095 | ) |
| Dry hole costs incurred | | | 1,212 | | | | 1,894 | | | | 661 | | | | 1,034 | | | | 233 | | | | 43 | |
| Impairment of oil and natural gas properties | | | 14,749 | | | | 2,224 | | | | 3,773 | | | | 8,009 | | | | 2,630 | | | | 5,555 | |
| Provision for doubtful accounts | | | 1,141 | | | | 29 | | | | 430 | | | | (73 | ) | | | 46 | | | | (51 | ) |
| Deferred income taxes | | | 7,308 | | | | 3,699 | | | | 1,072 | | | | (6,151 | ) | | | 3,161 | | | | 5,378 | |
| Net change in fair value contracts | | | (97 | ) | | | (1,036 | ) | | | 251 | | | | 402 | | | | (389 | ) | | | 1,377 | |
| Decrease (increase) in accounts receivable | | | (45,487 | ) | | | (34,257 | ) | | | (36,515 | ) | | | 99,749 | | | | (4,770 | ) | | | (4,820 | ) |
| Decrease (increase) in inventories | | | (5,598 | ) | | | 669 | | | | (1,053 | ) | | | 14,135 | | | | 606 | | | | (9,579 | ) |
| Decrease (increase) in income tax receivable | | | 1,836 | | | | (145 | ) | | | 1,458 | | | | 1,127 | | | | (898 | ) | | | (719 | ) |
| Decrease (increase) in prepayments | | | (2,547 | ) | | | 2,700 | | | | (5,580 | ) | | | 5,839 | | | | (8,687 | ) | | | 2,559 | |
| Increase (decrease) in accounts payable | | | 47,662 | | | | 40,521 | | | | 43,069 | | | | (104,887 | ) | | | 7,809 | | | | 10,474 | |
| Increase (decrease) in accrued and other liabilities | | | 1,378 | | | | (406 | ) | | | (58 | ) | | | 448 | | | | (516 | ) | | | 1,227 | |
| Other changes, net | | | (539 | ) | | | 494 | | | | 485 | | | | (81 | ) | | | 1,549 | | | | 843 | |
| Net cash provided by operating activities | | | 55,815 | | | | 36,928 | | | | 22,285 | | | | 47,133 | | | | 43,976 | | | | 54,494 | |
| | | | | | | | | | | | | | | | | | | | | | | | | |
| INVESTING ACTIVITIES: | | | | | | | | | | | | | | | | | | | | | | | | |
| Property and equipment additions | | | (53,276 | ) | | | (22,421 | ) | | | (22,390 | ) | | | (30,523 | ) | | | (27,602 | ) | | | (51,012 | ) |
| Insurance and state collateral (deposits) refunds | | | (495 | ) | | | (151 | ) | | | (192 | ) | | | (493 | ) | | | (1,179 | ) | | | (582 | ) |
| Proceeds from property sales | | | 8,394 | | | | 147 | | | | 1,004 | | | | 7,045 | | | | 1,082 | | | | 6,342 | |
| Redemption of short-term investments | | | 11,098 | | | | - | | | | - | | |
| Investment in short-term investments | | | (11,098 | ) | | | - | | | | - | | |
| Proceeds from the sale of discontinued operations | | | | - | | | | - | | | | 3,546 | |
| Net cash (used in) investing activities | | | (45,377 | ) | | | (22,425 | ) | | | (21,578 | ) | | | (23,971 | ) | | | (27,699 | ) | | | (41,706 | ) |
| | | | | | | | | | | | | | | | | | | | | | | | | |
| FINANCING ACTIVITIES: | | | | | | | | | | | | | | | | | | | | | | | | |
| Dividend payments | | | (2,404 | ) | | | (2,277 | ) | | | (2,109 | ) | | | (3,711 | ) | | | (2,783 | ) | | | (2,615 | ) |
| Net cash (used in) financing activities | | | (2,404 | ) | | | (2,277 | ) | | | (2,109 | ) | | | (3,711 | ) | | | (2,783 | ) | | | (2,615 | ) |
| | | | | | | | | | | | | | | | | | | | | | | | | |
| Increase (decrease) in cash and cash equivalents | | | 8,034 | | | | 12,226 | | | | (1,402 | ) | | | 19,451 | | | | 13,494 | | | | 10,173 | |
| | | | | | | | | | | | | | | | | | | | | | | | | |
| Cash and cash equivalents at beginning of year | | | 29,032 | | | | 16,806 | | | | 18,208 | | | | 60,733 | | | | 47,239 | | | | 37,066 | |
| | | | | | | | | | | | | | | | | | | | | | | | | |
| Cash and cash equivalents at end of year | | $ | 37,066 | | | $ | 29,032 | | | $ | 16,806 | | | $ | 80,184 | | | $ | 60,733 | | | $ | 47,239 | |
The accompanying notes are an integral part of these consolidated financial statements.
ADAMS RESOURCES & ENERGY, INC.
NOTES TO CONSOLIDATED FINANCIAL STATEMENTS
| (1) | Summary of Significant Accounting Policies |
Principles of Consolidation
The accompanying consolidated financial statements include the accounts of Adams Resources & Energy, Inc., a Delaware corporation and(‟ARE”) together with its wholly owned subsidiaries (the "Company"‟Company”) after elimination of all intercompany accounts and transactions. The impact on the accompanying financial statements of events occurring after December 31, 2011 has been2014 was evaluated through the date of issuance of these financial statements.
Nature of Operations
The Company is engaged in the business of crude oil natural gas and petroleum products marketing, as well as tank truck transportation of liquid chemicals, and oil and gas exploration and production. Its primary area of operation is within a 1,000 mile radius of Houston, Texas.
Cash and Cash Equivalents
Cash and cash equivalents include any Treasury bill, commercial paper, money market fund or federal funds with maturity of 90 days or less. Depending on cash availability and market conditions, investments in corporate and municipal bonds, which are classified as investments in marketable securities, may also be made from time to time. Cash and cash equivalents are maintained with major financial institutions and such deposits may exceed the amount of federally backed insurance provided. While the Company regularly monitors the financial stability of such institutions, cash and cash equivalents ultimately remain at risk subject to the financial viability of such institutions.
Marketable Securities
From time to time, the Company may invest in marketable securities consisting of investment grade corporate bonds traded in liquid markets. Such bonds are held for the purpose of investing in liquid funds and are not generally intended to be retained on a long term basis. Marketable securities are initially recognized at acquisition costs inclusive of transaction costs and are classified as trading securities. In subsequent periods, marketable securities are valued at fair value. Changes in these fair values are recognized as gains or losses in the accompanying statement of operations under the caption “Costs‟Costs and Expenses – Marketing”. Interest on marketable securities is recognized directly in the statement of operations during the period earned.
Allowance for Doubtful Accounts
Accounts receivable result from salesare the product of crude oil, natural gas and refined products as well as from trucking services. Marketing business wholesale level sales of crude oil and natural gas and the sale of trucking services. Marketing segment wholesale level sales of crude oil comprise in excess of 90 percent of total accounts receivable and under industry practices, such items are “settled”‟settled” and paid in cash within 2520 days of the month following the transaction date. For such receivables, an allowance for doubtful accounts is determined based on specific account identification. The balance of accounts receivable results primarily from salesthe sale of refined petroleum products and trucking services. For this component of receivables, the allowance for doubtful accounts is determined based on a review of specific accounts combined with a review of the general status of the aging of all accounts.
Inventories
Inventory consists of crude oil held in storage tanks and at third-party pipelines as part of the Company’s crude oil marketing operations. Crude oil and petroleum product inventories areinventory is carried at the lower of average cost or market. Petroleum productsDue to declining crude oil prices, for the years ended December 31, 2014 and 2013 the Company recorded inventory includes gasoline, lubricating oilsliquidation and other petroleum products purchased for resale. Components of inventory are as follows (in thousands):valuation losses totaling $14,247,000 and $3,824,000, respectively.
36
| | | | |
| | | | | | | |
| Crude oil | | $ | 18,464 | | | $ | 12,909 | |
| Petroleum products | | | 1,725 | | | | 1,682 | |
| | | | | | | | | |
| | | $ | 20,189 | | | $ | 14,591 | |
Prepayments
The components of prepayments and other are as follows (in thousands):
| | | | | | | |
| | | | | | | | | | | | | |
| Cash collateral deposits for commodity purchases | | $ | 6,521 | | | $ | 5,150 | | | $ | 7,872 | | | $ | 13,705 | |
| Insurance premiums | | | 2,033 | | | | 1,954 | | | | 2,316 | | | | 2,490 | |
| Commodity imbalances and futures | | | 1,452 | | | | 330 | | |
| Rents, license and other | | | 645 | | | | 670 | | | | 752 | | | | 584 | |
| | | | | | | | | | | $ | 10,940 | | | $ | 16,779 | |
| | | $ | 10,651 | | | $ | 8,104 | | |
Property and Equipment
Expenditures for major renewals and betterments are capitalized, and expenditures for maintenance and repairs are expensed as incurred. Interest costs incurred in connection with major capital expenditures are capitalized and amortized over the lives of the related assets. When properties are retired or sold, the related cost and accumulated depreciation, depletion and amortization ("DD&A") is removed from the accounts and any gain or loss is reflected in earnings.
Oil and gas exploration and development expenditures are accounted for in accordance with the successful efforts method of accounting. Direct costs of acquiring developed or undeveloped leasehold acreage, including lease bonus, brokerage and other fees, are capitalized. Exploratory drilling costs are initially capitalized until the properties are evaluated and determined to be either productive or nonproductive. Such evaluations are made on a quarterly basis. If an exploratory well is determined to be nonproductive, the costs of drilling the well are charged to expense. Costs incurred to drill and complete development wells, including dry holes, are capitalized. As of December 31, 2011,2014 and 2013, the Company had no unevaluated or suspended exploratory drilling costs.
Depreciation, depletion and amortization of the cost of proved oil and gas properties is calculated using the unit-of-production method. The reserve base used to calculate depreciation, depletion and amortization for leasehold acquisition costs and the cost to acquire proved properties is the sum of proved developed reserves and proved undeveloped reserves. For lease and well equipment, development costs and successful exploration drilling costs, the reserve base includes only proved developed reserves. All other property and equipment is depreciated using the straight-line method over the estimated average useful lives of three to twenty years.
The Company reviews its long-lived assets for impairment whenever there is evidence that the carrying value of such assets may not be recoverable. Any impairment recognized is permanent and may not be restored. Producing oil and gas properties are reviewed on a field-by-field basis. For properties requiring impairment, the fair value is estimated based on an internal discounted cash-flowcash flow model. Cash flows are developed based on estimated future production and prices and then discounted using a market based rate of return consistent with that used by the Company in evaluating cash flows for other assets of a similar nature. For the years ended December 31, 2011, 20102014, 2013 and 20092012, there were $7,105,000, $946,000$4,001,000, $1,373,000 and $1,350,000$4,699,000 respectively, of impairment provisions on producing oil and gas properties, respectively.properties.
Fair value measurements for producing oil and gas properties that were subject to fair value impairment for the years ended December 31, 20112014 and 20102013 summarized as follows (in thousands):
| | | | | | | |
| | | | | | | |
| | | Producing Properties Subject to Fair | | | Producing Properties Subject to Fair | |
| | | | | | | | | | | | | |
| Net book value at January 1 | | $ | 8,704 | | | $ | 2,220 | | | $ | 10,180 | | | $ | 13,180 | |
| Property additions | | | 16,465 | | | | 1,802 | | | | 469 | | | | 5,661 | |
| Depletion taken | | | (6,633 | ) | | | (753 | ) | | | (1,792 | ) | | | (3,727 | ) |
| Impairment valuation loss | | | (7,105 | ) | | | (946 | ) | | | (4,001 | ) | | | (1,373 | ) |
| Net book at December 31 | | $ | 11,431 | | | $ | 2,323 | | |
| Net book value at December 31 | | | $ | 4,856 | | | $ | 13,741 | |
Fair value measurements for producing oil and gas properties are based on Level 3 – Significant Unobservable Inputs – (see Fair“Fair Value MeasurementsMeasurements” below).
On a quarterly basis, management also evaluates the carrying value of non-producing oil and gas leasehold properties and may deem them impaired based on remaining lease term, area drilling activity in the area and the Company’s plans for the property. This fair value measure depends highly on management’s assessment of the likelihood of continued exploration efforts in a given area and, as such, data inputs are categorized as ‟unobservable or Level 3” inputs. Importantly, this fair value measure only applies to the write-down of capitalized costs and will never result in an increase to reported earnings. Accordingly, impairment provisions on non-producing properties totaling $7,644,000, $1,277,000$4,008,000, $1,257,000 and $2,423,000$856,000 were recorded for the years endedending December 31, 2011, 20102014, 2013 and 2009,2012, respectively. ForCapitalized costs for non-producing properties, impairments are determined based on management’s knowledge of current geological evaluations, drilling results and activity in the area and intent to drill as it relates to the remaining term of the underlying oil and gas leasehold interests currently represent approximately four percent of remaining unamoritized oil and gas property carrying costs and categorize as follows (in thousands):
| | | December 31, | | | December 31, | |
| | | | | | | |
| | | | | | | |
| South Texas Project acreage | | $ | 357 | | | $ | 4,217 | |
| West Texas Project | | | - | | | | 116 | |
| Napoleonville Louisiana acreage | | | 48 | | | | 162 | |
| Other acreage areas | | | 554 | | | | 411 | |
| Total Non-producing Leasehold Costs | | $ | 959 | | | $ | 4,906 | |
The South Texas and Napoleonville acreage areas have active or scheduled drilling operations underway and holding the underlying acreage is essential to the ongoing exploration effort. The ‟Other Acreage Areas” category consists of smaller onshore interests dispersed over a wide geographical area. Since the Company is generally not the operator of its oil and gas property interests, it does not maintain underlying detail acreage data and is dependent on the operator when determining which specific acreage will ultimately be drilled. However, the capitalized cost detail on a property-by-property basis is reviewed by management and deemed impaired if development is not anticipated prior to lease expiration. Onshore leasehold periods are normally three years and may contain renewal options. Capitalized cost activity on the ‟Other Acreage Areas” was as follows (in thousands):
| | | | |
| | | | | | | |
| Net book value January 1 | | $ | 411 | | | $ | 329 | |
| Property additions | | | 580 | | | | 304 | |
| Property sale | | | - | | | | - | |
| Impairments | | | (437 | ) | | | (222 | ) |
| Net book value December 31 | | $ | 554 | | | $ | 411 | |
During 2014, the Company sold substantially all of its producing property interests in Oklahoma. Proceeds totaled $1,731,000 and the Company recorded a $1,149,000 pre-tax gain from this sale. Also during 2014 the Company sold one-half of its interest in sections of its South Texas project interest. Proceeds totaled $1,509,000 and the Company recorded a $632,000 pre-tax gain from this sale. Certain other oil and gas property interests were also sold in 2014 for proceeds totaling $822,000 and gains totaling $747,000. During 2012, the Company sold half of its interest in certain non-producing Kansas oil and gas properties. Proceeds from the sale totaled $578,000 and the Company recorded a $475,000 pre-tax gain from this sale. Also during 2012, the Company sold its interest in two oil and gas producing property units for total proceeds of $3,049,000. The Company realized a $1,728,000 pre-tax gain from these two sales.
During 2014, 2013 and 2012, the Company sold certain used trucks and equipment from its marketing and transportation segments and recorded net pre-tax gains totaling $1,028,000, $683,000 and $2,482,000, respectively.
Cash Deposits and Other Assets
The Company has established certain deposits to support participation in its liability insurance program and remittance of state crude oil severance taxes and other state collateral deposits. Insurance collateral deposits are invested at the discretion of the Company’s insurance carrier and such investments primarily consist of intermediate term federal government bonds and bonds backed by federal agencies. Components of cash deposits and other assets are as follows (in thousands):
| | | | | | | |
| | | | | | | | | | | | | |
| Insurance collateral deposits | | $ | 3,331 | | | $ | 2,291 | | | $ | 4,536 | | | $ | 3,718 | |
| State collateral deposits | | | 168 | | | | 166 | | | | 155 | | | | 160 | |
| Materials and supplies | | | 668 | | | | 520 | | | | 307 | | | | 609 | |
| | | $ | 4,167 | | | $ | 2,977 | | | $ | 4,998 | | | $ | 4,487 | |
Revenue Recognition
Commodity purchase and sale contracts utilized by the Company’s marketing businessesbusiness generally qualify as derivative instruments. Further, all natural gas, as well asinstruments with certain specifically identified crude oil purchase and sale contracts are designated as trading activities. From the time of contract origination, such trading activity contracts are marked-to-market and recorded on a net revenue basis in the accompanying consolidated financial statements.
SubstantiallyMost all crude oil and refined products purchase and sale contracts qualify and are designated as non-trading activities and the Company elects theconsiders such contracts as normal purchases and sales exception methodology for such activity. For normal purchasepurchases and sale activities,sales the Company’s customers are invoiced monthly based upon contractually agreed upon terms with revenue recognized in the month in which the physical product is delivered to the customer. Such sales are recorded gross in the financial statements because the Company takes title, to and has risk of loss for the products, is the primary obligor for the purchase, establishes the sale price independently with a third party, and maintains credit risk associated with the sale of the product.
Certain crude oil contracts may be with a single counterparty to provide for similar quantities of crude oil to be bought and sold at different locations. These contracts are entered into for a variety of reasons, including effecting the transportation of the commodity, to minimize credit exposure, and/or to meet the competitive demands of the customer. Such buy/sell arrangements are reflected on a net revenue basis in the accompanying consolidated financial statements. Reporting such crude oil contracts on a gross revenue basis would increase the Company’s reported revenues by $1,812,561,000, $1,415,844,000$1,272,034,000, $1,602,626,000 and $874,386,000$1,381,352,000 for the years ended December 31, 2011, 20102014, 2013 and 2009,2012, respectively.
Transportation segment customers are invoiced, and the related revenue is recognized as the service is provided. Oil and gas revenue from the Company’s interests in producing wells is recognized as title and physical possession of the oil and gas passes to the purchaser.
Letter of Credit Facility
The Company maintains a Credit and Security Agreement with Wells Fargo Bank to provide a $60 million stand-by letter of credit facility that is used to support the Company’s crude oil and natural gas purchases within the marketing segment. This facility is collateralized by the eligible accounts receivable within those operations.the segment and certain marketing and transportation equipment. Stand-by letters of credit issued totaled $38.9$15.3 million and $23.9$14.6 million as of December 31, 20112014 and 2010,2013, respectively. The issued stand-by letters of credit are cancelled as the underlying purchase obligations are satisfied by cash payment when due.�� The letter of credit facility places certain restrictions on the Company’s Gulfmark Energy, Inc. and Adams Resources Marketing, Ltd. subsidiaries.subsidiary. Such restrictions included the maintenance of a combined 1.1 to 1.0 current ratio and the maintenance of positive net earnings excluding inventory valuation changes, as defined, among other restrictions. Management believes theThe Company is currently in compliance with all such financial covenants.
Statement of Cash Flows
Interest paid totaled $8,000, $36,000$2,000, $24,000 and $25,000$10,000 during the years ended December 31, 2011, 20102014, 2013 and 2009,2012, respectively. IncomeFederal and state income taxes paid during these same periods totaled $5,597,000, $532,000,$8,169,000, $9,949,000, and $1,152,000,$12,650,000, respectively. In addition, State and Federal income tax refunds totaled $2,743,000$18,615, $4,000 and $2,000,000$10,000 in 20112014, 2013 and 2009,2012, respectively. Non-cash investing activities for property and equipment items included in accounts payable as of period end were $4,070,000$1,137,000, $1,507,000 and $2,868,000$2,419,000 as of December 31, 20112014, 2013 and 2010,2012, respectively. There were no significant non-cash financing activities in any of the periods reported.
Earnings per Share
Earnings per share are based on the weighted average number of shares of common stock and potentially dilutive common stock shares outstanding during the period. The weighted average number of shares outstanding was 4,217,596 for 2011, 20102014, 2013 and 2009.2012. There were no potentially dilutive securities outstanding during those periods.
Share-Based Payments
During the periods presented herein, the Company had no stock-based employee compensation plans, nor any other share-based payment arrangements.
Use of Estimates
The preparation of financial statements in conformity with accounting principles generally accepted in the United States requires management to make estimates and assumptions that affect the reported amounts of assets and liabilities at the date of the financial statements and the reported amounts of revenues and expenses during the reporting period. Actual results could differ from those estimates. Examples of significant estimates used in the accompanying consolidated financial statements include the oil and gas reserve volumes that form the foundation for (1) calculating depreciation, depletion and amortization and (2) derivingestimating cash flow estimatesflows to assess impairment triggers orand estimated values associated with oil and gas property,properties. Other examples include revenue accruals, the provision for bad debts, insurance related accruals, income taxes,tax permanent and timing differences, contingencies, and valuation of fair value contracts.
Income Taxes
Income taxes are accounted for using the asset and liability method. Under this approach, deferred tax assets and liabilities are recognized based on anticipated future tax consequences attributable to differences between financial statement carrying amounts of assets and liabilities and their respective tax basis (see(See also Note 2)(2).
Use of Derivative Instruments
The Company’s marketing segment is involved in the purchase and sale of crude oil and natural gas.oil. The Company seeks to make a profit by procuring such commoditiesthis commodity as they areit is produced and then delivering such productsthe material to the end users or the intermediate use marketplace. As is typical for the industry, in certain cases such transactions are made pursuant to the terms of forward month commodity purchase and/or sale contracts. TheseSome of these contracts meet the definition of a derivative instrument and therefore, the Company accounts for such contracts at fair value, unless the normal purchase and sale exception is applicable. Such underlying contracts are standard for the industry and are the governing document for the Company’s crude oil and natural gas wholesale distribution businesses. None of the Company’s derivative instruments have been designated as hedging instruments. The accounting methodology utilized by the Company for its commodity contracts is further discussed below under the caption “Fair‟Fair Value Measurements”.
None of the Company’s derivative instruments have been designated as hedging instruments and theThe estimated fair value of forward month commodity contracts (derivatives) is reflected in the accompanying Consolidated Balance Sheet as of December 31, 20112014 as follows (in thousands):
| | | Balance Sheet Location and Amount | | | Balance Sheet Location and Amount | |
| | | Current | | | Other | | | Current | | | Other | | | Current | | | Other | | | Current | | | Other | |
| | | | | | | | | | | | | | | | | | | | | | | | | |
| Asset Derivatives | | | | | | | | | | | | | | | | | | | | | | | | |
| - Fair Value Commodity | | | | | | | | | | | | | | | | | | | | | | | | |
| Contracts at Gross Valuation | | $ | 3,500 | | | $ | - | | | $ | - | | | $ | - | | | $ | 1,332 | | | $ | - | | | $ | - | | | $ | - | |
| Liability Derivatives | | | | | | | | | | | | | | | | | | | | | | | | | | | | | | | | |
| - Fair Value Commodity | | | | | | | | | | | | | | | | | | | | | | | | | | | | | | | | |
| Contracts at Gross Valuation | | | - | | | | - | | | | 2,117 | | | | - | | | | - | | | | - | | | | 1,339 | | | | - | |
| Less Counterparty Offsets | | | (1,436 | ) | | | - | | | | (1,436 | ) | | | - | | | | (396 | ) | | | - | | | | (396 | ) | | | - | |
| As Reported Fair Value Contracts | | $ | 2,064 | | | $ | - | | | $ | 681 | | | $ | - | | | $ | 936 | | | $ | - | | | $ | 943 | | | $ | - | |
As of December 31, 2014, three purchase and sale contracts comprised the Company’s derivative valuations. The purchase and sale contracts encompass approximately 294 barrels of crude oil per day in each of January and February 2015 and 129 barrels of crude oil per day in March through December 2015.
ForwardThe estimated fair value of forward month commodity contracts (derivatives) areis reflected in the accompanying Consolidated Balance Sheet as of December 31, 20102013 as follows (in thousands):
| | | Balance Sheet Location and Amount | | | Balance Sheet Location and Amount | |
| | | Current | | | Other | | | Current | | | Other | | | Current | | | Other | | | Current | | | Other | |
| | | | | | | | | | | | | | | | | | | | | | | | | |
| Asset Derivatives | | | | | | | | | | | | | | | | | | | | | | | | |
| - Fair Value Commodity | | | | | | | | | | | | | | | | | | | | | | | | |
| Contracts at Gross Valuation | | $ | 8,094 | | | $ | - | | | $ | - | | | $ | - | | | $ | 449 | | | $ | - | | | $ | - | | | $ | - | |
| Liability Derivatives | | | | | | | | | | | | | | | | | | | | | | | | | | | | | | | | |
| - Fair Value Commodity | | | | | | | | | | | | | | | | | | | | | | | | | | | | | | | | |
| Contracts at Gross Valuation | | | - | | | | - | | | | 6,808 | | | | - | | | | - | | | | - | | | | 54 | | | | - | |
| Less Counterparty Offsets | | | (5,330 | ) | | | - | | | | (5,330 | ) | | | - | | | | (54 | ) | | | - | | | | (54 | ) | | | - | |
| As Reported Fair Value Contracts | | $ | 2,764 | | | $ | - | | | $ | 1,478 | | | $ | - | | | $ | 395 | | | $ | - | | | $ | - | | | $ | - | |
As of December 31, 2013, one 100,000 barrel crude oil commodity put option and one commodity purchase and sales contract comprised the Company’s derivative valuations. The purchase and sale contract encompassed 175 barrels of crude oil per day in each of January and February 2014.
The Company only enters into commodity contracts with creditworthy counterparties or obtains collateral support for such activities. As of December 31, 20112014 and 2010,2013, the Company was not holding nor had it posted any collateral to support its forward month fair value derivative activity. The Company is not subject to any credit-risk related trigger events. The Company has no other financial investment arrangements that would serve to offset its derivative contracts.
Forward month commodity contracts (derivatives) are reflected in the accompanying Consolidated Statement of Operations for the years ended December 31, 2011, 20102014, 2013 and 20092012 as follows (in thousands):
| | | | | | | |
| | | | | | | | | | | | | | | | | | |
| Revenues - marketing | | $ | 97 | | | $ | 1,036 | | | $ | (251 | ) | |
| Revenues – marketing | | | $ | 312 | | | $ | (193 | ) | | $ | (1,365 | ) |
Fair Value Measurements
The carrying amount reported in the balance sheetConsolidated Balance Sheet for cash and cash equivalents, accounts receivable and accounts payable approximates fair value because of the immediate or short-term maturity of these financial instruments. Marketable securities are recorded at fair value based on market quotations from actively traded liquid markets.
Fair value contracts consist of derivative financial instruments and are recorded as either an asset or liability measured at fair value. Changes in fair value are recognized immediately in earnings unless the derivatives qualify for, and the Company elects, cash flow hedge accounting. The Company had no contracts designated for hedge accounting during any reporting periods.
Fair value estimates are based on assumptions that market participants would use when pricing an asset or liability and the Company uses a fair value hierarchy of three levels that prioritizes the information used to develop those assumptions. Currently, for all items presented herein, the Company utilizes a market approach to valuing its contracts. On a contract by contract, forward month by forward month basis, the Company obtains observable market data for valuing its contracts. The fair value hierarchy gives the highest priority to quoted prices in active markets and the lowest priority to unobservable data. The fair value hierarchy is summarized as follows:
| | Level 1 – quoted prices in active markets for identical assets or liabilities that may be accessed at the measurement date. Active markets are those in which transactions for the asset or liability occur in sufficient frequency and volume to provide pricing information on an ongoing basis. For Level 1 valuation of marketable securities, the Company utilizes market quotations provided by its primary financial institution and for the valuations of derivative financial instruments, the Company utilizes the New York Mercantile Exchange “NYMEX”‟NYMEX” for such valuations. |
| | Level 2 – (a) quoted prices for similar assets or liabilities in active markets, (b) quoted prices for identical assets or liabilities but in markets that are not actively traded or in which little information is released to the public, (c) observable inputs other than quoted prices, and (d) inputs derived from observable market data. Source data for Level 2 inputs include information provided by the NYMEX, the Intercontinental Exchange “ICE”, published price data and indices, third party price survey data and broker provided forward price statistics. |
| | Level 3 – Unobservable market data inputs for assets or liabilities. |
As of December 31, 2011,2014, the Company’s fair value assets and liabilities are summarized and categorized as follows (in thousands):
| | | | | | | | | | | | | | | | | | | |
| | | Gross Level 1 | | | Gross Level 2 | | | Level 3 | | | Counterparty | | | | | | Gross Level 1 | | | Gross Level 2 | | | Gross Level 3 | | | Counterparty | | | | |
| | | | | | | | | | | | | | | | | | | | | | | | | | | | | | | |
| Derivatives | | | | | | | | | | | | | | | | | | | | | | | | | | | | | | |
| - Current assets | | $ | 1,455 | | | $ | 2,045 | | | $ | - | | | $ | (1,436 | ) | | $ | 2,064 | | | $ | - | | | $ | 1,332 | | | $ | - | | | $ | (396 | ) | | $ | 936 | |
| - Current liabilities | | | (675 | ) | | | (1,442 | ) | | | - | | | | 1,436 | | | | (681 | ) | | | - | | | | (1,339 | ) | | | - | | | | 396 | | | | (943 | ) |
| Net Value | | $ | 780 | | | $ | 603 | | | $ | - | | | $ | - | | | $ | 1,383 | | | $ | - | | | $ | (7 | ) | | $ | - | | | $ | - | | | $ | (7 | ) |
As of December 31, 2010,2013, the Company’s fair value assets and liabilities are summarized and categorized as follows (in thousands):
| | | | | | | | | | |
| | | Gross Level 1 | | | Gross Level 2 | | | Level 3 | | | Counterparty | | | | |
| | | | | | | | | | | | | | | | |
| Derivatives | | | | | | | | | | | | | | | |
| - Current assets | | $ | - | | | $ | 8,094 | | | $ | - | | | $ | (5,330 | ) | | $ | 2,764 | |
| - Current liabilities | | | (118 | ) | | | (6,690 | ) | | | - | | | | 5,330 | | | | (1,478 | ) |
| Net Value | | $ | (118 | ) | | $ | 1,404 | | | $ | - | | | $ | - | | | $ | 1,286 | |
The Company’s gross transaction volumes for physically settled energy trading contracts were approximately 75,890,000 mmbtu’s, 93,827,000 mmbtu’s, and 132,488,000 mmbtu’s in 2011, 2010 and 2009, respectively.| | | | | | | | | | |
| | | Gross Level 1 | | | Gross Level 2 | | | Gross Level 3 | | | Counterparty | | | | |
| | | | | | | | | | | | | | | | |
| Derivatives | | | | | | | | | | | | | | | |
| - Current assets | | $ | - | | | $ | 449 | | | $ | - | | | $ | (54 | ) | | $ | 395 | |
| - Current liabilities | | | - | | | | (54 | ) | | | - | | | | 54 | | | | - | |
| Net Value | | $ | - | | | $ | 395 | | | $ | - | | | $ | - | | | $ | 395 | |
When determining fair value measurements, the Company makes credit valuation adjustments to reflect both its own nonperformance risk and its counterparty’s nonperformance risk. When adjusting the fair value of derivative contracts for the effect of nonperformance risk, the impact of netting and any applicable credit enhancements, such as collateral postings, thresholds, and guarantees are considered. Credit valuation adjustments utilize Level 3 inputs, such as credit scores to evaluate the likelihood of default by the Company or its counterparties. As of December 31, 20112014 and 2010,2013, credit valuation adjustments were not significant to the overall valuation of the Company’s fair value contracts. As a result, applicable fair value assets and liabilities are included in their entirety are classified in Level 2 of the fair value hierarchy.
The following table illustrates the factors impacting the change in the net value of the Company’s fair value contracts for the year ended December 31, 20112014 (in thousands):
| | | Level 1 | | | Level 2 | | | | | | Level 1 | | | Level 2 | | | | |
| | | | | | | | | | | | | | | | | | | |
| Net Fair Value January 1, | | $ | (118 | ) | | $ | 1,404 | | | $ | 1,286 | | | $ | - | | | $ | 395 | | | $ | 395 | |
| - Net realized (gains) losses | | | 118 | | | | (1,404 | ) | | | (1,286 | ) | | | - | | | | 220 | | | | 220 | |
| - Option gain | | | | - | | | | 99 | | | | 99 | |
| - Option collateral | | | | - | | | | (714 | ) | | | (714 | ) |
| - Net unrealized gains (losses) | | | 780 | | | | 603 | | | | 1,383 | | | | - | | | | (7 | ) | | | (7 | ) |
| Net Fair Value December 31, | | $ | 780 | | | $ | 603 | | | $ | 1,383 | | | $ | - | | | $ | (7 | ) | | $ | (7 | ) |
The following table illustrates the factors impacting the change in the net value of the Company’s fair value contracts for the year ended December 31, 20102013 (in thousands):
| | | Level 1 | | | Level 2 | | | | | | Level 1 | | | Level 2 | | | | |
| | | | | | | | | | | | | | | | | | | |
| Net Fair Value January 1, | | $ | 224 | | | $ | 26 | | | $ | 250 | | | $ | - | | | $ | (27 | ) | | $ | (27 | ) |
| - Net realized (gains) losses | | | (224 | ) | | | (26 | ) | | | (250 | ) | | | - | | | | 27 | | | | 27 | |
| - Option deposit | | | | - | | | | 615 | | | | 615 | |
| - Net unrealized gains (losses) | | | (118 | ) | | | 1,404 | | | | 1,286 | | | | - | | | | (220 | ) | | | (220 | ) |
| Net Fair Value December 31, | | $ | (118 | ) | | $ | 1,404 | | | $ | 1,286 | | | $ | - | | | $ | 395 | | | $ | 395 | |
Asset Retirement Obligations
The Company records a liability for the estimated retirement costs associated with certain tangible long-lived assets. The estimated fair value of asset retirement obligations are recorded in the period in which they are incurred and the corresponding cost capitalized by increasing the carrying amount of the related long-lived asset. The liability is accreted to its then present value each period, and the capitalized cost is depreciated over the useful life of the asset or the units of production associated with the related asset. If the liability is settled for an amount other than the recorded amount, a gain or loss is recognized. A summary of the Company’s asset retirement obligations is presented as follows (in thousands):
| | | | | | | | | | | | | |
| Balance on January 1, | | $ | 1,390 | | | $ | 1,315 | | |
| Balance on January 1 | | | $ | 2,564 | | | $ | 1,886 | |
| -Liabilities incurred | | | 164 | | | | 76 | | | | 111 | | | | 431 | |
| -Accretion of discount | | | 82 | | | | 75 | | | | 94 | | | | 85 | |
| -Liabilities settled | | | (68 | ) | | | (76 | ) | | | (305 | ) | | | (138 | ) |
| -Revisions to estimates | | | - | | | | - | | | | - | | | | 300 | |
| Balance on December 31, | | $ | 1,568 | | | $ | 1,390 | | |
| Balance on December 31 | | | $ | 2,464 | | | $ | 2,564 | |
In addition to an accrual for asset retirement obligations, the Company maintains $75,000 in escrow cash, which is legally restricted for the potential purpose of settling asset retirement costs in accordance with certain state regulations. Such cash deposits are included in other assets in the accompanying consolidated balance sheet.
Recent Accounts Pronouncement
In January 2010,April 2014, the Financial Accounting Standards Board (“(‟FASB”) issued FASB Accounting Standards Update (ASU) No. 2010-03, “Oilupdated guidance changing the criteria for reporting discontinued operations including enhanced disclosure requirements. Under the new guidance, only activities representing a strategic shift in operations are presented as discontinued operations. Such strategic shifts are those having a major effect on the organization’s operations and Gas Reserve Estimations and Disclosures” (ASU No. 2010-03). This update aligns the current oil and gas reserve estimation and disclosure requirements of the Extractive Industries – Oil and Gas topic of the ASC (ASC Topic 932) with the changes required by the SEC final rule, “Modernization of Oil and Gas Reporting,” as discussed above. ASU No. 2010-03 expands the disclosures required for equity method investments, revises the definition of oil and gas producing activities to include nontraditional resources in reserves unless not intended to be upgraded into synthetic oil or gas, amends the definition of proved oil and gas reserves to require 12-month average pricing in estimating reserves, amends and adds definitions in the Master Glossary that is used in estimating proved oil and gas quantities and provides guidance on geographic area with respect to disclosure of information about significant reserves. ASU No. 2010-03 must be applied prospectively as a change in accounting principle that is inseparable from a change in accounting estimate.financial results. The Company adopted ASU No. 2010-03the new guidance effective December 31, 2009.July 1, 2014 and the adoption did not have a material effect on the Consolidated Financial Statements.
In May 2011,2014, the FASB issued ASU 2011-04, which further amendsamended the Fair Value Measurements and Disclosures topic of the Accounting Standards Codification. Among other provisions, ASU 2011-04 expands and modifies certain principles and requirementsexisting accounting standards for measuring fair value and disclosing fair value measurement information. ASU 2011-04 is effective for interim and fiscal periods beginning after December 15, 2011.revenue recognition. The adoption of ASU 2011-04 is not expected to have a material impactamendments are based on the Company’s financial statements, but may resultprinciple that revenue should be recognized to depict the transfer of promised goods or services to customers in additional disclosures regarding fair value measurements.
In December 2011, the FASB issued FASB Accounting Standards Update (ASU) 2011-11. This update requires additional disclosures about an entity’s right of setoff and related arrangements associated with its financial and derivative instruments. The ASU requires a tabular presentationamount that reflects the gross, net and setoff amounts associated with such assets and liabilities among other requirements.consideration to which the entity expects to be entitled in exchange for those goods or services. The expanded disclosure requirements arenew guidance is effective for the annual reportingperiod ending after December 15, 2016. Early adoption is not permitted. The amendments may be applied retrospectively to each prior period presented or retrospectively with the cumulative effect recognized as of the date of initial application. Management is currently evaluating the impact of these amendments on the Company’s consolidated financial statements and the transition alternatives.
In August 2014, the FASB issued guidance requiring management to perform interim and annual assessments of an entity’s ability to continue as a going concern within one year of the date the financial statements are issued. The standard also provides guidance on determining when and how to disclose going-concern uncertainties in the financial statements. The new guidance is effective for the annual period ending after December 15, 2016, and interim periods beginning on January 1, 2013. Thethereafter, with early adoption permitted. Management does not expect the adoption of ASU 2011-11 is not expectedthis guidance to result in significant additional disclosures.have an impact on the Consolidated Financial Statements.
Management believes the impact of other recently issued standards and updates, which are not yet effective, will not have a material impact on the Company’s consolidated financial position, results of operations or cash flows upon adoption.
(2) Income Taxes
The following table shows the components of the Company'sCompany’s income tax (provision) benefit (in thousands):
| | | | | | | |
| | | | | | | | | | | | | | | | | | | |
| Current: | | | | | | | | | | | | | | | | | | |
| Federal | | $ | (4,336 | ) | | $ | 350 | | | $ | (649 | ) | | $ | (8,626 | ) | | $ | (8,102 | ) | | $ | (10,282 | ) |
| State | | | (1,187 | ) | | | (721 | ) | | | (631 | ) | | | (1,249 | ) | | | (892 | ) | | | (1,176 | ) |
| | | | (5,523 | ) | | | (371 | ) | | | (1,280 | ) | | | (9,875 | ) | | | (8,994 | ) | | | (11,458 | ) |
| Deferred: | | | | | | | | | | | | | | | | | | | | | | | | |
| Federal | | | (7,407 | ) | | | (3,688 | ) | | | (1,286 | ) | | | 5,878 | | | | (2,682 | ) | | | (4,940 | ) |
| State | | | 99 | | | | (11 | ) | | | 214 | | | | 273 | | | | (478 | ) | | | (438 | ) |
| | | | (7,308 | ) | | | (3,699 | ) | | | (1,072 | ) | | | 6,151 | | | | (3,160 | ) | | | (5,378 | ) |
| | | | | | | | | | | | | | | | | | | | | | | | | |
| | | $ | (12,831 | ) | | $ | (4,070 | ) | | $ | (2,352 | ) | | $ | (3,724 | ) | | $ | (12,154 | ) | | $ | (16,836 | ) |
The following table summarizes the components of the income tax (provision) benefit (in thousands):
| | | | |
| | | | | | | | | | |
| From continuing operations | | $ | (3,561 | ) | | $ | (12,429 | ) | | $ | (16,664 | ) |
| From discontinued operations | | | (163 | ) | | | 275 | | | | (172 | ) |
| | | $ | (3,724 | ) | | $ | (12,154 | ) | | $ | (16,836 | ) |
Taxes computed at the corporate federal income tax rate reconcile to the reported income tax (provision) as follows (in thousands):
| | | | | | | |
| | | | | | | | | | �� | | | | | | | | | |
| Statutory federal income tax (provision) benefit | | $ | (12,517 | ) | | $ | (4,445 | ) | | $ | (2,275 | ) | | $ | (3,587 | ) | | $ | (11,819 | ) | | $ | (15,619 | ) |
| State income tax (provision) benefit | | | (707 | ) | | | (476 | ) | | | (270 | ) | | | (634 | ) | | | (891 | ) | | | (1,049 | ) |
| Federal statutory depletion | | | 393 | | | | 534 | | | | 186 | | | | 549 | | | | 522 | | | | 36 | |
| Foreign investment write-off | | | - | | | | 201 | | | �� | - | | |
| Other | | | - | | | | 116 | | | | 7 | | | | (52 | ) | | | 34 | | | | (204 | ) |
| | | $ | (12,831 | ) | | $ | (4,070 | ) | | $ | (2,352 | ) | | $ | (3,724 | ) | | $ | (12,154 | ) | | $ | (16,836 | ) |
Deferred income taxes reflect the net difference between the financial statement carrying amounts and the underlying income tax basis in such items. The components of the federal deferred tax asset (liability) are as follows (in thousands):
| | | | | | | |
| | | | | | | | | | | | | |
| Current deferred tax asset (liability) | | | | | | | | | | | | |
| Allowance for doubtful accounts | | $ | 772 | | | $ | 372 | | | $ | 62 | | | $ | 424 | |
| Prepaid insurance | | | (793 | ) | | | (776 | ) | |
| Prepaid and other insurance | | | | (719 | ) | | | (855 | ) |
| Fair value contracts | | | (484 | ) | | | (450 | ) | | | (1 | ) | | | 73 | |
| | | | | | | | | | |
| Net current deferred liability | | | (505 | ) | | | (854 | ) | | | (658 | ) | | | (358 | ) |
| | | | | | | | | | | | | | | | | |
| Long-term deferred tax asset (liability) | | | | | | | | | | | | | | | | |
| Property | | | (10,579 | ) | | | (2,885 | ) | | | (12,673 | ) | | | (18,964 | ) |
| Uniform capitalization | | | 471 | | | | 396 | | | | 661 | | | | 613 | |
| Other | | | 160 | | | | 198 | | | | (170 | ) | | | (283 | ) |
| Net long-term deferred tax liability | | | (9,948 | ) | | | (2,291 | ) | | | (12,182 | ) | | | (18,634 | ) |
| | | | | | | | | | |
| Net deferred tax liability | | $ | (10,453 | ) | | $ | (3,145 | ) | | $ | (12,840 | ) | | $ | (18,992 | ) |
Financial statement recognition and measurement of positions taken, or expected to be taken, by an entity in its income tax returns must consider the uncertainty and judgment involved in the determination and filing of income taxes. Tax positions taken in an income tax return that are recognized in the financial statements must satisfy a more-likely-than-not recognition threshold, assuming that the tax position will be examined by taxing authorities with full knowledge of all relevant information. As of December 31, 2010, the Company had accrued approximately $27,000 including approximately $8,000 of potential interest and penalty, respectively, applicable to certain open and unfiled state tax returns. A reconciliation of the unrecognized tax benefits is as follows (in thousands):
| | | | | | | |
| Balance as of January 1, | | $ | 19 | | | $ | 72 | |
| Additions for tax positions of prior years | | | - | | | | - | |
| Reductions of prior positions | | | (19 | ) | | | (53 | ) |
| Balance as of December 31, | | $ | - | | | $ | 19 | |
The Company has filed all remaining open returns and expects final resolution with all states by year-end 2011. As the actual tax payments are made, the accrual is reduced. The Company has no othersignificant unrecognized tax benefits. Interest and penalties associated with income tax liabilities are classified as income tax expense.
The earliest tax years remaining open for audit for Federalfederal and major states of operations are as follows:
| | Earliest Open |
| | |
| | |
| Federal | 20082011 |
| Texas | 20072010 |
| Louisiana | 20082011 |
| Michigan | 20082011 |
(3) Concentration of Credit Risk
Credit risk represents the amount of loss the Company would absorb if its customers failedfail to perform pursuant to contractual terms. Management of credit risk involves a number of considerations, such as the financial profile of the customer, the value of collateral held, if any, specific terms and duration of the contractual agreement, and the customer'scustomer’s sensitivity to economic developments. The Company has established various procedures to manage credit exposure, including initial credit approval, credit limits, and rights of offset. Letters of credit and guarantees are also utilized to limit credit risk. Accounts receivable associated with crude oil and natural gas marketing activities comprise approximately 90 percent of the Company’s total receivables and industry practice requires payment for such sales to occur within 2520 days of the end of the month following a transaction. The Company’s customer mix,makeup, credit policies and the relatively short duration of receivables mitigate the uncertainty typically associated with receivables management.
The Company’s largest customers consist of large multinational integrated oil companies and utilities.independent domestic refiners of crude oil. In addition, the Company transacts business with independent oil producers, major chemical concerns, crude oil and natural gas trading companies and a variety of commercial energy users. Within this group of customers, the Company generally derives up toapproximately 50 percent of its revenues from twothree to threefive large crude oil refining concerns. While the Company has ongoing established relationships with certain domestic refiners of crude oil, alternative markets are readily available since the Company supplies less than one percent of U. S.U.S. domestic refiner demand. As a fungible commodity delivered to major Gulf Coast supply points, the Company’s crude oil sales can be readily delivered to alternative end markets. Management believes that a loss of any of those customers where the Company currently derives more than 10 percent of its revenues would not have a material adverse effect on the Company’s operations.
TheDuring 2014, the Company had accounts receivablerevenues from two customers that comprised 24.520.3 percent and 21.514.0 percent, respectively, of total accounts receivable at December 31, 2011. Fourrevenues. The Company had revenues from four customers in 2013 that comprised 18.218.5 percent, 15.417.7 percent, 13.415.8 percent and 11.310.4 percent respectively, of total revenues, during 2011. The Company had accounts receivable from fourrespectively. During 2012, three customers that comprised 22.4 percent, 16.2 percent, 13.7 percent and 10.6 percent, respectively, of total accounts receivable at December 31, 2010. Five customers comprised 35.8 percent, 20.2 percent, 17.9 percent 13and 16.8 percent and 11 percent, respectively, of total revenues during 2010. Therevenues.
As of December 31, 2014 the Company had accounts receivable from three customers that comprised 17.816.6 percent, 12.616.6 percent and 10.810.4 percent, respectively, of total accounts receivables atreceivable. As of December 31, 2009. Three2013 the Company had accounts receivable from three customers that comprised 39.416.0 percent, 17.715.8 percent and 15.712.7 percent, respectively of total revenues during 2009.accounts receivables. As of December 31, 2012 three customers comprised 22.1 percent, 21.4 percent and 11.4 percent, respectively, of total accounts receivable.
An allowance for doubtful accounts is provided where appropriate and accounts receivable presented herein are net of allowances for doubtful accounts of $2,205,000$179,000 and $1,064,000$252,000 at December 31, 20112014 and 2010,2013, respectively. As reflected in the table below, during 2011 and 2009 the Company’s provision for bad debt was elevated as a result of deteriorating collectability primarily attributable to diesel fuel sales to the construction industry.
An analysis of the changes in the allowance for doubtful accounts is presented as follows (in thousands):
| | | | | | | | | | | | | | | | | | | |
| Balance, beginning of year | | $ | 1,064 | | | $ | 1,681 | | | $ | 1,251 | | | $ | 252 | | | $ | 206 | | | $ | 357 | |
| Provisions for bad debts | | | 1,223 | | | | 29 | | | | 704 | | | | 50 | | | | 147 | | | | - | |
| Less: Write-offs and recoveries | | | (82 | ) | | | (646 | ) | | | (274 | ) | | | (123 | ) | | | (101 | ) | | | (151 | ) |
| Balance, end of year | | $ | 2,205 | | | $ | 1,064 | | | $ | 1,681 | | | $ | 179 | | | $ | 252 | | | $ | 206 | |
(4) Employee Benefits
The Company maintains a 401(k) savings plan for the benefit of its employees. The Company’s contributory expenses for the plan were $597,000, $565,000$691,000, $674,000 and $578,000$645,000 in 2011, 20102014, 2013 and 2009,2012, respectively. No other pension or retirement plans are maintained by the Company.
(5) Transactions with Affiliates
The late Mr. K. S. Adams, Jr., former Chairman and Chief Executive Officer,of the Board and certain of his family partnerships and affiliates have participated as working interest owners with the Company’s subsidiary, Adams Resources Exploration Corporation.Corporation (‟AREC”). Mr. Adams and suchthe affiliates participateparticipated on terms similar to those afforded other non-affiliated working interest owners. In recent years,While the affiliates have generally maintained their existing property interest, they have not participated in any such related party transactions generally resultoriginating after the Company has first identified oil and gas prospectsdeath of interest. Typically the available dollar commitment to participateMr. Adams in such transactions is greater than the amount management is comfortable putting at risk. In such event, the Company first determines the percentage of the transaction it wants to obtain, which allows a related party to participate in the investment to the extent there is excess available. In those instances where there was no excess availability there has been no related party participation. Similarly, related parties are not required to participate, nor is the Company obligated to offer any such participation to a related or other party. When such related party transactions occur, they are individually reviewed and approved by the Audit Committee comprised of the independent directors on the Company’s Board of Directors. During 2011 and 2010, the Company’s investment commitments totaled approximately $24.6 million and $11.7 million, respectively, in those oil and gas projects where a related party was also participating in such investments.October 2013. As of December 31, 20112014 and 2010,2013, the Company owed a combined net total of $58,000$51,000 and $9,000,$38,000, respectively, to these related parties. In connection with the operation of certain oil and gas properties, the Company also charges such related parties for administrative overhead primarily as prescribed by the Council of Petroleum Accountants Society Bulletin 5. Such overhead recoveries totaled $145,000, $160,000$151,000, $152,000 and $150,000$152,000 for the years ended December 31, 2011, 2010,2014, 2013, and 2009,2012, respectively.
The Company also enters into certain transactions in the normal course of business with other affiliated entities including direct cost reimbursement for shared phone and administrative services. For the years ended December 31, 2011, 20102014, 2013 and 2009,2012, the affiliated entities charged the Company $42,000, $43,000$65,000, $69,000 and $62,000,$64,000, respectively, of expense reimbursement and the Company charged the affiliates $118,000, $117,000$42,000, $99,000 and $127,000,$98,000, respectively, for such expense reimbursements. In January 2012, the company relocatedThe Company also leases its primarycorporate office lease space toin a building operated by an affiliated entity. Estimated annual rental expense, including pro-rata building operating expense are $480,000 per year under a seven year lease term. The lease rental rate was determined by an independent appraisal.
Rental expense paid to the related party for 2014 and 2013 totaled $607,000 and $481,000, respectively. Additionally, in 2014, the Company engaged a professional services firm controlled by Townes Pressler, a member of the Company’s Board of Directors, to conduct a crude oil supply availability study. Total study costs incurred were $70,420.
(6) Commitments and Contingencies
Rental expense primarily results from payments toThe Company maintains certain operating lease arrangements with independent truck owner-operators for use of their equipment and driver services on a month-to-month basis. The Company has also entered into longer term operating lease arrangements for tractors, trailers, office space, and other equipment and facilities. In addition, the Company has entered into certain lease and terminal access contracts in order to provide tank storage and dock access for its crude oil marketing business. All operating lease commitments qualify for off-balance sheet treatment. Such contracts require certain minimum monthly payments for the term of the contracts. Rental expense for the years ended December 31, 2011, 2010,2014, 2013, and 20092012 was $7,621,000, $5,870,000$9,755,000, $8,281,000 and $6,898,000,$8,110,000, respectively. At December 31, 2011,2014, commitments under long-term non-cancelable operating leases and terminal arrangements for the next five years and thereafter are payable as follows: 2012 - $3,059,000; 2013 - $2,148,000; 2014 - $1,468,000; 2015 - $1,201,000;$6,075,000; 2016 $1,181,000- $6,118,000; 2017 - $4,106,000; 2018 - $1,666,000; 2019 - $308,000 and $1,602,000none thereafter.
Under certain of the Company’s automobile and workers’ compensation insurance policies, the Company can either receive a return of premium paid or be assessed for additional premiums up to pre-established limits. Additionally, under the policies in certain instances the risk of insured losses is shared with a group of similarly situated entities. The Company has appropriately recognized estimated expenses and liabilities related to these policies for losses incurred but not reported to the Company or its insurance carrier of $1,285,000$2,585,000 and $2,125,911$1,796,000 as of December 31, 20112014 and 2010,2013, respectively.
The Company maintains a self-insurance program for managing employee medical claims. A liability for expected claims incurred is established on a monthly basis and as claims are paid, the liability is relieved. As of December 31, 2014 and 2013, accrued medical claims totaled $1,057,000 and $1,129,000, respectively. The Company maintains third party insurance stop-loss coverage for annual individual medical claims exceeding $100,000. In addition, the Company maintains $2 million of umbrella insurance coverage for aggregate medical claims exceeding approximately $4.5 million for the calendar years 2014 and 2015.
AREC is named as a defendant in a number of Louisiana based suits involving alleged environmental contamination from prior drilling operations. Such suits typically allege improper disposal of oilfield wastes in earthen pits with one suit alleging subsidence contributing of the formation of a sink hole. AREC is currently involved in three such suits. The suits are styled LePetit Chateau Deluxe v. Adams Resources Exploration Corporation dated March 2004, Gustave J. LaBarre, Jr., et. al. v. Adams Resources Exploration Corporation et al dated October 2012 and Henning Management, LLC v. Adams Resources Exploration Corporation dated November 2013. Each suit involves multiple industry defendants with substantially larger proportional interest in the properties except all the larger defendants have settled their claims in the LePetit Chateau Deluxe matter. The plaintiffs in each of these matters are seeking unspecified compensatory and punitive damages. In August 2014, AREC was dismissed from a similar suit styled Edward Conner, et al v. Adams Resources Exploration Corporation dated October 2013. While management does not believe that a material adverse effect will result from the claims, significant attorney fees will be incurred to defend these items. As of December 31, 2014 and 2013, the Company has accrued $500,000 and $200,000, respectively, of future legal and/or settlement costs for these matters.
From time to time as incidental to its operations, the Company may become involved in various lawsuits and/or disputes. Primarily as an operator of an extensive trucking fleet, the Company is a party to motor vehicle accidents, worker compensation claims and other items of general liability as would be typical for the industry. Management of the Company is presently unaware of any claims against the Company that are either outside the scope of insurance coverage, or that may exceed the level of insurance coverage and, therefore could potentially represent a material adverse effect on the Company’s financial position or results of operations.
(7) Guarantees
Pursuant to arranging operating lease financing for truck-tractors and tank trailers, individual subsidiaries of the Company may guarantee the lessor a minimum residual equipment sales value upon the expiration of a lease and sale of the underlying equipment. The Company believes performance under these guarantees to be remote. Aggregate guaranteed residual values for tractors and trailers under operating leases as of December 31, 2011 are as follows (in thousands):
| | | | | | | | | | | | | | | | |
| Equipment residual values | | $ | 72 | | | $ | 216 | | | $ | - | | | $ | - | | | $ | 288 | |
In connection with certain contracts for the purchase and resale of branded motor fuels, the Company has received certain price discounts from its suppliers toward the purchase of gasoline and diesel fuel. Such discounts have been passed through to the Company’s customers as an incentive to offset a portion of the costs associated with offering branded motor fuels for sale to the general public. Under the terms of the supply contracts, the Company and its customers are not obligated to return the price discounts, provided the gasoline service station offering such product for sale remains as a branded station for periods ranging from three to ten years. The Company has a number of customers and stations operating under such arrangements, and the Company’s customers are contractually obligated to remain a branded dealer for the required periods of time. Should the Company’s customers seek to void such contracts, the Company would be obligated to return a portion of such discounts received to its suppliers. As of December 31, 2011, the maximum amount of such potential obligation is approximately $1,712,000. Management of the Company believes its customers will adhere to their branding obligations and no such refunds will result. In addition, effective February 27, 2012 this obligation was assumed by the purchaser of the Company’s refined products contracts. See also Note (10) of Notes to Financial Statements.
Presently, neither Adams Resources & Energy, Inc. (“ARE”) nor any of its subsidiaries has any other types of guarantees outstanding that require liability recognition.
ARE frequently issues parent guarantees of commitments resulting fromassociated with the ongoing activities of its subsidiary companies. The guarantees generally result from subsidiary commodity purchase obligations, subsidiary operating lease commitments and subsidiary banking transactions. The nature of such items is to guarantee the performance of the subsidiary companies in meeting their respective underlying obligations. Except for operating lease commitments and letters of credit, all such underlying obligations are recorded on the books of the subsidiary companies and are included in the consolidated financial statementsConsolidated Financial Statements included herein. Therefore, no such obligation is recorded again on the books of the parent. The parent would only be called upon to perform under the guarantee in the event of a payment default by the applicable subsidiary company. In satisfying such obligations, the parent would first look to the assets of the defaulting subsidiary company.
As of December 31, 2011,2014, parental guaranteed obligations are approximately as follows (in thousands):
| | | | | | | | | | | | | | | | | | | | | | | | | | | | | | | | | | | | | |
| Lease payments | | $ | 56 | | | $ | 47 | | | $ | - | | | | - | | | | - | | | | 103 | | |
| Equipment residual values | | | 72 | | | | 216 | | | | - | | | | - | | | | - | | | | 288 | | |
| Commodity purchases | | | 68,815 | | | | - | | | | - | | | | - | | | | - | | | | 68,815 | | | $ | 41,110 | | | | - | | | | - | | | | - | | | | - | | | $ | 41,110 | |
| Letters of credit | | | 38,925 | | | | - | | | | - | | | | - | | | | - | | | | 38,925 | | | | 15,300 | | | | - | | | | - | | | | - | | | | - | | | | 15,300 | |
| | | $ | 107,868 | | | $ | 263 | | | $ | - | | | $ | - | | | $ | - | | | $ | 108,131 | | | $ | 56,410 | | | $ | - | | | $ | - | | | $ | - | | | $ | - | | | $ | 56,410 | |
Presently, neither ARE nor any of its subsidiaries has any other types of guarantees outstanding that require liability recognition.
(8) Segment Reporting
The Company is engaged in the business of crude oil natural gas and petroleum products marketing as well as tank truck transportation of liquid chemicals, and oil and gas exploration and production. Information concerning the Company'sCompany’s various business activities is summarized as follows (in thousands):
| | | | | | Segment Operating | | | Depreciation Depletion and | | | Property and Equipment | |
| | | Revenues | | | Earnings (loss) | | | Amortization | | | Additions | |
| Year ended December 31, 2011- | | | | | | | | | | | | |
| Marketing | | | | | | | | | | | | |
| - Crude oil | | $ | 2,961,176 | | | $ | 49,237 | | | $ | 3,724 | | | $ | 13,554 | |
| - Natural gas | | | 6,251 | | | | 2,147 | | | | 3 | | | | 64 | |
| - Refined products | | | 169,411 | | | | (788 | ) | | | 375 | | | | 66 | |
| Marketing Total | | | 3,136,838 | | | | 50,596 | | | | 4,102 | | | | 13,684 | |
| Transportation | | | 63,501 | | | | 8,521 | | | | 3,912 | | | | 14,118 | |
| Oil and gas | | | 14,060 | | | | (13,871 | ) | | | 8,246 | | | | 24,580 | |
| | | $ | 3,214,399 | | | $ | 45,246 | | | $ | 16,260 | | | $ | 52,382 | |
| Year ended December 31, 2010- | | | | | | | | | | | | | | | | |
| Marketing | | | | | | | | | | | | | | | | |
| - Crude oil | | $ | 2,005,301 | | | $ | 13,530 | | | $ | 2,320 | | | $ | 6,051 | |
| - Natural gas | | | 10,592 | | | | 3,073 | | | | 44 | | | | 115 | |
| - Refined products | | | 128,189 | | | | 121 | | | | 503 | | | | 146 | |
| Marketing Total | | | 2,144,082 | | | | 16,724 | | | | 2,867 | | | | 6,312 | |
| Transportation | | | 56,867 | | | | 6,623 | | | | 4,288 | | | | 4,410 | |
| Oil and gas | | | 11,021 | | | | (1,757 | ) | | | 4,662 | | | | 11,699 | |
| | | $ | 2,211,970 | | | $ | 21,590 | | | $ | 11,817 | | | $ | 22,421 | |
| Year ended December 31, 2009- | | | | | | | | | | | | | | | | |
| Marketing | | | | | | | | | | | | | | | | |
| - Crude oil | | $ | 1,770,600 | | | $ | 15,404 | | | $ | 1,997 | | | $ | 1,947 | |
| - Natural gas | | | 14,232 | | | | 2,749 | | | | 166 | | | | - | |
| - Refined products | | | 104,751 | | | | (666 | ) | | | 533 | | | | 177 | |
| Marketing Total | | | 1,889,583 | | | | 17,487 | | | | 2,696 | | | | 2,124 | |
| Transportation | | | 44,895 | | | | 2,128 | | | | 3,970 | | | | 7,524 | |
| Oil and gas | | | 8,650 | | | | (3,625 | ) | | | 3,654 | | | | 12,742 | |
| | | $ | 1,943,128 | | | $ | 15,990 | | | $ | 10,320 | | | $ | 22,390 | |
| | | | | | Segment Operating | | | Depreciation Depletion and | | | Property and Equipment | |
| | | Revenues | | | Earnings (loss) | | | Amortization | | | Additions | |
| Year ended December 31, 2014- | | | | | | | | | | | | |
| Marketing | | $ | 4,050,497 | | | $ | 20,854 | (1) | | $ | 9,626 | | | $ | 13,598 | |
| Transportation | | | 68,968 | | | | 4,750 | | | | 7,416 | | | | 8,994 | |
| Oil and gas | | | 13,361 | | | | (7,510 | )(2) | | | 7,573 | | | | 7,931 | |
| | | $ | 4,132,826 | | | $ | 18,094 | | | $ | 24,615 | | | $ | 30,523 | |
| Year ended December 31, 2013- | | | | | | | | | | | | | | | | |
| Marketing | | $ | 3,863,057 | | | $ | 40,369 | (1) | | $ | 7,682 | | | $ | 11,343 | |
| Transportation | | | 68,783 | | | | 5,180 | | | | 7,099 | | | | 3,165 | |
| Oil and gas | | | 14,129 | | | | (2,113 | )(2) | | | 7,494 | | | | 13,094 | |
| | | $ | 3,945,969 | | | $ | 43,436 | | | $ | 22,275 | | | $ | 27,602 | |
| Year ended December 31, 2012- | | | | | | | | | | | | | | | | |
| Marketing | | $ | 3,292,948 | | | $ | 46,145 | (1) | | $ | 5,945 | | | $ | 12,391 | |
| Transportation | | | 67,183 | | | | 10,253 | | | | 5,921 | | | | 15,538 | |
| Oil and gas | | | 15,954 | | | | (3,632 | )(2) | | | 8,848 | | | | 23,083 | |
| | | $ | 3,376,085 | | | $ | 52,766 | | | $ | 20,714 | | | $ | 51,012 | |
| | Intersegment__________________________________ |
| (1) Marketing segment operating earnings included inventory liquidation and valuation losses totaling $14,247,000, $3,824,000 and $1,596,000 for 2014, 2013 and 2012, respectively. |
| (2) Oil and gas segment operating earnings include gains on property sales are insignificanttotaling $2,528,000 and all sales by the Company occurred in the United States.$2,203,000 during 2014 and 2012, respectively, and property impairments totaling $8,009,000, $2,630,000 and $5,555,000 for 2014, 2013 and 2012, respectively. |
Segment operating earnings reflect revenues net of operating costs and depreciation, depletion and amortization and are reconciled to earnings from continuing operations before income taxes, as follows (in thousands):
| | | | |
| | | | | | | | | | |
| Segment operating earnings | | $ | 45,246 | | | $ | 21,590 | | | $ | 15,990 | |
| - General and administrative expenses | | | (9,713 | ) | | | (9,044 | ) | | | (9,589 | ) |
| Operating earnings | | | 35,533 | | | | 12,546 | | | | 6,401 | |
| - Interest income | | | 237 | | | | 191 | | | | 125 | |
| - Interest expense | | | (8 | ) | | | (36 | ) | | | (25 | ) |
| Earnings before income taxes | | $ | 35,762 | | | $ | 12,701 | | | $ | 6,501 | |
| | | | |
| | | | | | | | | | |
| Segment operating earnings | | $ | 18,094 | | | $ | 43,436 | | | $ | 52,766 | |
| - General and administrative expenses | | | (8,613 | ) | | | (9,060 | ) | | | (8,810 | ) |
| Operating earnings | | | 9,481 | | | | 34,376 | | | | 43,956 | |
| - Interest income | | | 301 | | | | 198 | | | | 190 | |
| - Interest expense | | | (2 | ) | | | (24 | ) | | | (10 | ) |
| Earnings from continuing operations before | | | | | | | | | | | | |
| income taxes and discontinued operations | | $ | 9,780 | | | $ | 34,550 | | | $ | 44,136 | |
Identifiable assets by industry segment are as follows (in thousands):
| | | | |
| | | | | | | |
| Marketing | | | | | | |
| - Crude oil | | $ | 253,817 | | | $ | 184,299 | |
| - Natural gas | | | 12,246 | | | | 19,948 | |
| - Refined products | | | 11,700 | | | | 11,594 | |
| Marketing Total | | | 277,763 | | | | 215,841 | |
| Transportation | | | 27,221 | | | | 17,378 | |
| Oil and gas | | | 29,105 | | | | 32,563 | |
| Other | | | 44,751 | | | | 35,523 | |
| | | $ | 378,840 | | | $ | 301,305 | |
| | | | |
| | | | | | | | | | |
| Marketing | | $ | 189,332 | | | $ | 306,693 | | | $ | 277,920 | |
| Transportation | | | 37,643 | | | | 34,406 | | | | 38,940 | |
| Oil and gas | | | 25,888 | | | | 37,093 | | | | 35,788 | |
| Cash and other | | | 87,951 | | | | 69,890 | | | | 66,853 | |
| | | $ | 340,814 | | | $ | 448,082 | | | $ | 419,501 | |
Intersegment sales are insignificant and all sales occurred in the United States. Other identifiable assets are primarily corporate cash, corporate accounts receivable, and properties not identified with any specific segment of the Company'sCompany’s business. Accounting policies for transactions between reportable segments are consistent with applicable accounting policies as disclosed herein.
(9) Discontinued Operations
In February 2012, the Company completed the sale of contracts, inventory and certain equipment associated with the former refined products segment of its marketing business. Revenues from this segment included in net earnings from discontinued operations totaled $25,717,000 for 2012. The business had experienced marginal results including an operating loss during 2011. The Company received $2 million in cash proceeds plus a cash payment of $1,546,000 for the agreed value of refined product inventories on the date of sale. A pre-tax gain net of wind-down costs recognized from this transaction in 2012 totaled $808,000. The Company’s fee interest in certain parcels of real estate were initially retained but were sold in 2014 for cash proceeds totaling $664,000 with a pre-tax gain of $553,000 included in 2014 results from discontinued operations.
Due to inadequate earnings, the Company completed an orderly wind-down and closure of its natural gas marketing segment effective October 31, 2013. Revenues from this segment included in net earnings from discontinued operations totaled $2,377,000 and $4,879,000 for the years ended December 31, 2013 and 2012, respectively. All obligations were satisfied and no further events are anticipated.
(10) Quarterly Financial Data (Unaudited) -
Selected quarterly financial data and earnings per share of the Company are presented below for the years ended December 31, 20112014 and 20102013 (in thousands, except per share data):
| | | | | | | | | Earnings (Loss) from | | | | | | | |
| | | | | | | | | | | | | | | | | | | | | | | | | | | | | |
| | | | | | | | Operating | | | | | | Per | | | | | | Per | | | | | | | | | | | | | | | | | | | | | | | | |
| | | | | Revenues | | | Earnings (loss) | | | Amount | | | Share | | | Amount | | | Share | | | | | | | | | | | | | | | | | | | | | |
| | 2011 - | | | | | | | | | | | | | | | | | | | | 2014 - | | | | | | | | | | | | | | | | | | | |
| March 31 | March 31 | | | $ | 697,188 | | | $ | 8,475 | | | $ | 5,583 | | | $ | 1.32 | | | $ | - | | | $ | - | | March 31 | | | $ | 949,189 | | | $ | 5,363 | | | $ | 1.27 | | | $ | 5,363 | | | $ | 1.27 | | | $ | 928 | | | $ | .22 | |
| June 30 | June 30 | | | | 824,210 | | | | 5,807 | | | | 3,589 | | | | .85 | | | | - | | | | - | | June 30 | | | | 1,159,931 | | | | 3,975 | | | | .94 | | | | 3,975 | | | | .94 | | | | 928 | | | | .22 | |
| September 30 | September 30 | | | | 801,690 | | | | 13,576 | | | | 9,026 | | | | 2.14 | | | | - | | | | - | | September 30 | | | | 1,173,970 | | | | 3,855 | | | | .92 | | | | 3,855 | | | | .92 | | | | 928 | | | | .22 | |
| December 31 | December 31 | | | | 891,311 | | | | 7,675 | | | | 4,733 | | | | 1.13 | | | | 2,404 | | | | .57 | | December 31 | | | | 849,736 | | | | (6,974 | ) | | | (1.65 | ) | | | (6,670 | ) | | | (1.58 | ) | | | 927 | | | | .22 | |
| Total | Total | | | $ | 3,214,399 | | | $ | 35,533 | | | $ | 22,931 | | | $ | 5.44 | | | $ | 2,404 | | | $ | .57 | | Total | | | $ | 4,132,826 | | | $ | 6,219 | | | $ | 1.48 | | | $ | 6,523 | | | $ | 1.55 | | | $ | 3,711 | | | $ | .88 | |
| | | | | | | | | | | | | | | | | | | | | | | | | | | | | | | | | | | | | | | | | | | | | | | | | | | | | | | | | |
| | 2010 - | | | | | | | | | | | | | | | | | | | | | | | | | | 2013 - | | | | | | | | | | | | | | | | | | | | | | | | | | | | | |
| March 31 | March 31 | | | $ | 533,785 | | | $ | 2,575 | | | $ | 1,794 | | | $ | .43 | | | $ | - | | | $ | - | | March 31 | | | $ | 952,435 | | | $ | 8,073 | | | $ | 1.91 | | | $ | 8,015 | | | $ | 1.90 | | | $ | - | | | $ | - | |
| June 30 | June 30 | | | | 547,141 | | | | 2,656 | | | | 1,685 | | | | .39 | | | | - | | | | - | | June 30 | | | | 965,098 | | | | 6,521 | | | | 1.55 | | | | 6,330 | | | | 1.50 | | | | 928 | | | | .22 | |
| September 30 | September 30 | | | | 502,455 | | | | 4,021 | | | | 2,762 | | | | .66 | | | | - | | | | - | | September 30 | | | | 1,060,340 | | | | 7,238 | | | | 1.72 | | | | 7,156 | | | | 1.70 | | | | 927 | | | | .22 | |
| December 31 | December 31 | | | | 628,589 | | | | 3,294 | | | | 2,390 | | | | .57 | | | | 2,277 | | | | .54 | | December 31 | | | | 968,096 | | | | 289 | | | | .06 | | | | 109 | | | | .02 | | | | 928 | | | | .22 | |
| Total | Total | | | $ | 2,211,970 | | | $ | 12,546 | | | $ | 8,631 | | | $ | 2.05 | | | $ | 2,277 | | | $ | .54 | | Total | | | $ | 3,945,969 | | | $ | 22,121 | | | $ | 5.24 | | | $ | 21,610 | | | $ | 5.12 | | | $ | 2,783 | | | $ | .66 | |
The above unaudited interim financial data reflect all adjustments that are in the opinion of management necessary to a fair statement of the results for the period presented. All such adjustments are of a normal recurring nature.
(10) Subsequent Event
On February 27, 2012, the Company sold certain equipment, inventory and contracts associated with its refined products marketing segment. The Company received proceeds of $2 million plus the fair market value of its inventory and transferred title to its inventory, transportation equipment and other miscellaneous net assets. The current gain is estimated to be approximately $1 million, subject to final post-closing adjustments.
Accounts receivable and accounts payable as of the transaction date that are associated with this segment were retained and will continue to be satisfied in the ordinary course of business. The Company has discontinued its refined products marketing operation and has agreed to a three year non-compete agreement in connection with this matter.
(11) Oil and Gas Producing Activities (Unaudited)
The Company’s oil and gas exploration and production activities are conducted in Texas and the south central region of the United States, primarily along the Gulf Coast of Texas and Louisiana.
Oil and Gas Producing Activities -
Total costs incurred in oil and gas exploration and development activities, all incurred within the United States, were as follows (in thousands):
| | | | | | For the year Ended December 31, | |
| | | | | | | | | | | | | | | | | | | |
| Property acquisition costs | | | | | | | | | | | | | | | | | | |
| Unproved | | $ | 3,591 | | | $ | 2,295 | | | $ | 6,199 | | | $ | 1,144 | | | $ | 1,444 | | | $ | 1,965 | |
| Proved | | | - | | | | - | | | | - | | | | - | | | | - | | | | - | |
| Exploration costs | | | | | | | | | | | | | | | | | | | | | | | | |
| Expensed | | | 9,166 | | | | 3,233 | | | | 3,818 | | | | 5,054 | | | | 1,619 | | | | 1,151 | |
| Capitalized | | | - | | | | - | | | | 1,035 | | | | - | | | | - | | | | - | |
| Development costs | | | 12,133 | | | | 6,233 | | | | 2,341 | | | | 1,745 | | | | 10,160 | | | | 20,219 | |
| Total costs incurred | | $ | 24,890 | | | $ | 11,761 | | | $ | 13,393 | | | $ | 7,943 | | | $ | 13,223 | | | $ | 23,335 | |
The aggregate capitalized costs relative to oil and gas producing activities are as follows (in thousands):
| | | | | | | |
| | | | | | | | | | | | | |
| Unproved oil and gas properties | | $ | 7,291 | | | $ | 12,250 | | | $ | 3,104 | | | $ | 7,578 | |
| Proved oil and gas properties | | | 74,376 | | | | 69,011 | | | | 85,557 | | | | 91,369 | |
| | | | 81,667 | | | | 81,261 | | | | 88,661 | | | | 98,947 | |
| Accumulated depreciation, depletion | | | | | | | | | | | | | | | | |
| and amortization | | | (55,061 | ) | | | (51,857 | ) | | | (64,682 | ) | | | (64,169 | ) |
| Net capitalized cost | | $ | 26,606 | | | $ | 29,404 | | | $ | 23,979 | | | $ | 34,778 | |
Estimated Oil and Natural Gas Reserves -
The following information regarding estimates of the Company'sCompany’s proved oil and gas reserves, all located in Texas and the south central region of the United States, is based on reports prepared on behalf of the Company by its independent petroleum engineers. Because oil and gas reserve estimates are inherently imprecise and require extensive judgments of reservoir engineering data, they are generally less precise than estimates made in conjunction with financial disclosures. The revisions of previous estimates as reflected in the table below result from changes in commodity pricing assumptions and from more precise engineering calculations based upon additional production histories and price changes.
Proved developed and undeveloped reserves are presented as follows (in thousands):
| | | | | | | |
| | | | | | | | | | | | | | | | | | | |
| | | Natural | | | | | | Natural | | | | | | Natural | | | | | | Natural | | | | | | Natural | | | | | | Natural | | | | |
| | | Gas | | | Oil | | | Gas | | | Oil | | | Gas | | | Oil | | | Gas | | | Oil | | | Gas | | | Oil | | | Gas | | | Oil | |
| | | (Mcf’s) | | | (Bbls.) | | | (Mcf’s) | | | (Bbls.) | | | (Mcf’s) | | | (Bbls.) | | | (Mcf’s) | | | (Bbls.) | | | (Mcf’s) | | | (Bbls.) | | | (Mcf’s) | | | (Bbls.) | |
| Total proved reserves- | | | | | | | | | | | | | | | | | | | | | | | | | | | | | | | | | | | | |
| Beginning of year | | | 7,794 | | | | 267 | | | | 7,248 | | | | 242 | | | | 6,443 | | | | 230 | | | | 6,286 | | | | 368 | | | | 8,837 | | | | 307 | | | | 9,661 | | | | 292 | |
| Revisions of previous estimates | | | (520 | ) | | | (24 | ) | | | (832 | ) | | | - | | | | (129 | ) | | | (4 | ) | | | 724 | | | | 6 | | | | (1,438 | ) | | | (17 | ) | | | (507 | ) | | | 29 | |
| Oil and gas reserves sold | | | (2,148 | ) | | | (26 | ) | | | - | | | | - | | | | - | | | | - | | | | (558 | ) | | | (11 | ) | | | (28 | ) | | | - | | | | (104 | ) | | | (54 | ) |
| Extensions, discoveries and | | | | | | | | | | | | | | | | | | | | | | | | | | | | | | | | | | | | | | | | | | | | | | | | |
| Other reserve additions | | | 6,430 | | | | 137 | | | | 2,743 | | | | 79 | | | | 2,238 | | | | 66 | | |
| other reserve additions | | | | 292 | | | | 82 | | | | 523 | | | | 180 | | | | 2,395 | | | | 138 | |
| Production | | | (1,895 | ) | | | (62 | ) | | | (1,365 | ) | | | (54 | ) | | | (1,304 | ) | | | (50 | ) | | | (1,133 | ) | | | (127 | ) | | | (1,608 | ) | | | (102 | ) | | | (2,608 | ) | | | (98 | ) |
| End of year | | | 9,661 | | | | 292 | | | | 7,794 | | | | 267 | | | | 7,248 | | | | 242 | | | | 5,611 | | | | 318 | | | | 6,286 | | | | 368 | | | | 8,837 | | | | 307 | |
The components of proved oil and gas reserves for the three years ended December 31, 20112014 is presented below. All reserves are in the United States (in thousands):
| | | | |
| | | | | | | | | | |
| | | Natural | | | | | | Natural | | | | | | Natural | | | | |
| | | Gas | | | Oil | | | Gas | | | Oil | | | Gas | | | Oil | |
| | | (Mcf’s) | | | (Bbls.) | | | (Mcf’s) | | | (Bbls.) | | | (Mcf’s) | | | (Bbls.) | |
| Proved developed reserves | | | 9,433 | | | | 277 | | | | 7,134 | | | | 240 | | | | 6,295 | | | | 242 | |
| Proved undeveloped reserves | | | 228 | | | | 15 | | | | 660 | | | | 27 | | | | 953 | | | | - | |
| Total proved reserves | | | 9,661 | | | | 292 | | | | 7,794 | | | | 267 | | | | 7,248 | | | | 242 | |
Proved undeveloped reserves originated in 2009 when active drilling efforts commenced and such period identified and delineated additional reserve acreage. During 2010 drilling efforts continued identifying additional reserve acreage and converting such undeveloped reserves to the developed category. Drilling in 2011 continued to develop the reserve acreage.| | | | |
| | | | | | | | | | |
| | | Natural | | | | | | Natural | | | | | | Natural | | | | |
| | | Gas | | | Oil | | | Gas | | | Oil | | | Gas | | | Oil | |
| | | (Mcf’s) | | | (Bbls.) | | | (Mcf’s) | | | (Bbls.) | | | (Mcf’s) | | | (Bbls.) | |
| Proved developed reserves | | | 5,482 | | | | 299 | | | | 6,157 | | | | 367 | | | | 8,708 | | | | 306 | |
| Proved undeveloped reserves | | | 129 | | | | 19 | | | | 129 | | | | 1 | | | | 129 | | | | 1 | |
| Total proved reserves | | | 5,611 | | | | 318 | | | | 6,286 | | | | 368 | | | | 8,837 | | | | 307 | |
The Company has developed internal policies and controls for estimating and recording oil and gas reserve data. The estimation and recording of proved reserves is required to be in compliance with SEC definitions and guidance. The Company assigns responsibility for compliance in reserve bookings to the office of President of the Company’s AREC subsidiary.AREC. No portion of this individual’s compensation is directly dependent on the quantity of reserves booked. Reserve estimates are required to be made by qualified reserve estimators, as defined by Society of Petroleum Engineers’ Standards.
The Company employsemployed third party petroleum consultant, Ryder Scott Company, to prepare its oil and gas reserve data estimates as of December 31, 2011, 20102014, 2013 and 2009.2012. The firm of Ryder Scott is well recognized within the industry for more than 50 years. As prescribed by the SEC, such proved reserves were estimated using 12-month average oil and gas prices, based on the first-day-of-the-month price for each month in the period, and year-end production and development costs for each of the years presented, all without escalation.
The process of estimating oil and gas reserves is complex and requires significant judgment. Uncertainties are inherent in estimating quantities of proved reserves, including many factors beyond the estimator’s control. Reserve engineering is a subjective process of estimating subsurface accumulations of oil and gas that cannot be measured in an exact manner, and the accuracy of any reserve estimate is a function of the quality of available data and the interpretation thereof. As a result, estimatesassessments by different engineers often vary, sometimes significantly. In addition, physical factors such as the results of drilling, testing and production subsequent to the date of an estimate, as well as economic factors such as changes in product prices, may justify revision of such estimates. Accordingly, oil and gas quantities ultimately recovered will vary from reserve estimates.
Standardized Measure of Discounted Future Net Cash Flows from Oil and Gas Operations and Changes Therein -
The standardized measure of discounted future net cash flows was determined based on the economic conditions in effect at the end of the years presented, except in those instances where fixed and determinable gas price escalations are included in contracts. The disclosures below do not purport to present the fair market value of the Company'sCompany’s oil and gas reserves. An estimate of the fair market value would also take into account, among other things, the recovery of reserves in excess of proved reserves, anticipated future changes in prices and costs, a discount factor more representative of the time value of money and risks inherent in reserve estimates. The standardized measure of discounted future net cash flows is presented as follows (in thousands):
| | | | |
| | | | | | | | | | |
| Future gross revenues | | $ | 73,626 | | | $ | 61,311 | | | $ | 43,498 | |
| Future costs - | | | | | | | | | | | | |
| Lease operating expenses | | | (19,788 | ) | | | (17,288 | ) | | | (15,969 | ) |
| Development costs | | | (2,198 | ) | | | (1,596 | ) | | | (2,495 | ) |
| Future net cash flows before income taxes | | | 51,640 | | | | 42,427 | | | | 25,034 | |
| Discount at 10% per annum | | | (19,439 | ) | | | (16,777 | ) | | | (10,719 | ) |
| Discounted future net cash flows | | | | | | | | | | | | |
| before income taxes | | | 32,201 | | | | 25,650 | | | | 14,315 | |
| Future income taxes, net of discount at | | | | | | | | | | | | |
| 10% per annum | | | (11,270 | ) | | | (8,978 | ) | | | (5,010 | ) |
| Standardized measure of discounted | | | | | | | | | | | | |
| future net cash flows | | $ | 20,931 | | | $ | 16,672 | | | $ | 9,305 | |
| | | | |
| | | | | | | | | | |
| Future gross revenues | | $ | 58,885 | | | $ | 64,495 | | | $ | 59,793 | |
| Future costs - | | | | | | | | | | | | |
| Lease operating expenses | | | (16,421 | ) | | | (19,207 | ) | | | (16,357 | ) |
| Development costs | | | (1,068 | ) | | | (119 | ) | | | (299 | ) |
| Future net cash flows before income taxes | | | 41,396 | | | | 45,169 | | | | 43,137 | |
| Discount at 10% per annum | | | (17,175 | ) | | | (17,729 | ) | | | (17,976 | ) |
| Discounted future net cash flows | | | | | | | | | | | | |
| before income taxes | | | 24,221 | | | | 27,440 | | | | 25,161 | |
| Future income taxes, net of discount at | | | | | | | | | | | | |
| 10% per annum | | | (8,477 | ) | | | (9,604 | ) | | | (8,806 | ) |
| Standardized measure of discounted | | | | | | | | | | | | |
| future net cash flows | | $ | 15,744 | | | $ | 17,836 | | | $ | 16,355 | |
The reserve estimates provided at December 31, 2011, 20102014, 2013 and 20092012 are based on aggregate prices of $95.85, $76.14$89.60, $94.99 and $58.43$93.85 per barrel for crude oil and $5.42, $4.69 $5.26 and $4.05$3.51 per mcf for natural gas, respectively. Such prices reflectwere based on the unweighted arithmetic average of the prices in effect on the first day of the month for each month of the respective twelve month periods as required by Securities & Exchange CommissionSEC regulations. The affectprices reported in the reserve disclosures for natural gas include the value of associated natural gas liquids. Hydrocarbon prices declined significantly during the fourth quarter of 2014. Realized domestic crude oil prices averaged in the $54 per barrel range during the month of December with additional price declines continuing into 2015.
The effect of income taxes and discounting on the standardized measure of discounted future net cash flows is presented as follows (in thousands):
| | | | |
| | | | | | | | | | |
| Future net cash flows before income taxes | | $ | 41,396 | | | $ | 45,169 | | | $ | 43,137 | |
| Future income taxes | | | (14,489 | ) | | | (15,809 | ) | | | (15,098 | ) |
| Future net cash flows | | | 26,907 | | | | 29,360 | | | | 28,039 | |
| Discount at 10% per annum | | | (11,163 | ) | | | (11,524 | ) | | | (11,684 | ) |
| Standardized measure of discounted | | | | | | | | | | | | |
| future net cash flows | | $ | 15,744 | | | $ | 17,836 | | | $ | 16,355 | |
| | | | |
| | | | | | | | | | |
| Future net cash flows before income taxes | | $ | 51,640 | | | $ | 42,427 | | | $ | 25,034 | |
| Future income taxes | | | (18,074 | ) | | | (14,849 | ) | | | (8,762 | ) |
| Future net cash flows | | | 33,566 | | | | 27,578 | | | | 16,272 | |
| Discount at 10% per annum | | | (12,635 | ) | | | (10,906 | ) | | | (6,967 | ) |
| Standardized measure of discounted | | | | | | | | | | | | |
| future net cash flows | | $ | 20,931 | | | $ | 16,672 | | | $ | 9,305 | |
The principal sources of changes in the standardized measure of discounted future net flows are as follows (in thousands):
| | | | | | | |
| | | | | | | | | | | | | | | | | | | |
| Beginning of year | | $ | 16,672 | | | $ | 9,305 | | | $ | 11,547 | | | $ | 17,836 | | | $ | 16,355 | | | $ | 20,931 | |
| Sale of oil and gas reserves | | | (7,429 | ) | | | - | | | | - | | | | (981 | ) | | | - | | | | (3,802 | ) |
| Net change in prices and production costs | | | 791 | | | | 9,435 | | | | (4,890 | ) | | | (72 | ) | | | 9,341 | | | | (5,313 | ) |
| New field discoveries and extensions, net of future | | | | | | | | | | | | | | | | | | | | | | | | |
| production costs | | | 18,769 | | | | 9,068 | | | | 3,471 | | | | 4,456 | | | | 9,767 | | | | 9,513 | |
| Sales of oil and gas produced, net of production costs | | | (7,723 | ) | | | (7,084 | ) | | | (5,114 | ) | | | (6,590 | ) | | | (8,373 | ) | | | (8,953 | ) |
| Net change due to revisions in quantity estimates | | | (1,739 | ) | | | (1,369 | ) | | | (347 | ) | | | 2,460 | | | | (3,624 | ) | | | (940 | ) |
| Accretion of discount | | | 1,678 | | | | 1,072 | | | | 1,242 | | | | 1,773 | | | | 1,797 | | | | 1,944 | |
| Production rate changes and other | | | 2,204 | | | | 213 | | | | 2,189 | | | | (4,265 | ) | | | (6,629 | ) | | | 511 | |
| Net change in income taxes | | | (2,292 | ) | | | (3,968 | ) | | | 1,207 | | | | 1,127 | | | | (798 | ) | | | 2,464 | |
| End of year | | $ | 20,931 | | | $ | 16,672 | | | $ | 9,305 | | | $ | 15,744 | | | $ | 17,836 | | | $ | 16,355 | |
Results of Operations for Oil and Gas Producing Activities -
The results of oil and gas producing activities, excluding corporate overhead and interest costs, are as follows (in thousands):
| | | | | | | |
| | | | | | | | | | | | | | | | | | | |
| Revenues | | $ | 14,060 | | | $ | 11,021 | | | $ | 8,650 | | | $ | 13,361 | | | $ | 14,129 | | | $ | 15,954 | |
| Costs and expenses - | | | | | | | | | | | | | | | | | | | | | | | | |
| Production | | | (6,337 | ) | | | (3,937 | ) | | | (3,536 | ) | | | (6,771 | ) | | | (5,756 | ) | | | (7,091 | ) |
| Producing property impairment | | | (7,105 | ) | | | (946 | ) | | | (1,350 | ) | | | (4,001 | ) | | | (1,373 | ) | | | (4,699 | ) |
| Exploration | | | (9,166 | ) | | | (3,233 | ) | | | (3,735 | ) | | | (5,054 | ) | | | (1,619 | ) | | | (1,151 | ) |
| Oil and natural gas property sale gain | | | | 2,528 | | | | - | | | | 2,203 | |
| Depreciation, depletion and amortization | | | (8,246 | ) | | | (4,662 | ) | | | (3,654 | ) | | | (7,573 | ) | | | (7,494 | ) | | | (8,848 | ) |
| Operating income (loss) before income taxes | | | (16,794 | ) | | | (1,757 | ) | | | (3,625 | ) | | | (7,510 | ) | | | (2,113 | ) | | | (3,632 | ) |
| Income tax (expense) benefit | | | 5,878 | | | | 615 | | | | 1,268 | | |
| Income tax benefit | | | | 2,628 | | | | 739 | | | | 1,271 | |
| Operating income (loss) | | $ | (10,916 | ) | | $ | (1,142 | ) | | $ | (2,357 | ) | | $ | (4,882 | ) | | $ | (1,374 | ) | | $ | (2,361 | ) |
| | | | | | | | | | | | | | |
| Item 9. | CHANGES IN AND DISAGREEMENTS WITH ACCOUNTANTS ON ACCOUNTING AND FINANCIAL DISCLOSURE |
None.
Item 9A. CONTROLS AND PROCEDURES
Disclosure Controls and Procedures
In May 2013, the Committee of Sponsoring Organizations of the Treadway Commission (‟COSO”) issued an updated version of its Internal Control – Integrated Framework (the ‟2013 Framework”). Originally issued in 1992 (the ‟1992 Framework”), the Framework helps organizations design, implement and evaluate the effectiveness of internal control concepts and simplify their use and application. The 1992 Framework remained available during the transition period which extended to December 15, 2014, after which time COSO considered it superseded by the 2013 Framework. As of December 31, 2014, the Company has transitioned to 2013 Framework.
The Company maintains “disclosure‟disclosure controls and procedures” (asas defined in Rule 13a-15(e) and 15d-15(e) under the Securities Exchange Act of 1934, as amended (the “Exchange‟Exchange Act”) that are designed to ensure that information required to be disclosed in the reports that the Company files or submits under the Exchange Act are recorded, processed, summarized and reported within the time periods specified in the Securities and Exchange Commission’s rules and forms and is accumulated and communicated to management, including the Company’s Chief Executive Officer and Chief Financial Officer, as appropriate, to allow timely discussions regarding required disclosure. Management necessarily applied its judgment in assessing the costs and benefit of such controls and procedures, which, by their nature, can provide only reasonable assurance regarding management’s disclosure control objectives.
As of the end of the period covered by this annual report, an evaluation was carried out under the supervision and with the participation of the Company’s management, including the Company’s Chief Executive Officer and Chief Financial Officer, of the effectiveness of the design and operation of the Company’s disclosure controls and procedures. Based upon that evaluation, the Chief Executive Officer and the Chief Financial Officer concluded that there isthe Company’s disclosure controls and procedures were effective at a reasonable assurance that the disclosure controls and procedureslevel as of the end of the period covered by this report are effective to ensure that information required to be disclosed in the Company’s Exchange Act filings is recorded, processed, summarized and reported within the periods specified in the Securities and Exchange Commission’s rules and forms.report.
Management’s Report on Internal Control Over Financial Reporting
Management is responsible for establishing and maintaining adequate internal control over financial reporting as defined in Rule 13a-15(f) and 15d-15(f) under the Exchange Act. The Company’s internal control over financial reporting is a process designed under the supervision of the Company’s Chief Executive Officer and the Chief Financial Officer to provide reasonable assurance regarding the reliability of financial reporting and the preparation of financial statements for external purposes in accordance with accounting principles generally accepted in the United States.
Because of its inherent limitations, internal control over financial reporting may not prevent or detect misstatements. Also, projections of any evaluation of effectiveness to future periods are subject to the risk that controls may become inadequate because of changes in conditions, or that the degree of compliance with policies and procedures may deteriorate.
Management, including the Company’s Chief Executive Officer and Chief Financial Officer, assessed the effectiveness of the Company’s internal control over financial reporting as of December 31, 2011.2014. In making this assessment, management used the criteria described in Internal Control – Integrated Framework (2013) issued by the Committee of Sponsoring Organizations of the Treadway Commission (COSO). Based on this assessment, management, including the Company’s Chief Executive Officer and Chief Financial Officer, concluded that internal control over financial reporting was effective at a reasonable assurance level as of December 31, 2011.2014.
This annual report does not include an attestation report of the Company’s independent registered public accounting firm regarding internal control over financial reporting. This management’s report was not subject to attestation by an independent registered public accounting firm pursuant to the rules of the Securities and Exchange Commission that permit the Company to provide only management’s report in this annual report.
This Management’s Report on Internal Control over Financial Reporting shall not be deemed “filed” for purposes of Section 18 of the Exchange Act or incorporated by reference in any filing under the Securities Act of 1933, as amended, or the Exchange Act, except as shall be expressly set forth by specific reference in such a filing.
Changes in Internal Control over Financial Reporting.Reporting
There have not been any changes in the Company’s internal control over financial reporting during the fiscal quarter ended December 31, 20112014 that have materially affected, or are reasonably likely to materially affect, the Company’s internal control over financial reporting.
Item 9B. OTHER
None.
REPORT OF INDEPENDENT REGISTERED PUBLIC ACCOUNTING FIRM
To the Board of Directors and Shareholders of
Adams Resources & Energy, Inc.
Houston, Texas
We have audited the internal control over financial reporting of Adams Resources & Energy, Inc. and subsidiaries (the "Company") as of December 31, 2014, based on criteria established in Internal Control — Integrated Framework (2013) issued by the Committee of Sponsoring Organizations of the Treadway Commission. The Company's management is responsible for maintaining effective internal control over financial reporting and for its assessment of the effectiveness of internal control over financial reporting, included in the accompanying Management’s Report on Internal Control Over Financial Reporting. Our responsibility is to express an opinion on the Company's internal control over financial reporting based on our audit.
We conducted our audit in accordance with the standards of the Public Company Accounting Oversight Board (United States). Those standards require that we plan and perform the audit to obtain reasonable assurance about whether effective internal control over financial reporting was maintained in all material respects. Our audit included obtaining an understanding of internal control over financial reporting, assessing the risk that a material weakness exists, testing and evaluating the design and operating effectiveness of internal control based on that risk, and performing such other procedures as we considered necessary in the circumstances. We believe that our audit provides a reasonable basis for our opinion.
A company's internal control over financial reporting is a process designed by, or under the supervision of, the company's principal executive and principal financial officers, or persons performing similar functions, and effected by the company's board of directors, management, and other personnel to provide reasonable assurance regarding the reliability of financial reporting and the preparation of financial statements for external purposes in accordance with generally accepted accounting principles. A company's internal control over financial reporting includes those policies and procedures that (1) pertain to the maintenance of records that, in reasonable detail, accurately and fairly reflect the transactions and dispositions of the assets of the company; (2) provide reasonable assurance that transactions are recorded as necessary to permit preparation of financial statements in accordance with generally accepted accounting principles, and that receipts and expenditures of the company are being made only in accordance with authorizations of management and directors of the company; and (3) provide reasonable assurance regarding prevention or timely detection of unauthorized acquisition, use, or disposition of the company's assets that could have a material effect on the financial statements.
Because of the inherent limitations of internal control over financial reporting, including the possibility of collusion or improper management override of controls, material misstatements due to error or fraud may not be prevented or detected on a timely basis. Also, projections of any evaluation of the effectiveness of the internal control over financial reporting to future periods are subject to the risk that the controls may become inadequate because of changes in conditions, or that the degree of compliance with the policies or procedures may deteriorate.
In our opinion, the Company maintained, in all material respects, effective internal control over financial reporting as of December 31, 2014, based on the criteria established in Internal Control — Integrated Framework (2013) issued by the Committee of Sponsoring Organizations of the Treadway Commission.
We have also audited, in accordance with the standards of the Public Company Accounting Oversight Board (United States), the consolidated financial statements as of and for the year ended December 31, 2014 of the Company and our report dated March 13, 2015 expressed an unqualified opinion on those financial statements.
/s/Deloitte & Touche LLP
Houston, Texas
March 13, 2015
Item 9B. OTHER INFORMATION
None.
PART III
| Item 10. | DIRECTORS, EXECUTIVE OFFICERS AND CORPORATE GOVERNANCE |
The information concerning directors, corporate governance and executive officers of the Company is incorporated by reference from the Company’s definitive Proxy Statement for the Annual Meeting of Shareholders to be held Wednesday,Thursday, May 16, 2012,14, 2015, under the heading “Election‟Election of Directors” and “Executive‟Executive Officers”, respectively, to be filed with the Commission not later than 120 days after the end of the fiscal year covered by this Form 10-K.
| Item 11. | EXECUTIVE COMPENSATION |
The information required by Item 11 is incorporated by reference from the Company’s definitive Proxy Statement for the Annual Meeting of Shareholders to be held Wednesday,Thursday, May 16, 2012,14, 2015, under the heading “Executive‟Executive Compensation” to be filed with the Commission not later than 120 days after the end of the fiscal year covered by this Form 10-K.
| Item 12. | SECURITY OWNERSHIP OF CERTAIN BENEFICIAL OWNERS AND MANAGEMENT AND RELATED STOCKHOLDER MATTERS |
The information required by Item 12 is incorporated by reference from the Company’s definitive Proxy Statement for the Annual Meeting of Shareholders to be held Wednesday,Thursday, May 16, 2012,14, 2015, under the heading “Voting‟Voting Securities and Principal Holders Thereof” to be filed with the Commission not later than 120 days after the end of the fiscal year covered by this Form 10-K.
| Item 13. | CERTAIN RELATIONSHIPS AND RELATED PARTY TRANSACTIONS, AND DIRECTOR INDEPENDENCE |
The information required by Item 13 is incorporated by reference from the Company’s definitive Proxy Statement for the Annual Meeting of Shareholders to be held Wednesday,Thursday, May 16, 2012,14, 2015, under the headings “Transactions‟Transactions with Related Parties” and “Director‟Director Independence” to be filed with the Commission not later than 120 days after the end of the fiscal year covered by this Form 10-K.
| Item 14. | PRINCIPAL ACCOUNTING FEES AND SERVICES |
The information required by Item 14 is incorporated by reference from the Company’s definitive Proxy Statement for the Annual Meeting of Shareholders to be held Wednesday,Thursday, May 16, 2012,14, 2015, under the heading “Principal‟Principal Accounting Fees and Services” to be filed with the Commission not later than 120 days after the end of the fiscal year covered by this Form 10-K.
PART IV
| Item 15. | EXHIBITS, AND FINANCIAL STATEMENT SCHEDULES |
(a) The following documents are filed as a part of this Form 10-K:
1. Financial Statements
Report of Independent Registered Public Accounting Firm
Consolidated Balance Sheets as of December 31, 20112014 and 20102013
Consolidated Statements of Operations for the Years Ended
December 31, 2011, 20102014, 2013 and 20092012
Consolidated Statements of Shareholders'Shareholders’ Equity for the Years Ended
December 31, 2011, 20102014, 2013 and 20092012
Consolidated Statements of Cash Flows for the Years Ended
December 31, 2011, 20102014, 2013 and 20092012
Notes to Consolidated Financial Statements
2. | All financial schedules have been omitted because they are not applicable or the required information is shown in the financial statements or notes thereto. |
2.All financial schedules have been omitted because they are not applicable or the required information is shown in the financial statements or notes thereto.
3. | Exhibits required to be filed |
3.Exhibits required to be filed
| 3(a) | - | Certificate of Incorporation of the Company, as amended. (Incorporated by reference to Exhibit 3(a) filed with the Annual Report on Form 10-K (-File No. 1-7908) of the Company for the fiscal year ended December 31, 1987). |
| 3(b) | - | Bylaws of the Company, as amendedamended. (Incorporated by reference to Exhibits 3.2 and 3.2.1 of Amendment No. 1 to the Registration Statement on Form S-1Exhibit 3(b) filed with the Securities and Exchange CommissionAnnual Report on October 29, 1973 - FileForm 10-K for the year ended December 31, 2012 (-File No. 2-48144)1-7908). |
| 3(c) | - | Amendment to the Bylaws of the Company to add an Article VII, Section 8. Indemnification of Directors, Officers, Employees and Agents (Incorporated by reference to Exhibit 3(c) of the Annual Report on Form 10-K (-File No. 1-7908) of the Company for the fiscal year ended December 31, 1986) |
3(d) | - | Adams Resources & Energy, Inc. and Subsidiaries’ Code of Ethics (Incorporated by reference to Exhibit 3(d) of the Annual Report on Form 10-K (-File No. 1-7908) of the Company for the fiscal year ended December 31, 2002). |
| 4(a) | - | Specimen common stock Certificate (Incorporated by reference to Exhibit 4(a) of the Annual Report on Form 10-K of the Company (-File No. 1-7908) for the fiscal year ended December 31, 1991). |
| 4(b) | - | Credit and Security Agreement between Gulfmark Energy, Inc., Adams Resources Marketing, LtdLtd., and Wells Fargo Bank, National Association dated August 27, 2009 (Incorporated by reference to Exhibit 4(b) of the Quarterly Report on Form 10-Q for the period ended September 30, 2009.2009). |
| 10.1(a)+ | - | Employment agreementAgreement of Frank T. Webster, President, dated May 4,12, 2004 by and between Adams Resources & Energy, Inc. and Frank T. Webster (Incorporated by reference to Exhibit 10.1 to the Company’s Quarterly Report on Form 10-Q for the period ended September 30, 2004). |
| 10.1(b)+ | - NinthEleventh Amendment to Employment Agreement of Frank T. Webster, President, by and between Adams Resources & Energy, Inc. and Frank T. Webster effective December 6, 2011. Incorporated5, 2013 (Incorporated by reference to Exhibit 10.1 to the Company’s Form 8-K filed on December 6, 2011)2013). |
| 10.1(c)+ | - Change in Control/Severance agreement by and between Adams Resources & Energy, Inc. and Richard B. Abshire effective July 25, 2008 (Incorporated by reference to Exhibit 10.1 to the Company’s current report on Form 8-K filed on July 25, 2008). |
10.1(d)+ | - First Amendment to Change in Control/Severance agreement by and between Adams Resources & Energy, Inc. and Richard B. Abshire effective December 6, 2011 (Incorporated by reference to Exhibit 10.2 to the Company’s current report on Form 8-K filed on December 6, 2011). |
10.1(e)+ | - Amendment to Change in Control/Severance agreement by and between Adams Resources & Energy, Inc. and Sharon Davis effective December 6, 2011 (Incorporated by reference to Exhibit 10.3 to the Company’s current report on Form 8-K filed on December 6, 2011). |
10.1(f)+ | - Amendment to Employment Agreement of Frank T. Webster, President, dated December 6, 2010 by and between Adams Resources & Energy, Inc. and Frank T. Webster (Incorporated by reference to Exhibit 10.1(b) to the Company’s Annual Report on Form 10-K for the fiscal year ended December 31, 2010). |
10.1(g)+ | - Non-Employee Director Change in Control Agreement by and between Adams Resources & Energy, Inc. and E. C. Reinauer, Jr., dated effective December 6, 2011 (Incorporated by reference to Exhibit 10.4 to the Company’s Form 8-K filed on December 6, 2011). |
10.1(h)+ | - Non-Employee Director Change in Control Agreement by and between Adams Resources & Energy, Inc. and Townes G. Pressler, dated effective December 6, 2011 (Incorporated by reference to Exhibit 10.5 to the Company’s Form 8-K filed on December 6, 2011). |
10.1(i)+ | - Non-Employee Director Change in Control Agreement by and between Adams Resources & Energy, Inc. and Larry E. Bell, dated effective December 6, 2011 (Incorporated by reference to Exhibit 10.5 to the Company’s Form 8-K filed on December 6, 2011) |
10.1(j)+ | - Standard form Indemnification Agreement between Adams Resources & Energy, Inc. and Officers or Directors (Incorporated by reference to Exhibit 10.1 to the Company’s Quarterly - Report on Form 10-Q for the period ended September 30, 2011). |
10.1(k)*+ - Change in Control/Severance agreement by and between Adams Resources & Energy, Inc. and Sharon Davis (nee Copeland) effective September 20, 2008.
| 10.1(d)+ | - Retirement and Transition Agreement dated February 26, 2015 between Adams Resources & Energy, Inc. and Frank T. Webster effective February 26, 2015 (Incorporated by reference to Exhibit 10.1 to the Company’s Form 8-K filed on February 26, 2015). |
| 21* | - | Subsidiaries of the Registrant |
| 23.1* | - | Consent of Ryder Scott Company |
| 31.1* | - | Adams Resources & Energy, Inc. Certification Pursuant to 17 CFR 13a-14 (a)/15d-14(a), Asas adopted pursuant to Section 302 of the Sarbanes-Oxley Act of 2002 |
| 31.2* | - | Adams Resources & Energy, Inc. Certification Pursuant to 17 CFR 13a-14(a)/15d-14(a), as adopted pursuant to Section 302 of the Sarbanes-Oxley Act of 2002 |
| 32.1* | - | Certification Pursuant to 18 U.S.C. Section 1350, as adopted pursuant to Section 906 of the Sarbanes-Oxley Act of 2002 |
| 32.2* | - | Certification Pursuant to 18 U.S.C. Section 1350, as adopted pursuant to Section 906 of the Sarbanes-Oxley Act of 2002 |
| 99.1* | - | Ryder Scott Company Report |
| | ______________________________ |
| +- Management contract or compensation plan or arrangement |
| **-Attached as Exhibit 101 to this report are the following documents formatted in XBRL (Extensible Business Reporting Language): (i) the Consolidated Statements of Income – Year Ended December 31, 2014 and 2013, (ii) the Consolidated Balance Sheets – December 31, 2014 and December 31, 2013, (iii) the Consolidated Statements of Cash Flows – Year Ended December 31, 2014 and 2013 and (iv) Notes to Consolidated Financial Statements. |
Copies of all agreements defining the rights of holders of long-term debt of the Company and its subsidiaries, which agreements authorize amounts not in excess of 10% of the total consolidated assets of the Company, are not filed herewith but will be furnished to the Commission upon request.
SIGNATURES
Pursuant to the requirements of Section 13 or 15(d) of the Securities Exchange Act of 1934, the registrant has duly caused this report to be signed on its behalf by the undersigned, thereunto duly authorized.
| | ADAMS RESOURCES & ENERGY, INC. |
| | (Registrant) |
| | |
| | |
By /s/Richard B. Abshire | By /s/ K.Thomas S. Adams, Jr.Smith |
| Richard B. Abshire, | K.Thomas S. Adams, Jr.,Smith |
| Vice President and Chief Financial Officer | Chairman of the Board andChief Executive Officer |
| (Principal Financial Officer and Principal Accounting Officer) | Chief Executive Officer |
| (Principal Executive Officer) |
| |
Date: March 22, 201213, 2015
Pursuant to the requirements of the Securities Exchange Act of 1934, this report has been signed below by the following persons on behalf of the Registrant and in the capacities and on the date indicated.
By /s/ Thomas S. Smith |
| Thomas S. Smith, Director |
| (Chairman) |
By /s/ Frank T. Webster | By /s/ E. C. Reinauer, Jr. |
| Frank T. Webster, Director | E. C. Reinauer, Jr., Director |
| | |
| | |
| | |
By /s/ Larry E. Bell | By /s/ Townes G. Pressler |
| Larry E. Bell, Director | Townes G. Pressler, Director |
| |
EXHIBIT INDEX
| Exhibit | |
| Number | Description |
| | |
| 3(a) | - Certificate of Incorporation of the Company, as amended. (Incorporated by reference to Exhibit 3(a) filed with the Annual Report on Form 10-K of the Company for the fiscal year ended December 31, 1987) . |
| | |
| 3(b) | - Bylaws of the Company, as amendedamended. (Incorporated by reference to Exhibits 3.2 and 3.2.1 of Amendment No. 1 to the Registration Statement on Form S-1Exhibit 3(b) filed with the Securities and Exchange CommissionAnnual Report on October 29, 1973 – FileForm 10-K for the year ended December 31, 2012 (-File No. 2-48144) 1-7908). |
| | |
| 3(c) | - Amendment to the Bylaws of the Company to add an Article VII, Section 8. Indemnification of Directors, Officers, Employees and Agents (Incorporated by reference to Exhibit 3(c) of the Annual Report on Form 10-K of the Company for the fiscal year ended December 31, 1986)
|
| |
3(d) | - Adams Resources & Energy, Inc. and Subsidiaries’ Code of Ethics (Incorporated by reference to Exhibit 3(d) of the Annual Report on Form 10-K of the Company for the fiscal year ended December 31, 2002) . |
| | |
| 4(a) | - Specimen common stock Certificate (Incorporated by reference to Exhibit 4(a) of the Annual Report on Form 10-K of the Company for the fiscal year ended December 31, 1991) . |
| | |
| 4(b) | - Credit and Security Agreement between Gulfmark Energy, Inc., Adams Resources Marketing, Ltd and Wells Fargo Bank, National Association dated August 27, 2010 (Incorporated by reference to Exhibit 4(b) of the Quarterly Report on Form 10-Q for the period ended September 31, 201030, 2009). |
10.1(a)+ 10.1(b)+
10.1(c)+
10.1(d)+
10.1(e)+
10.1(f)+
10.1(g)+
10.1(h)+
10.1(i)+
10.1(j)+
10.1(k)*+
| - Employment agreementAgreement of Frank T. Webster, President, dated May 4,12, 2004 by and between Adams Resources & Energy, Inc. and Frank T. Webster (Incorporated by reference to Exhibit 10.1 to the Company’s Quarterly Report on Form 10-Q for the period ended September 30, 2004) . |
| |
| 10.1(b)+ | - NinthEleventh Amendment to Employment Agreement of Frank T. Webster, President, by and between Adams Resources & Energy, Inc. and Frank T. Webster effective December 6, 2011.5, 2013 (Incorporated by reference to Exhibit 10.1 to the Company’s Form 8-K filed in December 6, 2011). - Change in Control/Severance agreement by and between Adams Resources & Energy, Inc. and Richard B. Abshire effective July 25, 2008. (Incorporated by reference to Exhibit 10.1 to the Company’s current report on Form 8-K filed on July 25, 2008)
- First Amendment to Change in Control/Severance agreement by and between Adams Resources & Energy, Inc. and Richard B. Abshire effective December 6, 2011. (Incorporated by reference to Exhibit 10.2 to the Company’s current report on Form 8-K filed on December 6, 2011)2013).
- Amendment to Change in Control/Severance agreement by and between Adams Resources & Energy, Inc. and Sharon Davis effective December 6, 2011. (Incorporated by reference to Exhibit 10.3 to the Company’s current report on Form 8-K filed on December 6, 2011)
- Amendment to Employment Agreement of Frank T. Webster, President, dated December 6, 2010 by and between Adams Resources & Energy, Inc. and Frank T. Webster (Incorporated by reference to Exhibit 10.1(b) to the Company’s Annual Report on Form 10-K for the fiscal year ended December 31, 2010).
- Non-Employee Director Change in Control Agreement by and between Adams Resources & Energy, Inc. and E. C. Reinauer, Jr., dated effective December 6, 2011 (Incorporated by reference to Exhibit 10.4 to the Company’s Form 8-K filed on December 6, 2011).
- Non-Employee Director Change in Control Agreement by and between Adams Resources & Energy, Inc. and Townes G. Pressler, dated effective December 6, 2011 (Incorporated by reference to Exhibit 10.5 to the Company’s Form 8-K filed on December 6, 2011).
- Non-Employee Director Change in Control Agreement by and between Adams Resources & Energy, Inc. and Larry E. Bell, dated effective December 6, 2011 (Incorporated by reference to Exhibit 10.5 to the Company’s Form 8-K filed on December 6, 2011)
|
| |
| 10.1(c)+ | - Standard form Indemnification Agreement between Adams Resources & Energy, Inc. and Officers or Directors (Incorporated by reference to Exhibit 10.1 to the Company’s Quarterly Report on Form 10-Q for the period ended September 30, 2011). |
| |
| 10.1(d)+ | - Change in Control/Severance agreement byRetirement and Transition Agreement dated February 26, 2015 between Adams Resources & Energy, Inc. and Sharon Davis (nee Copeland)Frank T. Webster effective September 20, 2008February 26, 2015 (Incorporated by reference to Exhibit 10.1 to the Company’s Form 8-K filed on February 26, 2015). |
| | |
| 21* | - Subsidiaries of the Registrant |
| | |
| 23.1* | - Consent of Ryder Scott Company |
| | |
| 31.1* | - Certification Pursuant to 17 CFR 13a-14(a)/15d-14(a), Asas Adopted Pursuant to Section 302 of the Sarbanes-Oxley Act of 2002 |
| | |
| 31.2* | - Certification Pursuant to 17 CFR 13a-14(a)/15d-14(a), Asas Adopted Pursuant to Section 302 of the Sarbanes-Oxley Act of 2002 |
| | |
| 32.1* | - Certification Pursuant to 18 U.S.C. Section 1350, Asas Adopted Pursuant to Section 906 of the Sarbanes-Oxley Act of 2002 |
| | |
| 32.2* | - Certification Pursuant to 18 U.S.C. Section 1350, Asas Adopted Pursuant to Section 906 of the Sarbanes-Oxley Act of 2002 |
| | |
| 99.1* | - Ryder Scott Company Report |
| | |
| 101.INS* | - XBRL Instance Document |
| |
| 101.SCH* | - XBRL Schema Document |
| |
| 101.CAL* | - XBRL Calculation Linkbase Document |
| |
| 101.LAB* | - XBRL Label Linkbase Document |
| |
| 101.PRE* | - XBRL Presentation Linkbase Document |
| |
| | ______________________________ |
| +- Management contract or compensation plan or arrangement. |
| **- Attached as Exhibit 101 to this report are the following documents formatted in XBRL (Extensible Business Reporting Language): (i) the Consolidated Statements of Income – Year Ended December 31, 2014 and 2013, (ii) the Consolidated Balance Sheets – December 31, 2014 and December 31, 2013, (iii) the Consolidated Statements of Cash Flows – Year Ended December 31, 2014 and 2013 and (iv) Notes to Consolidated Financial Statements. |