UNITED STATES
SECURITIES AND EXCHANGE COMMISSION
Washington, D.C. 20549
FORM 10-K
(Mark One)
þ☑ ANNUAL REPORT PURSUANT TO SECTION 13 OR 15(d) OF
THE SECURITIES EXCHANGE ACT OF 1934
For the fiscal year ended December 31, 2018 2021
OR
o☐ TRANSITION REPORT PURSUANT TO SECTION 13 OR 15(d) OF
THE SECURITIES EXCHANGE ACT OF 1934
For the transition period from ___ to ___.
Commission file number: 1-7908
ADAMS RESOURCES & ENERGY, INC.
(Exact name of Registrant as Specified in Its Charter)
| | | | | | | | | | | |
DELAWAREDelaware | | 74-1753147 | |
(State or Other Jurisdiction of Incorporation or Organization) | | (I.R.S. Employer Identification No.) | |
| | | |
| 17 SOUTH BRIAR HOLLOW LANE, SUITE 100, HOUSTON, TEXASTexas 77027 | | |
| (Address of Principal Executive Offices) (Zip Code) | | |
| | | |
| (713) 881-3600 | | |
| (Registrant’s Telephone Number, Including Area Code) | | |
Securities registered pursuant to Section 12(b) of the Act:
| | | | | | | | | | | | | | |
Title of Each Classeach class | | Trading Symbol(s) | | Name of Each Exchange On Which Registeredeach exchange on which registered |
| Common Stock, $0.10 Par Value | | AE | | NYSE American LLC |
Securities to be registered pursuant to Section 12(g) of the Act:Act: None.
Indicate by check mark if the registrant is a well-known seasoned issuer, as defined in Rule 405 of the Securities Act. Yes o No þ
Indicate by check mark if the registrant is not required to file reports pursuant to Section 13 or Section 15(d) of the Act. Yes o No þ
Indicate by check mark whether the registrant (1) has filed all reports required to be filed by Section 13 or 15(d) of the Securities Exchange Act of 1934 during the preceding 12 months (or for such shorter period that the registrant was required to file such reports), and (2) has been subject to such filing requirements for the past 90 days. Yes þ No o
Indicate by check mark whether the registrant has submitted electronically every Interactive Data File required to be submitted pursuant to Rule 405 of Regulation S-T during the preceding 12 months (or for such shorter period that the registrant was required to submit such files).
Yes þ No o
Indicate by check mark if disclosure of delinquent filers pursuant to Item 405 of Regulation S-K is not contained herein, and will not be contained, to the best of registrant’s knowledge, in definitive proxy or information statements incorporated by reference in Part III of this Form 10-K or any amendment to this Form 10-K. þ
Indicate by check mark whether the registrant is a large accelerated filer, an accelerated filer, a non-accelerated filer, a smaller reporting company, or an emerging growth company. See definitions of “large accelerated filer,” “accelerated filer,” “smaller reporting company” and “emerging growth company” in Rule 12b-2 of the Exchange Act.
Large accelerated filer o Accelerated filer þo Non-accelerated filer oþ Smaller reporting company þ☑ Emerging growth company o☐
If an emerging growth company, indicate by check mark if the registrant has elected not to use the extended transition period for complying with any new or revised financial accounting standards provided pursuant to Section 13(a) of the Exchange Act. o
Indicate by check mark whether the registrant has filed a report on and attestation to its management’s assessment of the effectiveness of its internal control over financial reporting under Section 404(b) of the Sarbanes-Oxley Act (15 U.S.C. 7262(b)) by the registered public accounting firm that prepared or issued its audit report.☑
Indicate by check mark whether the registrant is a shell company (as defined in Rule 12b-2 of the Exchange Act). Yes o☐ No þ
The aggregate market value of the Company’s voting and non-voting common shares held by non-affiliates as of the close of business on June 29, 201830, 2021 was $92,505,083$63,547,304 based on the closing price of $43.00$27.69 per one share of common stock as reported on the NYSE American LLC for such date. There were 4,217,5964,367,866 shares of Common Stock outstanding at March 1, 2019.2022.
DOCUMENTS INCORPORATED BY REFERENCE
Portions of the Proxy Statement for the Annual Meeting of Shareholders to be held May 14, 201910, 2022 are incorporated by reference into Part III of this annual report on Form 10-K.
ADAMS RESOURCES & ENERGY, INC.
TABLE OF CONTENTS
CAUTIONARY STATEMENT REGARDING FORWARD-LOOKING INFORMATION
This annual report on Form 10-K for the year ended December 31, 20182021 (our “annual report”) contains various forward-looking statements and information that are based on our beliefs, as well as assumptions made by us and information currently available to us. When used in this document, words such as “anticipate,” “project,” “expect,” “plan,” “seek,” “goal,” “estimate,” “forecast,” “intend,” “could,” “should,” “would,” “will,” “believe,” “may,” “potential” and similar expressions and statements regarding our plans and objectives for future operations are intended to identify forward-looking statements. Although we believe that our expectations reflected in such forward-looking statements are reasonable, we cannot give any assurances that such expectations will prove to be correct. Forward-looking statements are subject to a variety of risks, uncertainties and assumptions as described in more detail under Part I, Item 1A of this annual report. If one or more of these risks or uncertainties materialize, or if underlying assumptions prove incorrect, our actual results may vary materially from those anticipated, estimated, projected or expected. You should not put undue reliance on any forward-looking statements. The forward-looking statements in this annual report speak only as of the date hereof. Except as required by federal and state securities laws, we undertake no obligation to publicly update or revise any forward-looking statements, whether as a result of new information, future events or any other reason.
PART I
Items 1 and 2. Business and Properties.
General
Adams Resources & Energy, Inc. (“AE”) is a publicly traded Delaware corporation organized in 1973, the common shares of which are listed on the NYSE American LLC (“NYSE American”) under the ticker symbol “AE”. We, throughThrough our subsidiaries, we are primarily engaged in the business of crude oil marketing, transportation, terminalling and storage in various crude oil and natural gas basins in the lower 48 states of the United States (“U.S.”). We also conduct tank truck transportation of liquid chemicals, pressurized gases, asphalt and dry bulk primarily in the lower 48 states of the U.S. with deliveries into Canada and Mexico, and with nineteen terminals in the Gulf Coast region ofacross the U.S. Our headquarters are located in 27,93222,197 square feet of office space located at 17 South Briar Hollow Lane, Suite 100, Houston, Texas 77027, and the telephone number of that address is (713) 881-3600.77027. Unless the context requires otherwise, references to “we,” “us,” “our,” the “Company” or “AE” are intended to mean the business and operations of Adams Resources & Energy, Inc. and its consolidated subsidiaries.
We operate and report in twothree business segments: (i) crude oil marketing, transportation and storage, andstorage; (ii) tank truck transportation of liquid chemicals, pressurized gases, asphalt and dry bulk. We exited the upstreambulk; and (iii) pipeline transportation, terminalling and storage of crude oil and natural gas exploration and production business during 2017 with the sale of our upstream crude oil and natural gas exploration and production assets.
oil. For detailed financial information regarding our business segments, see Note 9 in the Notes to Consolidated Financial Statements included under Part II, Item 8 of this annual report.
2018
2021 Developments
Asset AcquisitionCOVID-19 Update
The outbreak of the novel coronavirus (“COVID-19”) in 2019 has evolved into a continuing global pandemic that has spread to many regions of the world, including the areas of the U.S. where we operate. In an attempt to control the spread of the virus, significant governmental measures have been implemented, including quarantines, travel restrictions, business shutdowns, restrictions on non-essential activities in the U.S. and abroad and vaccine mandates. The ongoing pandemic has resulted in a number of adverse economic effects, including changes in consumer behavior related to the economic slowdown, disruption of historical supply and demand patterns, and changes in the work force, which has affected our business and the businesses of our customers. These adverse economic effects of the COVID-19 outbreak have impacted our crude oil marketing operations and our transportation services.
The COVID-19 pandemic has created business challenges primarily related to changes in the work force, which has impacted our ability to hire and retain qualified truck drivers in both of our business units, and issues with the supply chain, resulting in delays in purchasing items, including new tractors. While demand for transportation of products and demand for crude oil has increased from 2020 levels during the initial months of the pandemic, our growth in 2021 has been limited in certain markets by the availability of truck drivers.
Our primary focus continues to be the safety of our employees and operations while providing uninterrupted service to our customers. We continue to maintain the safety protocols we established, including encouraging our employees to seek vaccination when eligible. We are dependent on our workforce of truck drivers to transport crude oil and products for our customers. Developments such as social distancing and shelter-in-place directives thus far have not had a significant impact on our ability to deploy our workforce effectively as the transportation industry has been deemed an essential service under current Cybersecurity and Infrastructure Security Agency guidelines. We have taken measures to seek to ensure the safety of our employees and operations while maintaining uninterrupted service to our customers. The safety of our employees and operations while providing uninterrupted service to our customers remains our primary focus.
We have also been seeking ways to overcome supply shortages in tractors, by additional maintenance to extend vehicle lives, shortages in tires and other inventory by having additional items on hand and increases in the price of diesel fuel by continuing to pass costs through to customers or attempting to reduce costs through efficiencies.
We are actively monitoring the global situation and its effect on our financial condition, liquidity, operations, customers, industry and workforce. Given the daily evolution of the COVID-19 outbreak and the global responses to curb its spread, we cannot estimate the length or gravity of the impacts of these events at this time. While we consider the overall effects of the pandemic to be temporary, if the pandemic and its economic effects continue, particularly in light of new and variant strains of the virus and the plateau of vaccination rates, it may have a material adverse effect on our results of future operations, financial position and liquidity.
We plan to continue to operate our remaining business segments with internally generated cash flows and borrowings under the Credit Agreement (discussed further below) during 2022, but we intend to remain flexible as the focus will be on increasing efficiencies and on business development opportunities, as well as on the hiring and retention of qualified truck drivers. During 2022, we plan to continue our efforts to diversify service offerings and leverage back haul opportunities in our transportation segment, and we plan to grow in new or existing areas with our crude oil marketing segment, while focusing on opportunities to increase our pipeline and storage capacity utilization.
Credit Agreement
On October 1, 2018,May 4, 2021, we completedentered into a $10.0Credit Agreement (“Credit Agreement”) with Wells Fargo Bank, National Association, as Agent and Issuing Lender, under which we may borrow or issue letters of credit in an aggregate of up to $40.0 million purchase ofunder a trucking company that owned approximately 113 tractors and 126 trailers operating in the Red River area in North Texas and South Central Oklahoma (the “Red River acquisition”). This acquisition is included inrevolving credit facility, which will mature on May 4, 2024, subject to our crude oil marketing segment.compliance with certain financial covenants. See Note 612 in the Notes to Consolidated Financial Statements included under Part II, Item 8 of this annual report for further information. report.
Business Segments
Crude Oil Marketing
Our crude oil marketing segment consists of the operations of our wholly owned subsidiary, GulfMark Energy, Inc. (“GulfMark”). Our crude oil marketing activities generate revenue from the sale and delivery of crude oil purchased either directly from producers or from others on the open market. We also derive revenue from third party transportation contracts. We purchase crude oil and arrange sales and deliveries to refiners and other customers, primarily onshore in Texas, Oklahoma, North Dakota, Michigan, Wyoming and Louisiana. On October 1, 2018, we completed the Red River acquisition.
Our crude oil marketing activities includes a fleet of 255201 tractor-trailer rigs, the majority of which we own and operate, used to transport crude oil. We also maintain approximately 201180 pipeline inventory locations or injection stations. We have the ability to barge crude oil from foursix crude oil storage facilities along the IntercoastalIntracoastal Waterway of Texas and Louisiana, and we have access to approximately 629,000889,000 barrels of storage capacity at the dock facilities in order to access waterborne markets for our products.
The following table shows the age of our owned and leased tractors and trailers within our crude oil marketing segment at December 31, 2018:2021:
| | | | | | | | | | | |
| Tractors (1) (2) | | Trailers (2) |
| | | |
| Model Year: | | | |
| 2019 | 24 | | — |
| 2018 | 15 | | — |
| 2017 | 4 | | — |
| 2015 | 86 | | 29 |
| 2014 | 37 | | 34 |
| 2013 | 41 | | 41 |
| 2012 | 25 | | 31 |
| 2011 | 23 | | 112 |
| 2010 and earlier | — | | 69 |
| Total | 255 | | 316 |
| | | | | | | | | | | |
| Tractors (1) | | Trailers |
| | | |
| Model Year: | | | |
| | | |
| 2021 | 40 | | | — | |
| 2020 | 51 | | | — | |
| 2019 | 38 | | | — | |
| 2018 | 15 | | | — | |
| 2017 | 4 | | | — | |
| 2015 | 37 | | | 29 | |
| 2014 | 11 | | | 33 | |
| 2013 | 1 | | | 41 | |
| 2012 | 1 | | | 30 | |
| 2011 | 3 | | | 109 | |
| 2010 and earlier | — | | | 40 | |
| Total | 201 | | | 282 | |
____________________
(1)Includes twenty-fourforty 2021 tractors, thirty 2019 tractors and fifteen 2018 tractors that we lease from a third party under a capitalfinance lease agreement.agreements. See Note 1517 in the Notes to Consolidated Financial Statements for further information.
(2) Includes 113 tractors and 126 trailers that we acquired in our Red River acquisition.
We purchase crude oil at the field (wellhead) level. Volume and price information were as follows for the periods indicated:
| | | | | | | | | | | | | | | | | |
| Year Ended December 31, | | | | |
| 2018 | | 2017 | | 2016 |
Field level purchase volumes – per day (1) (2) | | | | | |
| Crude oil – barrels | 79,361 | | 67,447 | | 72,900 |
| | | | | |
| Average purchase price | | | | | |
| Crude oil – per barrel | $ | 64.53 | | $ | 49.88 | | $ | 39.30 |
| | | | | | | | | | | | | | | | | |
| Year Ended December 31, |
| 2021 | | 2020 | | 2019 |
Field level purchase volumes – per day (1) | | | | | |
| Crude oil – barrels | 89,061 | | | 91,957 | | | 107,383 | |
| | | | | |
| Average purchase price | | | | | |
| Crude oil – per barrel | $ | 65.48 | | | $ | 36.90 | | | $ | 56.28 | |
____________________
(1)Reflects the volume purchased from third parties at the field level of operations.
(2) Effective October 1, 2018, in connection with the Red River acquisition, we entered into a new revenue contract to purchase crude oil. The 2018 amount includes the additional volumes purchased during the fourth quarter of 2018.
Field level purchase volumes depict our day-to-day operations of acquiring crude oil at the wellhead, transporting crude oil, and delivering it to market sales points. We held crude oil inventory at a weighted average composite price as follows at the dates indicated (in barrels):
| | | | | | | | | | | | | | | | | | | | | | | | | | | | | | | | | | | |
| December 31, | | | | | | | | | | |
| 2018 | | | | 2017 | | | | 2016 | | |
| | | Average | | | | Average | | | | Average |
| Barrels | | Price | | Barrels | | Price | | Barrels | | Price |
| | | | | | | | | | | |
| Crude oil inventory | 415,523 | | $ | 54.82 | | 198,011 | | $ | 61.57 | | 255,146 | | $ | 51.22 |
| | | | | | | | | | | | | | | | | | | | | | | | | | | | | | | | | | | |
| December 31, |
| 2021 | | 2020 | | 2019 |
| | | Average | | | | Average | | | | Average |
| Barrels | | Price | | Barrels | | Price | | Barrels | | Price |
| | | | | | | | | | | |
| Crude oil inventory | 259,489 | | | $ | 71.86 | | | 421,759 | | | $ | 45.83 | | | 426,397 | | | $ | 61.93 | |
We deliver physical supplies to refinery customers or enter into commodity exchange transactions from time to time to protect from a decline in inventory valuation. During the year ended December 31, 2018,2021, we had sales to two customers that comprised 27.3approximately 23.7 percent and 14.111.6 percent, respectively, of total consolidated revenues. We believe alternative market outlets for our commodity sales are readily available and a loss of any of these customers would not have a material adverse effect on our operations. See Note 1619 in the Notes to Consolidated Financial Statements for further information regarding credit risk.
Operating results for our crude oil marketing segment are sensitive to a number of factors. These factors include commodity location, grades of product, individual customer demand for grades or location of product, localized market price structures, availability of transportation facilities, actual delivery volumes that vary from expected quantities, and the timing and costs to deliver the commodity to the customer.
Transportation
Our transportation segment consists of the operations of our wholly owned subsidiary, Service Transport Company (“STC”). STC transports liquid chemicals, pressurized gases, asphalt and to a lesser extent, dry bulk on a “for hire” basis throughout the continental U.S., and into Canada and Mexico. For deliveries into Mexico, our drivers meet a third party carrier at the border, and the third party contractor delivers the products to the customer within Mexico. We do not own any of the products that we haul; rather we act as a third party carrier to deliver our customers’ products from point A to point B, using predominately our employees and our owned or leased tractors and trailers. However, we also use contracted independent owner operators to provide transportation services. Transportation services are provided to customers under multiple load contracts in addition to loads covered under STC’s standard price list. Our customers include major oil and chemical companies and large and mid-sized industrial companies.
The following table shows the age of our owned and leased tractors and trailers within our transportation segment at December 31, 2018:
| | | | | | | | | | | |
| Tractors (1) | | Trailers |
| | | |
| Model Year: | | | |
| 2019 | 60 | | — |
| 2016 | 29 | | — |
| 2015 | 36 | | 82 |
| 2014 | 1 | | 35 |
| 2013 | 82 | | — |
| 2012 | 26 | | 30 |
| 2011 | 3 | | — |
| 2008 and earlier | — | | 403 |
| Total | 237 | | 550 |
____________________
(1) Excludes 30 contracted independent owner operator tractors.
Miles traveled was as follows for the periods indicated (in thousands):
| | | | | | | | | | | | | | | | | |
| Year Ended December 31, | | | | |
| 2018 | | 2017 | | 2016 |
| | | | | |
| Mileage | 19,177 | | 21,835 | | 22,611 |
STC also operates nineteen truck terminals in ten states: (i) Texas, with terminals in Houston, Corpus Christi, Nederland and Freeport, Texas;Freeport; (ii) Louisiana, with terminals in Baton Rouge (St. Gabriel), St. Rose, Boutte and Boutte, Louisiana;Sterlington; (iii) Florida, with terminals in Jacksonville and Tampa; (iv) Georgia, with terminals in Atlanta and Augusta; (v) Mobile, (Saraland), Alabama. Alabama; (vi) Charlotte, North Carolina; (vii) Cincinnati, Ohio; (viii) South Charleston, West Virginia; (ix) West Memphis, Arkansas; and (x) Illinois, with terminals in East St. Louis and Joliet. The St. Gabriel, Louisiana and the Corpus Christi, Texas terminals are situated on 11.5 acres and 3.5 acres, respectively, that we own, and both include an office building, maintenance bays and tank cleaning facilities.
Transportation operations are headquartered at a terminal facility situated on 26.5 acres that we own in Houston, Texas. This property includes maintenance facilities, administrative offices and terminal facility, tank wash rack facilities and a water treatment system. The St. Gabriel, Louisiana terminal is situated on 11.5 acres that we own and includes an office building, maintenance bays and tank cleaning facilities. Pursuant to regulatory requirements, STC holds a Hazardous Materials Certificate of Registration issued by the U.S. Department of Transportation (“DOT”).
The following table shows the age of our owned and leased tractors and trailers within our transportation segment at December 31, 2021:
| | | | | | | | | | | |
| Tractors (1) (2) | | Trailers (3) |
| | | |
| Model Year: | | | |
| 2022 | 28 | | | 50 | |
| 2021 | 33 | | | 12 | |
| 2020 | 137 | | | 100 | |
| 2019 | 82 | | | — | |
| 2018 | 1 | | | 20 | |
| 2016 | 29 | | | 6 | |
| 2015 | 13 | | | 76 | |
| 2014 | — | | | 34 | |
| 2013 | — | | | 5 | |
| 2012 | — | | | 30 | |
| 2008 and earlier | — | | | 504 | |
| Total | 323 | | | 837 | |
____________________
(1)Excludes 83 contracted independent owner operator tractors.
(2)Includes thirty-three 2021 tractors that we lease from a third party under finance lease agreements.
(3)Includes twenty 2020 and twenty 2018 trailers that we lease from a third party under a finance lease agreement. See Note 17 in the Notes to Consolidated Financial Statements for further information.
Miles traveled was as follows for the periods indicated (in thousands):
| | | | | | | | | | | | | | | | | |
| Year Ended December 31, |
| 2021 | | 2020 | | 2019 |
| | | | | |
Mileage (1) | 27,902 | | | 24,239 | | | 20,535 | |
____________________
(1)The increase in mileage from 2019 to 2021 is primarily due to the acquisition of substantially all of the transportation assets of Comcar’s subsidiary, CTL Transportation, LLC (“CTL”) in June 2020, which added services to new and existing customers, new product lines and six new market areas to our transportation segment portfolio. See Note 6 in the Notes to Consolidated Financial Statements included under Part II, Item 8 of this annual report for further information.
All company and independent contractor tractors are equipped with in-cab communication technology, enabling two-way communications between our dispatch office and our drivers, through both standardized and free-form messaging, including electronic logging. We have also installed electronic logging devices (ELDs) on 100 percent of our tractor fleet. This technology enables us to dispatch drivers efficiently in response to customers’ requests and to provide real-time information to customers about the status of their shipments. We have also equipped our tractor fleet with forward-facing and in-ward facing event recorders.These cameras are constantly recording the movements of the vehicles, and our management team is alerted via email in the event the unit triggers a G-force event.A snapshot of this recording is then sent to the management team for review.
STC is a recognized certified partner withholds the American Chemistry Council’s certification as a Responsible Care Management System (“RCMS”). company. The scope of this RCMS certification covers the carriage of bulk liquids throughout STC’s area of operations as well as the tank trailer cleaning facilities and equipment maintenance. Certification was granted based on STC’s conformance to the RCMS’s comprehensive environmental health, safety and security requirements. STC’s quality management process is one of its major assets. The practice of using statistical process control covering safety, on-time performance and customer satisfaction aids continuous improvement in all areas of quality service. Certified RCMS partners serve
STC is a Partner in the U.S. Environmental Protection Agency’s (“EPA”) SmartWay Transport Partnership, a national voluntary program developed by the EPA and freight industry representatives to reduce greenhouse gases and air pollution and promote cleaner, more efficient ground freight transportation.
During 2020, STC applied for and received its first bronze star rating from EcoVadis, a global leader in monitoring, benchmarking and enabling sustainability in global supply chains.
STC is a member of Texas TRANSCAER®, a non-profit organization with membership from the chemical, industrytransportation and implementemergency response industries. The mission of Texas TRANSCAER® is to promote safe transportation and monitorhandling of hazardous materials, educate about the seven Codessafety and security of Management Practices. The seven codes address compliancehazardous materials that are transported through communities, and continuing improvement in (1) Community Awarenessprovide education and Emergency Response, (2) Pollution Prevention, (3) Processtraining for emergency responders along transportation routes. As members of Texas TRANSCAER®, STC Safety (4) Distribution, (5) Employee Health and Safety, (6) Product Stewardship, and (7) Security.Personnel assist with training events for first responders all over Texas.
Our strategy is to build long-term relationships with our customers based upon the highest level of customer service, safety and reliability. We believe that our commitment to safety, flexibility, size and capabilities provide us with a competitive advantage over other carriers.
InvestmentsPipeline and Storage Segment
Our new pipeline and storage segment consists of the operations of two wholly-owned subsidiaries of GulfMark, which constitute the VEX Pipeline System: (i) VEX, which we acquired on October 22, 2020 and which owns the VEX pipeline, and (ii) GMT, which was formed in October 2020 to hold the related terminal facility assets we acquired with the VEX Pipeline System. The VEX Pipeline System complements our existing storage terminal and dock at the Port of Victoria, where with our crude oil marketing segment, we now control approximately 450,000 barrels of storage with three docks.
The VEX Pipeline System, with truck and storage terminals at both Cuero and the Port of Victoria, Texas, is a crude oil and condensate pipeline system, which connects the heart of the Eagle Ford Basin to the Gulf Coast waterborne market. The VEX Pipeline System includes 56 miles of 12-inch pipeline, which spans DeWitt County to Port of Victoria in Victoria County, Texas, with approximately 350,000 barrels of above ground storage at its two terminals. The pipeline system has a current capacity of 90,000 barrels per day and is regulated by the Federal Energy Regulatory Commission (“FERC”) and the Texas Railroad Commission. The VEX Pipeline System can receive crude oil by pipeline and truck, and has downstream pipeline connections to two terminals today, with potential for additional downstream connection opportunities in the future.
The Cuero terminal has 40,000 barrels per day of offload capacity via eight truck unloading stations, with two 80,000 barrels and one 16,000 barrels of storage tanks. The Port of Victoria terminal has 40,000 barrels per day of offload capacity via eight truck unloading stations and water access via two barge docks, which have been leased from the Port Authority in Victoria. The Port of Victoria has four 40,000 barrels and one 10,000 barrels storage tanks.
The VEX Pipeline System supports GulfMark’s Gulf Coast region crude oil supply and marketing business and integrates into GulfMark’s value chain, serving as the link between producers/operators and our end-user markets we supply directly along the Gulf Coast waterborne market. With GulfMark’s ownership of the VEX Pipeline System, we have the opportunity to increase our efficiency by more effectively managing the pipeline and terminalling portion of our overall transportation costs.
In addition to the VEX Pipeline System serving GulfMark, we currently have opportunities to work with third parties both upstream and downstream of the VEX Pipeline System. We also continue to provide services to our existing customer at the Port of Victoria terminal.
We expect that this acquisition will further strengthen and ensure that we continue to provide excellent service to the producers in the Gulf Coast region, as well as increase our margin opportunity as we more cost effectively service our end-user markets along the Gulf Coast.
Investment in Unconsolidated AffiliatesAffiliate
We own an approximate 15 percent equity interest (less than 3 percent voting interest) in VestaCare, Inc., a California corporation (“VestaCare”), through Adams Resources Medical Management, Inc. (“ARMM”), a wholly owned subsidiary. We acquired our interest in VestaCare in April 2016 for a $2.5 million cash payment, which we impaired during the third quarter ofin 2017. VestaCare provides an array of software as a service (SaaS) electronic payment technologies to medical providers, payers and patients including VestaCare’s most recent product offering, VestaPay™. VestaPay™ allows medical care providers to structure fully automated and dynamically updating electronic payment plans for their patients. We do not currently have any plans to pursue additional medical-related investments. See Note 82 in the Notes to Consolidated Financial Statements for further information.
Competition
In all phases of our operations, we encounter strong competition from a number of entities. Many of these competitors possess financial resources substantially in excess of ours and may have a more expansive geographic footprint than we have. We face competition principally in establishing trade credit, pricing of available materials, quality of service and location of service. Our strategy is to build long-term partnerships with our customers based upon the safety of our operations, reliability and superior customer service.
Our crude oil marketing segment competes with major crude oil companies and other large industrial concerns that own or control significant refining, midstream and marketing facilities. These major crude oil companies may offer their products to others on more favorable terms than those available to us.
In the trucking industry, the tank lines transportation business is extremely competitive and fragmented. Price, service and location are the major competitive factors in each local market.
Seasonality
In the trucking industry, revenue has historically followed a seasonal pattern for various commodities and customer businesses. Peak freight demand has historically occurred in the months of September, October and November. After the December holiday season and during the remaining winter months, freight volumes are typically lower as many customers reduce shipment levels. Operating expenses have historically been higher in the winter months primarily due to decreased fuel efficiency, increased cold weather-related maintenance costs of revenue equipment, and increased insurance claim costs attributable to adverse winter weather conditions. Revenue can also be impacted by weather, holidays and the number of business days that occur during a given period, as revenue is directly related to the available working days of shippers.
Although our crude oil marketing business is not materially affected by seasonality, certain aspects of our operations are impacted by seasonal changes, such as tropical weather conditions, energy demand in connection with heating and cooling requirements and the summer driving season.
Inflation
Most of our operating expenses are inflation-sensitive, with inflation generally producing increased costs of operations. During the past three years, inflation has been fairly modest with its impacts mostly related to the price of equipment and tires and compensation paid to drivers.
In addition to inflation, fluctuations in fuel prices can affect profitability. Most of our transportation contracts with customers contain fuel surcharge provisions. Although we historically has been able to pass through most long-term increases in fuel prices and operating taxes to customers in the form of surcharges and higher rates, there is no guarantee that this will be possible in the future. See “Part I, Item 1A. Risk Factors.”
Regulatory Matters
We are subject to an extensive variety of evolving federal, state and local laws, rules and regulations governing the storage, transportation, manufacture, use, discharge, release and disposal of product and contaminants into the environment, or otherwise relating to the protection of the environment. Below is a non-exclusive listing of the environmental laws that potentially impact our business.
•The Solid Waste Disposal Act, as amended by the Resource Conservation and Recovery Act of 1976, as amended.
•The Clean Water Act of 1972, as amended.
•The Clean Air Act of 1970, as amended.
•The Toxic Substances Control Act of 1976, as amended.
•The Emergency Planning and Community Right-to-Know Act.
•The Occupational Safety and Health Act of 1970, as amended.
•Texas Clean Air Act.
•Texas Solid Waste Disposal Act.
•Texas Water Code.
•Texas Oil Spill Prevention and Response Act of 1991, as amended.
Railroad Commission of Texas (“RRC”)
The RRC regulates, among other things, the drilling and operation of crude oil and natural gas wells, the operation of crude oil and natural gas pipelines, the disposal of crude oil and natural gas production wastes, and certain storage of crude oil and natural gas. RRC regulations govern the generation, management and disposal of waste from these crude oil and natural gas operations and provide for the cleanup of contamination from crude oil and natural gas operations.
Louisiana Office of Conservation
The Louisiana Office of Conservation has primary statutory responsibility for regulation and conservation of crude oil, natural gas, and other natural resources in the State of Louisiana. Their objectives are to (i) regulate the exploration and production of crude oil, natural gas and other hydrocarbons, (ii) control and allocate energy supplies and distribution thereof, and (iii) protect public safety and the environment from oilfield waste, including the regulation of underground injection and disposal practices.
State and Local Government Regulation
Many states are authorized by the U.S. Environmental Protection Agency (“EPA”)EPA to enforce regulations promulgated under various federal statutes. In addition, there are numerous other state and local authorities that regulate the environment, some of which impose more stringent environmental standards than federal laws and regulations. The penalties for violations of state law vary, but typically include injunctive relief and recovery of damages for injury to air, water or property as well as fines for non-compliance.
Trucking Activities
Our crude oil marketing and transportation businesses operate truck fleets pursuant to the authority of the DOT and various state authorities. Trucking operations must be conducted in accordance with various laws relating to pollution and environmental control as well as safety requirements prescribed by states and by the DOT. Matters such as weight and dimension of equipment are also subject to federal and state regulations. These regulations also require mandatory drug testing of drivers and require certain tests for alcohol levels in drivers and other safety personnel. The trucking industry is subject to possible regulatory and legislative changes, such as increasingly stringent environmental requirements or limits on vehicle weight and size. Regulatory change may affect the economics of the industry by requiring changes in operating practices or by changing the demand for private and common or contract carrier services or the cost of providing truckload services. In addition, our tank wash facilities are subject to increasingly stringent local, state and federal environmental regulations.
We have implemented security procedures for drivers and terminal facilities. Satellite tracking transponders installed in the power units are used to communicate emergencies to us and to maintain constant information as to the unit’s location. If necessary, our terminal personnel will notify local law enforcement agencies. In addition, we are able to advise a customer of the status and location of their loads. Remote cameras and enhanced lighting coverage in the staging and parking areas have augmented terminal security. We have a focus on safety in the communities in which we operate, including leveraging camera technology to enhance driver behavior and awareness. Our crude oil marketing and transportation businesses are Partners in the EPA’s SmartWay Transport Partnership, a national voluntary program developed by the EPA and freight industry representatives to reduce greenhouse gases and air pollution and promote cleaner, more efficient ground freight transportation.
FERC Regulation
The VEX Pipeline System, which we acquired in 2020, is regulated by the FERC as a common carrier interstate pipeline under the Interstate Commerce Act (“ICA”), the Energy Policy Act of 1992, and related rules and orders. The ICA and its implementing regulations give the FERC authority to regulate the rates charged for service on interstate common carrier pipelines and generally require the rates and practices of interstate liquids pipelines to be just, reasonable, not unduly discriminatory and not unduly preferential. The ICA also requires tariffs that set forth the rates a common carrier pipeline charges for providing transportation services on its interstate common carrier liquids pipelines, as well as the rules and regulations governing these services, to be maintained on file with the FERC and posted publicly. The Energy Policy Act of 1992 deemed certain rates in effect prior to its passage to be just and reasonable and limited the circumstances under which a complaint can be made against such “grandfathered” rates. The Energy Policy Act of 1992 and its implementing regulations also allow interstate common carrier liquids pipelines to annually index their rates up to a prescribed ceiling level and require that such pipelines index their rates down to the prescribed ceiling level if the index is negative. In addition, the FERC retains cost-of-service ratemaking, market-based rates and settlement rates as alternatives to the indexing approach.
The ICA permits interested persons to challenge proposed new or changed rates or rules, and authorizes the FERC to investigate such changes and to suspend their effectiveness for a period of up to seven months. Upon completion of such an investigation, the FERC may require refunds of amounts collected above what it finds to be a just and reasonable level, together with interest. The FERC may also investigate, upon complaint or on its own motion, rates and related rules that are already in effect, and may order a carrier to change them prospectively. Upon an appropriate showing, a shipper may obtain reparations (including interest) for damages sustained for a period of up to two years prior to the filing of its complaint.
Changes in the FERC’s methodologies for approving rates could adversely affect us. In addition, challenges to our regulated rates could be filed with the FERC and future decisions by the FERC regarding our regulated rates could adversely affect our cash flows. We believe the transportation rates currently charged by our interstate liquids pipeline is in accordance with the ICA and applicable FERC regulations. However, we cannot predict the rates we will be allowed to charge in the future for transportation services by such pipeline.
Pipeline Safety
We are subject to regulation by the DOT as authorized under various provisions of Title 49 of the United States Code and comparable state statutes relating to the design, installation, testing, construction, operation, replacement and management of our pipeline facilities. These statutes require companies that own or operate pipelines to (i) comply with such regulations, (ii) permit access to and copying of pertinent records, (iii) file certain reports and (iv) provide information as required by the U.S. Secretary of Transportation. The DOT regulates natural gas and hazardous liquids pipelines through its Pipeline and Hazardous Materials Safety Administration (“PHMSA”). We believe we are in material compliance with DOT regulations.
The development and/or implementation of more stringent requirements pursuant to DOT regulations, as well as any implementation of the PHMSA rules thereunder or reinterpretation of guidance by PHMSA or any state agencies with respect thereto, may result in us incurring significant and unanticipated expenditures to comply with such standards. Until the proposed regulations are finalized, the impact on our operations, if any, is not known.
Regulatory Status and Potential Environmental Liability
Our operations and facilities are subject to numerous federal, state and local environmental laws and regulations including those described above, as well as associated permitting and licensing requirements. We regard compliance with applicable environmental regulations as a critical component of our overall operation, and devote significant attention to providing quality service and products to our customers, protecting the health and safety of our employees, and protecting our facilities from damage. We believe we have obtained or applied for all permits and approvals required under existing environmental laws and regulations to operate our current business. We are not subject to any pending or threatened environmental litigation or enforcement actions which could materially and adversely affect our business.
We have, where appropriate, implemented operating procedures at each of our facilities designed to assure compliance with environmental laws and regulation. However, given the nature of our business, we are subject to environmental risks, and the possibility remains that our ownership of our facilities and our operations and activities could result in civil or criminal enforcement and public as well as private actions against us, which may necessitate or generate mandatory cleanup activities, revocation of required permits or licenses, denial of application for future permits, and/or significant fines, penalties or damages, any and all of which could have a material adverse effect on us. See “Item 1A. Risk Factors” for further discussion. At December 31, 2018,2021, we are not aware of any unresolved environmental issues for which additional accounting accruals are necessary.
Employees
Human Capital Resources
At December 31, 2018, we employed 703 persons. None of our employees are represented by a union. We believe our employee relations are satisfactory.General
Our business strategy and ability to serve customers relies on employing talented professionals and attracting, training, developing and retaining a skilled workforce.
There is substantial competition for qualified truck drivers in the trucking industry. Recruitment, training, and retention of a professional driver workforce is essential to our continued growth and fulfillment of customer needs. We hire qualified professional drivers who hold a valid commercial driver’s license, satisfy applicable federal and state safety performance and measurement requirements, and meet our hiring criteria. These guidelines relate primarily to safety history, road test evaluations, and various other evaluations, which include physical examinations and mandatory drug and alcohol testing. We provide comfortable, late model equipment, encourage direct communication with management, and pay competitive wages and benefits, and other incentives intended to encourage driver safety, retention and long-term employment. Prior to being released for individual duty, each new hire is required to undergo a mandatory training and evaluation period by a certified driver trainer/instructor. The length of this training period will be dependent on experience and the new hire adaptation to company policies and procedures.
Employees
At December 31, 2021, we employed 710 persons, of which 469, or 66 percent, were truck drivers. We believe our employee relations are satisfactory, and none of our employees are subject to union contracts or part of a collective bargaining unit.
Independent Contractors
In addition to company drivers, we enter into contracts with independent contractors, who provide a tractor and a driver and are responsible for all operating expenses in exchange for an agreed upon fee structure. At December 31, 2021, we had 83 independent contractor operated tractors, which comprised approximately 15 percent of our professional truck driving fleet.
Health and Safety
Safety is one of our guiding principles as we are committed to providing our employees a safe working environment. We have implemented safety programs and management practices to promote a culture of safety. We are continuously working toward maintaining a strong safety culture and to emphasizing the importance of our employees’ role in identifying, mitigating and communicating safety risks.
With respect to the current COVID-19 pandemic, we have updated and implemented our pandemic plan to ensure the continuation of safe and reliable service to customers and to maintain the safety of our employees, as well as to incorporate any new governmental guidance and rules and regulations regarding workplace safety. Since the beginning of the pandemic, we have been deemed an essential entity by virtue of the transportation services we provide.
Diversity and Inclusion
We are committed to providing a professional work environment where all employees are treated with respect and dignity and provided with equal opportunities. We do not discriminate based upon race, religion, color, national origin, gender (including pregnancy, childbirth, or related medical conditions), sexual orientation, gender identity, gender expression, age, status as a protected veteran, status as an individual with a disability or other applicable legally protected characteristics. We also support the hiring of veterans and are honored to provide opportunities to men and women who have served their respective countries.
We also partner with the Women in Trucking Association to support our efforts to advance the careers of women and gender diversity. It is our goal to empower the professional development of all employees and to operate from a mindset of sharing, caring, inclusion and equity.
We support basic human rights throughout our business enterprise and prohibit the use of child, compulsory or forced labor. Our employees are strictly prohibited from using our equipment to transport, or our facilities to shelter, unauthorized persons, or to take any other act in support of human trafficking or human rights abuses. Employees are required to immediately report any human trafficking concerns to the appropriate law enforcement agency.
We work with Truckers Against Trafficking (“TAT”) to train all over-the-road drivers on how to spot and report signs of human trafficking. Our drivers receive training from TAT and become registered as TAT trained and certified.
Benefits
Our compensation and benefits programs are designed to attract, retain and motivate our employees and to reward them for their services and success. In addition to providing competitive salaries and other compensation opportunities, we offer comprehensive and competitive benefits to our eligible employees including, depending on location, life and health (medical, dental and vision) insurance, prescription drug benefits, flexible spending accounts, parental leave, disability coverage, mental and behavioral health resources, paid time off and retirement savings plan.
Federal and State Taxation
We are subject to the provisions of the Internal Revenue Code of 1986, as amended (the “Code”). In accordance with the Code, we computed our income tax provision based on a 21 percent tax rate for the year ended December 31, 2018.2021. We conduct a significant amount of business within the State of Texas. Texas operations are subject to a one-half percent state tax on its revenues net of cost of goods sold as defined by the state. We believe we are currently in compliance with all federal and state tax regulations.
Available Information
We electronically file certain documents with the U.S. Securities and Exchange Commission (“SEC”). We file annual reportsAnnual Reports on Form 10-K; quarterly reportsQuarterly Reports on Form 10-Q; and current reportsCurrent Reports on Form 8-K (as appropriate); along with any related amendments and supplements thereto.
We also make available free of charge, through the “Investor Relations” link on our website, www.adamsresources.com, our Annual Reports on Form 10-K, Quarterly Reports on Form 10-Q, Current Reports on Form 8-K and any amendments to those reports filed or furnished pursuant to Section 13(a) or 15(d) of the Exchange Act, simultaneously with or as soon as reasonably practicable after filing such materials with, or furnishing such materials to, the SEC, and on our website www.adamsresources.com.SEC. The information on our website, or information about us on any other website, is not incorporated by reference into this report.
Item 1A. Risk Factors.
An investment in our common stock involves certain risks. If any of the following key risks were to occur, it could have a material adverse effect on our financial position, results of operations and cash flows. In any such circumstance and others described below, the trading price of our securities could decline and you could lose part or all of your investment.
Economic developments could damage
Risk Related to our operations and materially reduce our profitability and cash flows.Business
Potential disruptions in the credit markets and concerns about global economic growth could have a significant adverse impact on global financial markets and commodity prices. These factors could contribute to a decline in our stock price and corresponding market capitalization. If commodity prices experience a period of rapid decline, or a prolonged period of low commodity prices, our future earnings will be reduced. We currently do not have bank debt obligations. If the capital and credit markets experience volatility and the availability of funds become limited, our customers and suppliers may incur increased costs associated with issuing commercial paper and/or other debt instruments and this, in turn, could adversely affect our ability to secure supply and make profitable sales.
General economic conditions could reduce demand for chemical based trucking services.
Customer demand for our products and services is substantially dependent upon the general economic conditions for the U.S., which are cyclical in nature. In particular, demand for liquid chemical truck transportation services is dependent on activity within the petrochemical sector of the U.S. economy. Chemical sector demand typically varies with the housing and auto markets as well as the relative strength of the U.S. dollar to foreign currencies. A relatively strong U.S. dollar exchange rate may be adverse to our transportation operation since it tends to suppress export demand for petrochemicals. Conversely, a weak U.S. dollar exchange rate tends to stimulate export demand for petrochemicals.
Difficulty in attracting and retaining drivers could negatively affect our operations and limit our growth.
There is substantial competition for qualified personnel, particularly drivers, in the trucking industry. We operate in geographic areas where there is currently a shortage of drivers. Regulatory requirements, including electronic logging, and an improving U.S. jobs market, could continue to reduce the number of eligible drivers in our markets. Any shortage of drivers could result in temporary under-utilization of our equipment, difficulty in meeting our customers’ demands and increased compensation levels, each of which could have a material adverse effect on our business, results of operations and financial condition. A loss of qualified drivers could lead to an increased frequency in the number of accidents, potential claims exposure and, indirectly, insurance costs.
Difficulty in attracting qualified drivers could also require us to limit our growth. Our strategy is to grow in part by expanding existing customer relationships into new markets. However, we may have difficulty finding qualified drivers on a timely basis when presented with new customer opportunities, which could result in our inability to accept or service this business or could require us to increase the wages we pay in order to attract drivers. If we are unable to hire qualified drivers to service business opportunities in new markets, we may have to temporarily send drivers from existing terminals to those new markets, causing us to incur significant costs relating to out-of-town driver pay and expenses. In making acquisitions and converting private fleets, some of the drivers in those fleets may not meet our standards, which would require us to find qualified drivers to replace them. If we are unable to find and retain such qualified drivers on terms acceptable to us, we may be forced to forego opportunities to expand or maintain our business.
Our business is dependent on the ability to obtain trade and other credit.
Our future development and growth depends, in part, on our ability to successfully obtain credit from suppliers and other parties. Trade credit arrangements are relied upon as a significant source of liquidity for capital requirements not satisfied by operating cash flow. If global financial markets and economic conditions disrupt and reduce stability in general, and the solvency of creditors specifically, the availability of funding from credit markets, would be reduced as many lenders and institutional investors would enact tighter lending standards, refuse to refinance existing debt on terms similar to current debt or, in some cases, cease to provide funding to borrowers. These issues coupled with weak economic conditions would make it more difficult for us, our suppliers and our customers to obtain funding. If we are unable to obtain trade or other forms of credit on reasonable and competitive terms, the ability to continue our marketing businesses, pursue improvements, and continue future growth will be limited. We cannot assure you that we will be able to maintain future credit arrangements on commercially reasonable terms.
Fluctuations in crude oil prices could have an adverse effect on us.
Our future financial condition, revenues, results of operations and future rate of growth are materially affected by crude oil prices that historically have been volatile and are likely to continue to be volatile in the future. Crude oil prices depend on factors outside of our control. These factors include:
•supply and demand for crude oil and expectations regarding supply and demand;
•political conditions in other crude oil-producing countries, including the possibility of insurgency or war in such areas;
•economic conditions in the U.S. and worldwide;
•governmental regulations and taxation;
•impact of energy conservation efforts;
•the price and availability of alternative fuel sources;
•weather conditions;
•availability of local, interstate and intrastate transportation systems; and
•market uncertainty.
Potentially escalating diesel fuel prices could have an adverse effect on us.
As an integral part of our crude oil marketing and transportation businesses, we operate approximately 492 tractors, and diesel fuel costs are a significant component of our operating expenses. These costs generally fluctuate with increasing and decreasing world crude oil prices. In our transportation segment, we typically incorporate a fuel surcharge provision in our customer contracts. During periods of high prices, we attempt to recoup rising diesel fuel costs through the pricing of our services; however to the extent these costs escalate, our operating earnings will generally be adversely affected.
The financial soundness of customers could affect our business and operating results.
Constraints in the financial markets and other macro-economic challenges that might affect the economy of the U.S. and other parts of the world could cause our customers to experience cash flow concerns. As a result, if our customers’ operating and financial performance deteriorates, or if they are unable to make scheduled payments or obtain credit, customers would not be able to pay, or may delay payment of, accounts receivable owed to us. Any inability of current and/or potential customers to pay for services may adversely affect our financial condition and results of operations.
Counterparty credit defaultWe may face opposition to the operation of our pipeline and facilities from various groups.
We may face opposition to the operation of our pipeline and facilities from environmental groups, landowners, tribal groups, local groups and other advocates. Such opposition could have an adverse effecttake many forms, including organized protests, attempts to block or sabotage our operations, intervention in regulatory or administrative proceedings involving our assets, or lawsuits or other actions designed to prevent, disrupt or delay the operation of our assets and business. In addition, acts of sabotage or eco-terrorism could cause significant damage or injury to people, property or the environment or lead to extended interruptions of our operations. Any such event that interrupts the revenues generated by our operations, or which causes us to make significant expenditures not covered by insurance, could reduce our cash available for paying distributions to our partners and, accordingly, adversely affect our financial condition and the market price of our securities.
Our pipeline integrity program as well as compliance with pipeline safety laws and regulations may impose significant costs and liabilities on us.
Our revenues are generated under contractsIf we were to incur material costs in connection with various counterparties,our pipeline integrity program or pipeline safety laws and regulations, those costs could have a material adverse effect on our financial condition, results of operations couldand cash flows.
The DOT requires pipeline operators to develop integrity management programs to comprehensively evaluate their pipelines. The majority of the costs to comply with this integrity management rule are associated with pipeline integrity testing and any repairs found to be adversely affected by non-performance under the various contracts. A counterparty’s default or non-performance could be caused by factors beyond our control. A default could occurnecessary as a result of circumstances relating directlysuch testing. Changes such as advances in pipeline inspection tools and identification of additional threats to a pipeline’s integrity, among other things, can have a significant impact on the costs to perform integrity testing and repairs. We will continue our pipeline integrity testing programs to assess and maintain the integrity of our pipeline. The results of these tests could cause us to incur significant and unanticipated capital and operating expenditures for repairs or upgrades deemed necessary to ensure the continued safe and reliable operation of our pipeline.
The rates of our regulated assets are subject to review and possible adjustment by federal and state regulators, which could adversely affect our revenues.
The FERC, pursuant to the counterparty, or due to circumstances caused by other market participants having a direct or indirect relationshipICA (as amended), the Energy Policy Act and rules and orders promulgated thereunder, regulates the tariff rates and terms and conditions of service for our interstate common carrier liquids pipeline operations. To be lawful under the ICA, interstate tariff rates, terms and conditions of service must be just and reasonable and not unduly discriminatory, and must be on file with the counterparty. We seekFERC. In addition, pipelines may not confer any undue preference upon any shipper. Shippers may protest (and the FERC may investigate) the lawfulness of new or changed tariff rates. The FERC can suspend those tariff rates for up to mitigateseven months. It can also require refunds of amounts collected pursuant to rates that are ultimately found to be unlawful and prescribe new rates prospectively. The FERC and interested parties can also challenge tariff rates that have become final and effective. The FERC can also order new rates to take effect prospectively and order reparations for past rates that exceed the riskjust and reasonable level up to two years prior to the date of default by evaluatinga complaint. Due to the financial strengthcomplexity of potential counterparties; however, despite mitigation efforts, contractual defaultsrate making, the lawfulness of any rate is never assured. A successful challenge of our rates could adversely affect our revenues.
The intrastate liquids pipeline transportation services we provide are subject to various state laws and regulations that apply to the rates we charge and the terms and conditions of the services we offer. Although state regulation typically is less onerous than FERC regulation, the rates we charge and the provision of our services may occur from timebe subject to time.challenge.
Revenues are generated under contracts that must be renegotiated periodically.
Substantially all of our revenues are generated under contracts which expire periodically or which must be frequently renegotiated, extended or replaced. Whether these contracts are renegotiated, extended or replaced is often subject to factors beyond our control. These factors include sudden fluctuations in crude oil and natural gas prices, counterparty ability to pay for or accept the contracted volumes and, most importantly, an extremely competitive marketplace for the services we offer. We cannot assure you that the costs and pricing of our services can remain competitive in the marketplace or that we will be successful in renegotiating our contracts.
Anticipated or scheduled volumes will differ from actual or delivered volumes.
Our crude oil marketing business purchases initial production of crude oil at the wellhead under contracts requiring us to accept the actual volume produced. The resale of this production is generally under contracts requiring a fixed volume to be delivered. We estimate our anticipated supply and match that supply estimate for both volume and pricing formulas with committed sales volumes. Since actual wellhead volumes produced will neverrarely equal anticipated supply, our marketing margins may be adversely impacted. In many instances, any losses resulting from the difference between actual supply volumes compared to committed sales volumes must be absorbed by us.
Environmental liabilities and environmental regulations may have an adverse effect on us.
Our business is subject to environmental hazards such as spills, leaks or any discharges of petroleum products and hazardous substances. These environmental hazards could expose us to material liabilities for property damage, personal injuries, and/or environmental harms, including the costs of investigating and rectifying contaminated properties.
Environmental laws and regulations govern many aspects of our business, such as transportation and waste management. Compliance with environmental laws and regulations can require significant costs or may require a decrease in business activities. Moreover, noncompliance with these laws and regulations could subject us to significant administrative, civil, and/or criminal fines and/or penalties, as well as potential injunctive relief. See discussion under Item“Item 1 and 2. Business and Properties — Regulatory Matters,” and in the sections that follow, for additional detail.
Restrictions in our Credit Agreement reduce operating flexibility, and the Credit Agreement contains covenants and restrictions that create the potential for defaults, which could adversely affect our business, financial condition and results of operations.
Under our Credit Agreement, we may borrow or issue letters of credit in an aggregate of up to $40.0 million under a revolving credit facility, subject to our compliance with certain financial covenants. At December 31, 2021, we had no borrowings outstanding and $6.1 million of letters of credit issued under the Credit Agreement.
The terms of our Credit Agreement restrict our ability to, among other things (and subject in each case, to various exceptions and conditions):
•incur additional indebtedness,
•create additional liens on our assets,
•make certain investments,
•dispose of our assets or engage in a merger or other similar transaction, or
•engage in transactions with affiliates.
We are also required to maintain compliance with the following financial covenants on a pro forma basis, after giving effect to any borrowings (in each case commencing with the fiscal quarter ending June 30, 2021): (i) the Consolidated Total Leverage Ratio, which is the ratio of (a) Consolidated Funded Indebtedness on such date to (b) Consolidated EBITDA for the most recently completed Reference Period shall not be greater than 3.00 to 1.00; (ii) the Current Ratio, which is (a) consolidated current assets to (b) consolidated current liabilities, in each case with certain exclusions, shall not be less than 1.25 to 1.00; (iii) Consolidated Interest Coverage Ratio, which is the ratio of (a) Consolidated EBITDA for the most recently completed Reference Period to (b) Consolidated Interest Expense for the most recently completed Reference Period shall be not be less than 3.00 to 1.00; and (iv) the Consolidated Tangible Net Worth, which is (a) our shareholders’ equity as shown on our consolidated statement of financial position, with certain exclusions, minus (b) all goodwill and intangible assets as of such date shall not be less than $100.0 million. The Reference Period is the most recently completed four consecutive fiscal quarters.
Our ability to comply with the financial covenants in the Credit Agreement depends on our operating performance, which in turn depends significantly on prevailing economic, financial and business conditions and other factors that are beyond our control. Therefore, despite our best efforts and execution of our strategic plan, we may be unable to comply with these financial covenants in the future.
At December 31, 2021, we were in compliance with all financial covenants. However, if in the future there are economic declines, we can make no assurance that these declines will not negatively impact our financial results and, in turn, our ability to meet these financial covenant requirements. If we fail to comply with certain covenants, including our financial covenants, we could be in default under our Credit Agreement. In the event of such a default, the lenders under the Credit Agreement are entitled to take various actions, including the acceleration of the maturity of all loans and to take all actions permitted to be taken by a secured creditor against the collateral under the related security documents and applicable law. Any of these events could adversely affect our business, financial condition and results of operations.
In addition, these restrictions reduce our operating flexibility and could prevent us from exploiting certain investment, acquisition, or other time-sensitive business opportunities
Risk Related to our Industry
The ongoing COVID-19 pandemic and other health outbreaks could disrupt our operations and adversely impact our business and financial results.
The outbreak of COVID-19 in 2019 has evolved into a continuing global pandemic that has spread to many regions of the world, including the areas of the U.S. where we operate. In an attempt to control the spread of the virus, significant governmental measures have been implemented, including quarantines, travel restrictions, business shutdowns, restrictions on non-essential activities in the U.S. and abroad and vaccine mandates. The ongoing pandemic has resulted in a number of adverse economic effects, including changes in consumer behavior related to the economic slowdown, disruption of historical supply and demand patterns, and changes in the work force, which has affected our business and the businesses of our customers. These adverse economic effects of the COVID-19 outbreak have impacted our crude oil marketing operations and our transportation services.
The COVID-19 pandemic has created business challenges primarily related to changes in the work force, which has impacted our ability to hire and retain qualified truck drivers in both of our business units, and issues with the supply chain, resulting in delays in purchasing items, including new tractors. While demand for transportation of products and demand for crude oil has increased from 2020 levels during the initial months of the pandemic, our growth in 2021 has been limited in certain markets by the availability of truck drivers.
Our primary focus continues to be the safety of our employees and operations while providing uninterrupted service to our customers. We continue to maintain the safety protocols we established, including encouraging our employees to seek vaccination when eligible. We are dependent on our workforce of truck drivers to transport crude oil and products for our customers. Developments such as social distancing and shelter-in-place directives thus far have not had a significant impact on our ability to deploy our workforce effectively as the transportation industry has been deemed an essential service under current Cybersecurity and Infrastructure Security Agency guidelines. We have taken measures to seek to ensure the safety of our employees and operations while maintaining uninterrupted service to our customers. The safety of our employees and operations while providing uninterrupted service to our customers remains our primary focus.
We have also been seeking ways to overcome supply shortages in tractors, by additional maintenance to extend vehicle lives, shortages in tires and other inventory by having additional items on hand and increases in the price of diesel fuel by continuing to pass costs through to customers or attempting to reduce costs through efficiencies.
We are actively monitoring the global situation and its effect on our financial condition, liquidity, operations, customers, industry and workforce. Given the daily evolution of the COVID-19 outbreak and the global responses to curb its spread, we cannot estimate the length or gravity of the impacts of these events at this time. While we consider the overall effects of the pandemic to be temporary, if the pandemic and its economic effects continue, particularly in light of new and variant strains of the virus and the plateau of vaccination rates, it may have a material adverse effect on our results of future operations, financial position and liquidity.
Should the coronavirus continue to spread, our business operations could be delayed or interrupted. For instance, our operations would be adversely impacted if a number of our administrative personnel, drivers or field personnel are infected and become ill or are quarantined. At this time, we believe that our business would generally be exempted from shelter-in-place orders or other mandated local travel restrictions as an essential service but there can be no assurance as the scope of quarantine orders imposed by local or state governments.
While the potential economic impact brought by and the duration of the pandemic or any new pandemic may be difficult to assess or predict, it has already caused, and is likely to result in further, significant disruption of global financial markets, which may reduce our ability to access capital either at all or on favorable terms. In addition, a recession, depression or other sustained adverse market event resulting from the spread of the coronavirus could materially and adversely affect our business and financial results.
General economic conditions could reduce demand for chemical based trucking services.
Customer demand for our products and services is substantially dependent upon the general economic conditions for the U.S., which are cyclical in nature. In particular, demand for liquid chemical truck transportation services is dependent on activity within the petrochemical sector of the U.S. economy. Chemical sector demand typically varies with the housing and auto markets as well as the relative strength of the U.S. dollar to foreign currencies. A relatively strong U.S. dollar exchange rate may be adverse to our transportation operation since it tends to suppress export demand for petrochemicals. Conversely, a weak U.S. dollar exchange rate tends to stimulate export demand for petrochemicals.
Fluctuations in crude oil prices could have an adverse effect on us.
Our future financial condition, revenues, results of operations and future rate of growth are materially affected by crude oil prices that historically have been volatile and are likely to continue to be volatile in the future. Crude oil prices depend on factors outside of our control. These factors include:
•supply and demand for crude oil and expectations regarding supply and demand;
•political conditions in other crude oil-producing countries, including the possibility of insurgency or war in such areas;
•economic conditions in the U.S. and worldwide;
•the impact of public health epidemics, like the global coronavirus outbreak beginning in 2020;
•governmental regulations and taxation;
•the impact of energy conservation efforts;
•the price and availability of alternative fuel sources;
•weather conditions;
•availability of local, interstate and intrastate transportation systems; and
•market uncertainty.
Increases in the price of diesel fuel and availability of diesel fuel could have an adverse effect on us.
As an integral part of our crude oil marketing and transportation businesses, we operate approximately 520 tractors, and diesel fuel costs are a significant component of our operating expenses. The market price for fuel can be extremely volatile and is affected by a number of economic and political factors. In addition, changes in federal or state regulations can impact the price of fuel, as well as increase the amount we pay in fuel taxes.
In our transportation segment, we typically incorporate a fuel surcharge provision in our customer contracts. During periods of high prices, we attempt to recoup rising diesel fuel costs through the pricing of our services. However, our customers may be able to negotiate contracts that minimize or eliminate our ability to pass on fuel price increases.
Our operations may also be adversely affected by any limit on the availability of fuel. Disruptions in the political climate in key oil producing regions in the world, particularly in the event of wars or other armed conflicts, could resultseverely limit the availability of fuel in liabilities that may notthe U.S. In the event we face significant difficulty in obtaining fuel, our business, results of operations and financial condition would be fully covered by insurancematerially adversely affected.
.
Insurance and claims expenses, including for self-insured risks, could significantly reduce our earnings.
Transportation of hazardous materials involves certain operating hazards such as automobile accidents, explosions, fires and pollution. Any of these operating hazards could cause serious injuries, fatalities or property damage, which could expose us to liability. The payment of any of these liabilities could reduce, or even eliminate, the funds available for other areas.
Consistent with the industry standard, our insurance policies provide limited coverage for losses or liabilities relating to pollution, with broader coverage provided for sudden and accidental occurrences. Insurance might be inadequate to cover all liabilities. Obtaining insurance for our line of business can become difficult and costly. Typically, when insurance cost escalates, we may reduce our level of coverage, and more risk may be retained to offset cost increases.
Beginning in 2021, we self-insure a significant portion of our claims exposure resulting from auto liability, general liability and workers’ compensation through our wholly owned captive insurance company. Although we reserve for anticipated losses and expenses based on actuarial reviews and periodically evaluate and adjust our claims reserves to reflect our experience, estimating the number and severity of claims, as well as related costs to settle or resolve them, is inherently difficult, and such costs could exceed our estimates. Accordingly, our actual losses associated with insured claims may differ materially from our estimates and adversely affect our financial condition and results of operations in material amounts.
We maintain an insurance program for potential losses that are in excess of the amounts that we insure through the captive, as well as potential losses from other categories of claims. Although we believe our aggregate insurance limits should be sufficient to cover our historic or future claims amounts, it is possible that one or more claims could exceed our aggregate coverage limits. If substantial liabilityany claim were to exceed our aggregate insurance coverage, we would bear the excess, in addition to the amount in the captive.
Given the current claims settlement environment, the amount of commercially available insurance coverage is incurreddecreasing, and damagesthe premiums for this coverage are increasing significantly. For the foregoing reasons, our insurance and claims expenses may increase, or we could increase our self-insured retention as policies are renewed or replaced. In addition, we may assume additional risk within our captive insurance company that we may or may not covered by insurance or exceed policy limits, our operationreinsure. Our results of operations and financial condition could be materially and adversely affected.affected if (1) our costs or losses significantly exceed our aggregate self-insurance and excess coverage limits, (2) we are unable to obtain affordable insurance coverage in amounts we deem sufficient, (3) our insurance carriers fail to pay on our insurance claims, or (4) we experience a claim for which coverage is not provided.
Counterparty credit default could have an adverse effect on us.
We
Our revenues are generated under contracts with various counterparties, and our results of operations could be adversely affected by changes in tax lawsnon-performance under the various contracts. A counterparty’s default or regulationsnon-performance could be caused by factors beyond our control. A default could occur as a result of circumstances relating directly to the counterparty, or due to circumstances caused by other market participants having a direct or indirect relationship with the counterparty. We seek to mitigate the risk of default by evaluating the financial strength of potential counterparties; however, despite mitigation efforts, contractual defaults do occur from time to time.
.
The Internal Revenue Service, the U.S. Treasury Department, Congress and the states frequently review federal or state income tax legislation. We cannot predict whether, when, or to what extent new federal or state tax laws, regulations, interpretations or rulings will be adopted. Any such legislative action may prospectively or retroactively modify tax treatment and, therefore, may adversely affect taxation
Our business is subject to changing government regulations.
Federal, state or local government agencies may impose environmental, labor or other regulations that increase costs and/or terminate or suspend operations. Our business is subject to federal, state and local laws and regulations. These regulations relate to, among other things, transportation of crude oil and natural gas. Existing laws and regulations could be changed, and any changes could increase costs of compliance and costs of operations.
Security issues exist relating to drivers, equipment and terminal facilities.
We transport liquid combustible materials including petrochemicals, and these materials may be a target for terrorist attacks. While we employ a variety of security measures to mitigate risks, we cannot assure you that such events will not occur.
Current and future litigation could have an adverse effect on us.
We are currently involved in certain administrative and civil legal proceedings as part of the ordinary course of our business. Moreover, as incidental to operations, we sometimes become involved in various lawsuits and/or disputes. Lawsuits and other legal proceedings can involve substantial costs, including the costs associated with investigation, litigation and possible settlement, judgment, penalty or fine. Although we maintain insurance to mitigate these costs, we cannot assure you that costs associated with lawsuits or other legal proceedings will not exceed the limits of insurance policies. Our results of operations could be adversely affected if a judgment, penalty or fine is not fully covered by insurance.
Climate change legislation or regulations restricting emissions of “greenhouse gases” (“GHGs”) could result in increased operating costs and reduced demand for the crude oil and natural gas we market and transport.
More stringent laws and regulations relating to climate change and GHGs may be adopted and could cause us to incur material expenses to comply with such laws and regulations. In the absence of comprehensive federal legislation on GHG emission control, the EPA attempted to require the permitting of GHG emissions; although the Supreme Court struck down certain of the permitting requirements in 2014, it upheld the EPA’s authority to control GHG emissions when a permit is required due to emissions of other pollutants. The EPA also requires the reporting of GHG emissions from specified large GHG emission sources including onshore and offshore crude oil and natural gas production facilities and onshore crude oil and natural gas processing, transmission, storage and distribution facilities. Reporting of GHG emissions from such large facilities is required on an annual basis. We do not presently operate any such large GHG emission sources but, if we were to do so in the future, we would incur costs associated with evaluating and meeting this reporting obligation.
Regulation of methane emissions has varied significantly between recent administrations, and may continue to change under the current administration or in the future. In May 2016, the EPA finalized rules to reduce methane emissions from new, modified or reconstructed sources in the crude oil and natural gas sector. The EPA later proposedHowever, in June 2017 to stay the rules for two (2) years. Both the stay and the underlying rules have been the subject of litigation. In September 2018,August 2020, the EPA proposedadopted significant revisions to the 2016 rules. Regarding existing sources in the crude oil and natural gas section, the EPA announced in March 2016 that it intended to develop rules to reduce methane emissions for existing sources, although the EPA later announced in March 2017 that it no longer intends to pursue regulation of methane emissions from existing sources. In November 2016, the Bureau of Land Management (“(“BLM”) issued final rules to reduce methane emissions from venting, flaring and leaks during crude oil and natural gas operations on public lands, which the BLM later revised in rules promulgated in September 2018. Several states are pursuing similar measures to regulate emissions of methane from new and existing sources within the crude oil and natural gas source category.
In addition, the U.S. Congress has considered legislation to reduce emissions of GHGs, and many states and regions have already taken legal measures to reduce or measure GHG emission levels, often involving the planned development of GHG emission inventories and/or regional cap and trade programs. Most of these cap and trade programs require major sources of emissions or major producers of fuels to acquire and surrender emission allowances. The number of allowances available for purchase is reduced each year in an effort to reduce overall GHG emissions, and the cost of these allowances could escalate significantly over time. In the markets in which we currently operate, our operations are not affected by such GHG cap and trade programs. On an international level, almost 200 nations agreed in December 2015 to an international climate change agreement in Paris, France that calls for countries to set their own GHG emissions targets and to be transparent about the measures each country will use to achieve its GHG emissions targets. Although the present administration announced in June 2017 its intention to withdrawU.S. withdrew from the Paris accord such withdrawal has not yet been finalized.in November 2020, it rejoined under the new administration in February 2021. Further, several states and local governments remain committed to the principles of the international climate agreement in their effectuation of policy and regulations. It is not possible at this time to predict how or when the U.S. might impose restrictions on GHGs as a result of the international climate change agreement. The adoption and implementation of any legislation or regulatory programs imposing GHG reporting obligations on, or limiting emissions of GHGs from, our equipment and operations could require us to incur costs to reduce emissions of GHGs associated with our operations including costs to operate and maintain our facilities, install new emission controls on our facilities, acquire allowances to authorize our GHG emissions, pay any taxes related to GHG emissions and administer and manage a GHG emissions program. Such programs also could adversely affect demand for the crude oil and natural gas that we market and transport.
General Risk Factors
Economic developments could damage our operations and materially reduce our profitability and cash flows.
Potential disruptions in the credit markets and concerns about global economic growth could have a significant adverse impact on global financial markets and commodity prices. These factors could contribute to a decline in our stock price and corresponding market capitalization. If commodity prices experience a period of rapid decline, or a prolonged period of low commodity prices, our future earnings will be reduced. We currently do not have bank debt obligations. If the capital and credit markets experience volatility and the availability of funds become limited, our customers and suppliers may incur increased costs associated with issuing commercial paper and/or other debt instruments and this, in turn, could adversely affect our ability to secure supply and make profitable sales.
Current and future litigation could have an adverse effect on us.
We are currently involved in certain administrative and civil legal proceedings as part of the ordinary course of our business. Moreover, as incidental to operations, we sometimes become involved in various lawsuits and/or disputes. Lawsuits and other legal proceedings can involve substantial costs, including the costs associated with investigation, litigation and possible settlement, judgment, penalty or fine. Although we maintain insurance to mitigate these costs, we cannot assure you that costs associated with lawsuits or other legal proceedings will not exceed the limits of insurance policies. Our results of operations could be adversely affected if a judgment, penalty or fine is not fully covered by insurance.
We could be adversely affected by changes in tax laws or regulations.
The Internal Revenue Service, the U.S. Treasury Department, Congress and the states frequently review federal or state income tax legislation. We cannot predict whether, when, or to what extent new federal or state tax laws, regulations, interpretations or rulings will be adopted. Any such legislative action may prospectively or retroactively modify tax treatment and, therefore, may adversely affect taxation of us.
We are subject to risks associated with climate change.
In an interpretative guidance on climate change disclosures, the SEC indicates that climate change could have an effect on the severity of weather (including hurricanes and floods), sea levels, the arability of farmland and water availability and quality. If such effects were to occur, our operations have the potential to be adversely affected. Potential adverse effects could include disruption of our marketing and transportation activities, including, for example, damages to our facilities from powerful winds or floods, or increases in our costs of operation or reductions in the efficiency of our operations, as well as potentially increased costs for insurance coverages in the aftermath of such effects. Significant physical effects of climate change could also have an indirect effect on our financing and operations by disrupting the transportation or process related services provided by companies or suppliers with whom we have a business relationship. In addition, the demand for and consumption of our products and services (due to change in both costs and weather patterns), and the economic health of the regions in which we operate, could have a material adverse effect on our business, financial condition, results of operations and cash flows. We may not be able to recover through insurance some or any of the damages, losses or costs that may result from potential physical effects of climate change.
Cyber-attacks or other disruptions to our information technology systems could lead to reduced revenue, increased costs, liability claims, fines or harm to our competitive position.
We arerely on our information technology systems to conduct our business, including systems of third-party vendors. These systems include information used to operate our assets and cloud-based services. These systems have been subject to attempted security breaches and cyber-attacks in the past, and may be subject to such attacks in the future.
Cyber-attacks are becoming more sophisticated, and U.S. government warnings have indicated that infrastructure assets, including pipelines, may be specifically targeted by certain groups. These attacks include, without limitation, malicious software, ransomware, attempts to gain unauthorized access to data, and other electronic security breaches. These attacks may be perpetrated by state-sponsored groups, “hacktivists”, criminal organizations or private individuals (including employee malfeasance). These cybersecurity risks include cyber-attacks on both us and third parties who provide material services to us. In addition to disrupting operations, cyber security breaches could also affect our ability to operate or control our facilities, render data or systems unusable, or result in the theft of sensitive, confidential or customer information. These events could also damage our reputation, and result in losses from remedial actions, loss of business or potential liability to third parties.
We may incur increasing costs in connection with our efforts to enhance and ensure security and in response to actual or attempted cybersecurity attacks. Substantial aspects of our business depend on the secure operation of our computer systems and websites. Security breaches could expose us to a risk of loss, misuse or interruption of sensitive and critical information and functions, including our own proprietary information and that of our customers, suppliers and employees. Such breaches could result in operational impacts, reputational harm, competitive disadvantage, litigation, regulatory enforcement actions and liability. While we devote substantial resources to maintaining adequate levels of cybersecurity, we cannot assure you that we will be able to prevent all of the rapidly evolving types of cyberattacks. Actual or anticipated attacks and risks may cause us to incur increasing costs for technology, personnel and services to enhance security or to respond to occurrences.
We have programs, processes and technologies in place to attempt to prevent, detect, contain, respond to and mitigate security-related threats and potential incidents. We undertake ongoing improvements to our systems, connected devices and information-sharing products in order to minimize vulnerabilities, in accordance with industry and regulatory standards; however, the techniques used to obtain unauthorized access change frequently and can be difficult to detect. Anticipating, identifying or preventing these intrusions or mitigating them if and when they occur is challenging and makes us more vulnerable to cyber-attackscyberattacks than other companies not similarly situated.
If our security measures are circumvented, proprietary information may be misappropriated, our operations may be disrupted, and our computers or those of our customers or other third parties may be damaged. Compromises of our security may result in an interruption of operations, violation of applicable privacy and other laws, significant legal and financial exposure, damage to our reputation, and a loss of confidence in our security measures.
Item 1B. Unresolved Staff Comments.
None.
Item 3. Legal Proceedings.
From time to time as incidental to our operations, we may become involved in various lawsuits and/or disputes. Primarily as an operator of an extensive trucking fleet, we are a party to motor vehicle accidents, workers’ compensation claims and other items of general liability as would be typical for the industry. We are currently unaware of any claims against us that are either outside the scope of insurance coverage or that may exceed the level of insurance coverage and could potentially represent a material adverse effect on our financial position or results of operations.
See Note 1518 in the Notes to Consolidated Financial Statements for further discussion.
Item 4. Mine Safety Disclosures.
Not applicable.
PART II
Item 5. Market for Registrant’s Common Stock,Equity, Related Stockholder Matters and Issuer Purchases of Equity Securities.
Our common stock is traded on the NYSE American under the ticker symbol “AE”. As of March 1, 2019,2022, there were approximately 132121 shareholders of record of our common shares.shares, however, the actual number of beneficial holders of our common stock may be substantially greater than the stated number of holders of record because a substantial portion of our common stock is held in street name.
We have paid dividends to our common shareholders each year since 1994. Our Board of Directors expects to continue paying dividends in the near future, although the declaration, amount and timing of any dividends falls within the sole discretion of our Board, whose decision will depend on many factors, including our financial condition, earnings, capital requirements and other factors that our Board may deem relevant.
Unregistered Sales of Securities.Securities
None.
Issuer Purchases of Equity Securities
None.
Performance Graph
The following graph compares the total shareholder return performance of our common stock with the performance of: (i) the Standard & Poor’s 500 Stock Index (“S&P 500”) and (ii) the S&P 500 Integrated Oil and Gas Index.Index (“S&P Integrated Oil & Gas”). The graph assumes that $100 was invested in our common stock and each comparison index beginning on December 31, 20132016 and that all dividends were reinvested on a quarterly basis on the ex-dividend dates. The graph was prepared under the applicable rules of the SEC based on data supplied by Research Data Group. The stock performance shown on the graph is not necessarily indicative of future price performance.
| | | | | | | | | | | | | | | | | | | | | | | | | | | | | | | | | | | |
| December 31, | | | | | | | | | | |
| 2013 | | 2014 | | 2015 | | 2016 | | 2017 | | 2018 |
| | | | | | | | | | | |
| Adams Resources & Energy, Inc. | $ | 100.00 | | $ | 74.02 | | $ | 57.97 | | $ | 61.28 | | $ | 68.75 | | $ | 62.45 |
| S&P 500 | 100.00 | | 113.69 | | 115.26 | | 129.05 | | 157.22 | | 150.33 |
| S&P Integrated Oil & Gas | 100.00 | | 93.27 | | 80.34 | | 99.74 | | 101.81 | | 88.61 |
Item 6. Selected Financial Data.The information under the caption “Performance Graph” above is not deemed to be “filed” as part of the Annual Report on Form 10-K, and is not subject to the liability provisions of Section 18 of the Exchange Act. Such information will not be deemed incorporated by reference into any filing we make under the Securities Act unless we explicitly incorporate it into such filing at such time.
The following table presents our selected historical consolidated financial data. This information has been derived from and should be read in conjunction with our audited financial statements included under Part II, Item 8 of this annual report, which presents our audited balance sheets as of December 31, 2018 and 2017 and related consolidated statements of operations, cash flows and shareholders’ equity for the three years ended December 31, 2018, 2017 and 2016, respectively. As presented in the table, amounts are in thousands (except per share data).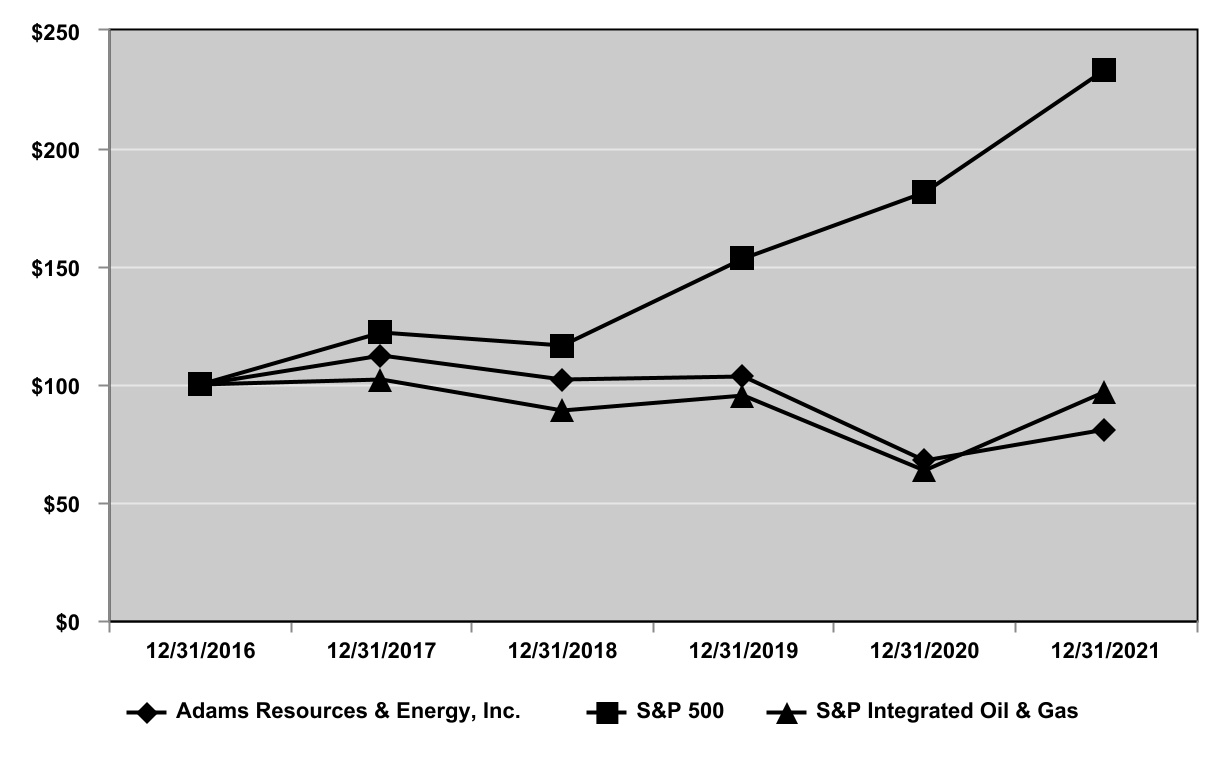
| | | | | | | | | | | | | | | | | | | | | | | | | | | | | |
| Year Ended December 31, | | | | | | | | |
| 2018 | | 2017 | | 2016 | | 2015 | | 2014 |
| Statements of operations data: | | | | | | | | | |
| Revenues: | | | | | | | | | |
| Marketing | $ | 1,694,437 | | $ | 1,267,275 | | $ | 1,043,775 | | $ | 1,875,885 | | $ | 4,050,497 |
| Transportation | 55,776 | | 53,358 | | 52,355 | | 63,331 | | 68,968 |
Oil and natural gas (1) | — | | 1,427 | | 3,410 | | 5,063 | | 13,361 |
| Total revenues | 1,750,213 | | 1,322,060 | | 1,099,540 | | 1,944,279 | | 4,132,826 |
| | | | | | | | | |
| Costs and expenses: | | | | | | | | | |
| Marketing | 1,681,045 | | 1,247,763 | | 1,016,733 | | 1,841,893 | | 4,020,017 |
| Transportation | 48,169 | | 48,538 | | 45,154 | | 52,076 | | 56,802 |
Oil and natural gas (1) | — | | 948 | | 2,084 | | 6,931 | | 7,817 |
Oil and natural gas property impairments (2) | — | | 3 | | 313 | | 12,082 | | 8,009 |
Oil and natural gas property sale (3) | — | | — | | — | | — | | (2,528) |
| General and administrative | 8,937 | | 9,707 | | 10,410 | | 9,939 | | 8,613 |
| Depreciation, depletion and amortization | 10,654 | | 13,599 | | 18,792 | | 23,717 | | 24,615 |
| | | | | | | | | |
| Operating earnings (losses) | 1,408 | | 1,502 | | 6,054 | | (2,359) | | 9,481 |
| | | | | | | | | |
Loss on deconsolidation of subsidiary (1) | — | | (3,505) | | — | | — | | — |
| Impairment of investment in unconsolidated | | | | | | | | | |
affiliate (4) | — | | (2,500) | | — | | — | | — |
| Interest income | 2,046 | | 1,076 | | 580 | | 314 | | 299 |
| | | | | | | | | |
| Earnings (losses) from continuing operations | 3,454 | | (3,427) | | 6,634 | | (2,045) | | 9,780 |
| | | | | | | | | |
| Income tax (provision) benefit | (509) | | 2,945 | | (2,691) | | 770 | | (3,561) |
| | | | | | | | | |
| Earnings (losses) before investment in | | | | | | | | | |
| unconsolidated affiliate | | | | | | | | | |
| and discontinued operations | 2,945 | | (482) | | 3,943 | | (1,275) | | 6,219 |
| | | | | | | | | |
| Discontinued operations, net of taxes | — | | — | | — | | — | | 304 |
| Losses from investment in unconsolidated | | | | | | | | | |
affiliate, net of tax (5) | — | | — | | (1,430) | | — | | — |
| Net (losses) earnings | $ | 2,945 | | $ | (482) | | $ | 2,513 | | $ | (1,275) | | $ | 6,523 |
| | | | | | | | | |
| Earnings (losses) per share: | | | | | | | | | |
| From continuing operations | $ | 0.70 | | $ | (0.11) | | $ | 0.94 | | $ | (0.30) | | $ | 1.48 |
| From investment in unconsolidated | | | | | | | | | |
| affiliate | — | | — | | (0.34) | | — | | — |
| From discontinued operations | — | | — | | — | | — | | 0.07 |
Basic and diluted earnings (losses)
per share | $ | 0.70 | | $ | (0.11) | | $ | 0.60 | | $ | (0.30) | | $ | 1.55 |
| | | | | | | | | |
| Dividends per common share | $ | 0.88 | | $ | 0.88 | | $ | 0.88 | | $ | 0.88 | | $ | 0.88 |
| | | | | | | | | |
| | | | | | | | | | | | | | | | | | | | | | | | | | | | | | | | | | | |
| December 31, |
| 2016 | | 2017 | | 2018 | | 2019 | | 2020 | | 2021 |
| | | | | | | | | | | |
| Adams Resources & Energy, Inc. | $ | 100.00 | | | $ | 112.19 | | | $ | 101.92 | | | $ | 103.08 | | | $ | 67.73 | | | $ | 80.79 | |
| S&P 500 | 100.00 | | | 121.83 | | | 116.49 | | | 153.17 | | | 181.35 | | | 233.41 | |
| S&P Integrated Oil & Gas | 100.00 | | | 102.08 | | | 88.84 | | | 95.23 | | | 63.40 | | | 96.89 | |
| | | | | | | | | | | | | | | | | | | | | | | | | | | | | |
| December 31, | | | | | | | | |
| 2018 | | 2017 | | 2016 | | 2015 | | 2014 |
Balance sheet data: | | | | | | | | | |
| Cash | $ | 117,066 | | $ | 109,393 | | $ | 87,342 | | $ | 91,877 | | $ | 80,184 |
| Total assets | 278,870 | | 282,704 | | 246,872 | | 243,215 | | 340,814 |
| Long-term debt | — | | — | | — | | — | | — |
| Shareholders’ equity | 146,598 | | 147,119 | | 151,312 | | 152,510 | | 157,497 |
| Dividends on common shares | 3,711 | | 3,711 | | 3,711 | | 3,712 | | 3,711 |
________________________
(1) During 2017, we deconsolidated our upstream crude oil and natural gas exploration and production subsidiary upon its bankruptcy filing. We recognized an impairment related to the bankruptcy, deconsolidation and sale of this subsidiary during 2017.
(2) During 2015, we recognized an impairment of $10.3 million on producing properties, and an impairment of $1.8 million on non-producing properties.
(3) During 2014, we sold certain crude oil and natural gas producing properties for $4.1 million, producing a net gain of $2.5 million.
(4) During 2017, we recognized an impairment on our medical investment in VestaCare.
(5) During 2016, we recognized losses and an impairment on our medical investment in Bencap LLC (“Bencap”). Other than our remaining ownership interest in VestaCare, we have no other medical-related investments, and we currently do not have any plans to pursue additional medical-related investments.
Item 7. Management’s Discussion and Analysis of Financial Condition and Results of Operations.
The following information should be read in conjunction with our Consolidated Financial Statements and accompanying notes included under Part II, Item 8 of this annual report. Our financial statements have been prepared in accordance with generally accepted accounting principles (“GAAP”) in the United States (“U.S.”).
Overview of Business
Adams Resources & Energy, Inc. (“AE”), a Delaware corporation organized in 1973, and its subsidiaries are primarily engaged in the business of crude oil marketing, transportation, terminalling and storage in various crude oil and natural gas basins in the lower 48 states of the U.S. We also conduct tank truck transportation of liquid chemicals, pressurized gases, asphalt and dry bulk primarily in the lower 48 states of the U.S. with deliveries into Canada and Mexico, and with nineteen terminals in the Gulf Coast region ofacross the U.S.
We operate and report in twothree business segments: (i) crude oil marketing, transportation and storage, andstorage; (ii) tank truck transportation of liquid chemicals, pressurized gases, asphalt and dry bulk. We exitedbulk; and (iii) pipeline transportation, terminalling and storage of crude oil. See Note 9 in the upstream crude oil and natural gas exploration and productionNotes to Consolidated Financial Statements for further information regarding our business during 2017 with the sale of our upstream crude oil and natural gas exploration and production assets.segments.
Results of Operations
Crude Oil Marketing
Our crude oil marketing segment revenues, operating earnings and selected costs were as follows for the periods indicated (in thousands):
| | | | | | | | | | | | | | | | | | | | | | | | | | | | | |
| Year Ended December 31, | | | | | | | | |
| 2018 | | 2017 | | Change (1) | | 2016 | | Change (1) |
| | | | | | | | | |
| Revenues | $ | 1,694,437 | | $ | 1,267,275 | | 33.7% | | | $ | 1,043,775 | | 21.4% | |
| Operating earnings | 7,008 | | 11,700 | | (40.1%) | | | 17,045 | | (31.4%) | |
| Depreciation and amortization | 6,384 | | 7,812 | | (18.3%) | | | 9,997 | | (21.9%) | |
| Driver commissions | 14,567 | | 13,058 | | 11.6% | | | 14,933 | | (12.6%) | |
| Insurance | 6,248 | | 4,509 | | 38.6% | | | 7,442 | | (39.4%) | |
| Fuel | 7,435 | | 5,278 | | 40.9% | | | 5,397 | | (2.2%) | |
| | | | | | | | | | | | | | | | | | | | | | | | | | | | | |
| Year Ended December 31, |
| 2021 | | 2020 | | Change (1) | | 2019 | | Change (1) |
| | | | | | | | | |
| Revenues | $ | 1,930,042 | | | $ | 950,426 | | | 103.1 | % | | $ | 1,748,056 | | | (45.6 | %) |
Operating earnings (2) | 25,243 | | | 2,974 | | | 748.8 | % | | 16,099 | | | (81.5 | %) |
| Depreciation and amortization | 6,673 | | | 7,421 | | | (10.1 | %) | | 8,741 | | | (15.1 | %) |
| Driver compensation | 17,717 | | | 18,549 | | | (4.5 | %) | | 22,754 | | | (18.5 | %) |
| Insurance | 6,193 | | | 6,109 | | | 1.4 | % | | 7,772 | | | (21.4 | %) |
| Fuel | 8,064 | | | 5,967 | | | 35.1 | % | | 8,979 | | | (33.5 | %) |
____________________
(1)Represents the percentage increase (decrease) from the prior year.
(2)Operating earnings included net inventory liquidation gains of $10.3 million, net inventory valuation losses of $15.0 million and net inventory liquidation gains of $3.7 million for the years ended December 31, 2021, 2020 and 2019, respectively.
Volume and price information were as follows for the periods indicated:
| | | | | | | | | | | | | | | | | |
| Year Ended December 31, | | | | |
| 2018 | | 2017 | | 2016 |
Field level purchase volumes – per day (1) (2) | | | | | |
| Crude oil – barrels | 79,361 | | 67,447 | | 72,900 |
| | | | | |
| Average purchase price | | | | | |
| Crude oil – per barrel | $ | 64.53 | | $ | 49.88 | | $ | 39.30 |
____________________
(1) Reflects the volume purchased from third parties at the field level of operations.
(2) Effective October 1, 2018, in connection with the Red River acquisition, we entered into a new revenue contract to purchase crude oil. The 2018 amount includes the additional volumes purchased during the fourth quarter of 2018.
Volume and price information were as follows for the periods indicated:
2018
| | | | | | | | | | | | | | | | | |
| Year Ended December 31, |
| 2021 | | 2020 | | 2019 |
Field level purchase volumes – per day (1) | | | | | |
| Crude oil – barrels | 89,061 | | | 91,957 | | | 107,383 | |
| | | | | |
| Average purchase price | | | | | |
| Crude oil – per barrel | $ | 65.48 | | | $ | 36.90 | | | $ | 56.28 | |
____________________
(1)Reflects the volume purchased from third parties at the field level of operations.
2021 compared to 20172020. Crude oil marketing revenues increased by $427.2$979.6 million during the year ended December 31, 20182021 as compared to 20172020, primarily as a result of an increase in the market price of crude oil, which increased revenues by approximately $172.8$1,053.3 million, and higherpartially offset by lower crude oil volumes, which increaseddecreased revenues by approximately $254.4$73.7 million. The average crude oil price received was $49.88$36.90 for 2017,2020, which increased to $64.53$65.48 for 2018. On October 1, 2018, we acquired trucking assets2021. Revenues from legacy volumes are based upon the market price in our other market areas, primarily in the Red River areaGulf Coast. The market price of North Texas and South Central Oklahoma, and subsequently entered into a new revenue agreement, which has increased our crude oil increased during 2021 as compared to 2020 primarily as a result of increased competition for supply from shippers and marketers to fill obligations to pipelines with the lower crude oil production available, partially offset by lower volumes during the fourth quarter of 2018. in 2021.
Our crude oil marketing operating earnings for the year ended December 31, 2018 decreased2021 increased by $4.7$22.3 million as compared to 2017,2020, primarily as a result of inventory liquidation gains of $10.3 million in 2021 as compared to inventory valuation losses of $5.4$15.0 million in 2020 (as shown in the following table), partially offset by increasesand an increase in crude oil volumes and the average market price of crude oil. During 2018,oil, partially offset by decreases in crude oil volumes increased as activity in certain marketing areas increased primarily as a result of increased wellhead purchases.2021.
Driver commissions increasedcompensation decreased by $1.5$0.8 million during the year ended December 31, 20182021 as compared to 2017,2020, primarily as a result of a decrease in the increasenumber of drivers employed by us as well as lower volumes transported in crude oil marketing volumes in 2018. 2021 as compared to 2020.
Insurance costs increased by $1.7$0.1 million during the year ended December 31, 20182021 as compared to 2017,2020, primarily asdue to favorable adjustments to reserves in 2020 for insurance claims resulting from our favorable safety record over the policy period, partially offset by a result of higher insurance costs during 2018, including higher insurance as a result of the Red River acquisitionlower driver count and lower miles driven in 2018.2021. Fuel costs increased by $2.2$2.1 million during the year ended December 31, 20182021 as compared to 2017 consistent with increased marketing volumes and2020, primarily due to higher crude oilfuel prices during 2018, and an increase in the price of diesel fuel during 2018 as compared to 2017.2021.
2017 compared to 2016. Crude oil marketing revenues increasedDepreciation and amortization expense decreased by $223.5$0.7 million during the year ended December 31, 20172021 as compared to 2016,2020, primarily due to the timing of purchases and retirements of tractors and other field equipment during 2020 and 2021.
2020 compared to 2019. Crude oil marketing revenues decreased by $797.6 million during the year ended December 31, 2020 as compared to 2019, primarily as a result of an increasea decrease in the market price of crude oil, which increaseddecreased revenues by approximately $329.7$641.2 million, partially offset byand lower crude oil volumes, which decreased revenues by approximately $106.2$156.4 million. The average crude oil price received was $39.30$56.28 for 2016,2019, which increaseddecreased to $49.88$36.90 for 2017.2020. The decrease in the market price of crude oil and the lower crude oil volumes produced and available for purchase were due to the effects of the COVID-19 outbreak on the economy and the delay of OPEC to agree on crude oil production levels during the second quarter of 2020, both of which resulted in market disruptions that decreased the demand for and price of crude oil.
Our crude oil marketing operating earnings for the year ended December 31, 20172020 decreased by $5.3$13.1 million as compared to 2016,2019, primarily as a result of declines in crude oil volumes, including declines as a result of the effects of Hurricane Harvey, which affected the Gulf Coast area in late August and early September 2017, as well as a narrowing of margins during 2017. Operating earnings were also impacted by inventory valuation changeslosses of $15.0 million in 2020 as compared to inventory liquidation gains of $3.7 million in 2019 (as shown in the following table), decreases in crude oil volumes in 2020, and a decrease in the implementation in August 2017average market price of a voluntary early retirement program for certain employees, which resulted in an increase in personnel expensescrude oil.
Driver commissionscompensation decreased by $1.9$4.2 million during the year ended December 31, 20172020 as compared to 2016,2019, primarily as a result of thea decrease in crude oil marketingthe number of drivers required for volumes transported in 2017. 2020 as compared to 2019.
Insurance costs decreased by $2.9$1.7 million during the year ended December 31, 20172020 as compared to 2016,2019, primarily asdue to a result ofdecreases in reserves for insurance claims resulting from our favorable driver safety performancerecord over the policy period, lower hours worked by drivers and reduced mileage during 2017 as compared to 2016.lower miles driven in 2020. Fuel costs decreased by $0.1$3.0 million during the year ended December 31, 20172020 as compared to 20162019 consistent with decreased marketing volumesthe lower driver count and lower crude oil pricesmiles driven in 2020.
Depreciation and amortization expense decreased by $1.3 million during 2016, offset by an increase in the price of diesel fuel during 2017year ended December 31, 2020 as compared to 2016.2019, primarily due to the timing of purchases and retirements of tractors and other field equipment during 2019 and 2020.
Field Level Operating Earnings (Non-GAAP Financial Measure). Inventory valuations and forward commodity contract (derivatives or mark-to-market) valuations are two significant factors affecting comparative crude oil marketing segment operating earnings. As a purchaser and shipper of crude oil, we hold inventory in storage tanks and third-party pipelines. During periods of increasing crude oil prices, we recognize inventory liquidation gains while during periods of falling prices, we recognize inventory liquidation and valuation losses.
Crude oil marketing operating earnings can be affected by the valuations of our forward month commodity contracts (derivative instruments). These non-cash valuations are calculated and recorded at each period end based on the underlying data existing as of such date. We generally enter into these derivative contracts as part of a pricing strategy based on crude oil purchases at the wellhead (field level). The valuation of derivative instruments at period end requires the recognition of non-cash “mark-to-market” gains and losses.
The impact of inventory liquidations and derivative valuations on our crude oil marketing segment operating earnings is summarized in the following reconciliation of our non-GAAP financial measure for the periods indicated (in thousands):
| | | Year Ended December 31, | | | Year Ended December 31, |
| | 2018 | | 2017 | | 2016 | | 2021 | | 2020 | | 2019 |
| As reported segment operating earnings (1) | As reported segment operating earnings (1) | $ | 7,008 | | $ | 11,700 | | $ | 17,045 | As reported segment operating earnings (1) | $ | 25,243 | | | $ | 2,974 | | | $ | 16,099 | |
| Add (subtract): | Add (subtract): | | Add (subtract): | |
| Inventory liquidation gains | Inventory liquidation gains | — | | (3,372) | | (8,243) | Inventory liquidation gains | (10,344) | | | — | | | (3,749) | |
| Inventory valuation losses | Inventory valuation losses | 5,363 | | — | | — | Inventory valuation losses | — | | | 14,967 | | | — | |
| Derivative valuation (gains) losses | Derivative valuation (gains) losses | (2) | | 27 | | (243) | Derivative valuation (gains) losses | (14) | | | (9) | | | 24 | |
Field level operating earnings (2) | Field level operating earnings (2) | $ | 12,369 | | $ | 8,355 | | $ | 8,559 | Field level operating earnings (2) | $ | 14,885 | | | $ | 17,932 | | | $ | 12,374 | |
____________________
(1)Segment operating earnings included net inventory liquidation gains of $10.3 million, net inventory valuation losses of $5.4$15.0 million for the year ended December 31, 2018, and net inventory liquidation gains of $3.3 million and $8.2$3.7 million for the years ended December 31, 20172021, 2020 and 2016,2019, respectively.
(2)The use of field level operating earnings is unique to us, not a substitute for a GAAP measure and may not be comparable to any similar measures developed by industry participants. We utilize this data to evaluate the profitability of our operations.
Field level operating earnings and field level purchase volumes depict our day-to-day operation of acquiring crude oil at the wellhead, transporting the product and delivering the product to market sales points. Field level operating earnings increaseddecreased during the year ended December 31, 20182021 as compared to 2017,2020, primarily due to higher revenues resulting fromfuel and insurance costs and lower crude oil volumes, partially offset by an increase in the market price of crude oil higher crude oil volumes and improved market conditions. in 2021.
Field level operating earnings decreasedincreased during the year ended December 31, 20172020 as compared to 2016,2019, primarily due to increased personnel costs related to the voluntary early retirement program,lower operating expenses, partially offset by increasedlower revenues resulting from lower volumes and the effects of a negotiated barge contract, which reduced operating expenses, beginningdecrease in the third quartermarket price of 2017.crude oil in 2020.
We held crude oil inventory at a weighted average composite price as follows at the dates indicated (in barrels and price per barrel):
| | | | | | | | | | | | | | | | | | | | | | | | | | | | | | | | | | | |
| December 31, | | | | | | | | | | |
| 2018 | | | | 2017 | | | | 2016 | | |
| | | Average | | | | Average | | | | Average |
| Barrels | | Price | | Barrels | | Price | | Barrels | | Price |
| | | | | | | | | | | |
| Crude oil inventory | 415,523 | | $ | 54.82 | | 198,011 | | $ | 61.57 | | 255,146 | | $ | 51.22 |
| | | | | | | | | | | | | | | | | | | | | | | | | | | | | | | | | | | |
| December 31, |
| 2021 | | 2020 | | 2019 |
| | | Average | | | | Average | | | | Average |
| Barrels | | Price | | Barrels | | Price | | Barrels | | Price |
| | | | | | | | | | | |
| Crude oil inventory | 259,489 | | | $ | 71.86 | | | 421,759 | | | $ | 45.83 | | | 426,397 | | | $ | 61.93 | |
Historically, prices received for crude oil have been volatile and unpredictable with price volatility expected to continue. See “Item 1A. Risk Factors.”
Transportation
Our transportation segment revenues, operating earnings and selected costs were as follows for the periods indicated (in thousands):
| | | | | | | | | | | | | | | | | | | | | | | | | | | | | |
| Year Ended December 31, |
| 2021 | | 2020 | | Change (1) | | 2019 | | Change (1) |
| | | | | | | | | |
| Revenues | $ | 94,498 | | | $ | 71,724 | | | 31.8 | % | | $ | 63,191 | | | 13.5 | % |
| Operating earnings | $ | 7,104 | | | $ | 1,873 | | | 279.3 | % | | $ | 1,899 | | | (1.4 | %) |
| Depreciation and amortization | $ | 12,099 | | | $ | 10,963 | | | 10.4 | % | | $ | 7,900 | | | 38.8 | % |
| Driver commissions | $ | 14,948 | | | $ | 12,575 | | | 18.9 | % | | $ | 10,774 | | | 16.7 | % |
| Insurance | $ | 8,368 | | | $ | 6,462 | | | 29.5 | % | | $ | 5,938 | | | 8.8 | % |
| Fuel | $ | 8,201 | | | $ | 5,065 | | | 61.9 | % | | $ | 6,279 | | | (19.3 | %) |
| Maintenance expense | $ | 3,932 | | | $ | 3,949 | | | (0.4 | %) | | $ | 3,849 | | | 2.6 | % |
Mileage (000s) (2) | 27,902 | | | 24,239 | | | 15.1 | % | | 20,535 | | | 18.0 | % |
____________________
(1)Represents the percentage increase (decrease) from the prior year.
(2)The increase in mileage from 2019 to 2021 is primarily due to the CTL acquisition in June 2020, which added services to new and existing customers, new product lines and six new market areas.
Transportation
Our transportation segment revenues, operating earnings (losses) and selected costs were as follows for the periods indicated (in thousands):
| | | | | | | | | | | | | | | | | | | | | | | | | | | | | |
| Year Ended December 31, | | | | | | | | |
| 2018 | | 2017 | | Change (1) | | 2016 | | Change (1) |
| | | | | | | | | |
| Revenues | $ | 55,776 | | $ | 53,358 | | 4.5% | | | $ | 52,355 | | 1.9% | |
| Operating earnings (losses) | $ | 3,337 | | $ | (544) | | (713.4%) | | | $ | (48) | | 1,033.3% | |
| Depreciation and amortization | $ | 4,270 | | $ | 5,364 | | (20.4%) | | | $ | 7,249 | | (26.0%) | |
| Driver commissions | $ | 11,680 | | $ | 11,546 | | 1.2% | | | $ | 11,227 | | 2.8% | |
| Insurance | $ | 4,716 | | $ | 5,452 | | (13.5%) | | | $ | 4,952 | | 10.1% | |
| Fuel | $ | 6,988 | | $ | 6,401 | | 9.2% | | | $ | 5,688 | | 12.5% | |
| Maintenance expense | $ | 5,347 | | $ | 6,061 | | (11.8%) | | | $ | 5,410 | | 12.0% | |
| Mileage (000s) | 19,177 | | 21,836 | | (12.2%) | | | 22,611 | | (3.4%) | |
____________________
(1) Represents the percentage increase (decrease) from the prior year.
Our revenue rate structure includes a component for fuel costs in which fuel cost fluctuations are largely passed through to the customer over time. Revenues, net of fuel cost,costs, were as follows for the periods indicated (in thousands):
| | | Year Ended December 31, | | | Year Ended December 31, |
| | 2018 | | 2017 | | 2016 | | 2021 | | 2020 | | 2019 |
| | Total transportation revenue | Total transportation revenue | $ | 55,776 | | $ | 53,358 | | $ | 52,355 | Total transportation revenue | $ | 94,498 | | | $ | 71,724 | | | $ | 63,191 | |
| Diesel fuel cost | Diesel fuel cost | (6,988) | | (6,401) | | (5,688) | Diesel fuel cost | (8,201) | | | (5,065) | | | (6,279) | |
Revenues, net of fuel cost (1) | $ | 48,788 | | $ | 46,957 | | $ | 46,667 | |
Revenues, net of fuel costs (1) | | Revenues, net of fuel costs (1) | $ | 86,297 | | | $ | 66,659 | | | $ | 56,912 | |
____________________
(1)Revenues, net of fuel cost,costs, is a non-GAAP financial measure and is utilized for internal analysis of the results of our transportation segment.
20182021 compared to 20172020. Transportation revenues increased by $22.8 million during the year ended December 31, 2021 as compared to 2020. Transportation revenues, net of fuel costs, increased by $19.6 million during the year ended December 31, 2021 as compared to 2020. These increases were primarily due to the CTL acquisition in June 2020 (see Note 6 in the Notes to Consolidated Financial Statements), an increase in business activities as a result of continued market recovery after COVID-19 lockdowns, higher transportation rates and additional revenues associated with our new terminals. During 2021, we opened four new terminals in Charleston, West Virginia, West Memphis, Arkansas, Joliet, Illinois, and Augusta, Georgia. Our 2020 revenues were also lower due to fewer miles traveled as a result of decreases in certain business activities of our customers as a result of the COVID-19 outbreak.
Our transportation operating earnings increased by $5.2 million during the year ended December 31, 2021 as compared to 2020, primarily due to increased transportation rates as well as higher revenues as a result of the CTL acquisition, partially offset by higher depreciation and amortization expense related to the timing of new assets placed into service and higher insurance, driver commissions and fuel costs.
Driver commissions increased by $2.4 million during the year ended December 31, 20182021 as compared to 2020, primarily due to a higher driver count, increased miles driven in 2021 and an increase in driver pay mid-2021, partially offset by the year ended December 31, 2017, primarily asimpact of Hurricane Ida in August 2021, which affected our Louisiana operations, resulting in a resultloss of a new transportation agreement entered intodays worked by drivers in January 2018 and higher transportation rates in 2018. Revenues, netthe area, thus decreasing driver commissions. The impact of fuel cost,the storm affected our Louisiana locations through mid-September.
Fuel costs increased by $1.8$3.1 million during the year ended December 31, 2018,2021 as compared to 2020, primarily as a result of higher revenues in 2018, partially offset bythe CTL acquisition, which increased the number of miles traveled during 2021, and an increase in the price of diesel fuel and lower miles traveledfuel. Insurance costs increased $1.9 million during 2018. Transportation activity has continuedthe year ended December 31, 2021 as compared to increase as we continue2020, primarily due to pursue our strategy of streamlining operations and diversifying offerings in our transportation segment. We have continued to work with customers to increase our transportation rates as well as streamlining operations in low margin areas. This increase in services hasthe CTL acquisition which resulted in an increasea higher driver count, increased miles driven in revenues, an increase in variable expenses related to transportation activities2021 and a decrease in mileage as we reduce low margin operations.higher insurance premiums.
Fuel costs increased by $0.6 million as a result of an increase in the price of diesel during 2018 as compared to 2017, partially offset by a decrease in miles traveled. Depreciation and amortization expense decreasedincreased by $1.1 million during the year ended December 31, 20182021 as compared to 2017,2020, primarily as a result of certainthe CTL acquisition in June 2020 and the purchase and lease of new tractors and trailers in 2020 and field equipment being fully depreciated2021.
2020 compared to 2019. Transportation revenues increased by $8.5 million during 2017,the year ended December 31, 2020 as compared to 2019, primarily as a result of the CTL acquisition in June 2020 and the purchase of transportation assets from EH Transport, Inc. and affiliates (“EH Transport”) in May 2019 (see Note 6 in the Notes to Consolidated Financial Statements), partially offset by a decrease in customer activity as a result of the purchaseCOVID-19 outbreak resulting in lower miles traveled in 2020. Revenues, net of fuel costs, increased by $9.7 million during the year ended December 31, 2020 as compared to 2019, primarily as a result of the higher transportation revenues and miles traveled during 2020.
Our transportation operating earnings for the year ended December 31, 2020 were consistent with the year ended December 31, 2019, primarily due to higher depreciation and amortization expense related to the CTL acquisition, the EH Transport acquisition and new tractorsassets placed into service, and higher insurance and certain other operating expenses, offset by higher revenues and increased miles traveled during 2020.
Fuel costs decreased by $1.2 million during the year ended December 31, 2020 as compared to 2019, primarily as a result of lower fuel prices and fewer miles traveled during the first six months of 2020, partially offset by an increase in the second, thirdnumber of miles traveled as a result of the CTL acquisition in June 2020. Insurance costs increased by $0.5 million during the year ended December 31, 2020 as compared to 2019, primarily due to the CTL acquisition which resulted in a higher driver count and fourth quarters of 2018, which will resultincreased miles driven in increased depreciation expense in future periods.2020. Maintenance expense decreased $0.7increased by $0.1 million during the year ended December 31, 2020 as compared to 2019, as a result of the purchase of new tractors and the retirement of older tractors, as the age of our fleet has decreased. During 2019, we expect to purchase additional tractors and trailers, which will continue to reduce the age of our fleet and increase depreciation expense and reduce maintenance expenses. See “Other Items” below for further information regarding our purchase commitments.
2017 compared to 2016. Transportation revenuesDepreciation and amortization expense increased $1.0by $3.1 million during the year ended December 31, 20172020 as compared to the year ended December 31, 2016,2019, primarily as a result of higher transportation ratesthe CTL acquisition in 2017. Revenues, netJune 2020, the EH Transport acquisition in May 2019 and the purchase and lease of fuel cost, increased by $0.3 million during the year ended December 31, 2017, primarily as a result of increased activitynew tractors and trailers in our transportation segment. We began to see a slight increase in transportation activity during late 2017,2019 and we continued to pursue our strategy of streamlining operations and diversifying offerings in our transportation segment. This increase in services resulted in an increase in revenues, an increase in variable expenses related to transportation activities and a decrease in mileage as we began to reduce low margin activities.
Fuel increased by $0.7 million as a result of an increase in the price of diesel during 2017 as compared to 2016, partially offset by a decrease in miles traveled. Our operating results for 2017 were also adversely impacted by Hurricane Harvey, which affected the Gulf Coast area in late August and early September of 2017, resulting in decreased revenues and lower mileage during 2017.2020.
Equipment additions and retirements for the transportation fleet were as follows for the periods indicated:
| | | Year Ended December 31, | | | Year Ended December 31, |
| | 2018 | | 2017 | | 2016 | | 2021 | | 2020 | | 2019 |
| | New tractors purchased | 60 units | | — | | 30 units | |
New tractors purchased (1) (2) | | New tractors purchased (1) (2) | 28 units | | 12 units | | 151 units |
| Tractors retired | Tractors retired | 67 units | | 21 units | | — | Tractors retired | 79 units | | 49 units | | 107 units |
| New trailers purchased | — | | — | | 54 units | |
New trailers purchased (1) (2) | | New trailers purchased (1) (2) | 67 units | | 10 units | | 77 units |
| Trailers retired | Trailers retired | 12 units | | — | | 50 units | Trailers retired | 33 units | | 30 units | | 20 units |
________________
(1)2020 amounts do not include 163 tractors and 328 trailers purchased in connection with the CTL asset acquisition in June 2020.
(2)2020 amounts do not include 33 tractors and 40 trailers which were acquired under finance lease agreements.
The sales of retired equipment in our transportation segment produced gains of approximately $0.8$0.4 million, less than $0.1$0.2 million and $0.4$0.5 million during the years ended December 31, 2018, 20172021, 2020 and 2016,2019, respectively.
Our customers are primarily in the domestic petrochemical industry. Customer demand is affected by low natural gas prices (a basic feedstock cost for the petrochemical industry) and high export demand for petrochemicals. During 2016 and into 2017, the competitive landscape in the transportation sector remained difficult and led to lower revenues in this segment. During late 2017, we saw an increase in customer demand for chemical tank trucking, and we worked to capture those opportunities. During 2018, we began a strategy of streamlining operations and diversifying offerings in our transportation segment. We have continued to work with customers to increase our transportation rates as well as streamlining operations in low margin areas.
Oil and Gas
Prior to our bankruptcy filing, our upstream crude oil and natural gas exploration and production segment revenues and operating earnings (losses) were primarily a function of crude oil and natural gas prices and volumes. We accounted for our upstream operations under the successful efforts method of accounting. As a result of AREC’s bankruptcy filing in April 2017 and our loss of control of this subsidiary, we deconsolidated AREC effective with its bankruptcy filing and recorded our investment in AREC under the cost method of accounting. Our results for 2017 are only through April 30, 2017, during the period in which AREC was consolidated.
Pipeline and Storage
Our upstream crude oilpipeline and natural gas exploration and productionstorage segment revenues, operating earnings (losses)losses and selected costs were as follows for the periods indicated (in thousands):
| | | | | | | | | | | | | | | | | |
| Year Ended December 31, | | | | |
| 2017 | | 2016 | | Change (1) |
| | | | | |
Revenues (2) | $ | 1,427 | | $ | 3,410 | | (58.2%) | |
Operating earnings (losses) (2) | 53 | | (533) | | 109.9% | |
Depreciation and depletion (2) | 423 | | 1,546 | | (72.6%) | |
Prospect impairments (2) | 3 | | 283 | | (98.9%) | |
Producing property impairments (2) | — | | 30 | | (100.0%) | |
| | | | | | | | | | | |
| Year Ended December 31, |
| 2021 | | 2020 (1) |
| | | |
Segment revenues (2) | $ | 4,524 | | | $ | 272 | |
Less: Intersegment revenues (2) | (3,860) | | | — | |
| Revenues | $ | 664 | | | $ | 272 | |
| | | |
| Operating losses | (2,487) | | | (310) | |
| Depreciation and amortization | 1,025 | | | 189 | |
| Insurance | 726 | | | 138 | |
____________________
(1)Represents the percentage increase (decrease) from the prior year.
(2) Results for 2017 represent amounts for the period from January 1, 2017acquisition, October 22, 2020 through April 30, 2017.December 31, 2020.
Our upstreamSegment revenues include intersegment revenues from our crude oil and natural gas exploration and production revenues and depreciation and depletion expense decreased $2.0 million and $1.1 million, respectively, during the year ended December 31, 2017 as compared to 2016. These decreases were primarily as a resultmarketing segment, which are eliminated in consolidation in our consolidated statements of the deconsolidation of AREC effective with its bankruptcy filing in April 2017 (four months of revenues and expenses in 2017 versus twelve months of revenues and expenses in 2016) as well as production declines offsetting commodity price increases in 2017.operations.
Volume and price information werewas as follows for the periods indicated (volumes in thousands)(in barrels per day):
| | | | | | | | | | | |
| Year Ended December 31, | | |
| 2017 | | 2016 |
| | | |
| Crude oil: | | | |
Volume – barrels (1) | 11,643 | | 34,200 |
| Average price per barrel | $ | 49.44 | | $ | 38.07 |
| | | |
| Natural gas: | | | |
Volume – Mcf (1) | 189,488 | | 662,000 |
| Average price per Mcf | $ | 2.86 | | $ | 2.26 |
| | | |
| Natural gas liquids: | | | |
Volume – barrels (1) | 11,204 | | 42,500 |
| Average price per barrel | $ | 26.77 | | $ | 14.39 |
_____________________
(1) Volumes for 2017 are only through April 30, 2017 as a result of the deconsolidation of this subsidiary due to its bankruptcy filing.
During | | | | | | | | | | | |
| Year Ended December 31, |
| 2021 | | 2020 |
| | | |
Pipeline throughput (1) | 7,670 | | | 1,395 | |
Terminalling (1) | 8,132 | | | 2,581 | |
____________________
(1)2020 amounts represent the period from January 1, 2017acquisition, October 22, 2020 through April 30, 2017, we participated in the drilling of six wells in the Permian Basin and one well in the Haynesville Shale with no dry holes. During the year ended December 31, 2016, we participated in the drilling of seven wells in the Permian Basin with no dry holes.
During the year ended December 31, 2016, impairment charges for crude oil and natural gas properties were approximately $0.3 million.
Capitalized crude oil and natural gas property costs were amortized in expense as the underlying crude oil and natural gas reserves were produced (units-of-production method).
TableIn October 2020, we purchased the VEX Pipeline System. The VEX Pipeline System, with truck and storage terminals at both Cuero and the Port of ContentsVictoria, Texas, is a crude oil and condensate pipeline system, which connects the heart of the Eagle Ford Basin to the Gulf Coast waterborne market. The VEX Pipeline System includes 56 miles of 12-inch pipeline, which spans DeWitt County to Victoria County, Texas, with approximately 350,000 barrels of above ground storage, two 8 bay truck offload stations, and access to two docks at the Port of Victoria. The VEX Pipeline System can receive crude oil by pipeline and truck, and has downstream pipeline connections to two terminals today, with potential for additional downstream connection opportunities in the future and has a current capacity of 90,000 barrels per day.
We are focusing on opportunities to increase our pipeline and storage capacity utilization, by identifying opportunities with our existing and new customers to increase volumes. In addition, we are exploring new connections for the pipeline system both upstream and downstream of the pipeline, to increase the crude oil supply and take-away capability of the system.
General and Administrative Expense
General and administrative expenses decreasedincreased by $0.8$3.4 million during the year ended December 31, 20182021 as compared to 2017,2020, primarily due to the receipt in 2018 of approximately $0.6 million in insurance proceedshigher salaries and wages and related to Hurricane Harvey insurance claims, which reduced expenses, lower personnel costs, in 2018,insurance costs and outside service costs, partially offset by lower legal fees and director fees.
General and administrative expenses increased by $0.1 million during the reversal in 2017 of certain legal accruals ofyear ended December 31, 2020 as compared to 2019, primarily due to higher personnel costs, including approximately $0.7 million related to legal matters. 2017 also included approximately $1.0$0.3 million of additional personnel expenses related to a voluntary early retirement program and terminations for certain employees. These decreasesemployees, and higher rental expense and director fees in expenses were2020, partially offset by an increase in expenseslower insurance costs, audit fees and outside service fees.
Gain on Dissolution of Investment
During 2019, we received a cash payment from our upstream crude oil and natural gas exploration and production subsidiary, Adams Resources Exploration Company (“AREC”), totaling approximately $1.0 million, related to the amortizationfinal settlement of equity awardsits bankruptcy and an increasedissolution. Of the amount received, approximately $0.4 million was offset against a receivable that had been set up as of December 31, 2018 and $0.6 million was recorded as a gain in legal and outside service fees in 2018.
General and administrative expenses decreased by $0.7 millionour consolidated statements of operations during the year ended December 31, 2017 as compared to 2016, primarily due to the deconsolidation of AREC in April 2017 (four months of expense in 2017 versus twelve months of expense in 2016), partially offset by an increase of approximately $1.0 million in personnel expenses in 2017 as a result of a voluntary early retirement program for certain employees, and higher legal and audit fees in 2017.
Investments in Unconsolidated Affiliates
AREC. In April 2017, we deconsolidated AREC effective with its bankruptcy filing on April 21, 2017 and recorded our investment in AREC under the cost method of accounting. Based upon bids received in the auction process (see Note 4 in the Notes to Consolidated Financial Statements for further information), we determined that the fair value of our investment in AREC was expected to be lower than its net book value immediately prior to the deconsolidation. As a result, during the second quarter of 2017, we recorded a non-cash charge of approximately $1.6 million associated with the deconsolidation of AREC, which reflected the excess of the net assets of AREC over its estimated fair value based on an expected sales transaction price of approximately $5.0 million, net of estimated transaction costs. During the third quarter of 2017, as a result of the sale of substantially all of AREC’s assets, we recognized an additional loss of $1.9 million, which represented the difference between the net proceeds we expected to be paid upon settlement of the bankruptcy, net of anticipated remaining closing costs identified as part of the liquidation plan, and the book value of our cost method investment.
VestaCare. During the third quarter of 2017, we reviewed our investment in VestaCare and determined that the current projected operating results did not support the carrying value of our investment. As a result, we recognized a pre-tax impairment charge of $2.5 million during the third quarter of 2017 and wrote-off our investment in VestaCare.
Bencap. During the year ended December 31, 2016, we reviewed our equity method investment in Bencap and determined that there was an other than temporary impairment as Bencap’s lower than projected revenue growth and operating losses did not support the carrying value of our investment. Under the terms of the investment agreement, Bencap had the option to request borrowings from us of up to $1.5 million (on or after December 5, 2016 but before October 31, 2018) that we were required to provide or forfeit our 30 percent member interest. Our management determined that we were unlikely to provide additional funding due to our impairment review. During the third quarter of 2016, we recognized an after-tax net loss of $1.4 million to write-off our investment in Bencap, which included a pre-tax impairment charge of $1.7 million, pre-tax losses from the equity method investment of $0.5 million and a tax benefit of $0.8 million.2019.
Income Taxes
Provision for (benefit from) income taxes is based upon federal and state tax rates, and variations in amounts are consistent with taxable income (loss) in the respective accounting periods.
We have determined that the NOL carryback provision in the CARES Act would result in a cash benefit to us for the fiscal years 2018, 2019 and 2020. We carried back our NOL for fiscal year 2018 to 2013, and in June 2020, we received a cash refund of approximately $2.7 million. We also carried back our NOL for the fiscal year 2019 to 2014, and in April 2021, we received a cash refund of approximately $3.7 million. We have an income tax receivable at December 31, 2021 of approximately $6.8 million for the benefit of carrying back our NOL for the fiscal year 2020 to 2015 and 2016. As we are carrying the losses back to years beginning before January 1, 2018, the receivables were recorded at the previous 35 percent federal tax rate rather than the current statutory rate of 21 percent.
On December 22, 2017, the Tax CutWe account for interest and Jobs Act was enacted into law resulting in a reduction in thepenalties related to uncertain tax positions as part of our provision for federal corporateand state income tax rate from 35 percent to 21 percent for years beginning in 2018.taxes. At December 31, 20182021 and 2017,2020, we have not recorded any uncertain tax benefits.
At December 31, 2021 and 2020, we had deferred tax liabilities of approximately $4.2$11.3 million and $3.3$12.7 million, (2017 amount reflects a reduction of approximately $2.0 million resulting from the lower rate under which those deferred taxes would be expected to be recovered or settled), respectively. Our provision for income taxes during 2018 was impacted by the lower tax rate.
See Note 1214 in the Notes to Consolidated Financial Statements for further information.
Liquidity and Capital Resources
LiquidityGeneral
Our primary sources of liquidity is fromare (i) our cash balance, and net(ii) cash provided byflow from operating activities, (iii) borrowings under our credit agreement and (iv) funds received from the sale of equity securities. Our primary cash requirements include, but are not limited to, (i) ordinary course of business uses, such as the payment of amounts related to the purchase of crude oil, and other expenses, (ii) discretionary capital spending for investments in our business and (iii) dividends to our shareholders. We believe we will have sufficient liquidity through our current cash balances, availability under our credit agreement, expected cash generated from future operations, and the ease of financing tractor and trailer additions through leasing arrangements (should the need arise) to meet our short-term and long-term liquidity needs for the reasonably foreseeable future. Our cash balance and cash flow from operating activities is therefore dependent on the success of future operations. If our cash inflow subsides or turns negative, we will evaluate our investment plan accordingly and remain flexible.
One of our wholly owned subsidiaries, AREC, filed for bankruptcy in April 2017. Over the past few years, we have de-emphasized our upstream operations and do not expect this Chapter 11 filing by AREC to have a material adverse impact on any of our core businesses. As a result of an auction process (see Note 1 in the Notes to Consolidated Financial Statements), AREC sold its assets for approximately $5.2 million during 2017. After settlement of certain claims in late 2017, AE received approximately $2.8 million from AREC in December 2017. We expect to receive an additional $0.4 million in 2019 upon final settlement of the bankruptcy and dissolution of the entity.
At December 31, 2018, 2017 and 2016, we had no bank debt or other forms of debenture obligations. We maintain cash balances in order to meet the timing of day-to-day cash needs. Cash and cash equivalents (excluding restricted cash) and working capital, the excess of current assets over current liabilities, were as follows at the dates indicated (in thousands):
| | | | | | | | | | | | | | | | | |
| December 31, | | | | |
| 2018 | | 2017 | | 2016 |
| | | | | |
| Cash and cash equivalents | $ | 117,066 | | $ | 109,393 | | $ | 87,342 |
| Working capital | 106,323 | | 116,087 | | 106,444 |
| | | | | | | | | | | | | | | | | |
| December 31, |
| 2021 | | 2020 | | 2019 |
| | | | | |
| Cash and cash equivalents | $ | 97,825 | | | $ | 39,293 | | | $ | 112,994 | |
| Working capital | 87,199 | | | 72,965 | | | 87,747 | |
We maintainOur cash balance at December 31, 2021 increased by 149.0 percent from December 31, 2020, as discussed further below.
On May 4, 2021, we entered into a letter of credit facilityCredit Agreement with Wells Fargo Bank, National Association, to provide for the issuanceas Agent and Issuing Lender, under which we may borrow or issue letters of credit in an aggregate of up to $60.0$40.0 million in stand-by letters of credit primarily used to support crude oil purchases within our crude oil marketing segment and for other purposes. Stand-by letters of credit are issued as needed and are canceled as the underlying purchase obligations are satisfied by cash payment when due. The issuance of stand-by letters of credit enables us to avoid posting cash collateral when procuring crude oil supply. We are currently using the letter ofunder a revolving credit facility, for letters of credit relatedwhich will mature on May 4, 2024, subject to our insurance program.compliance with certain financial covenants. At December 31, 2018 and 2017,2021, we had $4.6no borrowings outstanding under the Credit Agreement and $6.1 million and $2.2 million, respectively, of letters of credit outstandingissued under this facility.the Credit Agreement at a fee of 1.75 percent per annum. See Note 12 in the Notes to Consolidated Financial Statements for further information.
On December 23, 2020, we entered into an At Market Issuance Sales Agreement (“ATM Agreement”) with B. Riley Securities, Inc., as agent (the “Agent”). Pursuant to the ATM Agreement, we may offer to sell shares of our common stock through or to the Agent for cash from time to time. We believe current cash balances, together with expected cash generated from future operations,filed a registration statement initially registering an aggregate of $20.0 million of shares of common stock for sale under the ATM Agreement. The total number of shares of common stock to be sold, if any, and the ease of financing truck and trailer additions through leasing arrangements (shouldprice the need arise)shares will be sufficientsold at will be determined by us periodically in connection with any such sales, though the total amount sold may not exceed the limitations stated in the registration statement. During the year ended December 31, 2021, we received net proceeds of approximately $2.8 million (net of offering costs to meetB. Riley Securities, Inc. of $0.1 million) from the sale of 97,623 of our short-term and long-term liquidity needs.common shares at an average price per share of approximately $30.70 under this agreement.
We utilize cash from operations to make discretionary investments in our crude oil marketing, transportation and transportationpipeline and storage businesses. With the exception of operating and capitalfinance lease commitments primarily associated with storage tank terminal arrangements, leased office space, tractors, trailers and tractors,other equipment, our future commitments and planned investments can be readily curtailed if operating cash flows decrease. See “Other Items” below for information regarding our operating and capitalfinance lease obligations. We have no off-balance sheet arrangements that have or are reasonably expected to have a material current or future effect on our financial position, results of operations or cash flows.
The most significant item affecting future increases or decreases in liquidity is earnings from operations, and these earnings are dependent on the success of future operations. See “Part I, Item 1A. Risk Factors.”
Cash Flows from Operating, Investing and Financing Activities
Our consolidated cash flows from operating, investing and financing activities were as follows for the periods indicated (in thousands):
| | | | | | | | | | | | | | | | | |
| Year Ended December 31, | | | | |
| 2018 | | 2017 | | 2016 |
| | | | | |
| Cash provided by (used in): | | | | | |
| Operating activities | $ | 31,014 | | $ | 26,096 | | $ | 6,944 |
| Investing activities | (19,135) | | (216) | | (7,768) |
| Financing activities | (4,206) | | (3,829) | | (3,711) |
| | | | | | | | | | | | | | | | | |
| Year Ended December 31, |
| 2021 | | 2020 | | 2019 |
| | | | | |
| Cash provided by (used in): | | | | | |
| Operating activities | $ | 81,026 | | | $ | (43,999) | | | $ | 46,899 | |
| Investing activities | (10,096) | | | (19,663) | | | (36,037) | |
| Financing activities | (15,678) | | | (6,528) | | | (5,673) | |
Operating activities. Net cash flows provided by operating activities was $81.0 million for the year ended December 31, 2018 increased by $4.9 million when2021 as compared to 2017. Thisnet cash flows used in operating activities of $44.0 million for the year ended December 31, 2020. The increase in net cash flows from operating activities of $125.0 million was primarily due to an increasehigher earnings in revenues2021 and a decreasechanges in general and administrative expenses, partially offset by increased operating expenses.our working capital accounts.
Net cash flows provided byused in operating activities was $44.0 million for the year ended December 31, 2017 increased by $19.2 million when2020 as compared to 2016. This increasenet cash flows provided by operating activities of $46.9 million for the year ended December 31, 2019. The decrease in net cash flows from operating activities of $90.9 million was primarily due to an increaselower earnings in revenues, partially offset by increased operating expenses.2020 and changes in our working capital accounts.
At various times each month, we may make cash prepayments and/or early payments in advance of the normal due date to certain suppliers of crude oil within our crude oil marketing operations. Crude oil supply prepayments are recouped and advanced from month to month as the suppliers deliver product to us. In addition, in order to secure crude oil supply, we may also “early pay” our suppliers in advance of the normal payment due date of the twentieth of the month following the month of production. These “early payments” reduce cash and accounts payable as of the balance sheet date.
We also require certain customers to make similar early payments or to post cash collateral with us in order to support their purchases from us. Early payments and cash collateral received from customers increases cash and reduces accounts receivable as of the balance sheet date.
Early payments received from customers and prepayments made to suppliers were as follows at the dates indicated (in thousands):
| | | December 31, | | | December 31, |
| | 2018 | | 2017 | | 2016 | | 2021 | | 2020 | | 2019 |
| | Early payments received | Early payments received | $ | 38,539 | | $ | 20,078 | | $ | 15,032 | Early payments received | $ | 52,841 | | | $ | 939 | | | $ | 54,108 | |
| | Prepayments to suppliers | | Prepayments to suppliers | — | | | 1,085 | | | — | |
| Early payments to suppliers | Early payments to suppliers | — | | 6,100 | | 14,382 | Early payments to suppliers | 5,732 | | | — | | | — | |
We rely heavily on our ability to obtain open-line trade credit from our suppliers especially with respect to our crude oil marketing operations. During the fourth quarter of 2018,December 2019, we received several early payments from certain customers in our crude oil marketing operations. Ouroperations, while during December 2020, we received significantly less in early payments from customers primarily due to the volatility in the price of crude oil. During December 2021, we received several early payments from certain customers primarily due to the increase in the price of crude oil, and as such, our cash balance increased by approximately $7.7$58.5 million at December 31, 20182021 relative to the year ended December 31, 2017 as the year end 2018 and 2017 balances were higher than normal as a result of these early payments received during the fourth quarter of 2018 and 2017.
Investing activities. Net cash flows used in investing activities for the year ended December 31, 2018 increased by $18.9 million when compared to 2017. The increase was primarily due to the payment of $10.3 million for the purchase of Red River assets in our crude oil marketing segment (see Note 6 in the Notes to Consolidated Financial Statements for further information), a $9.1 million increase in capital spending for property and equipment (see “Capital Projects” below) and the receipt of $2.8 million of proceeds in 2017 related to the partial settlement of AREC’s bankruptcy. These increases in net cash flows used in investing activities were partially offset by a $1.9 million increase in insurance and state collateral refunds and a $1.3 million increase in cash proceeds from the sales of assets.
2020.
Investing activities. Net cash flows used in investing activities for the year ended December 31, 20172021 decreased by $7.6$9.6 million when compared to 2016. The2020. This decrease in net cash flows used in investing activities was primarily due a decrease of $20.2 million in cash paid for asset acquisitions ($10.0 million was paid in October 2020 for the purchase the VEX Pipeline System and $9.2 million was paid in June 2020 for the purchase of the CTL transportation assets (see Note 6 in the Notes to a $5.8Consolidated Financial Statements for further information)). This decrease in net cash flows used in investing activities was partially offset by an increase of $7.4 million decrease in capital spending for property and equipment (see “Capital Projects”Spending” below), a $4.7decrease of $2.2 million in cash proceeds from sales of assets and a decrease of $1.0 million in insurance and state collateral refunds in 2021.
Net cash used in investing activities for the year ended December 31, 2020 decreased by $16.4 million when compared to 2019. This decrease in investmentsnet cash used in unconsolidated affiliatesinvesting activities was primarily due to a decrease of $30.7 million in capital spending for property and equipment (see “Capital Spending” below), an increase of $0.8 million in cash proceeds from sales of assets and an increase of $0.4 million in insurance and state collateral refunds in 2020. These decreases in net cash flows used in investing activities were partially offset by an increase in cash paid for asset acquisitions ($10.0 million was paid in October 2020 for the purchase the VEX Pipeline System and $9.2 million was paid in June 2020 for the purchase of the CTL transportation assets, while $5.6 million was paid in May 2019 for the purchase of the EH Transport assets) and the receipt in 2019 of $2.8$1.0 million ofin cash proceeds related to the partialfinal settlement of AREC’s bankruptcy, partially offset by a $3.0 million decrease in cash proceeds from the sales of assets. During 2016, we invested a total of $4.7 million in two medical-related investments, VestaCare and Bencap (see Note 8 in the Notes to Consolidated Financial Statements for further information).bankruptcy.
Financing activities. CashNet cash used in financing activities for the year ended December 31, 20182021 increased by $0.4$9.2 million when compared to 2017. The2020. This increase in net cash used in financing activities was primarily due to the payment of the $10.0 million outstanding payable related to the purchase of the VEX Pipeline System in October 2020 and an increase of $0.4$2.0 million in principal repayments made for capitalfinance lease obligations that we entered into in 2018 and 2017 for certain of our tractors in our crude oil marketing segment, with principal contractual commitments to be paid over a period of five years. See “Other Items”(see “Material Cash Requirements” below for information regarding our capitalfinance lease obligations.obligations). During each2021, we borrowed and repaid $8.0 million under the Credit Agreement, the borrowing of which was used to repay the amount due for the remaining purchase price of the VEX Pipeline System. During both of the years ended December 31, 20182021 and 2017,2020, we paid a quarterlyaggregate cash dividenddividends of $0.22$0.96 per common share, ($0.88 peror totals of $4.1 million and $4.1 million, respectively. During the year ended December 31, 2021, we received net proceeds of approximately $2.8 million from the sale of 97,623 of our common share per year), or a total of $3.7 million.under the ATM Agreement.
CashNet cash used in financing activities for the year ended December 31, 20172020 increased by $0.1$0.9 million when compared to 2016. The2019. This increase in net cash used in financing activities was primarily due to the paymentan increase of $0.6 million in 2017 of $0.1 million of principal repayments on capitalmade for finance lease obligations that we entered into in 2017 for certain of our tractors in our crude oil marketing segment.obligations. During each of the years ended December 31, 20172020 and 2016,2019, we paid a quarterlyaggregate cash dividenddividends of $0.22$0.96 per common share, ($0.88 per common share per year), or a total of $3.7 million.$4.1 million, and $0.94 per common share, or a total of $4.0 million, respectively.
Capital ProjectsSpending
We use cash from operations and existing cash balances to make discretionary investments in our crude oil marketing and transportation businesses. Capital spending for the past five years was as follows for the periods indicated (in thousands):
| | | | | | | | | | | | | | | | | | | | | | | | | | | | | |
| Year Ended December 31, | | | | | | | | |
| 2018 | | 2017 | | 2016 | | 2015 | | 2014 |
| | | | | | | | | |
Crude oil marketing (1) (2) | $ | 1,540 | | $ | 468 | | $ | 1,321 | | $ | 2,126 | | $ | 13,598 |
| Transportation | 10,178 | | 351 | | 6,868 | | 6,579 | | 8,994 |
| Oil and natural gas exploration | — | | 1,825 | | 295 | | 2,369 | | 7,931 |
| Medical management | — | | — | | 4,700 | | — | | — |
| Other | 13 | | — | | — | | — | | — |
| Capital spending | $ | 11,731 | | $ | 2,644 | | $ | 13,184 | | $ | 11,074 | | $ | 30,523 |
| | | | | | | | | | | | | | | | | |
| Year Ended December 31, |
| 2021 | | 2020 | | 2019 |
| | | | | |
Crude oil marketing (1) | $ | 3,245 | | | $ | 3,130 | | | $ | 7,249 | |
Transportation (2) | 7,960 | | | 1,355 | | | 28,472 | |
Pipeline and storage (3) | 1,169 | | | — | | | — | |
Other (4) | 8 | | | 523 | | | 22 | |
| Capital spending | $ | 12,382 | | | $ | 5,008 | | | $ | 35,743 | |
_______________
(1) Our crude oil marketing segment amountsAmounts for the years ended December 31, 20182021, 2020 and 2017,2019, do not include approximately $2.9$2.1 million, $3.6 million and $1.8$4.1 million, respectively, of tractors and other equipment acquired under capitalfinance leases. The amount for the year ended December 31, 2018, also does not include approximately $1.0 million of costs incurred but not yet paid for the purchase of eight new trucks that will be placed into service in early 2019.
(2) 2018 amount does not include approximately $10.3 million of capital spending related to the Red River acquisition.
Crude oil marketing. During 2014, our crude oil marketing segment spending level was backed by crude oil prices remaining strong, in the $90 – $100 per barrel range. In late 2014, crude oil prices fell, and we curtailed spending during 2015, 2016 and 2017. During 2018, capital expenditures were primarily related to construction of a pipeline connection and a truck loading/unloading facility.
Transportation(2). During 2014,Amounts for the years ended December 31, 2020 and 2019 do not include approximately $9.2 million and $6.4 million of capital expenditures werespending related to add capacity in connection with the petrochemical industry expansion efforts. However, in late 2015 through 2017, demandacquisitions of CTL and EH Transport, respectively. Amount for truck services weakened. During 2016, the majorityyear ended December 31, 2020 does not include approximately $7.3 million of tractors and trailers acquired under finance leases.
(3)Amount for the year ended December 31, 2020 does not include approximately $10.0 million of capital spending related to the acquisition of the capital spending was forVEX Pipeline System.
(4)Amounts relate to the purchase of software and equipment and leasehold improvements at our corporate headquarters, which are not attributed or allocated to our existing Houston terminal facility. In late 2017, we began to see increased demand in our transportation segment, and we began to pursue a strategy of streamlining operations and diversifying offerings in this segment. During 2018, we purchased 60 new tractors, and at December 31, 2018, we have commitments to purchase an additional 35 new tractors and 20 new trailers in 2019, which will continue to reduce the ageany of our fleet. reporting segments.
Oil and natural gas exploration and productionCrude oil marketing. During 2017, we exitedCapital expenditures during 2021 were for the crude oilpurchase of 16 tractors, 2 trailers and natural gas explorationother field equipment. Capital expenditures during 2020 were primarily for the purchase of 16 tractors and production business withother field equipment, and during 2019, amounts were primarily for the April 2017 bankruptcy filingpurchase of 43 tractors and subsequent sale of our crude oil and natural gas assets.other field equipment.
Medical managementTransportation. During 2016,Capital expenditures during 2021 were for the purchase of 28 tractors, 52 trailers and computer software and equipment. Capital expenditures during 2020 were for the purchase of other field equipment and computer software and equipment. As a result of the uncertainty relating to the economic environment resulting from the COVID-19 pandemic, we invested $4.7 millionsignificantly reduced our capital spending in two medical-related investments, Bencap2020 and, VestaCare. During 2016, we wrote offas a result, entered into finance lease agreements for the use of 33 tractors and 40 trailers during 2020. Capital expenditures during 2019 were for the purchase of 152 tractors and 77 trailers. See “Material Cash Requirements” below for information regarding our investment in Bencap and forfeited our interest in the entity. During 2017, we wrote off our investment in VestaCare, but continue to own an approximate 15 percent equity interest in the entity. We currently do not have any plans to pursue additional medical-related investments.finance lease obligations.
Other Items. Capital expenditures for 2021 were for the purchase of computer equipment and field equipment.
Contractual Obligations
Material Cash Requirements
The following table summarizes our significant contractual obligations with material cash requirements at December 31, 20182021 (in thousands):
| | | | | | | | | | | | | | | | | | | | | | | | | | | | | |
| | | Payments due by period | | | | | | |
| Contractual Obligations | Total | | Less than 1 year | | 1-3 years | | 3-5 years | | More than 5 years |
| | | | | | | | | |
Capital lease obligations (1) | $ | 4,516 | | $ | 1,052 | | $ | 2,104 | | $ | 1,360 | | $ | — |
Operating lease obligations (2) | 13,372 | | 4,242 | | 4,365 | | 3,277 | | 1,488 |
| Purchase obligations: | | | | | | | | | |
Crude oil marketing (3) | 106,706 | | 106,706 | | — | | — | | — |
Transportation (4) | 6,805 | | 6,805 | | — | | — | | — |
| Total contractual obligations | $ | 131,399 | | $ | 118,805 | | $ | 6,469 | | $ | 4,637 | | $ | 1,488 |
| | | | | | | | | | | | | | | | | | | | | | | | | | | | | | | | |
| | | | Payments due by period |
| Contractual Obligations | | Total | | Less than 1 year | | 1-3 years | | 3-5 years | | More than 5 years |
| | | | | | | | | | |
Finance lease obligations (1) | | $ | 14,004 | | | $ | 3,941 | | | $ | 5,491 | | | $ | 4,572 | | | $ | — | |
Operating lease obligations (2) | | 7,572 | | | 2,399 | | | 3,991 | | | 727 | | | 455 | |
| Purchase obligations: | | | | | | | | | | |
Crude oil marketing — crude oil (3) | | 188,044 | | | 188,044 | | | — | | | — | | | — | |
Tractors and trailers (4) | | 13,680 | | | 13,680 | | | — | | | — | | | — | |
| Total contractual obligations | | $ | 223,300 | | | $ | 208,064 | | | $ | 9,482 | | | $ | 5,299 | | | $ | 455 | |
___________________
(1)Amounts represent our principal contractual commitments, including interest, outstanding under capitalfinance leases for certain tractors, in our crude oil marketing segment.trailers, tank storage and throughput arrangements and other equipment.
(2)Amounts represent rental obligations under non-cancelable operating leases and terminal arrangements with terms in excess of one year.
(3)Amount represents commitments to purchase certain quantities of crude oil substantially in January 20192022 in connection with our crude oil marketing activities. These commodity purchase obligations are the basis for commodity sales, which generate the cash flow necessary to meet these purchase obligations.
(4)Amount represents commitments to purchase 3543 new tractors in our transportation business and 52 new tractors and 202 new trailers in connection with our transportationcrude oil marketing business.
We maintain certain lease arrangements with independent truck owner-operators for use of their equipment and driver services on a month-to-month basis. In addition, we enter into office space and certain lease and terminal access contracts in order to provide tank storage and dock access for our crude oil marketing business. These storage and access contracts require certain minimum monthly payments for the term of the contracts.
Rental expense was as follows for the periods indicated (in thousands):
| | | | | | | | | | | | | | | | | |
| Year Ended December 31, | | | | |
| 2018 | | 2017 | | 2016 |
| | | | | |
| Rental expense | $ | 11,078 | | $ | 12,073 | | $ | 11,314 |
| | | | | | | | | | | | | | | | | |
| Year Ended December 31, |
| 2021 | | 2020 | | 2019 |
| | | | | |
| Rental expense | $ | 21,604 | | | $ | 16,585 | | | $ | 14,662 | |
Insurance
Our primary insurance needs are workers’ compensation, automobile and umbrella liability coverage for our trucking fleet and medical insurance for our employees. See Note 18 in the Notes to Consolidated Financial Statements for further information. Insurance costs were as follows for the periods indicated (in thousands):
| | | | | | | | | | | | | | | | | |
| Year Ended December 31, | | | | |
| 2018 | | 2017 | | 2016 |
| | | | | |
| Insurance costs | $ | 11,374 | | $ | 10,438 | | $ | 13,330 |
Off-Balance Sheet Arrangements
We have no off-balance sheet arrangements that have or are reasonably expected to have a material current or future effect on our financial position, results of operations or cash flows. | | | | | | | | | | | | | | | | | |
| Year Ended December 31, |
| 2021 | | 2020 | | 2019 |
| | | | | |
| Insurance costs | $ | 15,610 | | | $ | 13,283 | | | $ | 14,149 | |
Related Party Transactions
For information regarding our related party transactions, see Note 10 in the Notes to Consolidated Financial Statements included under Part II, Item 8 of this annual report.
Recent Accounting Developments
For information regarding recent accounting developments, see Note 2 in the Notes to Consolidated Financial Statements included under Part II, Item 8 of this annual report.
Outlook
Our focus in 20192022 will be to continue to expand our core businesses. Competition remainsbusinesses while delivering value to our shareholders. We will work to achieve positive results in markets with strong competition and margins remain tight inmargin pressures throughout all segments of our core crude oil marketing areas, and competition in our transportation segment remains strong, as well.business.
Our major objectives for 20192022 are as follows:
•CrudeCrude oil marketing – We will continueplan to focus on increasing margins to maximize cash flow and capturing midstream opportunities associated with increasing rig counts, drillingin an increasingly volatile market. We will utilize a new fleet dispatch and completion activitymaintenance software system to help drive more efficiency in the U.S.our fleet operations and lower our operating costs, which we believe will help drive increased profitability. In addition, we will look for opportunities to increase our trucking fleet to add to our overall ability to gather and distribute crude oil.
•Transportation – We plan to continue to increase truck utilization, upgrade our fleet quality and enhance driver retention and recruitment. The transportation segment is uniquely positionedWe also plan to take advantagecapitalize on our recent acquisitions to improve quality of major downstream infrastructure projects that are taking place across the Gulf Coast. We planrevenue through improved efficiencies, and we will continue to look for ways to expand our terminal footprint to put us in a position to better compete for new business.
•Pipeline and storage – We will focus on opportunities to increase our pipeline and storage capacity utilization, by identifying opportunities with our existing and new customers to increase volumes. In addition, we will explore new connections for the pipeline system both upstream and downstream of the pipeline, to increase the crude oil supply and take-away capability of the system.
•Strategic business development – We will deploy a disciplined investment approach to growth in our two corethree segments and funding new growth opportunities that are adjacent and complimentary to existing operating activities.
Critical Accounting Policies and Estimates
In our financial reporting processes, we employ methods, estimates and assumptions that affect the reported amounts of assets and liabilities and disclosure of contingent assets and liabilities as of the date of our financial statements. These methods, estimates and assumptions also affect the reported amounts of revenues and expenses for each reporting period. Investors should be aware that actual results could differ from these estimates if the underlying assumptions prove to be incorrect. The following sections discuss the use of estimates within our critical accounting policies and estimates.
Valuation and Amortization Methods of Customer Relationship Intangible Assets
Customer relationship intangible assets represent the estimated economic value assigned to relationships between an acquisition target and its various customers to whom we did not have a previous relationship. These customer relationships provide us with access to those customers to whom we did not have a previous relationship and allows us to enter product markets in which we have not previously participated.
In order to estimate the fair value of the customer relationships, we use a discounted cash flow analysis that relies on Level 3 fair value inputs. Level 3 fair values are based on unobservable inputs. Unobservable inputs are used to measure fair value to the extent that observable inputs are not available, thereby allowing for situations in which there is little, if any, market activity for the asset at the measurement date. The Level 3 inputs generally include such items as the rate of retention of the current customers of the acquisition target as of the valuation date, our historical customer retention rate and projected future revenues associated with the customers. The customers expected to remain with us after the transaction are included in the valuation of the customer relationships. For our existing customer relationship intangible assets, we are amortizing these assets over a period of seven years, using a modified straight-line approach.
At December 31, 2021 and 2020, the carrying values of our customer relationship intangible assets were $3.3 million and $4.1 million, respectively. See Note 6 and Note 8 in the Notes to Consolidated Financial Statements for further information.
Fair Value Accounting
We enter into certain forward commodity contracts that are required to be recorded at fair value, and these contracts are recorded as either an asset or liability measured at its fair value. Changes in fair value are recognized immediately in earnings unless the derivatives qualify for, and we elect, cash flow hedge accounting. We had no contracts designated for hedge accounting during the years ended December 31, 2018, 20172021, 2020 and 2016.2019.
We utilize a market approach to valuing our commodity contracts. On a contract by contract, forward month by forward month basis, we obtain observable market data for valuing our contracts that typically have durations of less than 18 months. At December 31, 2018,2021, all of our market value measurements were based on inputs based on observable market data (Level 2 inputs). See discussion under “Fair Value Measurements” in NotesNote 2 and 11Note 13 in the Notes to the Consolidated Financial Statements.
Our fair value contracts give rise to market risk, which represents the potential loss that may result from a change in the market value of a particular commitment. We monitor and manage our exposure to market risk to ensure compliance with our risk management policies. These risk management policies are regularly assessed to ensure their appropriateness given our objectives, strategies and current market conditions.
Accounts ReceivableLiability and Allowance for Doubtful Accounts
Accounts receivable associated with crude oil marketing activities comprise approximately 90 percent of our total receivables, and industry practice requires payment for these salesContingency Accruals, including those related to occur within 20 days of the end of the month following a transaction. Our customer makeup, credit policies and the relatively short duration of receivables mitigate the uncertainty typically associated with receivables management. We manage our crude oil marketing receivables by participating in a monthly settlement process with each of our counterparties. Ongoing account balances are monitored monthly, and we reconcile outstanding balances with counterparties. We also place great emphasis on collecting cash balances due.Insurance Liabilities
We maintainestablish a liability under the automobile and monitor our allowanceworkers’ compensation insurance policies for doubtful accounts. Our allowance for doubtful accounts is determinedexpected claims incurred but not reported on a monthly basis. We retain a third-party consulting actuary to establish loss development factors, based on specific identification combined with a reviewhistorical claims experience as well as industry experience. We apply those factors to current claims information to derive an estimate of the general status of the aging of all accounts. We consider the following factors in our review of our allowance for doubtful accounts: (i) historical experience with customers, (ii) the perceived financial stability of customers based on our research, (iii) the levels of credit we grant to customers, and (iv) the duration of the receivable. We may increase the allowance for doubtful accounts in response to the specific identification of customers involved in bankruptcy proceedings and similar financial difficulties. On a routine basis, we review estimates associated with the allowance for doubtful accounts to ensure that we have recorded sufficient reserves to cover potential losses. Customer payments are regularly monitored. However, a degree of risk remains due to the custom and practices of the industry.ultimate claims liability. See Note 218 in the Notes to Consolidated Financial Statements for further information.
Liability and Contingency Accruals
From time to time as incidental to our operations, we become involved in various accidents, lawsuits and/or disputes. As an operator of an extensive trucking fleet, we are a party to motor vehicle accidents, worker compensation claims or other items of general liability as are typical for the industry. In addition, we have extensive operations that must comply with a wide variety of tax laws, environmental laws and labor laws, among others. Should an incident occur, we evaluate the claim based on its nature, the facts and circumstances and the applicability of insurance coverage. When our assessment indicates that it is probable that a liability has occurred and the amount of the liability can be reasonably estimated, we make appropriate accruals or disclosure. We base our estimates on all known facts at the time and our assessment of the ultimate outcome, including consultation with external experts and counsel. We revise these estimates as additional information is obtained or resolution is achieved.
At December 31, 2018,2021, we weredo not awarebelieve any of any contingencies or liabilities thatour outstanding legal matters would have a material adverse effect on our financial position, results of operations or cash flows.
Revenue Recognition
On January 1, 2018, we adopted Financial Accounting Standards Board Accounting Standards Codification 606, Revenue from Contracts with Customers (“ASC 606”) and all related Accounting Standards Updates by applying the modified retrospective approach to all contracts that were not completed on January 1, 2018. The new revenue standard’s core principle is that a company will recognize revenue when it transfers promised goods or services to customers in an amount that reflects the consideration to which the company expects to be entitled in exchange for those goods or services. The new revenue standard requires entities to recognize revenue through the application of a five-step model, which includes: identification of the contract; identification of the performance obligations; determination of the transaction price; allocation of the transaction price to the performance obligations; and recognition of revenue as the entity satisfies the performance obligations.
Our revenues are primarily generated from the marketing, transportation, storage and storageterminalling of crude oil and other related products and the tank truck transportation of liquid chemicals, pressurized gases, asphalt and dry bulk. A performance obligation is a promise in a contract to transfer a distinct good or service to the customer and is the unit of account in ASC 606. To identify the performance obligations, we considered all of the products or services promised in the contracts with customers, whether explicitly stated or implied based on customary business practices. Revenue is recognized when, or as, each performance obligation is satisfied under terms of the contract. Payment is typically due in full within 30 days of the invoice date.
For ourCrude oil marketing segment. Crude oil marketing activities generate revenues from the sale and delivery of crude oil marketing segment, mostpurchased either directly from producers or on the open market. Most of our crude oil purchase and sale contracts qualify and are designated as non-trading activities, and we consider these contracts as normal purchases and sales activity. For normal purchases and sales, our customers are invoiced monthly based upon contractually agreed upon terms with revenue recognized in the month in which the physical product is delivered to the customer, generally upon delivery of the product to the customer. Revenue is recognized based on the transaction price and the quantity delivered.
The majority of our crude oil sales contracts have multiple distinct performance obligations as the promise to transfer the individual goods (e.g., barrels of crude oil) is separately identifiable from the other goods promised within the contracts. Our performance obligations are satisfied at a point in time. For normal sales arrangements, revenue is recognized in the month in which control of the physical product is transferred to the customer, generally upon delivery of the product to the customer.
For ourTransportation segment. Transportation activities generate revenue from the truck transportation segment, eachof liquid chemicals, pressurized gases, asphalt or dry bulk for customers. Each sales order is associated with our master transportation agreements and is considered a distinct performance obligation. The performance obligations associated with this segment are satisfied over time as the goods and services are delivered.
Pipeline and storage segment. Pipeline and storage activities generate revenue by transporting crude oil on our pipeline and providing storage and terminalling services for our customers. Our operations generally consist of fee-based activities associated with the transportation of crude oil and providing storage and terminalling services for crude oil. Revenues from pipeline tariffs and fees are associated with the transportation of crude oil at a published tariff. We primarily recognize pipeline tariff and fee revenues over time as services are rendered, based on the volumes transported. As is common in the pipeline transportation industry, our tariffs incorporate a loss allowance factor. We recognize the allowance volumes collected as part of the transaction price and record this non-cash consideration at fair value, measured as of the contract inception date.
Storage fees are typically recognized in revenue ratably over the term of the contract regardless of the actual storage capacity utilized as our performance obligation is to make available storage capacity for a period of time. Terminalling fees are recognized as the crude oil enters or exits the terminal and are received from or delivered to the connecting carrier or third-party terminal, as applicable.
See Note 3 in the Notes to the Consolidated Financial Statements for further information.
Item 7A. Quantitative and Qualitative Disclosures aboutAbout Market RiskRisk.
In the normal course of business, we are exposed to certain risks, including changes in interest rates and commodity prices.
Interest Rate Risk
We are exposed to the risk of changes in interest rates. At December 31, 2021, we had no borrowings outstanding under the Credit Agreement. A 10 percent increase or decrease in interest rates as of December 31, 2021 would not have a material impact on our consolidated financial position, results of operations or cash flows.
Commodity Price Risk
Our major market risk exposure is in the pricing applicable to our crude oil marketing segment. Realized pricing is primarily driven by the prevailing spot prices applicable to crude oil. Commodity price risk in our crude oil marketing operations represents the potential loss that may result from a change in the market value of an asset or a commitment. From time to time, we enter into forward contracts to minimize or hedge the impact of market fluctuations on our purchases of crude oil. In each instance, we lock in a separate matching price support contract with a third party in order to minimize the risk of these financial instruments. Substantially all forward contracts fall within a six-month to eighteen-month term with no contracts extending longer than two years in duration.
Certain forward contracts are recorded at fair value, depending on our assessments of numerous accounting standards and positions that comply with GAAP in the U.S. The fair value of these contracts is reflected in the balance sheet as fair value assets and liabilities and any revaluation is recognized on a net basis in our results of operations (see NotesNote 2 and 11Note 13 in the Notes to the Consolidated Financial Statements for further information).
Historically, prices received for crude oil sales have been volatile and unpredictable with price volatility expected to continue. From January 1, 20172020 through December 31, 2018,2021, our crude oil monthly average wholesale purchase costs ranged from ana monthly average low of $43.42$14.37 per barrel to a monthly average high of $74.74$78.62 per barrel during the same period. A hypothetical ten percent additional adverse change in average crude oil prices, assuming no changes in volume levels, would have reduced earnings by approximately $2.3$1.9 million and $1.2$1.9 million for the years ended December 31, 20182021 and 2017,2020, respectively.
Item 8. Financial Statements and Supplementary Data.
ADAMS RESOURCES & ENERGY, INC. AND SUBSIDIARIES
INDEX TO CONSOLIDATED FINANCIAL STATEMENTS
| | | | | |
| Page No. |
ReportsReport of Independent Registered Public Accounting FirmsFirm | |
| |
Consolidated Balance Sheets as of December 31, 20182021 and 20172020 | |
| |
Consolidated Statements of Operations for the Years Ended December 31, 2018, 20172021, 2020 and 20162019 | |
| |
Consolidated Statements of Cash Flows for the Years Ended December 31, 2018, 20172021, 2020 and 20162019 | |
| |
Consolidated Statements of Shareholders’ Equity for the Years Ended December 31, 2018, 20172021, 2020 and 20162019 | |
| |
| Notes to Consolidated Financial Statements | |
| Note 1 – Organization and Basis of Presentation | |
| Note 2 – Summary of Significant Accounting Policies | |
| Note 3 – Revenue Recognition | |
Note 4 – Subsidiary Bankruptcy, Deconsolidation and Sale | |
Note 5 – Prepayments and Other Current Assets | |
| Note 5 – Property and Equipment | |
Note 6 – Property and EquipmentAcquisitions | |
Note 7 – Cash Deposits and Other Assets | |
Note 8 – Investments in Unconsolidated AffiliatesIntangible Assets | |
| Note 9 – Segment Reporting | |
| Note 10 – Transactions with Affiliates | |
| Note 11 – Other Current Liabilities | |
| Note 12 – Credit Agreement | |
| Note 13 – Derivative Instruments and Fair Value Measurements | |
Note 1214 – Income Taxes | |
Note 1315 – Share-BasedStock-Based Compensation Plan | |
Note 1416 – Supplemental Cash Flow Information | |
Note 1517 – Leases | |
| Note 18 – Commitments and Contingencies | |
Note 1619 – Concentration of Credit Risk | |
Note 1720 – Quarterly Financial Information (Unaudited) | |
Note 18 – Oil and Gas Producing Activities (Unaudited) | |
Report of Independent Registered Public Accounting Firm
To the Shareholders and Board of Directors
Adams Resources & Energy, Inc.:
Opinion on the Consolidated Financial Statements
We have audited the accompanying consolidated balance sheets of Adams Resources & Energy, Inc. and subsidiaries (the Company) as of December 31, 20182021 and 2017,2020, the related consolidated statements of operations, shareholders’ equity, and cash flows for each of the years in the two-yearthree-year period ended December 31, 2018,2021, and the related notes (collectively, the consolidated financial statements). In our opinion, the consolidated financial statements present fairly, in all material respects, the financial position of the Company as of December 31, 20182021 and 2017,2020, and the results of its operations and its cash flows for each of the years in the two-yearthree-year period ended December 31, 2018,2021, in conformity with U.S. generally accepted accounting principles.
We also have audited, in accordance with the standards of the Public Company Accounting Oversight Board (United States) (PCAOB), the Company’s internal control over financial reporting as of December 31, 2018,2021, based on criteria established in Internal Control – Integrated Framework (2013) issued by the Committee of Sponsoring Organizations of the Treadway Commission, and our report dated March 8, 20199, 2022 expressed an unqualified opinion on the effectiveness of the Company’s internal control over financial reporting.
Basis for Opinion
These consolidated financial statements are the responsibility of the Company’s management. Our responsibility is to express an opinion on these consolidated financial statements based on our audits. We are a public accounting firm registered with the PCAOB and are required to be independent with respect to the Company in accordance with the U.S. federal securities laws and the applicable rules and regulations of the Securities and Exchange Commission and the PCAOB.
We conducted our audits in accordance with the standards of the PCAOB. Those standards require that we plan and perform the audit to obtain reasonable assurance about whether the consolidated financial statements are free of material misstatement, whether due to error or fraud. Our audits included performing procedures to assess the risks of material misstatement of the consolidated financial statements, whether due to error or fraud, and performing procedures that respond to those risks. Such procedures included examining, on a test basis, evidence regarding the amounts and disclosures in the consolidated financial statements. Our audits also included evaluating the accounting principles used and significant estimates made by management, as well as evaluating the overall presentation of the consolidated financial statements. We believe that our audits provide a reasonable basis for our opinion.
Critical Audit Matter
The critical audit matter communicated below is a matter arising from the current period audit of the consolidated financial statements that was communicated or required to be communicated to the audit committee and that: (1) relates to accounts or disclosures that are material to the consolidated financial statements and (2) involved our especially challenging, subjective, or complex judgments. The communication of a critical audit matter does not alter in any way our opinion on the consolidated financial statements, taken as a whole, and we are not, by communicating the critical audit matter below, providing a separate opinion on the critical audit matter or on the accounts or disclosures to which it relates.
Measurement of accrued liabilities for automobile and workers’ compensation claims
As discussed in Note 18 to the consolidated financial statements, the Company establishes accrued liabilities for automobile and workers’ compensation claims reported plus an estimate for loss development and potential claims that have been incurred but not reported to the Company or its insurance provider. The estimates are based on insurance adjusters’ estimates, historical experience and statistical methods commonly used within the insurance industry. The Company retains a third-party actuary to review its accrued liabilities for such claims. As of December 31, 2021, the accrued liabilities for automobile and workers’ compensation were $4.1 million.
We identified the assessment of the accrued liabilities for automobile and workers’ compensation claims that have been incurred but not reported as a critical audit matter. Specialized skills and knowledge were required to evaluate the Company’s actuarial models and underlying assumptions made by the Company to estimate these accrued liabilities for incurred but not reported claims. Specifically, the accrued liabilities were sensitive to possible changes to the following key underlying assumptions:
•incurred and paid loss development factors used in the determination of the ultimate loss
•initial expected loss rates
•the selection of estimated loss among estimates derived using different methods.
The following are the primary procedures we performed to address this critical audit matter. We evaluated the design and tested the operating effectiveness of certain internal controls related to the Company’s process to estimate accrued liabilities for automobile and workers compensation claims that have been incurred but not reported, including controls related to the development of the key assumptions listed above. In addition, we involved actuarial professionals with specialized skills and knowledge, who assisted in:
•assessing the actuarial models and procedures used by the Company by comparing them to generally accepted actuarial methods and procedures to estimate the ultimate losses
•evaluating the Company’s key assumptions and judgments underlying the Company’s estimate by developing an independent range of the incurred but not reported claims and comparing it against the Company’s recorded amount.
/s/ KPMG LLP
We have served as the Company’s auditor since 2017.
Houston, Texas
March 8, 2019 9, 2022
REPORT OF INDEPENDENT REGISTERED PUBLIC ACCOUNTING FIRM
To the Board of Directors and Stockholders of
Adams Resources & Energy, Inc.
Houston, Texas
We have audited the accompanying consolidated statements of operations, shareholders’ equity, and cash flows of Adams Resources & Energy, Inc. and subsidiaries (the “Company”) for the year ended December 31, 2016. These financial statements are the responsibility of the Company’s management. Our responsibility is to express an opinion on these financial statements based on our audit.
We conducted our audit in accordance with the standards of the Public Company Accounting Oversight Board (United States). Those standards require that we plan and perform the audit to obtain reasonable assurance about whether the financial statements are free of material misstatement. An audit includes examining, on a test basis, evidence supporting the amounts and disclosures in the financial statements. An audit also includes assessing the accounting principles used and significant estimates made by management, as well as evaluating the overall financial statement presentation. We believe that our audit provides a reasonable basis for our opinion.
In our opinion, such consolidated financial statements present fairly, in all material respects, the results of Adams Resources & Energy, Inc. and subsidiaries operations and their cash flows for the year ended December 31, 2016, in conformity with accounting principles generally accepted in the United States of America.
/s/ DELOITTE & TOUCHE LLP
Houston, Texas
March 31, 2017
ADAMS RESOURCES & ENERGY, INC. AND SUBSIDIARIES
CONSOLIDATED BALANCE SHEETS
(In thousands)
| | | | | | | | | | | | | | |
| | December 31, | | |
| | 2018 | | 2017 |
| ASSETS | | | | |
| Current assets: | | | | |
| Cash and cash equivalents | | $ | 117,066 | | $ | 109,393 |
Accounts receivable, net of allowance for doubtful accounts of $153 and $303, respectively | | 85,197 | | 121,353 |
| Accounts receivable – related party | | 425 | | — |
| Inventory | | 22,779 | | 12,192 |
| Derivative assets | | 162 | | 166 |
| Income tax receivable | | 2,404 | | 1,317 |
| Prepayments and other current assets | | 1,557 | | 1,264 |
| Total current assets | | 229,590 | | 245,685 |
| Property and equipment, net | | 44,623 | | 29,362 |
| Investment in unconsolidated affiliate | | — | | 425 |
| Cash deposits and other assets | | 4,657 | | 7,232 |
| Total assets | | $ | 278,870 | | $ | 282,704 |
| | | | |
| LIABILITIES AND SHAREHOLDERS’ EQUITY | | | | |
| Current liabilities: | | | | |
| Accounts payable | | $ | 116,068 | | $ | 124,706 |
| Accounts payable – related party | | 29 | | 5 |
| Derivative liabilities | | 139 | | 145 |
| Current portion of capital lease obligations | | 883 | | 338 |
| Other current liabilities | | 6,148 | | 4,404 |
| Total current liabilities | | 123,267 | | 129,598 |
| Other long-term liabilities: | | | | |
| Asset retirement obligations | | 1,525 | | 1,273 |
| Capital lease obligations | | 3,209 | | 1,351 |
| Deferred taxes and other liabilities | | 4,271 | | 3,363 |
| Total liabilities | | 132,272 | | 135,585 |
| | | | |
| Commitments and contingencies (Note 15) | | | | |
| | | | |
| Shareholders’ equity: | | | | |
Preferred stock – $1.00 par value, 960,000 shares authorized, none outstanding | | — | | — |
Common stock – $0.10 par value, 7,500,000 shares authorized, 4,217,596 shares outstanding | | 422 | | 422 |
| Contributed capital | | 11,948 | | 11,693 |
| Retained earnings | | 134,228 | | 135,004 |
| Total shareholders’ equity | | 146,598 | | 147,119 |
| Total liabilities and shareholders’ equity | | $ | 278,870 | | $ | 282,704 |
| | | | | | | | | | | | | | |
| | December 31, |
| | 2021 | | 2020 |
| ASSETS | | | | |
| Current assets: | | | | |
| Cash and cash equivalents | | $ | 97,825 | | | $ | 39,293 | |
| Restricted cash | | 9,492 | | | 12,772 | |
Accounts receivable, net of allowance for doubtful accounts of $108 and $114, respectively | | 137,789 | | | 99,799 | |
| Accounts receivable – related party | | 2 | | | — | |
| Inventory | | 18,942 | | | 19,336 | |
| Derivative assets | | 347 | | | 61 | |
| Income tax receivable | | 6,424 | | | 13,288 | |
| Prepayments and other current assets | | 2,389 | | | 2,964 | |
| Total current assets | | 273,210 | | | 187,513 | |
| Property and equipment, net | | 88,036 | | | 94,134 | |
| Operating lease right-of-use assets, net | | 7,113 | | | 8,051 | |
| Intangible assets, net | | 3,317 | | | 4,106 | |
| Other assets | | 3,027 | | | 2,383 | |
| Total assets | | $ | 374,703 | | | $ | 296,187 | |
| | | | |
| LIABILITIES AND SHAREHOLDERS’ EQUITY | | | | |
| Current liabilities: | | | | |
| Accounts payable | | $ | 168,224 | | | $ | 85,991 | |
| | | | |
| Derivative liabilities | | 324 | | | 52 | |
| Current portion of finance lease obligations | | 3,663 | | | 4,112 | |
| Current portion of operating lease liabilities | | 2,178 | | | 2,050 | |
| Other current liabilities | | 11,622 | | | 22,343 | |
| Total current liabilities | | 186,011 | | | 114,548 | |
| Other long-term liabilities: | | | | |
| | | | |
| Asset retirement obligations | | 2,376 | | | 2,308 | |
| Finance lease obligations | | 9,672 | | | 11,507 | |
| Operating lease liabilities | | 4,938 | | | 6,000 | |
| Deferred taxes and other liabilities | | 11,320 | | | 12,732 | |
| Total liabilities | | 214,317 | | | 147,095 | |
| | | | |
| Commitments and contingencies (Note 18) | | 0 | | 0 |
| | | | |
| Shareholders’ equity: | | | | |
Preferred stock – $1.00 par value, 960,000 shares authorized, none outstanding | | — | | | — | |
Common stock – $0.10 par value, 7,500,000 shares authorized, 4,355,001 and 4,243,716 shares outstanding, respectively | | 433 | | | 423 | |
| Contributed capital | | 16,913 | | | 13,340 | |
| Retained earnings | | 143,040 | | | 135,329 | |
| Total shareholders’ equity | | 160,386 | | | 149,092 | |
| Total liabilities and shareholders’ equity | | $ | 374,703 | | | $ | 296,187 | |
See Notes to Consolidated Financial Statements.
ADAMS RESOURCES & ENERGY, INC. AND SUBSIDIARIES
CONSOLIDATED STATEMENTS OF OPERATIONS
(In thousands, except per share data)
| | | | | | | | | | | | | | | | | | | | |
| | Year Ended Year Ended December 31, | | | | |
| | 2018 | | 2017 | | 2016 |
| Revenues: | | | | | | |
| Marketing | | $ | 1,694,437 | | $ | 1,267,275 | | $ | 1,043,775 |
| Transportation | | 55,776 | | 53,358 | | 52,355 |
| Oil and natural gas | | — | | 1,427 | | 3,410 |
| Total revenues | | 1,750,213 | | 1,322,060 | | 1,099,540 |
| | | | | | |
| Costs and expenses: | | | | | | |
| Marketing | | 1,681,045 | | 1,247,763 | | 1,016,733 |
| Transportation | | 48,169 | | 48,538 | | 45,154 |
| Oil and natural gas | | — | | 948 | | 2,084 |
| Oil and natural gas property impairments | | — | | 3 | | 313 |
| | | | | | |
| General and administrative | | 8,937 | | 9,707 | | 10,410 |
| Depreciation, depletion and amortization | | 10,654 | | 13,599 | | 18,792 |
| Total costs and expenses | | 1,748,805 | | 1,320,558 | | 1,093,486 |
| | | | | | |
| Operating earnings (losses) | | 1,408 | | 1,502 | | 6,054 |
| | | | | | |
| Other income (expense): | | | | | | |
| Loss on deconsolidation of subsidiary (Note 4) | | — | | (3,505) | | — |
| Impairment of investment in unconsolidated affiliate | | — | | (2,500) | | — |
| | | | | | |
| Interest income | | 2,155 | | 1,103 | | 582 |
| Interest expense | | (109) | | (27) | | (2) |
| Total other income (expense), net | | 2,046 | | (4,929) | | 580 |
| | | | | | |
| (Losses) earnings before income taxes and investment | | | | | | |
| in unconsolidated affiliate | | 3,454 | | (3,427) | | 6,634 |
| | | | | | |
| Income tax (provision) benefit: | | | | | | |
| Current | | 427 | | (895) | | (2,778) |
| Deferred | | (936) | | 3,840 | | 87 |
| Income tax benefit (provision) | | (509) | | 2,945 | | (2,691) |
| | | | | | |
| Earnings (losses) from continuing operations | | 2,945 | | (482) | | 3,943 |
| Losses from investment in unconsolidated affiliate, net of | | | | | | |
| tax benefit of $—, $—, and $770, respectively | | — | | — | | (1,430) |
| Net (losses) earnings | | $ | 2,945 | | $ | (482) | | $ | 2,513 |
| | | | | | |
| Basic earnings (losses) per common share: | | | | | | |
| From continuing operations | | $ | 0.70 | | $ | (0.11) | | $ | 0.94 |
| From investment in unconsolidated affiliate | | — | | — | | $ | (0.34) |
| Basic net (losses) earnings per common share | | $ | 0.70 | | $ | (0.11) | | $ | 0.60 |
| | | | | | |
| Diluted net (losses) earnings per common share | | $ | 0.70 | | $ | (0.11) | | $ | 0.60 |
| | | | | | |
| Dividends per common share | | $ | 0.88 | | $ | 0.88 | | $ | 0.88 |
| | | | | | | | | | | | | | | | | | | | |
| | Year Ended December 31, |
| | 2021 | | 2020 | | 2019 |
| Revenues: | | | | | | |
| Marketing | | $ | 1,930,042 | | | $ | 950,426 | | | $ | 1,748,056 | |
| Transportation | | 94,498 | | | 71,724 | | | 63,191 | |
| Pipeline and storage | | 664 | | | 272 | | | — | |
| Total revenues | | 2,025,204 | | | 1,022,422 | | | 1,811,247 | |
| | | | | | |
| Costs and expenses: | | | | | | |
| Marketing | | 1,898,126 | | | 940,031 | | | 1,723,216 | |
| Transportation | | 75,295 | | | 58,888 | | | 53,392 | |
| Pipeline and storage | | 2,126 | | | 393 | | | — | |
| General and administrative | | 13,701 | | | 10,284 | | | 10,198 | |
| Depreciation and amortization | | 19,797 | | | 18,573 | | | 16,641 | |
| Total costs and expenses | | 2,009,045 | | | 1,028,169 | | | 1,803,447 | |
| | | | | | |
| Operating earnings (losses) | | 16,159 | | | (5,747) | | | 7,800 | |
| | | | | | |
| Other income (expense): | | | | | | |
| Gain on dissolution of investment | | — | | | — | | | 573 | |
| Interest income | | 243 | | | 656 | | | 2,766 | |
| Interest expense | | (746) | | | (444) | | | (636) | |
| Total other income (expense), net | | (503) | | | 212 | | | 2,703 | |
| | | | | | |
| Earnings (Losses) before income taxes | | 15,656 | | | (5,535) | | | 10,503 | |
| | | | | | |
| Income tax (provision) benefit: | | | | | | |
| Current | | (5,169) | | | 12,919 | | | (211) | |
| Deferred | | 1,401 | | | (6,389) | | | (2,085) | |
| Income tax (provision) benefit | | (3,768) | | | 6,530 | | | (2,296) | |
| | | | | | |
| Net earnings | | $ | 11,888 | | | $ | 995 | | | $ | 8,207 | |
| | | | | | |
| Earnings per share: | | | | | | |
| Basic net earnings per common share | | $ | 2.78 | | | $ | 0.23 | | | $ | 1.94 | |
| Diluted net earnings per common share | | $ | 2.75 | | | $ | 0.23 | | | $ | 1.94 | |
| | | | | | |
| Dividends per common share | | $ | 0.96 | | | $ | 0.96 | | | $ | 0.94 | |
See Notes to Consolidated Financial Statements.
ADAMS RESOURCES & ENERGY, INC. AND SUBSIDIARIES
CONSOLIDATED STATEMENTS OF CASH FLOWS
(In thousands)
| | | | | | | | | | | | | | | | | | | | |
| | Year Ended Year Ended December 31, | | | | |
| | 2018 | | 2017 | | 2016 |
| Operating activities: | | | | | | |
| Net (losses) earnings | | $ | 2,945 | | $ | (482) | | $ | 2,513 |
| Adjustments to reconcile net (losses) earnings to net cash | | | | | | |
| provided by operating activities: | | | | | | |
| Depreciation, depletion and amortization | | 10,654 | | 13,599 | | 18,792 |
| Gains on sales of property | | (1,240) | | (594) | | (1,966) |
| Impairment of oil and natural gas properties | | — | | 3 | | 313 |
| Provision for doubtful accounts | | (150) | | 78 | | 19 |
| Share-based compensation expense | | 255 | | — | | — |
| Deferred income taxes | | 936 | | (3,840) | | (857) |
| Net change in fair value contracts | | (2) | | 27 | | (243) |
| Losses from equity investment | | — | | — | | 468 |
| Impairment of investments in unconsolidated affiliates | | — | | 2,500 | | 1,732 |
| Loss on deconsolidation of subsidiary (Note 4) | | — | | 3,505 | | — |
| Changes in assets and liabilities: | | | | | | |
| Accounts receivable | | 36,350 | | (34,935) | | (15,368) |
| Accounts receivable/payable, affiliates | | 24 | | 271 | | — |
| Inventories | | (10,587) | | 878 | | (5,399) |
| Income tax receivable | | (1,087) | | 1,418 | | (148) |
| Prepayments and other current assets | | (293) | | 831 | | 492 |
| Accounts payable | | (10,252) | | 44,790 | | 6,984 |
| Accrued liabilities | | 1,744 | | (991) | | 52 |
| Other | | 1,717 | | (962) | | (440) |
| Net cash provided by operating activities | | 31,014 | | 26,096 | | 6,944 |
| | | | | | |
| Investing activities: | | | | | | |
| Property and equipment additions | | (11,731) | | (2,644) | | (8,484) |
| Asset acquisition | | (10,272) | | — | | — |
| Proceeds from property sales | | 2,038 | | 720 | | 3,706 |
| Proceeds from sales of AREC assets | | — | | 2,775 | | — |
| Investments in unconsolidated affiliates | | — | | — | | (4,700) |
| Insurance and state collateral (deposits) refunds | | 830 | | (1,067) | | 1,710 |
| Net cash used in investing activities | | (19,135) | | (216) | | (7,768) |
| | | | | | |
| Financing activities: | | | | | | |
| Principal repayments of capital lease obligations | | (495) | | (118) | | — |
| Dividends paid on common stock | | (3,711) | | (3,711) | | (3,711) |
| Net cash used in financing activities | | (4,206) | | (3,829) | | (3,711) |
| | | | | | |
| Increase (decrease) in cash and cash equivalents | | 7,673 | | 22,051 | | (4,535) |
| Cash and cash equivalents at beginning of period | | 109,393 | | 87,342 | | 91,877 |
| Cash and cash equivalents at end of period | | $ | 117,066 | | $ | 109,393 | | $ | 87,342 |
| | | | | | | | | | | | | | | | | | | | |
| | Year Ended December 31, |
| | 2021 | | 2020 | | 2019 |
| Operating activities: | | | | | | |
| Net earnings | | $ | 11,888 | | | $ | 995 | | | $ | 8,207 | |
| Adjustments to reconcile net earnings to net cash | | | | | | |
| provided by (used in) operating activities: | | | | | | |
| Depreciation and amortization | | 19,797 | | | 18,573 | | | 16,641 | |
| Gains on sales of property | | (733) | | | (1,859) | | | (1,400) | |
| Provision for doubtful accounts | | (6) | | | (27) | | | (12) | |
| Stock-based compensation expense | | 854 | | | 643 | | | 478 | |
| Deferred income taxes | | (1,401) | | | 6,389 | | | 2,085 | |
| Net change in fair value contracts | | (14) | | | (9) | | | 23 | |
| Gain on dissolution of AREC | | — | | | — | | | (573) | |
| Changes in assets and liabilities: | | | | | | |
| Accounts receivable | | (37,984) | | | (5,162) | | | (8,373) | |
| Accounts receivable/payable, affiliates | | (2) | | | (5) | | | (24) | |
| Inventories | | 394 | | | 4,751 | | | (3,628) | |
| Income tax receivable | | 6,864 | | | (10,719) | | | (165) | |
| Prepayments and other current assets | | 575 | | | (1,401) | | | (2) | |
| Accounts payable | | 82,170 | | | (61,116) | | | 31,795 | |
| Accrued liabilities | | (692) | | | 5,052 | | | 1,154 | |
| Other | | (684) | | | (104) | | | 693 | |
| Net cash provided (used in) by operating activities | | 81,026 | | | (43,999) | | | 46,899 | |
| | | | | | |
| Investing activities: | | | | | | |
| Property and equipment additions | | (12,382) | | | (5,008) | | | (35,743) | |
| Acquisitions | | — | | | (20,200) | | | (5,624) | |
| Proceeds from property sales | | 2,286 | | | 4,515 | | | 3,680 | |
| Proceeds from dissolution of AREC | | — | | | — | | | 998 | |
| Insurance and state collateral (deposits) refunds | | — | | | 1,030 | | | 652 | |
| Net cash used in investing activities | | (10,096) | | | (19,663) | | | (36,037) | |
| | | | | | |
| Financing activities: | | | | | | |
| Borrowings under Credit Agreement | | 8,000 | | | — | | | — | |
| Repayments under Credit Agreement | | (8,000) | | | — | | | — | |
| Principal repayments of finance lease obligations | | (4,367) | | | (2,336) | | | (1,697) | |
| Payment for financed portion of VEX acquisition | | (10,000) | | | — | | | — | |
| Net proceeds from sale of equity | | 2,830 | | | — | | | — | |
| Payment of contingent consideration liability | | — | | | (111) | | | — | |
| Dividends paid on common stock | | (4,141) | | | (4,081) | | | (3,976) | |
| Net cash used in financing activities | | (15,678) | | | (6,528) | | | (5,673) | |
| | | | | | |
Increase (Decrease) in cash and cash equivalents, including restricted cash | | 55,252 | | | (70,190) | | | 5,189 | |
Cash and cash equivalents, including restricted cash, at beginning of period | | 52,065 | | | 122,255 | | | 117,066 | |
Cash and cash equivalents, including restricted cash, at end of period | | $ | 107,317 | | | $ | 52,065 | | | $ | 122,255 | |
See Notes to Consolidated Financial Statements.
ADAMS RESOURCES & ENERGY, INC. AND SUBSIDIARIES
CONSOLIDATED STATEMENTS OF SHAREHOLDERS’ EQUITY
(In thousands)thousands, except per share data)
| | | | | | | | | | | | | | | | | | | | | | | | | | |
| | | | | | | | Total |
| | Common | | Contributed | | Retained | | Shareholders’ |
| | Stock | | Capital | | Earnings | | Equity |
| | | | | | | | |
| Balance, January 1, 2016 | | $ | 422 | | $ | 11,693 | | $ | 140,395 | | $ | 152,510 |
| Net earnings | | — | | — | | 2,513 | | 2,513 |
| Dividends declared: | | | | | | | | |
| Common stock, $0.88/share | | — | | — | | (3,711) | | (3,711) |
| Balance, December 31, 2016 | | 422 | | 11,693 | | 139,197 | | 151,312 |
| Net losses | | — | | — | | (482) | | (482) |
| Dividends declared: | | | | | | | | |
| Common stock, $0.88/share | | — | | — | | (3,711) | | (3,711) |
| Balance, December 31, 2017 | | 422 | | 11,693 | | 135,004 | | 147,119 |
| Net earnings | | — | | — | | 2,945 | | 2,945 |
| Stock-based compensation expense | | — | | 255 | | — | | 255 |
| Dividends declared: | | | | | | | | |
| Common stock, $0.88/share | | — | | — | | (3,711) | | (3,711) |
| Awards under LTIP, $0.44/share | | — | | — | | (10) | | (10) |
| Balance, December 31, 2018 | | $ | 422 | | $ | 11,948 | | $ | 134,228 | | $ | 146,598 |
| | | | | | | | | | | | | | | | | | | | | | | | | | |
| | | | | | | | Total |
| | Common | | Contributed | | Retained | | Shareholders’ |
| | Stock | | Capital | | Earnings | | Equity |
| | | | | | | | |
| Balance, January 1, 2019 | | $ | 422 | | | $ | 11,948 | | | $ | 134,228 | | | $ | 146,598 | |
| Net earnings | | — | | | — | | | 8,207 | | | 8,207 | |
| Stock-based compensation expense | | — | | | 478 | | | — | | | 478 | |
| Issuance of common shares for acquisition | | 1 | | | 391 | | | — | | | 392 | |
| Cancellation of shares withheld to cover | | | | | | | | |
| taxes upon vesting of restricted awards | | — | | | (39) | | | — | | | (39) | |
| Dividends declared: | | | | | | | | |
| Common stock, $0.94 per share | | — | | | — | | | (3,976) | | | (3,976) | |
| Awards under LTIP, $0.94 per share | | — | | | — | | | (19) | | | (19) | |
| Balance, December 31, 2019 | | 423 | | | 12,778 | | | 138,440 | | | 151,641 | |
| Net earnings | | — | | | — | | | 995 | | | 995 | |
| Stock-based compensation expense | | — | | | 643 | | | — | | | 643 | |
| Cancellation of shares withheld to cover | | | | | | | | |
| taxes upon vesting of restricted awards | | — | | | (81) | | | — | | | (81) | |
| Dividends declared: | | | | | | | | |
| Common stock, $0.96 per share | | — | | | — | | | (4,070) | | | (4,070) | |
| Awards under LTIP, $0.96 per share | | — | | | — | | | (36) | | | (36) | |
| Balance, December 31, 2020 | | 423 | | | 13,340 | | | 135,329 | | | 149,092 | |
| Net earnings | | — | | | — | | | 11,888 | | | 11,888 | |
| Stock-based compensation expense | | — | | | 854 | | | — | | | 854 | |
| Shares sold under at-the-market | | | | | | | | |
| offering program | | 9 | | | 2,821 | | | — | | | 2,830 | |
| Vesting of restricted awards | | 1 | | | (1) | | | — | | | — | |
| Cancellation of shares withheld to cover | | | | | | | | |
| taxes upon vesting of restricted awards | | — | | | (101) | | | — | | | (101) | |
| Dividends declared: | | | | | | | | |
| Common stock, $0.96 per share | | — | | | — | | | (4,112) | | | (4,112) | |
| Awards under LTIP, $0.96 per share | | — | | | — | | | (65) | | | (65) | |
| Balance, December 31, 2021 | | $ | 433 | | | $ | 16,913 | | | $ | 143,040 | | | $ | 160,386 | |
See Notes to Consolidated Financial Statements.
ADAMS RESOURCES & ENERGY, INC. AND SUBSIDIARIES
NOTES TO CONSOLIDATED FINANCIAL STATEMENTS
Note 1. Organization and Basis of Presentation
Organization
Adams Resources & Energy, Inc. (“AE”) is a publicly traded Delaware corporation organized in 1973, the common shares of which are listed on the NYSE American LLC under the ticker symbol “AE”. We, throughThrough our subsidiaries, we are primarily engaged in the business of crude oil marketing, transportation, terminalling and storage in various crude oil and natural gas basins in the lower 48 states of the United States (“U.S.”). We also conduct tank truck transportation of liquid chemicals, pressurized gases, asphalt and dry bulk primarily in the lower 48 states of the U.S. with deliveries into Canada and Mexico, and with nineteen terminals in the Gulf Coast region ofacross the U.S. Unless the context requires otherwise, references to “we,” “us,” “our,”“our” or the “Company” or “AE” are intended to mean the business and operations of Adams Resources & Energy, Inc. and its consolidated subsidiaries.
On April 21, 2017, one of our wholly owned subsidiaries, Adams Resources Exploration Corporation (“AREC”), filed a voluntary petitionWe operate and report in the United States Bankruptcy Court for the District of Delaware (the “Bankruptcy Court”) seeking relief under Chapter 11 of Title 11 of the United States Code (the “Bankruptcy Code”), Case No. 17-10866 (KG). AREC operated its business and managed its properties as “debtors-in-possession” under the jurisdiction of the Bankruptcy Court and in accordance with the applicable provisions of the Bankruptcy Code and order of the Bankruptcy Court. AE was the primary creditor in the Chapter 11 process.
On May 3 2017, AREC filed a motion with the Bankruptcy Court for approval of an auction process to sell its assets pursuant to Section 363 of the Bankruptcy Code and for approval to engage an advisor to conduct the auction. The auction commenced on July 19, 2017 to determine the highest or otherwise best bid to acquire all or substantially all of AREC’s assets. During the third quarter of 2017, Bankruptcy Court approval was obtained on three asset purchase and sales agreements with three unaffiliated parties, and AREC closed on the sales of substantially all of its assets (see Note 4 for further information).
As a result of AREC’s voluntary bankruptcy filing in April 2017, we no longer controlled the operations of AREC; therefore, we deconsolidated AREC effective with the bankruptcy filing and recorded our investment in AREC under the cost method (see Note 4 for further information). We obtained approval of a confirmed plan in December 2017, and the case was dismissed in October 2018. Over the past few years, we have de-emphasized our upstream operations and do not expect this Chapter 11 filing by AREC to have a material adverse impact on any of our core businesses.
Historically, we have operated and reported in three business segments: (i) crude oil marketing, transportation and storage,storage; (ii) tank truck transportation of liquid chemicals, pressurized gases, asphalt and dry bulk,bulk; and (iii) upstreampipeline transportation, terminalling and storage of crude oil and natural gas exploration and production. We exited the crude oil and natural gas exploration and production business during 2017 with the sale of our crude oil and natural gas exploration and production assets (seeoil. See Note 49 for further information).information regarding our business segments.
The consolidated financial statements and the accompanying notes are prepared in accordance with U.S. generally accepted accounting principles (“GAAP”) and the rules of the U.S. Securities and Exchange Commission (“SEC”). All significant intercompany transactions and balances have been eliminated in consolidation.
ADAMS RESOURCES & ENERGY, INC. AND SUBSIDIARIES
NOTES TO CONSOLIDATED FINANCIAL STATEMENTS
Use of Estimates
The preparation of our financial statements in conformity with GAAP requires management to use estimates and assumptions that affect the reported amount of assets and liabilities and disclosure of contingent assets and liabilities at the date of the financial statements and the reported amounts of revenues and expenses during the reporting period. We base our estimates and judgments on historical experience and on various other assumptions and information we believe to be reasonable under the circumstances. Estimates and assumptions about future events and their effects cannot be perceived with certainty and, accordingly, these estimates may change as new events occur, as more experience is acquired, as additional information is obtained and as the operating environment changes. While we believe the estimates and assumptions used in the preparation of the consolidated financial statements are appropriate, actual results could differ from those estimates.
Note 2. Summary of Significant Accounting Policies
We adhere to the following significant accounting policies in the preparation of our consolidated financial statements.
Accounts Receivable and Allowance for Doubtful Accounts
Accounts receivable associated with crude oil marketing activities comprise approximately 9087 percent of our total receivables, and industry practice requires payment for these sales to occur within 20 days of the end of the month following a transaction. Our customer makeup, credit policies and the relatively short duration of receivables mitigate the uncertainty typically associated with receivables management. AnWe manage our crude oil marketing receivables by participating in a monthly settlement process with each of our counterparties. Ongoing account balances are monitored monthly, and we reconcile outstanding balances with counterparties. We also place great emphasis on collecting cash balances due.
ADAMS RESOURCES & ENERGY, INC. AND SUBSIDIARIES
NOTES TO CONSOLIDATED FINANCIAL STATEMENTS
We maintain and monitor our allowance for doubtful accounts is provided where appropriate.
accounts. Our allowance for doubtful accounts is determined based on specific identification combined with a review of the general status of the aging of all accounts. We consider the following factors in our review of our allowance for doubtful accounts: (i) historical experience with customers, (ii) the perceived financial stability of customers based on our research, (iii) the levels of credit we grant to customers, and (iv) the duration of the receivable. We may increase the allowance for doubtful accounts in response to the specific identification of customers involved in bankruptcy proceedings and similar financial difficulties. On a routine basis, we review estimates associated with the allowance for doubtful accounts to ensure that we have recorded sufficient reserves to cover potential losses. Customer payments are regularly monitored. However, a degree of risk remains due to the custom and practices of the industry. See Note 1619 for further information regarding credit risk.
The following table presents our allowance for doubtful accounts activity for the periods indicated (in thousands):
| | | December 31, | | | December 31, |
| | 2018 | | 2017 | | 2016 | | 2021 | | 2020 | | 2019 |
| | Balance at beginning of period | Balance at beginning of period | $ | 303 | | $ | 225 | | $ | 206 | Balance at beginning of period | $ | 114 | | | $ | 141 | | | $ | 153 | |
| Charges to costs and expenses | Charges to costs and expenses | 43 | | 137 | | 100 | Charges to costs and expenses | — | | | — | | | 26 | |
| Deductions | Deductions | (193) | | (59) | | (81) | Deductions | (6) | | | (27) | | | (38) | |
| Balance at end of period | Balance at end of period | $ | 153 | | $ | 303 | | $ | 225 | Balance at end of period | $ | 108 | | | $ | 114 | | | $ | 141 | |
Cash, and Cash Equivalents and Restricted Cash
Cash and cash equivalents represent unrestricted cash on hand and highly liquid investments with original maturities of less than three months from the date of purchase. Cash and cash equivalents are maintained with major financial institutions, and deposit amounts may exceed the amount of federally backed insurance provided. While we regularly monitor the financial stability of these institutions, cash and cash equivalents ultimately remain at risk subject to the financial viability of these institutions.
The following table provides a reconciliation of cash and cash equivalents and restricted cash as reported in the consolidated balance sheets that totals to the amounts shown in the consolidated statements of cash flows at the dates indicated (in thousands):
| | | | | | | | | | | | | | |
| | December 31, |
| | 2021 | | 2020 |
| | | | |
| Cash and cash equivalents | | $ | 97,825 | | | $ | 39,293 | |
| Restricted cash: | | | | |
Collateral for outstanding letters of credit (1) | | — | | | 5,144 | |
Captive insurance subsidiary (2) | | 9,492 | | | 7,628 | |
| Total cash, cash equivalents and restricted cash shown in the | | | | |
| consolidated statements of cash flows | | $ | 107,317 | | | $ | 52,065 | |
_______________
(1)Represents amounts that were previously held in a segregated bank account by Wells Fargo as collateral for outstanding letters of credit. Effective with our entry into the credit agreement (see Note 12), letters of credit are now secured under the credit agreement.
(2)$1.5 million of the restricted cash balance relates to the initial capitalization of our captive insurance company formed in late 2020, and the remainder represents amounts paid to our captive insurance company for insurance premiums.
ADAMS RESOURCES & ENERGY, INC. AND SUBSIDIARIES
NOTES TO CONSOLIDATED FINANCIAL STATEMENTS
Common Shares Outstanding
The following table reconciles our outstanding common stock for the periods indicated:
| | | | | | | | |
| | Common |
| | shares |
| | |
| Balance, January 1, 2019 | | 4,217,596 | |
| Issuance of shares in acquisition (see Note 6) | | 11,145 | |
| Vesting of restricted stock unit awards (see Note 15) | | 7,604 | |
| Shares withheld to cover taxes upon vesting of restricted stock unit awards | | (883) | |
| Other | | 71 | |
| Balance, December 31, 2019 | | 4,235,533 | |
| Vesting of restricted stock unit awards (see Note 15) | | 10,290 | |
| Shares withheld to cover taxes upon vesting of restricted stock unit awards | | (2,107) | |
| Balance, December 31, 2020 | | 4,243,716 | |
| Vesting of restricted stock unit awards (see Note 15) | | 14,244 | |
| Vesting of performance share unit awards (see Note 15) | | 2,461 | |
| Shares withheld to cover taxes upon vesting of equity awards | | (3,043) | |
| Shares sold under at-the-market offering program | | 97,623 | |
| Balance, December 31, 2021 | | 4,355,001 | |
Derivative Instruments
In the normal course of our operations, our crude oil marketing segment purchases and sells crude oil. We seek to profit by procuring the commodity as it is produced and then delivering the product to the end users or the intermediate use marketplace. As typical for the industry, these transactions are made pursuant to the terms of forward month commodity purchase and/or sale contracts. Some of these contracts meet the definition of a derivative instrument, and therefore, we account for these contracts at fair value, unless the normal purchase and sale exception is applicable. These types of underlying contracts are standard for the industry and are the governing document for our crude oil marketing segment. None of our derivative instruments have been designated as hedging instruments.
Earnings Per Share
Basic earnings (losses) per share is computed by dividing our net earnings (losses) by the weighted average number of shares of common stock outstanding during the period. Diluted earnings (losses) per share is computed by giving effect to all potential shares of common stock outstanding, including our stock related to unvested restricted stock unit awards. Unvested restricted stock unit awards granted under the Adams Resources & Energy, Inc. 2018 Long-Term Incentive Plan (“2018 LTIP”) are not considered to be participating securities as the holders of these shares do not have non-forfeitable dividend rights in the event of our declaration of a dividend for common shares (see Note 1315 for further discussion).
A reconciliation of the calculation of basic and diluted earnings (losses) per share is as follows (in thousands, except per share data):
| | | | | | | | | | | | | | | | | |
| Year Ended December 31, | | | | |
| 2018 | | 2017 | | 2016 |
Earnings (losses) per share – numerator: | | | | | |
| Earnings (losses) from continuing operations | $ | 2,945 | | $ | (482) | | $ | 3,943 |
| Losses from investment in unconsolidated affiliate, net of tax | — | | — | | (1,430) |
| Net (losses) earnings | $ | 2,945 | | $ | (482) | | $ | 2,513 |
| | | | | |
| Denominator: | | | | | |
| Basic weighted average number of shares outstanding | 4,218 | | 4,218 | | 4,218 |
| | | | | |
| Basic earnings (losses) per share: | | | | | |
| From continuing operations | $ | 0.70 | | $ | (0.11) | | $ | 0.94 |
| From investment in unconsolidated affiliate | — | | — | | (0.34) |
| Basic earnings (losses) per share | $ | 0.70 | | $ | (0.11) | | $ | 0.60 |
| | | | | |
| Diluted earnings (losses) per share: | | | | | |
| | | | | |
| Diluted weighted average number of shares outstanding: | | | | | |
| Common shares | 4,218 | | 4,218 | | 4,218 |
Restricted stock unit awards (1) | — | | — | | — |
Performance share unit awards (2) | — | | — | | — |
| Total | 4,218 | | 4,218 | | 4,218 |
| | | | | |
| Diluted earnings (losses) per share: | | | | | |
| From continuing operations | $ | 0.70 | | $ | (0.11) | | $ | 0.94 |
| From investment in unconsolidated affiliate | — | | — | | (0.34) |
| Diluted earnings (losses) per share | $ | 0.70 | | $ | (0.11) | | $ | 0.60 |
________________________
(1) The dilutive effect of restricted stock unit awards for the year ended December 31, 2018 is de minimis.
(2) The dilutive effect of performance share awards will be included in the calculation of diluted earnings per share when the performance share award performance conditions have been achieved.
ADAMS RESOURCES & ENERGY, INC. AND SUBSIDIARIES
NOTES TO CONSOLIDATED FINANCIAL STATEMENTS
A reconciliation of the calculation of basic and diluted earnings per share was as follows for the periods indicated (in thousands, except per share data):
| | | | | | | | | | | | | | | | | |
| Year Ended December 31, |
| 2021 | | 2020 | | 2019 |
Earnings per share – numerator: | | | | | |
| Net earnings | $ | 11,888 | | | $ | 995 | | | $ | 8,207 | |
| | | | | |
| Denominator: | | | | | |
| Basic weighted average number of shares outstanding | 4,283 | | | 4,240 | | | 4,228 | |
| Basic earnings per share | $ | 2.78 | | | $ | 0.23 | | | $ | 1.94 | |
| | | | | |
| Diluted earnings per share: | | | | | |
| | | | | |
| Diluted weighted average number of shares outstanding: | | | | | |
| Common shares | 4,283 | | | 4,240 | | | 4,228 | |
| Restricted stock unit awards | 23 | | | 11 | | | 5 | |
Performance share unit awards (1) | 17 | | | 3 | | | — | |
| Total | 4,323 | | | 4,254 | | | 4,233 | |
| | | | | |
| Diluted earnings per share | $ | 2.75 | | | $ | 0.23 | | | $ | 1.94 | |
_______________
(1)The dilutive effect of performance share awards are included in the calculation of diluted earnings per share when the performance share award performance conditions have been achieved. The performance conditions for the performance share unit awards granted in 2019, 2020 and 2021 were achieved as of December 31, 2019, 2020 and 2021, respectively. For the year ended December 31, 2019, the effects of the performance share awards on earning per share were anti-dilutive.
Employee Benefits
We maintain a 401(k) savings plan for the benefit of our employees. We do not maintain any other pension or retirement plans. Our 401(k) plan contributory expenses were as follows for the periods indicated (in thousands):
| | | | | | | | | | | | | | | | | |
| Year Ended December 31, | | | | |
| 2018 | | 2017 | | 2016 |
| | | | | |
| Contributory expenses | $ | 808 | | $ | 734 | | $ | 757 |
| | | | | | | | | | | | | | | | | |
| Year Ended December 31, |
| 2021 | | 2020 | | 2019 |
| | | | | |
| Contributory expenses | $ | 1,159 | | | $ | 1,100 | | | $ | 1,117 | |
Equity At-The-Market Offerings
During the year ended December 31, 2021, we received net proceeds of approximately $2.8 million (net of offering costs to B. Riley Securities, Inc. of $0.1 million) from the sale of 97,623 of our common shares at an average price per share of approximately $30.70 in at-the-market offerings under our At Market Issuance Sales Agreement with B. Riley Securities, Inc. dated December 23, 2020.
Fair Value Measurements
The carrying amounts reported in the consolidated balance sheets for cash and cash equivalents, accounts receivable and accounts payable approximates fair value because of the immediate or short-term maturity of these financial instruments. Marketable securities are recorded at fair value based on market quotations from actively traded liquid markets.
ADAMS RESOURCES & ENERGY, INC. AND SUBSIDIARIES
NOTES TO CONSOLIDATED FINANCIAL STATEMENTS
Our fair value estimates are based on either (i) actual market data or (ii) assumptions that other market participants would use in pricing an asset or liability, including estimates of risk, in the principal market of the asset or liability at a specified measurement date. Recognized valuation techniques employ inputs such as contractual prices, quoted market prices or rates, operating costs, discount factors and business growth rates. These inputs may be either readily observable, corroborated by market data or generally unobservable. In developing our estimates of fair value, we endeavor to utilize the best information available and apply market-based data to the highest extent possible. Accordingly, we utilize valuation techniques (such as the market approach) that maximize the use of observable inputs and minimize the use of unobservable inputs.
A three-tier hierarchy has been established that classifies fair value amounts recognized in the financial statements based on the observability of inputs used to estimate such fair values. The hierarchy considers fair value amounts based on observable inputs (Levels 1 and 2) to be more reliable and predictable than those based primarily on unobservable inputs (Level 3). At each balance sheet reporting date, we categorize our financial assets and liabilities using this hierarchy.
The characteristics of the fair value amounts classified within each level of the hierarchy are described as follows:
•Level 1 fair values are based on quoted prices, which are available in active markets for identical assets or liabilities as of the measurement date. Active markets are defined as those in which transactions for identical assets or liabilities occur with sufficient frequency so as to provide pricing information on an ongoing basis. For Level 1 valuation of marketable securities, we utilize market quotations provided by our primary financial institution. For the valuations of derivative financial instruments, we utilize the New York Mercantile Exchange (“NYMEX”) for certain commodity valuations.
•Level 2 fair values are based on (a) quoted prices for similar assets or liabilities in active markets, (b) quoted prices for identical assets or liabilities but in markets that are not actively traded or in which little information is released to the public, (c) observable inputs other than quoted prices, and (d) inputs derived from observable market data. Source data for Level 2 inputs include information provided by the NYMEX, published price data and indices, third party price survey data and broker provided forward price statistics.
•Level 3 fair values are based on unobservable market data inputs for assets or liabilities.
See Note 6 for a discussion of the Level 3 inputs used in the determination of the fair value of the intangible assets acquired in asset acquisitions.
Fair value contracts consist of derivative financial instruments and are recorded as either an asset or liability measured at its fair value. Changes in fair value are recognized immediately in earnings unless the derivatives qualify for, and we elect, cash flow hedge accounting. We had no contracts designated for hedge accounting during any of the current reporting periods (see Note 1113 for further information).
ADAMS RESOURCES & ENERGY, INC. AND SUBSIDIARIES
NOTES TO CONSOLIDATED FINANCIAL STATEMENTS
Fair value estimates are based on assumptions that market participants would use when pricing an asset or liability, and we use a fair value hierarchy of three levels that prioritizes the information used to develop those assumptions. Currently, for all items presented herein, we utilize a market approach to valuing our contracts. On a contract by contract, forward month by forward month basis, we obtain observable market data for valuing our contracts. The fair value hierarchy gives the highest priority to quoted prices in active markets and the lowest priority to unobservable data.
ADAMS RESOURCES & ENERGY, INC. AND SUBSIDIARIES
NOTES TO CONSOLIDATED FINANCIAL STATEMENTS
Impairment Testing for Long-Lived Assets
Long-lived assets (primarily property and equipment)equipment and intangible assets) are reviewed for impairment when events or changes in circumstances indicate that the carrying amount of these assets may not be recoverable. Long-lived assets with carrying values that are not expected to be recovered through future cash flows are written-down to their estimated fair values. The carrying value of a long-lived asset is deemed not recoverable if it exceeds the sum of undiscounted cash flows expected to result from the use and eventual disposition of the asset. If the asset’s carrying value exceeds the sum of its undiscounted cash flows, a non-cash asset impairment charge equal to the excess of the asset’s carrying value over its estimated fair value is recorded. Fair value is defined as the price that would be received to sell an asset or be paid to transfer a liability in an orderly transaction between market participants at a specified measurement date. We measure fair value using market price indicators or, in the absence of such data, appropriate valuation techniques. See Note 11 for information regarding impairment charges related to long-lived assets.
Income Taxes
Income taxes are accounted for using the asset and liability method. Under this approach, deferred tax assets and liabilities are recognized based on anticipated future tax consequences attributable to differences between financial statement carrying amounts of such items and their respective tax basis (see Note 1214 for further information). On December 22, 2017, the Tax Cut and Jobs Act was enacted into law resulting in a reduction in the federal corporate income tax rate from 35 percent to 21 percent for years beginning in 2018, which impacts our income tax provision or benefit.
We are subject to income taxes in the U.S. and numerous states. We record uncertain tax positions on the basis of a two-step process in which (1) we determine whether it is more-likely-than-not the tax positions will be sustained on the basis of technical merits of the position and (2) for those tax positions meeting the more-likely-than-not recognition threshold, we recognize the largest amount of tax benefit that is more than 50 percent likely to be realized upon ultimate settlement with the related tax authority.
Interest and penalties related to income taxes are included in the benefit (provision) for income taxes in our consolidated statements of operations.
On March 27, 2020, the Coronavirus Aid, Relief, and Economic Security Act (“CARES Act”) was enacted and signed into law in response to the COVID-19 pandemic. The CARES Act, among other things, permits net operating losses (“NOL”) incurred in tax years 2018, 2019 and 2020 to offset 100 percent of taxable income and be carried back to each of the five preceding taxable years to generate a refund of previously paid income taxes.
We have determined that the NOL carryback provision in the CARES Act would result in a cash benefit to us for the fiscal years 2018, 2019 and 2020. We carried back our NOL for fiscal year 2018 to 2013, and in June 2020, we received a cash refund of approximately $2.7 million. We also carried back our NOL for the fiscal year 2019 to 2014, and in April 2021, we received a cash refund of approximately $3.7 million. We have an income tax receivable at December 31, 2021 of approximately $6.8 million for the benefit of carrying back our NOL for the fiscal year 2020 to 2015 and 2016. As we are carrying the losses back to years beginning before January 1, 2018, the receivables were recorded at the previous 35 percent federal tax rate rather than the current statutory rate of 21 percent.
ADAMS RESOURCES & ENERGY, INC. AND SUBSIDIARIES
NOTES TO CONSOLIDATED FINANCIAL STATEMENTS
Inventory, and Linefill and Base Gas
Inventory consists of crude oil held in storage tanks and at third-party pipelines as part of our crude oil marketing and pipeline and storage operations. Crude oil inventory is carried at the lower of cost or net realizable value. At the end of each reporting period, we assess the carrying value of our inventory and make adjustments necessary to reduce the carrying value to the applicable net realizable value. Any resulting adjustments are a component of marketing costs and expenses or pipeline and storage expenses on our consolidated statements of operations. During the year ended December 31, 2018,2020, we recorded a charge of $5.4$24.2 million related to the write-down of our crude oil inventory in our crude oil marketing segment due to declines in prices.prices in 2020. There were no0 charges recognized during the years ended December 31, 20172021 and 2016. 2019.
LetterLinefill and base gas in assets we own are recorded at historical cost and consist of Credit Facilitycrude oil. We classify as linefill or base gas our proportionate share of barrels used to fill a pipeline that we own and barrels that represent the minimum working requirements in storage tanks that we own. These crude oil barrels are not considered to be available for sale because the volumes must be maintained in order to continue normal operation of the related pipeline or tanks. Linefill and base gas are reviewed for impairment when events or changes in circumstances indicate that the carrying amount of these assets may not be recoverable. Linefill and base gas are included in “Property and equipment” on our Consolidated Balance Sheets. See Note 5 for additional information regarding linefill and base gas.
Investment in Unconsolidated Affiliate
We maintainown an approximate 15 percent equity interest (less than 3 percent voting interest) in VestaCare, Inc., a CreditCalifornia corporation (“VestaCare”), which we purchased for a $2.5 million cash payment in 2016. VestaCare provides an array of software as a service (SaaS) electronic payment technologies to medical providers, payers and Security Agreement with Wells Fargo Bank, National Associationpatients including VestaCare’s product offering, VestaPay™. VestaPay™ allows medical care providers to providestructure fully automated and dynamically updating electronic payment plans for their patients. We account for this investment under the issuancecost method of upaccounting. During 2017, we reviewed our investment in VestaCare and determined that the current projected operating results did not support the carrying value of the investment. As a result, during 2017, we recognized an impairment charge of $2.5 million to $60 millionwrite-off our investment in stand-by letters of credit primarily usedVestaCare. At December 31, 2021, we continue to support crude oil purchases within our crude oil marketing segment and for other purposes. We are currently using the letter of credit facility for letters of credit related to our insurance program. This facility is collateralized by the eligible accounts receivable within the crude oil marketing segment and expires on August 30, 2019.own an approximate 15 percent equity interest in VestaCare.
ADAMS RESOURCES & ENERGY, INC. AND SUBSIDIARIES
NOTES TO CONSOLIDATED FINANCIAL STATEMENTS
The issued stand-by letters of credit are canceled as the underlying purchase obligations are satisfied by cash payment when due. The letter of credit facility places certain restrictions on GulfMark Energy, Inc., one of our wholly owned subsidiaries. These restrictions include the maintenance of positive net earnings excluding inventory valuation changes, as defined, among other restrictions. We are currently in compliance with all such financial covenants. However, per the terms of our letter of credit agreement, we were in default of certain nonfinancial covenants at December 31, 2018, and we obtained a waiver whereby the creditor will not exercise any of its rights or remedies. At December 31, 2018 and 2017, we had $4.6 million and $2.2 million, respectively, of letters of credit outstanding under this facility.
Property and Equipment
Property and equipment is recorded at cost. Expenditures for additions, improvements and other enhancements to property and equipment are capitalized, and minor replacements, maintenance and repairs that do not extend asset life or add value are charged to expense as incurred. When property and equipment assets are retired or otherwise disposed of, the related cost and accumulated depreciation is removed from the accounts and any resulting gain or loss is included in results of operations in operating costs and expenses for the respective period. Property and equipment, except for land, is depreciated using the straight-line method over the estimated average useful lives of two to thirty-nine years.
We capitalize interest costs, if any, incurred in connection with major capital expenditures while the asset is in its construction phase. The capitalized interest is recorded as part of the asset to which it relates and is amortized over the asset’s estimated useful life as a component of depreciation expense. When capitalized interest is recorded, it reduces interest expense.
Asset retirement obligations (“AROs”) are legal obligations associated with the retirement of tangible long-lived assets that result from their acquisition, construction, development and/or normal operation. When an ARO is incurred, we record a liability for the ARO and capitalize an equal amount as an increase in the carrying value of the related long-lived asset. ARO amounts are measured at their estimated fair value using expected present value techniques. Over time, the ARO liability is accreted to its present value (through accretion expense), and the capitalized amount is depreciated over the remaining useful life of the related long-lived asset. We will incur a gain or loss to the extent that our ARO liabilities are not settled at their recorded amounts.
See Note 65 for additional information regarding our property and equipment and AROs.
Recent Accounting Pronouncements
Lease accounting standard. In February 2016, the Financial Accounting Standards Board issued Accounting Standards Codification (“ASC”) 842, Leases (“ASC 842”), which requires substantially all leases to be recorded on the balance sheet. We adopted the new standard on January 1, 2019 and expect to apply it to all existing lease contracts as of January 1, 2019. We also plan to apply it to all new leases entered into after January 1, 2019. ASC 842 supersedes existing lease accounting guidance under ASC 840, Leases (“ASC 840”).
We expect to adopt the new standard using the modified retrospective approach and apply certain optional transitional practical expedients. We elected an optional transition method that allowed application of the new standard at the adoption date and the recognition of a cumulative-effect adjustment to the opening balance of retained earnings in the period of adoption with no adjustment to previously reported results. In accordance with this approach, our consolidated financial statements for periods prior to January 1, 2019 will not be revised to reflect the new lease accounting guidance. We also elected the package of practical expedients permitted under the transition guidance within the new standard, which among other things, allowed the carry forward of historical lease classification. We did not elect the practical expedient related to hindsight.
ADAMS RESOURCES & ENERGY, INC. AND SUBSIDIARIES
NOTES TO CONSOLIDATED FINANCIAL STATEMENTS
ASC 842 will result in changes to the way our operating leases are recorded, presented and disclosed in our consolidated financial statements. Upon adoption of ASC 842 on January 1, 2019, we expect to recognize a right-of-use (“ROU”) asset and a corresponding lease liability based on the present value of then existing operating lease obligations. In addition, there are several key accounting policy elections that we will make upon adoption of ASC 842 including:
•We will not recognize ROU assets and lease liabilities for short-term leases and will instead record them in a manner similar to operating leases under ASC 840 lease accounting guidelines. A short term lease is one with a maximum lease term of 12 months or less and does not include a purchase option or renewal option the lessee is reasonably certain to exercise.
•We will also elect the non-lease component for any asset class where lease and non-lease components are comingled and the non-lease component is determined to be insignificant when compared to the lease component.
Upon adoption of this new guidance, we expect to recognize a ROU asset and lease liability for operating leases of approximately $11.4 million on our consolidated balance sheet based upon discounted amounts on January 1, 2019.
Stock-Based Compensation
We measure all share-based payment awards, including the issuance of restricted stock unitsunit awards and performance share unitsunit awards to employees and board members, using a fair-value based method. The cost of services received from employees and non-employee board members in exchange for awards of equity instruments is recognized in the consolidated statementstatements of operations based on the estimated fair value of those awards on the grant date and is amortized on a straight-line basis over the requisite service period. The fair value of restricted stock unit awards and performance share unit awards is based on the closing price of our common stock on the grant date. We account for forfeitures as they occur. See Note 1315 for additional information regarding our 2018 LTIP.
Note 3. Revenue Recognition
Adoption of ASC 606
On January 1, 2018, we adopted ASCWe account for our revenues under Accounting Standards Codification (“ASC”) 606, Revenue from Contracts with Customers(“. ASC 606”) and all related Accounting Standards Updates by applying the modified retrospective method to all contracts that were not completed on January 1, 2018. The modified retrospective approach required us to recognize the cumulative effect of initially applying the new standard as an adjustment to the opening balance of retained earnings on January 1, 2018. Comparative information has not been restated and continues to be reported under the historical accounting standards in effect for those periods. The adoption of the new revenue standard did not result in a cumulative effect adjustment to our retained earnings since there was no significant impact upon adoption of the new standard. There was also no material impact to revenues, or any other financial statement line items for the year ended December 31, 2018 as a result of applying ASC 606. We expect the impact of the adoption of ASC 606 to remain immaterial to our net earnings on an ongoing basis.
Revenue Recognition
The new revenue standard’s606’s core principle is that a company will recognize revenue when it transfers promised goods or services to customers in an amount that reflects the consideration to which the company expects to be entitled in exchange for those goods or services. The new revenue standardASC 606 requires entities to recognize revenue through the application of a five-step model, which includes: identification of the contract; identification of the performance obligations; determination of the transaction price; allocation of the transaction price to the performance obligations; and recognition of revenue as the entity satisfies the performance obligations.
ADAMS RESOURCES & ENERGY, INC. AND SUBSIDIARIES
NOTES TO CONSOLIDATED FINANCIAL STATEMENTS
Our revenues are primarily generated from the marketing, transportation, storage and storageterminalling of crude oil and other related products and the tank truck transportation of liquid chemicals, pressurized gases, asphalt and dry bulk. A performance obligation is a promise in a contract to transfer a distinct good or service to the customer and is the unit of account in ASC 606. To identify the performance obligations, we considered all of the products or services promised in the contracts with customers, whether explicitly stated or implied based on customary business practices. Revenue is recognized when, or as, each performance obligation is satisfied under terms of the contract. Payment is typically due in full within 30 days of the invoice date.
ForThe following information describes the nature of our significant revenue streams by segment and type:
Crude oil marketing segment. Crude oil marketing activities generate revenues from the sale and delivery of crude oil marketing segment, mostpurchased either directly from producers or on the open market. Most of our crude oil purchase and sale contracts qualify and are designated as non-trading activities, and we consider these contracts as normal purchases and sales activity. For normal purchases and sales, our customers are invoiced monthly based upon contractually agreed upon terms with revenue recognized in the month in which the physical product is delivered to the customer, generally upon delivery of the product to the customer. Revenue is recognized based on the transaction price and the quantity delivered.
The majority of our crude oil sales contracts have multiple distinct performance obligations as the promise to transfer the individual goods (e.g., barrels of crude oil) is separately identifiable from the other goods promised within the contracts. Our performance obligations are satisfied at a point in time. For normal sales arrangements, revenue is recognized in the month in which control of the physical product is transferred to the customer, generally upon delivery of the product to the customer.
For ourTransportation segment. Transportation activities generate revenue from the truck transportation segment, eachof liquid chemicals, pressurized gases, asphalt or dry bulk from point A to point B for customers. Each sales order is associated with our master transportation agreements and is considered a distinct performance obligation. The performance obligations associated with this segment are satisfied over time as the goods and services are delivered.
Practical Expedients
In connection with our adoption of ASC 606, we reviewed our revenue contracts for impact upon adoption. For example, our revenue contracts often include promises to transfer various goods and services to a customer. Determining whether goods and services are considered distinct performance obligations that should be accounted for separately versus together will continue to require continual assessment. We also used practical expedients permitted by ASC 606 when applicable. These practical expedients included:
•Applying the new guidance only to contracts that were not completed as of January 1, 2018; and
•
ADAMS RESOURCES & ENERGY, INC. AND SUBSIDIARIES
NOTES TO CONSOLIDATED FINANCIAL STATEMENTS
Pipeline and storage segment. Pipeline and storage activities generate revenue by transporting crude oil on our pipeline and providing storage and terminalling services for our customers. Our operations generally consist of fee-based activities associated with the transportation of crude oil and providing storage and terminalling services for crude oil. Revenues from pipeline tariffs and fees are associated with the transportation of crude oil at a published tariff. We primarily recognize pipeline tariff and fee revenues over time as services are rendered, based on the volumes transported. As is common in the pipeline transportation industry, our tariffs incorporate a loss allowance factor. We recognize the allowance volumes collected as part of the transaction price and record this non-cash consideration at fair value, measured as of the contract inception date.
Storage fees are typically recognized in revenue ratably over the term of the contract regardless of the actual storage capacity utilized as our performance obligation is to make available storage capacity for a period of time. Terminalling fees are recognized as the crude oil enters or exits the terminal and is received from or delivered to the connecting carrier or third-party terminal, as applicable.
Contract Balances
The timing of revenue recognition, billings and cash collections results in billed accounts receivable and customer advances and deposits (contract liabilities) on our consolidated balance sheet.sheets. Currently, we do not record any contract assets in our financial statements due to the timing of revenue recognized and when our customers are billed. Our crude oil marketing customers are generally billed monthly based on contractually agreed upon terms. However, we sometimes receive advances or deposits from customers before revenue is recognized, resulting in contract liabilities. These contract assets and liabilities, if any, are reported on our consolidated balance sheets at the end of each reporting period.
ADAMS RESOURCES & ENERGY, INC. AND SUBSIDIARIES
NOTES TO CONSOLIDATED FINANCIAL STATEMENTS
Revenue Disaggregation
The following table disaggregates our revenue by segment and by major source for the periodperiods indicated (in thousands):
| | | Year Ended December 31, 2018 | | | Reporting Segments | |
| | Reporting Segments | | | | Crude Oil Marketing | | Transportation | | Pipeline and storage (1) | | Total |
| | Marketing | | Transportation | | Total | | | | | | | | |
| | Year Ended December 31, 2021 | | Year Ended December 31, 2021 | |
| Revenues from contracts with customers | Revenues from contracts with customers | $ | 1,580,997 | | $ | 55,776 | | $ | 1,636,773 | Revenues from contracts with customers | $ | 1,898,160 | | | $ | 94,498 | | | $ | 664 | | | $ | 1,993,322 | |
Other (1) | 113,440 | | — | | 113,440 | |
Other (2) | | Other (2) | 31,882 | | | — | | | — | | | 31,882 | |
| Total revenues | Total revenues | $ | 1,694,437 | | $ | 55,776 | | $ | 1,750,213 | Total revenues | $ | 1,930,042 | | | $ | 94,498 | | | $ | 664 | | | $ | 2,025,204 | |
| | Timing of revenue recognition: | Timing of revenue recognition: | | Timing of revenue recognition: | |
| Goods transferred at a point in time | Goods transferred at a point in time | $ | 1,580,997 | | $ | — | | $ | 1,580,997 | Goods transferred at a point in time | $ | 1,898,160 | | | $ | — | | | $ | — | | | $ | 1,898,160 | |
| Services transferred over time | Services transferred over time | — | | 55,776 | | 55,776 | Services transferred over time | — | | | 94,498 | | | 664 | | | 95,162 | |
| Total revenues from contracts with customers | Total revenues from contracts with customers | $ | 1,580,997 | | $ | 55,776 | | $ | 1,636,773 | Total revenues from contracts with customers | $ | 1,898,160 | | | $ | 94,498 | | | $ | 664 | | | $ | 1,993,322 | |
| | Year Ended December 31, 2020 | | Year Ended December 31, 2020 | |
| Revenues from contracts with customers | | Revenues from contracts with customers | $ | 915,438 | | | $ | 71,724 | | | $ | 272 | | | $ | 987,434 | |
Other (2) | | Other (2) | 34,988 | | | — | | | — | | | 34,988 | |
| Total revenues | | Total revenues | $ | 950,426 | | | $ | 71,724 | | | $ | 272 | | | $ | 1,022,422 | |
| | Timing of revenue recognition: | | Timing of revenue recognition: | |
| Goods transferred at a point in time | | Goods transferred at a point in time | $ | 915,438 | | | $ | — | | | $ | — | | | $ | 915,438 | |
| Services transferred over time | | Services transferred over time | — | | | 71,724 | | | 272 | | | 71,996 | |
| Total revenues from contracts with customers | | Total revenues from contracts with customers | $ | 915,438 | | | $ | 71,724 | | | $ | 272 | | | $ | 987,434 | |
| | Year Ended December 31, 2019 | | Year Ended December 31, 2019 | |
| Revenues from contracts with customers | | Revenues from contracts with customers | $ | 1,555,393 | | | $ | 63,191 | | | $ | — | | | $ | 1,618,584 | |
Other (2) | | Other (2) | 192,663 | | | — | | | — | | | 192,663 | |
| Total revenues | | Total revenues | $ | 1,748,056 | | | $ | 63,191 | | | $ | — | | | $ | 1,811,247 | |
| | Timing of revenue recognition: | | Timing of revenue recognition: | |
| Goods transferred at a point in time | | Goods transferred at a point in time | $ | 1,555,393 | | | $ | — | | | $ | — | | | $ | 1,555,393 | |
| Services transferred over time | | Services transferred over time | — | | | 63,191 | | | — | | | 63,191 | |
| Total revenues from contracts with customers | | Total revenues from contracts with customers | $ | 1,555,393 | | | $ | 63,191 | | | $ | — | | | $ | 1,618,584 | |
_______________
(1)On October 22, 2020, we acquired a crude oil pipeline and related terminal facility assets, resulting in a new operating segment. See Note 6 and Note 9 for further information.
(2)Other crude oil marketing revenues are recognized under ASC 815, Derivatives and Hedging, and ASC 845, Nonmonetary Transactions – Purchases and Sales of Inventory with the Same Counterparty.
Other Crude Oil Marketing Revenue
Certain of the commodity purchase and sale contracts utilized by our crude oil marketing segment qualify as derivative instruments with certain specifically identified contracts also designated as trading activity. From the time of contract origination, these contracts are marked-to-market and recorded on a net revenue basis in the accompanying consolidated financial statements.
ADAMS RESOURCES & ENERGY, INC. AND SUBSIDIARIES
NOTES TO CONSOLIDATED FINANCIAL STATEMENTS
Certain of our crude oil contracts may be with a single counterparty to provide for similar quantities of crude oil to be bought and sold at different locations. These contracts are entered into for a variety of reasons, including effecting the transportation of the commodity, to minimize credit exposure, and/or to meet the competitive demands of the customer. These buy/sell arrangements are reflected on a net revenue basis in the accompanying consolidated financial statements.
Reporting these crude oil contracts on a gross revenue basis would increase our reported revenues as follows for the periods indicated (in thousands):
| | | | | | | | | | | | | | | | | |
| Year Ended December 31, | | | | |
| 2018 | | 2017 | | 2016 |
| | | | | |
| Revenue gross-up | $ | 448,846 | | $ | 203,095 | | $ | 314,270 |
| | | | | | | | | | | | | | | | | |
| Year Ended December 31, |
| 2021 | | 2020 | | 2019 |
| | | | | |
| Revenue gross-up | $ | 761,369 | | | $ | 419,127 | | | $ | 859,091 | |
ADAMS RESOURCES & ENERGY, INC. AND SUBSIDIARIES
NOTES TO CONSOLIDATED FINANCIAL STATEMENTS
Note 4. Subsidiary Bankruptcy, Deconsolidation and Sale
Bankruptcy Filing, Deconsolidation and Sale
On April 21, 2017, AREC filed a voluntary petition in the Bankruptcy Court seeking relief under the Bankruptcy Code. AREC operated its business and managed its properties as “debtors-in-possession” under the jurisdiction of the Bankruptcy Court and in accordance with the applicable provisions of the Bankruptcy Code and order of the Bankruptcy Court. As a result of AREC’s bankruptcy filing, AE ceded its authority to the Bankruptcy Court, and AE management could not carry on AREC activities in the ordinary course of business without Bankruptcy Court approval. AE managed the day-to-day operations of AREC, but did not have discretion to make significant capital or operating budgetary changes or decisions or to purchase or sell significant assets, as AREC’s material decisions were subject to review and approval by the Bankruptcy Court. For these reasons, we concluded that AE lost control of AREC, and no longer had significant influence over AREC during the pendency of the bankruptcy. Therefore, we deconsolidated AREC effective with the filing of the Chapter 11 bankruptcy in April 2017.
In order to deconsolidate AREC, the carrying values of the assets and liabilities of AREC were removed from our consolidated balance sheet as of April 30, 2017, and we recorded our investment in AREC at its estimated fair value of approximately $5.0 million. We determined the fair value of our investment based upon bids we received in an auction process (see Note 1 for further discussion). We also determined that the estimated fair value of our investment in AREC was expected to be lower than its net book value immediately prior to the deconsolidation. As a result, during the second quarter of 2017, we recorded a non-cash charge of approximately $1.6 million associated with the deconsolidation of AREC, which reflected the excess of the net assets of AREC over its estimated fair value based on the expected sales transaction price of approximately $5.0 million, net of estimated transaction costs. Subsequent to the deconsolidation of AREC, we accounted for our investment in AREC using the cost method of accounting because AE did not exercise significant influence over the operations of AREC due to the Chapter 11 filing.
On August 1, 2017, a hearing was held before the Bankruptcy Court seeking approval of asset purchase and sales agreements under Section 363 of the Bankruptcy Code with three unaffiliated parties to purchase AREC’s crudeoil and natural gas assets for aggregate cash proceeds of approximately $5.2 million. The Bankruptcy Court approved the asset purchase and sales agreements, and we closed on the sales of these assets during the third quarter of 2017.
In October 2017, AREC submitted its liquidation plan to the Bankruptcy Court for approval. In connection with the sales of these assets and submission of the liquidation plan, we recognized an additional loss of $1.9 million during the third quarter of 2017, which represents the difference between the proceeds we expected to be paid upon settlement of the bankruptcy, net of anticipated remaining closing costs identified as part of the liquidation plan, and the book value of our cost method investment. In December 2017, we received proceeds of approximately $2.8 million from AREC related to the settlement of a portion of the bankruptcy process. The bankruptcy case was dismissed during October 2018, and we expect final settlement and liquidation to occur during 2019. At December 31, 2018, we have a receivable from AREC of approximately $0.4 million related to the final settlement of AREC.
DIP Financing – Related Party Relationship
In connection with the bankruptcy filing, AREC entered into a Debtor in Possession Credit and Security Agreement with AE (“DIP Credit Agreement”) dated as of April 25, 2017, in an aggregate amount of up to $1.25 million, of which the funds were to be used by AREC solely to fund operations through August 11, 2017. Loans under the DIP Credit Agreement accrued interest at a rate of LIBOR plus 2.0 percent per annum and were due and payable upon the earlier of (a) twelve months after the petition date, (b) the closing of the sale of substantially all of AREC’s assets, (c) the effective date of a Chapter 11 plan of reorganization of AREC, and (d) the date that the DIP loan was accelerated upon the occurrence of an event of default, as defined in the DIP Credit Agreement. AREC borrowed approximately $0.4 million under the DIP Credit Agreement, and the amount was repaid during the third quarter of 2017 with proceeds from the sales of the assets.
ADAMS RESOURCES & ENERGY, INC. AND SUBSIDIARIES
NOTES TO CONSOLIDATED FINANCIAL STATEMENTS
Note 5. Prepayments and Other Current Assets
The components of prepayments and other current assets were as follows at the dates indicated (in thousands):
| | | | | | | | | | | |
| December 31, | | |
| 2018 | | 2017 |
| | | |
| Insurance premiums | $ | 677 | | $ | 425 |
| Rents, licenses and other | 880 | | 839 |
| Total | $ | 1,557 | | $ | 1,264 |
| | | | | | | | | | | |
| December 31, |
| 2021 | | 2020 |
| | | |
| Insurance premiums | $ | 641 | | | $ | 690 | |
| Vendor prepayment | 602 | | | 1,085 | |
| Rents, licenses and other | 1,146 | | | 1,189 | |
| Total prepayments and other current assets | $ | 2,389 | | | $ | 2,964 | |
ADAMS RESOURCES & ENERGY, INC. AND SUBSIDIARIES
NOTES TO CONSOLIDATED FINANCIAL STATEMENTS
Note 6.5. Property and Equipment
The historical costs of our property and equipment and related accumulated depreciation and amortization balances were as follows at the dates indicated (in thousands):
| | | Estimated | | | Estimated | |
| | Useful Life | | December 31, | | | Useful Life | | December 31, |
| | in Years | | 2018 | | 2017 | | in Years | | 2021 | | 2020 |
| Tractors and trailers (1) | Tractors and trailers (1) | 5 – 6 | | $ | 96,523 | | $ | 88,065 | Tractors and trailers (1) | 5 – 6 | | $ | 106,558 | | | $ | 101,813 | |
| Field equipment | Field equipment | 2 – 5 | | 20,725 | | 18,490 | Field equipment | 2 – 5 | | 22,851 | | | 22,139 | |
Finance lease ROU assets (1) | | Finance lease ROU assets (1) | 3 – 6 | | 22,349 | | | 20,266 | |
| Pipeline and related facilities | | Pipeline and related facilities | 20 – 25 | | 20,336 | | | 21,265 | |
Linefill and base gas (2) | | Linefill and base gas (2) | N/A | | 3,922 | | | 3,333 | |
| Buildings | Buildings | 5 – 39 | | 15,746 | | 15,727 | Buildings | 5 – 39 | | 16,163 | | | 14,977 | |
| Office equipment | Office equipment | 2 – 5 | | 1,863 | | 1,929 | Office equipment | 2 – 5 | | 2,060 | | | 1,893 | |
| Land | Land | | 1,790 | | 1,790 | Land | N/A | | 2,008 | | | 1,790 | |
| Construction in progress | Construction in progress | | 2,794 | | 275 | Construction in progress | N/A | | 3,396 | | | 1,626 | |
| Total | | 139,441 | | 126,276 | |
| Less accumulated depreciation | | (94,818) | | (96,914) | |
| Total property and equipment, at cost | | Total property and equipment, at cost | | 199,643 | | | 189,102 | |
| Less accumulated depreciation and amortization | | Less accumulated depreciation and amortization | | (111,607) | | | (94,968) | |
| Property and equipment, net | Property and equipment, net | | $ | 44,623 | | $ | 29,362 | Property and equipment, net | | $ | 88,036 | | | $ | 94,134 | |
______________
(1) Amounts includeOur finance lease right-of-use (“ROU”) assets arise from leasing arrangements for the right to use various classes of underlying assets including tractors, held under capital leases in our crude oil marketing segment. At December 31, 2018trailers, a tank storage and 2017, gross propertythroughput arrangement and office equipment associated with assets held under capital leases were $4.7 million and $1.8 million, respectively. Accumulated amortization associated with assets held under capital leases were $0.7 million and $0.1 million at December 31, 2018 and 2017, respectively (see Note 1517 for further information). Accumulated amortization of the assets presented as “Finance lease ROU assets” was $9.8 million and $5.0 million as of December 31, 2021 and 2020, respectively.
(2)Linefill and base gas represents crude oil in the VEX pipeline (Note 6) and storage tanks we own, and the crude oil is recorded at historical cost.
Components of depreciation depletion and amortization expense were as follows for the periods indicated (in thousands):
| | | | | | | | | | | | | | | | | |
| Year Ended December 31, | | | | |
| 2018 | | 2017 | | 2016 |
| Depreciation, depletion and amortization, excluding amounts | | | | | |
| under capital leases | $ | 10,112 | | $ | 13,478 | | $ | 18,792 |
| Amortization of property and equipment under capital leases | 542 | | 121 | | — |
| Total depreciation, depletion and amortization | $ | 10,654 | | $ | 13,599 | | $ | 18,792 |
| | | | | | | | | | | | | | | | | |
| Year Ended December 31, |
| 2021 | | 2020 | | 2019 |
| Depreciation and amortization, excluding amounts | | | | | |
| under finance leases | $ | 15,053 | | | $ | 16,026 | | | $ | 14,833 | |
| Amortization of property and equipment under finance leases | 4,744 | | | 2,547 | | | 1,808 | |
| Total depreciation and amortization | $ | 19,797 | | | $ | 18,573 | | | $ | 16,641 | |
Gains on Sales of Assets
We sold certain used tractors, trailers and other equipment and recorded net pre-tax gains as follows for the periods indicated (in thousands):
| | | | | | | | | | | | | | | | | |
| Year Ended December 31, |
| 2021 | | 2020 | | 2019 |
| | | | | |
| Gains on sales of used tractors, trailers and equipment | $ | 733 | | | $ | 1,859 | | | $ | 1,400 | |
ADAMS RESOURCES & ENERGY, INC. AND SUBSIDIARIES
NOTES TO CONSOLIDATED FINANCIAL STATEMENTS
Asset Acquisition
On October 1, 2018, we completed the purchase of a trucking company for $10.0 million that owned approximately 113 tractors and 126 trailers operating in the Red River area in North Texas and South Central Oklahoma. This acquisition is included in our crude oil marketing segment from the date of the acquisition. We incurred approximately $0.3 million of acquisition costs in connection with this acquisition, which was included in the allocation of the purchase price to the assets acquired. The purchase price of approximately $10.3 million was allocated on October 1, 2018 as follows (in thousands):
| | | | | | | | |
| | |
Tractors | | $ | 4,799 |
Trailers | | 4,901 |
Field equipment | | 381 |
Materials and supplies | | 191 |
Total | | $ | 10,272 |
Gains on Sales of Assets
We sold certain used trucks and equipment and recorded net pre-tax gains as follows for the periods indicated (in thousands):
| | | | | | | | | | | | | | | | | |
| Year Ended December 31, | | | | |
| 2018 | | 2017 | | 2016 |
| | | | | |
| Gains on sales of used trucks and equipment | $ | 1,240 | | $ | 594 | | $ | 1,966 |
Crude Oil and Natural Gas Exploration and Production Assets
Our subsidiary that owned the upstream crude oil and natural gas exploration and production assets was deconsolidated effective with its bankruptcy filing in April 2017 and subsequently accounted for as a cost method investment (see Note 4). These upstream crude oil and natural gas exploration and production assets were sold during the third quarter of 2017. We have no further interest in these assets.
Impairment provisions included in upstream crude oil and natural gas exploration and production segment operating losses were as follows for the periods indicated (in thousands):
| | | | | | | | | | | | | | | | | |
| Year Ended December 31, | | | | |
| 2018 | | 2017 | | 2016 |
| | | | | |
| Producing property impairments | $ | — | | $ | — | | $ | 30 |
| Non-producing property impairments | — | | 3 | | 283 |
| Total crude oil and natural gas impairments | $ | — | | $ | 3 | | $ | 313 |
ADAMS RESOURCES & ENERGY, INC. AND SUBSIDIARIES
NOTES TO CONSOLIDATED FINANCIAL STATEMENTS
Asset Retirement Obligations
We record AROs for the estimated retirement costs associated with certain tangible long-lived assets. The estimated fair value of AROs are recorded in the period in which they are incurred and the corresponding cost is capitalized by increasing the carrying amount of the related long-lived asset. The liability is accreted to its then present value each period, and the capitalized cost is depreciated over the useful life of the asset. If the liability is settled for an amount other than the recorded amount, an increase or decrease to expense is recognized. AThe following table reflects a summary of our AROs is presented as follows for the periods indicated (in thousands):
| | | | | | | | | | | | | | | | | |
| Year Ended December 31, | | | | |
| 2018 | | 2017 | | 2016 |
| | | | | |
| ARO liability beginning balance | $ | 1,273 | | $ | 2,329 | | $ | 2,469 |
| Liabilities incurred | 252 | | 18 | | 162 |
| Accretion of discount | 36 | | 58 | | 92 |
| Liabilities settled | (36) | | (261) | | (394) |
Deconsolidation of subsidiary (1) | — | | (871) | | — |
| ARO liability ending balance | $ | 1,525 | | $ | 1,273 | | $ | 2,329 |
_______________ | | | | | | | | | | | | | | | | | |
| Year Ended December 31, |
| 2021 | | 2020 | | 2019 |
| | | | | |
| ARO liability at beginning of year | $ | 2,307 | | | $ | 1,573 | | | $ | 1,525 | |
| Liabilities incurred | — | | | — | | | 17 | |
| Accretion of discount | 69 | | | 49 | | | 48 | |
| Liabilities settled | — | | | (38) | | | (17) | |
| AROs related to pipeline acquisition (see Note 6) | — | | | 723 | | | — | |
| ARO liability at end of year | $ | 2,376 | | | $ | 2,307 | | | $ | 1,573 | |
(1) Relates to our upstream crude oil and natural gas exploration and production subsidiary that was deconsolidated in April 2017 as a result of its bankruptcy filing (see Note 4 for further information).
Note 6. Acquisitions
Acquisition of Pipeline and Related Terminal Facility Assets
On October 22, 2020, we and our subsidiary, GulfMark Terminals, LLC (“GMT”) entered into a purchase and sale agreement with EnLink Midstream Operating, L.P. for the purchase of the outstanding equity interests of Victoria Express Pipeline, LLC (“VEX”) and certain related pipeline terminal facility assets for $20.0 million, plus a cash payment of $0.5 million for working capital items. Of the purchase price, $10.0 million was paid at closing, with the remainder to be paid in 4 quarterly installments of $2.5 million, plus interest at a rate of 4.0 percent per annum, beginning in March 2021. The equity interests in GMT, VEX and the other acquired assets were pledged to secure the payment of the installment portions of the purchase price as part of the agreement.
The VEX Pipeline System, with truck and storage terminals at both Cuero and the Port of Victoria, Texas, is a crude oil and condensate pipeline system, which connects the heart of the Eagle Ford Basin to the Gulf Coast waterborne market. The VEX Pipeline System includes 56 miles of 12-inch pipeline, which spans DeWitt County to Victoria County, Texas, with 350,000 barrels of above ground storage, 2 8 bay truck offload stations, and access to 2 docks at the Port of Victoria. The VEX Pipeline System is able to receive crude oil by pipeline and truck, and has downstream pipeline connections to 2 terminals, with potential for additional downstream connection opportunities in the future. The pipeline system has a current capacity of 90,000 barrels per day.
The VEX Pipeline System and related terminal assets have been included in our new pipeline and storage segment. We expect that this acquisition will further strengthen our ability to provide excellent service to the producers in the Gulf Coast region, as well as more effectively service our end-user markets along the Gulf Coast. In addition, the VEX Pipeline System complements our existing storage terminal and dock at the Port of Victoria, where we now control approximately 450,000 barrels of storage with 3 docks after giving effect to the acquisition.
In addition to the purchase price of $20.0 million and a cash payment of $0.5 million for working capital items, we also incurred approximately $0.6 million of acquisition costs in connection with this acquisition, which has been included in the allocation of the total purchase price of $21.0 million to the assets acquired. We accounted for this acquisition as an asset acquisition as substantially all of the fair value of the gross assets is concentrated in a group of similar identifiable assets.
ADAMS RESOURCES & ENERGY, INC. AND SUBSIDIARIES
NOTES TO CONSOLIDATED FINANCIAL STATEMENTS
The following table summarizes the allocation of the purchase price based on the estimated fair value of the assets and liabilities acquired at the acquisition date (in thousands):
| | | | | | | | |
| Accounts receivable and other current assets | | $ | 80 | |
| Linefill and base gas | | 1,013 | |
| Property and equipment — Pipeline and related terminal facilities | | 20,542 | |
| Accounts payable and other accrued liabilities | | (598) | |
| Total purchase price | | $ | 21,037 | |
The estimated fair value of the acquired property and equipment was determined using the cost approach, specifically determining the replacement cost value of each type of asset.
In connection with the acquisition, we recorded an asset retirement obligation of approximately $0.7 million related to legal and regulatory requirements to perform specified retirement activities, including purging and sealing the pipeline if it is abandoned.
Acquisition of Transportation Assets — CTL
On May 17, 2020, we entered into a purchase and sale agreement with Comcar Industries, Inc. (“Comcar”), a bulk carrier trucking company, for the purchase of substantially all of the transportation assets of Comcar’s subsidiary, CTL Transportation, LLC (“CTL”). CTL provides short-haul delivery services to customers in the chemical industry, with operations in 9 locations in the southeastern United States. On June 26, 2020, we closed on the asset acquisition for approximately $9.0 million in cash. This acquisition added approximately 163 tractors and 328 trailers to our existing transportation fleet, and these assets were included in our transportation segment. This acquisition added new customers, new market areas and new product lines to our transportation segment portfolio. As a result of the acquisition, we added services to new and existing customers in 6 new market areas, including new terminals in Louisiana, Missouri, Ohio, Georgia and Florida.
We also incurred approximately $0.1 million of acquisition costs in connection with this acquisition, which has been included in the allocation of the total purchase price of $9.2 million to the assets acquired.
The following table summarizes the allocation of the purchase price based on the estimated fair value of the assets acquired at the acquisition date (in thousands):
| | | | | | | | |
| Property and equipment — tractors and trailers | | $ | 5,901 | |
| Materials and supplies | | 87 | |
| Intangible assets — customer relationships | | 3,175 | |
| Total purchase price | | $ | 9,163 | |
The estimated fair value of the acquired property and equipment was determined using the estimated market value of each type of asset. The estimated fair value of the acquired customer relationship intangible assets was determined using an income approach, specifically a discounted cash flow analysis. The income approach estimates the future benefits of the customer relationships and deducts the expenses incurred in servicing the relationships and the contributions from the other business assets to derive the future net benefits of these assets. The future net benefits are discounted back to present value using the appropriate discount rate, which results in the value of the customer relationships.
ADAMS RESOURCES & ENERGY, INC. AND SUBSIDIARIES
NOTES TO CONSOLIDATED FINANCIAL STATEMENTS
A customer relationship intangible asset is the relationship between CTL and various customers to whom we did not have a previous relationship. The customer relationships we acquired in this transaction provide us with access to those customers to whom we did not have a previous relationship and allows us to enter product markets in which we have not previously participated. Because of the highly competitive and fragmented transportation market, we believe access to these customers will provide us with an entry into new market areas.
The discounted cash flow analysis used to estimate the fair value of the CTL customer relationships relied on Level 3 fair value inputs. Level 3 fair values are based on unobservable inputs. Unobservable inputs are used to measure fair value to the extent that observable inputs are not available, thereby allowing for situations in which there is little, if any, market activity for the asset at the measurement date. With respect to the CTL customer relationships, the Level 3 inputs included the rate of retention of the current customers of CTL as of the valuation date, our transportation segment’s historical customer retention rate and projected future revenues associated with the customers. The CTL customers expected to remain with us after the transaction were included in the valuation of the customer relationships. We are amortizing the customer relationship intangible assets over a period of seven years, using a modified straight-line approach. See Note 8 for further information regarding our intangible assets.
In connection with the acquisition, we entered into a finance lease agreement for an additional 40 trailers with a six year term. See Note 17 for further information regarding finance leases.
Acquisition of Transportation Assets — EH Transport
On April 10, 2019, we entered into a purchase and sale agreement with EH Transport, Inc. and affiliates (collectively, “EH Transport”), a Houston, Texas based bulk carrier trucking company, for the purchase of certain transportation assets. On May 6, 2019, we closed on the asset acquisition for approximately $6.4 million, which consisted of $5.6 million in cash after post-closing adjustments related to equipment qualifications, 11,145 of our common shares valued at $0.4 million and contingent consideration valued at approximately $0.4 million.
This acquisition added approximately 39 tractors and 51 trailers to our existing transportation fleet, and these assets were included in our transportation segment. This acquisition added new customers and new product lines to our transportation segment portfolio, which allows us to grow into new markets. As a result of the acquisition, in addition to general chemical products, we transport liquefied petroleum gas, asphalt and bleach for customers.
We incurred approximately $0.1 million of acquisition costs in connection with this acquisition, which has been included in the allocation of the purchase price to the assets acquired.
The following table summarizes the consideration paid for the EH Transport assets and the estimated fair value of the assets acquired at the acquisition date (in thousands):
| | | | | | | | |
| Consideration: | | |
| Cash | | $ | 5,624 | |
| Value of AE common shares issued | | 392 | |
| Contingent consideration arrangement | | 431 | |
| Fair value of total consideration transferred | | $ | 6,447 | |
| | |
| Recognized amounts of identifiable assets acquired: | | |
| Property and equipment — tractors and trailers | | $ | 4,576 | |
| Shop, office and telecommunication equipment | | 20 | |
| Intangible assets — customer relationships | | 1,851 | |
| Total purchase price | | $ | 6,447 | |
ADAMS RESOURCES & ENERGY, INC. AND SUBSIDIARIES
NOTES TO CONSOLIDATED FINANCIAL STATEMENTS
The fair market value of the common shares issued in this transaction was determined based upon the closing share price of AE common stock on May 6, 2019 of $35.15.
We assumed no liabilities in this acquisition. The estimated fair value of the acquired property and equipment was determined using the estimated market value of each type of asset. The estimated fair value of the acquired customer relationship intangible assets was determined using an income approach, specifically a discounted cash flow analysis. The income approach estimates the future benefits of the customer relationships and deducts the expenses incurred in servicing the relationships and the contributions from the other business assets to derive the future net benefits of these assets. The future net benefits are discounted back to present value using the appropriate discount rate, which results in the value of the customer relationships.
A customer relationship intangible asset is the relationship between EH Transport and various customers to whom we did not have a previous relationship. The customer relationships we acquired in this transaction provide us with access to those customers to whom we did not have a previous relationship and allows us to enter product markets in which we had not previously participated. Because of the highly competitive and fragmented transportation market, we believe access to these customers and product lines will provide us with an entry into new markets.
The discounted cash flow analysis used to estimate the fair value of the EH Transport customer relationships relied on Level 3 fair value inputs. Level 3 fair values are based on unobservable inputs. Unobservable inputs are used to measure fair value to the extent that observable inputs are not available, thereby allowing for situations in which there is little, if any, market activity for the asset at the measurement date. With respect to the EH Transport customer relationships, the Level 3 inputs include the rate of retention of the current customers of EH Transport as of the valuation date, our transportation segment’s historical customer retention rate and projected future revenues associated with the customers. The EH Transport customers expected to remain with us after the transaction were included in the valuation of the customer relationships. We are amortizing the customer relationship intangible assets over a period of seven years, using a modified straight-line approach. See Note 8 for further information regarding our intangible assets.
The purchase and sale agreement included a contingent consideration arrangement that required us to pay the former owner of the assets up to a quarterly maximum amount of $146,875 (undiscounted) plus interest for the first four quarters following the closing date of the acquisition. The amount to be paid was based upon the number of qualified truck drivers that were employed by us at the end of each quarter. The potential undiscounted amount of all future payments that could be required to be paid under the contingent consideration arrangement was between $0 and $587,500. The fair value of the contingent consideration arrangement of $0.4 million was estimated by applying an income valuation approach, which is based on Level 3 inputs, including the number of qualified truck drivers we expect will be employed at each payment date. At December 31, 2021, all amounts outstanding under the contingent consideration arrangement had been paid.
ADAMS RESOURCES & ENERGY, INC. AND SUBSIDIARIES
NOTES TO CONSOLIDATED FINANCIAL STATEMENTS
Note 7. Cash Deposits and Other Assets
Components of cash deposits and other assets were as follows at the dates indicated (in thousands):
| | | | | | | | | | | |
| December 31, | | |
| 2018 | | 2017 |
| | | |
| Amounts associated with liability insurance program: | | | |
Insurance collateral deposits (1) | $ | 1,453 | | $ | 3,767 |
| Excess loss fund | 1,916 | | 2,284 |
| Accumulated interest income | 788 | | 814 |
| Other amounts: | | | |
| State collateral deposits | 57 | | 57 |
| Materials and supplies | 443 | | 273 |
| Other | — | | 37 |
| Total | $ | 4,657 | | $ | 7,232 |
_______________
(1) During 2018, we issued a letter of credit of approximately $4.2 million to the insurance companies in connection with our liability insurance program, and as a result, our cash collateral deposit was refunded to us. | | | | | | | | | | | |
| December 31, |
| 2021 | | 2020 |
| | | |
| Amounts associated with liability insurance program: | | | |
| Insurance collateral deposits | $ | 721 | | | $ | 714 | |
| Excess loss fund | 622 | | | 617 | |
| Accumulated interest income | 489 | | | 449 | |
| Other amounts: | | | |
| State collateral deposits | 36 | | | 31 | |
| Materials and supplies | 574 | | | 488 | |
| Debt issuance costs | 292 | | | — | |
| Other | 293 | | | 84 | |
| Total other assets | $ | 3,027 | | | $ | 2,383 | |
We have established certain deposits to support participation in our liability insurance program and remittance of state crude oil severance taxes and other state collateral deposits. Insurance collateral deposits are held by the insurance company to cover past or potential open claims based upon a percentage of the maximum assessment under our insurance policies. Insurance collateral deposits are invested at the discretion of our insurance carrier. Excess amounts in our loss fund represent premium payments in excess of claims incurred to date that we may be entitled to recover through settlement or commutation as claim periods are closed. Interest income is earned on the majority of amounts held by the insurance companies and will be paid to us upon settlement of policy years.
ADAMS RESOURCES & ENERGY, INC. AND SUBSIDIARIES
NOTES TO CONSOLIDATED FINANCIAL STATEMENTS
Note 8. Investments in Unconsolidated Affiliates The following table summarizes our intangible assets at the dates indicated (in thousands):
At December 31, 2018, we had no remaining balances in our medical-related investments. We currently do not have any plans to pursue additional medical-related investments. | | | | | | | | | | | | | | | | | | | | | | | | | | | | | | | | | | | | | | |
| | December 31, 2021 | | December 31, 2020 |
| | Gross | | Accumulated | | | | Gross | | Accumulated | | |
| | Value | | Amortization | | Net | | Value | | Amortization | | Net |
| Customer relationships: | | | | | | | | | | | | |
| EH Transport acquisition | | $ | 1,703 | | | $ | (765) | | | $ | 938 | | | $ | 1,703 | | | $ | (500) | | | $ | 1,203 | |
| CTL acquisition | | 3,173 | | | (794) | | | 2,379 | | | 3,173 | | | (270) | | | 2,903 | |
| Intangible assets, net | | $ | 4,876 | | | $ | (1,559) | | | $ | 3,317 | | | $ | 4,876 | | | $ | (770) | | | $ | 4,106 | |
BencapWe are amortizing the customer relationship intangible assets over a period of seven years, using a modified straight-line approach. During the years ended December 31, 2021, 2020 and 2019, we recorded $0.8 million, $0.6 million and $0.2 million, respectively, of amortization expense related to these intangible assets. The following table presents our forecast of amortization expense associated with these intangible assets for the years indicated (in thousands):
In December 2015, we formed a new wholly owned subsidiary, Adams Resources Medical Management, Inc. (“ARMM”), and in January 2016, ARMM acquired a 30 percent member interest in Bencap LLC (“Bencap”) for a $2.2 million cash payment. Bencap provides medical insurance brokerage and medical claims auditing services to employers utilizing ERISA governed employee benefit plans. We accounted for this investment under the equity method of accounting.
Under the terms of the investment agreement, Bencap had the option to request borrowings from us of up to $1.5 million (on or after December 5, 2016 but before October 31, 2018) that we were required to provide or forfeit our 30 percent member interest. During 2016, we determined that we were unlikely to provide additional funding due to Bencap’s lower than projected revenue growth and operating losses since investment inception. We completed a review of our equity method investment in Bencap during 2016 and determined that there was an other than temporary impairment. During 2016, we recognized an after-tax net loss of $1.4 million to write-off our investment in Bencap, which consisted of a pre-tax impairment charge of approximately $1.7 million, pre-tax losses from the equity method investment of $0.5 million and an income tax benefit of $0.8 million. In February 2017, in accordance with the terms of the investment agreement, Bencap requested additional funding of approximately $0.5 million from us. We declined the additional funding request and as a result, forfeited our 30 percent member interest in Bencap. At December 31, 2018, we had no further ownership interest in Bencap.
VestaCare
In April 2016, ARMM acquired an approximate 15 percent equity interest (less than 3 percent voting interest) in VestaCare, Inc., a California corporation (“VestaCare”), for a $2.5 million cash payment. VestaCare provides an array of software as a service (SaaS) electronic payment technologies to medical providers, payers and patients including VestaCare’s most recent product offering, VestaPay™. VestaPay™ allows medical care providers to structure fully automated and dynamically updating electronic payment plans for their patients. We account for this investment under the cost method of accounting. During 2017, we reviewed our investment in VestaCare and determined that the current projected operating results did not support the carrying value of the investment. As a result, during the third quarter of 2017, we recognized an impairment charge of $2.5 million to write-off our investment in VestaCare. At December 31, 2018, we continue to own an approximate 15 percent equity interest in VestaCare.
AREC
As a result of AREC’s voluntary bankruptcy filing in April 2017 and our loss of control of this subsidiary, we deconsolidated AREC in April 2017, and we recorded our investment in this subsidiary under the cost method of accounting. During the second quarter of 2017, we recorded a non-cash charge of approximately $1.6 million associated with the deconsolidation of AREC, which reflected the excess of the net assets of AREC over its estimated fair value based on the expected sales transaction price, net of estimated transaction costs. During the third quarter of 2017, as a result of the sale of substantially all of AREC’s assets, we recognized an additional loss of $1.9 million, which represented the difference between the net proceeds we expected to be paid upon settlement of the bankruptcy, net of anticipated remaining closing costs identified as part of the liquidation plan, and the book value of our cost method investment. In December 2017, we received proceeds of approximately $2.8 million from AREC related to the settlement of a portion of the bankruptcy process. At December 31, 2017, our remaining investment in AREC was $0.4 million. The bankruptcy case was dismissed during October 2018, and we expect final settlement and liquidation of the company to occur during 2019. At December 31, 2018, we have a receivable from AREC of approximately $0.4 million related to the final settlement of AREC.
| | | | | | | | | | | | | | | | | | | | | | | | | | | | | | | | |
| | 2022 | | 2023 | | 2024 | | 2025 | | 2026 |
| | | | | | | | | | |
| EH Transport acquisition | | $ | 245 | | | $ | 227 | | | $ | 209 | | | $ | 193 | | | $ | 63 | |
| CTL acquisition | | 492 | | | 460 | | | 428 | | | 413 | | | 397 | |
| Total | | $ | 737 | | | $ | 687 | | | $ | 637 | | | $ | 606 | | | $ | 460 | |
ADAMS RESOURCES & ENERGY, INC. AND SUBSIDIARIES
NOTES TO CONSOLIDATED FINANCIAL STATEMENTS
Note 9. Segment Reporting
Historically, our three reporting segments have been:We operate and report in 3 business segments: (i) crude oil marketing, transportation and storage,storage; (ii) tank truck transportation of liquid chemicals, pressurized gases, asphalt and dry bulk,bulk; and (iii) upstreambeginning in the fourth quarter of 2020, pipeline transportation, terminalling and storage of crude oil, which includes the pipeline and natural gas exploration and production. Our upstream crude oil and natural gas exploration and production wholly owned subsidiary filed for bankruptcyrelated terminal facility assets we acquired in April 2017October 2020 (see Note 46 for further information),information regarding our acquisition). Our business segments are generally organized and asmanaged according to the types of services rendered. See Note 3 for a result of our loss of controlsummary of the wholly owned subsidiary, AREC was deconsolidatedtypes of products and is accounted for under the cost method of accounting. AREC remained a reportableservices from which each segment untilderives its deconsolidation, effective April 30, 2017.revenues.
Information concerning our various business activitiesOur Chief Operating Decision Maker (“CODM”) (our Chief Executive Officer) evaluates segment performance based on measures including segment operating (losses) earnings and capital spending (property and equipment additions). Segment operating (losses) earnings is calculated as segment revenues less segment operating costs and depreciation and amortization expense.
Financial information by reporting segment was as follows for the periods indicated (in thousands):
| | | | | | | | | | | | | | | | | | | | | | | |
| Reporting Segments | | | | | | |
| Marketing | | Transportation | | Oil and Gas and Other | | Total |
| | | | | | | |
| Year Ended December 31, 2018 | | | | | | | |
| Revenues | $ | 1,694,437 | | $ | 55,776 | | $ | — | | $ | 1,750,213 |
Segment operating (losses) earnings (1) | 7,008 | | 3,337 | | — | | 10,345 |
| Depreciation, depletion and amortization | 6,384 | | 4,270 | | — | | 10,654 |
Property and equipment additions (3) (4) | 1,540 | | 10,178 | | 13 | | 11,731 |
| | | | | | | |
| Year Ended December 31, 2017 | | | | | | | |
| Revenues | $ | 1,267,275 | | $ | 53,358 | | $ | 1,427 | | $ | 1,322,060 |
Segment operating (losses) earnings (1) (2) | 11,700 | | (544) | | 53 | | 11,209 |
| Depreciation, depletion and amortization | 7,812 | | 5,364 | | 423 | | 13,599 |
Property and equipment additions (3) | 468 | | 351 | | 1,825 | | 2,644 |
| | | | | | | |
| Year Ended December 31, 2016 | | | | | | | |
| Revenues | $ | 1,043,775 | | $ | 52,355 | | $ | 3,410 | | $ | 1,099,540 |
Segment operating (losses) earnings (1) | 17,045 | | (48) | | (533) | | 16,464 |
| Depreciation, depletion and amortization | 9,997 | | 7,249 | | 1,546 | | 18,792 |
| Property and equipment additions | 1,321 | | 6,868 | | 295 | | 8,484 |
| | | | | | | | | | | | | | | | | | | | | | | | | | | | | |
| Reporting Segments | | |
| Crude Oil Marketing | | Transportation | | Pipeline and storage | | Other | | Total |
| | | | | | | | | |
| Year Ended December 31, 2021 | | | | | | | | | |
Segment revenues (1) | $ | 1,930,042 | | | $ | 94,824 | | | $ | 4,524 | | | $ | — | | | $ | 2,029,390 | |
Less: Intersegment revenues (1) | — | | | (326) | | | (3,860) | | | — | | | (4,186) | |
| Revenues | $ | 1,930,042 | | | $ | 94,498 | | | $ | 664 | | | $ | — | | | $ | 2,025,204 | |
| | | | | | | | | |
Segment operating (losses) earnings (2) | 25,243 | | | 7,104 | | | (2,487) | | | — | | | 29,860 | |
| Depreciation and amortization | 6,673 | | | 12,099 | | | 1,025 | | | — | | | 19,797 | |
Property and equipment additions (3)(4) | 3,245 | | | 7,960 | | | 1,169 | | | 8 | | | 12,382 | |
| | | | | | | | | |
| Year Ended December 31, 2020 | | | | | | | | | |
| Segment revenues | $ | 950,426 | | | $ | 71,724 | | | $ | 272 | | | $ | — | | | $ | 1,022,422 | |
| Less: Intersegment revenues | — | | | — | | | — | | | — | | | — | |
| Revenues | $ | 950,426 | | | $ | 71,724 | | | $ | 272 | | | $ | — | | | $ | 1,022,422 | |
| | | | | | | | | |
Segment operating (losses) earnings (2) | 2,974 | | | 1,873 | | | (310) | | | — | | | 4,537 | |
| Depreciation and amortization | 7,421 | | | 10,963 | | | 189 | | | — | | | 18,573 | |
Property and equipment additions (3)(4) | 3,130 | | | 1,355 | | | — | | | 523 | | | 5,008 | |
| | | | | | | | | |
| Year Ended December 31, 2019 | | | | | | | | | |
| Segment revenues | $ | 1,748,056 | | | $ | 63,191 | | | $ | — | | | $ | — | | | $ | 1,811,247 | |
| Less: Intersegment revenues | — | | | — | | | — | | | — | | | — | |
| Revenues | $ | 1,748,056 | | | $ | 63,191 | | | $ | — | | | $ | — | | | $ | 1,811,247 | |
| | | | | | | | | |
Segment operating (losses) earnings (2) | 16,099 | | | 1,899 | | | — | | | — | | | 17,998 | |
| Depreciation and amortization | 8,741 | | | 7,900 | | | — | | | — | | | 16,641 | |
Property and equipment additions (3)(4) | 7,249 | | | 28,472 | | | — | | | 22 | | | 35,743 | |
_________________
(1) Our crude oil marketing segment’sSegment revenues include intersegment amounts that are eliminated in operating earnings included inventory valuation lossescosts and expenses in our consolidated statements of $5.4 million for the year ended December 31, 2018, and inventory liquidation gains of $3.3 million and $8.2 million for the years ended December 31, 2017 and 2016, respectively.
(2) Segment operating (losses) earnings includes approximately $0.4 million of costs related to a voluntary early retirement program that was implemented in August 2017.
(3) Our crude oil marketing segment’s property and equipment additions do not include approximately $2.9 million and $1.8 million of tractors acquired during the years ended December 31, 2018 and 2017, respectively, under capital leases. See Note 15 for further information.
(4) During the year ended December 31, 2018, we had $13 thousand of property and equipment additions for leasehold improvementsoperations. Intersegment activities are conducted at our corporate headquarters, which is not attributed or allocated to any of our reporting segments.
ADAMS RESOURCES & ENERGY, INC. AND SUBSIDIARIES
NOTES TO CONSOLIDATED FINANCIAL STATEMENTS
applicable, or otherwise at rates similar to those charged to third parties or rates that we believe approximate market at the time the agreement is executed.
(2)Our crude oil marketing segment’s operating earnings included net inventory liquidation gains of $10.3 million, net inventory valuation losses of $15.0 million, and net inventory liquidation gains of $3.7 million for the years ended December 31, 2021, 2020 and 2019, respectively.
(3)Our segment property and equipment additions do not include assets acquired under finance leases during the years ended December 31, 2021, 2020 and 2019. See Note 17 for further information.
(4)Amounts included in property and equipment additions for Other are additions for leasehold improvements and computer equipment at our corporate headquarters, which were not attributed or allocated to any of our reporting segments.
Segment operating earnings reflect revenues net of operating costs and depreciation depletion and amortization expense and are reconciled to earnings (losses) before income taxes, and investment in unconsolidated affiliate, as follows for the periods indicated (in thousands):
| | | | | | | | | | | | | | | | | |
| Year Ended December 31, | | | | |
| 2018 | | 2017 | | 2016 |
| | | | | |
| Segment operating earnings | $ | 10,345 | | $ | 11,209 | | $ | 16,464 |
General and administrative (1) | (8,937) | | (9,707) | | (10,410) |
| Operating earnings (losses) | 1,408 | | 1,502 | | 6,054 |
| Loss on deconsolidation of subsidiary | — | | (3,505) | | — |
| Impairment of investment in unconsolidated affiliate | — | | (2,500) | | — |
| Interest income | 2,155 | | 1,103 | | 582 |
| Interest expense | (109) | | (27) | | (2) |
| (Losses) earnings before income taxes and investment | | | | | |
| in unconsolidated affiliate | $ | 3,454 | | $ | (3,427) | | $ | 6,634 |
_______________
(1) General and administrative expenses for the year ended December 31, 2017 included approximately $1.0 million of costs related to a voluntary early retirement program we implemented in August 2017. | | | | | | | | | | | | | | | | | |
| Year Ended December 31, |
| 2021 | | 2020 | | 2019 |
| | | | | |
| Segment operating earnings | $ | 29,860 | | | $ | 4,537 | | | $ | 17,998 | |
| General and administrative | (13,701) | | | (10,284) | | | (10,198) | |
| Operating earnings (losses) | 16,159 | | | (5,747) | | | 7,800 | |
| Gain on dissolution of investment | — | | | — | | | 573 | |
| Interest income | 243 | | | 656 | | | 2,766 | |
| Interest expense | (746) | | | (444) | | | (636) | |
| Earnings (losses) before income taxes | $ | 15,656 | | | $ | (5,535) | | | $ | 10,503 | |
Identifiable assets by industry segment were as follows at the dates indicated (in thousands):
| | | | | | | | | | | | | | | | | |
| December 31, | | | | |
| 2018 | | 2017 | | 2016 |
| | | | | |
| Reporting segment: | | | | | |
| Marketing | $ | 119,370 | | $ | 134,745 | | $ | 107,257 |
| Transportation | 34,112 | | 29,069 | | 32,120 |
Oil and Gas (1) | — | | 425 | | 7,279 |
| Cash and other | 125,388 | | 118,465 | | 100,216 |
| Total assets | $ | 278,870 | | $ | 282,704 | | $ | 246,872 |
____________________
(1) At December 31, 2017, amount represents our remaining cost method investment in this segment. See Note 4 for further information.
There were no intersegment sales during the year ended December 31, 2018, and intersegment sales during the years ended December 31, 2017 and 2016 were insignificant. | | | | | | | | | | | | | | | | | |
| December 31, |
| 2021 | | 2020 | | 2019 |
| | | | | |
| Reporting segment: | | | | | |
| Marketing | $ | 162,770 | | | $ | 128,441 | | | $ | 141,402 | |
| Transportation | 67,167 | | | 72,247 | | | 58,483 | |
| Pipeline and storage | 25,569 | | | 24,541 | | | — | |
Cash and other (1) | 119,197 | | | 70,958 | | | 130,957 | |
| Total assets | $ | 374,703 | | | $ | 296,187 | | | $ | 330,842 | |
_________________
(1)Other identifiable assets are primarily corporate cash, corporate accounts receivable, investmentsproperties and propertiesoperating lease right-of-use assets not identified with any specific segment of our business.
All of our property and equipment is located in the U.S. Substantially all of our consolidated revenues are earned in the U.S. and derived from a wide customer base. Accounting policies for transactions between reportablebusiness segments are consistent with applicable accounting policies as disclosed herein.
ADAMS RESOURCES & ENERGY, INC. AND SUBSIDIARIES
NOTES TO CONSOLIDATED FINANCIAL STATEMENTS
Note 10. Transactions with Affiliates
We enter into certain transactions in the normal course of business with affiliated entities including direct cost reimbursement for shared phone and administrative services. In addition, weservices from KSA Industries, Inc. (“KSA”), an affiliated entity. We lease our corporate office space fromin a building operated by 17 South Briar Hollow Lane, LLC, an affiliated entity.
We utilize our former affiliate Bencap, to administer certain of our employee medical benefit programs including a detail audit of individual medical claims (see Note 15 for further information). Bencap earns a fee from us for providing such services at a discounted amount from its standard charge to non-affiliates. We had an equity method investment in Bencap, which was forfeited during the first quarter of 2017. As a result, we have no further ownership interest in Bencap (see Note 8).KSA.
Activities with affiliates were as follows for the periods indicated (in thousands):
| | | | | | | | | | | | | | | | | |
| Year Ended December 31, | | | | |
| 2018 | | 2017 | | 2016 |
| | | | | |
Overhead recoveries (1) | $ | — | | $ | — | | $ | 32 |
| Affiliate billings to us | 75 | | 81 | | 65 |
| Billings to affiliates | 6 | | 4 | | 5 |
| Rentals paid to affiliate | 487 | | 583 | | 628 |
Fee paid to Bencap (2) | — | | 108 | | 583 |
___________________
(1) In connection with the operation of certain crude oil and natural gas properties, we charged related parties for administrative overhead. In late 2016, these charges ended as properties were either plugged and abandoned or operating responsibilities for these properties were transferred to another entity.
(2) Amount represents fees paid to Bencap through the forfeiture of our investment during the first quarter of 2017. As a result of the investment forfeiture, Bencap is no longer an affiliate. | | | | | | | | | | | | | | | | | |
| Year Ended December 31, |
| 2021 | | 2020 | | 2019 |
| | | | | |
| Affiliate billings to us | $ | 13 | | | $ | 18 | | | $ | 83 | |
| Billings to affiliates | 14 | | | 5 | | | 5 | |
| Rentals paid to affiliate | 605 | | | 644 | | | 487 | |
DIP Financing
In connection with its voluntary bankruptcy filing, AREC entered intoDuring the DIP Credit Agreement with AE,year ended December 31, 2021, we paid West Point Buick GMC, an affiliate of which amounts outstanding were repaid during the third quarter of 2017 with proceeds from the sales of AREC’s assets. We earned interest incomeKSA, a total of approximately $0.1$0.5 million under(net of trade-in values) for the DIP Credit Agreement through December 31, 2017 (see Note 4 for further information). purchase of 12 pickup trucks.
Note 11. Derivative Instruments and Fair Value MeasurementsOther Current Liabilities
Derivative InstrumentsThe components of other current liabilities were as follows at the dates indicated (in thousands):
At December 31, 2018, we had in place ten commodity purchase and sale contracts with fair value associated with them as the contractual prices of crude oil were outside of the range of prices specified in the agreements. These commodity purchase and sale contracts encompassed approximately: | | | | | | | | | | | |
| December 31, |
| 2021 | | 2020 |
| | | |
| Accrued purchase price for VEX acquisition (see Note 6) | $ | — | | | $ | 10,000 | |
| Accrual for payroll, benefits and bonuses | 5,210 | | | 6,575 | |
| Accrued automobile and workers’ compensation claims | 4,127 | | | 3,171 | |
| Accrued medical claims | 1,100 | | | 915 | |
| Accrued taxes | 534 | | | 772 | |
| Other | 651 | | | 910 | |
| Total other current liabilities | $ | 11,622 | | | $ | 22,343 | |
•322 barrels per day of crude oil during January 2019 through April 2019;
•258 barrels per day of crude oil during May 2019;
•322 barrels per day of crude oil during June 2019 through August 2019; and
•258 barrels per day of crude oil during September 2019 through December 2019.
Note 12. Credit Agreement
On May 4, 2021, we entered into a Credit Agreement (“Credit Agreement”) with Wells Fargo Bank, National Association, as Agent and Issuing Lender, under which we may borrow or issue letters of credit in an aggregate of up to $40.0 million under a revolving credit facility (the “Revolving Credit Facility”), which will mature on May 4, 2024, subject to our compliance with certain financial covenants. At December 31, 2021, we had no borrowings outstanding under the Credit Agreement and $6.1 million of letters of credit issued under the Credit Agreement at a fee of 1.75 percent per annum.
ADAMS RESOURCES & ENERGY, INC. AND SUBSIDIARIES
NOTES TO CONSOLIDATED FINANCIAL STATEMENTS
For each borrowing under the Revolving Credit Facility, we can elect whether the loans bear interest at (i) the Base Rate plus Applicable Margin; or (ii) the LIBOR Rate plus Applicable Margin. Base Rate is the highest of (a) the Prime Rate, (b) the Federal Funds Rate, plus 0.50 percent and (c) LIBOR for an interest period of three months plus 1.00 percent. The estimated fair valueApplicable Margin to be added to a Base Rate borrowing is 0.75 percent. The LIBOR Rate is (x) LIBOR (which shall not be less than 1.00 percent) divided by (y) 1.00 minus the Eurodollar Reserve Percentage. The Applicable Margin to be added to a LIBOR borrowing is 1.75 percent. A commitment fee of forward month commodity contracts (derivatives) reflected0.25 percent per annum will accrue on the daily average unused amount of the commitments under the Revolving Credit Facility.
Under the Credit Agreement, we are required to maintain compliance with the following financial covenants on a pro forma basis, after giving effect to any borrowings (in each case commencing with the fiscal quarter ending June 30, 2021): (i) the Consolidated Total Leverage Ratio, which is the ratio of (a) Consolidated Funded Indebtedness on such date to (b) Consolidated EBITDA for the most recently completed Reference Period shall not be greater than 3.00 to 1.00; (ii) the Current Ratio, which is (a) consolidated current assets to (b) consolidated current liabilities, in each case with certain exclusions, shall not be less than 1.25 to 1.00; (iii) Consolidated Interest Coverage Ratio, which is the ratio of (a) Consolidated EBITDA for the most recently completed Reference Period to (b) Consolidated Interest Expense for the most recently completed Reference Period shall be not be less than 3.00 to 1.00; and (iv) the Consolidated Tangible Net Worth, which is (a) our shareholders’ equity as shown on our consolidated statement of financial position, with certain exclusions, minus (b) all goodwill and intangible assets as of such date, shall not be less than $100.0 million. The Reference Period is the most recently completed four consecutive fiscal quarters.
Consolidated EBITDA is defined under the Credit Agreement as: (a) Consolidated Net Income for such period plus (b) the sum of the following, without duplication, to the extent deducted in determining Consolidated Net Income for such period: (i) Consolidated Interest Expense; (ii) expense for taxes measured by net income, profits or capital (or any similar measures), paid or accrued, including federal and state and local income taxes, foreign income taxes and franchise taxes; and (iii) depreciation, amortization and other non-cash charges or expenses, excluding any non-cash charge or expense that represents an accrual for a cash expense to be taken in a future period; less (c) the sum of the following, without duplication, to the extent included in determining Consolidated Net Income for such period: (i) interest income, (ii) federal, state, local and foreign income tax credits us and our subsidiaries for such period (to the extent not netted from income tax expense); (iii) any unusual and non-recurring gains; (iv) non-cash gains or non-cash items; and (v) any cash expense made during such period which represents the reversal of any non-cash expense that was added in a prior period pursuant to clause (b)(iii) above subsequent to the fiscal quarter in which the relevant non-cash expenses, charges or losses were incurred.
The Credit Agreement contains certain customary representations and warranties and affirmative and negative covenants. The affirmative covenants require us to provide the lenders with certain financial statements, business plans, compliance certificates and other documents and reports and to comply with certain laws. The negative covenants restrict each of the borrowers’ ability to incur additional indebtedness, create additional liens on its assets, make certain investments, dispose of its assets or engage in a merger or other similar transaction or engage in transactions with affiliates, subject, in each case, to the various exceptions and conditions described in the accompanying consolidated balance sheet were as follows atCredit Agreement. The negative covenants further restrict our ability to make certain restricted payments.
Our obligations under the date indicated (in thousands):
| | | | | | | | | | | | | | | | | | | | | | | |
| December 31, 2018 | | | | | | |
| Balance Sheet Location and Amount | | | | | | |
| Current | | Other | | Current | | Other |
| Assets | | Assets | | Liabilities | | Liabilities |
| Asset derivatives: | | | | | | | |
| Fair value forward hydrocarbon commodity | | | | | | | |
| contracts at gross valuation | $ | 162 | | $ | — | | $ | — | | $ | — |
| Liability derivatives: | | | | | | | |
| Fair value forward hydrocarbon commodity | | | | | | | |
| contracts at gross valuation | — | | — | | 139 | | — |
| Less counterparty offsets | — | | — | | — | | — |
| As reported fair value contracts | $ | 162 | | $ | — | | $ | 139 | | $ | — |
At December 31, 2017,2021, we were in compliance with all covenants under the Credit Agreement. We incurred $0.3 million of debt issuance costs, which are included in other assets and are being amortized to interest expense over the term of the Credit Agreement.
ADAMS RESOURCES & ENERGY, INC. AND SUBSIDIARIES
NOTES TO CONSOLIDATED FINANCIAL STATEMENTS
Note 13. Derivative Instruments and Fair Value Measurements
Derivative Instruments
At December 31, 2021, we had in place twenty4 commodity purchase and sale contracts, of which four of these contracts2 had noa fair value associated with them as the contractual prices of crude oil were withinoutside the range of prices specified in the agreements. These commodity purchase and sale contracts encompass approximately 324 barrels per day of crude oil during January 2022 through December 2022.
At December 31, 2020, we had in place 6 commodity purchase and sale contracts, of which 3 had a fair value associated with them as the contractual prices of crude oil were outside the range of prices specified in the agreements. These commodity purchase and sale contracts encompassed approximately:
•452approximately 192 barrels per day of crude oil during January 2018;
•322 barrels per day of crude oil during February through May 2018;
•258 barrels per day of crude oil during June 2018;
•646 barrels per day of crude oil during July 2018;
•322 barrels per day of crude oil during August through September 2018; and
•258 barrels per day of crude oil during October2021 through December 2018.2021.
The estimated fair value of forward month commodity contracts (derivatives) reflected in the accompanying consolidated balance sheetsheets were as follows at the datedates indicated (in thousands):
| | | | | | | | | | | | | | | | | | | | | | | |
| December 31, 2017 | | | | | | |
| Balance Sheet Location and Amount | | | | | | |
| Current | | Other | | Current | | Other |
| Assets | | Assets | | Liabilities | | Liabilities |
| Asset derivatives: | | | | | | | |
| Fair value forward hydrocarbon commodity | | | | | | | |
| contracts at gross valuation | $ | 166 | | $ | — | | $ | — | | $ | — |
| Liability derivatives: | | | | | | | |
| Fair value forward hydrocarbon commodity | | | | | | | |
| contracts at gross valuation | — | | — | | 145 | | — |
| Less counterparty offsets | — | | — | | — | | — |
| As reported fair value contracts | $ | 166 | | $ | — | | $ | 145 | | $ | — |
| | | | | | | | | | | | | | | | | | | | | | | |
| Balance Sheet Location and Amount |
| Current | | Other | | Current | | Other |
| December 31, 2021 | Assets | | Assets | | Liabilities | | Liabilities |
| Asset derivatives: | | | | | | | |
| Fair value forward hydrocarbon commodity | | | | | | | |
| contracts at gross valuation | $ | 347 | | | $ | — | | | $ | — | | | $ | — | |
| Liability derivatives: | | | | | | | |
| Fair value forward hydrocarbon commodity | | | | | | | |
| contracts at gross valuation | — | | | — | | | 324 | | | — | |
| Less counterparty offsets | — | | | — | | | — | | | — | |
| As reported fair value contracts | $ | 347 | | | $ | — | | | $ | 324 | | | $ | — | |
| | | | | | | |
| December 31, 2020 | | | | | | | |
| Asset derivatives: | | | | | | | |
| Fair value forward hydrocarbon commodity | | | | | | | |
| contracts at gross valuation | $ | 61 | | | $ | — | | | $ | — | | | $ | — | |
| Liability derivatives: | | | | | | | |
| Fair value forward hydrocarbon commodity | | | | | | | |
| contracts at gross valuation | — | | | — | | | 52 | | | — | |
| Less counterparty offsets | — | | | — | | | — | | | — | |
| As reported fair value contracts | $ | 61 | | | $ | — | | | $ | 52 | | | $ | — | |
We only enter into commodity contracts with creditworthy counterparties and evaluate our exposure to significant counterparties on an ongoing basis. At December 31, 20182021 and 2017,2020, we were not holding nor have we posted any collateral to support our forward month fair value derivative activity. We are not subject to any credit-risk related trigger events. We have no other financial investment arrangements that would serve to offset our derivative contracts.
ADAMS RESOURCES & ENERGY, INC. AND SUBSIDIARIES
NOTES TO CONSOLIDATED FINANCIAL STATEMENTS
Forward month commodity contracts (derivatives) reflected in the accompanying consolidated statements of operations were as follows for the periods indicated (in thousands):
| | | | | | | | | | | | | | | | | |
| Gains (Losses) | | | | |
| Year Ended December 31, | | | | |
| 2018 | | 2017 | | 2016 |
| | | | | |
| Revenues – marketing | $ | 2 | | $ | (26) | | $ | 243 |
| | | | | | | | | | | | | | | | | |
| Gains (Losses) |
| Year Ended December 31, |
| 2021 | | 2020 | | 2019 |
| | | | | |
| Revenues – marketing | $ | 14 | | | $ | 9 | | | $ | (24) | |
Fair Value Measurements
The following tables set forth,table reflects, by level with the Level 1, 2 and 3 fair value hierarchy, the carrying values of our financial assets and liabilities at the dates indicated (in thousands):
| | | | | | | | | | | | | | | | | | | | | | | | | | | | | |
| December 31, 2018 | | | | | | | | |
| Fair Value Measurements Using | | | | | | | | |
| Quoted Prices | | | | | | | | |
| in Active | | Significant | | | | | | |
| Markets for | | Other | | Significant | | | | |
| Identical Assets | | Observable | | Unobservable | | | | |
| and Liabilities | | Inputs | | Inputs | | Counterparty | | |
| (Level 1) | | (Level 2) | | (Level 3) | | Offsets | | Total |
| | | | | | | | | |
| Derivatives: | | | | | | | | | |
| Current assets | $ | — | | $ | 162 | | $ | — | | $ | — | | $ | 162 |
| Current liabilities | — | | (139) | | — | | — | | (139) |
| Net value | $ | — | | $ | 23 | | $ | — | | $ | — | | $ | 23 |
| | | December 31, 2017 | | | Fair Value Measurements Using | |
| | Fair Value Measurements Using | | | | Quoted Prices | | |
| | Quoted Prices | | | | in Active | | Significant | |
| | in Active | | Significant | | | Markets for | | Other | | Significant | |
| | Markets for | | Other | | Significant | | | Identical Assets | | Observable | | Unobservable | |
| | Identical Assets | | Observable | | Unobservable | | | and Liabilities | | Inputs | | Inputs | | Counterparty | |
| | and Liabilities | | Inputs | | Inputs | | Counterparty | | | (Level 1) | | (Level 2) | | (Level 3) | | Offsets | | Total |
| | (Level 1) | | (Level 2) | | (Level 3) | | Offsets | | Total | | | | | | | | | | |
| | December 31, 2021 | | December 31, 2021 | |
| Derivatives: | Derivatives: | | Derivatives: | |
| Current assets | Current assets | $ | — | | $ | 166 | | $ | — | | $ | — | | $ | 166 | Current assets | $ | — | | | $ | 347 | | | $ | — | | | $ | — | | | $ | 347 | |
| Current liabilities | Current liabilities | — | | (145) | | — | | — | | (145) | Current liabilities | — | | | (324) | | | — | | | — | | | (324) | |
| Net value | Net value | $ | — | | $ | 21 | | $ | — | | $ | — | | $ | 21 | Net value | $ | — | | | $ | 23 | | | $ | — | | | $ | — | | | $ | 23 | |
| | December 31, 2020 | | December 31, 2020 | |
| Derivatives: | | Derivatives: | |
| Current assets | | Current assets | $ | — | | | $ | 61 | | | $ | — | | | $ | — | | | $ | 61 | |
| Current liabilities | | Current liabilities | — | | | (52) | | | — | | | — | | | (52) | |
| Net value | | Net value | $ | — | | | $ | 9 | | | $ | — | | | $ | — | | | $ | 9 | |
These assets and liabilities are measured on a recurring basis and are classified based on the lowest level of input used to estimate their fair value. Our assessment of the relative significance of these inputs requires judgments.
When determining fair value measurements, we make credit valuation adjustments to reflect both our own nonperformance risk and our counterparty’s nonperformance risk. When adjusting the fair value of derivative contracts for the effect of nonperformance risk, we consider the impact of netting and any applicable credit enhancements. Credit valuation adjustments utilize Level 3 inputs, such as credit scores to evaluate the likelihood of default by us or our counterparties. At December 31, 20182021 and 2017,2020, credit valuation adjustments were not significant to the overall valuation of our fair value contracts. As a result, applicable fair value assets and liabilities are included in their entirety in the fair value hierarchy.
ADAMS RESOURCES & ENERGY, INC. AND SUBSIDIARIES
NOTES TO CONSOLIDATED FINANCIAL STATEMENTS
Nonrecurring Fair Value Measurements
Certain nonfinancial assets and liabilities are measured at fair value on a nonrecurring basis and are subject to fair value adjustments in certain circumstances, such as when there is evidence of impairment. During the year ended December 31, 2018, we had no long-lived assets that were subject to non-recurring fair value measurements.
The following table presents categories of long-lived assets that were subject to non-recurring fair value measurements during the year ended December 31, 2017 (in thousands):
| | | | | | | | | | | | | | | | | | | | | | | | | | | | | |
| | | Fair Value Measurements at the End of the Reporting Period Using | | | | | | |
| | | Quoted Prices | | | | | | |
| | | in Active | | Significant | | | | |
| Carrying | | Markets for | | Other | | Significant | | Total |
| Value at | | Identical Assets | | Observable | | Unobservable | | Non-Cash |
| December 31, | | and Liabilities | | Inputs | | Inputs | | Impairment |
| 2017 | | (Level 1) | | (Level 2) | | (Level 3) | | Loss |
| | | | | | | | | |
| Oil and gas properties — | | | | | | | | | |
| Investment in AREC | $ | 425 | | $ | — | | $ | 425 | | $ | — | | $ | 3,505 |
| Investment in VestaCare | — | | — | | — | | — | | 2,500 |
| | | | | | | | | $ | 6,005 |
The following table presents categories of long-lived assets that were subject to non-recurring fair value measurements during the year ended December 31, 2016 (in thousands):
| | | | | | | | | | | | | | | | | | | | | | | | | | | | | |
| | | Fair Value Measurements at the End of the Reporting Period Using | | | | | | |
| | | Quoted Prices | | | | | | |
| | | in Active | | Significant | | | | |
| Carrying | | Markets for | | Other | | Significant | | Total |
| Value at | | Identical Assets | | Observable | | Unobservable | | Non-Cash |
| December 31, | | and Liabilities | | Inputs | | Inputs | | Impairment |
| 2016 | | (Level 1) | | (Level 2) | | (Level 3) | | Loss |
| | | | | | | | | |
| Investment in Bencap | $ | — | | $ | — | | $ | — | | $ | — | | $ | 2,200 |
| Oil and gas properties | 62,784 | | — | | — | | 62,784 | | 313 |
| | | | | | | | | $ | 2,513 |
ADAMS RESOURCES & ENERGY, INC. AND SUBSIDIARIES
NOTES TO CONSOLIDATED FINANCIAL STATEMENTS
Note 12.14. Income Taxes
The components of our income tax (provision) benefit were as follows for the periods indicated (in thousands):
| | | | | | | | | | | | | | | | | |
| Year Ended December 31, | | | | |
| 2018 | | 2017 | | 2016 |
| Current: | | | | | |
| Federal | $ | 388 | | $ | (1,418) | | $ | (2,103) |
| State | 39 | | 523 | | (675) |
| Total current | 427 | | (895) | | (2,778) |
| Deferred: | | | | | |
| Federal | (752) | | 3,722 | | 777 |
| State | (184) | | 118 | | 80 |
| Total deferred | (936) | | 3,840 | | 857 |
Total (provision for) benefit from income taxes (1) | $ | (509) | | $ | 2,945 | | $ | (1,921) |
______________
(1) 2016 includes a tax benefit of $0.8 million related to losses from our investment in Bencap, and is included in the loss from investment in unconsolidated affiliate category on the consolidated statements of operations. | | | | | | | | | | | | | | | | | |
| Year Ended December 31, |
| 2021 | | 2020 | | 2019 |
| Current: | | | | | |
| Federal | $ | (4,811) | | | $ | 13,246 | | | $ | 164 | |
| State | (358) | | | (327) | | | (375) | |
| Total current | (5,169) | | | 12,919 | | | (211) | |
| Deferred: | | | | | |
| Federal | 1,347 | | | (6,631) | | | (2,063) | |
| State | 54 | | | 242 | | | (22) | |
| Total deferred | 1,401 | | | (6,389) | | | (2,085) | |
| Total (provision for) benefit from income taxes | $ | (3,768) | | | $ | 6,530 | | | $ | (2,296) | |
A reconciliation of the (provision for) benefit from income taxes with amounts determined by applying the statutory U.S. federal income tax rate to income before income taxes was as follows for the periods indicated (in thousands):
| | | | | | | | | | | | | | | | | |
| Year Ended December 31, | | | | |
| 2018 | | 2017 | | 2016 |
| | | | | |
Pre-tax net book income (loss) (1) | $ | 3,454 | | $ | (3,427) | | $ | 4,434 |
| | | | | |
| Statutory federal income tax (provision) benefit | $ | (725) | | $ | 1,165 | | $ | (1,552) |
| State income tax (provision) benefit | (145) | | 736 | | (387) |
| Federal statutory depletion | — | | 153 | | 62 |
| Federal tax rate adjustment | — | | 2,007 | | — |
| Valuation allowance | — | | (1,038) | | — |
| Reverse valuation allowance | 98 | | — | | — |
| Return to provision adjustments | 388 | | — | | — |
| Other | (125) | | (78) | | (44) |
| Total (provision for) benefit from income taxes | $ | (509) | | $ | 2,945 | | $ | (1,921) |
Effective income tax rate (2) (3) | 15% | | | 86% | | | 43% | |
| | | | | | | | | | | | | | | | | |
| Year Ended December 31, |
| 2021 | | 2020 | | 2019 |
| | | | | |
| Pre-tax net book income (loss) | $ | 15,656 | | | $ | (5,535) | | | $ | 10,503 | |
| | | | | |
| Statutory federal income tax (provision) benefit | $ | (3,288) | | | $ | 1,162 | | | $ | (2,206) | |
| State income tax provision | (224) | | | (16) | | | (397) | |
| 2018/2019 carryback | — | | | 2,664 | | | — | |
| 2020 carryback | — | | | 2,642 | | | — | |
| Return to provision adjustments | (88) | | | 13 | | | 285 | |
| Other | (168) | | | 65 | | | 22 | |
| Total (provision for) benefit from income taxes | $ | (3,768) | | | $ | 6,530 | | | $ | (2,296) | |
Effective income tax rate (1) | 24 | % | | 118 | % | | 22 | % |
_______________
(1) 2016 includes the pre-tax loss from investment in unconsolidated affiliate of $2.2 million.
(2) Excluding the adjustment related to the federal tax rate change,carryback of the 2018, 2019 and 2020 net operating losses, the effective income tax rate for 2017 is 58the year ended December 31, 2020 was 22 percent.
(3) Excluding the adjustment related to the return to provision, the effective income tax rate for 2018 is 26 percent.
ADAMS RESOURCES & ENERGY, INC. AND SUBSIDIARIES
NOTES TO CONSOLIDATED FINANCIAL STATEMENTS
Deferred income taxes reflect the net difference between the financial statement carrying amounts and the underlying income tax basis in these items. The components of the federal deferred tax asset (liability) were as follows at the dates indicated (in thousands):
| | | | | | | | | | | |
| December 31, | | |
| 2018 | | 2017 |
| | | |
Long-term deferred tax asset (liability): (1) | | | |
| Prepaid and other insurance | $ | (170) | | $ | (684) |
| Property | (5,259) | | (2,497) |
| Investments in unconsolidated affiliates | 525 | | 623 |
| Valuation allowance related to investments in unconsolidated affiliates | (525) | | (623) |
| Net operating loss | 1,436 | | — |
| Other | (245) | | (121) |
| Net long-term deferred tax liability | (4,238) | | (3,302) |
| Net deferred tax liability | $ | (4,238) | | $ | (3,302) |
______________
(1) Amounts as of December 31, 2017 have been revalued at 21 percent as a result of the enactment of the Tax Cuts and Jobs Act on December 22, 2017. | | | | | | | | | | | |
| December 31, |
| 2021 | | 2020 |
| | | |
| Long-term deferred tax asset (liability): | | | |
| Prepaid and other insurance | $ | (832) | | | $ | (861) | |
| Property | (11,682) | | | (12,807) | |
| Investment in unconsolidated affiliate | 525 | | | 525 | |
| Valuation allowance related to investment in unconsolidated affiliate | (525) | | | (525) | |
| Net operating loss | 621 | | | 536 | |
| Other | 586 | | | 423 | |
| Net long-term deferred tax liability | (11,307) | | | (12,709) | |
| Net deferred tax liability | $ | (11,307) | | | $ | (12,709) | |
Financial statement recognition and measurement of positions taken, or expected to be taken, by an entity in its income tax returns must consider the uncertainty and judgment involved in the determination and filing of income taxes. Tax positions taken in an income tax return that are recognized in the financial statements must satisfy a more-likely-than-not recognition threshold, assuming that the tax position will be examined by taxing authorities with full knowledge of all relevant information. We have no significant unrecognized tax benefits. Interest and penalties associated with income tax liabilities are classified as income tax expense.
The earliest tax years remaining open for audit for federal and major states of operations are as follows:
| | | | | |
| Earliest Open |
| Tax Year |
| |
| Federal | 2014 2015 |
| Texas | 2014 2017 |
| Louisiana | 2015 2018 |
| Michigan | 2014 2017 |
Other Matters
The Tax Cuts and Jobs Act (the “Act”) was signed into law on December 22, 2017. The Act changed many aspects of U.S. corporate income taxation and included a reduction of the corporate income tax rate from 35 percent to 21 percent, implementation of a territorial tax system and imposition of a tax on deemed repatriated earnings of foreign subsidiaries. We recognized the tax effects of the Act in the year ended December 31, 2017 and recorded a $2.0 million tax benefit, which relates entirely to the remeasurement of deferred tax liabilities to the 21 percent tax rate.
ADAMS RESOURCES & ENERGY, INC. AND SUBSIDIARIES
NOTES TO CONSOLIDATED FINANCIAL STATEMENTS
Note 13. Share-Based15. Stock-Based Compensation Plan
In May 2018, our shareholders approved the 2018 LTIP, a long-term incentive plan under which any employee or non-employee director who provides services to us is eligible to participate in the plan. The 2018 LTIP, which is overseen by the Compensation Committee of our Board of Directors, provides for the grant of various types of equity awards, of which restricted stock unit awards and performance-based compensation awards were granted during the second quarter of 2018.have been granted. The maximum number of shares authorized for issuance under the 2018 LTIP is 150,000 shares, and the 2018 LTIP is effective until May 8, 2028. We began awarding share-basedstock-based compensation to eligible employees and directors in June 2018. After giving effect to awards granted and forfeitures made under the 2018 LTIP, and assuming the potential achievement of the maximum amounts of the performance factors through December 31, 2018,2021, a total of 120,40355,809 shares were available for issuance. During the year ended December 31, 2018, we
Compensation expense recognized $0.3 million of compensation expense in connection with equity-based awards.awards was as follows for the periods indicated (in thousands):
| | | | | | | | | | | | | | | | | |
| Year Ended December 31, |
| 2021 | | 2020 | | 2019 |
| | | | | |
| Compensation expense | $ | 854 | | | $ | 643 | | | $ | 478 | |
If dividends are paid with respect to our common shares during the vesting period, an equivalent amount will accrue and be held by us without interest until the restricted stock unit awards and performance share unit awards vest, at which time the amount will be paid to the recipient. If the award is forfeited prior to vesting, the accrued dividends will also be forfeited. At December 31, 2018,2021 and 2020, we had $10.0 thousand$82,500 and $50,800, respectively, of accrued dividend amounts for awards granted under the 2018 LTIP.
Restricted Stock Unit Awards
A restricted stock unit award is a grant of a right to receive our common shares in the future at no cost to the recipient apart from fulfilling service and other conditions once a defined vesting period expires, subject to customary forfeiture provisions. A restricted stock unit award will either be settled by the delivery of common shares or by the payment of cash based upon the fair market value of a specified number of shares, at the discretion of the Compensation Committee, subject to the terms of the applicable award agreement. The Compensation Committee intends for these awards to vest with the settlement of common shares. Restricted stock unit awards generally vest at a rate of approximately 33 percent per year beginning one year after the grant date and are non-vested until the required service periods expire.
The fair value of a restricted stock unit award is based on the market price per share of our common shares on the date of grant. Compensation expense is recognized based on the grant date fair value over the requisite service or vesting period.
ADAMS RESOURCES & ENERGY, INC. AND SUBSIDIARIES
NOTES TO CONSOLIDATED FINANCIAL STATEMENTS
The following table presents restricted stock unit award activity for the periods indicated:
| | | Weighted- | | Weighted- |
| | Average Grant | | Average Grant |
| | Number of | | Date Fair Value | | Number of | | Date Fair Value |
| | Shares | | per Share (1) | | Shares | | per Share (1) |
| | Restricted stock unit awards at January 1, 2018 | — | | $ | — | |
| Restricted stock unit awards at January 1, 2019 | | Restricted stock unit awards at January 1, 2019 | 13,733 | | | $ | 43.00 | |
Granted (2) | Granted (2) | 13,733 | | $ | 43.00 | Granted (2) | 14,376 | | | $ | 34.00 | |
| Vested | Vested | — | | $ | — | Vested | (7,188) | | | $ | 41.90 | |
| Forfeited | Forfeited | — | | $ | — | Forfeited | (2,139) | | | $ | 38.42 | |
| Restricted stock unit awards at December 31, 2018 | 13,733 | | $ | — | |
| Restricted stock unit awards at December 31, 2019 | | Restricted stock unit awards at December 31, 2019 | 18,782 | | | $ | 37.05 | |
Granted (3) | | Granted (3) | 20,346 | | | $ | 24.85 | |
| Vested | | Vested | (9,578) | | | $ | 36.36 | |
| Forfeited | | Forfeited | (2,060) | | | $ | 30.07 | |
| Restricted stock unit awards at December 31, 2020 | | Restricted stock unit awards at December 31, 2020 | 27,490 | | | $ | 28.64 | |
Granted (4) | | Granted (4) | 26,369 | | | $ | 29.70 | |
| Vested | | Vested | (14,244) | | | $ | 30.20 | |
| Forfeited | | Forfeited | (1,350) | | | $ | 28.92 | |
| Restricted stock unit awards at December 31, 2021 | | Restricted stock unit awards at December 31, 2021 | 38,265 | | | $ | 28.78 | |
____________________
(1)Determined by dividing the aggregate grant date fair value of awards by the number of awards issued.
(2)The aggregate grant date fair value of restricted stock unit awards issued during 20182019 was $0.6$0.5 million based on a grant date market price of our common shares of $43.00$34.00 per share.
(3)The aggregate grant date fair value of restricted stock unit awards issued during 2020 was $0.5 million based on grant date market prices of our common shares ranging from $24.77 to $26.23 per share.
(4)The aggregate grant date fair value of restricted stock unit awards issued during 2021 was $0.8 million based on grant date market prices of our common shares ranging from $29.70 to $30.00 per share.
Unrecognized compensation cost associated with restricted stock unit awards was approximately $0.4 million at December 31, 2018.2021. Due to the graded vesting provisions of these awards, we expect to recognize the remaining compensation cost for these awards over a weighted-average period of 1.51.4 years.
ADAMS RESOURCES & ENERGY, INC. AND SUBSIDIARIES
NOTES TO CONSOLIDATED FINANCIAL STATEMENTS
Performance Share Unit Awards
An award granted as performance-based compensation is awarded to a participant contingent upon attainment of our future performance goals during a performance cycle. The performancePerformance goals wereare pre-established by the Compensation Committee. Following the end of the performance period, the holder of a performance-based compensation award is entitled to receive payment of an amount not exceeding the number of shares of common stock subject to, or the maximum value of, the performance-based compensation award, based on the achievement of the performance measures for the performance period. The performance share unit awards generally vest in full approximately three years after grant date, and are non-vested until the required service period expires.
The fair value of a performance share unit award is based on the market price per share of our common shares on the date of grant. Compensation expense is recognized based on the grant date fair value over the requisite service or vesting period. Compensation expense will beis generally adjusted for the performance goals on a quarterly basis.
The following table presents performance share unit award activity for the periods indicated:
| | | | | | | | | | | | | | |
| | | | Weighted- |
| | | | Average Grant |
| | Number of | | Date Fair Value |
| | Shares | | per Share (1) |
| | | | |
| Performance share unit awards at January 1, 2018 | | — | | $ | — |
Granted (2) | | 7,932 | | $ | 43.00 |
Performance factor decrease (3) | | (3,966) | | $ | 43.00 |
| Vested | | — | | $ | — |
| Forfeited | | — | | $ | — |
| Performance share unit awards at December 31, 2018 | | 3,966 | | $ | — |
____________________
(1) Determined by dividing the aggregate grant date fair value of awards by the number of awards issued.
(2) The aggregate grant date fair value of performance share unit awards issued during 2018 was $0.2 million based on a grant date market price of our common share of $43.00 per share and assuming a performance factor of 100 percent.
(3) The performance factor was lowered to 50 percent at the end of 2018 based upon a comparison of actual results to performance goals.
Unrecognized compensation cost associated with performance share unit awards was approximately $0.1 million at December 31, 2018. We expect to recognize the remaining compensation cost for these awards over a weighted-average period of 2.4 years.
ADAMS RESOURCES & ENERGY, INC. AND SUBSIDIARIES
NOTES TO CONSOLIDATED FINANCIAL STATEMENTS
The following table presents performance share unit award activity for the periods indicated:
| | | | | | | | | | | | | | |
| | | | Weighted- |
| | | | Average Grant |
| | Number of | | Date Fair Value |
| | Shares | | per Share (1) |
| | | | |
| Performance share unit awards at January 1, 2019 | | 3,966 | | | $ | 43.00 | |
Granted (2) | | 8,094 | | | $ | 34.00 | |
Performance factor decrease (3) | | (7,312) | | | $ | 34.23 | |
| Vested | | (416) | | | $ | 43.00 | |
| Forfeited | | (1,545) | | | $ | 37.37 | |
| Performance share unit awards at December 31, 2019 | | 2,787 | | | $ | 43.00 | |
Granted (4) | | 10,781 | | | $ | 24.92 | |
Performance factor increase (3) | | 3,981 | | | $ | 24.92 | |
| Vested | | (713) | | | $ | 28.55 | |
| Forfeited | | (595) | | | $ | 30.22 | |
| Performance share unit awards at December 31, 2020 | | 16,241 | | | $ | 27.67 | |
Granted (5) | | 12,205 | | | $ | 29.70 | |
Performance factor decrease (3) | | (4,493) | | | $ | 29.70 | |
| Vested | | (2,461) | | | $ | 43.00 | |
| Forfeited | | — | | | $ | — | |
| Performance share unit awards at December 31, 2021 | | 21,492 | | | $ | 26.64 | |
____________________
(1)Determined by dividing the aggregate grant date fair value of awards by the number of awards issued.
(2)The aggregate grant date fair value of performance share unit awards issued during 2019 was $0.3 million based on a grant date market price of our common shares of $34.00 per share and assuming a performance factor of 100 percent.
(3)The performance factor for awards granted in 2019 was lowered to 0 percent based on a comparison of actual results for 2019 to performance goals. The performance factor for awards granted in 2020 was increased to 138.5 percent based upon a comparison of actual results for 2020 to performance goals. The performance factor for awards granted in 2021 decreased to 63.1 percent based upon a comparison of actual results for 2021 to performance goals.
(4)The aggregate grant date fair value of performance share unit awards issued during 2020 was $0.2 million based on grant date market prices of our common shares ranging from $24.77 to $26.23 per share and assuming a performance factor of 100 percent.
(5)The aggregate grant date fair value of performance share unit awards issued during 2021 was $0.4 million based on a grant date market price of our common shares of $29.70 per share and assuming a performance factor of 100 percent.
Unrecognized compensation cost associated with performance share unit awards was approximately $0.3 million at December 31, 2021. We expect to recognize the remaining compensation cost for these awards over a weighted-average period of 1.7 years.
ADAMS RESOURCES & ENERGY, INC. AND SUBSIDIARIES
NOTES TO CONSOLIDATED FINANCIAL STATEMENTS
Note 14.16. Supplemental Cash Flow Information
Supplemental cash flows and non-cash transactions were as follows for the periods indicated (in thousands):
| | | | | | | | | | | | | | | | | |
| Year Ended December 31, | | | | |
| 2018 | | 2017 | | 2016 |
| | | | | |
| Cash paid for interest | $ | 109 | | $ | 22 | | $ | 2 |
| Cash paid for federal and state income taxes | 787 | | 459 | | 2,589 |
| | | | | |
| Non-cash transactions: | | | | | |
Change in accounts payable related to property and equipment additions | 1,685 | | 70 | | 679 |
| Property and equipment acquired under capital leases | 2,898 | | 1,808 | | — |
| | | | | | | | | | | | | | | | | |
| Year Ended December 31, |
| 2021 | | 2020 | | 2019 |
| | | | | |
| Cash paid for interest | $ | 746 | | | $ | 444 | | | $ | 636 | |
| Cash paid for federal and state income taxes | 2,251 | | | 418 | | | 234 | |
| Cash refund for NOL carryback under CARES Act | 3,712 | | | 2,703 | | | — | |
| | | | | |
| Non-cash transactions: | | | | | |
Change in accounts payable related to property and equipment additions | — | | | (1,237) | | | (448) | |
| Property and equipment acquired under finance leases | 2,083 | | | 11,412 | | | 4,148 | |
| Issuance of common shares in asset acquisition (see Note 6) | — | | | — | | | 392 | |
| Receivable for sale of property and equipment | — | | | — | | | 952 | |
See Note 17 for information related to non-cash transactions related to leases.
Note 15. Commitment and Contingencies
Capital Lease Obligations
During 2017 and 2018, we entered into capital leases for certain of our tractors in our crude oil marketing segment. The following table summarizes our principal contractual commitments outstanding under our capital leases at December 31, 2018 for the next five years, and in total thereafter (in thousands):
| | | | | |
| 2019 | $ | 1,052 |
| 2020 | 1,052 |
| 2021 | 1,052 |
| 2022 | 909 |
| 2023 | 451 |
| Thereafter | — |
| Total minimum lease payments | 4,516 |
| Less: Amount representing interest | (424) |
| Present value of capital lease obligations | 4,092 |
| Less current portion of capital lease obligations | (883) |
| Total long-term capital lease obligations | $ | 3,209 |
Operating Lease Obligations17. Leases
We account for leases under ASC 842, Leases, which requires lessees to recognize a ROU asset and a corresponding lease certain liability for leases with terms longer than twelve months. We determine if an arrangement is a lease at inception. Operating leases are included in operating lease ROU assets, current liabilities and long-term operating lease liabilities in the consolidated balance sheets. Finance leases are included in property and equipment, under noncancelablecurrent liabilities and cancelablelong-term finance lease liabilities in the consolidated balance sheets.
ROU assets represent our right to use an underlying asset for the lease term and lease liabilities represent our obligation to make lease payments arising from the lease. ROU assets and liabilities are recognized at the lease commencement date based on the present value of lease payments over the lease term. For determining the present value of lease payments, we use the discount rate implicit in the lease when readily determinable. As most of our leases do not provide an implicit rate, we use an incremental borrowing rate in determining the present value of lease payments that approximates the rate of interest we would have to pay to borrow on a collateralized basis over a similar term. At adoption, the ROU asset also includes any lease payment made and excludes lease incentives and initial direct costs. Our lease terms may include options to extend or terminate the lease when it is reasonably certain that we will exercise that option. Lease expense for lease payments is recognized on a straight-line basis over the lease term.
We are a lessee in noncancellable (i) operating leases. Our significant lease agreements consist of (i) arrangements with independent truck owner-operatorsleases for use of theiroffice space, equipment and driver services; (ii) leased office space; and (iii) certain lease and terminal access contracts in order to providefor tank storage and dock access for our crude oil marketing business. Currently,business, and (ii) finance leases for tractors, trailers, a tank storage and throughput arrangement in our significantcrude oil marketing business and office equipment. Leases with an initial term of twelve months or less are not recorded on the balance sheet. Our lease agreements have remaining lease terms that rangeranging from one year to sevenapproximately eight years. NaN of our finance lease agreements for tractors and trailers contain residual value guarantee provisions, which would become due at the expiration of the finance lease if the fair value of the lease vehicles is less than the guaranteed residual value. At December 31, 2021, we have recorded a liability of $2.2 million for the estimated end of term loss related to these residual value guarantees as we expect that we will pay the full amount of the guarantees at the end of the leases.
ADAMS RESOURCES & ENERGY, INC. AND SUBSIDIARIES
NOTES TO CONSOLIDATED FINANCIAL STATEMENTS
Lease expense is charged to operating costs and expensesOur lease agreements do not contain any leases with material variable lease payments (i.e., payments that depend on a straight-line basis over the periodpercentage of expected economic benefit. Contingent rentalsales of a lessee or payments are expensedthat increase based upon an index such as incurred. WeCPI), residual value guarantees probable of being paid other than those noted above or material restrictive covenants. Lease agreements with lease and non-lease components are generally requiredaccounted for separately when practical. For leases where the lease and non-lease component are comingled and the non-lease component is determined to perform routine maintenance onbe insignificant when compared to the underlying leased assets. Maintenancelease component, the lease and repairsthe non-lease components are treated as a single lease component for all asset classes.
Some leases include one or more options to renew, with renewal terms that can extend the lease term for generally one year with exercise of leased assets resulting fromlease renewal options being at our operations are charged tosole discretion as lessee.
The following table provides the components of lease expense as incurred. Rental expense was as follows for the periods indicated (in thousands):
| | | | | | | | | | | | | | | | | |
| Year Ended December 31, | | | | |
| 2018 | | 2017 | | 2016 |
| | | | | |
| Rental expense | $ | 11,078 | | $ | 12,073 | | $ | 11,314 |
| | | | | | | | | | | | | | | | | | | | |
| | Year Ended December 31, |
| | 2021 | | 2020 | | 2019 |
| Finance lease cost: | | | | | | |
| Amortization of ROU assets | | $ | 4,744 | | | $ | 2,547 | | | $ | 1,807 | |
| Interest on lease liabilities | | 413 | | | 300 | | | 295 | |
| Operating lease cost | | 2,560 | | | 2,718 | | | 2,933 | |
| Short-term lease cost | | 13,880 | | | 11,020 | | | 9,627 | |
| Variable lease cost | | 7 | | | — | | | — | |
| Total lease expense | | $ | 21,604 | | | $ | 16,585 | | | $ | 14,662 | |
At December 31, 2018, rental obligations under non-cancelable operatingThe following table provides supplemental cash flow and other information related to leases and terminal arrangements with terms in excess of one year for the next five years and thereafter are payable as follows (in thousands):
| | | | | |
| 2019 | $ | 4,242 |
| 2020 | 2,258 |
| 2021 | 2,107 |
| 2022 | 1,782 |
| 2023 | 1,495 |
| Thereafter | 1,488 |
| Total operating lease payments | $ | 13,372 |
Insurance Policies
Under our automobile and workers’ compensation insurance policies that were in place through September 30, 2017, we pre-funded our estimated losses, and therefore, we could either receive a return of premium paid or be assessed for additional premiums up to pre-established limits. Additionally, in certain instances, the risk of insured losses was shared with a group of similarly situated entities through an insurance captive. We have appropriately recognized estimated expenses and liabilities related to these policies for losses incurred but not reported to us or our insurance carrier. The amount of pre-funded insurance premiums left to cover potential future losses are presented in the table below. If the potential insurance claims do not further develop, the pre-funded premiums will be returned to us as a premium refund.
Effective October 1, 2017, we changed the structure of our automobile and workers’ compensation insurance policies. We have exited the group captive and now establish a liability for expected claims incurred but not reported on a monthly basis as we move forward. As claims are paid, the liability is relieved. The amount of pre-funded insurance premiums left to cover potential future losses and our accruals for automobile and workers’ compensation claims were as follows at the datesperiods indicated (in thousands):
| | | | | | | | | | | |
| December 31, | | |
| 2018 | | 2017 |
| | | |
| Pre-funded premiums for losses incurred but not reported | $ | 427 | | $ | 988 |
| Accrued automobile and workers’ compensation claims | 2,246 | | 450 |
| | | | | | | | | | | | | | | | | | | | |
| | Year Ended December 31, |
| | 2021 | | 2020 | | 2019 |
| Cash paid for amounts included in measurement of lease liabilities: | | | | |
Operating cash flows from operating leases (1) | | $ | 2,560 | | | $ | 2,717 | | | $ | 2,934 | |
| Operating cash flows from finance leases | | 326 | | | 291 | | | 295 | |
| Financing cash flows from finance leases | | 4,367 | | | 2,336 | | | 1,697 | |
| | | | | | |
| ROU assets obtained in exchange for new lease liabilities: | | | | | | |
Finance leases (2) | | 2,083 | | | 11,412 | | | 4,148 | |
| Operating leases | | 1,385 | | | 819 | | | 12,006 | |
______________
(1)Amounts are included in Other operating activities on the consolidated cash flow statements.
(2)2020 amount consists of a finance lease agreements for 58 tractors with five year terms, 40 trailers with a six year term that we entered into in connection with the CTL acquisition (see Note 6 for further information) and other office equipment.
We maintain a self-insurance program for managing employee medical claims. A liability for expected claims incurred but not reported is established on a monthly basis. As claims are paid, the liability is relieved. We also maintain third party insurance stop-loss coverage for annual aggregate medical claims exceeding $6.0 million. Medical accrual amounts were as follows at the dates indicated (in thousands):
| | | | | | | | | | | |
| December 31, | | |
| 2018 | | 2017 |
| | | |
| Accrued medical claims | $ | 1,181 | | $ | 1,329 |
ADAMS RESOURCES & ENERGY, INC. AND SUBSIDIARIES
NOTES TO CONSOLIDATED FINANCIAL STATEMENTS
The following table provides lease terms and discount rates for the periods indicated:
| | | | | | | | | | | | | | | | | | | | |
| | Year Ended December 31, |
| | 2021 | | 2020 | | 2019 |
| Weighted-average remaining lease term (years): | | | | | | |
| Finance leases | | 3.60 | | 4.16 | | 3.03 |
| Operating leases | | 3.85 | | 4.57 | | 4.78 |
| | | | | | |
| Weighted-average discount rate: | | | | | | |
| Finance leases | | 2.6 | % | | 3.0 | % | | 4.9 | % |
| Operating leases | | 3.8 | % | | 4.3 | % | | 5.0 | % |
The following table provides supplemental balance sheet information related to leases at the dates indicated (in thousands):
| | | | | | | | | | | | | | |
| | December 31, |
| | 2021 | | 2020 |
| Assets | | | | |
Finance lease ROU assets (1) | | $ | 12,590 | | | $ | 15,251 | |
| Operating lease ROU assets | | 7,113 | | | 8,051 | |
| | | | |
| Liabilities | | | | |
| Current | | | | |
| Finance lease liabilities | | 3,663 | | | 4,112 | |
| Operating lease liabilities | | 2,178 | | | 2,050 | |
| Noncurrent | | | | |
| Finance lease liabilities | | 9,672 | | | 11,507 | |
| Operating lease liabilities | | 4,938 | | | 6,000 | |
______________
(1)Amounts are included in Property and equipment, net on the consolidated balance sheets.
The following table provides maturities of undiscounted lease liabilities at December 31, 2021 (in thousands):
| | | | | | | | | | | | | | |
| | Finance | | Operating |
| | Lease | | Lease |
| | | | |
| 2022 | | $ | 3,941 | | | $ | 2,399 | |
| 2023 | | 3,143 | | | 2,080 | |
| 2024 | | 2,348 | | | 1,911 | |
| 2025 | | 3,771 | | | 394 | |
| 2026 | | 801 | | | 333 | |
| Thereafter | | — | | | 455 | |
| Total lease payments | | 14,004 | | | 7,572 | |
| Less: Interest | | (669) | | | (456) | |
| Present value of lease liabilities | | 13,335 | | | 7,116 | |
| Less: Current portion of lease obligation | | (3,663) | | | (2,178) | |
| Total long-term lease obligation | | $ | 9,672 | | | $ | 4,938 | |
ADAMS RESOURCES & ENERGY, INC. AND SUBSIDIARIES
NOTES TO CONSOLIDATED FINANCIAL STATEMENTS
The following table provides maturities of undiscounted lease liabilities at December 31, 2020 (in thousands):
| | | | | | | | | | | | | | |
| | Finance | | Operating |
| | Lease | | Lease |
| | | | |
| 2021 | | $ | 4,496 | | | $ | 2,343 | |
| 2022 | | 3,562 | | | 2,002 | |
| 2023 | | 2,764 | | | 1,821 | |
| 2024 | | 1,969 | | | 1,700 | |
| 2025 | | 2,992 | | | 222 | |
| Thereafter | | 802 | | | 675 | |
| Total lease payments | | 16,585 | | | 8,763 | |
| Less: Interest | | (966) | | | (713) | |
| Present value of lease liabilities | | 15,619 | | | 8,050 | |
| Less: Current portion of lease obligation | | (4,112) | | | (2,050) | |
| Total long-term lease obligation | | $ | 11,507 | | | $ | 6,000 | |
Note 18. Commitments and Contingencies
Insurance
We have accrued liabilities for estimated workers’ compensation and other casualty claims incurred based upon claim reserves plus an estimate for loss development and incurred but not reported claims. We self-insure a significant portion of expected losses relating to workers’ compensation, general liability and automobile liability, with a self-insured retention of $1.0 million. Insurance is purchased over our retention to reduce our exposure to catastrophic events. Estimates are recorded for potential and incurred outstanding liabilities for workers’ compensation, auto and general liability claims and claims that are incurred but not reported. Estimates are based on adjusters’ estimates, historical experience and statistical methods commonly used within the insurance industry that we believe are reliable. We have also engaged a third-party actuary to perform a review of our accrued liability for these claims as well as potential funded losses in our captive insurance company. Insurance estimates include certain assumptions and management judgments regarding the frequency and severity of claims, claim development and settlement practices and the selection of estimated loss among estimates derived using different methods. Unanticipated changes in these factors may produce materially different amounts of expense that would be reported under these programs.
On October 1, 2020, we elected to utilize a wholly owned insurance captive to insure the self-insured retention for our workers’ compensation, general liability and automobile liability insurance programs.All accrued liabilities associated with periods from October 1, 2017 through current were transferred to the captive.
We maintain excess property and casualty programs with third-party insurers in an effort to limit the financial impact of significant events covered under these programs. Our operating subsidiaries pay premiums to both the excess and reinsurance carriers and our captive for the estimated losses based on an external actuarial analysis. These premiums held by our wholly owned captive are currently held in a restricted account, resulting in a transfer of risk from our operating subsidiaries to the captive.
We also maintain a self-insurance program for managing employee medical claims in excess of employee deductibles. As claims are paid, the liability is relieved.We also maintain third party insurance stop-loss coverage for individual medical claims exceeding a certain minimum threshold. In addition, we maintain $1.2 million of umbrella insurance coverage for annual aggregate medical claims exceeding approximately $11.5 million.
ADAMS RESOURCES & ENERGY, INC. AND SUBSIDIARIES
NOTES TO CONSOLIDATED FINANCIAL STATEMENTS
Our accruals for automobile, workers’ compensation and medical claims were as follows at the dates indicated (in thousands):
| | | | | | | | | | | |
| December 31, |
| 2021 | | 2020 |
| | | |
| Pre-funded premiums for losses incurred but not reported | $ | 50 | | | $ | 55 | |
| Accrued automobile and workers’ compensation claims | 4,127 | | | 3,171 | |
| Accrued medical claims | 1,100 | | | 915 | |
Litigation
From time to time as incidental to our operations, we may become involved in various lawsuits and/or disputes. Primarily as an operator of an extensive trucking fleet, we are a party to motor vehicle accidents, worker compensation claims and other items of general liability as would be typical for the industry. We are presently unaware of any claims against us that are either outside the scope of insurance coverage or that may exceed the level of insurance coverage and could potentially represent a material adverse effect on our financial position, or results of operations.operations or cash flows.
Guarantees
AE issuesWe issue parent guarantees of commitments associated with the activities of itsour subsidiary companies. The guarantees generally result from subsidiary commodity purchase obligations, subsidiary operating lease commitments and subsidiary banking transactions. The nature of these arrangements is to guarantee the performance of the subsidiary in meeting their respective underlying obligations. The parentWe would only be called upon to perform under the guarantee in the event of a payment default by the applicable subsidiary company. In satisfying these obligations, the parentwe would first look to the assets of the defaulting subsidiary company.
At December 31, 2018,2021, parental guaranteed obligations were approximately $22.3$24.1 million. Currently, neither AEwe nor any of itsour subsidiaries has any other types of guarantees outstanding that require liability recognition.recognition, except for the residual value guarantees for certain of our finance leases (see Note 17 for further discussion).
Note 16.19. Concentration of Credit Risk
We may incur credit risk to the extent our customers do not fulfill their obligations to us pursuant to contractual terms. Risks of nonpayment and nonperformance by our customers are a major consideration in our business, and our credit procedures and policies may not be adequate to sufficiently eliminate customer credit risk. Managing credit risk involves a number of considerations, such as the financial profile of the customer, the value of collateral held, if any, specific terms and duration of the contractual agreement, and the customer’s sensitivity to economic developments. We have established various procedures to manage credit exposure, including initial credit approval, credit limits and rights of offset. We also utilize letters of credit and guarantees to limit exposure.
Our largest customers consist of large multinational integrated crude oil companies and independent domestic refiners of crude oil. In addition, we transact business with independent crude oil producers, major chemical companies, crude oil trading companies and a variety of commercial energy users. Within this group of customers, we derive approximately 50 percent of our revenues from three4 to five5 large crude oil refining customers. While we have ongoing established relationships with certain domestic refiners of crude oil, alternative markets are readily available since we supply less than one1 percent of U.S. domestic refiner demand. As a fungible commodity delivered to major Gulf Coast supply points, our crude oil sales can be readily delivered to alternative end markets.
We believe that a loss of any of those customers where we currently derive more than 10 percent of our revenues would not have a material adverse effect on our operations as shown in the table below:
| | | | | | | | | | | | | | | | | | | | | | | | | | | | | | | | |
| Individual customer sales | | | | | | Individual customer receivables in excess | | | | |
| in excess of 10% of revenues | | | | | | of 10% of total receivables | | | | |
| Year Ended December 31, | | | | | | December 31, | | | | |
| 2018 | | 2017 | | 2016 | | 2018 | | 2017 | | 2016 |
| | | | | | | | | | |
| 27.3 | % | | 22.8 | % | | 18.2 | % | | 18.4 | % | | 19.1 | % | | 20.9 | % |
| 14.1 | % | | 17.1 | % | | 16.5 | % | | 11.9 | % | | 15.0 | % | | 14.0 | % |
| | | 10.8 | % | | 15.9 | % | | | | | 11.1 | % | | 10.1 | % |
| | | 10.7 | % | | 10.6 | % | | | | | 10.4 | % | | |
ADAMS RESOURCES & ENERGY, INC. AND SUBSIDIARIES
NOTES TO CONSOLIDATED FINANCIAL STATEMENTS
The following tables reflect the percentages of individual customer sales in excess of 10 percent of our consolidated revenues and individual customer receivables in excess of 10 percent of our total consolidated receivables for the periods indicated. We believe that a loss of any of the customers where we currently derive more than 10 percent of our revenues would not have a material adverse effect on our operations.
| | | | | | | | | | | | | | | | | | | | | | | | | | | | | | | | |
| Individual customer sales | | Individual customer receivables in excess |
| in excess of 10% of revenues | | of 10% of total receivables |
| Year Ended December 31, | | December 31, |
| 2021 | | 2020 | | 2019 | | 2021 | | 2020 | | 2019 |
| | | | | | | | | | |
| 23.7 | % | | 24.0 | % | | 37.3 | % | | 11.5 | % | | 11.3 | % | | 16.6 | % |
| 11.6 | % | | 10.8 | % | | 11.4 | % | | — | % | | 10.9 | % | | 12.6 | % |
| | | | | | — | % | | 10.7 | % | | |
| | | | | | 17.0 | % | | 10.4 | % | | |
| | | | | | 12.6 | % | | 0 | | |
Note 17.20. Quarterly Financial Information (Unaudited)
The following table presents selected quarterly financial data for the periods indicated (in thousands, except per share data):
| | | | | | | | | | | | | | | | | | | | | | | |
| First | | Second | | Third | | Fourth |
| Quarter | | Quarter | | Quarter | | Quarter |
| Year Ended December 31, 2018 | | | | | | | |
| Revenues | $ | 387,256 | | $ | 452,417 | | $ | 467,891 | | $ | 442,649 |
Operating (losses) earnings (1) | 1,077 | | 4,298 | | 2,239 | | (6,206) |
| Net (losses) earnings | 1,138 | | 3,620 | | 2,035 | | (3,848) |
| | | | | | | |
| Earnings (losses) per share: | | | | | | | |
| Basic net (losses) earnings per share | $ | 0.27 | | $ | 0.86 | | $ | 0.48 | | $ | (0.91) |
| Diluted net (losses) earnings per share | $ | 0.27 | | $ | 0.86 | | $ | 0.48 | | $ | (0.91) |
| | | | | | | |
| Year Ended December 31, 2017 | | | | | | | |
| Revenues | $ | 303,087 | | $ | 315,202 | | $ | 295,311 | | $ | 408,460 |
| Operating (losses) earnings | (1,584) | | 619 | | (1,290) | | 3,757 |
| Net (losses) earnings | (860) | | (282) | | (3,033) | | 3,693 |
| | | | | | | |
| Earnings (losses) per share: | | | | | | | |
| Basic and diluted net (losses) earnings per share | $ | (0.20) | | $ | (0.07) | | $ | (0.72) | | $ | 0.88 |
| | | | | | | | | | | | | | | | | | | | | | | |
| First | | Second | | Third | | Fourth |
| Quarter | | Quarter | | Quarter | | Quarter |
| Year Ended December 31, 2021 | | | | | | | |
| Revenues | $ | 325,491 | | | $ | 486,744 | | | $ | 568,181 | | | $ | 644,788 | |
| Operating earnings | 3,851 | | | 6,335 | | | 2,301 | | | 3,672 | |
| Net earnings | 2,808 | | | 4,709 | | | 1,546 | | | 2,825 | |
| | | | | | | |
Earnings per share: (1) | | | | | | | |
| Basic net earnings per share | $ | 0.66 | | | $ | 1.11 | | | $ | 0.36 | | | $ | 0.65 | |
| Diluted net earnings per share | $ | 0.66 | | | $ | 1.10 | | | $ | 0.36 | | | $ | 0.64 | |
| | | | | | | |
| Year Ended December 31, 2020 | | | | | | | |
| Revenues | $ | 353,477 | | | $ | 152,286 | | | $ | 266,904 | | | $ | 249,755 | |
Operating (losses) earnings (2) | (19,940) | | | 2,935 | | | 6,056 | | | 5,202 | |
| Net (losses) earnings | (11,427) | | | 3,503 | | | 3,073 | | | 5,846 | |
| | | | | | | |
Earnings (losses) per share: (1) | | | | | | | |
| Basic net (losses) earnings per share | $ | (2.70) | | | $ | 0.83 | | | $ | 0.72 | | | $ | 1.38 | |
| Diluted net (losses) earnings per share | $ | (2.69) | | | $ | 0.82 | | | $ | 0.72 | | | $ | 1.37 | |
____________________
(1)The fourthsum of our quarterly earnings (losses) per share amounts may not equal our full year amounts due to slight rounding differences.
(2)The first quarter of 20182020 includes inventory valuation losses of approximately $7.9$24.2 million in our crude oil marketing segment.
Note 18. Oil and Gas Producing Activities (Unaudited)
Our wholly owned subsidiary, AREC, participated in the exploration and development of domestic crude oil and natural gas properties primarily in the Permian Basin of West Texas and the Haynesville Shale. AREC’s offices were maintained in Houston. As discussed further in Note 4, AREC was deconsolidated effective with its bankruptcy filing in April 2017, and we recorded our investment in AREC under the cost method of accounting in April 2017. During the third quarter of 2017, AREC closed on the sale of substantially all of its assets. As a result of the sales of these assets, we no longer have an ownership interest in any crude oil and natural gas producing activities. In the disclosures and tables below, amounts for 2017 are for the period from January 1, 2017 through April 30, 2017, as a result of the deconsolidation of AREC due to its bankruptcy filing. There is no further exploration and development activity after April 30, 2017.
Crude Oil and Natural Gas Producing Activities
Total costs incurred in crude oil and natural gas exploration and development activities, all within the U.S., were as follows for the periods indicated (in thousands):
| | | | | | | | | | | |
| Year Ended December 31, | | |
| 2017 | | 2016 |
| Property acquisition costs: | | | |
| Unproved | $ | 4 | | $ | 32 |
| Exploration costs: | | | |
| Expensed | 5 | | 291 |
| Development costs | 1,815 | | — |
| Total costs incurred | $ | 1,824 | | $ | 323 |
ADAMS RESOURCES & ENERGY, INC. AND SUBSIDIARIES
NOTES TO CONSOLIDATED FINANCIAL STATEMENTS
Estimated Crude Oil and Natural Gas Reserves
The following information regarding estimates of our proved crude oil and natural gas reserves, substantially all located onshore in Texas and Louisiana, was based on reports prepared on our behalf by our independent petroleum engineers. Because crude oil and natural gas reserve estimates are inherently imprecise and require extensive judgments of reservoir engineering data, they are generally less precise than estimates made in conjunction with financial disclosures. The revisions of previous estimates as reflected in the table below result from changes in commodity pricing assumptions and from more precise engineering calculations based upon additional production histories and price changes. As discussed previously, AREC was deconsolidated effective with its bankruptcy filing in April 2017, and we recorded our investment in AREC under the cost method of accounting in April 2017. During the third quarter of 2017, AREC closed on the sale of substantially all of its assets. As a result of the sales of these assets, we no longer have an ownership interested in any crude oil and natural gas producing activities. In the tables below, amounts for 2017 are for the period from January 1, 2017 through April 30, 2017, as a result of the deconsolidation of AREC due to its bankruptcy filing.
Proved developed and undeveloped reserves were as follows for the periods indicated (in thousands):
| | | | | | | | | | | | | | | | | | | | | | | |
| Year Ended December 31, | | | | | | |
| 2017 | | | | 2016 | | |
| Natural | | Crude | | Natural | | Crude |
| Gas | | Oil | | Gas | | Oil |
| (Mcf) | | (Bbls) | | (Mcf) | | (Bbls) |
| Total proved reserves: | | | | | | | |
| Beginning of year | 4,214 | | 187 | | 4,835 | | 226 |
| Revisions of previous estimates | — | | — | | 65 | | 24 |
| Crude oil and natural gas reserves sold | (4,067) | | (170) | | (175) | | (4) |
| Extensions, discoveries and other reserve additions | 42 | | 6 | | 151 | | 18 |
| Production | (189) | | (23) | | (662) | | (77) |
| End of year | — | | — | | 4,214 | | 187 |
The components of our previously owned proved crude oil and natural gas reserves, all within the U.S., were as follows for the periods indicated (in thousands):
| | | | | | | | | | | | | | | | | | | | | | | |
| Year Ended December 31, | | | | | | |
| 2017 | | | | 2016 | | |
| Natural | | Crude | | Natural | | Crude |
| Gas | | Oil | | Gas | | Oil |
| (Mcf) | | (Bbls) | | (Mcf) | | (Bbls) |
| | | | | | | |
| Proved developed reserves | — | | — | | 4,214 | | 187 |
| Proved undeveloped reserves | — | | — | | — | | — |
| Total proved reserves | — | | — | | 4,214 | | 187 |
We had developed internal policies and controls for estimating and recording crude oil and natural gas reserve data. The estimation and recording of proved reserves is required to be in compliance with SEC definitions and guidance. We assigned responsibility for compliance in reserve bookings to the office of President of AREC. No portion of this individual’s compensation was directly dependent on the quantity of reserves booked. Reserve estimates are required to be made by qualified reserve estimators, as defined by Society of Petroleum Engineers’ Standards.
ADAMS RESOURCES & ENERGY, INC. AND SUBSIDIARIES
NOTES TO CONSOLIDATED FINANCIAL STATEMENTS
We employed a third party petroleum consultant, Ryder Scott Company, to prepare our crude oil and natural gas reserve data estimates as of December 31, 2016. The firm of Ryder Scott is well recognized within the industry for more than 50 years. As prescribed by the SEC, proved reserves were estimated using 12-month average crude oil and natural gas prices, based on the first-day-of-the-month price for each month in the period, and year-end production and development costs for each of the years presented, all without escalation.
The process of estimating crude oil and natural gas reserves is complex and requires significant judgment. Uncertainties are inherent in estimating quantities of proved reserves, including many factors beyond the estimator’s control. Reserve engineering is a subjective process of estimating subsurface accumulations of crude oil and natural gas that cannot be measured in an exact manner, and the accuracy of any reserve estimate is a function of the quality of available data and the interpretation thereof. As a result, assessments by different engineers often vary, sometimes significantly. In addition, physical factors such as the results of drilling, testing and production subsequent to the date of an estimate, as well as economic factors such as changes in product prices, may justify revision of such estimates. Accordingly, crude oil and natural gas quantities ultimately recovered will vary from reserve estimates.
Standardized Measure of Discounted Future Net Cash Flows from Crude Oil and Natural Gas Operations and Changes Therein
The standardized measure of discounted future net cash flows was determined based on the economic conditions in effect at the end of the years presented, except in those instances where fixed and determinable gas price escalations were included in contracts. The disclosures below do not purport to present the fair market value of our previously owned crude oil and natural gas reserves. An estimate of the fair market value would also take into account, among other things, the recovery of reserves in excess of proved reserves, anticipated future changes in prices and costs, a discount factor more representative of the time value of money and risks inherent in reserve estimates. The standardized measure of discounted future net cash flows was as follows for the periods indicated (in thousands):
| | | | | | | | | | | |
| Year Ended December 31, | | |
| 2017 | | 2016 |
| | | |
| Future gross revenues | $ | — | | $ | 17,938 |
| Future costs: | | | |
| Lease operating expenses | — | | (12,421) |
| Development costs | — | | (38) |
| Future net cash flows before income taxes | — | | 5,479 |
| Discount at 10% per annum | — | | (2,002) |
| Discounted future net cash flows before income taxes | — | | 3,477 |
| Future income taxes, net of discount at 10% per annum | — | | (1,217) |
| Standardized measure of discounted future net cash flows | $ | — | | $ | 2,260 |
The estimated value of crude oil and natural gas reserves and future net revenues derived therefrom are highly dependent upon crude oil and natural gas commodity price assumptions. For these estimates, our independent petroleum engineers assumed market prices as follows for the periods indicated:
| | | | | | | | | | | |
| Year Ended December 31, | | |
| 2017 | | 2016 |
| Market price: | | | |
| Crude oil per barrel | $ | — | | $ | 38.34 |
| Natural gas per thousand cubic feet (Mcf) | $ | — | | $ | 2.56 |
ADAMS RESOURCES & ENERGY, INC. AND SUBSIDIARIES
NOTES TO CONSOLIDATED FINANCIAL STATEMENTS
These prices were based on the unweighted arithmetic average of the prices in effect on the first day of the month for each month of the respective twelve month periods as required by SEC regulations. The prices reported in the reserve disclosures for natural gas included the value of associated natural gas liquids. Crude oil and natural gas reserve values and future net cash flow estimates are very sensitive to pricing assumptions and will vary accordingly.
The effect of income taxes and discounting on the standardized measure of discounted future net cash flows was as follows for the periods indicated (in thousands):
| | | | | | | | | | | |
| Year Ended December 31, | | |
| 2017 | | 2016 |
| | | |
| Future net cash flows before income taxes | $ | — | | $ | 5,479 |
| Future income taxes | — | | (1,918) |
| Future net cash flows | — | | 3,561 |
| Discount at 10% per annum | — | | (1,301) |
| Standardized measure of discounted future net cash flows | $ | — | | $ | 2,260 |
The principal sources of changes in the standardized measure of discounted future net cash flows were as follows for the periods indicated (in thousands):
| | | | | | | | | | | |
| Year Ended December 31, | | |
| 2017 | | 2016 |
| | | |
| Beginning of year | $ | 2,260 | | $ | 3,527 |
| Sale of crude oil and natural gas reserves | (2,732) | | (350) |
| Net change in prices and production costs | — | | (1,391) |
| New field discoveries and extensions, net of future production costs | 94 | | 275 |
| Sales of crude oil and natural gas produced, net of production costs | (476) | | 87 |
| Net change due to revisions in quantity estimates | — | | 181 |
| Accretion of discount | 130 | | 194 |
| Production rate changes and other | (493) | | (945) |
| Net change in income taxes | 1,217 | | 682 |
| End of year | $ | — | | $ | 2,260 |
Results of Operations for Crude Oil and Natural Gas Producing Activities
The results of crude oil and natural gas producing activities, excluding corporate overhead and interest costs, were as follows for the periods indicated (in thousands):
| | | | | | | | | | | |
| Year Ended December 31, | | |
| 2017 | | 2016 |
| | | |
| Revenues | $ | 1,427 | | $ | 3,410 |
| Costs and expenses: | | | |
| Production | (951) | | (3,337) |
| Producing property impairment | — | | (30) |
| Depreciation, depletion and amortization | (423) | | (1,546) |
| Operating earnings (losses) before income taxes | 53 | | (1,503) |
| Income tax benefit (expense) | (19) | | 526 |
| Operating earnings (losses) | $ | 34 | | $ | (977) |
Item 9. Changes in and Disagreements withWith Accountants on Accounting and Financial Disclosure.
None.
Item 9A. Controls and Procedures.
Disclosure Controls and Procedures
As of the end of the period covered by this annual report, our management carried out an evaluation, with the participation of our Chief Executive ChairmanOfficer and Chief Financial Officer, of the effectiveness of our disclosure controls and procedures pursuant to Rule 13a-15(e) and 15d-15(e) of the Exchange Act. Based on this evaluation, as of the end of the period covered by this annual report, our Chief Executive ChairmanOfficer and our Chief Financial Officer concluded:
(i) that our disclosure controls and procedures are designed to ensure that information required to be disclosed by us in the reports that we file or submit under the Exchange Act is recorded, processed, summarized and reported within the time periods specified in the SEC’s rules and forms, and that such information is accumulated and communicated to our management, including our principal executive and financial officers, as appropriate to allow for timely decisions regarding required disclosures; and
(ii) that our disclosure controls and procedures are effective.
Changes in Internal Control over Financial Reporting
There have been no changes in our internal control over financial reporting (as defined in Rule 13a-15(f) under the Securities Exchange Act of 1934) during the fourth quarter of 2018,2021, that have materially affected, or are reasonably likely to materially affect, our internal control over financial reporting.
MANAGEMENT’S ANNUAL REPORT ON INTERNAL CONTROL
OVER FINANCIAL REPORTING AS OF DECEMBER 31, 20182021
Management of Adams Resources & Energy, Inc. and its consolidated subsidiaries is responsible for establishing and maintaining adequate internal control over financial reporting as defined in Rule 13a-15(f) and 15d-15(f) of the Securities Exchange Act of 1934, as amended. Our internal control over financial reporting is a process designed under the supervision of our Chief Executive ChairmanOfficer and Chief Financial Officer to provide reasonable assurance regarding the reliability of financial reporting and the preparation of financial statements for external purposes in accordance with accounting principles generally accepted in the United States.
Because of its inherent limitations, internal control over financial reporting may not prevent or detect misstatements. Also, projections of any evaluation of effectiveness to future periods are subject to the risk that controls may become inadequate because of changes in conditions, or that the degree of compliance with policies and procedures may deteriorate.
Management, including the Company’s Chief Executive ChairmanOfficer and Chief Financial Officer, assessed the effectiveness of the Company’s internal control over financial reporting as of December 31, 2018.2021. In making this assessment, management used the criteria described in Internal Control – Integrated Framework (2013) issued by the Committee of Sponsoring Organizations of the Treadway Commission (“COSO”). Based on this assessment, management, including the Company’s Chief Executive ChairmanOfficer and Chief Financial Officer, concluded that internal control over financial reporting was effective as of December 31, 2018.2021.
KPMG LLP has issued its attestation report regarding our internal control over financial reporting. That report is included within this Item 9A (See “Report of Independent Registered Public Accounting Firm”).
Pursuant to the requirements of Rules 13a-15(f) and 15d-15(f) of the Securities Exchange Act of 1934, as amended, this annual report on Internal Control Over Financial Reporting has been signed below by the following persons on behalf of the registrant and in their respective capacities indicated below on March 8, 2019.9, 2022.
| | | | | | | | |
/s/ Townes G. PresslerKevin J. Roycraft | | /s/ Tracy E. Ohmart |
Townes G. PresslerKevin J. Roycraft | | Tracy E. Ohmart |
Chief Executive ChairmanOfficer | | Chief Financial Officer |
Report of Independent Registered Public Accounting Firm
To the Shareholders and Board of Directors
Adams Resources & Energy, Inc.:
Opinion on Internal Control Over Financial Reporting
We have audited Adams Resources & Energy, Inc.’s and subsidiaries’ (the Company) internal control over financial reporting as of December 31, 2018,2021, based on criteria established in Internal Control — Integrated Framework (2013) issued by the Committee of Sponsoring Organizations of the Treadway Commission. In our opinion, the Company maintained, in all material respects, effective internal control over financial reporting as of December 31, 2018,2021, based on criteria established in Internal Control — Integrated Framework (2013) issued by the Committee of Sponsoring Organizations of the Treadway Commission.
We also have audited, in accordance with the standards of the Public Company Accounting Oversight Board (United States) (PCAOB), the consolidated balance sheets of the Company as of December 31, 20182021 and 2017,2020, the related consolidated statements of operations, shareholders’ equity, and cash flows for each of the years in the two-yearthree-year period ended December 31, 2018,2021, and the related notes (collectively, the consolidated financial statements), and our report dated March 8, 20199, 2022 expressed an unqualified opinion on those consolidated financial statements.
Basis for Opinion
The Company’s management is responsible for maintaining effective internal control over financial reporting and for its assessment of the effectiveness of internal control over financial reporting, included in the accompanying Management’s Annual Report on Internal Control Overover Financial Reporting as of December 31, 2018.2021. Our responsibility is to express an opinion on the Company’s internal control over financial reporting based on our audit. We are a public accounting firm registered with the PCAOB and are required to be independent with respect to the Company in accordance with the U.S. federal securities laws and the applicable rules and regulations of the Securities and Exchange Commission and the PCAOB.
We conducted our audit in accordance with the standards of the PCAOB. Those standards require that we plan and perform the audit to obtain reasonable assurance about whether effective internal control over financial reporting was maintained in all material respects. Our audit of internal control over financial reporting included obtaining an understanding of internal control over financial reporting, assessing the risk that a material weakness exists, and testing and evaluating the design and operating effectiveness of internal control based on the assessed risk. Our audit also included performing such other procedures as we considered necessary in the circumstances. We believe that our audit provides a reasonable basis for our opinion.
Definition and Limitations of Internal Control Over Financial Reporting
A company’s internal control over financial reporting is a process designed to provide reasonable assurance regarding the reliability of financial reporting and the preparation of financial statements for external purposes in accordance with generally accepted accounting principles. A company’s internal control over financial reporting includes those policies and procedures that (1) pertain to the maintenance of records that, in reasonable detail, accurately and fairly reflect the transactions and dispositions of the assets of the company; (2) provide reasonable assurance that transactions are recorded as necessary to permit preparation of financial statements in accordance with generally accepted accounting principles, and that receipts and expenditures of the company are being made only in accordance with authorizations of management and directors of the company; and (3) provide reasonable assurance regarding prevention or timely detection of unauthorized acquisition, use, or disposition of the company’s assets that could have a material effect on the financial statements.
Because of its inherent limitations, internal control over financial reporting may not prevent or detect misstatements. Also, projections of any evaluation of effectiveness to future periods are subject to the risk that controls may become inadequate because of changes in conditions, or that the degree of compliance with the policies or procedures may deteriorate.
/s/ KPMG LLP
Houston, Texas
March 8, 2019 9, 2022
Item 9B. Other Information.
None.
Item 9C. Disclosure Regarding Foreign Jurisdictions that Prevent Inspections.
None.
PART III
Item 10. Directors, Executive Officers and Corporate Governance.
The information required by this item will be included in our definitive Proxy Statement in connection with our 20192022 Annual Meeting of Shareholders (the “2019“2022 Proxy Statement”), which will be filed with the SEC within 120 days after the end of the fiscal year ended December 31, 2018,2021, under the headings “Election of Directors” andDirectors,” “Executive Officers” and is incorporated herein by reference.
Item 11. Executive Compensation.
The information required by this item will be set forth in our 20192022 Proxy Statement, which will be filed with the SEC within 120 days after the end of the fiscal year ended December 31, 2018,2021, under the heading “Executiveheadings “Summary Compensation Table,” “Compensation Overview” and “2021 Director Compensation” and is incorporated herein by reference.
Item 12. Security Ownership of Certain Beneficial Owners and Management and Related Stockholder Matters.
The information required by this item will be set forth in our 20192022 Proxy Statement, which will be filed with the SEC within 120 days after the end of the fiscal year ended December 31, 2018,2021, under the heading “Voting Securities“Security Ownership of Certain Beneficial Owners and Principal Holders Thereof”Management” and is incorporated herein by reference.
Item 13. Certain Relationships and Related Transactions, and Director Independence.
The information required by this item will be set forth in our 20192022 Proxy Statement, which will be filed with the SEC within 120 days after the end of the fiscal year ended December 31, 2018,2021, under the headings “Transactions with Related Parties” and “Director Independence” and is incorporated herein by reference.
Item 14. Principal AccountingAccountant Fees and ServicesServices.
Our independent registered accounting public accounting firm is KPMG LLP, Houston, TX, Auditor Firm ID: 185.
The information required by this item will be set forth in our 20192022 Proxy Statement, which will be filed with the SEC within 120 days after the end of the fiscal year ended December 31, 2018,2021, under the heading “Principal AccountingAccountant Fees and Services” and is incorporated herein by reference.
PART IV
Item 15. Exhibits and Financial Statement SchedulesSchedules.
(a) The following documents are filed as a part of this annual report:
(1) Financial Statements: See “Index to Consolidated Financial Statements” beginning on page 3342 of this annual report for the financial statements included herein.
(2) Financial Statement Schedules: The separate filing of financial statement schedules has been omitted because such schedules are either not applicable or the information called for therein appears in the footnotes of our Consolidated Financial Statements.
(3) Exhibits:
| | | | | |
Exhibit Number | Exhibit |
| |
| |
| 3.1 | |
| 3.2 | |
3.34.1 | |
4.1 | Specimen common stock certificate (incorporated by reference to Exhibit 4(a) to4.1 of the Annual Report on Form 10-K for the fiscal year ended December 31, 1991)2019). |
| 4.2 | |
| | | | | |
Exhibit Number | Exhibit |
|
| |
| 10.1+ | |
10.2+ | |
10.3* | |
| | | | | |
Exhibit
Number
| Exhibit |
| |
10.4* | |
10.5* | |
10.6* | |
10.7* | |
10.8 | |
10.9 | |
10.10 | |
10.11+10.3+ | |
10.12+10.4+ | |
10.13+10.5+ | |
10.14+10.6+ | |
10.1510.7+ | |
| 10.8+ | |
| 10.9+ | |
| 10.10 | |
| 10.11 | |
| 10.12 | Purchase and Sale Agreement by and among EnLink Midstream Operating, LP, GulfMark Energy, Inc., GulfMark Terminals, LLC, and for the limited purposes set forth therein, EnLink Midstream Partners, LP, dated as of October 22, 2020 (incorporated by reference to Exhibit 10.22 of the Annual Report on Form 10-K for the year ended December 31,2020). |
| 10.13 | |
| 10.14 | Credit Agreement, dated May 4, 2021, by and among Adams Resources & Energy, Inc., GulfMark Energy, Inc., Service Transport Company, Wells Fargo Bank, National Association, as administrative agent and issuing lender, and the other lenders party thereto (incorporated by reference to Exhibit 10.1 of the Current Report on Form 8-K filed on May 7, 2021). |
| 14.1* | |
| 21* | |
| 23.1* | |
23.2* | |
23.3* | |
| | | | | |
Exhibit Number | Exhibit |
|
| |
| 31.1* | |
| 31.2* | |
| 32.1* | |
| 32.2* | |
| | | | | |
Exhibit
Number
| Exhibit |
| |
99.1 | |
| 101.CAL* | Inline XBRL Calculation Linkbase Document |
| 101.DEF* | Inline XBRL Definition Linkbase Document |
| 101.INS* | Inline XBRL Instance Document – the instance document does not appear in the Interactive Data File because its XBRL tags are embedded within the Inline XBRL document. |
| 101.LAB* | Inline XBRL Labels Linkbase Document |
| 101.PRE* | Inline XBRL Presentation Linkbase Document |
| 101.SCH* | Inline XBRL Schema Document |
| 104* | Cover Page Interactive Data File (formatted as inline XBRL and contained in Exhibit 101) |
_______________________
* Filed foror furnished (in the case of Exhibits 32.1 and 32.2) with this report.
+ Management contract or compensation plan or arrangement.
Item 16. Form 10-K SummarySummary.
Not applicable.
SIGNATURES
Pursuant to the requirements of Section 13 or 15(d) of the Securities Exchange Act of 1934, the registrant has duly caused this report to be signed on its behalf by the undersigned, thereunto duly authorized on March 8, 2019.
| | | | | | | | |
| | ADAMS RESOURCES & ENERGY, INC. |
| | (Registrant) |
| | |
| | |
| By: | /s/ Townes G. PresslerKevin J. Roycraft |
| | Townes G. PresslerKevin J. Roycraft |
| | Chief Executive ChairmanOfficer |
| | (Principal Executive Officer) |
| | |
| By: | /s/ Tracy E. Ohmart |
| | Tracy E. Ohmart |
| | Chief Financial Officer |
| | (Principal Financial Officer and Principal |
| | Accounting Officer) |
Pursuant to the requirements of the Securities Exchange Act of 1934, this report has been signed below by the following persons on behalf of the registrant and in the capacities indicated below on March 8, 2019.9, 2022.
| | | | | | | | |
| Signature | | Title |
| | |
| /s/ Townes G. Pressler | | Director and Chairman of the Board |
| Townes G. Pressler | | |
| | |
| /s/ Murray E. Brasseux | | Director |
| Murray E. Brasseux | | |
| | |
| /s/ Dennis E. Dominic | | Director |
| Dennis E. Dominic | | |
| | |
| /s/ Michelle A. Earley | | Director |
| Michelle A. Earley | | |
| | |
| /s/ Richard C. Jenner | | Director |
| Richard C. Jenner | | |
| | |
| /s/ John O. Niemann Jr. | | Director |
| John O. Niemann Jr. | | |
| | |
| /s/ W.R. Scofield | | Director |
| W.R. Scofield | | |