SECURITIES AND EXCHANGE COMMISSION
| þ | ANNUAL REPORT PURSUANT TO SECTION 13 OR 15(d) OF THE SECURITIES EXCHANGE ACT OF 1934 |
September 29, 2006
| o | TRANSITION REPORT PURSUANT TO SECTION 13 OR 15(d) OF THE SECURITIES EXCHANGE ACT OF 1934 |
| Delaware | 04-2302115 | |||||||
| (State or | (I.R.S. Employer Identification No.) | |||||||
| 20 Sylvan Road, Woburn, Massachusetts | 01801 | ||||||
| (Address of | (Zip Code) | ||||||
| Registrant’s telephone number, including area | (781) 376-3000 |
| Title of Each Class | Name of Each Exchange on Which Registered | |
| Common Stock, par value $0.25 per share | Nasdaq Global Select Market |
YesCommon Stock, $.25 par value
(Title of Class)þ
No
þ
| Large Accelerated filerþ | Accelerated filero | Non-accelerated filero |
162,876,234.
| Part of Form 10-K | Documents from which portions are incorporated by reference | |
| Part III | Portions of the Registrant’s Proxy Statement relating to the Registrant’s 2007 Annual Meeting of Stockholders to be filed on or before January 29, 2007 are incorporated by reference into Items 10, 11, 12, 13 and 14 |
Part III of this annual report incorporates by reference certain information contained in the registrant’s definitive proxy statement for the Annual Meeting of Shareholders to be held March 10, 2004, which will be filed with the Securities and Exchange Commission not later than 120 days after October 3, 2003 (the “Proxy Statement”). Except with respect to information specifically incorporated by reference in the Form 10-K, the Proxy Statement is not deemed to be filed as part hereof.
2
| • | CDMA (Code Division Multiple Access): a method for transmitting simultaneous signals over a shared portion of the spectrum | ||
| • | DigRF: the digital interface standard that defines an efficient physical interconnection between baseband and RF integrated circuits for digital cellular terminals | ||
| • | EDGE (Enhanced Data rates for Global Evolution): an enhancement to the GSM and TDMA wireless communications systems that increases data throughput to 384Kpbs | ||
| • | GPRS (General Packet Radio Service): an enhancement to the GSM mobile communications system that supports data packets | ||
| • | GSM (Global System for Mobile Communications): a digital cellular phone technology based on TDMA that is the predominant system in Europe, but is also used around the world | ||
| • | TD-SCDMA (Time Division Synchronous Code Division Multiple Access): a 3G mobile communications standard, being pursued in the People’s Republic of China by the CATT | ||
| • | WCDMA (Wideband CDMA): a 3G technology that increases data transmission rates in GSM systems by using the CDMA air interface instead of TDMA | ||
| • | WEDGE: an acronym for technology that supports both EDGE and WCDMA | ||
| • | WiFi (Wireless Fidelity): a trademark for the certification of products that meet certain standards for transmitting data over wireless networks | ||
| • | WiMAX (Worldwide Interoperability for Microwave Access): a standards-based technology enabling the delivery of last mile wireless broadband access as an alternative to cable and DSL | ||
| • | WLAN (Wireless Local Area Network): a type of local-area network that uses high-frequency radio waves rather than wires to communicate between nodes |
| • | our plans to develop and market new products, enhancements or technologies and the timing of these development programs; | ||
| • | our estimates regarding our capital requirements and our needs for additional financing; | ||
| • | our estimates of expenses and future revenues and profitability; | ||
| • | our estimates of the size of the markets for our products and services; | ||
| • | the rate and degree of market acceptance of our products; and | ||
| • | the success of other competing technologies that may become available. |
3
factors could cause results to differ materially and adversely from those expressed in the estimates made by the independent parties and by us.
INTRODUCTIONSkyworks Solutions, Inc. (“Skyworks” or the “Company”) is a leading wireless semiconductor company focused exclusively on radio frequency (“RF”)an innovator of high performance analog and complete cellular system solutions formixed signal semiconductors enabling mobile communications applications. We offerconnectivity. The Company’s power amplifiers, front-end modules RF subsystems and cellular systems to leading wireless handset and infrastructure customers.From the power amplifier, through the radio and to the baseband, we have developed one of the industry’s broadest product portfolios including leadership switches and power amplifier modules. Additionally, we offer a highly integrated direct conversion transceiverradios are at the heart of many of today’s leading-edge multimedia handsets. Leveraging core technologies, Skyworks also offers a diverse portfolio of linear products that support automotive, broadband, cellular infrastructure, industrial and have launched a comprehensive cellular system for next generation handsets.
With our extensive product portfolio and significant systems-level expertise, Skyworks is the ideal partner for both top-tier wireless manufacturers and new market entrants who demand simplified architectures, faster development cycles and fewer overall suppliers.
medical applications.
Skyworks was formed through the merger (“Merger”) of the wireless business of Conexant Systems, Inc. (“Conexant”) and Alpha Industries, Inc. (“Alpha”) on June 25, 2002.2002, pursuant to an Agreement and Plan of Reorganization, dated as of December 16, 2001, and amended as of April 12, 2002, by and among Alpha, Conexant and Washington Sub, Inc. (“Washington”), a wholly-owned subsidiary of Conexant to which Conexant spun off its wireless communications business. Pursuant to the Merger, Washington merged with and into Alpha, with Alpha as the surviving corporation. Immediately following the Merger, the CompanyAlpha purchased Conexant’s semiconductor assembly and test facility located in Mexicali, Mexico and certain related operations (the “Mexicali Operations”). For purposes of this Annual Report on Form 10-K, the Washington business and the Mexicali Operations are collectively referred to as “Washington/Mexicali”. Shortly thereafter, Alpha, which was incorporated in Delaware in 1962, changed its corporate name to Skyworks Solutions, Inc. We are headquarteredHeadquartered in Woburn, Massachusetts, and have executive offices in Irvine, California. We have design,Mass., Skyworks is worldwide with engineering, manufacturing, marketing, sales and service facilities throughout North America,Asia, Europe and the Asia/Pacific region.North America. Our Internet address iswww.skyworksinc.com. www.skyworksinc.com. We make available on our Internet website free of charge our annual reportAnnual Report on Form 10-K, quarterly reports on Form 10-Q, current reports on Form 8-K, Section 16 filings on Forms 3, 4 and 5, and amendments to those reports as soon as practicable after we electronically filesubmit such material with the Securities and Exchange Commission (“SEC”). The information contained in our website is not incorporated by reference in this Annual Report on Form 10-K.INDUSTRY BACKGROUNDWe believe that
Skyworks believes the wireless industry is onin the vergemidst of another substantial growth cycle. Traditional voice services offered bya significant transition, with two major trends impacting the market landscape for wireless carriers are being rapidly supplemented or augmented byproducts and the emergenceway original equipment manufacturers (“OEMs”) engage semiconductor suppliers. First, there is a market share consolidation underway. By virtually all analyst estimates, 80 percent of the next-generation wireless technologieshandset market is controlled by five OEMs. Second, and WiFi-based (802.11)perhaps even more dramatic, is the number of handsets requiring both voice and high speed data functionality as consumers demand smaller handsets that include multimedia applications such as cameras, MP3 players, video streaming, gaming, Web browsing and WiFi based 802.11 wireless data applications. AllThis demand increases the relative complexity of a handset since maintaining data integrity while at the same time handling a voice session is a significant challenge. There is a greater need for compatibility among the Radio Frequency (“RF”), the analog/mixed signal and system software. As a result, OEMs today are engaging suppliers as partners, and much earlier in the development process. By contrast, in the past, handset manufacturers could mix and match power amplifiers and transceivers much more readily using various suppliers — and they did so rather routinely. Skyworks believes that going forward the link between the front-end module, radio and software is increasingly critical and can no longer be easily decoupled.4
From the power amplifier, through the radio and to the baseband, we have developed one of the industry’s broadest product portfolios including leadership switches and power amplifier modules. Additionally, we offer a highly integrated direct conversion transceiverradios are at the heart of many of today’s leading-edge multimedia handsets. Leveraging core technologies, Skyworks also offers a diverse portfolio of linear products that support automotive, broadband, cellular infrastructure, industrial and have launched a comprehensive cellular system for next generation handsets.
With our extensive product portfolio and significant systems-level expertise, Skyworks is the ideal partner for both top-tier wireless manufacturers and new market entrants who demand simplified architectures, faster development cycles and fewer overall suppliers.
medical applications.
We believe that

The cellular handset market has grown significantly overtemperature, pressure and audio information into the past five years despite the broad technology slowdown in 2001 and 2002.digital realm. According to the Semiconductor Industry Association, the total available market research firm EMC, handset sales have increased by approximately 300% from 1997 to 2002 with volume reaching 400 million units in 2002. Exiting 2002,for the worldwide penetration rate of wireless services was at 18% andanalog semiconductor segment is expected to climbapproach $50 billion in 2009. Today, this adjacent analog semiconductor market, which is characterized by longer product lifecycles and higher gross margins, is highly fragmented and diversified among various end-markets, customer bases and applications.
In parallel, handset growth is being driven by replacement units purchased by existing subscribers as carriers introduce updated models, smaller form factors, added featuresmarkets the Company has targeted: infrastructure, medical, automotive and new applications. In particular, color displays and camera phones are expected to be two major growth drivers in the coming years. According to the Shosteck Group, sales of color-display phones will increase from roughly 85 million units in 2002 to over 350 million units by 2005. Meanwhile, handsets with built-in cameras are forecasted to increase from 20 million units in 2002 to almost 250 million units by 2005. These new wireless phones will also feature higher data rate services driven by 2.5G and 3G standards such as GPRS, CDMA 2000, EDGE and WCDMA. According to EMC, the combination of new subscriber additions and higher replacement rates is expected to drive total handset sales from 400 million units in 2002 to approximately 544 million units in 2005.
In response to this rapidly growing market, handset original equipment manufacturers, or OEMs, are significantly shortening product development cycles, seeking simplified architectures and streamlining manufacturing processes. Traditional OEMs are shifting to low-cost suppliers around the world. In turn, original design manufacturers, or ODMs, and contract manufacturers, who lack RF and systems-level expertise, are entering the high-volume mobile phone market to support OEMs as well as to develop handset platforms of their own. ODMs and contract manufacturers seek to manage low-cost handset manufacturing and assembly, freeing OEMs to focus on marketing and distribution aspects of their business. Established handset manufacturers and new market entrants alike are demanding complete semiconductor system solutions that include the RF system, all baseband processing, protocol stack and user interface software, plus comprehensive reference designs and development platforms. With these solutions, traditional handset OEMs can accelerate time-to-market cycles with lower investments in engineering and system design. These solutions also enable ODMs to enter the high volume handset market without requiring significant investments in RF and systems-level expertise.
Similarly, cellular and personal communications services network operators are developing and deploying next generation services. These service providers are incorporating packet-switching capability in their networks to deliver data communications and Internet access to digital cellular and other wireless devices. Over the long term, service providers are seeking to establish a global network that can be accessed by subscribers at any time, anywhere in the world and that can provide subscribers with multimedia services. To meet this goal, OEMs that supply wireless infrastructure base stations to network operators are increasingly relying on mobile communications semiconductor suppliers that can provide highly integrated RF and mixed signal processing functionality.
Additionally, as service providers migrate cellular subscribers to data intensive next generation applications, base stations that transmit and receive signals in the backbone of cellular and personal communications services systems will be under further capacity constraints. To meet the related demand, OEMs will be challenged to increase base station transceiver performance and functionality, while reducing size, power consumption and overall system costs.
We believe that these market trends create a potentially significant opportunity for a broad-based wireless semiconductor supplier with a comprehensive product portfolio supported by specialized wireless manufacturing process technologies and a full range of systems-level expertise.
BUSINESS OVERVIEW
Skyworks is a leading wireless semiconductor company focused exclusively on RF and complete cellular system solutions for mobile communications applications. We offer front-end modules, RF subsystems and cellular systems to leading wireless handset and infrastructure customers.
Skyworks possesses a broad wireless technology capability and one of the most complete wireless communications product portfolios, coupled with customer relationships with virtually all major handset and infrastructure manufacturers. Our product portfolio includes almost every key semiconductor found within a digital cellular handset.
The following diagram illustrates our products that are used in a digital cellular handset:
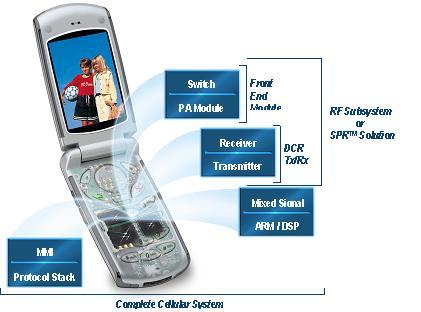
Front End Modules — PA Modules are increasingly integrating band-select switches, t/r switches, diplexers, filters and other componentsbroadband, among others, to create a single chip front end solution
RF Subsystems/SPR™ Solution: combinesbusiness characterized by longer product lifecycles, sustained revenue profiles, diverse applications and contribution margins that are typically 10 to 15 points higher than the transceiver, PA and associated controller, SAW filters, and a switchplexer module that includes switches and low-pass filters in a compact 13x13mm MCM packagehandset business.
5
Complete Cellular Systems
Skyworks also offers a broad product portfolio addressing next-generation wireless infrastructure applications, including amplifier drivers, ceramic resonators, couplers and detectors, filters, synthesizers and front-end receivers. These components support a variety of RF and mixed signal processing functions within the wireless infrastructure.
We have a comprehensive RF and mixed signal processing and packaging portfolio, extensive circuit design libraries and a proven track record in component and system design. We believe that these capabilities position us to address the growing need of wireless infrastructure manufacturers for base station products with increased transceiver performance and functionality with reduced size, power consumption and overall system costs.
THE SKYWORKS ADVANTAGE
OUR SKYWORKS’ STRATEGYSkyworks’ vision is to become the
 premierleading supplier of wireless semiconductor solutions.high performance analog and mixed signal semiconductors enabling mobile connectivity. Key elements in our strategy include:Leveraging Core Technologies
Skyworks deploys technology building blocks such as radio frequency integrated circuits, analog/mixed-signal processing cores
Skyworks’ vision is to become the leading supplier of high performance analog and mixed signal semiconductors enabling mobile connectivity. Key elements in our strategy include:
Expanding Power Amplifier and digital baseband engines as well as software across multiple product platforms.Front-End Solutions Market ShareOur products offer customers solutions that significantly speed time-to-market while dramatically reducing bill of material costs, power consumption and footprints. We believe that this approach creates economies of scale in research and development and facilitates a reduction in the timeplan to increase our current 40 percent worldwide market for key products.Increasing Integration Levels
Highshare position through higher levels of integration enhanceand continued innovation, leveraging our leading edge process and packaging technology.
Capturing Increasing Dollar Content in Third and Fourth generation ApplicationsAs the benefitsindustry migrates to multi-mode EDGE, WEDGE, WCDMA and WiMAX architectures, RF complexity in the transmit and receive chain substantially increases given simultaneous voice and high speed data communications requirements, coupled with the need for backward compatibility to existing networks. As a result, Skyworks believes that the addressable semiconductor market for our solutions essentially doubles.Gaining RF Market Share in Helios™, DigRF and WDCMAWe continue to expand our radio presence with the Helios™ platform, which bundles our single chip direct conversion transceiver and front-end module. Skyworks is now supporting the majority of tier one handset OEMs with complete radios and we look forward to even greater traction as we launch our differentiated DigRF and WCDMA solutions in the coming year.Diversifying into Adjacent Linear MarketsBy leveraging core analog, mixed signal and RF technology, Skyworks is also able to deliver solutions to broader and diverse markets that are characterized by longer product lifecycles, sustained revenue profiles and higher contribution margins than our handset business. While the addressable market for linear products by reducing production costs throughis highly fragmented, it is roughly four times the use of fewer external components, reduced board space and improved system assembly yields. By combining allsize of the necessary communications functions for a complete system solution, Skyworks can deliver additional semiconductor content, thereby offering existing and potential customers more compelling and cost-effective solutions.Capturing an Increasing Amount of Semiconductor Content
We enable our customers to start with individual components as necessary, and then migrate up the product integration ladder. We believe that our highly integrated solutions will enable these customers to speed their time to market while focusing their resources on product differentiation through a broader range of more sophisticated, next-generation features.
Diversifying Customer Base
Skyworks supports virtually every wirelesscellular handset OEM including Nokia Corporation, Motorola, Inc., Samsung Electronics Co., Sony/Ericsson and LG Electronics, Inc. as well as emerging ODMs and contract manufacturers such as BenQ, Compal, Flextronics and Quanta. With the industry’s move towards outsourcing, we believe that we are particularly well-positioned to address the growing needs of new market entrants who seek RF and system-level integration expertise.industry.
6
Delivering Operational ExcellenceThe Skyworks operations team leverages world-class manufacturing technologies and enables highly integrated modules as well as system-level solutions. Skyworks will
Skyworks’ strategy is to vertically integrate where itwe can differentiate or will otherwise enter alliances and partnerships for leading-edge capabilities. These partnerships and alliances are designed to ensure product leadership and competitive advantage in the marketplace. We are focused on achieving the industry’s shortest cycle times, highest yields and ultimately the lowest product cost structure.BUSINESS FRAMEWORKDuring the fourth fiscal quarter of 2006, Skyworks began the restructuring of its business by discontinuing its baseband operations in order to sharpen focus on its high growth core business. Skyworks’ baseband product area developed complete reference designs, incorporating the digital signal processor and software functionality, in support of tier-three handset suppliers. This initiative was complex, research and development intensive and generated substantial operating losses. As tier-one OEMs increasingly dominate the landscape, the addressable market for the Company’s baseband solutions had significantly contracted. As a result of this decision, Skyworks restructured its business to focus on its core analog and RF product markets.To address the wireless industry opportunities discussed above and to execute our strategy, we have aligned our product portfolio around two markets: mobile platforms and linear products. We believe we possess a broad technology capability and one of the most complete wireless communications product portfolios that, when coupled with key customer relationships with all major handset manufacturers, positions us well to meet industry needs. Below are just a few examples from each of our product portfolios.
7
SKYWORKS PRODUCT PORTFOLIODCR™ Transceivers Attenuators GPRS RF Subsystems Chip Capacitors GSM/GPRS/EDGE Power Amplifiers Diodes Helios™ DigRF Subsystems Directional Couplers/Detectors Helios™ EDGE RF Subsystems Hybrids Intera™ Front-End Modules Infrastructure RF Subsystems SPR® Solutions Mixers/Demodulators TD-SCDMA Power Amplifiers Modulators WCDMA/CDMA Power Amplifiers Phase Shifters Power Dividers/Combiners Receivers Switches Synthesizers/PLLs Technical Ceramics
Mobile Platforms:• DCR Transceiver (Tx/Rx):encompasses the complete RF transmit and receive functions • Front-End Modules (FEM): power amplifiers that are integrated with switches, diplexers, filters and other components to create a single package front-end solution • Power Amplifiers (PA): the module that strengthens the signal so that it has sufficient energy to reach a base station • Helios™ RF Subsystems/Single Package Radio (SPR®) Solution:combines the transceiver, the PA and associated controller, surface acoustic wave (SAW) filters, and a switchplexer into a single, multi chip module (MCM) package
Linear Products:• Attenuators:A circuit that allows a known source of power to be reduced by a predetermined factor (usually expressed as decibels) • Capacitors:a passive electronic component that stores energy in the form of an electrostatic field • Ceramic:material used in semiconductors which contain transition metal oxides that are II-VI semiconductors, such as zinc-oxide • Diodes:semiconductor devices that pass current in one direction only • Directional Coupler:a transmission coupling device for separately sampling the forward or backward wave in a transmission line • Directional Detector:intended for use in power management applications • Hybrid:monolithic circuitry that is 100% passive and offers low loss, high isolation and phase/amplitude balance • Phase Shifter:achieves its distinct sound by creating one or more notches in the frequency domain that eliminate sounds at the notch frequencies
8
• PLL (Phase-Locked Loop):is a closed-loop feedback control system that maintains a generated signal in a fixed phase relationship to a reference signal • Power Combiner:used for connecting more than one antenna to a single radio • Power Divider:passive devices designed to combine multiple antennas in a stacked antenna system, while providing a constant 50 ohm impedance over the bandwidth chosen • Switch: the component that performs the change between the transmit and receive function, as well as the band function for cellular handsets • Synthesizer:designed for tuning systems and is optimized for low-phase noise with comparison frequencies
THE SKYWORKS ADVANTAGEBy turning complexity into simplicity, we provide our customers with the following competitive advantages:• Broad multimode radio and precision analog product portfolio • Market leadership in key product segments • Solutions for all air interface standards, including CDMA2000, GSM/GPRS/EDGE, WCDMA and WLAN • Engagements with a diverse set of influential customers • Analog, RF and mixed signal design capabilities • Access to all key process technologies: GaAs HBT, PHEMT, BiCMOS, SiGE, CMOS and RF CMOS • World-class manufacturing capabilities and scale • Unparalleled level of customer service and technical support • Commitment to technology innovation
MARKETING AND DISTRIBUTIONOur products are primarily sold through a direct Skyworks sales force. This team is globally deployed across all major market regions. In some markets we supplement our direct sales effort with independent manufacturers’ representatives, assuring broader coverage of territories and customers. We also utilize distribution partners, some of which are franchised globally with others focused in specific toregional markets (e.g., Europe, North American markets.America, China and Taiwan).
We maintain an internal marketing organization that is responsible for developing sales and advertising literature, print media, such as product announcements and catalogs, as well as a variety of web-basedWeb-based content. Skyworks’ sales engagement begins at the earliest stages in a customer design. We strive to provide close technical collaboration with our customers at the inception of a new program. This partnership allows our team to facilitate customer-driven solutions, which leverage the unique strength of our portfolio while providing high value and greatly reduced time to market.reducing time-to-market.
We believe that the technical and complex nature of our products and markets demandsdemand an extraordinary commitment to close ongoing relationships with our customers. As such, we strive to expand the scope of our customer relationship to include design, engineering, manufacturing, purchasing and project management. We also employ a collaborative approach in developing these partnerships by combining the support of our design teams, applications engineers, manufacturing personnel, sales and marketing staff and senior management.9
We believe that maintaining frequent and interactive contact with our customers is paramount to our continuous efforts to provide world-class sales and service support. By listening and responding to feedback, we are able to mobilize actions to raise the level of customer satisfaction, improve our ability to anticipate future product needs, and enhance our understanding of key market dynamics. We are confident that diligence in following this path will position Skyworks to participate in numerous opportunities for growth in the future.CUSTOMERS
During fiscal year 2003, Samsung Electronics Co.
REVENUES FROM AND DEPENDENCE ON CUSTOMERS; CUSTOMER CONCENTRATIONFor information regarding customer concentration and Motorola, Inc. accountedrevenues from external customers for 15% and 11%, respectively,our reportable segment for each of the Company’s total net revenues. Duringlast three fiscal year 2002, Samsung Electronics Co. and Motorola, Inc. accounted for 35% and 11%, respectively,years, see Note 16 of the Company’s total net revenues. AsItem 8 of September 30, 2003 Samsung Electronics Co. accounted for approximately 18% of the Company’s gross accounts receivable. The foregoing percentages are basedthis Annual Report on sales representing the wireless business of Conexant’s sales for the fiscal year 2002 up to the time of the Merger, and sales of the combined company for the post-Merger period from June 26, 2002 through the end of the fiscal year and for fiscal 2003.Form 10-K.
INTELLECTUAL PROPERTY AND PROPRIETARY RIGHTSWe own or are licensed under numerous United States and foreign patents and patent applications related to our products, our manufacturing operations and processes and other activities. In addition, we own a number of trademarks and service marks applicable to certain of our products and services. We believe that intellectual property, including patents, patent applications, trade secrets and trademarks are of material importance to our business. We rely on patent, copyright, trademark, trade secret and other intellectual property laws, as well as nondisclosure and confidentiality agreements and other methods, to protect our confidential and proprietary technologies, devices, algorithms and processes.Weprocesses. We cannot guarantee that these efforts will meaningfully protect our intellectual property, and others may independently develop substantially equivalent proprietary technologies, devices, algorithms or processes. In addition, the laws of some foreign countries do not protect proprietary rights to the same extent as the laws of the United States, and effective copyright, patent, trademark and trade secret protection may not be available in those jurisdictions. In addition to protecting our proprietary technologies and processes, we strive to strengthen our intellectual property portfolio to enhance our ability to obtain cross-licenses of intellectual property from others, to obtain access to intellectual property we do not possess and to more favorably resolve potential intellectual property claims against us. WeDue to rapid technological changes in the industry, we believe that ourestablishing and maintaining a technological leadership position depends primarily on our ability to develop new innovative products through the technical competence of our engineering personnel.COMPETITIVE CONDITIONSWe compete on the basis of time to market;time-to-market, new product innovation;innovation, overall product quality and performance; price;performance, price, compliance with industry standards;standards, strategic relationships with customers;customers, and protection of our intellectual property. Certain competitors may be able to adapt more quickly than we can to new or emerging technologies and changes in customer requirements, or may be able to devote greater resources to the development, promotion and sale of their products than we can.Current and potential competitors also have established or may establish financial or strategic relationships among themselves or with our customers, resellers, suppliers or other third parties. These relationships may affect our customers’ purchasing decisions. Accordingly, it is possible that new competitors or alliances among competitors could emerge and rapidly acquire significant market share. We cannot provide assurances that we will be able to compete successfully against current and potential competitors.RESEARCH AND DEVELOPMENTOur products and markets are subject to continued technological advances. Recognizing the importance of such technological advances, we maintain a high level of research and development activities. We maintain close collaborative relationships with many of our customers to help identify market demands and target our development efforts to meet those demands. Our design centers are strategically located around the world to be in close proximity to our customers and to take advantage of key technical and engineering talent worldwide. We are focusing our development efforts on new products, design tools and manufacturing processes using our core technologies.Our research and development expenditures for fiscal 2003, 2002years ended September 29, 2006, September 30, 2005, and 2001October 1, 2004 were $151.8$164.1 million, $132.6$152.2 million, and $111.1$152.6 million, respectively.
10
RAW MATERIALSRaw materials for our products and manufacturing processes are generally available from several sources. ItWe do not carry significant inventories and it is our policy not to depend on a sole source of supply unless market or other conditions dictate otherwise. Consequently, there are limited situations where we procure certain components and services for our products from single or limited sources. We purchase materials and services against long-term agreements or onprimarily pursuant to individual purchase orders. We do not carry significant inventories andHowever, we have a limited number of long-term supply contracts with our suppliers. Certain of our suppliers consign raw materials to us at our manufacturing facilities. We request these raw materials and take title to them as they are needed in our manufacturing process. We believe we have adequate sources for the supply of raw materials and components for our manufacturing needs with suppliers located around the world.Under supply agreements entered into with Conexant and Jazz Semiconductor, we receive wafer fabrication, wafer probe and certain other services from Jazz Semiconductor. Pursuant to these supply agreements, we are committed to obtain certain minimum wafer volumes from Jazz Semiconductor. Our expected minimum purchase obligations under these supply agreements are anticipated to be approximately $39 million and $13 million in fiscal 2004 and 2005, respectively.
BACKLOGOur sales are made primarily pursuant to standard purchase orders for delivery of products, with such purchase orders officially acknowledged by us according to our own terms and conditions. Due to industry practice, which allows customers to cancel orders with limited advance notice to us prior to shipment, and with little or no penalty, we believe that backlog as of any particular date is not a reliable indicator of our future revenue levels. We also deliver product to certain external customer “hubs” (consignment) where our significant customers will pull inventory from their existing consignment inventories when required. These consignment pulls trigger revenue recognition and we periodically replenish these inventory levels.
ENVIRONMENTAL REGULATIONSFederal, state and local requirements relating to the discharge of substances into the environment, the disposal of hazardous wastes, and other activities affecting the environment have had, and will continue to have, an impact on our manufacturing operations. Thus far, compliance with environmental requirements and resolution of environmental claims havehas been accomplished without material effect on our liquidity and capital resources, competitive position or financial condition.Most of our European customers have mandated that our products comply with local and regional lead free and other “green” initiatives. We believe that our current expenditures for environmental capital investment and remediation necessary to comply with present regulations governing environmental protection, and other expenditures for the resolution of environmental claims, will not have a material adverse effect on our liquidity and capital resources, competitive position or financial condition. We cannot assess the possible effect of compliance with future requirements.CYCLICALITY;
CYCLICALITY/ SEASONALITYThe semiconductor industry is highly cyclical and is characterized by constant and rapid technological change. Product obsolescence, price erosion, evolving technical standards and shortened product life cycles may contribute to wide fluctuations in product supply and demand. These and other factors, together with changes in general economic conditions, may cause significant upturns and downturns in the industry, and in our business. We have experienced periods of industry downturns characterized by diminished product demand, production overcapacity, excess inventory levels and accelerated erosion of average selling prices. These factors may cause substantial fluctuations in our revenues and our operational performance. We have experienced these cyclical fluctuations in our business in the past and may experience cyclical fluctuations in the future.Sales of our products are also subject to seasonal fluctuation and periods of increased demand in end-user consumer applications, such as mobile handsets. This generally occurs in the last calendar quarter ending in December. Sales of semiconductor products and system solutions used in these products generally increase just prior to this quarter and continue at a higher level through the end of the calendar year.GEOGRAPHIC INFORMATIONNet
For information regarding net revenues by geographic area are presented based uponregion for each of the countrylast three fiscal years, see Note 16 of destination. Net revenues by geographic area are as follows (in thousands):Item 8 of this Annual Report on Form 10-K.11
Years Ended September 30,
2003
2002
2001
United States $ 87,691 $ 72,185 $ 63,948 Other Americas 69,559 4,615 5,455
Total Americas 157,250 76,800 69,403 South Korea 157,772 237,681 142,459 Other Asia-Pacific 218,817 114,974 23,898
Total Asia-Pacific 376,589 352,655 166,357 Europe, Middle East and Africa 83,950 28,314 24,691
$ 617,789 $ 457,769 $ 260,451
Our revenues by geography do not necessarily correlate to end handset demand by region. For example, if we sell a power amplifier module to a customer in South Korea, we record the sale within the South Korea account although that customer, in turn, may integrate that module into a product sold to a service provider (its customer) in Africa, China, Europe, the Middle East, the Americas or within South Korea.
Long-lived assets by geographic area are as follows (in thousands):
September 30,
2003
2002
United States $ 101,871 $ 109,975 Mexico 21,223 30,427 Other 4,671 3,371
$ 127,765 $ 143,773
EMPLOYEESAs of October 3, 2003, the CompanySeptember 29, 2006, we employed approximately 3,8004,000 persons. Approximately 1,100700 employees in Mexico are covered by collective bargaining agreements. In September 2006, the Company exited its baseband product area and shortly thereafter reduced its global workforce by approximately 10%. These reductions are not reflected in the aforementioned employee census. We believe our future success will depend in large part upon our continued ability to attract, motivate, develop and retain highly skilled and dedicated employees.
ITEM 1A. RISK FACTORSCERTAIN BUSINESS RISKSWe operate in a rapidly changing environment that involves a number of risks, many of which are beyond our control. This discussion highlights some of the risks, which may affect our future operating results. These are the risks and uncertainties we believe are most important for you to consider. Additional risks and uncertainties not presently known to us, which we currently deem immaterial or which are similar to those faced by other companies in our industry or business in general, may also impair our business operations. If any of the following risks or uncertainties actually occurs, our business, financial condition and operating results would likely suffer.We operate in the highly cyclical wireless communications semiconductor industry, which is subject to significant downturns.We operate primarily in the semiconductor industry, which is cyclical and subject to rapid change and evolving industry standards. From time to time, changes in general economic conditions, together with other factors, cause significant upturns and downturns in the industry. Periods of industry downturn are characterized by diminished product demand, production overcapacity, excess inventory levels and accelerated erosion of average selling prices. These characteristics, and in particular their impact on the level of demand for digital cellular handsets, may cause substantial fluctuations in our revenues and results of operations. Furthermore, downturns in the semiconductor industry may be severe and prolonged, and any prolonged delay or failure of the industry or the wireless communications market to recover from downturns would materially and adversely affect our business, financial condition and results of operations. The semiconductor industry also periodically experiences increased demand and production capacity and materials constraints, which may affect our ability to meet customer demand for our products. We have experienced these cyclical fluctuations in our business and may experience cyclical fluctuations in the future.Uncertainties involving shifting marketplace dynamics.Our operating results for fiscal 2005 and fiscal 2006 were adversely affected by shifting marketplace dynamics which favored Tier I and Tier II handset manufacturers and suppliers. Consolidation of the global handset marketplace from smaller Tier III handset customers primarily located in developing countries to Tier I and Tier II customers accelerated in fiscal 2006. This trend led to a slowdown in customer orders, increasing channel inventories and customer defaults on accounts receivable. We responded to this rapidly changing dynamic by exiting our baseband product area in the fourth quarter of fiscal 2006. While this marketplace shift only affected our baseband product area there can be no assurances that future changes in marketplace conditions in our other product areas will not materially and adversely affect our operating results. We may not be able to respond to shifting customer demand in other product areas on a timely basis, if at all, and accordingly this could result in a material and adverse impact to our operating results.We have incurred substantial operating losses in the past and may experience future losses.Our operating results for fiscal years 2002 and 2003 were adversely affected by a global economic slowdown, decreased consumer confidence, reduced capital spending, and adverse business conditions and liquidity concerns in the telecommunications and related industries. These factors led to a slowdown in customer orders, an increase in the number of cancellations and reschedulings of backlog, higher overhead costs as a percentage of our reduced net revenue, and an abrupt decline in demand for many of the end-user products that incorporate our wireless communications semiconductor products and system solutions. Although we emerged from this period of economic12
weakness in fiscal 2004, should economic conditions deteriorate for any reason, it could result in underutilization of our manufacturing capacity, reduced revenues or changes in our revenue mix, and other impacts that would materially and adversely affect our operating results. Due to this economic uncertainty, although we were profitable in fiscal 2004 and fiscal 2005, we cannot assure you that we will be able to sustain such profitability or that we will not experience future operating losses.Additionally, the conflict in Iraq, as well as other contemporary international conflicts, natural disasters, acts of terrorism, and civil and military unrest contributes to the economic uncertainty. These continuing and potentially escalating conflicts can also be expected to place continued pressure on economic conditions in the United States and worldwide. These conditions make it extremely difficult for our customers, our vendors and for us to accurately forecast and plan future business activities. If such uncertainty continues or economic conditions worsen (or both), our business, financial condition and results of operations will likely be materially and adversely affected.The wireless semiconductor markets are characterized by intense competition.The wireless communications semiconductor industry in general and the markets in which we compete in particular are intensely competitive. We compete with U.S. and international semiconductor manufacturers of all sizes in terms of resources and market share. We currently face significant competition in our markets and expect that intense price and product competition will continue. This competition has resulted in, and is expected to continue to result in, declining average selling prices for our products and increased challenges in maintaining or increasing market share. Furthermore, additional competitors may enter our markets as a result of growth opportunities in communications electronics, the trend toward global expansion by foreign and domestic competitors and technological and public policy changes. We believe that the principal competitive factors for semiconductor suppliers in our markets include, among others:• rapid time-to-market and product ramp, • timely new product innovation, • product quality, reliability and performance, • product price, • features available in products, • compliance with industry standards, • strategic relationships with customers, and • access to and protection of intellectual property.
We cannot assure you that we will be able to successfully address these factors. Many of our competitors enjoy the benefit of:• long presence in key markets, • name recognition, • high levels of customer satisfaction, • ownership or control of key technology or intellectual property, and • strong financial, sales and marketing, manufacturing, distribution, technical or other resources.
13
As a result, certain competitors may be able to adapt more quickly than we can to new or emerging technologies and changes in customer requirements or may be able to devote greater resources to the development, promotion and sale of their products than we can.Current and potential competitors have established or may in the future establish, financial or strategic relationships among themselves or with customers, resellers or other third parties. These relationships may affect customers’ purchasing decisions. Accordingly, it is possible that new competitors or alliances among competitors could emerge and rapidly acquire significant market share. Furthermore, some of our customers have divisions that internally develop or manufacture products similar to ours, and may compete with us. We cannot assure you that we will be able to compete successfully against current and potential competitors. Increased competition could result in pricing pressures, decreased gross margins and loss of market share and may materially and adversely affect our business, financial condition and results of operations.Our manufacturing processes are extremely complex and specialized.Our manufacturing operations are complex and subject to disruption, including for causes beyond our control. The fabrication of integrated circuits is an extremely complex and precise process consisting of hundreds of separate steps. It requires production in a highly controlled, clean environment. Minor impurities, contamination of the clean room environment, errors in any step of the fabrication process, defects in the masks used to print circuits on a wafer, defects in equipment or materials, human error, or a number of other factors can cause a substantial percentage of wafers to be rejected or numerous die on each wafer to malfunction. Because our operating results are highly dependent upon our ability to produce integrated circuits at acceptable manufacturing yields, these factors could have a material adverse affect on our business. In addition, we may discover from time to time defects in our products after they have been shipped, which may require us to pay warranty claims, replace products, or pay costs associated with the recall of a customer’s products containing our parts.Additionally, our operations may be affected by lengthy or recurring disruptions of operations at any of our production facilities or those of our subcontractors. These disruptions may include electrical power outages, fire, earthquake, flooding, war, acts of terrorism, health advisories or risks, or other natural or man-made disasters. Disruptions of our manufacturing operations could cause significant delays in shipments until we are able to shift the products from an affected facility or subcontractor to another facility or subcontractor. In the event of such delays, we cannot assure you that the required alternative capacity, particularly wafer production capacity, would be available on a timely basis or at all. Even if alternative wafer production or assembly and test capacity is available, we may not be able to obtain it on favorable terms, which could result in higher costs and/or a loss of customers. We may be unable to obtain sufficient manufacturing capacity to meet demand, either at our own facilities or through external manufacturing or similar arrangements with others.Due to the highly specialized nature of the gallium arsenide integrated circuit manufacturing process, in the event of a disruption at the Newbury Park, California or Woburn, Massachusetts semiconductor wafer fabrication facilities, alternative gallium arsenide production capacity would not be immediately available from third-party sources. These disruptions could have a material adverse effect on our business, financial condition and results of operations.We may not be able to maintain and improve manufacturing yields that contribute positively to our gross margin and profitability.Minor deviations or perturbations in the manufacturing process can cause substantial manufacturing yield loss, and in some cases, cause production to be suspended. Manufacturing yields for new products initially tend to be lower as we complete product development and commence volume manufacturing, and typically increase as we bring the product to full production. Our forward product pricing includes this assumption of improving manufacturing yields and, as a result, material variances between projected and actual manufacturing yields will have a direct effect on our gross margin and profitability. The difficulty of accurately forecasting manufacturing yields and maintaining cost competitiveness through improving manufacturing yields will continue to be magnified by the increasing process complexity of manufacturing semiconductor products. Our manufacturing operations will also face pressures arising from the compression of product life cycles, which will require us to manufacture new products faster and for shorter periods while maintaining acceptable manufacturing yields and quality without, in many cases, reaching the longer-term, high-volume manufacturing conducive to higher manufacturing yields and declining costs.14
We are dependent upon third parties for the manufacture, assembly and test of our products.We rely upon independent wafer fabrication facilities, called foundries, to provide silicon-based products and to supplement our gallium arsenide wafer manufacturing capacity. There are significant risks associated with reliance on third-party foundries, including:• the lack of ensured wafer supply, potential wafer shortages and higher wafer prices, • limited control over delivery schedules, manufacturing yields, production costs and quality assurance, and • the inaccessibility of, or delays in obtaining access to, key process technologies.
Although we have long-term supply arrangements to obtain additional external manufacturing capacity, the third-party foundries we use may allocate their limited capacity to the production requirements of other customers. If we choose to use a new foundry, it will typically take an extended period of time to complete the qualification process before we can begin shipping products from the new foundry. The foundries may experience financial difficulties, be unable to deliver products to us in a timely manner or suffer damage or destruction to their facilities, particularly since some of them are located in earthquake zones. If any disruption of manufacturing capacity occurs, we may not have alternative manufacturing sources immediately available. We may therefore experience difficulties or delays in securing an adequate supply of our products, which could impair our ability to meet our customers’ needs and have a material adverse effect on our operating results.Although we own and operate a test and assembly facility, we still depend on subcontractors to package, assemble and test certain of our products. We do not have long-term agreements with any of our assembly or test subcontractors and typically procure services from these suppliers on a per order basis. If any of these subcontractors experiences capacity constraints or financial difficulties, suffers any damage to its facilities, experiences power outages or any other disruption of assembly or testing capacity, we may not be able to obtain alternative assembly and testing services in a timely manner. Due to the amount of time that it usually takes us to qualify assemblers and testers, we could experience significant delays in product shipments if we are required to find alternative assemblers or testers for our components. Any problems that we may encounter with the delivery, quality or cost of our products could damage our customer relationships and materially and adversely affect our results of operations. We are continuing to develop relationships with additional third-party subcontractors to assemble and test our products. However, even if we use these new subcontractors, we will continue to be subject to all of the risks described above.We are dependent upon third parties for the supply of raw materials and components.Our manufacturing operations depend on obtaining adequate supplies of raw materials and the components used in our manufacturing processes. Although we maintain relationships with suppliers located around the world with the objective of ensuring that we have adequate sources for the supply of raw materials and components for our manufacturing needs, recent increased demand from the semiconductor industry for such raw materials and components has resulted in tighter supplies. We cannot assure you that our suppliers will be able to meet our delivery schedules, that we will not lose a significant or sole supplier, or that a supplier will be able to meet performance and quality specifications. If a supplier were unable to meet our delivery schedules, or if we lost a supplier or a supplier were unable to meet performance or quality specifications, our ability to satisfy customer obligations would be materially and adversely affected. In addition, we review our relationships with suppliers of raw materials and components for our manufacturing needs on an ongoing basis. In connection with our ongoing review, we may modify or terminate our relationship with one or more suppliers. We may also enter into other sole supplier arrangements to meet certain of our raw material or component needs. While we do not typically rely on a single source of supply for our raw materials, we are currently dependent on a sole-source supplier for epitaxial wafers used in the gallium arsenide semiconductor manufacturing processes at our manufacturing facilities. If we were to lose this sole source of supply, for any reason, a material adverse effect on our business could result until an alternate source is obtained. To the extent we enter into additional sole supplier arrangements for any of our raw materials or components, the risks associated with our supply arrangements would be exacerbated.15
Changes in the accounting treatment of share-based compensation have adversely affected our results of operations.In December 2004, the Financial Accounting Standards Board issued SFAS No. 123(R), “Share-Based Payment” to require companies to expense employee stock options for financial reporting purposes. Such equity-based award expensing has required us to value our employee stock option grants and other equity-based awards pursuant to an option valuation formula and amortize that value against our earnings over the vesting period in effect for those options. Historically we accounted for stock-based awards to employees in accordance with Accounting Principles Board Opinion No. 25, “Accounting for Stock Issued to Employees,” and had adopted the disclosure-only alternative of SFAS No. 123, “Accounting for Share-Based Compensation.” We implemented SFAS 123(R) in the reporting period starting October 1, 2005. This change in accounting treatment has materially affected our reported results of operations as the share-based compensation expense has been and will continue to be charged directly against our reported earnings but will have no impact on cash flows from operations. We anticipate that our share-based compensation expense will approximate $24.2 million in total from fiscal 2007 through 2010. This expense projection is calculated as of September 29, 2006 and does not take into account any future equity awards that we might issue nor does it account for future actual stock-based award forfeitures. We will be required to adjust future share-based compensation expense for actual future stock option forfeitures.Our success depends upon our ability to develop new products and reduce costs in a timely manner.The wireless communications semiconductor industry generally and, in particular, the markets into which we sell our products are highly cyclical and characterized by constant and rapid technological change, rapid product evolution, price erosion, evolving technical standards, short product life cycles, increasing demand for higher levels of integration, increased miniaturization, and wide fluctuations in product supply and demand. Our operating results depend largely on our ability to continue to cost-effectively introduce new and enhanced products on a timely basis. The successful development and commercialization of semiconductor devices and modules is highly complex and depends on numerous factors, including:• the ability to anticipate customer and market requirements and changes in technology and industry standards, • the ability to obtain capacity sufficient to meet customer demand, • the ability to define new products that meet customer and market requirements, • the ability to complete development of new products and bring products to market on a timely basis, • the ability to differentiate our products from offerings of our competitors, • overall market acceptance of our products, and • the ability to obtain adequate intellectual property protection for our new products.
Our ability to manufacture current products, and to develop new products, depends, among other factors, on the viability and flexibility of our own internal information technology systems (“IT Systems”).We cannot assure you that we will have sufficient resources to make the substantial investment in research and development needed to develop and bring to market new and enhanced products in a timely manner. We will be required to continually evaluate expenditures for planned product development and to choose among alternative technologies based on our expectations of future market growth. We cannot assure you that we will be able to develop and introduce new or enhanced wireless communications semiconductor products in a timely and cost-effective manner, that our products will satisfy customer requirements or achieve market acceptance or that we will be able to anticipate new industry standards and technological changes. We also cannot assure you that we will be able to respond successfully to new product announcements and introductions by competitors or to changes in the design or specifications of complementary products of third parties with which our products interface. If we fail to16
rapidly and cost-effectively introduce new and enhanced products in sufficient quantities and that meet our customers requirements, our business and results of operations would be materially and adversely harmed.In addition, prices of many of our products decline, sometimes significantly, over time. We believe that to remain competitive, we must continue to reduce the cost of producing and delivering existing products at the same time that we develop and introduce new or enhanced products. We cannot assure you that we will be able to continue to reduce the cost of our products to remain competitive.The markets into which we sell our products are characterized by rapid technological change.The demand for our products can change quickly and in ways we may not anticipate. Our markets generally exhibit the following characteristics:• rapid technological developments and product evolution, • rapid changes in customer requirements, • frequent new product introductions and enhancements, • demand for higher levels of integration, decreased size and decreased power consumption, • short product life cycles with declining prices over the life cycle of the product, and • evolving industry standards.
These changes in our markets may contribute to the obsolescence of our products. Our products could become obsolete or less competitive sooner than anticipated because of a faster than anticipated change in one or more of the above-noted factors.The ability to attract and retain qualified personnel to contribute to the design, development, manufacture and sale of our products is critical to our success.As the source of our technological and product innovations, our key technical personnel represent a significant asset. Our success depends on our ability to continue to attract, retain and motivate qualified personnel, including executive officers and other key management and technical personnel. The competition for management and technical personnel is intense in the semiconductor industry, and therefore we cannot assure you that we will be able to attract and retain qualified management and other personnel necessary for the design, development, manufacture and sale of our products. We may have particular difficulty attracting and retaining key personnel during periods of poor operating performance, given, among other things, the use of equity-based compensation by us and our competitors. The loss of the services of one or more of our key employees or our inability to attract, retain and motivate qualified personnel, could have a material adverse effect on our ability to operate our business.If OEMs and Original Design Manufacturers (“ODMs”) of communications electronics products do not design our products into their equipment, we will have difficulty selling those products. Moreover, a “design win” from a customer does not guarantee future sales to that customer.Our products are not sold directly to the end-user, but are components or subsystems of other products. As a result, we rely on OEMs and ODMs of wireless communications electronics products to select our products from among alternative offerings to be designed into their equipment. Without these “design wins,” we would have difficulty selling our products. If a manufacturer designs another supplier’s product into one of its product platforms, it is more difficult for us to achieve future design wins with that platform because changing suppliers involves significant cost, time, effort and risk on the part of that manufacturer. Also, achieving a design win with a customer does not ensure that we will receive significant revenues from that customer. Even after a design win, the customer is not obligated to purchase our products and can choose at any time to reduce or cease use of our products, for example, if its own products are not commercially successful, or for any other reason. We cannot assure you that we17
will continue to achieve design wins or to convert design wins into actual sales, and any failure to do so could materially and adversely affect our operating results.Lengthy product development and sales cycles associated with many of our products may result in significant expenditures before generating any revenues related to those products.After our product has been developed, tested and manufactured, our customers may need three to six months or longer to integrate, test and evaluate our product and an additional three to six months or more to begin volume production of equipment that incorporates the product. This lengthy cycle time increases the possibility that a customer may decide to cancel or change product plans, which could reduce or eliminate our sales to that customer. As a result of this lengthy sales cycle, we may incur significant research and development expenses, and selling, general and administrative expenses, before we generate the related revenues for these products. Furthermore, we may never generate the anticipated revenues from a product after incurring such expenses if our customer cancels or changes its product plans.Uncertainties involving the ordering and shipment of, and payment for, our products could adversely affect our business.Our sales are typically made pursuant to individual purchase orders and not under long-term supply arrangements with our customers. Our customers may cancel orders before shipment. Additionally, we sell a portion of our products through distributors, some of whom have rights to return unsold products. We may purchase and manufacture inventory based on estimates of customer demand for our products, which is difficult to predict. This difficulty may be compounded when we sell to OEMs indirectly through distributors or contract manufacturers, or both, as our forecasts of demand will then be based on estimates provided by multiple parties. In addition, our customers may change their inventory practices on short notice for any reason. The cancellation or deferral of product orders, the return of previously sold products, or overproduction due to a change in anticipated order volumes could result in us holding excess or obsolete inventory, which could result in inventory write-downs and, in turn, could have a material adverse effect on our financial condition.In addition, if a customer encounters financial difficulties of its own as a result of a change in demand or for any other reason, the customer’s ability to make timely payments to us for non-returnable products could be impaired.In the fourth quarter of fiscal 2006, the Company recorded bad debt expense of $35.1 million. Specifically, the Company recorded charges related to two customers: Vitelcom Mobile and an Asian component distributor.Our leverage and our debt service obligations may adversely affect our cash flow.On September 29, 2006, we had total indebtedness of approximately $229.3 million, which represented approximately 25.2% of our total capitalization.As long as our 4.75 percent convertible subordinated notes due November 2007 remain outstanding, we will have debt service obligations on such notes of approximately $8.5 million per year. If we issue other debt securities in the future, our debt service obligations will increase.Based on our results of operations for fiscal 2006 and current trends, we expect our existing sources of liquidity, together with cash expected to be generated from operations and short term investments along with our ability to access financial markets for additional debt or equity financing, will allow us to sufficiently fund our research and development, capital expenditures, debt obligations (to replace existing or maturing debt instruments), purchase obligations, working capital and other cash requirements for at least the next 12 months. If necessary, among other alternatives, we may add lease lines of credit to finance capital expenditures and we may obtain other long-term debt, lines of credit and other financing.Our indebtedness could have significant negative consequences, including:increasing our vulnerability to general adverse economic and industry conditions,18
• limiting our ability to obtain additional financing, • requiring the dedication of a substantial portion of any cash flow from operations to service our indebtedness, thereby reducing the amount of cash flow available for other purposes, including capital expenditures, • limiting our flexibility in planning for, or reacting to, changes in our business and the industry in which we compete, and • placing us at a possible competitive disadvantage to less leveraged competitors and competitors that have better access to capital resources.
Despite our current debt levels, we are able to incur substantially more debt, which would increase the risks described above.Our reliance on a small number of customers for a large portion of our sales could have a material adverse effect on the results of our operations.Significant portions of our sales are concentrated among a limited number of customers. If we lost one or more of these major customers, or if one or more major customers significantly decreased its orders for our products, our business would be materially and adversely affected. Sales to our three largest customers, including sales to their manufacturing subcontractors, represented approximately 50.0% of our net revenue for fiscal 2006. We expect that our largest customers will continue to account for a substantial portion of our net revenue in fiscal 2007 and for the foreseeable future.Average product life cycles in the semiconductor industry tend to be very short.In the semiconductor industry, product life cycles tend to be short relative to the sales and development cycles. Therefore, the resources devoted to product sales and marketing may not result in material revenue, and from time to time we may need to write off excess or obsolete inventory. If we were to incur significant marketing expenses and investments in inventory that we are not able to recover, and we are not able to compensate for those expenses, our operating results would be materially and adversely affected. In addition, if we sell our products at reduced prices in anticipation of cost reductions but still hold higher cost products in inventory, our operating results would be harmed.We face a risk that capital needed for our business will not be available when we need it.We might obtain additional sources of financing in the future. Based on our results of operations for fiscal 2006 and current trends, we expect our existing sources of liquidity, together with cash expected to be generated from operations and short term investments along with our ability to access financial markets for additional debt or equity financing, will likely allow us to sufficiently fund our research and development, capital expenditures, debt obligations, purchase obligations, working capital and other cash requirements for at least the next 12 months. To the extent that existing cash and securities and cash from operations are insufficient to fund our future activities, we may need to raise additional funds through public or private equity or debt financing. Conditions existing in the U.S. capital markets, if and when we seek additional financing as well as the then current condition of the Company, will affect our ability to raise capital, as well as the terms of any such financing. We may not be able to raise enough capital to meet our capital needs on a timely basis or at all. Failure to obtain capital when required would have a material adverse effect on us.In addition, any strategic investments and acquisitions that we may make to help us grow our business may require additional capital resources. We cannot assure you that the capital required to fund these investments and acquisitions will be available in the future.19
Remaining competitive in the semiconductor industry requires transitioning to smaller geometry process technologies and achieving higher levels of design integration.In order to remain competitive, we expect to continue to transition our semiconductor products to increasingly smaller line width geometries. This transition requires us to modify the manufacturing processes for our products, design new products to more stringent standards, and to redesign some existing products. In the past, we have experienced some difficulties migrating to smaller geometry process technologies or new manufacturing processes, which resulted in sub-optimal manufacturing yields, delays in product deliveries and increased expenses. We may face similar difficulties, delays and expenses as we continue to transition our products to smaller geometry processes in the future. In some instances, we depend on our relationships with our foundries to transition to smaller geometry processes successfully. We cannot assure you that our foundries will be able to effectively manage the transition or that we will be able to maintain our foundry relationships. If our foundries or we experience significant delays in this transition or fail to efficiently implement this transition, our business, financial condition and results of operations could be materially and adversely affected. As smaller geometry processes become more prevalent, we expect to continue to integrate greater levels of functionality, as well as customer and third party intellectual property, into our products. However, we may not be able to achieve higher levels of design integration or deliver new integrated products on a timely basis, or at all.We are subject to the risks of doing business internationally.A substantial majority of our net revenues are derived from customers located outside the United States, primarily countries located in the Asia-Pacific region and Europe. In addition, we have suppliers located outside the United States, and third-party packaging, assembly and test facilities and foundries located in the Asia-Pacific region. Finally, we have our own packaging, assembly and test facility in Mexicali, Mexico. Our international sales and operations are subject to a number of risks inherent in selling and operating abroad. These include, but are not limited to, risks regarding:• currency exchange rate fluctuations, • local economic and political conditions, including social, economic and political instability, • disruptions of capital and trading markets, • inability to collect accounts receivable, • restrictive governmental actions (such as restrictions on transfer of funds and trade protection measures, including export duties, quotas, customs duties, import or export controls and tariffs), • changes in legal or regulatory requirements, • natural disasters, acts of terrorism, widespread illness and war, • limitations on the repatriation of funds, • difficulty in obtaining distribution and support, • cultural differences in the conduct of business, • the laws and policies of the United States and other countries affecting trade, foreign investment and loans, and import or export licensing requirements, • tax laws, • the possibility of being exposed to legal proceedings in a foreign jurisdiction, and • limitations on our ability under local laws to protect or enforce our intellectual property rights in a particular foreign jurisdiction.
20
Additionally, we are subject to risks in certain global markets in which wireless operators provide subsidies on handset sales to their customers. Increases in handset prices that negatively impact handset sales can result from changes in regulatory policies or other factors, which could impact the demand for our products. Limitations or changes in policy on phone subsidies in South Korea, Japan, China and other countries may have additional negative impacts on our revenues.Our operating results may be adversely affected by substantial quarterly and annual fluctuations and market downturns.Our revenues, earnings and other operating results have fluctuated in the past and our revenues, earnings and other operating results may fluctuate in the future. These fluctuations are due to a number of factors, many of which are beyond our control.These factors include, among others:• changes in end-user demand for the products (principally digital cellular handsets) manufactured and sold by our customers, • the effects of competitive pricing pressures, including decreases in average selling prices of our products, • production capacity levels and fluctuations in manufacturing yields, • availability and cost of products from our suppliers, • the gain or loss of significant customers, • our ability to develop, introduce and market new products and technologies on a timely basis, • new product and technology introductions by competitors, • changes in the mix of products produced and sold, • market acceptance of our products and our customers, and • intellectual property disputes.
The foregoing factors are difficult to forecast, and these, as well as other factors, could materially and adversely affect our quarterly or annual operating results. If our operating results fail to meet the expectations of analysts or investors, it could materially and adversely affect the price of our common stock.Global economic conditions that impact the wireless communications industry could negatively affect our revenues and operating results.Global economic weakness can have wide-ranging effects on markets that we serve, particularly wireless communications equipment manufacturers and network operators. Although the wireless communications industry has recovered somewhat from an industry-wide recession, such recovery may not continue. In addition, we cannot predict what effects negative events, such as war or other international conflicts, may have on the economy or the wireless communications industry. The continued threat of terrorism and heightened security and military action in response to this threat, or any future acts of terrorism, may cause further disruptions to the global economy and to the wireless communications industry and create further uncertainties. Further, a continued economic recovery may not benefit us in the near term. If it does not, our ability to increase or maintain our revenues and operating results may be impaired.21
Our gallium arsenide semiconductors may cease to be competitive with silicon alternatives.Among our product portfolio, we manufacture and sell gallium arsenide semiconductor devices and components, principally power amplifiers and switches. The production of gallium arsenide integrated circuits is more costly than the production of silicon circuits. The cost differential is due to higher costs of raw materials for gallium arsenide and higher unit costs associated with smaller sized wafers and lower production volumes. Therefore, to remain competitive, we must offer gallium arsenide products that provide superior performance over their silicon-based counterparts. If we do not continue to offer products that provide sufficiently superior performance to justify the cost differential, our operating results may be materially and adversely affected. We expect the costs of producing gallium arsenide devices will continue to exceed the costs of producing their silicon counterparts. Silicon semiconductor technologies are widely used process technologies for certain integrated circuits and these technologies continue to improve in performance. We cannot assure you that we will continue to identify products and markets that require performance attributes of gallium arsenide solutions.We may be subject to claims of infringement of third-party intellectual property rights, or demands that we license third-party technology, which could result in significant expense and prevent us from using our technology.The semiconductor industry is characterized by vigorous protection and pursuit of intellectual property rights. From time to time, third parties have asserted and may in the future assert patent, copyright, trademark and other intellectual property rights to technologies that are important to our business and have demanded and may in the future demand that we license their technology or refrain from using it.Any litigation to determine the validity of claims that our products infringe or may infringe intellectual property rights of another, including claims arising from our contractual indemnification of our customers, regardless of their merit or resolution, could be costly and divert the efforts and attention of our management and technical personnel. Regardless of the merits of any specific claim, we cannot assure you that we would prevail in litigation because of the complex technical issues and inherent uncertainties in intellectual property litigation. If litigation were to result in an adverse ruling, we could be required to:• pay substantial damages, • cease the manufacture, import, use, sale or offer for sale of infringing products or processes, • discontinue the use of infringing technology, • expend significant resources to develop non-infringing technology, and • license technology from the third party claiming infringement, which license may not be available on commercially reasonable terms.
We cannot assure you that our operating results or financial condition will not be materially adversely affected if we were required to do any one or more of the foregoing items.Many of our products incorporate technology licensed or acquired from third parties.We sell products in markets that are characterized by rapid technological changes; evolving industry standards, frequent new product introductions, short product life cycles and increasing levels of integration. Our ability to keep pace with this market depends on our ability to obtain technology from third parties on commercially reasonable terms to allow our products to remain in a competitive posture. If licenses to such technology are not available on commercially reasonable terms and conditions, and we cannot otherwise integrate such technology, our products or our customers’ products could become unmarketable or obsolete, and we could lose market share. In such instances, we could also incur substantial unanticipated costs or scheduling delays to develop substitute technology to deliver competitive products.22
If we are not successful in protecting our intellectual property rights, it may harm our ability to compete.We rely on patent, copyright, trademark, trade secret and other intellectual property laws, as well as nondisclosure and confidentiality agreements and other methods, to protect our proprietary technologies, information, data, devices, algorithms and processes. In addition, we often incorporate the intellectual property of our customers, suppliers or other third parties into our designs, and we have obligations with respect to the non-use and non-disclosure of such third-party intellectual property. In the future, it may be necessary to engage in litigation or like activities to enforce our intellectual property rights, to protect our trade secrets or to determine the validity and scope of proprietary rights of others, including our customers. This could require us to expend significant resources and to divert the efforts and attention of our management and technical personnel from our business operations. We cannot assure you that:• the steps we take to prevent misappropriation, infringement, dilution or other violation of our intellectual property or the intellectual property of our customers, suppliers or other third parties will be successful, • any existing or future patents, copyrights, trademarks, trade secrets or other intellectual property rights or ours will not be challenged, invalidated or circumvented, or • any of the measures described above would provide meaningful protection.
Despite these precautions, it may be possible for a third party to copy or otherwise obtain and use our technology without authorization, develop similar technology independently or design around our patents. If any of our intellectual property protection mechanisms fails to protect our technology, it would make it easier for our competitors to offer similar products, potentially resulting in loss of market share and price erosion. Even if we receive a patent, the patent claims may not be broad enough to adequately protect our technology. Furthermore, even if we receive patent protection in the United States, we may not seek, or may not be granted, patent protection in foreign countries. In addition, effective patent, copyright, trademark and trade secret protection may be unavailable or limited for certain technologies and in certain foreign countries.There is a growing industry trend to include or adapt “open source” software that is generally made available to the public by its developers, authors or third parties. Often such software includes license provisions, requiring public disclosure of any derivative works containing open source code. There is little legal precedent in the area of open source software or its effects on copyright law or the protection of proprietary works. We take steps to avoid the use of open source works in our proprietary software, and are taking steps to limit our suppliers from doing so. However, in the event a copyright holder were to demonstrate in court that we have not complied with a software license, we may be required to cease production or distribution of that work or to publicly disclose the source code for our proprietary software, which may negatively affect our operations or stock price.We attempt to control access to and distribution of our proprietary information through operational, technological and legal safeguards. Despite our efforts, parties, including former or current employees, may attempt to copy, disclose or obtain access to our information without our authorization. Furthermore, attempts by computer hackers to gain unauthorized access to our systems or information could result in our proprietary information being compromised or interrupt our operations. While we attempt to prevent such unauthorized access we may be unable to anticipate the methods used, or be unable to prevent the release of our proprietary information.Our success depends, in part, on our ability to effect suitable investments, alliances and acquisitions, and to integrate companies we acquire.Although we have in the past and intend to continue to invest significant resources in internal research and development activities, the complexity and rapidity of technological changes and the significant expense of internal research and development make it impractical for us to pursue development of all technological solutions on our own. On an ongoing basis, we intend to review investment, alliance and acquisition prospects that would complement our product offerings, augment our market coverage or enhance our technological capabilities. However, we cannot assure you that we will be able to identify and consummate suitable investment, alliance or acquisition transactions in the future. Moreover, if we consummate such transactions, they could result in:issuances of equity securities dilutive to our stockholders,23
• large one-time write-offs, • the incurrence of substantial debt and assumption of unknown liabilities, • the potential loss of key employees from the acquired company, • amortization expenses related to intangible assets, and • the diversion of management’s attention from other business concerns.
Moreover, integrating acquired organizations and their products and services may be difficult, expensive, time-consuming and a strain on our resources and our relationship with employees and customers and ultimately may not be successful. Additionally, in periods following an acquisition, we will be required to evaluate goodwill and acquisition-related intangible assets for impairment. When such assets are found to be impaired, they will be written down to estimated fair value, with a charge against earnings. For instance, we recorded a cumulative effect of a change in accounting principle in fiscal 2003 in the amount of $397.1 million as a result of the goodwill obtained in connection with the Merger.Certain provisions in our organizational documents and Delaware law may make it difficult for someone to acquire control of us.We have certain anti-takeover measures that may affect our common stock. Our certificate of incorporation, our by-laws and the Delaware General Corporation Law contain several provisions that would make more difficult an acquisition of control of us in a transaction not approved by our Board of Directors. Our certificate of incorporation and by-laws include provisions such as:• the division of our Board of Directors into three classes to be elected on a staggered basis, one class each year, • the ability of our Board of Directors to issue shares of preferred stock in one or more series without further authorization of stockholders, • a prohibition on stockholder action by written consent, • elimination of the right of stockholders to call a special meeting of stockholders, • a requirement that stockholders provide advance notice of any stockholder nominations of directors or any proposal of new business to be considered at any meeting of stockholders, • a requirement that the affirmative vote of at least 66 2/3 percent of our shares be obtained to amend or repeal any provision of our by-laws or the provision of our certificate of incorporation relating to amendments to our by-laws, • a requirement that the affirmative vote of at least 80% of our shares be obtained to amend or repeal the provisions of our certificate of incorporation relating to the election and removal of directors, the classified board or the right to act by written consent, • a requirement that the affirmative vote of at least 80% of our shares be obtained for business combinations unless approved by a majority of the members of the Board of Directors and, in the event that the other party to the business combination is the beneficial owner of 5% or more of our shares, a majority of the members of Board of Directors in office prior to the time such other party became the beneficial owner of 5% or more of our shares, • a fair price provision, and
24
a requirement that the affirmative vote of at least 90% of our shares be obtained to amend or repeal the fair price provision.In addition to the provisions in our certificate of incorporation and by-laws, Section 203 of the Delaware General Corporation Law generally provides that a corporation shall not engage in any business combination with any interested stockholder during the three-year period following the time that such stockholder becomes an interested stockholder, unless a majority of the directors then in office approves either the business combination or the transaction that results in the stockholder becoming an interested stockholder or specified stockholder approval requirements are met.Increasingly stringent environmental laws, rules and regulations may require us to redesign our existing products and processes, and could adversely affect our ability to cost-effectively produce our products.The semiconductor and electronics industries have been subject to increasing environmental regulations. A number of domestic and foreign jurisdictions seek to restrict the use of various substances, a number of which have been used in our products or processes. For example, the European Union Restriction of Hazardous Substances in Electrical and Electronic Equipment (RoHS) Directive now requires that certain substances be removed from all electronics components. Removing such substances requires the expenditure of additional research and development funds to seek alternative substances, as well as increased testing by third parties to ensure the quality of our products and compliance with the RoHS Directive. While we have implemented a compliance program to ensure our product offering meets these regulations, there may be instances where alternative substances will not be available or commercially feasible, or may only be available from a single source, or may be significantly more expensive than their restricted counterparts. Additionally, if we were found to be non-compliant with any such rule or regulation, we could be subject to fines, penalties and/or restrictions imposed by government agencies that could adversely affect our operating results.We may be liable for penalties under environmental laws, rules and regulations, which could adversely impact our business.We have used, and will continue to use, a variety of chemicals and compounds in manufacturing operations and have been and will continue to be subject to a wide range of environmental protection regulations in the United States and in foreign countries. We cannot assure you that current or future regulation of the materials necessary for our products would not have a material adverse effect on our business, financial condition and results of operations. Environmental regulations often require parties to fund remedial action for violations of such regulations regardless of fault. Consequently, it is often difficult to estimate the future impact of environmental matters, including potential liabilities. Furthermore, our customers increasingly require warranties or indemnity relating to compliance with environmental regulations. We cannot assure you that the amount of expense and capital expenditures that might be required to satisfy environmental liabilities, to complete remedial actions and to continue to comply with applicable environmental laws will not have a material adverse effect on our business, financial condition and results of operations.Our stock price has been volatile and may fluctuate in the future. Accordingly, you might not be able to sell your shares of common stock at or above the price you paid for them.The trading price of our common stock has and may continue to fluctuate significantly. Such fluctuations may be influenced by many factors, including:• our performance and prospects, • the performance and prospects of our major customers, • the depth and liquidity of the market for our common stock, • investor perception of us and the industry in which we operate, • changes in earnings estimates or buy/sell recommendations by analysts,
25
• general financial and other market conditions, and • domestic and international economic conditions.
Public stock markets have recently experienced extreme price and trading volume volatility, particularly in the technology sectors of the market. This volatility has significantly affected the market prices of securities of many technology companies for reasons frequently unrelated to or disproportionately impacted by the operating performance of these companies. These broad market fluctuations may materially and adversely affect the market price of our common stock.In addition, fluctuations in our stock price, volume of shares traded, and our price-to-earnings multiple may have made our stock attractive to momentum, hedge or day-trading investors who often shift funds into and out of stocks rapidly, exacerbating price fluctuations in either direction, particularly when viewed on a quarterly basis. Our Company has been, and in the future may be, the subject of commentary by financial news media. Such commentary may contribute to volatility in our stock price. If our operating results do not meet the expectations of securities analysts or investors, our stock price may decline, possibly substantially over a short period of time. Accordingly, you may not be able to resell your shares of common stock at or above the price you paid.ITEM 1B. UNRESOLVED STAFF COMMENTSNone.ITEM 2. PROPERTIESPROPERTIES.
We own and lease manufacturing facilities and other real estate properties in the United States and a number of foreign countries. For information regarding property, plant and equipment by geographic region for each of the last two fiscal years, see Note 16 of Item 8 of this Annual Report on Form 10-K. We own and lease approximately 900,000760,000 square feet and 100,00062,000 square feet, respectively, of office and manufacturing space. In addition, we lease approximately 430,000397,000 square feet of sales office and design center space with approximately 22% of this space located in foreign countries. We are headquartered in Woburn, Massachusetts and have executive offices in Irvine, California. The following table sets forth our principal facilities measuring 50,000 square feet or more:Location
Owned/Leased
Primary Function
Woburn, Massachusetts Owned Corporate headquarters and manufacturing Irvine, California Leased Office space and design center Newbury Park, California Owned Manufacturing and office space Newbury Park, California Leased Design center Adamstown, Maryland Owned Manufacturing and office space Newbury Park, CaliforniaLeasedDesign centerAdamstown, MarylandOwnedManufacturing and office spaceMexicali, Mexico Owned Assembly and test facility Haverhill, MassachusettsOwnedVacant - building and land held for sale
Due to the exit of our baseband product area on September 29, 2006, we will be vacating a portion of the office and design center space in Irvine, California in fiscal year 2007 and certain of our sales office and design center space at foreign locations.We believe our properties have been well maintained, are in sound operating condition and contain all the equipment and facilities necessary to operate at present levels.Certain of our facilities, including our California and Mexico facilities, are located near major earthquake fault lines. We maintain no earthquake insurance with respect to these facilities.
ITEM 3. LEGAL PROCEEDINGSPROCEEDINGS.
From time to time various lawsuits, claims and proceedings have been, and may in the future be, instituted or asserted against Skyworks, including those pertaining to patent infringement, intellectual property, environmental, product liability, safety and health, employment and contractual matters. In addition, in connection with the Merger, Skyworks has assumed responsibility for all then current and future litigation (including environmental and intellectual property proceedings) against Conexant or its subsidiaries in respect of the operations of Conexant’s wireless business. The outcome of litigation cannot be26
predicted with certainty and some lawsuits, claims or proceedings may be disposed of unfavorably to Skyworks. Intellectual property disputes often have a risk of injunctive relief, which, if imposed against Skyworks, could materially and adversely affect the financial condition, or results of operations of Skyworks.Additionally, the semiconductor industry is characterized by vigorous protection and pursuit of intellectual property rights. From time to time, third parties have asserted and may in the future assert patent, copyright, trademark and other intellectual property rights to technologies that are important to our business and have demanded and may in the future demand that we license their technology. At the present time, we are in discussions with Qualcomm Incorporated regarding claims each of us have filed and served against the other in the United States District Court for Southern District of California asserting violations of certain of our respective intellectual property rights. The purpose of these discussions is to arrive at a business resolution that avoids protracted litigation for both parties. We believe their claims are without merit and if we are not successful resolving this matter outside of litigation, we are prepared to vigorously defend against their claims and fully prosecute our claims against them.
ITEM 4. SUBMISSION OF MATTERS TO A VOTE OF SECURITY HOLDERSHOLDERS.
There were no matters submitted to a vote of security holders during the quarter ended October 3, 2003.September 29, 2006.27
PART IIITEM 5. MARKET FOR THE REGISTRANT’S COMMON STOCK ANDEQUITY, RELATED STOCKHOLDER MATTERS AND ISSUER PURCHASES OF EQUITY SECURITIES.
Our common stock is traded on the Nasdaq NationalNASDAQ Global Select Market under the symbol “SWKS”. The following table sets forth the range of high and low sale prices for our common stock for the periods indicated, as reported by Nasdaq. Such quotations represent inter-dealer prices without retail markup, markdown or commission and may not necessarily represent actual transactions. The merger of the wireless business of Conexant with Alpha and the acquisition of the Mexicali Operations (“Washington/Mexicali”) was completed on June 25, 2002. Market price range information for periods on and after June 26, 2002 reflects sale prices for the common stock of the combined company, and market price range information for all periods on and prior to June 25, 2002 reflects prices for the common stock of Alpha on the Nasdaq National Market under the symbol “AHAA”. Washington/Mexicali was not publicly traded prior to the Merger.NASDAQ Global Select Market. The number of stockholders of record of Skyworks’ common stock as of November 28, 200316, 2006, was approximately 38,931.High
Low
Fiscal year ended October 3, 2003: First quarter $ 12 .73 $ 4 .00 Second quarter 9 .57 5 .96 Third quarter 8 .10 4 .94 Fourth quarter 12 .28 6 .52 Fiscal year ended September 27, 2002: First quarter $ 31 .84 $ 15 .64 Second quarter 24 .24 14 .05 Third quarter, until June 25, 2002 17 .54 5 .22 Third quarter, on and after June 26, 2002 6 .00 4 .71 Fourth quarter 6 .00 2 .89
33,558.
High Low Fiscal year ended September 29, 2006: First quarter $ 7.14 $ 4.64 Second quarter 7.09 5.01 Third quarter 8.00 5.15 Fourth quarter 5.80 4.03 Fiscal year ended September 30, 2005: First quarter $ 10.91 $ 8.74 Second quarter 8.99 6.07 Third quarter 7.94 5.07 Fourth quarter 8.38 6.67
Neither Skyworks nor its corporate predecessor, Alpha, have paid cash dividends on common stock since an Alpha dividend made in fiscal 1986, and Skyworks does not anticipate paying cash dividends in the foreseeable future. Our expectation is to retain all of our future earnings, if any, to finance future growth.RECENT SALES OF UNREGISTERED SECURITIES
On June 25, 2002, in connection with the Merger, the Company issued to Jazz Semiconductor, Inc. a warrant to purchase 1,017,900 shares of the Company’s common stock at a price of $24.02 per share. This warrant is exercisable in increments of 25% as of June 25, 2002, March 11, 2003, September 11, 2003 and March 11, 2004. This warrant was issued in reliance upon the exemption from registration set forth in Section 4(2) of the Securities Act of 1933 (the “Securities Act”).
The Company did not receive any cash proceeds from the issuance of this warrant.On December 12, 2002, the Company issued 46,211 shares of its common stock to Skyworks Technologies, Inc (“STI”) in connection with the settlement of an outstanding complaint filed by STI alleging trademark infringement, false designation of origin, unfair competition, and false advertising by the Company. The settlement agreement entered into with STI required that the Company issue such shares to STI and that STI release of all of its pending claims against the Company, as well as arranged for mutual coexistence using the name “Skyworks.” The common stock was issued in reliance upon the exemption from registration set forth in Section 4(2) of the Securities Act. The common stock issued in this transaction has been registered for resale pursuant to an effective registration statement on Form S-3. The Company did not receive any cash proceeds from the issuance of this common stock.
On November 12, 2002, the Company sold $230 million aggregate principal amount of its 4.75 percent convertible subordinated notes due November 15, 2007 (the “Junior Notes”), in a private placement pursuant to Section 4(2) of the Securities Act, at a purchase price equal to 100 percent of the principal amount at maturity of the notes, resulting in net proceeds to the Company of approximately $222.6 million. The initial purchasers, Credit Suisse First Boston Corporation, CIBC World Markets Corp. and U.S. Bancorp Piper Jaffray Inc., purchased the Junior Notes at 97 percent of the issue price and resold them in private resale transactions to qualified institutional buyers pursuant to Rule 144A of the Exchange Act of 1934, as amended. The Junior Notes are convertible at the option of the holder at any time on or prior to maturity into shares of our common stock at a conversion price of $9.0505 per share which is equal to 110.4911 shares per $1,000 principal amount of notes, subject to adjustment. The Junior Notes are subordinated to our existing and future senior indebtedness (including the Senior Notes discussed below). We may redeem the Junior Notes at any time after November 20, 2005. The redemption price of the Junior Notes during the period between November 20, 2005 through November 14, 2006 will be $1,011.875 per $1,000 principal amount of notes to be redeemed, plus accrued and unpaid interest, if any, to the redemption date, and the redemption price of the notes beginning on November 15, 2006 and thereafter will be $1,000 per $1,000 principal amount of notes to be redeemed, plus accrued and unpaid interest, if any, to the redemption date. Holders may require the Company to repurchase the Junior Notes upon a change in control of the Company.
The net proceeds from the offering of Junior Notes were principally used to retire $105 million of a $150 million note issued to Conexant for the purchase of the Mexicali Operations and to prepay $65 million principal amount outstanding as of November 13, 2002 under a separate loan facility with Conexant, dissolving the loan facility. In connection with the prepayment of $105 million of the $150 million note relating to the purchase of the Mexicali Operations, the remaining $45 million principal balance on this note was exchanged, in a private placement to Conexant pursuant to Section 3(a)(9) of the Securities Act, for an equal principal amount of new 15 percent Interim Convertible Notes due June 30, 2005 (the “Interim Notes”) with a maturity date of June 30, 2005. In addition to the retirement of $170 million in principal amount of indebtedness owing to Conexant, we also retained approximately $53 million of net proceeds of the private placement to support our working capital needs.
On November 25, 2002, the Company issued $45 million aggregate principal amount of 15 percent Convertible Senior Subordinated Notes due June 30, 2005 (the “Senior Notes”) to Conexant, in a private placement pursuant to Section 3(a)(9) of the Securities Act, in exchange for an equal principal amount of Interim Notes which were issued to Conexant in November 2002. The Senior Notes mature on June 30, 2005, unless earlier converted or redeemed. At maturity (including upon certain acceleration events), we will pay the principal amount of the Senior Notes by issuing a number of sharesfollowing table provides information regarding repurchases of common stock equal tomade by us during the principal amount of the Senior Notes then due and payable divided by the applicable conversion price in effect on such date, together with cash in lieu of any fractional shares. The Senior Notes are convertible at the option of the holder into shares of our common stock, at the applicable conversion price as of the related conversion date, at any time prior to maturity at an initial conversion price of $7.87 per share, subject to adjustment for certain anti-dilution events and as follows: in the event that the market price of our common stock is below the conversion price for a specified period, the Senior Notes are convertible into that number of shares of our common stock that is equal to the principal amount of the Senior Notes being converted divided by the market price of our common stock, provided that in no event will the number of shares issued exceed 125 percent of the number of shares that the holders would have received at the initial conversion price. We may redeem the Senior Notes at any time after May 12, 2004 at $1,030 per $1,000 principal amount of Senior Notes to be redeemed, plus accrued and unpaid interest. Holders of the Senior Notes may require us to repurchase the Senior Notes upon a change in control. The Company did not receive any separate cash proceeds from the issuance of the Senior Notes.fiscal quarter ended September 29, 2006:
Maximum Number (or Approximately Total Number of Dollar Value) of Shares Purchased Shares that May as Part of Publicly Yet Be Purchased Total Number of Averaged Price Announced Plans or Under the Plans or Period Shares Purchased Paid per Share Programs Programs August 14, 2006 10,649 (1) $ 4.36 N/A(2) N/A(2) September 5, 2006 7,600 (1) $ 5.10 N/A(2) N/A(2)
(1) All shares of common stock reported in the table above were purchased by us, at the fair market value of the common stock on August 14, 2006 and September 5, 2006, respectively, in connection with the satisfaction of tax withholding obligations under restricted stock agreements between us and certain of our key employees. (2) We have no publicly announced plans or programs.
28
For information regarding securities authorized for issuance under equity compensation plans, seeItem 12 of this Annual Report on Form 10-K.
ITEM 6. SELECTED FINANCIAL DATADATA.
You should read the data set forth below in conjunction withItem 7, “Management’s Discussion and Analysis of Financial Condition and Results of Operations”Operation,” and ourconsolidated financial statements and related notes appearing elsewhere in this Annual Report on Form 10-K. The Company’s fiscal year ends on the Friday closest to September 30. Fiscal 20032006 consisted of 5352 weeks and ended on October 3, 2003September 29, 2006, and fiscal years 20022005 and 20012004 each consisted of 52 weeks and ended on September 27, 200230, 2005 and September 28, 2001,October 1, 2004, respectively. For convenience, the consolidated financial statements have been shown as ending on the last day of the calendar month. The following balance sheet data and statements of operations data for the five years ended September 30, 200329, 2006, were derived from our audited consolidated financial statements. Consolidated balance sheets at September 29, 2006 and September 30, 2003 and 20022005, and the related consolidated statements of operations and of cash flows for each of the three years in the period ended September 30, 200329, 2006, and notes thereto appear elsewhere in this Annual Report on Form 10-K.Because the Merger was accounted for as a reverse acquisition, a purchase of Alpha by Washington/Mexicali, the historical financial statements of Washington/Mexicali became the historical financial statements of Skyworks after the Merger. The historical information provided below does not include the historical financial results of Alpha for periods prior to June 25,26, 2002, the date the Merger was consummated. The historical financial information may not be indicative of the Company’sour future performance and does not reflect what the results of operations and financial position prior to the Merger would have been had Washington/Mexicali operated independently of Conexant during the periods presented prior to the Merger or had the results of Alpha been combined with those of Washington/Mexicali during the periods presented prior to the Merger.29
Fiscal Year 2003
2002 (1)
2001 (1)
2000 (1)
1999 (1)
(In thousands) Statement of Operations Data: Net revenues $ 617,789 $ 457,769 $ 260,451 $ 378,416 $ 216,415 Cost of goods sold (2) 380,465 331,608 311,503 270,170 134,539
Gross profit (loss) 237,324 126,161 (51,052 ) 108,246 81,876 Operating expenses: Research and development 151,762 132,603 111,053 91,616 66,457 Selling, general and administrative 80,222 50,178 51,267 52,422 27,202 Amortization of intangible assets (3) 4,386 12,929 15,267 5,327 -- Purchased in-process research and development (4) -- 65,500 -- 24,362 -- Special charges (5) 34,493 116,321 88,876 -- 1,432
Total operating expenses 270,863 377,531 266,463 173,727 95,091
Operating loss (33,539 ) (251,370 ) (317,515 ) (65,481 ) (13,215 ) Interest expense (21,403 ) (4,227 ) -- -- -- Other income (expense), net 1,317 (56 ) 210 142 (54 )
Loss before income taxes and cumulative effect of change in accounting principle (53,625 ) (255,653 ) (317,305 ) (65,339 ) (13,269 ) Provision (benefit) for income taxes 652 (19,589 ) 1,619 1,140 1,646
Loss before cumulative effect of change in accounting principle (54,277 ) (236,064 ) (318,924 ) (66,479 ) (14,915 )
Cumulative effect of change in accounting principle, net of tax (6) (397,139 ) -- -- -- --
Net loss $ (451,416 ) $ (236,064 ) $ (318,924 ) $ (66,479 ) $ (14,915 )
Per share information (7): Loss before income taxes and cumulative effect of change in accounting principle $ (0.39 ) $ (1.72 ) Cumulative effect of change in accounting principle, net of tax (6) (2.85 ) --
Net loss $ (3.24 ) $ (1.72 )
Balance Sheet Data: Working capital $ 249,279 $ 79,769 $ 60,540 $ 135,649 $ 55,374 Total assets 1,090,668 1,346,912 314,287 501,553 291,909 Long-term liabilities 280,677 184,309 3,806 3,767 3,335 Stockholders' equity 673,175 1,014,976 287,661 466,416 275,568
Fiscal Year (In thousands) 2006 (8) 2005 2004 2003 2002 (1) Statement of Operations Data: Net revenues $ 773,750 $ 792,371 $ 784,023 $ 617,789 $ 457,769 Cost of goods sold (7) 511,071 484,599 470,807 370,940 329,701 Gross profit 262,679 307,772 313,216 246,849 128,068 Operating expenses: Research and development 164,106 152,215 152,633 156,077 133,614 Selling, general and administrative (6) 135,801 103,070 97,522 85,432 51,074 Amortization of intangible assets (2) 2,144 2,354 3,043 4,386 12,929 Purchased in-process research and development (3) — — — — 65,500 Restructuring and special charges (4) 26,955 — 17,366 34,493 116,321 Total operating expenses 329,006 257,639 270,564 280,388 379,438 Operating income (loss) (66,327 ) 50,133 42,652 (33,539 ) (251,370 ) Interest expense (14,797 ) (14,597 ) (17,947 ) (21,403 ) (4,227 ) Other income (expense), net 8,350 5,453 1,691 1,317 (56 ) Income (loss) before income taxes and cumulative effect of change in accounting principle (72,774 ) 40,989 26,396 (53,625 ) (255,653 ) Provision (benefit) for income taxes 15,378 15,378 3,984 652 (19,589 ) Income (loss) before cumulative effect of change in accounting principle (88,152 ) 25,611 22,412 (54,277 ) (236,064 ) Cumulative effect of change in accounting principle, net of tax (5) — — — (397,139 ) — Net income (loss) $ (88,152 ) $ 25,611 $ 22,412 $ (451,416 ) $ (236,064 ) Per share information: Income (loss) before cumulative effect of change in accounting principle, basic and diluted $ (0.55 ) $ 0.16 $ 0.15 $ (0.39 ) $ (1.72 ) Cumulative effect of change in accounting principle, net of tax, basic and diluted (5) — — — (2.85 ) — Net income (loss), basic and diluted $ (0.55 ) $ 0.16 $ 0.15 $ (3.24 ) $ (1.72 ) Balance Sheet Data: Working capital $ 245,223 $ 337,747 $ 282,613 $ 249,279 $ 79,769 Total assets 1,090,496 1,187,843 1,168,806 1,090,668 1,346,912 Long-term liabilities 185,783 237,044 235,932 280,677 184,309 Stockholders’ equity 729,093 792,564 751,623 673,175 1,014,976
(1) The Merger was completed on June 25, 2002. Financial statements for periods prior to June 26, 2002, represent Washington/Mexicali’s combined results and financial condition. Financial statements for periods after June 26,25, 2002, represent the consolidated results and financial condition of Skyworks, the combined company.
30
(2) In fiscal 2001, the Company recorded $58.7 million of inventory write-downs.
(3)Amounts in fiscal 2003 through 2006 primarily reflect amortization of current technology and customer relationships acquired in the Merger. Amounts in fiscal 2002 2001 and 2000, primarily reflect amortization of goodwill and other intangible assets related to the acquisition of Philsar Semiconductor, Inc. in fiscal 2000.
(4)(3) In fiscal 2002, and fiscal 2000, the Companywe recorded purchased in-process research and development charges of $65.5 million and $24.4 million, respectively, related to the Merger and the acquisition of Philsar Semiconductor Inc., respectively.
Merger.
(5)(4) In fiscal 2006, we recorded restructuring and other special charges of $27.0 million related to the exit of our baseband product area. Of the $27.0 million, $13.1 million related to severance and benefits, $7.4 million related to the write-down of technology licenses and design software associated with the baseband product area, $4.2 million related to the impairment of baseband related long-lived assets and $2.3 million related to other charges. In fiscal 2004, we recorded restructuring and special charges of $17.4 million, principally related to the impairment of legacy technology licenses related to our baseband product area. In fiscal 2003, the Companywe recorded restructuring and special charges of $34.5 million, principally related to the impairment of assets related to the Company’sour infrastructure products and certain restructuring charges.products. In fiscal 2002, the Companywe recorded special charges of $116.3 million, principally related to the impairment of the assembly and test machinery and equipment and the related facility in Mexicali, Mexico, and the write-off of goodwill and other intangible assets related to Philsar Semiconductor, Inc. In fiscal 2001, the Company recorded special charges of $88.9 million, principally related to the impairment of certain wafer fabrication assets and restructuring activities.
(6)(5) The CompanyWe adopted Statement of Financial Accounting Standards No. 142, “Goodwill and Other Intangible Assets,” on October 1, 2002. As a result of this adoption, the Companywe performed a transitional evaluation of itsour goodwill and intangible assets with indefinite lives. Based on this transitional evaluation, the Companywe determined that itsour goodwill was impaired and recorded a $397.1 million charge for the cumulative effect of a change in accounting principle in fiscal 2003.
(6) In the fourth quarter of fiscal 2006, we recorded bad debt expense of $35.1 million. Specifically, we recorded charges related to two customers: Vitelcom Mobile and an Asian component distributor. (7) PriorIn the fourth quarter of fiscal 2006, we recorded $23.3 million of inventory charges and reserves primarily related to the Merger with Alpha Industries, Inc.exit of our baseband product area.
(8) We recorded $14.2 million in share-based compensation expense upon the adoption of Statement of Financial Accounting Standards No. 123 (revised 2004), Washington/Mexicali had no separate capitalization. Therefore, a calculation cannot be performed for weighted average shares outstanding to then calculate earnings per share.“Share-Based Payment,” (“SFAS 123(R)”) during the fiscal year ended September 29, 2006. Approximately $2.2 million, $6.3 million and $5.7 million were included in cost of goods sold, research and development expense and selling, general and administrative expense, respectively.
ITEM 7. MANAGEMENT’S DISCUSSION AND ANALYSIS OF FINANCIAL CONDITION AND RESULTS OF OPERATIONSOPERATION.
The following discussion and analysis of our financial condition and results of operations should be read in conjunction with our consolidated financial statements and related notes that appear elsewhere in this Annual Report onForm 10-K. In addition to historical information, the following discussion contains forward-looking statements that are subject to risks and uncertainties. Actual results may differ substantially and adversely from those referred to herein due to a number of factors, including but not limited to risk factors, risksthose described below and cautionary statements described elsewhere in this Annual Report on Form 10-K.OVERVIEWSkyworks Solutions, Inc. (“Skyworks” or the “Company”) is a leading wireless semiconductor company focused exclusively on radio frequency (“RF”)an innovator of high performance analog and complete cellular system solutions formixed signal semiconductors enabling mobile communications applications. We offerconnectivity. The Company’s power amplifiers, front-end modules RF subsystems and cellular systems to leading wireless handset and infrastructure customers.On June 25, 2002, pursuant to an Agreement and Plan of Reorganization, dated as of December 16, 2001, as amended as of April 12, 2002, by and among Alpha Industries, Inc. (“Alpha”), Conexant Systems, Inc. (“Conexant”) and Washington Sub, Inc. (“Washington”), a wholly owned subsidiary of Conexant to which Conexant spun off its wireless communications business, including its gallium arsenide wafer fabrication facility located in Newbury Park, California, but excluding certain assets and liabilities, Washington merged with and into Alpha with Alpha as the surviving entity (the “Merger”). Following the Merger, Alpha changed its corporate name to Skyworks Solutions, Inc.
Immediately following completion of the Merger, the Company purchased Conexant’s semiconductor assembly, module manufacturing and test facility located in Mexicali, Mexico, and certain related operations (“Mexicali Operations”) for $150 million. For financial accounting purposes, the sale of the Mexicali Operations by Conexant to Skyworks Solutions was treated as if Conexant had contributed the Mexicali Operations to Washington as part of the spin-off, and the $150 million purchase price was treated as a return of capital to Conexant. For purposes of these financial statements, the Washington business and the Mexicali Operationsdirect conversion radios are collectively referred to as Washington/Mexicali. References to the “Company” refer to Washington/Mexicali for all periods prior to June 26, 2002, and to the combined company following the Merger.
The Merger was accounted for as a reverse acquisition whereby Washington was treated as the acquirer and Alpha as the acquiree, primarily because Conexant shareholders owned a majority, approximately 67 percent, of the Company upon completion of the Merger. Under a reverse acquisition, the purchase price of Alpha was based upon the fair market value of Alpha common stock for a reasonable period of time before and after the announcement date of the Merger and the fair value of Alpha stock options. The purchase price of Alpha was allocated to the assets acquired and liabilities assumed by Washington, as the acquiring company for accounting purposes, based upon their estimated fair market value at the acquisition date. Because the historical financial statementsheart of the Company after the Merger do not include the historical financial resultsmany of Alpha for periods prior to June 25, 2002, the financial statements may not be indicativetoday’s leading-edge multimedia handsets. Leveraging core technologies, Skyworks also offers a diverse portfolio of future results of operationslinear products that support automotive, broadband, cellular infrastructure, industrial and are not indicative of the historical results that would have resulted if the Merger had occurred at the beginning of a historical financial period.medical applications.
31
We entered into agreements with Conexant providing for the supply to us of transition services by Conexant and for the supply of gallium arsenide wafer fabrication and assembly and test services to Conexant, initially at substantially the same volumes as historically obtained by Conexant from Washington/Mexicali. We also entered into agreements with Conexant and Jazz Semiconductor, Inc., a Newport Beach, California foundry joint venture between Conexant and the Carlyle Group (“Jazz Semiconductor”), providing for the supply to us of silicon-based wafer fabrication, wafer probe and certain other services by Jazz Semiconductor. Historically, Washington/Mexicali obtained a portion of its silicon-based semiconductors from the Newport Beach wafer fabrication facility that is now Jazz Semiconductor. We also provide semiconductor assembly and test services to Conexant at our Mexicali facility.
The wireless communications semiconductor industry is highly cyclical and is characterized by constant and rapid technological change, rapid product obsolescence and price erosion, evolving standards, short product life cycles and wide fluctuations in product supply and demand. In the past, average selling prices of established products have generally declined over time and this trend is expected to continue in the future. Our operating results have been, and our operating results may continue to be, negatively affected by substantial quarterly and annual fluctuations and market downturns due to a number of factors, such as changes in demand for end-user equipment, the timing of the receipt, reduction or cancellation of significant customer orders, the gain or loss of significant customers, market acceptance of our products and our customers’ products, our ability to develop, introduce and market new products and technologies on a timely basis, availability and cost of products from suppliers, new product and technology introductions by competitors, changes in the mix of products produced and sold, intellectual property disputes, the timing and extent of product development costs and general economic conditions. In addition, we may discover from time to time defects in our products after they have been shipped, which may require us to pay warranty claims, replace products, or pay costs associated with the past, average selling pricesrecall of establisheda customer’s products containing our parts.BUSINESS FRAMEWORKAt the end of the fourth fiscal quarter, Skyworks decided to immediately cease its baseband operations in order to sharpen focus on its high growth core business. Skyworks’ baseband product area developed complete reference designs, incorporating the digital signal processor and software functionality, in support of tier-three handset suppliers. This initiative was complex, research and development intensive and generated substantial operating losses. As tier-one OEMs increasingly dominate the landscape, the addressable market for the Company’s baseband solutions had significantly contracted. As a result of this decision, Skyworks restructured its business to focus on its core analog and RF product markets.To address the wireless industry opportunities discussed above and to execute our strategy, we have generally declined over timealigned our product portfolio around two markets: mobile platforms and this trend is expectedlinear products. We believe we possess a broad technology capability and one of the most complete wireless communications product portfolios that, when coupled with key customer relationships with all major handset manufacturers, positions us well to continue in the future.meet industry needs. Below are just a few examples from each of our product portfolios.
BASIS OF PRESENTATIONThe financial statements prior
Skyworks was formed through the merger (“Merger”) of the wireless business of Conexant Systems, Inc. (“Conexant”) and Alpha Industries, Inc. (“Alpha”) on June 25, 2002, pursuant to an Agreement and Plan of Reorganization, dated as of December 16, 2001, and amended as of April 12, 2002, by and among Alpha Industries, Inc., Conexant Systems, Inc. and Washington Sub, Inc. (“Washington”), a wholly-owned subsidiary of Conexant to which Conexant spun off its wireless communications business. Pursuant to the Merger, were prepared usingWashington merged with and into Alpha, with Alpha as the surviving corporation. Immediately following the Merger, Alpha purchased Conexant’s historical basissemiconductor assembly and test facility located in Mexicali, Mexico and certain related operations (the “Mexicali Operations”). For purposes of this Annual Report on Form 10-K, the assets and liabilitiesWashington business and the historical operating results of Washington/Mexicali during each respective period. We believe the assumptions underlying the financial statementsOperations are reasonable. However, the financial information included herein andcollectively referred to as “Washington/Mexicali.” Shortly thereafter, Alpha, which was incorporated in our consolidated financial statements may not be indicative of the combined assets, liabilities, operating results and cash flows of the CompanyDelaware in the future and is not indicative of what they would have been had Washington/Mexicali been a separate stand-alone entity and independent of Conexant during the historical periods presented.Our1962, changed its corporate name to Skyworks Solutions, Inc.
The Company’s fiscal year ends on the Friday closest to September 30. Fiscal 20032006 consisted of 5352 weeks and ended on October 3, 2003September 29, 2006, and fiscal years 20022005 and 20012004 each consisted of 52 weeks and ended on September 27, 200230, 2005 and October 1, 2004, respectively.RESULTS OF OPERATIONSYEARS ENDED SEPTEMBER 29, 2006, SEPTEMBER 30, 2005 AND OCTOBER 1, 2004The following table sets forth the results of our operations expressed as a percentage of net revenues for the fiscal years below: 2006 2005 2004 Net revenues 100.0 % 100.0 % 100.0 % Cost of goods sold 66.1 61.2 60.1 Gross margin 33.9 38.8 39.9
32
2006 2005 2004 Operating expenses: Research and development 21.2 19.2 19.5 Selling, general and administrative 17.6 13.0 12.4 Amortization of intangible assets 0.3 0.3 0.4 Restructuring and special charges 3.5 — 2.2 Total operating expenses 42.6 32.5 34.5 Operating income (loss) (8.7 ) 6.3 5.4 Interest expense (1.9 ) (1.8 ) (2.3 ) Other income, net 1.1 0.7 0.2 Income (loss) before income taxes (9.5 ) 5.2 3.3 Provision for income taxes 2.0 2.0 0.5 Net income (loss) (11.5 )% 3.2 % 2.8 %
GENERALDuring fiscal 2006, certain key factors contributed to our overall results of operations and cash flows from operations. More specifically:§ We exited our baseband product area in order to focus on our higher growth power amplifier, front-end modules, radio solution and linear product areas. We recorded charges of $90.4 million which included $35.1 million in bad debt expense (selling, general and administrative expense), $23.3 million of inventory charges and reserves (cost of goods sold), $13.1 million related to severance and benefits (restructuring and special charges), $7.4 million related to the write-down of technology licenses and design software (restructuring and special charges), $5.0 million related to revenue adjustments, $4.2 million related to the impairment of certain long-lived assets (restructuring and special charges) and $2.3 million related to other charges (restructuring and special charges); § Revenues in the Mobile Platform and Linear Products areas (our core business areas) increased $77.9 million to $733.3 million, an 11.9% increase, in fiscal 2006 as compared to fiscal 2005, despite an approximate 2% and 10% decline in average selling prices in the Mobile Platforms and Linear Products areas, respectively. We achieved a 26.9% increase in overall units sold in our core business areas; § We experienced a decrease of $77.1 million in revenues (approximately 62.7%) from our baseband product area as the market share consolidation of worldwide handset original equipment manufacturers (“OEM”) accelerated in 2006. Lower tier, smaller handset manufacturers primarily located in developing countries lost significant market share to top tier OEM’s such as Nokia Corporation, Motorola, Inc., Samsung Electronics Co., Sony Ericsson Mobile Communications AB and LG Electronics. § We retired $50.7 million in long-term debt and invested $49.4 million in capital equipment in fiscal 2006 thereby expanding our capacity to efficiently manage future growth in operations; § We recorded $14.2 million in share-based compensation expense upon the adoption of Statement of Financial Accounting Standards No. 123 (revised 2004), “Share-Based Payment,” (“SFAS 123(R)”) during the fiscal year ended September 29, 2006. Approximately $2.2 million, $6.3 million and $5.7 million were included in cost of goods sold, research and development expense and selling, general and administrative expense, respectively. § Cash provided by operations was $27.2 million for fiscal 2006 as compared to $54.2 million in fiscal 2005.
SHARED-BASED PAYMENTSWe grant stock options to purchase our common stock to our employees and directors under our stock option plans. We also grant restricted stock to certain key employees, which may have service, market or performance based conditions attached, and we also granted performance shares to certain of our employees during the fiscal year ended September 28, 2001, respectively. For convenience,29, 2006. Eligible employees can also purchase shares of our common stock at 85% of the consolidated financial statements have been shown as endinglower of the fair market value on the first or the last day of the calendar month. Accordingly, referencesoffering period under our employee stock purchase plan. The benefits provided under these plans are share-based payments subject to the provisions of revised Statement of Financial Accounting Standards No. 123 (revised 2004) (“SFAS 123(R)”), “Share-Based Payment.” Effective October33
1, 2005, we use the fair value method to apply the provisions of SFAS 123(R) with a modified prospective application which provides for certain changes to the method for valuing share-based compensation. The valuation provisions of SFAS 123(R) apply to new awards and to awards that are outstanding on the effective date and subsequently modified or cancelled. Under the modified prospective application, prior periods are not revised for comparative purposes. Share-based compensation expense recognized under SFAS 123(R) for the fiscal year ended September 29, 2006 was $14.2 million. At September 29, 2006, total unrecognized estimated compensation expense related to non-vested stock options granted prior to that date was $20.1 million. The weighted average period over which the unrecognized estimated compensation expense related to non-vested stock options will be recognized is 1.8 years. Stock options, before forfeitures and cancellations, granted during the fiscal year ended September 29, 2006 represented 2.4% of the Company’s outstanding shares as of September 29, 2006.At September 29, 2006, total unrecognized estimated compensation for restricted stock (nonvested awards) was $4.1 million.Upon adoption of SFAS 123(R), the Company elected to retain its method of valuation for share-based awards granted beginning in fiscal 2006 using the Black-Scholes option-pricing model (“Black-Scholes model”) which was also previously used for the Company’s pro forma information required under Statement of Financial Accounting Standards No. 123 (“SFAS 123”), “Accounting for Stock-Based Compensation”. The Company’s determination of fair value of share-based payment awards on the date of grant using an option-pricing model is affected by the Company’s stock price as well as assumptions regarding a number of highly complex and subjective variables. These variables include, but are not limited to the Company’s expected stock price volatility over the term of the awards, and actual and projected employee stock option exercise behaviors.If factors change and we employ different assumptions in the application of SFAS 123(R) in future periods, the compensation expense that we record under SFAS 123(R) may differ significantly from what we have recorded in the current period. Therefore, we believe it is important for investors to be aware of the high degree of subjectivity involved when using option-pricing models to estimate share-based compensation under SFAS 123(R). Option-pricing models were developed for use in estimating the value of traded options that have no vesting or hedging restrictions, are fully transferable and do not cause dilution. Certain share-based payments, such as employee stock options, may expire worthless or otherwise result in zero intrinsic value as compared to the fair values originally estimated on the grant date and reported in our financial statements. Alternatively, value may be realized from these instruments that are significantly in excess of the fair values originally estimated on the grant date and reported in our financial statements. There is currently no market-based mechanism or other practical application to verify the reliability and accuracy of the estimates stemming from these valuation models, nor is there a means to compare and adjust the estimates to actual values. Although the fair value of employee share-based awards is determined in accordance with SFAS 123(R) and the Securities and Exchange Commission’s Staff Accounting Bulletin No. 107 (“SAB 107”), “Interaction Between FASB Statement No. 123(R), and Certain SEC Rules and Regulations Regarding the Valuation of Share-Based Payment Arrangements for Public Companies” using an option-pricing model, that value may not be indicative of the fair value observed in a willing buyer/willing seller market transaction.Estimates of share-based compensation expenses are significant to our financial statements, but these expenses are based on option valuation models and will never result in the payment of cash by us. For this reason, and because we do not view share-based compensation as related to our operational performance, we exclude estimated share-based compensation expense when evaluating the business performance of our operations.The guidance in SFAS 123(R) and SAB 107 is relatively new, and best practices are still evolving. The application of these principles may be subject to further interpretation and refinement over time. There are significant differences among valuation models, and there is a possibility that we will adopt different valuation models in the future. This may result in a lack of consistency in future periods and materially affect the fair value estimate of share-based payments. It may also result in a lack of comparability with other companies that use different models, methods and assumptions.Theoretical valuation models and market-based methods are evolving and may result in lower or higher fair value estimates for share-based compensation. The timing, readiness, adoption, general acceptance, reliability and testing of these methods is uncertain. Sophisticated mathematical models may require voluminous historical information, modeling expertise, financial analyses, correlation analyses, integrated software and databases, consulting fees, customization and testing for adequacy of internal controls. Market-based methods are emerging that, if employed34
by us, may dilute our earnings per share and involve significant transaction fees and ongoing administrative expenses. The uncertainties and costs of these extensive valuation efforts may outweigh the benefits to investors.We did not modify any of our outstanding share options prior to the adoption of SFAS 123(R) with the exception of the acceleration of certain of our unvested “out of the money” stock options on September 2, 2005. Specifically, we accelerated the vesting of options previously awarded to employees and officers that had an exercise price per share over $9.00 and were granted prior to November 10, 2004. As a result of this action, options to purchase approximately 3.8 million shares of Skyworks common stock became immediately exercisable. The decision to accelerate vesting of these options was accounted for under APB Opinion Number 25, “Accounting for Stock Issued to Employees” and made to avoid recognizing compensation cost of approximately $21.0 million associated with certain “out-of-the-money” options in the statement of operations in future financial statements upon the effectiveness of SFAS 123(R). The decision to not accelerate the vesting of stock options with an exercise price under $9.01, as well as those granted after November 9, 2004, balanced our desire to manage compensation expense with our need to continue to motivate and retain employees. The options accelerated were “out-of-the money” by a minimum of $1.49 per share, based on the closing market price of Skyworks’ common stock on September 2, 2005.During fiscal 2005 and fiscal 2006, we elected to gradually transition more of our share-based compensation awards to restricted stock (with service, market or performance based conditions) from traditional stock options.We granted 222,000 performance units during the fiscal year ended September 29, 2006, pursuant to which recipients will receive Skyworks common stock if certain milestones are achieved. Of the 222,000 performance units, we issued 49,000 shares in fiscal 2006 as a result of milestone achievement. In addition, certain other milestones were deemed to be highly probable of achievement, thus we recorded total compensation expense of $0.3 million in fiscal 2006.We used an arithmetic average of historical volatility and implied volatility to calculate our expected volatility at September 29, 2006. Historical volatility was determined by calculating the mean reversion of the daily-adjusted closing stock price over the past 4.25 years of our existence (post-Merger). The implied volatility was calculated by analyzing the 52-week minimum and maximum prices of publicly traded call options on our common stock. We concluded that an arithmetic average of these two calculations provided for the most reasonable estimate of expected volatility under the guidance of SFAS 123(R). Utilizing this methodology results in a volatility of 59.27% at September 29, 2006.The expected life of employee stock options represents a calculation based upon the historical exercise experience of our stock options over the 4.25 years from June 2002 (post-Merger) to September 29, 2006. We determined that we had two populations with unique exercise behavior. These populations included stock options with a contractual life of 7 years and 10 years, respectively. This methodology results in an expected term calculation of 4.42 and 5.84 years, respectively.The risk-free interest rate is based on the yield curve of U.S. Treasury strip securities for a period consistent with the contractual life of the option in effect at the time of grant (weighted-average of 4.55% at September 29, 2006).The post-vesting forfeiture rate is estimated using historical option cancellation information (weighted-average of 8.59% at September 29, 2006).NET REVENUES Fiscal Years Ended September 29, September 30, October 1, (dollars in thousands) 2006 Change 2005 Change 2004 Net revenues $ 773,750 (2.4 )% $ 792,371 1.1 % $ 784,023
We market and sell our semiconductor products (including power amplifiers, front-end modules, radio solutions and linear products among others) to top tier OEMs of communication electronics products, third-party Original Design Manufacturers (“ODMs”) and contract manufacturers, and indirectly through electronic components distributors.35
Revenues from our core Mobile Platforms and Linear product areas increased by $77.9 million, or 11.9%, from fiscal 2005 to fiscal 2006. Overall, net revenues decreased slightly in fiscal 2006 when compared to fiscal 2005 primarily as a result of a decrease in baseband revenues of $77.1 million (a 62.7% decrease). Additionally, we recorded a charge against revenue of $5.0 million in fiscal 2006 relating to the exit of the baseband product area in the fourth quarter of fiscal 2006. Units sold in our core product areas increased by 33.2% somewhat offset by an overall average selling price decline of approximately 10% in our Linear Product area and approximately 2% in our Mobile Platforms product area.Net revenues increased slightly overall in fiscal 2005 when compared to fiscal 2004 primarily as a result of increased demand in our Mobile Platform product area. Revenues in aggregate dollars from our highly integrated complex products more than doubled between fiscal 2004 and fiscal 2005. This increase in revenues was partially offset by an overall decrease in average selling prices in nearly all of our product areas during these periods. Additionally, baseband revenues in aggregate dollars declined 13.9% and revenues from test and assembly declined by 62.7% due to the termination of the test and assembly services arrangement with Conexant. Our revenues from the test and assembly business were $37.8 million in fiscal 2004 and $14.1 million in fiscal 2005. We fulfilled our manufacturing support obligation to Conexant on June 30, 2003, 20022005.For information regarding net revenues by geographic region and 2001 containedcustomer concentration for each of the last three fiscal years, see Note 16 of Item 8 of this Annual Report on Form 10-K.GROSS PROFIT Fiscal Years Ended September 29, September 30, October 1, (dollars in thousands) 2006 Change 2005 Change 2004 Gross profit $ 262,679 (14.7 )% $ 307,772 (1.7 )% $ 313,216 % of net revenues 33.9 % 38.8 % 39.9 %
Gross profit represents net revenues less cost of goods sold. Cost of goods sold consists primarily of purchased materials, labor and overhead (including depreciation) associated with product manufacturing, royalty and other intellectual property costs and sustaining engineering expenses pertaining to products sold.Gross profit for fiscal 2006 decreased by $45.1 million from approximately $307.8 million in this discussion referfiscal 2005 and gross profit margin decreased to 33.9% from 38.8% in fiscal 2005. Gross profit on our core Mobile Platforms and Linear product areas actually increased in aggregate dollars in fiscal 2006 as compared to fiscal 2005. The decrease in both absolute dollars and as a percentage of sales was primarily due to the $23.3 million (approximately 50% of the decrease in aggregate dollars) in inventory related charges associated with the exit of the baseband product area in the fourth quarter of fiscal 2006. Additionally, the decline in baseband product area revenues in fiscal 2006 as compared to fiscal 2005 of $77.1 million resulted in an approximate decline in contribution margin of $38.6 million. We also incurred approximately $2.2 million in share-based compensation expense in cost of goods sold in fiscal 2006 related to our actualadoption of SFAS 123(R). No share-based compensation expense was recorded in fiscal year-end.2005 in cost of goods sold.Gross profit for fiscal 2005 decreased by $5.4 million from approximately $313.2 million in fiscal 2004, and gross profit margin decreased from 39.9% to 38.8% from fiscal 2004. The decrease in both absolute dollars and as a percentage of sales was primarily due to 1) continued additional costs associated with the ongoing launch of a number of our more highly integrated products, 2) an unfavorable shift in product mix in the fourth fiscal quarter, and 3) a one time payment to a customer of $3.2 million in the fourth fiscal quarter of 2005. A decline in the assembly and test services provided to Conexant in conjunction with fixed overhead and manufacturing costs in the assembly and test area also contributed to the decreased gross profit margin between fiscal 2005 and fiscal 2004.36
RESEARCH AND DEVELOPMENT Fiscal Years Ended September 29, September 30, October 1, (dollars in thousands) 2006 Change 2005 Change 2004 Research and development $ 164,106 7.8 % $ 152,215 (0.3 )% $ 152,633 % of net revenues 21.2 % 19.2 % 19.5 %
Research and development expenses consist principally of direct personnel costs, costs for pre-production evaluation and testing of new devices, and design and test tool costs.Although research and development expenses in fiscal 2006 increased when compared to fiscal 2005, we anticipate that we will achieve a reduction in research and development costs in future periods due to our exit of the baseband product area in the fourth quarter of fiscal 2006. The aforementioned increase is primarily attributable to increased labor and benefit costs incurred to support our next generation multimode radios and precision analog semiconductors. We anticipate continued acceleration in the development and commercialization of our Helios EDGE (Enhanced Data rates for Global Evolution) radio, CDMA (“Code Division Multiple Access”) solutions and next generation front-end modules and power amplifiers with several of our top customers in fiscal 2007. The increase in research and development costs primarily supports new product introductions, as well as new product development, focused on diversifying our product portfolio within our Linear Products area outside of the cellular handset market. We also incurred $6.3 million in research and development related share-based compensation expense in fiscal 2006 related to our adoption of SFAS 123(R). No research and development related share-based compensation expense was recorded in fiscal 2005.Research and development expenses in fiscal 2005 declined slightly when compared to fiscal 2004. The decline is principally due to decreased incentive compensation costs. We also reduced research and development expenditures in the baseband product area during this period as we focused our product development on core front-end modules, RF subsystems, infrastructure and next-generation solutions.SELLING, GENERAL AND ADMINISTRATIVE Fiscal Years Ended September 29, September 30, October 1, (dollars in thousands) 2006 Change 2005 Change 2004 Selling, general and administrative $ 135,801 31.8 % $ 103,070 5.7 % $ 97,522 % of net revenues 17.6 % 13.0 % 12.4 %
Selling, general and administrative expenses include personnel costs (legal, accounting, treasury, human resources, information systems, customer service, etc.), bad debt expense, sales representative commissions, advertising and other marketing costs.The increase in selling, general and administrative expenses in fiscal 2006 as compared to fiscal 2005 is principally due to our recording of $35.1 million in bad debt expense in the fourth quarter of fiscal 2006. Specifically, we recorded charges related to two customers: Vitelcom Mobile and an Asian component distributor, on accounts receivable associated with our baseband products. We also incurred $5.7 million in selling, general and administrative related share-based compensation expense in 2006 related to our adoption of SFAS 123(R). The increased bad debt and SFAS 123(R) expenses were partially offset by reductions in legal expenses incurred to protect our intellectual property portfolio.The increase in selling, general and administrative expenses in fiscal 2005, as compared to fiscal 2004 is primarily due to an increase in bad debt expense of $4.8 million between fiscal 2005 and fiscal 2004. Additionally, costs incurred to comply with the requirements of Section 404 of the Sarbanes-Oxley Act of 2002 (“Sarbanes-Oxley”) contributed to the increase. The increased bad debt expense and Sarbanes-Oxley fees were partially offset by reductions in incentive compensation costs and legal costs due to the settlement of an intellectual property lawsuit.37
AMORTIZATION OF INTANGIBLE ASSETS AND WARRANTS Fiscal Years Ended September 29, September 30, October 1, (dollars in thousands) 2006 Change 2005 Change 2004 Amortization $ 2,144 (8.9 )% $ 2,354 (22.6 )% $ 3,043 % of net revenues 0.3 % 0.3 % 0.4 %
In 2002, we recorded $36.4 million of intangible assets related to the Merger consisting of developed technology, customer relationships and a trademark. These assets are principally being amortized on a straight-line basis over a 10-year period. Amortization expense in fiscal 2006, 2005, and 2004 primarily represents the amortization of these intangible assets.Amortization expense on intangible assets declined in fiscal 2006 as compared to fiscal 2005, is primarily due to the recognition of amortization expense on a warrant of $0.2 million in fiscal 2005. The warrant expired without being exercised on January 20, 2005.The decrease in amortization expense on intangible assets between fiscal 2005 and fiscal 2004 is the result of $0.8 million in amortization expense recognized on certain warrants in 2004, while only $0.2 million was recognized in fiscal 2005.For additional information regarding goodwill and intangible assets, see Note 6 of Item 8 of this Annual Report on Form 10-K.RESTRUCTURING AND SPECIAL CHARGES Fiscal Years Ended September 29, September 30, October 1, (dollars in thousands) 2006 Change 2005 Change 2004 Restructuring and special charges $ 26,955 100.0 % $ — (100.0 )% $ 17,366 % of net revenues 3.5 % 0.0 % 2.2 %
No special charges were recorded in fiscal 2005.Restructuring and special charges consist of charges for asset impairments and restructuring activities, as follows:2006 RESTRUCTURING CHARGES, ASSET IMPAIRMENTS AND SPECIAL CHARGESOn September 29, 2006, we exited our baseband product area in order to focus on our core business encompassing linear products, radio solutions, power amplifiers and front-end modules. We recorded various charges associated with this action. We recorded charges which included the following:We recorded $13.1 million related to severance and benefits, $7.4 million related to the write-down of technology licenses and design software, $4.2 million related to the impairment of certain long-lived assets and $2.3 million related to other charges. These charges total $27.0 million and are recorded in restructuring and special charges.We anticipate recording additional restructuring charges of approximately $7.0 million related to the exit of the baseband product area in the first fiscal quarter of 2007. These charges primarily relate to costs to exit certain operating leases and the write down of a technology license.38
2004 RESTRUCTURING CHARGES, ASSET IMPAIRMENTS AND SPECIAL CHARGESDuring the second quarter of fiscal 2004, we recorded a $13.2 million charge primarily related to the impairment of obsolete baseband technology licenses that were established prior to the Merger. The impairment charge was based on a recoverability analysis prepared by management in response to the decision to discontinue certain products and the related impact on its current and projected outlook. Management believed these factors indicated that the carrying value of the related assets (intangible assets, machinery and equipment) was impaired and that an impairment analysis should be performed. In performing the analysis for recoverability, management estimated the future cash flows expected to result from these products (salvage value). Since the estimated undiscounted cash flows were less than the carrying value of the related assets, it was concluded that an impairment loss should be recognized. In accordance with SFAS No. 144 “Accounting for the Impairment or Disposal of Long-Lived Assets,” the impairment charge was determined by comparing the estimated fair value of the related assets to their carrying value. The write down established a new cost basis for the impaired assets.During fiscal 2004, we consolidated baseband product area software design centers in an effort to improve our overall time-to market for next-generation multimedia systems development. These actions aligned our structure with our current business environment. We implemented reductions in force at three remote facilities and recorded restructuring charges of approximately $4.2 million for costs related to severance benefits for affected employees and lease obligations. All amounts accrued for these actions have been paid as of September 29, 2006.For additional information regarding restructuring charges and liability balances, see Note 14 of Item 8 of this Annual Report on Form 10-K.INTEREST EXPENSE Fiscal Years Ended September 29, September 30, October 1, (dollars in thousands) 2006 Change 2005 Change 2004 Interest expense $ 14,797 1.4 % $ 14,597 (18.7 )% $ 17,947 % of net revenues 1.9 % 1.8 % 2.3 %
Interest expense is comprised principally of payments in connection with the $50.0 million credit facility between Skyworks USA, Inc., our wholly-owned subsidiary, and Wachovia Bank, N.A. (“Facility Agreement”) and the Company’s 4.75% convertible subordinated notes (the “Junior Notes”).Interest expense increased for fiscal 2006 as compared to the previous year primarily due to a higher interest rate paid on the Facility Agreement resulting from an increase in LIBOR during such period, as well as an increase in the amortization of capitalized deferred financing costs of $0.6 million due to the retirement of $50.7 million of our Junior Notes. This was partially offset by a decrease in required interest payments due to the retirement of $50.7 million of our Junior Notes in fiscal 2006.The decrease in interest expense for fiscal 2005, when compared to fiscal 2004 is due to the conversion of our $45 million of senior subordinated notes into shares of our common stock during fiscal 2004. Specifically, we recorded $12.5 million in interest expense and deferred financing costs amortization on our $230 million Junior notes payable and $2.1 million in interest expense on our $50 million line of credit facility.For additional information regarding our borrowing arrangements, see Note 7 of Item 8 of this Annual Report on Form 10-K.OTHER INCOME, NET Fiscal Years Ended September 29, September 30, October 1, (dollars in thousands) 2006 Change 2005 Change 2004 Other income, net $ 8,350 53.1 % $ 5,453 222.5 % $ 1,691 % of net revenues 1.1 % 0.7 % 0.2 %
39
Other income, net is comprised primarily of interest income on invested cash balances, other non-operating income and expense items and foreign exchange gains/losses.The increase in other income, net between fiscal 2005 and fiscal 2006, as well as between fiscal 2004 and fiscal 2005 is primarily due to an increase in interest income on invested cash balances as a result of increased interest rates earned on our auction rate securities.PROVISION FOR INCOME TAXES Fiscal Years Ended September 29, September 30, October 1, (dollars in thousands) 2006 Change 2005 Change 2004 Provision for income taxes $ 15,378 0.0 % $ 15,378 286.0 % $ 3,984 % of net revenues 2.0 % 2.0 % 0.5 %
Based upon our history of operating losses, management has determined that it is more likely than not that historic and current year income tax benefits will not be realized except for certain future deductions associated with our foreign operations. Consequently, no United States income tax benefit has been recognized for the Company’s United States operating losses. As of September 29, 2006, we have established a valuation allowance against all of our net United States deferred tax assets. Deferred tax assets have been recognized for foreign operations when management believes that is more likely than not that they will be recovered.During fiscal 2006 the carrying value of our gross deferred tax assets increased by $38.8 million. This increase is primarily due to charges included in United States income related to the exit of our baseband product area that were not tax benefited.The provision for income taxes for fiscal 2006 and fiscal 2005 consists of approximately $(0.1) million and $11.1 million, respectively, of United States income taxes. The credit of $(0.1) million represents a favorable adjustment between fiscal 2005’s tax provision and tax return liability. The provision for income tax for fiscal 2005 represents a charge reducing the carrying value of goodwill.In addition, the provision for income taxes for fiscal 2006, 2005, and 2004 consists of foreign income taxes of $15.4 million, $4.9 million, and $4.0 million, respectively. In fiscal 2006, the Company completed a legal reorganization of its Mexico operations to reduce its future operating costs. In connection with this reorganization, ownership of machinery and equipment used in Mexico’s operations was transferred to a United States subsidiary. In 2002, the Company recorded a tax benefit of approximately $23.0 million related to the impairment of this equipment. The carrying value of the deferred tax asset related to these assets was $16.3 million as of September 30, 2005. Consequently, the fiscal 2006 foreign tax provision includes the write off of this deferred tax asset, reduced by the establishment of a $1.7 million deferred tax charge in connection with this reorganization. The deferred tax asset allowable for U.S. tax purposes is included in the Company’s United States deferred tax assets subject to a valuation allowance.The fiscal year 2005 foreign tax provision included a charge of $2.2 million resulting from a reduction of the statutory income tax rate in Mexico. Deferred tax assets and liabilities are measured using enacted tax rates expected to apply to taxable income in the years in which the temporary differences are expected to be recovered or settled. The effect on deferred tax assets and liabilities of a change in tax rates is recognized in income in the period that includes the enactment date. A charge of $2.3 million related to normal amortization of the tax benefit for tax over book depreciation. A favorable foreign translation adjustment of $0.8 million increased the deferred tax asset’s carrying value. In addition, the provision for income taxes for fiscal 2006, 2005 and 2004 consists of foreign income taxes incurred by foreign operations.No provision has been made for United States, state, or additional foreign income taxes related to approximately $12.1 million of undistributed earnings of foreign subsidiaries which have been or are intended to be permanently reinvested. It is not practicable to determine the United States federal income tax liability, if any, which would be payable if such earnings were not permanently reinvested.40
In fiscal 2005, we repatriated approximately $25.6 million of earnings, which were not subject to Mexican withholding tax and could be applied against United States net operating loss carryforwards, resulting in no United States income tax. We provide for United States income tax on current earnings attributable to our operations in Mexico.LIQUIDITY AND CAPITAL RESOURCES Fiscal Years Ended September 29, September 30, October 1, (dollars in thousands) 2006 2005 2004 Cash and cash equivalents at beginning of period $116,522 $123,505 $161,506 Net cash provided by operating activities 27,226 54,197 91,913 Net cash provided by (used in) investing activities 42,383 (66,424 ) (141,044 ) Net cash (used in) provided by financing activities (49,382 ) 5,244 11,130 Cash and cash equivalents at end of period $136,749 $116,522 $123,505
FISCAL 2006Based on our results of operations for fiscal 2006 and current trends, we expect our existing sources of liquidity, together with cash expected to be generated from operations and short term investments along with our ability to access financial markets for additional debt or equity financing, will allow us to sufficiently fund our research and development, capital expenditures, debt obligations (to replace existing or maturing debt instruments), purchase obligations, working capital and other cash requirements for at least the next 12 months. However, we cannot assure you that the capital required to fund these expenses will be available in the future. In addition, any strategic investments and acquisitions that we may make to help us grow our business may require additional capital resources. If we are unable to obtain enough capital to meet our capital needs on a timely basis or at all, our business and operations could be materially adversely affected.Our cash and cash equivalent balances increased by $20.2 million to $136.7 million at September 29, 2006 from $116.5 million at September 30, 2005. Cash and cash equivalent balances and short-term investments decreased by $64.7 million to $171.2 million at September 29, 2006 from $235.9 million at September 30, 2005. The number of days sales outstanding for the fiscal year ended September 29, 2006 decreased to 73 from 82 as compared to fiscal 2005 partially due to the recording of allowance for doubtful accounts relating to the exit of our baseband product area.During fiscal 2006, we generated $27.2 million in cash from operating activities. Offsetting these positive operating cash flows were net losses of $88.2 million which included total charges incurred to exit our baseband product area. We also incurred multiple non-cash charges (e.g., depreciation, amortization, contribution of common shares to savings and retirement plans, share-based compensation expense, non-cash restructuring expense, asset impairment charges and provision for deferred income taxes) totaling $75.7 million. In fiscal 2006, we also experienced an increase in other accrued liabilities and expenses of $16.0 million (principally related to restructuring accruals in the fourth fiscal quarter) and a decrease in deferred tax assets of $16.5 million and an increase of $31.2 million in the provision for losses on accounts receivable (principally related to the reserves recorded on two baseband customers). These increases were offset by uses of cash caused by increases of $18.2 million in accounts receivable and $3.5 million in inventory. However, on a net basis accounts receivable actually declined by $13.0 million when accounting for the impact of the afore-mentioned $31.2 million increase in the provision for losses on accounts receivable.During fiscal 2006, we generated $42.4 million in cash from investing activities. Cash provided by investing activities in fiscal 2006 consisted of net proceeds of $85.2 million from the sale of auction rate securities and proceeds received from the sale of a building and land of $6.6 million. Capital expenditures of $49.4 million offset these amounts and were primarily related to the purchase of equipment utilized to support an anticipated expanded level of highly integrated product demand requiring more technologically enhanced manufacturing capacity.41
The proceeds from the net sales of our auction rate securities were utilized, in part, to retire $50.7 million of our Junior Notes. We believe a focused program of capital expenditures will be required to sustain our current manufacturing capabilities. Future capital expenditures will be funded by the generation of positive cash flows from operations. We may also consider acquisition opportunities to extend our technology portfolio and design expertise and to expand our product offerings.During fiscal 2006, we utilized $49.4 million in cash from financing activities. This principally resulted from the retirement of $50.7 million in our Junior Notes and the pledge of $0.3 million in cash on a new insurance policy offset by stock option exercises of $1.7 million. As of September 29, 2006, our Facility Agreement of $50.0 million is fully drawn. Our Junior Notes of approximately $179.3 million become due in November 2007. We paid approximately $13.7 million in interest to service this debt during fiscal 2006. For additional information regarding our borrowing arrangements, see Note 7 to the Consolidated Financial Statements.In connection with the exit of the baseband product area, we anticipate making cash payments of approximately $25.6 million in future periods. We anticipate the majority of these payments will be remitted in the first and second quarters of fiscal 2007. We expect our existing sources of liquidity, together with cash expected to be generated from operations and short term investments, will be sufficient to fund these costs associated with the exit of our baseband product area.FISCAL 2005During fiscal 2005, we generated $54.2 million in cash from operating activities. This was principally attributable to increased revenues and lower overall operating expenses combined with reduced interest expense and higher other income (primarily interest income). Non-cash charges (including depreciation, charge in lieu of income tax expense, amortization and contribution of common shares to savings and retirement plans) totaled $62.8 million. This was offset by a reduction in liabilities of $21.1 million primarily related to payment of prior year incentive compensation. Annualized inventory turns for the fourth quarter of fiscal 2005 were 6.2. Inventory management remained an area of focus as we balance the need to maintain strategic inventory levels to ensure competitive lead times against the risk of inventory obsolescence because of rapidly changing technology and customer requirements. Other decreases to cash provided by operating activities resulted from a net increase in our receivable balances of $18.8 million offset by bad debt provisions of $5.1 million. The increase in accounts receivable balances is due to the timing and collection of customer receivables. The timing of purchasing patterns by our customers in our industry affects the timing of our revenue recognition and our collections and is one of the principal reasons for the increase in days sales outstanding from 66 at the end of fiscal 2004 to 82 at the end of fiscal 2005.Cash used in investing activities for the year ended September 30, 2005 consisted of $28.3 million of net investments in auction rate securities and capital expenditures of $38.1 million.Cash provided by financing activities for the year ended September 30, 2005, consisted of $5.2 million of proceeds received from the exercise of stock options. There were no changes to the long-term and short-term debt balances in fiscal 2005.FISCAL 2004During fiscal 2004 we focused our efforts on both cash and inventory management. Days sales outstanding in the fourth quarter of fiscal 2004 was 66. Annualized inventory turns for the fourth quarter of fiscal 2004 were 6.6. During fiscal 2004, we also converted our 15 percent convertible senior subordinated notes into shares of our common stock, ultimately reducing our future cash outflows and expenses related to the interest incurred on these senior subordinated notes.In fiscal 2004, we generated $91.9 million in cash from operating activities. This was principally attributable to net revenues in fiscal 2004 of $784.0 million primarily resulting from increased demand for our wireless product portfolio. More specifically, we had launched a number of more highly integrated product offerings, added to our customer base and expanded our geographical market presence. In addition, we reduced research and development expenses and selling, general and administrative expense as a percentage of net revenues to 31.9% in fiscal 2004. During fiscal 2004, we invested $60.0 million in capital equipment primarily related to the design of new highly42
integrated products and processes, enabling us to address new opportunities and to meet our customers’ demands. In fiscal 2004 we made net investments of approximately $81.0 million in short-term auction rate securities.Cash provided by financing activities in fiscal 2004 primarily represents an increase in borrowings under our $50.0 million credit facility secured by the purchased accounts receivable with Wachovia Bank, N.A.CONTRACTUAL CASH FLOWSFollowing is a summary of our contractual payment obligations for consolidated debt, purchase agreements, operating leases, other commitments and long-term liabilities at September 29, 2006 (see Notes 7 and 11 of Item 8 of this Annual Report on Form 10-K), in thousands: Payments Due By Period Less Than 1 Obligation Total Year 1-3 years 3-5 Years Thereafter(1) Long-Term Debt Obligations $ 179,335 $ — $ 179,335 $ — $ — Other Commitments 12,669 6,681 5,988 — — Operating Lease Obligations 28,132 7,600 12,944 6,924 664 Purchase Obligations — — — — — Other Long-Term Liabilities 6,448 479 930 488 4,551 $ 226,584 $ 14,760 $ 199,197 $ 7,412 $ 5,215
(1) Other Long-Term Liabilities includes $3.7 million of Executive Deferred Compensation for which there is a corresponding long term asset.
Based on our results of operations for fiscal 2006 and current trends, we expect our existing sources of liquidity, together with cash expected to be generated from operations and short term investments along with our ability to access financial markets for additional debt or equity financing, will allow us to sufficiently fund our research and development, capital expenditures, debt obligations (to replace existing or maturing debt instruments), purchase obligations, working capital and other cash requirements for at least the next 12 months. However, we cannot assure you that the capital required to fund these expenses will be available in the future. In addition, any strategic investments and acquisitions that we may make to help us grow our business may require additional capital resources. If we are unable to obtain enough capital to meet our capital needs on a timely basis or at all, our business and operations could be materially adversely affected.CRITICAL ACCOUNTING POLICIES AND ESTIMATES
The preparation of financial statements in accordance with accounting principles generally accepted in the United States requires us to make estimates and assumptions that affect the reported amounts of assets and liabilities and disclosure of contingent assets and liabilities at the date of the financial statements and the reported amounts of revenues and expenses during the reporting period. We regularly evaluate our estimates and assumptions based upon historical experience and various other factors that we believe to be reasonable under the circumstances, the results of which form the basis for making judgments about the carrying values of assets and liabilities that are not readily apparent from other sources. To the extent actual results differ from those estimates, our future results of operations may be affected. We believe the following critical accounting policies affect the more significant judgments and estimates used in the preparation of our consolidated financial statements.REVENUE RECOGNITIONRevenues from product sales are recognized upon shipment and transfer of title, in accordance with the shipping terms specified in the arrangement with the customer. Revenue from license fees and intellectual property is recognized when these fees are due and payable, and all other criteria of SEC Staff Accounting Bulletin No. 104, (“Revenue Recognition”) have been met. We ship product on consignment to certain customers and only recognize revenue when the customer notifies us that the inventory has been consumed. Revenue recognition is deferred in all instances where the earnings process is incomplete. Certain product sales are made to electronic component distributors under agreements allowing for price protection and/or a right of return on unsold products. A reserve for43
Allowance
sales returns and allowances for doubtful accountscustomers is recorded based on historical experience or specific identification of an event necessitating a reserve.ALLOWANCE FOR DOUBTFUL ACCOUNTS — We maintain allowances for doubtful accounts for estimated losses resulting from the inability of our customers to make required payments. If the financial condition of our customers were to deteriorate, our actual losses may exceed our estimates, and additional allowances would be required.INVENTORIESInventories — We assess are stated at the lower of cost, determined on a first-in, first-out basis, or market. The Company provides for estimated obsolescence or unmarketable inventory based upon assumptions about future demand and market conditions. The recoverability of inventories is assessed through an on-going review of inventory levels relativein relation to sales backlog and forecasts, product marketing plans and product life cycles. When the inventory on hand exceeds the foreseeable demand (generally in excess of sixtwelve months), we write down the value of those excess inventories. We sell our productssuch inventory that is not expected to communications equipment original equipment manufacturers (“OEMs”) that have designed our products into equipment such as cellular handsets. These design wins are gained through a lengthy sales cycle, which includes providing technical support tobe sold at the OEM customer. In the eventtime of the loss of business from existing OEM customers, we may be unable to secure new customers for our existing products without first achieving new design wins. Consequently, when the quantities of inventory on hand exceed forecasted demand from existing OEM customers into whose products our products have been designed, we generally will be unable to sell our excess inventories to others, and the net realizable value of such inventoriesreview is generally estimated to be zero.written down. The amount of the write-down is the excess of historical cost over estimated realizable value (generally zero).Once established, these write-downs are considered permanent adjustments to the cost basis of the excess inventory. Demand for our products may fluctuate significantly over time, andIf actual demand and market conditions may be more orare less favorable than those projected by management.management, additional inventory write-downs may be required. Some or all of the inventories that have been written-down may be retained and made available for sale. In the event that actual demand is lowerhigher than originally projected, additional inventory write-downsa portion of these inventories may be required.able to be sold in the future. Inventories that have been written-down and are identified as obsolete are generally scrapped.SHARE-BASED COMPENSATIONOn October 1, 2005, the Company adopted Statement of Financial Accounting Standards No. 123 (revised 2004), “Share-Based Payment,” (“SFAS 123(R)”) which requires the measurement and recognition of compensation expense for all share-based payment awards made to employees and directors including employee stock options, employee stock purchases related to the Company’s 2002 Employee Stock Purchase Plan, restricted stock and other special equity awards based on estimated fair values. SFAS 123(R) supersedes the Company’s previous accounting under Accounting Principles Board Opinion No. 25, “Accounting for Stock Issued to Employees” (“APB 25”) for periods beginning in fiscal 2006. In March 2005, the Securities and Exchange Commission issued Staff Accounting Bulletin No. 107, “Share Based Payment” (“SAB 107”), providing interpretative guidance relating to SFAS 123(R). The Company has applied the provisions of SAB 107 in its adoption of SFAS 123(R).The Company adopted SFAS 123(R) using the modified prospective transition method, which requires the application of the applicable accounting standard as of October 1, 2005, the first day of the Company’s fiscal year 2006.The Company’s practice in general is to issue shares of common stock upon exercise or settlement of options and to issue shares in connection with the Employee Stock Purchase Plan (“ESPP”) from previously unissued shares.Share-based compensation expense recognized during the period is based on the value of the portion of share-based payment awards that is ultimately expected to vest during the period. Share-based compensation expense recognized in the Company’s Consolidated Statement of Operations for the fiscal year ended September 29, 2006 included compensation expense for share-based payment awards granted on or before, but not yet vested as of, September 30, 2005, based on the grant date fair value estimated in accordance with the pro forma provisions of SFAS 123, and compensation expense for the share-based payment awards granted subsequent to September 30, 2005 based on the grant date fair value estimated in accordance with the provisions of SFAS 123(R). As share-based compensation expense recognized in the Consolidated Statement of Operations for the fiscal year ended September 29, 2006 is based on awards ultimately expected to vest, it has been reduced for estimated forfeitures. SFAS 123(R) requires forfeitures to be estimated at the time of grant and revised, if necessary, in subsequent periods if actual forfeitures differ from those estimates.44
Valuation
Upon adoption of long-lived assets, goodwillSFAS 123(R), the Company elected to retain its method of valuation for share-based awards using the Black-Scholes option-pricing model (“Black-Scholes model”) which was also previously used for the Company’s pro forma information required under SFAS 123. The Company’s determination of fair value of share-based payment awards on the date of grant using the Black-Scholes model is affected by the Company’s stock price as well as assumptions regarding a number of highly complex and intangible assetssubjective variables. These variables include, but are not limited to; the Company’s expected stock price volatility over the term of the awards, and actual and projected employee stock option exercise behaviors.SFAS 123(R) requires the Company to evaluate and periodically validate several assumptions in conjunction with calculating share-based compensation expense. These assumptions include the expected life of a stock option or other equity based award, expected volatility, pre-vesting forfeiture, risk free rate and expected dividend yield. All of these assumptions affect to one degree or another, the valuation of the Company’s equity based awards or the recognition of the resulting share-based compensation expense. The most significant assumptions in the Company’s calculations are described below.Expected Life of an Option or other Equity Based Award — Since employee options are non-transferable, SFAS 123(R) allows the use of an expected life to more accurately estimate the value of an employee stock option rather than using the full contractual term.The vesting of the majority of the Company’s stock options are graded over four years (25% at each anniversary) and the contractual term is either 7 years or 10 years. The Company analyzed its historical exercise experience and exercise behavior by job group. The Company analyzed the following three exercise metrics: exercise at full vesting, exercise at midpoint in the contractual life and exercise at the end of the full contractual term. The Company chose the mid-point alternative as the estimate which most closely approximated actual exercise experience of its employee population. The valuation and resulting share-based compensation expense recorded is sensitive to what alternative is chosen and the choice of another alternative in the future could result in a material difference in the amount of share-based compensation expense recorded in a reporting period.Expected VolatilityExpected volatility is a statistical measure of the amount by which a stock price is expected to fluctuate during a period. SFAS 123(R) does not specify a method for estimating expected volatility; instead it provides a list of factors that should be considered when estimating volatility: historical volatility that is generally commensurate with the expected option life, implied volatilities, the length of time a stock has been publicly traded, regular intervals for price observations, corporate and capital structure and the possibility of mean reversion. The Company analyzed its volatility history and determined that the selection of a weighting of 50% to historical volatility and 50% to implied volatility (as measured by examining the underlying volatility in the open market of publicly traded call options) would provide the best estimate of expected future volatility of the stock price. The selection of another methodology to calculate volatility or even a different weighting between implied volatility and historical volatility could materially impact the valuation of stock options and other equity based awards and the resulting amount of share-based compensation expense recorded in a reporting period.Pre-Vesting ForfeitureSFAS 123(R) specifies that initial accruals of share-based compensation expense should be based on the estimated number of instruments for which the requisite service is expected to be rendered. The Company examined its options forfeiture history and computed an average annualized forfeiture percentage. The Company determined that a weighted average of historical annualized forfeitures is the best estimate of future actual forfeiture experience. The application of a different methodology for calculating estimated forfeitures could materially impact the amount of share-based compensation expense recorded in a reporting period.45
VALUATION OF LONG-LIVED ASSETSCarrying values for long-lived assets and definitive-liveddefinite lived intangible assets, excludingwhich excludes goodwill, are reviewed for possible impairment as circumstances warrant in connection with Statement of Financial Accounting Standards (“SFAS”) No. 144, “Accounting for the Impairment or Disposal of Long-Lived Assets,Assets.” which was adopted on October 1, 2002. Impairment reviews are conducted at the judgment of management whenever events or changes in circumstances indicate that the carrying amount of any such asset or asset group may not be recoverable. The determination of recoverability is based on an estimate of undiscounted cash flows expected to result from the use of an asset and its eventual disposition. The estimate of cash flows is based upon, among other things, certain assumptions about expected future operating performance. OurThe Company’s estimates of undiscounted cash flows may differ from actual cash flows due to, among other things, technological changes, economic conditions, changes to ourthe Company’s business model or changes in ourits operating performance. If the sum of the undiscounted cash flows (excluding interest) is less than the carrying value we recognizeof an asset or asset group, the Company recognizes an impairment loss, measured as the amount by which the carrying value exceeds the fair value of the asset.asset or asset group. Fair value is determined using discounted cash flows.Carrying values of goodwill
GOODWILL AND INTANGIBLE ASSETSGoodwill and other intangible assets with indefinite lives are reviewedtested at least annually for possible impairment in accordance with the provisions of SFAS No. 142, “Goodwill and Other Intangible Assets,Assets.” which was adopted on October 1, 2002. The goodwill and other intangible asset impairment test is a two-step process. The first step of the impairment analysis compares ourthe Company’s fair value to ourits net book value.value to determine if there is an indicator of impairment. In determining fair value, SFAS No. 142 allows for the use of several valuation methodologies, although it states quoted market prices are the best evidence of fair value. The Company calculates fair value using the average market price of its common stock over a seven-day period surrounding the annual impairment testing date of the first day of the fourth fiscal quarter and the number of shares of common stock outstanding on the date of the annual impairment test (the first day of the fourth fiscal quarter). Step two of the analysis compares the implied fair value of goodwill and other intangible assets to its carrying amount in a manner similar to a purchase price allocation.allocation for a business combination. If the carrying amount of goodwill and other intangible assets exceeds its implied fair value, an impairment loss is recognized equal to that excess. We test our goodwill and other intangible assets for impairment annually as of the first day of our fourth fiscal quarter and in interim periods if certain events occur indicating that the carrying value of goodwill or other intangible assets may be impaired. Indicators such as unexpected adverse business conditions, economic factors, unanticipated technological change or competitive activities, loss of key personnel, and acts by governments and courts, may signal that an asset has become impaired.
DeferredINCOME TAXESThe Company uses the asset and liability method of accounting for income taxes — We have provided a valuation allowance related to our substantial United Statestaxes. Under the asset and liability method, deferred tax assets. If sufficient evidenceassets and liabilities are recognized for the estimated future tax consequences attributable to differences between the financial statement carrying amounts of our abilityexisting assets and liabilities and their respective tax bases. This method also requires the recognition of future tax benefits such as net operating loss carryforwards, to the extent that realization of such benefits is more likely than not. Deferred tax assets and liabilities are measured using enacted tax rates expected to apply to taxable income in the years in which those temporary differences are expected to be recovered or settled. The effect on deferred tax assets and liabilities of a change in tax rates is recognized in income in the period that includes the enactment date.The carrying value of the Company’s net deferred tax assets assumes that the Company will be able to generate sufficient future taxable income in certain tax jurisdictions, becomes apparent, webased on estimates and assumptions. If these estimates and related assumptions change in the future, the Company may be required to reduce ourrecord additional valuation allowance, which may resultallowances against its deferred tax assets resulting in additional income tax benefitsexpense in ourthe Company’s consolidated statement of operations. The future realization of certain tax deferred assets will be applied to reduce the carrying value of goodwill. The portion of the valuation allowance for these deferred tax assets for which subsequently recognized tax benefits may be applied to reduce goodwill related to the purchase consideration of the Merger is approximately $44 million. We evaluateManagement evaluates the realizability of the deferred tax assets and assessassesses the need for aadequacy of the valuation allowance quarterly. In fiscal 2002, weLikewise, in the event that the Company was to determine that it would be able to realize its deferred tax assets in the future in excess of its net recorded a tax benefit of approximately $23 million relatedamount, an adjustment to the impairment of our Mexicali assets. A valuation allowance has not been established because we believe that the related deferred tax asset will be recovered duringassets would increase income or decrease the carryforward period.carrying value of goodwill in the period such determination was made.46
Revenue recognition —Revenues from product sales are recognized upon shipment and transfer
It was the Company’s intention to permanently reinvest the undistributed earnings of title,all its foreign subsidiaries in accordance with the shipping terms specified in the arrangement with the customer. Revenue recognition is deferred in all instances where the earnings process is incomplete. Certain product sales are made to electronic component distributors under agreements allowingAccounting Principles Board Opinion No. 23, “Accounting for price protection and/or a right of return on unsold products. We reduce revenue to the extent of our estimate for distributor claims of price protection and/or right of return on unsold product. A reserve for sales returns and allowances for customers is recorded based on historical experience or specific identification of an event necessitating a reserve.RESULTS OF OPERATIONS
GENERAL
Net revenues increased $160.0 million, or 35%, in fiscal 2003 when compared to fiscal 2002 primarily as the result of increasing demand for our wireless product portfolio and the exclusion of Alpha’s revenues for periods prior to the Merger. Since the Merger, we have also expanded our customer base and geographical market presence resulting in higher revenues in fiscal 2003. Gross margin improved in fiscal 2003 when compared to fiscal 2002 reflecting increased revenues and improved utilization of our manufacturing facilities. In fiscal 2003, we recorded special charges of $34.5 million, principally related to the impairment of assets related to our infrastructure products and certain restructuring charges.
We adopted SFAS No. 142, “Goodwill and Other Intangible Assets,” October 1, 2002 and performed a transitional impairment test for goodwill. The goodwill impairment test is a two-step process. The first step of the impairment analysis compares our fair value to our net book value. In determining fair value, SFAS No. 142 allows for the use of several valuation methodologies, although it states quoted market prices are the best evidence of fair value. As part of the first step, we determined that we have one reporting unit for purposes of performing the fair-value based test of goodwill. This reporting unit is consistent with our single operating segment, which management determined is appropriate under the provisions of SFAS No. 131, “Disclosures about Segments of an Enterprise and Related Information.” We completed step one and determined that our goodwill and unamortized intangible assets were impaired. Step two of the analysis compares the implied fair value of goodwill to its carrying amount in a manner similar to purchase price allocation. If the carrying amount of goodwill exceeds its implied fair value, an impairment loss is recognized equal to that excess. We completed step two and determined that the carrying amount of our goodwill was $397.1 million greater than its implied fair value. This transitional impairment charge was recorded as a cumulative effect of a change in accounting principle in fiscal 2003. In addition, we completed our annual goodwill impairment test for fiscal 2003 and determined that as of July 1, 2003, our goodwill was not further impaired.
YEARS ENDED SEPTEMBER 30, 2003, 2002 AND 2001
The following table sets forth the results of our operations expressed as a percentage of net revenues forIncome Taxes — Special Areas”. During the fiscal years below:
2003
2002
2001
Net revenues 100 .0% 100 .0% 100 .0% Cost of goods sold 61 .6 72 .4 119 .6
Gross margin 38 .4 27 .6 (19 .6) Operating expenses: Research and development 24 .6 29 .0 42 .6 Selling, general and administrative 13 .0 11 .0 19 .7 Amortization of intangible assets 0 .7 2 .8 5 .9 Purchased in-process research and development - - 14 .3 - - Special charges 5 .6 25 .4 34 .1
Total operating expenses 43 .8 82 .5 102 .3
Operating loss (5 .4) (54 .9) (121 .9) Interest expense (3 .5) (0 .9) - - Other income (expense), net 0 .2 - - 0 .1
Loss before income taxes and cumulative effect of change in accounting principle (8 .7) (55 .8) (121 .8) Provision (benefit) for income taxes before cumulative effect of change in accounting principle 0 .1 (4 .3) 0 .7
Loss before cumulative effect of change in accounting principle (8 .8) (51 .6) (122 .5) Cumulative effect of change in accounting principle, net of tax (64 .3) - - - -
Net loss (73 .1)% (51 .6)% (122 .5)%
NET REVENUES
Years Ended September 30,
2003
Change
2002
Change
2001
(in thousands) Net revenues $ 617,789 35 .0% $ 457,769 75 .8% $ 260,451
We market and sell our semiconductor products and system solutions to leading OEMs of communication electronics products, third-party original design manufacturers (“ODMs”) and contract manufacturers and indirectly through electronic components distributors. Samsung Electronics Co. accounted for 15%, 35%, and 44% of net revenues for the fiscal years 2003, 2002 and 2001, respectively. Motorola, Inc. accounted for 11% of net revenues for the fiscal years 2003 and 2002, and represented less than 10% of net revenues for fiscal 2001. Conexant accounted for less than 10% of net revenues for the fiscal years 2003 and 2002 and represented 17% of net revenues for fiscal 2001. Nokia Corporation accounted for less than 10% of net revenues for the fiscal years 2003 and 2002 and represented 12% of net revenues for fiscal 2001.
Revenues derived from customers located in the Americas region accounted for 25%, 17% and 27% of net revenues for the fiscal years 2003, 2002 and 2001, respectively. Revenues derived from customers located in the Asia-Pacific region were 61%, 77% and 64% of net revenues for the fiscal years 2003, 2002 and 2001, respectively. Revenues derived from customers located in the Europe/Middle East/Africa region were 14%, 6% and 9% of net revenues for the fiscal years 2003, 2002 and 2001, respectively. Our revenues by geography do not necessarily correlate to end handset demand by region. For example, if we sell a power amplifier module to a customer in South Korea, we record the sale within the South Korea account although that customer, in turn, may integrate that module into a product sold to a service provider (its customer) in Africa, China, Europe, the Middle East, the Americas or within South Korea.
The foregoing percentages are based on sales representing Washington/Mexicali sales for fiscal 2001 and fiscal 2002 up to the time of the Merger, and sales of the combined company for the post-Merger period from June 26, 2002 through the end of the fiscal year and for fiscal 2003.
Net revenues increased in fiscal 2003 when compared to fiscal 2002 primarily reflecting increasing demand for our wireless product portfolio and the exclusion of Alpha’s revenues for periods prior to the Merger. More specifically, GSM direct conversion transceivers and complete cellular systems as well as CDMA RF subsystems exhibited strong year-over-year growth. Additionally, we have launched a number of more highly integrated product offerings, added to our customer base and expanded our geographical market presence.
These increases in net revenues in fiscal 2003 when compared to fiscal 2002 were tempered by a decrease in average selling prices of our front-end module products and an industry-wide component and handset inventory correction. In addition, lower CDMA handset subsidies in Korea also adversely affected net revenues in fiscal 2003 when compared to fiscal 2002. In certain global markets, wireless operators provide subsidies on handset sales to their customers, ultimately decreasing the cost of the handset to the customer.
Net revenues increased 75.8% in fiscal 2002, when compared to fiscal 2001, principally reflecting increased sales of GSM products, including power amplifier modules and complete cellular systems. We also experienced increased demand for our power amplifier modules for CDMA and TDMA applications from a number of our key customers.
GROSS MARGIN
Years Ended September 30,
2003
2002
2001
(in thousands) Gross margin $ 237,324 $ 126,161 (51,052 ) % of net revenues 38.4 % 27.6 % (19.6 )%
Gross margin represents net revenues less cost of goods sold. Cost of goods sold consists primarily of purchased materials, labor and overhead (including depreciation) associated with product manufacturing, royalty and other intellectual property costs and sustaining engineering expenses pertaining to products sold. Cost of goods sold for the periods prior to the Merger also includes allocations from Conexant of manufacturing cost variances, process engineering and other manufacturing costs, which are not included in our unit costs but are expensed as incurred.
The improvement in gross margin in fiscal 2003 compared to fiscal 2002 reflects increased revenues, improved utilization of our manufacturing facilities and a decrease in depreciation expense that resulted from the write-down of our Mexicali facility assets in the third quarter of fiscal 2002. Although recent revenue growth has increased the level of utilization of our manufacturing facilities, these facilities continue to operate below optimal capacity and underutilization continues to adversely affect our unit cost of goods sold and gross margin.
Gross margin in fiscal 2003 was also favorably affected by $4.8 million when we reevaluated our obligation under a wafer fabrication supply agreement with Conexant and Jazz Semiconductor and reduced our liability and cost of sales in the first quarter of fiscal 2003. Pursuant to the terms of wafer supply agreements with Conexant and Jazz Semiconductor, we are committed to obtain certain minimum wafer volumes from Jazz Semiconductor. As of September 30, 2003, we expect to meet all of these purchase obligations. Our costs will be affected by the extent of our use of outside foundries and the pricing we are able to obtain. During periods of high industry demand for wafer fabrication capacity, we may have to pay higher prices to secure wafer fabrication capacity.
The improvement in gross margin in fiscal 2002, compared to fiscal 2001, reflects increased revenues, improved utilization of our manufacturing facilities and a decrease in depreciation expense that resulted from the write-down of the Newbury Park wafer fabrication assets in the third quarter of fiscal 2001 and the Mexicali facility assets in the third quarter of 2002. The effect of the write-down of the Newbury Park wafer fabrication assets and the Mexicali facility assets on fiscal 2002 gross margin was approximately $10.5 million and $5.5 million, respectively. Gross margin for fiscal 2002 was adversely impacted by additional warranty costs of $14.0 million. The additional warranty costs were the result of an agreement with a major customer for the reimbursement of costs the customer incurred in connection with the failure of a product when used in a certain adverse environment. Although we developed and sold the product to the customer pursuant to mutually agreed-upon specifications, the product experienced unusual failures when used in an environment in which the product had not been previously tested. The product has since been modified and no significant additional costs are expected to be incurred in connection with this issue.
In addition, we originally estimated our obligation under our wafer supply agreement with Conexant and Jazz Semiconductor, Inc. would result in excess costs of approximately $12.9 million when recorded as a liability and charged to cost of sales in the third quarter of fiscal 2002. During the fourth quarter of fiscal 2002, we reevaluated this obligation and reduced our liability and cost of sales by approximately $8.1 million in the quarter.
Gross margin for the year ended September 30, 2002 benefited2005, the Company reversed its policy of permanently reinvesting the earnings of its Mexican business. This policy reversal increased the 2005 tax provision by approximately $12.5 million as a result of$9.0 million. For the sale of inventories having a historical cost of $12.5 million that were written down to a zero cost basis during fiscal year 2001; such sales resulted from sharply increased demand beginning in the fourth quarter of fiscal 2001 thatended September 29, 2006, U.S. income tax was not anticipated at the time of the write-downs. Gross margin for fiscal 2001 was adversely affected by inventory write-downs of approximately $58.7 million, partially offset by approximately $4.5 million of subsequent sales of inventories written down to a zero cost basis. The inventories that were written down to a zero cost basis in fiscal 2001 were either sold or scrapped during fiscal 2003, 2002 and 2001. During fiscal 2003, 2002 and 2001, we sold $2.7 million, $12.5 million and $4.5 million, respectively, and scrapped $2.7 million, $1.8 million and $34.5 million, respectively. As of September 30, 2003, we no longer held inventories which were written down to a zero cost basis in fiscal 2001.
The inventory write-downs recorded in fiscal 2001 resulted from the sharply reduced end-customer demand we experienced, primarily associated with our RF components, as a result of the rapidly changing demand environment for digital cellular handsets during that period. As a result of these market conditions, we experienced a significant number of order cancellations and a decline in the volume of new orders, beginning in the fiscal 2001 first quarter and becoming more pronounced in the second quarter.
RESEARCH AND DEVELOPMENT
Years Ended September 30,
2003
Change
2002
Change
2001
(in thousands) Research and development $ 151,762 14 .4% $ 132,603 19 .4% $ 111,053 % of net revenues 24.6% 29.0% 42.6%
Research and development expenses consist principally of direct personnel costs, costs for pre-production evaluation and testing of new devices and design and test tool costs. Research and development expenses for the periods prior to the Merger also include allocated costs for shared research and development services provided by Conexant, principally in the areas of advanced semiconductor process development, design automation and advanced package development, for the benefit of several of Conexant’s businesses.
The increase in research and development expenses in fiscal 2003 compared to fiscal 2002 represents our commitment to design new products and processes and address new opportunities to meet our customers’ demands. We have expanded customer support engagements as well as development efforts targeting semiconductor solutions using the CDMA2000, GSM, General Packet Radio Services, or GPRS, and third-generation, or 3G, wireless standards in both the digital cellular handset and infrastructure markets. The increase in research and development expenses in fiscal 2003 when compared to the previous year is also relatedon current earnings attributable to our research and development expenses representing those of the combined company after the Merger whereas those expensesoperations in 2002 are representative of only Washington/Mexicali prior to June 25, 2002.
The increase in research and development expenses in fiscal 2002 compared to fiscal 2001 primarily reflects the opening of a new design center in Le Mans, France and higher headcount and personnel-related costs. Subsequent to the first quarter of fiscal 2001, we expanded customer support engagements as well as development efforts targeting semiconductor solutions using the CDMA2000, GSM, GPRS, and 3G wireless standards in both the digital cellular handset and infrastructure markets.
SELLING, GENERAL AND ADMINISTRATIVE
Years Ended September 30,
2003
Change
2002
Change
2001
(in thousands) Selling, general and administrative $ 80,222 60 .0% $ 50,178 (2 .1)% $ 51,267 % of net revenues 13.0% 11.0% 19.7%
Selling, general and administrative expenses include personnel costs (legal, accounting, treasury, human resources, information systems, customer service, etc.), sales representative commissions, advertising and other marketing costs. Selling, general and administrative expenses also include allocated general and administrative expenses from Conexant for the periods prior to the Merger for a variety of these shared functions.
The increase in selling, general and administrative expenses in fiscal 2003 when compared to fiscal 2002 is primarily related to our selling, general and administrative expenses representing those of the combined company after the Merger whereas those expenses for the same period in 2002 are representative of only Washington/Mexicali prior to June 25, 2002.
The decrease in selling, general and administrative expenses in fiscal 2002 compared to fiscal 2001 primarily reflects lower headcount and personnel-related costs resulting from the expense reduction and restructuring actions initiated during fiscal 2001 and lower provisions for uncollectible accounts receivable.
AMORTIZATION OF INTANGIBLE ASSETS
Years Ended September 30,
2003
Change
2002
Change
2001
(in thousands) Amortization of intangible assets $ 4,386 (66 .1)% $ 12,929 (15 .3)% $ 15,267 % of net revenues 0.7% 2.8% 5.9%
In 2002, we recorded $36.4 million of intangible assets related to the Merger consisting of developed technology, customer relationships and a trademark. These assets are principally being amortized on a straight-line basis over a 10-year period. Amortization expense for fiscal 2003 primarily represents the amortization of these intangible assets. Amortization expense for fiscal 2002 and 2001 primarily represents amortization of goodwill and intangible assets acquired in connection with Washington/Mexicali’s acquisition of Philsar Semiconductor, Inc. (“Philsar”) in fiscal 2000. Philsar was a developer of RF semiconductor solutions for personal wireless connectivity, including emerging standards such as Bluetooth, and RF components for third-generation digital cellular handsets. We wrote off all goodwill and other intangible assets associated with our acquisition of the Philsar Bluetooth business in the third quarter of fiscal 2002. The lower amortization expense in fiscal 2003 when compared to fiscal 2002 and fiscal 2001, primarily resulted from the adoption of Statement of Financial Accounting Standards (“SFAS”) No. 142, “Goodwill and Other Intangible Assets,” on October 1, 2002. Had the Company ceased amortizing goodwill on October 1, 2000, amortization expense would have been $10.7 million and $13.9 million less in fiscal 2002 and fiscal 2001, respectively.
We adopted SFAS No. 142, “Goodwill and Other Intangible Assets,” on October 1, 2002 and performed a transitional impairment test for goodwill. The goodwill impairment test is a two-step process. The first step of the impairment analysis compares our fair value to our net book value. In determining fair value, SFAS No. 142 allows for the use of several valuation methodologies, although it states quoted market prices are the best evidence of fair value. As part of the first step, we determined that we have one reporting unit for purposes of performing the fair-value based test of goodwill. This reporting unit is consistent with our single operating segment, which management determined is appropriate under the provisions of SFAS No. 131, “Disclosures about Segments of an Enterprise and Related Information.” We completed step one and determined that our goodwill and unamortized intangible assets were impaired. Step two of the analysis compares the implied fair value of goodwill to its carrying amount in a manner similar to purchase price allocation. If the carrying amount of goodwill exceeds its implied fair value, an impairment loss is recognized equal to that excess. We completed step two and determined that the carrying amount of our goodwill was $397.1 million greater than its implied fair value. This transitional impairment charge was recorded as a cumulative effect of a change in accounting principle in fiscal 2003. In addition, we completed our annual goodwill impairment test for fiscal 2003 and determined that as of July 1, 2003, our goodwill was not further impaired.
PURCHASED IN-PROCESS RESEARCH AND DEVELOPMENT
Years Ended September 30,
2003
Change
2002
Change
2001
(in thousands) Purchased in-process research and development $ -- N/A $ 65,500 N/A $ --
In connection with the Merger in fiscal 2002, $65.5 million was allocated to purchased in-process research and development (“IPR&D”) and expensed immediately upon completion of the acquisition (as a charge not deductible for tax purposes) because the technological feasibility of certain products under development had not been established and no future alternative uses existed. The charges represent the estimated fair values of the portion of IPR&D projects that had been completed by Alpha at the time of the Merger.
Prior to the Merger, Alpha was in the process of developing new technologies in its semiconductor and ceramics segments. The objective of the IPR&D effort was to develop new semiconductor processes, ceramic materials and related products to satisfy customer requirements in the wireless and broadband markets.
The semiconductor segment was involved in several projects that have been aggregated into the following categories based on the respective technologies:
Power Amplifier: Power amplifiers are designed and manufactured for use in different types of wireless handsets. The main performance attributes of these amplifiers are efficiency, power output, operating voltage and distortion. Current research and development is focused on expanding the offering to all types of wireless standards, improving performance by process and circuit improvements and offering a higher level of integration.
Control Products: Control products consist of switches and switch filters that are used in wireless applications for signal routing. Most applications are in the handset market enabling multi-mode, multi-band handsets. Current research and development is focused on performance improvement and cost reduction by reducing chip size and increasing functionality.
Broadband: The products in this grouping consist of radio frequency (RF) and millimeter wave semiconductors and components designed and manufactured specifically to address the needs of high-speed, wireline and wireless network access. Current and long-term research and development is focused on performance enhancement of speed and bandwidth as well as cost reduction and integration.
Silicon Diode: These products use silicon processes to fabricate diodes for use in a variety of RF and wireless applications. Current research and development is focused on reducing the size of the device, improving performance and reducing cost.
Ceramics: The ceramics segment was involved in projects that relate to the design and manufacture of ceramic-based components such as resonators and filters for the wireless infrastructure market. Current research and development is focused on performance enhancements through improved formulations and electronic designs.
The material risks associated with the successful completion of the in-process technology were associated with our ability to successfully finish the creation of viable prototypes and successful design of the chips, masks and manufacturing processes required. We expected to benefit from the in-process projects as the individual products that contained the in-process technology were put into production and sold to end-users. The release dates for each of the products within the product families were varied. The fair value of the IPR&D was determined using the income approach. Under the income approach, the fair value reflected the present value of the projected cash flows that were expected to be generated by the products incorporating the IPR&D, if successful. The projected cash flows were discounted to approximate fair value. The discount rate applicable to the cash flows of each project reflected the stage of completion and other risks inherent in each project. The weighted average discount rate used in the valuation of IPR&D was 30 percent. As of September 30, 2003, the Company had either completed or abandoned each of these projects. The completed IPR&D projects commenced generating cash flows in fiscal 2003. Due to the nature of these projects and the related technolgy, the revenue streams derived from these projects cannot be separately identified.
SPECIAL CHARGES
Years Ended September 30,
2003
Change
2002
Change
2001
(in thousands) Special charges $ 34,493 (70.3)% $ 116,321 (30. 9)% $ 88,876
ASSET IMPAIRMENTS
During the fourth quarter of fiscal 2003, we recorded a $26.0 million charge for the impairment of assets related to certain infrastructure products manufactured in our Woburn, Massachusetts and Adamstown, Maryland facilities. The Woburn facility primarily manufactures semiconductor products based on both silicon wafer technology and gallium arsenide technology. Our Adamstown, Maryland facility primarily manufactures ceramics components. We experienced a significant decline in factory utilization resulting from a downturn in the market for products manufactured at these two facilities and a decision to discontinue certain products. The impairment charge was based on a recoverability analysis prepared by management based on these factors and the related impact on our current and projected outlook. We projected lower revenues and new order volume for these products and management believed these factors indicated that the carrying value of the related assets (machinery, equipment and intangible assets) may have been impaired and that an impairment analysis should be performed. In performing the analysis for recoverability, management estimated the future cash flows expected to result from these products over a five-year period. Since the estimated undiscounted cash flows were less than the carrying value of the related assets, it was concluded that an impairment loss should be recognized. In accordance with SFAS No. 144, “Accounting for the Impairment or Disposal of Long-Lived Assets,” the impairment charge was determined by comparing the estimated fair value of the related assets to their carrying value. The fair value of the assets was determined by computing the present value of the estimated future cash flows using a discount rate of 16%, which management believed was commensurate with the underlying risks associated with the projected future cash flows. Management believes the assumptions used in the discounted cash flow model represented a reasonable estimate of the fair value of the assets. The write down established a new cost basis for the impaired assets. The anticipated pre-tax cost savings related to these impairment charges is expected to be $17.4 million over the next five years (fiscal 2004 through fiscal 2008) and $8.6 million over the subsequent fifteen years (fiscal 2009 through 2023).
In addition, during the fourth quarter of fiscal 2003 we recorded a $2.3 million charge for the impairment of our Haverhill, Massachusetts property that is currently being held for sale. In fiscal 2003, we relocated our operations from this facility to our Woburn, Massachusetts facility. We are actively marketing the property located in Haverhill, Massachusetts.
During fiscal 2002, the Company recorded a $66.0 million charge for the impairment of the assembly and test machinery and equipment and related facility in Mexicali, Mexico. The impairment charge was based on a recoverability analysis prepared by management as a result of a significant downturn in the market for test and assembly services for non-wireless products and the related impact on our current and projected outlook.
We experienced a severe decline in factory utilization at our Mexicali facility for non-wireless products and projected decreasing revenues and new order volume. Management believed these factors indicated that the carrying value of the assembly and test machinery and equipment and related facility may have been impaired and that an impairment analysis should be performed. In performing the analysis for recoverability, management estimated the future cash flows expected to result from the manufacturing activities at the Mexicali facility over a ten-year period. The estimated future cash flows were based on a gradual phase-out of services sold to Conexant and modest volume increases consistent with management’s view of the outlook for the business, partially offset by declining average selling prices. The declines in average selling prices were consistent with historical trends and management’s decision to reduce capital expenditures for future capacity expansion. Since the estimated undiscounted cash flows were less than the carrying value (approximately $100 million based on historical cost) of the related assets, it was concluded that an impairment loss should be recognized. The impairment charge was determined by comparing the estimated fair value of the related assets to their carrying value. The fair value of the assets was determined by computing the present value of the estimated future cash flows using a discount rate of 24%, which management believed was commensurate with the underlying risks associated with the projected future cash flows. Management believes the assumptions used in the discounted cash flow model represented a reasonable estimate of the fair value of the assets. The write down established a new cost basis for the impaired assets.
During fiscal 2002, we recorded a $45.8 million charge for the write-off of goodwill and other intangible assets associated with our acquisition of Philsar in fiscal 2000. Management determined that we would not support the technology associated with the Philsar Bluetooth business. Accordingly, this product line was discontinued and the employees associated with the product line were either severed or relocated to other operations. As a result of the actions taken, management determined that the remaining goodwill and other intangible assets associated with the Philsar acquisition were impaired.
During the third quarter of fiscal 2001 we recorded an $86.2 million charge for the impairment of our manufacturing facility and related wafer fabrication machinery and equipment at our Newbury Park, California facility. This impairment charge was based on a recoverability analysis prepared by management as a result of the dramatic downturn in the market for wireless communications products and the related impact on our then-current and projected business outlook. Through the third quarter of fiscal 2001, we experienced a severe decline in factory utilization at the Newbury Park wafer fabrication facility and decreasing revenues, backlog, and new order volume. Management believed these factors, together with its decision to significantly reduce future capital expenditures for advanced process technologies and capacity beyond the then-current levels, indicated that the value of the Newbury Park facility may have been impaired and that an impairment analysis should be performed. In performing the analysis for recoverability, management estimated the future cash flows expected to result from the manufacturing activities at the Newbury Park facility over a ten-year period. The estimated future cash flows were based on modest volume increases consistent with management’s view of the outlook for the industry, partially offset by declining average selling prices. The declines in average selling prices were consistent with historical trends and management’s decision to focus on existing products based on the current technology. Since the estimated undiscounted cash flows were less than the carrying value (approximately $106 million based on historical cost) of the related assets, it was concluded that an impairment loss should be recognized. The impairment charge was determined by comparing the estimated fair value of the related assets to their carrying value. The fair value of the assets was determined by computing the present value of the estimated future cash flows using a discount rate of 30%, which management believed was commensurate with the underlying risks associated with the projected cash flows. We believe the assumptions used in the discounted cash flow model represented a reasonable estimate of the fair value of the assets. The write-down established a new cost basis for the impaired assets.
RESTRUCTURING CHARGES
During the second and fourth quarters of fiscal 2003, we recorded $3.3 million and $2.9 million, respectively, in restructuring charges to provide for workforce reductions and the consolidation of facilities. The charges were based upon estimates of the cost of severance benefits for affected employees and lease cancellation, facility sales, and other costs related to the consolidation of facilities. Substantially all amounts accrued for these actions are expected to be paid within one year.
During fiscal 2002, we implemented a number of cost reduction initiatives to more closely align our cost structure with the then-current business environment. We recorded restructuring charges of approximately $3.0 million for costs related to the workforce reduction and the consolidation of certain facilities. Substantially all amounts accrued for these actions have been paid.
During fiscal 2001, Washington/Mexicali reduced its workforce by approximately 250 employees, including approximately 230 employees in manufacturing operations. Restructuring charges of $2.7 million were recorded for such actions and were based upon estimates of the cost of severance benefits for the affected employees. We have paid all amounts accrued for these actions.
Activity and liability balances related to the fiscal 2002 and fiscal 2003 restructuring actions are as follows (in thousands):
Fiscal 2002
Workforce
Reductions
Fiscal 2002
Facility Closings
and Other
Fiscal 2003
Workforce
Reductions
Fiscal 2003
Facility
Closings
and Other
Total
Charged to costs and expenses $ 2,923 $ 97 $ -- $ -- $ 3,020 Cash payments (2,225 ) (13 ) -- -- (2,238 )
Restructuring balance, September 30, 2002 698 84 -- -- 782 Charged to costs and expenses -- -- 4,819 1,405 6,224 Cash payments (698 ) (47 ) (3,510 ) (1,236 ) (5,491 )
Restructuring balance, September 30, 2003 $ -- $ 37 $ 1,309 $ 169 $ 1,515
In addition, we assumed approximately $7.8 million of restructuring reserves from Alpha in connection with the Merger. During the fiscal years ended September 30, 2003 and 2002, payments related to the restructuring reserves assumed from Alpha were $4.7 million and $1.1 million, respectively. On September 30, 2003, this balance was $2.0 and primarily relates to payments on a lease that expires in 2008.
INTEREST EXPENSE
Years Ended September 30,
2003
Change
2002
Change
2001
(in thousands) Interest expense $ 21,403 406.3% $ 4,227 N/A $ --
Our debt at September 30, 2003 consists of $230 million of convertible subordinated Junior notes, $45 million of convertible senior subordinated notes, $41.7 million of borrowings under our receivable purchase agreement and a loan that matures in December 2003.
Our long-term debt primarily consists of $230 million of convertible subordinated Junior notes at a fixed interest rate of 4.75 percent due 2007. These Junior notes can be converted into 110.4911 shares of common stock per $1,000 principal balance, which is the equivalent of a conversion price of approximately $9.05 per share. We may redeem the Junior notes at any time after November 20, 2005. The redemption price of the Junior notes during the period between November 20, 2005 through November 14, 2006 will be $1,011.875 per $1,000 principal amount of notes to be redeemed, plus accrued and unpaid interest, if any, to the redemption date, and the redemption price of the notes beginning on November 15, 2006 and thereafter will be $1,000 per $1,000 principal amount of notes to be redeemed, plus accrued and unpaid interest, if any, to the redemption date. Holders may require that we repurchase the Junior notes upon a change in control of the Company. We pay interest in cash semi-annually in arrears on May 15 and November 15 of each year.
In addition, our long-term debt includes $45 million of convertible senior subordinated notes at a fixed rate of 15 percent due June 30, 2005, which were issued as part of our debt refinancing with Conexant completed on November 13, 2002. These Senior notes can be converted into our common stock at a conversion rate based on the applicable conversion price, which is subject to adjustment based on, among other things, the market price of our common stock. Based on this adjustable conversion price, we expect that the maximum number of shares that could be issued under the Senior notes is approximately 7.1 million shares, subject to adjustment for stock splits and other similar dilutive occurrences. If the holder(s) of these Senior notes converted the notes at a price that is less than the original conversion price ($7.87) as the result of a decrease in the market price of our stock, we would be required to record a charge to interest expense in the period of conversion. At maturity (including upon certain acceleration events), we will pay the principal amount of the Senior notes by issuing a number of shares of common stock equal to the principal amount of the Senior notes then due and payable divided by the applicable conversion price in effect on such date, together with cash in lieu of any fractional shares. We may redeem the Senior notes at any time after May 12, 2004 at $1,030 per $1,000 principal amount of Senior notes to be redeemed, plus accrued and unpaid interest. The holder(s) may require that we repurchase the Senior notes upon a change in control of the Company. We pay interest in cash on the Senior notes on the last business day of each March, June, September and December of each year. Interest on the Senior notes is not deductible for tax purposes because of the conversion feature.
We entered into a receivables purchase agreement under which we have agreed to sell from time to time certain of our accounts receivable to Skyworks USA, Inc. (“Skyworks USA”), a wholly-owned, special purpose entity that is fully consolidated for accounting purposes. Concurrently, Skyworks USA entered into an agreement with Wachovia Bank, National Association providing for a $50 million credit facility (“Facility Agreement”) secured by the purchased accounts receivable. Our short-term debt consists primarily of funds borrowed under the Facility Agreement. As a part of the consolidation, any interest incurred by Skyworks USA related to monies it borrows under the Facility Agreement is recorded as interest expense in our results of operations. Interest related to the Facility Agreement is LIBOR plus 0.4% and was approximately 1.5% at September 30, 2003. We perform collections and administrative functions on behalf of Skyworks USA. As of September 30, 2003, Skyworks USA had borrowed $41.7 million under this agreement.
In addition, our short-term debt includes the remaining portion of a ten-year $960,000 loan from the State of Maryland under the Community Development Block Grant program due December 2003 at an interest rate of 5 percent.
OTHER INCOME (EXPENSE), NET
Years Ended September 30,
2003
Change
2002
Change
2001
(in thousands) Other income (expense), net $ 1,317 nm $ (56) (126 .7)% $ 210
nm = not meaningful
Other income (expense), net is comprised primarily of interest income on invested cash balances, foreign exchange gains/losses and other non-operating income and expense items.
PROVISION FOR INCOME TAXES
Years Ended September 30,
2003
Change
2002
Change
2001
(in thousands) Provision (benefit) for income taxes $ 652 nm $ (19,589) nm $ 1,619
As a result of our history of operating losses and the expectation of future operating results, we determined that it is more likely than not that historic and current year income tax benefits will not be realized except for certain future deductions associated with our foreign operations. Consequently, no United States income tax benefit has been recognized relating to the U.S. operating losses. As of September 30, 2003, we have established a valuation allowance against all of our net U.S. deferred tax assets. Deferred tax assets have been recognized for foreign operations when management believes they will be recovered during the carry forward period.
The provision (benefit) for income taxes for fiscal 2003, 2002 and 2001 consists of foreign income taxes incurred by foreign operations. We do not expect to recognize any income tax benefits relating to future operating losses generated in the United States until management determines that such benefits are more likely than not to be realized. In 2002, the provision for foreign income taxes was offset by a tax benefit of approximately $23 million related to the impairment of our Mexicali assets.
No provision has been made for United States,U.S. federal, state, or additional foreign income taxes related to approximately $3.8 millionthat would be due upon the actual or deemed distribution of undistributed earnings of the other foreign subsidiaries, which have been, or are intended to be, permanently reinvested. It is not practical
On November 10, 2005, the FASB issued FASB Staff Position No. FAS 123(R)-3, “Transition Election Related to Accounting for Tax Effects of Share-Based Payment Awards” the “FASB Staff Position”). The Company adopted the alternative transition method provided in the FASB Staff Position for calculating the tax effects of share-based compensation pursuant to SFAS 123(R) during the year ended September 29, 2006. The alternative transition method includes simplified methods to establish the beginning balance of the additional paid-in capital pool (“APIC pool”) related to the tax effects of employee share-based compensation, and to determine the United States federal incomesubsequent impact on the APIC pool and Consolidated Statements of Cash Flows of the tax liability, if any, which wouldeffects of employee share-based compensation awards that are outstanding upon adoption of SFAS 123(R). Under the simplified method the Company’s beginning APIC pool is zero and the ending APIC pool balance at September 29, 2006 remains zero.RECENTLY ISSUED ACCOUNTING PRONOUNCEMENTSIn November 2004, the Financial Accounting Standards Board (“FASB”) issued SFAS No. 151, “Inventory Costs — an amendment to APB No. 23, Chapter 4” (“SFAS No. 151”). The amendments made by SFAS No. 151 clarify that abnormal amounts of idle facility expense, freight, handling costs and wasted materials (spoilage) should be payable if such earnings were not permanently reinvested.CUMULATIVE EFFECT OF CHANGE IN ACCOUNTING PRINCIPLE
Werecognized as current-period charges and require the allocation of fixed production overheads to inventory based on the normal capacity of the production facilities. The guidance is effective for inventory costs incurred during fiscal years beginning after June 15, 2005. The Company adopted SFAS No. 142, "Goodwill and Other Intangible Assets,"151 on October 1, 2002,2005 and performedit did not have a transitional impairment test for goodwill. The goodwill impairment test is a two-step process. The first step ofmaterial impact on its financial statements during fiscal 2006.
In December 2004, the impairment analysis compares our fair value to our net book value. In determining fair value,FASB issued SFAS No. 142 allows for the use153, “Exchanges of several valuation methodologies, although it states quoted market prices are the best evidenceNonmonetary Assets—an amendment of fair value. As part of the first step, we determined that we have one reporting unit for purposes of performing the fair-value based test of goodwill. This reporting unit is consistent with our single operating segment, which management determined is appropriate under the provisions of APB Opinion No. 29” (“SFAS No. 131, "Disclosures about Segments153”). The guidance in APB Opinion No. 29, “Accounting for Nonmonetary Transactions” (“APB No. 29”) is based on the principle that exchanges of an Enterprise and Related Information." We completed step one and determined that our goodwill and unamortized intangiblenonmonetary assets were impaired. Step two ofshould be measured based on the analysis compares the implied fair value of goodwill to its carrying amount. If the carrying amount of goodwill exceeds its implied fair value, an impairment loss is recognized equalassets exchanged. The guidance in APB No. 29, however, included certain exceptions to that excess. We completed step twoprinciple. SFAS No. 153 amends APB No. 29 to eliminate the exception for nonmonetary exchanges of similar productive assets and determinedreplaces it with a general exception for exchanges of nonmonetary assets that do not have commercial substance. SFAS No. 153 is effective for such exchange transactions occurring in fiscal periods beginning after June 15, 2005. The Company adopted SFAS No. 153 on October 1, 2005 and it did not have a material impact on its financial statements during fiscal 2006.In May 2005, the carrying amountFASB issued SFAS No. 154, “Accounting Changes and Error Corrections—a replacement of our goodwill was $397.1 million greater than its implied fair value.APB Opinion No. 20 and FASB Statement No. 3” (“SFAS No. 154”). This transitional impairment charge was recorded as a cumulative effectStatement replaces APB Opinion No. 20, “Accounting Changes” and FASB Statement No. 3, “Reporting Accounting Changes in Interim Financial Statements—an amendment of APB Opinion No. 28,” and also changes the requirements for the accounting for and reporting of a change in accounting principleprinciple. SFAS No. 154 applies to all voluntary changes in an accounting principle. It also applies to changes required by an accounting pronouncement in the unusual instance that the pronouncement does not include specific transition provisions. When a pronouncement includes specific transition provisions, those provisions should be followed. SFAS No. 154 is effective for accounting changes and error corrections occurring in fiscal 2003. In addition, we completed our annual goodwill impairment test for fiscal 2003 and determined that as of July 1, 2003, our goodwill was not further impaired.LIQUIDITY AND CAPITAL RESOURCES
(in thousands) Years Ended September 30, 2003
2002
2001
Cash and cash equivalents at beginning of period $ 53,358 $ 1,998 $ 4,179 Net cash provided by (used in) operating activities (72,052 ) (99,094 ) (89,406 ) Net cash provided by (used in) investing activities (44,282 ) 70,042 (51,118 ) Net cash provided by (used in) financing activities 224,482 80,412 138,343
Cash and cash equivalents at end of period $ 161,506 $ 53,358 $ 1,998
Cash and cash equivalents at September 30, 2003, 2002 and 2001 totaled $161.5 million, $53.4 million and $2.0 million, respectively. Working capital at September 30, 2003 was approximately $249.3 million compared to $79.8 million at September 30, 2002 and $60.5 million at September 30, 2001. Inventory turns were approximately 6.5 for fiscal 2003.
Cash used in operating activities was $72.1 million for fiscal 2003, reflecting a net loss of $451.4 million, offset by non-cash charges (primarily asset impairments, depreciation and amortization) of $489.2 million and a net decrease in working capital items of approximately $109.9 million, including $40.0 million of merger-related expense payments. As of September 30, 2003, substantially all amounts accrued for merger-related expenses have been paid. Weyears beginning after December 15, 2005. The Company adopted SFAS No. 142, “Goodwill154 on September 30, 2005 and Other Intangible Assets,”it did not have a material effect on October 1, 2002 and recorded a $397.1 million cumulative effectits financial statements during fiscal 2006.
On November 10, 2005, the FASB issued FASB Staff Position No. FAS 123(R)-3, “Transition Election Related to Accounting for Tax Effects of a change in accounting principle, representingShare-Based Payment Awards” the difference between“FASB Staff Position”). The Company adopted the implied fair value and carrying value of our goodwill. Operating results in fiscal 2003 improved when compared to fiscal 2002, primarily as the result of increased revenues and improved utilization of our manufacturing facilities.Cash used in investing activities for fiscal 2003 primarily consisted of capital expenditures of $40.3 million. The capital expenditures for fiscal 2003 represent our continued investment in production and test facilities in addition to our commitment to investalternative transition method provided in the capital neededFASB Staff Position for calculating the tax effects of share-based compensation pursuant to design new products and processes and address new opportunitiesSFAS 123(R) during the year ended September 29, 2006. The alternative transition method includes simplified methods to meet our customers’ demands. We believe a focused program of capital expenditures will be required to sustain our current manufacturing capabilities. We may also consider acquisition opportunities to extend our technology portfolio and design expertise and to expand our product offerings. Cash used in investing activities for fiscal 2003 also included $4.0 million of purchases of short-term investments. Our short-term investments are classified as held-to-maturity and consist primarily of commercial paper with original maturities of more than 90 days and less than twelve months.
On August 11, 2003 we filed a shelf registration statement on Form S-3 withestablish the SEC with respect to the issuance of up to $250 million aggregate principal amount of securities, including debt securities, common or preferred shares, warrants or any combination thereof. This registration statement, which the SEC declared effective on August 28, 2003, provides us with greater flexibility and access to capital. On September 9, 2003 we issued 9.2 million shares of common stock under our shelf registration statement. Cash provided by financing activities for fiscal 2003 included approximately $102.2 million of net proceeds from this offering. We may from time to time issue securities under the remainingbeginning balance of the shelf registration statementadditional paid-in capital pool (“APIC pool”) related to the tax effects of employee share-based compensation, and to determine the subsequent impact on
47
the APIC pool and Consolidated Statements of Cash Flows of the tax effects of employee share-based compensation awards that are outstanding upon adoption of SFAS 123(R). Under the simplified method the Company’s beginning APIC pool is zero.In March 2006, the Emerging Issues Task Force issued EITF Issue No. 04-13, “Accounting for general corporate purposes.Cash provided by financing activitiesPurchases and Sales of Inventory with the Same Counterparty” (“EITF 04-13”). EITF 04-13 clarifies the circumstances under which two or more transactions involving inventory with the same counterparty should be viewed as a single nonmonetary transaction. In addition the EITF reached a consensus that there are circumstances under which nonmonetary exchanges of inventory within the same line of business should be recognized at fair value. Issue 04-13 is effective for new arrangements entered into in reporting periods beginning after March 15, 2006. The Company adopted the provisions of EITF 04-13 in the three month period ended June 30, 2006 and it did not have a material impact on its financial statements.
In July 2006, the FASB issued FASB Interpretation No. 48, “Accounting for Uncertainty in Income Taxes—an interpretation of FASB Statement No. 109” (“FIN 48”), which clarifies the accounting and disclosure for uncertainty in tax positions, as defined. FIN 48 seeks to reduce the diversity in practice associated with certain aspects of the recognition and measurement related to accounting for income taxes. This interpretation is effective for fiscal 2003 also includedyears beginning after December 15, 2006. The Company expects to adopt FIN48 on September 29, 2007, the netfirst day of fiscal 2008 and has not yet determined the impact this interpretation will have on our results from operations or financial position.In September 2006, the FASB issued SFAS No. 157, “Fair Value Measurements” (“SFAS 157”) which defines fair value, establishes a framework for measuring fair value in generally accepted accounting principles and expands disclosures about fair value measurements. SFAS 157 is effective for financial statements issued for fiscal years beginning after November 15, 2007 and interim periods within those fiscal years. The Company has not yet determined the impact this FASB will have on our results from operations or financial position.In September 2006, the FASB issued SFAS No. 158, “Employers’ Accounting for Defined Benefit Pension and Other Postretirement Plans—an amendment of FASB Statements No. 87, 88, 106, and 132(R)” (“SFAS 158”) which requires an employer to: (a) recognize in its statement of financial position an asset for a plan’s overfunded status or a liability for a plan’s underfunded status; (b) measure a plan’s assets and its obligations that determine its funded status as of the end of the employer’s fiscal year; and (c) recognize changes in the funded status of a defined benefit postretirement plan in the year in which the changes occur. Those changes will be reported in other comprehensive income. The requirement to recognize the funded status of a benefit plan and the disclosure requirements are effective as of the end of fiscal years ending after December 15, 2006. The requirement to measure plan assets and benefit obligations as of the date of the employer’s fiscal year-end statement of financial position is effective for fiscal years ending after December 15, 2008, although earlier adoption is permitted. The Company has not yet determined the impact that SFAS 158 will have on our results from operations or financial position.In September 2006, the Securities and Exchange Commission issued Staff Accounting Bulletin No. 108, “Considering the Effects of Prior Year Misstatements When Quantifying Misstatements in Current Year Financial Statements” (“SAB 108”), which provides interpretive guidance on how the effects of the carryover or reversal of prior year misstatements should be considered in quantifying a current year misstatement. SAB 108 is effective for fiscal years ending after November 15, 2006. The Company does not expect the impact of our private placement of $230 million of 4.75 percent convertible subordinated notes due 2007 and related debt refinancing with Conexant on November 13, 2002. These subordinated notes can be converted into 110.4911 shares of common stock per $1,000 principal balance, which is the equivalent of a conversion price of approximately $9.05 per share. The net proceeds from the note offering were principally used to prepay $105 million of the $150 million debt to Conexant relating to the purchase of the Mexicali Operations and prepay the $65 million principal amount outstanding as of November 13, 2002 under a separate loan facility with Conexant. In connection with our prepayment of $105 million of the $150 million debt owed to Conexant relating to the purchase of the Mexicali Operations, the remaining $45 million principal balance was exchanged for new 15 percent convertible senior subordinated notes with a maturity date of June 30, 2005. These senior subordinated notes can be converted into our common stock at a conversion rate based on the applicable conversion price, which is subject to adjustment based on, among other things, the market price of our common stock. Based on this adjustable conversion price, we expect that the maximum number of shares that could be issued under the senior subordinated notes is approximately 7.1 million shares, subject to adjustment for stock splits and other similar dilutive occurrences. In addition to the retirement of $170 million in principal amount of indebtedness owing to Conexant, we also retained approximately $53 million of net proceeds of the private placement to support our working capital needs. In addition, as of September 30, 2003, Skyworks USA had borrowed $41.7 million under our $50 million Facility Agreement secured by the purchased accounts receivable with Wachovia Bank, National Association.Cash used in operating activities was $99.1 million and $89.4 million for fiscal 2002 and 2001, respectively. Operating cash flows for fiscal 2002 and 2001 reflect net losses of $236.1 million and $318.9 million, respectively, offset by non-cash charges (depreciation and amortization, asset impairments and an in-process research and development charge) of $221.6 million and $220.8 million, respectively, and a net increase in working capital of approximately $84.6 million and a net decrease of $8.7 million, respectively. During 2002 we consolidated facilities, reduced our work force and continued to implement cost saving initiatives. In addition, increased revenues and improved utilization of our manufacturing facilities contributed to improved operating results in fiscal 2002 when compared to fiscal 2001.
Cash provided by investing activities for fiscal 2002 consisted of capital expenditures of $29.4 million and dividends to Conexant of $3.1 million offset by cash received of $67.1 million as a result of the Merger and $35.4 million from the sale of short-term investments acquired in the Merger. Cash used in investing activities for fiscal 2001 consisted of capital expenditures of $51.1 million. The capital expenditures for fiscal 2002 reflect a significant reduction from annual capital expenditures in fiscal 2001, a key component of the cost reduction initiatives implemented in fiscal 2002.
Cash provided by financing activities consisted of net transfers from Conexant, pre-Merger, of $50.4 million and $138.3 million for fiscal 2002 and 2001, respectively. Cash provided by financing activities for fiscal 2002 also consisted of $30.0 million of proceeds from borrowings against the revolving credit facility with Conexant. Historically, Conexant managed cash on a centralized basis. Cash receipts associated with Washington/Mexicali’s business were generally collected by Conexant, and Conexant generally made disbursements on behalf of Washington/Mexicali.
Following is a summary of our contractual payment obligations for consolidated debt, purchase agreements and operating leases at September 30, 2003 (seeNotes 8 and13 of the consolidated financial statements), in thousands:
Obligation
Total
1-3 years
4-5 Years
Thereafter
Debt $316,681 $ 86,681 $230,000 $ -- Purchase obligations 51,507 51,507 -- -- Operating leases 34,132 18,285 8,813 7,034
$402,320 $156,473 $238,813 $7,034
Under supply agreements entered into with Conexant and Jazz Semiconductor, we receive wafer fabrication, wafer probe and certain other services from Jazz Semiconductor. Pursuant to these supply agreements, we are committed to obtain certain minimum wafer volumes from Jazz Semiconductor. Our expected minimum purchase obligations under these supply agreements are anticipated to be approximately $39 million and $13 million in fiscal 2004 and 2005, respectively.
Based on our fiscal 2003 results of operations and current trends, and after giving effect to the net proceeds we received in our private placement of 4.75 percent convertible subordinated notes due 2007, our debt refinancing with Conexant, our common stock public offering and our Facility Agreement, we expect our existing sources of liquidity, together with cash expected to be generated from operations,SAB 108 will be sufficientmaterial to fund our research and development, capital expenditures, debt obligations, purchase obligations, working capital and other cash requirements for at least the next twelve months.
its financial statements.
OTHER MATTERSInflation did not have a significantmaterial impact upon our results of operations during the three-year period ended September 30, 2003.In July 2001, the Financial Accounting Standards Board (“FASB”) issued SFAS No. 142, “Goodwill and Other Intangibles.” SFAS No. 142 addresses financial accounting and reporting for acquired goodwill and other intangible assets. Goodwill and intangible assets that have indefinite useful lives are not amortized into results of operations, but instead are evaluated at least annually for impairment and written down when the recorded value exceeds the estimated fair value. We adopted SFAS No. 142 on October 1, 2002, and performed a transitional impairment test for goodwill. The goodwill impairment test is a two-step process. The first step of the impairment analysis compares our fair value to our net book value. In determining fair value, SFAS No. 142 allows for the use of several valuation methodologies, although it states quoted market prices are the best evidence of fair value. As part of the first step, we determined that we have one reporting unit for purposes of performing the fair-value based test of goodwill. This reporting unit is consistent with its single operating segment, which management determined is appropriate under the provisions of SFAS No. 131, “Disclosures about Segments of an Enterprise and Related Information.” We completed step one and determined that our goodwill and unamortized intangible assets were impaired. Step two of the analysis compares the implied fair value of goodwill to its carrying amount. If the carrying amount of goodwill exceeds its implied fair value, an impairment loss is recognized equal to that excess. We completed step two and determined that the carrying amount of our goodwill was $397.1 million greater than its implied fair value. This transitional impairment charge was recorded as a cumulative effect of a change in accounting principle in fiscal 2003. In addition, we completed our annual goodwill impairment test for fiscal 2003 and determined that as of July 1, 2003, our goodwill was not further impaired.
In June 2001, the FASB issued SFAS No. 143, “Accounting for Asset Retirement Obligations,” which addresses financial accounting and reporting for obligations associated with the retirement of tangible long-lived assets and the associated asset retirement costs. It requires that the fair value of a liability for an asset retirement obligation be recognized in the period in which it is incurred if a reasonable estimate of fair value can be made. We adopted the provisions or SFAS No. 143 on October 1, 2002 and its adoption did not have a material impact on our financial position or results of operations.
In August 2001, the FASB issued SFAS No. 144, “Accounting for the Impairment or Disposal of Long-Lived Assets,” which supersedes previous guidance on financial accounting and reporting for the impairment or disposal of long-lived assets and for segments of a business to be disposed of. We adopted SFAS No. 144 on October 1, 2002 and recorded asset impairment charges in accordance with its guidance during the fourth quarter of fiscal 2003. These charges primarily related to certain infrastructure products manufactured at our Woburn, Massachusetts and Adamstown, Maryland facilities.
In April 2002, the FASB issued SFAS No. 145, “Rescission of FASB Statement No.‘s 4, 44, and 64, Amendment of SFAS No. 13 and Technical Corrections,” effective for fiscal years beginning May 15, 2002 or later. It rescinds SFAS No. 4, “Reporting Gains and Losses From Extinguishments of Debt,” SFAS No. 64, “Extinguishments of Debt to Satisfy Sinking-Fund Requirements,” and SFAS No. 44, “Accounting for Intangible Assets of Motor Carriers.” This Statement also amends SFAS No. 13, “Accounting for Leases,” to eliminate an inconsistency between the required accounting for sale-leaseback transactions and the required accounting for certain lease modifications that have economic effects similar to sale-leaseback transactions. This Statement also amends other existing authoritative pronouncements to make various technical corrections, clarify meanings or describe their applicability under changed conditions. We adopted SFAS No. 145 on October 1, 2002 and its adoption did not have a material impact on our financial position or results of operations.
In June 2002, the FASB issued SFAS No. 146, “Accounting for Costs Associated With Exit or Disposal Activities.” SFAS No. 146 requires companies to recognize costs associated with exit or disposal activities when they are incurred rather than at the date of commitment to an exit or disposal plan. This Statement is effective for exit or disposal activities initiated after December 31, 2002. We adopted SFAS No. 146 on October 1, 2002 and its adoption did not have a material impact on our financial position or results of operations.
In November 2002, the FASB issued Interpretation No. 45, “Guarantor’s Accounting and Disclosure Requirements for Guarantees, Including Indirect Guarantees of Indebtedness of Others” (“FIN 45”). FIN 45 requires that upon issuance of a guarantee, a guarantor must recognize a liability for the fair value of an obligation assumed under a guarantee. FIN 45 also requires additional disclosures by a guarantor in its interim and annual financial statements about the obligations associated with guarantees issued. The recognition provisions of FIN 45 are effective for any guarantees that are issued or modified after December 31, 2002. We adopted FIN 45 on January 1, 2003 and its adoption did not have a material impact on our financial position or results of operations.
In December 2002, the FASB issued SFAS No. 148, “Accounting for Stock-Based Compensation – Transition and Disclosure.” SFAS No. 148 amends SFAS No. 123, “Accounting for Stock-Based Compensation,” to provide alternative methods of transition for a voluntary change to the fair value method of accounting for stock-based employee compensation. In addition, SFAS No. 148 amends the disclosure requirements of SFAS No. 123 to require prominent disclosures in both annual and interim financial statements about the method of accounting for stock-based employee compensation and the effect of the method on reported results. SFAS No. 148 is effective for financial statements for fiscal years and interim periods ending after December 15, 2002. The Company adopted the disclosure provisions of SFAS No. 148 on December 15, 2002 and continues to follow APB No. 25, “Accounting for Stock Issued to Employees,” in accounting for employee stock options.
In January 2003, the FASB issued Interpretation No. 46, “Consolidation of Variable Interest Entities” (“FIN 46”). FIN 46 clarifies situations in which entities shall be subject to consolidation. FIN 46 is effective for all variable interest entities created after January 31, 2003. We adopted FIN 46 on April 1, 2003 and its adoption did not have an impact on our financial position or results of operations.
29, 2006.CERTAIN BUSINESS RISKS
We operate in the highly cyclical wireless communications semiconductor industry, which is subject to significant downturns.
From time to time changes in general economic conditions, together with other factors, cause significant upturns and downturns in the industry. Periods of industry downturn, as we experienced beginning in calendar year 2001, have been characterized by diminished product demand, production overcapacity, high inventory levels and accelerated erosion of average selling prices. These characteristics, and in particular their impact on the level of demand for digital cellular handsets, may cause substantial fluctuations in our revenues and results of operations.
During the late 1990‘s and extending into 2000, the wireless communications semiconductor industry enjoyed unprecedented growth, benefiting from the rapid expansion of wireless communication services worldwide and increased demand for digital cellular handsets. However, beginning in calendar year 2001, we were adversely impacted by a global economic slowdown and an abrupt decline in demand for many of the end-user products that incorporate our products and system solutions, particularly cellular handsets. The impact of weakened end-customer demand was compounded by higher than normal levels of inventories among our original equipment manufacturer, or OEM, subcontractor and distributor customers. Should the reduced end-customer demand continue, this could result in underutilization of our manufacturing capacity, changes in revenue mix and other impacts that would continue to materially and adversely affect our operating results.
Because of the cyclical nature of the wireless communications semiconductor industry, we cannot assure you of the timing, duration or magnitude of any recovery in our industry or that a recovery will occur. We cannot assure you that the wireless communications semiconductor industry will not experience renewed, and possibly more severe and prolonged, downturns in the future, or that our operating results or financial condition will not be adversely affected by them. We have experienced these cyclical fluctuations in our business and may experience cyclical fluctuations in the future.
We have recently incurred substantial operating losses and may experience future losses.
Our operating results have been adversely affected by a global economic slowdown, concerns about inflation, decreased consumer confidence, reduced capital spending, adverse business conditions, and liquidity concerns in the telecommunications and related industries. These factors have lead to an to a slowdown in customer orders, an increase in the number of cancellations and reschedulings of backlog, higher overhead costs as a percentage of our reduced net revenue, and an abrupt decline in demand for many of the end-user products that incorporate wireless communications semiconductor products and system solutions. As a result, we continued to incur operating losses during fiscal 2003 and may experience operating losses in the future. Should the reduced end-customer demand continue for any reason, this could result in underutilization of our manufacturing capacity, reduced revenues or changes in our revenue mix, and other factors that could continue to materially and adversely affect our operating results in the near term. Due to these economic factors, we cannot assure you as to whether or when we will become profitable or whether we will be able to sustain such profitability, if achieved.
Additionally, the conflict in Iraq as well as other contemporary international conflicts, acts of terrorism and civil and military unrest have augmented the economic slowdown. These continuing and potentially escalating conflicts can be expected to place further pressure on economic conditions in the United States and worldwide. These conditions make it extremely difficult for our customers, our vendors and for us to accurately forecast and plan future business activities. If such conditions continue or worsen, our business, financial condition and results of operations will likely be materially and adversely affected.
The wireless semiconductor markets are characterized by intense competition.
The wireless communications semiconductor industry in general and the markets in which we compete in particular are intensely competitive. We compete with U.S. and international semiconductor manufacturers of all sizes in terms of resources and market share. We currently face significant competition in our markets and expect that intense price and product competition will continue. This competition has resulted in, and is expected to continue to result in, declining average selling prices for our products and increased challenges in maintaining or increasing market share. Furthermore, additional competitors may enter our markets as a result of growth opportunities in communications electronics, the trend toward global expansion by foreign and domestic competitors and technological and public policy changes. We believe that the principal competitive factors for semiconductor suppliers in our markets include, among others:
• time-to-market;
• timely new product innovation;
• product quality, reliability and performance;
• product price;
• features available in products;
• compliance with industry standards;
• strategic relationships with customers; and
• access to and protection of intellectual property.
We cannot assure you that we will be able to successfully address these factors. Many of our competitors enjoy the benefit of:
• long presence in key markets;
• name recognition;
• high levels of customer satisfaction;
• ownership or control of key technology or intellectual property; and
• strong financial, sales and marketing, manufacturing, distribution, technical or other resources.
As a result, certain competitors may be able to adapt more quickly than we can to new or emerging technologies and changes in customer requirements or may be able to devote greater resources to the development, promotion and sale of their products than we can.
Current and potential competitors have established or may in the future establish financial or strategic relationships among themselves or with customers, resellers or other third parties. These relationships may affect customers’ purchasing decisions. Accordingly, it is possible that new competitors or alliances among competitors could emerge and rapidly acquire significant market share. We cannot assure you that we will be able to compete successfully against current and potential competitors. Increased competition could result in pricing pressures, decreased gross margins and loss of market share and may materially and adversely affect our business, financial condition and results of operations.
Our success depends upon our ability to develop new products and reduce costs in a timely manner.
The wireless communications semiconductor industry is highly cyclical and characterized by constant and rapid technological change, rapid product evolution, price erosion, evolving technical standards, short product life cycles, increasing demand for higher levels of integration and increased miniaturization, and wide fluctuations in product supply and demand. In particular, the markets into which we sell demand cutting-edge technologies and new and innovative products. Our operating results depend largely on our ability to continue to introduce new and enhanced products on a timely basis. The development and commercialization of semiconductor devices, modules and system solutions is highly complex. Successful product development and introduction depends on numerous factors, including:
• the ability to anticipate customer and market requirements and changes in technology and industry standards;
• the ability to obtain capacity sufficient to meet customer demand;
• the ability to define new products that meet customer and market requirements;
• the ability to complete development of new products and bring products to market on a timely basis;
• the ability to differentiate our products from offerings of our competitors;
• overall market acceptance of our products; and
• the ability to obtain adequate intellectual property protection for our new products.
We cannot assure you that we will have sufficient resources to make the substantial investment in research and development needed to develop and bring to market new and enhanced products in a timely manner. We will be required to continually evaluate expenditures for planned product development and to choose among alternative technologies based on our expectations of future market growth. We cannot assure you that we will be able to develop and introduce new or enhanced wireless communications semiconductor products in a timely and cost-effective manner, that our products will satisfy customer requirements or achieve market acceptance or that we will be able to anticipate new industry standards and technological changes. We also cannot assure you that we will be able to respond successfully to new product announcements and introductions by competitors or to changes in the design or specifications of complementary products of third parties to which our products interface.
In addition, prices of products may decline, sometimes significantly, over time. We believe that to remain competitive we must continue to reduce the cost of producing and delivering existing products at the same time that we develop and introduce new or enhanced products. We cannot assure you that we will be able to continue to reduce the cost of our products to remain competitive.
The markets into which we sell our products are characterized by rapid technological change.
The demand for our products can change quickly and in ways we may not anticipate. Our markets generally exhibit the following characteristics:
• rapid technological developments and product evolution;
• rapid changes in customer requirements;
• frequent new product introductions and enhancements;
• demand for higher levels of integration, decreased size and decreased power consumption;
• short product life cycles with declining prices over the life cycle of the product; and
• evolving industry standards.
These changes in our markets may contribute to the obsolescence of our products. Our products could become obsolete or less competitive sooner than anticipated because of a faster than anticipated change in one or more of the above-noted factors.
The ability to attract and retain qualified personnel to contribute to the design, development, manufacture and sale of our products is critical to our success.
As the source of our technological and product innovations, our key technical personnel represent a significant asset. Our success depends on our ability to continue to attract, retain and motivate qualified personnel, including executive officers and other key management and technical personnel. The competition for management and technical personnel is intense in the semiconductor industry, and we therefore cannot assure you that we will be able to attract and retain qualified management and other personnel necessary for the design, development, manufacture and sale of our products. We may have particular difficulty attracting and retaining key personnel during periods of poor operating performance, given, among other things, the use of equity-based compensation by us and our competitors. The loss of the services of one or more of our key employees or our inability to attract, retain and motivate qualified personnel, could have a material adverse effect on our ability to operate our business.
If OEMs and ODMs of communications electronics products do not design our products into their equipment, we will havedifficulty selling those products. Moreover, a “design win” from a customer does not guarantee future sales to that customer
Our products will not be sold directly to the end-user but will be components or subsystems of other products. As a result, we will rely on OEMs and ODMs of wireless communications electronics products to select our products from among alternative offerings to be designed into their equipment. Without these “design wins,” we would have difficulty selling our products. If a manufacturer designs another supplier’s product into one of its product platforms, it is more difficult for us to achieve future design wins with that platform because changing suppliers involves significant cost, time, effort and risk on the part of that manufacturer. Also, achieving a design win with a customer does not ensure that we will receive significant revenues from that customer. Even after a design win, the customer is not obligated to purchase our products and can choose at any time to reduce or cease use of our products, for example, if its own products are not commercially successful, or for any other reason. We cannot assure you that we will continue to achieve design wins or to convert design wins into actual sales.
Lengthy product development and sales cycles associated with many of our products may result in significant expenditures before generating any revenues related to those products.
After our product is has been developed, tested, and manufactured, our customers may need three to six months or longer to integrate, test and evaluate our products and an additional three to six months or more to begin volume production of equipment incorporates the products. This lengthy cycle time increases the possibility that a customer may decide to cancel or change product plans, which could reduce or eliminate our sales to that customer. As a result of this lengthy sales cycle, we may incur significant research and development expenses, and selling, general and administrative expenses, before we generate the related revenues for these products. Furthermore, we may never generate the anticipated revenues from a product after incurring such expenses if our customer cancels or changes its product plans.
Uncertainties involving the ordering and shipment of our products could adversely affect our business.
Our sales will typically be made pursuant to individual purchase orders and not under long-term supply arrangements with our customers. Our customers may cancel orders before shipment. Additionally, we will sell a portion of our products through distributors, some of whom will have rights to return unsold products. We may purchase and manufacture inventory based on estimates of customer demand for our products, which is difficult to predict. This difficulty may be compounded when we sell to OEMs indirectly through distributors or contract manufacturers, or both, as our forecasts of demand will then be based on estimates provided by multiple parties. In addition, our customers may change their inventory practices on short notice for any reason. The cancellation or deferral of product orders, the return of previously sold products, or overproduction due to a change in anticipated order volumes, could result in us holding excess or obsolete inventory, which could result in inventory write-downs and, in turn, could have a material adverse effect on our financial condition.
Our reliance on a small number of customers for a large portion of our sales could have a material adverse effect on the results of our operations.
A significant portion of our sales are concentrated among a limited number of customers. If we lost one or more of these major customers, or if one or more major customers significantly decreased its orders of our products, our business would be materially and adversely affected. Sales to Samsung Electronics Co. and to Motorola, Inc. represented approximately 15% and 11%, respectively, of net revenues for fiscal 2003. Our future operating results will depend on the success of these customers and other customers and our success in selling products to them.
Average product life cycles in the semiconductor industry tend to be very short.
In the semiconductor industry, product life cycles tend to be short relative to the sales and development cycles. Therefore, the resources devoted to product sales and marketing may not result in material revenue, and from time to time we may need to write off excess or obsolete inventory. If we were to incur significant marketing expenses and investments in inventory that we are not able to recover, and we are not able to compensate for those expenses, our operating results would be materially and adversely affected. In addition, if we sell our products at reduced prices in anticipation of cost reductions but still hold higher cost products in inventory, our operating results would be harmed.
Our leverage and our debt service obligations may adversely affect our cash flow.
On September 30, 2003, after giving effect to unused availability under our receivable financing credit facility with Wachovia Bank, National Association, we would have had total indebtedness of approximately $325 million, which would have represented approximately 34% of our total capitalization.
As long as our 4.75 percent convertible subordinated notes remain outstanding, we will have debt service obligations on such notes of approximately $10,925,000 per year in interest payments. In addition, we will have debt service obligations on our 15 percent convertible senior subordinated notes due June 30, 2005, originally issued to Conexant, of approximately $6,750,000 per year. If we issue other debt securities in the future, our debt service obligations will increase. If we are unable to generate sufficient cash to meet these obligations and must instead use our existing cash or investments, we may have to reduce or curtail other activities of our business.
We intend to fulfill our debt service obligations from cash generated by our operations, if any, and from our existing cash and investments. If necessary, among other alternatives, we may add lease lines of credit to finance capital expenditures and we may obtain other long-term debt, lines of credit and other financing.
Our indebtedness could have significant negative consequences, including:
• increasing our vulnerability to general adverse economic and industry conditions;
• limiting our ability to obtain additional financing;
• requiring the dedication of a substantial portion of any cash flow from operations to service our indebtedness, thereby reducing the amount of cash flow available for other purposes, including capital expenditures;
• limiting our flexibility in planning for, or reacting to, changes in our business and the industry in which we compete; and
• placing us at a possible competitive disadvantage to less leveraged competitors and competitors that have better access to capital resources.
Despite our current debt levels, we are able to incur substantially more debt, which would increase the risks described above.
We face a risk that capital needed for our business will not be available when we need it.
We will need to obtain sources of financing in the future. After giving effect to the net proceeds of our $102 million offering on or about September 12, 2003, our $230 million private placement of 4.75 percent convertible subordinated notes due 2007, our $45 million debt refinancing with Conexant and our receivables financing credit facility with Wachovia Bank, National Association, we believe that our existing sources of liquidity, together with cash expected to be generated from operations, will be sufficient to fund our research and development, capital expenditure, working capital and other financing requirements for at least the next twelve months.
However, we cannot assure you that the capital required to fund these expenses will be available in the future. Conditions existing in the U.S. capital markets when we seek financing as well as the then current condition of the Company will affect our ability to raise capital, as well as the terms of any financing. We may not be able to raise enough capital to meet our capital needs on a timely basis or at all. Failure to obtain capital when required would have a material adverse effect on the Company.
In addition, any strategic investments and acquisitions that we may make to help us grow our business may require additional capital resources. We cannot assure you that the capital required to fund these investments and acquisitions will be available in the future.
Our manufacturing processes are extremely complex and specialized.
Our manufacturing operations are complex and subject to disruption, including for causes beyond our control. The fabrication of integrated circuits is an extremely complex and precise process consisting of hundreds of separate steps. It requires production in a highly controlled, clean environment. Minor impurities, contamination of the clean room environment, errors in any step of the fabrication process, defects in the masks used to print circuits on a wafer, defects in equipment or materials, human error, or a number of other factors can cause a substantial percentage of wafers to be rejected or numerous die on each wafer to malfunction. Because our operating results are highly dependent upon our ability to produce integrated circuits at acceptable manufacturing yields, these factors present could have a material adverse affect on our business. In addition, we may discover from time to time defects in our products after they have been shipped, which may require us to replace such products.
Additionally, our operations may be affected by lengthy or recurring disruptions of operations at any of our production facilities or those of our subcontractors. These disruptions may include electrical power outages, fire, earthquake, flooding, war, acts of terrorism, or other natural or man-made disasters. Disruptions of our manufacturing operations could cause significant delays in shipments until we are able to shift the products from an affected facility or subcontractor to another facility or subcontractor. In the event of such delays, we cannot assure you that the required alternative capacity, particularly wafer production capacity, would be available on a timely basis or at all. Even if alternative wafer production or assembly and test capacity is available, we may not be able to obtain it on favorable terms, which could result in higher costs and/or a loss of customers. We may be unable to obtain sufficient manufacturing capacity to meet demand, either at our own facilities or through external manufacturing or similar arrangements with others.
Due to the highly specialized nature of the gallium arsenide integrated circuit manufacturing process, in the event of a disruption at the Newbury Park, California or Woburn, Massachusetts semiconductor wafer fabrication facilities, alternative gallium arsenide production capacity would not be immediately available from third-party sources. These disruptions could have a material adverse effect on our business, financial condition and results of operations.
We may not be able to maintain and improve manufacturing yields that contribute positively to our gross margin and profitability.
Minor deviations or perturbations in the manufacturing process can cause substantial manufacturing yield loss, and in some cases, cause production to be suspended. Manufacturing yields for new products initially tend to be lower as we complete product development and commence volume manufacturing, and typically increase as we bring the product to full production. Our forward product pricing includes this assumption of improving manufacturing yields and, as a result, material variances between projected and actual manufacturing yields will have a direct effect on our gross margin and profitability. The difficulty of accurately forecasting manufacturing yields and maintaining cost competitiveness through improving manufacturing yields will continue to be magnified by the increasing process complexity of manufacturing semiconductor products. Our manufacturing operations will also face pressures arising from the compression of product life cycles, which will require us to manufacture new products faster and for shorter periods while maintaining acceptable manufacturing yields and quality without, in many cases, reaching the longer-term, high-volume manufacturing conducive to higher manufacturing yields and declining costs.
We are dependent upon third parties for the manufacture, assembly and test of our products.
We rely upon independent wafer fabrication facilities, called foundries, to provide silicon-based products and to supplement our gallium arsenide wafer manufacturing capacity. We also utilize subcontractors to package, assemble and test our products. There are significant risks associated with reliance on third-party foundries, including:
• the lack of ensured wafer supply, potential wafer shortages and higher wafer prices;
• limited control over delivery schedules, manufacturing yields, production costs and quality assurance; and
• the inaccessibility of, or delays in obtaining access to, key process technologies.
Although we have long-term supply arrangements to obtain additional external manufacturing capacity, the third-party foundries we use may allocate their limited capacity to the production requirements of other customers. If we choose to use a new foundry, it will typically take an extended period of time to complete the qualification process before we can begin shipping products from the new foundry. The foundries may experience financial difficulties, be unable to deliver products to us in a timely manner or suffer damage or destruction to their facilities, particularly since some of them are located in earthquake zones. If any disruption of manufacturing capacity occurs, we may not have alternative manufacturing sources immediately available. We may therefore experience difficulties or delays in securing an adequate supply of our products, which could impair our ability to meet our customers’ needs and have a material adverse effect on our operating results.
We are dependent upon third parties for the supply of raw materials and components.
Our manufacturing operations depend on obtaining adequate supplies of raw materials and the components used in our manufacturing processes. We believe we have adequate sources for the supply of raw materials and components for our manufacturing needs with suppliers located around the world. While we do not typically rely on a single source of supply for our raw materials, we are currently dependent on a sole-source supplier for epitaxial wafers used in the gallium arsenide semiconductor manufacturing processes at our manufacturing facilities. We cannot assure you that we will not lose a significant or sole supplier or that a supplier will be able to meet performance and quality specifications or delivery schedules. If we lost a supplier or a supplier were unable to meet performance or quality specifications or delivery schedules, our ability to satisfy customer obligations could be materially and adversely affected. In addition, we review our relationships with suppliers of raw materials and components for our manufacturing needs on an ongoing basis. In connection with our ongoing review, we may modify or terminate our relationship with one or more suppliers. We may also enter into other sole supplier arrangements to meet certain of our raw material or component needs. If we were to enter into an additional sole supplier arrangement for any of our raw materials or components, the risks associated with our supply arrangements would be exacerbated.
Under supply agreements entered into with Conexant and Jazz Semiconductor, Inc. we receive wafer fabrication, wafer probe and certain other services from Jazz Semiconductor. Pursuant to these supply agreements, we are committed to obtaining certain minimum wafer volumes from Jazz Semiconductor. Our expected minimum purchase obligations under these supply agreements are anticipated to be approximately $39 million and $13 million, respectively, in fiscal 2004 and 2005.
Remaining competitive in the semiconductor industry requires transitioning to smaller geometry process technologies and achieving higher levels of design integration.
In order to remain competitive, we expect to continue to transition our semiconductor products to increasingly smaller line width geometries. This transition requires us to modify the manufacturing processes for our products, design new products to more stringent standards, and to redesign some existing products. In the past, we have experienced some difficulties migrating to smaller geometry process technologies or new manufacturing processes, which resulted in sub-optimal manufacturing yields, delays in product deliveries and increased expenses. We may face similar difficulties, delays and expenses as we continue to transition our products to smaller geometry processes in the future. In some instances, we depend on our relationships with our foundries to transition to smaller geometry processes successfully. We cannot assure you that our foundries will be able to effectively manage the transition or that we will be able to maintain our foundry relationships. If our foundries or we experience significant delays in this transition or fail to efficiently implement this transition, our business, financial condition and results of operations could be materially and adversely affected. As smaller geometry processes become more prevalent, we expect to continue to integrate greater levels of functionality, as well as customer and third party intellectual property, into our products. However, we may not be able to achieve higher levels of design integration or deliver new integrated products on a timely basis, or at all.
We are subject to the risks of doing business internationally.
Historically, a substantial majority of the Company’s net revenues from customers other than Conexant were derived from customers located outside the United States, primarily countries located in the Asia-Pacific region and Europe. In addition, we have design centers and suppliers located outside the United States, and third-party packaging, assembly and test facilities and foundries located in the Asia-Pacific region. Finally, we have our own packaging, assembly and test facility in Mexicali, Mexico. Our international sales and operations are subject to a number of risks inherent in selling and operating abroad. These include, but are not limited to, risks regarding:
• currency exchange rate fluctuations;
• local economic and political conditions, including social, economic and political instability;
• disruptions of capital and trading markets;
• restrictive governmental actions (such as restrictions on transfer of funds and trade protection measures, including export duties, quotas, customs duties, import or export controls and tariffs);
• changes in legal or regulatory requirements;
• natural disasters, acts of terrorism, widespread illness and war;
• limitations on the repatriation of funds;
• difficulty in obtaining distribution and support;
• cultural differences in the conduct of business;
• the laws and policies of the United States and other countries affecting trade, foreign investment and loans, and import or export
• licensing requirements;
• tax laws;
• the possibility of being exposed to legal proceedings in a foreign jurisdiction; and
• limitations on our ability under local laws to protect or enforce our intellectual property rights in a particular foreign jurisdiction.
Additionally, we are subject to risks in certain global markets in which wireless operators provide subsidies on handset sales to their customers. Increases in handset prices that negatively impact handset sales can result from changes in regulatory policies or other factors, which could impact the demand for our products. Limitations or changes in policy on phone subsidies in South Korea, Japan, China and other countries may have additional negative impacts on our revenues.
Our operating results may be adversely affected by substantial quarterly and annual fluctuations and market downturns.
Our revenues, earnings and other operating results have fluctuated in the past and our revenues, earnings and other operating results may fluctuate in the future. These fluctuations are due to a number of factors, many of which are beyond our control.
These factors include, among others:
• changes in end-user demand for the products (principally digital cellular handsets) manufactured and sold by our customers;
• the effects of competitive pricing pressures, including decreases in average selling prices of our products;
• production capacity levels and fluctuations in manufacturing yields;
• availability and cost of products from our suppliers;
• the gain or loss of significant customers;
• our ability to develop, introduce and market new products and technologies on a timely basis;
• new product and technology introductions by competitors;
• changes in the mix of products produced and sold;
• market acceptance of our products and our customers;
• intellectual property disputes;
The foregoing factors are difficult to forecast, and these, as well as other factors, could materially and adversely affect our quarterly or annual operating results. If our operating results fail to meet the expectations of analysts or investors, it could materially and adversely affect the price of our common stock.
Global economic conditions that impact the wireless communications industry could negatively affect our revenues and operating results.
Global economic weakness can have wide-ranging effects on markets that we serve, particularly wireless communications equipment manufacturers and network operators. The wireless communications industry appears to be recovering from an industry-wide recession. We cannot predict whether a recovery will continue, the rate of any such recovery, or what effects negative events, such as war, may have on the economy or the wireless communications industry. The continued threat of terrorism and heightened security and military action in response to this threat, or any future acts of terrorism, may cause further disruptions to the global economy and to the wireless communications industry and create further uncertainties. Further, an economic recovery may not benefit us in the near term. If it does not, our ability to increase or maintain our revenues and operating results may be impaired.
Our gallium arsenide semiconductors may cease to be competitive with silicon alternatives.
Among our product portfolio, we manufacture and sell gallium arsenide semiconductor devices and components, principally power amplifiers and switches. The production of gallium arsenide integrated circuits is more costly than the production of silicon circuits. The cost differential is due to higher costs of raw materials for gallium arsenide and higher unit costs associated with smaller sized wafers and lower production volumes. Therefore, to remain competitive we must offer gallium arsenide products that provide superior performance over their silicon-based counterparts. If we do not continue to offer products that provide sufficiently superior performance to justify the cost differential, our operating results may be materially and adversely affected. We expect the costs of producing gallium arsenide devices will continue to exceed the costs of producing their silicon counterparts. Silicon semiconductor technologies are widely-used process technologies for certain integrated circuits and these technologies continue to improve in performance. We cannot assure you that we will continue to identify products and markets that require performance attributes of gallium arsenide solutions.
We may be subject to claims of infringement of third-party intellectual property rights, or demands that we license third-party technology, which could result in significant expense and prevent us from using our technology.
The semiconductor industry is characterized by vigorous protection and pursuit of intellectual property rights. From time to time, third parties have asserted and may in the future assert patent, copyright, trademark and other intellectual property rights to technologies that are important to our business and have demanded and may in the future demand that we license their technology or refrain from using it. At the present time, we are in discussions with Qualcomm Incorporated regarding claims each of us have filed and served against the other asserting violations of certain of our respective intellectual property rights. The purpose of these discussions is to arrive at a business resolution that avoids protracted litigation for both parties. We believe their claims are without merit and if we are not successful resolving this matter outside of litigation, we are prepared to vigorously defend against their claims and fully prosecute our claims against them.
Any litigation to determine the validity of claims that our products infringe or may infringe intellectual property rights of another, including claims arising from our contractual indemnification of our customers, regardless of their merit or resolution, could be costly and divert the efforts and attention of our management and technical personnel. Regardless of the merits of any specific claim, we cannot assure you that we would prevail in litigation because of the complex technical issues and inherent uncertainties in intellectual property litigation. If litigation were to result in an adverse ruling, we could be required to:
• pay substantial damages;
• cease the manufacture, import, use, sale or offer for sale of infringing products or processes;
• discontinue the use of infringing technology;
• expend significant resources to develop non-infringing technology; and
• license technology from the third party claiming infringement, which license may not be available on commercially reasonable terms.
We cannot assure you that our operating results or financial condition will not be adversely affected if we were required to do any one or more of the foregoing items.
Many of our products incorporate technology licensed or acquired from third parties.
We sell products in markets that are characterized by rapid technological changes, evolving industry standards, frequent new product introductions, short product life cycles and increasing levels of integration. Our ability to keep pace with this market depends on our ability to obtain technology from third parties on commercially reasonable terms to allow our products to remain in a competitive posture. If licenses to such technology are not available on commercially reasonable terms and conditions, and we cannot otherwise integrate such technology, our products or our customers’ products could become unmarketable or obsolete, and we could lose market share. In such instances, we could also incur substantial unanticipated costs or scheduling delays to develop substitute technology to deliver competitive products.
If we are not successful in protecting our intellectual property rights, it may harm our ability to compete.
We rely on patent, copyright, trademark, trade secret and other intellectual property laws, as well as nondisclosure and confidentiality agreements and other methods, to protect our proprietary technologies, information, data, devices, algorithms and processes. In addition, we often incorporate the intellectual property of our customers, suppliers or other third parties into our designs, and we have obligations with respect to the non-use and non-disclosure of such third-party intellectual property. In the future, it may be necessary to engage in litigation or like activities to enforce our intellectual property rights, to protect our trade secrets or to determine the validity and scope of proprietary rights of others, including our customers. This could require us to expend significant resources and to divert the efforts and attention of our management and technical personnel from our business operations. We cannot assure you that:
ITEM 7A. • the steps we take to prevent misappropriation, infringement, dilution or other violation of our intellectual property or the intellectual property of our customers, suppliers or other third parties will be successful;
• any existing or future patents, copyrights, trademarks, trade secrets or other intellectual property rights or ours will not be challenged, invalidated or circumvented; or
• any of the measures described above would provide meaningful protection.QUANTITATIVE AND QUALITATIVE DISCLOSURES ABOUT MARKET RISK.
Despite these precautions, it may be possible for a third party to copy or otherwise obtain and use our technology without authorization, develop similar technology independently or design around our patents. If any of our intellectual property protection mechanisms fails to protect our technology, it would make it easier for our competitors to offer similar products, potentially resulting in loss of market share and price erosion. In addition, effective patent, copyright, trademark and trade secret protection may be unavailable or limited for certain technologies and in certain foreign countries.
Our success depends, in part, on our ability to effect suitable investments, alliances and acquisitions, and to integrate companies we acquire, and on our continued success integrating the wireless business of Conexant with the Company.
Although we intend to invest significant resources in internal research and development activities, the complexity and rapidity of technological changes and the significant expense of internal research and development make it impractical for us to pursue development of all technological solutions on our own. On an ongoing basis, we intend to review investment, alliance and acquisition prospects that would complement our product offerings, augment our market coverage or enhance our technological capabilities. However, we cannot assure you that we will be able to identify and consummate suitable investment, alliance or acquisition transactions in the future. Moreover, if we consummate such transactions, they could result in:
• issuances of equity securities dilutive to our stockholders; • large one-time write-offs;
• the incurrence of substantial debt and assumption of unknown liabilities;
• the potential loss of key employees from the acquired company;
• amortization expenses related to intangible assets; and
• the diversion of management’s attention from other business concerns.
Moreover, integrating acquired organizations and their products and services may be difficult, expensive, time-consuming and a strain on our resources and our relationship with employees and customers and ultimately may not be successful. Additionally, in periods following an acquisition, we will be required to evaluate goodwill and acquisition-related intangible assets for impairment. When such assets are found to be impaired, they will be written down to estimated fair value, with a charge against earnings. For instance, we recorded a cumulative effect of a change in accounting principle in fiscal 2003 in the amount of $397.1 million as a result of the goodwill obtained in connection with the Merger.
We may be responsible for payment of a substantial amount of U.S. federal income and other taxes upon certain events.
In connection with Conexant’s spin-off of its wireless business prior to the Merger, Conexant sought and received a ruling from the Internal Revenue Service to the effect that certain transactions related to and including the spin-off qualified as a reorganization and as tax-free for U.S. federal income tax purposes. While the tax ruling generally is binding on the Internal Revenue Service, the continuing validity of the ruling is subject to certain factual representations and assumptions. In connection with the Merger we entered into a tax allocation agreement with Conexant that generally provides, among other things, that we will be responsible for certain taxes imposed on various persons (including Conexant) as a result of either:
• the failure of certain spin-off transactions to qualify as a reorganization for U.S. federal income tax purposes, or
• the failure of certain spin-off transactions to qualify as tax-free to Conexant for certain U.S. federal income tax purposes,
if such failure is attributable to certain actions or transactions by or in respect of Skyworks (including our subsidiaries) or our stockholders, such as the acquisition of stock of Skyworks by a third party at a time and in a manner that would cause such failure. In addition, the tax allocation agreement provides that we will be responsible for various other tax obligations and for compliance with various representations, statements, and conditions made in the course of obtaining the tax ruling referenced above and in connection with the tax allocation agreement. Our obligations under the tax allocation agreement have been limited by a letter agreement dated November 6, 2002 entered into in connection with our debt refinancing with Conexant. Nevertheless, if we do not carefully monitor our compliance with the requirements imposed as a result of the spin-off and related transactions and our responsibilities under the tax allocation agreement, we might inadvertently trigger an obligation to indemnify certain persons (including Conexant) pursuant to the tax allocation agreement or other obligations under such agreement. In addition, our indemnity obligations could discourage or prevent a third party from making a proposal to acquire Skyworks.
If we were required to pay any of the taxes described above, the payment could be very substantial and have a material adverse effect on our business, financial condition, results of operations and cash flow.
In addition, it is expected that the interest payments we are required to make on our $45 million principal amount of 15% convertible subordinated notes due June 30, 2005 originally issued to Conexant will not be deductible for tax purposes. Our inability to offset our interest expense from these notes against other income may increase our tax liability currently and in future years.
Further, the terms of these senior subordinated notes require us to pay the principal due at the maturity date or upon certain acceleration events in a number of shares of our common stock equal to the principal due at such time divided by the applicable conversion price on such date. If the fair market value of our common stock on such date is less than the applicable conversion price, we may recognize cancellation of indebtedness income for tax purposes equal to the excess of the principal amount of these notes due at such time over the fair market value of the common stock issued by us to satisfy our obligations under these notes.
Certain provisions in our organizational documents and Delaware law may make it difficult for someone to acquire control of us.
We have certain anti-takeover measures that may affect our common stock. Our certificate of incorporation, our by-laws and the Delaware General Corporation Law contain several provisions that would make more difficult an acquisition of control of us in a transaction not approved by our board of directors. Our certificate of incorporation and by-laws include provisions such as:
• the division of our board of directors into three classes to be elected on a staggered basis, one class each year;
• the ability of our board of directors to issue shares of preferred stock in one or more series without further authorization of stockholders;
• a prohibition on stockholder action by written consent;
• elimination of the right of stockholders to call a special meeting of stockholders;
• a requirement that stockholders provide advance notice of any stockholder nominations of directors or any proposal of new business to be considered at any meeting of stockholders;
• a requirement that the affirmative vote of at least 66 2/3 percent of our shares be obtained to amend or repeal any provision of our by-laws or the provision of our certificate of incorporation relating to amendments to our by-laws;
• a requirement that the affirmative vote of at least 80 percent of our shares be obtained to amend or repeal the provisions of our certificate of incorporation relating to the election and removal of directors, the classified board or the right to act by written consent;
• a requirement that the affirmative vote of at least 80 percent of our shares be obtained for business combinations unless approved by a majority of the members of the board of directors and, in the event that the other party to the business combination is the beneficial owner of 5 percent or more of our shares, a majority of the members of board of directors in office prior to the time such other party became the beneficial owner of 5 percent or more of our shares;
• a fair price provision; and
• a requirement that the affirmative vote of at least 90 percent of our shares be obtained to amend or repeal the fair price provision.
In addition to the provisions in our certificate of incorporation and by-laws, Section 203 of the Delaware General
Corporation Law generally provides that a corporation shall not engage in any business combination with any interested stockholder during the three-year period following the time that such stockholder becomes an interested stockholder, unless a majority of the directors then in office approves either the business combination or the transaction that results in the stockholder becoming an interested stockholder or specified stockholder approval requirements are met.
We may be liable for penalties under environmental laws, rules and regulations, which could adversely impact our business.
We have used, and will continue to use, a variety of chemicals and compounds in manufacturing operations and have been and will continue to be subject to a wide range of environmental protection regulations in the United States. While we have not experienced any material adverse effect on our operations as a result of such regulations, we cannot assure you that current or future regulations would not have a material adverse effect on our business, financial condition and results of operations. Environmental regulations often require parties to fund remedial action regardless of fault. Consequently, it is often difficult to estimate the future impact of environmental matters, including potential liabilities. We cannot assure you that the amount of expense and capital expenditures that might be required to satisfy environmental liabilities, to complete remedial actions and to continue to comply with applicable environmental laws will not have a material adverse effect on our business, financial condition and results of operations.
Our stock price has been volatile and may fluctuate in the future. Accordingly, you might not be able to sell your shares of common stock at or above the price you paid for them.
The trading price of our common stock has and may continue to fluctuate significantly. Such fluctuations may be influenced by many factors, including:
• our performance and prospects;
• the performance and prospects of our major customers;
• the depth and liquidity of the market for our common stock;
• investor perception of us and the industry in which we operate;
• changes in earnings estimates or buy/sell recommendations by analysts;
• general financial and other market conditions; and
• domestic and international economic conditions.
Public stock markets have experienced, and are currently experiencing, extreme price and trading volume volatility, particularly in the technology sectors of the market. This volatility has significantly affected the market prices of securities of many technology companies for reasons frequently unrelated to or disproportionately impacted by the operating performance of these companies. These broad market fluctuations may materially and adversely affect the market price of our common stock.
In addition, fluctuations in our stock price and our price-to-earnings multiple may have made our stock attractive to momentum, hedge or day-trading investors who often shift funds into and out of stocks rapidly, exacerbating price fluctuations in either direction, particularly when viewed on a quarterly basis.
ITEM 7A. QUANTITATIVE AND QUALITATIVE DISCLOSURES ABOUT MARKET RISK
We are subject to market risks, such as changes in currency and interest rates that arise from normal business operation. Our financial instruments include cash and cash equivalents, short-term investments, short-term debt and long-term debt. Our main investment objective is the preservation of investment capital. Consequently, we invest48
with only high-credit-quality issuers and we limit the amount of our credit exposure to any one issuer. We do not use derivative instruments for speculative or investment purposes.Our cash and cash equivalents are not subject to significant interest rate risk due to the short maturities of these instruments. As of September 30, 2003,29, 2006, the carrying value of our cash and cash equivalents approximates fair value.Our short-term debt primarily consists of borrowings under our receivables purchase agreement.credit facility with Wachovia Bank, N.A. As of September 30, 2003,29, 2006, we had borrowed $41.7borrowings of $50.0 million outstanding under this agreement. In addition, our short-term debt includes the remaining portion of a ten-year $960,000 loan from the State of Maryland under the Community Development Block Grant program due December 2003 at an interest rate of 5 percent.credit facility. Interest related to our short-term debt is at a fixed rate.LIBOR plus 0.4% and was approximately 5.7% at September 29, 2006. Consequently, we do not have significant cash flow exposure on our short-term debt.We issued fixed-rate debt, which is convertible into our common stock at a predetermined or market related conversion price. Convertible debt has characteristics that give rise to both interest-rate risk and market risk because the fair value of the convertible security is affected by both the current interest-rate environment and the price of the underlying common stock. For the year ended September 30, 200329, 2006, our convertible debt, on an if-converted basis, was not dilutive and, as a result, had no impact on our net income (loss) per share (assuming dilution). In future periods, the debt may be converted, or the if-converted method may be dilutive and net income per share (assuming dilution) would be reduced. Our long-term debt consists of $230$179.3 million of 4.75 percent4.75% unsecured convertible subordinated notes due November 2007 and $45 million of 15 percent unsecured convertible senior subordinated notes due June 2005.2007. We do not believe that we have significant cash flow exposure on our long-term debt.Based on our overall evaluation of our market risk exposures from all of our financial instruments at September 30, 200329, 2006, a near-term change in marketinterest rates would not materially affect our consolidated financial position, results of operations or cash flows.Our exposure to fluctuations in foreign currency exchange rates is primarily the result of foreign subsidiaries domiciled in various foreign countries. We do not currently use financial derivative instruments to hedge foreign currency exchange rate risks associated with our foreign subsidiaries. We estimate that we do not have any significant foreign exchange rate fluctuation risk.49
ITEM 8. FINANCIAL STATEMENTS AND SUPPLEMENTARY DATA.
The following consolidated financial statements of the Company for the fiscal year ended September 30, 200329, 2006 are included herewith:
(1)Independent Auditors' ReportsPages 45 through 46 (2) Page 4751 (3) Page 4852 (4) Page 4953 (5) Page 5054 (6)Page 55Pages 56 Pages 51 through 7580
50
The Board of Directors and Stockholders
Skyworks Solutions, Inc.:We have audited the accompanying consolidated balance sheets of Skyworks Solutions, Inc. and subsidiaries (the “Company”) as of September 29, 2006 and September 30, 2003 and 20022005, and the related consolidated statements of operations, stockholders’ equity and comprehensive income (loss), and cash flows for each of the years then ended.in the three-year period ended September 29, 2006. Our audits also included the financial statement schedule listed in the Index at Item 15 for the years ended September 29, 2006, September 30, 20032005 and 2002.October 1, 2004. These consolidated financial statements and financial statement schedule are the responsibility of the Company’s management. Our responsibility is to express an opinion on these consolidated financial statements and financial statement schedule based on our audit.audits.
We conducted our auditaudits in accordance with auditingthe standards generally accepted inof the United States of America.Public Company Accounting Oversight Board (United States). Those standards require that we plan and perform the audit to obtain reasonable assurance about whether the financial statements are free of material misstatement. An audit includes examining, on a test basis, evidence supporting the amounts and disclosures in the financial statements. An audit also includes assessing the accounting principles used and significant estimates made by management, as well as evaluating the overall financial statement presentation. We believe that our audits provide a reasonable basis for our opinion.In our opinion, the consolidated financial statements referred to above present fairly, in all material respects, the financial position of Skyworks Solutions, Inc. and subsidiaries as of September 29, 2006 and September 30, 2003 and 2002,2005, and the results of their operations and their cash flows for each of the years thenin the three-year period ended September 29, 2006 in conformity with accounting principlesU.S. generally accepted in the United States of America.accounting principles. Also, in our opinion, the related financial statement schedule for the years ended September 29, 2006, September 30, 20032005 and 2002,October 1, 2004, when considered in relation to the basic consolidated financial statements taken as a whole, presents fairly, in all material respects, the information set forth therein.As discussed in Note 6note 2 to the consolidated financial statements, effective October 1, 2002, the CompanySkyworks Solutions, Inc. adopted the provisions of Statement of Financial Accounting Standards No. 142, “Goodwill and Other Intangible Assets.123(R), “Share- Based Payment,”/s/ KPMG LLP
KPMG LLP
Boston, Massachusetts
November 12, 2003, except for the third paragraph of Note 14, as to which the date is December 4, 2003
INDEPENDENT AUDITORS’ REPORT
The Board of Directors and Stockholders
Skyworks Solutions, Inc.:
effective October 1, 2005.
We also have audited, in accordance with the accompanying consolidated statementsstandards of operations, stockholders’ equity (formerly Conexant’s net investment and comprehensive income)the Public Company Accounting Oversight Board (United States), and cash flowsthe effectiveness of Skyworks Solutions, Inc.’s internal control over financial reporting as of September 29, 2006, based on criteria established in Internal Control — Integrated Framework issued by the Committee of Sponsoring Organizations of the Treadway Commission (COSO), and subsidiaries (formerly the Washington Businessour report dated December 13, 2006, expressed an unqualified opinion on management’s assessment of, and the Mexicali Operationseffective operation of, Conexant Systems, Inc.) for the year ended September 30, 2001. Our audit also included theinternal control over financial statement schedule listed in the Index at Item 15 for the year ended September 30, 2001. These financial statements and the financial statement schedule are the responsibility of the Company’s management. Our responsibility is to express an opinion on these financial statements and the financial statements schedule based on our audit.reporting./s/ KPMG LLPBoston, Massachusetts
December 13, 200651
We conducted our audit in accordance with auditing standards generally accepted in the United States of America. Those standards require that we plan and perform the audit to obtain reasonable assurance about whether the financial statements are free of material misstatement. An audit includes examining, on a test basis, evidence supporting the amounts and disclosures in the financial statements. An audit also includes assessing the accounting principles used and significant estimates made by management, as well as evaluating the overall financial statement presentation. We believe that our audit provides a reasonable basis for our opinion.
In our opinion, the financial statements referred to above present fairly, in all material respects, the results of operations and cash flows for Skyworks Solutions, Inc. and subsidiaries (formerly the Washington Business and the Mexicali Operations of Conexant Systems, Inc.) for the year ended September 30, 2001, in conformity with accounting principles generally accepted in the United States of America. Also, in our opinion, such 2001 financial statement schedule when considered in relation to the basic 2001 financial statements taken as a whole presents fairly, in all material respects, the information set forth therein.
CONSOLIDATED BALANCE SHEETSSTATEMENTS OF OPERATIONS
(In thousands, except per share amounts)ASSETS September 30, 2003
2002
Current assets: Cash and cash equivalents $ 161,506 $ 53,358 Short-term investments 3,988 -- Restricted cash 5,312 -- Receivables, net of allowance for doubtful accounts of $1,979 and $1,324, respectively 144,267 94,425 Inventories 58,168 55,643 Other current assets 12,854 23,970
Total current assets 386,095 227,396 Property, plant and equipment, less accumulated depreciation and amortization of $243,797 and $202,436, respectively 121,556 143,773 Property held for sale 6,209 -- Goodwill 505,514 905,219 Intangible assets, less accumulated amortization of $4,460 and $915, respectively 22,181 35,467 Deferred tax asset 22,766 22,487 Other assets 26,347 12,570
Total assets $ 1,090,668 $ 1,346,912
LIABILITIES AND STOCKHOLDERS' EQUITY Current liabilities: Current maturities of long-term debt $ 29 $ 129 Short-term debt 41,652 -- Accounts payable 50,369 45,350 Accrued compensation and benefits 16,963 17,585 Other current liabilities 27,803 84,563
Total current liabilities 136,816 147,627 Long-term debt, less current maturities 275,000 180,039 Other long-term liabilities 5,677 4,270
Total liabilities 417,493 331,936 Commitments and contingencies -- -- Stockholders' equity: Preferred stock, no par value: 25,000 authorized, no shares issued -- -- Common stock, $0.25 par value: 525,000 shares authorized; 148,604 and 137,589 shares issued and outstanding, respectively 37,151 34,397 Additional paid-in capital 1,258,265 1,150,856 Accumulated deficit (621,609 ) (170,193 ) Accumulated comprehensive loss (632 ) -- Deferred compensation, net of accumulated amortization of $137 and $53, respectively -- (84 ) Total stockholders' equity 673,175 1,014,976
Total liabilities and stockholders' equity $ 1,090,668 $ 1,346,912
Fiscal Years Ended September 29, September 30, October 1, 2006 2005 2004 Net revenues $ 773,750 $ 792,371 $ 784,023 Cost of goods sold (includes share-based compensation expense of $2,174 for the fiscal year ended September 29, 2006) 511,071 484,599 470,807 Gross profit 262,679 307,772 313,216 Operating expenses: Research and development (includes share-based compensation expense of $6,311 for the fiscal year ended September 29, 2006) 164,106 152,215 152,633 Selling, general and administrative (includes share-based compensation expense of $5,734 for the fiscal year ended September 29, 2006) 135,801 103,070 97,522 Amortization of intangible assets 2,144 2,354 3,043 Restructuring and special charges 26,955 — 17,366 Total operating expenses 329,006 257,639 270,564 Operating income (loss) (66,327 ) 50,133 42,652 Interest expense (14,797 ) (14,597 ) (17,947 ) Other income, net 8,350 5,453 1,691 Income (loss) before income taxes (72,774 ) 40,989 26,396 Provision for income taxes 15,378 15,378 3,984 Net income (loss) ) $ (88,152 ) $ 25,611 $ 22,412 Per share information: Net income (loss), basic and diluted $ (0.55 ) $ 0.16 $ 0.15 Number of weighted-average shares used in per share computations, basic 159,408 157,453 152,090 Number of weighted-average shares used in per share computations, diluted 159,408 158,857 154,242
The accompanying notes are an integral part of these consolidated financial statements.52
CONSOLIDATED STATEMENTS OF OPERATIONSBALANCE SHEETS
(In thousands, except per share amounts)Years Ended September 30, 2003
2002
2001
Net revenues $ 617,789 $ 457,769 $ 260,451 Cost of goods sold 380,465 331,608 311,503
Gross profit (loss) 237,324 126,161 (51,052 ) Operating expenses: Research and development 151,762 132,603 111,053 Selling, general and administrative 80,222 50,178 51,267 Amortization of intangible assets 4,386 12,929 15,267 Purchased in-process research and development -- 65,500 -- Special charges 34,493 116,321 88,876
Total operating expenses 270,863 377,531 266,463
Operating loss (33,539 ) (251,370 ) (317,515 ) Interest expense (21,403 ) (4,227 ) -- Other income (expense), net 1,317 (56 ) 210
Loss before income taxes and cumulative effect of change in accounting principle (53,625 ) (255,653 ) (317,305 ) Provision (benefit) for income taxes 652 (19,589 ) 1,619
Loss before cumulative effect of change in accounting principle (54,277 ) (236,064 ) (318,924 )
Cumulative effect of change in accounting principle, net of tax (397,139 ) -- --
Net loss $ (451,416 ) $ (236,064 ) $ (318,924 )
Per share information: Loss before cumulative effect of change in accounting principle, basic and diluted (1) $ (0.39 ) $ (1.72 ) Cumulative effect of change in accounting principle, net of tax, basic and diluted (1) (2.85 ) --
Net loss, basic and diluted (1) $ (3.24 ) $ (1.72 )
Number of weighted-average shares used in per share computations, basic and diluted (1) 139,376 137,416
(1) SeeNote 2 to the consolidated financial statements
As of September 29, September 30, 2006 2005 ASSETS Current assets: Cash and cash equivalents $ 136,749 $ 116,522 Short-term investments 28,150 113,325 Restricted cash 6,302 6,013 Receivables, net of allowance for doubtful accounts of $37,022 and $5,815, respectively 158,798 171,454 Inventories 81,529 77,400 Other current assets 9,315 11,268 Total current assets 420,843 495,982 Property, plant and equipment, less accumulated depreciation and amortization of $250,195 and $260,731, respectively 150,383 144,208 Property held for sale — 6,630 Goodwill 493,389 493,389 Intangible assets, less accumulated amortization of $11,055 and $8,911, respectively 15,586 17,730 Deferred tax assets 251 16,052 Other assets 10,044 13,852 Total assets $ 1,090,496 $ 1,187,843 LIABILITIES AND STOCKHOLDERS’ EQUITY Current liabilities: Short-term debt $ 50,000 $ 50,000 Accounts payable 73,071 72,276 Accrued compensation and benefits 25,297 19,679 Other current liabilities 27,252 16,280 Total current liabilities 175,620 158,235 Long-term debt, less current maturities 179,335 230,000 Other long-term liabilities 6,448 7,044 Total liabilities 361,403 395,279 Commitments and contingencies (Note 11 and Note 12) Stockholders’ equity: Preferred stock, no par value: 25,000 shares authorized, no shares issued — — Common stock, $0.25 par value: 525,000 shares authorized; 161,690 shares issued and 161,659 shares outstanding at September 29, 2006 and 158,625 shares issued and outstanding at September 30, 2005 40,414 39,656 Additional paid-in capital 1,351,190 1,327,631 Treasury Stock (173 ) — Accumulated deficit (661,739 ) (573,586 ) Accumulated other comprehensive loss (599 ) (1,137 ) Total stockholders’ equity 729,093 792,564 Total liabilities and stockholders’ equity $ 1,090,496 $ 1,187,843
The accompanying notes are an integral part of these consolidated financial statements.53
CONSOLIDATED STATEMENTS OF STOCKHOLDERS’ EQUITYCASH FLOWS
(In thousands)Common stock Shares
Par value
Additional
Paid-in
Capital
Conexant's
Net
Investment
Retained
Earnings
Accumulated
Other
Comprehensive
Income
(Loss)
Unearned
Compensation
Balance at September 30, 2000 -- -- -- 466,468 -- (52 ) -- Net loss -- -- -- (318,924 ) -- -- -- Foreign currency translation adjustment -- -- -- -- -- (232 ) -- Contribution of additional assets related to business -- -- -- 2,058 -- -- -- acquired Net transfers from Conexant -- -- -- 138,343 -- -- --
Balance at September 30, 2001 -- -- -- 287,945 -- (284 ) --
Net loss -- -- -- (66,280 ) (170,193 ) -- -- Foreign currency translation adjustment -- -- -- -- -- 409 -- Net transfers from Conexant -- -- -- 50,404 -- -- -- Dividend (1) -- -- -- (204,716 ) -- -- -- Recapitalization as a result of purchase accounting under a reverse acquisition 137,368 34,342 1,149,965 (67,353 ) -- (125 ) (137 ) Issuance of common shares for purchase plans, 401k and stock options 221 55 861 -- -- -- -- Amortization of unearned compensation -- -- -- -- -- -- 53 Compensation expense -- -- 30 -- -- -- --
Balance at September 30, 2002 137,589 $34,397 $ 1,150,856 $ -- $(170,193 ) $ -- $(84 )
Net loss -- -- -- -- (451,416 ) -- -- Issuance of common shares in offering, net of expenses 9,200 2,300 99,888 -- -- -- -- Issuance of common shares for purchase plans, 401k and stock options 1,769 442 8,607 -- -- -- -- Amortization of unearned compensation -- -- -- -- -- -- 84 Adjustment to recapitalization as a result of purchase accounting under a reverse acquisition (2) -- -- (1,543 ) -- -- -- -- Minimum pension liability adjustment -- -- -- -- -- (632 ) -- Issuance of common shares in trademark settlement 46 12 457 -- -- -- --
Balance at September 30, 2003 148,604 $37,151 $ 1,258,265 $ -- $(621,609 ) $ (632 ) $ --
(1)The dividend to Conexant represents the payment for the Mexicali operations ($150 million), the net assets retained by Conexant in connection with the spin-off, primarily accounts receivable net of accounts payable, and the assumption of certain Conexant liabilities by the Company.
(2)Represents an adjustment to recapitalization as a result of purchase accounting under a reverse acquisition, as reported in fiscal 2002, based on final valuations derived in fiscal 2003.
Fiscal Years Ended September 29, September 30, October 1, 2006 2005 2004 Cash flows from operating activities: Net income (loss) $ (88,152 ) $ 25,611 $ 22,412 Adjustments to reconcile net income (loss) to net cash provided by operating activities: Share-based compensation expense 14,219 — — Depreciation 38,217 37,277 35,829 Charge in lieu of income tax expense — 11,104 1,022 Amortization of intangible assets 2,144 2,354 3,043 Amortization of deferred financing costs 1,992 1,596 2,176 Contribution of common shares to Savings and Retirement Plans 8,064 10,437 8,162 Non-cash restructuring expense 6,426 — — Deferred income taxes 16,547 3,253 3,055 Gain on sales of assets 73 28 34 Asset impairments 4,197 — 10,853 Provision for losses on accounts receivable 31,206 5,127 377 Changes in assets and liabilities: Receivables (18,177 ) (18,809 ) (13,882 ) Inventories (3,454 ) 2,172 (21,404 ) Other assets (3,395 ) (3,706 ) 3,794 Accounts payable 795 (1,129 ) 23,036 Other liabilities 16,524 (21,118 ) 13,406 Net cash provided by operating activities 27,226 54,197 91,913 Cash flows from investing activities: Capital expenditures (49,359 ) (38,135 ) (59,998 ) Receipts from property held for sale 6,567 — — Sale of short-term investments 1,094,985 1,223,181 1,049,082 Purchase of short-term investments (1,009,810 ) (1,251,470 ) (1,130,128 ) Net cash provided by (used in) investing activities 42,383 (66,424 ) (141,044 ) Cash flows from financing activities: Proceeds from short-term debt — — 8,290 Payments on long-term debt (50,665 ) — 29 Restricted cash (290 ) — (701 ) Repurchase of treasury stock (173 ) — — Exercise of stock options 1,746 5,244 3,512 Net cash provided by (used in) financing activities (49,382 ) 5,244 11,130 Net increase (decrease) in cash and cash equivalents 20,227 (6,983 ) (38,001 ) Cash and cash equivalents at beginning of period 116,522 123,505 161,506 Cash and cash equivalents at end of period $ 136,749 $ 116,522 $ 123,505 Supplemental cash flow disclosures: Taxes paid $ 2,023 $ 1,221 $ 2,206 Interest paid $ 13,787 $ 13,030 $ 15,845 Supplemental disclosure of non-cash activities: Senior Notes conversion $ — $ — $ 45,000 Non-cash proceeds received from non-monetary exchange $ 760 $ — $ —
The accompanying notes are an integral part of these consolidated financial statements.54
CONSOLIDATED STATEMENTS OF CASH FLOWSSTOCKHOLDERS’ EQUITY AND COMPREHENSIVE INCOME (LOSS)
(In thousands)Years Ended September 30, 2003
2002
2001
Cash flows from operating activities: Net loss $ (451,416 ) $ (236,064 ) $ (318,924 ) Adjustments to reconcile net loss to net cash used in operating activities: Depreciation 36,941 47,695 58,708 Amortization 4,386 12,931 15,267 Amortization of deferred financing costs 2,123 -- -- Contribution of common shares to Savings and Retirement Plan 7,482 874 -- Gain on sales of assets 1,802 209 80 Deferred income taxes 351 (23,117 ) -- Purchased in-process research and development -- 65,500 -- Asset impairments 425,407 111,817 86,209 Provision for losses (recoveries) on accounts receivable 1,156 (512 ) (468 ) Inventory provisions 9,577 6,225 60,978 Changes in assets and liabilities, net of acquisition: Receivables (50,998 ) (85,590 ) 27,276 Inventories (12,102 ) (7,934 ) (8,378 ) Other assets 6,369 (8,292 ) (1,604 ) Accounts payable 5,019 36,635 (2,547 ) Other liabilities (58,149 ) (19,471 ) (6,003 )
Net cash provided by (used in) operating activities (72,052 ) (99,094 ) (89,406 )
Cash flows from investing activities: Capital expenditures (40,294 ) (29,412 ) (51,118 ) Cash, cash equivalents and short-term investments of acquired business -- 67,102 -- Sale of short-term investments -- 35,422 -- Purchase of short-term investments (3,988 ) -- -- Dividend to Conexant -- (3,070 ) --
Net cash provided by (used in) investing activities (44,282 ) 70,042 (51,118 )
Cash flows from financing activities: Proceeds from unsecured notes offering 230,000 -- -- Net proceeds from common stock public offering 102,188 -- -- Deferred financing costs (10,474 ) -- -- Restricted cash (5,312 ) -- -- Net transfers from Conexant -- 50,404 138,343 Proceeds from short-term debt 41,652 30,000 -- Payments on long-term debt (135,139 ) (34 ) -- Exercise of stock options 1,567 42 --
Net cash provided by (used in) financing activities 224,482 80,412 138,343 Net increase (decrease) in cash and cash equivalents 108,148 51,360 (2,181 ) Cash and cash equivalents at beginning of period 53,358 1,998 4,179
Cash and cash equivalents at end of period $ 161,506 $ 53,358 $ 1,998
Supplemental cash flow disclosures: Taxes paid $ 517 $ 832 $ --
Interest paid $ 21,061 $ 323 $ --
Supplemental disclosure of non-cash activities: Acquisition of Alpha Industries, Inc. $ -- $ 1,183,105 $ --
Dividend to Conexant $ -- $ 201,646 $
Conexant debt refinancing $ 45,000 $ -- $ --
Stock issued for trademark settlement $ 469 $ -- $ --
Par value Accumulated Shares of of Shares of Value of Additional Other Total Common Common Treasury Treasury Paid-in Accumulated Comprehensive Stockholders’ Stock Stock Stock Stock Capital Deficit Loss Equity Balance at September 30, 2003 148,604 37,151 — — 1,258,265 (621,609 ) (632 ) 673,175 Net income — — — — — 22,412 — 22,412 Pension adjustment — — — — — — (154 ) (154 ) Other comprehensive loss — — — — — — (154 ) (154 ) Comprehensive income — — — — — — — 22,258 Issuance of common shares for stock purchase plans, 401(k) and stock option plans 1,690 423 — — 11,251 — — 11,674 Issuance of common shares in conversion of senior notes, net of expenses 5,718 1,429 — — 42,908 — — 44,337 Adjustment to issuance of common shares in offering, net of expenses — — — — 179 — — 179 Balance at October 1, 2004 156,012 39,003 — — 1,312,603 (599,197 ) (786 ) 751,623 Net income — — — — — 25,611 — 25,611 Pension adjustment — — — — — — (351 ) (351 ) Other comprehensive loss — — — — — — (351 ) (351 ) Comprehensive income — — — — — — — 25,260 Issuance of common shares for stock purchase plans, 401(k) and stock option plans 2,452 613 — — 14,932 — — 15,545 Issuance and expense of restricted stock and acceleration of options 161 40 — — 96 — — 136 Balance at September 30, 2005 158,625 $ 39,656 — $ — $ 1,327,631 $ (573,586 ) $ (1,137 ) $ 792,564 Net loss — — — — — (88,153 ) — (88,153 ) Pension adjustment — — — — — — 538 538 Other comprehensive income — — — — — — 538 538 Comprehensive loss — — — — — — — (87,615 ) Issuance and expense of common shares for stock purchase plans, 401(k) and stock option plans 1,982 496 — — 22,528 — — 23,024 Issuance and expense of common shares for restricted stock and performance shares 1,083 270 — — 1,023 — — 1,293 Shares withheld for taxes (31 ) (8 ) 31 (173 ) 8 — — (173 ) Balance at September 29, 2006 161,659 $ 40,414 31 $ (173 ) $ 1,351,190 $ (661,739 ) $ (599 ) $ 729,093
The accompanying notes are an integral part of these consolidated financial statements.55
NOTE 1. DESCRIPTION OF BUSINESS AND BASIS OF PRESENTATION
Skyworks Solutions, Inc. (“Skyworks” or the “Company”) is an innovator of high performance analog and mixed signal semiconductors enabling mobile connectivity. The Company’s power amplifiers, front-end modules and direct conversion radios are at the heart of many of today’s leading-edge multimedia handsets. Leveraging core technologies, Skyworks also offers a leadingdiverse portfolio of linear products that support automotive, broadband, cellular infrastructure, industrial and medical applications.Skyworks was formed through the merger (“Merger”) of the wireless semiconductor company focused exclusively on radio frequencybusiness of Conexant Systems, Inc. (“RF”Conexant”) and complete cellular system solutions for mobile communications applications. The Company offers front-end modules, RF subsystems and cellular systems to leading wireless handset and infrastructure customers.OnAlpha Industries, Inc. (“Alpha”) on June 25, 2002, pursuant to an Agreement and Plan of Reorganization, dated as of December 16, 2001, asand amended as of April 12, 2002, by and among Alpha, Industries, Inc. (“Alpha”), Conexant Systems, Inc. (“Conexant”) and Washington Sub, Inc. (“Washington”), a wholly ownedwholly-owned subsidiary of Conexant to which Conexant spun off its wireless communications business, including its gallium arsenide wafer fabrication facility located in Newbury Park, California, but excluding certain assets and liabilities,business. Pursuant to the Merger, Washington merged with and into Alpha, with Alpha as the surviving entity (the “Merger”). Followingcorporation. Immediately following the Merger, Alpha changed its corporate name to Skyworks Solutions, Inc.
Immediately following completion of the Merger, the Company purchased Conexant’s semiconductor assembly module manufacturing and test facility located in Mexicali, Mexico and certain related operations (“Mexicali(the “Mexicali Operations”) for $150 million. For financial accounting purposes, the sale of the Mexicali Operations by Conexant to Skyworks Solutions was treated as if Conexant had contributed the Mexicali Operations to Washington as part of the spin-off, and the $150 million purchase price was treated as a return of capital to Conexant. For purposes of these financial statements, the. The Washington business and the Mexicali Operations are collectively referred to as Washington/“Washington/Mexicali. References” Shortly thereafter, Alpha, which was incorporated in Delaware in 1962, changed its corporate name to Skyworks Solutions, Inc.
NOTE 2. SUMMARY OF SIGNIFICANT ACCOUNTING POLICIES
REVENUE RECOGNITIONRevenues from product sales are recognized upon shipment and transfer of title, in accordance with the shipping terms specified in the arrangement with the customer. Revenue from license fees and intellectual property is recognized when these fees are due and payable, and all other criteria of SEC Staff Accounting Bulletin No. 104, (“Revenue Recognition”) have been met. We ship product on consignment to certain customers and only recognize revenue when the customer notifies us that the inventory has been consumed. Revenue recognition is deferred in all instances where the earnings process is incomplete. Certain product sales are made to electronic component distributors under agreements allowing for price protection and/or a right of return on unsold products. A reserve for sales returns and allowances for customers is recorded based on historical experience or specific identification of an event necessitating a reserve.ALLOWANCE FOR DOUBTFUL ACCOUNTSWe maintain allowances for doubtful accounts for estimated losses resulting from the inability of our customers to make required payments. If the financial condition of our customers were to deteriorate, our actual losses may exceed our estimates, and additional allowances would be required.PRINCIPLES OF CONSOLIDATIONAll majority owned subsidiaries are included in the Company’s Consolidated Financial Statements and all intercompany balances are eliminated in consolidation.FISCAL YEARThe Company’s fiscal year ends on the Friday closest to September 30. Fiscal 2006 consisted of 52 weeks and ended on September 29, 2006, and fiscal years 2005 and 2004 each consisted of 52 weeks and ended on September 30, 2005 and October 1, 2004, respectively.USE OF ESTIMATESThe preparation of consolidated financial statements in conformity with accounting principles generally accepted in the United States requires management to make estimates and assumptions that affect the reported amounts of assets56
and liabilities and disclosure of contingent liabilities at the date of the financial statements and the reported amounts of revenues and expenses during the reporting period. On an ongoing basis, management reviews its estimates based upon currently available information. Actual results could differ materially from those estimates.CASH AND CASH EQUIVALENTSCash and cash equivalents include cash deposited in demand deposits at banks and highly liquid investments with original maturities of 90 days or less as well as commercial paper with original maturities of 90 days or less.SHORT-TERM INVESTMENTSThe Company’s short-term investments are classified as available for sale. These investments consist of auction rate securities which have long-term underlying maturities (ranging from 20 to 40 years), however the market is highly liquid and the interest rates reset every 28 or 31 days. The Company’s intent is not to hold these securities to maturity, but rather to use the interest rate reset feature to sell securities to provide liquidity as needed. The Company’s practice is to invest in these securities for higher yields compared to cash equivalents. Such short-term investments are carried at amortized cost, which approximates fair value, due to the “Company” refershort period of time to maturity. Gains and losses are included in investment income in the period they are realized.RECLASSIFICATIONCertain reclassifications have been made to the prior year’s consolidated financial statements to conform to the current year’s presentation.RESTRICTED CASHRestricted cash is primarily used to collateralize the Company’s obligation under a receivables purchase agreement under which it has agreed to sell from time to time certain of its accounts receivable to Skyworks USA, Inc. (“Skyworks USA”), a wholly-owned special purpose entity that is fully consolidated for accounting purposes. Concurrently, Skyworks USA entered into an agreement with Wachovia Bank, N.A. providing for a $50 million credit facility (“Facility Agreement’’) secured by the purchased accounts receivable. For further information regarding the Facility Agreement, please see Note 7 to the Consolidated Financial Statements.INVENTORIESInventories are stated at the lower of cost, determined on a first-in, first-out basis, or market. The Company provides for estimated obsolescence or unmarketable inventory based upon assumptions about future demand and market conditions. The recoverability of inventories is assessed through an on-going review of inventory levels in relation to sales backlog and forecasts, product marketing plans and product life cycles. When the inventory on hand exceeds the foreseeable demand (generally in excess of twelve months), the value of such inventory that is not expected to be sold at the time of the review is written down. The amount of the write-down is the excess of historical cost over estimated realizable value (generally zero).Once established, these write-downs are considered permanent adjustments to the cost basis of the excess inventory. If actual demand and market conditions are less favorable than those projected by management, additional inventory write-downs may be required. Some or all of the inventories that have been written-down may be retained and made available for sale. In the event that actual demand is higher than originally projected, a portion of these inventories may be able to be sold in the future. Inventories that have been written-down and are identified as obsolete are generally scrapped.PROPERTY, PLANT AND EQUIPMENTProperty, plant and equipment are carried at cost less accumulated depreciation and amortization. Depreciation is calculated using the straight-line method. Significant renewals and betterments are capitalized and equipment taken out of service is written off. Maintenance and repairs, as well as renewals of a minor amount, are expensed as incurred.57
Estimated useful lives used for depreciation purposes are 5 to 30 years for buildings and improvements and 3 to 10 years for machinery and equipment. Leasehold improvements are depreciated over the lesser of the economic life or the life of the associated lease.VALUATION OF LONG-LIVED ASSETSCarrying values for long-lived assets and definite lived intangible assets, which excludes goodwill, are reviewed for possible impairment as circumstances warrant in connection with Statement of Financial Accounting Standards (“SFAS”) No. 144, “Accounting for the Impairment or Disposal of Long-Lived Assets.” Impairment reviews are conducted at the judgment of management whenever events or changes in circumstances indicate that the carrying amount of any such asset or asset group may not be recoverable. The determination of recoverability is based on an estimate of undiscounted cash flows expected to result from the use of an asset and its eventual disposition. The estimate of cash flows is based upon, among other things, certain assumptions about expected future operating performance. The Company’s estimates of undiscounted cash flows may differ from actual cash flows due to, among other things, technological changes, economic conditions, changes to the Company’s business model or changes in its operating performance. If the sum of the undiscounted cash flows (excluding interest) is less than the carrying value of an asset or asset group, the Company recognizes an impairment loss, measured as the amount by which the carrying value exceeds the fair value of the asset or asset group. Fair value is determined using discounted cash flows.GOODWILL AND INTANGIBLE ASSETSGoodwill and intangible assets with indefinite lives are tested at least annually for impairment in accordance with the provisions of SFAS No. 142, “Goodwill and Other Intangible Assets.” The goodwill and other intangible asset impairment test is a two-step process. The first step of the impairment analysis compares the Company’s fair value to its net book value to determine if there is an indicator of impairment. In determining fair value, SFAS No. 142 allows for the use of several valuation methodologies, although it states quoted market prices are the best evidence of fair value. The Company calculates fair value using the average market price of its common stock over a seven-day period surrounding the annual impairment testing date of the first day of the fourth fiscal quarter and the number of shares of common stock outstanding on the date of the annual impairment test (the first day of the fourth fiscal quarter). Step two of the analysis compares the implied fair value of goodwill and other intangible assets to its carrying amount in a manner similar to a purchase price allocation for a business combination. If the carrying amount of goodwill and other intangible assets exceeds its implied fair value, an impairment loss is recognized equal to that excess. We test our goodwill and other intangible assets for impairment annually as of the first day of our fourth fiscal quarter and in interim periods if certain events occur indicating that the carrying value of goodwill or other intangible assets may be impaired. Indicators such as unexpected adverse business conditions, economic factors, unanticipated technological change or competitive activities, loss of key personnel, and acts by governments and courts, may signal that an asset has become impaired.DEFERRED FINANCING COSTSFinancing costs are capitalized as an asset on the Company’s balance sheet and amortized on a straight-line basis over the life of the financing. The Company amortized additional deferred financing costs during fiscal 2006 due to the early extinguishment of $50.7 million of its long-term debt as more fully described in Note 7 to the Consolidated Financial Statements.INCOME TAXESThe Company uses the asset and liability method of accounting for income taxes. Under the asset and liability method, deferred tax assets and liabilities are recognized for the estimated future tax consequences attributable to differences between the financial statement carrying amounts of existing assets and liabilities and their respective tax bases. This method also requires the recognition of future tax benefits such as net operating loss carryforwards, to the extent that realization of such benefits is more likely than not. Deferred tax assets and liabilities are measured using enacted tax rates expected to apply to taxable income in the years in which those temporary differences are58
expected to be recovered or settled. The effect on deferred tax assets and liabilities of a change in tax rates is recognized in income in the period that includes the enactment date.The carrying value of the Company’s net deferred tax assets assumes that the Company will be able to generate sufficient future taxable income in certain tax jurisdictions, based on estimates and assumptions. If these estimates and related assumptions change in the future, the Company may be required to record additional valuation allowances against its deferred tax assets resulting in additional income tax expense in the Company’s consolidated statement of operations. Management evaluates the realizability of the deferred tax assets and assesses the adequacy of the valuation allowance quarterly. Likewise, in the event that the Company was to determine that it would be able to realize its deferred tax assets in the future in excess of its net recorded amount, an adjustment to the deferred tax assets would increase income or decrease the carrying value of goodwill in the period such determination was made.It was the Company’s intention to permanently reinvest the undistributed earnings of some of its foreign subsidiaries in accordance with Accounting Principles Board Opinion No. 23, “Accounting for Income Taxes — Special Areas”. During the fiscal year ended September 30, 2005, the Company reversed its policy of permanently reinvesting the earnings of its Mexican business. This policy reversal increased the 2005 tax provision by $9.0 million. For the fiscal year ended September 29, 2006, U.S. income tax was provided on current earnings attributable to our operations in Mexico. No provision has been made for U.S. federal, state, or additional foreign income taxes that would be due upon the actual or deemed distribution of undistributed earnings of the other foreign subsidiaries, which have been, or are intended to be, permanently reinvested.On November 10, 2005, the FASB issued FASB Staff Position No. FAS 123(R)-3, “Transition Election Related to Accounting for Tax Effects of Share-Based Payment Awards” the “FASB Staff Position”). The Company adopted the alternative transition method provided in the FASB Staff Position for calculating the tax effects of share-based compensation pursuant to SFAS 123(R) during the year ended September 29, 2006. The alternative transition method includes simplified methods to establish the beginning balance of the additional paid-in capital pool (“APIC pool”) related to the tax effects of employee share-based compensation, and to determine the subsequent impact on the APIC pool and Consolidated Statements of Cash Flows of the tax effects of employee share-based compensation awards that are outstanding upon adoption of SFAS 123(R). Under the simplified method the Company’s beginning APIC pool is zero and the ending APIC pool balance at September 29, 2006 remains zero.RESEARCH AND DEVELOPMENT COSTSResearch and development costs are expensed as incurred.FINANCIAL INSTRUMENTSThe carrying value of cash and cash equivalents, accounts receivable, accounts payable, short-term debt and accrued liabilities approximates fair value due to short-term maturities of these assets and liabilities. Fair values of long-term debt and short-term investments are based on quoted market prices at the date of measurement.FOREIGN CURRENCY ACCOUNTINGThe foreign operations of the Company are subject to exchange rate fluctuations and foreign currency transaction costs. The functional currency for the Company’s foreign operations is the U.S. dollar. Exchange gains and losses resulting from transactions denominated in currencies other than the functional currency are included in the results of operations for the year. Inventories, property, plant and equipment, goodwill and intangible assets, costs of goods sold, and depreciation and amortization are remeasured from the foreign currency into U.S. dollars at historical exchange rates; other accounts are translated at current exchange rates. Gains and losses resulting from the remeasurement of the Company’s long-term deferred tax assets denominated in foreign currencies are included in the provision (benefit) for income taxes and increased tax expense by $0.2 million and $2.2 million in fiscal 2006 and fiscal 2004, respectively reduced tax expense by $0.8 million in fiscal 2005. Gains and losses resulting from the remeasurement of all other accounts are included in other income, net. The Company recognized a gain of $0.1 million, $0.2 million and $0.5 million related to these remeasurements in fiscal 2006, fiscal 2005 and fiscal 2004, respectively.59
SHARE-BASED COMPENSATIONOn October 1, 2005, the Company adopted SFAS No. 123 (revised 2004), “Share-Based Payment” (“SFAS 123(R)”) which requires the measurement and recognition of compensation expense for all share-based payment awards made to employees and directors including employee stock options, employee stock purchases related to the Company’s 2002 Employee Stock Purchase Plan (“ESPP”), restricted stock and other special equity awards based on estimated fair values. SFAS 123(R) supersedes the Company’s previous accounting under Accounting Principles Board Opinion No. 25, “Accounting for Stock Issued to Employees” (“APB 25”) for periods beginning in fiscal 2006. In March 2005, the Securities and Exchange Commission issued Staff Accounting Bulletin No. 107, “Share Based Payment” (“SAB 107”), providing interpretative guidance relating to SFAS 123(R). The Company has applied the provisions of SAB 107 in its adoption of SFAS 123(R).The Company adopted SFAS 123(R) using the modified prospective transition method, which requires the application of the accounting standard as of October 1, 2005, the first day of the Company’s fiscal year 2006.The Company’s practice in general is to issue shares of common stock upon exercise or settlement of options and to issue shares in connection with the Employee Stock Purchase Plan (“ESPP”) from previously unissued shares.Share-based compensation expense recognized during the period is based on the value of the portion of share-based payment awards that is ultimately expected to vest during the period. Share-based compensation expense recognized in the Company’s Consolidated Statement of Operations for the fiscal year ended September 29, 2006 included compensation expense for share-based payment awards granted on or before, but not yet vested as of, September 30, 2005, based on the grant date fair value estimated in accordance with the pro forma provisions of SFAS 123, and compensation expense for the share-based payment awards granted subsequent to September 30, 2005 based on the grant date fair value estimated in accordance with the provisions of SFAS 123(R). As share-based compensation expense recognized in the Consolidated Statement of Operations for the fiscal year ended September 29, 2006 is based on awards ultimately expected to vest, it has been reduced for estimated forfeitures. SFAS 123(R) requires forfeitures to be estimated at the time of grant and revised, if necessary, in subsequent periods if actual forfeitures differ from those estimates.Upon adoption of SFAS 123(R), the Company elected to retain its method of valuation for share-based awards using the Black-Scholes option-pricing model (“Black-Scholes model”) which was also previously used for the Company’s pro forma information required under SFAS 123. The Company’s determination of fair value of share-based payment awards on the date of grant using the Black-Scholes model is affected by the Company’s stock price as well as assumptions regarding a number of highly complex and subjective variables. These variables include, but are not limited to; the Company’s expected stock price volatility over the term of the awards, and actual and projected employee stock option exercise behaviors.PENSIONS AND RETIREE MEDICAL BENEFITSIn connection with Conexant’s spin-off of its Washington/Mexicali business, Conexant transferred obligations to Washington/Mexicali for all periods priorits pension plan and retiree benefits. The amounts that were transferred relate to June 26, 2002,twenty Washington/Mexicali employees that had enrolled in Conexant’s Voluntary Early Retirement Plan (“VERP”) in 1998. The VERP also provides health care benefits to members of the plan. The Company currently does not offer pension plans or retiree benefits to its employees.The costs and obligations of the Company’s pension and retiree medical plans are calculated using many assumptions, the amount of which cannot be completely determined until the benefit payments cease. The most significant assumptions, as presented in Note 10 to the combined company followingConsolidated Financial Statements, include discount rate, expected return on plan assets and future trends in health care costs. The selection of assumptions is based on historical trends and known economic and market conditions at the Merger.time of valuation. Actual results may differ substantially from these assumptions. These differences may significantly impact future pension or retiree medical expenses.
Annual pension and retiree medical expense is principally the sum of three components: 1) increase in liability from interest; less 2) expected return on plan assets; and 3) other gains and losses as described below. The Merger was accounted for as a reverse acquisition whereby Washington was treated as the acquirer and Alpha as the acquiree, primarily because Conexant shareholders owned a majority, approximately 67 percent,expected return on plan assets is calculated by applying an assumed long-term rate of the Company upon completion of the Merger. Under a reverse acquisition, the purchase price of Alpha was based upon the fair market value of Alpha common stock for a reasonable period of time before and after the announcement date of the Merger andreturn to the fair value of Alpha stock options.plan assets. In any given year, actual returns can differ significantly from the expected return. Differences between the actual and expected return on plan assets are combined with gains or losses resulting from the revaluation of plan liabilities. Plan liabilities are revalued annually, based on updated assumptions and information about the individuals covered by the plan. The purchase pricecombined gain or loss is generally expensed evenly over the remaining years that employees are expected to work.60
COMPREHENSIVE INCOME (LOSS)The Company accounts for comprehensive income (loss) in accordance with the provisions of Alpha was allocated to the assets acquired and liabilities assumed by Washington, as the acquiring company for accounting purposes, based upon their estimated fair market value at the acquisition date. Because the historicalSFAS No. 130, “Reporting Comprehensive Income” (“SFAS No. 130”). SFAS No. 130 is a financial statements ofstatement presentation standard that requires the Company after the Merger doto disclose non-owner changes included in equity but not include the historical financial resultsincluded in net income or loss. Other items of Alpha for periods prior to June 25, 2002, the financial statements may not be indicative of future results of operations and are not indicative of the historical results that would have resulted if the Merger had occurred at the beginning of a historical financial period.The financial statements prior to the Merger were prepared using Conexant’s historical basis in the assets and liabilities and the historical operating results of Washington/Mexicali during each respective period. Management believes the assumptions underlying the financial statements are reasonable. However, there can be no assurance that the financial information included herein reflects the combined assets, liabilities, operating results and cash flows of the Company in the future or what they would have been had Washington/Mexicali been a separate stand-alone entity and independent of Conexant during the periods presented.
Conexant used a centralized approach to cash management and the financing of its operations. Cash deposits from Washington/Mexicali were transferred to Conexant on a regular basis and were netted against Conexant’s net investment. As a result, none of Conexant’s cash, cash equivalents, marketable securities or debt was allocated to Washington/Mexicali in the financial statements. Cash and cash equivalentscomprehensive income (loss) presented in the financial statements priorconsists of adjustments to the acquisition, representedCompany’s minimum pension liability as follows (in thousands):
Accumulated Other Pension Comprehensive Adjustments Loss Balance as of October 1, 2004 $ (786 ) $ (786 ) Change in period (351 ) (351 ) Balance as of September 30, 2005 (1,137 ) (1,137 ) Change in period 538 538 Balance as of September 29, 2006 $ (599 ) $ (599 )
RECENTLY ISSUED ACCOUNTING PRONOUNCEMENTSIn November 2004, the FASB issued SFAS No. 151, “Inventory Costs — an amendment to APB No. 23, Chapter 4” (“SFAS No. 151”). The amendments made by SFAS No. 151 clarify that abnormal amounts held byof idle facility expense, freight, handling costs and wasted materials (spoilage) should be recognized as current-period charges and require the allocation of fixed production overheads to inventory based on the normal capacity of the production facilities. The guidance is effective for inventory costs incurred during fiscal years beginning after June 15, 2005. The Company adopted SFAS No. 151 on October 1, 2005 and it did not have a material impact on its financial statements in fiscal 2006.In December 2004, the FASB issued SFAS No. 153, “Exchanges of Nonmonetary Assets—an amendment of APB Opinion No. 29” (“SFAS No. 153”). The guidance in APB Opinion No. 29, “Accounting for Nonmonetary Transactions” (“APB No. 29”) is based on the principle that exchanges of nonmonetary assets should be measured based on the fair value of the assets exchanged. The guidance in APB No. 29, however, included certain foreign operationsexceptions to that principle. SFAS No. 153 amends APB No. 29 to eliminate the exception for nonmonetary exchanges of Washington/Mexicali.similar productive assets and replaces it with a general exception for exchanges of nonmonetary assets that do not have commercial substance. SFAS No. 153 is effective for such exchange transactions occurring in fiscal periods beginning after June 15, 2005. The Company adopted SFAS No. 153 on October 1, 2005 and it did not have a material impact on its financial statements in fiscal 2006.In May 2005, the FASB issued SFAS No. 154, “Accounting Changes and Error Corrections—a replacement of APB Opinion No. 20 and FASB Statement No. 3” (“SFAS No. 154”). This Statement replaces APB Opinion No. 20, “Accounting Changes” and FASB Statement No. 3, “Reporting Accounting Changes in equity represented funding from ConexantInterim Financial Statements—an amendment of APB Opinion No. 28,” and also changes the requirements for workingthe accounting for and reporting of a change in accounting principle. SFAS No. 154 applies to all voluntary changes in an accounting principle. It also applies to changes required by an accounting pronouncement in the unusual instance that the pronouncement does not include specific transition provisions. When a pronouncement includes specific transition provisions, those provisions should be followed. SFAS No. 154 is effective for accounting changes and error corrections occurring in fiscal years beginning after December 15, 2005. The Company adopted SFAS No. 154 on September 30, 2005 and it did not have a material effect on its financial statements in fiscal 2006.On November 10, 2005, the FASB issued FASB Staff Position No. FAS 123(R)-3, “Transition Election Related to Accounting for Tax Effects of Share-Based Payment Awards” (the “FASB Staff Position”). The Company adopted the alternative transition method provided in the FASB Staff Position for calculating the tax effects of share-based compensation pursuant to SFAS 123(R) during the year ended September 29, 2006. The alternative transition method includes simplified methods to establish the beginning balance of the additional paid-in capital pool (“APIC pool”) related to the tax effects of employee share-based compensation, and capital expenditure requirementsto determine the subsequent impact on the APIC pool and Consolidated Statements of Cash Flows of the tax effects of employee share-based compensation61
awards that are outstanding upon adoption of SFAS 123(R). Under the simplified method the Company’s beginning APIC pool is zero.In March 2006, the Emerging Issues Task Force issued EITF Issue No. 04-13, “Accounting for Purchases and Sales of Inventory with the Same Counterparty” (“EITF 04-13”). EITF 04-13 clarifies the circumstances under which two or more transactions involving inventory with the same counterparty should be viewed as a single nonmonetary transaction. In addition the EITF reached a consensus that there are circumstances under which nonmonetary exchanges of inventory within the same line of business should be recognized at fair value. Issue 04-13 is effective for new arrangements entered into in reporting periods beginning after giving effectMarch 15, 2006. The Company adopted the provisions of EITF 04-13 in the three month period ended June 30, 2006 and it did not have a material impact on its financial statements in fiscal 2006.In July 2006, the FASB issued FASB Interpretation No. 48, “Accounting for Uncertainty in Income Taxes—an interpretation of FASB Statement No. 109” (FIN 48), which clarifies the accounting and disclosure for uncertainty in tax positions, as defined. FIN 48 seeks to Washington/Mexicali’s transfersreduce the diversity in practice associated with certain aspects of the recognition and measurement related to accounting for income taxes. This interpretation is effective for fiscal years beginning after December 15, 2006. The Company expects to adopt FIN48 on September 29, 2007, the first day of fiscal 2008 and from Conexant for its cash flowshas not yet determined the impact this interpretation will have on our results from operations through June 25, 2002.Historically, Conexant provided financingor financial position.
In September 2006, the FASB issued SFAS No. 157, “Fair Value Measurements” (“SFAS 157”) which defines fair value, establishes a framework for Washington/Mexicalimeasuring fair value in generally accepted accounting principles and incurred debt at the parent level. Theexpands disclosures about fair value measurements. SFAS 157 is effective for financial statements issued for fiscal years beginning after November 15, 2007 and interim periods within those fiscal years. The Company has not yet determined the periods prior to June 25, 2002impact this FASB will have on our results from operations or financial position.In September 2006, the FASB issued SFAS No. 158, “Employers’ Accounting for Defined Benefit Pension and Other Postretirement Plans—an amendment of Washington/Mexicali do not includeFASB Statements No. 87, 88, 106, and 132(R)” (“SFAS 158”) which requires an allocationemployer to: (a) recognize in its statement of Conexant’s debt or the related interest expense. Therefore, the financial statements do not necessarily reflect the financial position an asset for a plan’s overfunded status or a liability for a plan’s underfunded status; (b) measure a plan’s assets and results of operations of Washington/Mexicali had it been an independent companyits obligations that determine its funded status as of the dates, and for the periods, presented.The financial statements for the periods prior to the Merger also include allocations of certain Conexant operating expenses for research and development, legal, accounting, treasury, human resources, real estate, information systems, distribution, customer service, sales, marketing, engineering and other corporate services provided by Conexant, including executive salaries and other costs. The operating expense allocations have been determined on bases that management considered to be reasonable reflectionsend of the utilizationemployer’s fiscal year; and (c) recognize changes in the funded status of services provideda defined benefit postretirement plan in the year in which the changes occur. Those changes will be reported in other comprehensive income. The requirement to orrecognize the funded status of a benefit received by, Washington/Mexicali. Management believes thatplan and the expenses allocated to Washington/Mexicalidisclosure requirements are representativeeffective as of the operating expenses that would have been incurred had Washington/Mexicali operatedend of fiscal years ending after December 15, 2006. The requirement to measure plan assets and benefit obligations as an independent company. Sinceof the date of the Merger, theemployer’s fiscal year-end statement of financial position is effective for fiscal years ending after December 15, 2008, although earlier adoption is permitted. The Company has been performing these functions using its own resourcesnot yet determined the impact that SFAS 158 will have on our results from operations or purchased services, including certain services obtained from Conexant pursuant tofinancial position.
In September 2006, the Securities and Exchange Commission issued Staff Accounting Bulletin No. 108, “Considering the Effects of Prior Year Misstatements When Quantifying Misstatements in Current Year Financial Statements” (“SAB 108”), which provides interpretive guidance on how the effects of the carryover or reversal of prior year misstatements should be considered in quantifying a transition services agreement, most of which expired on December 31, 2002.current year misstatement. SAB 108 is effective for fiscal years ending after November 15, 2006. The Company expectsdoes not expect the impact of SAB 108 will be material to transition the remaining services from Conexant to third party providers before the end of fiscal 2004.NOTE 2. SUMMARY OF SIGNIFICANT ACCOUNTING POLICIES
Principles of Consolidation:
its financial statements.The financial statements include the accounts of the Company and its subsidiaries. All significant intercompany accounts and transactions have been eliminated in consolidation.
Fiscal Year:
The Company’s fiscal year ends on the Friday closest to September 30. Fiscal 2003 consisted of 53 weeks and fiscal years 2002 and 2001 each consisted of 52 weeks. Fiscal years 2003, 2002 and 2001 ended on October 3, 2003, September 27, 2002 and September 28, 2001, respectively. For convenience, the consolidated financial statements have been shown as ending on the last day of the calendar month.
Use of Estimates:
The preparation of consolidated financial statements in conformity with accounting principles generally accepted in the United States of America requires management to make estimates and assumptions that affect the reported amounts of assets and liabilities and disclosure of contingent liabilities at the date of the financial statements and the reported amounts of revenues and expenses during the reporting period. On an ongoing basis, management reviews its estimates based upon currently available information. Actual results could differ materially from those estimates.
The combined financial statements have been prepared using Conexant’s historical basis in the assets and liabilities and the historical operating results of Washington/Mexicali during each respective period. The Company believes the assumptions underlying the financial statements are reasonable. However, the Company cannot assure you that the financial information included herein reflects the combined assets, liabilities, operating results and cash flows of the Company in the future or what they would have been had Washington/Mexicali been a separate stand-alone entity and independent of Conexant during the periods presented.
Revenue Recognition:
Revenues from product sales are recognized upon shipment and transfer of title, in accordance with the shipping terms specified in the arrangement with the customer. Revenue recognition is deferred in all instances where the earnings process is incomplete. Certain product sales are made to electronic component distributors under agreements allowing for price protection and/or a right of return on unsold products. A reserve for sales returns and allowances for customers is recorded based on historical experience or specific identification of an event necessitating a reserve.
Cash and Cash Equivalents:
Cash and cash equivalents include cash deposited in demand deposits at banks and highly liquid investments with original maturities of 90 days or less.
Short-term Investments:
The Company’s short-term investments are classified as held-to-maturity. These investments consist of commercial paper with original maturities of more than 90 days but less than twelve months. Such short-term investments are carried at amortized cost, which approximates fair value, due to the short period of time to maturity. Gains and losses are included in investment income in the period they are realized.
Restricted Cash:
Restricted cash is used to collateralize the Company’s obligation under a receivables purchase agreement under which it has agreed to sell from time to time certain of its accounts receivable to Skyworks USA, Inc. (“Skyworks USA”), a wholly-owned special purpose entity that is fully consolidated for accounting purposes. Concurrently, Skyworks USA entered into an agreement with Wachovia Bank, National Association providing for a $50 million credit facility (“Facility Agreement “) secured by the purchased accounts receivable. SeeNote 8.
Accounts Receivable:
Accounts receivable consist of amounts due from normal business activities. The Company maintains allowances for doubtful accounts for estimated losses resulting from the inability of its customers to make required payments. If the financial condition of the Company’s customers were to deteriorate, resulting in an impairment of their ability to make future payments, additional allowances may be required.
Inventories:
Inventories are stated at the lower of cost, determined on a first-in, first-out basis, or market. The Company provides for estimated obsolescence or unmarketable inventory based upon assumptions about future demand and market conditions. The recoverability of inventories is assessed through an on-going review of inventory levels in relation to sales backlog and forecasts, product marketing plans and product life cycles. When the inventory on hand exceeds the foreseeable demand (generally in excess of six months), the value of such inventory that is not expected to be sold at the time of the review is written down. The amount of the write-down is the excess of historical cost over estimated realizable value (generally zero). Once established, these write-downs are considered permanent adjustments to the cost basis of the excess inventory. If actual demand and market conditions are less favorable than those projected by management, additional inventory write-downs may be required.
Property, Plant and Equipment:
Property, plant and equipment are carried at cost less accumulated depreciation and amortization. Depreciation is calculated using the straight-line method for financial reporting and accelerated methods for tax purposes. Significant renewals and betterments are capitalized and replaced units are written off. Maintenance and repairs, as well as renewals of a minor amount, are expensed as incurred.
Estimated useful lives used for depreciation purposes are 5 to 30 years for buildings and improvements and 3 to 10 years for machinery and equipment. Leasehold improvements are depreciated over the lesser of the economic life or the life of the associated lease.
Property Held for Sale:
Property held for sale at September 30, 2003 relates to land and buildings no longer in use and is recorded at estimated fair value less estimated selling costs. The Company is actively marketing the property held for sale.
Valuation of long-lived assets:
Carrying values for long-lived assets and definitive lived intangible assets, excluding goodwill, are reviewed for possible impairment as circumstances warrant in connections with Statement of Financial Accounting Standards (“SFAS”) No. 144, “Accounting for the Impairment or Disposal of Long-Lived Assets,” which was adopted on October 1, 2002. Impairment reviews are conducted at the judgment of management whenever events or changes in circumstances indicate that the carrying amount of any such asset may not be recoverable. The determination of recoverability is based on an estimate of undiscounted cash flows expected to result from the use of an asset and its eventual disposition. The estimate of cash flows is based upon, among other things, certain assumptions about expected future operating performance. The Company’s estimates of undiscounted cash flows may differ from actual cash flows due to, among other things, technological changes, economic conditions, changes to the Company’s business model or changes in its operating performance. If the sum of the undiscounted cash flows (excluding interest) is less than the carrying value, the Company recognizes an impairment loss, measured as the amount by which the carrying value exceeds the fair value of the asset. Fair value is determined using discounted cash flows.
Goodwill and Intangible Assets:
Goodwill and intangible assets are principally the result of the Merger with Washington/Mexicali completed on June 25, 2002. The Company adopted SFAS No. 142, “Goodwill and Other Intangibles,” on October 1, 2002 and performed a transitional impairment test for goodwill in fiscal 2003. SFAS No. 142 addresses financial accounting and reporting for acquired goodwill and other intangible assets. Goodwill and intangible assets that have indefinite useful lives are not amortized into results of operations, but instead are evaluated at least annually for impairment and written down when the recorded value exceeds the estimated fair value. The goodwill impairment test is a two-step process. The first step of the impairment analysis compares the Company’s fair value to its net book value. In determining fair value, SFAS No. 142 allows for the use of several valuation methodologies, although it states quoted market prices are the best evidence of fair value. As part of the first step, the Company determined that it has one reporting unit for purposes of performing the fair-value based test of goodwill. This reporting unit is consistent with the Company’s single operating segment, which management determined is appropriate under the provisions of SFAS No. 131, “Disclosures about Segments of an Enterprise and Related Information.” The Company completed step one and determined that its goodwill and unamortized intangible assets were impaired. Step two of the analysis compares the implied fair value of goodwill to its carrying amount. If the carrying amount of goodwill exceeds its implied fair value, an impairment loss is recognized equal to that excess. The Company completed step two and determined that the carrying amount of its goodwill was $397.1 million greater than its implied fair value. This transitional impairment charge was recorded as a cumulative effect of a change in accounting principle in fiscal 2003. The Company tests its goodwill for impairment annually as of the first day of its fourth fiscal quarter and in interim periods if certain events occur indicating that the carrying value of goodwill may be impaired. The Company completed its annual goodwill impairment test for fiscal 2003 and determined that as of July 1, 2003, its goodwill was not further impaired.
Deferred Financing Costs:
Financing costs are capitalized as an asset on the Company’s balance sheet and amortized on a straight-line basis over the life of the financing.
Income Taxes:
The Company uses the asset and liability method of accounting for income taxes. Under the asset and liability method, deferred tax assets and liabilities are recognized for the estimated future tax consequences attributable to differences between the financial statement carrying amounts of existing assets and liabilities and their respective tax bases. This method also requires the recognition of future tax benefits such as net operating loss carryforwards, to the extent that realization of such benefits is more likely than not. Deferred tax assets and liabilities are measured using enacted tax rates expected to apply to taxable income in the years in which those temporary differences are expected to be recovered or settled. The effect on deferred tax assets and liabilities of a change in tax rates is recognized in income in the period that includes the enactment date.
The carrying value of the Company’s net deferred tax assets assumes that the Company will be able to generate sufficient future taxable income in certain tax jurisdictions, based on estimates and assumptions. If these estimates and related assumptions change in the future, the Company may be required to record additional valuation allowances against its deferred tax assets resulting in additional income tax expense in the Company’s consolidated statement of operations. Management evaluates the realizability of the deferred tax assets and assesses the adequacy of the valuation allowance quarterly. Likewise, in the event that the Company was to determine that it would be able to realize its deferred tax assets in the future in excess of its net recorded amount, an adjustment to the deferred tax assets would increase income or decrease the carrying value of goodwill in the period such determination was made.
Research and Development Expenditures:
Research and development costs are expensed as incurred.
Product Warranties:
Warranties are offered on the sale of certain products and an accrual is recorded for estimated claims. The changes in the warranty reserve are as follows:
Warranty balance, September 30, 2001$ 3,414Additions14,000Cash payments and reductions(4,042)NOTE 3. MARKETABLE SECURITIES
Marketable securities are categorized as available for sale and are summarized as follows as of September 29, 2006 (in thousands): Gross Gross Amortized Unrealized Unrealized Market Short term available for sale securities: Cost Gains Losses Value Auction rate securities $ 28,150 $ — $ — $ 28,150 Total marketable securities $ 28,150 $ — $ — $ 28,150
62
Marketable securities are categorized as available for sale and are summarized as follows as of September 30, 2005 (in thousands): Gross Gross Amortized Unrealized Unrealized Market Short term available for sale securities: Cost Gains Losses Value Auction rate securities $ 113,325 $ — $ — $ 113,325 Total marketable securities $ 113,325 $ — $ — $ 113,325
Warranty balance, September 30, 2002NOTE 4. 13,372Additions--Cash payments and reductions(7,241)
Warranty balance, September 30, 2003$ 6,131
INVENTORY
Foreign Currency Translation and Remeasurement:
The foreign operations of the Company are subject to exchange rate fluctuations and foreign currency transaction costs. The functional currency for the Company’s foreign operations is the U.S. dollar. Exchange gains and losses resulting from transactions denominated in currencies other than the functional currency are included in the results of operations for the year. Inventories, property, plant and equipment, goodwill and intangible assets, costs of goods sold, and depreciation and amortization are remeasured from the foreign currency into U.S. dollars at historical exchange rates; other accounts are translated at current exchange rates. Gains and losses resulting from these remeasurements are included in results of operations. The Company recorded a gain of $0.4 million related to these remeasurements in fiscal 2003.
Stock Option Plans:
The Company has elected to follow Accounting Principles Board Opinion (“APB”) No. 25, “Accounting for Stock Issued to Employees,” and related interpretations, in accounting for employee stock options rather than the alternative fair value accounting allowed by SFAS No. 123, “Accounting for Stock-Based Compensation.” APB No. 25 provides that compensation expense relative to the Company’s employee stock options is measured based on the intrinsic value of stock options granted and the Company recognizes compensation expense in its statement of operations using the straight-line method over the vesting period for fixed awards. Under SFAS No. 123, the fair value of stock options at the date of grant is recognized in earnings over the vesting period of the options. In December 2002, the Financial Accounting Standards Board (“FASB”) issued SFAS No. 148, “Accounting for Stock-Based Compensation – Transition and Disclosure.” SFAS No. 148 amends SFAS No. 123 to provide alternative methods of transition for a voluntary change to the fair value method of accounting for stock-based employee compensation. In addition, SFAS No. 148 amends the disclosure requirements of SFAS No. 123 to require prominent disclosures in both annual and interim financial statements about the method of accounting for stock-based employee compensation and the effect of the method on reported results. SFAS No. 148 is effective for financial statements for fiscal years and interim periods ending after December 15, 2002. The Company adopted the disclosure provisions of SFAS No. 148 on December 27, 2002 and continues to follow APB No. 25 in accounting for employee stock options.
No stock-based employee compensation cost is reflected in net income, as all options granted under the Company’s stock-based employee compensation plans had an exercise price equal to the market value of the underlying common stock on the date of grant. Prior to the Merger with Alpha Industries, Inc., Conexant’s wireless business had no separate capitalization. Therefore, the Company had no stock-based compensation prior to June 25, 2002.
Had compensation cost for the Company’s stock option and stock purchase plans been determined based upon the fair value at the grant date for awards under these plans consistent with the methodology prescribed under SFAS No. 123, the Company’s net income (loss) would have been as follows:
Years Ended September 30,
(In thousands, except per share amounts) 2003
2002
Reported net loss $ (451,416 ) $ (236,064 ) Total stock-based employee compensation expense determined under fair value based method for all awards, net of related tax effects 4,923 285
Adjusted net loss $ (456,339 ) $ (236,349 )
Per share information: Basic and diluted: Reported net loss $ (3.24) $ (1.72 ) Total stock-based employee compensation expense determined under fair value based method for all awards, net of related tax effects (0.03) --
Adjusted net loss $ (3.27) $ (1.72 )
For purposes of pro forma disclosures under SFAS No. 123, the estimated fair value of the options is assumed to be amortized to expense over the options’ vesting period. The fair value of the options granted has been estimated at the date of the grant using the Black-Scholes option pricing model with the following assumptions:
2003
2002
Expected volatility 95 % 70 % Risk free interest rate 2.5 % 2.2 % Dividend yield -- -- Expected option life (years) 4.5 4.5 Weighted average fair value of options granted $ 2.57 $ 1.87
The Black-Scholes option valuation model was developed for use in estimating the fair value of traded options that have no vesting restrictions and are fully transferable. In addition, option valuation models require input of highly subjective assumptions, including the expected stock price volatility. Because options held by employees and directors have characteristics significantly different from those of traded options, and because changes in the subjective input assumptions can materially affect the fair value estimate, in the opinion of management, the existing models do not necessarily provide a reasonable measure of the fair value of these options.
Earnings Per Share:
Prior to the Merger with Alpha, Conexant’s wireless business had no separate capitalization. Therefore, a calculation cannot be performed for weighted average shares outstanding to then calculate earnings per share. Basic earnings per share is calculated by dividing net income (loss) by the assumed weighted average number of common shares outstanding. Diluted earnings per share includes the dilutive effect of stock options and a stock warrant, using the treasury stock method, and debt securities on an if converted basis, if their effect is dilutive. For the year ended September 30, 2003, debt securities convertible into 31.1 million shares, stock options exercisable into 25.8 million shares and a warrant to purchase 1.0 million shares were outstanding but not included in the computation of diluted earnings per share as the net loss for this period would have made their effect anti-dilutive. For the year ended September 30, 2002, options to purchase 31.3 million shares were outstanding but not included in the computation of diluted earnings per share as the net loss for this period would have made their effect anti-dilutive.
Pensions and Retiree Medical Benefits:
In connection with Conexant’s spin-off of its Washington/Mexicali business, Conexant transferred obligations to Washington/Mexicali for its pension plan and retiree benefits. The amounts that were transferred relate to approximately twenty Washington/Mexicali employees that had enrolled in Conexant’s Voluntary Early Retirement Plan (“VERP”) in 1998. The VERP also provides health care benefits to members of the plan. The Company currently does not offer pension plans or retiree benefits to its employees.
The costs and obligations of the Company’s pension and retiree medical plans are calculated using many assumptions, the amount of which cannot be completely determined until the benefit payments cease. The most significant assumptions, as presented in Note 12 to the Consolidated Financial Statements, include discount rate, expected return on plan assets and future trends in health care costs. The selection of assumptions is based on historical trends and known economic and market conditions at the time of valuation. Actual results may differ substantially from these assumptions. These differences may significantly impact future pension or retiree medical expenses.
Annual pension and retiree medical expense is principally the sum of three components: 1) increase in liability from interest; less 2) expected return on plan assets; and 3) other gains and losses as described below. The expected return on plan assets is calculated by applying an assumed long-term rate of return to the fair value of plan assets. In any given year, actual returns can differ significantly from the expected return. Differences between the actual and expected return on plan assets are combined with gains or losses resulting from the revaluation of plan liabilities. Plan liabilities are revalued annually, based on updated assumptions and information about the individuals covered by the plan. The combined gain or loss is generally expensed evenly over the remaining years that employees are expected to work.
Comprehensive Income (Loss):
The Company accounts for comprehensive income (loss) in accordance with the provisions of SFAS No. 130, “Reporting Comprehensive Income.” SFAS No. 130 is a financial statement presentation standard that requires the Company to disclose non-owner changes included in equity but not included in net income or loss. Comprehensive loss presented in the combined financial statements of Conexant’s net investment consists of Washington/Mexicali’s net loss and foreign currency translation adjustments prior to the Merger. The foreign currency translation adjustments are not recorded net of any tax effect, as management does not expect to incur any tax liability or benefit related thereto. Accumulated other comprehensive loss, prior to the Merger, is included in Conexant’s net investment in the combined balance sheets. Comprehensive loss, for periods subsequent to the Merger, consists of an adjustment to the Company’s minimum pension liability.
An analysis of other comprehensive income (loss) follows (in thousands):
Foreign Currency
Translation
Pension
Adjustments
Accumulated Other
Comprehensive
Income (Loss)
Balance as of September 30, 2001 $ (284 ) $ -- $ (284 ) Change in period 409 -- 409 Balance retained by Conexant (125 ) -- (125 )
Balance as of September 30, 2002 -- -- -- Change in period -- (632 ) (632 )
Balance as of September 30, 2003 $ -- $ (632 ) $ (632 )
Reclassifications:
Certain reclassifications have been made to the prior years’ financial statements to conform to the current year’s presentation.
Recent Accounting Pronouncements:
During fiscal 2003, the Company adopted the provisions of SFAS No. 146, “Accounting for Costs Associated with Exit or Disposal Activities”, FASB Interpretation No. (“FIN”) 45, “Guarantor’s Accounting and Disclosure Requirements for Guarantees, Including Indirect Guarantees of Indebtedness of Others” and FIN 46, “Consolidation of Variable Interest Entities” with no material impact to the consolidated financial statements. The disclosure requirements of FIN 45 are addressed in Note 15.
NOTE 3. BUSINESS COMBINATIONS
Merger with Conexant Systems, Inc.‘s Wireless Business
On December 16, 2001, Alpha, Conexant and Washington, a wholly owned subsidiary of Conexant, entered into a definitive agreement providing for the combination of Conexant’s wireless business with Alpha. Under the terms of the agreement, Conexant spun off its wireless business into Washington, including its gallium arsenide wafer fabrication facility located in Newbury Park, California, but excluding certain assets and liabilities, followed immediately by the Merger of this wireless business into Alpha with Alpha as the surviving entity in the Merger. The Merger was completed on June 25, 2002. Following the Merger, Alpha changed its corporate name to Skyworks Solutions, Inc.
Immediately following completion of the Merger, the Company purchased the Mexicali Operations for $150 million. For financial accounting purposes, the sale of the Mexicali Operations by Conexant to Skyworks Solutions was treated as if Conexant had contributed the Mexicali Operations to Washington as part of the spin-off, and the $150 million purchase price was treated as a return of capital to Conexant.
The Merger was accounted for as a reverse acquisition whereby Washington was treated as the acquirer and Alpha as the acquiree, primarily because Conexant shareholders owned a majority, approximately 67 percent, of the Company upon completion of the Merger. Under a reverse acquisition, the purchase price of Alpha was based upon the fair market value of Alpha common stock for a reasonable period of time before and after the announcement date of the Merger and the fair value of Alpha stock options. The purchase price of Alpha was allocated to the assets acquired and liabilities assumed by Washington, as the acquiring company for accounting purposes, based upon their estimated fair market value at the acquisition date. Because the Merger was accounted for as a purchase of Alpha, the historical financial statements of Washington/Mexicali became the historical financial statements of the Company after the Merger. Since the historical financial statements of the Company after the Merger do not include the historical financial results of Alpha for periods prior to June 25, 2002, the financial statements may not be indicative of future results of operations and are not indicative of the historical results that would have resulted if the Merger had occurred at the beginning of a historical financial period.
In connection with the Merger, the Company identified duplicate facilities resulting in a write-down of fixed assets with historical carrying values of $92.4 million to $20.2 million, a reduction in workforce of approximately 210 employees at a cost of $4.8 million and facility exit or closing costs of $3.1 million. The effects of these actions are reflected in the purchase price allocation below.
The total purchase price was valued at approximately $1.2 billion and is summarized as follows:
(in thousands)Fair market value of Alpha common stock$1,054,111Fair value of Alpha stock options95,388Estimated transaction costs of acquirer33,606
Total$1,183,105
The purchase price was allocated as follows:
(in thousands)Working capital$ 120,977Property, plant and equipment59,767Amortized intangible assets34,082Unamortized intangible assets2,300Goodwill902,653In-process research and development65,500Long-term debt(73)Other long-term liabilities(2,236)Deferred compensation135
Total$ 1,183,105
The following unaudited pro forma financial information presents the consolidated operations of the Company as if the June 25, 2002 Merger had occurred as of the beginning of the periods presented. This information gives effect to certain adjustments including increased amortization of intangibles and increased interest expense related to debt issued in conjunction with the Merger. In-process research and development of $65.5 million and other Merger-related expenses of $28.8 million have been excluded from the pro forma results as they are non-recurring and not indicative of normal operating results. This information is provided for illustrative purposes only, and is not necessarily indicative of the operating results that would have occurred had the Merger been consummated at the beginnings of the periods presented, nor is it necessarily indicative of any future operating results.
(in thousands, except per share data) Years Ended September 30, 2002
2001
Net revenue $ 543,091 $ 458,352 Net loss $(301,684 ) $(328,981 ) Net loss per share (basic and diluted) (1) $ (2.20 )
(1) SeeNote 2 to the consolidated financial statements
In connection with the Merger, $65.5 million was allocated to purchased in-process research and development and expensed immediately upon completion of the acquisition (as a charge not deductible for tax purposes) because the technological feasibility of certain products under development had not been established and no future alternative uses existed.
The semiconductor segment was involved in several projects that have been aggregated into the following categories based on the respective technologies:
Power Amplifier: Power amplifiers are designed and manufactured for use in different types of wireless handsets. The main performance attributes of these amplifiers are efficiency, power output, operating voltage and distortion. Current research and development is focused on expanding the offering to all types of wireless standards, improving performance by process and circuit improvements and offering a higher level of integration.
Control Products: Control products consist of switches and switch filters that are used in wireless applications for signal routing. Most applications are in the handset market enabling multi-mode, multi-band handsets. Current research and development is focused on performance improvement and cost reduction by reducing chip size and increasing functionality.
Broadband: The products in this grouping consist of radio frequency (RF) and millimeter wave semiconductors and components designed and manufactured specifically to address the needs of high-speed, wireline and wireless network access. Current and long-term research and development is focused on performance enhancement of speed and bandwidth as well as cost reduction and integration.
Silicon Diode: These products use silicon processes to fabricate diodes for use in a variety of RF and wireless applications. Current research and development is focused on reducing the size of the device, improving performance and reducing cost.
Ceramics: The ceramics segment was involved in projects that relate to the design and manufacture of ceramic-based components such as resonators and filters for the wireless infrastructure market. Current research and development is focused on performance enhancements through improved formulations and electronic designs.
The material risks associated with the successful completion of the in-process technology were associated with our ability to successfully finish the creation of viable prototypes and successful design of the chips, masks and manufacturing processes required. We expected to benefit from the in-process projects as the individual products that contained the in-process technology were put into production and sold to end-users. The release dates for each of the products within the product families were varied. The fair value of the IPR&D was determined using the income approach. Under the income approach, the fair value reflected the present value of the projected cash flows that were expected to be generated by the products incorporating the IPR&D, if successful. The projected cash flows were discounted to approximate fair value. The discount rate applicable to the cash flows of each project reflected the stage of completion and other risks inherent in each project. The weighted average discount rate used in the valuation of IPR&D was 30 percent. As of September 30, 2003, the Company had either completed or abandoned each of these projects. The completed IPR&D projects commenced generating cash flows in fiscal 2003. Due to the nature of these projects and the related technolgy, the revenue streams derived from these projects cannot be separately identified.
NOTE 4. INVENTORY
Inventories consist of the following (in thousands):
September 30, 2003
2002
Raw materials $ 8,475 $13,496 Work-in-process 35,797 27,764 Finished goods 13,896 14,383
$58,168 $55,643
As of September 29, September 30, 2006 2005 Raw materials $ 9,476 $ 8,080 Work-in-process 52,097 49,329 Finished goods 19,956 19,991 $ 81,529 $ 77,400
NOTE 5. The assessment of the recoverability of inventories, and the amounts of any write-downs, is based on currently available information and assumptions about future demand and the market conditions. Demand for products may fluctuate significantly over time, and actual demand and market conditions may be more or less favorable than those projected by management. In the event that actual demand is lower than originally projected, additional inventory write-downs may be required.PROPERTY, PLANT AND EQUIPMENT
Some or all of the inventories which have been written-down may be retained and made available for sale. In the event that actual demand is higher than originally projected, a portion of these inventories may be able to be sold in the future. Inventories which have been written-down and are identified as obsolete are generally scrapped.
NOTE 5. PROPERTY, PLANT AND EQUIPMENT
Property, plant and equipment consist of the following (in thousands):
September 30, 2003
2002
Land $ 9,423 $ 11,578 Land and leasehold improvements 3,410 6,583 Buildings 58,340 60,386 Machinery and equipment 249,124 250,500 Construction in progress 33,739 17,162
354,035 346,209
Accumulated depreciation and amortization (232,480 ) (202,436 )
$ 121,556 $ 143,773
NOTE 6. GOODWILL AND INTANGIBLE ASSETS
As of September 29, September 30, 2006 2005 Land $ 9,423 $ 9,423 Land and leasehold improvements 3,990 4,284 Buildings 55,983 59,586 Machinery and equipment 308,618 317,334 Construction in progress 22,564 14,312 400,578 404,939 Accumulated depreciation and amortization (250,195 ) (260,731 ) $ 150,383 $ 144,208
NOTE 6. The Company adopted SFAS No. 142, “Goodwill and Other Intangibles,” on October 1, 2002 and performed a transitional impairment test for goodwill. The goodwill impairment test is a two-step process. The first step of the impairment analysis compares the Company’s fair value to its net book value. In determining fair value, SFAS No. 142 allows for the use of several valuation methodologies, although it states quoted market prices are the best evidence of fair value. As part of the first step, the Company determined that it has one reporting unit for purposes of performing the fair-value based test of goodwill. This reporting unit is consistent with its single operating segment, which management determined is appropriate under the provisions of SFAS No. 131, “Disclosures about Segments of an Enterprise and Related Information.” The Company completed step one and determined that its goodwill and unamortized intangible assets were impaired. Step two of the analysis compares the implied fair value of goodwill to its carrying amount. If the carrying amount of goodwill exceeds its implied fair value, an impairment loss is recognized equal to that excess. The Company completed step two and determined that the carrying amount of its goodwill was $397.1 million greater than its implied fair value. This transitional impairment charge was recorded as a cumulative effect of a change in accounting principle in fiscal 2003. The Company tests its goodwill for impairment annually as of the first day of its fourth fiscal quarter and in interim periods if certain events occur indicating that the carrying value of goodwill may be impaired. The Company completed its annual goodwill impairment test for fiscal 2003 and determined that as of July 1, 2003, its goodwill was not further impaired.GOODWILL AND INTANGIBLE ASSETS
Goodwill and intangible assets are principally the result of the Merger completed on June 25, 2002. The Company tests its goodwill for impairment annually as of the first day of its fourth fiscal quarter and in interim periods if certain events occur indicating that the carrying value of goodwill may be impaired. The Company completed its annual goodwill impairment test for fiscal 2006 and determined that as of July 1, 2006, its goodwill was not impaired.Goodwill and intangible assets consist of the following (in thousands): As of September 29, 2006 September 30, 2005 Weighted Average Gross Net Gross Net Amortization Carrying Accumulated Carrying Carrying Accumulated Carrying Period (Years) Amount Amortization Amount Amount Amortization Amount Goodwill $ 493,389 $ — $ 493,389 $ 493,389 $ — $ 493,389 Amortized intangible assets Developed technology 10 $ 10,550 $ (5,525 ) $ 5,025 $ 10,550 $ (4,651 ) $ 5,899 Customer relationships 10 12,700 (5,408 ) 7,292 12,700 (4,138 ) 8,562 Other 3 122 (122 ) — 122 (122 ) — 23,372 (11,055 ) 12,317 23,372 (8,911 ) 14,461
63
September 30, 2003
September 30, 2002
Weighted
Average
Amortization
Period (Years)
Gross
Carrying
Amount
Accumulated
Amortization
Net
Carrying
Amount
Gross
Carrying
Amount
Accumulated
Amortization
Net
Carrying
Amount
Goodwill $ 505,514 $ -- $ 505,514 $ 905,219 $ -- $905,219 Amortized intangible assets: Developed technology 10 10,550 (2,806 ) 7,744 21,260 (576 ) 20,684 Customer relationships 10 12,700 (1,598 ) 11,102 12,700 (328 ) 12,372 Other 3 122 (56 ) 66 122 (11 ) 111
23,372 (4,460 ) 18,912 34,082 (915 ) 33,167 Unamortized intangible assets: Trademarks 3,269 -- 3,269 2,300 -- 2,300
10 $ 532,155 $ (4,460 ) $ 527,695 $ 941,601 $ (915 ) $940,686
As of September 29, 2006 September 30, 2005 Weighted Average Gross Net Gross Net Amortization Carrying Accumulated Carrying Carrying Accumulated Carrying Period (Years) Amount Amortization Amount Amount Amortization Amount Unamortized intangible assets Trademarks 3,269 — 3,269 3,269 — 3,269 Total intangible assets $ 26,641 $ (11,055 ) $ 15,586 $ 26,641 $ (8,911 ) $ 17,730
Annual amortization expense related to intangible assets areis as follows (in thousands):
Years Ended September 30,
2003
2002
2001
Amortization expense $ 3,545 $ 12,687 $ 15,267
Fiscal Years Ended September 29, September 30, October 1, 2006 2005 2004 Amortization expense $ 2,144 $ 2,165 $ 2,286
The changes in the gross carrying amount of goodwill and intangible assets are as follows:
Goodwill
Developed
Technology
Customer
Relationships
Trademarks
Other
Total
Balance as of September 30, 2001 $ 71,412 $ 5,995 $ -- $ -- $ 793 $ 78,200 Additions (deductions) during year 905,219 21,260 12,700 2,300 122 941,601 Impairment losses (71,412 ) (5,995 ) -- -- (793 ) (78,200 )
Balance as of September 30, 2002 905,219 21,260 12,700 2,300 122 941,601 Additions (deductions) during year (2,566 ) -- -- 969 -- (1,597 ) Transitional impairment loss (397,139 ) -- -- -- -- (397,139 ) Impairment losses (10,710 ) -- -- -- -- (10,710 )
Balance as of September 30, 2003 $ 505,514 $ 10,550 $12,700 $3,269 $ 122 $ 532,155
The additions (deductions) in fiscal 2003 primarily reflect income tax refunds and gains on the sale of acquired assets related to Alpha and the acquisition of a trademark. Impairment losses in fiscal 2003 represent the write-down of assets related to the Company’s infrastructure business and are included in special charges in the accompanying consolidated statements of operations.
The additions (deductions) in fiscal 2002 reflect the results of the purchase price allocation of Alpha in the Merger. Impairment losses in fiscal 2002 represent the write-down of all goodwill and other intangible assets associated with the Company’s acquisition of the Philsar Bluetooth business and are included in special charges in the accompanying consolidated statements of operations.
In accordance with SFAS No. 142, the following table provides net loss and related per share amounts for fiscal 2002 and 2001, as reported and adjusted as if the Company had ceased amortizing goodwill effective October 1, 2000.
(In thousands, except per share amounts) Years Ended September 30,
2002
2001
Reported net loss $ (236,064 ) $ (318,924 ) Goodwill amortization, net of tax 10,699 13,909
Adjusted net loss $ (225,365 ) $ (305,015 )
Per share information (1): Basic and diluted: Reported net loss $ (1.72) Goodwill amortization, net of tax 0.08
Adjusted net loss $ (1.64)
(1) SeeNote 2
Goodwill and Intangible Assets Developed Customer Goodwill Technology Relationships Trademarks Other Total Balance as of October 1, 2004 $ 504,493 $ 10,550 $ 12,700 $ 3,269 $ 122 $ 531,134 Deductions during year (11,104 ) — — — — (11,104 ) Balance as of September 30, 2005 $ 493,389 $ 10,550 $ 12,700 $ 3,269 $ 122 $ 520,030 Deductions during year — — — — — — Balance as of September 29, 2006 $ 493,389 $ 10,550 $ 12,700 $ 3,269 $ 122 $ 520,030
The reduction to goodwill in fiscal 2005 results from the consolidated financial statementsutilization of deferred tax assets for which no tax benefit was recognized as of the date of the Merger. The remaining pre-Merger deferred tax assets that could reduce goodwill in future periods are $31.9 million as of September 29, 2006.
Annual amortization expense related to intangible assets is expected to be as follows (in thousands):
2004
2005
2006
2007
2008
Amortization expense $ 2,285 $ 2,161 $ 2,144 $ 2,144 $ 2,144
NOTE 7. OTHER CURRENT LIABILITIES
Other current liabilities consist
2007 2008 2009 2010 2011 Amortization expense $ 2,144 $ 2,144 $ 2,144 $ 2,144 $ 2,144
NOTE 7. BORROWING ARRANGEMENTS
LONG-TERM DEBT Long-term debt consists of the following (in thousands): Fiscal Years Ended September 29, September 30, 2006 2005 Junior notes $ 179,335 $ 230,000 Less-current maturities — — $ 179,335 $ 230,000
Junior notes represent the Company’s 4.75% convertible subordinated notes due November 2007. These Junior notes can be converted into 110.4911 shares of common stock per $1,000 principal balance, which is the equivalent of a conversion price of approximately $9.05 per share. The Company may redeem the Junior notes at any time after November 20, 2005. The redemption price of the Junior notes between the period November 20, 2005 through November 14, 2006, will be $1,011.875 per $1,000 principal amount of notes to be redeemed, plus accrued and unpaid interest, if any, to the redemption date. The redemption price of the notes beginning on November 15, 2006 and thereafter will be $1,000 per $1,000 principal amount of notes to be redeemed, plus accrued and unpaid interest, if any, to the redemption date. Holders may require the Company to repurchase the Junior notes upon a change in control of the Company. The Company pays interest in cash semi-annually in arrears on May 15 and November 15 of each year. The fair value of the Company’s long-term debt approximated $178.2 million at September 29, 2006. The Company retired $50.7 million of its 4.75% convertible subordinated notes through an open market repurchase transaction during fiscal 2006, recording a gain of approximately $50,000 and expensing approximately $572,000 in previously capitalized deferred financing costs.64
September 30, 2003
2002
Product warranty accrual $ 6,131 $13,372 Accrued merger expenses 452 42,764 Other 21,220 28,427
$27,803 $84,563
NOTE 8. BORROWING ARRANGEMENTS
LONG-TERM
Aggregate annual maturities of long-term debt are as follows (in thousands): Fiscal Year 2007 — 2008 179,335 $ 179,335
SHORT-TERM DEBTOn July 15, 2003, the Company entered into a receivables purchase agreement under which it has agreed to sell from time to time certain of its accounts receivable to Skyworks USA, Inc. (“Skyworks USA”), a wholly-owned special purpose entity that is fully consolidated for accounting purposes. Concurrently, Skyworks USA entered into an agreement with Wachovia Bank, N.A. providing for a $50.0 million credit facility (“Facility Agreement’’) secured by the purchased accounts receivable. As a part of the consolidation, any interest incurred by Skyworks USA related to monies it borrows under the Facility Agreement is recorded as interest expense in the Company’s results of operations. The Company performs collections and administrative functions on behalf of Skyworks USA. Interest related to the Facility Agreement is at LIBOR plus 0.4%. As of September 29, 2006, Skyworks USA had borrowed $50.0 million under this agreement.NOTE 8. INCOME TAXES
Income (loss) before income taxes and cumulative effect of change in accounting principle consists of the following components (in thousands): Fiscal Years Ended September 29, September 30, October 1, 2006 2005 2004 United States $ (87,169 ) $ 23,885 $ 15,029 Foreign 14,395 17,104 11,367 $ (72,774 ) $ 40,989 $ 26,396
The provision for income taxes from operations consists of the following (in thousands): Fiscal Years Ended September 29, September 30, October 1, 2006 2005 2004 Current tax expense (benefit): Federal $ (52 ) $ 367 $ — State — (1,032 ) (1,040 ) Foreign 438 1,178 837 386 513 (203 ) Deferred tax expense: Federal — — — State — — — Foreign 14,992 3,761 3,165 14,992 3,761 3,165 Charge in lieu of tax expense — 11,104 1,022 Provision for income taxes $ 15,378 $ 15,378 $ 3,984
The actual income tax expense reported for operations is different than that which would have been computed by applying the federal statutory tax rate to income (loss) before income taxes and cumulative effect of change in accounting principle. A reconciliation of income tax expense as computed at the United States Federal statutory income tax rate to the provision for income tax expense follows (in thousands): Fiscal Years Ended September 29, September 30, October 1, 2006 2005 2004 Tax (benefit) expense at United States statutory rate $ (25,471 ) $ 14,346 $ 9,239
65
Fiscal Years Ended September 29, September 30, October 1, 2006 2005 2004 Foreign tax rate difference 10,391 (1,048 ) 23 Deemed dividend from foreign subsidiary — 8,956 — Nondeductible interest expense — — 1,162 Research and development credits (1,500 ) (5,000 ) (4,600 ) State income taxes — (1,032 ) (1,040 ) Change in valuation allowance 31,261 (13,436 ) (2,466 ) Charge in lieu of tax expense — 11,104 1,022 Other, net 697 1,488 644 Provision for income taxes $ 15,378 $ 15,378 $ 3,984
The charge in lieu of tax expense resulted from partial recognition of certain acquired tax benefits that were subject to a valuation allowance at the time of acquisition, the realization of which required a reduction of goodwill.Deferred income tax assets and liabilities consist of the tax effects of temporary differences related to the following (in thousands): Fiscal Years Ended September 29, September 30, 2006 2005 Current: Inventories $ 10,550 $ 4,920 Bad debts 13,431 2,004 Accrued compensation and benefits 4,242 2,919 Product returns, allowances and warranty 1,648 1,247 Restructuring 7,845 393 Prepaid insurance (772 ) (818 ) Other — net (535 ) 1,085 Current deferred tax assets 36,409 11,750 Less valuation allowance (36,070 ) (10,665 ) Net current deferred tax assets 339 1,085 Long-term: Property, plant and equipment 9,859 18,474 Intangible assets 7,439 7,406 Retirement benefits and deferred compensation 5,712 1,183 Net operating loss carryforwards 62,768 65,936 Federal tax credits 23,934 21,399 State investment credits 5,560 4,419 Restructuring — 1,506 Other — net 3,733 1,136 Long-term deferred tax assets 119,005 121,459 Less valuation allowance (118,755 ) (105,408 ) Net long-term deferred tax assets 250 16,051 Total deferred tax assets $ 589 $ 17,136
Based upon a history of significant operating losses, management has determined that it is more likely than not that historic and current year income tax benefits will not be realized except for certain future deductions associated with the Company’s foreign operations. Consequently, no United States income tax benefit has been recognized relating to the United States operating losses. As of September 29, 2006, the Company has established a valuation allowance against all of its net United States deferred tax assets. The net change in the valuation allowance of $38.8 million is principally due to restructuring charges recorded against the Company’s United States operations that were not tax benefited. As noted above, the Company has a valuation allowance of $154.8 million against its United States deferred tax assets as of September 29, 2006. When recognized, the tax benefits relating to any reversal of the valuation allowance on deferred tax assets at September 29, 2006 will be accounted for as follows: approximately $119.0 million will be recognized as a reduction of income tax expense, $31.9 million will be recognized as a reduction of goodwill and $3.9 million will be recognized as an increase to shareholders’ equity for certain tax deductions from employee stock options.66
The provision for income taxes for fiscal 2006 and fiscal 2005 consists of approximately $0.0 million and $11.1 million, respectively, of United States income taxes recorded as a charge reducing the carrying value of goodwill. No benefit has been recognized for utilizing certain acquisition related deferred tax assets. The utilization of these deferred items reduces the carrying value of goodwill, i.e., charge in lieu of tax expense, instead of reducing income tax expense. We evaluate the realization of these deferred tax assets periodically and adjust the provision for income taxes accordingly based on whether the Company believes it is more likely than not that the deferred tax assets will be realized during the carryforward period.Deferred tax assets have been recognized for foreign operations when management believes they will more likely than not be recovered during the carryforward period. The Company does not expect to recognize any income tax benefits relating to future operating losses generated in the United States until management determines that such benefits are more likely than not to be realized.In 2002, the Company recorded a tax benefit of approximately $23.0 million related to the impairment of its Mexico assets. A valuation allowance had not been established because the Company believed that the related deferred tax asset would more likely than not be recovered during the carryforward period. During the first quarter of fiscal 2005, the Company reduced the carrying value of its deferred tax assets by $2.2 million. This charge resulted from a reduction of the statutory income tax rate in Mexico. Accordingly, the deferred tax asset was remeasured using the enacted tax rates expected to apply to taxable income in the years in which the temporary difference is expected to be recovered.In 2006, the Company reorganized its Mexico operations. As a result, the long term deferred tax asset relating to the impairment of its Mexico assets was written off because the machinery and equipment was transferred to a United States company. The write-off increased tax expense by $14.6 million net of a deferred tax charge associated with this reorganization. The deferred tax asset allowable for United States tax purposes is included in the Company’s U.S. deferred tax assets subject to a valuation allowance as previously discussed.Gains and losses resulting from the remeasurement of the Company’s long-term deferred tax assets denominated in foreign currencies are included in the provision (benefit) for income taxes and increased tax expense by $0.2 million and $2.2 million in fiscal 2006 and fiscal 2004, respectively. The aforementioned gains and losses reduced tax expense by $0.8 million in fiscal 2005.As of September 29, 2006, the Company has United States federal net operating loss carryforwards of approximately $187.1 million, which will expire at various dates through 2026 and aggregate state net operating loss carryforwards of approximately $17.5 million, which will expire at various dates through 2010. The Company also has United States federal and state income tax credit carryforwards of approximately $29.5 million. The United States federal tax credits expire at various dates through 2025.No provision has been made for United States federal, state, or additional foreign income taxes related to approximately $12.1 million of undistributed earnings of foreign subsidiaries which have been or are intended to be permanently reinvested. It is not practicable to determine the United States federal income tax liability, if any, which would be payable if such earnings were not permanently reinvested.In fiscal 2005 our subsidiary in Mexico issued a dividend of approximately $25.6 million of earnings to the United States. Such earnings, which were not subject to Mexico withholding tax and could be applied against United States net operating loss carryforwards, resulted in no significant United States income tax expense. Earnings of our Mexico subsidiary are no longer considered permanently reinvested, and accordingly, United States income taxes are provided on current earnings attributable to our earnings in Mexico.On October 22, 2004, the American Jobs Creation Act of 2004 (“AJCA”) was signed into law. The AJCA provides incentives for United States multinational corporations, subject to certain limitations. The incentives include an 85% dividends received deduction for certain dividends from controlled foreign corporations that repatriate accumulated income abroad. Due to the existence and amount of the Company’s net operating loss carryforwards, the Company did not benefit from this provision in the AJCA.67
NOTE 9. STOCKHOLDERS’ EQUITY
COMMON STOCKThe Company is authorized to issue (1) 525,000,000 shares of common stock, par value $0.25 per share, and (2) 25,000,000 shares of preferred stock, without par value.Holders of the Company’s common stock are entitled to such dividends as may be declared by the Company’s Board of Directors out of funds legally available for such purpose. Dividends may not be paid on common stock unless all accrued dividends on preferred stock, if any, have been paid or declared and set aside. In the event of the Company’s liquidation, dissolution or winding up, the holders of common stock will be entitled to share pro rata in the assets remaining after payment to creditors and after payment of the liquidation preference plus any unpaid dividends to holders of any outstanding preferred stock.Each holder of the Company’s common stock is entitled to one vote for each such share outstanding in the holder’s name. No holder of common stock is entitled to cumulate votes in voting for directors. The Company’s second amended and restated certificate of incorporation provides that, unless otherwise determined by the Company’s Board of Directors, no holder of common stock has any preemptive right to purchase or subscribe for any stock of any class which the Company may issue or sell.On August 11, 2003 the Company filed a shelf registration statement on Form S-3 with the SEC with respect to the issuance of up to $250 million aggregate principal amount of securities, including debt securities, common or preferred shares, warrants or any combination thereof. This registration statement, which the SEC declared effective on August 28, 2003, provides the Company with greater flexibility and access to capital. On September 9, 2003, the Company issued 9.2 million shares of common stock under its shelf registration statement. Currently, approximately $144 million remains on this 2003 shelf registration. The Company may from time to time issue securities under the remaining balance of the shelf registration statement for general corporate purposes.At September 29, 2006, the Company had 161,689,853 shares of common stock issued and 161,658,561 shares outstanding.PREFERRED STOCKThe Company’s second amended and restated certificate of incorporation permits the Company to issue up to 25,000,000 shares of preferred stock in one or more series and with rights and preferences that may be fixed or designated by the Company’s Board of Directors without any further action by the Company’s stockholders. The designation, powers, preferences, rights and qualifications, limitations and restrictions of the preferred stock of each series will be fixed by the certificate of designation relating to such series, which will specify the terms of the preferred stock. At September 29, 2006, the Company had no shares of preferred stock issued or outstanding.EMPLOYEE STOCK BENEFIT PLANSNet loss for the fiscal year ended September 29, 2006 included share-based compensation expense under SFAS 123(R) of $14.2 million including $11.2 million on employee stock options, $0.7 million on non-vested restricted stock with service and market conditions, $0.3 million on non-vested restricted stock with service conditions, $0.3 million on performance shares, and $1.7 million on the Employee Stock Purchase Plan (“ESPP”). Net income for fiscal year ended September 30, 2005 reflected share-based compensation expense of $26,000 for restricted stock awards issued during the period. There was no share-based compensation expense for fiscal 2004 relating to restricted stock awards. No share-based compensation expense related to employee stock options or ESPP purchases was recognized prior to October 1, 2005 because the Company had not adopted the recognition provisions of Statement of Financial Accounting Standards No. 123, “Accounting for Stock-Based Compensation” (“SFAS 123”).Employee Stock Purchase PlanThe Company maintains a domestic and an international employee stock purchase plan. Under these plans, eligible employees may purchase common stock through payroll deductions of up to 10% of compensation. The price per share is the lower of 85% of the market price at the beginning or end of each offering period (generally six months).68
The plans provide for purchases by employees of up to an aggregate of 4.6 million shares through December 31, 2012. Shares of common stock purchased under these plans in fiscal 2006, 2005, and 2004 were 835,621, 824,211, and 616,760, respectively. At September 29, 2006, there are 1.7 million shares available for purchase. The Company recognized compensation expense of $1.7 million for the fiscal year ended September 29, 2006. The Company did not recognize any compensation expense under these plans in fiscal 2005 or 2004.Employee Stock Option PlansThe Company has share-based compensation plans under which employees and directors may be granted options to purchase common stock. Options are generally granted with exercise prices at not less than the fair market value on the grant date, generally vest over 4 years and expire 7 or 10 years after the grant date. As of September 29, 2006, a total of 46.8 million shares are authorized for grant under the Company’s share-based compensation plans. The number of common shares reserved for granting of future awards to employees and directors under these plans was 15.0 million at September 29, 2006. In addition, options outstanding as of September 29, 2006 include 9.7 million options issued in connection with the Merger. The remaining unrecognized compensation expense on stock options at September 29, 2006 was $18.9 million. The weighted average period over which the cost is expected to be recognized is approximately 1.8 years.Pursuant to an exchange offer dated June 16, 2003 (the “Exchange Offer”), the Company offered a stock option exchange program to its employees, other than its executive officers under Section 16 of the Securities Exchange Act of 1934, as amended, giving them the right to tender outstanding stock options with an exercise price of $13.00 per share or more in exchange for new options to be issued six months and one day after the close of the Exchange Offer. On July 3, 2003, the expiration date of the Company’s Exchange Offer, the Company accepted for exchange from eligible employees, options to purchase an aggregate of approximately 5.3 million shares of the Company’s common stock. These stock options were cancelled as of that date. Pursuant to the Exchange Offer, a ratio was applied to the options accepted for exchange from eligible employees and on January 5, 2004, the Company issued new options to purchase approximately 3.4 million shares of the Company’s common stock with an exercise price at fair market value ($9.60) in exchange for the options cancelled in connection with the offer. These new options vest ratably over the 18 month period from the date of grant. The Exchange Offer qualified for fixed accounting, and thus the Company did not recognize compensation expense in connection with the grant of the replacement options pursuant to the Exchange Offer.As of September 29, 2006, the Company had 10 equity compensation plans under which our equity securities are authorized for issuance to our employees and/or directors:– the 1986 Long-Term Incentive Plan, Long-term debt consists of –the following (in thousands):1994 Non-Qualified Stock Option Plan
September 30, 2003
2002
Junior notes $230,000 $ -- Senior notes 45,000 -- Conexant Mexicali note -- 150,000 Conexant revolving credit line used -- 30,000 CDBG Grant 29 168
275,029 180,168 Less - current maturities 29 129
$275,000 $180,039
Junior notes represent –the Company’s 4.75 percent convertible subordinated notes due 2007. These Junior notes can be converted into 110.4911 shares of common stock per $1,000 principal balance, which is the equivalent of a conversion price of approximately $9.05 per share. The Company may redeem the Junior notes at any time after November 20, 2005. The redemption price of the Junior notes during the period between November 20, 2005 through November 14, 2006 will be $1,011.875 per $1,000 principal amount of notes to be redeemed, plus accrued and unpaid interest, if any, to the redemption date, and the redemption price of the notes beginning on November 15, 2006 and thereafter will be $1,000 per $1,000 principal amount of notes to be redeemed, plus accrued and unpaid interest, if any, to the redemption date. Holders may require the Company to repurchase the Junior notes upon a change in control of the Company. The Company will pay interest in cash semi-annually in arrears on May 15 and November 15 of each year.1996 Long-Term Incentive Plan
Senior notes represent –the Company’s 15 percent convertible senior subordinated notes due June 30, 2005, which were issued as part of the Company’s debt refinancing with Conexant completed on November 13, 2002. These Senior notes can be converted into the Company’s common stock at a conversion rate based on the applicable conversion price, which is subject to adjustment based on, among other things, the market price of the Company’s common stock. Based on this adjustable conversion price, the Company expects that the maximum number of shares that could be issued under the Senior notes is approximately 7.1 million shares, subject to adjustment for stock splits and other similar dilutive occurrences. If the holder(s) of these Senior notes converted the notes at a price that is less than the original conversion price ($7.87) as the result of a decrease in the market price of the Company’s stock, the Company would be required to record a charge to interest expense in the period of conversion. At maturity (including upon certain acceleration events), the Company will pay the principal amount of the Senior notes by issuing a number of shares of common stock equal to the principal amount of the Senior notes then due and payable divided by the applicable conversion price in effect on such date, together with cash in lieu of any fractional shares. The Company may redeem the Senior notes at any time after May 12, 2004 at $1,030 per $1,000 principal amount of Senior notes to be redeemed, plus accrued and unpaid interest. The holder(s) may require the Company to repurchase the Senior notes upon a change in control of the Company. The Company pays interest in cash on the Senior notes on the last business day of each March, June, September and December of each year. Interest on the Senior notes is not deductible for tax purposes because of the conversion feature.Directors’ 1997 Non-Qualified Stock Option Plan
The Company has a ten-year $960,000 loan from –the State of Maryland under the Community Development Block Grant (“CDBG”) program. Quarterly payments are due through December 2003 and represent principal plus interest at 5 percent of the unamortized balance.1999 Employee Long-Term Incentive Plan
Aggregate annual maturities of long-term debt are as follows (in thousands):–the Directors’ 2001 Stock Option Plan
Fiscal Year
2004 $ 29 2005 45,000 2006 -- 2007 -- 2008 230,000
$275,029
SHORT-TERM DEBT
On July 15, 2003, –the Company entered into a receivables purchase agreement under which it has agreed to sell from time to time certain of its accounts receivable to Skyworks USA, Inc. (“Skyworks USA”), a wholly-owned special purpose entity that is fully consolidated for accounting purposes. Concurrently, Skyworks USA entered into an agreement with Wachovia Bank, National Association providing for a $50 million credit facility (“Facility Agreement”) secured by the purchased accounts receivable. As a part of the consolidation, any interest incurred by Skyworks USA related to monies it borrows under the Facility Agreement is recorded as interest expense in the Company’s results of operations. The Company performs collections and administrative functions on behalf of Skyworks USA. As of September 30, 2003, Skyworks USA had borrowed $41.7 million under this agreement.Non-Qualified Employee Stock Purchase Plan
NOTE 9. INCOME TAXES
Income (loss) before income taxes and cumulative effect of change in accounting principle consists of –the following components (in thousands):2002 Employee Stock Purchase Plan
Years Ended September 30,
2003
2002
2001
United States $(59,379 ) $(151,214 ) $(323,642 ) Foreign 5,754 (104,439 ) 6,337
$(53,625 ) $(255,653 ) $(317,305 )
The provision for income taxes from continuing operations consists of the following (in thousands):–
Years Ended September 30,
2003
2002
2001
Current tax expense: Federal $ -- $ -- $ -- State -- -- -- Foreign 1,414 3,506 1,619
1,414 3,506 1,619 Deferred tax expense (benefit): Federal -- -- -- State -- -- -- Foreign (762 ) (23,095 ) --
(762 ) (23,095 ) -- Net income tax expense (benefit) $ 652 $(19,589 ) $1,619
The actual income tax expense (benefit) reported from operations are different than those which would have been computed by applying the federal statutory tax rate to income (loss) before income tax expense (benefit). A reconciliation of income tax expense (benefit) as computed at the U.S. Federal statutory income tax rate to the provision for income tax expense (benefit) as follows (in thousands):
Years Ended September 30,
2003
2002
2001
Tax (benefit) expense at U.S. statutory rate $ (18,769 ) $ (89,479 ) $ (111,057 ) Foreign tax rate difference (1,362 ) 3,529 (599 ) Nondeductible amortization of intangible assets -- 16,151 5,099 Nondeductible in-process research and development -- 22,925 -- Nondeductible interest expense 2,113 -- -- Pre-distribution loss not available to Skyworks -- 21,968 -- Research and development credits (5,369 ) (711 ) (4,921 ) State income taxes, net of federal benefit -- -- (11,672 ) Change in valuation allowance 25,168 5,947 123,466 Other, net (1,129 ) 81 1,303
$ 652 $ (19,589 ) $ 1,619
Deferred income tax assets and liabilities consist of the tax effects of temporary differences related to the following (in thousands):
September 30, 2003
2002
Current: Inventories $ 11,878 $ 14,352 Deferred revenue -- 258 Accrued compensation and benefits 1,907 1,914 Product returns, allowances and warranty 4,259 8,097 Restructuring 1,295 5,475 Deferred state taxes -- -- Other - net 1,494 523
Current deferred income taxes 20,833 30,619
Long-term: Property, plant and equipment 46,356 51,321 Intangible assets 8,837 (13,029 ) Retirement benefits and deferred compensation 1,172 931 Net operating loss carryforwards 61,049 27,003 Federal tax credits 7,798 3,904 State investment credits 5,541 2,672 Restructuring 2,978 2,688 Other - net 855 (416 )
Long-term deferred income taxes 134,586 75,074
Total deferred income taxes 155,419 105,693
Valuation allowance (131,975 ) (83,206 )
Net deferred tax assets $ 23,444 $ 22,487
Based upon a history of significant operating losses, management has determined that it is more likely than not that historic and current year income tax benefits will not be realized except for certain future deductions associated with the Mexicali Operations in the post-Merger period. Consequently, no United States income tax benefit has been recognized relating to the U.S. operating losses. As of September 30, 2003, the Company has established a valuation allowance against all of its net U.S. deferred tax assets. The net change in the valuation allowance of $48.8 million is principally due to the generation of additional tax attributes, i.e. federal and state net operating loss and credit carryovers, and other intangibles associated with the Mexicali transaction. The future realization of certain deferred assets will be applied to reduce the carrying value of goodwill. The portion of the valuation allowance for these deferred tax assets for which subsequently recognized tax benefits will be applied to reduce goodwill related to the purchase consideration of the Merger with Alpha is approximately $44 million. Deferred tax assets have been recognized for foreign operations when management believes they will be recovered during the carry-forward period. The Company does not expect to recognize any income tax benefits relating to future operating losses generated in the United States until management determines that such benefits are more likely than not to be realized. In 2002, the Company recorded a tax benefit of approximately $23 million related to the impairment of its Mexicali assets. A valuation allowance has not been established because the Company believes that the related deferred tax asset will be recovered during the carryforward period.
As of September 30, 2003, the Company has U.S. federal net operating loss carryforwards of approximately $164.5 million which will expire at various dates through 2023 and aggregate state net operating loss carryforwards of approximately $59.5 million which will expire at various dates through 2008. The Company also has U.S. federal and state income tax credit carryforwards of approximately $12.4 million. The U.S. federal tax credits expire at various dates through 2023. The use of the pre-Merger net operating loss and tax credit carryovers from Alpha will be limited due to statutory tax restrictions resulting from the Merger and related change in ownership. The annual limit on the utilization of pre-merger net operating losses has been estimated at $14 million. Pre-Merger credits would also be subject to the tax equivalent of the annual net operating loss limitation.
No provision has been made for United States, state, or additional foreign income taxes related to approximately $3.8 million of undistributed earnings of foreign subsidiaries which have been or are intended to be permanently reinvested. It is not practical to determine the United States federal income tax liability, if any, which would be payable if such earnings were not permanently reinvested.
As part of the spin-off and the Merger, Washington, Conexant and Alpha entered into a tax allocation agreement which provides, among other things, for the allocation between Conexant and the combined company of certain tax liabilities relating to the Washington Business. In general, Conexant assumed and is responsible for tax liabilities of the Washington Business and Washington for periods prior to the Merger and the combined company has assumed and is responsible for tax liabilities of the Washington Business for periods after the Merger. Subsequent to the execution of the tax allocation agreement, and in connection with the refinancing agreement and amended financing agreement with Conexant, we entered into a letter agreement on November 6, 2002 with Conexant that amends the tax allocation agreement to limit our indemnification obligations under the tax allocation agreement to a reduced set of circumstances that could trigger such indemnification. However, the tax allocation agreement continues to provide that we will be responsible for various other tax obligations and for compliance with various representations and covenants made under the tax allocation agreement.
NOTE 10. STOCKHOLDERS’ EQUITY
Prior to the Merger with Alpha, Conexant’s wireless business had no separate capitalization. The following information represents the Company’s capital structure following the Merger.
COMMON STOCK
The Company is authorized to issue (1) 525,000,000 shares of common stock, par value $0.25 per share, and (2) 25,000,000 shares of preferred stock, without par value.
Holders of the Company’s common stock are entitled to such dividends as may be declared by the Company’s board of directors out of funds legally available for such purpose. Dividends may not be paid on common stock unless all accrued dividends on preferred stock, if any, have been paid or declared and set aside. In the event of the Company’s liquidation, dissolution or winding up, the holders of common stock will be entitled to share pro rata in the assets remaining after payment to creditors and after payment of the liquidation preference plus any unpaid dividends to holders of any outstanding preferred stock.
Each holder of the Company’s common stock is entitled to one vote for each such share outstanding in the holder’s name. No holder of common stock is entitled to cumulate votes in voting for directors. The Company’s second amended and restated certificate of incorporation provides that, unless otherwise determined by the Company’s board of directors, no holder of common stock has any preemptive right to purchase or subscribe for any stock of any class which the Company may issue or sell.
On August 11, 2003 the Company filed a shelf registration statement on Form S-3 with the Securities and Exchange Commission (“SEC”) with respect to the issuance of up to $250 million aggregate principal amount of securities, including debt securities, common or preferred shares, warrants or any combination thereof. This registration statement, which the SEC declared effective on August 28, 2003, provides the Company with greater flexibility and access to capital. On September 9, 2003 the Company issued 9.2 million shares of common stock under its shelf registration statement. The Company may from time to time issue securities under the remaining balance of the shelf registration statement for general corporate purposes.
At September 30, 2003, the Company had 148,604,137 shares of common stock issued and outstanding.
PREFERRED STOCK
The Company’s second amended and restated certificate of incorporation permits the Company to issue up to 25,000,000 shares of preferred stock in one or more series and with rights and preferences that may be fixed or designated by the Company’s board of directors without any further action by the Company’s stockholders. The designation, powers, preferences, rights and qualifications, limitations and restrictions of the preferred stock of each series will be fixed by the certificate of designation relating to such series, which will specify the terms of the preferred stock.
At September 30, 2003, the Company had no shares of preferred stock issued or outstanding.
STOCK OPTIONS
The Company has stock option plans under which employees may be granted options to purchase common stock. Options are generally granted with exercise prices at not less than the fair market value on the grant date, generally vest over four years and expire ten years after the grant date. As of September 30, 2003, a total of 24.1 million shares are authorized for grant under the Company’s long-term incentive plans. The number of common shares reserved for granting of future awards was 14.2 million at September 30, 2003.
Pursuant to an exchange offer dated June 16, 2003 (the “Exchange Offer”), the Company offered a stock option exchange program to its employees, other than its executive officers under Section 16 of the Securities Exchange Act of 1934, as amended, giving them the right to tender outstanding stock options with an exercise price of $13.00 per share or more in exchange for new options to be issued six months and one day after the close of the Exchange Offer. On July 3, 2003, the expiration date of the Company’s Exchange Offer, the Company accepted for exchange from eligible employees options to purchase an aggregate of 5,328,085 shares of the Company’s common stock. These stock options were cancelled as of that date. Pursuant to the Exchange Offer, a ratio was applied to the options accepted for exchange from eligible employees and the Company expects that it will issue, on January 5, 2004, new options to purchase approximately 3,428,881 shares of the Company’s common stock with an exercise price at fair market value in exchange for the options cancelled in connection with the offer. These new options will vest ratably over an eighteen-month period. The Exchange Offer qualifies for fixed accounting and thus the Company does not expect to recognize compensation expense in connection with the grant of the replacement options pursuant to the Exchange Offer.
In connection with Conexant’s spin-off of Washington, options to purchase shares of Conexant common stock were adjusted so that immediately following the spin-off, option holders held options to purchase shares of Conexant common stock and options to purchase Washington common stock. In connection with the Merger, those options to purchase shares of Washington common stock were converted into options to purchase the Company’s common stock, par value $0.25 per share. The terms of options to purchase the Company’s common stock will be governed by the Washington Sub, Inc. 2002 Stock Option Plan which was assumed by Skyworks in the Merger and which provides that such options will generally have the same terms and conditions applicable to the original Conexant options. These options are included in the following schedules and options related to non-employees are disclosed separately below.
A summary of stock option transactions follows (shares in thousands):–
Shares
Weighted average
exercise price of
shares under plan
Balance outstanding prior to the close of the Merger -- $ --
Recapitalization as a result of the Merger: Alpha options assumed 8,277 18.97 Conexant options assumed 23,188 20.80 Balance outstanding at June 25, 2002 31,465 $20.32
Granted 998 4.69 Exercised (20 ) 2.08 Cancelled (1,111 ) 23.35
Balance outstanding at September 30, 2002 31,332 $19.73
Granted 6,372 5.06 Exercised (496 ) 6.37 Accepted for exchange (5,328 ) 23.38 Cancelled (6,117 ) 20.21
Balance outstanding at September 30, 2003 25,763 $15.44
Options exercisable at the end of each fiscal year (shares in thousands):2005 Long-Term Incentive Plan
Shares
Weighted average
exercise price
2003 15,141 $ 19 .03 2002 16,080 $ 19 .86
Except for the 1999 Employee Long-Term Incentive Plan, the Washington Sub, Inc. 2002 Stock Option Plan and the Non-Qualified Employee Stock Purchase Plan, each of the foregoing equity compensation plans was approved by our stockholders.Non-Vested (“Restricted”) Stock Awards With Service ConditionsThe Company’s share-based compensation plans provide for awards of restricted shares of common stock and other stock-based incentive awards to officers, other employees and certain non-employees. Restricted stock awards are subject to forfeiture if employment terminates during the prescribed retention period (generally within four years of the date of award). The Company granted 106,000 restricted shares in fiscal 2006 and 160,500 restricted shares in fiscal 2005 with a four year graded vesting. The remaining unrecognized compensation expense on restricted stock70
with service conditions outstanding at September 29, 2006 was $0.9 million, and the weighted average period over which the cost is expected to be recognized is 3.0 years.Non-Vested (“Restricted”) Stock Awards With Market Conditions and Service ConditionsThe Company granted 493,125 shares of restricted common stock with market conditions and service conditions during fiscal 2006. The market condition allows for accelerated vesting of the award as of the first, second, and, if not previously accelerated, the third anniversary of the grant date. Specifically, if the Company’s stock performance meets or exceeds the 60th percentile of its selected peer group for the years ended on each of the first three anniversaries of the grant date, then 50% of the award vests upon each anniversary (up to 100%). If the restricted stock recipient meets the service condition but not the market condition in years 1, 2 and 3, then the restricted stock vests 50% at the end of year 3 and 50% at the end of year 4. The Company calculated a derived service period of approximately 2.5 years using a Monte-Carlo simulation to simulate a range of possible future stock prices for the Company and the members of the Company’s selected peer group. The remaining unrecognized compensation expense on restricted stock with market and service condition vesting at September 29, 2006 was $1.3 million. The weighted average period over which the cost is expected to be recognized is approximately 1.6 years.Non-Vested (“Restricted”) Stock AwardsThe Company granted 446,000 shares of restricted common stock during fiscal 2006. This restricted stock will vest over a three year period (50% at the end of year 1, and 25% at the end of both year 2 and year 3). The remaining unrecognized compensation expense on restricted stock with market and service condition vesting at September 29, 2006 was $1.9 million. The weighted average period over which the cost is expected to be recognized is approximately 2.0 years.Performance Units With Milestone-Based Performance ConditionsThe Company granted 222,000 performance units to non-executives with milestone-based performance conditions during the fiscal year ended September 29, 2006. The units will convert to common stock at such time that the performance conditions are deemed to be achieved. The performance units will be expensed over implicit performance periods ranging from 11-23 months. The Company will utilize both quantitative and qualitative criteria to judge whether the milestones are probable of achievement. If the milestones are deemed to be not probable of achievement no expense will be recognized until such time as they become probable of achievement. If a milestone is initially deemed probable of achievement and subsequent to that date it is deemed to be not probable of achievement the Company will discontinue recording expense on the units. If the milestone is deemed to be improbable of achievement any expense recorded on those units will be reversed. The fair value of the performance units at the date of grant was $1.2 million in the aggregate. Of the 222,000 performance units, we issued 49,000 shares in fiscal 2006 as a result of milestone achievement. In addition, certain other milestones were deemed to be probable of achievement thus we recorded total compensation expense of $0.3 million in fiscal 2006.Share-Based Compensation Plans for DirectorsThe Company has three share-based compensation plans for non-employee directors — the 1994 Non-Qualified Stock Option Plan, the 1997 Non-Qualified Stock Option Plan and the Directors’ 2001 Stock Option Plan. Under the three plans, a total of 1.5 million shares have been authorized for option grants. As of September 29, 2006, under the three plans, a total of 0.2 million shares are available for new grants. The three plans have substantially similar terms and conditions and are structured to provide options to non-employee directors as follows: a new director receives a total of 45,000 options upon becoming a member of the Board; and continuing directors receive 15,000 options after each Annual Meeting of Stockholders. The maximum contractual term of the Director stock options is 10 years. Under these plans, the option price is the fair market value at the time the option is granted. Beginning in fiscal 2001, all options granted became exercisable 25% per year beginning one year from the date of grant. Options granted prior to fiscal 2001 became exercisable at a rate of 20% per year beginning one year from the date of grant. During the fiscal year ended September 29, 2006, there were 165,000 options granted under these plans at a weighted average exercise price of $6.85. At September 29, 2006, a total of 0.9 million options at a weighted average exercise price of $9.89 per share are outstanding under these three plans, and 0.6 million shares were exercisable at a weighted average exercise price of $11.63 per share. The remaining unrecognized compensation expense on director stock options at September 29, 2006 was $1.2 million. The weighted average period over which the cost is expected to be recognized is approximately 2.0 years. During the fiscal year ended October 1, 2004, there were 15,000 options exercised under these plans. For the fiscal years ended September 29, 2006 and September 30,71
2005, there were no options exercised. The above-mentioned activity for the share-based compensation plans for directors is included in the option tables below.Distribution and Dilutive Effect of OptionsThe following table illustrates the grant dilution and exercise dilution: (In thousands) Fiscal Years Ended September 29, September 30, October 1, 2006 2005 2004 Shares of common stock outstanding 161,659 158,625 156,012 Granted 3,869 4,668 7,351 Granted for options accepted for exchange — 3,377 Cancelled/forfeited (4,176 ) (3,918 ) (4,043 ) Expired — — — Net options granted (307 ) 750 6,685 Grant dilution (1) (0.2 %) 0.5 % 4.3 % Exercised 393 935 685 Exercise dilution (2) 0.2 % 0.6 % 0.4 %
(1) The following table summarizes information concerning currently outstanding and exercisablepercentage for grant dilution is computed based on net options as of September 30, 2003 (shares in thousands):
Range of exercise
prices
Number
outstanding
Weighted
average
remaining
contractual
life (years)
Weighted average
outstanding
option price
Options
exercisable
Weighted average
exercise price
$0.00 - $9.99 8,731 8 .2 $ 5 .44 1,636 $ 5 .74 $10.00 - $19.99 8,659 5 .2 $ 15 .82 7,184 $ 16 .03 $20.00 - $29.99 6,841 6 .7 $ 21 .97 5,012 $ 21 .87 $30.00 - 39.99 1,224 4 .7 $ 37 .57 1,073 $ 38 .04 $40.00 - $59.99 231 6 .0 $ 45 .76 174 $ 45 .80 $60.00 - $210.35 77 4 .2 $ 82 .98 62 $ 83 .05
25,763 6 .6 $ 15 .44 15,141 $ 19 .03
STOCK OPTION DISTRIBUTION
The following table summarizes information concerning currently outstanding options as of September 30, 2003 (shares in thousands):
Number
outstanding
% of total
common stock
outstanding
Stock options held by non-employees (excluding directors) 14,352 9 .7% Stock options held by employees and directors 11,411 7 .7%
25,763 17 .4%
As of September 30, 2003, the Company’s ratio of options outstandinggranted as a percentage of total common stock outstanding (“overhang”) was 17.4%. The overhang attributable to options held by non-employees (other than its non-employee directors) was 9.7% and the overhang attributable to employees and directors was 7.7%.
In connection with the Merger, as of September 30, 2003 and 2002 non-employees, excluding directors, held 14,351,737 and 18,184,701 options at a weighted average price of $16.76 and $20.49, respectively. Effective June 25, 2002, in connection with the Merger each Conexant option holder, other than holders of options granted to employees of Conexant’s former Mindspeed Technologies segment on March 30, 2001 and options held by persons in certain foreign locations, received an option to purchase an equal number of shares of common stock of the Washington subsidiary. In the Merger, each outstanding Washington option was converted into an option to purchase Skyworks common stock. The conversion of Washington options into Skyworks’ options was done in such a manner that (1) the aggregate intrinsic value of the options immediately before and after the conversion was the same, (2) the ratio of the exercise price per option to the market value per option was not reduced, and (3) the vesting provisions and options period of the Skyworks’ options were the same as the original vesting terms and option period of the corresponding Washington options. As a result, there are a large number of options held by persons other than Skyworks’ employees and directors. More specifically, non-employees hold a greater number of options to purchase Skyworks’ common stock than do Skyworks’ employees.outstanding.
RESTRICTED STOCK AWARDS
(2) The Company’s long-term incentive plans providepercentage for awardsexercise dilution is computed based on options exercised as a percentage of restricted shares of common stock outstanding.
General Option InformationA summary of stock option transactions follows (shares in thousands): Options Outstanding Shares Weighted average Available for exercise price of Grant Shares shares under plan Balance outstanding at September 30, 2003 14,193 25,763 $ 15.44 Granted (7,351 ) 7,351 9.16 Granted for options accepted for exchange (3,377 ) 3,377 9.60 Exercised — (685 ) 5.05 Cancelled 2,245 (4,043 ) 15.61 Balance outstanding at October 1, 2004 5,710 31,763 $ 13.63 Granted (1) (4,908 ) 4,668 8.47 Exercised — (935 ) 5.57 Cancelled/forfeited (2) 2,113 (3,918 ) 13.66 Additional shares reserved 5,500 — — Balance outstanding at September 30, 2005 8,415 31,578 $ 12.99 Granted (1) (5,770 ) 3,869 5.19 Exercised — (393 ) 4.44 Cancelled/forfeited (2) 2,386 (4,176 ) 12.65 Additional shares reserved 10,000 — — Balance outstanding at September 29, 2006 15,031 30,878 $ 12.17
(1) “Granted” under “Shares Available for Grant” includes restricted stock grants for the year ended September 29, 2006 and other stock-based incentiveSeptember 30, 2005 of 1.0 million and 0.2 million shares, respectively. Pursuant to the plan under which they were awarded, these restricted stock grants are deemed equivalent to the issue of 1.6 million and 0.2 million stock options, respectively. “Granted” under “Shares Available for Grant” also includes performance awards granted at September 29, 2006 of 0.2 million shares. Pursuant to officersthe plan
71
under which they were awarded, these performance shares are deemed equivalent to the issue of 0.3 million stock options. (2) “Cancelled” under “Options Available for Grant” do not include any cancellations under terminated plans. For the years ended September 29, 2006, September 30, 2005, and other employees and certain non-employees. October 1, 2004, cancellations under terminated plans were 1.8 million.
Options exercisable at the end of each fiscal year (shares in thousands): Weighted average Shares exercise price 2006 23,136 $ 14.05 2005 24,053 $ 14.68 2004 17,671 $ 17.59
The following table summarizes information concerning currently outstanding and exercisable options as of September 29, 2006 (Shares and Aggregate Intrinsic Value in thousands): Options Outstanding Options Exercisable Weighted Weighted average Weighted average Weighted remaining average Aggregate remaining average Aggregate Range of exercise Number contractual exercise price Intrinsic Options contractual exercise price Intrinsic prices outstanding life (years) per share Value exercisable life (years) per share Value $0.83 — $4.99 6,055 6.8 $ 4.73 $ 2,772 2,625 5.5 $ 4.51 $ 1,798 $5.01 — $8.93 6,001 8.0 $ 7.64 21 2,051 7.3 $ 7.54 5 $8.96 — $9.60 6,446 7.3 $ 9.32 — 6,198 7.3 $ 9.33 — $9.67 — $17.12 6,805 3.2 $ 15.14 — 6,691 3.1 $ 15.21 — $17.20 — $39.80 5,388 4.0 $ 23.82 — 5,388 4.0 $ 23.82 — $40.13 — $170.44 183 3.1 $ 53.95 — 183 3.0 $ 53.95 — 30,878 5.8 $ 12.17 $ 2,793 23,136 5.1 $ 14.05 $ 1,803
The aggregate intrinsic value in the preceding table represents the total pretax intrinsic value, based on the Company’s closing stock price of $5.19 as of September 29, 2006, which would have been received by the option holders had all option holders exercised their options as of that date. The aggregate intrinsic value of options exercised for the fiscal years ended September 29, 2006, September 30, 2005, and October 1, 2004 were $0.7 million, $3.4 million and $3.4 million, respectively. The fair value of stock options vested at September 29, 2006, September 30, 2005, and October 1, 2004 were $63.2 million, $61.8 million, and $15.0 million, respectively. The total number of in-the-money options exercisable as of September 29, 2006 was 2.7 million.General Nonvested (“Restricted”) Shares and Performance Award InformationA summary of the restricted share transactions follows (shares in thousands): Weighted average Grant-date Shares fair value Balance outstanding at October 1, 2004 — $ — Granted 161 5.20 Vested (— ) — Forfeited (— ) — Balance Outstanding at September 30, 2005 161 $ 5.20 Granted 1,094 5.14 Vested(1) (89 ) 4.94 Forfeited (12 ) 5.14 Balance Outstanding at September 29, 2006 1,154 $ 5.17
72
(1) Restricted stock awards are subject to forfeiture if employment terminates during the prescribed retention period (generally within two years of the date of award) or, in certain cases, if prescribedand performance criteria are not met. The fair value of restricted stock awards is charged to expense over the vesting period. Therevested at September 29, 2006 were no restricted stock grants during fiscal years 200340,127 shares and 2002.49,000 shares, respectively.
STOCK OPTION PLANS FOR DIRECTORS
Valuation and Expense Information under SFAS 123(R)The following table summarizes share-based compensation expense related to employee stock options, employee stock purchases, and restricted stock grants under SFAS 123(R) for the fiscal year ended September 29, 2006 which was allocated as follows: (In thousands) Fiscal Year Ended September 29, 2006 Cost of sales 2,174 Research and development 6,311 Selling, general and administrative 5,734 Share-based compensation expense included in operating expenses $ 14,219
As of September 29, 2006, the Company had capitalized share-based compensation expense of $0.3 million in inventory. The Company did not recognize any tax benefit on the share-based compensation recorded in the fiscal year ended September 29, 2006 because we have established a valuation allowance against our net deferred tax assets.The table below reflects net (loss) income per share, basic and diluted, for the fiscal year ended September 29, 2006 compared with the pro forma information for the fiscal years ended September 30, 2005 and October 1, 2004. Fiscal Years Ended (In thousands, except per share amounts) September 29, September 30, October 1, 2006 2005 2004 Net income-as reported for prior periods (1) N/A $ 25,611 $ 22,412 Share-based compensation expense related to employee stock options, employee stock purchases, and restricted stock grants (2) (14,219 ) (47,183 ) (17,992 ) Restricted stock expense as calculated under APB 25 — 79 — Restricted stock expense as calculated under FAS 123 — (70 ) — Net (loss) income, including the effect of share-based compensation expense (3) $ (88,152 ) $ (21,563 ) $ 4,420 Per share information, basic and diluted: Net income, as reported for the prior period (1) N/A $ 0.16 $ 0.15 Net (loss) income, including the effect of share-based compensation expense (3) $ (0.55 ) $ (0.14 ) $ 0.03
(1) The Company has three stock option plans for non-employee directors — the 1994 Non-Qualified Stock Option Plan, the 1997 Non-Qualified Stock Option PlanNet income and the Directors’ 2001 Stock Option Plan. Under the three plans, a total of 826,000 shares have been authorized for option grants. The three plans have substantially similar terms and conditions and are structured to provide options to non-employee directors as follows: a new director receives a total of 45,000 options upon becoming a member of the Board; and continuing directors receive 15,000 options after each Annual Meeting of Shareholders. Under these plans, the option price is the fair market value at the time the option is granted. Beginning in fiscal 2001, all options granted become exercisable 25%net income per year beginning one year from the date of grant. Options grantedshare prior to fiscal 2001 become exercisable at a rate2006 did not include share-based compensation expense related to employee stock options and ESPP purchases under SFAS 123 because we did not adopt the recognition provisions of 20% per year beginning one year fromSFAS 123.(2) Share-based compensation expense prior to fiscal 2006 is calculated based on the datepro forma application of grant. During fiscal 2003, 114,000 options were granted under these plans at a weighted average price of $6.66. At September 30, 2003, a total of 627,000 options, net of cancellations, at a weighted average price of $13.84 have been granted under these three plans and 301,500 shares were exercisable at a weighted average price of $19.45. During fiscal 2003 and 2002, no options were exercised under these plans. Non-employee directorsSFAS 123 as previously disclosed in the notes to the Consolidated Financial Statements. Reflected in the 2005 pro forma stock-based compensation expense is the effect of the Company are also eligible to receive option grants underacceleration of the Company’s 1996 Long-Term Incentive Plan.
EMPLOYEE STOCK PURCHASE PLAN
The Company maintains a domestic and an internationalvesting of certain employee stock purchase plan. Under these plans, eligible employees may purchase common stock through payroll deductions of up to 10% of compensation. The price per share is the lower of 85% of the market price at the beginning or end of each six-month offering period. The plans provide for purchases by employees of up to an aggregate of 1,880,000 shares through December 31, 2012. Shares of 704,921 and 65,668 were purchased under these plansoptions in fiscal 2003 and 2002, respectively.
STOCK WARRANTS
In connection with the Merger, the Company issued to Jazz Semiconductor, Inc. (“Jazz Semiconductor”) a warrant to purchase 1,017,900 shares of Skyworks common stock at a price of $24.02 per share. This warrant became exercisableSeptember 2005 in increments of 25% as of June 25, 2002, March 11, 2003, September 11, 2003 and March 11, 2004. The Company applied the Black-Scholes model to determine the fair value estimate and approximately $0.8 million and $0.2 million was included in amortization of intangible assets related to this item in fiscal 2003 and 2002, respectively. The warrant expires on January 20, 2005.
NOTE 11. EMPLOYEE BENEFIT PLAN
The Company maintains a 401(k) plan covering substantially all of its employees. All of the Company’s employees who are at least 21 years old are eligible to receive a Company contribution. Discretionary Company contributions are determined by the Board of Directors and may be in the form of cash or the Company’s stock. The Company contributes a match of 100% of the first 4% of an employee’s annual salary. For fiscal years 2003 and 2002, the Company contributed 560,516 and 128,836 shares, respectively, of the Company’s common stock valued at $4.2 million and $0.6 million, respectively, to fund the Company’s obligation under the 401(k) plan.
Conexant sponsored various benefit plans for its eligible employees, including a 401(k) retirement savings plan, a retirement medical plan and a pension plan. Expenses allocated from Conexant under these employee benefit plans for Washington/Mexicali participants prior to the Merger were $1.0 million and $1.3 million for fiscal years 2002 and 2001, respectively.
NOTE 12. PENSIONS AND OTHER RETIREE BENEFITS
In connection with Conexant’s spin-off of its Washington/Mexicali business, Conexant transferred obligations to Washington/Mexicali for its pension plan and retiree benefits. The amounts that were transferred relate to approximately twenty Washington/Mexicali employees that had enrolled in Conexant’s Voluntary Early Retirement Plan (“VERP”) in 1998. The VERP also provides health care benefits to members of the plan. The Company currently does not offer pension plans or retiree benefits to its employees.
The components of defined benefit expense for fiscal 2003 are as follows (in thousands):
Pension
Benefits
Retiree
Medical
Benefits
Service cost-benefits earned $ -- $ -- Interest cost on benefit obligation 175 70 Estimated return on assets (59 ) -- Net amortization 3 50
Net periodic benefit cost $ 119 $120
The funded status of the Company’s principal defined benefit and retiree medical benefit plans and the amounts recognized in the balance sheet for fiscal 2003 are as follows (in thousands):
Pension
Benefits
Retiree
Medical
Benefits
Change in benefit obligation: Balance at beginning of year $ 2,652 $ 1,014 Benefit payments (256 ) (38 ) Service and interest costs 175 70 Actuarial (gains) losses 323 --
Balance at end of year $ 2,894 $ 1,046
Change in fair value of plan assets: Balance at beginning of year $ 1,419 $ -- Actual return on plan assets 77 -- Employer contribution 579 -- Benefit payments (256 ) --
Balance at end of year $ 1,819 $ --
Benefit obligations in excess of plan assets $ (1,075 ) $ (1,046 ) Unrecognized net actuarial loss 632 --
Net accrued benefit cost $ (443 ) $ (1,046 )
The assumptions used in determining retirement benefit obligations for fiscal 2003 are as follows:
Pension
Benefits
Retiree
Medical
Benefits
Discount rate 6 % 7 % Long-term rate of return on assets 4 % N /A
An increase in the health care cost trend rate by 1% would increase the accumulated retirement medical obligation by $0.1 million at September 30, 2003 and would not affect retirement medical expense. Consequently, a decrease in the health care cost trend rate by 1% would decrease the accumulated retirement medical obligation by $0.1 million at September 30, 2003 and would not affect retirement medical expense.
NOTE 13. COMMITMENTS
The Company has various operating leases primarily for computer equipment and buildings. Rent expense amounted to $10.4 million, $7.1 million and $4.9 million in fiscal 2003, 2002 2001, respectively. Purchase options may be exercised, at fair market value, at various times for some of these leases. Future minimum payments under these noncancelable leases are as follows (in thousands):
Fiscal Year
2004 $ 7,328 2005 6,051 2006 4,906 2007 4,465 2008 4,348 Thereafter 7,034
$34,132
Under supply agreements entered into with Conexant and subsequently with Jazz Semiconductor the Company receives wafer fabrication, wafer probe and certain other services from Jazz Semiconductor’s Newport Beach, California foundry.
Pursuant to the terms of these agreements, the Company is committed to obtaining certain minimum wafer volumes from Jazz Semiconductor. The Company’s expected minimum purchase obligations under these supply agreements will be approximately $39 million and $13 million in fiscal 2004 and 2005, respectively. The Company originally estimated its obligation under this agreement would result in excess costs of approximately $12.9 million when recorded as a liability and charged to cost of sales in the third quarter of fiscal 2002. During the fourth quarter of fiscal 2002, the Company reevaluated this obligation and reduced its liability and cost of sales by approximately $8.1 million in the quarter. During the first quarter of fiscal 2003, the Company reevaluated the remaining $4.8 million obligation related to Jazz Semiconductor and reduced its liability and cost of sales by approximately $4.8 million in the quarter. The Company currently anticipates meeting each of the annual minimum purchase obligations under these supply agreements.
NOTE 14. CONTINGENCIES
From time to time various lawsuits, claims and proceedings have been, and may in the future be, instituted or asserted against Skyworks, including those pertaining to patent infringement, intellectual property, environmental, product liability, safety and health, employment and contractual matters. In addition, in connection with the Merger, Skyworks has assumed responsibility for all then current and future litigation (including environmental and intellectual property proceedings) against Conexant or its subsidiaries in respect of the operations of Conexant’s wireless business. The outcome of litigation cannot be predicted with certainty and some lawsuits, claims or proceedings may be disposed of unfavorably to Skyworks. Intellectual property disputes often have a risk of injunctive relief which, if imposed against Skyworks, could materially and adversely affect the financial condition or results of operations of Skyworks.
Additionally, the semiconductor industry is characterized by vigorous protection and pursuit of intellectual property rights. From time to time, third parties have asserted and may in the future assert patent, copyright, trademark and other intellectual property rights to technologies that are important to our business and have demanded and may in the future demand that we license their technology. At the present time, the Company is in discussions with Qualcomm Incorporated (“Qualcomm”) regarding claims that both the Company and Qualcomm filed and first served against each other on December 4, 2003 asserting violations of certain of each company’s respective intellectual property rights. The purpose of these discussions is to arrive at a business resolution that avoids protracted litigation for both parties. The Company believes Qualcomm’s claims are without merit and if the Company is not successful resolving this matter outside of litigation, it is prepared to vigorously defend against Qualcomm’s claims and fully prosecute its claims against them.
NOTE 15. GUARANTEES
The Company has made guarantees and indemnities, under which it may be required to make payments to a guaranteed or indemnified party, in relation to certain transactions. In connection with the Merger, the Company assumed responsibility for all contingent liabilities and then-current and future litigation (including environmental and intellectual property proceedings) against Conexant or its subsidiaries to the extent related to the operations or assets of the wireless business of Conexant. The Company may also be responsible for certain federal income tax liabilities that relate to Washington/Mexicali’s spin-off from Conexant under the Tax Allocation Agreement, dated as of June 25, 2002, between the Company and Conexant, which provides that the Company will be responsible for certain taxes imposed on Conexant or its shareholders. The Company’s obligations under the tax allocation agreement have been limited by a letter dated November 6, 2002 entered into in connection with the debt refinancing with Conexant.
In connection with the sales of its products, the Company provides certain intellectual property indemnities to its customers. In connection with certain facility leases, the Company has indemnified its lessors for certain claims arising from the facility or the lease. The Company indemnifies its directors and officers to the maximum extent permitted under the laws of the state of Delaware. The duration of the guarantees and indemnities varies, and in many cases is indefinite. The guarantees and indemnities to customers in connection with product sales generally are subject to limits based upon the amount of the related product sales and in many cases are subject to geographic and other restrictions. In certain instances, the Company’s guarantees and indemnities do not provide for any limitation of the maximum potential future payments the Company could be obligated to make. The Company has not recorded any liability for these guarantees and indemnities in the accompanying consolidated balance sheets.$21.0 million.
NOTE 16. SPECIAL CHARGES
ASSET IMPAIRMENTS
During the fourth quarter of fiscal 2003, the Company recorded a $26.0 million charge for the impairment of assets related to certain infrastructure products manufactured in its Woburn, Massachusetts and Adamstown, Maryland facilities. The Woburn facility primarily manufactures semiconductor products based on both silicon wafer technology and gallium arsenide technology. The Company’s Adamstown, Maryland facility primarily manufactures ceramics components. The Company experienced a significant decline in factory utilization resulting from a downturn in the market for products manufactured at these two facilities and a decision to discontinue certain products. The impairment charge was based on a recoverability analysis prepared by management based on these factors and the related impact on its current and projected outlook. The Company projected lower revenues and new order volume for these products and management believed these factors indicated that the carrying value of the related assets (machinery, equipment and intangible assets) may have been impaired and that an impairment analysis should be performed. In performing the analysis for recoverability, management estimated the future cash flows expected to result from these products over a five-year period. Since the estimated undiscounted cash flows were less than the carrying value of the related assets, it was concluded that an impairment loss should be recognized. In accordance with SFAS No. 144 “Accounting for the Impairment or Disposal of Long-Lived Assets,” the impairment charge was determined by comparing the estimated fair value of the related assets to their carrying value. The fair value of the assets was determined by computing the present value of the estimated future cash flows using a discount rate of 16%, which management believed was commensurate with the underlying risks associated with the projected future cash flows. Management believes the assumptions used in the discounted cash flow model represented a reasonable estimate of the fair value of the assets. The write down established a new cost basis for the impaired assets. The anticipated pre-tax cost savings related to these impairment charges is expected to be $17.4 million over the next five years (fiscal 2004 through fiscal 2008) and $8.6 million over the subsequent fifteen years (fiscal 2009 through 2023).
(3) In addition, during the fourth quarter of fiscal 2003 the Company recorded a $2.3 million charge for the impairment of its Haverhill, Massachusetts property currently being held for sale. In fiscal 2003, the Company relocated its operations from this facility to its Woburn, Massachusetts facility. The Company is actively marketing the property located in Haverhill, Massachusetts.
During fiscal 2002, the Company recorded a $66.0 million charge for the impairment of the assembly and test machinery and equipment and related facility in Mexicali, Mexico. The impairment charge was based on a recoverability analysis prepared by management as a result of a significant downturn in the market for test and assembly services for non-wireless products and the related impact on the Company’s current and projected outlook.
The Company experienced a severe decline in factory utilization at its Mexicali facility for non-wireless products and projected decreasing revenues and new order volume. Management believed these factors indicated that the carrying value of the assembly and test machinery and equipment and related facility may have been impaired and that an impairment analysis should be performed. In performing the analysis for recoverability, management estimated the future cash flows expected to result from the manufacturing activities at the Mexicali facility over a ten-year period. The estimated future cash flows were based on a gradual phase-out of services sold to Conexant and modest volume increases consistent with management’s view of the outlook for the business, partially offset by declining average selling prices. The declines in average selling prices were consistent with historical trends and management’s decision to reduce capital expenditures for future capacity expansion. Since the estimated undiscounted cash flows were less than the carrying value (approximately $100 million based on historical cost) of the related assets, it was concluded that an impairment loss should be recognized. The impairment charge was determined by comparing the estimated fair value of the related assets to their carrying value. The fair value of the assets was determined by computing the present value of the estimated future cash flows using a discount rate of 24%, which management believed was commensurate with the underlying risks associated with the projected future cash flows. Management believes the assumptions used in the discounted cash flow model represented a reasonable estimate of the fair value of the assets. The write down established a new cost basis for the impaired assets.
During fiscal 2002, the Company recorded a $45.8 million charge for the write-off of goodwill and other intangible assets associated with its acquisition of Philsar Semiconductor Inc. (“Philsar”) in fiscal 2000. Philsar was a developer of radio frequency semiconductor solutions for personal wireless connectivity, including emerging standards such as Bluetooth, and radio frequency components for third-generation digital cellular handsets. Management determined that the Company would not support the technology associated with the Philsar Bluetooth business. Accordingly, this product line was discontinued and the employees associated with the product line were either severed or relocated to other operations. As a result of the actions taken, management determined that the remaining goodwill and other intangible assets associated with the Philsar acquisition were impaired.
During the third quarter of fiscal 2001, the Company recorded an $86.2 million charge for the impairment of the manufacturing facility and related wafer fabrication machinery and equipment at the Company’s Newbury Park, California facility. This impairment charge was based on a recoverability analysis prepared by management as a result of the dramatic downturn in the market for wireless communications products and the related impact on the then-current and projected business outlook of the Company. Through the third quarter of fiscal 2001, the Company experienced a severe decline in factory utilization at the Newbury Park wafer fabrication facility and decreasing revenues, backlog, and new order volume. Management believed these factors, together with its decision to significantly reduce future capital expenditures for advanced process technologies and capacity beyond the then-current levels, indicated that the value of the Newbury Park facility may have been impaired and that an impairment analysis should be performed. In performing the analysis for recoverability, management estimated the future cash flows expected to result from the manufacturing activities at the Newbury Park facility over a ten-year period. The estimated future cash flows were based on modest volume increases consistent with management’s view of the outlook for the industry, partially offset by declining average selling prices. The declines in average selling prices were consistent with historical trends and management’s decision to focus on existing products based on the current technology. Since the estimated undiscounted cash flows were less than the carrying value (approximately $106 million based on historical cost) of the related assets, it was concluded that an impairment loss should be recognized. The impairment charge was determined by comparing the estimated fair value of the related assets to their carrying value. The fair value of the assets was determined by computing the present value of the estimated future cash flows using a discount rate of 30%, which management believed was commensurate with the underlying risks associated with the projected cash flows. The Company believes the assumptions used in the discounted cash flow model represented a reasonable estimate of the fair value of the assets. The write-down established a new cost basis for the impaired assets.
RESTRUCTURING CHARGES
During the second and fourth quarters of fiscal 2003, the Company recorded $3.3 million and $2.9 million, respectively, in restructuring charges to provide for workforce reductions and the consolidation of facilities. The charges were based upon estimates of the cost of severance benefits for affected employees and lease cancellation, facility sales, and other costs related to the consolidation of facilities. Substantially all amounts accrued for these actions are expected to be paid within one year.
During fiscal 2002, the Company implemented a number of cost reduction initiatives to more closely align its cost structure with the then-current business environment. The Company recorded restructuring charges of approximately $3.0 million for costs related to the workforce reduction and the consolidation of certain facilities. Substantially all amounts accrued for these actions have been paid.
During fiscal 2001, Washington/Mexicali reduced its workforce by approximately 250 employees, including approximately 230 employees in manufacturing operations. Restructuring charges of $2.7 million were recorded for such actions and were based upon estimates of the cost of severance benefits for the affected employees. The Company has paid all amounts accrued for these actions.
Activity and liability balances related to the fiscal 2002 and fiscal 2003 restructuring actions are as follows (in thousands):
Fiscal 2002
Workforce
Reductions
Fiscal 2002
Facility Closings
and Other
Fiscal 2003
Workforce
Reductions
Fiscal 2003
Facility
Closings
and Other
Total
Charged to costs and expenses $ 2,923 $ 97 $ -- $ -- $ 3,020 Cash payments (2,225 ) (13 ) -- -- (2,238 )
Restructuring balance, September 30, 2002 698 84 -- -- 782 Charged to costs and expenses -- -- 4,819 1,405 6,224 Cash payments (698 ) (47 ) (3,510 ) (1,236 ) (5,491 )
Restructuring balance, September 30, 2003 $ -- $ 37 $ 1,309 $ 169 $ 1,515
In addition, the Company assumed approximately $7.8 million of restructuring reserves from Alpha in connection with the Merger. During the fiscal years ended September 30, 2003 and 2002, payments related to the restructuring reserves assumed from Alpha were $4.7 million and $1.1 million, respectively. On September 30, 2003 this balance was $2.0 and primarily relates to payments on a lease that expires in 2008.
NOTE 17. SEGMENT INFORMATION AND CONCENTRATIONS
The Company follows SFAS No. 131, “Disclosures About Segments of an Enterprise and Related Information.” SFAS No. 131 establishes standards for the way public business enterprises report information about operating segments in annual financial statements and in interim reports to shareholders. The method for determining what information to report is based on the way that management organizes the segments within the Company for making operating decisions and assessing financial performance. In evaluating financial performance, management uses sales and operating profit as the measure of the segments’ profit or loss. Based on the guidance in SFAS No. 131, the Company has one operating segment for financial reporting purposes.
The Company operates in one business segment, which designs, develops, manufactures and markets proprietary semiconductor products and system solutions for manufacturers of wireless communication products.
GEOGRAPHIC INFORMATION
Net revenues by geographic area are presented(loss) income and net (loss) income per share prior to fiscal 2006 represents pro forma information based uponon SFAS 123 as previously disclosed in the country of destination. Net revenues by geographic area are as follows (in thousands):notes to the Consolidated Financial Statements.
Years Ended September 30,
2003
2002
2001
United States $ 87,691 $ 72,185 $ 63,948 Other Americas 69,559 4,615 5,455
Total Americas 157,250 76,800 69,403 South Korea 157,772 237,681 142,459 Other Asia-Pacific 218,817 114,974 23,898
Total Asia-Pacific 376,589 352,655 166,357 Europe, Middle East and Africa 83,950 28,314 24,691
$ 617,789 $ 457,769 $ 260,451
The weighted-average estimated grant date fair value of employee stock options granted during the fiscal years ended September 29, 2006, September 30, 2005, and October 1, 2004 were $3.19 per share, $4.86 per share and $3.80 per share, respectively using the Black Scholes option-pricing model with the following weighted-average assumptions:73
Fiscal Years Ended September 29, September 30, October 1, 2006 2005 2004 Expected volatility 59.27 % 71.00 % 91.00 % Risk free interest rate 4.55 % 3.90 % 1.90 % Dividend yield 0.00 0.00 0.00 Expected option life (7 year contractual life options) 4.42 3.5 5.0 Expected option life (10 year contractual life options) 5.84 3.5 5.0
The Company used an arithmetic average of historical volatility and implied volatility to calculate its expected volatility during the year ended September 29, 2006. Historical volatility was determined by calculating the mean reversion of the daily-adjusted closing stock price over the past 4.25 years of the Company’s existence (post-Merger). The implied volatility was calculated by analyzing the 52-week minimum and maximum prices of publicly traded call options on the Company’s common stock. The Company concluded that an arithmetic average of these two calculations provided for the most reasonable estimate of expected volatility under the guidance of SFAS 123(R).The risk-free interest rate assumption is based upon observed Treasury bill interest rates (risk free) appropriate for the term of the Company’s employee stock options.The expected life of employee stock options represents a calculation based upon the historical exercise, cancellation and forfeiture experience for the Company over the 4.25 years between June 2002 (post-Merger) and September 29, 2006. The Company deemed that exercise, cancellation and forfeiture experience in 2006 was consistent with historical norms thus expected life was not recalculated at September 29, 2006. The Company determined that it had two populations with unique exercise behavior. These populations included stock options with a contractual life of 7 years and 10 years, respectively.As share-based compensation expense recognized in the Consolidated Statement of Operations for the fiscal year ended September 29, 2006 is actually based on awards ultimately expected to vest, it has been reduced for annualized estimated forfeitures of 8.59%. SFAS 123(R) requires forfeitures to be estimated at the time of grant and revised, if necessary, in subsequent periods if actual forfeitures differ from those estimates. Forfeitures were estimated based on historical experience.For purposes of pro forma disclosures under SFAS 123, for the fiscal years ended September 30, 2005 and October 1, 2004, the estimated fair value of the options is assumed to be amortized to expense over the options’ vesting period on a straight-line basis.STOCK OPTION DISTRIBUTIONThe following table summarizes information concerning currently outstanding options as of September 29, 2006 (shares in thousands): % of total common Number stock outstanding outstanding Stock options held by employees and directors 23,333 14.4 % Stock options held by non-employees (excluding directors) 7,545 4.7 % 30,878 19.1 %
As of September 29, 2006, the Company’s ratio of options outstanding as a percentage of total common stock outstanding (“overhang”) was 19.1%. The overhang attributable to options held by non-employees (other than its non-employee directors) was 4.7% and the overhang attributable to employees and directors was 14.4%.In connection with the Merger, as of September 29, 2006 and September 30, 2005, non-employees, excluding directors, held 7.5 million and 8.6 million options at a weighted average exercise price of $20.44 and $20.46, respectively. Effective June 25, 2002, in connection with the Merger, each Conexant option holder, other than holders of options granted to employees of Conexant’s former Mindspeed Technologies segment on March 30, 2001 and options held by persons in certain foreign locations, received an option to purchase an equal number of shares74
of common stock of the Washington subsidiary. In the Merger, each outstanding Washington option was converted into an option to purchase Skyworks common stock. The conversion of Washington options into Skyworks’ options was done in such a manner that (1) the aggregate intrinsic value of the options immediately before and after the conversion was the same, (2) the ratio of the exercise price per option to the market value per option was not reduced, and (3) the vesting provisions and options period of the Skyworks’ options were the same as the original vesting terms and option period of the corresponding Washington options. As a result, there are a large number of options held by persons other than Skyworks’ employees and directors.STOCK WARRANTSIn connection with the Merger, the Company issued to Jazz Semiconductor, Inc. (“Jazz Semiconductor”) a warrant to purchase 1.0 million shares of Skyworks common stock at a price of $24.02 per share. This warrant became exercisable in increments of 25% as of June 25, 2002, March 11, 2003, September 11, 2003 and March 11, 2004. The Company applied the Black-Scholes model to determine the fair value estimate and approximately $0.2 million and $0.8 million was included in amortization of intangible assets related to this item in fiscal 2005 and fiscal 2004, respectively. The warrant expired without being exercised on January 20, 2005.NOTE 10. The Company’s revenues by geography do not necessarily correlate to end handset demand by region. For example, if the Company sells a power amplifier module to a customer in South Korea, the sale is recorded within the South Korea account although that customer, in turn, may integrate that module into a product sold to a service provider (its customer) in Africa, China, Europe, the Middle East, the Americas or within South Korea.EMPLOYEE BENEFIT PLAN, PENSIONS AND OTHER RETIREE BENEFITS
The Company maintains a 401(k) plan covering substantially all of its employees. All of the Company’s employees who are at least 21 years old are eligible to receive discretionary Company contributions under the 401(k) plan. Discretionary Company contributions are determined by the Board of Directors and may be in the form of cash or the Company’s stock. The Company has generally contributed a match of up to 4.0% of an employee’s annual eligible compensation. For those employees employed by Alpha for five (5) years or more prior to the Merger, the Company contributes an additional match of up to 0.75% of the employee’s annual eligible compensation. For fiscal years 2006, 2005 and 2004, the Company contributed and recognized expense for 0.8 million, 0.7 million, and 0.4 million shares, respectively, of the Company’s common stock valued at $4.1 million, $5.1 million, and $3.6 million, respectively, to fund the Company’s obligation under the 401(k) plan.In connection with Conexant’s spin-off of its Washington/Mexicali business, Conexant transferred obligations to Washington/Mexicali for its pension plan and retiree benefits. The amounts that were transferred relate to approximately twenty Washington/Mexicali employees that had enrolled in Conexant’s Voluntary Early Retirement Plan (“VERP”) in 1998. The VERP also provides health care benefits to members of the plan. The Company currently does not offer defined benefit pension plans or retiree health benefits to its employees. The Company incurred net periodic benefit costs of $0.1 million for pension benefits and $0.1 million for retiree medical benefits in each of the fiscal years ending September 29, 2006, September 30, 2005 and October 1, 2004.The funded status of the Company’s principal defined benefit and retiree medical benefit plans and the amounts recognized in the balance sheet are as follows (in thousands): Pension Benefits Retiree Medical Benefits Fiscal Years Ended Fiscal Years Ended September 29, September 30, October 1, September 29, September 30, October 1, 2006 2005 2004 2006 2005 2004 Benefit obligations in excess of plan assets $ 599 $ 1,137 $ 969 $ 1,238 $ 1,238 $ 1,210 Unrecognized net actuarial loss (981 ) (1,301 ) (786 ) — — — Net (prepaid) accrued benefit cost $ (382 ) $ (164 ) $ 183 $ 1,238 $ 1,238 $ 1,210
NOTE 11. Long-lived assets by geographic area are as follows (in thousands):COMMITMENTS
September 30,
2003
2002
United States $ 101,871 $ 109,975 Mexico 21,223 30,427 Other 4,671 3,371
$ 127,765 $ 143,773
CONCENTRATIONS
The Company has various operating leases primarily for computer equipment and buildings. Rent expense amounted to $9.3 million in fiscal 2006 and $9.8 million in both fiscal 2005 and fiscal 2004. Purchase options may be exercised, at fair market value, at various times for some of these leases. Future minimum payments under these non-cancelable leases are as follows (in thousands): Fiscal Year 2007 7,600 2008 6,813
75
Fiscal Year 2009 6,131 2010 5,090 2011 1,834 Thereafter 664 $ 28,132
The Company is attempting to sublet certain properties that were vacated upon the exit of the baseband product area and, if successful, future operating lease commitments will be somewhat offset by proceeds received from the sublessors.In addition, the Company has entered into licensing agreements for intellectual property rights and maintenance and support services. Pursuant to the terms of these agreements, the Company is committed to aggregate payments of $6.7 million, $4.8 million and $1.2 million in fiscal years 2007, 2008, and 2009, respectively.NOTE 12. CONTINGENCIES
From time to time, various lawsuits, claims and proceedings have been, and may in the future be, instituted or asserted against the Company, including those pertaining to patent infringement, intellectual property, environmental, product liability, safety and health, employment and contractual matters.Additionally, the semiconductor industry is characterized by vigorous protection and pursuit of intellectual property rights. From time to time, third parties have asserted and may in the future assert patent, copyright, trademark and other intellectual property rights to technologies that are important to our business and have demanded and may in the future demand that we license their technology. The outcome of litigation cannot be predicted with certainty and some lawsuits, claims or proceedings may be disposed of unfavorably to the Company. Intellectual property disputes often have a risk of injunctive relief, which, if imposed against the Company, could materially and adversely affect the Company’s financial condition, or results of operations.From time to time we are involved in legal proceedings in the ordinary course of business. We believe that there is no such ordinary course litigation pending that could have, individually or in the aggregate, a material adverse effect on our business, financial condition, results of operations or cash flows.NOTE 13. GUARANTEES AND INDEMNITIES
The Company does not currently have any guarantees. The Company generally indemnifies its customers from third-party intellectual property infringement litigation claims related to its products. In connection with certain facility leases, the Company has indemnified its lessors for certain claims arising from the facility or the lease.The Company indemnifies its directors and officers to the maximum extent permitted under the laws of the state of Delaware. The duration of the indemnities varies, and in many cases is indefinite. The indemnities to customers in connection with product sales generally are subject to limits based upon the amount of the related product sales and in many cases are subject to geographic and other restrictions. In certain instances, the Company’s indemnities do not provide for any limitation of the maximum potential future payments the Company could be obligated to make. The Company has not recorded any liability for these indemnities in the accompanying consolidated balance sheets.NOTE 14. RESTRUCTURING AND SPECIAL CHARGES
Restructuring and special charges consists of the following (in thousands): Fiscal Years Ended September 29, September 30, October 1, 2006 2005 2004 Asset impairments $ 4,197 $ — $ 13,183 Restructuring and special charges 22,758 — 4,183 $ 26,955 $ — $ 17,366
Restructuring and special charges consist of charges for asset impairments and restructuring activities, as follows:76
2006 RESTRUCTURING CHARGES AND OTHEROn September 29, 2006, the Company exited its baseband product area in order to focus on its core business encompassing linear products, power amplifiers, front-end modules and radio solutions. The Company recorded various charges associated with this action. In total, the Company recorded charges of $90.4 million which included the following:The Company recorded $13.1 million related to severance and benefits, $7.4 million related to the write-down of technology licenses and design software, $4.2 million related to the impairment of certain long-lived assets and $2.3 million related to other charges. These charges total $27.0 million and are recorded in restructuring and special charges.The Company also recorded charges of $35.1 million in bad debt expense principally for two baseband product area customers, $23.3 million of excess and obsolete baseband and other inventory charges and reserves and $5.0 million related to baseband product area revenue adjustments. These charges were recorded against selling, general and administrative expenses, cost of goods sold and revenues, respectively.The Company anticipates recording additional restructuring charges of approximately $7.0 million related to the exit of the baseband product area in the first fiscal quarter of 2007. These charges primarily relate to costs to exit certain operating leases and the write down of a technology license. The Company anticipates the completion of the restructuring activities by December 31, 2006.Activity and liability balances related to the fiscal 2006 restructuring actions are as follows (in thousands): License and Software Workforce Asset Facility Closings Write-offs Reductions Impairments Total Charged to costs and expenses $ 105 $ 9,583 $ 13,070 $ 4,197 $ 26,955 Non-cash items — (6,426 ) — (4,197 ) (10,623 ) Cash payments — — — — — Restructuring balance, September 29, 2006 $ 105 $ 3,157 $ 13,070 $ — $ 16,332
2004 ASSET IMPAIRMENTSDuring the second quarter of fiscal 2004, the Company recorded a $13.2 million charge primarily related to the impairment of obsolete baseband technology licenses that were established prior to the Merger. This charge included approximately $1.8 million of contractual payment obligations, which have been paid in full as of September 29, 2006. The impairment charge was based on a recoverability analysis prepared by management based on the decision to discontinue certain products and the related impact on its current and projected outlook. Management believed these factors indicated that the carrying value of the related assets (intangible assets, machinery and equipment) was impaired and that an impairment analysis should be performed. In performing the analysis for recoverability, management estimated the future cash flows expected to result from these products (salvage value). Since the estimated undiscounted cash flows were less than the carrying value of the related assets, it was concluded that an impairment loss should be recognized. In accordance with SFAS No. 144 “Accounting for the Impairment or Disposal of Long-Lived Assets”, the impairment charge was determined by comparing the estimated fair value of the related assets to their carrying value. The write down established a new cost basis for the impaired assets.2004 Corporate Restructuring PlanDuring fiscal 2004, the Company consolidated cellular systems software design centers in an effort to improve the Company’s overall time to market for next-generation multimedia systems development. These actions aligned the Company’s structure with its current business environment. The Company implemented reductions in force at three remote facilities and recorded restructuring charges of approximately $4.2 million for costs related to severance benefits for affected employees and lease obligations. All amounts accrued for have been paid as of September 29, 2006.77
Activity and liability balances related to the fiscal 2004 restructuring actions are as follows (in thousands): Workforce Facility Reductions Closings Total Charged to costs and expenses $ 3,685 $ 498 $ 4,183 Cash payments (3,530 ) (287 ) (3,817 ) Restructuring balance, October 1, 2004 $ 155 $ 211 $ 366 Cash payments (155 ) (198 ) (353 ) Restructuring balance, September 30, 2005 $ — $ 13 $ 13 Cash payments — (13 ) (13 ) Restructuring balance, September 29, 2006 $ — $ — $ —
Pre-Merger Alpha Restructuring PlanIn addition, the Company assumed approximately $7.8 million of restructuring reserves from Alpha in connection with the Merger. During fiscal 2006 and the fiscal years ended September 30, 2005 and 2004, payments related to the restructuring reserves assumed from Alpha were $0.4 million, $0.2 million, and $0.2 million, respectively. In addition, the Company reduced this restructuring reserve by approximately $0.5 million in fiscal 2004 primarily related to a reduction in facility closure costs. This reduction of expenses is reflected in the special charges line of the Company’s results of operations. As of September 29, 2006, the restructuring reserve balance related to Alpha was $0.7 million and primarily relates to estimated future payments on a lease that expires in 2008.NOTE 15. EARNINGS PER SHARE
(In thousands, except per share amounts) Fiscal Years Ended September 29, September 30, October 1, 2006 2005 2004 Net (loss) income $ (88,152 ) $ 25,611 $ 22,412 Weighted average shares outstanding — basic 159,408 157,453 152,090 Effect of dilutive stock options and restricted stock — 1,404 2,152 Weighted average shares outstanding — diluted 159,408 158,857 154,242 Net (loss) income per share — basic $ (0.55 ) $ 0.16 $ 0.15 Effect of dilutive stock options — — — Net (loss) income per share — diluted $ (0.55 ) $ 0.16 $ 0.15
Basic earnings per share is calculated by dividing net income (loss) by the weighted average number of common shares outstanding. Diluted earnings per share includes the dilutive effect of stock options and a stock warrant through its expiration in January 2005, using the treasury stock method, and debt securities on an if-converted basis, if their effect is dilutive.Debt securities convertible into approximately 19.8 million shares and equity based awards exercisable for approximately 23.7 million shares were outstanding but not included in the computation of earnings per share for the fiscal year ended September 29, 2006 as their effect would have been anti-dilutive. If the Company had earned at least $93.9 million in net income for the fiscal year ended September 29, 2006 the debt securities would have been dilutive to earnings per share. Debt securities convertible into approximately 25.4 million shares and equity based awards exercisable for approximately 25.5 million shares were outstanding but not included in the computation of earnings per share for the fiscal year ended September 30, 2005 as their effect would have been anti-dilutive. Debt securities convertible into approximately 25.4 million shares and equity based awards exercisable into approximately 19.0 million shares and a warrant to purchase 1.0 million shares were outstanding but not included in the computation of earnings per share for the fiscal year ended October 1, 2004 as their effect would have been anti-dilutive.78
NOTE 16. SEGMENT INFORMATION AND CONCENTRATIONS
The Company follows SFAS No. 131, “Disclosures about Segments of an Enterprise and Related Information” (“SFAS No. 131”). SFAS No. 131 establishes standards for the way public business enterprises report information about operating segments in annual financial statements and in interim reports to shareholders. The method for determining what information to report is based on the way that management organizes the segments within the Company for making operating decisions and assessing financial performance. In evaluating financial performance, management uses sales and operating profit as the measure of the segments’ profit or loss. Based on the guidance in SFAS No. 131, the Company has one operating segment for financial reporting purposes, which designs, develops, manufactures and markets proprietary semiconductor products, including intellectual property, for manufacturers of wireless communication products.GEOGRAPHIC INFORMATIONNet revenues by geographic area are presented based upon the country of destination. Net revenues by geographic area are as follows (in thousands): Fiscal Years Ended September 29, September 30, October 1, 2006 2005 2004 United States $ 43,180 $ 66,429 $ 74,105 Other Americas 18,925 39,541 51,537 Total Americas 62,105 105,970 125,642 China 224,539 215,082 206,364 South Korea 114,926 107,225 188,090 Taiwan 116,073 92,171 69,126 Other Asia-Pacific 173,523 144,940 64,570 Total Asia-Pacific 629,061 559,418 528,150 Europe, Middle East and Africa 82,584 126,983 130,231 $ 773,750 $ 792,371 $ 784,023
The Company’s revenues by geography do not necessarily correlate to end handset demand by region. For example, if the Company sells a power amplifier module to a customer in South Korea, the sale is recorded within the South Korea account although that customer, in turn, may integrate that module into a product sold to a service provider (its customer) in Africa, China, Europe, the Middle East, the Americas or within South Korea.The increase in net revenues derived from Other Asia-Pacific in fiscal 2006 as compared to fiscal 2005 and fiscal 2004 is due to the continuing consolidation of the purchasing and manufacturing functions of several of the Company’s significant customers to Singapore and Malaysia from European and American locations.Geographic property, plant and equipment balances, including property held for sale, are based on the physical locations within the indicated geographic areas and are as follows (in thousands): As of September 29, 2006 September 30, 2005 United States $ 88,896 $ 85,072 Mexico 59,234 60,594 Other 2,253 5,172 $ 150,383 $ 150,838
CONCENTRATIONSFinancial instruments that potentially subject the Company to concentration of credit risk consist principally of trade accounts receivable. Trade receivables are primarily derived from sales to manufacturers of communications and consumer products. Ongoing credit evaluations of customers’ financial condition are performed and collateral, such as letters of credit and bank guarantees, are required whenever deemed necessary. As of September 29, 2006, Motorola, Inc.79
and RTI Industries Co. Ltd., accounted for approximately 18% and 13%, respectively of the Company’s gross accounts receivable. As of September 30, 2005, Motorola, Inc. and RTI Industries Co. Ltd., accounted for approximately 16% and 15%, respectively of the Company’s gross accounts receivable. As of October 1, 2004 Motorola, Inc. represented approximately 12% and Samsung Electronics Co. and RTI Industries Co. Ltd., each accounted for approximately 10% of the Company’s gross accounts receivable.The following customers accounted for 10% or more of net revenues: Fiscal Years Ended September 29, September 30, October 1, 2006 2005 2004 Motorola, Inc. 23 % 21 % 14 % Sony Ericsson Mobile Communications AB 16 % 10 % * Asian Information Technology, Inc 11 % * * Samsung Electronics Co. * * 12 %
* Customers accounted for 18% and 27% of the Company’s gross accounts receivable balances at September 30, 2003 and 2002, respectively.
The following customers accounted for 10% or more of net revenues:
Years Ended September 30, 2003
2002
2001
Samsung Electronics Co., 15 % 35 % 44 % Motorola, Inc. 11 % 11 % * Conexant * * 17 % Nokia Corporation * * 12 %
* Represents less than 10% of net revenuesrevenues.
NOTE 17. The foregoing percentages are based on sales representing Washington/Mexicali sales for fiscal 2001 and fiscal 2002 up to the time of the Merger, and sales of the combined company for the post-Merger period from June 26, 2002 through the end of the fiscal year and for fiscal 2003.QUARTERLY FINANCIAL DATA (UNAUDITED)
NOTE 18. QUARTERLY FINANCIAL DATA (UNAUDITED)
(In thousands, except per share data)
First
Quarter (1)
Second
Quarter
Third
Quarter
Fourth
Quarter
Year
Fiscal 2003 Net revenues $ 160,194 $ 157,364 $ 150,199 $ 150,032 $ 617,789 Gross profit 65,120 63,519 56,078 52,607 237,324 Income (loss) before cumulative effect of change in accounting principle 791 (5,955 ) (6,186 ) (42,927 ) (54,277 ) Cumulative effect of change in accounting principle, net of tax (397,139 ) -- -- -- (397,139 ) Net loss (396,348 ) (5,955 ) (6,186 ) (42,927 ) (451,416 ) Per share data (2) Income (loss) before cumulative effect of change in accounting principle, basic and diluted 0.01 (0.04 ) (0.04 ) (0.30 ) (0.39 ) Cumulative effect of change in accounting principle, net of tax, basic and diluted (2.88 ) -- -- -- (2.85 ) Net loss, basic and diluted (2.87 ) (0.04 ) (0.04 ) (0.30 ) (3.24 ) Fiscal 2002 Net revenues $ 93,760 $ 100,356 $ 112,980 $ 150,673 $ 457,769 Gross profit 15,954 29,433 20,063 60,711 126,161 Net loss (34,297 ) (18,339 ) (181,945 ) (1,483 ) (236,064 ) Per share data (2) Net loss, basic and diluted -- -- (1.33 ) (0.01 ) (1.72 )
(In thousands, except per share data) First Second Third Fourth Quarter (2) Quarter Quarter Quarter(3) Year Fiscal 2006 Net revenues $ 198,325 $ 185,234 $ 197,058 $ 193,133 $ 773,750 Gross profit 74,723 69,350 73,347 45,259 262,679 Net income(loss) 4,287 926 3,005 (96,370 ) (88,152 ) Per share data (1) Net income(loss), basic 0.03 0.01 0.02 (0.60 ) (0.55 ) Net income(loss), diluted 0.03 0.01 0.02 (0.60 ) (0.55 ) Fiscal 2005 Net revenues $ 220,160 $ 190,505 $ 191,532 $ 190,174 $ 792,371 Gross profit 88,019 72,599 77,874 69,280 307,772 Net income 13,917 1,244 7,389 3,061 25,611 Per share data (1) Net income, basic 0.09 0.01 0.05 0.02 0.16 Net income, diluted 0.09 0.01 0.05 0.02 0.16
(1) The Company adopted SFAS No. 142, “Goodwill and Other Intangible Assets,” on October 1, 2002 and recorded a cumulative effect of a change in accounting principle of $397.1 million, which is reflected in the above table as of the beginning of fiscal 2003.
(2)Earnings per share calculations for each of the quarters are based on the weighted average number of shares outstanding and included common stock equivalents in each period. Therefore, the sums of the quarters do not necessarily equal the full year earnings per share. Prior
(2) During the first quarter of fiscal 2005, the Company reduced the carrying value of its deferred tax assets by $2.2 million. This charge resulted from a reduction of the statutory income tax rate in Mexico. This reduction is being reported in the provision for income taxes line of the statement of operations in the first quarter of fiscal 2005. (3) The Company recorded charges of $90.4 million which included $35.1 million in bad debt expense, $23.3 million of inventory charges and reserves, $13.1 million related to severance and benefits, $7.4 million related to the Merger with Alpha Industries, Inc., Conexant’s wireless business had no separate capitalization, therefore a calculation cannot be performed for weighted average shares outstandingwrite-down of technology licenses and design software, $5.0 million related to then calculate earnings per share.revenue adjustments, $4.2 million related to the impairment of certain long-lived assets and $2.3 million related to other charges.
80
ITEM 9. CHANGES IN AND DISAGREEMENTS WITH ACCOUNTANTS ON ACCOUNTING AND FINANCIAL DISCLOSURE.
None.ITEM 9. CHANGES IN AND DISAGREEMENTS WITH ACCOUNTANTS ON ACCOUNTING AND FINANCIAL DISCLOSUREAlpha’s independent accountant was KPMG LLP (“KPMG”)
ITEM 9A. CONTROLS AND PROCEDURES.
Disclosure Controls and Washington/Mexicali’s independent accountant was Deloitte & Touche LLP (“Deloitte & Touche”). KPMG has continued to serve as the Company’s independent accountant after consummation of the Merger. Because the Merger is being accounted for as a reverse acquisition, the financial statements of Washington/Mexicali constitute the financial statements of the Company as of the consummation of the Merger. Therefore, upon the consummation of the Merger on June 25, 2002, there was a change in the independent accountant for the Company’s financial statements from Deloitte & Touche to KPMG, and accordingly, Deloitte & Touche was dismissed as the Company’s independent accountant.The report of Deloitte & Touche on Washington/Mexicali’s financial statements for the fiscal year ended September 30, 2001 did not contain an adverse opinion or a disclaimer of opinion, nor was such report qualified or modified as to uncertainty, audit scope or accounting principles. The decision to change accountants was approved by the Board of Directors.
During Washington/Mexicali’s fiscal year ended September 30, 2001 and through the subsequent interim period to June 25, 2002, Washington/Mexicali did not have any disagreement with Deloitte & Touche on any matter of accounting principles or practices, financial statement disclosure, or auditing scope or procedure that, if not resolved to Deloitte & Touche’s satisfaction, would have caused Deloitte & Touche to make reference to the subject matter of the disagreement in connection with its report. During that time, there were no “reportable events” as set forth in Item 304(a)(1)(v)(A)-(D) of Regulation S-K (“Regulation S-K”) adopted by the SEC.
KPMG (or its predecessors) has been Alpha’s independent accountant since 1975 and Alpha has regularly consulted KPMG (or its predecessors) since that time. Washington/Mexicali, as the continuing reporting entity for accounting purposes, did not consult KPMG during Washington/Mexicali’s fiscal year ended September 30, 2001 and through the interim period to June 25, 2002 regarding any of the matters specified in Item 304(a)(2) of Regulation S-K.
ITEM 9A. CONTROLS AND PROCEDURES
Under the supervision andProcedures
Skyworks’ management, with the participation of our management, including our Presidentits chief executive officer and Chief Executive Officer and Chief Financial Officer, wechief financial officer, evaluated the effectiveness of the design and operation of ourSkyworks’ disclosure controls and procedures (asas of September 29, 2006. The term “disclosure controls and procedures,” as defined in RuleRules 13a-15(e) and 15d-15(e) under the Exchange Act) asAct, means controls and other procedures of a company that are designed to ensure that information required to be disclosed by a company in the end ofreports that it files or submits under the period covered by this Annual Report (the “Evaluation Date”). Based upon that evaluation,Exchange Act is recorded, processed, summarized and reported, within the Presidenttime periods specified in the SEC’s rules and Chief Executive Officer and Chief Financial Officer concluded that, as of the Evaluation Date, our disclosureforms. Disclosure controls and procedures were effective in timely alerting theminclude, without limitation, controls and procedures designed to the materialensure that information relating to us (or our consolidated subsidiaries) required to be includeddisclosed by a company in our periodic SEC filings. In designingthe reports that it files or submits under the Exchange Act is accumulated and evaluatingcommunicated to the disclosure controlscompany’s management, including its principal executive and procedures, our management recognizedprincipal financial officers, as appropriate to allow timely decisions regarding required disclosure. Management recognizes that any controls and procedures, no matter how well designed and operated, can provide only reasonable assurance of achieving the desired controltheir objectives and our management necessarily was required to applyapplies its judgment in evaluating the cost-benefit relationship of possible controls and procedures.There Based on the evaluation of Skyworks’ disclosure controls and procedures as of September 29, 2006, Skyworks’ chief executive officer and chief financial officer concluded that, as of such date, Skyworks’ disclosure controls and procedures were no significant changes made in oureffective at the reasonable assurance level.
Management’s report on Skyworks’ internal control over financial reporting (as defined in Rules 13a-15(f) and 15d-15(f) under the Exchange Act) and the independent registered public accounting firm’s related audit report are included below in this Item 9A. of this Form 10-K and are incorporated herein by reference.No change in Skyworks’ internal control over reporting occurred during the fiscal quarter ended September 30, 200329, 2006 that has materially affected, or is reasonably likely to materially affect, ourthe Company’s internal control over reporting.Management Report on Internal Control over Financial ReportingThe management of the Company is responsible for establishing and maintaining adequate internal control over financial reporting.
PART III
ITEM 10. DIRECTORS AND EXECUTIVE OFFICERS OF THE REGISTRANT
reporting for the company. Internal control over financial reporting is defined in Rule 13a-15(f) or 15d-15(f) promulgated under the Securities Exchange Act of 1934 as a process designed by, or under the supervision of, the company’s principal executive and principal financial officers and effected by the Company’s board of directors, management and other personnel, to provide reasonable assurance regarding the reliability of financial reporting and the preparation of financial statements for external purposes in accordance with generally accepted accounting principles and includes those policies and procedures that: Executive Officers•Pertain to the maintenance of records that in reasonable detail accurately and Directors — The information infairly reflect the section entitled “Directorstransactions and Executive Officers,” appearing indispositions of the Proxy Statement, is incorporated herein by reference. Audit Committee — The information inassets of the section entitled “Audit Committee,” appearing in the Proxy Statement, is incorporated herein by reference.company;
Audit Committee Financial Expert — The board•Provide reasonable assurance that transactions are recorded as necessary to permit preparation of directors has determinedfinancial statements in accordance with generally accepted accounting principles, and that David J. McLachlan, Chairmanreceipts and expenditures of the Audit Committee, is an “audit committee financial expert”company are being made only in accordance with authorizations of management and “independent” as defined under applicable SECdirectors of the company; and Nasdaq rules. The board’s affirmative determination was based, among other things, upon his extensive experience as chief financial officer of Genzyme Corporation.
The Company has adopted its “Code•Provide reasonable assurance regarding prevention or timely detection of Business Conduct and Ethics,” a code of ethics that applies to all employees, including its executive officers. A copyunauthorized acquisition, use or disposition of the Code of Business Conduct and Ethics is postedcompany’s assets that could have a material effect on the Company’s Internet site athttp://www.skyworksinc.com. Additionally, the Company has adopted its “Code of Ethics for Principal Financial Officers,” which is applicable to the Company’s Principal Financial Officers and is also available on our Internet site. In the event that the Company makes any amendment to, or grants any waivers of, a provision of the codes that requires disclosure under applicable rules, the Company intends to disclose such amendment or waiver and the reasons therefor on its Internet site.financial statements.
Because of its inherent limitations, internal control over financial reporting may not prevent or detect misstatements. Projections of any evaluation of effectiveness to future periods are subject to the risk that controls may become81
inadequate because of changes in conditions, or that the degree of compliance with the policies or procedures may deteriorate.The Company’s management assessed the effectiveness of the Company’s internal control over financial reporting as of September 29, 2006. In making this assessment, the Company’s management used the criteria set forth by the Committee of Sponsoring Organizations of the Treadway Commission (COSO) in Internal Control-Integrated Framework.Based on our assessment, management concluded that, as of September 29, 2006, the Company’s internal control over financial reporting is effective based on those criteria.The Company’s independent auditors have issued an audit report on our assessment of the Company’s internal control over financial reporting. This report appears on page 83.82
REPORT OF INDEPENDENT REGISTERED PUBLIC ACCOUNTING FIRMThe Board of Directors and Stockholders
Skyworks Solutions, Inc.:We have audited management’s assessment, included in the accompanying Management Report on Internal Control over Financial Reporting, that Skyworks Solutions, Inc. maintained effective internal control over financial reporting as of September 29, 2006, based on criteria established in Internal Control — Integrated Framework issued by the Committee of Sponsoring Organizations of the Treadway Commission (COSO). Skyworks Solutions, Inc.’s management is responsible for maintaining effective internal control over financial reporting and for its assessment of the effectiveness of internal control over financial reporting. Our responsibility is to express an opinion on management’s assessment and an opinion on the effectiveness of the Company’s internal control over financial reporting based on our audit.We conducted our audit in accordance with the standards of the Public Company Accounting Oversight Board (United States). Those standards require that we plan and perform the audit to obtain reasonable assurance about whether effective internal control over financial reporting was maintained in all material respects. Our audit included obtaining an understanding of internal control over financial reporting, evaluating management’s assessment, testing and evaluating the design and operating effectiveness of internal control, and performing such other procedures as we considered necessary in the circumstances. We believe that our audit provides a reasonable basis for our opinion.A company’s internal control over financial reporting is a process designed to provide reasonable assurance regarding the reliability of financial reporting and the preparation of financial statements for external purposes in accordance with generally accepted accounting principles. A company’s internal control over financial reporting includes those policies and procedures that (1) pertain to the maintenance of records that, in reasonable detail, accurately and fairly reflect the transactions and dispositions of the assets of the company; (2) provide reasonable assurance that transactions are recorded as necessary to permit preparation of financial statements in accordance with generally accepted accounting principles, and that receipts and expenditures of the company are being made only in accordance with authorizations of management and directors of the company; and (3) provide reasonable assurance regarding prevention or timely detection of unauthorized acquisition, use, or disposition of the company’s assets that could have a material effect on the financial statements.Because of its inherent limitations, internal control over financial reporting may not prevent or detect misstatements. Also, projections of any evaluation of effectiveness to future periods are subject to the risk that controls may become inadequate because of changes in conditions, or that the degree of compliance with the policies or procedures may deteriorate.In our opinion, management’s assessment that Skyworks Solutions, Inc. maintained effective internal control over financial reporting as of September 29, 2006, is fairly stated, in all material respects, based on criteria established in Internal Control — Integrated Framework issued by COSO. Also, in our opinion, Skyworks Solutions, Inc. maintained, in all material respects, effective internal control over financial reporting as of September 29, 2006, based on criteria established in Internal Control — Integrated Framework issued by COSO.We also have audited, in accordance with the standards of the Public Company Accounting Oversight Board (United States), the consolidated balance sheets of Skyworks Solutions, Inc. and subsidiaries as of September 29, 2006 and September 30, 2005, and the related consolidated statements of operations, stockholders’ equity and comprehensive income (loss), and cash flows for each of the years in the three-year period ended September 29, 2006 and our report dated December 13, 2006 expressed an unqualified opinion on those consolidated financial statements. Such report includes as explanatory paragraph regarding the Company’s adoption of Statement of Financial Accounting Standards No. 123(R), “Share- Based Payment,” effective October 1, 2005./s/ KPMG LLPBoston, Massachusetts
December 13, 200683
ITEM 9B. Section 16(a) Compliance — The information in the section entitled “Section 16(a) Beneficial Ownership Compliance,” appearing in the Proxy Statement, is incorporated herein by reference.OTHER INFORMATION.
None.PART IIIITEM 10. DIRECTORS AND EXECUTIVE OFFICERS OF THE REGISTRANT
The information relating to our directors, nominees for election as directors and executive officers under the headings “Election of Directors”, “Directors and Executive Officers”, “Corporate Governance” and “Section 16(a) Beneficial Ownership Reporting Compliance” in our definitive proxy statement for the 2007 Annual Meeting of Stockholders is incorporated herein by reference to such proxy statement.We have adopted a written code of business conduct and ethics that applies to our directors, officers and employees, including our principal executive officer, principal financial officer, principal accounting officer or controller, or persons performing similar functions. We make available our code of business conduct and ethics free of charge through our website, which is located at www.skyworksinc.com. We intend to disclose any amendments to, or waivers from, our code of business conduct and ethics that are required to be publicly disclosed pursuant to rules of the SEC and the NASDAQ Global Select Market by filing such amendment or waiver with the SEC and by posting it on our website.ITEM 11. EXECUTIVE COMPENSATION
Information required by this item is contained in our definitive proxy statement for the 2007 Annual Meeting of Stockholders under the caption “Compensation of Executive Officers and Directors” is incorporated herein by reference, provided that the sections entitled “Compensation Committee Report on Executive Compensation” and “Comparative Stock Performance Graph” in our definitive proxy statement for the 2007 Annual Meeting of Executive Officers” and “Compensation of Directors, ” appearing in the Proxy Statement, isStockholders are not incorporated herein by reference.
ITEM 12. SECURITY OWNERSHIP OF CERTAIN BENEFICIAL OWNERS AND MANAGEMENT AND RELATED STOCKHOLDER MATTERS
Except
ITEM 12. SECURITY OWNERSHIP OF CERTAIN BENEFICIAL OWNERS AND MANAGEMENT AND RELATED SHAREHOLDER MATTERS
Information required by this item relating to security ownership of certain beneficial owners and management is contained in our definitive proxy statement for the information concerning equity compensation plans,2007 Annual Meeting of Stockholders under the information in the section entitled “Securitiescaption “Security Ownership of Certain Beneficial Owners and Management,” appearing in the Proxy Statement,Management” and is incorporated herein by reference.EQUITY COMPENSATION PLAN INFORMATION
The Company maintains nine Information required by this item relating to securities authorized for issuance under equity compensation plans under whichis contained in our equity securities are authorized for issuance to our employees and/or directors:
— the 1986 Long-Term Incentive Plan;
— the 1994 Non-Qualified Stock Option Plan;
— the 1996 Long-Term Incentive Plan;
— the 1997 Non-Qualified Stock Option Plan;
— the 1999 Employee Long-Term Incentive Plan;
— the Directors’ 2001 Stock Option Plan;
— the Non-Qualified Employee Stock Purchase Plan;
— the 2002 Employee Stock Purchase Plan; and
— the Washington Sub, Inc. 2002 Stock Option Plan.
Exceptdefinitive proxy statement for the 1999 Employee Long-Term Incentive Plan, the Washington Sub, Inc. 2002 Stock Option Plan and the Non-Qualified Employee Stock Purchase Plan, each2007 Annual Meeting of the foregoing equity compensation plans was approved by our stockholders.
The following table presents information about these plans as of September 30, 2003.
Plan Category
Number of securities to
be issued upon exercise
of outstanding options,
warrants, and rights
(a)
Weighted-average
exercise price of
outstanding options,
warrants and rights
(b)
Number of securities
remaining available for
future issuance under
equity compensation
plans (excluding
securities reflected in
column (a))
(c)
Equity compensation plans approved by security holders 8,691,510 $ 16 .45 1,834,897 Equity compensation plans not approved by security holders 17,071,976 $ 14 .93 12,348,938
Total 25,763,523 $ 15 .44 14,183,835
(1)No further grants will be made under the 1986 Long-Term Incentive Plan, the 1994 Non-Qualified Stock Option Plan and the 1997 Non-Qualified Stock Option Plan.
(2)No further grants may be made under the Washington Sub Inc. 2002 Stock Option Plan. (3) Includes 14,351,737 options held by non-employees (excluding directors).
1999 EMPLOYEE LONG-TERM INCENTIVE PLAN
The purposes of the Company’s 1999 Employee Long-term Incentive Plan (the “1999 Employee Plan”) are (i) to provide long-term incentives and rewards to those employees of the Company and its subsidiaries, other than officers and non-employee directors, who are in a position to contribute to the long-term success and growth of the Company and its subsidiaries, (ii) to assist the Company in retaining and attracting employees with requisite experience and ability, and (iii) to associate more closely the interests of such employees with those of the Company’s stockholders. The 1999 Employee Plan provides for the grant of non-qualified stock options to purchase shares of the Company’s common stock. The term of these options may not exceed ten years. The 1999 Employee Plan contains provisions which permit restrictions on vesting or transferability, as well as continued exercisability upon a participant’s termination of employment with the Company, of options granted thereunder. The 1999 Employee Plan provides for full acceleration of the vesting of options granted thereunder upon a “change in control” of the Company, as defined in the 1999 Employee Plan. The Board of Directors generally may amend, suspend or terminate the 1999 Employee Plan in whole or in part at any time; provided that any amendment which affects outstanding options be consented to by the holder of the options.
WASHINGTON SUB, INC. 2002 STOCK OPTION PLAN
The Washington Sub, Inc. 2002 Stock Option Plan (the “Washington Sub Plan”) became effective on June 25, 2002 in connection with the Merger. At the time of the spin-off of Conexant’s wireless business, outstanding Conexant options granted pursuant to certain Conexant stock incentive plans were converted so that following the spin-off and Merger each holder of those certain Conexant options held (i) options to purchase shares of Conexant common stock and (ii) options to purchase shares of Skyworks common stock. The purpose of the Washington Sub Plan is to provide a means for the Company to perform its obligations with respect to these converted stock options. The only participants in the Washington Sub Plan are those persons who, at the time of the Merger, held outstanding options granted pursuant to certain Conexant stock option plans. No further options to purchase shares of Skyworks common stock will be grantedStockholders under the Washington Sub Plan. The Washington Subcaption “Stock Based Compensation Plan contains a number of sub-plans, which contain termsInformation” and conditions that are applicable to certain portions of the options subject to the Washington Sub Plan, depending upon the Conexant stock option plan from which the Skyworks options granted under the Washington Sub Plan were derived. The outstanding options under the Washington Sub Plan generally have the same terms and conditions as the original Conexant options from which they are derived. Most of the sub-plans of the Washington Sub Plan contain provisions related to the effect of a participant’s termination of employment with the Company, if any, and/or with Conexant on options granted pursuant to such sub-plan. Several of the sub-plans under the Washington Sub Plan contain specific provisions related to a change in control of the Company.
NON-QUALIFIED ESPP
The Company also maintains a Non-Qualified Employee Stock Purchase Plan to provide employees of the Company and participating subsidiaries with an opportunity to acquire a proprietary interest in the Company through the purchase, by means of payroll deductions, of shares of the Company’s common stock at a discount from the market price of the common stock at the time of purchase. The Non-Qualified Employee Stock Purchase Plan is intended for use primarily by employees of the Company located outside the United States. Under the plan, eligible employees may purchase common stock through payroll deductions of up to 10% of compensation. The price per share is the lower of 85% of the market price at the beginning or end of each six-month offering period.
ITEM 13. CERTAIN RELATIONSHIPS AND RELATED TRANSACTIONS
The information required by this Item 13 is hereby incorporated by reference to the Company's Proxy Statement.
ITEM 14. PRINCIPAL ACCOUNTANT FEES AND SERVICES
The information in the section entitled “Audit Fees and Services,” appearing in the Proxy Statement, is incorporated herein by reference.
PART IV
ITEM 15. EXHIBITS, FINANCIAL STATEMENT SCHEDULES, AND REPORTS ON FORM 8-K
(a) 1. Index to Financial Statements
The financial statements filed as part of this report are listed on the index appearing on page 43.
2. Index to Financial Statement Schedules
The following financial statement schedule is filed as part of this report (page reference is to this report):
Schedule II Valuation and Qualifying Accounts................................................Page 86
All other required schedule information is included in the Notes to Consolidated Financial Statements or is omitted because it is either not required or not applicable.
3. Exhibits
No.
Description
2.a
2.b
2.c
2.d
2.e
3.a
3.b
4.a
4.b
4.c
4.d
4.e
4.f
4.g
10.a
10.b
10.c
10.d
10.e
10.f
10.g
10.h
10.i
10.j
10.k
10.l
10.m
10.n
10.o
10.p
10.q
10.r
10.s
10.t
10.u
10.v
10.w
10.x
10.y
10.z
10.aa
10.bb
10.cc
11
16
21
23.a
23.b
31.a
31.b
32Agreement and Plan of Reorganization, dated as of December 16, 2001, as amended as of
April 12, 2002, by and among the Company, Washington Sub, Inc. and Conexant Systems,
Inc. (14)
Contribution and Distribution Agreement, dated as of December 16, 2001, as amended as
of June 25, 2002, by and between Washington Sub, Inc. the Company and Conexant Systems,
Inc. (13)
Mexican Stock Purchase Agreement, dated as of June 25, 2002, by and between the Company
and Conexant Systems, Inc. (13)
Amended and Restated Mexican Asset Purchase Agreement, dated as of June 25, 2002, by
and between the Company and Conexant Systems, Inc. (13)
U.S. Asset Purchase Agreement, dated as of December 16, 2001 by and between the Company
and Conexant Systems, Inc. (13)
Amended and Restated Certificate of Incorporation (18)
Second Amended and Restated By-laws (18)
Specimen Certificate of Common Stock (1)
Loan and Security Agreement, dated December 15, 1993, by and between Trans-Tech, Inc.
and County Commissioners of Frederick County (9)
Indenture, dated as of November 12, 2002, by and between the Company and State Street
Bank and Trust Company (as Trustee) (18)
Form of 4.75% Convertible Subordinated Note of the Company (18)
Indenture, dated as of November 20, 2002, by and between the Company and Wachovia Bank,
National Association (as Trustee) (18)
Form of 15% Senior Convertible Note of the Company (18)
First Supplemental Indenture dated as of January 15, 2003 between Skyworks Solutions,
Inc. and Wachovia Bank, National Association (as Trustee) (20)
Skyworks Solutions, Inc., 1986 Long-Term Incentive Plan as amended (2)*
Skyworks Solutions, Inc., Long-Term Compensation Plan dated September 24, 1990 (3);
amended March 28, 1991 (4); and as further amended October 27, 1994 (5)*
Severance Agreement, dated April 1, 2001, between the Company and David J. Aldrich (6)*
Skyworks Solutions, Inc. 1994 Non-Qualified Stock Option Plan for Non-Employee
Directors (2)*
Skyworks Solutions, Inc. Executive Compensation Plan dated January 1, 1995 and Trust
for the Skyworks Solutions, Inc. Executive Compensation Plan dated January 3, 1995 (5)*
Severance Agreement, dated September 4, 1998, between the Company and Paul E. Vincent
(7)*
Skyworks Solutions, Inc. 1997 Non-Qualified Stock Option Plan for Non-Employee
Directors (8)*
Skyworks Solutions, Inc. 1996 Long-Term Incentive Plan (10)*
Skyworks Solutions, Inc. Directors' 2001 Stock Option Plan (11)*
Skyworks Solutions, Inc. 1999 Employee Long-Term Incentive Plan (18)
Washington Sub Inc., 2002 Stock Option Plan (15)
Skyworks Solutions, Inc. Non-Qualified Employee Stock Purchase Plan (18)
Form of Shareholders Agreement, dated as of December 16, 2001, entered into between
each of the directors and certain executive officers of the Company as of the date
thereof and Conexant Systems, Inc. (17)
Warrant, dated as of June 25, 2002, issued to Jazz Semiconductor, Inc. (16)
Newport Beach Wafer Supply and Services Agreement, dated as of June 25, 2002, by and
between the Company and Conexant Systems, Inc. (18)
Information Technology Service Agreement, dated as of June 25, 2002, by and between the
Company and Conexant Systems, Inc. (18)
Mexicali Device Supply and Services Agreement, dated as of June 25, 2002, by and
between the Company and Conexant Systems, Inc. + (18)
Newbury Park Wafer Supply and Services Agreement, dated as of June 25, 2002, by and
between the Company and Conexant Systems, Inc. + (18)
Refinancing Agreement, dated as of November 6, 2002, by and among the Company, certain
of its subsidiaries and Conexant Systems, Inc. (12)
First Amendment of Financing Agreement, dated as of November 6, 2002, by and among the
Company, certain of its subsidiaries and Conexant Systems, Inc. (12)
Letter Agreement, dated as of November 6, 2002, by and between the Company and Conexant
Systems, Inc. (12)
Registration Rights Agreement, dated as of November 12, 2002, by and among the Company
and Credit Suisse First Boston (as representative for the several purchasers) (18)
Registration Rights Agreement, dated as of November 12, 2002, by and between the
Company and Conexant Systems, Inc. (18)
2002 Skyworks Solutions, Inc. Employee Stock Purchase Plan (18)
Credit and Security Agreement, dated as of July 15, 2003, by and between Skyworks USA,
Inc. and Wachovia Bank, National Association. (19)
Servicing Agreement, dated as of July 15, 2003, by and between the Company and Skyworks
USA, Inc. (19)
Receivables Purchase Agreement, dated as of July 15, 2003, by and between Skyworks USA,
Inc. and the Company. (19)
Registration Rights Agreement, dated as of September 9, 2003, by and among the Company
and Credit Suisse First Boston (as representative for the several purchasers) (21)
Terms Agreement, dated as of September 9, 2003, by and among the Company and Credit
Suisse First Boston. (21)
Statement regarding computation of per share earnings. (SeeNote 2 to the Consolidated
Financial Statements)
Letter dated June 27, 2002 from Deloitte & Touche LLP to the Securities and Exchange
Commission. (22)
Subsidiaries of the Registrant **
Consent of KPMG LLP **
Consent of Deloitte & Touche LLP **
Certification of CEO - Rule 13A-14(A) or 15D-14(A) **
Certification of CFO - Rule 13A-14(A) or 15D-14(A) **
Certification pursuant to 18 U.S.C. Section 1350, as Adopted Pursuant to Section 906 of
the Sarbanes-Oxley Act of 2002 **ITEM 13. CERTAIN RELATIONSHIPS AND RELATED TRANSACTIONS
Information required by this item is contained in our definitive proxy statement for the 2007 Annual Meeting of Stockholders under the caption “Certain Relationships and Related Transactions” and is incorporated herein by reference.
* Management contract or compensatory plan
** Filed herewith
+ Confidential treatment granted for certain portions of this agreement which have been omitted and filed separately with the Securities and Exchange Commission.
(1)
(2)
(3)
(4)
(5)
(6)
(7)
(8)
(9)
(10)
(11)
(12)
(13)
(14)
(15)
(16)
(17)
(18)
(19)
(20)
(21)
(22)
ITEM 14. Incorporated by reference to the exhibitPRINCIPAL ACCOUNTING FEES AND SERVICES
Information required by this item is contained in our definitive proxy statement for the 2007 Annual Meeting of Stockholders under the caption “Audit Fees” and is incorporated herein by reference.84
PART IVITEM 15. EXHIBITS, FINANCIAL STATEMENT SCHEDULES.
(a) The following are filed with our Registration Statement on Form
S-3 filed on July 15, 2002 (File No. 333-92394).
Incorporated by reference to the exhibit filed with our Quarterly Report on Form 10-Q
for the fiscal quarter ended October 2, 1994 (File No. 001-05560).
Incorporated by reference to the exhibit filed with ouras part of this Annual Report on Form 10-K for
the fiscal year ended March 29, 1992 (File No. 001-05560).
Incorporated by reference10-K:
1. Index to the exhibit filed with our Quarterly Financial Statements Page number in this report
Report on Form 10-Q
of Independent Registered Public Accounting Firm Page 51 Consolidated Statements of Operations for the fiscal quarter ended June 27, 1993 (File No. 001-05560).
Incorporated by referenceYears Ended September 29, 2006, September 30, 2005, and October 1, 2004 Page 52 Consolidated Balance Sheets at September 29, 2006 and September 30, 2005 Page 53 Consolidated Statements of Cash Flows for the Years Ended September 29, 2006, September 30, 2005 and October 1, 2004 Page 54 Consolidated Statements of Stockholders’ Equity and Comprehensive Income (Loss) for the Years Ended September 29, 2006, September 30, 2005, and October 1, 2004 Page 55 Notes to the exhibitConsolidated Financial Statements Pages 56 through 80
2. The schedule listed below is filed with ouras part of this Annual Report on Form 10-K for
10-K: Page number in this report Schedule II-Valuation and Qualifying Accounts Page 88
All other required schedule information is included in the fiscal year ended April 2, 1995 (File No. 001-05560).
Incorporated by referenceNotes to Consolidated Financial Statements or is omitted because it is either not required or not applicable 3. The Exhibits listed in the exhibitExhibit Index immediately preceding the Exhibits are filed with our Quarterly Report on Form 10-Q
for the fiscal quarter ended July 1, 2001.
Incorporated by reference to the exhibit filed with our Quarterly Report on Form 10-Q
for the fiscal quarter ended September 27, 1998 (File No. 001-05560).
Incorporated by reference to the exhibit filed with ouras a part of this Annual Report on Form 10-K for
the fiscal year ended March 29, 1998 (File No. 001-05560).
Incorporated by reference to the exhibit filed with our Quarterly Report on Form 10-Q
for the fiscal quarter ended July 3,1994 (File No. 001-05560).
Incorporated by reference to the exhibit filed with our Annual Report on Form 10-K for
the fiscal year ended April 1, 2001.
Incorporated by reference to the exhibit filed with our Quarterly Report on Form 10-Q
for the fiscal quarter ended September 30, 2001.
Incorporated by reference to the exhibits filed with our Current Report on Form 8-K
dated November 6, 2002.
Incorporated by reference to the exhibits filed with our Current Report on Form 8-K
dated June 25, 2002.
Incorporated by reference to Annex A filed with our Registration Statement on Form S-4,
as amended, filed on May 10, 2002 (File No. 333-83768).
Incorporated by reference to exhibit filed with our Registration Statement on Form S-3
filed on July 15, 2002 (File No. 333-92394).
Incorporated by reference to the exhibit filed with our Registration Statement on Form
S-3 filed on August 30, 2002 (File No. 333-99015).
Incorporated by reference to the exhibit filed with our Registration Statement on Form
S-4, as amended, filed on May 3, 2002 (File No. 333-83768)
Incorporated by reference to the exhibit filed with our Annual Report on Form 10-K for
the fiscal year ended September 27, 2002.
Incorporated by reference to the exhibit filed with our Quarterly Report on Form 10-Q
for the fiscal quarter ended June 27, 2003.
Incorporated by reference to the exhibit filed with our Quarterly Report on Form 10-Q
for the fiscal quarter ended December 27, 2003.
Incorporated by reference to the exhibits filed with our Current Report on Form 8-K
dated September 10, 2003.
Incorporated by reference to the exhibit filed with our Current Report on Form 8-K
dated June 28, 2002.10-K.
(b) Reports on Form 8-K
The Company filed, on July 23, 2003, a current report on Form 8-K furnishing one exhibit: a Press Release announcing the Company’s financial results for the three and nine month periods ended June 27, 2003.(b)Exhibits
The Company filed, on September 9, 2003, a current report on Form 8-K, which served to incorporate by reference the Company’s press releases dated September 8, 2003 and September 9, 2003 relating to the issuance, pricing and sale of an offering of 9,200,000 shares of the Company’s common stock.
The Company filed, on September 10, 2003, a current report on Form 8-K which served to incorporate by reference the Terms Agreement dated September 9, 2003 between the Company and Credit Suisse First Boston LLC, relating to the issuance and sale of an offering of 9,200,000 shares of the Company’s common stock.
The Company filed, on October 30, 2003, a current report on Form 8-K furnishing one exhibit: a Press Release announcing the Company’s financial results for the three and twelve month periods ended October 3, 2003.
(c) Exhibits
The exhibits required by Item 601 of Regulation S-K are filed herewith and incorporated by reference herein. The response to this portion of Item 15 is submitted under Item 15 (a) (3).
85
SIGNATURESPursuant to the requirements of the Securities Exchange Act of 1934, the Registrant has duly caused this report to be signed on its behalf by the undersigned thereunto duly authorized.SKYWORKS SOLUTIONS, INC. Registrant By: /s/ /s/ DAVID J. ALDRICH David J. Aldrich Chief Executive Officer President Director
By: /s/ PAUL E. VINCENTPresident Paul E. Vincent Chief Financial Officer Treasurer Principal Accounting Officer Director Secretary
POWER OF ATTORNEY AND SIGNATURES
We, the undersigned officers and directors of Skyworks Solutions, Inc., hereby severally constitute and appoint David J. Aldrich and Paul E. Vincent, and each of them singly, our true and lawful attorneys, with full power to them and each of them singly, to sign for us and in our names in the capacities indicated below, any amendments to this Annual Report on Form 10-K, and generally to do all things in our names and on our behalf in such capacities to enable Skyworks Solutions, Inc. to comply with the provisions of the Securities Exchange Act of 1934, as amended, and all the requirements of the Securities Exchange Commission.86
Pursuant to the requirements of the Securities Exchange Act of 1934, this report has been signed below by the following persons on behalf of the registrant and in the capacities indicated on December 22, 2003.13, 2006.Signature and TitleSignature and Title
Signature and Title /s/ DWIGHT W. DECKER /s/ DONALD R. BEALLDwight W. Decker Donald R. Beall Chairman of the Board Director /s/ DAVID J. ALDRICH /s/ MOIZ M. BEGUWALADavid J. Aldrich Moiz M. Beguwala Chief Executive Officer President and Director (principal executive officer) President and /s/ ALLAN M. KLINE Allan M. Kline Chief Financial Officer Director Vice President (principal accounting and /s/ PAUL E. VINCENT/s/ TIMOTHY R. FUREY Paul E. Vincentfinancial officer) Timothy R. Furey
Chief Financial Officer Director Signature and Title Treasurer /s/ KEVIN L. BEEBE Kevin L. Beebe Director Principal Accounting Officer /s/ MOIZ M. BEGUWALA Moiz M. Beguwala Director Secretary /s/ TIMOTHY R. FUREY Timothy R. Furey Director /s/ BALAKRISHNAN S. IYER Balakrishnan S. Iyer Director Balakrishnan S. Iyer Director /s/ THOMAS C. LEONARD Thomas C. Leonard Director Thomas C. Leonard Director /s/ DAVID P. MCGLADE David P. McGlade Director /s/ DAVID J. MCLACHLAN David J. McLachlan Director /s/ ROBERT A. SCHRIESHEIM Robert A. Schriesheim Director
87
Charged to Cost and Ending Description Beginning Balance Expenses Deductions Misc. Balance Year Ended October 1, 2004 Allowance for doubtful accounts $ 1,979 $ 377 $ (369 ) $ — $ 1,987 Reserve for sales returns $ 5,009 $ 9,200 $ (9,300 ) $ — $ 4,909 Allowance for excess and obsolete inventories $ 25,305 $ 535 $ (12,105 ) $ — $ 13,735 Year Ended September 30, 2005 Allowance for doubtful accounts $ 1,987 $ 5,127 $ (1,299 ) $ — $ 5,815 Reserve for sales returns $ 4,909 $ 4,986 $ (6,884 ) $ 48 $ 3,059 Allowance for excess and obsolete inventories $ 13,735 $ 11,482 $ (13,238 ) $ — $ 11,979 Year Ended September 29, 2006 Allowance for doubtful accounts $ 5,815 $ 35,959 $ (4,752 ) $ — $ 37,022 Reserve for sales returns $ 3,059 $ 4,867 $ (3,803 ) $ (19 ) $ 4,104 Allowance for excess and obsolete inventories $ 11,979 $ 23,154 $ (7,428 ) $ — $ 27,705
88
Description
Beginning
Balance
Charged to
Costs and
Expenses (1)
Deductions
Other (3)
Ending
Balance
Year Ended September 30, 2001 Allowance for doubtful accounts $ 3,792 $ (468 ) $ (118 ) $ -- $ 3,206 Reserve for sales returns $ 534 $ 4,055 $ -- $ -- $ 4,589 Allowance for excess and obsolete inventories $ 9,099 $ 2,286 (2) $ -- $ -- $11,385 Year Ended September 30, 2002 Allowance for doubtful accounts $ 3,206 $ (512 ) $ (575 ) $ (795 ) $ 1,324 Reserve for sales returns $ 4,589 $ 7,616 $(7,199 ) $ 3,510 $ 8,516 Allowance for excess and obsolete inventories $ 11,285 $ 6,225 $(3,092 ) $ 6,100 $20,618 Year Ended September 30, 2003 Allowance for doubtful accounts $ 1,324 $ 1,156 $ (501 ) $ -- $ 1,979 Reserve for sales returns $ 8,516 $ 3,624 $(7,131 ) $ -- $ 5,009 Allowance for excess and obsolete inventories $20,618 $ 9,577 $(4,890 ) $ -- $25,305
EXHIBIT INDEX(1) Additions charged to costs and expenses in the allowance for doubtful accounts reflect credit balances recorded in fiscal 2001, resulting from reductions in the allowance account associated with overall collections experience more favorable than previously estimated. Deductions in the allowance for doubtful accounts reflect amounts written off.
(2) Amount excludes inventory write-downs of $58.7 million charged to cost of goods sold relating to inventory that was written down to a zero cost basis.
(3) Amounts include Alpha’s allowance for doubtful accounts, reserve for sales returns
Exhibit Incorporated by Reference Filed Number Exhibit Description Form File No. Exhibit Filing Date Herewith 2.A Agreement and allowances for excessPlan of Reorganization, dated as of December 16, 2001, as amended as of April 12, 2002, by and absolute inventories balancesamong the Company, Washington Sub, Inc. and Conexant Systems, Inc. S-4 333-83768 2.a 5/10/2002 2.B Contribution and Distribution Agreement, dated as of $1.2 million, $3.5 million and $6.1 million, respectively, which were assumed on June 25, 2002 in connection with the Merger. In addition, Conexant retained Washington/Mexicali’s accounts receivable and allowance for doubtful accounts balancesDecember 16, 2001, as amended as of June 25, 2002. Washington/Mexicali’s allowance for doubtful accounts balance at2002, by and between Washington Sub, Inc. the Company and Conexant Systems, Inc. 8-K 001-5560 2.2 6/28/2002 2.C Mexican Stock Purchase Agreement, dated as of June 25, 2002, was $2.0 million.by and between the Company and Conexant Systems, Inc. 8-K 001-5560 2.3 6/28/2002 2.D Amended and Restated Mexican Asset Purchase Agreement, dated as of June 25, 2002, by and between the Company and Conexant Systems, Inc. 8-K 001-5560 2.4 6/28/2002 2.E U.S. Asset Purchase Agreement, dated as of December 16, 2001 by and between the Company and Conexant Systems, Inc. 8-K 001-5560 2.5 6/28/2002 3.A Amended and Restated Certificate of Incorporation 10-K 001-5560 3.A 12/23/2002 3.B Second Amended and Restated By-laws 10-K 001-5560 3.B 12/23/2002 4.A Specimen Certificate of Common Stock S-3 333-92394 4 7/15/2002 4.B Form of 4.75% Convertible Subordinated Note of the Company 10-K 001-5560 4.D 12/23/2002 4.C Indenture, dated as of November 20, 2002, by and between the Company and Wachovia Bank, N.A. (as Trustee) 10-K 001-5560 4.E 12/23/2002 4.D First Supplemental Indenture dated as of January 15, 2003 between Skyworks Solutions, Inc. and Wachovia Bank, N.A. (as Trustee) S-3 333-102157 4.03 1/16/2003 10.A* Skyworks Solutions, Inc., 1986 Long-Term Incentive Plan as amended 10-K 001-5560 10.A 12/14/2005 10.B* Skyworks Solutions, Inc., Long-Term Compensation Plan dated September 24, 1990; amended March 28, 1991; and as further amended October 27, 1994 10-K 001-5560 10.B 12/14/2005 10.C* Skyworks Solutions, Inc. 1994 Non-Qualified Stock Option Plan for Non-Employee Directors 10-K 001-5560 10.C 12/14/2005
89
EXHIBIT INDEX
Exhibit Incorporated by Reference Filed Number Exhibit Description Form File No.
Exhibit Filing Date Herewith 10.D* Skyworks Solutions, Inc. Executive Compensation Plan dated January 1, 1995 and Trust for the Skyworks Solutions, Inc. Executive Compensation Plan dated January 3, 1995 10-K 001-5560 10.D 12/14/2005 10.E* Skyworks Solutions, Inc. 1997 Non-Qualified Stock Option Plan for Non-Employee Directors 10-K 001-5560 10.E 12/14/2005 10.F* Skyworks Solutions, Inc. 1996 Long-Term Incentive Plan X 10.G* Skyworks Solutions, Inc. 1999 Employee Long-Term Incentive Plan 10-K 001-5560 10.L 12/23/2002 10.H* Washington Sub Inc., 2002 Stock Option Plan S-3 333-92394 99.A 7/15/2002 10.I* Skyworks Solutions, Inc. Non-Qualified Employee Stock Purchase Plan 10-K 001-5560 10.N 12/23/2002 10.J Form of Shareholders Agreement, dated as of December 16, 2001, entered into between each of the directors and certain executive officers of the Company as of the date thereof and Conexant Systems, Inc. S-4 333-83768 10 5/10/2002 10.K Registration Rights Agreement, dated as of November 12, 2002, by and among the Company and Credit Suisse First Boston (as representative for the several purchasers) 10-K 001-5560 10.AA 12/23/2002 10.L* 2002 Skyworks Solutions, Inc. Employee Stock Purchase Plan 10-K 001-5560 10.CC 12/23/2002 10.M Credit and Security Agreement, dated as of July 15, 2003, by and between Skyworks USA, Inc. and Wachovia Bank, N.A. 10-Q 001-5560 10.A 8/11/2003 10.N Servicing Agreement, dated as of July 15, 2003, by and between the Company and Skyworks USA, Inc. 10-Q 001-5560 10.B 8/11/2003 10.O Receivables Purchase Agreement, dated as of July 15, 2003, by and between Skyworks USA, Inc. and the Company 10-Q 001-5560 10.C 8/11/2003 10.P Terms Agreement, dated as of September 9, 2003, by and among the Company and Credit Suisse First Boston 8-K 001-5560 1.1 9/10/2003 10.Q* Form of Notice of Grant of Stock Option for the Company’s 1996 Long-Term Incentive Plan 8-K 001-5560 10.1 11/17/2004 10.R* Fiscal 2007 Executive Incentive Compensation Plan X
90
Exhibit Incorporated by Reference Filed Number Exhibit Description
Form File No. Exhibit Filing Date Herewith 10.S* Skyworks Solutions, Inc. 2005 Long-Term Incentive Plan 8-K 001-556 10.1 5/04/2005 10.T* Skyworks Solutions, Inc. Directors’ 2001 Stock Option Plan 8-K 001-556 10.2 5/04/2005 10.U* Form of Notice of Grant of Stock Option for the Company’s 2001 Directors Plan 8-K 001-556 10.3 5/04/2005 10.V* Form of Notice of Stock Option Agreement under the Company’s 2005 Long-Term Incentive Plan 10-Q 001-5560 10.A 5/11/2005 10.W* Form of Notice of Restricted Stock Agreement under the Company’s 2005 Long-Term Incentive Plan 10-Q 001-5560 10.B 5/11/2005 10.X* Severance and Change in Control Agreement, dated May 31, 2005, between the Company and David J. Aldrich 8-K 001-5560 10.1 5/31/2005 10.Y* Severance and Change in Control Agreement between the Company and Liam K. Griffin 8-K 001-5560 10.2 5/31/2005 10.Z* Severance and Change in Control Agreement between the Company and Allan M. Kline 8-K 001-5560 10.3 5/31/2005 10.AA* Severance and Change in Control Agreement between the Company and George M. LeVan 8-K 001-5560 10.4 5/31/2005 10.BB* Severance and Change in Control Agreement between the Company and Gregory L. Waters 8-K 001-5560 10.5 5/31/2005 10.CC* Severance and Change in Control Agreement between the Company and Kevin D. Barber 8-K 001-5560 10.6 5/31/2005 10.DD* Severance and Change in Control Agreement between the Company and Mark V. B. Tremallo 8-K 001-5560 10.7 5/31/2005 10.EE* Skyworks Solutions, Inc. Restricted Stock Agreement Granted Under 2005 Long-Term Incentive Plan 8-K 001-5560 10.1 11/15/2005 10.FF* Amended and Restated Severance and Change in Control Agreement between the Company and Kevin D. Barber X 11 Statement regarding calculation of per share earnings [see Note 2 to the Consolidated Financial Statements] X 12 Computation of Ratios X 21
23.a
23.b
31.a
31.b
32 Subsidiaries of the Registrant
Company X 23.1 Consent of KPMG LLP
Consent of Deloitte & Touche LLP
LLP. X 31.1 Certification of CEO - Rule 13A-14(A) or 15D-14(A)
the Company’s Chief Executive Officer pursuant to Securities and Exchange Act
91
Exhibit Incorporated by Reference Filed Number Exhibit Description Form File No. Exhibit Filing Date Herewith Rules 13a- 14(a) and 15d-14(a), as adopted pursuant to Section 302 of the Sarbanes-Oxley Act of 2002 X 31.2 Certification of CFO - Rule 13A-14(A) or 15D-14(A)
the Company’s Chief Financial Officer pursuant to Securities and Exchange Act Rules 13a-14(a) and 15d-14(a), as adopted pursuant to Section 302 of the Sarbanes-Oxley Act of 2002 X 32.1 Certification of the Company’s Chief Executive Officer pursuant to 18 U.S.C. Section 1350, as Adopted Pursuantadopted pursuant to Section 906 of
the Sarbanes-Oxley Act of 2002 X 32.2 Certification of the Company’s Chief Financial Officer pursuant to 18 U.S.C. Section 1350, as adopted pursuant to Section 906 of the Sarbanes-Oxley Act of 2002 X
* Indicates a management contract or compensatory plan or arrangement.
92
Leveraging Core Technologies
Skyworks deploys technology building blocks such as radio frequency integrated circuits, analog/mixed-signal processing cores
| Skyworks’ vision is to become the leading supplier of high performance analog and mixed signal semiconductors enabling mobile connectivity. Key elements in our strategy include: |
Increasing Integration Levels
Highshare position through higher levels of integration enhanceand continued innovation, leveraging our leading edge process and packaging technology.
Capturing an Increasing Amount of Semiconductor Content
We enable our customers to start with individual components as necessary, and then migrate up the product integration ladder. We believe that our highly integrated solutions will enable these customers to speed their time to market while focusing their resources on product differentiation through a broader range of more sophisticated, next-generation features.
Diversifying Customer Base
Skyworks supports virtually every wirelesscellular handset OEM including Nokia Corporation, Motorola, Inc., Samsung Electronics Co., Sony/Ericsson and LG Electronics, Inc. as well as emerging ODMs and contract manufacturers such as BenQ, Compal, Flextronics and Quanta. With the industry’s move towards outsourcing, we believe that we are particularly well-positioned to address the growing needs of new market entrants who seek RF and system-level integration expertise.industry.
6
The Skyworks operations team leverages world-class manufacturing technologies and enables highly integrated modules as well as system-level solutions. Skyworks will
7
| DCR™ Transceivers | Attenuators | |||
| GPRS RF Subsystems | Chip Capacitors | |||
| GSM/GPRS/EDGE Power Amplifiers | Diodes | |||
| Helios™ DigRF Subsystems | Directional Couplers/Detectors | |||
| Helios™ EDGE RF Subsystems | Hybrids | |||
| Intera™ Front-End Modules | Infrastructure RF Subsystems | |||
| SPR® Solutions | Mixers/Demodulators | |||
| TD-SCDMA Power Amplifiers | Modulators | |||
| WCDMA/CDMA Power Amplifiers | Phase Shifters | |||
| Power Dividers/Combiners | ||||
| Receivers | ||||
| Switches | ||||
| Synthesizers/PLLs | ||||
| Technical Ceramics |
| • | DCR Transceiver (Tx/Rx):encompasses the complete RF transmit and receive functions | ||
| • | Front-End Modules (FEM): power amplifiers that are integrated with switches, diplexers, filters and other components to create a single package front-end solution | ||
| • | Power Amplifiers (PA): the module that strengthens the signal so that it has sufficient energy to reach a base station | ||
| • | Helios™ RF Subsystems/Single Package Radio (SPR®) Solution:combines the transceiver, the PA and associated controller, surface acoustic wave (SAW) filters, and a switchplexer into a single, multi chip module (MCM) package |
| • | Attenuators:A circuit that allows a known source of power to be reduced by a predetermined factor (usually expressed as decibels) | ||
| • | Capacitors:a passive electronic component that stores energy in the form of an electrostatic field | ||
| • | Ceramic:material used in semiconductors which contain transition metal oxides that are II-VI semiconductors, such as zinc-oxide | ||
| • | Diodes:semiconductor devices that pass current in one direction only | ||
| • | Directional Coupler:a transmission coupling device for separately sampling the forward or backward wave in a transmission line | ||
| • | Directional Detector:intended for use in power management applications | ||
| • | Hybrid:monolithic circuitry that is 100% passive and offers low loss, high isolation and phase/amplitude balance | ||
| • | Phase Shifter:achieves its distinct sound by creating one or more notches in the frequency domain that eliminate sounds at the notch frequencies |
8
| • | PLL (Phase-Locked Loop):is a closed-loop feedback control system that maintains a generated signal in a fixed phase relationship to a reference signal | ||
| • | Power Combiner:used for connecting more than one antenna to a single radio | ||
| • | Power Divider:passive devices designed to combine multiple antennas in a stacked antenna system, while providing a constant 50 ohm impedance over the bandwidth chosen | ||
| • | Switch: the component that performs the change between the transmit and receive function, as well as the band function for cellular handsets | ||
| • | Synthesizer:designed for tuning systems and is optimized for low-phase noise with comparison frequencies |
| • | Broad multimode radio and precision analog product portfolio | |
| • | Market leadership in key product segments | |
| • | Solutions for all air interface standards, including CDMA2000, GSM/GPRS/EDGE, WCDMA and WLAN | |
| • | Engagements with a diverse set of influential customers | |
| • | Analog, RF and mixed signal design capabilities | |
| • | Access to all key process technologies: GaAs HBT, PHEMT, BiCMOS, SiGE, CMOS and RF CMOS | |
| • | World-class manufacturing capabilities and scale | |
| • | Unparalleled level of customer service and technical support | |
| • | Commitment to technology innovation |
America, China and Taiwan).
reducing time-to-market.
9
CUSTOMERS
During fiscal year 2003, Samsung Electronics Co.
Form 10-K.
Our research and development expenditures for fiscal 2003, 2002years ended September 29, 2006, September 30, 2005, and 2001October 1, 2004 were $151.8$164.1 million, $132.6$152.2 million, and $111.1$152.6 million, respectively.
10
Under supply agreements entered into with Conexant and Jazz Semiconductor, we receive wafer fabrication, wafer probe and certain other services from Jazz Semiconductor. Pursuant to these supply agreements, we are committed to obtain certain minimum wafer volumes from Jazz Semiconductor. Our expected minimum purchase obligations under these supply agreements are anticipated to be approximately $39 million and $13 million in fiscal 2004 and 2005, respectively.
We also deliver product to certain external customer “hubs” (consignment) where our significant customers will pull inventory from their existing consignment inventories when required. These consignment pulls trigger revenue recognition and we periodically replenish these inventory levels.
CYCLICALITY;
Net
11
| Years Ended September 30, | |||||||||||
|---|---|---|---|---|---|---|---|---|---|---|---|
| 2003 | 2002 | 2001 | |||||||||
| United States | $ | 87,691 | $ | 72,185 | $ | 63,948 | |||||
| Other Americas | 69,559 | 4,615 | 5,455 | ||||||||
| Total Americas | 157,250 | 76,800 | 69,403 | ||||||||
| South Korea | 157,772 | 237,681 | 142,459 | ||||||||
| Other Asia-Pacific | 218,817 | 114,974 | 23,898 | ||||||||
| Total Asia-Pacific | 376,589 | 352,655 | 166,357 | ||||||||
| Europe, Middle East and Africa | 83,950 | 28,314 | 24,691 | ||||||||
| $ | 617,789 | $ | 457,769 | $ | 260,451 | ||||||
Our revenues by geography do not necessarily correlate to end handset demand by region. For example, if we sell a power amplifier module to a customer in South Korea, we record the sale within the South Korea account although that customer, in turn, may integrate that module into a product sold to a service provider (its customer) in Africa, China, Europe, the Middle East, the Americas or within South Korea.
| September 30, | ||||||||
|---|---|---|---|---|---|---|---|---|
| 2003 | 2002 | |||||||
| United States | $ | 101,871 | $ | 109,975 | ||||
| Mexico | 21,223 | 30,427 | ||||||
| Other | 4,671 | 3,371 | ||||||
| $ | 127,765 | $ | 143,773 | |||||
12
| • | rapid time-to-market and product ramp, | ||
| • | timely new product innovation, | ||
| • | product quality, reliability and performance, | ||
| • | product price, | ||
| • | features available in products, | ||
| • | compliance with industry standards, | ||
| • | strategic relationships with customers, and | ||
| • | access to and protection of intellectual property. |
| • | long presence in key markets, | ||
| • | name recognition, | ||
| • | high levels of customer satisfaction, | ||
| • | ownership or control of key technology or intellectual property, and | ||
| • | strong financial, sales and marketing, manufacturing, distribution, technical or other resources. |
13
14
| • | the lack of ensured wafer supply, potential wafer shortages and higher wafer prices, | ||
| • | limited control over delivery schedules, manufacturing yields, production costs and quality assurance, and | ||
| • | the inaccessibility of, or delays in obtaining access to, key process technologies. |
15
| • | the ability to anticipate customer and market requirements and changes in technology and industry standards, | ||
| • | the ability to obtain capacity sufficient to meet customer demand, | ||
| • | the ability to define new products that meet customer and market requirements, | ||
| • | the ability to complete development of new products and bring products to market on a timely basis, | ||
| • | the ability to differentiate our products from offerings of our competitors, | ||
| • | overall market acceptance of our products, and | ||
| • | the ability to obtain adequate intellectual property protection for our new products. |
16
| • | rapid technological developments and product evolution, | ||
| • | rapid changes in customer requirements, | ||
| • | frequent new product introductions and enhancements, | ||
| • | demand for higher levels of integration, decreased size and decreased power consumption, | ||
| • | short product life cycles with declining prices over the life cycle of the product, and | ||
| • | evolving industry standards. |
17
18
| • | limiting our ability to obtain additional financing, | ||
| • | requiring the dedication of a substantial portion of any cash flow from operations to service our indebtedness, thereby reducing the amount of cash flow available for other purposes, including capital expenditures, | ||
| • | limiting our flexibility in planning for, or reacting to, changes in our business and the industry in which we compete, and | ||
| • | placing us at a possible competitive disadvantage to less leveraged competitors and competitors that have better access to capital resources. |
19
| • | currency exchange rate fluctuations, | ||
| • | local economic and political conditions, including social, economic and political instability, | ||
| • | disruptions of capital and trading markets, | ||
| • | inability to collect accounts receivable, | ||
| • | restrictive governmental actions (such as restrictions on transfer of funds and trade protection measures, including export duties, quotas, customs duties, import or export controls and tariffs), | ||
| • | changes in legal or regulatory requirements, | ||
| • | natural disasters, acts of terrorism, widespread illness and war, | ||
| • | limitations on the repatriation of funds, | ||
| • | difficulty in obtaining distribution and support, | ||
| • | cultural differences in the conduct of business, | ||
| • | the laws and policies of the United States and other countries affecting trade, foreign investment and loans, and import or export licensing requirements, | ||
| • | tax laws, | ||
| • | the possibility of being exposed to legal proceedings in a foreign jurisdiction, and | ||
| • | limitations on our ability under local laws to protect or enforce our intellectual property rights in a particular foreign jurisdiction. |
20
| • | changes in end-user demand for the products (principally digital cellular handsets) manufactured and sold by our customers, | ||
| • | the effects of competitive pricing pressures, including decreases in average selling prices of our products, | ||
| • | production capacity levels and fluctuations in manufacturing yields, | ||
| • | availability and cost of products from our suppliers, | ||
| • | the gain or loss of significant customers, | ||
| • | our ability to develop, introduce and market new products and technologies on a timely basis, | ||
| • | new product and technology introductions by competitors, | ||
| • | changes in the mix of products produced and sold, | ||
| • | market acceptance of our products and our customers, and | ||
| • | intellectual property disputes. |
21
| • | pay substantial damages, | ||
| • | cease the manufacture, import, use, sale or offer for sale of infringing products or processes, | ||
| • | discontinue the use of infringing technology, | ||
| • | expend significant resources to develop non-infringing technology, and | ||
| • | license technology from the third party claiming infringement, which license may not be available on commercially reasonable terms. |
22
| • | the steps we take to prevent misappropriation, infringement, dilution or other violation of our intellectual property or the intellectual property of our customers, suppliers or other third parties will be successful, | ||
| • | any existing or future patents, copyrights, trademarks, trade secrets or other intellectual property rights or ours will not be challenged, invalidated or circumvented, or | ||
| • | any of the measures described above would provide meaningful protection. |
23
| • | large one-time write-offs, | ||
| • | the incurrence of substantial debt and assumption of unknown liabilities, | ||
| • | the potential loss of key employees from the acquired company, | ||
| • | amortization expenses related to intangible assets, and | ||
| • | the diversion of management’s attention from other business concerns. |
| • | the division of our Board of Directors into three classes to be elected on a staggered basis, one class each year, | ||
| • | the ability of our Board of Directors to issue shares of preferred stock in one or more series without further authorization of stockholders, | ||
| • | a prohibition on stockholder action by written consent, | ||
| • | elimination of the right of stockholders to call a special meeting of stockholders, | ||
| • | a requirement that stockholders provide advance notice of any stockholder nominations of directors or any proposal of new business to be considered at any meeting of stockholders, | ||
| • | a requirement that the affirmative vote of at least 66 2/3 percent of our shares be obtained to amend or repeal any provision of our by-laws or the provision of our certificate of incorporation relating to amendments to our by-laws, | ||
| • | a requirement that the affirmative vote of at least 80% of our shares be obtained to amend or repeal the provisions of our certificate of incorporation relating to the election and removal of directors, the classified board or the right to act by written consent, | ||
| • | a requirement that the affirmative vote of at least 80% of our shares be obtained for business combinations unless approved by a majority of the members of the Board of Directors and, in the event that the other party to the business combination is the beneficial owner of 5% or more of our shares, a majority of the members of Board of Directors in office prior to the time such other party became the beneficial owner of 5% or more of our shares, | ||
| • | a fair price provision, and |
24
| • | our performance and prospects, | ||
| • | the performance and prospects of our major customers, | ||
| • | the depth and liquidity of the market for our common stock, | ||
| • | investor perception of us and the industry in which we operate, | ||
| • | changes in earnings estimates or buy/sell recommendations by analysts, |
25
| • | general financial and other market conditions, and | ||
| • | domestic and international economic conditions. |
ITEM 2. PROPERTIESPROPERTIES.
We own and lease manufacturing facilities and other real estate properties in the United States and a number of foreign countries. For information regarding property, plant and equipment by geographic region for each of the last two fiscal years, see Note 16 of Item 8 of this Annual Report on Form 10-K. We own and lease approximately 900,000760,000 square feet and 100,00062,000 square feet, respectively, of office and manufacturing space. In addition, we lease approximately 430,000397,000 square feet of sales office and design center space with approximately 22% of this space located in foreign countries. We are headquartered in Woburn, Massachusetts and have executive offices in Irvine, California. The following table sets forth our principal facilities measuring 50,000 square feet or more:Location
Owned/Leased
Primary Function
Woburn, Massachusetts Owned Corporate headquarters and manufacturing Irvine, California Leased Office space and design center Newbury Park, California Owned Manufacturing and office space Newbury Park, California Leased Design center Adamstown, Maryland Owned Manufacturing and office space Newbury Park, CaliforniaLeasedDesign centerAdamstown, MarylandOwnedManufacturing and office spaceMexicali, Mexico Owned Assembly and test facility Haverhill, MassachusettsOwnedVacant - building and land held for sale
Due to the exit of our baseband product area on September 29, 2006, we will be vacating a portion of the office and design center space in Irvine, California in fiscal year 2007 and certain of our sales office and design center space at foreign locations.We believe our properties have been well maintained, are in sound operating condition and contain all the equipment and facilities necessary to operate at present levels.Certain of our facilities, including our California and Mexico facilities, are located near major earthquake fault lines. We maintain no earthquake insurance with respect to these facilities.
ITEM 3. LEGAL PROCEEDINGSPROCEEDINGS.
From time to time various lawsuits, claims and proceedings have been, and may in the future be, instituted or asserted against Skyworks, including those pertaining to patent infringement, intellectual property, environmental, product liability, safety and health, employment and contractual matters. In addition, in connection with the Merger, Skyworks has assumed responsibility for all then current and future litigation (including environmental and intellectual property proceedings) against Conexant or its subsidiaries in respect of the operations of Conexant’s wireless business. The outcome of litigation cannot be26
PROPERTIES.
| Location | Owned/Leased | Primary Function | ||||||||
| Woburn, Massachusetts | Owned | Corporate headquarters and manufacturing | ||||||||
| Irvine, California | Leased | Office space and design center | ||||||||
| Newbury Park, California | Owned | Manufacturing and office space | ||||||||
| Newbury Park, California | Leased | Design center | ||||||||
| Adamstown, Maryland | Owned | Manufacturing and office space | ||||||||
| Mexicali, Mexico | Owned | Assembly and test facility | ||||||||
PROCEEDINGS.
26
Additionally, the semiconductor industry is characterized by vigorous protection and pursuit of intellectual property rights. From time to time, third parties have asserted and may in the future assert patent, copyright, trademark and other intellectual property rights to technologies that are important to our business and have demanded and may in the future demand that we license their technology. At the present time, we are in discussions with Qualcomm Incorporated regarding claims each of us have filed and served against the other in the United States District Court for Southern District of California asserting violations of certain of our respective intellectual property rights. The purpose of these discussions is to arrive at a business resolution that avoids protracted litigation for both parties. We believe their claims are without merit and if we are not successful resolving this matter outside of litigation, we are prepared to vigorously defend against their claims and fully prosecute our claims against them.
ITEM 4. SUBMISSION OF MATTERS TO A VOTE OF SECURITY HOLDERSHOLDERS.
There were no matters submitted to a vote of security holders during the quarter ended October 3, 2003.September 29, 2006.27
HOLDERS.
AND ISSUER PURCHASES OF EQUITY SECURITIES.
| High | Low | |||||||
|---|---|---|---|---|---|---|---|---|
| Fiscal year ended October 3, 2003: | ||||||||
| First quarter | $ | 12 | .73 | $ | 4 | .00 | ||
| Second quarter | 9 | .57 | 5 | .96 | ||||
| Third quarter | 8 | .10 | 4 | .94 | ||||
| Fourth quarter | 12 | .28 | 6 | .52 | ||||
| Fiscal year ended September 27, 2002: | ||||||||
| First quarter | $ | 31 | .84 | $ | 15 | .64 | ||
| Second quarter | 24 | .24 | 14 | .05 | ||||
| Third quarter, until June 25, 2002 | 17 | .54 | 5 | .22 | ||||
| Third quarter, on and after June 26, 2002 | 6 | .00 | 4 | .71 | ||||
| Fourth quarter | 6 | .00 | 2 | .89 | ||||
33,558.
| High | Low | |||||||
Fiscal year ended September 29, 2006: | ||||||||
| First quarter | $ | 7.14 | $ | 4.64 | ||||
| Second quarter | 7.09 | 5.01 | ||||||
| Third quarter | 8.00 | 5.15 | ||||||
| Fourth quarter | 5.80 | 4.03 | ||||||
Fiscal year ended September 30, 2005: | ||||||||
| First quarter | $ | 10.91 | $ | 8.74 | ||||
| Second quarter | 8.99 | 6.07 | ||||||
| Third quarter | 7.94 | 5.07 | ||||||
| Fourth quarter | 8.38 | 6.67 | ||||||
RECENT SALES OF UNREGISTERED SECURITIES
On June 25, 2002, in connection with the Merger, the Company issued to Jazz Semiconductor, Inc. a warrant to purchase 1,017,900 shares of the Company’s common stock at a price of $24.02 per share. This warrant is exercisable in increments of 25% as of June 25, 2002, March 11, 2003, September 11, 2003 and March 11, 2004. This warrant was issued in reliance upon the exemption from registration set forth in Section 4(2) of the Securities Act of 1933 (the “Securities Act”).
On December 12, 2002, the Company issued 46,211 shares of its common stock to Skyworks Technologies, Inc (“STI”) in connection with the settlement of an outstanding complaint filed by STI alleging trademark infringement, false designation of origin, unfair competition, and false advertising by the Company. The settlement agreement entered into with STI required that the Company issue such shares to STI and that STI release of all of its pending claims against the Company, as well as arranged for mutual coexistence using the name “Skyworks.” The common stock was issued in reliance upon the exemption from registration set forth in Section 4(2) of the Securities Act. The common stock issued in this transaction has been registered for resale pursuant to an effective registration statement on Form S-3. The Company did not receive any cash proceeds from the issuance of this common stock.
On November 12, 2002, the Company sold $230 million aggregate principal amount of its 4.75 percent convertible subordinated notes due November 15, 2007 (the “Junior Notes”), in a private placement pursuant to Section 4(2) of the Securities Act, at a purchase price equal to 100 percent of the principal amount at maturity of the notes, resulting in net proceeds to the Company of approximately $222.6 million. The initial purchasers, Credit Suisse First Boston Corporation, CIBC World Markets Corp. and U.S. Bancorp Piper Jaffray Inc., purchased the Junior Notes at 97 percent of the issue price and resold them in private resale transactions to qualified institutional buyers pursuant to Rule 144A of the Exchange Act of 1934, as amended. The Junior Notes are convertible at the option of the holder at any time on or prior to maturity into shares of our common stock at a conversion price of $9.0505 per share which is equal to 110.4911 shares per $1,000 principal amount of notes, subject to adjustment. The Junior Notes are subordinated to our existing and future senior indebtedness (including the Senior Notes discussed below). We may redeem the Junior Notes at any time after November 20, 2005. The redemption price of the Junior Notes during the period between November 20, 2005 through November 14, 2006 will be $1,011.875 per $1,000 principal amount of notes to be redeemed, plus accrued and unpaid interest, if any, to the redemption date, and the redemption price of the notes beginning on November 15, 2006 and thereafter will be $1,000 per $1,000 principal amount of notes to be redeemed, plus accrued and unpaid interest, if any, to the redemption date. Holders may require the Company to repurchase the Junior Notes upon a change in control of the Company.
The net proceeds from the offering of Junior Notes were principally used to retire $105 million of a $150 million note issued to Conexant for the purchase of the Mexicali Operations and to prepay $65 million principal amount outstanding as of November 13, 2002 under a separate loan facility with Conexant, dissolving the loan facility. In connection with the prepayment of $105 million of the $150 million note relating to the purchase of the Mexicali Operations, the remaining $45 million principal balance on this note was exchanged, in a private placement to Conexant pursuant to Section 3(a)(9) of the Securities Act, for an equal principal amount of new 15 percent Interim Convertible Notes due June 30, 2005 (the “Interim Notes”) with a maturity date of June 30, 2005. In addition to the retirement of $170 million in principal amount of indebtedness owing to Conexant, we also retained approximately $53 million of net proceeds of the private placement to support our working capital needs.
On November 25, 2002, the Company issued $45 million aggregate principal amount of 15 percent Convertible Senior Subordinated Notes due June 30, 2005 (the “Senior Notes”) to Conexant, in a private placement pursuant to Section 3(a)(9) of the Securities Act, in exchange for an equal principal amount of Interim Notes which were issued to Conexant in November 2002. The Senior Notes mature on June 30, 2005, unless earlier converted or redeemed. At maturity (including upon certain acceleration events), we will pay the principal amount of the Senior Notes by issuing a number of sharesfollowing table provides information regarding repurchases of common stock equal tomade by us during the principal amount of the Senior Notes then due and payable divided by the applicable conversion price in effect on such date, together with cash in lieu of any fractional shares. The Senior Notes are convertible at the option of the holder into shares of our common stock, at the applicable conversion price as of the related conversion date, at any time prior to maturity at an initial conversion price of $7.87 per share, subject to adjustment for certain anti-dilution events and as follows: in the event that the market price of our common stock is below the conversion price for a specified period, the Senior Notes are convertible into that number of shares of our common stock that is equal to the principal amount of the Senior Notes being converted divided by the market price of our common stock, provided that in no event will the number of shares issued exceed 125 percent of the number of shares that the holders would have received at the initial conversion price. We may redeem the Senior Notes at any time after May 12, 2004 at $1,030 per $1,000 principal amount of Senior Notes to be redeemed, plus accrued and unpaid interest. Holders of the Senior Notes may require us to repurchase the Senior Notes upon a change in control. The Company did not receive any separate cash proceeds from the issuance of the Senior Notes.fiscal quarter ended September 29, 2006:
| Maximum Number | ||||||||||||
| (or Approximately | ||||||||||||
| Total Number of | Dollar Value) of | |||||||||||
| Shares Purchased | Shares that May | |||||||||||
| as Part of Publicly | Yet Be Purchased | |||||||||||
| Total Number of | Averaged Price | Announced Plans or | Under the Plans or | |||||||||
| Period | Shares Purchased | Paid per Share | Programs | Programs | ||||||||
| August 14, 2006 | 10,649 | (1) | $ | 4.36 | N/A(2) | N/A(2) | ||||||
| September 5, 2006 | 7,600 | (1) | $ | 5.10 | N/A(2) | N/A(2) | ||||||
| (1) | All shares of common stock reported in the table above were purchased by us, at the fair market value of the common stock on August 14, 2006 and September 5, 2006, respectively, in connection with the satisfaction of tax withholding obligations under restricted stock agreements between us and certain of our key employees. | |
| (2) | We have no publicly announced plans or programs. |
28
For information regarding securities authorized for issuance under equity compensation plans, seeItem 12 of this Annual Report on Form 10-K.
ITEM 6. SELECTED FINANCIAL DATADATA.
You should read the data set forth below in conjunction withItem 7, “Management’s Discussion and Analysis of Financial Condition and Results of Operations”Operation,” and ourconsolidated financial statements and related notes appearing elsewhere in this Annual Report on Form 10-K. The Company’s fiscal year ends on the Friday closest to September 30. Fiscal 20032006 consisted of 5352 weeks and ended on October 3, 2003September 29, 2006, and fiscal years 20022005 and 20012004 each consisted of 52 weeks and ended on September 27, 200230, 2005 and September 28, 2001,October 1, 2004, respectively. For convenience, the consolidated financial statements have been shown as ending on the last day of the calendar month. The following balance sheet data and statements of operations data for the five years ended September 30, 200329, 2006, were derived from our audited consolidated financial statements. Consolidated balance sheets at September 29, 2006 and September 30, 2003 and 20022005, and the related consolidated statements of operations and of cash flows for each of the three years in the period ended September 30, 200329, 2006, and notes thereto appear elsewhere in this Annual Report on Form 10-K.Because the Merger was accounted for as a reverse acquisition, a purchase of Alpha by Washington/Mexicali, the historical financial statements of Washington/Mexicali became the historical financial statements of Skyworks after the Merger. The historical information provided below does not include the historical financial results of Alpha for periods prior to June 25,26, 2002, the date the Merger was consummated. The historical financial information may not be indicative of the Company’sour future performance and does not reflect what the results of operations and financial position prior to the Merger would have been had Washington/Mexicali operated independently of Conexant during the periods presented prior to the Merger or had the results of Alpha been combined with those of Washington/Mexicali during the periods presented prior to the Merger.29
Fiscal Year 2003
2002 (1)
2001 (1)
2000 (1)
1999 (1)
(In thousands) Statement of Operations Data: Net revenues $ 617,789 $ 457,769 $ 260,451 $ 378,416 $ 216,415 Cost of goods sold (2) 380,465 331,608 311,503 270,170 134,539
Gross profit (loss) 237,324 126,161 (51,052 ) 108,246 81,876 Operating expenses: Research and development 151,762 132,603 111,053 91,616 66,457 Selling, general and administrative 80,222 50,178 51,267 52,422 27,202 Amortization of intangible assets (3) 4,386 12,929 15,267 5,327 -- Purchased in-process research and development (4) -- 65,500 -- 24,362 -- Special charges (5) 34,493 116,321 88,876 -- 1,432
Total operating expenses 270,863 377,531 266,463 173,727 95,091
Operating loss (33,539 ) (251,370 ) (317,515 ) (65,481 ) (13,215 ) Interest expense (21,403 ) (4,227 ) -- -- -- Other income (expense), net 1,317 (56 ) 210 142 (54 )
Loss before income taxes and cumulative effect of change in accounting principle (53,625 ) (255,653 ) (317,305 ) (65,339 ) (13,269 ) Provision (benefit) for income taxes 652 (19,589 ) 1,619 1,140 1,646
Loss before cumulative effect of change in accounting principle (54,277 ) (236,064 ) (318,924 ) (66,479 ) (14,915 )
Cumulative effect of change in accounting principle, net of tax (6) (397,139 ) -- -- -- --
Net loss $ (451,416 ) $ (236,064 ) $ (318,924 ) $ (66,479 ) $ (14,915 )
Per share information (7): Loss before income taxes and cumulative effect of change in accounting principle $ (0.39 ) $ (1.72 ) Cumulative effect of change in accounting principle, net of tax (6) (2.85 ) --
Net loss $ (3.24 ) $ (1.72 )
Balance Sheet Data: Working capital $ 249,279 $ 79,769 $ 60,540 $ 135,649 $ 55,374 Total assets 1,090,668 1,346,912 314,287 501,553 291,909 Long-term liabilities 280,677 184,309 3,806 3,767 3,335 Stockholders' equity 673,175 1,014,976 287,661 466,416 275,568
DATA.
| Fiscal Year | |||||||||||||||||
|---|---|---|---|---|---|---|---|---|---|---|---|---|---|---|---|---|---|
| 2003 | 2002 (1) | 2001 (1) | 2000 (1) | 1999 (1) | |||||||||||||
| (In thousands) | |||||||||||||||||
| Statement of Operations Data: | |||||||||||||||||
| Net revenues | $ | 617,789 | $ | 457,769 | $ | 260,451 | $ | 378,416 | $ | 216,415 | |||||||
| Cost of goods sold (2) | 380,465 | 331,608 | 311,503 | 270,170 | 134,539 | ||||||||||||
| Gross profit (loss) | 237,324 | 126,161 | (51,052 | ) | 108,246 | 81,876 | |||||||||||
| Operating expenses: | |||||||||||||||||
| Research and development | 151,762 | 132,603 | 111,053 | 91,616 | 66,457 | ||||||||||||
| Selling, general and administrative | 80,222 | 50,178 | 51,267 | 52,422 | 27,202 | ||||||||||||
| Amortization of intangible assets (3) | 4,386 | 12,929 | 15,267 | 5,327 | -- | ||||||||||||
| Purchased in-process research and development (4) | -- | 65,500 | -- | 24,362 | -- | ||||||||||||
| Special charges (5) | 34,493 | 116,321 | 88,876 | -- | 1,432 | ||||||||||||
| Total operating expenses | 270,863 | 377,531 | 266,463 | 173,727 | 95,091 | ||||||||||||
| Operating loss | (33,539 | ) | (251,370 | ) | (317,515 | ) | (65,481 | ) | (13,215 | ) | |||||||
| Interest expense | (21,403 | ) | (4,227 | ) | -- | -- | -- | ||||||||||
| Other income (expense), net | 1,317 | (56 | ) | 210 | 142 | (54 | ) | ||||||||||
| Loss before income taxes and cumulative effect of change in accounting principle | (53,625 | ) | (255,653 | ) | (317,305 | ) | (65,339 | ) | (13,269 | ) | |||||||
| Provision (benefit) for income taxes | 652 | (19,589 | ) | 1,619 | 1,140 | 1,646 | |||||||||||
| Loss before cumulative effect of change in accounting principle | (54,277 | ) | (236,064 | ) | (318,924 | ) | (66,479 | ) | (14,915 | ) | |||||||
| Cumulative effect of change in accounting principle, net of tax (6) | (397,139 | ) | -- | -- | -- | -- | |||||||||||
| Net loss | $ | (451,416 | ) | $ | (236,064 | ) | $ | (318,924 | ) | $ | (66,479 | ) | $ | (14,915 | ) | ||
| Per share information (7): | |||||||||||||||||
| Loss before income taxes and cumulative effect of change in accounting principle | $ | (0.39 | ) | $ | (1.72 | ) | |||||||||||
| Cumulative effect of change in accounting principle, net of tax (6) | (2.85 | ) | -- | ||||||||||||||
| Net loss | $ | (3.24 | ) | $ | (1.72 | ) | |||||||||||
| Balance Sheet Data: | |||||||||||||||||
| Working capital | $ | 249,279 | $ | 79,769 | $ | 60,540 | $ | 135,649 | $ | 55,374 | |||||||
| Total assets | 1,090,668 | 1,346,912 | 314,287 | 501,553 | 291,909 | ||||||||||||
| Long-term liabilities | 280,677 | 184,309 | 3,806 | 3,767 | 3,335 | ||||||||||||
| Stockholders' equity | 673,175 | 1,014,976 | 287,661 | 466,416 | 275,568 | ||||||||||||
| Fiscal Year | ||||||||||||||||||||
| (In thousands) | 2006 (8) | 2005 | 2004 | 2003 | 2002 (1) | |||||||||||||||
Statement of Operations Data: | ||||||||||||||||||||
| Net revenues | $ | 773,750 | $ | 792,371 | $ | 784,023 | $ | 617,789 | $ | 457,769 | ||||||||||
| Cost of goods sold (7) | 511,071 | 484,599 | 470,807 | 370,940 | 329,701 | |||||||||||||||
| Gross profit | 262,679 | 307,772 | 313,216 | 246,849 | 128,068 | |||||||||||||||
| Operating expenses: | ||||||||||||||||||||
| Research and development | 164,106 | 152,215 | 152,633 | 156,077 | 133,614 | |||||||||||||||
| Selling, general and administrative (6) | 135,801 | 103,070 | 97,522 | 85,432 | 51,074 | |||||||||||||||
| Amortization of intangible assets (2) | 2,144 | 2,354 | 3,043 | 4,386 | 12,929 | |||||||||||||||
| Purchased in-process research and development (3) | — | — | — | — | 65,500 | |||||||||||||||
| Restructuring and special charges (4) | 26,955 | — | 17,366 | 34,493 | 116,321 | |||||||||||||||
| Total operating expenses | 329,006 | 257,639 | 270,564 | 280,388 | 379,438 | |||||||||||||||
| Operating income (loss) | (66,327 | ) | 50,133 | 42,652 | (33,539 | ) | (251,370 | ) | ||||||||||||
| Interest expense | (14,797 | ) | (14,597 | ) | (17,947 | ) | (21,403 | ) | (4,227 | ) | ||||||||||
| Other income (expense), net | 8,350 | 5,453 | 1,691 | 1,317 | (56 | ) | ||||||||||||||
| Income (loss) before income taxes and cumulative effect of change in accounting principle | (72,774 | ) | 40,989 | 26,396 | (53,625 | ) | (255,653 | ) | ||||||||||||
| Provision (benefit) for income taxes | 15,378 | 15,378 | 3,984 | 652 | (19,589 | ) | ||||||||||||||
| Income (loss) before cumulative effect of change in accounting principle | (88,152 | ) | 25,611 | 22,412 | (54,277 | ) | (236,064 | ) | ||||||||||||
| Cumulative effect of change in accounting principle, net of tax (5) | — | — | — | (397,139 | ) | — | ||||||||||||||
| Net income (loss) | $ | (88,152 | ) | $ | 25,611 | $ | 22,412 | $ | (451,416 | ) | $ | (236,064 | ) | |||||||
| Per share information: | ||||||||||||||||||||
| Income (loss) before cumulative effect of change in accounting principle, basic and diluted | $ | (0.55 | ) | $ | 0.16 | $ | 0.15 | $ | (0.39 | ) | $ | (1.72 | ) | |||||||
| Cumulative effect of change in accounting principle, net of tax, basic and diluted (5) | — | — | — | (2.85 | ) | — | ||||||||||||||
| Net income (loss), basic and diluted | $ | (0.55 | ) | $ | 0.16 | $ | 0.15 | $ | (3.24 | ) | $ | (1.72 | ) | |||||||
Balance Sheet Data: | ||||||||||||||||||||
| Working capital | $ | 245,223 | $ | 337,747 | $ | 282,613 | $ | 249,279 | $ | 79,769 | ||||||||||
| Total assets | 1,090,496 | 1,187,843 | 1,168,806 | 1,090,668 | 1,346,912 | |||||||||||||||
| Long-term liabilities | 185,783 | 237,044 | 235,932 | 280,677 | 184,309 | |||||||||||||||
| Stockholders’ equity | 729,093 | 792,564 | 751,623 | 673,175 | 1,014,976 | |||||||||||||||
| (1) | The Merger was completed on June 25, 2002. Financial statements for periods prior to June 26, 2002, represent Washington/Mexicali’s combined results and financial condition. Financial statements for periods after June |
30
| (2) |
|
Amounts in fiscal 2003 through 2006 primarily reflect amortization of current technology and customer relationships acquired in the Merger. Amounts in fiscal 2002 |
| (3) | In fiscal 2002, |
| (4) | In fiscal 2006, we recorded restructuring and other special charges of $27.0 million related to the exit of our baseband product area. Of the $27.0 million, $13.1 million related to severance and benefits, $7.4 million related to the write-down of technology licenses and design software associated with the baseband product area, $4.2 million related to the impairment of baseband related long-lived assets and $2.3 million related to other charges. In fiscal 2004, we recorded restructuring and special charges of $17.4 million, principally related to the impairment of legacy technology licenses related to our baseband product area. In fiscal 2003, |
| (5) |
|
| (6) | In the fourth quarter of fiscal 2006, we recorded bad debt expense of $35.1 million. Specifically, we recorded charges related to two customers: Vitelcom Mobile and an Asian component distributor. | |
| (7) |
| |
| (8) | We recorded $14.2 million in share-based compensation expense upon the adoption of Statement of Financial Accounting Standards No. 123 (revised 2004), |
ITEM 7. MANAGEMENT’S DISCUSSION AND ANALYSIS OF FINANCIAL CONDITION AND RESULTS OF OPERATIONSOPERATION.
The following discussion and analysis of our financial condition and results of operations should be read in conjunction with our consolidated financial statements and related notes that appear elsewhere in this Annual Report onForm 10-K. In addition to historical information, the following discussion contains forward-looking statements that are subject to risks and uncertainties. Actual results may differ substantially and adversely from those referred to herein due to a number of factors, including but not limited to risk factors, risksthose described below and cautionary statements described elsewhere in this Annual Report on Form 10-K.OVERVIEWSkyworks Solutions, Inc. (“Skyworks” or the “Company”) is a leading wireless semiconductor company focused exclusively on radio frequency (“RF”)an innovator of high performance analog and complete cellular system solutions formixed signal semiconductors enabling mobile communications applications. We offerconnectivity. The Company’s power amplifiers, front-end modules RF subsystems and cellular systems to leading wireless handset and infrastructure customers.On June 25, 2002, pursuant to an Agreement and Plan of Reorganization, dated as of December 16, 2001, as amended as of April 12, 2002, by and among Alpha Industries, Inc. (“Alpha”), Conexant Systems, Inc. (“Conexant”) and Washington Sub, Inc. (“Washington”), a wholly owned subsidiary of Conexant to which Conexant spun off its wireless communications business, including its gallium arsenide wafer fabrication facility located in Newbury Park, California, but excluding certain assets and liabilities, Washington merged with and into Alpha with Alpha as the surviving entity (the “Merger”). Following the Merger, Alpha changed its corporate name to Skyworks Solutions, Inc.
Immediately following completion of the Merger, the Company purchased Conexant’s semiconductor assembly, module manufacturing and test facility located in Mexicali, Mexico, and certain related operations (“Mexicali Operations”) for $150 million. For financial accounting purposes, the sale of the Mexicali Operations by Conexant to Skyworks Solutions was treated as if Conexant had contributed the Mexicali Operations to Washington as part of the spin-off, and the $150 million purchase price was treated as a return of capital to Conexant. For purposes of these financial statements, the Washington business and the Mexicali Operationsdirect conversion radios are collectively referred to as Washington/Mexicali. References to the “Company” refer to Washington/Mexicali for all periods prior to June 26, 2002, and to the combined company following the Merger.
The Merger was accounted for as a reverse acquisition whereby Washington was treated as the acquirer and Alpha as the acquiree, primarily because Conexant shareholders owned a majority, approximately 67 percent, of the Company upon completion of the Merger. Under a reverse acquisition, the purchase price of Alpha was based upon the fair market value of Alpha common stock for a reasonable period of time before and after the announcement date of the Merger and the fair value of Alpha stock options. The purchase price of Alpha was allocated to the assets acquired and liabilities assumed by Washington, as the acquiring company for accounting purposes, based upon their estimated fair market value at the acquisition date. Because the historical financial statementsheart of the Company after the Merger do not include the historical financial resultsmany of Alpha for periods prior to June 25, 2002, the financial statements may not be indicativetoday’s leading-edge multimedia handsets. Leveraging core technologies, Skyworks also offers a diverse portfolio of future results of operationslinear products that support automotive, broadband, cellular infrastructure, industrial and are not indicative of the historical results that would have resulted if the Merger had occurred at the beginning of a historical financial period.medical applications.
31
OPERATION.
On June 25, 2002, pursuant to an Agreement and Plan of Reorganization, dated as of December 16, 2001, as amended as of April 12, 2002, by and among Alpha Industries, Inc. (“Alpha”), Conexant Systems, Inc. (“Conexant”) and Washington Sub, Inc. (“Washington”), a wholly owned subsidiary of Conexant to which Conexant spun off its wireless communications business, including its gallium arsenide wafer fabrication facility located in Newbury Park, California, but excluding certain assets and liabilities, Washington merged with and into Alpha with Alpha as the surviving entity (the “Merger”). Following the Merger, Alpha changed its corporate name to Skyworks Solutions, Inc.
Immediately following completion of the Merger, the Company purchased Conexant’s semiconductor assembly, module manufacturing and test facility located in Mexicali, Mexico, and certain related operations (“Mexicali Operations”) for $150 million. For financial accounting purposes, the sale of the Mexicali Operations by Conexant to Skyworks Solutions was treated as if Conexant had contributed the Mexicali Operations to Washington as part of the spin-off, and the $150 million purchase price was treated as a return of capital to Conexant. For purposes of these financial statements, the Washington business and the Mexicali Operationsdirect conversion radios are collectively referred to as Washington/Mexicali. References to the “Company” refer to Washington/Mexicali for all periods prior to June 26, 2002, and to the combined company following the Merger.
The Merger was accounted for as a reverse acquisition whereby Washington was treated as the acquirer and Alpha as the acquiree, primarily because Conexant shareholders owned a majority, approximately 67 percent, of the Company upon completion of the Merger. Under a reverse acquisition, the purchase price of Alpha was based upon the fair market value of Alpha common stock for a reasonable period of time before and after the announcement date of the Merger and the fair value of Alpha stock options. The purchase price of Alpha was allocated to the assets acquired and liabilities assumed by Washington, as the acquiring company for accounting purposes, based upon their estimated fair market value at the acquisition date. Because the historical financial statementsheart of the Company after the Merger do not include the historical financial resultsmany of Alpha for periods prior to June 25, 2002, the financial statements may not be indicativetoday’s leading-edge multimedia handsets. Leveraging core technologies, Skyworks also offers a diverse portfolio of future results of operationslinear products that support automotive, broadband, cellular infrastructure, industrial and are not indicative of the historical results that would have resulted if the Merger had occurred at the beginning of a historical financial period.medical applications.
We entered into agreements with Conexant providing for the supply to us of transition services by Conexant and for the supply of gallium arsenide wafer fabrication and assembly and test services to Conexant, initially at substantially the same volumes as historically obtained by Conexant from Washington/Mexicali. We also entered into agreements with Conexant and Jazz Semiconductor, Inc., a Newport Beach, California foundry joint venture between Conexant and the Carlyle Group (“Jazz Semiconductor”), providing for the supply to us of silicon-based wafer fabrication, wafer probe and certain other services by Jazz Semiconductor. Historically, Washington/Mexicali obtained a portion of its silicon-based semiconductors from the Newport Beach wafer fabrication facility that is now Jazz Semiconductor. We also provide semiconductor assembly and test services to Conexant at our Mexicali facility.
meet industry needs. Below are just a few examples from each of our product portfolios.
The financial statements prior
Our1962, changed its corporate name to Skyworks Solutions, Inc.
| 2006 | 2005 | 2004 | ||||||||||
| Net revenues | 100.0 | % | 100.0 | % | 100.0 | % | ||||||
| Cost of goods sold | 66.1 | 61.2 | 60.1 | |||||||||
| Gross margin | 33.9 | 38.8 | 39.9 | |||||||||
32
| 2006 | 2005 | 2004 | ||||||||||
| Operating expenses: | ||||||||||||
| Research and development | 21.2 | 19.2 | 19.5 | |||||||||
| Selling, general and administrative | 17.6 | 13.0 | 12.4 | |||||||||
| Amortization of intangible assets | 0.3 | 0.3 | 0.4 | |||||||||
| Restructuring and special charges | 3.5 | — | 2.2 | |||||||||
| Total operating expenses | 42.6 | 32.5 | 34.5 | |||||||||
| Operating income (loss) | (8.7 | ) | 6.3 | 5.4 | ||||||||
| Interest expense | (1.9 | ) | (1.8 | ) | (2.3 | ) | ||||||
| Other income, net | 1.1 | 0.7 | 0.2 | |||||||||
| Income (loss) before income taxes | (9.5 | ) | 5.2 | 3.3 | ||||||||
| Provision for income taxes | 2.0 | 2.0 | 0.5 | |||||||||
| Net income (loss) | (11.5 | )% | 3.2 | % | 2.8 | % | ||||||
| § | We exited our baseband product area in order to focus on our higher growth power amplifier, front-end modules, radio solution and linear product areas. We recorded charges of $90.4 million which included $35.1 million in bad debt expense (selling, general and administrative expense), $23.3 million of inventory charges and reserves (cost of goods sold), $13.1 million related to severance and benefits (restructuring and special charges), $7.4 million related to the write-down of technology licenses and design software (restructuring and special charges), $5.0 million related to revenue adjustments, $4.2 million related to the impairment of certain long-lived assets (restructuring and special charges) and $2.3 million related to other charges (restructuring and special charges); | ||
| § | Revenues in the Mobile Platform and Linear Products areas (our core business areas) increased $77.9 million to $733.3 million, an 11.9% increase, in fiscal 2006 as compared to fiscal 2005, despite an approximate 2% and 10% decline in average selling prices in the Mobile Platforms and Linear Products areas, respectively. We achieved a 26.9% increase in overall units sold in our core business areas; | ||
| § | We experienced a decrease of $77.1 million in revenues (approximately 62.7%) from our baseband product area as the market share consolidation of worldwide handset original equipment manufacturers (“OEM”) accelerated in 2006. Lower tier, smaller handset manufacturers primarily located in developing countries lost significant market share to top tier OEM’s such as Nokia Corporation, Motorola, Inc., Samsung Electronics Co., Sony Ericsson Mobile Communications AB and LG Electronics. | ||
| § | We retired $50.7 million in long-term debt and invested $49.4 million in capital equipment in fiscal 2006 thereby expanding our capacity to efficiently manage future growth in operations; | ||
| § | We recorded $14.2 million in share-based compensation expense upon the adoption of Statement of Financial Accounting Standards No. 123 (revised 2004), “Share-Based Payment,” (“SFAS 123(R)”) during the fiscal year ended September 29, 2006. Approximately $2.2 million, $6.3 million and $5.7 million were included in cost of goods sold, research and development expense and selling, general and administrative expense, respectively. | ||
| § | Cash provided by operations was $27.2 million for fiscal 2006 as compared to $54.2 million in fiscal 2005. |
33
34
| Fiscal Years Ended | ||||||||||||||||||||
| September 29, | September 30, | October 1, | ||||||||||||||||||
| (dollars in thousands) | 2006 | Change | 2005 | Change | 2004 | |||||||||||||||
| Net revenues | $ | 773,750 | (2.4 | )% | $ | 792,371 | 1.1 | % | $ | 784,023 | ||||||||||
35
| Fiscal Years Ended | ||||||||||||||||||||
| September 29, | September 30, | October 1, | ||||||||||||||||||
| (dollars in thousands) | 2006 | Change | 2005 | Change | 2004 | |||||||||||||||
| Gross profit | $ | 262,679 | (14.7 | )% | $ | 307,772 | (1.7 | )% | $ | 313,216 | ||||||||||
| % of net revenues | 33.9 | % | 38.8 | % | 39.9 | % | ||||||||||||||
36
| Fiscal Years Ended | ||||||||||||||||||||
| September 29, | September 30, | October 1, | ||||||||||||||||||
| (dollars in thousands) | 2006 | Change | 2005 | Change | 2004 | |||||||||||||||
| Research and development | $ | 164,106 | 7.8 | % | $ | 152,215 | (0.3 | )% | $ | 152,633 | ||||||||||
| % of net revenues | 21.2 | % | 19.2 | % | 19.5 | % | ||||||||||||||
| Fiscal Years Ended | ||||||||||||||||||||
| September 29, | September 30, | October 1, | ||||||||||||||||||
| (dollars in thousands) | 2006 | Change | 2005 | Change | 2004 | |||||||||||||||
| Selling, general and administrative | $ | 135,801 | 31.8 | % | $ | 103,070 | 5.7 | % | $ | 97,522 | ||||||||||
| % of net revenues | 17.6 | % | 13.0 | % | 12.4 | % | ||||||||||||||
37
| Fiscal Years Ended | ||||||||||||||||||||
| September 29, | September 30, | October 1, | ||||||||||||||||||
| (dollars in thousands) | 2006 | Change | 2005 | Change | 2004 | |||||||||||||||
| Amortization | $ | 2,144 | (8.9 | )% | $ | 2,354 | (22.6 | )% | $ | 3,043 | ||||||||||
| % of net revenues | 0.3 | % | 0.3 | % | 0.4 | % | ||||||||||||||
| Fiscal Years Ended | ||||||||||||||||||||
| September 29, | September 30, | October 1, | ||||||||||||||||||
| (dollars in thousands) | 2006 | Change | 2005 | Change | 2004 | |||||||||||||||
| Restructuring and special charges | $ | 26,955 | 100.0 | % | $ | — | (100.0 | )% | $ | 17,366 | ||||||||||
| % of net revenues | 3.5 | % | 0.0 | % | 2.2 | % | ||||||||||||||
38
| Fiscal Years Ended | ||||||||||||||||||||
| September 29, | September 30, | October 1, | ||||||||||||||||||
| (dollars in thousands) | 2006 | Change | 2005 | Change | 2004 | |||||||||||||||
| Interest expense | $ | 14,797 | 1.4 | % | $ | 14,597 | (18.7 | )% | $ | 17,947 | ||||||||||
| % of net revenues | 1.9 | % | 1.8 | % | 2.3 | % | ||||||||||||||
| Fiscal Years Ended | ||||||||||||||||||||
| September 29, | September 30, | October 1, | ||||||||||||||||||
| (dollars in thousands) | 2006 | Change | 2005 | Change | 2004 | |||||||||||||||
| Other income, net | $ | 8,350 | 53.1 | % | $ | 5,453 | 222.5 | % | $ | 1,691 | ||||||||||
| % of net revenues | 1.1 | % | 0.7 | % | 0.2 | % | ||||||||||||||
39
| Fiscal Years Ended | ||||||||||||||||||||
| September 29, | September 30, | October 1, | ||||||||||||||||||
| (dollars in thousands) | 2006 | Change | 2005 | Change | 2004 | |||||||||||||||
| Provision for income taxes | $ | 15,378 | 0.0 | % | $ | 15,378 | 286.0 | % | $ | 3,984 | ||||||||||
| % of net revenues | 2.0 | % | 2.0 | % | 0.5 | % | ||||||||||||||
40
| Fiscal Years Ended | ||||||||||||
| September 29, | September 30, | October 1, | ||||||||||
| (dollars in thousands) | 2006 | 2005 | 2004 | |||||||||
| Cash and cash equivalents at beginning of period | $116,522 | $123,505 | $161,506 | |||||||||
| Net cash provided by operating activities | 27,226 | 54,197 | 91,913 | |||||||||
| Net cash provided by (used in) investing activities | 42,383 | (66,424 | ) | (141,044 | ) | |||||||
| Net cash (used in) provided by financing activities | (49,382 | ) | 5,244 | 11,130 | ||||||||
| Cash and cash equivalents at end of period | $136,749 | $116,522 | $123,505 | |||||||||
41
42
| Payments Due By Period | ||||||||||||||||||||
| Less Than 1 | ||||||||||||||||||||
| Obligation | Total | Year | 1-3 years | 3-5 Years | Thereafter(1) | |||||||||||||||
| Long-Term Debt Obligations | $ | 179,335 | $ | — | $ | 179,335 | $ | — | $ | — | ||||||||||
| Other Commitments | 12,669 | 6,681 | 5,988 | — | — | |||||||||||||||
| Operating Lease Obligations | 28,132 | 7,600 | 12,944 | 6,924 | 664 | |||||||||||||||
| Purchase Obligations | — | — | — | — | — | |||||||||||||||
| Other Long-Term Liabilities | 6,448 | 479 | 930 | 488 | 4,551 | |||||||||||||||
| $ | 226,584 | $ | 14,760 | $ | 199,197 | $ | 7,412 | $ | 5,215 | |||||||||||
| (1) | Other Long-Term Liabilities includes $3.7 million of Executive Deferred Compensation for which there is a corresponding long term asset. |
AND ESTIMATES
43
Allowance
44
Valuation
45
Carrying values of goodwill
Indicators such as unexpected adverse business conditions, economic factors, unanticipated technological change or competitive activities, loss of key personnel, and acts by governments and courts, may signal that an asset has become impaired.
46
Revenue recognition —Revenues from product sales are recognized upon shipment and transfer
RESULTS OF OPERATIONS
GENERAL
Net revenues increased $160.0 million, or 35%, in fiscal 2003 when compared to fiscal 2002 primarily as the result of increasing demand for our wireless product portfolio and the exclusion of Alpha’s revenues for periods prior to the Merger. Since the Merger, we have also expanded our customer base and geographical market presence resulting in higher revenues in fiscal 2003. Gross margin improved in fiscal 2003 when compared to fiscal 2002 reflecting increased revenues and improved utilization of our manufacturing facilities. In fiscal 2003, we recorded special charges of $34.5 million, principally related to the impairment of assets related to our infrastructure products and certain restructuring charges.
We adopted SFAS No. 142, “Goodwill and Other Intangible Assets,” October 1, 2002 and performed a transitional impairment test for goodwill. The goodwill impairment test is a two-step process. The first step of the impairment analysis compares our fair value to our net book value. In determining fair value, SFAS No. 142 allows for the use of several valuation methodologies, although it states quoted market prices are the best evidence of fair value. As part of the first step, we determined that we have one reporting unit for purposes of performing the fair-value based test of goodwill. This reporting unit is consistent with our single operating segment, which management determined is appropriate under the provisions of SFAS No. 131, “Disclosures about Segments of an Enterprise and Related Information.” We completed step one and determined that our goodwill and unamortized intangible assets were impaired. Step two of the analysis compares the implied fair value of goodwill to its carrying amount in a manner similar to purchase price allocation. If the carrying amount of goodwill exceeds its implied fair value, an impairment loss is recognized equal to that excess. We completed step two and determined that the carrying amount of our goodwill was $397.1 million greater than its implied fair value. This transitional impairment charge was recorded as a cumulative effect of a change in accounting principle in fiscal 2003. In addition, we completed our annual goodwill impairment test for fiscal 2003 and determined that as of July 1, 2003, our goodwill was not further impaired.
YEARS ENDED SEPTEMBER 30, 2003, 2002 AND 2001
The following table sets forth the results of our operations expressed as a percentage of net revenues forIncome Taxes — Special Areas”. During the fiscal years below:
| 2003 | 2002 | 2001 | |||||||||
|---|---|---|---|---|---|---|---|---|---|---|---|
| Net revenues | 100 | .0% | 100 | .0% | 100 | .0% | |||||
| Cost of goods sold | 61 | .6 | 72 | .4 | 119 | .6 | |||||
| Gross margin | 38 | .4 | 27 | .6 | (19 | .6) | |||||
| Operating expenses: | |||||||||||
| Research and development | 24 | .6 | 29 | .0 | 42 | .6 | |||||
| Selling, general and administrative | 13 | .0 | 11 | .0 | 19 | .7 | |||||
| Amortization of intangible assets | 0 | .7 | 2 | .8 | 5 | .9 | |||||
| Purchased in-process research and development | - | - | 14 | .3 | - | - | |||||
| Special charges | 5 | .6 | 25 | .4 | 34 | .1 | |||||
| Total operating expenses | 43 | .8 | 82 | .5 | 102 | .3 | |||||
| Operating loss | (5 | .4) | (54 | .9) | (121 | .9) | |||||
| Interest expense | (3 | .5) | (0 | .9) | - | - | |||||
| Other income (expense), net | 0 | .2 | - | - | 0 | .1 | |||||
| Loss before income taxes and cumulative effect of change in accounting principle | (8 | .7) | (55 | .8) | (121 | .8) | |||||
| Provision (benefit) for income taxes before cumulative effect of | |||||||||||
| change in accounting principle | 0 | .1 | (4 | .3) | 0 | .7 | |||||
| Loss before cumulative effect of change in accounting principle | (8 | .8) | (51 | .6) | (122 | .5) | |||||
| Cumulative effect of change in accounting principle, net of tax | (64 | .3) | - | - | - | - | |||||
| Net loss | (73 | .1)% | (51 | .6)% | (122 | .5)% | |||||
NET REVENUES
| Years Ended September 30, | |||||||||||||||||
|---|---|---|---|---|---|---|---|---|---|---|---|---|---|---|---|---|---|
| 2003 | Change | 2002 | Change | 2001 | |||||||||||||
| (in thousands) | |||||||||||||||||
| Net revenues | $ | 617,789 | 35 | .0% | $ | 457,769 | 75 | .8% | $ | 260,451 | |||||||
We market and sell our semiconductor products and system solutions to leading OEMs of communication electronics products, third-party original design manufacturers (“ODMs”) and contract manufacturers and indirectly through electronic components distributors. Samsung Electronics Co. accounted for 15%, 35%, and 44% of net revenues for the fiscal years 2003, 2002 and 2001, respectively. Motorola, Inc. accounted for 11% of net revenues for the fiscal years 2003 and 2002, and represented less than 10% of net revenues for fiscal 2001. Conexant accounted for less than 10% of net revenues for the fiscal years 2003 and 2002 and represented 17% of net revenues for fiscal 2001. Nokia Corporation accounted for less than 10% of net revenues for the fiscal years 2003 and 2002 and represented 12% of net revenues for fiscal 2001.
Revenues derived from customers located in the Americas region accounted for 25%, 17% and 27% of net revenues for the fiscal years 2003, 2002 and 2001, respectively. Revenues derived from customers located in the Asia-Pacific region were 61%, 77% and 64% of net revenues for the fiscal years 2003, 2002 and 2001, respectively. Revenues derived from customers located in the Europe/Middle East/Africa region were 14%, 6% and 9% of net revenues for the fiscal years 2003, 2002 and 2001, respectively. Our revenues by geography do not necessarily correlate to end handset demand by region. For example, if we sell a power amplifier module to a customer in South Korea, we record the sale within the South Korea account although that customer, in turn, may integrate that module into a product sold to a service provider (its customer) in Africa, China, Europe, the Middle East, the Americas or within South Korea.
The foregoing percentages are based on sales representing Washington/Mexicali sales for fiscal 2001 and fiscal 2002 up to the time of the Merger, and sales of the combined company for the post-Merger period from June 26, 2002 through the end of the fiscal year and for fiscal 2003.
Net revenues increased in fiscal 2003 when compared to fiscal 2002 primarily reflecting increasing demand for our wireless product portfolio and the exclusion of Alpha’s revenues for periods prior to the Merger. More specifically, GSM direct conversion transceivers and complete cellular systems as well as CDMA RF subsystems exhibited strong year-over-year growth. Additionally, we have launched a number of more highly integrated product offerings, added to our customer base and expanded our geographical market presence.
These increases in net revenues in fiscal 2003 when compared to fiscal 2002 were tempered by a decrease in average selling prices of our front-end module products and an industry-wide component and handset inventory correction. In addition, lower CDMA handset subsidies in Korea also adversely affected net revenues in fiscal 2003 when compared to fiscal 2002. In certain global markets, wireless operators provide subsidies on handset sales to their customers, ultimately decreasing the cost of the handset to the customer.
Net revenues increased 75.8% in fiscal 2002, when compared to fiscal 2001, principally reflecting increased sales of GSM products, including power amplifier modules and complete cellular systems. We also experienced increased demand for our power amplifier modules for CDMA and TDMA applications from a number of our key customers.
GROSS MARGIN
| Years Ended September 30, | |||||||||||
|---|---|---|---|---|---|---|---|---|---|---|---|
| 2003 | 2002 | 2001 | |||||||||
| (in thousands) | |||||||||||
| Gross margin | $ | 237,324 | $ | 126,161 | (51,052 | ) | |||||
| % of net revenues | 38.4 | % | 27.6 | % | (19.6 | )% | |||||
Gross margin represents net revenues less cost of goods sold. Cost of goods sold consists primarily of purchased materials, labor and overhead (including depreciation) associated with product manufacturing, royalty and other intellectual property costs and sustaining engineering expenses pertaining to products sold. Cost of goods sold for the periods prior to the Merger also includes allocations from Conexant of manufacturing cost variances, process engineering and other manufacturing costs, which are not included in our unit costs but are expensed as incurred.
The improvement in gross margin in fiscal 2003 compared to fiscal 2002 reflects increased revenues, improved utilization of our manufacturing facilities and a decrease in depreciation expense that resulted from the write-down of our Mexicali facility assets in the third quarter of fiscal 2002. Although recent revenue growth has increased the level of utilization of our manufacturing facilities, these facilities continue to operate below optimal capacity and underutilization continues to adversely affect our unit cost of goods sold and gross margin.
Gross margin in fiscal 2003 was also favorably affected by $4.8 million when we reevaluated our obligation under a wafer fabrication supply agreement with Conexant and Jazz Semiconductor and reduced our liability and cost of sales in the first quarter of fiscal 2003. Pursuant to the terms of wafer supply agreements with Conexant and Jazz Semiconductor, we are committed to obtain certain minimum wafer volumes from Jazz Semiconductor. As of September 30, 2003, we expect to meet all of these purchase obligations. Our costs will be affected by the extent of our use of outside foundries and the pricing we are able to obtain. During periods of high industry demand for wafer fabrication capacity, we may have to pay higher prices to secure wafer fabrication capacity.
The improvement in gross margin in fiscal 2002, compared to fiscal 2001, reflects increased revenues, improved utilization of our manufacturing facilities and a decrease in depreciation expense that resulted from the write-down of the Newbury Park wafer fabrication assets in the third quarter of fiscal 2001 and the Mexicali facility assets in the third quarter of 2002. The effect of the write-down of the Newbury Park wafer fabrication assets and the Mexicali facility assets on fiscal 2002 gross margin was approximately $10.5 million and $5.5 million, respectively. Gross margin for fiscal 2002 was adversely impacted by additional warranty costs of $14.0 million. The additional warranty costs were the result of an agreement with a major customer for the reimbursement of costs the customer incurred in connection with the failure of a product when used in a certain adverse environment. Although we developed and sold the product to the customer pursuant to mutually agreed-upon specifications, the product experienced unusual failures when used in an environment in which the product had not been previously tested. The product has since been modified and no significant additional costs are expected to be incurred in connection with this issue.
In addition, we originally estimated our obligation under our wafer supply agreement with Conexant and Jazz Semiconductor, Inc. would result in excess costs of approximately $12.9 million when recorded as a liability and charged to cost of sales in the third quarter of fiscal 2002. During the fourth quarter of fiscal 2002, we reevaluated this obligation and reduced our liability and cost of sales by approximately $8.1 million in the quarter.
Gross margin for the year ended September 30, 2002 benefited2005, the Company reversed its policy of permanently reinvesting the earnings of its Mexican business. This policy reversal increased the 2005 tax provision by approximately $12.5 million as a result of$9.0 million. For the sale of inventories having a historical cost of $12.5 million that were written down to a zero cost basis during fiscal year 2001; such sales resulted from sharply increased demand beginning in the fourth quarter of fiscal 2001 thatended September 29, 2006, U.S. income tax was not anticipated at the time of the write-downs. Gross margin for fiscal 2001 was adversely affected by inventory write-downs of approximately $58.7 million, partially offset by approximately $4.5 million of subsequent sales of inventories written down to a zero cost basis. The inventories that were written down to a zero cost basis in fiscal 2001 were either sold or scrapped during fiscal 2003, 2002 and 2001. During fiscal 2003, 2002 and 2001, we sold $2.7 million, $12.5 million and $4.5 million, respectively, and scrapped $2.7 million, $1.8 million and $34.5 million, respectively. As of September 30, 2003, we no longer held inventories which were written down to a zero cost basis in fiscal 2001.
The inventory write-downs recorded in fiscal 2001 resulted from the sharply reduced end-customer demand we experienced, primarily associated with our RF components, as a result of the rapidly changing demand environment for digital cellular handsets during that period. As a result of these market conditions, we experienced a significant number of order cancellations and a decline in the volume of new orders, beginning in the fiscal 2001 first quarter and becoming more pronounced in the second quarter.
RESEARCH AND DEVELOPMENT
| Years Ended September 30, | |||||||||||||||||
|---|---|---|---|---|---|---|---|---|---|---|---|---|---|---|---|---|---|
| 2003 | Change | 2002 | Change | 2001 | |||||||||||||
| (in thousands) | |||||||||||||||||
| Research and development | $ | 151,762 | 14 | .4% | $ | 132,603 | 19 | .4% | $ | 111,053 | |||||||
| % of net revenues | 24.6% | 29.0% | 42.6% | ||||||||||||||
Research and development expenses consist principally of direct personnel costs, costs for pre-production evaluation and testing of new devices and design and test tool costs. Research and development expenses for the periods prior to the Merger also include allocated costs for shared research and development services provided by Conexant, principally in the areas of advanced semiconductor process development, design automation and advanced package development, for the benefit of several of Conexant’s businesses.
The increase in research and development expenses in fiscal 2003 compared to fiscal 2002 represents our commitment to design new products and processes and address new opportunities to meet our customers’ demands. We have expanded customer support engagements as well as development efforts targeting semiconductor solutions using the CDMA2000, GSM, General Packet Radio Services, or GPRS, and third-generation, or 3G, wireless standards in both the digital cellular handset and infrastructure markets. The increase in research and development expenses in fiscal 2003 when compared to the previous year is also relatedon current earnings attributable to our research and development expenses representing those of the combined company after the Merger whereas those expensesoperations in 2002 are representative of only Washington/Mexicali prior to June 25, 2002.
The increase in research and development expenses in fiscal 2002 compared to fiscal 2001 primarily reflects the opening of a new design center in Le Mans, France and higher headcount and personnel-related costs. Subsequent to the first quarter of fiscal 2001, we expanded customer support engagements as well as development efforts targeting semiconductor solutions using the CDMA2000, GSM, GPRS, and 3G wireless standards in both the digital cellular handset and infrastructure markets.
SELLING, GENERAL AND ADMINISTRATIVE
| Years Ended September 30, | |||||||||||||||||
|---|---|---|---|---|---|---|---|---|---|---|---|---|---|---|---|---|---|
| 2003 | Change | 2002 | Change | 2001 | |||||||||||||
| (in thousands) | |||||||||||||||||
| Selling, general and administrative | $ | 80,222 | 60 | .0% | $ | 50,178 | (2 | .1)% | $ | 51,267 | |||||||
| % of net revenues | 13.0% | 11.0% | 19.7% | ||||||||||||||
Selling, general and administrative expenses include personnel costs (legal, accounting, treasury, human resources, information systems, customer service, etc.), sales representative commissions, advertising and other marketing costs. Selling, general and administrative expenses also include allocated general and administrative expenses from Conexant for the periods prior to the Merger for a variety of these shared functions.
The increase in selling, general and administrative expenses in fiscal 2003 when compared to fiscal 2002 is primarily related to our selling, general and administrative expenses representing those of the combined company after the Merger whereas those expenses for the same period in 2002 are representative of only Washington/Mexicali prior to June 25, 2002.
The decrease in selling, general and administrative expenses in fiscal 2002 compared to fiscal 2001 primarily reflects lower headcount and personnel-related costs resulting from the expense reduction and restructuring actions initiated during fiscal 2001 and lower provisions for uncollectible accounts receivable.
AMORTIZATION OF INTANGIBLE ASSETS
| Years Ended September 30, | |||||||||||||||||
|---|---|---|---|---|---|---|---|---|---|---|---|---|---|---|---|---|---|
| 2003 | Change | 2002 | Change | 2001 | |||||||||||||
| (in thousands) | |||||||||||||||||
| Amortization of intangible assets | $ | 4,386 | (66 | .1)% | $ | 12,929 | (15 | .3)% | $ | 15,267 | |||||||
| % of net revenues | 0.7% | 2.8% | 5.9% | ||||||||||||||
In 2002, we recorded $36.4 million of intangible assets related to the Merger consisting of developed technology, customer relationships and a trademark. These assets are principally being amortized on a straight-line basis over a 10-year period. Amortization expense for fiscal 2003 primarily represents the amortization of these intangible assets. Amortization expense for fiscal 2002 and 2001 primarily represents amortization of goodwill and intangible assets acquired in connection with Washington/Mexicali’s acquisition of Philsar Semiconductor, Inc. (“Philsar”) in fiscal 2000. Philsar was a developer of RF semiconductor solutions for personal wireless connectivity, including emerging standards such as Bluetooth, and RF components for third-generation digital cellular handsets. We wrote off all goodwill and other intangible assets associated with our acquisition of the Philsar Bluetooth business in the third quarter of fiscal 2002. The lower amortization expense in fiscal 2003 when compared to fiscal 2002 and fiscal 2001, primarily resulted from the adoption of Statement of Financial Accounting Standards (“SFAS”) No. 142, “Goodwill and Other Intangible Assets,” on October 1, 2002. Had the Company ceased amortizing goodwill on October 1, 2000, amortization expense would have been $10.7 million and $13.9 million less in fiscal 2002 and fiscal 2001, respectively.
We adopted SFAS No. 142, “Goodwill and Other Intangible Assets,” on October 1, 2002 and performed a transitional impairment test for goodwill. The goodwill impairment test is a two-step process. The first step of the impairment analysis compares our fair value to our net book value. In determining fair value, SFAS No. 142 allows for the use of several valuation methodologies, although it states quoted market prices are the best evidence of fair value. As part of the first step, we determined that we have one reporting unit for purposes of performing the fair-value based test of goodwill. This reporting unit is consistent with our single operating segment, which management determined is appropriate under the provisions of SFAS No. 131, “Disclosures about Segments of an Enterprise and Related Information.” We completed step one and determined that our goodwill and unamortized intangible assets were impaired. Step two of the analysis compares the implied fair value of goodwill to its carrying amount in a manner similar to purchase price allocation. If the carrying amount of goodwill exceeds its implied fair value, an impairment loss is recognized equal to that excess. We completed step two and determined that the carrying amount of our goodwill was $397.1 million greater than its implied fair value. This transitional impairment charge was recorded as a cumulative effect of a change in accounting principle in fiscal 2003. In addition, we completed our annual goodwill impairment test for fiscal 2003 and determined that as of July 1, 2003, our goodwill was not further impaired.
PURCHASED IN-PROCESS RESEARCH AND DEVELOPMENT
| Years Ended September 30, | |||||||||||||||||
|---|---|---|---|---|---|---|---|---|---|---|---|---|---|---|---|---|---|
| 2003 | Change | 2002 | Change | 2001 | |||||||||||||
| (in thousands) | |||||||||||||||||
| Purchased in-process research and development | $ | -- | N/A | $ | 65,500 | N/A | $ | -- | |||||||||
In connection with the Merger in fiscal 2002, $65.5 million was allocated to purchased in-process research and development (“IPR&D”) and expensed immediately upon completion of the acquisition (as a charge not deductible for tax purposes) because the technological feasibility of certain products under development had not been established and no future alternative uses existed. The charges represent the estimated fair values of the portion of IPR&D projects that had been completed by Alpha at the time of the Merger.
Prior to the Merger, Alpha was in the process of developing new technologies in its semiconductor and ceramics segments. The objective of the IPR&D effort was to develop new semiconductor processes, ceramic materials and related products to satisfy customer requirements in the wireless and broadband markets.
The semiconductor segment was involved in several projects that have been aggregated into the following categories based on the respective technologies:Power Amplifier: Power amplifiers are designed and manufactured for use in different types of wireless handsets. The main performance attributes of these amplifiers are efficiency, power output, operating voltage and distortion. Current research and development is focused on expanding the offering to all types of wireless standards, improving performance by process and circuit improvements and offering a higher level of integration.Control Products: Control products consist of switches and switch filters that are used in wireless applications for signal routing. Most applications are in the handset market enabling multi-mode, multi-band handsets. Current research and development is focused on performance improvement and cost reduction by reducing chip size and increasing functionality.Broadband: The products in this grouping consist of radio frequency (RF) and millimeter wave semiconductors and components designed and manufactured specifically to address the needs of high-speed, wireline and wireless network access. Current and long-term research and development is focused on performance enhancement of speed and bandwidth as well as cost reduction and integration.Silicon Diode: These products use silicon processes to fabricate diodes for use in a variety of RF and wireless applications. Current research and development is focused on reducing the size of the device, improving performance and reducing cost.Ceramics: The ceramics segment was involved in projects that relate to the design and manufacture of ceramic-based components such as resonators and filters for the wireless infrastructure market. Current research and development is focused on performance enhancements through improved formulations and electronic designs.
The material risks associated with the successful completion of the in-process technology were associated with our ability to successfully finish the creation of viable prototypes and successful design of the chips, masks and manufacturing processes required. We expected to benefit from the in-process projects as the individual products that contained the in-process technology were put into production and sold to end-users. The release dates for each of the products within the product families were varied. The fair value of the IPR&D was determined using the income approach. Under the income approach, the fair value reflected the present value of the projected cash flows that were expected to be generated by the products incorporating the IPR&D, if successful. The projected cash flows were discounted to approximate fair value. The discount rate applicable to the cash flows of each project reflected the stage of completion and other risks inherent in each project. The weighted average discount rate used in the valuation of IPR&D was 30 percent. As of September 30, 2003, the Company had either completed or abandoned each of these projects. The completed IPR&D projects commenced generating cash flows in fiscal 2003. Due to the nature of these projects and the related technolgy, the revenue streams derived from these projects cannot be separately identified.
SPECIAL CHARGES
| Years Ended September 30, | |||||||||||||||||
|---|---|---|---|---|---|---|---|---|---|---|---|---|---|---|---|---|---|
| 2003 | Change | 2002 | Change | 2001 | |||||||||||||
| (in thousands) | |||||||||||||||||
| Special charges | $ 34,493 | (70.3)% | $ | 116,321 | (30. | 9)% | $ | 88,876 | |||||||||
ASSET IMPAIRMENTS
During the fourth quarter of fiscal 2003, we recorded a $26.0 million charge for the impairment of assets related to certain infrastructure products manufactured in our Woburn, Massachusetts and Adamstown, Maryland facilities. The Woburn facility primarily manufactures semiconductor products based on both silicon wafer technology and gallium arsenide technology. Our Adamstown, Maryland facility primarily manufactures ceramics components. We experienced a significant decline in factory utilization resulting from a downturn in the market for products manufactured at these two facilities and a decision to discontinue certain products. The impairment charge was based on a recoverability analysis prepared by management based on these factors and the related impact on our current and projected outlook. We projected lower revenues and new order volume for these products and management believed these factors indicated that the carrying value of the related assets (machinery, equipment and intangible assets) may have been impaired and that an impairment analysis should be performed. In performing the analysis for recoverability, management estimated the future cash flows expected to result from these products over a five-year period. Since the estimated undiscounted cash flows were less than the carrying value of the related assets, it was concluded that an impairment loss should be recognized. In accordance with SFAS No. 144, “Accounting for the Impairment or Disposal of Long-Lived Assets,” the impairment charge was determined by comparing the estimated fair value of the related assets to their carrying value. The fair value of the assets was determined by computing the present value of the estimated future cash flows using a discount rate of 16%, which management believed was commensurate with the underlying risks associated with the projected future cash flows. Management believes the assumptions used in the discounted cash flow model represented a reasonable estimate of the fair value of the assets. The write down established a new cost basis for the impaired assets. The anticipated pre-tax cost savings related to these impairment charges is expected to be $17.4 million over the next five years (fiscal 2004 through fiscal 2008) and $8.6 million over the subsequent fifteen years (fiscal 2009 through 2023).
In addition, during the fourth quarter of fiscal 2003 we recorded a $2.3 million charge for the impairment of our Haverhill, Massachusetts property that is currently being held for sale. In fiscal 2003, we relocated our operations from this facility to our Woburn, Massachusetts facility. We are actively marketing the property located in Haverhill, Massachusetts.
During fiscal 2002, the Company recorded a $66.0 million charge for the impairment of the assembly and test machinery and equipment and related facility in Mexicali, Mexico. The impairment charge was based on a recoverability analysis prepared by management as a result of a significant downturn in the market for test and assembly services for non-wireless products and the related impact on our current and projected outlook.
We experienced a severe decline in factory utilization at our Mexicali facility for non-wireless products and projected decreasing revenues and new order volume. Management believed these factors indicated that the carrying value of the assembly and test machinery and equipment and related facility may have been impaired and that an impairment analysis should be performed. In performing the analysis for recoverability, management estimated the future cash flows expected to result from the manufacturing activities at the Mexicali facility over a ten-year period. The estimated future cash flows were based on a gradual phase-out of services sold to Conexant and modest volume increases consistent with management’s view of the outlook for the business, partially offset by declining average selling prices. The declines in average selling prices were consistent with historical trends and management’s decision to reduce capital expenditures for future capacity expansion. Since the estimated undiscounted cash flows were less than the carrying value (approximately $100 million based on historical cost) of the related assets, it was concluded that an impairment loss should be recognized. The impairment charge was determined by comparing the estimated fair value of the related assets to their carrying value. The fair value of the assets was determined by computing the present value of the estimated future cash flows using a discount rate of 24%, which management believed was commensurate with the underlying risks associated with the projected future cash flows. Management believes the assumptions used in the discounted cash flow model represented a reasonable estimate of the fair value of the assets. The write down established a new cost basis for the impaired assets.
During fiscal 2002, we recorded a $45.8 million charge for the write-off of goodwill and other intangible assets associated with our acquisition of Philsar in fiscal 2000. Management determined that we would not support the technology associated with the Philsar Bluetooth business. Accordingly, this product line was discontinued and the employees associated with the product line were either severed or relocated to other operations. As a result of the actions taken, management determined that the remaining goodwill and other intangible assets associated with the Philsar acquisition were impaired.
During the third quarter of fiscal 2001 we recorded an $86.2 million charge for the impairment of our manufacturing facility and related wafer fabrication machinery and equipment at our Newbury Park, California facility. This impairment charge was based on a recoverability analysis prepared by management as a result of the dramatic downturn in the market for wireless communications products and the related impact on our then-current and projected business outlook. Through the third quarter of fiscal 2001, we experienced a severe decline in factory utilization at the Newbury Park wafer fabrication facility and decreasing revenues, backlog, and new order volume. Management believed these factors, together with its decision to significantly reduce future capital expenditures for advanced process technologies and capacity beyond the then-current levels, indicated that the value of the Newbury Park facility may have been impaired and that an impairment analysis should be performed. In performing the analysis for recoverability, management estimated the future cash flows expected to result from the manufacturing activities at the Newbury Park facility over a ten-year period. The estimated future cash flows were based on modest volume increases consistent with management’s view of the outlook for the industry, partially offset by declining average selling prices. The declines in average selling prices were consistent with historical trends and management’s decision to focus on existing products based on the current technology. Since the estimated undiscounted cash flows were less than the carrying value (approximately $106 million based on historical cost) of the related assets, it was concluded that an impairment loss should be recognized. The impairment charge was determined by comparing the estimated fair value of the related assets to their carrying value. The fair value of the assets was determined by computing the present value of the estimated future cash flows using a discount rate of 30%, which management believed was commensurate with the underlying risks associated with the projected cash flows. We believe the assumptions used in the discounted cash flow model represented a reasonable estimate of the fair value of the assets. The write-down established a new cost basis for the impaired assets.
RESTRUCTURING CHARGES
During the second and fourth quarters of fiscal 2003, we recorded $3.3 million and $2.9 million, respectively, in restructuring charges to provide for workforce reductions and the consolidation of facilities. The charges were based upon estimates of the cost of severance benefits for affected employees and lease cancellation, facility sales, and other costs related to the consolidation of facilities. Substantially all amounts accrued for these actions are expected to be paid within one year.
During fiscal 2002, we implemented a number of cost reduction initiatives to more closely align our cost structure with the then-current business environment. We recorded restructuring charges of approximately $3.0 million for costs related to the workforce reduction and the consolidation of certain facilities. Substantially all amounts accrued for these actions have been paid.
During fiscal 2001, Washington/Mexicali reduced its workforce by approximately 250 employees, including approximately 230 employees in manufacturing operations. Restructuring charges of $2.7 million were recorded for such actions and were based upon estimates of the cost of severance benefits for the affected employees. We have paid all amounts accrued for these actions.
Activity and liability balances related to the fiscal 2002 and fiscal 2003 restructuring actions are as follows (in thousands):
| Fiscal 2002 Workforce Reductions | Fiscal 2002 Facility Closings and Other | Fiscal 2003 Workforce Reductions | Fiscal 2003 Facility Closings and Other | Total | |||||||||||||
|---|---|---|---|---|---|---|---|---|---|---|---|---|---|---|---|---|---|
| Charged to costs and expenses | $ | 2,923 | $ | 97 | $ | -- | $ | -- | $ | 3,020 | |||||||
| Cash payments | (2,225 | ) | (13 | ) | -- | -- | (2,238 | ) | |||||||||
| Restructuring balance, September 30, 2002 | 698 | 84 | -- | -- | 782 | ||||||||||||
| Charged to costs and expenses | -- | -- | 4,819 | 1,405 | 6,224 | ||||||||||||
| Cash payments | (698 | ) | (47 | ) | (3,510 | ) | (1,236 | ) | (5,491 | ) | |||||||
| Restructuring balance, September 30, 2003 | $ | -- | $ | 37 | $ | 1,309 | $ | 169 | $ | 1,515 | |||||||
In addition, we assumed approximately $7.8 million of restructuring reserves from Alpha in connection with the Merger. During the fiscal years ended September 30, 2003 and 2002, payments related to the restructuring reserves assumed from Alpha were $4.7 million and $1.1 million, respectively. On September 30, 2003, this balance was $2.0 and primarily relates to payments on a lease that expires in 2008.
INTEREST EXPENSE
| Years Ended September 30, | |||||||||||||||||
|---|---|---|---|---|---|---|---|---|---|---|---|---|---|---|---|---|---|
| 2003 | Change | 2002 | Change | 2001 | |||||||||||||
| (in thousands) | |||||||||||||||||
| Interest expense | $ 21,403 | 406.3% | $ | 4,227 | N/A | $ | -- | ||||||||||
Our debt at September 30, 2003 consists of $230 million of convertible subordinated Junior notes, $45 million of convertible senior subordinated notes, $41.7 million of borrowings under our receivable purchase agreement and a loan that matures in December 2003.
Our long-term debt primarily consists of $230 million of convertible subordinated Junior notes at a fixed interest rate of 4.75 percent due 2007. These Junior notes can be converted into 110.4911 shares of common stock per $1,000 principal balance, which is the equivalent of a conversion price of approximately $9.05 per share. We may redeem the Junior notes at any time after November 20, 2005. The redemption price of the Junior notes during the period between November 20, 2005 through November 14, 2006 will be $1,011.875 per $1,000 principal amount of notes to be redeemed, plus accrued and unpaid interest, if any, to the redemption date, and the redemption price of the notes beginning on November 15, 2006 and thereafter will be $1,000 per $1,000 principal amount of notes to be redeemed, plus accrued and unpaid interest, if any, to the redemption date. Holders may require that we repurchase the Junior notes upon a change in control of the Company. We pay interest in cash semi-annually in arrears on May 15 and November 15 of each year.
In addition, our long-term debt includes $45 million of convertible senior subordinated notes at a fixed rate of 15 percent due June 30, 2005, which were issued as part of our debt refinancing with Conexant completed on November 13, 2002. These Senior notes can be converted into our common stock at a conversion rate based on the applicable conversion price, which is subject to adjustment based on, among other things, the market price of our common stock. Based on this adjustable conversion price, we expect that the maximum number of shares that could be issued under the Senior notes is approximately 7.1 million shares, subject to adjustment for stock splits and other similar dilutive occurrences. If the holder(s) of these Senior notes converted the notes at a price that is less than the original conversion price ($7.87) as the result of a decrease in the market price of our stock, we would be required to record a charge to interest expense in the period of conversion. At maturity (including upon certain acceleration events), we will pay the principal amount of the Senior notes by issuing a number of shares of common stock equal to the principal amount of the Senior notes then due and payable divided by the applicable conversion price in effect on such date, together with cash in lieu of any fractional shares. We may redeem the Senior notes at any time after May 12, 2004 at $1,030 per $1,000 principal amount of Senior notes to be redeemed, plus accrued and unpaid interest. The holder(s) may require that we repurchase the Senior notes upon a change in control of the Company. We pay interest in cash on the Senior notes on the last business day of each March, June, September and December of each year. Interest on the Senior notes is not deductible for tax purposes because of the conversion feature.
We entered into a receivables purchase agreement under which we have agreed to sell from time to time certain of our accounts receivable to Skyworks USA, Inc. (“Skyworks USA”), a wholly-owned, special purpose entity that is fully consolidated for accounting purposes. Concurrently, Skyworks USA entered into an agreement with Wachovia Bank, National Association providing for a $50 million credit facility (“Facility Agreement”) secured by the purchased accounts receivable. Our short-term debt consists primarily of funds borrowed under the Facility Agreement. As a part of the consolidation, any interest incurred by Skyworks USA related to monies it borrows under the Facility Agreement is recorded as interest expense in our results of operations. Interest related to the Facility Agreement is LIBOR plus 0.4% and was approximately 1.5% at September 30, 2003. We perform collections and administrative functions on behalf of Skyworks USA. As of September 30, 2003, Skyworks USA had borrowed $41.7 million under this agreement.
In addition, our short-term debt includes the remaining portion of a ten-year $960,000 loan from the State of Maryland under the Community Development Block Grant program due December 2003 at an interest rate of 5 percent.
OTHER INCOME (EXPENSE), NET
| Years Ended September 30, | |||||||||||||||||
|---|---|---|---|---|---|---|---|---|---|---|---|---|---|---|---|---|---|
| 2003 | Change | 2002 | Change | 2001 | |||||||||||||
| (in thousands) | |||||||||||||||||
| Other income (expense), net | $ 1,317 | nm | $ | (56) | (126 | .7)% | $ | 210 | |||||||||
nm = not meaningful
Other income (expense), net is comprised primarily of interest income on invested cash balances, foreign exchange gains/losses and other non-operating income and expense items.
PROVISION FOR INCOME TAXES
| Years Ended September 30, | |||||||||||||||||
|---|---|---|---|---|---|---|---|---|---|---|---|---|---|---|---|---|---|
| 2003 | Change | 2002 | Change | 2001 | |||||||||||||
| (in thousands) | |||||||||||||||||
| Provision (benefit) for income taxes | $ 652 | nm | $ | (19,589) | nm | $ | 1,619 | ||||||||||
As a result of our history of operating losses and the expectation of future operating results, we determined that it is more likely than not that historic and current year income tax benefits will not be realized except for certain future deductions associated with our foreign operations. Consequently, no United States income tax benefit has been recognized relating to the U.S. operating losses. As of September 30, 2003, we have established a valuation allowance against all of our net U.S. deferred tax assets. Deferred tax assets have been recognized for foreign operations when management believes they will be recovered during the carry forward period.
The provision (benefit) for income taxes for fiscal 2003, 2002 and 2001 consists of foreign income taxes incurred by foreign operations. We do not expect to recognize any income tax benefits relating to future operating losses generated in the United States until management determines that such benefits are more likely than not to be realized. In 2002, the provision for foreign income taxes was offset by a tax benefit of approximately $23 million related to the impairment of our Mexicali assets.
No provision has been made for United States,U.S. federal, state, or additional foreign income taxes related to approximately $3.8 millionthat would be due upon the actual or deemed distribution of undistributed earnings of the other foreign subsidiaries, which have been, or are intended to be, permanently reinvested. It is not practical
CUMULATIVE EFFECT OF CHANGE IN ACCOUNTING PRINCIPLE
Werecognized as current-period charges and require the allocation of fixed production overheads to inventory based on the normal capacity of the production facilities. The guidance is effective for inventory costs incurred during fiscal years beginning after June 15, 2005. The Company adopted SFAS No. 142, "Goodwill and Other Intangible Assets,"151 on October 1, 2002,2005 and performedit did not have a transitional impairment test for goodwill. The goodwill impairment test is a two-step process. The first step ofmaterial impact on its financial statements during fiscal 2006.
LIQUIDITY AND CAPITAL RESOURCES
| (in thousands) | Years Ended September 30, | ||||||||
|---|---|---|---|---|---|---|---|---|---|
| 2003 | 2002 | 2001 | |||||||
| Cash and cash equivalents at beginning of period | $ 53,358 | $ 1,998 | $ 4,179 | ||||||
| Net cash provided by (used in) operating activities | (72,052 | ) | (99,094 | ) | (89,406 | ) | |||
| Net cash provided by (used in) investing activities | (44,282 | ) | 70,042 | (51,118 | ) | ||||
| Net cash provided by (used in) financing activities | 224,482 | 80,412 | 138,343 | ||||||
| Cash and cash equivalents at end of period | $ 161,506 | $ 53,358 | $ 1,998 | ||||||
Cash and cash equivalents at September 30, 2003, 2002 and 2001 totaled $161.5 million, $53.4 million and $2.0 million, respectively. Working capital at September 30, 2003 was approximately $249.3 million compared to $79.8 million at September 30, 2002 and $60.5 million at September 30, 2001. Inventory turns were approximately 6.5 for fiscal 2003.
Cash used in operating activities was $72.1 million for fiscal 2003, reflecting a net loss of $451.4 million, offset by non-cash charges (primarily asset impairments, depreciation and amortization) of $489.2 million and a net decrease in working capital items of approximately $109.9 million, including $40.0 million of merger-related expense payments. As of September 30, 2003, substantially all amounts accrued for merger-related expenses have been paid. Weyears beginning after December 15, 2005. The Company adopted SFAS No. 142, “Goodwill154 on September 30, 2005 and Other Intangible Assets,”it did not have a material effect on October 1, 2002 and recorded a $397.1 million cumulative effectits financial statements during fiscal 2006.
Cash used in investing activities for fiscal 2003 primarily consisted of capital expenditures of $40.3 million. The capital expenditures for fiscal 2003 represent our continued investment in production and test facilities in addition to our commitment to investalternative transition method provided in the capital neededFASB Staff Position for calculating the tax effects of share-based compensation pursuant to design new products and processes and address new opportunitiesSFAS 123(R) during the year ended September 29, 2006. The alternative transition method includes simplified methods to meet our customers’ demands. We believe a focused program of capital expenditures will be required to sustain our current manufacturing capabilities. We may also consider acquisition opportunities to extend our technology portfolio and design expertise and to expand our product offerings. Cash used in investing activities for fiscal 2003 also included $4.0 million of purchases of short-term investments. Our short-term investments are classified as held-to-maturity and consist primarily of commercial paper with original maturities of more than 90 days and less than twelve months.
On August 11, 2003 we filed a shelf registration statement on Form S-3 withestablish the SEC with respect to the issuance of up to $250 million aggregate principal amount of securities, including debt securities, common or preferred shares, warrants or any combination thereof. This registration statement, which the SEC declared effective on August 28, 2003, provides us with greater flexibility and access to capital. On September 9, 2003 we issued 9.2 million shares of common stock under our shelf registration statement. Cash provided by financing activities for fiscal 2003 included approximately $102.2 million of net proceeds from this offering. We may from time to time issue securities under the remainingbeginning balance of the shelf registration statementadditional paid-in capital pool (“APIC pool”) related to the tax effects of employee share-based compensation, and to determine the subsequent impact on
47
Cash provided by financing activitiesPurchases and Sales of Inventory with the Same Counterparty” (“EITF 04-13”). EITF 04-13 clarifies the circumstances under which two or more transactions involving inventory with the same counterparty should be viewed as a single nonmonetary transaction. In addition the EITF reached a consensus that there are circumstances under which nonmonetary exchanges of inventory within the same line of business should be recognized at fair value. Issue 04-13 is effective for new arrangements entered into in reporting periods beginning after March 15, 2006. The Company adopted the provisions of EITF 04-13 in the three month period ended June 30, 2006 and it did not have a material impact on its financial statements.
Cash used in operating activities was $99.1 million and $89.4 million for fiscal 2002 and 2001, respectively. Operating cash flows for fiscal 2002 and 2001 reflect net losses of $236.1 million and $318.9 million, respectively, offset by non-cash charges (depreciation and amortization, asset impairments and an in-process research and development charge) of $221.6 million and $220.8 million, respectively, and a net increase in working capital of approximately $84.6 million and a net decrease of $8.7 million, respectively. During 2002 we consolidated facilities, reduced our work force and continued to implement cost saving initiatives. In addition, increased revenues and improved utilization of our manufacturing facilities contributed to improved operating results in fiscal 2002 when compared to fiscal 2001.
Cash provided by investing activities for fiscal 2002 consisted of capital expenditures of $29.4 million and dividends to Conexant of $3.1 million offset by cash received of $67.1 million as a result of the Merger and $35.4 million from the sale of short-term investments acquired in the Merger. Cash used in investing activities for fiscal 2001 consisted of capital expenditures of $51.1 million. The capital expenditures for fiscal 2002 reflect a significant reduction from annual capital expenditures in fiscal 2001, a key component of the cost reduction initiatives implemented in fiscal 2002.
Cash provided by financing activities consisted of net transfers from Conexant, pre-Merger, of $50.4 million and $138.3 million for fiscal 2002 and 2001, respectively. Cash provided by financing activities for fiscal 2002 also consisted of $30.0 million of proceeds from borrowings against the revolving credit facility with Conexant. Historically, Conexant managed cash on a centralized basis. Cash receipts associated with Washington/Mexicali’s business were generally collected by Conexant, and Conexant generally made disbursements on behalf of Washington/Mexicali.
Following is a summary of our contractual payment obligations for consolidated debt, purchase agreements and operating leases at September 30, 2003 (seeNotes 8 and13 of the consolidated financial statements), in thousands:
| Obligation | Total | 1-3 years | 4-5 Years | Thereafter | |||||
|---|---|---|---|---|---|---|---|---|---|
| Debt | $316,681 | $ 86,681 | $230,000 | $ -- | |||||
| Purchase obligations | 51,507 | 51,507 | -- | -- | |||||
| Operating leases | 34,132 | 18,285 | 8,813 | 7,034 | |||||
| $402,320 | $156,473 | $238,813 | $7,034 | ||||||
Under supply agreements entered into with Conexant and Jazz Semiconductor, we receive wafer fabrication, wafer probe and certain other services from Jazz Semiconductor. Pursuant to these supply agreements, we are committed to obtain certain minimum wafer volumes from Jazz Semiconductor. Our expected minimum purchase obligations under these supply agreements are anticipated to be approximately $39 million and $13 million in fiscal 2004 and 2005, respectively.
Based on our fiscal 2003 results of operations and current trends, and after giving effect to the net proceeds we received in our private placement of 4.75 percent convertible subordinated notes due 2007, our debt refinancing with Conexant, our common stock public offering and our Facility Agreement, we expect our existing sources of liquidity, together with cash expected to be generated from operations,SAB 108 will be sufficientmaterial to fund our research and development, capital expenditures, debt obligations, purchase obligations, working capital and other cash requirements for at least the next twelve months.
its financial statements.
In July 2001, the Financial Accounting Standards Board (“FASB”) issued SFAS No. 142, “Goodwill and Other Intangibles.” SFAS No. 142 addresses financial accounting and reporting for acquired goodwill and other intangible assets. Goodwill and intangible assets that have indefinite useful lives are not amortized into results of operations, but instead are evaluated at least annually for impairment and written down when the recorded value exceeds the estimated fair value. We adopted SFAS No. 142 on October 1, 2002, and performed a transitional impairment test for goodwill. The goodwill impairment test is a two-step process. The first step of the impairment analysis compares our fair value to our net book value. In determining fair value, SFAS No. 142 allows for the use of several valuation methodologies, although it states quoted market prices are the best evidence of fair value. As part of the first step, we determined that we have one reporting unit for purposes of performing the fair-value based test of goodwill. This reporting unit is consistent with its single operating segment, which management determined is appropriate under the provisions of SFAS No. 131, “Disclosures about Segments of an Enterprise and Related Information.” We completed step one and determined that our goodwill and unamortized intangible assets were impaired. Step two of the analysis compares the implied fair value of goodwill to its carrying amount. If the carrying amount of goodwill exceeds its implied fair value, an impairment loss is recognized equal to that excess. We completed step two and determined that the carrying amount of our goodwill was $397.1 million greater than its implied fair value. This transitional impairment charge was recorded as a cumulative effect of a change in accounting principle in fiscal 2003. In addition, we completed our annual goodwill impairment test for fiscal 2003 and determined that as of July 1, 2003, our goodwill was not further impaired.
In June 2001, the FASB issued SFAS No. 143, “Accounting for Asset Retirement Obligations,” which addresses financial accounting and reporting for obligations associated with the retirement of tangible long-lived assets and the associated asset retirement costs. It requires that the fair value of a liability for an asset retirement obligation be recognized in the period in which it is incurred if a reasonable estimate of fair value can be made. We adopted the provisions or SFAS No. 143 on October 1, 2002 and its adoption did not have a material impact on our financial position or results of operations.
In August 2001, the FASB issued SFAS No. 144, “Accounting for the Impairment or Disposal of Long-Lived Assets,” which supersedes previous guidance on financial accounting and reporting for the impairment or disposal of long-lived assets and for segments of a business to be disposed of. We adopted SFAS No. 144 on October 1, 2002 and recorded asset impairment charges in accordance with its guidance during the fourth quarter of fiscal 2003. These charges primarily related to certain infrastructure products manufactured at our Woburn, Massachusetts and Adamstown, Maryland facilities.
In April 2002, the FASB issued SFAS No. 145, “Rescission of FASB Statement No.‘s 4, 44, and 64, Amendment of SFAS No. 13 and Technical Corrections,” effective for fiscal years beginning May 15, 2002 or later. It rescinds SFAS No. 4, “Reporting Gains and Losses From Extinguishments of Debt,” SFAS No. 64, “Extinguishments of Debt to Satisfy Sinking-Fund Requirements,” and SFAS No. 44, “Accounting for Intangible Assets of Motor Carriers.” This Statement also amends SFAS No. 13, “Accounting for Leases,” to eliminate an inconsistency between the required accounting for sale-leaseback transactions and the required accounting for certain lease modifications that have economic effects similar to sale-leaseback transactions. This Statement also amends other existing authoritative pronouncements to make various technical corrections, clarify meanings or describe their applicability under changed conditions. We adopted SFAS No. 145 on October 1, 2002 and its adoption did not have a material impact on our financial position or results of operations.
In June 2002, the FASB issued SFAS No. 146, “Accounting for Costs Associated With Exit or Disposal Activities.” SFAS No. 146 requires companies to recognize costs associated with exit or disposal activities when they are incurred rather than at the date of commitment to an exit or disposal plan. This Statement is effective for exit or disposal activities initiated after December 31, 2002. We adopted SFAS No. 146 on October 1, 2002 and its adoption did not have a material impact on our financial position or results of operations.
In November 2002, the FASB issued Interpretation No. 45, “Guarantor’s Accounting and Disclosure Requirements for Guarantees, Including Indirect Guarantees of Indebtedness of Others” (“FIN 45”). FIN 45 requires that upon issuance of a guarantee, a guarantor must recognize a liability for the fair value of an obligation assumed under a guarantee. FIN 45 also requires additional disclosures by a guarantor in its interim and annual financial statements about the obligations associated with guarantees issued. The recognition provisions of FIN 45 are effective for any guarantees that are issued or modified after December 31, 2002. We adopted FIN 45 on January 1, 2003 and its adoption did not have a material impact on our financial position or results of operations.
In December 2002, the FASB issued SFAS No. 148, “Accounting for Stock-Based Compensation – Transition and Disclosure.” SFAS No. 148 amends SFAS No. 123, “Accounting for Stock-Based Compensation,” to provide alternative methods of transition for a voluntary change to the fair value method of accounting for stock-based employee compensation. In addition, SFAS No. 148 amends the disclosure requirements of SFAS No. 123 to require prominent disclosures in both annual and interim financial statements about the method of accounting for stock-based employee compensation and the effect of the method on reported results. SFAS No. 148 is effective for financial statements for fiscal years and interim periods ending after December 15, 2002. The Company adopted the disclosure provisions of SFAS No. 148 on December 15, 2002 and continues to follow APB No. 25, “Accounting for Stock Issued to Employees,” in accounting for employee stock options.
In January 2003, the FASB issued Interpretation No. 46, “Consolidation of Variable Interest Entities” (“FIN 46”). FIN 46 clarifies situations in which entities shall be subject to consolidation. FIN 46 is effective for all variable interest entities created after January 31, 2003. We adopted FIN 46 on April 1, 2003 and its adoption did not have an impact on our financial position or results of operations.
CERTAIN BUSINESS RISKS
We operate in the highly cyclical wireless communications semiconductor industry, which is subject to significant downturns.
From time to time changes in general economic conditions, together with other factors, cause significant upturns and downturns in the industry. Periods of industry downturn, as we experienced beginning in calendar year 2001, have been characterized by diminished product demand, production overcapacity, high inventory levels and accelerated erosion of average selling prices. These characteristics, and in particular their impact on the level of demand for digital cellular handsets, may cause substantial fluctuations in our revenues and results of operations.
During the late 1990‘s and extending into 2000, the wireless communications semiconductor industry enjoyed unprecedented growth, benefiting from the rapid expansion of wireless communication services worldwide and increased demand for digital cellular handsets. However, beginning in calendar year 2001, we were adversely impacted by a global economic slowdown and an abrupt decline in demand for many of the end-user products that incorporate our products and system solutions, particularly cellular handsets. The impact of weakened end-customer demand was compounded by higher than normal levels of inventories among our original equipment manufacturer, or OEM, subcontractor and distributor customers. Should the reduced end-customer demand continue, this could result in underutilization of our manufacturing capacity, changes in revenue mix and other impacts that would continue to materially and adversely affect our operating results.
Because of the cyclical nature of the wireless communications semiconductor industry, we cannot assure you of the timing, duration or magnitude of any recovery in our industry or that a recovery will occur. We cannot assure you that the wireless communications semiconductor industry will not experience renewed, and possibly more severe and prolonged, downturns in the future, or that our operating results or financial condition will not be adversely affected by them. We have experienced these cyclical fluctuations in our business and may experience cyclical fluctuations in the future.
We have recently incurred substantial operating losses and may experience future losses.
Our operating results have been adversely affected by a global economic slowdown, concerns about inflation, decreased consumer confidence, reduced capital spending, adverse business conditions, and liquidity concerns in the telecommunications and related industries. These factors have lead to an to a slowdown in customer orders, an increase in the number of cancellations and reschedulings of backlog, higher overhead costs as a percentage of our reduced net revenue, and an abrupt decline in demand for many of the end-user products that incorporate wireless communications semiconductor products and system solutions. As a result, we continued to incur operating losses during fiscal 2003 and may experience operating losses in the future. Should the reduced end-customer demand continue for any reason, this could result in underutilization of our manufacturing capacity, reduced revenues or changes in our revenue mix, and other factors that could continue to materially and adversely affect our operating results in the near term. Due to these economic factors, we cannot assure you as to whether or when we will become profitable or whether we will be able to sustain such profitability, if achieved.
Additionally, the conflict in Iraq as well as other contemporary international conflicts, acts of terrorism and civil and military unrest have augmented the economic slowdown. These continuing and potentially escalating conflicts can be expected to place further pressure on economic conditions in the United States and worldwide. These conditions make it extremely difficult for our customers, our vendors and for us to accurately forecast and plan future business activities. If such conditions continue or worsen, our business, financial condition and results of operations will likely be materially and adversely affected.
The wireless semiconductor markets are characterized by intense competition.
The wireless communications semiconductor industry in general and the markets in which we compete in particular are intensely competitive. We compete with U.S. and international semiconductor manufacturers of all sizes in terms of resources and market share. We currently face significant competition in our markets and expect that intense price and product competition will continue. This competition has resulted in, and is expected to continue to result in, declining average selling prices for our products and increased challenges in maintaining or increasing market share. Furthermore, additional competitors may enter our markets as a result of growth opportunities in communications electronics, the trend toward global expansion by foreign and domestic competitors and technological and public policy changes. We believe that the principal competitive factors for semiconductor suppliers in our markets include, among others:
We cannot assure you that we will be able to successfully address these factors. Many of our competitors enjoy the benefit of:
As a result, certain competitors may be able to adapt more quickly than we can to new or emerging technologies and changes in customer requirements or may be able to devote greater resources to the development, promotion and sale of their products than we can.
Current and potential competitors have established or may in the future establish financial or strategic relationships among themselves or with customers, resellers or other third parties. These relationships may affect customers’ purchasing decisions. Accordingly, it is possible that new competitors or alliances among competitors could emerge and rapidly acquire significant market share. We cannot assure you that we will be able to compete successfully against current and potential competitors. Increased competition could result in pricing pressures, decreased gross margins and loss of market share and may materially and adversely affect our business, financial condition and results of operations.
Our success depends upon our ability to develop new products and reduce costs in a timely manner.
The wireless communications semiconductor industry is highly cyclical and characterized by constant and rapid technological change, rapid product evolution, price erosion, evolving technical standards, short product life cycles, increasing demand for higher levels of integration and increased miniaturization, and wide fluctuations in product supply and demand. In particular, the markets into which we sell demand cutting-edge technologies and new and innovative products. Our operating results depend largely on our ability to continue to introduce new and enhanced products on a timely basis. The development and commercialization of semiconductor devices, modules and system solutions is highly complex. Successful product development and introduction depends on numerous factors, including:
We cannot assure you that we will have sufficient resources to make the substantial investment in research and development needed to develop and bring to market new and enhanced products in a timely manner. We will be required to continually evaluate expenditures for planned product development and to choose among alternative technologies based on our expectations of future market growth. We cannot assure you that we will be able to develop and introduce new or enhanced wireless communications semiconductor products in a timely and cost-effective manner, that our products will satisfy customer requirements or achieve market acceptance or that we will be able to anticipate new industry standards and technological changes. We also cannot assure you that we will be able to respond successfully to new product announcements and introductions by competitors or to changes in the design or specifications of complementary products of third parties to which our products interface.
In addition, prices of products may decline, sometimes significantly, over time. We believe that to remain competitive we must continue to reduce the cost of producing and delivering existing products at the same time that we develop and introduce new or enhanced products. We cannot assure you that we will be able to continue to reduce the cost of our products to remain competitive.
The markets into which we sell our products are characterized by rapid technological change.
The demand for our products can change quickly and in ways we may not anticipate. Our markets generally exhibit the following characteristics:
These changes in our markets may contribute to the obsolescence of our products. Our products could become obsolete or less competitive sooner than anticipated because of a faster than anticipated change in one or more of the above-noted factors.
The ability to attract and retain qualified personnel to contribute to the design, development, manufacture and sale of our products is critical to our success.
As the source of our technological and product innovations, our key technical personnel represent a significant asset. Our success depends on our ability to continue to attract, retain and motivate qualified personnel, including executive officers and other key management and technical personnel. The competition for management and technical personnel is intense in the semiconductor industry, and we therefore cannot assure you that we will be able to attract and retain qualified management and other personnel necessary for the design, development, manufacture and sale of our products. We may have particular difficulty attracting and retaining key personnel during periods of poor operating performance, given, among other things, the use of equity-based compensation by us and our competitors. The loss of the services of one or more of our key employees or our inability to attract, retain and motivate qualified personnel, could have a material adverse effect on our ability to operate our business.
If OEMs and ODMs of communications electronics products do not design our products into their equipment, we will havedifficulty selling those products. Moreover, a “design win” from a customer does not guarantee future sales to that customer
Our products will not be sold directly to the end-user but will be components or subsystems of other products. As a result, we will rely on OEMs and ODMs of wireless communications electronics products to select our products from among alternative offerings to be designed into their equipment. Without these “design wins,” we would have difficulty selling our products. If a manufacturer designs another supplier’s product into one of its product platforms, it is more difficult for us to achieve future design wins with that platform because changing suppliers involves significant cost, time, effort and risk on the part of that manufacturer. Also, achieving a design win with a customer does not ensure that we will receive significant revenues from that customer. Even after a design win, the customer is not obligated to purchase our products and can choose at any time to reduce or cease use of our products, for example, if its own products are not commercially successful, or for any other reason. We cannot assure you that we will continue to achieve design wins or to convert design wins into actual sales.
Lengthy product development and sales cycles associated with many of our products may result in significant expenditures before generating any revenues related to those products.
After our product is has been developed, tested, and manufactured, our customers may need three to six months or longer to integrate, test and evaluate our products and an additional three to six months or more to begin volume production of equipment incorporates the products. This lengthy cycle time increases the possibility that a customer may decide to cancel or change product plans, which could reduce or eliminate our sales to that customer. As a result of this lengthy sales cycle, we may incur significant research and development expenses, and selling, general and administrative expenses, before we generate the related revenues for these products. Furthermore, we may never generate the anticipated revenues from a product after incurring such expenses if our customer cancels or changes its product plans.
Uncertainties involving the ordering and shipment of our products could adversely affect our business.
Our sales will typically be made pursuant to individual purchase orders and not under long-term supply arrangements with our customers. Our customers may cancel orders before shipment. Additionally, we will sell a portion of our products through distributors, some of whom will have rights to return unsold products. We may purchase and manufacture inventory based on estimates of customer demand for our products, which is difficult to predict. This difficulty may be compounded when we sell to OEMs indirectly through distributors or contract manufacturers, or both, as our forecasts of demand will then be based on estimates provided by multiple parties. In addition, our customers may change their inventory practices on short notice for any reason. The cancellation or deferral of product orders, the return of previously sold products, or overproduction due to a change in anticipated order volumes, could result in us holding excess or obsolete inventory, which could result in inventory write-downs and, in turn, could have a material adverse effect on our financial condition.
Our reliance on a small number of customers for a large portion of our sales could have a material adverse effect on the results of our operations.
A significant portion of our sales are concentrated among a limited number of customers. If we lost one or more of these major customers, or if one or more major customers significantly decreased its orders of our products, our business would be materially and adversely affected. Sales to Samsung Electronics Co. and to Motorola, Inc. represented approximately 15% and 11%, respectively, of net revenues for fiscal 2003. Our future operating results will depend on the success of these customers and other customers and our success in selling products to them.
Average product life cycles in the semiconductor industry tend to be very short.
In the semiconductor industry, product life cycles tend to be short relative to the sales and development cycles. Therefore, the resources devoted to product sales and marketing may not result in material revenue, and from time to time we may need to write off excess or obsolete inventory. If we were to incur significant marketing expenses and investments in inventory that we are not able to recover, and we are not able to compensate for those expenses, our operating results would be materially and adversely affected. In addition, if we sell our products at reduced prices in anticipation of cost reductions but still hold higher cost products in inventory, our operating results would be harmed.
Our leverage and our debt service obligations may adversely affect our cash flow.
On September 30, 2003, after giving effect to unused availability under our receivable financing credit facility with Wachovia Bank, National Association, we would have had total indebtedness of approximately $325 million, which would have represented approximately 34% of our total capitalization.
As long as our 4.75 percent convertible subordinated notes remain outstanding, we will have debt service obligations on such notes of approximately $10,925,000 per year in interest payments. In addition, we will have debt service obligations on our 15 percent convertible senior subordinated notes due June 30, 2005, originally issued to Conexant, of approximately $6,750,000 per year. If we issue other debt securities in the future, our debt service obligations will increase. If we are unable to generate sufficient cash to meet these obligations and must instead use our existing cash or investments, we may have to reduce or curtail other activities of our business.
We intend to fulfill our debt service obligations from cash generated by our operations, if any, and from our existing cash and investments. If necessary, among other alternatives, we may add lease lines of credit to finance capital expenditures and we may obtain other long-term debt, lines of credit and other financing.
Our indebtedness could have significant negative consequences, including:
Despite our current debt levels, we are able to incur substantially more debt, which would increase the risks described above.
We face a risk that capital needed for our business will not be available when we need it.
We will need to obtain sources of financing in the future. After giving effect to the net proceeds of our $102 million offering on or about September 12, 2003, our $230 million private placement of 4.75 percent convertible subordinated notes due 2007, our $45 million debt refinancing with Conexant and our receivables financing credit facility with Wachovia Bank, National Association, we believe that our existing sources of liquidity, together with cash expected to be generated from operations, will be sufficient to fund our research and development, capital expenditure, working capital and other financing requirements for at least the next twelve months.
However, we cannot assure you that the capital required to fund these expenses will be available in the future. Conditions existing in the U.S. capital markets when we seek financing as well as the then current condition of the Company will affect our ability to raise capital, as well as the terms of any financing. We may not be able to raise enough capital to meet our capital needs on a timely basis or at all. Failure to obtain capital when required would have a material adverse effect on the Company.
In addition, any strategic investments and acquisitions that we may make to help us grow our business may require additional capital resources. We cannot assure you that the capital required to fund these investments and acquisitions will be available in the future.
Our manufacturing processes are extremely complex and specialized.
Our manufacturing operations are complex and subject to disruption, including for causes beyond our control. The fabrication of integrated circuits is an extremely complex and precise process consisting of hundreds of separate steps. It requires production in a highly controlled, clean environment. Minor impurities, contamination of the clean room environment, errors in any step of the fabrication process, defects in the masks used to print circuits on a wafer, defects in equipment or materials, human error, or a number of other factors can cause a substantial percentage of wafers to be rejected or numerous die on each wafer to malfunction. Because our operating results are highly dependent upon our ability to produce integrated circuits at acceptable manufacturing yields, these factors present could have a material adverse affect on our business. In addition, we may discover from time to time defects in our products after they have been shipped, which may require us to replace such products.
Additionally, our operations may be affected by lengthy or recurring disruptions of operations at any of our production facilities or those of our subcontractors. These disruptions may include electrical power outages, fire, earthquake, flooding, war, acts of terrorism, or other natural or man-made disasters. Disruptions of our manufacturing operations could cause significant delays in shipments until we are able to shift the products from an affected facility or subcontractor to another facility or subcontractor. In the event of such delays, we cannot assure you that the required alternative capacity, particularly wafer production capacity, would be available on a timely basis or at all. Even if alternative wafer production or assembly and test capacity is available, we may not be able to obtain it on favorable terms, which could result in higher costs and/or a loss of customers. We may be unable to obtain sufficient manufacturing capacity to meet demand, either at our own facilities or through external manufacturing or similar arrangements with others.
Due to the highly specialized nature of the gallium arsenide integrated circuit manufacturing process, in the event of a disruption at the Newbury Park, California or Woburn, Massachusetts semiconductor wafer fabrication facilities, alternative gallium arsenide production capacity would not be immediately available from third-party sources. These disruptions could have a material adverse effect on our business, financial condition and results of operations.
We may not be able to maintain and improve manufacturing yields that contribute positively to our gross margin and profitability.
Minor deviations or perturbations in the manufacturing process can cause substantial manufacturing yield loss, and in some cases, cause production to be suspended. Manufacturing yields for new products initially tend to be lower as we complete product development and commence volume manufacturing, and typically increase as we bring the product to full production. Our forward product pricing includes this assumption of improving manufacturing yields and, as a result, material variances between projected and actual manufacturing yields will have a direct effect on our gross margin and profitability. The difficulty of accurately forecasting manufacturing yields and maintaining cost competitiveness through improving manufacturing yields will continue to be magnified by the increasing process complexity of manufacturing semiconductor products. Our manufacturing operations will also face pressures arising from the compression of product life cycles, which will require us to manufacture new products faster and for shorter periods while maintaining acceptable manufacturing yields and quality without, in many cases, reaching the longer-term, high-volume manufacturing conducive to higher manufacturing yields and declining costs.
We are dependent upon third parties for the manufacture, assembly and test of our products.
We rely upon independent wafer fabrication facilities, called foundries, to provide silicon-based products and to supplement our gallium arsenide wafer manufacturing capacity. We also utilize subcontractors to package, assemble and test our products. There are significant risks associated with reliance on third-party foundries, including:
Although we have long-term supply arrangements to obtain additional external manufacturing capacity, the third-party foundries we use may allocate their limited capacity to the production requirements of other customers. If we choose to use a new foundry, it will typically take an extended period of time to complete the qualification process before we can begin shipping products from the new foundry. The foundries may experience financial difficulties, be unable to deliver products to us in a timely manner or suffer damage or destruction to their facilities, particularly since some of them are located in earthquake zones. If any disruption of manufacturing capacity occurs, we may not have alternative manufacturing sources immediately available. We may therefore experience difficulties or delays in securing an adequate supply of our products, which could impair our ability to meet our customers’ needs and have a material adverse effect on our operating results.
We are dependent upon third parties for the supply of raw materials and components.
Our manufacturing operations depend on obtaining adequate supplies of raw materials and the components used in our manufacturing processes. We believe we have adequate sources for the supply of raw materials and components for our manufacturing needs with suppliers located around the world. While we do not typically rely on a single source of supply for our raw materials, we are currently dependent on a sole-source supplier for epitaxial wafers used in the gallium arsenide semiconductor manufacturing processes at our manufacturing facilities. We cannot assure you that we will not lose a significant or sole supplier or that a supplier will be able to meet performance and quality specifications or delivery schedules. If we lost a supplier or a supplier were unable to meet performance or quality specifications or delivery schedules, our ability to satisfy customer obligations could be materially and adversely affected. In addition, we review our relationships with suppliers of raw materials and components for our manufacturing needs on an ongoing basis. In connection with our ongoing review, we may modify or terminate our relationship with one or more suppliers. We may also enter into other sole supplier arrangements to meet certain of our raw material or component needs. If we were to enter into an additional sole supplier arrangement for any of our raw materials or components, the risks associated with our supply arrangements would be exacerbated.
Under supply agreements entered into with Conexant and Jazz Semiconductor, Inc. we receive wafer fabrication, wafer probe and certain other services from Jazz Semiconductor. Pursuant to these supply agreements, we are committed to obtaining certain minimum wafer volumes from Jazz Semiconductor. Our expected minimum purchase obligations under these supply agreements are anticipated to be approximately $39 million and $13 million, respectively, in fiscal 2004 and 2005.
Remaining competitive in the semiconductor industry requires transitioning to smaller geometry process technologies and achieving higher levels of design integration.
In order to remain competitive, we expect to continue to transition our semiconductor products to increasingly smaller line width geometries. This transition requires us to modify the manufacturing processes for our products, design new products to more stringent standards, and to redesign some existing products. In the past, we have experienced some difficulties migrating to smaller geometry process technologies or new manufacturing processes, which resulted in sub-optimal manufacturing yields, delays in product deliveries and increased expenses. We may face similar difficulties, delays and expenses as we continue to transition our products to smaller geometry processes in the future. In some instances, we depend on our relationships with our foundries to transition to smaller geometry processes successfully. We cannot assure you that our foundries will be able to effectively manage the transition or that we will be able to maintain our foundry relationships. If our foundries or we experience significant delays in this transition or fail to efficiently implement this transition, our business, financial condition and results of operations could be materially and adversely affected. As smaller geometry processes become more prevalent, we expect to continue to integrate greater levels of functionality, as well as customer and third party intellectual property, into our products. However, we may not be able to achieve higher levels of design integration or deliver new integrated products on a timely basis, or at all.
We are subject to the risks of doing business internationally.
Historically, a substantial majority of the Company’s net revenues from customers other than Conexant were derived from customers located outside the United States, primarily countries located in the Asia-Pacific region and Europe. In addition, we have design centers and suppliers located outside the United States, and third-party packaging, assembly and test facilities and foundries located in the Asia-Pacific region. Finally, we have our own packaging, assembly and test facility in Mexicali, Mexico. Our international sales and operations are subject to a number of risks inherent in selling and operating abroad. These include, but are not limited to, risks regarding:
Additionally, we are subject to risks in certain global markets in which wireless operators provide subsidies on handset sales to their customers. Increases in handset prices that negatively impact handset sales can result from changes in regulatory policies or other factors, which could impact the demand for our products. Limitations or changes in policy on phone subsidies in South Korea, Japan, China and other countries may have additional negative impacts on our revenues.
Our operating results may be adversely affected by substantial quarterly and annual fluctuations and market downturns.
Our revenues, earnings and other operating results have fluctuated in the past and our revenues, earnings and other operating results may fluctuate in the future. These fluctuations are due to a number of factors, many of which are beyond our control.
These factors include, among others:
The foregoing factors are difficult to forecast, and these, as well as other factors, could materially and adversely affect our quarterly or annual operating results. If our operating results fail to meet the expectations of analysts or investors, it could materially and adversely affect the price of our common stock.
Global economic conditions that impact the wireless communications industry could negatively affect our revenues and operating results.
Global economic weakness can have wide-ranging effects on markets that we serve, particularly wireless communications equipment manufacturers and network operators. The wireless communications industry appears to be recovering from an industry-wide recession. We cannot predict whether a recovery will continue, the rate of any such recovery, or what effects negative events, such as war, may have on the economy or the wireless communications industry. The continued threat of terrorism and heightened security and military action in response to this threat, or any future acts of terrorism, may cause further disruptions to the global economy and to the wireless communications industry and create further uncertainties. Further, an economic recovery may not benefit us in the near term. If it does not, our ability to increase or maintain our revenues and operating results may be impaired.
Our gallium arsenide semiconductors may cease to be competitive with silicon alternatives.
Among our product portfolio, we manufacture and sell gallium arsenide semiconductor devices and components, principally power amplifiers and switches. The production of gallium arsenide integrated circuits is more costly than the production of silicon circuits. The cost differential is due to higher costs of raw materials for gallium arsenide and higher unit costs associated with smaller sized wafers and lower production volumes. Therefore, to remain competitive we must offer gallium arsenide products that provide superior performance over their silicon-based counterparts. If we do not continue to offer products that provide sufficiently superior performance to justify the cost differential, our operating results may be materially and adversely affected. We expect the costs of producing gallium arsenide devices will continue to exceed the costs of producing their silicon counterparts. Silicon semiconductor technologies are widely-used process technologies for certain integrated circuits and these technologies continue to improve in performance. We cannot assure you that we will continue to identify products and markets that require performance attributes of gallium arsenide solutions.
We may be subject to claims of infringement of third-party intellectual property rights, or demands that we license third-party technology, which could result in significant expense and prevent us from using our technology.
The semiconductor industry is characterized by vigorous protection and pursuit of intellectual property rights. From time to time, third parties have asserted and may in the future assert patent, copyright, trademark and other intellectual property rights to technologies that are important to our business and have demanded and may in the future demand that we license their technology or refrain from using it. At the present time, we are in discussions with Qualcomm Incorporated regarding claims each of us have filed and served against the other asserting violations of certain of our respective intellectual property rights. The purpose of these discussions is to arrive at a business resolution that avoids protracted litigation for both parties. We believe their claims are without merit and if we are not successful resolving this matter outside of litigation, we are prepared to vigorously defend against their claims and fully prosecute our claims against them.
Any litigation to determine the validity of claims that our products infringe or may infringe intellectual property rights of another, including claims arising from our contractual indemnification of our customers, regardless of their merit or resolution, could be costly and divert the efforts and attention of our management and technical personnel. Regardless of the merits of any specific claim, we cannot assure you that we would prevail in litigation because of the complex technical issues and inherent uncertainties in intellectual property litigation. If litigation were to result in an adverse ruling, we could be required to:
We cannot assure you that our operating results or financial condition will not be adversely affected if we were required to do any one or more of the foregoing items.
Many of our products incorporate technology licensed or acquired from third parties.
We sell products in markets that are characterized by rapid technological changes, evolving industry standards, frequent new product introductions, short product life cycles and increasing levels of integration. Our ability to keep pace with this market depends on our ability to obtain technology from third parties on commercially reasonable terms to allow our products to remain in a competitive posture. If licenses to such technology are not available on commercially reasonable terms and conditions, and we cannot otherwise integrate such technology, our products or our customers’ products could become unmarketable or obsolete, and we could lose market share. In such instances, we could also incur substantial unanticipated costs or scheduling delays to develop substitute technology to deliver competitive products.
If we are not successful in protecting our intellectual property rights, it may harm our ability to compete.
We rely on patent, copyright, trademark, trade secret and other intellectual property laws, as well as nondisclosure and confidentiality agreements and other methods, to protect our proprietary technologies, information, data, devices, algorithms and processes. In addition, we often incorporate the intellectual property of our customers, suppliers or other third parties into our designs, and we have obligations with respect to the non-use and non-disclosure of such third-party intellectual property. In the future, it may be necessary to engage in litigation or like activities to enforce our intellectual property rights, to protect our trade secrets or to determine the validity and scope of proprietary rights of others, including our customers. This could require us to expend significant resources and to divert the efforts and attention of our management and technical personnel from our business operations. We cannot assure you that:
| ITEM 7A. |
Despite these precautions, it may be possible for a third party to copy or otherwise obtain and use our technology without authorization, develop similar technology independently or design around our patents. If any of our intellectual property protection mechanisms fails to protect our technology, it would make it easier for our competitors to offer similar products, potentially resulting in loss of market share and price erosion. In addition, effective patent, copyright, trademark and trade secret protection may be unavailable or limited for certain technologies and in certain foreign countries.
Our success depends, in part, on our ability to effect suitable investments, alliances and acquisitions, and to integrate companies we acquire, and on our continued success integrating the wireless business of Conexant with the Company.
Although we intend to invest significant resources in internal research and development activities, the complexity and rapidity of technological changes and the significant expense of internal research and development make it impractical for us to pursue development of all technological solutions on our own. On an ongoing basis, we intend to review investment, alliance and acquisition prospects that would complement our product offerings, augment our market coverage or enhance our technological capabilities. However, we cannot assure you that we will be able to identify and consummate suitable investment, alliance or acquisition transactions in the future. Moreover, if we consummate such transactions, they could result in:
Moreover, integrating acquired organizations and their products and services may be difficult, expensive, time-consuming and a strain on our resources and our relationship with employees and customers and ultimately may not be successful. Additionally, in periods following an acquisition, we will be required to evaluate goodwill and acquisition-related intangible assets for impairment. When such assets are found to be impaired, they will be written down to estimated fair value, with a charge against earnings. For instance, we recorded a cumulative effect of a change in accounting principle in fiscal 2003 in the amount of $397.1 million as a result of the goodwill obtained in connection with the Merger.
We may be responsible for payment of a substantial amount of U.S. federal income and other taxes upon certain events.
In connection with Conexant’s spin-off of its wireless business prior to the Merger, Conexant sought and received a ruling from the Internal Revenue Service to the effect that certain transactions related to and including the spin-off qualified as a reorganization and as tax-free for U.S. federal income tax purposes. While the tax ruling generally is binding on the Internal Revenue Service, the continuing validity of the ruling is subject to certain factual representations and assumptions. In connection with the Merger we entered into a tax allocation agreement with Conexant that generally provides, among other things, that we will be responsible for certain taxes imposed on various persons (including Conexant) as a result of either:
if such failure is attributable to certain actions or transactions by or in respect of Skyworks (including our subsidiaries) or our stockholders, such as the acquisition of stock of Skyworks by a third party at a time and in a manner that would cause such failure. In addition, the tax allocation agreement provides that we will be responsible for various other tax obligations and for compliance with various representations, statements, and conditions made in the course of obtaining the tax ruling referenced above and in connection with the tax allocation agreement. Our obligations under the tax allocation agreement have been limited by a letter agreement dated November 6, 2002 entered into in connection with our debt refinancing with Conexant. Nevertheless, if we do not carefully monitor our compliance with the requirements imposed as a result of the spin-off and related transactions and our responsibilities under the tax allocation agreement, we might inadvertently trigger an obligation to indemnify certain persons (including Conexant) pursuant to the tax allocation agreement or other obligations under such agreement. In addition, our indemnity obligations could discourage or prevent a third party from making a proposal to acquire Skyworks.
If we were required to pay any of the taxes described above, the payment could be very substantial and have a material adverse effect on our business, financial condition, results of operations and cash flow.
In addition, it is expected that the interest payments we are required to make on our $45 million principal amount of 15% convertible subordinated notes due June 30, 2005 originally issued to Conexant will not be deductible for tax purposes. Our inability to offset our interest expense from these notes against other income may increase our tax liability currently and in future years.
Further, the terms of these senior subordinated notes require us to pay the principal due at the maturity date or upon certain acceleration events in a number of shares of our common stock equal to the principal due at such time divided by the applicable conversion price on such date. If the fair market value of our common stock on such date is less than the applicable conversion price, we may recognize cancellation of indebtedness income for tax purposes equal to the excess of the principal amount of these notes due at such time over the fair market value of the common stock issued by us to satisfy our obligations under these notes.
Certain provisions in our organizational documents and Delaware law may make it difficult for someone to acquire control of us.
We have certain anti-takeover measures that may affect our common stock. Our certificate of incorporation, our by-laws and the Delaware General Corporation Law contain several provisions that would make more difficult an acquisition of control of us in a transaction not approved by our board of directors. Our certificate of incorporation and by-laws include provisions such as:
In addition to the provisions in our certificate of incorporation and by-laws, Section 203 of the Delaware General
Corporation Law generally provides that a corporation shall not engage in any business combination with any interested stockholder during the three-year period following the time that such stockholder becomes an interested stockholder, unless a majority of the directors then in office approves either the business combination or the transaction that results in the stockholder becoming an interested stockholder or specified stockholder approval requirements are met.
We may be liable for penalties under environmental laws, rules and regulations, which could adversely impact our business.
We have used, and will continue to use, a variety of chemicals and compounds in manufacturing operations and have been and will continue to be subject to a wide range of environmental protection regulations in the United States. While we have not experienced any material adverse effect on our operations as a result of such regulations, we cannot assure you that current or future regulations would not have a material adverse effect on our business, financial condition and results of operations. Environmental regulations often require parties to fund remedial action regardless of fault. Consequently, it is often difficult to estimate the future impact of environmental matters, including potential liabilities. We cannot assure you that the amount of expense and capital expenditures that might be required to satisfy environmental liabilities, to complete remedial actions and to continue to comply with applicable environmental laws will not have a material adverse effect on our business, financial condition and results of operations.
Our stock price has been volatile and may fluctuate in the future. Accordingly, you might not be able to sell your shares of common stock at or above the price you paid for them.
The trading price of our common stock has and may continue to fluctuate significantly. Such fluctuations may be influenced by many factors, including:
Public stock markets have experienced, and are currently experiencing, extreme price and trading volume volatility, particularly in the technology sectors of the market. This volatility has significantly affected the market prices of securities of many technology companies for reasons frequently unrelated to or disproportionately impacted by the operating performance of these companies. These broad market fluctuations may materially and adversely affect the market price of our common stock.
In addition, fluctuations in our stock price and our price-to-earnings multiple may have made our stock attractive to momentum, hedge or day-trading investors who often shift funds into and out of stocks rapidly, exacerbating price fluctuations in either direction, particularly when viewed on a quarterly basis.
ITEM 7A. QUANTITATIVE AND QUALITATIVE DISCLOSURES ABOUT MARKET RISK
48
49
| ITEM 8. | FINANCIAL STATEMENTS AND SUPPLEMENTARY DATA. |
| Page | ||||||||
| Page | ||||||||
| Page | ||||||||
| Page | ||||||||
| Pages 56 | ||||||||
| 80 | ||||||||
50
Skyworks Solutions, Inc.:
audits.
/s/ KPMG LLPKPMG LLPBoston, MassachusettsNovember 12, 2003, except for the third paragraph of Note 14, as to which the date is December 4, 2003
INDEPENDENT AUDITORS’ REPORT
The Board of Directors and StockholdersSkyworks Solutions, Inc.:
effective October 1, 2005.
December 13, 2006
51
We conducted our audit in accordance with auditing standards generally accepted in the United States of America. Those standards require that we plan and perform the audit to obtain reasonable assurance about whether the financial statements are free of material misstatement. An audit includes examining, on a test basis, evidence supporting the amounts and disclosures in the financial statements. An audit also includes assessing the accounting principles used and significant estimates made by management, as well as evaluating the overall financial statement presentation. We believe that our audit provides a reasonable basis for our opinion.
In our opinion, the financial statements referred to above present fairly, in all material respects, the results of operations and cash flows for Skyworks Solutions, Inc. and subsidiaries (formerly the Washington Business and the Mexicali Operations of Conexant Systems, Inc.) for the year ended September 30, 2001, in conformity with accounting principles generally accepted in the United States of America. Also, in our opinion, such 2001 financial statement schedule when considered in relation to the basic 2001 financial statements taken as a whole presents fairly, in all material respects, the information set forth therein.
(In thousands, except per share amounts)
| ASSETS | September 30, | |||||||
|---|---|---|---|---|---|---|---|---|
| 2003 | 2002 | |||||||
| Current assets: | ||||||||
| Cash and cash equivalents | $ | 161,506 | $ | 53,358 | ||||
| Short-term investments | 3,988 | -- | ||||||
| Restricted cash | 5,312 | -- | ||||||
| Receivables, net of allowance for doubtful accounts of | ||||||||
| $1,979 and $1,324, respectively | 144,267 | 94,425 | ||||||
| Inventories | 58,168 | 55,643 | ||||||
| Other current assets | 12,854 | 23,970 | ||||||
| Total current assets | 386,095 | 227,396 | ||||||
| Property, plant and equipment, less accumulated depreciation and amortization of | ||||||||
| $243,797 and $202,436, respectively | 121,556 | 143,773 | ||||||
| Property held for sale | 6,209 | -- | ||||||
| Goodwill | 505,514 | 905,219 | ||||||
| Intangible assets, less accumulated amortization of $4,460 and $915, respectively | 22,181 | 35,467 | ||||||
| Deferred tax asset | 22,766 | 22,487 | ||||||
| Other assets | 26,347 | 12,570 | ||||||
| Total assets | $ | 1,090,668 | $ | 1,346,912 | ||||
| LIABILITIES AND STOCKHOLDERS' EQUITY | ||||||||
| Current liabilities: | ||||||||
| Current maturities of long-term debt | $ | 29 | $ | 129 | ||||
| Short-term debt | 41,652 | -- | ||||||
| Accounts payable | 50,369 | 45,350 | ||||||
| Accrued compensation and benefits | 16,963 | 17,585 | ||||||
| Other current liabilities | 27,803 | 84,563 | ||||||
| Total current liabilities | 136,816 | 147,627 | ||||||
| Long-term debt, less current maturities | 275,000 | 180,039 | ||||||
| Other long-term liabilities | 5,677 | 4,270 | ||||||
| Total liabilities | 417,493 | 331,936 | ||||||
| Commitments and contingencies | -- | -- | ||||||
| Stockholders' equity: | ||||||||
| Preferred stock, no par value: 25,000 authorized, no shares issued | -- | -- | ||||||
| Common stock, $0.25 par value: 525,000 shares authorized; 148,604 and 137,589 | ||||||||
| shares issued and outstanding, respectively | 37,151 | 34,397 | ||||||
| Additional paid-in capital | 1,258,265 | 1,150,856 | ||||||
| Accumulated deficit | (621,609 | ) | (170,193 | ) | ||||
| Accumulated comprehensive loss | (632 | ) | -- | |||||
| Deferred compensation, net of accumulated amortization of $137 and $53, respectively | -- | (84 | ) | |||||
| Total stockholders' equity | 673,175 | 1,014,976 | ||||||
| Total liabilities and stockholders' equity | $ | 1,090,668 | $ | 1,346,912 | ||||
| Fiscal Years Ended | ||||||||||||
| September 29, | September 30, | October 1, | ||||||||||
| 2006 | 2005 | 2004 | ||||||||||
| Net revenues | $ | 773,750 | $ | 792,371 | $ | 784,023 | ||||||
| Cost of goods sold (includes share-based compensation expense of $2,174 for the fiscal year ended September 29, 2006) | 511,071 | 484,599 | 470,807 | |||||||||
| Gross profit | 262,679 | 307,772 | 313,216 | |||||||||
| Operating expenses: | ||||||||||||
| Research and development (includes share-based compensation expense of $6,311 for the fiscal year ended September 29, 2006) | 164,106 | 152,215 | 152,633 | |||||||||
| Selling, general and administrative (includes share-based compensation expense of $5,734 for the fiscal year ended September 29, 2006) | 135,801 | 103,070 | 97,522 | |||||||||
| Amortization of intangible assets | 2,144 | 2,354 | 3,043 | |||||||||
| Restructuring and special charges | 26,955 | — | 17,366 | |||||||||
| Total operating expenses | 329,006 | 257,639 | 270,564 | |||||||||
| Operating income (loss) | (66,327 | ) | 50,133 | 42,652 | ||||||||
| Interest expense | (14,797 | ) | (14,597 | ) | (17,947 | ) | ||||||
| Other income, net | 8,350 | 5,453 | 1,691 | |||||||||
| Income (loss) before income taxes | (72,774 | ) | 40,989 | 26,396 | ||||||||
| Provision for income taxes | 15,378 | 15,378 | 3,984 | |||||||||
| Net income (loss) ) | $ | (88,152 | ) | $ | 25,611 | $ | 22,412 | |||||
| Per share information: | ||||||||||||
| Net income (loss), basic and diluted | $ | (0.55 | ) | $ | 0.16 | $ | 0.15 | |||||
| Number of weighted-average shares used in per share computations, basic | 159,408 | 157,453 | 152,090 | |||||||||
| Number of weighted-average shares used in per share computations, diluted | 159,408 | 158,857 | 154,242 | |||||||||
52
(In thousands, except per share amounts)
| Years Ended September 30, | |||||||||||
|---|---|---|---|---|---|---|---|---|---|---|---|
| 2003 | 2002 | 2001 | |||||||||
| Net revenues | $ | 617,789 | $ | 457,769 | $ | 260,451 | |||||
| Cost of goods sold | 380,465 | 331,608 | 311,503 | ||||||||
| Gross profit (loss) | 237,324 | 126,161 | (51,052 | ) | |||||||
| Operating expenses: | |||||||||||
| Research and development | 151,762 | 132,603 | 111,053 | ||||||||
| Selling, general and administrative | 80,222 | 50,178 | 51,267 | ||||||||
| Amortization of intangible assets | 4,386 | 12,929 | 15,267 | ||||||||
| Purchased in-process research and development | -- | 65,500 | -- | ||||||||
| Special charges | 34,493 | 116,321 | 88,876 | ||||||||
| Total operating expenses | 270,863 | 377,531 | 266,463 | ||||||||
| Operating loss | (33,539 | ) | (251,370 | ) | (317,515 | ) | |||||
| Interest expense | (21,403 | ) | (4,227 | ) | -- | ||||||
| Other income (expense), net | 1,317 | (56 | ) | 210 | |||||||
| Loss before income taxes and cumulative effect of change in accounting principle | (53,625 | ) | (255,653 | ) | (317,305 | ) | |||||
| Provision (benefit) for income taxes | 652 | (19,589 | ) | 1,619 | |||||||
| Loss before cumulative effect of change in accounting principle | (54,277 | ) | (236,064 | ) | (318,924 | ) | |||||
| Cumulative effect of change in accounting principle, net of tax | (397,139 | ) | -- | -- | |||||||
| Net loss | $ | (451,416 | ) | $ | (236,064 | ) | $ | (318,924 | ) | ||
| Per share information: | |||||||||||
| Loss before cumulative effect of change in accounting principle, basic and diluted (1) | $ | (0.39 | ) | $ | (1.72 | ) | |||||
| Cumulative effect of change in accounting principle, net of tax, basic and diluted (1) | (2.85 | ) | -- | ||||||||
| Net loss, basic and diluted (1) | $ | (3.24 | ) | $ | (1.72 | ) | |||||
| Number of weighted-average shares used in per share computations, basic and diluted (1) | 139,376 | 137,416 | |||||||||
(1) SeeNote 2 to the consolidated financial statements
| As of | ||||||||
| September 29, | September 30, | |||||||
| 2006 | 2005 | |||||||
ASSETS | ||||||||
Current assets: | ||||||||
| Cash and cash equivalents | $ | 136,749 | $ | 116,522 | ||||
| Short-term investments | 28,150 | 113,325 | ||||||
| Restricted cash | 6,302 | 6,013 | ||||||
| Receivables, net of allowance for doubtful accounts of $37,022 and $5,815, respectively | 158,798 | 171,454 | ||||||
| Inventories | 81,529 | 77,400 | ||||||
| Other current assets | 9,315 | 11,268 | ||||||
| Total current assets | 420,843 | 495,982 | ||||||
| Property, plant and equipment, less accumulated depreciation and amortization of $250,195 and $260,731, respectively | 150,383 | 144,208 | ||||||
| Property held for sale | — | 6,630 | ||||||
| Goodwill | 493,389 | 493,389 | ||||||
| Intangible assets, less accumulated amortization of $11,055 and $8,911, respectively | 15,586 | 17,730 | ||||||
| Deferred tax assets | 251 | 16,052 | ||||||
| Other assets | 10,044 | 13,852 | ||||||
| Total assets | $ | 1,090,496 | $ | 1,187,843 | ||||
LIABILITIES AND STOCKHOLDERS’ EQUITY | ||||||||
Current liabilities: | ||||||||
| Short-term debt | $ | 50,000 | $ | 50,000 | ||||
| Accounts payable | 73,071 | 72,276 | ||||||
| Accrued compensation and benefits | 25,297 | 19,679 | ||||||
| Other current liabilities | 27,252 | 16,280 | ||||||
| Total current liabilities | 175,620 | 158,235 | ||||||
| Long-term debt, less current maturities | 179,335 | 230,000 | ||||||
| Other long-term liabilities | 6,448 | 7,044 | ||||||
| Total liabilities | 361,403 | 395,279 | ||||||
| Commitments and contingencies (Note 11 and Note 12) | ||||||||
Stockholders’ equity: | ||||||||
| Preferred stock, no par value: 25,000 shares authorized, no shares issued | — | — | ||||||
| Common stock, $0.25 par value: 525,000 shares authorized; 161,690 shares issued and 161,659 shares outstanding at September 29, 2006 and 158,625 shares issued and outstanding at September 30, 2005 | 40,414 | 39,656 | ||||||
| Additional paid-in capital | 1,351,190 | 1,327,631 | ||||||
| Treasury Stock | (173 | ) | — | |||||
| Accumulated deficit | (661,739 | ) | (573,586 | ) | ||||
| Accumulated other comprehensive loss | (599 | ) | (1,137 | ) | ||||
| Total stockholders’ equity | 729,093 | 792,564 | ||||||
| Total liabilities and stockholders’ equity | $ | 1,090,496 | $ | 1,187,843 | ||||
53
(In thousands)
| Common stock | |||||||||||||||||
|---|---|---|---|---|---|---|---|---|---|---|---|---|---|---|---|---|---|
| Shares | Par value | Additional Paid-in Capital | Conexant's Net Investment | Retained Earnings | Accumulated Other Comprehensive Income (Loss) | Unearned Compensation | |||||||||||
| Balance at September 30, 2000 | -- | -- | -- | 466,468 | -- | (52 | ) | -- | |||||||||
| Net loss | -- | -- | -- | (318,924 | ) | -- | -- | -- | |||||||||
| Foreign currency translation adjustment | -- | -- | -- | -- | -- | (232 | ) | -- | |||||||||
| Contribution of additional | |||||||||||||||||
| assets related to business | -- | -- | -- | 2,058 | -- | -- | -- | ||||||||||
| acquired | |||||||||||||||||
| Net transfers from Conexant | -- | -- | -- | 138,343 | -- | -- | -- | ||||||||||
| Balance at September 30, 2001 | -- | -- | -- | 287,945 | -- | (284 | ) | -- | |||||||||
| Net loss | -- | -- | -- | (66,280 | ) | (170,193 | ) | -- | -- | ||||||||
| Foreign currency translation | |||||||||||||||||
| adjustment | -- | -- | -- | -- | -- | 409 | -- | ||||||||||
| Net transfers from Conexant | -- | -- | -- | 50,404 | -- | -- | -- | ||||||||||
| Dividend (1) | -- | -- | -- | (204,716 | ) | -- | -- | -- | |||||||||
| Recapitalization as a result of purchase accounting under a reverse acquisition | 137,368 | 34,342 | 1,149,965 | (67,353 | ) | -- | (125 | ) | (137 | ) | |||||||
| Issuance of common shares for | |||||||||||||||||
| purchase plans, 401k and stock | |||||||||||||||||
| options | 221 | 55 | 861 | -- | -- | -- | -- | ||||||||||
| Amortization of unearned compensation | -- | -- | -- | -- | -- | -- | 53 | ||||||||||
| Compensation expense | -- | -- | 30 | -- | -- | -- | -- | ||||||||||
| Balance at September 30, 2002 | 137,589 | $34,397 | $ 1,150,856 | $ -- | $(170,193 | ) | $ -- | $(84 | ) | ||||||||
| Net loss | -- | -- | -- | -- | (451,416 | ) | -- | -- | |||||||||
| Issuance of common shares in offering, net of expenses | 9,200 | 2,300 | 99,888 | -- | -- | -- | -- | ||||||||||
| Issuance of common shares for | |||||||||||||||||
| purchase plans, 401k and stock | |||||||||||||||||
| options | 1,769 | 442 | 8,607 | -- | -- | -- | -- | ||||||||||
| Amortization of unearned compensation | -- | -- | -- | -- | -- | -- | 84 | ||||||||||
| Adjustment to recapitalization | |||||||||||||||||
| as a result of purchase | |||||||||||||||||
| accounting under a reverse | |||||||||||||||||
| acquisition (2) | -- | -- | (1,543 | ) | -- | -- | -- | -- | |||||||||
| Minimum pension liability adjustment | -- | -- | -- | -- | -- | (632 | ) | -- | |||||||||
| Issuance of common shares in | |||||||||||||||||
| trademark settlement | 46 | 12 | 457 | -- | -- | -- | -- | ||||||||||
| Balance at September 30, 2003 | 148,604 | $37,151 | $ 1,258,265 | $ -- | $(621,609 | ) | $ (632 | ) | $ -- | ||||||||
|
|
| Fiscal Years Ended | ||||||||||||
| September 29, | September 30, | October 1, | ||||||||||
| 2006 | 2005 | 2004 | ||||||||||
Cash flows from operating activities: | ||||||||||||
| Net income (loss) | $ | (88,152 | ) | $ | 25,611 | $ | 22,412 | |||||
| Adjustments to reconcile net income (loss) to net cash provided by operating activities: | ||||||||||||
| Share-based compensation expense | 14,219 | — | — | |||||||||
| Depreciation | 38,217 | 37,277 | 35,829 | |||||||||
| Charge in lieu of income tax expense | — | 11,104 | 1,022 | |||||||||
| Amortization of intangible assets | 2,144 | 2,354 | 3,043 | |||||||||
| Amortization of deferred financing costs | 1,992 | 1,596 | 2,176 | |||||||||
| Contribution of common shares to Savings and Retirement Plans | 8,064 | 10,437 | 8,162 | |||||||||
| Non-cash restructuring expense | 6,426 | — | — | |||||||||
| Deferred income taxes | 16,547 | 3,253 | 3,055 | |||||||||
| Gain on sales of assets | 73 | 28 | 34 | |||||||||
| Asset impairments | 4,197 | — | 10,853 | |||||||||
| Provision for losses on accounts receivable | 31,206 | 5,127 | 377 | |||||||||
| Changes in assets and liabilities: | ||||||||||||
| Receivables | (18,177 | ) | (18,809 | ) | (13,882 | ) | ||||||
| Inventories | (3,454 | ) | 2,172 | (21,404 | ) | |||||||
| Other assets | (3,395 | ) | (3,706 | ) | 3,794 | |||||||
| Accounts payable | 795 | (1,129 | ) | 23,036 | ||||||||
| Other liabilities | 16,524 | (21,118 | ) | 13,406 | ||||||||
| Net cash provided by operating activities | 27,226 | 54,197 | 91,913 | |||||||||
Cash flows from investing activities: | ||||||||||||
| Capital expenditures | (49,359 | ) | (38,135 | ) | (59,998 | ) | ||||||
| Receipts from property held for sale | 6,567 | — | — | |||||||||
| Sale of short-term investments | 1,094,985 | 1,223,181 | 1,049,082 | |||||||||
| Purchase of short-term investments | (1,009,810 | ) | (1,251,470 | ) | (1,130,128 | ) | ||||||
| Net cash provided by (used in) investing activities | 42,383 | (66,424 | ) | (141,044 | ) | |||||||
Cash flows from financing activities: | ||||||||||||
| Proceeds from short-term debt | — | — | 8,290 | |||||||||
| Payments on long-term debt | (50,665 | ) | — | 29 | ||||||||
| Restricted cash | (290 | ) | — | (701 | ) | |||||||
| Repurchase of treasury stock | (173 | ) | — | — | ||||||||
| Exercise of stock options | 1,746 | 5,244 | 3,512 | |||||||||
| Net cash provided by (used in) financing activities | (49,382 | ) | 5,244 | 11,130 | ||||||||
| Net increase (decrease) in cash and cash equivalents | 20,227 | (6,983 | ) | (38,001 | ) | |||||||
| Cash and cash equivalents at beginning of period | 116,522 | 123,505 | 161,506 | |||||||||
| Cash and cash equivalents at end of period | $ | 136,749 | $ | 116,522 | $ | 123,505 | ||||||
Supplemental cash flow disclosures: | ||||||||||||
| Taxes paid | $ | 2,023 | $ | 1,221 | $ | 2,206 | ||||||
| Interest paid | $ | 13,787 | $ | 13,030 | $ | 15,845 | ||||||
Supplemental disclosure of non-cash activities: | ||||||||||||
| Senior Notes conversion | $ | — | $ | — | $ | 45,000 | ||||||
| Non-cash proceeds received from non-monetary exchange | $ | 760 | $ | — | $ | — | ||||||
54
(In thousands)
| Years Ended September 30, | |||||||||||
|---|---|---|---|---|---|---|---|---|---|---|---|
| 2003 | 2002 | 2001 | |||||||||
| Cash flows from operating activities: | |||||||||||
| Net loss | $ | (451,416 | ) | $ | (236,064 | ) | $ | (318,924 | ) | ||
| Adjustments to reconcile net loss to net cash used in | |||||||||||
| operating activities: | |||||||||||
| Depreciation | 36,941 | 47,695 | 58,708 | ||||||||
| Amortization | 4,386 | 12,931 | 15,267 | ||||||||
| Amortization of deferred financing costs | 2,123 | -- | -- | ||||||||
| Contribution of common shares to Savings and Retirement Plan | 7,482 | 874 | -- | ||||||||
| Gain on sales of assets | 1,802 | 209 | 80 | ||||||||
| Deferred income taxes | 351 | (23,117 | ) | -- | |||||||
| Purchased in-process research and development | -- | 65,500 | -- | ||||||||
| Asset impairments | 425,407 | 111,817 | 86,209 | ||||||||
| Provision for losses (recoveries) on accounts receivable | 1,156 | (512 | ) | (468 | ) | ||||||
| Inventory provisions | 9,577 | 6,225 | 60,978 | ||||||||
| Changes in assets and liabilities, net of acquisition: | |||||||||||
| Receivables | (50,998 | ) | (85,590 | ) | 27,276 | ||||||
| Inventories | (12,102 | ) | (7,934 | ) | (8,378 | ) | |||||
| Other assets | 6,369 | (8,292 | ) | (1,604 | ) | ||||||
| Accounts payable | 5,019 | 36,635 | (2,547 | ) | |||||||
| Other liabilities | (58,149 | ) | (19,471 | ) | (6,003 | ) | |||||
| Net cash provided by (used in) operating activities | (72,052 | ) | (99,094 | ) | (89,406 | ) | |||||
| Cash flows from investing activities: | |||||||||||
| Capital expenditures | (40,294 | ) | (29,412 | ) | (51,118 | ) | |||||
| Cash, cash equivalents and short-term investments of acquired | |||||||||||
| business | -- | 67,102 | -- | ||||||||
| Sale of short-term investments | -- | 35,422 | -- | ||||||||
| Purchase of short-term investments | (3,988 | ) | -- | -- | |||||||
| Dividend to Conexant | -- | (3,070 | ) | -- | |||||||
| Net cash provided by (used in) investing activities | (44,282 | ) | 70,042 | (51,118 | ) | ||||||
| Cash flows from financing activities: | |||||||||||
| Proceeds from unsecured notes offering | 230,000 | -- | -- | ||||||||
| Net proceeds from common stock public offering | 102,188 | -- | -- | ||||||||
| Deferred financing costs | (10,474 | ) | -- | -- | |||||||
| Restricted cash | (5,312 | ) | -- | -- | |||||||
| Net transfers from Conexant | -- | 50,404 | 138,343 | ||||||||
| Proceeds from short-term debt | 41,652 | 30,000 | -- | ||||||||
| Payments on long-term debt | (135,139 | ) | (34 | ) | -- | ||||||
| Exercise of stock options | 1,567 | 42 | -- | ||||||||
| Net cash provided by (used in) financing activities | 224,482 | 80,412 | 138,343 | ||||||||
| Net increase (decrease) in cash and cash equivalents | 108,148 | 51,360 | (2,181 | ) | |||||||
| Cash and cash equivalents at beginning of period | 53,358 | 1,998 | 4,179 | ||||||||
| Cash and cash equivalents at end of period | $ | 161,506 | $ | 53,358 | $ | 1,998 | |||||
| Supplemental cash flow disclosures: | |||||||||||
| Taxes paid | $ | 517 | $ | 832 | $ | -- | |||||
| Interest paid | $ | 21,061 | $ | 323 | $ | -- | |||||
| Supplemental disclosure of non-cash activities: | |||||||||||
| Acquisition of Alpha Industries, Inc. | $ | -- | $ | 1,183,105 | $ | -- | |||||
| Dividend to Conexant | $ | -- | $ | 201,646 | $ | ||||||
| Conexant debt refinancing | $ | 45,000 | $ | -- | $ | -- | |||||
| Stock issued for trademark settlement | $ | 469 | $ | -- | $ | -- | |||||
| Par value | Accumulated | |||||||||||||||||||||||||||||||
| Shares of | of | Shares of | Value of | Additional | Other | Total | ||||||||||||||||||||||||||
| Common | Common | Treasury | Treasury | Paid-in | Accumulated | Comprehensive | Stockholders’ | |||||||||||||||||||||||||
| Stock | Stock | Stock | Stock | Capital | Deficit | Loss | Equity | |||||||||||||||||||||||||
| Balance at September 30, 2003 | 148,604 | 37,151 | — | — | 1,258,265 | (621,609 | ) | (632 | ) | 673,175 | ||||||||||||||||||||||
| Net income | — | — | — | — | — | 22,412 | — | 22,412 | ||||||||||||||||||||||||
| Pension adjustment | — | — | — | — | — | — | (154 | ) | (154 | ) | ||||||||||||||||||||||
| Other comprehensive loss | — | — | — | — | — | — | (154 | ) | (154 | ) | ||||||||||||||||||||||
| Comprehensive income | — | — | — | — | — | — | — | 22,258 | ||||||||||||||||||||||||
| Issuance of common shares for stock purchase plans, 401(k) and stock option plans | 1,690 | 423 | — | — | 11,251 | — | — | 11,674 | ||||||||||||||||||||||||
| Issuance of common shares in conversion of senior notes, net of expenses | 5,718 | 1,429 | — | — | 42,908 | — | — | 44,337 | ||||||||||||||||||||||||
| Adjustment to issuance of common shares in offering, net of expenses | — | — | — | — | 179 | — | — | 179 | ||||||||||||||||||||||||
| Balance at October 1, 2004 | 156,012 | 39,003 | — | — | 1,312,603 | (599,197 | ) | (786 | ) | 751,623 | ||||||||||||||||||||||
| Net income | — | — | — | — | — | 25,611 | — | 25,611 | ||||||||||||||||||||||||
| Pension adjustment | — | — | — | — | — | — | (351 | ) | (351 | ) | ||||||||||||||||||||||
| Other comprehensive loss | — | — | — | — | — | — | (351 | ) | (351 | ) | ||||||||||||||||||||||
| Comprehensive income | — | — | — | — | — | — | — | 25,260 | ||||||||||||||||||||||||
| Issuance of common shares for stock purchase plans, 401(k) and stock option plans | 2,452 | 613 | — | — | 14,932 | — | — | 15,545 | ||||||||||||||||||||||||
| Issuance and expense of restricted stock and acceleration of options | 161 | 40 | — | — | 96 | — | — | 136 | ||||||||||||||||||||||||
| Balance at September 30, 2005 | 158,625 | $ | 39,656 | — | $ | — | $ | 1,327,631 | $ | (573,586 | ) | $ | (1,137 | ) | $ | 792,564 | ||||||||||||||||
| Net loss | — | — | — | — | — | (88,153 | ) | — | (88,153 | ) | ||||||||||||||||||||||
| Pension adjustment | — | — | — | — | — | — | 538 | 538 | ||||||||||||||||||||||||
| Other comprehensive income | — | — | — | — | — | — | 538 | 538 | ||||||||||||||||||||||||
| Comprehensive loss | — | — | — | — | — | — | — | (87,615 | ) | |||||||||||||||||||||||
| Issuance and expense of common shares for stock purchase plans, 401(k) and stock option plans | 1,982 | 496 | — | — | 22,528 | — | — | 23,024 | ||||||||||||||||||||||||
| Issuance and expense of common shares for restricted stock and performance shares | 1,083 | 270 | — | — | 1,023 | — | — | 1,293 | ||||||||||||||||||||||||
| Shares withheld for taxes | (31 | ) | (8 | ) | 31 | (173 | ) | 8 | — | — | (173 | ) | ||||||||||||||||||||
| Balance at September 29, 2006 | 161,659 | $ | 40,414 | 31 | $ | (173 | ) | $ | 1,351,190 | $ | (661,739 | ) | $ | (599 | ) | $ | 729,093 | |||||||||||||||
The accompanying notes are an integral part of these consolidated financial statements.55
| NOTE 1. | DESCRIPTION OF BUSINESS AND BASIS OF PRESENTATION |
OnAlpha Industries, Inc. (“Alpha”) on June 25, 2002, pursuant to an Agreement and Plan of Reorganization, dated as of December 16, 2001, asand amended as of April 12, 2002, by and among Alpha, Industries, Inc. (“Alpha”), Conexant Systems, Inc. (“Conexant”) and Washington Sub, Inc. (“Washington”), a wholly ownedwholly-owned subsidiary of Conexant to which Conexant spun off its wireless communications business, including its gallium arsenide wafer fabrication facility located in Newbury Park, California, but excluding certain assets and liabilities,business. Pursuant to the Merger, Washington merged with and into Alpha, with Alpha as the surviving entity (the “Merger”). Followingcorporation. Immediately following the Merger, Alpha changed its corporate name to Skyworks Solutions, Inc.
Immediately following completion of the Merger, the Company purchased Conexant’s semiconductor assembly module manufacturing and test facility located in Mexicali, Mexico and certain related operations (“Mexicali(the “Mexicali Operations”) for $150 million. For financial accounting purposes, the sale of the Mexicali Operations by Conexant to Skyworks Solutions was treated as if Conexant had contributed the Mexicali Operations to Washington as part of the spin-off, and the $150 million purchase price was treated as a return of capital to Conexant. For purposes of these financial statements, the. The Washington business and the Mexicali Operations are collectively referred to as Washington/“Washington/Mexicali. References” Shortly thereafter, Alpha, which was incorporated in Delaware in 1962, changed its corporate name to Skyworks Solutions, Inc.
| NOTE 2. | SUMMARY OF SIGNIFICANT ACCOUNTING POLICIES |
56
57
58
59
time of valuation. Actual results may differ substantially from these assumptions. These differences may significantly impact future pension or retiree medical expenses.
60
The financial statements prior to the Merger were prepared using Conexant’s historical basis in the assets and liabilities and the historical operating results of Washington/Mexicali during each respective period. Management believes the assumptions underlying the financial statements are reasonable. However, there can be no assurance that the financial information included herein reflects the combined assets, liabilities, operating results and cash flows of the Company in the future or what they would have been had Washington/Mexicali been a separate stand-alone entity and independent of Conexant during the periods presented.
Conexant used a centralized approach to cash management and the financing of its operations. Cash deposits from Washington/Mexicali were transferred to Conexant on a regular basis and were netted against Conexant’s net investment. As a result, none of Conexant’s cash, cash equivalents, marketable securities or debt was allocated to Washington/Mexicali in the financial statements. Cash and cash equivalentscomprehensive income (loss) presented in the financial statements priorconsists of adjustments to the acquisition, representedCompany’s minimum pension liability as follows (in thousands):
| Accumulated | ||||||||
| Other | ||||||||
| Pension | Comprehensive | |||||||
| Adjustments | Loss | |||||||
| Balance as of October 1, 2004 | $ | (786 | ) | $ | (786 | ) | ||
| Change in period | (351 | ) | (351 | ) | ||||
| Balance as of September 30, 2005 | (1,137 | ) | (1,137 | ) | ||||
| Change in period | 538 | 538 | ||||||
| Balance as of September 29, 2006 | $ | (599 | ) | $ | (599 | ) | ||
61
Historically, Conexant provided financingor financial position.
The financial statements for the periods prior to the Merger also include allocations of certain Conexant operating expenses for research and development, legal, accounting, treasury, human resources, real estate, information systems, distribution, customer service, sales, marketing, engineering and other corporate services provided by Conexant, including executive salaries and other costs. The operating expense allocations have been determined on bases that management considered to be reasonable reflectionsend of the utilizationemployer’s fiscal year; and (c) recognize changes in the funded status of services provideda defined benefit postretirement plan in the year in which the changes occur. Those changes will be reported in other comprehensive income. The requirement to orrecognize the funded status of a benefit received by, Washington/Mexicali. Management believes thatplan and the expenses allocated to Washington/Mexicalidisclosure requirements are representativeeffective as of the operating expenses that would have been incurred had Washington/Mexicali operatedend of fiscal years ending after December 15, 2006. The requirement to measure plan assets and benefit obligations as an independent company. Sinceof the date of the Merger, theemployer’s fiscal year-end statement of financial position is effective for fiscal years ending after December 15, 2008, although earlier adoption is permitted. The Company has been performing these functions using its own resourcesnot yet determined the impact that SFAS 158 will have on our results from operations or purchased services, including certain services obtained from Conexant pursuant tofinancial position.
NOTE 2. SUMMARY OF SIGNIFICANT ACCOUNTING POLICIES
Principles of Consolidation:
Fiscal Year:
Use of Estimates:
Revenue Recognition:
Cash and Cash Equivalents:
Short-term Investments:
Restricted Cash:
Accounts Receivable:
Inventories:
Property, Plant and Equipment:
Property Held for Sale:
Valuation of long-lived assets:
Goodwill and Intangible Assets:
Deferred Financing Costs:
Income Taxes:
Research and Development Expenditures:
Product Warranties:
| NOTE 3. | MARKETABLE SECURITIES | ||
| Gross | Gross | |||||||||||||||
| Amortized | Unrealized | Unrealized | Market | |||||||||||||
| Short term available for sale securities: | Cost | Gains | Losses | Value | ||||||||||||
| Auction rate securities | $ | 28,150 | $ | — | $ | — | $ | 28,150 | ||||||||
| Total marketable securities | $ | 28,150 | $ | — | $ | — | $ | 28,150 | ||||||||
62
| Gross | Gross | |||||||||||||||
| Amortized | Unrealized | Unrealized | Market | |||||||||||||
| Short term available for sale securities: | Cost | Gains | Losses | Value | ||||||||||||
| Auction rate securities | $ | 113,325 | $ | — | $ | — | $ | 113,325 | ||||||||
| Total marketable securities | $ | 113,325 | $ | — | $ | — | $ | 113,325 | ||||||||
| INVENTORY |
Foreign Currency Translation and Remeasurement:
Stock Option Plans:
| Years Ended September 30, | |||||
|---|---|---|---|---|---|
| (In thousands, except per share amounts) | 2003 | 2002 | |||
| Reported net loss | $ (451,416 | ) | $ (236,064 | ) | |
| Total stock-based employee compensation expense | |||||
| determined under fair value based method for | |||||
| all awards, net of related tax | |||||
| effects | 4,923 | 285 | |||
| Adjusted net loss | $ (456,339 | ) | $ (236,349 | ) | |
| Per share information: | |||||
| Basic and diluted: | |||||
| Reported net loss | $ (3.24) | $ (1.72 | ) | ||
| Total stock-based employee compensation | |||||
| expense determined under fair value based | |||||
| method for all awards, net of related tax | |||||
| effects | (0.03) | -- | |||
| Adjusted net loss | $ (3.27) | $ (1.72 | ) | ||
| 2003 | 2002 | ||||
|---|---|---|---|---|---|
| Expected volatility | 95 | % | 70 | % | |
| Risk free interest rate | 2.5 | % | 2.2 | % | |
| Dividend yield | -- | -- | |||
| Expected option life (years) | 4.5 | 4.5 | |||
| Weighted average fair value of options granted | $ 2.57 | $ 1.87 | |||
Earnings Per Share:
Pensions and Retiree Medical Benefits:
Comprehensive Income (Loss):
An analysis of other comprehensive income (loss) follows (in thousands):
| Foreign Currency Translation | Pension Adjustments | Accumulated Other Comprehensive Income (Loss) | |||||
|---|---|---|---|---|---|---|---|
| Balance as of September 30, 2001 | $ (284 | ) | $ -- | $ (284 | ) | ||
| Change in period | 409 | -- | 409 | ||||
| Balance retained by Conexant | (125 | ) | -- | (125 | ) | ||
| Balance as of September 30, 2002 | -- | -- | -- | ||||
| Change in period | -- | (632 | ) | (632 | ) | ||
| Balance as of September 30, 2003 | $ -- | $ (632 | ) | $ (632 | ) | ||
Reclassifications:
Recent Accounting Pronouncements:
NOTE 3. BUSINESS COMBINATIONS
Merger with Conexant Systems, Inc.‘s Wireless Business
The total purchase price was valued at approximately $1.2 billion and is summarized as follows:
The purchase price was allocated as follows:
| (in thousands, except per share data) | Years Ended September 30, | ||||
|---|---|---|---|---|---|
| 2002 | 2001 | ||||
| Net revenue | $ 543,091 | $ 458,352 | |||
| Net loss | $(301,684 | ) | $(328,981 | ) | |
| Net loss per share (basic and diluted) (1) | $ (2.20 | ) | |||
(1) SeeNote 2 to the consolidated financial statements
NOTE 4. INVENTORY
| September 30, | |||||
|---|---|---|---|---|---|
| 2003 | 2002 | ||||
| Raw materials | $ 8,475 | $13,496 | |||
| Work-in-process | 35,797 | 27,764 | |||
| Finished goods | 13,896 | 14,383 | |||
| $58,168 | $55,643 | ||||
| As of | ||||||||
| September 29, | September 30, | |||||||
| 2006 | 2005 | |||||||
| Raw materials | $ | 9,476 | $ | 8,080 | ||||
| Work-in-process | 52,097 | 49,329 | ||||||
| Finished goods | 19,956 | 19,991 | ||||||
| $ | 81,529 | $ | 77,400 | |||||
| NOTE 5. |
NOTE 5. PROPERTY, PLANT AND EQUIPMENT
| September 30, | |||||
|---|---|---|---|---|---|
| 2003 | 2002 | ||||
| Land | $ 9,423 | $ 11,578 | |||
| Land and leasehold improvements | 3,410 | 6,583 | |||
| Buildings | 58,340 | 60,386 | |||
| Machinery and equipment | 249,124 | 250,500 | |||
| Construction in progress | 33,739 | 17,162 | |||
| 354,035 | 346,209 | ||||
| Accumulated depreciation and amortization | (232,480 | ) | (202,436 | ) | |
| $ 121,556 | $ 143,773 | ||||
NOTE 6. GOODWILL AND INTANGIBLE ASSETS
| As of | ||||||||
| September 29, | September 30, | |||||||
| 2006 | 2005 | |||||||
| Land | $ | 9,423 | $ | 9,423 | ||||
| Land and leasehold improvements | 3,990 | 4,284 | ||||||
| Buildings | 55,983 | 59,586 | ||||||
| Machinery and equipment | 308,618 | 317,334 | ||||||
| Construction in progress | 22,564 | 14,312 | ||||||
| 400,578 | 404,939 | |||||||
| Accumulated depreciation and amortization | (250,195 | ) | (260,731 | ) | ||||
| $ | 150,383 | $ | 144,208 | |||||
| NOTE 6. |
| As of | ||||||||||||||||||||||||||||
| September 29, 2006 | September 30, 2005 | |||||||||||||||||||||||||||
| Weighted | ||||||||||||||||||||||||||||
| Average | Gross | Net | Gross | Net | ||||||||||||||||||||||||
| Amortization | Carrying | Accumulated | Carrying | Carrying | Accumulated | Carrying | ||||||||||||||||||||||
| Period (Years) | Amount | Amortization | Amount | Amount | Amortization | Amount | ||||||||||||||||||||||
| Goodwill | $ | 493,389 | $ | — | $ | 493,389 | $ | 493,389 | $ | — | $ | 493,389 | ||||||||||||||||
| Amortized intangible assets | ||||||||||||||||||||||||||||
| Developed technology | 10 | $ | 10,550 | $ | (5,525 | ) | $ | 5,025 | $ | 10,550 | $ | (4,651 | ) | $ | 5,899 | |||||||||||||
| Customer relationships | 10 | 12,700 | (5,408 | ) | 7,292 | 12,700 | (4,138 | ) | 8,562 | |||||||||||||||||||
| Other | 3 | 122 | (122 | ) | — | 122 | (122 | ) | — | |||||||||||||||||||
| 23,372 | (11,055 | ) | 12,317 | 23,372 | (8,911 | ) | 14,461 | |||||||||||||||||||||
63
| September 30, 2003 | September 30, 2002 | ||||||||||||||
|---|---|---|---|---|---|---|---|---|---|---|---|---|---|---|---|
| Weighted Average Amortization Period (Years) | Gross Carrying Amount | Accumulated Amortization | Net Carrying Amount | Gross Carrying Amount | Accumulated Amortization | Net Carrying Amount | |||||||||
| Goodwill | $ 505,514 | $ -- | $ 505,514 | $ 905,219 | $ -- | $905,219 | |||||||||
| Amortized intangible assets: | |||||||||||||||
| Developed technology | 10 | 10,550 | (2,806 | ) | 7,744 | 21,260 | (576 | ) | 20,684 | ||||||
| Customer relationships | 10 | 12,700 | (1,598 | ) | 11,102 | 12,700 | (328 | ) | 12,372 | ||||||
| Other | 3 | 122 | (56 | ) | 66 | 122 | (11 | ) | 111 | ||||||
| 23,372 | (4,460 | ) | 18,912 | 34,082 | (915 | ) | 33,167 | ||||||||
| Unamortized intangible assets: | |||||||||||||||
| Trademarks | 3,269 | -- | 3,269 | 2,300 | -- | 2,300 | |||||||||
| 10 | $ 532,155 | $ (4,460 | ) | $ 527,695 | $ 941,601 | $ (915 | ) | $940,686 | |||||||
| As of | ||||||||||||||||||||||||||||
| September 29, 2006 | September 30, 2005 | |||||||||||||||||||||||||||
| Weighted | ||||||||||||||||||||||||||||
| Average | Gross | Net | Gross | Net | ||||||||||||||||||||||||
| Amortization | Carrying | Accumulated | Carrying | Carrying | Accumulated | Carrying | ||||||||||||||||||||||
| Period (Years) | Amount | Amortization | Amount | Amount | Amortization | Amount | ||||||||||||||||||||||
| Unamortized intangible assets | ||||||||||||||||||||||||||||
| Trademarks | 3,269 | — | 3,269 | 3,269 | — | 3,269 | ||||||||||||||||||||||
| Total intangible assets | $ | 26,641 | $ | (11,055 | ) | $ | 15,586 | $ | 26,641 | $ | (8,911 | ) | $ | 17,730 | ||||||||||||||
| Years Ended September 30, | |||||||
|---|---|---|---|---|---|---|---|
| 2003 | 2002 | 2001 | |||||
| Amortization expense | $ 3,545 | $ 12,687 | $ 15,267 | ||||
| Fiscal Years Ended | ||||||||||||
| September 29, | September 30, | October 1, | ||||||||||
| 2006 | 2005 | 2004 | ||||||||||
| Amortization expense | $ | 2,144 | $ | 2,165 | $ | 2,286 | ||||||
| Goodwill | Developed Technology | Customer Relationships | Trademarks | Other | Total | ||||||||
|---|---|---|---|---|---|---|---|---|---|---|---|---|---|
| Balance as of September 30, 2001 | $ 71,412 | $ 5,995 | $ -- | $ -- | $ 793 | $ 78,200 | |||||||
| Additions (deductions) during year | 905,219 | 21,260 | 12,700 | 2,300 | 122 | 941,601 | |||||||
| Impairment losses | (71,412 | ) | (5,995 | ) | -- | -- | (793 | ) | (78,200 | ) | |||
| Balance as of September 30, 2002 | 905,219 | 21,260 | 12,700 | 2,300 | 122 | 941,601 | |||||||
| Additions (deductions) during year | (2,566 | ) | -- | -- | 969 | -- | (1,597 | ) | |||||
| Transitional impairment loss | (397,139 | ) | -- | -- | -- | -- | (397,139 | ) | |||||
| Impairment losses | (10,710 | ) | -- | -- | -- | -- | (10,710 | ) | |||||
| Balance as of September 30, 2003 | $ 505,514 | $ 10,550 | $12,700 | $3,269 | $ 122 | $ 532,155 | |||||||
| (In thousands, except per share amounts) | Years Ended September 30, | ||||
|---|---|---|---|---|---|
| 2002 | 2001 | ||||
| Reported net loss | $ (236,064 | ) | $ (318,924 | ) | |
| Goodwill amortization, net of tax | 10,699 | 13,909 | |||
| Adjusted net loss | $ (225,365 | ) | $ (305,015 | ) | |
| Per share information (1): | |||||
| Basic and diluted: | |||||
| Reported net loss | $ (1.72) | ||||
| Goodwill amortization, net of tax | 0.08 | ||||
| Adjusted net loss | $ (1.64) | ||||
(1) SeeNote 2
| Goodwill and Intangible Assets | ||||||||||||||||||||||||
| Developed | Customer | |||||||||||||||||||||||
| Goodwill | Technology | Relationships | Trademarks | Other | Total | |||||||||||||||||||
| Balance as of October 1, 2004 | $ | 504,493 | $ | 10,550 | $ | 12,700 | $ | 3,269 | $ | 122 | $ | 531,134 | ||||||||||||
| Deductions during year | (11,104 | ) | — | — | — | — | (11,104 | ) | ||||||||||||||||
| Balance as of September 30, 2005 | $ | 493,389 | $ | 10,550 | $ | 12,700 | $ | 3,269 | $ | 122 | $ | 520,030 | ||||||||||||
| Deductions during year | — | — | — | — | — | — | ||||||||||||||||||
| Balance as of September 29, 2006 | $ | 493,389 | $ | 10,550 | $ | 12,700 | $ | 3,269 | $ | 122 | $ | 520,030 | ||||||||||||
utilization of deferred tax assets for which no tax benefit was recognized as of the date of the Merger. The remaining pre-Merger deferred tax assets that could reduce goodwill in future periods are $31.9 million as of September 29, 2006.
| 2004 | 2005 | 2006 | 2007 | 2008 | |||||||
|---|---|---|---|---|---|---|---|---|---|---|---|
| Amortization expense | $ 2,285 | $ 2,161 | $ 2,144 | $ 2,144 | $ 2,144 | ||||||
NOTE 7. OTHER CURRENT LIABILITIES
Other current liabilities consist
| 2007 | 2008 | 2009 | 2010 | 2011 | ||||||||||||||||
| Amortization expense | $ | 2,144 | $ | 2,144 | $ | 2,144 | $ | 2,144 | $ | 2,144 | ||||||||||
| NOTE 7. | BORROWING ARRANGEMENTS |
| Fiscal Years Ended | ||||||||
| September 29, | September 30, | |||||||
| 2006 | 2005 | |||||||
| Junior notes | $ | 179,335 | $ | 230,000 | ||||
| Less-current maturities | — | — | ||||||
| $ | 179,335 | $ | 230,000 | |||||
64
| September 30, | |||||
|---|---|---|---|---|---|
| 2003 | 2002 | ||||
| Product warranty accrual | $ 6,131 | $13,372 | |||
| Accrued merger expenses | 452 | 42,764 | |||
| Other | 21,220 | 28,427 | |||
| $27,803 | $84,563 | ||||
NOTE 8. BORROWING ARRANGEMENTS
LONG-TERM
| Fiscal Year | ||||
| 2007 | — | |||
| 2008 | 179,335 | |||
| $ | 179,335 | |||
| NOTE 8. | INCOME TAXES |
| Fiscal Years Ended | ||||||||||||
| September 29, | September 30, | October 1, | ||||||||||
| 2006 | 2005 | 2004 | ||||||||||
| United States | $ | (87,169 | ) | $ | 23,885 | $ | 15,029 | |||||
| Foreign | 14,395 | 17,104 | 11,367 | |||||||||
| $ | (72,774 | ) | $ | 40,989 | $ | 26,396 | ||||||
| Fiscal Years Ended | ||||||||||||
| September 29, | September 30, | October 1, | ||||||||||
| 2006 | 2005 | 2004 | ||||||||||
| Current tax expense (benefit): | ||||||||||||
| Federal | $ | (52 | ) | $ | 367 | $ | — | |||||
| State | — | (1,032 | ) | (1,040 | ) | |||||||
| Foreign | 438 | 1,178 | 837 | |||||||||
| 386 | 513 | (203 | ) | |||||||||
| Deferred tax expense: | ||||||||||||
| Federal | — | — | — | |||||||||
| State | — | — | — | |||||||||
| Foreign | 14,992 | 3,761 | 3,165 | |||||||||
| 14,992 | 3,761 | 3,165 | ||||||||||
| Charge in lieu of tax expense | — | 11,104 | 1,022 | |||||||||
| Provision for income taxes | $ | 15,378 | $ | 15,378 | $ | 3,984 | ||||||
| Fiscal Years Ended | ||||||||||||
| September 29, | September 30, | October 1, | ||||||||||
| 2006 | 2005 | 2004 | ||||||||||
| Tax (benefit) expense at United States statutory rate | $ | (25,471 | ) | $ | 14,346 | $ | 9,239 | |||||
65
| Fiscal Years Ended | ||||||||||||
| September 29, | September 30, | October 1, | ||||||||||
| 2006 | 2005 | 2004 | ||||||||||
| Foreign tax rate difference | 10,391 | (1,048 | ) | 23 | ||||||||
| Deemed dividend from foreign subsidiary | — | 8,956 | — | |||||||||
| Nondeductible interest expense | — | — | 1,162 | |||||||||
| Research and development credits | (1,500 | ) | (5,000 | ) | (4,600 | ) | ||||||
| State income taxes | — | (1,032 | ) | (1,040 | ) | |||||||
| Change in valuation allowance | 31,261 | (13,436 | ) | (2,466 | ) | |||||||
| Charge in lieu of tax expense | — | 11,104 | 1,022 | |||||||||
| Other, net | 697 | 1,488 | 644 | |||||||||
| Provision for income taxes | $ | 15,378 | $ | 15,378 | $ | 3,984 | ||||||
| Fiscal Years Ended | ||||||||
| September 29, | September 30, | |||||||
| 2006 | 2005 | |||||||
| Current: | ||||||||
| Inventories | $ | 10,550 | $ | 4,920 | ||||
| Bad debts | 13,431 | 2,004 | ||||||
| Accrued compensation and benefits | 4,242 | 2,919 | ||||||
| Product returns, allowances and warranty | 1,648 | 1,247 | ||||||
| Restructuring | 7,845 | 393 | ||||||
| Prepaid insurance | (772 | ) | (818 | ) | ||||
| Other — net | (535 | ) | 1,085 | |||||
| Current deferred tax assets | 36,409 | 11,750 | ||||||
| Less valuation allowance | (36,070 | ) | (10,665 | ) | ||||
| Net current deferred tax assets | 339 | 1,085 | ||||||
| Long-term: | ||||||||
| Property, plant and equipment | 9,859 | 18,474 | ||||||
| Intangible assets | 7,439 | 7,406 | ||||||
| Retirement benefits and deferred compensation | 5,712 | 1,183 | ||||||
| Net operating loss carryforwards | 62,768 | 65,936 | ||||||
| Federal tax credits | 23,934 | 21,399 | ||||||
| State investment credits | 5,560 | 4,419 | ||||||
| Restructuring | — | 1,506 | ||||||
| Other — net | 3,733 | 1,136 | ||||||
| Long-term deferred tax assets | 119,005 | 121,459 | ||||||
| Less valuation allowance | (118,755 | ) | (105,408 | ) | ||||
| Net long-term deferred tax assets | 250 | 16,051 | ||||||
| Total deferred tax assets | $ | 589 | $ | 17,136 | ||||
66
67
| NOTE 9. | STOCKHOLDERS’ EQUITY |
68
| – | the 1986 Long-Term Incentive Plan, | |
| the |
| September 30, | |||||
|---|---|---|---|---|---|
| 2003 | 2002 | ||||
| Junior notes | $230,000 | $ -- | |||
| Senior notes | 45,000 | -- | |||
| Conexant Mexicali note | -- | 150,000 | |||
| Conexant revolving credit line used | -- | 30,000 | |||
| CDBG Grant | 29 | 168 | |||
| 275,029 | 180,168 | ||||
| Less - current maturities | 29 | 129 | |||
| $275,000 | $180,039 | ||||
| the |
| the |
| the |
| the Directors’ 2001 Stock Option Plan |
| Fiscal Year | |||
|---|---|---|---|
| 2004 | $ 29 | ||
| 2005 | 45,000 | ||
| 2006 | -- | ||
| 2007 | -- | ||
| 2008 | 230,000 | ||
| $275,029 | |||
SHORT-TERM DEBT
| the |
NOTE 9. INCOME TAXES
| the |
| Years Ended September 30, | |||||||
|---|---|---|---|---|---|---|---|
| 2003 | 2002 | 2001 | |||||
| United States | $(59,379 | ) | $(151,214 | ) | $(323,642 | ) | |
| Foreign | 5,754 | (104,439 | ) | 6,337 | |||
| $(53,625 | ) | $(255,653 | ) | $(317,305 | ) | ||
| Years Ended September 30, | |||||||
|---|---|---|---|---|---|---|---|
| 2003 | 2002 | 2001 | |||||
| Current tax expense: | |||||||
| Federal | $ -- | $ -- | $ -- | ||||
| State | -- | -- | -- | ||||
| Foreign | 1,414 | 3,506 | 1,619 | ||||
| 1,414 | 3,506 | 1,619 | |||||
| Deferred tax expense (benefit): | |||||||
| Federal | -- | -- | -- | ||||
| State | -- | -- | -- | ||||
| Foreign | (762 | ) | (23,095 | ) | -- | ||
| (762 | ) | (23,095 | ) | -- | |||
| Net income tax expense (benefit) | $ 652 | $(19,589 | ) | $1,619 | |||
| Years Ended September 30, | |||||||
|---|---|---|---|---|---|---|---|
| 2003 | 2002 | 2001 | |||||
| Tax (benefit) expense at U.S. statutory rate | $ (18,769 | ) | $ (89,479 | ) | $ (111,057 | ) | |
| Foreign tax rate difference | (1,362 | ) | 3,529 | (599 | ) | ||
| Nondeductible amortization of intangible assets | -- | 16,151 | 5,099 | ||||
| Nondeductible in-process research and development | -- | 22,925 | -- | ||||
| Nondeductible interest expense | 2,113 | -- | -- | ||||
| Pre-distribution loss not available to Skyworks | -- | 21,968 | -- | ||||
| Research and development credits | (5,369 | ) | (711 | ) | (4,921 | ) | |
| State income taxes, net of federal benefit | -- | -- | (11,672 | ) | |||
| Change in valuation allowance | 25,168 | 5,947 | 123,466 | ||||
| Other, net | (1,129 | ) | 81 | 1,303 | |||
| $ 652 | $ (19,589 | ) | $ 1,619 | ||||
| September 30, | |||||
|---|---|---|---|---|---|
| 2003 | 2002 | ||||
| Current: | |||||
| Inventories | $ 11,878 | $ 14,352 | |||
| Deferred revenue | -- | 258 | |||
| Accrued compensation and benefits | 1,907 | 1,914 | |||
| Product returns, allowances and warranty | 4,259 | 8,097 | |||
| Restructuring | 1,295 | 5,475 | |||
| Deferred state taxes | -- | -- | |||
| Other - net | 1,494 | 523 | |||
| Current deferred income taxes | 20,833 | 30,619 | |||
| Long-term: | |||||
| Property, plant and equipment | 46,356 | 51,321 | |||
| Intangible assets | 8,837 | (13,029 | ) | ||
| Retirement benefits and deferred compensation | 1,172 | 931 | |||
| Net operating loss carryforwards | 61,049 | 27,003 | |||
| Federal tax credits | 7,798 | 3,904 | |||
| State investment credits | 5,541 | 2,672 | |||
| Restructuring | 2,978 | 2,688 | |||
| Other - net | 855 | (416 | ) | ||
| Long-term deferred income taxes | 134,586 | 75,074 | |||
| Total deferred income taxes | 155,419 | 105,693 | |||
| Valuation allowance | (131,975 | ) | (83,206 | ) | |
| Net deferred tax assets | $ 23,444 | $ 22,487 | |||
NOTE 10. STOCKHOLDERS’ EQUITY
COMMON STOCK
PREFERRED STOCK
STOCK OPTIONS
| Shares | Weighted average exercise price of shares under plan | ||||
|---|---|---|---|---|---|
| Balance outstanding prior to the close of the Merger | -- | $ -- | |||
| Recapitalization as a result of the Merger: | |||||
| Alpha options assumed | 8,277 | 18.97 | |||
| Conexant options assumed | 23,188 | 20.80 | |||
| Balance outstanding at June 25, 2002 | 31,465 | $20.32 | |||
| Granted | 998 | 4.69 | |||
| Exercised | (20 | ) | 2.08 | ||
| Cancelled | (1,111 | ) | 23.35 | ||
| Balance outstanding at September 30, 2002 | 31,332 | $19.73 | |||
| Granted | 6,372 | 5.06 | |||
| Exercised | (496 | ) | 6.37 | ||
| Accepted for exchange | (5,328 | ) | 23.38 | ||
| Cancelled | (6,117 | ) | 20.21 | ||
| Balance outstanding at September 30, 2003 | 25,763 | $15.44 | |||
| Shares | Weighted average exercise price | ||||
|---|---|---|---|---|---|
| 2003 | 15,141 | $ 19 | .03 | ||
| 2002 | 16,080 | $ 19 | .86 | ||
70
71
| (In thousands) | Fiscal Years Ended | |||||||||||
| September 29, | September 30, | October 1, | ||||||||||
| 2006 | 2005 | 2004 | ||||||||||
| Shares of common stock outstanding | 161,659 | 158,625 | 156,012 | |||||||||
| Granted | 3,869 | 4,668 | 7,351 | |||||||||
| Granted for options accepted for exchange | — | 3,377 | ||||||||||
| Cancelled/forfeited | (4,176 | ) | (3,918 | ) | (4,043 | ) | ||||||
| Expired | — | — | — | |||||||||
| Net options granted | (307 | ) | 750 | 6,685 | ||||||||
| Grant dilution (1) | (0.2 | %) | 0.5 | % | 4.3 | % | ||||||
| Exercised | 393 | 935 | 685 | |||||||||
| Exercise dilution (2) | 0.2 | % | 0.6 | % | 0.4 | % | ||||||
| (1) | The |
| Range of exercise prices | Number outstanding | Weighted average remaining contractual life (years) | Weighted average outstanding option price | Options exercisable | Weighted average exercise price | ||||||||
|---|---|---|---|---|---|---|---|---|---|---|---|---|---|
| $0.00 - | $9.99 | 8,731 | 8 | .2 | $ 5 | .44 | 1,636 | $ 5 | .74 | ||||
| $10.00 - | $19.99 | 8,659 | 5 | .2 | $ 15 | .82 | 7,184 | $ 16 | .03 | ||||
| $20.00 - | $29.99 | 6,841 | 6 | .7 | $ 21 | .97 | 5,012 | $ 21 | .87 | ||||
| $30.00 - | 39.99 | 1,224 | 4 | .7 | $ 37 | .57 | 1,073 | $ 38 | .04 | ||||
| $40.00 - | $59.99 | 231 | 6 | .0 | $ 45 | .76 | 174 | $ 45 | .80 | ||||
| $60.00 - | $210.35 | 77 | 4 | .2 | $ 82 | .98 | 62 | $ 83 | .05 | ||||
| 25,763 | 6 | .6 | $ 15 | .44 | 15,141 | $ 19 | .03 | ||||||
STOCK OPTION DISTRIBUTION
| Number outstanding | % of total common stock outstanding | ||||
|---|---|---|---|---|---|
| Stock options held by non-employees (excluding directors) | 14,352 | 9 | .7% | ||
| Stock options held by employees and directors | 11,411 | 7 | .7% | ||
| 25,763 | 17 | .4% | |||
RESTRICTED STOCK AWARDS
| (2) | The |
| Options Outstanding | ||||||||||||
| Shares | Weighted average | |||||||||||
| Available for | exercise price of | |||||||||||
| Grant | Shares | shares under plan | ||||||||||
| Balance outstanding at September 30, 2003 | 14,193 | 25,763 | $ | 15.44 | ||||||||
| Granted | (7,351 | ) | 7,351 | 9.16 | ||||||||
| Granted for options accepted for exchange | (3,377 | ) | 3,377 | 9.60 | ||||||||
| Exercised | — | (685 | ) | 5.05 | ||||||||
| Cancelled | 2,245 | (4,043 | ) | 15.61 | ||||||||
| Balance outstanding at October 1, 2004 | 5,710 | 31,763 | $ | 13.63 | ||||||||
| Granted (1) | (4,908 | ) | 4,668 | 8.47 | ||||||||
| Exercised | — | (935 | ) | 5.57 | ||||||||
| Cancelled/forfeited (2) | 2,113 | (3,918 | ) | 13.66 | ||||||||
| Additional shares reserved | 5,500 | — | — | |||||||||
| Balance outstanding at September 30, 2005 | 8,415 | 31,578 | $ | 12.99 | ||||||||
| Granted (1) | (5,770 | ) | 3,869 | 5.19 | ||||||||
| Exercised | — | (393 | ) | 4.44 | ||||||||
| Cancelled/forfeited (2) | 2,386 | (4,176 | ) | 12.65 | ||||||||
| Additional shares reserved | 10,000 | — | — | |||||||||
| Balance outstanding at September 29, 2006 | 15,031 | 30,878 | $ | 12.17 | ||||||||
| (1) | “Granted” under “Shares Available for Grant” includes restricted stock grants for the year ended September 29, 2006 and |
71
| under which they were awarded, these performance shares are deemed equivalent to the issue of 0.3 million stock options. | ||
| (2) | “Cancelled” under “Options Available for Grant” do not include any cancellations under terminated plans. For the years ended September 29, 2006, September 30, 2005, and |
| Weighted average | ||||||||
| Shares | exercise price | |||||||
| 2006 | 23,136 | $ | 14.05 | |||||
| 2005 | 24,053 | $ | 14.68 | |||||
| 2004 | 17,671 | $ | 17.59 | |||||
| Options Outstanding | Options Exercisable | ||||||||||||||||||||||||||||||||
| Weighted | Weighted | ||||||||||||||||||||||||||||||||
| average | Weighted | average | Weighted | ||||||||||||||||||||||||||||||
| remaining | average | Aggregate | remaining | average | Aggregate | ||||||||||||||||||||||||||||
| Range of exercise | Number | contractual | exercise price | Intrinsic | Options | contractual | exercise price | Intrinsic | |||||||||||||||||||||||||
| prices | outstanding | life (years) | per share | Value | exercisable | life (years) | per share | Value | |||||||||||||||||||||||||
| $0.83 — $4.99 | 6,055 | 6.8 | $ | 4.73 | $ | 2,772 | 2,625 | 5.5 | $ | 4.51 | $ | 1,798 | |||||||||||||||||||||
| $5.01 — $8.93 | 6,001 | 8.0 | $ | 7.64 | 21 | 2,051 | 7.3 | $ | 7.54 | 5 | |||||||||||||||||||||||
| $8.96 — $9.60 | 6,446 | 7.3 | $ | 9.32 | — | 6,198 | 7.3 | $ | 9.33 | — | |||||||||||||||||||||||
| $9.67 — $17.12 | 6,805 | 3.2 | $ | 15.14 | — | 6,691 | 3.1 | $ | 15.21 | — | |||||||||||||||||||||||
| $17.20 — $39.80 | 5,388 | 4.0 | $ | 23.82 | — | 5,388 | 4.0 | $ | 23.82 | — | |||||||||||||||||||||||
| $40.13 — $170.44 | 183 | 3.1 | $ | 53.95 | — | 183 | 3.0 | $ | 53.95 | — | |||||||||||||||||||||||
| 30,878 | 5.8 | $ | 12.17 | $ | 2,793 | 23,136 | 5.1 | $ | 14.05 | $ | 1,803 | ||||||||||||||||||||||
| Weighted average | ||||||||
| Grant-date | ||||||||
| Shares | fair value | |||||||
| Balance outstanding at October 1, 2004 | — | $ | — | |||||
| Granted | 161 | 5.20 | ||||||
| Vested | (— | ) | — | |||||
| Forfeited | (— | ) | — | |||||
| Balance Outstanding at September 30, 2005 | 161 | $ | 5.20 | |||||
| Granted | 1,094 | 5.14 | ||||||
| Vested(1) | (89 | ) | 4.94 | |||||
| Forfeited | (12 | ) | 5.14 | |||||
| Balance Outstanding at September 29, 2006 | 1,154 | $ | 5.17 | |||||
72
| (1) | Restricted stock awards |
STOCK OPTION PLANS FOR DIRECTORS
| (In thousands) | Fiscal Year Ended | |||
| September 29, 2006 | ||||
| Cost of sales | 2,174 | |||
| Research and development | 6,311 | |||
| Selling, general and administrative | 5,734 | |||
| Share-based compensation expense included in operating expenses | $ | 14,219 | ||
| Fiscal Years Ended | ||||||||||||
| (In thousands, except per share amounts) | September 29, | September 30, | October 1, | |||||||||
| 2006 | 2005 | 2004 | ||||||||||
| Net income-as reported for prior periods (1) | N/A | $ | 25,611 | $ | 22,412 | |||||||
| Share-based compensation expense related to employee stock options, employee stock purchases, and restricted stock grants (2) | (14,219 | ) | (47,183 | ) | (17,992 | ) | ||||||
| Restricted stock expense as calculated under APB 25 | — | 79 | — | |||||||||
| Restricted stock expense as calculated under FAS 123 | — | (70 | ) | — | ||||||||
| Net (loss) income, including the effect of share-based compensation expense (3) | $ | (88,152 | ) | $ | (21,563 | ) | $ | 4,420 | ||||
| Per share information, basic and diluted: | ||||||||||||
| Net income, as reported for the prior period (1) | N/A | $ | 0.16 | $ | 0.15 | |||||||
| Net (loss) income, including the effect of share-based compensation expense (3) | $ | (0.55 | ) | $ | (0.14 | ) | $ | 0.03 | ||||
| (1) | ||
| (2) | Share-based compensation expense prior to fiscal 2006 is calculated based on the |
EMPLOYEE STOCK PURCHASE PLAN
STOCK WARRANTS
NOTE 11. EMPLOYEE BENEFIT PLAN
NOTE 12. PENSIONS AND OTHER RETIREE BENEFITS
| Pension Benefits | Retiree Medical Benefits | ||||
|---|---|---|---|---|---|
| Service cost-benefits earned | $ -- | $ -- | |||
| Interest cost on benefit obligation | 175 | 70 | |||
| Estimated return on assets | (59 | ) | -- | ||
| Net amortization | 3 | 50 | |||
| Net periodic benefit cost | $ 119 | $120 | |||
| Pension Benefits | Retiree Medical Benefits | ||||
|---|---|---|---|---|---|
| Change in benefit obligation: | |||||
| Balance at beginning of year | $ 2,652 | $ 1,014 | |||
| Benefit payments | (256 | ) | (38 | ) | |
| Service and interest costs | 175 | 70 | |||
| Actuarial (gains) losses | 323 | -- | |||
| Balance at end of year | $ 2,894 | $ 1,046 | |||
| Change in fair value of plan assets: | |||||
| Balance at beginning of year | $ 1,419 | $ -- | |||
| Actual return on plan assets | 77 | -- | |||
| Employer contribution | 579 | -- | |||
| Benefit payments | (256 | ) | -- | ||
| Balance at end of year | $ 1,819 | $ -- | |||
| Benefit obligations in excess of plan assets | $ (1,075 | ) | $ (1,046 | ) | |
| Unrecognized net actuarial loss | 632 | -- | |||
| Net accrued benefit cost | $ (443 | ) | $ (1,046 | ) | |
| Pension Benefits | Retiree Medical Benefits | ||||
|---|---|---|---|---|---|
| Discount rate | 6 | % | 7 | % | |
| Long-term rate of return on assets | 4 | % | N | /A | |
NOTE 13. COMMITMENTS
| Fiscal Year | |||||
|---|---|---|---|---|---|
| 2004 | $ 7,328 | ||||
| 2005 | 6,051 | ||||
| 2006 | 4,906 | ||||
| 2007 | 4,465 | ||||
| 2008 | 4,348 | ||||
| Thereafter | 7,034 | ||||
| $34,132 | |||||
NOTE 14. CONTINGENCIES
NOTE 15. GUARANTEES
NOTE 16. SPECIAL CHARGES
ASSET IMPAIRMENTS
| (3) |
RESTRUCTURING CHARGES
| Fiscal 2002 Workforce Reductions | Fiscal 2002 Facility Closings and Other | Fiscal 2003 Workforce Reductions | Fiscal 2003 Facility Closings and Other | Total | |||||||||||||
|---|---|---|---|---|---|---|---|---|---|---|---|---|---|---|---|---|---|
| Charged to costs and expenses | $ | 2,923 | $ | 97 | $ | -- | $ | -- | $ | 3,020 | |||||||
| Cash payments | (2,225 | ) | (13 | ) | -- | -- | (2,238 | ) | |||||||||
| Restructuring balance, September 30, 2002 | 698 | 84 | -- | -- | 782 | ||||||||||||
| Charged to costs and expenses | -- | -- | 4,819 | 1,405 | 6,224 | ||||||||||||
| Cash payments | (698 | ) | (47 | ) | (3,510 | ) | (1,236 | ) | (5,491 | ) | |||||||
| Restructuring balance, September 30, 2003 | $ | -- | $ | 37 | $ | 1,309 | $ | 169 | $ | 1,515 | |||||||
NOTE 17. SEGMENT INFORMATION AND CONCENTRATIONS
GEOGRAPHIC INFORMATION
| Net |
| Years Ended September 30, | |||||||||||
|---|---|---|---|---|---|---|---|---|---|---|---|
| 2003 | 2002 | 2001 | |||||||||
| United States | $ | 87,691 | $ | 72,185 | $ | 63,948 | |||||
| Other Americas | 69,559 | 4,615 | 5,455 | ||||||||
| Total Americas | 157,250 | 76,800 | 69,403 | ||||||||
| South Korea | 157,772 | 237,681 | 142,459 | ||||||||
| Other Asia-Pacific | 218,817 | 114,974 | 23,898 | ||||||||
| Total Asia-Pacific | 376,589 | 352,655 | 166,357 | ||||||||
| Europe, Middle East and Africa | 83,950 | 28,314 | 24,691 | ||||||||
| $ | 617,789 | $ | 457,769 | $ | 260,451 | ||||||
73
| Fiscal Years Ended | ||||||||||||
| September 29, | September 30, | October 1, | ||||||||||
| 2006 | 2005 | 2004 | ||||||||||
| Expected volatility | 59.27 | % | 71.00 | % | 91.00 | % | ||||||
| Risk free interest rate | 4.55 | % | 3.90 | % | 1.90 | % | ||||||
| Dividend yield | 0.00 | 0.00 | 0.00 | |||||||||
| Expected option life (7 year contractual life options) | 4.42 | 3.5 | 5.0 | |||||||||
| Expected option life (10 year contractual life options) | 5.84 | 3.5 | 5.0 | |||||||||
| % of total | ||||||||
| common | ||||||||
| Number | stock | |||||||
| outstanding | outstanding | |||||||
| Stock options held by employees and directors | 23,333 | 14.4 | % | |||||
| Stock options held by non-employees (excluding directors) | 7,545 | 4.7 | % | |||||
| 30,878 | 19.1 | % | ||||||
74
| NOTE 10. |
| Pension Benefits | Retiree Medical Benefits | |||||||||||||||||||||||
| Fiscal Years Ended | Fiscal Years Ended | |||||||||||||||||||||||
| September 29, | September 30, | October 1, | September 29, | September 30, | October 1, | |||||||||||||||||||
| 2006 | 2005 | 2004 | 2006 | 2005 | 2004 | |||||||||||||||||||
| Benefit obligations in excess of plan assets | $ | 599 | $ | 1,137 | $ | 969 | $ | 1,238 | $ | 1,238 | $ | 1,210 | ||||||||||||
| Unrecognized net actuarial loss | (981 | ) | (1,301 | ) | (786 | ) | — | — | — | |||||||||||||||
| Net (prepaid) accrued benefit cost | $ | (382 | ) | $ | (164 | ) | $ | 183 | $ | 1,238 | $ | 1,238 | $ | 1,210 | ||||||||||
| NOTE 11. |
| September 30, | ||||||||
|---|---|---|---|---|---|---|---|---|
| 2003 | 2002 | |||||||
| United States | $ | 101,871 | $ | 109,975 | ||||
| Mexico | 21,223 | 30,427 | ||||||
| Other | 4,671 | 3,371 | ||||||
| $ | 127,765 | $ | 143,773 | |||||
CONCENTRATIONS
| Fiscal Year | ||||
| 2007 | 7,600 | |||
| 2008 | 6,813 |
75
| Fiscal Year | ||||
| 2009 | 6,131 | |||
| 2010 | 5,090 | |||
| 2011 | 1,834 | |||
| Thereafter | 664 | |||
| $ | 28,132 | |||
| NOTE 12. | CONTINGENCIES |
| NOTE 13. | GUARANTEES AND INDEMNITIES |
| NOTE 14. | RESTRUCTURING AND SPECIAL CHARGES |
| Fiscal Years Ended | ||||||||||||
| September 29, | September 30, | October 1, | ||||||||||
| 2006 | 2005 | 2004 | ||||||||||
| Asset impairments | $ | 4,197 | $ | — | $ | 13,183 | ||||||
| Restructuring and special charges | 22,758 | — | 4,183 | |||||||||
| $ | 26,955 | $ | — | $ | 17,366 | |||||||
76
| License and | ||||||||||||||||||||
| Software | Workforce | Asset | ||||||||||||||||||
| Facility Closings | Write-offs | Reductions | Impairments | Total | ||||||||||||||||
| Charged to costs and expenses | $ | 105 | $ | 9,583 | $ | 13,070 | $ | 4,197 | $ | 26,955 | ||||||||||
| Non-cash items | — | (6,426 | ) | — | (4,197 | ) | (10,623 | ) | ||||||||||||
| Cash payments | — | — | — | — | — | |||||||||||||||
| Restructuring balance, September 29, 2006 | $ | 105 | $ | 3,157 | $ | 13,070 | $ | — | $ | 16,332 | ||||||||||
77
| Workforce | Facility | |||||||||||
| Reductions | Closings | Total | ||||||||||
| Charged to costs and expenses | $ | 3,685 | $ | 498 | $ | 4,183 | ||||||
| Cash payments | (3,530 | ) | (287 | ) | (3,817 | ) | ||||||
| Restructuring balance, October 1, 2004 | $ | 155 | $ | 211 | $ | 366 | ||||||
| Cash payments | (155 | ) | (198 | ) | (353 | ) | ||||||
| Restructuring balance, September 30, 2005 | $ | — | $ | 13 | $ | 13 | ||||||
| Cash payments | — | (13 | ) | (13 | ) | |||||||
| Restructuring balance, September 29, 2006 | $ | — | $ | — | $ | — | ||||||
| NOTE 15. | EARNINGS PER SHARE |
| (In thousands, except per share amounts) | Fiscal Years Ended | |||||||||||
| September 29, | September 30, | October 1, | ||||||||||
| 2006 | 2005 | 2004 | ||||||||||
| Net (loss) income | $ | (88,152 | ) | $ | 25,611 | $ | 22,412 | |||||
| Weighted average shares outstanding — basic | 159,408 | 157,453 | 152,090 | |||||||||
| Effect of dilutive stock options and restricted stock | — | 1,404 | 2,152 | |||||||||
| Weighted average shares outstanding — diluted | 159,408 | 158,857 | 154,242 | |||||||||
| Net (loss) income per share — basic | $ | (0.55 | ) | $ | 0.16 | $ | 0.15 | |||||
| Effect of dilutive stock options | — | — | — | |||||||||
| Net (loss) income per share — diluted | $ | (0.55 | ) | $ | 0.16 | $ | 0.15 | |||||
78
| NOTE 16. | SEGMENT INFORMATION AND CONCENTRATIONS |
| Fiscal Years Ended | ||||||||||||
| September 29, | September 30, | October 1, | ||||||||||
| 2006 | 2005 | 2004 | ||||||||||
| United States | $ | 43,180 | $ | 66,429 | $ | 74,105 | ||||||
| Other Americas | 18,925 | 39,541 | 51,537 | |||||||||
| Total Americas | 62,105 | 105,970 | 125,642 | |||||||||
| China | 224,539 | 215,082 | 206,364 | |||||||||
| South Korea | 114,926 | 107,225 | 188,090 | |||||||||
| Taiwan | 116,073 | 92,171 | 69,126 | |||||||||
| Other Asia-Pacific | 173,523 | 144,940 | 64,570 | |||||||||
| Total Asia-Pacific | 629,061 | 559,418 | 528,150 | |||||||||
| Europe, Middle East and Africa | 82,584 | 126,983 | 130,231 | |||||||||
| $ | 773,750 | $ | 792,371 | $ | 784,023 | |||||||
| As of | ||||||||
| September 29, 2006 | September 30, 2005 | |||||||
| United States | $ | 88,896 | $ | 85,072 | ||||
| Mexico | 59,234 | 60,594 | ||||||
| Other | 2,253 | 5,172 | ||||||
| $ | 150,383 | $ | 150,838 | |||||
79
| Fiscal Years Ended | ||||||||||||
| September 29, | September 30, | October 1, | ||||||||||
| 2006 | 2005 | 2004 | ||||||||||
| Motorola, Inc. | 23 | % | 21 | % | 14 | % | ||||||
| Sony Ericsson Mobile Communications AB | 16 | % | 10 | % | * | |||||||
| Asian Information Technology, Inc | 11 | % | * | * | ||||||||
| Samsung Electronics Co. | * | * | 12 | % | ||||||||
| * | Customers accounted for |
| Years Ended September 30, | |||||||
|---|---|---|---|---|---|---|---|
| 2003 | 2002 | 2001 | |||||
| Samsung Electronics Co., | 15 | % | 35 | % | 44 | % | |
| Motorola, Inc. | 11 | % | 11 | % | * | ||
| Conexant | * | * | 17 | % | |||
| Nokia Corporation | * | * | 12 | % | |||
| NOTE 17. |
NOTE 18. QUARTERLY FINANCIAL DATA (UNAUDITED)
| (In thousands, except per share data) | First Quarter (1) | Second Quarter | Third Quarter | Fourth Quarter | Year | ||||||
|---|---|---|---|---|---|---|---|---|---|---|---|
| Fiscal 2003 | |||||||||||
| Net revenues | $ 160,194 | $ 157,364 | $ 150,199 | $ 150,032 | $ 617,789 | ||||||
| Gross profit | 65,120 | 63,519 | 56,078 | 52,607 | 237,324 | ||||||
| Income (loss) before cumulative effect of change in accounting principle | 791 | (5,955 | ) | (6,186 | ) | (42,927 | ) | (54,277 | ) | ||
| Cumulative effect of change in accounting | |||||||||||
| principle, net of tax | (397,139 | ) | -- | -- | -- | (397,139 | ) | ||||
| Net loss | (396,348 | ) | (5,955 | ) | (6,186 | ) | (42,927 | ) | (451,416 | ) | |
| Per share data (2) | |||||||||||
| Income (loss) before cumulative | |||||||||||
| effect of change in accounting | |||||||||||
| principle, basic and diluted | 0.01 | (0.04 | ) | (0.04 | ) | (0.30 | ) | (0.39 | ) | ||
| Cumulative effect of change in accounting principle, net of tax, basic and diluted | (2.88 | ) | -- | -- | -- | (2.85 | ) | ||||
| Net loss, basic and diluted | (2.87 | ) | (0.04 | ) | (0.04 | ) | (0.30 | ) | (3.24 | ) | |
| Fiscal 2002 | |||||||||||
| Net revenues | $ 93,760 | $ 100,356 | $ 112,980 | $ 150,673 | $ 457,769 | ||||||
| Gross profit | 15,954 | 29,433 | 20,063 | 60,711 | 126,161 | ||||||
| Net loss | (34,297 | ) | (18,339 | ) | (181,945 | ) | (1,483 | ) | (236,064 | ) | |
| Per share data (2) | |||||||||||
| Net loss, basic and diluted | -- | -- | (1.33 | ) | (0.01 | ) | (1.72 | ) | |||
| First | Second | Third | Fourth | |||||||||||||||||
| Quarter (2) | Quarter | Quarter | Quarter(3) | Year | ||||||||||||||||
Fiscal 2006 | ||||||||||||||||||||
| Net revenues | $ | 198,325 | $ | 185,234 | $ | 197,058 | $ | 193,133 | $ | 773,750 | ||||||||||
| Gross profit | 74,723 | 69,350 | 73,347 | 45,259 | 262,679 | |||||||||||||||
| Net income(loss) | 4,287 | 926 | 3,005 | (96,370 | ) | (88,152 | ) | |||||||||||||
| Per share data (1) | ||||||||||||||||||||
| Net income(loss), basic | 0.03 | 0.01 | 0.02 | (0.60 | ) | (0.55 | ) | |||||||||||||
| Net income(loss), diluted | 0.03 | 0.01 | 0.02 | (0.60 | ) | (0.55 | ) | |||||||||||||
Fiscal 2005 | ||||||||||||||||||||
| Net revenues | $ | 220,160 | $ | 190,505 | $ | 191,532 | $ | 190,174 | $ | 792,371 | ||||||||||
| Gross profit | 88,019 | 72,599 | 77,874 | 69,280 | 307,772 | |||||||||||||||
| Net income | 13,917 | 1,244 | 7,389 | 3,061 | 25,611 | |||||||||||||||
| Per share data (1) | ||||||||||||||||||||
| Net income, basic | 0.09 | 0.01 | 0.05 | 0.02 | 0.16 | |||||||||||||||
| Net income, diluted | 0.09 | 0.01 | 0.05 | 0.02 | 0.16 | |||||||||||||||
| (1) |
|
Earnings per share calculations for each of the quarters are based on the weighted average number of shares outstanding and included common stock equivalents in each period. Therefore, the sums of the quarters do not necessarily equal the full year earnings per share. | ||
| (2) | During the first quarter of fiscal 2005, the Company reduced the carrying value of its deferred tax assets by $2.2 million. This charge resulted from a reduction of the statutory income tax rate in Mexico. This reduction is being reported in the provision for income taxes line of the statement of operations in the first quarter of fiscal 2005. | |
| (3) | The Company recorded charges of $90.4 million which included $35.1 million in bad debt expense, $23.3 million of inventory charges and reserves, $13.1 million related to severance and benefits, $7.4 million related to the |
80
| ITEM 9. | CHANGES IN AND DISAGREEMENTS WITH ACCOUNTANTS ON ACCOUNTING AND FINANCIAL DISCLOSURE. |
Alpha’s independent accountant was KPMG LLP (“KPMG”)
| ITEM 9A. | CONTROLS AND PROCEDURES. |
The report of Deloitte & Touche on Washington/Mexicali’s financial statements for the fiscal year ended September 30, 2001 did not contain an adverse opinion or a disclaimer of opinion, nor was such report qualified or modified as to uncertainty, audit scope or accounting principles. The decision to change accountants was approved by the Board of Directors.
During Washington/Mexicali’s fiscal year ended September 30, 2001 and through the subsequent interim period to June 25, 2002, Washington/Mexicali did not have any disagreement with Deloitte & Touche on any matter of accounting principles or practices, financial statement disclosure, or auditing scope or procedure that, if not resolved to Deloitte & Touche’s satisfaction, would have caused Deloitte & Touche to make reference to the subject matter of the disagreement in connection with its report. During that time, there were no “reportable events” as set forth in Item 304(a)(1)(v)(A)-(D) of Regulation S-K (“Regulation S-K”) adopted by the SEC.
KPMG (or its predecessors) has been Alpha’s independent accountant since 1975 and Alpha has regularly consulted KPMG (or its predecessors) since that time. Washington/Mexicali, as the continuing reporting entity for accounting purposes, did not consult KPMG during Washington/Mexicali’s fiscal year ended September 30, 2001 and through the interim period to June 25, 2002 regarding any of the matters specified in Item 304(a)(2) of Regulation S-K.
ITEM 9A. CONTROLS AND PROCEDURES
Under the supervision andProcedures
There Based on the evaluation of Skyworks’ disclosure controls and procedures as of September 29, 2006, Skyworks’ chief executive officer and chief financial officer concluded that, as of such date, Skyworks’ disclosure controls and procedures were no significant changes made in oureffective at the reasonable assurance level.
PART III
ITEM 10. DIRECTORS AND EXECUTIVE OFFICERS OF THE REGISTRANT
reporting for the company. Internal control over financial reporting is defined in Rule 13a-15(f) or 15d-15(f) promulgated under the Securities Exchange Act of 1934 as a process designed by, or under the supervision of, the company’s principal executive and principal financial officers and effected by the Company’s board of directors, management and other personnel, to provide reasonable assurance regarding the reliability of financial reporting and the preparation of financial statements for external purposes in accordance with generally accepted accounting principles and includes those policies and procedures that:| Pertain to the maintenance of records that in reasonable detail accurately and |
| Provide reasonable assurance that transactions are recorded as necessary to permit preparation of |
| Provide reasonable assurance regarding prevention or timely detection of |
81
82
Skyworks Solutions, Inc.:
December 13, 2006
83
| ITEM 9B. |
| ITEM 10. | DIRECTORS AND EXECUTIVE OFFICERS OF THE REGISTRANT |
| ITEM 11. | EXECUTIVE COMPENSATION |
ITEM 12. SECURITY OWNERSHIP OF CERTAIN BENEFICIAL OWNERS AND MANAGEMENT AND RELATED STOCKHOLDER MATTERS
Except
| ITEM 12. | SECURITY OWNERSHIP OF CERTAIN BENEFICIAL OWNERS AND MANAGEMENT AND RELATED SHAREHOLDER MATTERS |
EQUITY COMPENSATION PLAN INFORMATION
The Company maintains nine Information required by this item relating to securities authorized for issuance under equity compensation plans under whichis contained in our equity securities are authorized for issuance to our employees and/or directors:— the 1986 Long-Term Incentive Plan;— the 1994 Non-Qualified Stock Option Plan;— the 1996 Long-Term Incentive Plan;— the 1997 Non-Qualified Stock Option Plan;— the 1999 Employee Long-Term Incentive Plan;— the Directors’ 2001 Stock Option Plan;— the Non-Qualified Employee Stock Purchase Plan;— the 2002 Employee Stock Purchase Plan; and— the Washington Sub, Inc. 2002 Stock Option Plan.
Exceptdefinitive proxy statement for the 1999 Employee Long-Term Incentive Plan, the Washington Sub, Inc. 2002 Stock Option Plan and the Non-Qualified Employee Stock Purchase Plan, each2007 Annual Meeting of the foregoing equity compensation plans was approved by our stockholders.
The following table presents information about these plans as of September 30, 2003.
| Plan Category | Number of securities to be issued upon exercise of outstanding options, warrants, and rights (a) | Weighted-average exercise price of outstanding options, warrants and rights (b) | Number of securities remaining available for future issuance under equity compensation plans (excluding securities reflected in column (a)) (c) | ||||
|---|---|---|---|---|---|---|---|
| Equity compensation | |||||||
| plans approved by | |||||||
| security holders | 8,691,510 | $ 16 | .45 | 1,834,897 | |||
| Equity compensation | |||||||
| plans not approved by | |||||||
| security holders | 17,071,976 | $ 14 | .93 | 12,348,938 | |||
| Total | 25,763,523 | $ 15 | .44 | 14,183,835 | |||
|
|
1999 EMPLOYEE LONG-TERM INCENTIVE PLAN
The purposes of the Company’s 1999 Employee Long-term Incentive Plan (the “1999 Employee Plan”) are (i) to provide long-term incentives and rewards to those employees of the Company and its subsidiaries, other than officers and non-employee directors, who are in a position to contribute to the long-term success and growth of the Company and its subsidiaries, (ii) to assist the Company in retaining and attracting employees with requisite experience and ability, and (iii) to associate more closely the interests of such employees with those of the Company’s stockholders. The 1999 Employee Plan provides for the grant of non-qualified stock options to purchase shares of the Company’s common stock. The term of these options may not exceed ten years. The 1999 Employee Plan contains provisions which permit restrictions on vesting or transferability, as well as continued exercisability upon a participant’s termination of employment with the Company, of options granted thereunder. The 1999 Employee Plan provides for full acceleration of the vesting of options granted thereunder upon a “change in control” of the Company, as defined in the 1999 Employee Plan. The Board of Directors generally may amend, suspend or terminate the 1999 Employee Plan in whole or in part at any time; provided that any amendment which affects outstanding options be consented to by the holder of the options.
WASHINGTON SUB, INC. 2002 STOCK OPTION PLAN
The Washington Sub, Inc. 2002 Stock Option Plan (the “Washington Sub Plan”) became effective on June 25, 2002 in connection with the Merger. At the time of the spin-off of Conexant’s wireless business, outstanding Conexant options granted pursuant to certain Conexant stock incentive plans were converted so that following the spin-off and Merger each holder of those certain Conexant options held (i) options to purchase shares of Conexant common stock and (ii) options to purchase shares of Skyworks common stock. The purpose of the Washington Sub Plan is to provide a means for the Company to perform its obligations with respect to these converted stock options. The only participants in the Washington Sub Plan are those persons who, at the time of the Merger, held outstanding options granted pursuant to certain Conexant stock option plans. No further options to purchase shares of Skyworks common stock will be grantedStockholders under the Washington Sub Plan. The Washington Subcaption “Stock Based Compensation Plan contains a number of sub-plans, which contain termsInformation” and conditions that are applicable to certain portions of the options subject to the Washington Sub Plan, depending upon the Conexant stock option plan from which the Skyworks options granted under the Washington Sub Plan were derived. The outstanding options under the Washington Sub Plan generally have the same terms and conditions as the original Conexant options from which they are derived. Most of the sub-plans of the Washington Sub Plan contain provisions related to the effect of a participant’s termination of employment with the Company, if any, and/or with Conexant on options granted pursuant to such sub-plan. Several of the sub-plans under the Washington Sub Plan contain specific provisions related to a change in control of the Company.
NON-QUALIFIED ESPP
The Company also maintains a Non-Qualified Employee Stock Purchase Plan to provide employees of the Company and participating subsidiaries with an opportunity to acquire a proprietary interest in the Company through the purchase, by means of payroll deductions, of shares of the Company’s common stock at a discount from the market price of the common stock at the time of purchase. The Non-Qualified Employee Stock Purchase Plan is intended for use primarily by employees of the Company located outside the United States. Under the plan, eligible employees may purchase common stock through payroll deductions of up to 10% of compensation. The price per share is the lower of 85% of the market price at the beginning or end of each six-month offering period.
ITEM 13. CERTAIN RELATIONSHIPS AND RELATED TRANSACTIONS
The information required by this Item 13 is hereby incorporated by reference to the Company's Proxy Statement.
ITEM 14. PRINCIPAL ACCOUNTANT FEES AND SERVICES
The information in the section entitled “Audit Fees and Services,” appearing in the Proxy Statement, is incorporated herein by reference.
PART IV
ITEM 15. EXHIBITS, FINANCIAL STATEMENT SCHEDULES, AND REPORTS ON FORM 8-K
(a) 1. Index to Financial Statements
The financial statements filed as part of this report are listed on the index appearing on page 43.
2. Index to Financial Statement Schedules
The following financial statement schedule is filed as part of this report (page reference is to this report):
Schedule II Valuation and Qualifying Accounts................................................Page 86
All other required schedule information is included in the Notes to Consolidated Financial Statements or is omitted because it is either not required or not applicable.
3. Exhibits
| ITEM 13. | CERTAIN RELATIONSHIPS AND RELATED TRANSACTIONS |
* Management contract or compensatory plan
** Filed herewith
+ Confidential treatment granted for certain portions of this agreement which have been omitted and filed separately with the Securities and Exchange Commission.
ITEM 14. |
84
| ITEM 15. | EXHIBITS, FINANCIAL STATEMENT SCHEDULES. |
| (a) | The following are filed |
| 1. | Index to | Page number in this report |
| Report of Independent Registered Public Accounting Firm | Page 51 | |
| Consolidated Statements of Operations for the | Page 52 | |
| Consolidated Balance Sheets at September 29, 2006 and September 30, 2005 | Page 53 | |
| Consolidated Statements of Cash Flows for the Years Ended September 29, 2006, September 30, 2005 and October 1, 2004 | Page 54 | |
| Consolidated Statements of Stockholders’ Equity and Comprehensive Income (Loss) for the Years Ended September 29, 2006, September 30, 2005, and October 1, 2004 | Page 55 | |
| Notes to | Pages 56 through 80 |
| 2. | The schedule listed below is filed 10-K: | Page number in this report | ||
| Schedule II-Valuation and Qualifying Accounts | Page 88 |
| All other required schedule information is included in the | ||
| 3. | The Exhibits listed in the |
(b) Reports on Form 8-K
| Exhibits |
(c) Exhibits
| The exhibits required by Item 601 of Regulation S-K are filed herewith and incorporated by reference herein. The response to this portion of Item 15 is submitted under Item 15 (a) (3). |
85
| SKYWORKS SOLUTIONS, INC. | ||||||
| Registrant | ||||||
| By: | /s/ DAVID J. ALDRICH | |||||
| David J. Aldrich | ||||||
| Chief Executive Officer | ||||||
| | ||||||
| | ||||||
| President | |||||
| | |||||
| | |||||
| | |||||
| | |||||
| Director | |
POWER OF ATTORNEY AND SIGNATURES
We, the undersigned officers and directors of Skyworks Solutions, Inc., hereby severally constitute and appoint David J. Aldrich and Paul E. Vincent, and each of them singly, our true and lawful attorneys, with full power to them and each of them singly, to sign for us and in our names in the capacities indicated below, any amendments to this Annual Report on Form 10-K, and generally to do all things in our names and on our behalf in such capacities to enable Skyworks Solutions, Inc. to comply with the provisions of the Securities Exchange Act of 1934, as amended, and all the requirements of the Securities Exchange Commission.86
Signature and TitleSignature and Title
| Signature and Title | ||
/s/ DWIGHT W. DECKER | ||
| Dwight W. Decker | | |
| Chairman of the Board | | |
/s/ DAVID J. ALDRICH | ||
| David J. Aldrich | | |
| Chief Executive Officer | ||
| President and Director (principal | ||
| executive officer) | ||
| | ||
/s/ ALLAN M. KLINE | ||
| Allan M. Kline | ||
| Chief Financial Officer Director | ||
| Vice President (principal accounting and | ||
| | ||
| | | |
| Signature and Title | ||
| | ||
/s/ KEVIN L. BEEBE | ||
| Kevin L. Beebe | ||
| Director | ||
| | ||
/s/ MOIZ M. BEGUWALA | ||
| Moiz M. Beguwala | ||
| Director | ||
| | ||
/s/ TIMOTHY R. FUREY | ||
| Timothy R. Furey | ||
| Director | ||
/s/ BALAKRISHNAN S. IYER | ||
| Balakrishnan S. Iyer | ||
| Director | ||
/s/ THOMAS C. LEONARD | ||
| Thomas C. Leonard | ||
| Director | ||
/s/ DAVID P. MCGLADE | ||
| David P. McGlade | ||
| Director | ||
/s/ DAVID J. MCLACHLAN | ||
| David J. McLachlan | ||
| Director | ||
/s/ ROBERT A. SCHRIESHEIM | ||
| Robert A. Schriesheim | ||
| Director | ||
87
Charged to Cost and Ending Description Beginning Balance Expenses Deductions Misc. Balance Year Ended October 1, 2004 Allowance for doubtful accounts $ 1,979 $ 377 $ (369 ) $ — $ 1,987 Reserve for sales returns $ 5,009 $ 9,200 $ (9,300 ) $ — $ 4,909 Allowance for excess and obsolete inventories $ 25,305 $ 535 $ (12,105 ) $ — $ 13,735 Year Ended September 30, 2005 Allowance for doubtful accounts $ 1,987 $ 5,127 $ (1,299 ) $ — $ 5,815 Reserve for sales returns $ 4,909 $ 4,986 $ (6,884 ) $ 48 $ 3,059 Allowance for excess and obsolete inventories $ 13,735 $ 11,482 $ (13,238 ) $ — $ 11,979 Year Ended September 29, 2006 Allowance for doubtful accounts $ 5,815 $ 35,959 $ (4,752 ) $ — $ 37,022 Reserve for sales returns $ 3,059 $ 4,867 $ (3,803 ) $ (19 ) $ 4,104 Allowance for excess and obsolete inventories $ 11,979 $ 23,154 $ (7,428 ) $ — $ 27,705
88
Description
Beginning
Balance
Charged to
Costs and
Expenses (1)
Deductions
Other (3)
Ending
Balance
Year Ended September 30, 2001 Allowance for doubtful accounts $ 3,792 $ (468 ) $ (118 ) $ -- $ 3,206 Reserve for sales returns $ 534 $ 4,055 $ -- $ -- $ 4,589 Allowance for excess and obsolete inventories $ 9,099 $ 2,286 (2) $ -- $ -- $11,385 Year Ended September 30, 2002 Allowance for doubtful accounts $ 3,206 $ (512 ) $ (575 ) $ (795 ) $ 1,324 Reserve for sales returns $ 4,589 $ 7,616 $(7,199 ) $ 3,510 $ 8,516 Allowance for excess and obsolete inventories $ 11,285 $ 6,225 $(3,092 ) $ 6,100 $20,618 Year Ended September 30, 2003 Allowance for doubtful accounts $ 1,324 $ 1,156 $ (501 ) $ -- $ 1,979 Reserve for sales returns $ 8,516 $ 3,624 $(7,131 ) $ -- $ 5,009 Allowance for excess and obsolete inventories $20,618 $ 9,577 $(4,890 ) $ -- $25,305
EXHIBIT INDEX(1) Additions charged to costs and expenses in the allowance for doubtful accounts reflect credit balances recorded in fiscal 2001, resulting from reductions in the allowance account associated with overall collections experience more favorable than previously estimated. Deductions in the allowance for doubtful accounts reflect amounts written off.
(2) Amount excludes inventory write-downs of $58.7 million charged to cost of goods sold relating to inventory that was written down to a zero cost basis.
(3) Amounts include Alpha’s allowance for doubtful accounts, reserve for sales returns
Exhibit Incorporated by Reference Filed Number Exhibit Description Form File No. Exhibit Filing Date Herewith 2.A Agreement and allowances for excessPlan of Reorganization, dated as of December 16, 2001, as amended as of April 12, 2002, by and absolute inventories balancesamong the Company, Washington Sub, Inc. and Conexant Systems, Inc. S-4 333-83768 2.a 5/10/2002 2.B Contribution and Distribution Agreement, dated as of $1.2 million, $3.5 million and $6.1 million, respectively, which were assumed on June 25, 2002 in connection with the Merger. In addition, Conexant retained Washington/Mexicali’s accounts receivable and allowance for doubtful accounts balancesDecember 16, 2001, as amended as of June 25, 2002. Washington/Mexicali’s allowance for doubtful accounts balance at2002, by and between Washington Sub, Inc. the Company and Conexant Systems, Inc. 8-K 001-5560 2.2 6/28/2002 2.C Mexican Stock Purchase Agreement, dated as of June 25, 2002, was $2.0 million.by and between the Company and Conexant Systems, Inc. 8-K 001-5560 2.3 6/28/2002 2.D Amended and Restated Mexican Asset Purchase Agreement, dated as of June 25, 2002, by and between the Company and Conexant Systems, Inc. 8-K 001-5560 2.4 6/28/2002 2.E U.S. Asset Purchase Agreement, dated as of December 16, 2001 by and between the Company and Conexant Systems, Inc. 8-K 001-5560 2.5 6/28/2002 3.A Amended and Restated Certificate of Incorporation 10-K 001-5560 3.A 12/23/2002 3.B Second Amended and Restated By-laws 10-K 001-5560 3.B 12/23/2002 4.A Specimen Certificate of Common Stock S-3 333-92394 4 7/15/2002 4.B Form of 4.75% Convertible Subordinated Note of the Company 10-K 001-5560 4.D 12/23/2002 4.C Indenture, dated as of November 20, 2002, by and between the Company and Wachovia Bank, N.A. (as Trustee) 10-K 001-5560 4.E 12/23/2002 4.D First Supplemental Indenture dated as of January 15, 2003 between Skyworks Solutions, Inc. and Wachovia Bank, N.A. (as Trustee) S-3 333-102157 4.03 1/16/2003 10.A* Skyworks Solutions, Inc., 1986 Long-Term Incentive Plan as amended 10-K 001-5560 10.A 12/14/2005 10.B* Skyworks Solutions, Inc., Long-Term Compensation Plan dated September 24, 1990; amended March 28, 1991; and as further amended October 27, 1994 10-K 001-5560 10.B 12/14/2005 10.C* Skyworks Solutions, Inc. 1994 Non-Qualified Stock Option Plan for Non-Employee Directors 10-K 001-5560 10.C 12/14/2005
89
EXHIBIT INDEX
Exhibit Incorporated by Reference Filed Number Exhibit Description Form File No.
Exhibit Filing Date Herewith 10.D* Skyworks Solutions, Inc. Executive Compensation Plan dated January 1, 1995 and Trust for the Skyworks Solutions, Inc. Executive Compensation Plan dated January 3, 1995 10-K 001-5560 10.D 12/14/2005 10.E* Skyworks Solutions, Inc. 1997 Non-Qualified Stock Option Plan for Non-Employee Directors 10-K 001-5560 10.E 12/14/2005 10.F* Skyworks Solutions, Inc. 1996 Long-Term Incentive Plan X 10.G* Skyworks Solutions, Inc. 1999 Employee Long-Term Incentive Plan 10-K 001-5560 10.L 12/23/2002 10.H* Washington Sub Inc., 2002 Stock Option Plan S-3 333-92394 99.A 7/15/2002 10.I* Skyworks Solutions, Inc. Non-Qualified Employee Stock Purchase Plan 10-K 001-5560 10.N 12/23/2002 10.J Form of Shareholders Agreement, dated as of December 16, 2001, entered into between each of the directors and certain executive officers of the Company as of the date thereof and Conexant Systems, Inc. S-4 333-83768 10 5/10/2002 10.K Registration Rights Agreement, dated as of November 12, 2002, by and among the Company and Credit Suisse First Boston (as representative for the several purchasers) 10-K 001-5560 10.AA 12/23/2002 10.L* 2002 Skyworks Solutions, Inc. Employee Stock Purchase Plan 10-K 001-5560 10.CC 12/23/2002 10.M Credit and Security Agreement, dated as of July 15, 2003, by and between Skyworks USA, Inc. and Wachovia Bank, N.A. 10-Q 001-5560 10.A 8/11/2003 10.N Servicing Agreement, dated as of July 15, 2003, by and between the Company and Skyworks USA, Inc. 10-Q 001-5560 10.B 8/11/2003 10.O Receivables Purchase Agreement, dated as of July 15, 2003, by and between Skyworks USA, Inc. and the Company 10-Q 001-5560 10.C 8/11/2003 10.P Terms Agreement, dated as of September 9, 2003, by and among the Company and Credit Suisse First Boston 8-K 001-5560 1.1 9/10/2003 10.Q* Form of Notice of Grant of Stock Option for the Company’s 1996 Long-Term Incentive Plan 8-K 001-5560 10.1 11/17/2004 10.R* Fiscal 2007 Executive Incentive Compensation Plan X
90
Exhibit Incorporated by Reference Filed Number Exhibit Description
Form File No. Exhibit Filing Date Herewith 10.S* Skyworks Solutions, Inc. 2005 Long-Term Incentive Plan 8-K 001-556 10.1 5/04/2005 10.T* Skyworks Solutions, Inc. Directors’ 2001 Stock Option Plan 8-K 001-556 10.2 5/04/2005 10.U* Form of Notice of Grant of Stock Option for the Company’s 2001 Directors Plan 8-K 001-556 10.3 5/04/2005 10.V* Form of Notice of Stock Option Agreement under the Company’s 2005 Long-Term Incentive Plan 10-Q 001-5560 10.A 5/11/2005 10.W* Form of Notice of Restricted Stock Agreement under the Company’s 2005 Long-Term Incentive Plan 10-Q 001-5560 10.B 5/11/2005 10.X* Severance and Change in Control Agreement, dated May 31, 2005, between the Company and David J. Aldrich 8-K 001-5560 10.1 5/31/2005 10.Y* Severance and Change in Control Agreement between the Company and Liam K. Griffin 8-K 001-5560 10.2 5/31/2005 10.Z* Severance and Change in Control Agreement between the Company and Allan M. Kline 8-K 001-5560 10.3 5/31/2005 10.AA* Severance and Change in Control Agreement between the Company and George M. LeVan 8-K 001-5560 10.4 5/31/2005 10.BB* Severance and Change in Control Agreement between the Company and Gregory L. Waters 8-K 001-5560 10.5 5/31/2005 10.CC* Severance and Change in Control Agreement between the Company and Kevin D. Barber 8-K 001-5560 10.6 5/31/2005 10.DD* Severance and Change in Control Agreement between the Company and Mark V. B. Tremallo 8-K 001-5560 10.7 5/31/2005 10.EE* Skyworks Solutions, Inc. Restricted Stock Agreement Granted Under 2005 Long-Term Incentive Plan 8-K 001-5560 10.1 11/15/2005 10.FF* Amended and Restated Severance and Change in Control Agreement between the Company and Kevin D. Barber X 11 Statement regarding calculation of per share earnings [see Note 2 to the Consolidated Financial Statements] X 12 Computation of Ratios X 21
23.a
23.b
31.a
31.b
32 Subsidiaries of the Registrant
Company X 23.1 Consent of KPMG LLP
Consent of Deloitte & Touche LLP
LLP. X 31.1 Certification of CEO - Rule 13A-14(A) or 15D-14(A)
the Company’s Chief Executive Officer pursuant to Securities and Exchange Act
91
Exhibit Incorporated by Reference Filed Number Exhibit Description Form File No. Exhibit Filing Date Herewith Rules 13a- 14(a) and 15d-14(a), as adopted pursuant to Section 302 of the Sarbanes-Oxley Act of 2002 X 31.2 Certification of CFO - Rule 13A-14(A) or 15D-14(A)
the Company’s Chief Financial Officer pursuant to Securities and Exchange Act Rules 13a-14(a) and 15d-14(a), as adopted pursuant to Section 302 of the Sarbanes-Oxley Act of 2002 X 32.1 Certification of the Company’s Chief Executive Officer pursuant to 18 U.S.C. Section 1350, as Adopted Pursuantadopted pursuant to Section 906 of
the Sarbanes-Oxley Act of 2002 X 32.2 Certification of the Company’s Chief Financial Officer pursuant to 18 U.S.C. Section 1350, as adopted pursuant to Section 906 of the Sarbanes-Oxley Act of 2002 X
* Indicates a management contract or compensatory plan or arrangement.
92
| Charged to | ||||||||||||||||||||
| Cost and | Ending | |||||||||||||||||||
| Description | Beginning Balance | Expenses | Deductions | Misc. | Balance | |||||||||||||||
| Year Ended October 1, 2004 | ||||||||||||||||||||
| Allowance for doubtful accounts | $ | 1,979 | $ | 377 | $ | (369 | ) | $ | — | $ | 1,987 | |||||||||
| Reserve for sales returns | $ | 5,009 | $ | 9,200 | $ | (9,300 | ) | $ | — | $ | 4,909 | |||||||||
| Allowance for excess and obsolete inventories | $ | 25,305 | $ | 535 | $ | (12,105 | ) | $ | — | $ | 13,735 | |||||||||
| Year Ended September 30, 2005 | ||||||||||||||||||||
| Allowance for doubtful accounts | $ | 1,987 | $ | 5,127 | $ | (1,299 | ) | $ | — | $ | 5,815 | |||||||||
| Reserve for sales returns | $ | 4,909 | $ | 4,986 | $ | (6,884 | ) | $ | 48 | $ | 3,059 | |||||||||
| Allowance for excess and obsolete inventories | $ | 13,735 | $ | 11,482 | $ | (13,238 | ) | $ | — | $ | 11,979 | |||||||||
| Year Ended September 29, 2006 | ||||||||||||||||||||
| Allowance for doubtful accounts | $ | 5,815 | $ | 35,959 | $ | (4,752 | ) | $ | — | $ | 37,022 | |||||||||
| Reserve for sales returns | $ | 3,059 | $ | 4,867 | $ | (3,803 | ) | $ | (19 | ) | $ | 4,104 | ||||||||
| Allowance for excess and obsolete inventories | $ | 11,979 | $ | 23,154 | $ | (7,428 | ) | $ | — | $ | 27,705 | |||||||||
88
| Description | Beginning Balance | Charged to Costs and Expenses (1) | Deductions | Other (3) | Ending Balance | ||||||||
|---|---|---|---|---|---|---|---|---|---|---|---|---|---|
| Year Ended September 30, 2001 | |||||||||||||
| Allowance for doubtful accounts | $ 3,792 | $ (468 | ) | $ (118 | ) | $ -- | $ 3,206 | ||||||
| Reserve for sales returns | $ 534 | $ 4,055 | $ -- | $ -- | $ 4,589 | ||||||||
| Allowance for excess and obsolete inventories | $ 9,099 | $ 2,286 | (2) | $ -- | $ -- | $11,385 | |||||||
| Year Ended September 30, 2002 | |||||||||||||
| Allowance for doubtful accounts | $ 3,206 | $ (512 | ) | $ (575 | ) | $ (795 | ) | $ 1,324 | |||||
| Reserve for sales returns | $ 4,589 | $ 7,616 | $(7,199 | ) | $ 3,510 | $ 8,516 | |||||||
| Allowance for excess and obsolete inventories | $ 11,285 | $ 6,225 | $(3,092 | ) | $ 6,100 | $20,618 | |||||||
| Year Ended September 30, 2003 | |||||||||||||
| Allowance for doubtful accounts | $ 1,324 | $ 1,156 | $ (501 | ) | $ -- | $ 1,979 | |||||||
| Reserve for sales returns | $ 8,516 | $ 3,624 | $(7,131 | ) | $ -- | $ 5,009 | |||||||
| Allowance for excess and obsolete inventories | $20,618 | $ 9,577 | $(4,890 | ) | $ -- | $25,305 | |||||||
|
|
| ||||||||||||||
| Exhibit | Incorporated by Reference | Filed | ||||||||||||
| Number | Exhibit Description | Form | File No. | Exhibit | Filing Date | Herewith | ||||||||
| 2.A | Agreement and | S-4 | 333-83768 | 2.a | 5/10/2002 | |||||||||
| 2.B | Contribution and Distribution Agreement, dated as of | 8-K | 001-5560 | 2.2 | 6/28/2002 | |||||||||
| 2.C | Mexican Stock Purchase Agreement, dated as of June 25, 2002, | 8-K | 001-5560 | 2.3 | 6/28/2002 | |||||||||
| 2.D | Amended and Restated Mexican Asset Purchase Agreement, dated as of June 25, 2002, by and between the Company and Conexant Systems, Inc. | 8-K | 001-5560 | 2.4 | 6/28/2002 | |||||||||
| 2.E | U.S. Asset Purchase Agreement, dated as of December 16, 2001 by and between the Company and Conexant Systems, Inc. | 8-K | 001-5560 | 2.5 | 6/28/2002 | |||||||||
| 3.A | Amended and Restated Certificate of Incorporation | 10-K | 001-5560 | 3.A | 12/23/2002 | |||||||||
| 3.B | Second Amended and Restated By-laws | 10-K | 001-5560 | 3.B | 12/23/2002 | |||||||||
| 4.A | Specimen Certificate of Common Stock | S-3 | 333-92394 | 4 | 7/15/2002 | |||||||||
| 4.B | Form of 4.75% Convertible Subordinated Note of the Company | 10-K | 001-5560 | 4.D | 12/23/2002 | |||||||||
| 4.C | Indenture, dated as of November 20, 2002, by and between the Company and Wachovia Bank, N.A. (as Trustee) | 10-K | 001-5560 | 4.E | 12/23/2002 | |||||||||
| 4.D | First Supplemental Indenture dated as of January 15, 2003 between Skyworks Solutions, Inc. and Wachovia Bank, N.A. (as Trustee) | S-3 | 333-102157 | 4.03 | 1/16/2003 | |||||||||
| 10.A* | Skyworks Solutions, Inc., 1986 Long-Term Incentive Plan as amended | 10-K | 001-5560 | 10.A | 12/14/2005 | |||||||||
| 10.B* | Skyworks Solutions, Inc., Long-Term Compensation Plan dated September 24, 1990; amended March 28, 1991; and as further amended October 27, 1994 | 10-K | 001-5560 | 10.B | 12/14/2005 | |||||||||
| 10.C* | Skyworks Solutions, Inc. 1994 Non-Qualified Stock Option Plan for Non-Employee Directors | 10-K | 001-5560 | 10.C | 12/14/2005 | |||||||||
89
| Exhibit | Incorporated by Reference | Filed | ||||||||||||||
| Number | Exhibit Description | Form | File No. | Exhibit | Filing Date | Herewith | ||||||||||
| 10.D* | Skyworks Solutions, Inc. Executive Compensation Plan dated January 1, 1995 and Trust for the Skyworks Solutions, Inc. Executive Compensation Plan dated January 3, 1995 | 10-K | 001-5560 | 10.D | 12/14/2005 | |||||||||||
| 10.E* | Skyworks Solutions, Inc. 1997 Non-Qualified Stock Option Plan for Non-Employee Directors | 10-K | 001-5560 | 10.E | 12/14/2005 | |||||||||||
| 10.F* | Skyworks Solutions, Inc. 1996 Long-Term Incentive Plan | X | ||||||||||||||
| 10.G* | Skyworks Solutions, Inc. 1999 Employee Long-Term Incentive Plan | 10-K | 001-5560 | 10.L | 12/23/2002 | |||||||||||
| 10.H* | Washington Sub Inc., 2002 Stock Option Plan | S-3 | 333-92394 | 99.A | 7/15/2002 | |||||||||||
| 10.I* | Skyworks Solutions, Inc. Non-Qualified Employee Stock Purchase Plan | 10-K | 001-5560 | 10.N | 12/23/2002 | |||||||||||
| 10.J | Form of Shareholders Agreement, dated as of December 16, 2001, entered into between each of the directors and certain executive officers of the Company as of the date thereof and Conexant Systems, Inc. | S-4 | 333-83768 | 10 | 5/10/2002 | |||||||||||
| 10.K | Registration Rights Agreement, dated as of November 12, 2002, by and among the Company and Credit Suisse First Boston (as representative for the several purchasers) | 10-K | 001-5560 | 10.AA | 12/23/2002 | |||||||||||
| 10.L* | 2002 Skyworks Solutions, Inc. Employee Stock Purchase Plan | 10-K | 001-5560 | 10.CC | 12/23/2002 | |||||||||||
| 10.M | Credit and Security Agreement, dated as of July 15, 2003, by and between Skyworks USA, Inc. and Wachovia Bank, N.A. | 10-Q | 001-5560 | 10.A | 8/11/2003 | |||||||||||
| 10.N | Servicing Agreement, dated as of July 15, 2003, by and between the Company and Skyworks USA, Inc. | 10-Q | 001-5560 | 10.B | 8/11/2003 | |||||||||||
| 10.O | Receivables Purchase Agreement, dated as of July 15, 2003, by and between Skyworks USA, Inc. and the Company | 10-Q | 001-5560 | 10.C | 8/11/2003 | |||||||||||
| 10.P | Terms Agreement, dated as of September 9, 2003, by and among the Company and Credit Suisse First Boston | 8-K | 001-5560 | 1.1 | 9/10/2003 | |||||||||||
| 10.Q* | Form of Notice of Grant of Stock Option for the Company’s 1996 Long-Term Incentive Plan | 8-K | 001-5560 | 10.1 | 11/17/2004 | |||||||||||
| 10.R* | Fiscal 2007 Executive Incentive Compensation Plan | X | ||||||||||||||
90
| Exhibit | Incorporated by Reference | Filed | ||||||||||||
| Number | Exhibit Description | Form | File No. | Exhibit | Filing Date | Herewith | ||||||||
| 10.S* | Skyworks Solutions, Inc. 2005 Long-Term Incentive Plan | 8-K | 001-556 | 10.1 | 5/04/2005 | |||||||||
| 10.T* | Skyworks Solutions, Inc. Directors’ 2001 Stock Option Plan | 8-K | 001-556 | 10.2 | 5/04/2005 | |||||||||
| 10.U* | Form of Notice of Grant of Stock Option for the Company’s 2001 Directors Plan | 8-K | 001-556 | 10.3 | 5/04/2005 | |||||||||
| 10.V* | Form of Notice of Stock Option Agreement under the Company’s 2005 Long-Term Incentive Plan | 10-Q | 001-5560 | 10.A | 5/11/2005 | |||||||||
| 10.W* | Form of Notice of Restricted Stock Agreement under the Company’s 2005 Long-Term Incentive Plan | 10-Q | 001-5560 | 10.B | 5/11/2005 | |||||||||
| 10.X* | Severance and Change in Control Agreement, dated May 31, 2005, between the Company and David J. Aldrich | 8-K | 001-5560 | 10.1 | 5/31/2005 | |||||||||
| 10.Y* | Severance and Change in Control Agreement between the Company and Liam K. Griffin | 8-K | 001-5560 | 10.2 | 5/31/2005 | |||||||||
| 10.Z* | Severance and Change in Control Agreement between the Company and Allan M. Kline | 8-K | 001-5560 | 10.3 | 5/31/2005 | |||||||||
| 10.AA* | Severance and Change in Control Agreement between the Company and George M. LeVan | 8-K | 001-5560 | 10.4 | 5/31/2005 | |||||||||
| 10.BB* | Severance and Change in Control Agreement between the Company and Gregory L. Waters | 8-K | 001-5560 | 10.5 | 5/31/2005 | |||||||||
| 10.CC* | Severance and Change in Control Agreement between the Company and Kevin D. Barber | 8-K | 001-5560 | 10.6 | 5/31/2005 | |||||||||
| 10.DD* | Severance and Change in Control Agreement between the Company and Mark V. B. Tremallo | 8-K | 001-5560 | 10.7 | 5/31/2005 | |||||||||
| 10.EE* | Skyworks Solutions, Inc. Restricted Stock Agreement Granted Under 2005 Long-Term Incentive Plan | 8-K | 001-5560 | 10.1 | 11/15/2005 | |||||||||
| 10.FF* | Amended and Restated Severance and Change in Control Agreement between the Company and Kevin D. Barber | X | ||||||||||||
| 11 | Statement regarding calculation of per share earnings [see Note 2 to the Consolidated Financial Statements] | X | ||||||||||||
| 12 | Computation of Ratios | X | ||||||||||||
| 21 | Subsidiaries of the Company | X | ||||||||||||
| 23.1 | Consent of KPMG LLP. | X | ||||||||||||
| 31.1 | Certification of the Company’s Chief Executive Officer pursuant to Securities and Exchange Act | |||||||||||||
91
| Exhibit | Incorporated by Reference | Filed | ||||||||||||
| Number | Exhibit Description | Form | File No. | Exhibit | Filing Date | Herewith | ||||||||
| Rules 13a- 14(a) and 15d-14(a), as adopted pursuant to Section 302 of the Sarbanes-Oxley Act of 2002 | X | |||||||||||||
| 31.2 | Certification of the Company’s Chief Financial Officer pursuant to Securities and Exchange Act Rules 13a-14(a) and 15d-14(a), as adopted pursuant to Section 302 of the Sarbanes-Oxley Act of 2002 | X | ||||||||||||
| 32.1 | Certification of the Company’s Chief Executive Officer pursuant to 18 U.S.C. Section 1350, as the Sarbanes-Oxley Act of 2002 | X | ||||||||||||
| 32.2 | Certification of the Company’s Chief Financial Officer pursuant to 18 U.S.C. Section 1350, as adopted pursuant to Section 906 of the Sarbanes-Oxley Act of 2002 | X | ||||||||||||
| * | Indicates a management contract or compensatory plan or arrangement. |
92