UNITED STATES
SECURITIES AND EXCHANGE COMMISSION
WASHINGTON, D.C. 20549
_________________________________
FORM 10-K
_________________________________
|
| |
| x | ANNUAL REPORT PURSUANT TO SECTION 13 or 15(d) OF THE SECURITIES EXCHANGE ACT OF 1934 |
For the fiscal year ended February 28, 2015March 4, 2017
|
| |
| ¨ | TRANSITION REPORT PURSUANT TO SECTION 13 or 15(d) OF THE SECURITIES EXCHANGE ACT OF 1934 |
For the transition period from to
Commission File Number: 0-6365
_________________________________
APOGEE ENTERPRISES, INC.
(Exact name of registrant as specified in its charter)
|
| | |
| Minnesota | | 41-0919654 |
(State or other jurisdiction of incorporation or organization) | | (I.R.S. Employer Identification No.) |
| | | |
4400 West 78th Street – Suite 520, Minneapolis, MN | | 55435 |
| (Address of principal executive offices) | | (Zip Code) |
Registrant’s telephone number, including area code: (952) 835-1874
Securities registered pursuant to Section 12(b) of the Act: |
| | | | |
| Title of each class | | Name of each exchange on which registered |
| Common Stock, $0.33 1/3 Par Value | | The NASDAQ Stock Market LLC |
Securities registered pursuant to Section 12(g) of the Act: None
________________________________
Indicate by check mark if the registrant is a well-known seasoned issuer, as defined in Rule 405 of the Securities Act.
¨ Yes x No
Indicate by check mark if the registrant is not required to file reports pursuant to Section 13 or Section 15(d) of the Act.
¨ Yes x No
Indicate by check mark whether the registrant (1) has filed all reports required to be filed by Section 13 or 15(d) of the Securities Exchange Act of 1934 during the preceding 12 months (or for such shorter period that the registrant was required to file such reports), and (2) has been subject to such filing requirements for the past 90 days. x Yes ¨ No
Indicate by check mark whether the registrant has submitted electronically and posted on its corporate Web site, if any, every Interactive Data File required to be submitted and posted pursuant to Rule 405 of Regulation S-T during the preceding 12 months (or for such shorter period that the registrant was required to submit and post such files). x Yes ¨ No
Indicate by check mark if disclosure of delinquent filers pursuant to Item 405 of Regulation S-K is not contained herein, and will not be contained, to the best of registrant's knowledge, in definitive proxy or information statements incorporated by reference in Part III of this Form 10-K or any amendment to this Form 10-K. ¨x
Indicate by check mark whether the registrant is a large accelerated filer, an accelerated filer, a non-accelerated filer, or a smaller reporting company or an emerging growth company. See the definitions of “large accelerated filer,” “accelerated filer” andfiler,” “smaller reporting company” and "emerging growth company" in Rule 12b-2 of the Exchange Act.
|
| | | | | | |
| Large accelerated filer | | x | | Accelerated filer | | ¨ |
| | | | | | | |
| Non-accelerated filer | | ¨ (Do not check if a smaller reporting company) | | Smaller reporting company | | ¨ |
| Emerging growth company | | ¨ | | | | |
| If an emerging growth company, indicate by check mark if the registrant has elected not to use the extended transition period for complying with any new or revised financial accounting standards provided pursuant to Section 13(a) of the Exchange Act. | | ¨ |
Indicate by check mark whether the registrant is a shell company (as defined in Rule 12b-2 of the Exchange Act). ¨ Yes x No
As of August 30, 201427, 2016, the last business day of the registrant's most recently completed second fiscal quarter, the approximate aggregate market value of voting and non-voting common equity held by non-affiliates of the registrant was $1,057,000,0001,386,000,000 (based on the closing price of $36.5147.97 per share as reported on the NASDAQ Stock Market LLC as of that date).
As of April 24, 2015, 29,181,87426, 2017, 28,679,636 shares of the registrant’s common stock, par value $0.33 1/3 per share, were outstanding.
DOCUMENTS INCORPORATED BY REFERENCE
Certain information required in Part III hereof is incorporated by reference to the Proxy Statement for the registrant's 20152017 Annual Meeting of Shareholders to be filed with the Securities and Exchange Commission pursuant to Regulation 14A not later than 120 days after the end of the fiscal year covered by this Form 10-K.
APOGEE ENTERPRISES, INC.
Annual Report on Form 10-K
For the fiscal year ended February 28, 2015March 4, 2017
TABLE OF CONTENTS
PART I
ITEM 1. BUSINESS
The Company
Apogee Enterprises, Inc. (Apogee, the Company or we) was incorporated under the laws of the State of Minnesota in 1949. The Company believes it isWe are a world leader in certain technologies involving the design and development of value-added glass solutions for enclosing commercial buildingsproducts and framing art. Unless the context otherwise requires, the terms "Company," "Apogee," "we," "us" and "our" as used herein refer to Apogee Enterprises, Inc. and its subsidiaries.services.
TheOur Company is comprised ofhas four reporting segments:segments, with three of the segments serving the commercial construction market:
The Architectural Glass segment fabricates coated, high-performance glass used globally in customized window and curtainwall systems comprising the outside skin of buildings.wall systems. For fiscal 20152017, ourthe Architectural Glass segment accounted for approximately 3433 percent of our net sales.
The Architectural Services segment primarily installs and renovates customized aluminum and glass window and curtainwall systems comprising the outside skin of buildings. It also designs, engineers and fabricates a majority of the metal systems it installs. For fiscal 2015, our Architectural Services segment accounted for approximately 25 percent of our net sales.
The Architectural Framing Systems segment designs, engineers, fabricates and fabricatesfinishes the aluminum frames used in customized aluminum and glass window, curtainwall, storefront and entrance systems comprising the outside skin and entrances of buildings. For fiscal 2015, our2017, the Architectural Framing Systems segment accounted for approximately 35 percent of our net sales.
The 32Architectural Services segment provides full-service installation of the walls of glass, windows and other curtainwall products making up the outside skin of buildings. For fiscal 2017, the Architectural Services segment accounted for approximately 24 percent of our net sales.
The Large-Scale Optical Technologies (LSO) segment manufactures value-added glass and acrylic products primarily for the custom picture framing market.and display applications. For fiscal 2015, our Large-Scale Optical Technologies2017, this segment accounted for approximately 98 percent of our net sales.
Financial information aboutOn December 14, 2016, we acquired substantially all the Company's segmentsassets of Sotawall, Inc. (now operating under the name Sotawall Limited or "Sotawall"), a privately-held designer and geographic regions can be foundfabricator of high-performance, unitized curtainwall systems for commercial construction projects based in Item 8, Note 16 to the Consolidated Financial Statements of the Company contained elsewhere in this report.
On November 5, 2013, the Company acquired all of the shares of Alumicor Limited (Alumicor). Alumicor'sToronto, Canada area, for approximately $138 million. Sotawall's results of operations arehave been included in ourthe consolidated financial statements and within the Architectural Framing Systems segment. Forsegment since the date of acquisition.
Strategy
Our overall strategy in the Architectural Glass and Architectural Framing Systems segments is to deliver growth faster than our commercial construction markets. We accomplish this through geographic and market segment expansion and new product offerings, while differentiating ourselves through superior service and lead times. In recent years, we have increased our focus on window and curtainwall retrofit and renovation of existing commercial buildings. We have seen increased interest from the non-residential and high-end multi-family residential building sectors in upgrading façades and improving energy efficiency. We consider this to be a significant opportunity for Apogee in the coming years.
In the Architectural Services segment, our emphasis is on improving margins through focused project selection, while continuing to deliver organic growth in line with our available project management capacity.
Within the LSO segment, our strategy is to grow domestically and internationally by continuing to convert the custom picture framing and fine art markets from clear uncoated glass and acrylic products to value-added products that protect art from UV damage and minimize reflection. Additionally, we have begun to enter new display markets that desire the value-added properties our glass and acrylic products provide in an effort to diversify LSO's product offerings.
We believe each of our segments has the ability to grow organically through entry into new geographies, further information, see "Acquisitionpenetration in existing geographies and introduction of Alumicor" below.new products. We also regularly evaluate business development opportunities in adjacent sectors. Any of these strategies can also be executed by acquisition or strategic alliances.
Finally, we are constantly working to improve the efficiency and productivity of our operations by implementing lean manufacturing disciplines and automation. We expect these efforts to continue to deliver gross margin expansion into the foreseeable future.
Products and Services
Apogee provides distinctive value-added glass solutions for enclosing commercial buildings and framing art. We operate in four segments as described in the following paragraphs.
Architectural Glass, Architectural ServicesFraming Systems and Architectural Framing Systems SegmentsServices segments
All of theseThese segments participate in various phases of the value chain to design, engineer, manufacturefabricate and install customized aluminumglass and glassaluminum window, curtainwall, and storefront and entrance systems for commercialcomprising the outside skin of buildings in the non-residentialcommercial, institutional and high-end multi-family residential construction markets. Through complex processes,sectors.
In our Architectural Glass segment, we add ultra-thin, high-performance coatings to uncoated architectural glass to create a variety of aesthetic characteristics, unique designs and differentenergy efficiency, including varying levels of solar energy management, especially importantaligned with the industry trend of increasingly energy-efficient buildings. We also laminate layers of glass and vinyl to create glass that helps protect against hurricanes and bomb blasts. Glass can also be temperedother severe impacts, and temper, or heat strengthen, glass to provide additional strength. In addition,Our high-performance glass is
custom made-to-order and is typically fabricated into insulating and/or laminated glass units for installation into window, curtainwall, storefront or entrance systems.
Within our Architectural Framing Systems segment, we have the ability to design and build windows,fabricate window, curtainwall, storefront and entrancesentrance systems using our customized aluminum and glass, or glass supplied by others. We also provide finishing services for the metal components used in windows and curtainwall, as well as plastic components used to frame architectural glass windowsfor other products.
By integrating technical capabilities, project management skills and walls and other products. Ourfield installation services, allowour Architectural Services segment provides design, engineering, fabrication and installation expertise for the outside skin of buildings. Our ability to efficiently design high-quality window and curtainwall systems and effectively manage the installation of building façades allows our customers to meet or exceed the timing and cost requirements of their jobs by providing efficiently designed quality window and wall systems and effectively managing the installation of the façade on their building projects.jobs.
Our product choicesand service offerings allow architects to create distinctive looks for office towers, hotels, education facilities and dormitories, health care facilities, government buildings, retail centers and multi-family residential buildings, while meeting functional requirements such as energy efficiency, hurricane, blast and other impact resistance and/or sound control.
The following table describes the products provided by these segments.
|
| | | | | | |
Products | | Product Attributes | | Participating Segment | | Description |
High-Performance Glass
| | Custom Manufactured-to-Order | | Architectural Glass | | We offer a wide range of glass colors and high-performance coatings that allow us to create unique designs, achieve specific light transmission levels and provide solar control options for energy efficiency. Additional value-added processes, such as digital printing, silk-screening and heat soaking, can be incorporated into the glass. High-performance glass is typically fabricated into custom insulating units and/or laminated units to allow for installation into window, curtainwall, storefront or entrance systems. |
Installation | | New Construction and Renovation Services | | Architectural Services | | We install curtainwall, window, storefront and entrance systems for new commercial and institutional buildings as well as for renovation of existing buildings. By integrating technical capabilities, project management skills and field installation services, we provide design, engineering, fabrication and installation expertise for the building envelope to building owners, architects and general contractors. |
Aluminum Framing | | Standard, Custom and Engineered-to-Order | | Architectural Framing Systems
and Architectural Services | | Varying degrees of customization of our window, curtainwall, storefront and entrance systems are available depending on the customer's project requirements. In-house engineering capabilities allow us to meet the architect's design requirements. Our window systems can be operable or non-operable. Our curtainwall systems may be unitized (shop fabricated) or field fabricated. Depending on the requirements, we paint or anodize the aluminum components. |
All of the businesses within the Architectural Glass, Architectural Services and Architectural Framing Systems segments manufacture their products to order. Products are shipped to the job site or other location where further assembly or installation may be required by the respective segment's customers.
Large-Scale Optical Technologies (LSO) SegmentLSO segment
The LSO segment provides coated glass and acrylic primarily for use in custom picture framing and fine artdisplay applications. The variables in the glass and acrylic used for picture framing products are theProducts vary based on size and coatings applied to give the productprovide conservation-grade UV protection, anti-reflective and anti-static properties and/or security features. The following table describes the products provided by the LSO segment.
|
| | | | |
Products and Services | | Product Attributes | | Description |
Value-Added Picture Framing Glass and Acrylic | | UV, Anti-Reflective and/ or Security Features | | Our coatings reduce the reflectivity of picture framing glass and protect pictures and art from the sun's damaging UV rays. Anti-reflective coatings on acrylic reduce glare and static charge on the surface. |
Product Demand and Distribution Channels
Architectural Glass, Architectural ServicesFraming Systems and Architectural Framing Systems SegmentsServices segments
Demand for the products and services offered by our Architectural segments is affected by changes in the North American commercial construction industries, as well as by changes in general economic conditions. Additionally, the Architectural Glass segment has an operation in Brazil and is, therefore, also impacted by Brazil's commercial construction industry and general economic conditions.
We look at several external indicators to analyze potential demand for our products and services, such as U.S. job growth, office space vacancy rates, credit and interest rates available for commercial construction projects, architectural billing statistics and material costs. We also rely on our own internal indicators to analyze demand. This includes our sales pipeline, made up of contracts in review, projects awarded or committed, and bidding activity. Our sales pipeline, together with ongoing feedback, analysis and data from our customers, architects and building owners, provide visibility into near- and medium-term future demand. Additionally, we evaluate data on U.S. non-residential construction market activity, industry analysis and longer-term trends provided by external data sources.
Our architectural products and services are used in a subsetsubsets of the construction industry that is differentiated by building type, level of customization required, customers, geographic location and project size. Published data is not readily available for the specific segments that we serve; however, we estimate demand by analyzing data for the overall U.S. and Canadian construction industry.
Building type - The construction industry is typically segmented into residential construction and non-residential construction, which includes commercial, industrial and institutional construction. Apogee is a leading supplier of architectural glass and metal framing products, as well as installation services, to the non-residential construction industry. Our products and services are primarily used in commercial buildings (office towers, hotels and retail centers) and institutional buildings (education facilities and dormitories, health care facilities and government buildings), as well as in high-end multi-family residential buildings (a subset of residential construction).
Level of customization - MostThe large majority of our projects have someinvolve a high degree of customization, as the end product or service is based on customer-specified requirements for aesthetics, and performance and size, and is designed to satisfy local building codes. All of our Architectural Glass, Architectural Services and Architectural Framing Systems businesses are involved in transforming glass, aluminum or other materials to create customized window, curtainwall, storefront and/or entrance systems that meet customer specifications. The only constant is the base materials of the products and the processes we utilize to fabricate, manufacture and/or install the products.
Customers and distribution channels - Our customers are mainly glazing subcontractors and those that influence the projects include architects, building owners, general contractors, with project design being influenced by architects and glazing subcontractors.building owners. Our high-performance architectural glass is marketedprimarily sold using a direct sales force and independent sales representatives. Our installation and renovationInstallation services are marketed by a direct sales force primarilyin certain metropolitan areas in the metropolitan areas we serve in the United States andU.S. We also where we have the ability to work with our customers in otherprovide remote project management throughout the U.S. markets. We market our custom and standard windows, curtainwall, storefront and entrance systems using a combination of a direct sales force,forces, independent sales representatives and distributors.
Geographic location - From our glass fabrication locations in the U.S., weWe primarily supply architectural glass products to customers in the U.S.,North America, with some international distributionsales of our high-performance architectural glass. We estimate the U.S. demand for architectural glass fabrication in non-residential buildings is approximately $1.3in excess of $1 billion in annual sales. From our Brazilian glass fabrication facility, we primarily supply architectural glass in Brazil, where we estimate demand to be approximately $0.3 billion in annual sales.annually. Our aluminum framing systems, including windows, curtainwall, storefront and entrances, are marketed in the U.S. and Canada, whereand we estimate demand is approximately $2.8to be in excess of $3 billion in annual sales.annually. In installation
We estimate the U.S. demand for installation services, is approximately $10.5 billion in annual sales. Within the installation services industry, Apogee iswe are one of only a few architectural glass installation companies in the U.S. to have a national presence, with 11 offices and satellite offices serving multiplewe estimate the U.S. geographies. We estimate that we are abledemand to service approximately 60 percentbe in the range of the total installation demand from our existing locations and our ability$10 to travel to other geographies where we do not have a local presence. Although installation of building glass in new commercial and institutional construction projects is the primary focus of our business, we also offer installation retrofits or renovations for the outside skin of older commercial and institutional buildings.$15 billion.
Project size - The projects on which ourOur Architectural Glass Architectural Services and Architectural Framing Systems segments bid and work vary in size. Our high-performance Architectural Glass fabrication productssegment primarily serveserves mid-size to monumental high-profile projects. Our Architectural Services segment servesFraming Systems primarily targets small and mid-size projects, and the Architectural Framing Systems segment targetsServices primarily serves mid-size and small projects.
LSO Segmentsegment
The Company's Tru Vue brand isIn our LSO segment, we have the largest domestically manufactured brand forof value-added glass and acrylic for custom picture framing. Through the Company's leadership,used in the custom picture framing industry continues to convert from clear glass to value-added glass and acrylic.market. Under thisthe Tru Vue brand, products are distributedsold primarily in North America through regionalnational and nationalregional retail chains using a direct sales force, as well as through local picture framing shops viausing an independent distribution network. The Company hasWe also been successful in supplyingsupply our glass and acrylic products to museums and public and private galleries. We also have distribution in Europegalleries and other international geographiescollections worldwide through independent distributors;distributors.
Competitive Conditions
Architectural Glass, Architectural Framing Systems and Architectural Services segments
The North American commercial construction market is highly fragmented. Competitive factors include price, product quality, product attributes and performance, reliable service, on-time delivery, lead-time, warranty and the ability to provide technical engineering and design services. To protect and enhance our competitive position, we view thismaintain strong relationships with architects, who influence the selection of products and services on a project, and with general contractors, who initiate projects and develop specifications.
In our Architectural Glass segment, we experience competition from regional glass fabricators who can provide certain products with attributes similar to our products. Within the market sector for large, complex projects, we encounter competition from international companies, which have products that may be equivalent to or have different characteristics than we provide. This international competition has strengthened in recent years due to the relative strength of the U.S. dollar.
The commercial window and storefront manufacturing industry is highly fragmented, and our Architectural Framing Systems segment competes against several national, regional and local aluminum window and storefront manufacturers, as a focus areawell as regional paint and anodizing companies. When providing installation services, our Architectural Services segment competes against national, regional and local glass installation companies.
LSO segment
Product attributes, price, quality, marketing and service are the primary competitive factors in the LSO segment. Our competitive strengths include our excellent relationships with customers, innovative marketing programs and the performance of our value-added products. We compete with certain European valued-added glass and acrylic products for future growth of this segment.picture framing.
Warranties
We offer product and service warranties that we believe are competitive for the markets in which our products and services are sold. The nature and extent of these warranties depend upon the product or service, the market and, in some cases, the customer being served. Our standard warranties are generally from two to 10 years for our architectural glass, curtainwall and window system products, while we generally offer warranties of two years or less on our other products and installation services. In the event of a claim against a product for which we have received a warranty from the supplier, we pass the claim back to our supplier. Although we carry liability insurance with very high deductibles for product failures, we reserve for warranty exposures, as our insurance does not cover warranty claims. There can be no assurance that our insurance will be sufficient to cover all product failure claims in the future; that the costs of this insurance and the related deductibles will not increase materially; or that liability insurance for product failures will be available on terms acceptable to the Company in the future.
Sources and Availability of Raw Materials
MaterialsRaw materials used within the Architectural Glass segment include flat glass, vinyl, silicone sealants and lumber. The Architectural Framing Systems segmentssegment's materials include raw glass, aluminum billet and extrusions, vinyl, metal targets, insulatedfabricated glass, spacer frames, silicone, plastic extrusions, desiccant, chemicals, paints, lumberhardware, paint and urethane.chemicals. Within the Architectural Services segment, materials used include fabricated glass, aluminum extrusions silicone, plastic extrusions and fabricated metal panels. The LSO segment mainly uses glass hard-coated acrylic, acrylic substrates, metal targets, coating materials and chemicals.
Glass manufacturers have applied surcharges to the cost of glass over the past several years to help offset increases in energy and fuel costs, which we are generally able to pass on to our customers through surcharges. We have also seen recent volatility in the cost of aluminum that is used in our window, storefront, entrance and curtainwall systems. Where possible, we have passed the changes in cost of materials on to our customers in the form of pricing adjustments and/or surcharges.
acrylics. A majority of our raw materials are readily available from a variety of domestic and international sources. While certain glass products may only be available at certain times of the year, all standard glass types and colors are available throughout the year
in reasonable quantities from multiple suppliers. Although we expect glass supply to become tighter in the U.S. due to the recent economic upturn across many industries that consume glass, including automotive manufacturing, residential construction and non-residential construction, no supplier delays or shortages are anticipated.
Trademarks and Patents
The Company hasWe have several trademarks and trade names that we believe have significant value in the marketing of our products, including APOGEE®. Trademark registrations in the United StatesU.S. are generally for a term of 10 years, renewable every 10 years as long as the trademark is used in the regular course of trade.
Within the Architectural Glass segment, VIRACON®, VIRACON VUE-50®, DIGITALDISTINCTIONS®, ROOMSIDE®, EXTREMEDGE®, BUILDING DESIGN®and STORMGUARD,GLASS IS EVERYTHING®, CLEARPOINT®, CYBERSHIELD® and STORMGUARD® are registered trademarks. GLASS IS EVERYTHING™, VIRASPAN™, CLEAR POINT™ and CYBERSHIELD™ are is an unregistered trademarks.trademark. In addition, GLASSEC®, INSULATTO® and BLINDATTO® are registered trademarks in Brazil. GLASSECVIRACON™ is an unregistered trademark in Brazil.
Within the Architectural Services segment, HARMON®, HARMON GLASS®, HI - 7000® and INNOVATIVE FACADE SOLUTIONS® and are registered trademarks. UCW-8000™, HI-8500™, HI-9000™, SMU-6000™ and HPW-250™ are unregistered trademarks.
Within the Architectural Framing Systems segment, LINETEC®, WAUSAU WINDOW AND WALL SYSTEMS®, TUBELITE®, ADVANTAGE BY WAUSAU®, 300ES®, FINISHER OF CHOICE®, THERML=BLOCK®, MAXBLOCK®, DFG®, ECOLUMINUM®, ALUMINATE®, GET THE POINT!®, FORCEFRONT®, SOTAWALL®, SOTA® and FORCEFRONTHYBRID-WALL® are registered trademarks. CUSTOM WINDOW™, INVENT™, INVENT.PLUS™, INVENT RETRO™, INVISION™, CLEARSTORY™, EPIC™, HERITAGE™, VISULINE™, SEAL™, SUPERWALL™ and SUPERWALL™CROSSTRAK™ are unregistered trademarks. ALUMICOR™ and BUILDING EXCELLENCETM are unregistered trademarks in Canada.
Within the Architectural Services segment, HARMON®, H DESIGN®, HARMON GLASS®, HI-7000® and INNOVATIVE FAÇADE SOLUTIONS® are registered trademarks. UCW-8000™, HI-8500™, HI-9000™, SMU-6000™, HPW-250™ and BUILDING TRUST IN EVERYTHING WE DO™ are unregistered trademarks.
Within the LSO segment, TRU VUE®, CONSERVATION CLEAR®, CONSERVATION MASTERPIECE ACRYLIC®, CONSERVATION REFLECTION CONTROL®, ULTRAVUE®, MUSEUM GLASS®, OPTIUM®, PREMIUM CLEAN®, REFLECTION CONTROL®, AR REFLECTION - FREEREFLECTION-FREE®, TRU VUE AR®, OPTIUM ACRYLIC®, OPTIUM MUSEUM ACRYLIC®, CONSERVATION MASTERPIECE®, STATICSHIELD®, TRULIFE® and STATICSHIELDVISTA AR® are registered trademarks. TRULIFE™TRULIFE INFINITY FRAMETM, THE DIFFERENCE IS CLEARTM and VISTA AR™TRU FRAMEABLE MOMENTSTM are unregistered trademarks.
The Company hasWe have several patents pertaining to our glass coating methods and products, including our UV coating and etch processes for anti-reflective glass for the picture framing industry.industry and fine art market, as well as a patent for an indirect daylighting device and patents for hybrid window wall/curtain wall systems and methods of installation. Despite being a point of differentiation from itsour competitors, no single patent is considered to be material to the Company.material.
Seasonality
The North American businessesWe do not experience a significant seasonal effect in our Architectural Glass, Architectural Services and Architectural Framing Systems segments experience a slight seasonal effect following the commercial construction industry. Our Brazilian Architectural Glass segment business does not have a significant seasonal trend. A bigger impact to net sales is the fact thatsegments. However, the construction industry is highly cyclical in nature and can be influenced differently by the effects of the local economies in geographies where our products are marketed.economies.
Within the LSO segment, picture framing glass and acrylic sales tend to increase in the September to December timeframe. However,September-to-December timeframe, but the timing of customer promotional activities may offset some of this seasonal impact.
Working Capital Requirements
Trade accounts receivable is the largest component of working capital for the Company, including receivables relating to contractual retention amounts that can be outstanding throughout the projecta project's duration within the Architectural Services segment. Payment terms offered to our customers are similar to those offered by others in the industry. For the Architectural Glass and Architectural Framing Systems segments, inventoryInventory requirements are not significant since these businesses make-to-order rather than build-to-stock for the majorityin any of their products. As a result, inventory levels follow customer demand for the products produced.
Sinceour segments, although the LSO segment builds-to-stock for the majority of its products, it requires greater inventory levels as it builds to stock to meet the demands of its customers.
Dependence on a Single Customer
We do not have any one customer that exceeds 10 percent of the Company's consolidated net sales. However, there are important customers within each of our segments; the loss of one or more customers could have an adverse effect on the Company.
Backlog
Backlog represents the dollar amount of revenues we expectsigned contracts or firm orders, generally as a result of a competitive bidding process, which is expected to recognizebe recognized as revenue primarily in the future from firm contracts or orders received, as well as those that are in progress.near-term. Backlog is not a term defined under generally accepted accounting principlesU.S. GAAP and is not a measure of contract profitability. We include a project within our backlog at the time a signed contract or a firm purchase order is received, generally as a result of a competitive bidding process. Backlog by reporting segment at February 28, 2015, November 29, 2014 and March 1, 2014 was as follows:
|
| | | | | | | | | | | |
| (In thousands) | February 28, 2015 | | November 29, 2014 | | March 1, 2014 |
| Architectural Glass | $ | 137,432 |
| | $ | 151,221 |
| | $ | 73,206 |
|
| Architectural Services | 287,473 |
| | 268,696 |
| | 187,471 |
|
| Architectural Framing Systems | 77,666 |
| | 88,070 |
| | 72,634 |
|
| Large-Scale Optical | 2,107 |
| | 2,100 |
| | 870 |
|
| Intersegment eliminations | (13,886 | ) | | (16,173 | ) | | (4,546 | ) |
| Total Backlog | $ | 490,792 |
| | $ | 493,914 |
| | $ | 329,635 |
|
We expect approximately $393.4 million, or 80 percent, of our February 28, 2015 backlog to be recognized in fiscal 2016, with the balance to be recognized in fiscal 2017 and beyond. We view backlog as an important statistic in evaluating the level of sales activity and short-term sales trends in our business. However, as backlog is only one indicator, and isshould not an effective indicator of our ultimate profitability, we do not believe that backlog should be used as the sole indicator of our future earningsrevenue because we have a substantial amount of the Company.
Competitive Conditions
Architectural Glass, Architectural Services and Architectural Framing Systems segments
The markets served by the Architectural Glass, Architectural Services and Architectural Framing Systems segments are very competitive, price and lead-time sensitive, and primarily affected by changes in the North American commercial construction industry, as well as changes in general economic conditions. Additionally, due to the Architectural Glass segment's operations in Brazil, it is impacted by the commercial construction industry and general economic conditions in Brazil and the surrounding region.
Interest rates, credit availability for commercial construction projects material costs, employment rates, office vacancy rates, building construction starts and office absorption rates are key indicators to the commercial construction market conditions. As each of these economic indicators moves favorably, our businesses typically experience sales growth, and vice-versa.
These segments primarily serve the custom portion of the commercial construction industry, which is generally highly fragmented. The primary competitive factors are price, product quality, reliable service, on-time delivery, warranty and the ability to provide technical engineering and design services. There is potential to offset some competitive pressures in the market for newly constructed buildings through increased renovation of the exteriors of commercial and institutional buildings using some of our segments' products and services due to their premium energy-efficiency properties.
We believewith short lead times that our domestic competition does not providebook-and-bill within the same level of custom coatings to the industryreporting period that are not included in backlog. We have strong visibility beyond backlog as our projects awarded, verbal commitments and bidding activities are monitored separately and not included in backlog.
Architectural Glass segment but regional glass fabricators can provide somewhat similar products with similar attributes. Regional glass fabricators incorporate high performance, post-temperable glass products, procured from primary glass suppliers, into their insulated glass products. The availabilitybacklog as of these products has enabled regional glass fabricators in some casesyear-end was $66.4 million, compared to bid on more complex projects than$62.4 million in the past. Since we typically target the more complexprior year, net of intersegment eliminations. This segment has strategically shortened lead-times, with capability and productivity improvements, in order to serve mid-size projects we have encountered increased competition from these regional glass fabricators. In certain regionswhere there is a higher level of the U.S., we encounter competition from international competitors on complex projects.book-and-bill activity within quarters. The backlog is all expected to be filled in fiscal 2018.
When providing glass installation services, our Architectural Services segment largely competes against regional and local construction companies and installation contractors, and periodically against other larger national companies. The commercial window and storefront manufacturing industry is highly fragmented and our Architectural Framing Systems segment competes against several major aluminum windowbacklog has grown to $245.4 million at year-end, compared to $123.0 million at the end of the prior year, due to recent increased order activity, particularly of longer lead-time contracts. The acquisition of Sotawall contributed approximately $70 million to this segment's backlog. Approximately 75 percent of the backlog in this segment is expected to be filled in fiscal 2018, with the remainder expected to be filled in fiscal 2019 and storefront manufacturers. Our architectural finishing business competes against regional paint and anodizing companies.beyond.
Our businessesBacklog in the Architectural Glass, Architectural Services and Architectural Framing Systems segments maintain significant relationships with architects, who influence the selection of products and services on a project. Additionally, throughout a construction project, the Architectural Services segment must maintain significant relationships with general contractors, who aredeclined from $320.4 million at the segment's direct customers. This isend of the prior year to $255.1 million at March 4, 2017, due to the high degree of dependence on general contractors and architects for project initiation and development of specifications. Additionally, the timing of a project depends on the schedule established by the general contractorsfirm orders and their ability to maintain this schedule. If a general contractor fails to keep a construction project on its established timeline, the timing and profitabilitysigned contracts. Approximately 67 percent of the project couldbacklog in this segment is expected to be negatively impacted.filled during fiscal 2018, with the remainder expected to be filled in fiscal 2019 and beyond.
LSO Segment
Product attributes, pricing, quality, marketing, and marketing support are the primary competitive factors inBacklog is not a significant metric for the LSO segment. The Company's competitive strengths include our excellent relationships with customerssegment, as orders are typically booked and the performance provided by our unique value-added products. While there is significant price sensitivity in regard to sales of clear glass to picture framers, there is somewhat less price sensitivity on certain of our value-added glass products due to their unique attributes. There is competition in North America with European imports of certain valued-added products for picture framing.billed within a short time frame.
Research and Development
The amount spent on research and development activities was $6.5$8.6 million,, $7.8 $8.0 million and $6.8$6.5 million in fiscal 2015, 20142017, 2016 and 2013,2015, respectively. Of this amount, $2.4$2.2 million,, $2.1 $2.4 million and $1.6$2.4 million,, respectively, waswere focused primarily upon design of custom window and curtainwall systems in accordance with customer specifications and isare included in cost of sales in the accompanying consolidated financial statements.
Environment
We use hazardous materials in our manufacturing operations, and have air and water emissions that require controls. As a result, we are subject to stringent federal, state and local regulations governing the storage and use of these materials and disposal of wastes. We contract with outside vendors to collect and dispose of waste at our production facilities in compliance with applicable environmental laws. In addition, we have procedures in place that we believe enable us to properly manage the regulated materials used in our manufacturing processes and wastes created by the production processes, and we have implemented a program to monitor our compliance with environmental laws and regulations. Although wemanufacturing processes. We believe we are currently in material compliance with such laws and regulations, current or future laws and regulations could require us to make substantial expenditures for compliance with chemical exposure, waste treatment or disposal regulations. We spent approximately $0.2 million, $0.5 million and $0.1 million in fiscal 2015, 2014 and 2013, respectively, to reduce wastewater solids and hazardous air emissions at our facilities. We expectWhile we will continue to incur environmental compliance costs to continue to comply with laws and regulations in the future for our ongoing manufacturing operations, butwe do not expect these to be material to our consolidated financial statements.
As part of the acquisition of Tubelite Inc. (Tubelite) on December 21, 2007,In fiscal 2008, we acquired aone manufacturing facility which hasthat had certain historical environmental conditions. We believe that Tubelite is a “responsible party” for certain of these historical environmental conditions, and the Company isare working to remediate those conditions. The Company believesconditions, and the remediation activities can beare being conducted without significant disruption to manufacturing operations at this facility. As of February 28, 2015, the environmental reserve balance was $1.8 million.our operations.
Employees
The Company employed 5,511 and 4,614 persons on 4,802March 4, 2017 and 4,266 persons on February 28, 2015 and March 1, 201427, 2016, respectively. At February 28, 2015, 416March 4, 2017, 624 of these employees were represented by U.S. labor unions and unions.294 of these employees were represented by labor unions in Brazil.
Acquisition of Alumicor
On November 5, 2013, the Company acquired all of the shares of Alumicor Limited, a privately held business, for $52.9 million, including cash acquired of $1.6 million. Alumicor is a window, storefront, entrance and curtainwall company primarily serving the Canadian commercial construction market. Alumicor's results of operations are included in the Architectural Framing Systems segment. Item 8, Note 6 of the Notes to the Consolidated Financial Statements contains further information regarding this acquisition.
International Sales
Information regarding export and international sales is included in Item 8, Financial Statements and Supplementary Data, within Note 16 of the Notes to theour Consolidated Financial Statements.
Available Information
The Company maintains a website at www.apog.com. Through a link to a third-party content provider, this corporate website provides free access to the Company's Annual Reports on Form 10-K, Quarterly Reports on Form 10-Q, Current Reports on Form 8-K and, if applicable, amendments to those reports filed or furnished pursuant to Section 13(a) or 15(d) of the Securities Exchange Act of 1934, as amended (the Exchange Act), as soon as reasonably practicable after electronic filing such material with, or furnishing it to, the Securities and Exchange Commission. Also available on our website are various corporate governance documents, including our Code of Business Ethics and Conduct, Corporate Governance Guidelines, and charters for the Audit, Compensation, and Nominating and Corporate Governance Committees of the Board of Directors.
EXECUTIVE OFFICERS OF THE REGISTRANT
|
| | | | | |
| Name | | Age | | Positions with Apogee Enterprises and Five-Year Employment History |
| Joseph F. Puishys | | 56 |
58 | | Chief Executive Officer and President of the Company since August 2011. President of Honeywell's Environmental and Combustion Controls division from 2008 through 2011, President of Honeywell's Building Solutions from 2005 through 2008, and President of Honeywell Building Solutions, America from 2004 to 2005. |
| James S. Porter | | 54 |
56 | | Chief Financial Officer since October 2005.2005 and Executive Vice President since 2015. Vice President of Strategy and Planning from 2002 through 2005. Various management positions within the Company since 1997. |
| Patricia A. Beithon | | 61 |
63 | | General Counsel and Secretary since September 1999. |
| Gary R. Johnson | | 53 |
55 | | Vice President, Treasurer since January 2001. Various management positions within the Company since 1995. |
| John A. Klein | | 59 |
60 | | Senior Vice President, Operations and Supply Chain Management of the Company since April 2012. Director of Operations at Cooper Industries' Power Systems Division from 2008 through 2012, and Vice President of Operations at Rexnord Industries' Bearing Division from 2005 through 2007. |
Executive officers are elected annually by the Board of Directors andto serve for a one-year period. There are no family relationships between any of the executive officers or directors of the Company.
ITEM 1A. RISK FACTORS
Our business faces many risks. Any of the risks discussed below, or elsewhere in thethis Form 10-K or our other filings with the Securities and Exchange Commission, could have a material adverse impact on our business, financial condition or results of operations.
General global economic and business conditions could negatively affect our results.
Our Architectural Glass, Architectural ServicesFraming Systems and Architectural Framing SystemsServices segments are dependent on global economic conditions and the cyclical nature of the North American commercial construction industry. The commercial construction industry is impacted negatively by volatilityglobal macroeconomic trends that, in global financial markets, including,turn, affect, among other things, volatility in securities prices, availability of credit, unemployment rates,employment levels, consumer confidence, interest rates and commodity prices. To the extent changes in these factors negatively impact the overall commercial construction industry, our revenue and profits could be significantly reduced.
Our Architectural Glass segment's operation located in Brazil is subject to the economic, political and tax conditions prevalent in the region. The economic conditions in this region are subject to different growth expectations, market weaknesses and business practices than seen in the U.S.country. We cannot predict how changing economic conditions in this regionBrazil will impact our financial results.results; however, our Brazilian operation makes up less than five percent of our net sales annually.
Our LSO segment depends on the strength of the retail custom picture framing industry. This industry is highly dependent on consumer confidence and the conditions of the U.S. economy. IfA decline in consumer confidence, declines, whether as a result of an economic slowdown, uncertainty regarding the future or other factors, our use of these strategies may not be as successfulcould result in the future, resulting in a potential decrease in net sales and operating income.
Unfavorable fluctuations in foreignForeign currency exchange rates could negatively impact our results and financial position.impacts
Our subsidiaries in Canada and Brazil report their results of operations and financial position in their relevant functional currencies (local country currency), which are then translated into U.S. Dollars.dollars. This translated financial information is included in our consolidated financial statements. The strengthening ofAs the relationship between these currencies and the U.S. Dollar in comparison to these functional currenciesdollar changes, there could havebe a negative impact on our reported results and financial position.
In addition, as the U.S. dollar strengthens against foreign currencies, imports of products into the U.S. produced by international competitors have become more price competitive and exports of our U.S.-fabricated products have become less price competitive. If we are not able to counteract these price pressures through superior quality and service, our net sales and operating income could be negatively impacted.
New competitors or specific actions of our existing competitors could adversely impact our industry position and future results.
All of our operating segments operate in competitive industries where the actions of our existing competitors or new competitors could result in a loss of customers or share of customers' demand. Changes in our competitors' products, prices or services could negatively impact our share of demand, net sales or margins.
Our Architectural Glass and Architectural Framing Systems segments have seen an increase in imports of competitive products into the U.S. from lower-cost, international suppliers that, if thisdue to the relative strength of the U.S. dollar. If imports of competitive products were to continue, could negatively impactoccur at increased levels for extended periods of time, our net sales and margins. margins could be negatively impacted.
Our LSO segment competes with several international specialty glass manufacturers that have traditionally not penetratedbeen less focused on the U.S. custom picture framing industry. AlthoughCertain of these LSO competitors have not beenrecently developed some value-added products that are able to meetcompete more directly with some products in our existing portfolio. If these competitors are able to successfully increase their product attributes and production capacity and/or increase their sales and marketing focus to the specification levelU.S. custom picture framing market, this segment's net sales and margins could be negatively impacted.
Acquisitions and related integration activities
We have completed and may complete additional acquisitions in the future to accelerate the execution of our products, upgrades to our competitor's products couldgrowth strategies, including new geographies, markets and new product introductions. While we have a negativedisciplined approach to assessing potential acquisition targets, conducting due diligence activities, and negotiating appropriate acquisition terms, there are risks inherent in completing acquisitions, including:
diversion of management’s attention from existing business activities;
difficulties or delays in integrating and assimilating information and financial systems, operations, and products of an acquired business or other business venture or in realizing projected efficiencies, growth prospects, cost savings, and synergies;
potential loss of key employees and customers of the acquired businesses or adverse effects on relationships with existing customers and suppliers;
adverse impact on net salesoverall profitability if the acquired business does not achieve the return on investment projected at the time of acquisition; and
inaccurate assessment of additional post-acquisition capital investments, undisclosed, contingent or margins.other liabilities, problems executing backlog of material supply or installation projects underway at time of acquisition, unanticipated costs, and an inability to recover or manage such liabilities and costs.
If one or more of these risks arises in a material manner, our operating results could be negatively impacted.
Our ability to effectively utilizeEffective utilization and management of our manufacturing capacity could adversely impact future results.
Near-term performance depends, to a significant degree, on our ability to increaseprovide sufficient available capacity and appropriately utilize availableexisting production capacity. The failure to successfully maintain existing capacity, investsuccessfully implement planned capacity expansions, and make additional investments in additional physical capacity and recruit necessary manufacturing labor could adversely affect our operating results.
Product quality issuesLoss of key personnel and inability to source sufficient labor
Our success depends on the skills of the Company's leadership, construction project managers and other key technical personnel, and our ability to secure sufficient manufacturing labor. Increased activity in residential and commercial construction has caused increased competition for experienced construction project managers. Additionally, some of our manufacturing facilities are located in regions that at times may experience low levels of unemployment. If we are unable to retain existing employees and/or recruit and train additional employees with the requisite skills and experience, our operating results could be adversely impacted.
Commodity price fluctuations and supply availability
Our Architectural Framing Systems and Architectural Services segments use aluminum as a significant input to their products. While we structure many of our supply agreements in a way to moderate the effects of fluctuations in the market for raw aluminum, and we are usually eventually able to pass aluminum cost increases on to our customers, short-term operating results could be negatively impacted by sudden price movements in the market for raw aluminum.
Our Architectural Glass segment uses raw glass as a significant input to its products. The supply of raw glass has become tighter due to several years of growth in automotive manufacturing and residential and non-residential construction. Although we have secured supply commitments from multiple suppliers that allow us to reach our near-term growth targets, a significant unplanned downtime at one or more of our key suppliers could negatively impact demand for our products and future profitability.operating results.
Product quality issues
We manufacture and/or install a significant portion of our products based on the specific requirements of each customer. We believe that future orders of our products or services will depend on our ability to maintain the performance, reliability and quality standards required by our customers. If our products or services have performance, reliability or quality problems, or products are installed using incompatible glazing materials or installed improperly (by us or a customer), we may experienceexperience: additional warranty and service expense; reduced or canceled orders; diminished pricing power; higher manufacturing or installation costs; or delays in the collection of accounts receivable. Additionally, performance, reliability or quality claims from our customers, with or without merit, could result in costly and time-consuming litigation that could require significant time and attention of management and involve significant monetary damages that could negatively impact our financial results.
Project management and installation issues could negatively impact future results.
The Architectural Services segment is typicallyand, occasionally, a portion of the Architectural Framing Systems segment are awarded fixed-price contracts for installation services. Often, bids are required before all aspects of a construction project are known. An underestimate in the amount of labor required and/or cost of materials for a project; a change in the timing of the delivery of product; system design errors, difficulties or errors in execution; use of incompatible glazing materials; or significant project delays, caused by us or other trades, could result in failure to achieve the expected results. Any one or more of such issues could result in losses on individual contracts that could negatively impact our operating results.
Our future profitability and cash flow are dependent on realizing expected government incentives.
We have made commitments to expand certain manufacturing facilities and make investmentsChanges in new manufacturing capabilities. Contributing to the decision to make such investments was the availability of federal, state and local incentives including tax credits, tax increment financing and grants. If the Company is not able to realize the benefits of planned incentive packages, future operating results could be negatively impacted.
A shift inarchitectural trends, building codes or consumer preferences could negatively impact the demand for our products.
Any change in commercial construction customer preference, architectural trends or building codes that reducesreduce window-to-wall ratios in non-residential construction would negatively impact net sales and operating income in our Architectural Glass, Architectural Services and Architectural Framing Systemsarchitectural-related segments. The LSO segment depends on U.S. consumers framing art and other decorative items. Any shift in customer preference away from framed art to other forms of decorative mediawall decor could negatively impact future net sales and operating income in the LSO segment.
The loss of a significant customerCustomer dependence in the LSO segment could adversely affect our results.
The LSO segment is highly dependent on a relatively small number of customers for its sales. Wesales, and we expect this to continue deriving a significant portion of our net sales from a small number of customers.in the future. Accordingly, loss of a significant customer, or a significant reduction in pricing, or a shift to a less favorable mix of value-addedvalue-
added picture framing glass or acrylic products for one of those customers, could materially reduce LSO net sales and operating results.
Our resultsResults can be volatile and differ significantly from our expectations and the expectations of analysts.analysts
Our sales and earnings guidance and external analyst estimates are largely based on our view of our business and the broader commercial construction market. Even though we have significant market intelligence through our contact with real estate developers, building owners and architects, and continually monitor micro- and macro-economic indicators of future performance of the commercial construction market, we are unable to precisely predict events that can significantly change market cycles. Failure to meet our guidance or analyst expectations for net sales and operating results may differ from Company-provided guidance and the expectations of securities analysts or investors in future periods. Our annual net sales and operating results may vary depending on a number of factors, including, but not limited to, fluctuating customer demand, delay or timing of shipments, construction delays or cancellations due to lack of financing for construction projects, changes in product and project, and market acceptance of new products. Manufacturing or operational difficulties that may arise due to quality control, or unplanned operational downtime may also adversely impact our annual net sales and operating results. In addition, competition, including new entrants into our markets, the introduction of new products by competitors, adoption of competitive technologies by our customers, or competitive pressures on prices of our products and services, could adversely impact our annual net sales and operating results. Finally, our annual net sales and operating results may vary depending on raw material pricing and the potential for disruption of supply, or changes in legislation that couldearnings would likely have an adverse impact on our labor or other costs. Our failure to meet net sales and operating result expectations would likely adversely affect the market price of our common stock.
We retain significantSignificant risk retention through self-insurance programs.programs
We obtain third-party insurance for potential losses from general liability, employment practices, workers' compensation and automobile liability risk.risk, as well as medical insurance. However, a high amount of risk is retained on a self-insured basis, partially through aour wholly-owned insurance subsidiary. Therefore, a material architectural product liability event, such as a material rework event could have a material adverse effect on our operating results.
Difficulties with ourDependence on information technology systems and potential security could adversely affect our results.threats
We have manyOur operations are dependent upon various information technology systems that are important to the operation of our businesses. These systems are used to process, transmit and store electronic information, and to manage or support our manufacturing operations and a variety of other business processes and activities. We could encounter difficulties in developing newmaintaining our existing systems, and maintaining existingdeveloping and implementing new systems. Such difficulties could lead to significant additional expenses and/or disruption in business operations and/or significant additional expenses that could adversely affect our results.
Additionally, information technology security threats are increasing in frequency and sophistication. These threats pose a risk to the security of our systems and networks, and the confidentiality, availability and integrity of our data. Should such an attack succeed, it could lead to the compromise of confidential information, manipulation and destruction of data and product specifications, production downtimes, disruption in the availability of financial data, or misrepresentation of information via digital media. The occurrence of any of these events could adversely affect our reputation and could result in litigation, regulatory action, potential liability,project delay claims, and increased costs and operational consequences of implementing further data protection matters.systems.
Use of hazardous chemicals and environmental compliance
We use hazardous chemicals in the production process of our products and are thus subjected to changes in environmental legislation.
We use hazardous chemicals in producingsome of our products. One of our facilities has certain historical environmental conditions that we believe require remediation.are in the process of being remediated. Our inability to remediate the historical environmental conditions at the facility at or below the amounts reserved therefore, could have a materialan adverse impact on future financial results. Additionally, we are subject to a variety of local, state and federal governmental regulations relating to storage, discharge, handling, emission, generation and disposal of toxic or other hazardous substances used to manufacture our products, compliance with which is expensive. Our failure to comply with current or future environmental regulations could result in the imposition of substantial fines, suspension of production, alteration of our manufacturing processes or increased costs. Our financial results could also be adversely impacted by rising energy and material costs associated with environmental regulations.
A loss of key personnel could negatively impact near-term results.
Our success depends on the skills, experience and efforts of our executive management and other key personnel. If, for any reason, one or more senior executives or key personnel were not to remain active in our Company, our financial results could be adversely affected.
ITEM 1B. UNRESOLVED STAFF COMMENTS
NoneNone.
ITEM 2. PROPERTIES
The following table lists, by segment, the Company's major facilitiesproperties as of February 28, 2015March 4, 2017, the general use of the facility and whether it is owned or leased by the Company..
|
| | | | | | | | | |
Facility | | Property Location | | Owned/ Leased | | Size (sq. ft.) | | Function |
Architectural Glass Segment | | | | segment | | | | |
Viracon | | Owatonna, MN | | Owned | | 868,500 |
| | Mfg/AdminManufacturing/Administrative |
Viracon | | Owatonna, MN | | Owned | | 136,050 |
| | Mfg/Admin |
Viracon | | Owatonna, MN | | Leased | | 160,000 |
| | Warehouse |
Viracon | | Statesboro, GA | | Owned | | 397,200 |
| | Mfg/Manufacturing/Warehouse |
Viracon | | St. George, UT | | Owned | | 236,000 |
| | Mfg/Manufacturing/Warehouse |
GlassecViracon | | Nazaré Pulista,Paulista, Brazil | | Owned(1) | | 100,000 |
| | Mfg/Admin |
| | | | | | | | |
Architectural Services Segment | | | | | | | | |
Harmon, Inc. Headquarters | | Minneapolis, MN | | Leased | | 12,954 |
| | Admin |
Harmon, Inc. | | West Chester, OH | | Leased | | 156,000 |
| | Mfg |
Harmon, Inc. | | Garland, TX | | Leased | | 114,025 |
| | Mfg |
Harmon, Inc. | | Glen Burnie, MD | | Leased | | 72,377 |
| | Mfg |
Harmon, Inc. | | Orlando, FL | | Leased | | 49,000 |
| | Mfg |
| | | | | | | | Manufacturing/Administrative |
Architectural Framing Systems Segment | | | | segment | | | | |
Wausau, Window and Wall Systems | | Wausau, WI | | Owned | | 370,400 | Manufacturing/Administrative
| | Mfg/Admin |
Wausau Window and Wall Systems | | Stratford, WI | | Owned | | 67,000 |
| | MfgManufacturing |
Linetec | | Wausau, WI | | Owned | | 430,000 |
| | Mfg/Admin |
Tubelite | | Reed City, MI | | Owned | | 245,000 |
| | MfgManufacturing |
Tubelite | | Walker, MI | | Leased | | 123,125 | Manufacturing/Administrative
| | Mfg/Admin |
Tubelite | | Dallas, TX | | Leased | | 47,500 |
| | MfgManufacturing |
Alumicor | | Ontario,Toronto, ON Canada | | Leased | | 180,329 |
| | Mfg/Manufacturing/Warehouse/AdminAdministrative |
Alumicor | | Ontario,Toronto, ON Canada | | Owned | | 55,000Manufacturing |
Brampton, ON Canada | | Mfg |
| Leased | | Manufacturing/Warehouse/Administrative |
| Architectural Services segment | | | | |
LSO SegmentMinneapolis, MN | | Leased | | Administrative |
| West Chester, OH | | Leased | | Manufacturing |
| Garland, TX | | Leased | | Manufacturing |
| Glen Burnie, MD | | Leased | | Manufacturing |
| Orlando, FL | | Leased | | Manufacturing |
| LSO segment | | | | |
Tru Vue | | McCook, IL | | Owned | | 300,000 | Manufacturing/Warehouse/Administrative
| | Mfg/Admin |
Tru Vue | | Faribault, MN | | Owned | | 274,600 | Manufacturing/Administrative
| | Mfg/Admin |
| | | | | | | | |
| Other | | | | | | | | |
Apogee Headquarters | | Minneapolis, MN | | Leased | | 19,237 |
| | AdminAdministrative |
| |
| (1) | This is an owned facility; however, the land is leased from the city. |
In addition to the locations listed above, the Architectural Services segment business operates 11 leased locations, serving multiple markets.
One of the Viracon facilities, a portion of the Wausau Window and Wall Systems facility, a portion of the Linetec facility and the Tru Vue facilities were constructed with the use of proceeds from industrial revenue bonds issued by their applicable cities. These properties are considered owned since, at the end of the bond term, title reverts to the Company.
ITEM 3. LEGAL PROCEEDINGS
The Company has been a party to various legal proceedings incidental to its normal operating activities. In particular, like others in the construction supply and services industry, the Company's construction supply and services businesses are routinely involved in various disputes and claims arising out of construction projects, sometimes involving significant monetary damages or product replacement. The Company has also been subject to litigation arising out of general liability, employment practices, workers' compensation general liability and automobile claims. Although it is very difficult to accurately predict the outcome of such proceedings, facts currently available indicate that no such claims will result in losses that would have a material adverse effect on the results of operations, cash flows or financial condition of the Company.
ITEM 4. MINE SAFETY DISCLOSURES
Not applicableapplicable.
PART II
ITEM 5. MARKET FOR REGISTRANT'S COMMON EQUITY, RELATED STOCKHOLDER MATTERS AND ISSUER PURCHASES OF EQUITY SECURITIES
Market Information
Apogee common stock is traded on the NASDAQ Stock Market LLC (Nasdaq) under the ticker symbol APOG.
As of April 8, 20152017, there were approximately 1,2781,197 shareholders of record and 7,71516,162 shareholders for whom securities firms acted as nominees.
The following chart shows the quarterly range and year-end closing pricesprice for one share of the Company's common stock over the past fivethree fiscal years.
|
| | | | | | | | | | | | | | | | | | | | | | | | | | | | | | | | |
| | | First | | Second | | Third | | Fourth | | Year-end |
| | | Low | High | | Low | High | | Low | High | | Low | High | | Close |
| 2015 | | $ | 28.28 |
| $ | 35.64 |
| | $ | 29.21 |
| $ | 36.68 |
| | $ | 35.07 |
| $ | 47.02 |
| | $ | 37.83 |
| $ | 48.03 |
| | $ | 45.85 |
|
| 2014 | | 23.06 |
| 30.26 |
| | 22.20 |
| 29.41 |
| | 27.25 |
| 36.09 |
| | 30.97 |
| 37.73 |
| | 34.23 |
|
| 2013 | | 12.17 |
| 16.44 |
| | 14.14 |
| 17.20 |
| | 15.80 |
| 23.31 |
| | 22.20 |
| 26.62 |
| | 26.21 |
|
| 2012 | | 12.42 |
| 14.82 |
| | 8.21 |
| 13.45 |
| | 7.79 |
| 11.54 |
| | 9.42 |
| 15.05 |
| | 12.60 |
|
| 2011 | | 12.57 |
| 16.89 |
| | 9.05 |
| 13.89 |
| | 8.76 |
| 12.05 |
| | 10.79 |
| 14.72 |
| | 13.92 |
|
|
| | | | | | | | | | | | | | | | | | | | | | | | | | | | | | | | |
| | | First | | Second | | Third | | Fourth | | Year-end |
| | | Low | High | | Low | High | | Low | High | | Low | High | | Close |
| 2017 | | $ | 39.93 |
| $ | 45.94 |
| | $ | 41.50 |
| $ | 48.88 |
| | $ | 39.96 |
| $ | 49.17 |
| | $ | 47.64 |
| $ | 59.38 |
| | $ | 58.19 |
|
| 2016 | | 42.35 |
| 56.27 |
| | 49.60 |
| 60.16 |
| | 43.90 |
| 57.86 |
| | 34.52 |
| 50.53 |
| | 39.41 |
|
| 2015 | | 28.28 |
| 35.64 |
| | 29.21 |
| 36.68 |
| | 35.07 |
| 47.02 |
| | 37.83 |
| 48.03 |
| | 45.85 |
|
Dividends
TheQuarterly, the Board of Directors quarterly evaluates declaring dividends based on operating results, available funds and the Company's financial condition. Cash dividends have been paid each quarter since 1974. The chart below shows quarterly and annual cumulative cash dividends per share for the past fivethree fiscal years.
|
| | | | | | | | | | | | | | | | | | | | |
| | | First | | Second | | Third | | Fourth | | Total |
| 2015 | | $ | 0.1000 |
| | $ | 0.1000 |
| | $ | 0.1000 |
| | $ | 0.1100 |
| | $ | 0.4100 |
|
| 2014 | | 0.0900 |
| | 0.0900 |
| | 0.0900 |
| | 0.1000 |
| | 0.3700 |
|
| 2013 | | 0.0900 |
| | 0.0900 |
| | 0.0900 |
| | 0.0900 |
| | 0.3600 |
|
| 2012 | | 0.0815 |
| | 0.0815 |
| | 0.0815 |
| | 0.0815 |
| | 0.3260 |
|
| 2011 | | 0.0815 |
| | 0.0815 |
| | 0.0815 |
| | 0.0815 |
| | 0.3260 |
|
|
| | | | | | | | | | | | | | | | | | | | |
| | | First | | Second | | Third | | Fourth | | Total |
| 2017 | | $ | 0.1250 |
| | $ | 0.1250 |
| | $ | 0.1250 |
| | $ | 0.1400 |
| | $ | 0.5150 |
|
| 2016 | | 0.1100 |
| | 0.1100 |
| | 0.1100 |
| | 0.1250 |
| | 0.4550 |
|
| 2015 | | 0.1000 |
| | 0.1000 |
| | 0.1000 |
| | 0.1100 |
| | 0.4100 |
|
Purchases of Equity Securities by the Company
The following table provides information with respect to purchases made by the Company of its own stock during the fourth quarter of fiscal 20152017:
|
| | | | | | | | | | | | |
| Period | Total Number of Shares Purchased (a) | | Average Price Paid per Share | | Total Number of Shares Purchased as Part of Publicly Announced Plans or Programs (b) | | Maximum Number of Shares that May Yet Be Purchased under the Plans or Programs (b) |
| November 30, 2014 through December 27, 2014 | 1,680 |
| | $ | 41.58 |
| | — |
| | 767,368 |
|
| December 28, 2014 through January 24, 2015 | 13,480 |
| | 43.09 |
| | — |
| | 767,368 |
|
| January 25, 2015 through February 28, 2015 | 2,614 |
| | 45.30 |
| | — |
| | 767,368 |
|
| Total | 17,774 |
| | $ | 43.89 |
| | — |
| | 767,368 |
|
|
| | | | | | | | | | | | |
| Period | Total Number of Shares Purchased (a) | | Average Price Paid per Share | | Total Number of Shares Purchased as Part of Publicly Announced Plans or Programs (b) | | Maximum Number of Shares that May Yet Be Purchased under the Plans or Programs (b) |
| November 27, 2016 through December 31, 2016 | 180 |
| | $ | 50.04 |
| | — |
| | 942,367 |
|
| January 1, 2017 through January 28, 2017 | 3,185 |
| | 55.55 |
| | — |
| | 942,367 |
|
| January 29, 2017 through March 4, 2017 | 1,625 |
| | 57.98 |
| | — |
| | 942,367 |
|
| Total | 4,990 |
| | $ | 56.15 |
| | — |
| | 942,367 |
|
(a) The shares in this column represent shares that were surrendered to us by plan participants in order to satisfy stock-for-stock option exercises or withholding tax obligations related to stock-based compensation.
(b) In April 2003,fiscal 2004, the Board of Directors authorized the repurchase of 1,500,000 shares of Company stock, which was announced on April 10, 2003. In January 2008,Subsequently, the Board of Directors increased the authorization by 750,000 shares, which was announced on January 24, 2008. In October 2008, the Board of Directors increased the authorization2008; by 1,000,000 shares, which was announced on October 8, 2008.2008; and by 1,000,000 shares, which was announced on January 13, 2016. The Company's repurchase program does not have an expiration date.
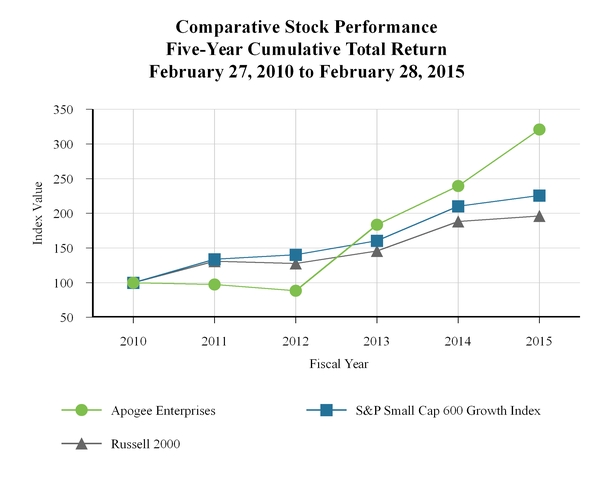
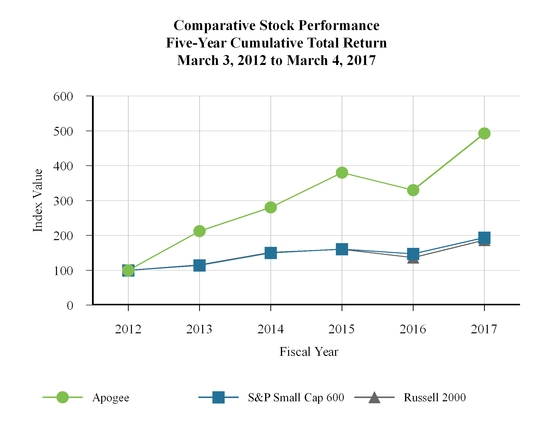
Comparative Stock Performance
The line graph below compares the cumulative total shareholder return on a $100 investment in our common stock for the last five fiscal years with the cumulative total return on a $100 investment in the Standard & Poor's Small Cap 600 Growth Index and the Russell 2000 Index. ThisThe graph assumes a $100an investment in each of Apogee, the Standard & Poor's Small Cap 600 Growth Index and the Russell 2000 Index at the close of trading on February 27, 2010,March 3, 2012, and also assumes the reinvestment of all dividends.
| | | | Fiscal 2010 | Fiscal 2011 | Fiscal 2012 | Fiscal 2013 | Fiscal 2014 | Fiscal 2015 | 2012 | | 2013 | | 2014 | | 2015 | | 2016 | | 2017 |
| Apogee | $ | 100.00 |
| $ | 97.41 |
| $ | 88.17 |
| $ | 183.41 |
| $ | 239.54 |
| $ | 320.85 |
| $ | 100.00 |
| | $ | 212.10 |
| | $ | 280.52 |
| | $ | 379.99 |
| | $ | 329.79 |
| | $ | 492.41 |
|
| S&P Small Cap 600 Growth Index | 100.00 |
| 133.88 |
| 140.37 |
| 160.30 |
| 210.33 |
| 225.62 |
| 100.00 |
| | 114.19 |
| | 149.83 |
| | 160.72 |
| | 147.48 |
| | 193.42 |
|
| Russell 2000 Index | 100.00 |
| 130.77 |
| 127.66 |
| 145.53 |
| 188.21 |
| 196.22 |
| 100.00 |
| | 115.68 |
| | 151.59 |
| | 160.12 |
| | 136.57 |
| | 186.43 |
|
For the fiscal year ended February 28, 2015, our primary business activities included architectural glass (approximately 34 percent of net sales), architectural services (approximately 25 percent of net sales), architectural framing systems (approximately 32 percent of net sales) and large-scale optical technologies (approximately 9 percent of net sales). We are not aware of any competitors, public or private, that are similar to us in size and scope of business activities. Most of our direct competitors are either privately owned or divisions of larger, publicly owned companies.
ITEM 6. SELECTED FINANCIAL DATA
The following information should be read in conjunction with Item 7 - Management's Discussion and Analysis of Financial Condition and Results of Operations, included in Item 7 of this Report, and our consolidated financial statements and related notes, included in Item 8 - Financial Statements and Supplementary Data.of this Report.
|
| | | | | | | | | | | | | | | | | | |
| (In thousands, except per share data and percentages) | 2015 | 2014(1)(2) | 2013(1) | 2012(1)(3) | 2011(4) | 2010 |
| Results from Operations Data | | | | | | |
| Net sales | $ | 933,936 |
| $ | 771,445 |
| $ | 700,224 |
| $ | 662,463 |
| $ | 582,777 |
| $ | 696,703 |
|
| Gross profit | 208,544 |
| 165,252 |
| 145,733 |
| 117,120 |
| 83,120 |
| 162,095 |
|
| Operating income (loss) | 63,585 |
| 40,285 |
| 27,419 |
| 3,816 |
| (20,972 | ) | 45,430 |
|
| Net earnings (loss) | 50,516 |
| 27,986 |
| 19,111 |
| 4,645 |
| (10,332 | ) | 31,742 |
|
| Earnings (loss) per share - basic | 1.76 |
| 0.98 |
| 0.68 |
| 0.17 |
| (0.37 | ) | 1.16 |
|
| Earnings (loss) per share - diluted | 1.72 |
| 0.95 |
| 0.67 |
| 0.17 |
| (0.37 | ) | 1.15 |
|
| | | | | | | |
| Balance Sheet Data | | | | | | |
| Current assets | $ | 298,975 |
| $ | 247,430 |
| $ | 256,479 |
| $ | 234,077 |
| $ | 213,923 |
| $ | 246,586 |
|
| Total assets | 612,057 |
| 569,995 |
| 524,779 |
| 497,742 |
| 511,098 |
| 526,854 |
|
| Current liabilities | 149,028 |
| 136,834 |
| 122,167 |
| 105,771 |
| 113,946 |
| 128,887 |
|
| Long-term debt | 20,587 |
| 20,659 |
| 20,756 |
| 20,916 |
| 21,442 |
| 8,400 |
|
| Shareholders' equity | 382,476 |
| 356,104 |
| 336,792 |
| 324,672 |
| 327,677 |
| 343,590 |
|
| | | | | | | |
| Cash Flow Data | | | | | | |
| Depreciation and amortization | $ | 29,423 |
| $ | 26,550 |
| $ | 26,529 |
| $ | 27,246 |
| $ | 28,218 |
| $ | 29,601 |
|
| Net cash provided by (used in) operating activities | 68,563 |
| 52,921 |
| 40,716 |
| 27,981 |
| (7,985 | ) | 97,234 |
|
| Net cash used in investing activities | (24,475 | ) | (43,974 | ) | (57,132 | ) | (18,498 | ) | (14,391 | ) | (53,245 | ) |
| Net cash (used in) provided by financing activities | (19,773 | ) | (17,576 | ) | 232 |
| (13,116 | ) | 209 |
| (9,832 | ) |
| Capital expenditures | 27,220 |
| 41,852 |
| 34,664 |
| 9,650 |
| 9,126 |
| 9,765 |
|
Dividends(5) | 12,071 |
| 10,764 |
| 10,316 |
| 9,153 |
| 9,161 |
| 9,112 |
|
| | | | | | | |
| Other Data | | | | | | |
| Gross margin - % of sales | 22.3 | % | 21.4 | % | 20.8 | % | 17.7 | % | 14.3 | % | 23.3 | % |
| Operating margin - % of sales | 6.8 | % | 5.2 | % | 3.9 | % | 0.6 | % | (3.6 | )% | 6.5 | % |
| Effective tax rate - % | 22.3 | % | 29.6 | % | 29.0 | % | (29.2 | )% | 39.3 | % | 31.7 | % |
| Non-cash working capital | $ | 97,479 |
| $ | 81,976 |
| $ | 58,791 |
| $ | 49,120 |
| $ | 39,426 |
| $ | 15,064 |
|
| Debt as a % of total capital | 5.1 | % | 5.5 | % | 5.9 | % | 6.1 | % | 6.4 | % | 2.4 | % |
| Return on: | | | | | | |
| Average shareholders' equity - % | 13.7 | % | 8.1 | % | 5.8 | % | 1.4 | % | (3.1 | )% | 9.6 | % |
Average invested capital(6)- % | 8.8 | % | 6.0 | % | 4.3 | % | 0.6 | % | (3.4 | )% | 7.5 | % |
| Dividend yield at year-end - % | 0.9 | % | 1.1 | % | 1.4 | % | 2.6 | % | 2.3 | % | 2.3 | % |
| Book value per share | 13.17 |
| 12.30 |
| 11.81 |
| 11.57 |
| 11.66 |
| 12.29 |
|
| Price/earnings ratio at year-end | 27:1 |
| 36:1 |
| 39:1 |
| 76:1 |
| NM |
| 12:1 |
|
| Average monthly trading volume | 3,665 |
| 5,098 |
| 3,381 |
| 2,830 |
| 4,790 |
| 5,900 |
|
|
| | | | | | | | | | | | | | | | | | | |
| | Fiscal Year |
| (In thousands, except per share data and percentages) | 2017(1, 2) | | 2016 | | 2015 | | 2014(3) | | 2013 |
| Results of Operations Data | | | | | | | | | |
| Net sales | $ | 1,114,533 |
| | $ | 981,189 |
| | $ | 933,936 |
| | $ | 771,445 |
| | $ | 700,224 |
|
| Gross profit | 292,023 |
| | 243,570 |
| | 208,544 |
| | 165,252 |
| | 145,733 |
|
| Operating income | 122,225 |
| | 97,393 |
| | 63,585 |
| | 40,285 |
| | 27,419 |
|
| Net earnings | 85,790 |
| | 65,342 |
| | 50,516 |
| | 27,986 |
| | 19,111 |
|
| Earnings per share - basic | 2.98 |
| | 2.25 |
| | 1.76 |
| | 0.98 |
| | 0.68 |
|
| Earnings per share - diluted | 2.97 |
| | 2.22 |
| | 1.72 |
| | 0.95 |
| | 0.67 |
|
| Cash dividends per share | 0.515 |
| | 0.455 |
| | 0.410 |
| | 0.370 |
| | 0.360 |
|
| | | | | | | | | | |
| Balance Sheet Data | | | | | | | | | |
| Total assets | 784,658 |
| | 657,440 |
| | 612,057 |
| | 569,995 |
| | 524,779 |
|
| Long-term debt | 65,400 |
| | 20,400 |
| | 20,587 |
| | 20,659 |
| | 20,756 |
|
| Shareholders' equity | 470,577 |
| | 406,195 |
| | 382,476 |
| | 356,104 |
| | 336,792 |
|
| | | | | | | | | | |
| Other Data | | | | | | | | | |
| Gross profit as a percentage of sales | 26.2 | % | | 24.8 | % | | 22.3 | % | | 21.4 | % | | 20.8 | % |
| Operating income as a percentage of sales | 11.0 | % | | 9.9 | % | | 6.8 | % | | 5.2 | % | | 3.9 | % |
Return on average invested capital(4) | 14.3 | % | | 12.7 | % | | 8.8 | % | | 6.0 | % | | 4.3 | % |
| |
(1) | Includes the retrospective adjustment of Balance Sheet Data to reflect the elimination of LIFO accounting, see Item 8, Note 1 to the Consolidated Financial StatementsFiscal 2017 included 53 weeks. Each of the Company contained elsewhere in this report.other periods presented included 52 weeks. |
| |
(2) | Includes the acquisition of Sotawall in December 2016. |
| |
(3) | Includes the acquisition of Alumicor in November 2013. |
| |
(3)(4) | Fiscal 2012 included 53 weeks, compared to 52 weeks in each of the other periods presented. |
| |
(4) | Includes the acquisition of Glassec in November 2010. |
| |
(5) | See Item 5 for fiscal year 2011-2015 dividend per share data. |
| |
(6) | [OperatingReturn on average invested capital is a non-GAAP measure that we define as [operating income x .65]/average invested capitalcapital. We believe this measure is useful in understanding operational performance over time. This non-GAAP measure should be viewed in addition to, and not as an alternative to, the reported financial results of the company prepared in accordance with GAAP. Other companies may calculate this measure differently from us, limiting the usefulness of the measure for comparison with others. |
NM=Not meaningful
ITEM 7. MANAGEMENT'S DISCUSSION AND ANALYSIS OF FINANCIAL CONDITION AND RESULTS OF OPERATIONS
Forward-Looking Statements
This discussion contains “forward-looking statements” within the meaning of the Private Securities Litigation Reform Act of 1995. These statements reflect our current views with respect to future events and financial performance. The words “believe,” “expect,” “anticipate,” “intend,” “estimate,” “forecast,” “project,” “should” and similar expressions are intended to identify “forward-looking statements” within the meaning of the Private Securities Litigation Reform Act of 1995. All forecasts and projections in this document are “forward-looking statements,” and are based on management's current expectations or beliefs of the Company's
near-term results, based on current information available pertaining to the Company, including the risk factors noted under Item 1A in this Form 10-K. From time to time, we also may provide oral and written forward-looking statements in other materials we release to the public, such as press releases, presentations to securities analysts or investors, or other communications by the Company. Any or all of our forward-looking statements in this report and in any public statements we make could be materially different from actual results.
Accordingly, we wish to caution investors that any forward-looking statements made by or on behalf of the Company are subject to uncertainties and other factors that could cause actual results to differ materially from such statements. These uncertainties and other risk factors include, but are not limited to, the risks and uncertainties set forth under Item 1A in this Form 10-K.
We wish to caution investors that other factors might in the future prove to be important in affecting the Company's results of operations. New factors emerge from time to time; it is not possible for management to predict all such factors, nor can it assess the impact of each such factor on the business or the extent to which any factor, or a combination of factors, may cause actual results to differ materially from those contained in any forward-looking statements. We undertake no obligation to update publicly or revise any forward-looking statements, whether as a result of new information, future events or otherwise.
Overview
We are a world leader in certain technologies that provide distinctive solutions for enclosing commercial buildingsinvolving the design and framing art. The Company'sdevelopment of value-added glass products and services. Our four reportablereporting segments are: Architectural Glass, Architectural Services,Framing Systems, Architectural Framing SystemsServices and Large-Scale Optical Technologies (LSO).
Architectural Glass segment consists of Viracon, a fabricator of coated, high-performance architectural glass for global markets.
The Architectural Services segment consists of Harmon, one of the largest U.S. full-service building glass installation and renovation companies; it designs, engineers, fabricates and installs the walls of glass, windows and other curtainwall products making up the outside skin of commercial and institutional buildings.
The Architectural Framing Systems segment companies design, engineer, fabricate and finish the aluminum frames used in customized aluminum and glass window, curtainwall, storefront and entrance systems comprising the outside skin and entrances of commercial and institutional buildings. We have aggregated four operating segments into the Architectural Framing Systems reporting segment based upon their similar products, customers, distribution methods, production processes and economic characteristics: Wausau Window and Wall Systems, a manufacturer of standard and custom aluminum window systems and curtainwall for the North American commercial construction and historical renovation markets; Tubelite, a fabricator of aluminum storefront, entrance and curtainwall products for the U.S. commercial construction industry; Alumicor, a fabricator of aluminum storefront, entrance, curtainwall and window products for the Canadian commercial construction industry; and Linetec, a paint and anodize finisher of architectural aluminum and PVC shutters for U.S. markets.
LSO segment consists of Tru Vue, a manufacturer of value-added glass and acrylic for the custom picture framing and fine art markets.
The following highlights the resultsHighlights for fiscal 20152017:
Consolidated revenuesnet sales increased 21to $1.1 billion, or 14 percent over fiscal 2014,2016.
Operating income increased to $122 million, or 17 percent excluding the impact of Alumicor, and operating income was up 58 percent over last year. All four segments grew revenue and earnings.
EPS was $1.72, including a $0.22 per share impact of a 48C tax credit. Excluding this item, adjusted EPS was $1.50, up 5825 percent over the prior year.
Architectural Glass segment revenues improved 18 percent over fiscal 2014 and operating income improved to $16.4 million, as
Diluted EPS was $2.97, compared to $3.9 million$2.22 in the prior year.
The Architectural Services segment revenues increased 13 percent over fiscal 2014 and operating income improved by 66year, for growth of 34 percent.
TheWe acquired the assets of Sotawall, Inc., a Canadian privately-held designer and fabricator of high-performance, unitized curtainwall systems for commercial construction projects, for approximately $138 million on December 14, 2016. Sotawall's results since the date of acquisition have been included in the consolidated financial statements and within the Architectural Framing Systems segment net sales improved 38 percent compared to fiscal 2014, or 24 percent organic growth when adjusting out the impact of Alumicor, and operating income was up 46 percent.
The LSO segment revenues increased by 8 percent over fiscal 2014 while operating income grew slightly over prior-year levels.
Consolidated backlog was $490.8 million at February 28, 2015, up 49 percent over the fiscal 2014 level.
Strategysegment.
Architectural Glass, Architectural Services and Architectural Framing Systems Segments
These three segments serve the commercial construction market, which is highly cyclical. They participate in various phases of the value chain to design, engineer, manufacture and install customized aluminum and glass window, curtainwall, and storefront and entrance systems for commercial buildings - each with nationally recognized brands and leading positions in their target market segments.
The window, curtainwall and storefront systems manufactured by our Architectural Framing Systems segment, as well as the glass products fabricated by our Architectural Glass segment, are sold to installers who enclose commercial buildings, such as offices, hospitals, educational facilities, government facilities, high-end multi-family buildings and retail centers. We believe general contractors and architects value our ability to reliably deliver quality, customized window and curtainwall solutions. Their customers - building owners and developers - value the distinctive look, energy efficiency, and hurricane and blast protection features of our window and curtainwall systems. These attributes can contribute to higher lease rates, lower operating costs due to the energy efficiency of our value-added glass and aluminum systems, a more comfortable environment for building occupants, and protection for buildings and occupants from hurricanes and blasts.
Our Architectural Services segment fabricates and installs window and curtainwall systems on newly constructed commercial buildings, as well as providing large-scale retrofit services for the window and curtainwall systems on existing commercial buildings. We collaborate closely with our customers, the general contractors, to complete installation projects on time and on budget in order to minimize costly job-site labor overruns.
We look at several market indicators, such as office space vacancy rates, architectural billing statistics, employment and other macroeconomic indicators, to gain insight into the commercial construction market. One of our primary indicators is U.S. non-residential construction market activity as documented by Dodge Data & Analytics (Dodge) (formerly McGraw-Hill Construction), a leading independent provider of construction industry analysis, forecasts and trends. We utilize the information for the building types that we typically serve (office towers, hotels, retail centers, education facilities and dormitories, health care facilities, government buildings and high-end multi-family buildings) and adjust this information (which is based on construction starts) to align with our fiscal year and the lag that is required to account for when our products and services typically are initiated in a construction project - approximately eight months after project start. From the Dodge data, we believe that our U.S. markets had a compound annual growth rate of eight percent over our past three fiscal years, while our combined compound annual organic growth rate for our three architectural segments was 13 percent over that same period.
Our overall strategy in the Architectural Glass and Architectural Framing Systems segments is to deliver organic growth faster than our commercial construction markets. While our Architectural Services segment will continue to deliver organic growth, the strategy of this segment will be focused on project selection and improved project margins. We will grow through geographic expansion and entry into adjacent markets and product offerings, while remaining focused on distinctive solutions for enclosing commercial buildings. We draw upon our leading brands, energy-efficient products and reputation for high quality and service in pursuit of our strategies. We also aspire to lead our markets in the development of practical, energy-efficient products for new construction and renovation. We have introduced products and services designed to meet the growing demand for energy-efficient building materials. These products have included new energy-efficient glass coatings, thermally enhanced aluminum framing systems, and systems with a high percentage of recycled content.
While each of our operating segments has the ability to grow through geographic expansion and product line extension, we regularly evaluate business development opportunities in complementary markets. This strategy can take the form of acquisition or strategic alliances.
In recent years, we have increased our focus on the window and curtainwall retrofit and renovation market. We have seen increased interest from the non-residential and high-end multi-family building sectors in upgrading the façades and improving the energy efficiency of their buildings. We consider this to be a significant opportunity for Apogee in the coming years.
Additionally, we are constantly working to improve the efficiency and productivity of our manufacturing and installation operations. During fiscal 2014, we completed the initial roll-out of lean manufacturing principles to all of our operating units. In fiscal 2015, we continued to see increasing maturity of many of the lean manufacturing disciplines. We expect this initiative to continue to deliver gross margin expansion into the foreseeable future.
Lastly, we consistently evaluate capital investments to improve productivity and product development capabilities, as well as to provide appropriate manufacturing capacity to support growth.
LSO segment
Our basic strategy in this segment is to convert the custom picture framing market from clear uncoated glass and acrylic products to value-added products that protect art from UV damage while minimizing reflection from the glass, so that viewers see the art rather than the glass. We estimate that over 60 percent of the demand for U.S. custom picture framing glass has converted to value-added glass. Although we are finding it more difficult to further increase the use of value-added glass in the U.S. market, we continue to see conversion to value-added glass. We offer a variety of products with varying levels of reflection control and promote the benefits to consumers with point-of-purchase displays and other promotional materials.
We also participate in the global fine art sector, which includes demand from museums and private art collections. This sector appreciates the conservation and anti-reflective properties of our products, primarily our acrylic products. Acrylic is a preferred material in the fine art sector because the product is light weight, which allows its use with art that is much larger and for which weight is an important consideration. We will continue to expand our presence in this sector through international expansion and product line extensions.
Additionally, this is the third fiscal year where we have been executing on our strategy of increasing custom picture framing sales in selected geographies outside the U.S. We now have distributors in over 30 countries, mainly in Europe, that are serviced from our warehouse in the Netherlands and directly from the U.S. As we leverage our products and distribution network, we will grow at a faster pace internationally than in the U.S.
Results of Operations
Net Sales
| | | (Dollars in thousands) | 2015 | | 2014 | | 2013 | | 2015 vs. 2014 | | 2014 vs. 2013 | 2017 | | 2016 | | 2015 | | 2017 vs. 2016 | | 2016 vs. 2015 |
| Net sales | $ | 933,936 |
| | $ | 771,445 |
| | $ | 700,224 |
| | 21.1 | % | | 10.2 | % | $ | 1,114,533 |
| | $ | 981,189 |
| | $ | 933,936 |
| | 13.6 | % | | 5.1 | % |
Fiscal 20152017 Compared to Fiscal 20142016
SalesNet sales in fiscal 2017 increased by 13.6 percent compared to $933.9 million, up 21.1fiscal 2016, due to gains in volume across all three architectural segments. Volume growth was driven by continued strength in non-residential construction end-markets and success in our strategies to expand geographically and introduce new products. The Architectural Framing Systems segment drove nearly 60 percent of our growth this year. The acquisition of Sotawall in the fourth quarter, included in this segment, contributed 13 percent of our overall growth. The Architectural Glass segment drove approximately 22 percent of our growth and the Architectural Services segment contributed nearly all of the remainder. Currency did not have a meaningful impact on our consolidated sales as compared to the prior year.
Fiscal 2016 Compared to Fiscal 2015
Net sales increased by 5.1 percent, or 7.0 percent on a constant currency basis, over fiscal 2014 sales of $771.4 million. Organic growth2015. This was 16.9 percent, or $127.5 million, when excluding the sales generated by our Canadian storefront and entrance business, which was acquired in the third quarter of fiscal 2014. Organic growth came primarily from increased sales volume in our architectural-based segmentsmainly due to increasedpricing and volume growth resulting from strong commercial construction activity in the U.S.U.S, partially offset by declines in the commercial construction markets in Brazil and Canada. The Architectural Glass segment accounted for approximately 44 percent of the growth, and the Architectural Services segment drove approximately 32 percent of the organic growth, due to increased volumes and improved pricing. Increased volume inwith nearly all of the U.S. window, storefront and finishing businesses inremainder coming from the domestic Architectural Framing Systems segment accounted for approximately 30 percent of the growth. The remaining organic growth was attributable to volume growth in the Architectural Services business and an improved mix of value-added products in the LSO segment.businesses.
Fiscal 2014 ComparedConstant currency revenue excludes the impact of fluctuations in foreign currency on our international operations. Constant currency percentages are calculated by converting prior-period local currency results using the average monthly exchange rate and comparing the adjusted amount to Fiscal 2013
Sales grew 10.2 percentcurrent period reported results. We believe constant currency information provides valuable supplemental information regarding our core operating results, consistent with how we evaluate our performance. We also refer to constant currency measures elsewhere in fiscal 2014this report. This non-GAAP measure should be viewed in addition to, $771.4 million comparedand not as an alternative to, $700.2 millionthe reported results prepared in fiscal 2013. The inclusion of Alumicor sales since the date of acquisition accounted for 2 percentage points of this increase. Improved product mix and pricing in the Architectural Glass segment drove approximately 4 percentage points of the increase. Volume growth in the Architectural Services segment favorably impacted fiscal 2014 by about 2 percentage points and the remainder of the increase resulted from improved volume in our Architectural Framing segment'saccordance with U.S. storefront and finishing businesses.GAAP.
Performance
The relationship between various components of operations, as a percentage of net sales, is illustrated below for the past three fiscal years.provided below.
| | | (Percentage of net sales) | 2015 | | 2014 | | 2013 | 2017 | | 2016 | | 2015 |
| Net sales | 100.0 | % | | 100.0 | % | | 100.0 | % | 100.0 | % | | 100.0 | % | | 100.0 | % |
| Cost of sales | 77.7 |
| | 78.6 |
| | 79.2 |
| 73.8 |
| | 75.2 |
| | 77.7 |
|
| Gross profit | 22.3 |
| | 21.4 |
| | 20.8 |
| 26.2 |
| | 24.8 |
| | 22.3 |
|
| Selling, general and administrative expenses | 15.5 |
| | 16.2 |
| | 16.9 |
| 15.2 |
| | 14.9 |
| | 15.5 |
|
| Operating income | 6.8 |
| | 5.2 |
| | 3.9 |
| 11.0 |
| | 9.9 |
| | 6.8 |
|
| Interest income | 0.1 |
| | 0.1 |
| | 0.1 |
| |
| Interest expense | 0.1 |
| | 0.1 |
| | 0.2 |
| |
| Other income (expense), net | 0.2 |
| | — |
| | — |
| |
| Other income, net | | — |
| | — |
| | 0.2 |
|
| Earnings before income taxes | 7.0 |
| | 5.2 |
| | 3.8 |
| 11.0 |
| | 9.9 |
| | 7.0 |
|
| Income tax expense | 1.6 |
| | 1.6 |
| | 1.1 |
| 3.3 |
| | 3.3 |
| | 1.6 |
|
| Net earnings | 5.4 | % | | 3.6 | % | | 2.7 | % | 7.7 | % | | 6.7 | % | | 5.4 | % |
| Effective income tax rate | 22.3 | % | | 29.6 | % | | 29.0 | % | 30.1 | % | | 32.9 | % | | 22.3 | % |
Fiscal 20152017 Compared to Fiscal 20142016
Gross profit improved 0.9 percentage points to 22.3 percent of sales in fiscal 2015 from 21.4was 26.2 percent in fiscal 2014. The increase in gross margins was due to the impact2017, an improvement of 140 basis points from fiscal 2016, driven by operating leverage on increased volume and improved pricing in the Architectural Glass segment, as well as operating leverage on increased volume in the window business within the Architectural Framing Systems
segment. These positive items were partially offset by manufacturing cost overruns in the Architectural Services Segment, increased aluminum costs in the U.S. and Canadian storefront and entrance businesses within the Architectural Framing Systems segment, and costs to restart the Utah facilityproductivity in our Architectural Glass segment.three architectural segments.
Selling, general and administrative (SG&A) spendingexpense for fiscal 2015 increased by $20.02017 was 15.2 percent, an increase of 30 basis points, or $23.6 million, overfrom fiscal 2014, while SG&A2016, mainly as a result of increased incentive-related compensation and intangible asset amortization expenses.
The effective tax rate for fiscal 2017 was 30.1 percent, of sales decreasedcompared to 15.532.9 percent in fiscal 2016. The decline of 280 basis points was a result of benefits from various tax planning strategies, including recognition of a foreign tax credit contributing 160 basis points, and increased income in foreign jurisdictions with lower tax rates.
Fiscal 2016 Compared to Fiscal 2015
Gross profit improved 250 basis points from fiscal 2015 from 16.2 percent into fiscal 2014. The addition of our Canadian storefront and entrance business acquired in the third quarter of fiscal 2014 contributed approximately 30 percent of the increase in year-on-year spend. The remaining increase was2016, primarily due to increased incentive compensation on improved results, increased sales commissions from higher sales volumespricing and write-down of certain assets acquired in our window business in fiscal 2014.mix, as well as productivity and volume leverage across all architectural segments.
Other income was $1.4SG&A expense declined by 60 basis points from 2015 to 2016, but increased $1.2 million, for fiscal 2015 comparedas a result of expense discipline relative to a small expense in the prior-year period, mainly due to the receipt of the final distribution in the first quarter of fiscal 2015 related to a European business that was discontinued over 15 years ago.sales growth across our segments.
Our effective tax rate for fiscal 2015 was 22.3 percent. The effective tax rate in fiscal 2015 includespercent, including a $6.4 million tax benefit from an energy-efficient investment credit under Section 48C of the Internal Revenue Code in the second quarter of this fiscal year, upon successful start-up and commercial production of coatings on our new architectural glass coater. The tax credit was awarded in 2011 by the U.S. Internal Revenue Service (IRS) in cooperation with the Department of Energy as part of the American Reinvestment and Recovery Act to incent energy-efficiency investments throughout the United States.credit. Excluding this credit, our effective tax rate would have been 32.2%, compared to 32.9% in fiscal 2015, slightly higher than 29.6% in fiscal 2014, due to a lesser net benefit from tax reserve adjustments in the current year.
Fiscal 2014 Compared to Fiscal 2013
Gross profit improved as a percent2016. This increase of sales to 21.4 percent in fiscal 2014 from 20.8 percent in fiscal 2013. The improvement in gross margins70 basis points was due to the margin impactchanges in state income tax laws, combined with a higher percentage of improved mix and pricingearnings in the Architectural Glass segment, improved project marginsU.S., where the tax rate is higher than in the Architectural Services segment and overall productivity improvements. These favorable items were partially offset by lower capacity utilizationforeign jurisdictions in the Architectural Framing System's window business related to an anticipated gap in the schedule for more complex projects.which we operate.
Selling, general and administrative spending increased by $6.7 million in fiscal 2014 over fiscal 2013, while SG&A as a percent of sales decreased to 16.2 percent in fiscal 2014 from 16.9 percent in fiscal 2013. The increase in spending was primarily due to increased salaries and related benefits to support sales growth and geographic expansion, as well as other costs related to geographic expansion and acquisitions during fiscal 2014.
Segment Analysis
Architectural Glass
| | | (In thousands) | 2015 | | 2014 | | 2013 | 2017 | | 2016 | | 2015 |
| Net sales | $ | 346,471 |
| | $ | 293,810 |
| | $ | 266,456 |
| $ | 411,881 |
| | $ | 377,713 |
| | $ | 346,471 |
|
| Operating income (loss) | 16,431 |
| | 3,861 |
| | (4,391 | ) | |
| Operating income (loss) as a percent of sales | 4.7 | % | | 1.3 | % | | (1.6 | )% | |
| Operating income | | 44,656 |
| | 35,504 |
| | 16,431 |
|
| Operating margin | | 10.8 | % | | 9.4 | % | | 4.7 | % |
Fiscal 20152017 Compared to Fiscal 2014.2016. Fiscal 20152017 net sales of $346.5 million increased $52.7$34.2 million, or 17.99.0 percent, over fiscal 2014. The increase for the yearprior year. This was primarily due to increased volume growth and some improvementimproved pricing and mix in pricing.our U.S.-based business, as a result of our focus on growth in the mid-size building sector, as well as the effects of a positive U.S. construction market. Currency did not have a meaningful impact on segment sales as compared to the prior year.
Operating incomemargin improved to $16.4 million in fiscal 2015, compared to $3.9 million in fiscal 2014, an improvement of $12.6 million. Operating margins improved to 4.7 percent in fiscal 2015 compared to 1.3 percent in fiscal 2014. As the commercial construction activity has increased, the Architectural Glass segment has benefited from operating140 basis points, driven by leverage on volume growth, pricing, mix and improved pricing. The segment also demonstrated positive manufacturing productivity that was partially offset by inefficiencies experienced as the business expanded its workforce to meet demand and costs incurred to restart the Utah facility.productivity.
Fiscal 20142016 Compared to Fiscal 2013.2015. Fiscal 20142016 net sales increased $27.4 million to $293.8 million, or 10.3improved 9.0 percent over fiscal 2013. Improvedthe prior year, or 12.2 percent on a constant currency basis, primarily due to improved pricing, mix and pricing in our U.S. and Brazilian businesses accounted for most of the increase. The remainder was due to volume growth in both ourthe U.S. and Brazilian businesses,as a result of the strong U.S. construction market, partially offset by a declinedeclines in volume and mix in our Brazilian operation and lower export volume.sales from the U.S.
Operating income of $3.9 million in fiscal 2014 was an $8.3 million improvement overmargin improved 470 basis points, doubling the fiscal 2013 loss of $4.4 million. Operating margins improved to 1.3 percent in fiscal 2014 compared to negative 1.6 percent in fiscal 2013. The2015 operating margin, with improvement in operating results was largely due to the impact of a betterdriven by pricing and mix, of higher value-added projects and improved pricing. The impact of volume growth and productivity improvements also contributed to the year-on-year increase in operating results.
Architectural Services
|
| | | | | | | | | | | |
| (In thousands) | 2015 | | 2014 | | 2013 |
| Net sales | $ | 230,650 |
| | $ | 203,351 |
| | $ | 186,570 |
|
| Operating income (loss) | 7,442 |
| | 4,479 |
| | (1,008 | ) |
| Operating income (loss) as a percent of sales | 3.2 | % | | 2.2 | % | | (0.5 | )% |
Fiscal 2015 Compared to Fiscal 2014. Net sales of $230.7 million in fiscal 2015 increased $27.3 million, or 13.4 percent over fiscal 2014. The increase was due to volume from project timing and a general increase in project activity on stronger end markets. Operating income increased $3.0 million to $7.4 million compared to $4.5 million in fiscal 2014. Operating margin was 3.2 percent in fiscal 2015 compared to 2.2 percent in fiscal 2014. The improvements in operating results for the year were a result of operating leverage on the increased volume and increasing project margins due to our focus on project selection.
Fiscal 2014 Compared to Fiscal 2013. Fiscal 2014 net sales increased $16.8 million over fiscal 2013, a 9.0 percent increase. Volume growth in existing and expanded geographies was the driver of this growth. Fiscal 2014 operating income increased $5.5 million to $4.5 million compared to a loss of $1.0 million in fiscal 2013. Operating margin of 2.2 percent in fiscal 2014 was an improvement of 2.7 percentage points over fiscal 2013. The improved operating results were a result of better project margins, as we have worked through lower margin projects that were bid in the bottom of the market cycle, as well as strong execution on projects flowing through revenue.operational performance and volume leverage in the U.S., partially offset by the impact of ongoing challenging Brazilian economic conditions.
Architectural Framing Systems
| | | (In thousands) | 2015 | | 2014 | | 2013 | 2017 | | 2016 | | 2015 |
| Net sales | $ | 298,395 |
| | $ | 216,059 |
| | $ | 191,137 |
| $ | 385,978 |
| | $ | 308,593 |
| | $ | 298,395 |
|
| Operating income | 21,808 |
| | 14,930 |
| | 14,584 |
| 44,768 |
| | 31,911 |
| | 21,808 |
|
| Operating income as a percent of sales | 7.3 | % | | 6.9 | % | | 7.6 | % | |
| Operating margin | | 11.6 | % | | 10.3 | % | | 7.3 | % |
Fiscal 20152017 Compared to Fiscal 2014.2016. Fiscal 2015Net sales improved 25.1 percent, or $77.4 million, over fiscal 2016 due to volume growth across our businesses. Our volume growth resulted from strong U.S. construction market conditions, increased penetration into certain geographies and new product introductions. In addition, Sotawall, acquired in the fourth quarter of fiscal 2017, contributed net sales of $298.4$17.8 million increased $82.3 million, or 38.1 percent, over fiscal 2014. Organic growth, excluding our Canadian storefront and entrance business, was 23.7 percent. The organic growth in fiscal 2015 was due2017, or approximately six percentage points of growth. Currency did not have a meaningful impact on segment sales as compared to double-digit volume increases at our three U.S. businesses in the segment, with the U.S. storefront and finishing businesses increasing penetration within their target sectors and geographies, the window business recovering from a prior-year gap in the schedule for complex projects, and an increase in volume due to market growth in our finishing business.prior year.
Fiscal 2015 operating income of $21.8 million was an increase of $6.9 millionOperating margin improved 130 basis points over the $14.9 million reported in fiscal 2014,2016, driven by leverage on volume growth and operating margins improved to 7.3 percent in fiscal 2015 from 6.9 percent in fiscal 2014. The increase in operating results was due to the impact of income growth in the U.S. window, finishing and storefront businesses resulting from increased volume and good execution. This improvement was slightly offset by the negative effect of higher aluminum costs in the U.S. and Canadian storefront businesses, and the impact of soft Canadian markets on the Canadian storefront business in the first half of the year.productivity.
Fiscal 20142016 Compared to Fiscal 2013.2015. Fiscal 2014 netNet sales increased $24.9 million, or 13.0improved 3.4 percent over fiscal 2013.The addition of2015, or 6.0 percent on a constant currency basis, on volume growth from strong U.S. construction markets, and improved pricing and mix in our Canadian storefront and entrance business accounted for approximately 8 percentage points of the increase for fiscal 2014. The remainder of the increase was due to improved volumes in the U.S. storefront and finishing businesses, partially offset by volume declines caused by an anticipated gapweakness in the schedule for the windowour Canadian business.
Operating margin improved 300 basis points over fiscal 2015, driven by improved pricing and mix, lower raw material costs and volume leverage in the U.S., partially offset by the volume weakness in our Canadian business.
Architectural Services
|
| | | | | | | | | | | |
| (In thousands) | 2017 | | 2016 | | 2015 |
| Net sales | $ | 270,937 |
| | $ | 245,935 |
| | $ | 230,650 |
|
| Operating income | 18,494 |
| | 11,687 |
| | 7,442 |
|
| Operating margin | 6.8 | % | | 4.8 | % | | 3.2 | % |
Fiscal 2014 operating income of $14.92017 Compared to Fiscal 2016. Net sales improved 10.2 percent, or $25.0 million, was up slightly over the $14.6 million reported in fiscal 2013, while operating margins decreasedprior year, driven by volume growth due to 6.9 percent in fiscal 2014 from 7.6 percent in fiscal 2013. The favorable impactyear-on-year timing of increased volumesproject activity, as we have continued to experience strong commercial construction activity in the U.S. storefrontOperating margin improved 200 basis points over the prior year, as a result of leveraging volume growth and finishing businesses was partially offsetcontinued good execution on projects with better margins.
Fiscal 2016 Compared to Fiscal 2015. Net sales improved 6.6 percent over the prior year, driven by lower salesvolume growth due to increased commercial construction activity in the window business related toU.S. Operating margin improved 160 basis points over the anticipated gap in the schedule for more complex projects, resulting in lower capacity utilization. Additionally, the Canadian storefront business that was acquired late in fiscal 2014 delivered an operating loss due to acquisition costs.
Large-Scale Optical Technologies (LSO)
| | | (In thousands) | 2015 | | 2014 | | 2013 | 2017 | | 2016 | | 2015 |
| Net sales | $ | 87,693 |
| | $ | 81,127 |
| | $ | 79,947 |
| $ | 89,710 |
| | $ | 88,541 |
| | $ | 87,693 |
|
| Operating income | 21,954 |
| | 21,252 |
| | 20,993 |
| 22,467 |
| | 22,963 |
| | 21,954 |
|
| Operating income as a percent of sales | 25.0 | % | | 26.2 | % | | 26.3 | % | |
| Operating margin | | 25.0 | % | | 25.9 | % | | 25.0 | % |
Fiscal 20152017 Compared to Fiscal 2014.2016. Net sales in our LSO fiscal 2015 net sales of $87.7 million were up $6.6 million, or 8.1segment increased 1.3 percent over fiscal 2014 net salesthe prior year. Operating margin declined 90 basis points over the prior year as a result of $81.1 million. The improvement compared to fiscal 2014 was due to a positive mix of higher value-added products on relatively flat volumes. Operating income of $22.0 million was up slightly over fiscal 2014 results of $21.3 million, while operating margins dropped to 25.0 percent in fiscal 2015 compared to 26.2 percent in fiscal 2014. The impact of the strong mix of value-added products was largely offset by increased incentive compensation and investments in new product development.market opportunities.
Fiscal 20142016 Compared to Fiscal 2013.2015. LSO revenuesNet sales in fiscal 2014this segment increased slightly1.0 percent over fiscal 2013 to $81.1 million from $79.9 million. The improvement compared to fiscal 2013 was due to a positive mix of higher value-added products. Operating income of $21.3 million was relatively flat compared to fiscal 2013 levels and operating margins were consistent. The impact of the strong mix of higher value-added products was largely offset by increased promotional activities and investments for growth in new geographies and markets.
Consolidated Backlog
Backlog represents the dollar amount of revenues we expect to recognize in the future from firm contracts or orders received, as well as those that are in progress. Backlog is not a term defined under generally accepted accounting principles and is not a measure of contract profitability. We include a project within our backlog at the time a signed contract or a firm purchase order is received, generallyprior year as a result of an improved mix of value-added products and stable demand. Operating margin improved 90 basis points over the prior year as a competitive bidding process. Backlog by reporting segment at February 28, 2015, November 29, 2014result of improved product mix and strong operational performance.March 1, 2014 was as follows:
|
| | | | | | | | | | | |
| (In thousands) | February 28, 2015 | | November 29, 2014 | | March 1, 2014 |
| Architectural Glass | $ | 137,432 |
| | $ | 151,221 |
| | $ | 73,206 |
|
| Architectural Services | 287,473 |
| | 268,696 |
| | 187,471 |
|
| Architectural Framing Systems | 77,666 |
| | 88,070 |
| | 72,634 |
|
| Large-Scale Optical | 2,107 |
| | 2,100 |
| | 870 |
|
| Intersegment eliminations | (13,886 | ) | | (16,173 | ) | | (4,546 | ) |
| Total Backlog | $ | 490,792 |
| | $ | 493,914 |
| | $ | 329,635 |
|
We expect approximately $393.4 million, or 80 percent, of our February 28, 2015 backlog to be recognized in fiscal 2016, with the balance to be recognized in fiscal 2017 and beyond. We view backlog as an important statistic in evaluating the level of sales activity and short-term sales trends in our business. However, as backlog is only one indicator, and is not an effective indicator of our ultimate profitability, we do not believe that backlog should be used as the sole indicator of future earnings of the Company.
Acquisitions
On November 5, 2013, the Company acquired all of the shares of Alumicor Limited, a privately held business, for $52.9 million, including cash acquired of $1.6 million. Alumicor is a window, storefront, entrance and curtainwall company primarily serving the Canadian commercial construction market. The purchase price allocation was based on the fair value of assets acquired and liabilities assumed and included total assets of $61.8 million, including goodwill and intangibles of $34.9 million, and total liabilities of $10.5 million. In the second quarter of fiscal 2014, we also acquired certain assets and liabilities of a window fabrication business as part of our strategy to grow through new products and new geographies. Both of these acquisitions are reported within our Architectural Framing Systems segment.
Liquidity and Capital Resources
| | | (Cash effect, in thousands) | 2015 | | 2014 | | 2013 | |
| (In thousands) | | 2017 | | 2016 | | 2015 |
| Operating Activities | | | | | | | | | | |
| Net cash provided by operating activities | $ | 68,563 |
| | $ | 52,921 |
| | $ | 40,523 |
| $ | 124,001 |
| | $ | 128,943 |
| | $ | 71,799 |
|
| Investing Activities | | | | | | | | | | |
| Capital expenditures | (27,220 | ) | | (41,852 | ) | | (34,664 | ) | (68,061 | ) | | (42,037 | ) | | (27,220 | ) |
| Proceeds from sales of property, plant and equipment | 273 |
| | 806 |
| | 1,078 |
| |
| Acquisition of businesses and intangibles, net of cash acquired | — |
| | (53,301 | ) | | (15 | ) | |
| Change in restricted investments, net | 2,532 |
| | 23,915 |
| | (4,528 | ) | |
| Net sales (purchases) of marketable securities | 804 |
| | 26,458 |
| | (17,552 | ) | 32,728 |
| | (31,767 | ) | | 804 |
|
| Acquisition of business and intangibles | | (137,932 | ) | | — |
| | — |
|
| Financing Activities | | | | | | | | | | |
| Proceeds from issuance of debt | — |
| | — |
| | 10,000 |
| |
| Payments on debt | (50 | ) | | (10,082 | ) | | (164 | ) | |
| Borrowings on line of credit, net | | 44,988 |
| | — |
| | — |
|
| Repurchase and retirement of common stock | (6,894 | ) | | — |
| | — |
| (10,817 | ) | | (24,911 | ) | | (6,894 | ) |
| Dividends paid | (12,071 | ) | | (10,764 | ) | | (10,316 | ) | (14,667 | ) | | (13,184 | ) | | (12,071 | ) |
Operating activities.Activities. Cash provided by operating activities was $68.6$124.0 million in fiscal 2015, $52.92017, a decrease of $5.0 million infrom fiscal 2014, and $40.5 million in fiscal 2013. Fiscal 2015 and 20142016. In all years presented, operating cash flows were each positively impactedbenefited by the increased income reported for those fiscal years as compared to the respective prior-year periods.
Non-cashperiod. In addition, in fiscal 2017, cash from operations was negatively impacted by timing of working capital (current assets, excluding cash and short-term available for sale securities and short-term restricted investments, less current liabilities, excluding current portion of long-term debt) was $97.5 million at February 28, 2015. This compares to $82.0 million at March 1, 2014, and $58.8 million at March 2, 2013. The increase in fiscal 2015 was due to our investment in working capital necessary to support sales growth. The change in fiscal 2014 was a result of including partial year results of Alumicor, growth in the base business and extending our geographic footprint in certain businesses.payments.
Investing Activities. InvestingNet cash used in investing activities used cash of $24.5was $183.8 million in fiscal 2015, $44.0 million in fiscal 2014 and $57.1 million in fiscal 2013. Thethe current year, includedmainly due to the acquisition of substantially all the assets of Sotawall, Inc. for approximately $138 million. We also made capital investments of $27.2 million mainlyexpenditures focused primarily on increasing our product capabilities, in particular related to increase productivity, increase capacity and improve product development capabilities. Net sales of marketable securities and restrictedthe oversized glass fabrication project. Additional capital investments generated $3.3 million of cash.
were made to increase our manufacturing productivity across all reporting segments. In fiscal 2014, we made2016 and 2015, capital investments of $41.9 million as we made investments forwere primarily focused on increasing manufacturing productivity and product development capabilities, including a new state-of-the-art coater in our Architectural Glass segment. We reduced our restricted investments by $23.9 million, as we released $10.0 million of cash held in escrow for the recovery zone facility bonds that was used to redeem the bonds and also released $12.0 million of cash collateral to unrestricted cash related to the letter of credit supporting these bonds. We decreased our investments in marketable securities by $26.5 million in fiscal 2014 to fund the acquisition of Alumicor.
During fiscal 2014, we completed two acquisitions as part of our strategy to grow through new products and new geographies. In the second quarter, we acquired certain assets and liabilities of a window fabrication business, which are included in the results of our window business within the Architectural Framing Systems segment. During the third quarter, we acquired the outstanding shares of Alumicor Limited; its results of operations are included within the Architectural Framing Systems segment.
In fiscal 2013, we made capital investments of $34.7 million for growth and productivity improvements, as well as equipment to support new product introductions, and maintenance capital. The net position of our investments for fiscal 2013 resulted in $17.6 million in net purchases as a result of generating excess cash through operating activities noted above. Net purchases of $4.5 million for restricted investments during fiscal 2013 were the result of $10.0 million of industrial development bonds (reflected in financing activities) that were made available for current and future investment in our storefront and entrance business in Michigan.capacity.
We expectestimate fiscal 20162018 capital expenditures to range from $45be $50 to $50$60 million, for investmentsas we continue to increaseinvest in capabilities capacity and productivity, as well as maintenance capital.productivity.
We continue to review our portfolio of businesses and their assets in comparison to our internal strategic and performance objectives. As part of this review, we may acquire other businesses, pursue geographic expansion, take actions to manage capacity and/orand further invest in, fully divest and/or sell parts of our current businesses.
At February 28, 2015, we had one sale and leaseback agreement for equipment that provides an option to purchase the equipment at projected future fair market value upon expiration of the lease in 2021. The lease is classified as an operating lease. We had a deferred gain of $2.8 million under the sale and leaseback transaction, which is included in the balance sheet as other current and non-current liabilities. The average annual lease payment over the life of the remaining lease is $1.0 million.
Financing Activities. Total outstanding borrowings at February 28, 2015 were $20.6We paid dividends totaling $14.7 million compared to $20.7 million at March 1, 2014 and $30.8 million at March 2, 2013. During the first quarter of fiscal 2014, $10.0 million of recovery zone facility bonds that had previously been issued for future investment in the Company's Architectural Glass fabrication facility in Utah were redeemed at par. Our debt consists of $20.4 million of industrial revenue bonds and $0.2 million of other debt. The industrial revenue bonds mature in fiscal years 2021 through 2043 and the other debt matures in fiscal years 2016 through 2021. There were small amounts of current debt at February 28, 2015 and March 1, 2014. At March 2, 2013, $10.0 million of the recovery zone facility bonds were classified as current as2017. Additionally, we repaid these bonds related torepurchased 250,001 shares under our Utah facility in early fiscal 2014. Our debt-to-total-capital ratio was 5.1 percent at February 28, 2015 and 5.5 percent at March 1, 2014.
During the fourth quarter of fiscal 2015, we entered into an amendment of our existing $100.0 million committed revolving credit facility. The amount of the facility was increased to $125.0 million; the expiration date was extended to December 2019; the letter of credit facility was reduced to $40.0 million from $50.0 million, the outstanding amounts of which decrease the available commitment; and the maximum debt-to-EBITDA ratio was increased to 3.00. No other provisions of the original agreement were materially amended by the amended credit agreement. No borrowings were outstanding under the facility as of February 28, 2015 or March 1, 2014.
The credit facility requires that we maintain a debt-to-EBITDA ratio of not more than 3.00. This ratio is computed quarterly, with EBITDA computed on a rolling four-quarter basis. The Company’s ratio was 0.22 at February 28, 2015. The credit facility also requires the Company to maintain a minimum level of net worth, as defined in the credit facility, based on certain quarterly financial calculations. The minimum required net worth computed in accordance with the credit facility at February 28, 2015 was $318.8 million, whereas the Company’s net worth as defined in the credit facility was $382.5 million. If the Company is not in compliance with either of these covenants, the lenders may terminate the commitment and/or declare any loan then outstanding to be immediately due and payable. At February 28, 2015, the Company was in compliance with the financial covenants of the credit facility.
In the second quarter of fiscal 2015, we entered into a Canadian Dollar $4.0 million revolving demand facility available to our Canadian storefront and entrance business. Borrowings under the facility are made available at the sole discretion of the lender and are payable on demand. Borrowings under the facility bear interest at rates specified in the credit agreement for the facility. We classify any outstanding balances under this demand facility as long-term debt, since outstanding amounts can be refinanced through our committed revolving credit facility. No borrowings were outstanding as of February 28, 2015.
During fiscal 2004, the Board of Directors authorized a share repurchase program during fiscal 2017, for a total cost of 1,500,000$10.8 million. We repurchased 575,000 shares of common stock. The Board of Directors increased this authorization by 750,000 sharesunder the program in January 2008fiscal 2016 and by 1,000,000 in October 2008. We purchased 203,509 shares under the program during fiscal 2015, for a total cost of $6.9 million; there were no share repurchases during fiscal 2014.2015. We have purchasedrepurchased a total of 2,482,6323,307,633 shares, at a total cost of $36.5$72.3 million, since the inception of this program.program during fiscal 2004. We have remaining authority to repurchase 767,368942,367 shares under this program, which has no expiration date.
In additionWe maintain a $175.0 million committed revolving credit facility that expires in November 2021 as further described in Note 8 of the Notes to Consolidated Financial Statements. $45.0 million was outstanding under this credit facility as of March 4, 2017, as we used this facility to partially finance the shares repurchasedSotawall acquisition. Nothing was outstanding under this credit facility at the repurchase plan, during fiscal 2015end of either of the two prior years. As defined within this credit facility, we have two financial covenants which require us to stay below a maximum leverage ratio and 2014to maintain a minimum interest expense-to-EBITDA ratio. At March 4, 2017, we also acquired $5.2 million and $3.6 million, respectively, of Company stock from employeeswere in order to satisfy stock-for-stock option exercises or withholding tax obligations related to stock-based compensation, pursuant to terms of Board and shareholder-approved compensation plans.compliance with both financial covenants.
Other Financing Activities. The following summarizes our significant contractual obligations that impact our liquidity as of February 28, 2015March 4, 2017:
| | | | Future Cash Payments Due by Fiscal Period | Payments Due by Fiscal Period |
| (In thousands) | 2016 | | 2017 | | 2018 | | 2019 | | 2020 | | Thereafter | | Total | 2018 | | 2019 | | 2020 | | 2021 | | 2022 | | Thereafter | | Total |
| Continuing operations | | | | | | | | | | | | | | |
| Industrial revenue bonds | $ | — |
| | $ | — |
| | $ | — |
| | $ | — |
| | $ | — |
| | $ | 20,400 |
| | $ | 20,400 |
| |
| Other debt obligations | 44 |
| | 44 |
| | 44 |
| | 44 |
| | 44 |
| | 11 |
| | 231 |
| |
| Long-term debt obligations | | $ | — |
| | $ | — |
| | $ | — |
| | $ | 5,400 |
| | $ | 47,000 |
| | $ | 13,000 |
| | $ | 65,400 |
|
| Operating leases (undiscounted) | 9,341 |
| | 7,423 |
| | 6,609 |
| | 5,932 |
| | 4,675 |
| | 3,658 |
| | 37,638 |
| 11,419 |
| | 10,796 |
| | 9,286 |
| | 6,342 |
| | 5,605 |
| | 9,002 |
| | 52,450 |
|
| Purchase obligations | 139,682 |
| | 14,441 |
| | 4,734 |
| | — |
| | — |
| | — |
| | 158,857 |
| 106,839 |
| | 4,693 |
| | 1,800 |
| | 1,230 |
| | 1,230 |
| | — |
| | 115,792 |
|
| Total cash obligations | $ | 149,067 |
| | $ | 21,908 |
| | $ | 11,387 |
| | $ | 5,976 |
| | $ | 4,719 |
| | $ | 24,069 |
| | $ | 217,126 |
| $ | 118,258 |
| | $ | 15,489 |
| | $ | 11,086 |
| | $ | 12,972 |
| | $ | 53,835 |
| | $ | 22,002 |
| | $ | 233,642 |
|
In addition to the committed revolving credit facility discussed above, we also have industrial revenue bond obligations of $20.4 million that mature in fiscal years 2021 through 2043.
From time to time, we acquire the use of certain assets through operating leases, such as warehouses, automobiles,vehicles, forklifts, vehicles, office equipment, hardware, software and some manufacturing equipment through operating leases.equipment. Many of these operating leases have termination penalties. However, because the assets are used in the conduct of our business operations, it is unlikely that any significant portion of these operating leases would be terminated prior to the normal expiration of their lease terms. Therefore, we consider the risk related to termination penalties to be minimal.
We have purchasePurchase obligations forin the table above relate to raw material commitments and capital expenditures. As of February 28, 2015, these obligations totaled $158.9 million.
We expect to make contributions of approximately $1.0 million to our defined-benefit pension plans in fiscal 2016,2018, which will equal or exceed our minimum funding requirements.
As of February 28, 2015March 4, 2017, we had $4.5reserves of $4.0 million and $1.8$1.4 million offor long-term unrecognized tax benefits and environmental liabilities, respectively. We expect approximately $0.7$0.4 million of the unrecognized tax benefits to lapse during the next 12 months. We are unable to reasonably estimate in which future periods the remaining unrecognized tax benefits and environmental liabilities will ultimately be settled.
At February 28, 2015March 4, 2017, we had ongoing letters of credit of $23.5 million related to construction contracts and certain industrial revenue bonds. The Company’s $20.4 million of industrial revenue bonds are supported by $21.0 million of letters of creditand construction contracts that expire in fiscal 2018 and that reduce availability of funds under our $125.0 millioncommitted credit facility. The letters of credit by expiration period were as follows at February 28, 2015:
|
| | | | | | | | | | | | | | | | | | | | | | | | | | | |
| | Amount of Commitment Expiration Per Fiscal Period |
| (In thousands) | 2016 | | 2017 | | 2018 | | 2019 | | 2020 | | Thereafter | | Total |
| Standby letters of credit | $ | 8,653 |
| | $ | 12,329 |
| | $ | — |
| | $ | — |
| | $ | — |
| | $ | 2,500 |
| | $ | 23,482 |
|
In addition to the above standby letters of credit, which were primarily issued for our industrial revenue bonds, we are required, in the ordinary course of business, to provide surety or performance bonds that commit payments to our customers for any non-performance by us. At February 28, 2015March 4, 2017, $76.996.2 million of our backlog was bonded by performance bonds with a face value of $274.0343.7 million. Performance bonds do not have stated expiration dates,
as we are released from the bonds upon completion of the contract.contracts. We have never been required to make any payments related to these performance bonds with respect to any of our current portfolio of businesses.
We believe that currenthad total cash on hand and short-term marketable securities of $20.0 million, and $106.5 million available capacity under our committed revolving credit facility, as well as the expectedat March 4, 2017. Due to our ability to generate strong cash to be generated from future operating activities,operations and borrowing capability under our committed revolving credit facility, we believe that our sources of liquidity will continue to be adequate to fund our working capital requirements, planned capital expenditures and dividend payments overfor at least the next 12 months. We have total cash and short-term available-for-sale securities of $52.5 million, and $101.5 million available under our credit facility at February 28, 2015. We believe that this will provide us with the financial strength to continue our growth strategy as our end markets continue to improve.
Off-balance sheet arrangements.Sheet Arrangements. With the exception of operating leases, we had no off-balance sheet financing arrangements at March 4, 2017 or February 28, 2015 or March 1, 2014.27, 2016.
Outlook
The following statements are based on our current expectations for fiscal 20162018 results. These statements are forward-looking, and actual results may differ materially.
Revenue growth of approximately 10 to 15 percent over fiscal 2015.2017.
We anticipate earningsGross margin of approximately 28 percent and operating margin of approximately 12.5 percent.
Earnings per diluted share of $2.05$3.35 to $2.20. Gross margins are anticipated to be approximately 24 percent.$3.55.
Capital expenditures are projectedof approximately $50 to be approximately $45 to $50$60 million.
Recently Issued Accounting Pronouncements
See New Accounting Standards set forth in Note 1 of the Notes to Consolidated Financial Statements underwithin Item 8 of this Form 10-K for information pertaining to recently adoptedissued accounting standards or accounting standards to be adopted in the future, which ispronouncements, incorporated herein by reference herein.reference.
Critical Accounting Policies
Management has evaluated the accounting policies and estimates used in the preparation of the accompanying financial statements and related notes, and believes those policies and estimates to be reasonable and appropriate. We believe that the most critical accounting policies and estimates applied in the presentation of our financial statements relate to accounting for future events. Future events and their effects cannot be determined with absolute certainty. Therefore, management is required to exercise judgment both in assessing the likelihood that a liability has been incurred as well as in estimating the amount of potential loss. We have identified the following accounting policies as critical to our business and in the understanding of our resultsOur analysis of operations and financial position:condition is based on our consolidated financial statements prepared in accordance with U.S. GAAP. Preparation of these consolidated financial statements requires us to make estimates and assumptions affecting the reported amounts of assets and liabilities at the date of the consolidated financial statements, reported amounts of revenues and expenses during the reporting period and related disclosures of contingent assets and liabilities. In developing these estimates and assumptions, a collaborative effort is undertaken involving management across the organization including finance, sales, project management, quality, risk, legal and tax, as well as outside advisors such as consultants, engineers, lawyers and actuaries. Our estimates are evaluated on an ongoing basis and are drawn from historical experience and other assumptions that we believe to be reasonable under the circumstances. Actual results could differ under other assumptions or circumstances.
The following items in our consolidated financial statements require significant estimation or judgment:
Revenue recognitionrecognition. - Our standard product sales terms are “free on board” (FOB) shipping point or FOB destination, andWe recognize revenue is recognized when title has transferred. However,transferred, except within our Architectural Services segment and for one business enterswithin our Architectural Framing Systems segment, which enter into fixed-price contracts for full-service commercial building glass installation and renovation services, which are accounted for as construction-type contracts. These contracts areprojects typically performed over a 12- to 18-month timeframe, and we record revenue for these contracts on a percentage-of-completion basis as we are able to reasonably estimate total contract revenue and total contract costs.24-month timeframe. The contracts entered into clearly specify the enforceable rights of the parties, the consideration and the terms of settlement, and both parties can be expected to satisfy all obligations under the contract. During fiscal 2015, approximately 25 percent of our consolidated sales were recordedWe record revenue for these contracts on a percentage-of-completion basis. Under this methodology,basis as we are able to reasonably estimate total contract revenue and total contract costs. We compare the total costs incurred to date to the total estimated costs for the contract, and record that proportion of the total contract revenue in the period. Contract costs include materials, labor and other direct costs related to contract performance. Given our ability to make reasonable estimates of our total contract revenues and total contract costs, weWe believe utilizing the cost-to-cost method for revenue recognition provides the greatest degree of precisionaccuracy in measuring progress toward completion ofrevenue throughout the installation contracts.contract period. Provisions are established for estimated losses, if any, on uncompleted contracts in the period in which such losses are determined. Amounts representing contract change orders, claims or other items are included in contract revenue only when customers have approved them. Aupon customer approval. Recognizing revenue under the percentage-of-completion method of accounting requires significant numberestimates, including total costs and the percentage complete on the contract, as well as any potential losses or contract overruns. During fiscal 2017, approximately 26 percent of estimates are used in these computations.our consolidated sales were recorded on a percentage-of-completion basis.
Goodwill impairment. We evaluate goodwill for impairment - To determine if there has been any impairment in accordance with accounting standards, we evaluate the goodwill onannually at our balance sheet annuallyyear-end, or more frequently if impairment indicators exist throughexist. This year we elected to first perform a qualitative assessment to determine whether it is more likely than not that the fair value of a reporting unit is less than its carrying amount (commonly referred to as “step 0”). If, after assessing all events and circumstances, it is determined that it is not more likely than not that the fair value of a reporting unit is less than its carrying amount, then the two-step process. Ingoodwill impairment assessment is unnecessary. If we proceed in the goodwill analysis, step one, we1 of the process compares the fair value of each of our reporting units and compare these values to the reporting units' net bookcarrying value, including goodwill. If the fair value exceeds the carrying value, goodwill impairment is less than the net book value, we perform step two, which determines the amount of goodwill to impair.not indicated. Each of our seven business units represents a reporting unit under applicable accounting standards. We werefor the goodwill
impairment analysis. Based on our assessment process, we determined that it was not required to perform step two for fiscal 2015;more likely than not that the estimated fair value of eachany of our reporting units was less than its carrying amount.
When we perform step 1 of the reporting units significantly exceeded their book value utilizing the discounted cash flow methodology at February 28, 2015.
Although we consider public information for transactions made on businesses similar to ours, since there were no market comparables identified,goodwill impairment assessment, we base our determination of fair value usingon a discounted cash flow methodology that involves significant judgments based uponjudgment about projections of future performance. In developing our discounted cash flow analysis, assumptionsAssumptions about future revenues and expenses, capital expenditures and changes in working capital are based on ourthe annual operating plan and long-term business plan for each of our reporting units.business unit. These plans take into consideration numerous factors, including historical experience, anticipated future economic conditions and growth expectations for the industries and end markets in which we participate. These assumptions are determined over a five-year, long-term planning period. The five-year growthGrowth rates for revenues and operating profits vary for each reporting unit being evaluated. Revenues and operating profit beyond the five-year period are projected to grow at a nominal perpetual growth rate for all reporting units.unit. The discount rate calculations are determined by assuming a company beta, market premium risk, size premium,assumption for each reporting unit takes into consideration our assessment of risks inherent in the future cash flows of our business and an estimated weighted-average cost of debt and debt-to-capital ratio of a market participant.
A significant change in the factors noted above could cause us to reduce the estimated fair value of some or all of our reporting units and recognize a corresponding impairment of our goodwill in connection with a future goodwill impairment test. There can be no assurances that these forecasts will be attained. Adverse changes in strategy, market conditions or assumed market capitalization may result in an impairment of goodwill.capital.
Reserves for disputes and claims regarding product liability and warrantieswarranties. - From time to time, weWe are subject to claims associated with our products and services, principally as a result of disputes with our customers involving the performance or aesthetics of our architectural products and services. The time period from when a claim is asserted to when it is resolved, either by dismissal, negotiation, settlement or litigation, can be several years. While we maintain product liability insurance, the insurance policies include significant self-retention of risk in the form of policy deductibles. In addition, certain claims could be determined to be uninsured. We reserve basedestimated exposures on our estimates of known claims, as well as on a portion of anticipated claims for possible product warranty and rework costs based on historical product liability claims as a ratio of sales. Factors that could have an impact on the warranty reserve in any given period include: changes in manufacturing quality, shifts in product mix and any significant changes in sales volume.
Self-insurance reserves - We obtain substantial amounts of commercial insurance for potential losses for general liability, workers' compensation, automobile liability, employment practices, architect's and engineer's errors and omissions risk, product re-work and other miscellaneous coverages. However, an amount of risk is retained on a self-insured basis through a wholly-owned insurance subsidiary; as a result, a material construction project rework event could have a material adverse effect on our operating results. Reserve requirements are established based on actuarial projections of ultimate losses.
Income taxes - We record a tax provision for the anticipated tax consequences of the reported results of operations. Deferred tax assets and liabilities are measured using the currently enacted tax rates that apply to taxable income in effect for the years in which those deferred tax assets and liabilities are expected to be realized or settled. In addition, the calculation of tax liabilities involves significant judgment in estimating the impact of uncertainties in the application of complex tax laws. Resolution of these uncertainties in a manner inconsistent with management's expectations could have a material impact on the Company's financial condition and operating results.
As part of our ongoing financial reporting process, a collaborative effort is undertaken involving our management with responsibility for financial reporting, product and project management, quality, legal and tax, and outside advisors such as consultants, engineers, lawyers and actuaries. The results of this effort provide management with the necessary information on which to base its judgments on these future events and develop the estimates used to prepare the financial statements. We believe that the amounts recorded in the accompanying financial statements related to these events are based on the best estimates and judgments of Apogee management. However, outcomes could differ from our estimates and could materially adversely affect our future operating results, financial position and cash flows.
ITEM 7A. QUANTITATIVE AND QUALITATIVE DISCLOSURES ABOUT MARKET RISK
Our investment portfolio consists of municipal bonds. At February 28, 2015, we had total investments of $11.0 million, whichWe are considered available-for-sale securities. Although these investments are subjectexposed to the creditongoing market risk of the issuer and/or letter of credit issuer, we manage our investment portfoliorelated to limit our exposure to any one issuer.
We do not use derivative financial instruments to manage interest rate risk or to speculate on future changes in interest rates and foreign currency exchange rates. Accordingly, a
A rise in interest rates could negatively affect the fair value of our municipal bond portfolio.fixed income holdings, while serving to provide greater return on our equity investments. To manage our direct risk from changes in market interest rates, managementwe actively monitorsmonitor the interest-sensitive components of our balance sheet, primarily available-for-sale securities, fixed income securities and debt obligations, and fixed income securities, as well as market interest rates,maintain a diversified portfolio in order to minimize the impact of changes in interest rates on net earnings and cash flow. We do not enter into any financial instruments for trading purposes, and we currently do not use derivative financial instruments to manage interest rate risk. We also diversify and manage our investment portfolio in order to limit impact of potential credit risk.
The primary measure of interest rate risk is the simulation of net income under different interest rate environments. The approach usedIf interest rates were to quantify interest rate risk is a sensitivity analysis. This approach calculates the impact on net earnings, relative to a base case scenario, of rates increasingincrease or decreasing graduallydecrease over the next 12 months by 200 basis points. This change in interest rates affecting our financial instrumentspoints, net earnings would be impacted by approximately $0.1 million. Our debt exceeded investments at February 28, 2015 would result in an approximately $0.2 million impact to net earnings. The Company's investments exceeded its debt at February 28, 2015,March 4, 2017, so as interest rates increase, net earnings increase;decrease; as interest rates decrease, net earnings decrease.increase.
In addition to the market risk related to interest rate changes on our financial instruments, the commercial construction markets in which our businesses operate are highly affected by changes in interest rates. Increases in interest rates and, therefore, significant interest rate fluctuations could materiallyadversely impact activity in the commercial construction industry and our operating results.
Due to our Canadian storefront and Brazilian glass businesses, we conduct business in locations outside of the United States, andWe are subject to market risk due to changes in the value of foreign currencies in relation to our reporting currency, the U.S. dollar.
We generally do not use derivative financial instruments to manage these risks. The functional currencyhave operations in each of our foreign operations is theCanada and Brazil, which primarily transact business in local currency in the country of domicile.currencies. We manage these operating activities at the local level and revenues,locally. Revenues, costs, assets and liabilities of these operations are generally denominated in local currencies, thereby mitigating some of the risk associated with changes in foreign exchange.exchange rates. However, our consolidated financial results of operations and assets and liabilities are reported in U.S. dollars, and thus will fluctuate withdollars. Thus, changes in exchange rates between the Canadian dollar and Brazilian real, on the one hand, and the U.S. dollar.
Ourdollar, on the other, will impact our results. From time to time, we may enter into insignificant, short-duration, foreign currency contracts, with an original maturity date of less than one year, to hedge foreign currency risk. Sales from our domestic businesses generally sell within the United States, with sales made outside of the United Statesoperations are generally denominated in U.S. dollars.
29
ITEM 8. FINANCIAL STATEMENTS AND SUPPLEMENTARY DATA
Management's Annual Report on Internal Control over Financial Reporting
Management of Apogee Enterprises, Inc. and its subsidiaries (the Company) is responsible for establishing and maintaining adequate internal control over financial reporting, as such term is defined in Rules 13a-15(f) of the Securities Exchange Act of 1934. The Company's internal control over financial reporting is designed to provide reasonable assurance regarding the reliability of financial reporting and the preparation of financial statements for external purposes in accordance with generally accepted accounting principles. The Company's internal control over financial reporting includes those policies and procedures that (1) pertain to maintenance of records that, in reasonable detail, accurately and fairly reflect the transactions and dispositions of the assets of the Company; (2) provide reasonable assurance that transactions are recorded as necessary to permit preparation of the financial statements in accordance with generally accepted accounting principles, and that receipts and expenditures of the Company are being made only in accordance with authorizations of management and directors of the Company; and (3) provide reasonable assurance regarding prevention or timely detection of unauthorized acquisition, use or disposition of the Company's assets that could have a material effect on the financial statements.
Because of inherent limitations, internal control over financial reporting may not prevent or detect misstatements. Also, projections of any evaluation of the effectiveness of internal control over financial reporting to future periods are subject to the risk that the controls may become inadequate because of changes in conditions, or that the degree of compliance with the policies or procedures may deteriorate.
The Company's management assessed the effectiveness of the Company's internal control over financial reporting as of February 28, 2015March 4, 2017, using criteria set forth by the Committee of Sponsoring Organizations of the Treadway Commission (COSO) in Internal Control—Integrated Framework (2013). The Company's management believes that as of February 28, 2015March 4, 2017, the Company's internal control over financial reporting was effective based on those criteria.
Management has excluded from its assessment the internal control over financial reporting at Sotawall, which was acquired on December 14, 2016, and whose financial statements constitute 18 percent of total assets, two percent of revenues and one percent of operating income on the consolidated financial statement amounts as of and for the year ended March 4, 2017.
TheFollowing this report are reports from the Company's independent registered public accounting firm, Deloitte & Touche LLP, has issued a reporton the Company's consolidated financial statements and on the effectiveness of the Company's internal control over financial reporting as of February 28, 2015March 4, 2017. That report is set forth immediately following the report of Deloitte & Touche LLP on the consolidated financial statements included herein.
REPORT OF INDEPENDENT REGISTERED PUBLIC ACCOUNTING FIRM
To the Board of Directors and Shareholders of
Apogee Enterprises, Inc.
Minneapolis, MNMinnesota
We have audited the accompanying consolidated balance sheets of Apogee Enterprises, Inc. and subsidiaries (the “Company”"Company") as of March 4, 2017 and February 28, 2015 and March 1, 2014,27, 2016, and the related consolidated results of operations, statements of comprehensive earnings, statements of cash flows, and statements of shareholders’ equity for each of the three years in the period ended February 28, 2015.March 4, 2017. Our audits also included the financial statement schedule listed in the Table of Contents at Item 15. These consolidated financial statements and financial statement schedule are the responsibility of the Company's management. Our responsibility is to express an opinion on the consolidatedthese financial statements and financial statement schedule based on our audits.
We conducted our audits in accordance with the standards of the Public Company Accounting Oversight Board (United States). Those standards require that we plan and perform the audit to obtain reasonable assurance about whether the financial statements are free of material misstatement. An audit includes examining, on a test basis, evidence supporting the amounts and disclosures in the financial statements. An audit also includes assessing the accounting principles used and significant estimates made by management, as well as evaluating the overall financial statement presentation. We believe that our audits provide a reasonable basis for our opinion.
In our opinion, such consolidated financial statements present fairly, in all material respects, the financial position of Apogee Enterprises, Inc. and subsidiaries at March 4, 2017 and February 28, 2015 and March 1, 2014,27, 2016, and the results of their operations and their cash flows for each of the three years in the period ended February 28, 2015,March 4, 2017, in conformity with accounting principles generally accepted in the United States of America. Also, in our opinion, such financial statement schedule, when considered in relation to the basic consolidated financial statements taken as a whole, presents fairly, in all material respects, the information set forth therein.
We have also audited, in accordance with the standards of the Public Company Accounting Oversight Board (United States), the Company's internal control over financial reporting as of February 28, 2015,March 4, 2017, based on the criteria established in Internal Control - Integrated Framework (2013) issued by the Committee of Sponsoring Organizations of the Treadway Commission and our report dated April 29, 2015,28, 2017 expressed an unqualified opinion on the Company's internal control over financial reporting.
/s/ Deloitte & Touche LLP
Minneapolis, Minnesota
April 29, 201528, 2017
REPORT OF INDEPENDENT REGISTERED PUBLIC ACCOUNTING FIRM
To the Board of Directors and Shareholders of
Apogee Enterprises, Inc.
Minneapolis, MNMinnesota
We have audited the internal control over financial reporting of Apogee Enterprises, Inc. and subsidiaries (the “Company”"Company") as of February 28, 2015,March 4, 2017, based on criteria established in Internal Control - Integrated Framework (2013)issued by the Committee of Sponsoring Organizations of the Treadway Commission. As described in Management’s Annual Report on Internal Control over Financial Reporting, management excluded from its assessment the internal control over financial reporting at Sotawall Limited (Sotawall), which was acquired on December 14, 2016, and whose financial statements constitute 18 percent of total assets, two percent of revenues, and one percent of operating income of the consolidated financial statement amounts as of and for the year ended March 4, 2017. Accordingly, our audit did not include the internal control over financial reporting at Sotawall. The Company's management is responsible for maintaining effective internal control over financial reporting and for its assessment of the effectiveness of internal control over financial reporting, included in the accompanying Management’s Report on Internal Control over Financial Reporting. Our responsibility is to express an opinion on the Company's internal control over financial reporting based on our audit.
We conducted our audit in accordance with the standards of the Public Company Accounting Oversight Board (United States). Those standards require that we plan and perform the audit to obtain reasonable assurance about whether effective internal control over financial reporting was maintained in all material respects. Our audit included obtaining an understanding of internal control over financial reporting, assessing the risk that a material weakness exists, testing and evaluating the design and operating effectiveness of internal control based on the assessed risk, and performing such other procedures as we considered necessary in the circumstances. We believe that our audit provides a reasonable basis for our opinion.
A company's internal control over financial reporting is a process designed by, or under the supervision of, the company's principal executive and principal financial officers, or persons performing similar functions, and effected by the company's board of directors, management, and other personnel to provide reasonable assurance regarding the reliability of financial reporting and the preparation of financial statements for external purposes in accordance with generally accepted accounting principles. A company's internal control over financial reporting includes those policies and procedures that (1) pertain to the maintenance of records that, in reasonable detail, accurately and fairly reflect the transactions and dispositions of the assets of the company; (2) provide reasonable assurance that transactions are recorded as necessary to permit preparation of financial statements in accordance with generally accepted accounting principles, and that receipts and expenditures of the company are being made only in accordance with authorizations of management and directors of the company; and (3) provide reasonable assurance regarding prevention or timely detection of unauthorized acquisition, use, or disposition of the company's assets that could have a material effect on the financial statements.
Because of the inherent limitations of internal control over financial reporting, including the possibility of collusion or improper management override of controls, material misstatements due to error or fraud may not be prevented or detected on a timely basis. Also, projections of any evaluation of the effectiveness of the internal control over financial reporting to future periods are subject to the risk that the controls may become inadequate because of changes in conditions, or that the degree of compliance with the policies or procedures may deteriorate.
In our opinion, the Company maintained, in all material respects, effective internal control over financial reporting as of February 28, 2015,March 4, 2017, based on the criteria established in Internal Control - Integrated Framework (2013) issued by the Committee of Sponsoring Organizations of the Treadway Commission.
We have also audited, in accordance with the standards of the Public Company Accounting Oversight Board (United States), the consolidated financial statements and financial statement schedule listed in the Table of Contents at Item 15 as of and for the year ended February 28, 2015,March 4, 2017 of the Company and our report dated April 29, 201528, 2017 expressed an unqualified opinion on those consolidated financial statements and financial statement schedule.
/s/ Deloitte & Touche LLP
Minneapolis, Minnesota
April 29, 201528, 2017
CONSOLIDATED BALANCE SHEETS
| | | (In thousands, except per share data) | | February 28,
2015 | | March 1,
2014 | | March 4, 2017 | | February 27, 2016 |
| Assets | | | | | | | | |
| Current assets | | | | | | | | |
| Cash and cash equivalents | | $ | 52,185 |
| | $ | 28,465 |
| | $ | 19,463 |
| | $ | 60,470 |
|
| Short-term available for sale securities | | 327 |
| | 204 |
| | 548 |
| | 30,173 |
|
| Restricted cash | | | 7,834 |
| | — |
|
| Receivables, net of allowance for doubtful accounts | | 171,623 |
| | 154,914 |
| | 185,740 |
| | 172,832 |
|
| Inventories | | 61,408 |
| | 53,435 |
| | 73,409 |
| | 63,386 |
|
| Refundable income taxes | | 5,115 |
| | 973 |
| | 1,743 |
| | — |
|
| Deferred tax assets | | 1,359 |
| | 2,714 |
| | — |
| | 1,820 |
|
| Other current assets | | 6,958 |
| | 6,725 |
| | 8,724 |
| | 8,112 |
|
| Total current assets | | 298,975 |
| | 247,430 |
| | 297,461 |
| | 336,793 |
|
| Property, plant and equipment, net | | 193,540 |
| | 193,946 |
| | 246,748 |
| | 202,462 |
|
| Available for sale securities | | 10,655 |
| | 11,273 |
| | 9,041 |
| | 12,519 |
|
| Restricted investments | | — |
| | 2,540 |
| |
| Deferred tax assets | | | 4,025 |
| | — |
|
| Goodwill | | 75,857 |
| | 78,021 |
| | 101,334 |
| | 73,996 |
|
| Intangible assets | | 23,280 |
| | 27,198 |
| | 106,686 |
| | 19,862 |
|
| Other non-current assets | | 9,750 |
| | 9,587 |
| | 19,363 |
| | 11,808 |
|
| Total assets | | $ | 612,057 |
| | $ | 569,995 |
| | $ | 784,658 |
| | $ | 657,440 |
|
| Liabilities and Shareholders’ Equity | | | | | | | | |
| Current liabilities | | | | | | | | |
| Accounts payable | | $ | 56,516 |
| | $ | 47,241 |
| | $ | 63,182 |
| | $ | 64,762 |
|
| Accrued payroll and related benefits | | 36,620 |
| | 25,216 |
| | 51,244 |
| | 39,946 |
|
| Accrued self-insurance reserves | | 8,058 |
| | 6,683 |
| | 8,575 |
| | 7,818 |
|
| Other current liabilities | | 25,557 |
| | 35,088 |
| | 34,200 |
| | 29,339 |
|
| Billings in excess of costs and earnings on uncompleted contracts | | 22,233 |
| | 22,557 |
| | 28,857 |
| | 31,890 |
|
| Current portion long-term debt | | 44 |
| | 49 |
| |
| Accrued income taxes | | | — |
| | 3,626 |
|
| Total current liabilities | | 149,028 |
| | 136,834 |
| | 186,058 |
| | 177,381 |
|
| Long-term debt | | 20,587 |
| | 20,659 |
| | 65,400 |
| | 20,400 |
|
| Unrecognized tax benefits | | 4,477 |
| | 5,234 |
| | 3,980 |
| | 4,441 |
|
| Long-term self-insurance reserves | | 6,185 |
| | 7,977 |
| | 8,831 |
| | 7,137 |
|
| Deferred tax liabilities | | 10,652 |
| | 8,567 |
| | 4,025 |
| | 4,972 |
|
| Other non-current liabilities | | 38,652 |
| | 34,620 |
| | 45,787 |
| | 36,914 |
|
| Commitments and contingent liabilities (Note 17) | | | | | |
| Commitments and contingent liabilities (Note 11) | | |
| |
|
| Shareholders’ equity | | | | | | | | |
| Common stock of $0.33-1/3 par value; authorized 50,000,000 shares; issued and outstanding 29,049,531 and 28,958,119 respectively | | 9,683 |
| | 9,653 |
| |
| Common stock of $0.33-1/3 par value; authorized 50,000,000 shares; issued and outstanding 28,680,841 and 28,683,948 shares, respectively | | | 9,560 |
| | 9,561 |
|
| Additional paid-in capital | | 138,575 |
| | 130,570 |
| | 150,111 |
| | 145,528 |
|
| Retained earnings | | 256,538 |
| | 228,841 |
| | 341,996 |
| | 282,477 |
|
| Common stock held in trust | | (801 | ) | | (791 | ) | | (875 | ) | | (837 | ) |
| Deferred compensation obligations | | 801 |
| | 791 |
| | 875 |
| | 837 |
|
| Accumulated other comprehensive loss | | (22,320 | ) | | (12,960 | ) | | (31,090 | ) | | (31,371 | ) |
| Total shareholders’ equity | | 382,476 |
| | 356,104 |
| | 470,577 |
| | 406,195 |
|
| Total liabilities and shareholders’ equity | | $ | 612,057 |
| | $ | 569,995 |
| | $ | 784,658 |
| | $ | 657,440 |
|
See accompanying notes to consolidated financial statements.
3325
CONSOLIDATED RESULTS OF OPERATIONS
| | | | | Year-Ended | | Year-Ended |
| | | February 28,
2015 | | March 1,
2014 | | March 2,
2013 | | March 4, 2017 | | February 27, 2016 | | February 28, 2015 |
| (In thousands, except per share data) | | (52 weeks) | | (52 weeks) | | (52 weeks) | | (53 weeks) | | (52 weeks) | | (52 weeks) |
| Net sales | | $ | 933,936 |
| | $ | 771,445 |
| | $ | 700,224 |
| | $ | 1,114,533 |
| | $ | 981,189 |
| | $ | 933,936 |
|
| Cost of sales | | 725,392 |
| | 606,193 |
| | 554,491 |
| | 822,510 |
| | 737,619 |
| | 725,392 |
|
| Gross profit | | 208,544 |
| | 165,252 |
| | 145,733 |
| | 292,023 |
| | 243,570 |
| | 208,544 |
|
| Selling, general and administrative expenses | | 144,959 |
| | 124,967 |
| | 118,314 |
| | 169,798 |
| | 146,177 |
| | 144,959 |
|
| Operating income | | 63,585 |
| | 40,285 |
| | 27,419 |
| | 122,225 |
| | 97,393 |
| | 63,585 |
|
| Interest income | | 954 |
| | 827 |
| | 758 |
| | 1,008 |
| | 981 |
| | 954 |
|
| Interest expense | | 924 |
| | 1,259 |
| | 1,494 |
| | 971 |
| | 593 |
| | 924 |
|
| Other income (expense), net | | 1,384 |
| | (87 | ) | | 224 |
| | 543 |
| | (457 | ) | | 1,384 |
|
| Earnings before income taxes | | 64,999 |
| | 39,766 |
| | 26,907 |
| | 122,805 |
| | 97,324 |
| | 64,999 |
|
| Income tax expense | | 14,483 |
| | 11,780 |
| | 7,796 |
| | 37,015 |
| | 31,982 |
| | 14,483 |
|
| Net earnings | | $ | 50,516 |
| | $ | 27,986 |
| | $ | 19,111 |
| | $ | 85,790 |
| | $ | 65,342 |
| | $ | 50,516 |
|
| Earnings per share – basic | | $ | 1.76 |
| | $ | 0.98 |
| | $ | 0.68 |
| |
| Earnings per share – diluted | | $ | 1.72 |
| | $ | 0.95 |
| | $ | 0.67 |
| |
| Earnings per share - basic | | | $ | 2.98 |
| | $ | 2.25 |
| | $ | 1.76 |
|
| Earnings per share - diluted | | | $ | 2.97 |
| | $ | 2.22 |
| | $ | 1.72 |
|
| Weighted average basic shares outstanding | | 28,763 |
| | 28,483 |
| | 27,954 |
| | 28,781 |
| | 29,058 |
| | 28,763 |
|
| Weighted average diluted shares outstanding | | 29,374 |
| | 29,374 |
| | 28,641 |
| | 28,893 |
| | 29,375 |
| | 29,374 |
|
See accompanying notes to consolidated financial statements.
3426
CONSOLIDATED STATEMENTS OF COMPREHENSIVE EARNINGS
|
| | | | | | | | | | | | |
| | | Year-Ended |
| | | February 28,
2015 | | March 1,
2014 | | March 2,
2013 |
| (In thousands) | | (52 weeks) | | (52 weeks) | | (52 weeks) |
| Net earnings | | $ | 50,516 |
| | $ | 27,986 |
| | $ | 19,111 |
|
| Other comprehensive earnings: | | | | | | |
| Unrealized gain (loss) on marketable securities, net of $88, $(46) and $(15) tax expense (benefit), respectively | | 163 |
| | (83 | ) | | (28 | ) |
| Unrealized (loss) gain on foreign currency hedge, net of $(36), $183 and $(147) tax (benefit) expense, respectively | | (62 | ) | | 320 |
| | (258 | ) |
| Unrealized (loss) gain on pension obligation, net of $(830), $10 and $(95) tax (benefit) expense, respectively | | (1,458 | ) | | 19 |
| | (168 | ) |
| Foreign currency translation adjustments | | (8,003 | ) | | (6,135 | ) | | (1,867 | ) |
| Other comprehensive loss | | (9,360 | ) | | (5,879 | ) | | (2,321 | ) |
| Total comprehensive earnings | | $ | 41,156 |
| | $ | 22,107 |
| | $ | 16,790 |
|
|
| | | | | | | | | | | | |
| | | Year-Ended |
| (In thousands) | | March 4,
2017 | | February 27,
2016 | | February 28,
2015 |
| Net earnings | | $ | 85,790 |
| | $ | 65,342 |
| | $ | 50,516 |
|
| Other comprehensive earnings (loss): | | | | | | |
| Unrealized (loss) gain on marketable securities, net of $(45), $38 and $88 of tax (benefit) expense, respectively | | (83 | ) | | 73 |
| | 163 |
|
| Unrealized loss on foreign currency hedge, net of $-, $- and $(36) of tax benefit, respectively | | — |
| | — |
| | (62 | ) |
| Unrealized gain (loss) on pension obligation, net of $74, $347 and $(830) of tax expense (benefit), respectively | | 130 |
| | 610 |
| | (1,458 | ) |
| Foreign currency translation adjustments | | 234 |
| | (9,734 | ) | | (8,003 | ) |
| Other comprehensive earnings (loss) | | 281 |
| | (9,051 | ) | | (9,360 | ) |
| Total comprehensive earnings | | $ | 86,071 |
| | $ | 56,291 |
| | $ | 41,156 |
|
See accompanying notes to consolidated financial statements.
3527
CONSOLIDATED STATEMENTS OF CASH FLOWS | | | | | Year Ended | | Year-Ended |
| | | February 28,
2015 | | March 1,
2014 | | March 2,
2013 | | March 4,
2017 | | February 27,
2016 | | February 28,
2015 |
| (In thousands) | | (52 Weeks) | | (52 Weeks) | | (52 Weeks) | | (53 weeks) | | (52 weeks) | | (52 weeks) |
| Operating Activities | | | | | | | | | | | | |
| Net earnings | | $ | 50,516 |
| | $ | 27,986 |
| | $ | 19,111 |
| | $ | 85,790 |
| | $ | 65,342 |
| | $ | 50,516 |
|
| Adjustments to reconcile net earnings to net cash provided by operating activities: | Adjustments to reconcile net earnings to net cash provided by operating activities: | | | | | | | | |
| Depreciation and amortization | | 29,423 |
| | 26,550 |
| | 26,529 |
| | 35,607 |
| | 31,248 |
| | 29,423 |
|
| Stock-based compensation | | 4,793 |
| | 4,661 |
| | 4,395 |
| |
| Share-based compensation | | | 5,986 |
| | 4,923 |
| | 4,793 |
|
| Deferred income taxes | | 4,274 |
| | (5,280 | ) | | 3,557 |
| | (1,065 | ) | | (6,139 | ) | | 4,274 |
|
| Excess tax benefits from stock-based compensation | | (3,236 | ) | | (2,725 | ) | | (483 | ) | |
| Gain on disposal of assets | | (933 | ) | | (1,629 | ) | | (1,954 | ) | | (371 | ) | | (198 | ) | | (933 | ) |
| Proceeds from new markets tax credit transaction, net of deferred costs | | — |
| | 7,471 |
| | — |
| | 5,109 |
| | — |
| | — |
|
| Other, net | | 229 |
| | 51 |
| | 1,156 |
| | (2,331 | ) | | 1,017 |
| | 229 |
|
| Changes in operating assets and liabilities: | | | | | | | | | | | | |
| Receivables | | (18,588 | ) | | (19,229 | ) | | (13,364 | ) | | 3,460 |
| | (2,918 | ) | | (18,588 | ) |
| Inventories | | (8,660 | ) | | (6,130 | ) | | (2,209 | ) | | (6,387 | ) | | (2,798 | ) | | (8,660 | ) |
| Accounts payable and accrued expenses | | 12,871 |
| | 18,282 |
| | 11,158 |
| | 17,449 |
| | 17,265 |
| | 12,871 |
|
| Billings in excess of costs and earnings on uncompleted contracts | | (324 | ) | | 1,202 |
| | (1,195 | ) | | (9,991 | ) | | 9,657 |
| | (324 | ) |
| Refundable and accrued income taxes | | (1,091 | ) | | 3,449 |
| | (4,086 | ) | | (9,647 | ) | | 12,589 |
| | (1,091 | ) |
| Other, net | | (711 | ) | | (1,738 | ) | | (2,092 | ) | | 392 |
| | (1,045 | ) | | (711 | ) |
| Net cash provided by operating activities | | 68,563 |
| | 52,921 |
| | 40,523 |
| | 124,001 |
| | 128,943 |
| | 71,799 |
|
| Investing Activities | | | | | | | | | | | | |
| Capital expenditures | | (27,220 | ) | | (41,852 | ) | | (34,664 | ) | | (68,061 | ) | | (42,037 | ) | | (27,220 | ) |
| Proceeds from sales of property, plant and equipment | | 273 |
| | 806 |
| | 1,078 |
| |
| Acquisition of businesses and intangibles, net of cash acquired | | — |
| | (53,301 | ) | | (15 | ) | |
| Purchases of restricted investments | | — |
| | (36,200 | ) | | (10,000 | ) | |
| Sales/maturities of restricted investments | | 2,532 |
| | 60,115 |
| | 5,472 |
| |
| Purchases of marketable securities | | (6,142 | ) | | (14,562 | ) | | (58,847 | ) | | (3,705 | ) | | (35,814 | ) | | (6,142 | ) |
| Sales/maturities of marketable securities | | 6,946 |
| | 41,020 |
| | 41,295 |
| | 36,433 |
| | 4,047 |
| | 6,946 |
|
| Investments in corporate-owned life insurance policies | | (864 | ) | | — |
| | (1,451 | ) | |
| Acquisition of business and intangibles | | | (137,932 | ) | | — |
| | — |
|
| Change in restricted cash | | | (7,834 | ) | | — |
| | — |
|
| Other, net | | | (2,659 | ) | | (4,052 | ) | | 1,941 |
|
| Net cash used in investing activities | | (24,475 | ) | | (43,974 | ) | | (57,132 | ) | | (183,758 | ) | | (77,856 | ) | | (24,475 | ) |
| Financing Activities | | | | | | | | | | | | |
| Net proceeds from revolving credit agreement | | 126 |
| | — |
| | — |
| |
| Proceeds from issuance of debt | | — |
| | — |
| | 10,000 |
| |
| Payments on debt | | (50 | ) | | (10,082 | ) | | (164 | ) | |
| Payments on debt issue costs | | (215 | ) | | (165 | ) | | (633 | ) | |
| Borrowings on line of credit | | | 121,000 |
| | — |
| | — |
|
| Payments on line of credit | | | (76,012 | ) | | — |
| | — |
|
| Payments on debt, net | | | (396 | ) | | (56 | ) | | (139 | ) |
| Shares withheld for taxes, net of stock issued to employees | | (3,905 | ) | | 710 |
| | 862 |
| | (446 | ) | | (3,254 | ) | | (3,905 | ) |
| Excess tax benefits from stock-based compensation | | 3,236 |
| | 2,725 |
| | 483 |
| |
| Repurchase and retirement of common stock | | (6,894 | ) | | — |
| | — |
| | (10,817 | ) | | (24,911 | ) | | (6,894 | ) |
| Dividends paid | | (12,071 | ) | | (10,764 | ) | | (10,316 | ) | | (14,667 | ) | | (13,184 | ) | | (12,071 | ) |
| Net cash (used in) provided by financing activities | | (19,773 | ) | | (17,576 | ) | | 232 |
| |
| Increase (decrease) in cash and cash equivalents | | 24,315 |
| | (8,629 | ) | | (16,377 | ) | |
| Net cash provided by (used in) financing activities | | | 18,662 |
| | (41,405 | ) | | (23,009 | ) |
| (Decrease) increase in cash and cash equivalents | | | (41,095 | ) | | 9,682 |
| | 24,315 |
|
| Effect of exchange rates on cash | | (595 | ) | | (673 | ) | | 117 |
| | 88 |
| | (1,397 | ) | | (595 | ) |
| Cash and cash equivalents at beginning of year | | 28,465 |
| | 37,767 |
| | 54,027 |
| | 60,470 |
| | 52,185 |
| | 28,465 |
|
| Cash and cash equivalents at end of period | | $ | 52,185 |
| | $ | 28,465 |
| | $ | 37,767 |
| | $ | 19,463 |
| | $ | 60,470 |
| | $ | 52,185 |
|
| Noncash Activity | | | | | | | | | | | | |
| Capital expenditures in accounts payable | | $ | 2,656 |
| | $ | 761 |
| | $ | 553 |
| | $ | 3,254 |
| | $ | 2,737 |
| | $ | 2,656 |
|
See accompanying notes to consolidated financial statements.
3628
Consolidated Statements of Shareholders' Equity | | | (In thousands, except per share data) | | Common Shares Outstanding | | Common Stock | | Additional Paid-In Capital | | Retained Earnings | | Common Stock Held in Trust | | Deferred Compensation Obligation | | Accumulated Other Comprehensive (Loss) Income | | Common Shares Outstanding | | Common Stock | | Additional Paid-In Capital | | Retained Earnings | | Common Stock Held in Trust | | Deferred Compensation Obligation | | Accumulated Other Comprehensive (Loss) Income |
| Balance at March 3, 2012 | | 28,062 |
| | $ | 9,354 |
| | $ | 113,046 |
| | $ | 207,032 |
| | $ | (745 | ) | | $ | 745 |
| | $ | (4,760 | ) | |
| Net earnings | | — |
| | — |
| | — |
| | 19,111 |
| | — |
| | — |
| | — |
| |
| Unrealized loss on marketable securities, net of $15 tax benefit | | — |
| | — |
| | — |
| | — |
| | — |
| | — |
| | (28 | ) | |
| Unrealized loss on foreign currency hedge, net of $147 tax benefit | | — |
| | — |
| | — |
| | — |
| | — |
| | — |
| | (258 | ) | |
| Unrealized loss on pension obligation, net of $95 tax benefit | | — |
| | — |
| | — |
| | — |
| | — |
| | — |
| | (168 | ) | |
| Foreign currency translation adjustments | | — |
| | — |
| | — |
| | — |
| | — |
| | — |
| | (1,867 | ) | |
| Issuance of stock, net of cancellations | | 316 |
| | 105 |
| | (59 | ) | | 14 |
| | (16 | ) | | 16 |
| | — |
| |
| Stock-based compensation | | — |
| | — |
| | 4,395 |
| | — |
| | — |
| | — |
| | — |
| |
| Tax benefit associated with stock plans | | — |
| | — |
| | 388 |
| | — |
| | — |
| | — |
| | — |
| |
| Exercise of stock options | | 243 |
| | 81 |
| | 2,422 |
| | — |
| | — |
| | — |
| | — |
| |
| Other share retirements | | (107 | ) | | (35 | ) | | (433 | ) | | (1,232 | ) | | — |
| | — |
| | — |
| |
| Cash dividends ($0.360 per share) | | — |
| | — |
| | — |
| | (10,316 | ) | | — |
| | — |
| | — |
| |
| Balance at March 2, 2013 | | 28,514 |
| | $ | 9,505 |
| | $ | 119,759 |
| | $ | 214,609 |
| | $ | (761 | ) | | $ | 761 |
| | $ | (7,081 | ) | |
| Net earnings | | — |
| | — |
| | — |
| | 27,986 |
| | — |
| | — |
| | — |
| |
| Unrealized loss on marketable securities, net of $46 tax benefit | | — |
| | — |
| | — |
| | — |
| | — |
| | — |
| | (83 | ) | |
| Unrealized gain on foreign currency hedge, net of $183 tax expense | | — |
| | — |
| | — |
| | — |
| | — |
| | — |
| | 320 |
| |
| Unrealized gain on pension obligation, net of $10 tax expense | | — |
| | — |
| | — |
| | — |
| | — |
| | — |
| | 19 |
| |
| Foreign currency translation adjustments | | — |
| | — |
| | — |
| | — |
| | — |
| | — |
| | (6,135 | ) | |
| Issuance of stock, net of cancellations | | 245 |
| | 82 |
| | (54 | ) | | 17 |
| | (30 | ) | | 30 |
| | — |
| |
| Stock-based compensation | | — |
| | — |
| | 4,661 |
| | — |
| | — |
| | — |
| | — |
| |
| Tax benefit associated with stock plans | | — |
| | — |
| | 2,598 |
| | — |
| | — |
| | — |
| | — |
| |
| Exercise of stock options | | 328 |
| | 109 |
| | 4,150 |
| | — |
| | — |
| | — |
| | — |
| |
| Other share retirements | | (129 | ) | | (43 | ) | | (544 | ) | | (3,007 | ) | | — |
| | — |
| | — |
| |
| Cash dividends ($0.370 per share) | | — |
| | — |
| | — |
| | (10,764 | ) | | — |
| | — |
| | — |
| |
| Balance at March 1, 2014 | | 28,958 |
| | $ | 9,653 |
| | $ | 130,570 |
| | $ | 228,841 |
| | $ | (791 | ) | | $ | 791 |
| | $ | (12,960 | ) | | 28,958 |
| | $ | 9,653 |
| | $ | 130,570 |
| | $ | 228,841 |
| | $ | (791 | ) | | $ | 791 |
| | $ | (12,960 | ) |
| Net earnings | | — |
| | — |
| | — |
| | 50,516 |
| | — |
| | — |
| | — |
| | — |
| | — |
| | — |
| | 50,516 |
| | — |
| | — |
| | — |
|
| Unrealized gain on marketable securities, net of $88 tax expense | | — |
| | — |
| | — |
| | — |
| | — |
| | — |
| | 163 |
| | — |
| | — |
| | — |
| | — |
| | — |
| | — |
| | 163 |
|
| Unrealized loss on foreign currency hedge, net of $36 tax benefit | | — |
| | — |
| | — |
| | — |
| | — |
| | — |
| | (62 | ) | | — |
| | — |
| | — |
| | — |
| | — |
| | — |
| | (62 | ) |
| Unrealized loss on pension obligation, net of $830 tax benefit | | — |
| | — |
| | — |
| | — |
| | — |
| | — |
| | (1,458 | ) | | — |
| | — |
| | — |
| | — |
| | — |
| | — |
| | (1,458 | ) |
| Foreign currency translation adjustments | | — |
| | — |
| | — |
| | — |
| | — |
| | — |
| | (8,003 | ) | | — |
| | — |
| | — |
| | — |
| | — |
| | — |
| | (8,003 | ) |
| Issuance of stock, net of cancellations | | 304 |
| | 101 |
| | (47 | ) | | 28 |
| | (10 | ) | | 10 |
| | — |
| | 304 |
| | 101 |
| | (47 | ) | | 28 |
| | (10 | ) | | 10 |
| | — |
|
| Stock-based compensation | | — |
| | — |
| | 4,793 |
| | — |
| | — |
| | — |
| | — |
| |
| Share-based compensation | | | — |
| | — |
| | 4,793 |
| | — |
| | — |
| | — |
| | — |
|
| Tax benefit associated with stock plans | | — |
| | — |
| | 3,293 |
| | — |
| | — |
| | — |
| | — |
| | — |
| | — |
| | 3,293 |
| | — |
| | — |
| | — |
| | — |
|
| Exercise of stock options | | 146 |
| | 49 |
| | 1,190 |
| | — |
| | — |
| | — |
| | — |
| | 146 |
| | 49 |
| | 1,190 |
| | — |
| | — |
| | — |
| | — |
|
| Share repurchases | | (203 | ) | | (68 | ) | | (965 | ) | | (5,861 | ) | | — |
| | — |
| | — |
| | (203 | ) | | (68 | ) | | (965 | ) | | (5,861 | ) | | — |
| | — |
| | — |
|
| Other share retirements | | (155 | ) | | (52 | ) | | (259 | ) | | (4,915 | ) | | — |
| | — |
| | — |
| | (155 | ) | | (52 | ) | | (259 | ) | | (4,915 | ) | | — |
| | — |
| | — |
|
| Cash dividends ($0.410 per share) | | — |
| | — |
| | — |
| | (12,071 | ) | | — |
| | — |
| | — |
| |
| Cash dividends ($0.41 per share) | | | — |
| | — |
| | — |
| | (12,071 | ) | | — |
| | — |
| | — |
|
| Balance at February 28, 2015 | | 29,050 |
| | $ | 9,683 |
| | $ | 138,575 |
| | $ | 256,538 |
| | $ | (801 | ) | | $ | 801 |
| | $ | (22,320 | ) | | 29,050 |
| | $ | 9,683 |
| | $ | 138,575 |
| | $ | 256,538 |
| | $ | (801 | ) | | $ | 801 |
| | $ | (22,320 | ) |
| Net earnings | | | — |
| | — |
| | — |
| | 65,342 |
| | — |
| | — |
| | — |
|
| Unrealized gain on marketable securities, net of $38 tax expense | | | — |
| | — |
| | — |
| | — |
| | — |
| | — |
| | 73 |
|
| Unrealized gain on pension obligation, net of $347 tax expense | | | — |
| | — |
| | — |
| | — |
| | — |
| | — |
| | 610 |
|
| Foreign currency translation adjustments | | | — |
| | — |
| | — |
| | — |
| | — |
| | — |
| | (9,734 | ) |
| Issuance of stock, net of cancellations | | | 102 |
| | 34 |
| | 114 |
| | — |
| | (36 | ) | | 36 |
| | — |
|
| Share-based compensation | | | — |
| | — |
| | 4,923 |
| | — |
| | — |
| | — |
| | — |
|
| Tax benefit associated with stock plans | | | — |
| | — |
| | 3,856 |
| | — |
| | — |
| | — |
| | — |
|
| Exercise of stock options | | | 200 |
| | 67 |
| | 1,539 |
| | — |
| | — |
| | — |
| | — |
|
| Share repurchases | | | (575 | ) | | (192 | ) | | (2,996 | ) | | (21,723 | ) | | — |
| | — |
| | — |
|
| Other share retirements | | | (93 | ) | | (31 | ) | | (483 | ) | | (4,496 | ) | | — |
| | — |
| | — |
|
| Cash dividends ($0.455 per share) | | | — |
| | — |
| | — |
| | (13,184 | ) | | — |
| | — |
| | — |
|
| Balance at February 27, 2016 | | | 28,684 |
| | $ | 9,561 |
| | $ | 145,528 |
| | $ | 282,477 |
| | $ | (837 | ) | | $ | 837 |
| | $ | (31,371 | ) |
| Net earnings | | | — |
| | — |
| | — |
| | 85,790 |
| | — |
| | — |
| | — |
|
| Unrealized loss on marketable securities, net of $45 tax benefit | | | — |
| | — |
| | — |
| | — |
| | — |
| | — |
| | (83 | ) |
| Unrealized gain on pension obligation, net of $74 tax expense | | | — |
| | — |
| | — |
| | — |
| | — |
| | — |
| | 130 |
|
| Foreign currency translation adjustments | | | — |
| | — |
| | — |
| | — |
| | — |
| | — |
| | 234 |
|
| Issuance of stock, net of cancellations | | | 140 |
| | 47 |
| | 105 |
| | 36 |
| | (38 | ) | | 38 |
| | — |
|
| Share-based compensation | | | — |
| | — |
| | 5,986 |
| | — |
| | — |
| | — |
| | — |
|
| Tax deficit associated with stock plans | | | — |
| | — |
| | (1,745 | ) | | — |
| | — |
| | — |
| | — |
|
| Exercise of stock options | | | 163 |
| | 54 |
| | 1,893 |
| | — |
| | — |
| | — |
| | — |
|
| Share repurchases | | | (250 | ) | | (83 | ) | | (1,357 | ) | | (9,377 | ) | | — |
| | — |
| | — |
|
| Other share retirements | | | (57 | ) | | (19 | ) | | (299 | ) | | (2,263 | ) | | — |
| | — |
| | — |
|
| Cash dividends ($0.515 per share) | | | — |
| | — |
| | — |
| | (14,667 | ) | | — |
| | — |
| | — |
|
| Balance at March 4, 2017 | | | 28,680 |
| | $ | 9,560 |
| | $ | 150,111 |
| | $ | 341,996 |
| | $ | (875 | ) | | $ | 875 |
| | $ | (31,090 | ) |
See accompanying notes to consolidated financial statements.
NOTES TO CONSOLIDATED FINANCIAL STATEMENTS
| |
| 1. | Summary of Significant Accounting Policies and Related Data |
Basis of Consolidation. The accompanying consolidated financial statements include the accountsbalances of Apogee Enterprises, Inc., a Minnesota corporation, and all majority-owned subsidiaries (the Company). Transactions between Apogee and its subsidiaries have been eliminated in consolidation.
The results of Alumicor Limited (Alumicor), which(Apogee, the Company acquired on November 5, 2013, are included inor we) after elimination of intercompany balances and transactions. We consolidate variable interest entities where it has been determined that the Company's Architectural Framing Systems segment. Refer to Note 6 for further information regardingCompany is the acquisitionprimary beneficiary of Alumicor and its treatment in the consolidated financial statements.
GlassecViracon's fiscal year ends December 31 and its results are incorporated into the consolidated financial statements on a two-month lag. There were no significant intervening events that would have materially affected our consolidated financial statements had they been recorded during the year ended February 28, 2015.those entities' operations.
Fiscal Year. Apogee'sOur fiscal year ends on the Saturday closest to the last day of February.February, or as determined by the Board of Directors. Fiscal 20152017, consisted of 53 weeks, while 20142016 and 20132015 each consisted of 52 weeks. Our Brazilian subsidiary follows a calendar year-end and is consolidated on a two-month lag.
Financial Instruments. Accounting Estimates.Unless otherwise noted, the carrying amount The preparation of the Company'sconsolidated financial instruments approximates fair value.statements in conformity with U.S. generally accepted accounting principles requires management to make estimates and assumptions that affect the reported amounts in the consolidated financial statements and accompanying notes. Actual results could differ significantly from those estimates.
Cash and Cash Equivalents. InvestmentsHighly liquid investments with an original maturity of three months or less are included in cash equivalents and cash equivalents. Cash equivalents are stated at cost, which approximates fair value, and consist primarily of money market funds.value.
Investments.Marketable securities. The Company hasWe hold marketable securities consisting of high-quality municipal bonds. The securities are classified as “availableavailable for sale”sale, and are carried at fair value based on prices from recent trades of similar securities. The Company testswe test for other than temporaryother-than-temporary losses on a quarterly basis andor whenever events or changes in circumstances indicate that the carrying amount of an asseta security may not be recoverable. If a decline in the fair value of a security is deemed by managementWe consider all unrealized losses to be other-than-temporary,temporary in nature. We intend to hold our securities until the investment is written downfull principal amount can be recovered, and we have the ability to fair value, and the amount of the write-down is included in net earnings.
The Company also has investments in mutual funds as a long-term funding source for the deferred compensation plan. The mutual fund investments are recorded at estimated fair value,do so based on quoted market prices,other sources of liquidity. Gross realized gains and losses are included in other non-current assetsincome (expense), net in theour consolidated balance sheet.results of operations.
Inventories. Inventories, which consist primarily of purchased glass and aluminum, are valued at lower of cost or market using the first-in, first-out ("FIFO")(FIFO) method. Our manufacturing operations recognize costs of sales using standard costs with full overhead absorption, which generally approximates actual cost.
During the fourth quarter of fiscal 2015, the Company changed its method of accounting for those inventories which were accounted for under the last-in, first-out (“LIFO”) method (53 percent of total fiscal 2014 inventories) to the FIFO method. The Company believes that this change is preferable as it provides uniformity across the Company's operations with respect to the method of inventory accounting, better reflects the current value of inventories on the consolidated balance sheets, aligns the accounting with the physical flow of inventory, and better matches revenues with associated expenses.
The change was applied retrospectively to March 3, 2012. The resulting impact to our consolidated balance sheets as of March 1, 2014 is as follows:
|
| | | | | | | | | | | |
| | March 1, 2014 |
| (In thousands) | As Originally Reported | | LIFO to FIFO Adjustment | | Retrospectively Adjusted |
| Inventories, net | $ | 47,982 |
| | $ | 5,453 |
| | $ | 53,435 |
|
| Current deferred tax assets | 3,529 |
| | (815 | ) | | 2,714 |
|
| Non-current deferred tax liabilities | 7,403 |
| | 1,164 |
| | 8,567 |
|
| Retained earnings | 225,367 |
| | 3,474 |
| | 228,841 |
|
No retrospective adjustments were made to the consolidated results of operations or consolidated statements of cash flow as they were immaterial for all periods presented, resulting in an immaterial adjustment recorded to the consolidated results of operations and consolidated balance sheets during the fourth quarter of fiscal 2015 of approximately $0.1 million.
Property, Plant and Equipment. Property, plant and equipment are(PP&E) is recorded at cost. Significant improvements and renewals that extend the useful life of the asset are capitalized. Repairs and maintenance are charged to expense as incurred. When propertyan asset is retired or otherwise disposed of, the cost and related accumulated depreciation are removed from the accounts and any related gains or losses are included in income as a reduction of or increase in selling, general and administrative expenses. Long-lived assets to be held and used, such as PP&E, are reviewed for impairment whenever events or changes in circumstances indicate that the carrying amount may not be recoverable.
Depreciation is computed on a straight-line basis, based on the following estimated useful lives:
|
| |
| | Years |
| Buildings and improvements | 15 to 25 |
| Machinery and equipment | 3 to 15 |
| Office equipment and furniture | 3 to 10 |
Goodwill and Other Intangible Assets. Goodwill represents the excess of the cost over the net tangible and identified intangible assets of acquired businesses. The Company accounts forWe evaluate goodwill and intangible assets in accordance with applicable accounting standards.
The Company tests goodwill of each of its reporting units for impairment annually in connection with its fourth-quarter planning processat our year-end, or more frequently if impairment indicators exist. The Company has determined thatWe have eight business units, each of its business unitswhich represents a reporting unit in accordance with applicable accounting standards. Duringfor the fourth quartergoodwill impairment analysis. This year we elected first to perform a qualitative assessment to determine whether it is more likely than not that the fair value of fiscal 2015,a reporting unit is less than its carrying amount (commonly referred to as “step 0”). For certain of our reporting units, we also completed step 1 of the Company completed its annualgoodwill assessment process, which compares the fair value of each of our reporting units to carrying value, including goodwill. If the fair value exceeds the carrying value, goodwill impairment test usingis not indicated. In all periods presented, we have followed a consistent discounted cash flow methodologiesmethodology in our step one evaluation of goodwill for valuing its reporting units as no market comparables were identified. There haveimpairment. Based on our analysis, we concluded that it was not been any material changes inmore likely than not that the impairment loss assessment methodology made during the past three fiscal years. The estimates of fair value for theof any reporting units were found to be in excess of theirunit was less than carrying value, and, therefore, no impairment charge was recorded.amount.
Intangible assets with discretedefined useful lives are amortized over theirbased on estimated useful lives.lives ranging from 18 months to 20 years and are reviewed for impairment whenever events or changes in circumstances indicate that the carrying amount may not be recoverable. Intangible assets with an indefinite useful life are tested for impairment annually at our year-end, or more frequently if events or changes in circumstances indicate that it is more likely than not that the asset is impaired. The Company has reassessed theestimated useful lives of its identifiableall intangible assets are reviewed annually, and we have determined that the remaining lives were appropriate.
Long-Lived Assets. The carrying value of long-lived assets, such as property, plant and equipment, and definite-lived intangible assets is reviewed when impairment indicators exist as required under generally accepted accounting principles. We consider many factors, including short- and long-term projections of future performance associated with these assets. If this review indicates that the long-lived assets will not be recoverable, the carrying value of such assets will be reduced to estimated fair value.
Self-Insurance. The Company obtainsWe obtain commercial insurance for potential losses for general liability, employment practices, workers' compensation, automobile liability, employment practices, architect's and engineer's errors and omissions risk, product rework and other miscellaneous coverages. However, a reasonable amountA substantial portion of this risk is retained on a self-insured basis primarily through aour wholly-owned insurance subsidiary, Prism Assurance, Ltd. (Prism). Reserve requirementssubsidiary. We establish a reserve for estimated ultimate losses on reported claims and those incurred but not yet reported utilizing actuarial projections. Reserves are establishedclassified within accrued or long-term self-insurance reserves based on actuarial projectionsexpectations of ultimate losses. Losseswhen the estimated toloss will be paid within 12 months are classified as accrued self-insurance reserves, while losses expected to be payable in later periods are included in long-term self-insurance reserves. paid.
Additionally, we maintain a self-insurance reserve for our health insurance programs maintainedoffered to eligible employees, included within accrued self-insurance reserves. The reserve includes an estimate for the benefit of our eligible employees. We estimate a reserve basedlosses on historical levels ofreported claims as well as for amounts incurred but not yet reported, which isbased on historical trends.
Warranty. We are subject to claims associated with our products and services, principally as a result of disputes with our customers involving the performance or aesthetics of our architectural products and services. We reserve estimated exposures on known claims, as well as on a portion of anticipated claims for product warranty and rework costs, based on historical product liability claims as a ratio of sales. Our warranty reserves are included in accrued self-insurance reserves.other current and non-current liabilities, based on the estimated timing of dispute resolution.
Environmental Liability. In accordance with accounting standards, weWe recognize environmental clean-up liabilities on an undiscounted basis when loss is probable and can be reasonably estimated. The cost of the clean-up is estimated by engineering,
financial and legal specialists based on currentestimates by specialists and applicable law. Such estimates are based primarily uponon the estimated cost of investigation and remediation required, and the likelihood that, where applicable, other potentially responsible parties will not be able to fulfill their commitments at the sites where the Company may be jointly and severally liable. As part of the acquisition of Tubelite Inc. in fiscal 2008, the Company acquired property which contains historical environmental conditions that the Company intends to remediate. At February 28, 2015, the reserve was $1.8 million. The reserve for environmental liabilities is included in other current and non-current liabilities in the consolidated balance sheets.
Foreign Currency. For foreign operations,The financial statements of subsidiaries located outside of the U.S. are measured in their functional currency, which is the local currency. Assets and liabilities of these operationssubsidiaries are translated at the period-end exchange rates at the balance sheet date. Income and income statement accountsexpense items are translated using the average monthly exchange rates prevailing during the year.rates. Translation adjustments are reflectedincluded in accumulated other comprehensive loss in the consolidated balance sheets.
From time to time, the Company may enter into short duration foreign currency contracts to hedge foreign currency risks. There is no material foreign currency risk related to these contracts as they generally have an original maturity date of less than one year.
Revenue Recognition. Generally, our sales terms are “free on board” (FOB) shipping point or FOB destination for our product-type sales, andWe recognize revenue is recognized when title has transferred. However, the Company'stransferred, except within our Architectural Services segment and for one business enterswithin our Architectural Framing Systems segment, which enter into fixed-price contracts for full-service commercial building glass installation and renovation services, which are accounted for as construction-type contracts. These contracts areprojects typically performed over a 12-12- to 18-month timeframe, and we24-month timeframe. We record revenue for these contracts on a percentage-of-completion basis as we are able to reasonably estimate total contract revenue and total contract costs. The contracts entered into clearly specify the enforceable rights of the parties, the consideration and the terms of settlement, and both parties can be expected to satisfy all obligations under the contract. Approximately 25 percent, 26 percent and 27 percent of our consolidated net sales in fiscal 2015, 2014 and 2013, respectively, were recorded on a percentage-of-completion basis. Under the methodology, the Company comparesWe compare the total costs incurred to date to the total estimated costs for eachthe contract, and recordsrecord that proportion of the total contract revenue in the period. Contract costs include materials, labor and other direct costs related to contract performance. Given our ability to make reasonable estimates of our total contract revenues and total contract costs, weWe believe utilizing the cost-to-cost method for revenue recognition provides the greatest degree of precisionaccuracy in measuring progress toward completion ofrevenue throughout the installation contracts.contract period. Provisions are established for estimated losses, if any, on uncompleted contracts in the period in which such losses are determined. Amounts representing contract change orders, claims or other items are included in contract revenue only when they have been approved by customers. upon customer approval. Approximately 26 percent of our consolidated net sales in fiscal 2017, and 25 percent in each of fiscal 2016 and 2015, were recorded on a percentage-of-completion basis.
Revenue excludes sales taxes as the Company considers itself a pass-through conduit for collecting and remitting sales taxes.
Pricing and Sales Incentives. The Company records estimated reductions to revenue for customer programs and incentive offerings, including pricing arrangements, promotions and other volume-based incentives, at the later of the date revenue is recognized or the incentive is offered. Sales incentives given to customers are recorded as a reduction to net sales unless (1) the Company receives an identifiable benefit for goods or services in exchange for the consideration, and (2) the Company can reasonably estimate the fair value of the benefit received.
Shipping and Handling. All amounts billed to a customer in a sales transaction related to shipping and handling represent revenues earned and are reported as revenues. The costsrevenue. Costs incurred by the Company for shipping and handling are reported as cost of sales.
Research and Development. Research and development expensescosts are charged to operationsexpensed as incurred within selling, general and administrative expenses, and were $6.58.6 million, $7.88.0 million and $6.86.5 million for fiscal 20152017, 20142016 and 20132015, respectively. Of these amounts, $2.42.2 million, $2.12.4 million and $1.62.4 million, respectively, were focused primarily upon design of custom window and curtainwall systems in accordance with customer specifications and are included in cost of sales.
Advertising. Advertising expensescosts are charged to operationsexpensed as incurred and were $1.1 million in fiscal 20152017, $1.2 million in fiscal 20142016, and $1.4$1.1 million in fiscal 20132015. They, and they are included in selling, general and administrative expenses in the consolidated results of operations.expenses.
Income Taxes. The Company accounts for income taxes as prescribed by applicable accounting standards, which requires use of the asset and liability method. This method recognizes deferred tax assets and liabilities based upon the future tax consequences of temporary differences between financial statement carrying amounts of assets and liabilities and their respective tax reporting.bases. See Note 1314 for additional information regarding income taxes.
Accounting Estimates.Subsequent Events. The preparationWe have evaluated subsequent events for potential recognition and disclosure through the date of this filing and determined that there were no subsequent events that required recognition or disclosure in the consolidated financial statements in conformity with accounting principles generally accepted in the United States requires management to make estimates and assumptions that affect the reported amounts of assets and liabilities, and disclosure of contingent assets and liabilities, at the date of the consolidated financial statements and the reported amounts of net sales and expenses during the reporting period. Amounts subject to significant estimates and assumptions include, but are not limited to, assessment of recoverability of long-lived assets, including goodwill, insurance reserves, warranty reserves,statements.
net sales recognition for construction contracts, income tax provisions and liabilities; and the status of outstanding disputes and claims. Actual results could differ from those estimates.
New Accounting Standards. In July 2013,March 2016, the Financial Accounting Standards Board (FASB) issued Accounting Standards Update (ASU) No. 2013-11 (ASU 2013-11)2016-09, Improvements to Employee Share-Based Payment Accounting, Income Taxes (Topic 740): Presentationwhich simplifies several aspects of an Unrecognized Tax Benefit Whenthe accounting and reporting for employee share-based payment transactions. The new standard requires excess tax benefits and tax deficiencies to be recorded in the statements of income as a component of the provision for income taxes when stock awards vest or are settled. In addition, it eliminates the requirement to reclassify cash flows related to excess tax benefits from operating activities to financing activities on the consolidated statements of cash flows. We elected to early adopt the new guidance in the fourth quarter of fiscal 2017, with the following impacts to our consolidated financial statements:
Differences between the accounting expense and the tax deduction for share-based compensation (excess tax benefits or deficits) are now recognized in the income statement within income taxes upon vesting or settlement of the award and are treated as discrete tax items impacting our effective tax rate in the period of settlement. Previously, these differences were recognized within additional paid-in capital. Net Operating Loss Carryforward, a Similar Tax Loss, or a Tax Credit Carryforward Exists. ASU 2013-11 requires an entitytax benefits related to present an unrecognized tax benefit, or portionshare-based compensation awards of an unrecognized tax benefit,$0.9 million for the year were recognized in the fourth quarter as a reduction of income tax expense in the consolidated statements of operations. The impact of this change to prior interim reporting periods in fiscal 2017 was not material.
The excess tax benefits from share-based compensation are included within the income taxes line as part of operating activities in the statement of cash flows, and are no longer included as a financing activity. This change is applied retrospectively.
The standard allows for an accounting policy election to continue to account for forfeitures as an estimate or to account for forfeitures as they occur. We elect to recognize forfeitures of any share-based awards as they occur.
In November 2015, the FASB issued ASU 2015-17, Balance Sheet Classification of Deferred Taxes, which requires all deferred tax asset inassets and liabilities, along with any related valuation allowance, to be classified as noncurrent on the financial statements for a net operating loss carryforward, a similar tax loss or a tax credit carryforward exists with certain exceptions. The Company elected to prospectively adopt ASU 2013-11balance sheet. We early adopted this standard in the first quarter of the current fiscal 2015.year, and prior periods were not retrospectively adjusted. The Company's adoption of ASU 2013-11 resultedthis standard did not have a significant impact to our consolidated financial statements in a $0.5 million reclassification from unrecognized tax benefits to deferred tax liabilities in the consolidated balance sheets.any period presented.
In January 2017, the FASB issued ASU 2017-04, Simplifying the Test for Goodwill Impairment, which simplifies the accounting for goodwill impairment by requiring impairment charges to be based on the first step in the current two-step impairment test process. The new guidance eliminates the current requirement to calculate a goodwill impairment charge using step 2. The standard is applicable to impairment tests performed in periods beginning after December 15, 2019, with early adoption permitted. We are currently evaluating early adoption of this guidance for our future annual goodwill impairment review process.
In August 2016, the FASB issued ASU 2016-15, Statement of Cash Flows, and in November 2016, it issued 2016-18, Restricted Cash. Both standards provide guidance for presentation of certain topics within the statement of cash flows, including presenting restricted cash within cash and cash equivalents, and are intended to improve consistency in presentation. The new classification guidance is effective for fiscal years beginning after December 15, 2017, our fiscal year 2019, and is to be applied retrospectively for comparability across all periods. These standards may be adopted early, and we are considering the timing of adoption but we do not expect this guidance to have a significant impact on our consolidated financial statements.
In February 2016, the FASB issued ASU 2016-02, Leases, which provides for a comprehensive change to lease accounting. The new standard requires that a lessee recognize a lease obligation liability and a right to use asset for virtually all leases of property, plant and equipment, subsequently amortized over the lease term. The new standard is effective for fiscal years beginning after December 15, 2018, with a modified retrospective transition. We are currently evaluating whether we will early adopt this standard in our fiscal year 2019 to align with the adoption of the new revenue recognition standard discussed below. The adoption of this standard will result in reflecting assets and liabilities for the value of our leased property and equipment on our consolidated balance sheet but it is not expected to have a significant impact on our consolidated results of operations.
In May 2014, the FASB issued a standard on revenueASU 2014-09, Revenue from contractsContracts with customers. The standardCustomers, which outlines a single comprehensive model for entities to use in accounting for revenue arising from contracts with customers and supersedes most current revenue recognition guidance, including industry-specific guidance. The core principle ofUnder the revenue model is thatnew standard, an entity recognizes revenue to depict the transfer of promised goods or services to customers in an amount that reflects the consideration to which the entity expects to be entitled in exchange for those goods or services. This
guidance is effective for annual reporting periods beginning after December 15, 2016, Apogee's2017, our fiscal 2018. The Company is currently2019. We are in the process of fully evaluating the impact that this new standard will have on its consolidatedour financial statements. However, at this time we have determined the following:
The standard allows a full retrospective or modified retrospective transition method. We plan to adopt the new guidance following the full retrospective method.
We expect to have business units that will continue to recognize revenue at the point in time when goods are shipped, as that represents when control is transferred, and business units that will continue to recognize revenue over time, following a cost-to-cost percentage of completion method of revenue recognition. Additionally, we expect that one of our business units in the Architectural Framing Systems segment will change from recognizing revenue at a point in time to recognizing revenue over time to better reflect transfer of control to the customer in line with the new guidance. This business unit will follow a similar cost-to-cost percentage of completion method of revenue recognition, consistent with our other business units using percentage of completion.
In the coming months, we will undertake a process to quantify the impact of the new accounting guidance on each of the relevant fiscal years and will provide further analysis and discussion as we progress in the evaluation process.
No other new accounting pronouncements issued or effective during fiscal 2015 have had or are expected to have a material impact on the consolidated financial statements.2. Acquisition
Subsequent Events. In connection with preparingOn December 14, 2016, we acquired substantially all the audited consolidated financial statementsassets of Sotawall, Inc. (now operating under the name Sotawall Limited or "Sotawall") a privately-held company based in the Toronto, Canada area, for approximately $138 million, funded by existing cash and short-term investments of approximately $73 million and by approximately $65 million from our committed revolving line of credit. Sotawall specializes in the year ended February 28, 2015, wedesign, engineering, fabrication, assembly and installation of unitized curtainwall systems for industrial, commercial and institutional buildings, primarily serving the Canadian and northeastern U.S. geographic regions. Sotawall's results of operations have evaluated subsequent events for potential recognition and disclosure through the date of this filing and determined that there were no subsequent events that required recognition or disclosurebeen included in the consolidated financial statements.
The assets and liabilities of Sotawall were recorded in the consolidated balance sheet and within the Architectural Framing Systems segment as of the acquisition date, at their respective fair values. Fair value is estimated based on one or a combination of income, cost and/or market approaches, as determined based on the nature of the asset or liability, and the level of inputs available. With respect to assets and liabilities, the determination of fair value requires management to make subjective judgments as to projections of future operating performance, the appropriate discount rate to apply, long-term growth rates, etc. (i.e. - unobservable inputs classified as Level 3 inputs under the fair value hierarchy described in Note 5) which affect the amounts recorded in the purchase price allocation. The excess of the consideration transferred over the fair value of the identifiable assets, net of liabilities, is recorded as goodwill, which is indicative of the expected continued growth and development of Sotawall. The purchase price allocation is based on these estimated fair value of assets acquired and liabilities assumed, as follows:
|
| | | | |
| (In thousands) | | December 14, 2016 |
| Net working capital | | $ | 10,682 |
|
| Property, plant and equipment | | 7,993 |
|
| Goodwill | | 27,444 |
|
| Other intangible assets | | 91,813 |
|
| Net assets acquired | | $ | 137,932 |
|
Other intangible assets reflect the following:
|
| | | | | |
| (In thousands) | Estimated fair value | | Estimated useful life (in years) |
| Technology | $ | 6,319 |
| | 10.0 |
| Tradename | 12,333 |
| | Indefinite |
| Backlog | 12,638 |
| | 1.5 |
| Customer relationships | 60,523 |
| | 17.0 |
| Total other intangible assets | $ | 91,813 |
| | |
These fair values are based on preliminary estimates and are subject to change based on finalization of net working capital values, intangible asset valuation and other purchase price adjustments expected to be completed in the first quarter of fiscal 2018. Up to 75 percent of the goodwill is tax deductible. Refer to Note 7 for more information on goodwill and intangible assets.
The following unaudited pro forma information provides the results of operations for the fiscal years ended March 4, 2017 and February 27, 2016, as if the acquisition had been completed at the beginning of fiscal year 2016:
|
| | | | | | | | |
| | | Pro Forma |
| (In thousands, except per share data) | | 2017 | | 2016 |
| Net sales | | $ | 1,196,504 |
| | $ | 1,054,281 |
|
| Net earnings | | 100,124 |
| | 66,203 |
|
| Earnings per share | | | | |
| Basic | | $ | 3.48 |
| | $ | 2.28 |
|
| Diluted | | $ | 3.47 |
| | $ | 2.25 |
|
Unaudited pro forma information has been provided for comparative purposes only and the information does not necessarily reflect what the combined company's results of operations would have been had the acquisition occurred at the beginning of fiscal year 2016. It also may not be useful in predicting the future results of operations of the combined company. The pro forma information includes the impact of intangible asset amortization of approximately $12.7 million in 2016 and $8.2 million in 2017 (based on historical average exchange rates), which is expected to be recognized in Apogee's results for fiscal 2018 and fiscal 2019, respectively. The information also reflects the pro forma cost of required debt financing but does not reflect the effect of any synergies or integration costs that may result from the acquisition.
Receivables
| | | (In thousands) | 2015 | | 2014 | 2017 | | 2016 |
| Trade accounts | $ | 111,494 |
| | $ | 98,246 |
| $ | 122,149 |
| | $ | 102,627 |
|
| Construction contracts | 33,582 |
| | 39,257 |
| 31,923 |
| | 41,631 |
|
| Contract retainage | 24,547 |
| | 19,040 |
| 29,191 |
| | 28,249 |
|
| Other receivables | 5,242 |
| | 1,305 |
| 3,972 |
| | 2,822 |
|
| Total receivables | 174,865 |
| | 157,848 |
| 187,235 |
| | 175,329 |
|
| Less allowance for doubtful accounts | (3,242 | ) | | (2,934 | ) | (1,495 | ) | | (2,497 | ) |
| Net receivables | $ | 171,623 |
| | $ | 154,914 |
| $ | 185,740 |
| | $ | 172,832 |
|
Inventories
| | | (In thousands) | 2015 | | 2014(1) | 2017 | | 2016 |
| Raw materials | $ | 19,761 |
| | $ | 20,348 |
| $ | 22,761 |
| | $ | 21,404 |
|
| Work-in-process | 14,385 |
| | 11,552 |
| 16,154 |
| | 9,958 |
|
| Finished goods | 23,076 |
| | 16,434 |
| 29,372 |
| | 25,486 |
|
| Costs and earnings in excess of billings on uncompleted contracts | 4,186 |
| | 5,101 |
| 5,122 |
| | 6,538 |
|
| Total inventories | $ | 61,408 |
| | $ | 53,435 |
| $ | 73,409 |
| | $ | 63,386 |
|
| |
(1) | During the fourth quarter of fiscal 2015, the Company changed its method of accounting for those inventories which were accounted for under the LIFO method to the FIFO method. See Note 1 for discussion of this accounting change and its related impact. |
Other Current Liabilities
|
| | | | | | | |
| (In thousands) | 2015 | | 2014 |
| Current portion of long-term compensation plans | $ | 841 |
| | $ | 3,538 |
|
| Deferred gain on sale leaseback transactions - current portion | 1,015 |
| | 1,015 |
|
| Volume discounts | 1,145 |
| | 1,724 |
|
| Unearned revenue | 1,266 |
| | 7,924 |
|
| Taxes, other than income taxes | 5,203 |
| | 4,698 |
|
| Warranties | 10,022 |
| | 10,769 |
|
| Other | 6,065 |
| | 5,420 |
|
| Total other current liabilities | $ | 25,557 |
| | $ | 35,088 |
|
| |
3. | Property, Plant and Equipment |
|
| | | | | | | |
| (In thousands) | 2015 | | 2014 |
| Land | $ | 9,054 |
| | $ | 9,461 |
|
| Buildings and improvements | 142,833 |
| | 140,316 |
|
| Machinery and equipment | 279,172 |
| | 233,687 |
|
| Office equipment and furniture | 49,849 |
| | 47,304 |
|
| Construction in progress | 11,695 |
| | 38,886 |
|
| Total property, plant and equipment | 492,603 |
| | 469,654 |
|
| Less accumulated depreciation | (299,063 | ) | | (275,708 | ) |
| Net property, plant and equipment | $ | 193,540 |
| | $ | 193,946 |
|
|
| | | | | | | |
| (In thousands) | 2017 | | 2016 |
| Warranties | $ | 21,100 |
| | $ | 14,666 |
|
| Taxes, other than income taxes | 4,452 |
| | 5,058 |
|
| Other | 8,648 |
| | 9,615 |
|
| Total other current liabilities | $ | 34,200 |
| | $ | 29,339 |
|
Depreciation expense was $27.5 million, $24.8 million and $24.3 million in fiscal 2015, 2014 and 2013, respectively.
At February 28, 2015,We hold the Company has investmentsfollowing marketable securities, all classified as available for sale:
|
| | | | | | | | | | | | | | | |
| (In thousands) | Amortized Cost | | Gross Unrealized Gains | | Gross Unrealized Losses | | Estimated Fair Value |
| March 4, 2017 | | | | | | | |
| Municipal bonds | $ | 9,595 |
| | $ | 91 |
| | $ | (97 | ) | | $ | 9,589 |
|
| Total marketable securities | $ | 9,595 |
| | $ | 91 |
| | $ | (97 | ) | | $ | 9,589 |
|
| February 27, 2016 | | | | | | | |
| Mutual fund | $ | 30,178 |
| | $ | — |
| | $ | (55 | ) | | $ | 30,123 |
|
| Municipal bonds | 12,393 |
| | 285 |
| | (109 | ) | | 12,569 |
|
| Total marketable securities | $ | 42,571 |
|
| $ | 285 |
|
| $ | (164 | ) |
| $ | 42,692 |
|
In the prior year, we were invested in municipal bondsa mutual fund holding short-term government securities as a means of $11.0 million; $0.3 million is current and $10.7 million is non-current. The Company’s wholly owneddeploying excess cash from operations while preserving liquidity. We sold this security in fiscal 2017 to partially finance the Sotawall acquisition.
We have a wholly-owned insurance subsidiary, Prism Assurance, Ltd. (Prism), held all of thewhich holds our municipal bonds at the end of both fiscal 2015 and 2014.bonds. Prism insures a portion of the Company’s workers’ compensation,our general liability, workers' compensation and automobile liability risks using reinsurance agreements to meet statutory requirements. The reinsurance carrier requires Prism to maintain fixed-maturity investments, which are generally high-quality municipal bonds, for the purpose of providing collateral for Prism’sPrism's obligations under the reinsurance agreement. All of the Company’s fixed maturity investments are classified as “available-for-sale,” are carried at fair value and are reported as short-term marketable securities available for sale or marketable securities available for sale in the consolidated balance sheets.
The amortized cost, gross unrealized gains and losses, and estimated fair values of investments available for sale at February 28, 2015 and March 1, 2014, are as follows:
|
| | | | | | | | | | | | | | | |
| (In thousands) | Amortized Cost | | Gross Unrealized Gains | | Gross Unrealized Losses | | Estimated Fair Value |
| February 28, 2015 | | | | | | | |
| Municipal bonds | $ | 10,973 |
| | $ | 127 |
| | $ | (118 | ) | | $ | 10,982 |
|
| Total investments | $ | 10,973 |
| | $ | 127 |
| | $ | (118 | ) | | $ | 10,982 |
|
| March 1, 2014 | | | | | | | |
| Municipal bonds | $ | 11,719 |
| | $ | 94 |
| | $ | (336 | ) | | $ | 11,477 |
|
| Total investments | $ | 11,719 |
| | $ | 94 |
| | $ | (336 | ) | | $ | 11,477 |
|
The Company tests for other than temporary losses on a quarterly basis and considers the unrealized losses indicated above to be temporary in nature. The Company intends to hold the investments until it can recover the full principal amount and has the ability to do so based on other sources of liquidity. The Company expects such recoveries to occur prior to the contractual maturities.
The following table presents the length of time that available-for-saleour securities were in continuous unrealized loss positions, but were not deemed to be other than temporarily impaired, as of February 28, 2015March 4, 2017:
| | | | Less Than 12 Months | | Greater Than or Equal to 12 Months | | Total | Less Than 12 Months | | Greater Than or Equal to 12 Months | | Total |
| (In thousands) | Fair Value | | Unrealized Losses | | Fair Value | | Unrealized Losses | | Fair Value | | Unrealized Losses | Fair Value | | Unrealized Losses | | Fair Value | | Unrealized Losses | | Fair Value | | Unrealized Losses |
| Municipal bonds | $ | 2,229 |
| | $ | (7 | ) | | $ | 1,139 |
| | $ | (111 | ) | | $ | 3,368 |
| | $ | (118 | ) | $ | 1,413 |
| | $ | (14 | ) | | $ | 1,167 |
| | $ | (83 | ) | | $ | 2,580 |
| | $ | (97 | ) |
| Total investments | $ | 2,229 |
| | $ | (7 | ) | | $ | 1,139 |
| | $ | (111 | ) | | $ | 3,368 |
| | $ | (118 | ) | |
The amortized cost and estimated fair values of investmentsour municipal bonds at February 28, 2015March 4, 2017, by contractual maturity, are shown below. Expected maturities may differ from contractual maturities, as borrowers may have the right to call or prepay obligations with or without call or prepayment penalties.
|
| | | | | | | |
| (In thousands) | Amortized Cost | | Estimated Market Value |
| Due within one year | $ | 322 |
| | $ | 327 |
|
| Due after one year through five years | 2,835 |
| | 2,848 |
|
| Due after five years through 10 years | 6,566 |
| | 6,668 |
|
| Due after 10 years through 15 years | 1,250 |
| | 1,139 |
|
| Total | $ | 10,973 |
| | $ | 10,982 |
|
penalty. Gross realized gains were $0.1 million in fiscal 2015, were not material in fiscal 2014, and were $0.3 million in fiscal 2013. Gross realized losses were not material during fiscal 2015, 2014 or 2013. The gross realized gains and losses are included in other income (expense), net in the accompanying consolidated results of operations.were insignificant for all periods presented.
Table of Contents |
| | | | | | | |
| (In thousands) | Amortized Cost | | Estimated Market Value |
| Due within one year | $ | 548 |
| | $ | 548 |
|
| Due after one year through five years | 3,003 |
| | 3,028 |
|
| Due after five years through 10 years | 4,553 |
| | 4,605 |
|
| Due after 10 years through 15 years | 1,491 |
| | 1,408 |
|
| Total | $ | 9,595 |
| | $ | 9,589 |
|
| |
| 5. | Fair Value Measurements |
The Company accounts for financialFinancial assets and liabilities are classified in accordance with accounting standards that definethe fair value and establish a framework for measuring fair value. The hierarchy prioritizes the inputs into three broad levels. Level 1 inputs are quoted prices (unadjusted) in active markets for identical assets or liabilities. Level 2 inputs are quoted prices for similar assets and liabilities in active markets or inputs that are observable for the asset or liability, either directly or indirectly through market corroboration, for substantially the full term of the financial instrument. Level 3 inputs are unobservable inputs based on the Company’s assumptions used to measure assets and liabilities at fair value. A financial asset’s or liability’s classification within the hierarchy is determined based on the lowest level input that is significant to the fair value measurement. The Company doesmeasurement: Level 1 (unadjusted quoted prices in active markets for identical assets or liabilities); Level 2 (observable market inputs, other than quoted prices included in Level 1); and Level 3 (unobservable inputs that cannot be corroborated by observable market data). We do not have any Level 3 assets or liabilities.
Financial assets and liabilities measured at fair value as of February 28, 2015 and March 1, 2014, are summarized below:on a recurring basis were:
| | | (In thousands) | Quoted Prices in Active Markets (Level 1) | | Other Observable Inputs (Level 2) | | Total Fair Value | Quoted Prices in Active Markets (Level 1) | | Other Observable Inputs (Level 2) | | Total Fair Value |
| February 28, 2015 | | | | | | |
| March 4, 2017 | | | | | | |
| Cash equivalents | | | | | | | | | | |
| Money market funds | $ | 34,386 |
| | $ | — |
| | $ | 34,386 |
| $ | 4,423 |
| | $ | — |
| | $ | 4,423 |
|
| Commercial paper | | — |
| | 5,500 |
| | 5,500 |
|
| Total cash equivalents | 34,386 |
| | — |
| | 34,386 |
| 4,423 |
| | 5,500 |
| | 9,923 |
|
| Available for sale securities | | | | | | |
| Short-term securities | | | | | |
|
|
| Municipal bonds | — |
| | 10,982 |
| | 10,982 |
| — |
| | 548 |
| | 548 |
|
| Total available for sale securities | — |
| | 10,982 |
| | 10,982 |
| |
| Mutual fund investments | | | | | | |
| Mutual funds | 305 |
| | — |
| | 305 |
| |
| Total mutual fund investments | 305 |
| | — |
| | 305 |
| |
| Long-term securities | | | | | | |
| Municipal bonds | | — |
| | $ | 9,041 |
| | 9,041 |
|
| Total assets at fair value | $ | 34,691 |
| | $ | 10,982 |
| | $ | 45,673 |
| $ | 4,423 |
| | $ | 15,089 |
| | $ | 19,512 |
|
| February 27, 2016 | | | | | | |
| Cash equivalents | | | | | | |
| Money market funds | | $ | 23,199 |
| | $ | — |
| | $ | 23,199 |
|
| Commercial paper | | — |
| | 29,774 |
| | 29,774 |
|
| Total cash equivalents | | 23,199 |
|
| 29,774 |
|
| 52,973 |
|
| Short-term securities | | | | | | |
| Mutual fund | | 30,123 |
| | — |
| | 30,123 |
|
| Municipal bonds | | — |
| | 50 |
| | 50 |
|
| Total short-term securities | | 30,123 |
|
| 50 |
|
| 30,173 |
|
| Long-term securities | | | | | | |
| Municipal bonds | | — |
| | 12,519 |
| | 12,519 |
|
| Total assets at fair value | | $ | 53,322 |
|
| $ | 42,343 |
|
| $ | 95,665 |
|
|
| | | | | | | | | | | |
| (In thousands) | Quoted Prices in Active Markets (Level 1) | | Other Observable Inputs (Level 2) | | Total Fair Value |
| March 1, 2014 | | | | | |
| Cash equivalents | | | | | |
| Money market funds | $ | 12,788 |
| | $ | — |
| | $ | 12,788 |
|
| Total cash equivalents | 12,788 |
| | — |
| | 12,788 |
|
| Available for sale securities | | | | | |
| Municipal bonds | — |
| | 11,477 |
| | 11,477 |
|
| Total available for sale securities | — |
| | 11,477 |
| | 11,477 |
|
| Restricted investments | | | | | |
| Money market funds | 2,540 |
| | — |
| | 2,540 |
|
| Total restricted investments | 2,540 |
| | — |
| | 2,540 |
|
| Mutual fund investments | | | | | |
| Mutual funds | 409 |
| | — |
| | 409 |
|
| Total mutual fund investments | 409 |
| | — |
| | 409 |
|
| Foreign currency instruments | | | | | |
| Foreign currency instruments | — |
| | 98 |
| | 98 |
|
| Total foreign currency instruments | — |
| | 98 |
| | 98 |
|
| Total assets at fair value | $ | 15,737 |
| | $ | 11,575 |
| | $ | 27,312 |
|
Cash equivalents
Cash equivalents include highly liquid investments with an original maturity of three months or less, and consist primarilyFair value of money market funds. The cash equivalentsfunds was determined based on quoted prices for identical assets in active markets. Commercial paper was measured at fair value using inputs based on quoted prices for similar securities in active markets.
Short- and long-term securities
Municipal bonds were measured at fair value based on market prices from recent trades of similar securities and are heldclassified as short-term or long-term based on maturity date. Mutual funds were measured at fair value based on quoted market prices which approximates stated cost.for identical assets in active markets.
Available for sale securities
The Company has short-term available-for-sale securities of $0.3 million and long-term available-for-sale securities of $10.7 million as of February 28, 2015, consisting of municipal bonds. All of the Company’s fixed maturity investments are classified as “available-for-sale,” and are carried at fair market value based on prices from recent trades of similar securities.
Restricted investments
At March 1, 2014, the Company had long-term restricted investments consisting of money market funds, which were short-term in nature but were restricted for investment in the Company’s storefront and entrance business in Michigan, and were, therefore, classified as long term. The restricted investments were held at fair value based on quoted market prices, which approximated stated cost.
Mutual fund investments
The Company has $0.3 million of mutual fund investments as a long-term funding source for the deferred compensation plan. The mutual fund investments are recorded at estimated fair value, based on quoted market prices, and are included in other non-current assets in the consolidated balance sheet.
Foreign Currency Instruments
At March 1, 2014, the Company had a foreign exchange forward contract in place to hedge against the effect of exchange rate fluctuations on certain forecasted purchases. The forward contract was measured at fair value using readily observable market inputs, such as quotations on forward foreign exchange points and foreign interest rates.
| |
| 6. | AcquisitionsProperty, Plant and Equipment |
On November 5, 2013, the Company acquired all of the shares of Alumicor Limited, a privately held business, for $52.9 million, including cash acquired of $1.6 million. Alumicor is a window, storefront, entrance and curtainwall company primarily serving the Canadian commercial construction market. Alumicor's results of operations are included within the Architectural Framing Systems segment. |
| | | | | | | |
| (In thousands) | 2017 | | 2016 |
| Land | $ | 8,400 |
| | $ | 8,827 |
|
| Buildings and improvements | 162,184 |
| | 149,685 |
|
| Machinery and equipment | 316,406 |
| | 296,388 |
|
| Office equipment and furniture | 49,720 |
| | 48,805 |
|
| Construction in progress | 46,544 |
| | 18,384 |
|
| Total property, plant and equipment | 583,254 |
| | 522,089 |
|
| Less accumulated depreciation | (336,506 | ) | | (319,627 | ) |
| Net property, plant and equipment | $ | 246,748 |
| | $ | 202,462 |
|
The assetsDepreciation expense was $31.6 million, $29.8 million and liabilities of Alumicor were recorded$27.5 million in the consolidated balance sheet within the Architectural Framing Systems segment as of the acquisition date, at their respective fair values. The purchase price allocation was based on the estimated fair value of assets acquiredfiscal 2017, 2016 and liabilities assumed and were allocated as follows:
|
| | | |
| (In thousands) | November 5, 2013 |
| Current assets | $ | 17,168 |
|
| Property, plant and equipment | 9,773 |
|
| Intangible assets | 16,611 |
|
| Goodwill | 18,254 |
|
| Current liabilities | (10,505 | ) |
| Net assets acquired | $ | 51,301 |
|
Identifiable intangible assets include customer relationships, which are definite-lived assets, and trademarks, which are indefinite-lived assets. The customer relationships have an amortization period of 19 years, which matches the average useful life of the asset. Goodwill recorded as part of the purchase price allocation is not tax deductible.
The following unaudited pro forma consolidated condensed financial results of operations for the year ended March 1, 2014 and March 2, 2013 are presented as if the acquisition had been completed at the beginning of fiscal year 2013:
|
| | | | | | | |
| | Pro Forma |
| (In thousands, except per share data) | 2014 | | 2013 |
| Net sales | $ | 825,596 |
| | $ | 756,497 |
|
| Net income | 30,487 |
| | 21,064 |
|
| Earnings per share | | | |
| Basic | $ | 1.07 |
| | $ | 0.75 |
|
| Diluted | 1.04 |
| | 0.74 |
|
These unaudited pro forma consolidated condensed financial results have been prepared for comparative purposes only and include certain adjustments, such as elimination of interest expense on pre-acquisition debt of the acquiree. The adjustments do not reflect the effect of synergies and integration costs that would result from integration of this acquisition.
| |
| 7. | Goodwill and Other Identifiable Intangible Assets |
The changes in the carrying amount of goodwill attributable to each reporting segment for the year ended February 28, 2015 and March 1, 2014 is detailed below.was:
| | | (In thousands) | Architectural Glass | | Architectural Services | | Architectural Framing Systems | | Large-Scale Optical | | Total | Architectural Glass | | Architectural Services | | Architectural Framing Systems | | Large-Scale Optical | | Total |
| Balance at March 2, 2013 | $ | 27,002 |
| | $ | 1,120 |
| | $ | 22,663 |
| | $ | 10,557 |
| | $ | 61,342 |
| |
| Balance at February 28, 2015 | | $ | 26,355 |
| | $ | 1,120 |
| | $ | 37,825 |
| | $ | 10,557 |
| | $ | 75,857 |
|
| Foreign currency translation | | (716 | ) | | — |
| | (1,145 | ) | | — |
| | (1,861 | ) |
| Balance at February 27, 2016 | | 25,639 |
| | 1,120 |
| | 36,680 |
| | 10,557 |
| | 73,996 |
|
| Goodwill acquired | — |
| | — |
| | 18,254 |
| | — |
| | 18,254 |
| — |
| | — |
| | 27,444 |
| | — |
| | 27,444 |
|
| Foreign currency translation | (374 | ) | | — |
| | (1,201 | ) | | — |
| | (1,575 | ) | 317 |
| | — |
| | (423 | ) | | — |
| | (106 | ) |
| Balance at March 1, 2014 | 26,628 |
| | 1,120 |
| | 39,716 |
| | 10,557 |
| | 78,021 |
| |
| Foreign currency translation | (273 | ) | | — |
| | (1,891 | ) | | — |
| | (2,164 | ) | |
| Balance at February 28, 2015 | $ | 26,355 |
| | $ | 1,120 |
| | $ | 37,825 |
| | $ | 10,557 |
| | $ | 75,857 |
| |
| Balance at March 4, 2017 | | $ | 25,956 |
| | $ | 1,120 |
| | $ | 63,701 |
| | $ | 10,557 |
| | $ | 101,334 |
|
The CompanyNo goodwill impairment has had no historical impairments of goodwill.been recorded in any period presented.
The following table provides the gross carrying amount of other intangible assets and related accumulated amortization:amortization was:
|
| | | | | | | | | | | | | | | |
| | February 28, 2015 |
| (In thousands) | Gross Carrying Amount | | Accumulated Amortization | | Foreign Currency Translation | | Net |
| Definite-lived intangible assets: | | | | | | | |
| Debt issue costs | $ | 3,668 |
| | $ | (2,560 | ) | | $ | — |
| | $ | 1,108 |
|
| Non-compete agreements | 6,690 |
| | (6,364 | ) | | (10 | ) | | 316 |
|
| Customer relationships | 25,677 |
| | (11,932 | ) | | (1,315 | ) | | 12,430 |
|
| Trademarks and other intangibles | 8,275 |
| | (2,920 | ) | | (168 | ) | | 5,187 |
|
| Total definite-lived intangible assets | $ | 44,310 |
| | $ | (23,776 | ) | | $ | (1,493 | ) | | $ | 19,041 |
|
| Indefinite-lived intangible assets: | | | | | | | |
| Trademarks | $ | 4,768 |
| | $ | — |
| | $ | (529 | ) | | $ | 4,239 |
|
| Total intangible assets | $ | 49,078 |
| | $ | (23,776 | ) | | $ | (2,022 | ) | | $ | 23,280 |
|
| | | | March 1, 2014 | | | | | | | | | |
| (In thousands) | Gross Carrying Amount | | Accumulated Amortization | | Foreign Currency Translation | | Net | Gross Carrying Amount | | Accumulated Amortization | | Foreign Currency Translation | | Net |
| Definite-lived intangible assets: | | | | | | | | |
| March 4, 2017 | | | | | | | | |
| Definite-lived intangible assets | | | | | | | | |
| Debt issue costs | $ | 3,453 |
| | $ | (2,370 | ) | | $ | — |
| | $ | 1,083 |
| $ | 4,066 |
| | $ | (2,960 | ) | | $ | — |
| | $ | 1,106 |
|
| Non-compete agreements | 6,767 |
| | (6,266 | ) | | (35 | ) | | 466 |
| 6,286 |
| | (6,025 | ) | | (65 | ) | | 196 |
|
| Customer relationships | 26,862 |
| | (10,673 | ) | | (1,077 | ) | | 15,112 |
| 82,479 |
| | (14,013 | ) | | (145 | ) | | 68,321 |
|
| Trademarks and other intangibles | 8,566 |
| | (2,546 | ) | | (251 | ) | | 5,769 |
| 25,950 |
| | (4,917 | ) | | (31 | ) | | 21,002 |
|
| Total definite-lived intangible assets | $ | 45,648 |
| | $ | (21,855 | ) | | $ | (1,363 | ) | | $ | 22,430 |
| 118,781 |
| | (27,915 | ) | | (241 | ) | | 90,625 |
|
| Indefinite-lived intangible assets: | | | | | | | | |
| Indefinite-lived intangible assets | | | | | | | | |
| Trademarks | $ | 5,104 |
| | $ | — |
| | $ | (336 | ) | | $ | 4,768 |
| 16,022 |
| | — |
| | 39 |
| | 16,061 |
|
| Total intangible assets | $ | 50,752 |
| | $ | (21,855 | ) | | $ | (1,699 | ) | | $ | 27,198 |
| $ | 134,803 |
| | $ | (27,915 | ) | | $ | (202 | ) | | $ | 106,686 |
|
| February 27, 2016 | | | | | | | | |
| Definite-lived intangible assets | | | | | | | | |
| Debt issue costs | | $ | 3,677 |
| | $ | (2,758 | ) | | $ | — |
| | $ | 919 |
|
| Non-compete agreements | | 6,673 |
| | (6,419 | ) | | (16 | ) | | 238 |
|
| Customer relationships | | 24,174 |
| | (12,737 | ) | | (1,162 | ) | | 10,275 |
|
| Trademarks and other intangibles | | 8,213 |
| | (3,271 | ) | | (431 | ) | | 4,511 |
|
| Total definite-lived intangible assets | | 42,737 |
| | (25,185 | ) | | (1,609 | ) | | 15,943 |
|
| Indefinite-lived intangible assets | | | | | | | | |
| Trademarks | | 4,239 |
| | — |
| | (320 | ) | | 3,919 |
|
| Total intangible assets | | $ | 46,976 |
| | $ | (25,185 | ) | | $ | (1,929 | ) | | $ | 19,862 |
|
Amortization expense on the definite-lived intangible assets was$4.0 million, $1.6 million and $2.1 million in fiscal 2017, 2016 and 2015, $1.9 million in fiscal 2014 and $2.6 million in fiscal 2013.respectively. The amortization expense associated with the debt issue costs is included in interest expense while the remainder is in selling, general and administrative expenses in the consolidated results of operations. The estimatedEstimated future amortization expense for definite-lived intangible assets during the next five fiscal years is as follows:
| | | (In thousands) | 2016 | | 2017 | | 2018 | | 2019 | | 2020 | 2018 | | 2019 | | 2020 | | 2021 | | 2022 |
| Estimated amortization expense | $ | 1,757 |
| | $ | 1,594 |
| | $ | 1,563 |
| | $ | 1,513 |
| | $ | 1,430 |
| $ | 14,157 |
| | $ | 7,918 |
| | $ | 5,592 |
| | $ | 5,479 |
| | $ | 5,372 |
|
DuringIn December 2016, we amended and restated the fourth quarter of fiscal 2015, we entered into an amendment ofcredit agreement governing our credit facility to, among other changes, increase the Company's existing $100.0 million committed revolving credit facility. The amount of the facility was increased to $125.0 million, the expiration date was extended to December 2019; the letter ofrevolving credit facility was reduced to $40.0$175.0 million, from $50.0extend the maturity date to November 2021 and to modify the financial covenants under the credit agreement. We had $45.0 million the outstanding amountson our revolving credit facility as of which decrease the available commitment;March 4, 2017 and the
no borrowings outstanding as of February 27, 2016. As defined within our facility, we have two financial covenants that require us to stay below a maximum debt-to-EBITDA ratio was increased to 3.00. No other provisions of the original agreement were materially amended by the amended credit agreement. No borrowings were outstanding under the facility as of February 28, 2015 or March 1, 2014. Letters of credit issued under the facility decrease the amount of available commitment; $101.5 million was available under the facility at February 28, 2015and$76.5 million was available at March 1, 2014.
The credit facility requires the Company to maintain a debt-to-EBITDAminimum ratio of not more than 3.00. This ratio isinterest expense-to-EBITDA. Both ratios are computed quarterly, with EBITDA computedcalculated on a rolling four-quarter basis. The Company’s ratio was 0.22 at February 28, 2015. The credit facility also requires the Company to maintain a minimum level of net worth, as defined in the credit facility, based on certain quarterly financial calculations. The minimum required net worth computed in accordance with the credit facility at February 28, 2015 was $318.8 million, whereas the Company’s net worth as defined in the credit facility was $382.5 million. If the Company is not in compliance with either of these covenants, the lendersour credit facility may terminate the commitmentbe terminated and/or declare any loanamounts then outstanding tomay be declared immediately due and payable. At February 28, 2015, the Company wasMarch 4, 2017, we were in compliance with both financial covenants. We have the financial covenantsability to issue letters of credit of up to $70.0 million under this credit facility, the outstanding amounts of which decrease the available commitment. At March 4, 2017, $106.5 million was available under this credit facility.
Debt at March 4, 2017 also included $20.4 million of industrial revenue bonds that mature in fiscal years 2021 through 2043. The fair value of the credit facility.industrial revenue bonds approximated carrying value at March 4, 2017, due to the variable interest rates on these instruments. The bonds would be classified as Level 2 within the fair value hierarchy described in Note 5.
In the second quarter of fiscal 2015, the Company entered intoWe also maintain a Canadian Dollar $4.0 million Canadian dollar revolving demand facility. No borrowings were outstanding under the facility available to our Canadian operation.as of March 4, 2017 or February 27, 2016. Borrowings under the facility are made available at the sole discretion of the lender and are payable on demand. Borrowings under the facility beardemand, with interest at rates specified in the credit agreement for the facility. Outstanding balances under this demand facility are classified as long-term debt, since outstanding amounts can be refinanced through our committed revolving credit facility. No borrowings were outstanding as of February 28, 2015.
|
| | | | | | | |
| (In thousands) | 2015 | | 2014 |
| Borrowings under revolving credit agreement | $ | — |
| | $ | — |
|
| Other, interest at 0.2% and 0.3% for fiscal 2015 and 2014, respectively | 20,631 |
| | 20,708 |
|
| Total long-term debt | 20,631 |
| | 20,708 |
|
| Less current installments | (44 | ) | | (49 | ) |
| Net long-term debt | $ | 20,587 |
| | $ | 20,659 |
|
Included in the totals above are $20.4 million of industrial revenue bonds, and $0.2 million of other debt. The industrial revenue bonds mature in fiscal years 2021 through 2043, and the other debt matures in fiscal years 2016 through 2021. The fair value of the industrial revenue bonds approximates carrying value at February 28, 2015, due to the variable interest rates on these instruments. The bonds are classified as level 2 within the fair value hierarchy.
Debt maturities are asand other selected information follows:
|
| | | | | | | | | | | | | | | |
| (In thousands) | 2016 | | 2017 | | 2018 | | 2019 | | 2020 | | Thereafter | | Total |
| Maturities | $44 | | $44 | | $44 | | $44 | | $44 | | $20,411 | | $ | 20,631 |
|
Selected information related to long-term debt is as follows: |
| | | | | | | | | | | | | | | |
| (In thousands) | 2018 | | 2019 | | 2020 | | 2021 | | 2022 | | Thereafter | | Total |
| Maturities | $— | | $— | | $— | | $5,400 | | $47,000 | | $13,000 | | $ | 65,400 |
|
|
| | | | | | | |
| (In thousands, except percentages) | 2015 | | 2014 |
| Average daily borrowings during the year | $ | 21,260 |
| | $ | 21,800 |
|
| Maximum borrowings outstanding during the year | 22,600 |
| | 30,820 |
|
| Weighted average interest rate during the year | 0.30 | % | | 0.30 | % |
Interest expense was as follows for fiscal 2015, 2014 and 2013: |
| | | | | | | |
| (In thousands, except percentages) | 2017 | | 2016 |
| Average daily borrowings during the year | $ | 34,320 |
| | $ | 21,730 |
|
| Maximum borrowings outstanding during the year | 91,400 |
| | 22,480 |
|
| Weighted average interest rate during the year | 2.22 | % | | 0.29 | % |
| | | (In thousands) | 2015 | | 2014 | | 2013 | 2017 | | 2016 | | 2015 |
| Interest on debt | $ | 581 |
| | $ | 895 |
| | $ | 895 |
| $ | 971 |
| | $ | 544 |
| | $ | 581 |
|
| Other interest expense | 343 |
| | 364 |
| | 599 |
| — |
| | 49 |
| | 343 |
|
| Interest expense | $ | 924 |
| | $ | 1,259 |
| | $ | 1,494 |
| $ | 971 |
| | $ | 593 |
| | $ | 924 |
|
Interest payments were $0.8 million in fiscal 20152017, $0.7$0.5 million in fiscal 20142016 and $1.00.8 million in fiscal and 20132015.
| |
| 9. | Other Non-Current Liabilities |
Other non-current liabilities as of February 28, 2015 and March 1, 2014 included the following:
| | | (In thousands) | February 28, 2015 | | March 1, 2014 | 2017 | | 2016 |
| Deferred benefit from New Markets Tax Credit transactions | | $ | 16,708 |
| | $ | 10,741 |
|
| Retirement plan obligations | $ | 11,186 |
| | $ | 9,206 |
| 9,635 |
| | 9,992 |
|
| Deferred compensation | 4,052 |
| | 3,317 |
| |
| Deferred benefit from New Markets Tax Credit | 10,741 |
| | 10,741 |
| |
| Deferred gain on sale leaseback arrangements | 1,818 |
| | 2,621 |
| |
| Deferred compensation plan | | 7,463 |
| | 4,814 |
|
| Other | 10,855 |
| | 8,735 |
| 11,981 |
| | 11,367 |
|
| Total other non-current liabilities | $ | 38,652 |
| | $ | 34,620 |
| $ | 45,787 |
| | $ | 36,914 |
|
| |
| 10. | Employee Benefit Plans |
401(k) Retirement Plan
The Company sponsors a single 401(k) retirement plan covering substantially all full-time, non-union employees, as well as union employees at two of its manufacturing facilities. Under the plan, employees are allowed to contribute up to 60 percent of their eligible earnings to thisthe plan, up to statutory limits. The Company contributes a match of 100 percent of the first one percent contributed and 50 percent of the next five percent contributed on eligible compensation that non-union employees contribute and according to contract terms for union employees. The Company match was $6.2 million in fiscal 2017, $5.4 million in fiscal 2016 and $4.7 million in fiscal 2015, $4.2 million in fiscal 2014 and $3.6 million in fiscal 2013.
Deferred Compensation Plan
The Company maintains a deferred compensation plan that allows participants to defer compensation and save for retirement and other short-term needs.compensation. The deferred compensation liability was $4.27.7 million and $3.4$5.0 million at February 28, 2015March 4, 2017 and March 1, 2014, respectively, and is included in other current and non-current liabilities in the consolidated balance sheet.February 27, 2016, respectively. The Company has investments in corporate-owned life insurance policies (COLI) of $4.07.7 million and mutualmoney market funds (classified as cash equivalents) of $0.3 million with the
intention of utilizing them as a long-term funding sourcesources for the deferred compensationthis plan. The COLI assets are recorded at their net cash
surrender values and are included in other non-current assets in the consolidated balance sheet. The mutual fund investments are recorded at estimated fair value, based on quoted market prices, and are included in other non-current assets in the consolidated balance sheet.
Plans under Collective Bargaining Agreements
The Company contributesWe contribute to various multi-employer union retirement plans, which provide retirement benefits to the majority of itsour union employees; none of the plans are considered significant. The total contribution to these plans in fiscal 20152017, 20142016 and 20132015 was $3.9 million, $4.3 million, $3.73.6 million and $4.84.3 million, respectively.
Pension Plan
The Company sponsors the Tubelite Inc. Hourly Employees' Pension Plan (Tubelite plan). This plan isPlan), a defined-benefit pension plan that was frozen to new entrants in fiscal 2004, with no additional years of service credit for participating employees as of January 1, 2004.benefits accruing to plan participants after such time.
Officers' Supplemental Executive Retirement Plan (SERP)
The Company sponsors an unfunded SERP for the benefit of certain executives. The plan is consideredexecutives, a defined-benefit pension plan which is based principally on an employee's years of service and compensation levels near retirement. The SERP isthat was frozen to new entrants andin fiscal 2009, with no additional benefits accrue foraccruing to plan participants.participants after such time.
Obligations and Funded Status of Defined-Benefit PensionsPension Plans
The following tables present reconciliations of the benefit obligation of the defined-benefit pension plans and the funded status of the defined-benefit pension plans. Both theThe Tubelite plan anduses a measurement date as of the calendar month-end closest to our fiscal year-end, while the SERP useuses a measurement date aligned with our fiscal year-end measurement date.year-end.
| | | (In thousands) | 2015 | | 2014 | 2017 | | 2016 |
| Change in benefit obligation | | | | |
| Change in projected benefit obligation | | | | |
| Benefit obligation beginning of period | $ | 14,274 |
| | $ | 14,869 |
| $ | 14,900 |
| | $ | 16,253 |
|
| Interest cost | 550 |
| | 538 |
| 555 |
| | 566 |
|
| Actuarial loss (gain) | 2,424 |
| | (113 | ) | 54 |
| | (907 | ) |
| Benefits paid | (995 | ) | | (1,020 | ) | (1,017 | ) | | (1,012 | ) |
| Benefit obligation at measurement date | $ | 16,253 |
| | $ | 14,274 |
| 14,492 |
| | 14,900 |
|
| | | | | |
| Change in plan assets | | | | | | |
| Fair value of plan assets beginning of period | $ | 4,430 |
| | $ | 4,709 |
| $ | 4,261 |
| | $ | 4,419 |
|
| Actual return on plan assets | 134 |
| | (66 | ) | 73 |
| | (62 | ) |
| Company contributions | 850 |
| | 807 |
| 868 |
| | 916 |
|
| Benefits paid | (995 | ) | | (1,020 | ) | (1,017 | ) | | (1,012 | ) |
| Fair value of plan assets at measurement date | $ | 4,419 |
| | $ | 4,430 |
| 4,185 |
| | 4,261 |
|
| | | | | |
| Funded status - net amount recognized | $ | (11,834 | ) | | $ | (9,844 | ) | |
| Underfunded status | | $ | (10,307 | ) | | $ | (10,639 | ) |
AmountsThe underfunded status of our plans was recognized in the consolidated balance sheets consist of:sheets:
| | | (In thousands) | 2015 | | 2014 | 2017 | | 2016 |
| Current liabilities | $ | (648 | ) | | $ | (638 | ) | $ | (672 | ) | | $ | (647 | ) |
| Other non-current liabilities | (11,186 | ) | | (9,206 | ) | (9,635 | ) | | (9,992 | ) |
| Total | $ | (11,834 | ) | | $ | (9,844 | ) | $ | (10,307 | ) | | $ | (10,639 | ) |
AmountsThe following was included in accumulated other comprehensive loss that haveand has not yet been recognized as componentsa component of net periodic benefit cost consist of:cost:
| | | (In thousands) | 2015 | | 2014 | 2017 | | 2016 |
| Net actuarial loss | $ | 6,857 |
| | $ | 4,569 |
| $ | 5,696 |
| | $ | 5,899 |
|
| Accumulated other comprehensive loss | $ | 6,857 |
| | $ | 4,569 |
| $ | 5,696 |
| | $ | 5,899 |
|
The amount recognized in comprehensive earnings, for fiscal 2015 and 2014, net of tax expense, is as follows:was:
| | | (In thousands) | 2015 | | 2014 | 2017 | | 2016 |
| Net actuarial loss (gain) | $ | 1,458 |
| | $ | (19 | ) | |
| Net actuarial gain | | $ | (130 | ) | | $ | (610 | ) |
| Total | $ | 1,458 |
| | $ | (19 | ) | $ | (130 | ) | | $ | (610 | ) |
Components of the defined-benefit pension plans' net periodic benefit cost are as follows:cost:
| | | (In thousands) | | 2015 | | 2014 | | 2013 | | 2017 | | 2016 | | 2015 |
| Interest cost | | $ | 550 |
| | $ | 538 |
| | $ | 570 |
| | $ | 555 |
| | $ | 566 |
| | $ | 550 |
|
| Expected return on assets | | (171 | ) | | (183 | ) | | (177 | ) | | (41 | ) | | (137 | ) | | (171 | ) |
| Amortization of unrecognized net loss | | 172 |
| | 163 |
| | 211 |
| | 225 |
| | 249 |
| | 172 |
|
| Net periodic benefit cost | | $ | 551 |
| | $ | 518 |
| | $ | 604 |
| | $ | 739 |
| | $ | 678 |
| | $ | 551 |
|
Total net periodic pension benefit cost is expected to be approximately $0.7 million in fiscal 2018. The estimated net actuarial loss for the defined-benefit pension plans that will be amortized from accumulated other comprehensive loss into net periodic benefit cost for fiscal 20162018 is $0.2 million, net of tax benefit.
Additional Information
Assumptions
Weighted-average assumptions used at the measurement date to determine the defined-benefit plans' benefit obligation for the following fiscal years are as follows: |
| | | | | | | | |
| Benefit Obligation Weighted-Average Assumptions | 2017 | | 2016 | | 2015 |
| Discount rate | 3.80 | % | | 3.85 | % | | 3.60 | % |
|
| | | | | | | | |
| (Percentages) | 2015 | | 2014 | | 2013 |
| Discount rate | 3.60 | % | | 4.00 | % | | 3.75 | % |
Weighted-average assumptions used at the measurement date to determine the defined-benefit plans' net periodic benefit cost for the following fiscal years are as follows:
|
| | | | | | | | |
| (Percentages) | 2015 | | 2014 | | 2013 |
| Discount rate | 4.00 | % | | 3.75 | % | | 4.00 | % |
| Expected return on assets | 4.50 | % | | 4.50 | % | | 4.50 | % |
|
| | | | | | | | |
| Net Periodic Benefit Expense Weighted-Average Assumptions | 2017 | | 2016 | | 2015 |
| Discount rate | 3.85 | % | | 3.60 | % | | 4.00 | % |
| Expected long-term rate of return on assets | 2.00 | % | | 2.00 | % | | 4.50 | % |
Discount rate. The discount rate reflects the current rate at which the defined-benefit plans' pension liabilities could be effectively settled at the end of the year based on the measurement date. The discount rate was determined by matching the expected benefit payments to payments from the Principal Discount Yield Curve. This produced a discount rate of 3.60 percent. There are no known or anticipated changes in the discount rate assumption that will have a significant impact theon pension expense in fiscal year 20162018.
Expected return on assets. To develop the expected long-term rate of return on asset assumption, the Companyassets, we considered historical long-term rates of return for broad asset classes, actual past rates of return achieved by the plan investments, the general mix of assets held by the planplan's investment strategy, and the stated investment policy for the plan. This resulted in the selection of the 4.50 percent long-term rate of return on assets assumption.current and projected market conditions.
Net periodic benefit cost. Total net periodic pension benefit cost was $0.6 millionIn accordance with its policy, during fiscal 2016, the assets of the Tubelite plan were invested in fiscal 2015, $0.5 milliona short-term bond fund and carried at fair value based on prices from recent trades of similar securities, which would be classified as Level 2 in fiscal 2014 and $0.6 millionthe valuation hierarchy. Prior to this strategy change, the assets were invested in fiscal 2013. Total net periodic pension benefit cost is expected to be approximately $0.7 million in fiscal 2016. The net periodic pension benefit costa long-term bond fund.
We do not maintain assets intended for fiscal 2016 has been estimated assuming a discount ratethe future use of 3.60 percent.the SERP.
Contributions
Pension contributionsContributions to the plans for each of fiscal 20152017 and 20142016 totaled $0.9 million and $0.8 million, respectively. Because the SERP is unfunded, contributions to that plan represent benefit payments made. The pension contributions in fiscal 2015 and 2014which equaled or exceeded the minimum funding requirement. Fiscal 2016 pension contributions are expected to total $1.0 million.
Estimated Future Benefit Payments
The following benefit payments, which reflect expected future service, as appropriate, are expected to be paid by the plans as follows:plans:
|
| | | |
| (In thousands) | |
| Fiscal 2016 | $ | 1,028 |
|
| Fiscal 2017 | 1,027 |
|
| Fiscal 2018 | 1,016 |
|
| Fiscal 2019 | 1,043 |
|
| Fiscal 2020 | 1,030 |
|
| Fiscal 2021-2025 | 4,860 |
|
|
| | | | | | | | | | | | | | | | | | | | | | | |
| (In thousands) | 2018 | | 2019 | | 2020 | | 2021 | | 2022 | | 2023-2027 |
| Estimated future benefit payments | $ | 1,016 |
| | $ | 1,052 |
| | $ | 1,026 |
| | $ | 1,009 |
| | $ | 984 |
| | $ | 4,602 |
|
Plan Assets
The Company does not maintain assets intended for the future use of the SERP. In accordance with its policy, the assets of the Tubelite plan have been invested in a bond fund, the assets are carried at fair value based on prices from recent trades of similar securities, and are classified as Level 2 in the valuation hierarchy.
Employee Stock Purchase Plan
The Company also sponsors an employee stock purchase plan into which its employees may contribute up to $500 per week on an after-tax basis. The Company contributes a match of 15 percent of the employee contribution. Contributions and Company match funds are used to purchase shares of Company stock on the open market. The Company match to this plan was $0.1 million in each of fiscal 2015, 2014 and 2013.
A class of 200,000 shares of junior preferred stock with a par value of $1.00 is authorized, but unissued.
Share Repurchases
During fiscal 2004, the Board of Directors authorized a share repurchase program of 1,500,000 shares of common stock. The Board of Directors increased this authorization by 750,000 shares in January 2008 and by 1,000,000 in October 2008. The Company purchased 203,509 shares under the program during fiscal 2015, for a total cost of $6.9 million. There were no share repurchases during fiscal 2014 or 2013. The Company has purchased a total of 2,482,632 shares, at a total cost of $36.5 million, since the inception of this program and has remaining authority to repurchase 767,368 shares under this program, which has no expiration date.
In addition to the shares repurchased according to this repurchase plan, during fiscal 11.2015, 2014Commitments and 2013 the Company also purchased $5.2 million, $3.6 million and $1.5 million, respectively, of Company stock from employees in order to satisfy stock-for-stock option exercises or withholding tax obligations related to stock-based compensation, pursuant to terms of board and shareholder approved compensation plans.Contingent Liabilities
Accumulated Other Comprehensive Loss
The following table summarizes the accumulated other comprehensive loss, net of tax at February 28, 2015 and March 1, 2014.
|
| | | | | | | | |
| (In thousands) | | 2015 | | 2014 |
| Net unrealized gain (loss) on marketable securities | | $ | 6 |
| | $ | (157 | ) |
| Foreign currency hedge | | — |
| | 62 |
|
| Pension liability adjustments | | (4,368 | ) | | (2,910 | ) |
| Foreign currency translation adjustments | | (17,958 | ) | | (9,955 | ) |
| Total accumulated other comprehensive loss | | $ | (22,320 | ) | | $ | (12,960 | ) |
| |
12. | Share-Based Compensation |
The 2009 Stock Incentive Plan, the 2009 Non-Employee Director Stock Incentive Plan and the 2002 Omnibus Stock Incentive Plan (the Plans) provide for the issuance of 1,888,000, 250,000 and 3,400,000 shares, respectively, for various forms of stock-based compensation to employees and non-employee directors. Awards under these Plans, either in the form of incentive stock options, nonstatutory options or stock-settled stock appreciation rights (SARs), are granted with an exercise price equal to the fair market value of the Company’s stock at the date of award. Nonvested share awards and nonvested share unit awards are also included in these Plans. Outstanding SARs vested over a three-year period and outstanding options issued to non-employee directors vested at the end of six months. Outstanding options and SARs have a 10-year term. Nonvested share awards and nonvested share unit awards generally vest over a two, three or four-year period.
The 2002 Omnibus Stock Incentive Plan was terminated in June 2009; no new grants may be made under this plan, although exercises of SARs and options previously granted thereunder will still occur in accordance with the terms of the various grants.
Total stock-based compensation expense under all Plans included in the results of operations was $4.8 million for fiscal 2015, $4.7 million for fiscal 2014 and $4.4 million for 2013.
Stock Options and SARs
There were no options or SARs issued in fiscal 2015, 2014 or 2013.
The following table summarizes the award transactions under the Plans for the year ended February 28, 2015:
|
| | | | | | | | | | | | |
| | Options/SARs Outstanding |
| | Number of Shares | | Weighted Average Exercise Price | | Weighted Average Remaining Contractual Life | | Aggregate Intrinsic Value |
| Outstanding at March 1, 2014 | 847,852 |
| | $ | 13.88 |
| | | | |
| Awards exercised | (223,257 | ) | | 19.38 |
| | | | |
| Awards canceled | (500 | ) | | 11.86 |
| | | | |
| Outstanding and exercisable at February 28, 2015 | 624,095 |
| | $ | 11.92 |
| | 5.3 Years | | $ | 21,178,150 |
|
Cash proceeds from the exercise of stock options were $1.2 million, $4.2 million and $2.3 million for fiscal 2015, 2014 and 2013, respectively. The aggregate intrinsic value of securities (the amount by which the stock price on the date of exercise exceeded the stock price of the award on the date of grant) exercised was $4.6 million in fiscal 2015, $6.2 million in fiscal 2014 and $2.5 million in fiscal 2013. The tax benefit realized for tax deductions from option exercises totaled $3.3 million, $2.6 million and $0.4 million for fiscal 2015, 2014 and 2013, respectively.
Nonvested Shares and Share Units
The Company's executive compensation program provides key employees selected by the Compensation Committee of the Board of Directors with long-term incentives using nonvested shares and nonvested share units. During fiscal 2015, 2014 and 2013, nonvested shares were issued based on performance against objectives and generally vest over three years. From fiscal 2010 through fiscal 2012, nonvested share units were issued at the beginning of each fiscal year, which gave the recipient the right to receive shares earned at the vesting date. The number of nonvested share units issued at grant was equal to the target number of nonvested share units and allowed for the right to receive an additional number of, or fewer, shares based on meeting pre-determined Company three-year performance goals.
The following table summarizes the nonvested share award transactions, including nonvested share units, for fiscal 2015:
|
| | | | | | |
| | Nonvested Shares and Units |
| | Number of Shares and Units | | Weighted Average Grant Date Fair Value |
| Nonvested at March 1, 2014 | 575,064 |
| | $ | 16.89 |
|
Granted(1) | 186,468 |
| | 28.45 |
|
| Vested | (358,651 | ) | | 15.43 |
|
| Canceled | (2,173 | ) | | 32.72 |
|
| Nonvested at February 28, 2015 | 400,708 |
| | $ | 23.49 |
|
| |
(1) | Includes 40,735 of shares granted and immediately vested for achievement above target for the fiscal 2012-2014 performance period. Nonvested share units of 117,765 (at target) were previously granted in fiscal 2012 for this performance period. |
At February 28, 2015, there was $5.2 million of total unrecognized compensation cost related to nonvested share and nonvested share unit awards, which is expected to be recognized over a weighted average period of approximately 22 months. The total fair value of shares vested during fiscal 2015 was $11.6 million.
Earnings before income taxes consisted of the following:
|
| | | | | | | | | | | |
| (In thousands) | 2015 | | 2014 | | 2013 |
| U.S. | $ | 59,898 |
| | $ | 36,700 |
| | $ | 26,699 |
|
| International | 5,101 |
| | 3,066 |
| | 208 |
|
| Earnings before income taxes | $ | 64,999 |
| | $ | 39,766 |
| | $ | 26,907 |
|
The components of income tax expense (benefit) for each of the last three fiscal years are as follows:
|
| | | | | | | | | | | |
| (In thousands) | 2015 | | 2014 | | 2013 |
| Current: | | | | | |
| Federal | $ | 7,328 |
| | $ | 15,711 |
| | $ | 5,036 |
|
| State and local | 1,198 |
| | 1,440 |
| | 169 |
|
| International | 1,790 |
| | 1,437 |
| | 409 |
|
| Total current | $ | 10,316 |
| | $ | 18,588 |
| | $ | 5,614 |
|
| Deferred: | | | | | |
| Federal | $ | 4,738 |
| | $ | (4,549 | ) | | $ | 2,680 |
|
| State and local | (363 | ) | | (378 | ) | | 1,015 |
|
| International | (101 | ) | | (353 | ) | | (138 | ) |
| Total deferred | $ | 4,274 |
| | $ | (5,280 | ) | | $ | 3,557 |
|
| Total non-current tax benefit | $ | (107 | ) | | $ | (1,528 | ) | | $ | (1,375 | ) |
| Total income tax expense | $ | 14,483 |
| | $ | 11,780 |
| | $ | 7,796 |
|
Income tax payments, net of refunds were $11.3 million, $12.9 million and $7.7 million in fiscal 2015, 2014 and 2013, respectively.
The differences between the statutory federal income tax rates and consolidated effective tax rates are as follows:
|
| | | | | |
| | 2015 | | 2014 | | 2013 |
| Federal income tax expense at statutory rates | 35.0% | | 35.0% | | 35.0% |
| State and local income taxes, net of federal tax benefit | 1.2 | | 0.9 | | 0.9 |
| Tax credits - research & development | (1.1) | | (1.6) | | (2.5) |
| Tax credits - 48C | (9.9) | | — | | — |
| Tax credits - other | (0.1) | | (0.2) | | (0.4) |
| Manufacturing deduction | (2.3) | | (3.5) | | (2.0) |
| Meals and entertainment | 0.4 | | 0.6 | | 0.9 |
| Permanent tax adjustment for officers compensation | 0.1 | | 0.1 | | — |
| Nondeductible acquisition costs | — | | 0.3 | | — |
| Tax-exempt interest | — | | (0.2) | | (0.4) |
| Tax reserve adjustments - statute expirations and benefits recognized | (0.2) | | (2.2) | | (3.0) |
| Change in valuation allowance | 0.1 | | 0.4 | | 0.8 |
| Other, net | (0.9) | | — | | — |
| Income tax expense | 22.3% | | 29.6% | | 29.3% |
The Company recognized approximately $6.4 million of tax benefit from an energy-efficiency investment credit under Section 48C of the U.S. Internal Revenue Code, upon successful start-up and commercial production of coatings on our new architectural glass coater. The tax credit was awarded in 2011 by the U.S. Internal Revenue Service (IRS) in cooperation with the Department of Energy as part of the American Reinvestment and Recovery Act to incent energy-efficient investments throughout the United States.
In fiscal 2015, 2014 and 2013, there were tax benefits associated with stock-based incentive plans of $3.3 million, $2.6 million and $0.4 million, respectively. These benefits impacted additional paid-in capital directly and were not reflected in the determination of income tax expense or benefit.
Deferred tax assets and deferred tax liabilities at February 28, 2015 and March 1, 2014 are as follows:
|
| | | | | | | | | | | | | | | |
| | 2015 | | 2014 |
| (In thousands) | Current | | Noncurrent | | Current | | Noncurrent |
| Accounts receivable | $ | 1,022 |
| | $ | — |
| | $ | 900 |
| | $ | — |
|
| Accrued insurance | 46 |
| | 254 |
| | 113 |
| | 574 |
|
| Other accruals | 2,826 |
| | 958 |
| | 2,680 |
| | 792 |
|
| Deferred compensation | 419 |
| | 11,250 |
| | (1 | ) | | 9,323 |
|
| Goodwill and other intangibles | 21 |
| | (7,994 | ) | | 23 |
| | (8,624 | ) |
| Inventory | 90 |
| | (585 | ) | | 720 |
| | (1,164 | ) |
| Depreciation | (853 | ) | | (20,544 | ) | | (853 | ) | | (14,413 | ) |
| Liability for unrecognized tax benefits | — |
| | 2,784 |
| | — |
| | 2,781 |
|
| Prepaid expenses | (731 | ) | | 864 |
| | (634 | ) | | 595 |
|
| Net operating losses | — |
| | 3,084 |
| | — |
| | 3,566 |
|
| Valuation allowance on net operating losses | (2,149 | ) | | (442 | ) | | (459 | ) | | (2,312 | ) |
| Other | 668 |
| | (281 | ) | | 225 |
| | 315 |
|
| Deferred tax assets (liabilities) | $ | 1,359 |
| | $ | (10,652 | ) | | $ | 2,714 |
| | $ | (8,567 | ) |
The Company has state net operating loss carryforwards with a tax effect of $3.6 million. A valuation allowance of $2.6 million has been established for these net operating loss carryforwards due to the uncertainty of the use of the tax benefits in future periods.
The Company files income tax returns in the U.S. federal jurisdiction, various U.S. state jurisdictions, Canada, Brazil and other international jurisdictions. The Company is no longer subject to U.S. federal tax examinations for years prior to fiscal 2012, or state and local income tax examinations for years prior to fiscal 2008. The Company is not currently under U.S. federal examination
for years subsequent to fiscal year 2011, and there is very limited audit activity of the Company’s income tax returns in U.S. state jurisdictions or international jurisdictions.
The Company considers the earnings of its non-U.S. subsidiaries to be indefinitely invested outside of the United States on the basis of estimates that future domestic cash generation will be sufficient to meet future domestic cash needs and specific plans for reinvestment of those subsidiary earnings. Should the Company decide to repatriate the foreign earnings, it would need to adjust the income tax provision in the period it was determined that the earnings will no longer be indefinitely invested outside the United States.
The total liability for unrecognized tax benefits for fiscal 2015, 2014 and 2013, respectively, is $5.0 million, $5.2 million and $6.8 million. Included in this total liability for each of fiscal 2015 and 2014 are $2.6 million and $3.3 million for fiscal 2013, of tax benefits that, if recognized, would decrease the effective tax rate. Also included in the balance of unrecognized tax benefits for fiscal 2015, 2014 and 2013 are $1.9 million, $1.8 million and $2.2 million of tax benefits that, if recognized, would result in adjustments to deferred taxes.
Penalties and interest related to unrecognized tax benefits are recorded in income tax expense, which is consistent with past practices. Related to the unrecognized tax benefits noted above, the Company reduced the accrual for penalties and interest by $0.3 million during fiscal 2015, resulting in a reserve for interest and penalties of $0.5 million at the end of fiscal 2015. During fiscal 2014, the Company reduced the accrual for penalties and interest by $0.5 million, resulting in a reserve for interest and penalties at the end of fiscal 2014 of $0.8 million. During fiscal 2013, the Company reduced the accrual for penalties and interest by $0.5 million, resulting in a reserve for interest and penalties at the end of fiscal 2013 of $1.3 million.
A reconciliation of the beginning and ending balances of the total amounts of gross unrecognized tax benefits is as follows:
|
| | | | | | | | | | | |
| (In thousands) | 2015 | | 2014 | | 2013 |
| Gross unrecognized tax benefits at beginning of year | $ | 4,431 |
| | $ | 5,516 |
| | $ | 7,125 |
|
| Gross increases in tax positions for prior years | 261 |
| | 44 |
| | 236 |
|
| Gross decreases in tax positions for prior years | (276 | ) | | (616 | ) | | (1,480 | ) |
| Gross increases based on tax positions related to the current year | 508 |
| | 326 |
| | 621 |
|
| Gross decreases based on tax positions related to the current year | (21 | ) | | (40 | ) | | (56 | ) |
| Settlements | (93 | ) | | (84 | ) | | (682 | ) |
| Statute of limitations expiration | (319 | ) | | (809 | ) | | (248 | ) |
| Unrecognized tax benefits acquired in connection with Alumicor | — |
| | 94 |
| | — |
|
| Gross unrecognized tax benefits at end of year | $ | 4,491 |
| | $ | 4,431 |
| | $ | 5,516 |
|
The total liability for unrecognized tax benefits is expected to decrease by approximately $0.7 million during fiscal 2016 due to audit settlements and lapsing of statutes.
In September 2013, the U.S. Department of the Treasury and the IRS issued final regulations addressing the acquisition, production and improvement of tangible property, and also proposed regulations addressing the disposition of property. These regulations replace previously issued temporary regulations and are effective for tax years beginning on or after January 1, 2014. The adoption of the new regulations did not have a material impact on the Company’s consolidated financial statements.
| |
14. | Quarterly Data (Unaudited) |
|
| | | | | | | | | | | | | | | | | | | |
| | Quarter | | |
| (In thousands, except per share data) | First | | Second | | Third | | Fourth | | Total |
| Fiscal 2015 | | | | | | | | | |
| Net sales | $ | 210,883 |
| | $ | 231,945 |
| | $ | 244,410 |
| | $ | 246,698 |
| | $ | 933,936 |
|
| Gross profit | 41,438 |
| | 49,321 |
| | 56,653 |
| | 61,132 |
| | 208,544 |
|
| Net earnings | 6,102 |
| | 16,791 |
| | 13,736 |
| | 13,887 |
| | 50,516 |
|
| Earnings per share - basic | 0.21 |
| | 0.59 |
| | 0.47 |
| | 0.49 |
| | 1.76 |
|
| Earnings per share - diluted | 0.21 |
| | 0.57 |
| | 0.47 |
| | 0.47 |
| | 1.72 |
|
| Fiscal 2014 | | | | | | | | | |
| Net sales | $ | 179,311 |
| | $ | 178,287 |
| | $ | 199,430 |
| | $ | 214,417 |
| | $ | 771,445 |
|
| Gross profit | 36,386 |
| | 38,535 |
| | 43,388 |
| | 46,943 |
| | 165,252 |
|
| Net earnings | 4,159 |
| | 6,121 |
| | 9,668 |
| | 8,038 |
| | 27,986 |
|
| Earnings per share - basic | 0.15 |
| | 0.21 |
| | 0.34 |
| | 0.28 |
| | 0.98 |
|
| Earnings per share - diluted | 0.14 |
| | 0.21 |
| | 0.33 |
| | 0.27 |
| | 0.95 |
|
Basic earnings per share is computed by dividing net income or loss by the weighted average number of common shares outstanding. Diluted earnings per share is computed by dividing net income or loss by the weighted average common shares outstanding, including the dilutive effects of stock options, SARs and nonvested shares. The following table presents a reconciliation of the share amounts used in the computation of basic and diluted earnings per share:
|
| | | | | | | | |
| (In thousands) | 2015 | | 2014 | | 2013 |
| Basic earnings per share - weighted common shares outstanding | 28,763 |
| | 28,483 |
| | 27,954 |
|
| Weighted average effect of nonvested share grants and assumed exercise of stock options | 611 |
| | 891 |
| | 687 |
|
| Diluted earnings per share - weighted common shares and potential common shares outstanding | 29,374 |
| | 29,374 |
| | 28,641 |
|
| Stock options excluded from the calculation of earnings per share because the exercise price was greater than the average market price of the common shares | — |
| | — |
| | 538 |
|
16.Business Segment Data
The Company has four reporting segments: Architectural Glass, Architectural Services, Architectural Framing Systems and Large-Scale Optical (LSO). The Architectural Glass segment fabricates glass used in customized window and wall systems comprising the outside skin of commercial and institutional buildings. The Architectural Services segment designs, engineers, fabricates and installs the walls of glass, and windows and other curtainwall products making up the outside skin of commercial and institutional buildings for new construction and renovation. The Architectural Framing Systems segment designs, engineers, fabricates and finishes the aluminum frames used in customized aluminum and glass window, curtainwall, storefront and entrance systems comprising the outside skin and entrances of commercial and institutional buildings. The Company has aggregated four operating segments into the Architectural Framing Systems reporting segment based upon their similar products, customers, distribution methods, production processes and economic characteristics. The LSO segment manufactures value-added glass and acrylic products for the custom picture framing market.
The following table presents certain data for the Company's four reporting segments, and consolidated data, for fiscal 2015, 2014 and 2013.
|
| | | | | | | | | | | |
| (In thousands) | 2015 | | 2014 | | 2013 |
| Net Sales | | | | | |
| Architectural glass | $ | 346,471 |
| | $ | 293,810 |
| | $ | 266,456 |
|
| Architectural services | 230,650 |
| | 203,351 |
| | 186,570 |
|
| Architectural framing systems | 298,395 |
| | 216,059 |
| | 191,137 |
|
| Large-scale optical | 87,693 |
| | 81,127 |
| | 79,947 |
|
| Intersegment elimination | (29,273 | ) | | (22,902 | ) | | (23,886 | ) |
| Total | $ | 933,936 |
| | $ | 771,445 |
| | $ | 700,224 |
|
| Operating Income (Loss) | | | | | |
| Architectural glass | $ | 16,431 |
| | $ | 3,861 |
| | $ | (4,391 | ) |
| Architectural services | 7,442 |
| | 4,479 |
| | (1,008 | ) |
| Architectural framing systems | 21,808 |
| | 14,930 |
| | 14,584 |
|
| Large-scale optical | 21,954 |
| | 21,252 |
| | 20,993 |
|
| Corporate and other | (4,050 | ) | | (4,237 | ) | | (2,759 | ) |
| Total | $ | 63,585 |
| | $ | 40,285 |
| | $ | 27,419 |
|
| Depreciation and Amortization | | | | | |
| Architectural glass | $ | 12,897 |
| | $ | 11,624 |
| | $ | 12,230 |
|
| Architectural services | 1,375 |
| | 1,421 |
| | 844 |
|
| Architectural framing systems | 8,001 |
| | 6,436 |
| | 6,477 |
|
| Large-scale optical | 4,817 |
| | 4,861 |
| | 4,634 |
|
| Corporate and other | 2,333 |
| | 2,208 |
| | 2,344 |
|
| Total | $ | 29,423 |
| | $ | 26,550 |
| | $ | 26,529 |
|
| Capital Expenditures | | | | | |
| Architectural glass | $ | 12,307 |
| | $ | 31,568 |
| | $ | 17,373 |
|
| Architectural services | 595 |
| | 1,195 |
| | 3,939 |
|
| Architectural framing systems | 9,238 |
| | 7,008 |
| | 8,151 |
|
| Large-scale optical | 3,500 |
| | 546 |
| | 2,792 |
|
| Corporate and other | 1,580 |
| | 1,535 |
| | 2,409 |
|
| Total | $ | 27,220 |
| | $ | 41,852 |
| | $ | 34,664 |
|
Identifiable Assets(1) | | | | | |
| Architectural glass | $ | 223,525 |
| | $ | 209,102 |
| | $ | 183,794 |
|
| Architectural services | 68,930 |
| | 66,567 |
| | 54,696 |
|
| Architectural framing systems | 190,106 |
| | 186,520 |
| | 113,943 |
|
| Large-scale optical | 60,356 |
| | 58,102 |
| | 59,348 |
|
| Corporate and other | 69,140 |
| | 49,704 |
| | 112,998 |
|
| Total | $ | 612,057 |
| | $ | 569,995 |
| | $ | 524,779 |
|
| |
(1) | During the fourth quarter of fiscal 2015, the Company changed its method of accounting for those inventories which were accounted for under the LIFO method to the FIFO method. See Note 1 for discussion of this accounting change and its related impact. |
Due to the varying combinations and integration of individual window, storefront and curtainwall systems, the Company has determined that it is impractical to report product revenues generated by class of product, beyond the segment revenues currently reported.
The following table presents net sales, based on the location in which the sale originated, and long-lived assets, representing property, plant and equipment, net of related depreciation, by geographic region.
|
| | | | | | | | | | | |
| (In thousands) | 2015 | | 2014 | | 2013 |
| Net Sales | | | | | |
| United States | $ | 847,887 |
| | $ | 718,881 |
| | $ | 668,243 |
|
| Canada | 50,807 |
| | 15,850 |
| | — |
|
| Brazil | 35,242 |
| | 36,714 |
| | 31,981 |
|
| Total | $ | 933,936 |
| | $ | 771,445 |
| | $ | 700,224 |
|
| Long-Lived Assets | | | | | |
| United States | $ | 178,048 |
| | $ | 177,378 |
| | $ | 160,337 |
|
| Canada | 8,214 |
| | 9,031 |
| | — |
|
| Brazil | 7,278 |
| | 7,537 |
| | 8,611 |
|
| Total | $ | 193,540 |
| | $ | 193,946 |
| | $ | 168,948 |
|
Apogee's export net sales from U.S. operations of $72.7 million for fiscal 2015 were approximately 8 percent of consolidated net sales; export net sales of $52.5 million for fiscal 2014 were approximately 7 percent of consolidated net sales; and export sales of $63.5 million for fiscal 2013 were approximately 9 percent of consolidated net sales. All sales from Canada and Brazil were to customers outside the United States, and are subject to changes in the value of foreign currencies in relation to our reporting currency, the U.S. dollar. No single customer, including government agencies, accounts for 10 percent or more of consolidated net sales.
Segment operating income is equal to net sales less cost of sales and operating expenses. Operating income does not include provision for interest expense or income taxes. Corporate and other includes miscellaneous corporate activity not allocable to business segments.
Included in the identifiable assets for Corporate and other are the short- and long-term available-for-sale securities at Prism of $11.0 million in fiscal 2015 and $11.5 million in fiscal 2014. Also included are short- and long-term restricted investments at corporate of $2.5 million in fiscal 2014.
| |
17. | Commitments and Contingent Liabilities |
Operating lease commitments. As of February 28, 2015March 4, 2017, the Company was obligated under noncancelablenon-cancelable operating leases for buildings and equipment. Certain leases provide for increased rentals based upon increases in real estate taxes or operating costs. As part of our acquisition of Sotawall, we acquired leases to two properties which hold Sotawall's current principal facilities. The lessor under these leases is a company owned by the President of Sotawall. Future minimum rental payments under noncancelablenon-cancelable operating leases are:
| | | (In thousands) | Fiscal 2016 | | Fiscal 2017 | | Fiscal 2018 | | Fiscal 2019 | | Fiscal 2020 | | Thereafter | | Total | 2018 | | 2019 | | 2020 | | 2021 | | 2022 | | Thereafter | | Total |
| Total minimum payments | $ | 9,341 |
| | $ | 7,423 |
| | $ | 6,609 |
| | $ | 5,932 |
| | $ | 4,675 |
| | $ | 3,658 |
| | $ | 37,638 |
| $ | 11,419 |
| | $ | 10,796 |
| | $ | 9,286 |
| | $ | 6,342 |
| | $ | 5,605 |
| | $ | 9,002 |
| | $ | 52,450 |
|
Total rental expense, including operating leases and short-term equipment rentals, was $18.716.9 million, $15.415.5 million and $13.018.7 million in fiscal 20152017, 20142016 and 20132015, respectively.
At February 28, 2015March 4, 2017, the Companywe had one sale and leaseback agreement for equipment that provides an option to purchase the equipment at projected future fair market value upon expiration of the lease in 2021. The lease is classified as an operating lease in accordance with applicable financial accounting standards. The Company has a deferred gain of $2.81.8 million under the sale and leaseback transaction, which is included in the balance sheet caption as other current and non-current liabilities. The average annual lease payment over the remaining life of the remaining lease is $1.0 million.
Bond commitments. In the ordinary course of business, predominantly in the Company’s Architectural Services business,segment, the Company is required to provide surety or performance bonds that commit payments to its customers for any non-performance by the Company.non-performance. At February 28, 2015March 4, 2017, $76.9$96.2 million of the Company’s backlog was bonded by performance bonds with a face value of $274.0 million.$343.7 million. Performance bonds do not have stated expiration dates, as the Company is released from the bonds upon
completion of the contract. The Company has never been required to make any payments related to these performance-based bonds with respect to any of theits current portfolio of businesses.
Guarantees and warranties.Warranties. The Company accruesWe reserve estimated exposures on known claims, as well as on a portion of anticipated claims for product warranty and claimrework costs as a percentage of sales based on historical trends and for specific sales creditsproduct liability claims as they become known and estimable. Actual warranty and claim costsa ratio of sales. Claims are deducted from the accrual when paid. Factors that could have an impact on the warranty accrual in any given period include the following: changes in manufacturing quality, shifts in product mix and any significant changes in sales volume. The Company’sA warranty and claim accruals are detailed below.rollforward follows:
| | | (In thousands) | 2015 | | 2014 | 2017 | | 2016 |
| Balance at beginning of period | $ | 11,978 |
| | $ | 8,323 |
| $ | 16,340 |
| | $ | 11,275 |
|
| Additional accruals | 6,482 |
| | 6,680 |
| 11,499 |
| | 8,214 |
|
| Claims paid | (7,185 | ) | | (3,025 | ) | (5,906 | ) | | (3,149 | ) |
| Balance at end of period | $ | 11,275 |
| | $ | 11,978 |
| $ | 21,933 |
| | $ | 16,340 |
|
Letters of credit. At February 28, 2015March 4, 2017, the Companywe had ongoing letters of credit related to its construction contracts and certain industrial revenue bonds. The total value of letters of credit under which the Company waswe were obligated as of February 28, 2015March 4, 2017 was approximately $23.5 million, all of which have been issued under theour credit facility. The Company’sOur total availability under itsour $125.0175.0 million credit facility is reduced by borrowings under the credit facility and also by letters of credit issued under the credit facility.
Purchase obligations. The Company has purchasePurchase obligations for raw material commitments and capital expenditures. Asexpenditures totaled $115.8 million as of February 28, 2015, these obligations totaled $158.9 millionMarch 4, 2017.
Environmental liability. In fiscal 2008, we acquired one manufacturing facility which has certain historical environmental conditions. We are working to remediate these conditions; remediation has been conducted without significant disruption to our operations. Our liability for these remediation activities was $1.4 million and $1.6 million at March 4, 2017 and February 27, 2016, respectively.
New Markets Tax Credit transaction.transactions. On November 7, 2013, the CompanyIn June 2016, we entered into a transaction with JP Morgan Chase (JPM)a subsidiary of Wells Fargo (WF) under a qualified New Markets Tax Credit (NMTC) program related to an investment in plant and equipment within the Company’sour Architectural Glass segment (the Project) whereby the Company received $7.8 million of cash fromsegment. Previously, in fiscal 2014, we entered into a qualified New Markets Tax Credit program (NMTC). The NMTC was provided for in the Community Renewal Tax Relief Act of 2000 and is intendedtransaction with JP Morgan Chase (JPM) related to inducea separate investment in underservedplant and impoverished areas of the United States. The Act permits taxpayers, whether companies or individuals, to claim credits against their federal income taxes for up to 39 percent of investments in qualified, active low-income businesses or ventures.
In exchange for substantially all of the benefits derived from the tax credits, JPM contributed $10.7 million into the Project. JPM does not have a material interest in the underlying economics of the Project. As a result of the transaction structure, the Company has concluded that the entities created in relation to the NMTC transaction are consolidated as variable-interest entities.
Based on the contractual arrangements that obligate the Company to deliver tax benefits to JPM, the Company has included the value of JPM’s contribution in other non-current liabilitiesequipment within the consolidated balance sheets. TheArchitectural Glass segment. Each NMTC transaction is subject to 100 percent tax credit recapture for a period of seven years. ProceedsTherefore, proceeds received in exchange for the transfer of the tax credits are expected towill be recognized as earnings in fiscal 2021 and 2024, if the expected tax benefits are delivered without risk of recapture to JPMeach bank and our performance obligation isobligations are relieved.
In exchange for substantially all the benefits derived from tax credits, WF contributed $6.0 million and JPM contributed $10.7 million into each respective project. These amounts are included within other non-current liabilities on our consolidated balance sheets. Direct and incremental costs incurred in structuring the arrangementthese arrangements have been deferred and will be recognized in proportion to the recognition of the related profits. These costs amounted to $3.3$4.5 million and are included in other non-current assets on the Company’sour consolidated balance sheet.sheets. Variable-interest entities were created as a result of the structure of these transactions, which have been included within our consolidated financial statements as the banks do not have a material interest in the underlying economics of the projects.
Litigation. The Company is a party to various legal proceedings incidental to its normal operating activities. In particular, like others in the construction supply and services industry, the Company’s construction supply and services businesses are routinely involved in various disputes and claims arising out of construction projects, sometimes involving significant monetary damages or product replacement. The Company is subject to litigation arising out of general liability, employment practices, workersworkers' compensation general liability and automobile claims. Although it is very difficult to accurately predict the outcome of such proceedings, facts currently available indicate that no such claims will result in losses that would have a material adverse effect on the results of operations, cash flows or financial condition of the Company.
A class of 200,000 shares of junior preferred stock with a par value of $1.00 is authorized, but unissued.
Share Repurchases
During fiscal 2004, the Board of Directors authorized a share repurchase program of 1,500,000 shares of common stock. The Board of Directors subsequently increased this authorization by 750,000 shares in fiscal 2008; by 1,000,000 shares in fiscal 2009; and by another 1,000,000 shares in fiscal 2016. We repurchased 250,001 shares under the program during fiscal 2017, for a total cost of $10.8 million. We repurchased 575,000 shares under the program, for a total cost of $24.9 million, in fiscal 2016 and 203,509 shares under the program, for a total cost of $6.9 million, in fiscal 2015. The Company has repurchased a total of 3,307,633 shares, at a total cost of $72.3 million, since the inception of this program. We have remaining authority to repurchase 942,367 shares under this program, which has no expiration date.
In addition to the shares repurchased under this repurchase plan, during fiscal 2017, 2016 and 2015, the Company also withheld $2.6 million, $5.1 million and $5.2 million, respectively, of Company stock from employees in order to satisfy stock-for-stock option exercises or tax obligations related to stock-based compensation, pursuant to terms of board and shareholder-approved compensation plans.
Accumulated Other Comprehensive Loss
The following summarizes the accumulated other comprehensive loss, net of tax, at March 4, 2017 and February 27, 2016:
|
| | | | | | | | |
| (In thousands) | | 2017 | | 2016 |
| Net unrealized (loss) gain on marketable securities | | $ | (4 | ) | | $ | 79 |
|
| Pension liability adjustments | | (3,628 | ) | | (3,758 | ) |
| Foreign currency translation adjustments | | (27,458 | ) | | (27,692 | ) |
| Total accumulated other comprehensive loss | | $ | (31,090 | ) | | $ | (31,371 | ) |
| |
| 13. | Share-Based Compensation |
We have a 2009 Stock Incentive Plan and a 2009 Non-Employee Director Stock Incentive Plan (the Plans) which provide for the issuance of 1,888,000 and 350,000 shares, respectively, for various forms of stock-based compensation to employees and non-employee directors. Awards under these Plans may be in the form of incentive stock options (to employees only), nonstatutory options or stock-settled stock appreciation rights (SARs) and are granted with an exercise price equal to the fair market value of the Company’s stock at the date of award. We also issue nonvested share awards and nonvested share unit awards under the Plans. Issued SARs vest over a three-year period and options issued to non-employee directors vest at the end of six months, both with a 10-year term. Nonvested share awards and nonvested share unit awards generally vest over a two, three or four-year period.
We had a 2002 Omnibus Stock Incentive Plan, which was terminated in June 2009; no new grants may be made under this plan, although exercises of SARs and options previously granted thereunder will still occur in accordance with the terms of the various grants.
Total stock-based compensation expense under all Plans included in the results of operations was $6.0 million for fiscal 2017, $4.9 million for fiscal 2016 and $4.8 million for 2015. We elect to account for any forfeitures as they occur.
Stock Options and SARs
There were no stock options or SARs issued in any fiscal year presented. Activity for the current year is summarized as follows: |
| | | | | | | | | | | | |
| | Number of Shares | | Weighted Average Exercise Price | | Weighted Average Remaining Contractual Life | | Aggregate Intrinsic Value at Year-End |
| Outstanding at February 27, 2016 | 403,714 |
| | $ | 11.81 |
| | | | |
| Awards exercised | (173,813 | ) | | 14.34 |
| | | | |
| Outstanding and exercisable at March 4, 2017 | 229,901 |
| | $ | 9.90 |
| | 4.0 Years | | $ | 11,101,695 |
|
Cash proceeds from the exercise of stock options were $1.9 million, $1.6 million and $1.2 million for fiscal 2017, 2016 and 2015, respectively. The aggregate intrinsic value of securities exercised (the amount by which the stock price on the date of exercise exceeded the stock price of the award on the date of grant) was $6.0 million, $7.5 million and $4.6 million in fiscal 2017, 2016 and 2015, respectively.
Nonvested Share Awards and Units
The following table summarizes nonvested share activity for fiscal 2017:
|
| | | | | | |
| | Number of Shares and Units | | Weighted Average Grant Date Fair Value |
| February 27, 2016 | 275,457 |
| | $ | 37.48 |
|
| Granted | 148,672 |
| | 42.90 |
|
| Vested | (143,875 | ) | | 28.81 |
|
| Canceled | (1,050 | ) | | 44.55 |
|
| March 4, 2017 | 279,204 |
| | $ | 44.80 |
|
At March 4, 2017, there was $6.6 million of total unrecognized compensation cost related to nonvested share and nonvested share unit awards, which is expected to be recognized over a weighted average period of approximately 20 months. The total fair value of shares vested during fiscal 2017 was $6.3 million.
Earnings before income taxes consisted of the following:
|
| | | | | | | | | | | |
| (In thousands) | 2017 | | 2016 | | 2015 |
| U.S. | $ | 123,229 |
| | $ | 100,859 |
| | $ | 59,898 |
|
| International | (424 | ) | | (3,535 | ) | | 5,101 |
|
| Earnings before income taxes | $ | 122,805 |
| | $ | 97,324 |
| | $ | 64,999 |
|
The components of income tax expense (benefit) for each of the last three fiscal years was:
|
| | | | | | | | | | | |
| (In thousands) | 2017 | | 2016 | | 2015 |
| Current | | | | | |
| Federal | $ | 35,610 |
| | $ | 35,888 |
| | $ | 7,328 |
|
| State and local | 2,929 |
| | 2,866 |
| | 1,198 |
|
| International | (147 | ) | | (636 | ) | | 1,790 |
|
| Total current | 38,392 |
| | 38,118 |
| | 10,316 |
|
| Deferred | | | | | |
| Federal | (945 | ) | | (5,403 | ) | | 4,738 |
|
| State and local | (78 | ) | | (512 | ) | | (363 | ) |
| International | (42 | ) | | (224 | ) | | (101 | ) |
| Total deferred | (1,065 | ) | | (6,139 | ) | | 4,274 |
|
| Total non-current tax (benefit) expense | (312 | ) | | 3 |
| | (107 | ) |
| Total income tax expense | $ | 37,015 |
| | $ | 31,982 |
| | $ | 14,483 |
|
Income tax payments, net of refunds were $47.8 million, $25.9 million and $11.3 million in fiscal 2017, 2016 and 2015, respectively.
The following table provides a reconciliation of the statutory federal income tax rate to our consolidated effective tax rates:
|
| | | | | | | | |
| | 2017 | | 2016 | | 2015 |
| Federal income tax expense at statutory rate | 35.0 | % | | 35.0 | % | | 35.0 | % |
| Manufacturing deduction | (3.3 | ) | | (3.4 | ) | | (2.3 | ) |
| State and local income taxes, net of federal tax benefit | 1.6 |
| | 1.6 |
| | 1.2 |
|
| Foreign tax rate differential | (1.6 | ) | | — |
| | — |
|
| Tax credits - research & development | (0.7 | ) | | (0.8 | ) | | (1.1 | ) |
| Tax credits - 48C | — |
| | — |
| | (9.9 | ) |
| Other, net | (0.9 | ) | | 0.5 |
| | (0.6 | ) |
| Income tax expense | 30.1 | % | | 32.9 | % | | 22.3 | % |
In the current year, we recorded a net tax benefit of $1.9 million on a distribution from our Brazilian operation. Additionally, in the fourth quarter, as a result of the adoption of ASU 2016-09 (see additional discussion in Note 1), we recognized tax benefits of $0.9 million within income tax expense. In fiscal 2016 and 2015, tax benefits associated with stock-based incentive plans were $3.9 million and $3.3 million, respectively. These benefits impacted additional paid-in capital and were not reflected in the determination of income tax expense or benefit.
In fiscal 2015, the Company recognized approximately $6.4 million of tax benefit from an energy-efficient investment credit under Section 48C of the U.S. Internal Revenue Code, upon successful start-up and commercial production of coatings on our new architectural glass coater. The tax credit was awarded in 2011 by the U.S. Internal Revenue Service (IRS) in cooperation with the Department of Energy as part of the American Reinvestment and Recovery Act to incent energy-efficient investments.
In the first quarter of fiscal 2017, the Company adopted ASU 2015-17, which requires deferred tax assets and liabilities to be classified as noncurrent in the financial statements. We have not elected to apply this change in accounting principle retroactively. Deferred tax assets and deferred tax liabilities at March 4, 2017 and February 27, 2016 were:
|
| | | | | | | | | | | |
| | 2017 | | 2016 |
| (In thousands) | Noncurrent | | Current | | Noncurrent |
| Accounts receivable | $ | 408 |
| | $ | 825 |
| | $ | — |
|
| Other accruals | 4,254 |
| | 2,968 |
| | 1,281 |
|
| Deferred compensation | 15,189 |
| | 554 |
| | 12,594 |
|
| Goodwill and other intangibles | (7,601 | ) | | 18 |
| | (7,615 | ) |
| Depreciation | (18,714 | ) | | — |
| | (17,354 | ) |
| Liability for unrecognized tax benefits | 2,623 |
| | — |
| | 2,797 |
|
| Net operating losses | 5,790 |
| | — |
| | 2,945 |
|
| Valuation allowance on net operating losses | (2,352 | ) | | (2,194 | ) | | (306 | ) |
| Other | 403 |
| | (351 | ) | | 686 |
|
| Deferred tax (liabilities) assets | $ | — |
| | $ | 1,820 |
| | $ | (4,972 | ) |
The Company has U.S. federal tax credits as well as state net operating loss carryforwards with a tax effect of $5.5 million. A valuation allowance of $2.4 million has been established for these net operating loss carryforwards due to the uncertainty of the use of the tax benefits in future periods.
The Company files income tax returns in the U.S. federal jurisdiction, various U.S. state jurisdictions, Canada, Brazil and other international jurisdictions. The Company is no longer subject to U.S. federal tax examinations for years prior to fiscal 2014, or state and local income tax examinations for years prior to fiscal 2010. The Company is not currently under U.S. federal examination for years subsequent to fiscal 2013, and there is very limited audit activity of the Company’s income tax returns in U.S. state jurisdictions or international jurisdictions.
The Company considers the earnings of its non-U.S. subsidiaries to be indefinitely invested outside of the U.S. on the basis of estimates that future domestic cash generation will be sufficient to meet future domestic cash needs and specific plans for reinvestment of those subsidiary earnings. Should the Company decide to repatriate foreign earnings, it would need to adjust the income tax provision in the period it was determined that the earnings will no longer be indefinitely invested outside the U.S.
If we were to prevail on all unrecognized tax benefits recorded, $2.1 million, $2.7 million and $2.6 million for fiscal 2017, 2016 and 2015, respectively, would benefit the effective tax rate. Also included in the balance of unrecognized tax benefits for fiscal 2017, 2016 and 2015, are $2.0 million, $1.8 million and $1.9 million, respectively, of tax benefits that, if recognized, would result in adjustments to deferred taxes.
Penalties and interest related to unrecognized tax benefits are recorded in income tax expense. For fiscal 2017, we accrued penalties and interest related to unrecognized tax benefits of $0.4 million. For each of fiscal 2016 and 2015, the accrual was $0.5 million.
The following table provides a reconciliation of the total amounts of gross unrecognized tax benefits:
|
| | | | | | | | | | | |
| (In thousands) | 2017 | | 2016 | | 2015 |
| Gross unrecognized tax benefits at beginning of year | $ | 4,512 |
| | $ | 4,491 |
| | $ | 4,431 |
|
| Gross increases in tax positions for prior years | 54 |
| | 60 |
| | 261 |
|
| Gross decreases in tax positions for prior years | (233 | ) | | (158 | ) | | (276 | ) |
| Gross increases based on tax positions related to the current year | 508 |
| | 526 |
| | 508 |
|
| Gross decreases based on tax positions related to the current year | — |
| | (33 | ) | | (21 | ) |
| Settlements | (23 | ) | | — |
| | (93 | ) |
| Statute of limitations expiration | (743 | ) | | (374 | ) | | (319 | ) |
| Gross unrecognized tax benefits at end of year | $ | 4,075 |
| | $ | 4,512 |
| | $ | 4,491 |
|
The total liability for unrecognized tax benefits is expected to decrease by approximately $0.4 million during fiscal 2018 due to lapsing of statutes.
Basic earnings per share is computed by dividing net earnings by the weighted average number of common shares outstanding. Diluted earnings per share is computed by dividing net earnings by the weighted average number of common shares outstanding, including the dilutive effects of stock options, SARs and nonvested shares. The following table presents a reconciliation of the share amounts used in the computation of basic and diluted earnings per share:
|
| | | | | | | | |
| (In thousands) | 2017 | | 2016 | | 2015 |
| Basic earnings per share - weighted average common shares outstanding | 28,781 |
| | 29,058 |
| | 28,763 |
|
| Weighted average effect of nonvested share grants and assumed exercise of stock options | 112 |
| | 317 |
| | 611 |
|
| Diluted earnings per share - weighted average common shares and potential common shares outstanding | 28,893 |
| | 29,375 |
| | 29,374 |
|
| Stock options excluded from the calculation of earnings per share because the exercise price was greater than the average market price of the common shares | — |
| | — |
| | — |
|
16.Business Segment Data
We have four reporting segments:
The Architectural Glass segment fabricates coated, high-performance glass used globally in customized window and wall systems comprising the outside skin of commercial, institutional and high-end multi-family residential buildings.
The Architectural Framing Systems segment designs, engineers, fabricates and finishes the aluminum frames used in customized aluminum and glass window, curtainwall, storefront and entrance systems comprising the outside skin and entrances of commercial, institutional and high-end multi-family residential buildings. We have aggregated five operating segments into this reporting segment based on their similar products, customers, distribution methods, production processes and economic characteristics.
The Architectural Services segment provides full-service installation of the walls of glass, windows and other curtainwall products making up the outside skin of commercial and institutional buildings.
The Large-Scale Optical Technologies (LSO) segment manufactures value-added glass and acrylic products for framing and display applications.
|
| | | | | | | | | | | |
| (In thousands) | 2017 | | 2016 | | 2015 |
| Net Sales | | | | | |
| Architectural Glass | $ | 411,881 |
| | $ | 377,713 |
| | $ | 346,471 |
|
| Architectural Framing Systems | 385,978 |
| | 308,593 |
| | 298,395 |
|
| Architectural Services | 270,937 |
| | 245,935 |
| | 230,650 |
|
| Large-Scale Optical | 89,710 |
| | 88,541 |
| | 87,693 |
|
| Intersegment elimination | (43,973 | ) | | (39,593 | ) | | (29,273 | ) |
| Total | $ | 1,114,533 |
| | $ | 981,189 |
| | $ | 933,936 |
|
| Operating Income (Loss) | | | | | |
| Architectural Glass | $ | 44,656 |
| | $ | 35,504 |
| | $ | 16,431 |
|
| Architectural Framing Systems | 44,768 |
| | 31,911 |
| | 21,808 |
|
| Architectural Services | 18,494 |
| | 11,687 |
| | 7,442 |
|
| Large-Scale Optical | 22,467 |
| | 22,963 |
| | 21,954 |
|
| Corporate and other | (8,160 | ) | | (4,672 | ) | | (4,050 | ) |
| Total | $ | 122,225 |
| | $ | 97,393 |
| | $ | 63,585 |
|
| Depreciation and Amortization | | | | | |
| Architectural Glass | $ | 15,912 |
| | $ | 14,397 |
| | $ | 12,897 |
|
| Architectural Framing Systems | 12,404 |
| | 8,019 |
| | 8,001 |
|
| Architectural Services | 1,364 |
| | 1,274 |
| | 1,375 |
|
| Large-Scale Optical | 4,785 |
| | 4,998 |
| | 4,817 |
|
| Corporate and other | 1,142 |
| | 2,560 |
| | 2,333 |
|
| Total | $ | 35,607 |
| | $ | 31,248 |
| | $ | 29,423 |
|
| Capital Expenditures | | | | | |
| Architectural Glass | $ | 44,439 |
| | $ | 17,701 |
| | $ | 12,307 |
|
| Architectural Framing Systems | 14,070 |
| | 19,166 |
| | 9,238 |
|
| Architectural Services | 1,981 |
| | 929 |
| | 595 |
|
| Large-Scale Optical | 1,510 |
| | 1,962 |
| | 3,500 |
|
| Corporate and other | 6,061 |
| | 2,279 |
| | 1,580 |
|
| Total | $ | 68,061 |
| | $ | 42,037 |
| | $ | 27,220 |
|
| Identifiable Assets | | | | | |
| Architectural Glass | $ | 254,840 |
| | $ | 215,571 |
| | $ | 223,525 |
|
| Architectural Framing Systems | 359,633 |
| | 193,823 |
| | 190,106 |
|
| Architectural Services | 70,875 |
| | 81,574 |
| | 68,930 |
|
| Large-Scale Optical | 58,198 |
| | 57,369 |
| | 60,356 |
|
| Corporate and other | 41,112 |
| | 109,103 |
| | 69,140 |
|
| Total | $ | 784,658 |
| | $ | 657,440 |
| | $ | 612,057 |
|
Due to the varying combinations and integration of individual window, storefront and curtainwall systems, the Company has determined that it is impractical to report product revenues generated by class of product beyond the segment revenues currently reported.
Segment operating income is equal to net sales less cost of sales and operating expenses. Operating income does not include interest expense or a provision for income taxes. Corporate and other includes miscellaneous corporate activity not allocable to our segments. Identifiable assets for Corporate and other include all short- and long-term available-for-sale securities.
The following table presents net sales, based on the location in which the sale originated, and long-lived assets, representing property, plant and equipment, net of related depreciation, by geographic region.
|
| | | | | | | | | | | |
| (In thousands) | 2017 | | 2016 | | 2015 |
| Net Sales | | | | | |
| United States | $ | 1,031,214 |
| | $ | 923,018 |
| | $ | 847,887 |
|
| Canada | 65,958 |
| | 39,324 |
| | 50,807 |
|
| Brazil | 17,361 |
| | 18,847 |
| | 35,242 |
|
| Total | $ | 1,114,533 |
| | $ | 981,189 |
| | $ | 933,936 |
|
| Long-Lived Assets | | | | | |
| United States | $ | 227,145 |
| | $ | 189,624 |
| | $ | 178,048 |
|
| Canada | 13,303 |
| | 7,162 |
| | 8,214 |
|
| Brazil | 6,300 |
| | 5,676 |
| | 7,278 |
|
| Total | $ | 246,748 |
| | $ | 202,462 |
| | $ | 193,540 |
|
Apogee's export net sales from U.S. operations of $76.2 million for fiscal 2017 were approximately 7 percent of consolidated net sales; export net sales of $79.5 million for fiscal 2016 were approximately 8 percent of consolidated net sales; and export sales of $72.7 million for fiscal 2015 were approximately 8 percent of consolidated net sales.
| |
| 17. | Quarterly Data (Unaudited) |
|
| | | | | | | | | | | | | | | | | | | |
| | Quarter | | |
| (In thousands, except per share data) | First | | Second | | Third | | Fourth (1) | | Total |
| 2017 | | | | | | | | | |
| Net sales | $ | 247,880 |
| | $ | 278,455 |
| | $ | 274,072 |
| | $ | 314,126 |
| | $ | 1,114,533 |
|
| Gross profit | 64,428 |
| | 72,531 |
| | 72,868 |
| | 82,196 |
| | 292,023 |
|
| Net earnings | 17,722 |
| | 22,397 |
| | 22,552 |
| | 23,119 |
| | 85,790 |
|
| Earnings per share - basic | 0.62 |
| | 0.78 |
| | 0.78 |
| | 0.81 |
| | 2.98 |
|
| Earnings per share - diluted | 0.61 |
| | 0.77 |
| | 0.78 |
| | 0.80 |
| | 2.97 |
|
| 2016 | | | | | | | | | |
| Net sales | $ | 239,962 |
| | $ | 240,754 |
| | $ | 238,324 |
| | $ | 262,149 |
| | $ | 981,189 |
|
| Gross profit | 55,588 |
| | 56,699 |
| | 62,426 |
| | 68,857 |
| | 243,570 |
|
| Net earnings | 12,126 |
| | 14,760 |
| | 18,521 |
| | 19,935 |
| | 65,342 |
|
| Earnings per share - basic | 0.42 |
| | 0.51 |
| | 0.64 |
| | 0.69 |
| | $ | 2.25 |
|
| Earnings per share - diluted | 0.41 |
| | 0.50 |
| | 0.63 |
| | 0.69 |
| | $ | 2.22 |
|
Per share amounts are computed independently for each of the quarters presented. The sum of the quarters may not equal the total year amount due to the impact of changes in average quarterly shares outstanding, and all other quarterly amounts may not equal the total year due to rounding.
(1) We acquired Sotawall in the fourth quarter of fiscal 2017; refer to Note 2 for additional information.
ITEM 9. CHANGES IN AND DISAGREEMENTS WITH ACCOUNTANTS ON ACCOUNTING AND FINANCIAL DISCLOSURE
NoneNone.
| |
| ITEM 9A. | CONTROLS AND PROCEDURES |
Evaluation of Disclosure Controls and Procedures. As of the end of the period covered by this report (the Evaluation Date), we carried out an evaluation, under the supervision and with the participation of management, including the Chief Executive Officer and the Chief Financial Officer, of the effectiveness of the design and operation of our disclosure controls and procedures (as defined in Rules 13a-15(e) or 15d-15(e) of the Exchange Act). Based upon that evaluation, the Chief Executive Officer and Chief Financial Officer concluded that, as of the Evaluation Date, our disclosure controls and procedures were effective to ensure that information required to be disclosed by the Company in the reports that it files or submits under the Exchange Act is (i) recorded, processed, summarized and reported within the time periods specified in applicable rules and forms, and (ii) accumulated and communicated to our management, including our Chief Executive Officer and Chief Financial Officer, to allow timely decisions regarding required disclosure.
Management's Annual Report on Internal Control Over Financial Reporting. The report of management required under this Item 9A is contained on page 3022 in Item 8 of this Annual Report on Form 10-K under the caption “Management's Annual Report on Internal Control Over Financial Reporting.”
Attestation Report of Independent Registered Public Accounting Firm. The attestation report required under this Item 9A is contained on page 3224 in Item 8 of this Annual Report on Form 10-K under the caption “Report of Independent Registered Public Accounting Firm.”
Changes in Internal Control over Financial Reporting. There have not been any changes in our internal control over financial reporting (as such term is defined in Rules 13a-15(f) and 15d-15(f) under the Exchange Act) during the most recent fiscal quarter covered by this report that would have materially affected, or are reasonably likely to materially affect, the Company's internal control over financial reporting.
ITEM 9B.OTHER INFORMATION
NoneNone.
PART III
| |
| ITEM 10. | DIRECTORS, EXECUTIVE OFFICERS AND CORPORATE GOVERNANCE |
We have adopted a Code of Business Ethics and Conduct whichthat applies to all of our employees and directors.Board of Directors. The Code of Business Ethics and Conduct is published on our website at www.apog.com. Any amendments to the Code of Business Ethics and Conduct and waivers of the Code of Business Ethics and Conduct for our Chief Executive Officer and Chief Financial Officer will be published on our website.
The other information required by this item, other than the information set forth in Part I above under the heading “Executive Officers of the Registrant,” is set forth under the headings “Proposal 1: Election of Directors,” “Corporate Governance“Frequently Asked Questions - Procedures forHow Can A Shareholder RecommendationsRecommend or Nominations ofNominate a Director Candidates,Candidate?”, “Corporate Governance - Board Meetings and 20142016 Annual Meeting of Shareholders,” “Corporate Governance - Board Committee Responsibilities, Meetings and Membership” and “Section 16(a) Beneficial Ownership Reporting Compliance" in the Proxy Statement for the Company's Annual Meeting of Shareholders to be held on June 25, 2015,22, 2017, which will be filed with the Securities and Exchange Commission within 120 days after our fiscal year-end (our 20152017 Proxy Statement). This information is incorporated herein by reference.
| |
| ITEM 11. | EXECUTIVE COMPENSATION |
The information required by this item is set forth under the headings “Executive Compensation” and “Non-Employee Director Compensation”Compensation" in our 20152017 Proxy Statement. This information is incorporated herein by reference.
ITEM 12.SECURITY OWNERSHIP OF CERTAIN BENEFICIAL OWNERS AND MANAGEMENT AND RELATED STOCKHOLDER MATTERS
The following table summarizes, with respect to our equity compensation plans, the number of shares of our common stock to be issued upon exercise of outstanding options, warrants and other rights to acquire shares, the weighted-average exercise price of these outstanding options, warrants and rights, and the number of shares remaining available for future issuance under our equity compensation plans as of February 28, 2015,March 4, 2017, the last day of fiscal 2015.
2017.
| | | Plan Category | | Number of Securities to be Issued Upon Exercise of Outstanding Options, Warrants and Rights | | Weighted-Average Exercise Price of Outstanding Options, Warrants and Rights | | Number of Securities Remaining Available for Future Issuance under Equity Compensation Plans (Excluding Securities Reflected in the First Column) | | | Number of Securities to be Issued Upon Exercise of Outstanding Options, Warrants and Rights | | Weighted-Average Exercise Price of Outstanding Options, Warrants and Rights | | Number of Securities Remaining Available for Future Issuance under Equity Compensation Plans (Excluding Securities Reflected in the First Column) | |
| | | | | | | | | |
| Equity compensation plans approved by security holders | | 173,583 |
| (1) (2) | $ | 21.20 |
| | 1,306,406 |
| (3) | | 29,560 |
| (1) (2) | $ | 20.48 |
| (3) | 1,042,458 |
| (4) |
| Equity compensation plans not approved by security holders | | 450,512 |
| (4) (5) | 8.34 |
| | None |
| | | 200,341 |
| (5) | 8.34 |
| | None |
| |
| Total | | 624,095 |
| | $ | 11.92 |
| | 1,306,406 |
| | | 229,901 |
| | $ | 9.90 |
| | 1,042,458 |
| |
| |
(1) | Includes shares underlying options and SARs granted under our Amended and Restated 2002 Omnibus Stock Incentive Plan and restricted stock unit awards granted under our Stock Incentive Plan and Director Stock Plan. None of the outstanding stock options or SARs has dividends rights attached, nor are they transferable. Certain outstanding restricted stock units have dividend rights attached, but none of the restricted stock units are transferable. |
| |
(2) | Pursuant to SEC rules and the reporting requirements for this table, we have not included in this column 337,723255,914 shares of restricted stock that are issued and outstanding. All shares of restricted stock outstanding have dividend rights attached, but none of the shares of restricted stock are transferable. |
| |
(3) | In calculating the weighted-average exercise price of outstanding options, warrants and rights, only the exercise prices of outstanding options and SARs are included, as the restricted stock units do not have an exercise price. |
| |
(4) | Pursuant to SEC Rules and the reporting requirements for this table, of these shares, 58,15256,539 are available for issuance under our Legacy Partnership Plan, 910,670680,642 are available for grant under our Stock Incentive Plan, 132,712102,912 are available for grant under our Director Stock Incentive Plan; no shares are available for grant under our 2002 Omnibus Stock Incentive Plan, and 204,872202,365 are available for grant under our Director Deferred Compensation Plan. |
| |
(4)(5) | Reflects stock options granted to Mr. Puishys on August 22, 2011 as inducement awards pursuant to the terms of his employment agreement with our Company effective as of August 22, 2011.2011, that became fully vested on August 22, 2014. The options vested in equal annual installments over a three-year period beginning on August 22, 2012. |
| |
(5) | Pursuant to SEC rules and reporting requirements for this table, we have not included in this column 62,350 shares of restricted stock that are issued and outstanding. All shares of restricted stock outstanding have dividend rights attached, but none of the shares of restricted stock are transferable. |
ITEM 13.CERTAIN RELATIONSHIPS AND RELATED TRANSACTIONS, AND DIRECTOR INDEPENDENCE
The information required by this item is set forth under the headings “Certain Relationships and Related Transactions” and “Corporate Governance - Board Independence” and "Corporate Governance - Certain Relationships and Related Transactions" in our 20152017 Proxy Statement. This information is incorporated herein by reference.
ITEM 14.PRINCIPAL ACCOUNTANT FEES AND SERVICES
The information required by this item is set forth under the headings “Audit Committee Report and Payment of Fees to Independent Registered Public Accounting Firm - Audit Fees, Audit-Related Fees, Tax Fees and All Other Fees” and “Policy on Audit Committee Pre-Approval of Audit and Permissible Non-Audit Services Provided by Our Independent Registered Public Accounting Firm” in our 20152017 Proxy Statement. This information is incorporated herein by reference.
PART IV
| |
| ITEM 15. | EXHIBITS AND FINANCIAL STATEMENT SCHEDULES |
| |
| a) | List of documents filed as a part of this report: |
| |
| 1. | Financial Statements - The consolidated financial statements listed below are set forth in Item 8 of Part II of this report. |
Consolidated Balance Sheets as of February 28, 2015March 4, 2017 and March 1, 2014February 27, 2016
Consolidated Results of Operations for the Years Ended February 28, 2015March 4, 2017, March 1, 2014February 27, 2016 and March 2, 2013February 28, 2015
Consolidated Statements of Comprehensive Earnings for the Years Ended February 28, 2015March 4, 2017, March 1, 2014February 27, 2016 and March 2, 2013February 28, 2015
Consolidated Statements of Cash Flows for the Years Ended February 28, 2015March 4, 2017, March 1, 2014February 27, 2016 and March 2, 2013February 28, 2015
Consolidated Statements of Shareholders' Equity for the Years Ended February 28, 2015March 4, 2017, March 1, 2014February 27, 2016 and March 2, 2013February 28, 2015
Notes to Consolidated Financial Statements
| |
| 2. | Financial Statement Schedules - Valuation and Qualifying Accounts |
| | | (In thousands) | | Balance at Beginning of Period | Acquisitions | Charged to Costs and Expenses | Deductions from Reserves(1) | Other changes add (deduct)(2) | Balance at End of Period | Balance at Beginning of Period | | Acquisitions | | Charged to Costs and Expenses | | Deductions from Reserves(1) | | Other Changes(2) | | Balance at End of Period |
| Allowances for doubtful receivables | | | | | | | | | | | | | | | |
| For the year ended March 4, 2017 | | $ | 2,497 |
| | $ | 25 |
| | $ | (416 | ) | | $ | 579 |
| | $ | (32 | ) | | $ | 1,495 |
|
| For the year ended February 27, 2016 | | 3,242 |
| | — |
| | (197 | ) | | 493 |
| | (55 | ) | | 2,497 |
|
| For the year ended February 28, 2015 | | $ | 2,934 |
| $ | — |
| $ | 1,322 |
| $ | 969 |
| $ | (45 | ) | $ | 3,242 |
| 2,934 |
| | — |
| | 1,322 |
| | 969 |
| | (45 | ) | | 3,242 |
|
| For the year ended March 1, 2014 | | 2,493 |
| 832 |
| 408 |
| 721 |
| (78 | ) | 2,934 |
| |
| For the year ended March 2, 2013 | | 3,109 |
| — |
| (194 | ) | 383 |
| (39 | ) | 2,493 |
| |
(1) Net of recoveries
(2) Result of foreign currency effects
All other schedules for which provision is made in the applicable accounting regulations of the Securities and Exchange Commission have been omitted because they are not applicable or the required information is shown in the financial statements or notes thereto.
| |
| 3. | Exhibits - See Item (b) below. |
| |
a) | Exhibits marked with an asterisk (*) identify each management contract or compensatory plan or arrangement. Exhibits marked with a pound sign (#) are filed herewith. The remainder of the exhibits have heretofore been filed with the Securities and Exchange Commission and are incorporated herein by reference. |
|
| | |
Exhibit No. | | |
| 3.1 | | Restated Articles of Incorporation. Incorporated by reference to Exhibit 3.1 to Registrant's Annual Report on Form 10-K for the year-ended February 28, 2004. |
| 3.2 | | Amended and Restated Bylaws of Apogee Enterprises, Inc., as amended through January 24, 2006. Incorporated by reference to Exhibit 3.1 to Registrant's Current Report on Form 8-K filed on January 30, 2006. |
| 4.1 | | Specimen certificate for shares of common stock of Apogee Enterprises, Inc. Incorporated by reference to Exhibit 4.1 to Registrant's Annual Report on Form 10-K for the year ended March 3, 2012. |
| 10.1* | | 1997 Omnibus Stock Incentive Plan. Incorporated by reference to Exhibit A of Registrant's proxy statement for the 1997 Annual Meeting of Shareholders filed on May 16, 1997. |
|
| | |
10.2* | | Apogee Enterprises, Inc. Officers' Supplemental Executive Retirement Plan (2005 Restatement), First Amendment of Apogee Enterprises, Inc. Officers' Supplemental Executive Retirement Plan (2005 Restatement) and Second Amendment of Apogee Enterprises, Inc. Officers' Supplemental Executive Retirement Plan (2005 Restatement). Incorporated by reference to Exhibit 10.1 to Registrant's Current Report on Form 8-K filed on January 29, 2008. |
10.3*10.2* | | Third Amendment of Apogee Enterprises, Inc. Officers' Supplemental Executive Retirement Plan (2005 Restatement). Incorporated by reference to Exhibit 10.2 to Registrant's Current Report on Form 8-K filed on October 15, 2008. |
10.4*10.3* | | Apogee Enterprises, Inc. Deferred Compensation Plan for Non-Employee Directors (2014 Restatement). Incorporated by reference to Exhibit 4.4 to Registrant's Registration Statement on Form S-8 filed on July 24, 2014. |
10.5*10.4* | | Apogee Enterprises, Inc. Amended and Restated 2002 Omnibus Stock Incentive Plan. Incorporated by reference to Exhibit 10.1 to the Registrant's Current Report on Form 8-K filed on June 30, 2006. |
10.6*10.5* | | Apogee Enterprises, Inc. 2000 Employee Stock Purchase Plan (Amended and Restated Effective as of May 1, 2003). Incorporated by reference to Exhibit 10.234.4 to Registrant's Annual ReportRegistration Statement on Form 10-K for the year-ended February 28, 2004.S-8 filed on October 9, 2015. |
10.7*10.6* | | First Amendment of Apogee Enterprises, Inc. 2000 Employee Stock Purchase Plan (Amended and Restated Effective as of May 1, 2003). dated February 27, 2009. Incorporated by reference to Exhibit 10.54.5 to Registrant's Current ReportRegistration Statement on Form 8-KS-8 filed on March 4, 2009.October 9, 2015. |
10.8*10.7* | | Form of Stock Appreciation Rights Agreement under the Apogee Enterprises, Inc. 2002 Omnibus Stock Incentive Plan. Incorporated by reference to Exhibit 10.2 to Registrant's Current Report on Form 8-K filed on April 19, 2005. |
10.9*10.8* | | Apogee Enterprises, Inc. Non-Employee Director Charitable Matching Contribution Program. Incorporated by reference to Exhibit 10.25 to Registrant's Annual Report on Form 10-K for the year-ended February 26, 2005. |
10.10*10.9* | | Form of Non-Employee Director Stock Option Agreement under the Apogee Enterprises, Inc. 2002 Omnibus Stock Incentive Plan. Incorporated by reference to Exhibit 10.1 to Registrant's Current Report on Form 8-K filed on June 16, 2005. |
10.11*10.10* | | Apogee Enterprises, Inc. Deferred Incentive Compensation Plan (2005 Restatement). Incorporated by reference to Exhibit 10.3 to Registrant's Current Report on Form 8-K filed on October 17, 2006. |
10.12*10.11* | | First Amendment of Apogee Enterprises, Inc. Deferred Incentive Compensation Plan (2005 Restatement). Incorporated by reference to Exhibit 10.4 to Registrant's Current Report on Form 8-K filed on October 15, 2008. |
10.13*10.12* | | Second Amendment of Apogee Enterprises, Inc. Deferred Incentive Compensation Plan (2005 Restatement). Incorporated by reference to Exhibit 10.3 to Registrant's Current Report on Form 8-K filed on March 4, 2009. |
10.14*10.13* | | Third Amendment of Apogee Enterprises, Inc. Deferred Incentive Compensation Plan (2005 Restatement). Incorporated by reference to Exhibit 10.5 to Registrant's Current Report on Form 8-K filed on October 12, 2010. |
10.15*10.14* | | Fourth Amendment of Apogee Enterprises, Inc. Deferred Incentive Compensation Plan (2005 Restatement). Incorporated by reference to Exhibit 10.3 to Registrant's Quarterly Report on Form 10-Q filed on January 6, 2011. |
10.16*10.15* | | Apogee Enterprises, Inc. Partnership Plan (2005 Restatement). Incorporated by reference to Exhibit 10.5 to Registrant's Current Report on Form 8-K filed on October 17, 2006. |
10.17*10.16* | | First Amendment of Apogee Enterprises, Inc. Partnership Plan (2005 Restatement). Incorporated by reference to Exhibit 10.6 to Registrant's Current Report on Form 8-K filed on October 15, 2008. |
10.18*10.17* | | Second Amendment of Apogee Enterprises, Inc. Partnership Plan (2005 Restatement). Incorporated by reference to Exhibit 10.8 to Registrant's Current Report on Form 8-K filed on March 4, 2009. |
10.19* |
| | |
| 10.18* | | Third Amendment of Apogee Enterprises, Inc. Partnership Plan (2005 Restatement). Incorporated by reference to Exhibit 10.4 to Registrant's Quarterly Report on Form 10-Q filed on January 6, 2011. |
10.20*10.19* | | Apogee Enterprises, Inc. 2009 Stock Incentive Plan, as amended and restated (2011). Incorporated by reference to Exhibit 10.1 to Apogee'sRegistrant's Current Report on Form 8-K filed on June 28, 2011. |
10.21*10.20* | | Apogee Enterprises, Inc. 2009 Non-Employee Director Stock Incentive Plan, as amended and restated (2014). Incorporated by reference to Exhibit 4.4 to Registrant's Registration Statement on Form S-8 filed on July 24, 2014. |
10.22*10.21* | | Form of Restricted Stock Agreement under the Apogee Enterprises, Inc. 2009 Non-Employee Director Stock Incentive Plan. Incorporated by reference to Exhibit 10.3 to Registrant's Current Report on Form 8-K filed on June 30, 2009. |
| 10.22* | | Restricted Stock Deferral Program under the Apogee Enterprises, Inc. 2009 Non-Employee Director Stock Incentive Plan, as Amended and Restated (2014) (2015 Statement). Incorporated by reference to Exhibit 10.1 to Registrant's Current Report on Form 8-K filed on June 30, 2015. |
| 10.23* | | Form of Deferred Restricted Stock Unit Agreement under the Apogee Enterprises, Inc. 2009 Non-Employee Director Stock Incentive Plan, as Amended and Restated (2014) (2015 Statement). Incorporated by reference to Exhibit 10.2 to Registrant's Current Report on Form 8-K filed on June 30, 2015. |
| 10.24* | | Form of Restricted Stock Agreement under the Apogee Enterprises, Inc. 2009 Stock Incentive Plan as amended and restated (2011).for awards made on or after April 26, 2011. Incorporated by reference to Exhibit 10.3 to the Company’sRegistrant's Current Report on Form 8-K filed on May 2, 2011. |
|
| | |
10.24*10.25* | | Form of Performance Award Agreement under the Apogee Enterprises, Inc. 2009 Stock Incentive Plan, as amended and restated (2011). Incorporated by reference to Exhibit 10.3 to Registrant's Current Report on Form 8-K filed on May 5, 2014. |
10.25*10.26* | | Apogee Enterprises, Inc. 2011 Deferred Compensation Plan, effective January 1, 2011. Incorporated by reference to Exhibit 10.1 to Registrant's Current Report on Form 8-K filed on October 12, 2010. |
10.26*10.27* | | First Amendment effective June 25, 2014 to the Apogee Enterprises, Inc. 2011 Deferred Compensation Plan. Incorporated by reference to Exhibit 10.3 to the Registrant's Current Report on Form 8-K filed July 1, 2014. |
10.27*10.28* | | Second Amendment to the Apogee Enterprises, Inc. 2011 Deferred Compensation Plan. Incorporated herein by reference to Exhibit 10.2 to Registrant’s Current Report on Form 8-K filed on June 29, 2016. |
| 10.29* | | Form of Change in Control Severance Agreement between Apogee Enterprises, Inc. and certain senior executive officers of the Registrant.Agreement. Incorporated by reference to Exhibit 10.1 to Registrant's Current Report on Form 8-K filed on March 3, 2011. |
10.28*10.30* | | Employment Agreement between Apogee Enterprises, Inc. and Joseph F. Puishys, made and entered into as of August 5, 2011, to be effective as of August 22, 2011. Incorporated by reference to Exhibit 10.1 to Registrant's Current Report on Form 8-K filed on August 8, 2011. |
10.29*10.31* | | Form of Restricted Stock Agreement to be entered into by Apogee Enterprises, Inc. and Joseph F. Puishys on August 22, 2011. Incorporated by reference to Exhibit 10.2 to Registrant's Current Report on Form 8-K filed on August 8, 2011. |
10.30*10.32* | | Form of Option Agreement to be entered into by Apogee Enterprises, Inc. and Joseph F. Puishys on August 22, 2011. Incorporated by reference to Exhibit 10.3 to Registrant's Current Report on Form 8-K filed on August 8, 2011. |
10.31*10.33* | | Form of Bonus Pool Award Agreement under the Apogee Enterprises, Inc. 2012 Executive Management Incentive Plan. Incorporated by reference to Exhibit 10.1 to Registrant's Current Report on Form 8-K filed on May 5, 2014. |
10.32*10.34* | | Form of Performance Award Agreement under the Apogee Enterprises, Inc. 2009 Stock Incentive Plan, as amended and restated (2011). Incorporated by reference to Exhibit 10.2 to Registrant's Current Report on Form 8-K filed on May 2, 2012. |
10.33*10.35* | | Apogee Enterprises, Inc. 2012 Executive Management Incentive Plan. Incorporated by reference to Exhibit 10.1 to Registrant's Current Report on Form 8-K filed on June 27, 2012. |
10.34*10.36* | | Form of Retention Incentive Agreement under the Apogee Enterprises, Inc. 2009 Stock Incentive Plan, as amended and restated (2011). Incorporated by reference to Exhibit 10.1 to the Registrant's Current Report on Form 8-K filed July 1, 2014. |
10.35*10.37* | | Form of CEO Performance-Based Retention Incentive Agreement under the Apogee Enterprises, Inc. 2009 Stock Incentive Plan, as amended and restated (2011). Incorporated herein by reference to Exhibit 10.5 to Registrant’s Current Report on Form 8-K filed on April 27, 2016. |
| 10.38* | | Form of Evaluation-Based Retention Agreement under the Apogee Enterprises, Inc. 2012 Executive Management Incentive Plan. Incorporated by reference to Exhibit 10.2 to the Registrant's Current Report on Form 8-K filed July 1, 2014. |
10.3610.39* | | Amended and Restated CreditForm of CEO Evaluation-Based Retention Incentive Agreement dated as of October 19, 2012, by and amongunder the Apogee Enterprises, Inc., as the Borrower, the Lenders referred to 2012 Executive Management Incentive Plan. Incorporated herein Wells Fargo Bank, National Association, as Administrative Agent, Swingline Lender and Issuing Lender, and Comerica Bank, as Documentation Agent and Issuing Lender. Incorporated by reference to Exhibit 10.110.3 to Registrant'sRegistrant’s Current Report on Form 8-K filed on October 25, 2012.May 6, 2015. |
|
10.37 | | |
| 10.40* | | Amendment No. 1 to Amended and Restated Credit Agreement, dated as of November 20, 2013, by and among Apogee Enterprises, Inc., as 2016 Executive Management Incentive Plan. Incorporated herein by reference to Exhibit 10.1 to the Borrower, the Lenders (as defined therein), and Wells Fargo Bank, National Association, as Administrative Agent.Registrant’s Current Report on Form 8-K filed on June 29, 2016. |
| 10.41* | | First Amendment to Apogee Enterprises, Inc. 2016 Executive Management Incentive Plan. Incorporated herein by reference to Exhibit 10.1 to Registrant’s Current Report on Form 8-K8-K/A filed on November 25, 2013.August 10, 2016. |
10.38 | | Amendment No. 2 to Amended and Restated Credit Agreement, dated as of December 17, 2014, by and among Apogee Enterprises, Inc., as the Borrower, the Lenders referred to therein, Wells Fargo Bank, National Association, as Administrative Agent. Incorporated herein by reference to Exhibit 10.1 to Registrant's Current Report on Form 8-K filed on December 23, 2014. |
10.3910.42 | | Share Purchase Agreement, dated November 5, 2013, between 2393514 Ontario Inc., Apogee Enterprises, Inc., PEF 2005 Alumicor Investment Limited Partnership, on behalf of itself and as sellers’ agent,Sellers’ Agent, Andre Belanger, Ken Rowson, John Castelhano, Anthony Kerwin, Lawrence Maker, Paul Antoniadis, and Alumicor Limited. Incorporated by reference to Exhibit 2.1 to Registrant’s Current Report on Form 8-K filed on November 5, 2013. |
18#10.43 | | Letter Re: Change in Accounting PrincipleSecond Amended and Restated Credit Agreement, dated November 2, 2016, by and among Apogee Enterprises, Inc., as the Borrower, the Lenders referred to therein, Wells Fargo Bank, National Association, as Administrative Agent, Swing Line Lender and Issuing Lender, and U.S. Bank National Association, as Syndication Agent and Issuing Lender. Incorporated herein by reference to Exhibit 10.1 to Registrant’s Current Report on Form 8-K filed on November 4, 2016. |
| 10.44 | | Asset Purchase Agreement between Sotawall, Inc., Juan A. Speck and WPP Acquisition Corporation, dated December 14, 2016. Incorporated herein by reference to Exhibit 10.1 to Registrant’s Current Report on Form 8-K filed on December 20, 2016. |
| 10.45* | | Apogee Enterprises, Inc. 401(k) Retirement Plan, effective January 1, 2015. Incorporated by reference to Exhibit 4.4 to Registrant's Registration Statement on Form S-8 filed October 9, 2015. |
| 21# | | Subsidiaries of the Registrant. |
| 23# | | Consent of Deloitte & Touche LLP. |
| 31.1# | | Certification of Chief Executive Officer pursuant to rule 13a-14(a) under the Securities Exchange Act of 1934. |
| 31.2# | | Certification of Chief Financial Officer pursuant to rule 13a-14(a) under the Securities Exchange Act of 1934. |
|
| | |
| 32.1# | | Certification of Chief Executive Officer pursuant to 18 U.S.C. Section 1350, as adopted pursuant to Section 906 of the Sarbanes-Oxley Act of 2002. |
| 32.2# | | Certification of Chief Financial Officer pursuant to 18 U.S.C. Section 1350, as adopted pursuant to Section 906 of the Sarbanes-Oxley Act of 2002. |
| 101 | | The following materials from Apogee Enterprises, Inc.'s Annual Report on Form 10-K for the year ended February 28, 2015March 4, 2017 are furnished herewith, formatted in XBRL (Extensible Business Reporting Language): (i) the Consolidated Balance Sheets as of March 4, 2017 and February 28, 2015 and March 1, 2014,27, 2016, (ii) the Consolidated Results of Operations for the three years ended March 4, 2017, February 27, 2016 and February 28, 2015, March 1, 2014 and March 2, 2013, (iii) the Consolidated Statements of Comprehensive Earnings for the three years ended March 4, 2017, February 27, 2016 and February 28, 2015, March 1, 2014 and March 2, 2013, (iv) the Consolidated Statements of Cash Flows for the three years ended March 4, 2017, February 27, 2016 and February 28, 2015, March 1, 2104 and March 2, 2013, (v) the Consolidated Statements of Shareholders' Equity for the years ended March 4, 2017, February 27, 2016 and February 28, 2015 March 1, 2014 and March 2, 2013 and (vi) the Notes to Consolidated Financial Statements. |
ITEM 16. FORM 10-K SUMMARY
None.
SIGNATURES
Pursuant to the requirements of Section 13 or 15(d) of the Securities Exchange Act of 1934, the registrant has duly caused this report to be signed on its behalf by the undersigned, thereunto duly authorized, on the date set forth below.April 28, 2017.
|
| | |
| APOGEE ENTERPRISES, INC. | | |
| | |
| /s/ Joseph F. Puishys | | April 24, 2015 |
| Joseph F. Puishys | | Date |
| President and Chief Executive Officer | | |
Pursuant to the requirements of the Securities Exchange Act of 1934, this report has been signed below by the following persons on behalf of the registrant and in the capacities indicated on the dates set forth below.April 28, 2017.
|
| | | | | | | | | | |
| Signature | | Date | | Title | | Signature | | Date | | Title |
| /s/ Joseph F. Puishys | | April 24, 2015 | | President, CEO and | | /s/ James S. Porter | | April 24, 2015 | | CFO (PrincipalExecutive Vice |
| Joseph F. Puishys | | | | CEO and Director
(Principal Executive Officer) | | James S. Porter | | | | President and CFO (Principal Financial and Accounting Officer) |
| | | | | | | | | | |
| /s/ Bernard P. Aldrich | | April 24, 2015 | | Chairman | | /s/ Robert J. Marzec | | April 24, 2015 | | Director |
| Bernard P. Aldrich | | | | | | Robert J. Marzec | | | | |
| | | | | | | | | | |
| /s/ Jerome L. Davis | | April 29, 2015 | | Director | | /s/ Donald A. Nolan | | April 29, 2015 | | Director |
| Jerome L. Davis | | | | | | Donald A. Nolan | | | | |
| | | | | | | | | | |
| /s/ Sara L. Hays | | April 29, 2015 | | Director | | /s/ Richard V. Reynolds | | April 28, 2015 | | Director |
| Sara L. Hays | | | | | | Richard V. Reynolds | | | | |
| | | | | | | | | | |
| /s/ John T. Manning | | April 24, 2015 | Director | | /s/ Patricia K. Wagner | | | Director |
| John T. Manning | | | | | Patricia K. Wagner | | | |
| | | | | | | | |
| | | | | /s/ David E. Weiss | | April 29, 2015 | | Director |
John T. Manning | | | | | | David E. Weiss | | | | |