As part of the Company’s business strategy, it sometimes engages in discussions with third parties regarding possible investments, acquisitions, strategic alliances, joint ventures, divestitures and outsourcing transactions (‘‘extraordinary transactions’’) and enters into agreements relating to such extraordinary transactions in order to further our business objectives. In order to pursue this strategy successfully, the Company must identify suitable candidates for and successfully complete extraordinary transactions, some of which may be large and complex, and manage post-closing issues such as the integration of acquired companies or employees. Integration and other risks of extraordinary transactions can be more pronounced for larger and more complicated transactions, or if multiple transactions are pursued simultaneously. If the Company fails to identify and complete successfully extraordinary transactions that further its strategic objectives, it may be required to expend resources to develop products and technology internally, it may be at a competitive disadvantage or it may be adversely affected by negative market perceptions, any of which may have a material adverse effect on the Company’s revenue, gross margin and profitability. Integration issues are complex, time-consuming and expensive and, without proper planning and implementation, could significantly disrupt the Company’s business. The challenges involved in integration include:
combining product offerings and entering into new markets in which the Company is not experienced;
convincing customers and distributors that the transaction will not diminish client service standards or business focus, preventing customers and distributors from deferring purchasing decisions or switching to other suppliers (which could result in our incurring additional obligations in order to address customer uncertainty), and coordinating sales, marketing and distribution efforts;
9
minimizing the diversion of management attention from ongoing business concerns;
persuading employees that business cultures are compatible, maintaining employee morale and retaining key employees, engaging with employee works councils representing an acquired company’s non-U.S. employees, integrating employees into the Company, correctly estimating employee benefit costs and implementing restructuring programs;
coordinating and combining administrative, manufacturing, and other operations, subsidiaries, facilities and relationships with third parties in accordance with local laws and other obligations while maintaining adequate standards, controls and procedures;
• achieving savings from supply chain integration; and
managing integration issues shortly after or pending the completion of other independent transactions.
The Company periodically evaluates and enters into significant extraordinary transactions on an ongoing basis. The Company may not fully realize all of the anticipated benefits of any
extraordinary transaction, and the timeframe for achieving benefits of an extraordinary transaction may depend partially upon the actions of employees, suppliers or other third parties. In addition, the pricing and other terms of the Company’s contracts for extraordinary transactions require it to make estimates and assumptions at the time it enters into these contracts, and, during the course of its due diligence, the Company may not identify all of the factors necessary to estimate its costs accurately. Any increased or unexpected costs, unanticipated delays or failure to achieve contractual obligations could make these agreements less profitable or unprofitable. Managing extraordinary transactions requires varying levels of management resources, which may divert the Company’s attention from other business operations. These extraordinary transactions also have resulted and in the future may result in significant costs and expenses and charges to earnings. Moreover, the Company has incurred and will incur additional depreciation and amortization expense over the useful lives of certain assets acquired in connection with extraordinary transactions, and, to the extent that the value of goodwill or intangible assets with indefinite lives acquired in connection with an extraordinary transaction becomes impaired, the Company may be required to incur additional material charges relating to the impairment of those assets. In order to complete an acquisition, the Company may issue common stock, potentially creating dilution for existing stockholders, or borrow, affecting the Company’s financial condition and potentially its credit ratings. Any prior or future downgrades in the Company’s credit rating associated with an acquisition could adversely affect its ability to borrow and result in more restrictive borrowing terms. In addition, the Company’s effective tax rate on an ongoing basis is uncertain, and extraordinary transactions could impact its effective tax rate. The Company also may experience risks relating to the challenges and costs of closing an extraordinary transaction and the risk that an announced extraordinary transaction may not
10
close. As a result, any completed, pending or future transactions may contribute to financial results that differ from the investment community’s expectations in a given quarter.
ITEM 1B. Unresolved Staff Comments.
None
ITEM 2. Properties.
United States Specialty Products Facility
South Hampton owns and operates a specialty petrochemical facility near Silsbee, Texas which is approximately 30 miles north of Beaumont, Texas, and 90 miles east of Houston. The facility presently consists of six operating units which, while interconnected, make distinct products through differing processes: (i) a Penhex Unit; (ii) a Reformer; (iii) a Cyclo-pentane Unit; (iv) an Aromax® Unit; (v) an Aromatics Hydrogenation Unit; and (vi) a White Oil Fractionation Unit. All of these units are currently in operation.
The Penhex Unit processeshas the capacity to process approximately 3,0006,700 barrels per day of fresh feed, with the Reforming Unit, the Aromax® Unit, and the Cyclo-Pentane Unit further processing streams produced by the Penhex Unit. The Aromatics Hydrogenation Unit has a capacity of approximately 400 barrels per day, and the White Oils Fractionation Unit has a capacity of approximately 3,000 barrels per day. The facility generally consists of equipment commonly found in most petroleum facilities such as fractionation towers and hydrogen treaters except the facility is adapted to produce specialized products that are high purity, very consistent, precise specification materials utilized in the petrochemical industry as solvents, additives, blowing agents and cooling agents. South Hampton
produces eight distinct product streams and markets several combinations of blends as needed in various customers’ applications. South Hampton does not produce motor fuel products or any other commodity type products commonly sold directly to retail consumers or outlets.
The products from the Penhex Unit, Reformer, Aromax® Unit, and Cyclo-pentane Unit are marketed directly to the customer by South Hampton marketing personnel. The Penhex Unit had a utilization rate during 20072008 of approximately 91%90%. This compares to a rate of 87%91% for 2006.2007. The Reformer and Aromax® units are operated as needed to support the Penhex and Cyclo-pentane Units. Consequently, utilization rates of these units are driven by production from the Penhex Unit. Operating utilization rates are affected by product demand, mechanical integrity, and unforeseen natural occurrences, such as weather events. The nature of the refining process demands periodic shut-downs for de-coking and other mechanical repairs. In 2007 there were mechanical shut-downs resulting in approximately 12 total days of lost production and another 6 days due to weather or other uncontrollable issues. If these items are considered,The Penhex Unit capacity was expanded in 2008 and now is configured in two independent process units. Since the marketing effort may take several years to utilize the expanded capacity, utilization would have been approximately 96%rates of capacity. In 2006, the comparable figures were 15unit could be significantly lower over the next few years. However, the volume of material available for sale will be much improved as the original PenHex Unit was operating near capacity for the last several years. The two unit configuration also improves reliability by reducing the amount of total down time due to mechanical related, 6 weather related, and 93% utilization. In 2005 the adjusted utilization rate would have been 96%other factors.
The other two operating units at the plant site, an Aromatics Hydrogenation Unit and a White Oils Fractionation Unit, are operated as two, independent and completely segregated processes. These units are dedicated to the needs of two different toll processing customers. The customers supply
11
and maintain title to the feedstock, South Hampton processes the feedstock into products based upon customer specifications, and the customers market the products. Products may be sold directly from South Hampton’s storage tanks or transported to the customers’ location for storage and marketing. As of October 2005, after the expansion program, the units have a combined capacity of 3,400 BPD. Together they realized a utilization rate 48% for 2006 and 58% for 2007.2007 and 43% for 2008. The units are operated in accordance with customer needs, and the contracts call for take or pay minimums of production.
In March 2007 the Board of Directors approved the expansion of the South Hampton Penhex unit. The total cost of the project will be approximately $12.0 million and the capacity willwas to be increased from 3,000 barrels per day to approximately 6,000 barrels per day. The Company immediately began acquiring equipment and ordering items, such as instrumentation, pumps, and compressors which require a long lead time for delivery. The project consists of an additional fractionation train identical to the current design, and will also entailentailed the expansion of the Aromax, reformer, and Cyclo-pentane units to support the increased volumes. Construction work began in the fall of 2007, with the initial focus being the infrastructure required to support the increased operation, such as
pipe racks, electrical capacity increases, fire water line extensions, water well modifications, etc. The final permit to construct was received from the TCEQ on February 28, 2008, and foundation work for the primary equipment started on that date. Final completion is expected to be towardswas in September 2008 and the endnew unit was in total operation in October 2008. The final cost of the second quarterexpansion was approximately $18.0 million and trial runs in October of 2008 which is approximately two months later than originally projected dueset the new capacity at 3,700 barrels per day in addition to delays in the permitting process.3,000 barrels per day with existing equipment. For additional information see Note 7 to the Consolidated Financial Statements.
South Hampton, in support of the petrochemical operation, owns approximately 69 storage tanks with total capacity approaching 225,000 barrels, and 106 acres of land at the plant site, 55 acres of which are developed. South Hampton also owns a truck and railroad loading terminal consisting of storage tanks, four rail spurs, and truck and tank car loading facilities on approximately 53 acres of which 13 acres are developed.
As a result of various expansion programs and the toll processing contracts, essentially all of the standing equipment at South Hampton is operational. South Hampton has various surplus equipment stored on-site which may be used in the future to assemble additional processing units as needs arise.
Gulf State owns and operates three (3) 8-inch diameter pipelines aggregating approximately 50 miles in length connecting South Hampton’s facility to: (1) a natural gas line, (2) South Hampton’s truck and rail loading terminal and (3) a major petroleum products pipeline system owned by an unaffiliated third party. All pipelines are operated within Texas Railroad Commission and DOT regulations for maintenance and integrity.
12
Saudi Arabia Mining Properties
Al Masane Project
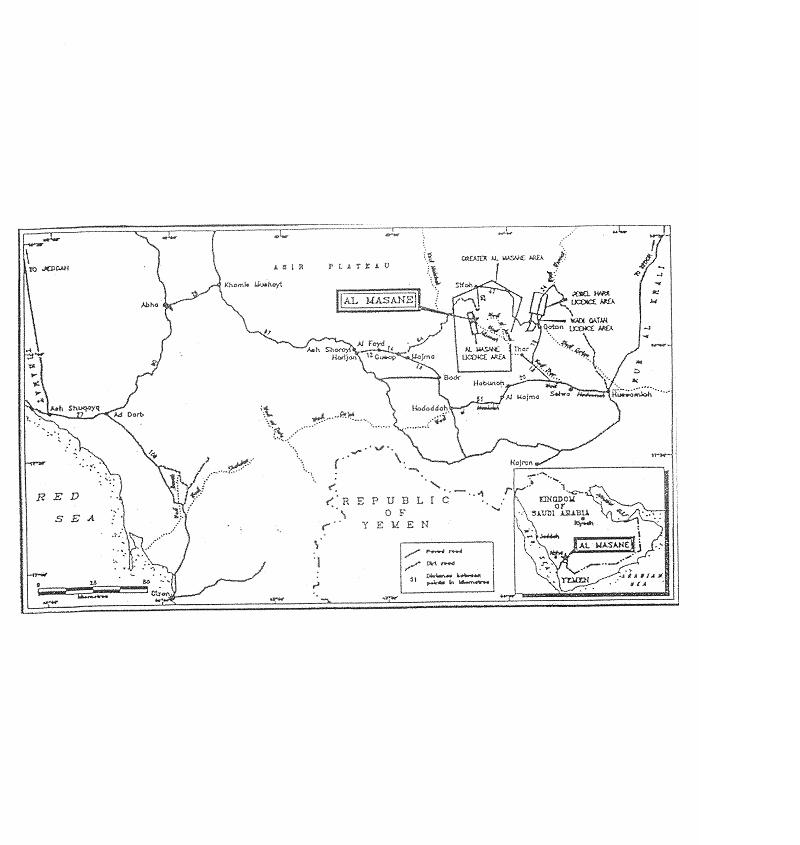
Location, Access and Transportation. The Company’s Al Masane project, consistscontributed to AMAK in December 2008, consisted of a mining lease area of approximately 44 square kilometers in southwestern Saudi Arabia approximately 640 km southeast of Jeddah. Reference is made to the map on page 20 of this Report for information concerning the location of the Al Masane project. Presently, the site can be accessed by heavy trucks via the 20 kilometer improved asphalt and gravel road from Sifah. The elevation of the Al Masane project is
approximately 1,620 meters above sea level. Najran is the major town located in the area and is serviced by air from Jeddah and Riyadh. Access from the town of Najran to the project site is 130 km by a paved road to which continues to Sifah. There are scheduled flights from Jeddah to Abha and Najran. From the west, there is paved road between Abha and Gusap, and then a dirt road to the site.
Conditions to Retain Title. The Saudi government granted the Company a mining lease for the Al Masane area on May 22, 1993. The lease was contributed to AMAK in December 2008. As holder of the Al Masane mining lease, the Company ishas been, until December 2008, solely responsible to the Saudi Arabian government for rental payments and other obligations required by the mining lease and repayment of an $11 million loan. The Company’s interpretation of the mining lease, and verified by the Ministry of Petroleum and Minerals in it’s Letter of Approval for the transfer, is that repayment of this loan will be made in accordance with a repayment schedule to be agreed upon with the Saudi Arabian government from the Company’s share of the project’s cash flows. The initial term of the lease is for a period of thirty (30) years beginning May 22, 1993, with the Company (now AMAK) having the option to renew or extend the term of the lease for additional periods not to exceed twenty (20) years. Under the lease, the Company (now AMAK) is obligated to pay advance surface rental in the amount of 10,000 Saudi riyals (approximately $2,667 at the current exchange rate) per square kilometer per year (approximately $117,350 annually) during the period of the lease. The Company in accordance with the agreement with the Ministry, paid $266,000 of the back payments on January 3, 2005, and the remaining $320,000 on December 27, 2005. Additionally, the Company paid $234,700 in March 2006, $117,300 in February 2007, and $117,300 in February 2008 which payspaid the lease amounts in full through the end of 2008. AMAK paid the lease fee in January 2009. In addition, the Company (now AMAK) must pay income tax in accordance with the laws of Saudi Arabia then in force and pay all infrastructure costs. The Saudi Arabian Mining Code provides that income tax is to be paid yearly at the rate of 20% commencing immediately upon realization of profits. The lease gives the Saudi Arabian government priority to purchase any gold production from the project as well as the right to purchase up to 10% of the annual production of other minerals on the same terms and conditions then available to other similar buyers and at current prices then prevailing in the free market. Furthermore, the lease contains provisions requiring that preferences be given to Saudi Arabian suppliers and contractors, that the Company employ Saudi Arabian citizens and provide training to Saudi Arabian personnel.
History of Previous Operations. The Al Masane project contains extensive ancient mineral workings and smelters which were discovered by Hatem El Khalidi, President and CEO of the Company while flying over the area and later mapped by him on camel back during 1967. From ancient inscriptions in the area, it is believed that mining activities occurred sporadically from 1000 BC to 700 AD. The ancients are believed to have extracted mainly gold, silver and copper. Various regional investigations of the Al Masane area were carried out by the United States Geological Survey (USGS) mission. The first systematic mapping was by Brown and Jackson who published the Geologic Map of the Asir Quadrangle in 1959, and Greenwood carried out
13
reconnaissance mapping in 1974 of the Wadi Malahah quadrangle, which includes Al Masane. Conway undertook geologic mapping of the area in 1976. Beginning in 1972, the Company undertook various geological, geophysical, and geochemical surveys which lead to the discovery of the ore lenses. In 1975, Robertson Research International (“RRI”) reviewed the exploration program completed by the Company, prepared a preliminary economic evaluation on the deposit and recommended ongoing development. In 1977, the Company retained Watts, Griffis and McOuat Limited of Toronto, Canada (WGM) to study the deposits and an underground development program was recommended to define the tonnage and grade of the deposit. By September 1980 a permanent exploration camp including water supply and power plant was
established. In April 1981 WGM completed a program of 3,700 meters of underground access and development using trackless mining equipment and 25,000 meters of underground diamond drilling and 20,000 meters of surface drilling (“Phase I”). Bulk underground metallurgical samples were taken, and pilot plant test work was conducted at the Colorado School of Mines Research to confirm the laboratory test work completed previously by Lakefield Research in Canada on the drill core. This work was financed primarily with the 1984 $11 million interest-free loan from the Saudi Arabian Ministry of Finance. Continued surface prospecting in the immediate area by the Company led to the discovery of the Moyeath zone in late 1980. Although the surface expression of the gossans1 was small, preliminary diamond drilling indicated a significant massive sulphide deposit at depth. Between 1982 and 1987, infill diamond drilling was conducted on the Al Houra and Moyeath deposits which expanded the ore reserves. In addition, a number of studies relating to water supply for the project were completed. Environmental studies for the project were completed by independent consultants in 1995 as part of the bankable feasibility studies.
Description of Current Property Condition. In 1982 WGM concluded that sufficient ore reserves were established to justify completion of a fully bankable feasibility study to determine the economic potential of establishing a commercial mining and ore treatment operation at Al Masane. WGM determined that the Al Masane deposits would support commercial production of copper, zinc, gold and silver and recommended implementation of Phase II of the Al Masane development program, which included construction of underground mining, ore treatment and support facilities. WGM’s September 1984 reevaluation of the project resulted in no substantial changes of its initial conclusions and recommendations. In 1993, the Company commissioned WGM to prepare a new fully bankable feasibility study to be used to obtain financing for commercial development of the project. The study, which was completed in 1994, contained specific recommendations to insure that project construction was accomplished expeditiously and economically. The engineering design and costing portions of the study were performed by Davy International of Toronto, Canada (“Davy”). WGM and Davy updated this study in 1996. WGM recommended that the Al Masane reserves be mined by underground methods using trackless mining equipment. Once the raw ore is mined, it would be subjected to a grinding and treating process resulting in three products to be delivered to smelters for further refining. These products are zinc concentrate, copper concentrate and Dore2 bullion. The copper and zinc concentrates also contain valuable amounts of gold and silver. These concentrates and the Dore bullion to be produced from the proposed cyanidization plant are estimated to be 22,000 ounces of gold and 800,000 ounces of silver and will be sold to copper and zinc custom smelters and refineries worldwide. After the smelter refining process, the metals could be sold by the Company or the smelter for the Company’s account in the open market. As recommended by WGM, the source
| 1 | “Gossan” means the rust colored oxidized, capping or staining of a mineral deposit, generally formed by the oxidation or alteration of iron sulphide. |
| 2 | “Dore” means unrefined gold and silver bullion bars consisting of approximately 90% precious metals which will be further refined to almost pure metal. |
14
of power for the Al Masane site will be from diesel powered generators until such time as the site is connected to the national power grid, which is presently 20 km from the site.
In the 1994 feasibility study, WGM stated that there is potential to find more reserves within the lease area, as the ore zones are all open at depth. Further diamond drilling is required to quantify the additional mineralization associated with these zones. A significant feature of the Al Masane ore zones is that they tend to have a much greater vertical plunge than strike length; relatively
small surface exposures such as the Moyeath zone may be developed into sizeable ore tonnages by thorough and systematic exploration. Similarly, systematic prospecting of the small gossans in the area could yield significant tonnages of new ore. The 1996 update showed the estimated capital cost to bring the project into operation to be $89 million. At a production rate of 700,000 tons per year, the operating cost of the project (excluding concentrate freight, ship loading, smelter charges, depreciation, interest and taxes) was estimated to be $38.49 per ton of ore milled. The feasibility study was updated in August of 2005, by SNC-Lavalin, Engineers and Constructors, Inc. of Toronto, Canada using the field work and conclusions of the previous studies. No design work or field work was performed, but the update was designed to apply current costs and metal prices to the existing work. The 2005 update indicates the current capital cost to be approximately $116 million with an additional $7 million needed for the addition of a Gold Recovery Circuit (GRC). The updated operating costs are estimated to be $53.37 per ton of ore milled, without the GRC, or $60.01 with the GRC.
Metal prices were at record lows worldwide during 2003, and therefore, numerous mining projects were not economically feasible. As prices have recovered forduring the 2005-20072006-2008 time period, the project becomesbecame economically viable. IfDespite the drop in metal prices over the last 3-4 months of 2008, if spot prices as of December 28, 2007,2008, are used in the analysis, or even the ten year average of prices is used, the project becomes veryremains economically attractive. Mining economics, as with other capital intensive extractive industries such as offshore petroleum exploration, will vary over time as market prices rise and fall with worldwide economic performance.
The following chart illustrates the change from the previous three year average to current levels:
| Average Price | Spot Price as of | Percentage | |||||
| For | 12/ | 31/08 | Increase (Decrease) | ||||
| Gold | $ | $ | % | ||||
| Silver | $ | $ | %) | ||||
| Copper | $ | $ | ( | %) | |||
| Zinc | $ | $ | ( | %) | |||
Pursuant to the mining lease agreement, when the Al Masane project is profitable the Company was obligated to form a Saudi public stock company with the Saudi Arabian Mining Company, a corporation wholly owned by the Saudi Arabian government (“Ma’aden”), as successor to and
15
assignee of the mining interests formerly held by the Petroleum Mineral Organization (“Petromin”). Ma’aden is the Saudi Arabian government’s official mining company. In 1994, the Company received instructions from the Saudi Ministry of Petroleum and Mineral Resources stating that it is possible for the Company to form a Saudi company without Petromin (now Ma’aden), but the sale of stock to the Saudi public could not occur until the mine’s commercial operations were profitable for at least two years. The instructions added that Petromin (now Ma’aden) still had the right to purchase shares in the Saudi joint stock company any time it desires. Title to the mining lease and the other obligations specified in the mining lease would be transferred to the Saudi joint stock company. According to the terms of the lease agreement the
Company would remain responsible for repaying the $11 million loan to the Saudi Arabian government. However, as a condition of approval for transferring the Company believes that ultimate resolution oflease to AMAK in late 2008, the Ministry required the note mayto be opentransferred to negotiation and intends to approach the subject with the Ministrybooks of the Treasury at the appropriate time.AMAK.
The Company and eight Saudi investors formed a Saudi joint stock company under the name Al Masane Al Kobra Mining Company (ALAK)(AMAK) and received a commercial license from the Ministry of Commerce in January 2008. TheIn December 2008 the Company's mining lease will bewas transferred to ALAKAMAK and ALAK will buildAMAK is constructing the mining and treatment facilities, and will operate the mine. The basic terms of agreement forming ALAKAMAK are as follows: (1) the capitalization will beis the amount necessary to develop the project, approximately $120 million, (2) the Company will ownowns 50% of ALAKAMAK with the remainder being held by the Saudi investors, (3) the Company will contributehas contributed the mining assets and mining lease for a credit of $60 million and the Saudi investors have contributed $60 million cash, and (4) the remaining capital for the project will be raised by ALAKAMAK by other means which may include application for a loan from the Saudi Industrial Development Fund, loans from private banks, and/or the inclusion of other investors. ALAKThe appraisal of the assets, which is necessary for the Company to receive full credit toward its capital contribution is underway and is expected to be completed in April 2009. AMAK will have all powers of administration over the Al Masane mining project. Subsequent to the above agreement, the cash contribution was deposited in the accounts for ALAKAMAK in September and October of 2007. The Company has four directors representing its interests on an eight person board of directors with the Chairman of ALAKAMAK chosen from the directors representing the Saudi investors. The original documents are in Arabic, and English translations have been provided to the parties.
The Saudi Government published and implementedBoard meetings are conducted in English for the new Mining Code on October 22, 2004 which contains several provisions the Company believes beneficial, not the leastbenefit of which is a reduction of taxes on profits from 45% to 20%.all attendees.
Rock Formations and Mineralization. Three mineralized zones, the Saadah, Al Houra and Moyeath, have been outlined by diamond drilling. The Saadah and Al Houra zones occur in a volcanic sequence that consists of two mafic-felsic sequences with interbedded exhalative cherts and metasedimentary rocks. The Moyeath zone was discovered after the completion of underground development in 1980. It is located along an angular unconformity with underlying felsic volcanics and shales. The principle sulphide minerals in all of the zones are pyrite, sphalerite, and chalcopyrite. The precious metals occur chiefly in tetrahedrite and as tellurides and electrum. The following table sets forth a summary of the diluted recoverable, proven and probable mineralized materials at the Al Masane project, along with the estimated average grades of these mineralized materials:
16
| Zone | Mineralized Materials (Tonnes) | Copper (%) | Zinc (%) | Gold (g/t) | Silver (g/t) | |||||||||||||||
| Saadah | 3,872,400 | 1.67 | 4.73 | 1.00 | 28.36 | |||||||||||||||
| Al Houra | 2,465,230 | 1.22 | 4.95 | 1.46 | 50.06 | |||||||||||||||
| Moyeath | 874,370 | 0.88 | 8.92 | 1.29 | 64.85 | |||||||||||||||
Total | 7,212,000 | 1.42 | 5.31 | 1.19 | 40.20 | |||||||||||||||
For purposes of calculating proven and probable mineralized materials, a dilution of 5% at zero grade on the Saadah zone and 15% at zero grade on the Al Houra and Moyeath zones was
assumed. A mining recovery of 80% was used for the Saadah zone and 88% for the Al Houra and Moyeath zones. Mining dilution is the amount of wallrack adjacent to the ore body that is included in the ore extraction process.
Proven mineralized materials are those mineral deposits for which quantity is computed from dimensions revealed in outcrops, trenches, workings or drill holes, and grade is computed from results of detailed sampling. For ore deposits to be proven the sites for inspection, sampling and measurement must be spaced so closely and the geologic character must be so well defined that the size, shape, depth and mineral content of reserves are well established. Probable mineralized materials are those for which quantity and grade are computed from information similar to that used for proven mineralized materials, but the sites for inspection, sampling and measurement are farther apart or are otherwise less adequately spaced. However, the degree of assurance, although lower than that for proven mineralized materials, must be high enough to assume continuity between points of observation.
The metallurgical studies conducted on the ore samples taken from the zones indicated that 87.7% of the copper and 82.6% of the zinc could be recovered in copper and zinc concentrates. Overall, gold and silver recovery from the ore was estimated to be 77.3% and 81.3%, respectively, partly into copper concentrate and partly as bullion through cyanide processing of zinc concentrates and mine tailings. Further studies recommended by consultants may improve those recoveries and thus the potential profitability of the project; however, there can be no assurances of this effect. WGM was contracted by AMAK to recalculate the reserves using the latest methods and technology. The results are not expected to appreciably change the economics of the project.
Other Exploration Areas in Saudi Arabia
During the course of its exploration and development work in the Al Masane area, the Company has carried on exploration work in other areas in Saudi Arabia. This work was contributed to AMAK in December 2008.
Wadi Qatan and Jebel Harr. The Wadi Qatan area is located in southwestern Saudi Arabia. Jebel Harr is north of Wadi Qatan. Both areas are approximately 30 kilometers east of the Al Masane area. These areas consist of 40 square kilometers, plus a northern extension of an additional 13 square kilometers. The Company’s geological, geophysical and limited core drilling in the past disclosed the existence of massive sulfides containing an average of 1.2% nickel. Reserves for these areas have not yet been classified and additional exploration work is required. When the Companyand if AMAK obtains an exploration license for the Wadi Qatan and Jebel Harr areas, the Company intends toAMAK may continue itsthe exploratory drilling program initiated by the Company in order to prove whether
17
sufficient ore reserves exist to justify a viable mining operation; however there is no assurance that a viable mining operation can be established.
Greater Al Masane. On June 22, 1999, the Company submitted a formal application for a five-year exclusive mineral exploration license for the Greater Al Masane area of approximately 2,850 square kilometers, which surrounds the Al Masane mining lease area and includes the Wadi Qatan and Jebel Harr areas. The Company previously worked in the Greater Al Masane area after obtaining written authorization from the Saudi Ministry of Petroleum and Mineral Resources, and has expended over $2 million on exploration work. Geophysical, geochemical and geological work and diamond core drilling on the Greater Al Masane area reveals mineralization similar to that discovered at Al Masane. A detailed exploration program and expenditures budget accompanied the application. The Company indicated on its application that it would welcome the participation of Ma’aden in this license. Ma’aden, which expressed an interest in the Greater Al Masane area, was informed directly by the Company that its participation as a joint venture partner in the license would be welcomed.
As previously stated, neither AMAK nor the Company does not possess current formal exploration licenses for any of the above areas. The absence of such licenses creates uncertainty regarding AMAK’s and the Company’s rights and obligations, if any, in these areas. The Company believes it has satisfied the Saudi Arabian government’s requirements in these areas and that the government should honor the Company’s (now AMAK’s) claims.
The new Mining Code, adopted by the Saudi government in October, 2004, specifies that the size of an exploration license cannot exceed one hundred (100) square kilometers. However, there is no restriction on how many exploration licenses can be held by one party simultaneously. The CompanyAMAK is in the process of identifying the best areas of the previously explored Greater Al Masane Area and intends to re-applyArea. AMAK submitted application for those individually.exploration licenses for two of the areas in question in late 2008. The applications were rejected and will be submitted per the Mining Code by ALAK.resubmitted with additional information in early 2009.
Reference is made to the map on page 20 of this Report for information concerning the location of the foregoing areas.
United States Mineral Interests
The Company’s only mineral interest in the United States is its ownership interest in Pioche. Pioche has been inactive for many years.
Nevada Mining Properties. Pioche’s properties include 48 patented and 5 unpatented claims totaling approximately 1,500 acres. All the claims are located in the Pioche Mining District, Lincoln County, Nevada. There are prospects and mines on these claims that previously produced silver, gold, lead, zinc and copper. The ore bodies are both oxidized and sulfide deposits, classified into three groups: fissure veins in quartzite, mineralized granite porphyry and replacement deposits in carbonate rocks (limestone and dolomites). There is a 300-ton-a-day processing mill on property owned by Pioche. The mill is not currently in use and a significant expenditure would be required in order to put the mill into continuous operation, if commercial mining is to be conducted on the property. Pioche’s properties are located approximately 100 miles from Las Vegas, Nevada, and with the significant growth presently occurringwhich has occurred in Las Vegas, the Company believes the real estate value of Pioche is potentially greater than the metal value. In other words, it is felt thatHowever, the asset value at which Pioche is carried on the Company’s books is supported by therecent real estate valuecrisis has caused the Company to re-evaluate the holdings and a write down of approximately $496,000 was recorded at the Pioche properties.end of 2008. The Board of Directors of Pioche has determined that the Company should sell parcels of the real estate if
18
market conditions are acceptable. Mr. Carter, appointed as a Director in 2007, was appointed President of Pioche, and Charles Goehringer was appointed Director and Vice President in January 2008. Title research has been conducted and the Company is being conductedsatisfied that most of the claims can be sold for real estate value. In 2008 the Company learned of a claim by the U.S. Bureau of Land Management (“BLM”) against World Hydrocarbons, Inc. for contamination of real property owned by the BLM north of and immediately adjacent to evaluate the feasibilityprocessing mill situated on property owned by Pioche. The BLM’s claim alleged that mine tailings from the processing mill containing lead and arsenic migrated onto BLM property during the first half of property sales.the twentieth century. World Hydrocarbons, Inc. responded to the BLM by stating that it does not own the mill and that Pioche is the owner and responsible party. Pioche subsequently commenced dialogue with the BLM in late 2008 to determine how best to remedy the situation. Communication with the BLM is continuing and Pioche management plans to inspect the properties in March 2009. Pioche has retained an environmental consultant to assist with the resolution of this matter.
Offices
The Company has a year-to-year lease on space in an office building in Jeddah, Saudi Arabia, used for office occupancy. The Company also leases a house in Jeddah that is used as a technical office and for staff housing. The Company continues to lease office space in Dallas, Texas on a month-to-month basis.
19
20
ITEM 3. Legal Proceedings.
In August of 1997, the Executive Director of the Texas Commission on Environmental Quality (TCEQ), filed a preliminary report and petition with the TCEQ alleging that South Hampton violated various TCEQ rules, TCEQ permits issued to South Hampton, a TCEQ order issued to South Hampton, the Texas Water Code, Texas Clean Air Act and Texas Solid Waste Disposal Act. The violations generally relate to the management of volatile organic compounds in a manner that allegedly violates the TCEQ air quality rules and the storage, processing and disposal of hazardous waste in a manner that allegedly violates the TCEQ industrial and hazardous waste rules. The TCEQ Executive Director recommended that TCEQ enter an order assessing administrative penalties against South Hampton in the amount of $709,408 and requiring South Hampton to undertake such actions as are necessary to bring its operations at its facility and its bulk terminal into compliance with the Texas Water Code, Texas Health and Safety Code, TCEQ rules, permits and orders. Over the course of time and negotiations, the TCEQ amended its position to change the penalties to $765,000 in May of 1998, and reduced it to $690,000 in April of 2003. All appropriate modifications were made by South Hampton in a timely manner where it appeared there were legitimate concerns.
On February 2, 2000, TCEQ amended its pending administrative action against South Hampton to add allegations dating through May 21, 1998 of 35 regulatory violations relating to air quality control and industrial solid waste requirements. TCEQ proposed that administrative penalties be increased to approximately $765,000 and that certain corrective actions be taken. On April 11, 2003, TCEQ reduced the penalties to approximately $690,000. On May 25, 2003, a settlement hearing with TCEQ was held and additional information was submitted to TCEQ on June 2, October 2 and November 4, 2003. South Hampton believesbelieved the original penalty and the additional allegations arewere incorrect and the Company has continued to vigorously defenddefended against these allegations, the proposed penalties and proposed corrective actions. Management and the TCEQ, in March 2008, reached a tentative agreement for a settlement of $274,433. The final approval is subject to reviewagreement was approved by the TCEQ governing body of Commissioners which is expected to take place in the secondthird quarter of 2008. South Hampton has a liability of $275,000$0 and $200,000$275,000 recorded at December 31, 20072008 and 2006,2007, related to these environmental issues. Payments were initiated immediately upon approval by the Commissioners, and the final payment was made in December 2008. Approximately one half of the settlement amount is to bewas paid into a state operated fund for local environmental improvement projects.projects and was applied to connect low income families to sewer facilities in Hardin County, Texas.
ITEM 4. Submission Of Matters To A Vote Of Security Holders.
None
PART II
ITEM 5. Market for Registrant’s Common Equity, Related Shareholder Matters, and Issuer Purchases of Equity Securities.
The Company’s common stock traded on the Pink SheetsNASDAQ and the OTC Bulletin Board during the last two fiscal years under the symbol: ARSD. The following table sets forth the range of high and low bid prices for each quarter as reported by the Pink SheetsNasdaq and the OTC Bulletin Board. The quotations reflect inter-dealer prices, without retail mark-up, mark-down or commission and may not represent actual transactions.
| Pink Sheets/OTC Bulletin Board | ||||||||
| High | Low | |||||||
| Fiscal Year Ended December 31, 2007 | ||||||||
First Quarter ended March 31, 2007 | $ | 3.41 | $ | 3.30 | ||||
Second Quarter ended June 30, 2007 | $ | 6.30 | $ | 6.00 | ||||
Third Quarter ended September 30, 2007 | $ | 6.07 | $ | 5.91 | ||||
Fourth Quarter ended December 31, 2007 | $ | 7.74 | $ | 7.55 | ||||
| Fiscal Year Ended December 31, 2006 | ||||||||
First Quarter ended March 31, 2006 | $ | 1.70 | $ | 1.51 | ||||
Second Quarter ended June 30, 2006 | $ | 1.54 | $ | 1.38 | ||||
Third Quarter ended September 30, 2006 | $ | 2.58 | $ | 2.27 | ||||
Fourth Quarter ended December 31, 2006 | $ | 3.05 | $ | 2.94 | ||||
| NASDAQ/OTC Bulletin Board | ||||||||
| High | Low | |||||||
| Fiscal Year Ended December 31, 2008 | ||||||||
First Quarter ended March 31, 2008 | $ | 7.16 | $ | 6.88 | ||||
Second Quarter ended June 30, 2008 | $ | 6.21 | $ | 5.89 | ||||
Third Quarter ended September 30, 2008 | $ | 4.66 | $ | 4.35 | ||||
Fourth Quarter ended December 31, 2008 | $ | 1.76 | $ | 1.50 | ||||
| Fiscal Year Ended December 31, 2007 | ||||||||
First Quarter ended March 31, 2007 | $ | 3.41 | $ | 3.30 | ||||
Second Quarter ended June 30, 2007 | $ | 6.30 | $ | 6.00 | ||||
Third Quarter ended September 30, 2007 | $ | 6.07 | $ | 5.91 | ||||
Fourth Quarter ended December 31, 2007 | $ | 7.74 | $ | 7.55 | ||||
At December 31, 2007,2008, there were approximately 682660 recorded holders of the Company’s common stock. The Company has not paid any dividends since its inception and, at this time, does not have any plans to pay dividends in the foreseeable future. The provisions ofcurrent lender allows the Petrochemical Company agreements with one of its previous lenders during 2005 restricts the declaration and payment ofpetrochemical subsidiaries to pay dividends and other distributions to an amount not exceeding $600,000 annually, provided there is no event of default under the relevant loan agreement. In 2005 consent was obtained, and approximately $2.6 million were distributed to the parent company with the additional being applied to outstanding debt. The current lender allows dividends to the parent companyof up to 30% of EBITDA. The Petrochemical Company was in compliance with this restriction as of December 31, 2007.2008. See Note 10 to the Consolidated Financial Statements.
On January 29, 2008 the Company stock moved from the Over the Counter Bulletin Board (OCBB) to the NASDAQ exchange. The listing symbol, ARSD, remained unchanged for the move to the new venue. Management believes the move to the electronic market model provides the Company with increased visibility and liquidity for its Common stock, as well as, increased efficiency and cost-effective trading execution for current and potential investors.
See Note 14 to the Consolidated Financial Statements for information about stock options outstanding and other stock awards at December 31, 2007.2008.
ITEM 6. Selected Financial Data.
The following is a five-year summary of selected financial data of the Company (in thousands, except per share amounts):
2007 | 2006 | 2005 | 2004 | 2003 | ||||||||||||||||
| Revenues | $ | 108,638 | $ | 98,502 | $ | 82,416 | $ | 59,793 | $ | 39,625 | ||||||||||
| Net Income (Loss) | $ | 7,771 | $ | 7,875 | $ | 16,636 | $ | (2,551 | ) | $ | (3,505 | ) | ||||||||
| Net Income (Loss) Per Share-Diluted | $ | 0.33 | $ | 0.34 | $ | 0.73 | $ | (.11 | ) | $ | (.15 | ) | ||||||||
| Total Assets (at December 31) | $ | 84,221 | $ | 71,590 | $ | 66,974 | $ | 51,048 | $ | 52,672 | ||||||||||
| Notes Payable (at December 31) | $ | 11,012 | $ | 11,013 | $ | 11,026 | $ | 11,744 | $ | 11,744 | ||||||||||
| Current Portion of Long-Term Debt (at December 31) | $ | 31 | $ | 489 | $ | 1,426 | $ | 3,071 | $ | 3,170 | ||||||||||
Total Long-Term Obligations (at December 31) | $ | 9,078 | $ | 5,108 | $ | 9,839 | $ | 4,916 | $ | -- | ||||||||||
2008 | 2007 | 2006 | 2005 | 2004 | ||||||||||||||||
| Revenues | $ | 154,630 | $ | 108,638 | $ | 98,502 | $ | 82,416 | $ | 59,793 | ||||||||||
| Net Income (Loss) | $ | (8,875 | ) | $ | 7,771 | $ | 7,875 | $ | 16,636 | $ | (2,551 | ) | ||||||||
| Net Income (Loss) Per Share-Diluted | $ | (0.38 | ) | $ | 0.33 | $ | 0.34 | $ | 0.73 | $ | (.11 | ) | ||||||||
| Total Assets (at December 31) | $ | 98,146 | $ | 84,221 | $ | 71,590 | $ | 66,974 | $ | 51,048 | ||||||||||
| Notes Payable (at December 31) | $ | 12 | $ | 11,012 | $ | 11,013 | $ | 11,026 | $ | 11,744 | ||||||||||
| Current Portion of Long-Term Debt (at December 31) | $ | 4,920 | $ | 31 | $ | 489 | $ | 1,426 | $ | 3,071 | ||||||||||
Total Long-Term Debt Obligations (at December 31) | $ | 23,557 | $ | 9,078 | $ | 5,108 | $ | 9,839 | $ | 4,916 | ||||||||||
ITEM 7. Management’s Discussion and Analysis Of Financial Condition and Results Of Operation.
General
Statements in Items 7 and 7A, as well as elsewhere in, or incorporated by reference in, this Annual Report on Form 10-K regarding the Company’s financial position, business strategy and plans and objectives of the Company’s management for future operations and other statements that are not historical facts, are “forward-looking statements” as that term is defined under applicable Federal securities laws. In some cases, “forward-looking statements” can be identified by terminology such as “may,” “will,” “should,” “expects,” “plans,” “anticipates,” “contemplates,” “proposes,” “believes,” “estimates,” “predicts,” “potential” or “continue” or the negative of such terms and other comparable terminology. Forward-looking statements are subject to risks, uncertainties and other factors that could cause actual results to differ materially from those expressed or implied by such statements. Such risks, uncertainties and factors include, but are not limited to, general economic conditions domestically and internationally; insufficient cash flows from operating activities; difficulties in obtaining financing; outstanding debt and other financial and legal obligations; lawsuits; competition; industry cycles; feedstock, specialty petrochemical product and mineral prices; feedstock availability; technological developments; regulatory changes; environmental matters; foreign government instability; foreign legal and political concepts; and foreign currency fluctuations, as well as other risks detailed in the Company’s filings with the U.S. Securities and Exchange Commission, including this Annual Report on Form 10-K, all of which are difficult to predict and many of which are beyond the Company’s control.
Liquidity and Capital Resources
The Company operates in two business segments, specialty petrochemicals (which is composed of the entities owned by the Petrochemical Company) and mining. The Company’s corporate overhead needs are minimal. A discussion of each segment’s liquidity and capital resources follows.
SPECIALTY PETROCHEMICALS SEGMENT. South Hampton obtains its feedstock requirements from a sole supplier. On May 7, 2004, South Hampton and the supplier signed a letter of intent whereby the supplier agreed to assist with the capital required to expand a toll processing unit for a large customer. As security for the funds used to purchase capital equipment and secure outstanding debts for feedstock purchased from the supplier, South Hampton executed a mortgage in June 2004 covering most of the existing facility’s equipment. South Hampton elected not to take advantage of the equipment financing portion of the agreement but continues to purchase feedstock from the supplier. The lien was removed in December 2006, and South Hampton agreed to purchase feedstock on delivery from the supplier versus the previous agreement which did not require payment by South Hampton until the feedstock was used.
In relation to the above, a contract was signed on June 1, 2004, between South Hampton and the supplier for the purchase of 65,000 barrels per month of natural gasoline on a secured basis for the period from June 1, 2004 through May 31, 2006, subsequently extended to May 31, 2007 and annually thereafter with thirty days written notice of termination by either party. In December 2006, the agreement was modified so that all purchases are simply on open account under normal credit terms and amounts owed are classified as current. The supplier built a tank to receive feedstock from a major pipeline system and provides storage for use by South Hampton. The arrangement is viewed as a means of solidifying a dependable, long term supply of feedstock for the Company. Storage fees for this arrangement are offset by the cancellation of tank rental fees in place with another party. The tank was completed in July 2007 and began full operation in October 2007.
On August 1, 2004, South Hampton entered into a capital lease with Silsbee Trading and Transportation, which is owned by an officer of the Company, for the purchase of a diesel powered manlift. The lease is for five years with title transferring to South Hampton at the end of the term.
On March 20, 2007 the Board approved expansion of the petrochemical facilities with the project expected to cost approximately $12 million. The project was completed in September 2008 at a cost of approximately $18 million. The Company originally financed $10 million and paid the remainder out of cash flow. The project was refinanced to include additional expenditures in October 2008, and the final amount financed totaled $14 million.
On January 30, 1992, the Board of Directors of TOCCO adopted a resolution authorizing the establishment of a commodities trading account to take advantage of opportunities to lower the cost of feedstock and natural gas for its subsidiary, South Hampton, through the use of short term commodity swap and option contracts. The policy adopted by the Board specifically prohibits the use of the account for speculative transactions. The operating guidelines adopted by Management generally limit exposures to 50% of the monthly feedstock volumes of the facility for up to six months forward and up to 100% of the natural gas requirements. The derivative agreements are not designated as hedges per SFAS 133, as amended. TOCCO had no option and swap contracts for natural gas outstanding as of December 31, 2008. As of the same date, TOCCO had committed to financial swap contracts for a portion of its required monthly feedstock volume with settlement dates through March 2009 and crude option contracts with settlement dates through December 2009. For the years ended December 31, 2008, 2007, and 2006, the net realized gain/(loss) from the derivative agreements was approximately $(1,721,000), $3,367,000, and $(784,048), respectively. There was an unrealized gain/(loss) from the derivative agreements for the year ended December 31, 2008, 2007, and 2006 of approximately $(5,486,000), $973,000, and $(840,000), respectively.
24
In addition, due to changes in the fair value of the derivative instruments at December 31, 2008, approximately $14,104,000 in derivative premiums were written off and were recorded in cost of petrochemical product sales and processing. The realized and unrealized gains/(losses) are recorded in Cost of Petrochemical Product Sales and Processing for the periods ended December 31, 2008, 2007, and 2006. The fair value of the derivative asset/(liability) at December 31, 2008, 2007, and 2006 totaled approximately $(6,976,000), $206,700 and $(766,000).
South Hampton assesses the fair value of the financial swaps on feedstock using quoted prices in active markets for identical assets or liabilities (Level 1 of fair value hierarchy). South Hampton assesses the fair value of the options held to purchase crude oil using a pricing valuation model. This valuation model considers various assumptions, including publicly available forward prices for crude, time value, volatility factors and current market and contractual prices for the underlying insturment, as well as, other relevant economic measures (Level 2 of fair value hierarchy).
The financial swaps for natural gasoline (covering approximately 30% of the feed requirements for the 4th quarter of 2008 and the 1st quarter of 2009) were ultimately bought out in several stages as prices continued to fall, and the final loss was fixed. The Company exited that market entirely as of early October 2008. In July 2008 as petroleum prices were nearing record highs and there was discussion in the market of further dramatic increases, the Company, after several months of study, determined that crude oil options would provide better and longer term price protection for feedstock versus shorter term financial swaps normally used. The Company acquired crude oil options in the form of collars covering the period of August 2008 to December 2009. Collars generally limit the upside of price movements by utilizing a call with a strike at the desired level, and the premium for the call is expectedpaid by selling a put at a strike price which is deemed an acceptable floor price. The initial floor of $120 was determined to be completed towardsan appropriate point as current crude prices were about $133 per barrel for the period in question. A cap of $140 was established as the ceiling. The volume of crude options covered from 15% to 20% of the total expected volume of feedstock for the Company over the time period in question. Beginning in early and mid-August, as it became apparent that the price declines might be more dramatic than normal, the Company began moving the strike price of the floor puts down to levels which seemed more reasonable and would appear to be out of the money in normal circumstances. Moving the floor puts required payment of a premium to buy back the established position and sale of another put to defer the cost of the buyback, with the new floor of the put at a reasonable level under the circumstances. In some cases puts were repurchased with no re-establishment of a new floor. After making several moves throughout the ninety day period, all the option positions were finally neutralized (offsetting puts and calls) in mid-November 2008.
The obligation on the financial swaps which are due at the end of January through March of 2009 results in a cash outlay each month of approximately $1.9 million split between two trading partners. The Company has sufficient cash on hand and cash from operations to ensure that it is able to make such payments timely. Additionally, as a safe guard, the second quarterCompany has received a temporary extension of 2008its Line of Credit with the bank which is approximately two months later than originally projected duewill enable the Company to delays inborrow up to $3.5 million above its borrowing base for working capital. The Company must return to compliance with its borrowing base limitation on its credit line by mid-June 2009. After the permitting process. The expansionMarch 2009 payment, there will be fundedno further liquidity issues with the derivative positions as they stand.
There are crude options outstanding through December 2009; however, they are neutralized and while unrealized gains and losses may be reported, there will be no significant realized gains and
25
losses relating to these options. In addition, the Company’s cash outflow has been limited to the amount of premiums paid of approximately $14,104,000 which were expensed during the year ended December 31, 2008. As of December 31, 2008, approximately $3,950,000 was in a contributionmargin account with one of $2.0 million fromthe Company’s trading partners. The balance is being reduced and returned to the Company as financial swaps outstanding for the first three months of the year expire and $10.0 million of term financing from a domestic bank.are paid off.
MINING SEGMENT. This segment is in the development stage. ItsThe Company’s most significant asset in this segment is the Al Masane mining projectits fifty percent ownership interest in Saudi Arabia, which is a net user of the Company’s available cash and capital resources.AMAK. As discussed in Item 2. Properties, implementation of the project was delayed until open market prices for metals improved. With prices over the last few years at acceptable levels, the Company has successfully established ALAK.joined with Saudi investors in establishing AMAK. The Company's mining lease will bewas transferred to ALAK,AMAK on December 30, 2008, and ALAK will buildAMAK is building the mining and treatment facilities, and will operate the mine. ALAKAMAK will have all powers of administration over the Al Masane mining project. The Saudi investors’ deposited cash contribution was depositedcontributions totaling $60.0 million in the accounts for ALAKAMAK in September and October of 2007, and application for the transfer of assets to ALAK is underway.2007.
Management also is addressinghas addressed two other significant financing issues within this segment. These issues are were the $11 million note (the “Note”) due the Saudi Arabian government and accrued salaries and termination benefits of approximately $1,060,000$1,076,000 due employees working in Saudi Arabia.
The Note was originally due in ten annual installments beginning in 1984. The Company has not made any repayments nor has it received any payment demands or other communications regardingdemands. The final resolution of the Note fromwas documented when the Saudi government. By memorandum toMinistry approved the King of Saudi Arabia in 1986, the Saudi Ministers of Finance and Petroleum recommended that the Note be incorporated into a loan from Saudi Industrial Development Fund to finance 50% of the costtransfer of the Al Masane project, repaymentlease and assets to AMAK, and conditioned the transfer upon the Note being transferred to AMAK, to be paid out of proceeds of the total amountMining operation. Discussions are underway between the Company and the Saudi investors as to the final resolution of which wouldthe note. The possibility exists that the note may be made through a mutually agreed upon repayment schedule frompaid out of the Company’s share of the operating cash flows generated by the project. The Company remains active in Saudi Arabia and received the Al Masane mining lease at a time when it had not made anyproceeds of the agreed upon repayment installments. Based on its experience to date, management believes that as long as the Company diligently attempts to explore and develop the Al Masane project no repayment demand will be made. Based on its interpretation of the Al Masane mining lease and other documents, management believes the government is likely to agree to link repayment of the Note to the Company’s share of the operating cash flows generated by the commercial development of the Al Masane project and to a long-term installment repayment schedule. In the event the Saudi government demands immediate repayment of the Note, which management considers unlikely, the Company may be unable to pay the entire amount due.operation. No specific payment schedule has been documented.
With respect to accrued salaries and termination benefits due employees working in Saudi Arabia, the Company plans to continuehas continued employing these individuals depending uponto meet the needs of the mining operation. Management believes it has sufficient resourcesUpon finalization of the transfer of the lease and the assets to manage thisAMAK, the Board voted to terminate the employees and give them an opportunity to apply for work with AMAK if they chose. Funds to pay severance liability as necessary.and any back pay were transferred to the Company’s bank account in Saudi Arabia in January 2009, and the termination process is scheduled to be completed by March 31, 2009.
At this time, the Company has no definitive plans for the development of its domestic mining assets.assets near Pioche, Nevada. It periodically receives proposals from outside parties who are interested in possibly developing or using certain assets. Management does not anticipate making any significant domestic mining capital expenditures. Recent investigation by the Company suggests the highest and best use of the property may be for residential and commercial real estate development versus accessibility of the minerals. However, the recent real estate crisis prompted the Company to re-evaluate its holding and record an impairment charge of approximately $496,000 in 2008.
To compensate for the loss of Mr. Crichton in December 2007 as President and Board member of Pioche representing ARSD, Mr. Carter was appointed President of Pioche and Mr. Goehringer
26
joined the Board of Pioche in January 2008. At the same time, the Board of Pioche agreed to move Pioche toward the sale of assets and to generate whatever cash might be possible over time.
The table below summarizes the following contractual obligations of the Company:
| Payments due by period | ||||||||||||||||||||
| Contractual Obligations | Total | Less than 1 year | 1-3 years | 3-5 years | More than 5 years | |||||||||||||||
| Long-Term Debt Obligations | $ | 9,058,726 | --- | $ | 6,058,726 | $ | 3,000,000 | --- | ||||||||||||
| Capital Lease Obligations | 52,994 | $ | 33,471 | 19,523 | --- | --- | ||||||||||||||
| Operating Lease Obligations | 2,568,000 | 808,500 | 234,600 | 234,600 | $ | 1,290,300 | ||||||||||||||
| Purchase Obligations | --- | --- | --- | --- | --- | |||||||||||||||
| Other Long-Term Liabilities Reflected on the Company’s Balance Sheet under GAAP | --- | --- | --- | --- | --- | |||||||||||||||
| Total | $ | 11,679,720 | $ | 841,971 | $ | 6,312,849 | $ | 3,234,600 | $ | 1,290,300 | ||||||||||
| Payments due by period | ||||||||||||||||||||
| Contractual Obligations | Total | Less than 1 year | 1-3 years | 3-5 years | More than 5 years | |||||||||||||||
| Long-Term Debt Obligations | $ | 28,458,726 | $ | 4,901,432 | $ | 13,326,312 | $ | 2,707,585 | $ | 7,523,397 | ||||||||||
| Capital Lease Obligations | 19,523 | 19,523 | --- | --- | --- | |||||||||||||||
| Operating Lease Obligations | --- | --- | --- | --- | --- | |||||||||||||||
| Purchase Obligations | --- | --- | --- | --- | --- | |||||||||||||||
| Other Long-Term Liabilities Reflected on the Company’s Balance Sheet under GAAP | --- | --- | --- | --- | --- | |||||||||||||||
| Total | $ | 28,478,249 | $ | 4,920,955 | $ | 13,326,312 | $ | 2,707,585 | $ | 7,523,397 | ||||||||||
Results of Operations
Comparison of the Years 2008, 2007, 2006 2005
Specialty Petrochemicals Segment
This discussion of the petrochemicals segment of the business uses the table below for purposes of illustration and discussion. The reader should rely on the Audited Financial Statements attached to this report for financial analysis under United States generally accepted accounting principles.
South Hampton sales volumes and gross revenues increased in each of the last three years. Historically, over the last twenty years, specialty products markets generally did not experience significant volatility and prices might only be adjusted once or twice a year. In recent years as the petroleum markets have demonstrated a great deal of price volatility, a more aggressive approach to product pricing has been required.
From 20052006 to 2006,2007, the Gross Sales figures indicate an increase of 23%10.0% with a volume increase of approximately 9.3%5.4%. The Coin facility was shut down in early 2005 but expanded Penhex production in Silsbee was activated in March 2005, thereby giving a net volume gain for the year resulting from a full year of increased production. Because of the strong demand and the Company’s focus on getting the most outmaximizing its operating capacity, the volume increased again by 5.4%15.4% from 20062007 to 20072008 while Gross Sales increased by 10.0%42.3%. The results of the dramatic rise in oil prices over the periods being reported upon are evident. It is important to note that the utilization rates described previously in this report and increased sales volumes for 20052006 through 20072008 indicate that market demand played a major role in the increased success of the Petrochemical Company. This strong demand allowed the Petrochemical Company to raise prices to necessary levels and still maintain market share.
The Petrochemical Company remains dedicated to maintaining a certain level of toll processing business in the facility and will continue to pursue opportunities. The Petrochemical Company, in January 2005, signed a contract with a current toll processing customer to add equipment sufficient to increase production capacity to up to twice the current levels by October 2005. The construction was completed on a timely basis and the increasing revenues are the result of the expansion program. AnotherAn expansion/modification was completed for a different tolling
customer in July 2006, and the results of this work are expected to allow continued increases. The results of the improvements forto these two customersprocesses are evidenced by
27
the increased revenues for toll processing from 20052006 to 2007. Further improvementFrom 2007 to 2008 revenues decreased primarily due to a change in ownership of one of the tolling customers which resulted in delays and adjustments in the customer’s marketing and logistics handling. Improvement is expected as capacity remains available.available and both parties are finding more efficient ways to manage their business.
2007 | 2006 | 2005 | ||||||||||
| TOCCO | (in thousands) | |||||||||||
| Product Sales | $ | 103,205 | $ | 93,855 | $ | 76,268 | ||||||
| Toll Processing | $ | 5,433 | $ | 4,647 | $ | 4,105 | ||||||
| Gross Revenue | $ | 108,638 | $ | 98,502 | $ | 80,373 | ||||||
| Volume of sales (thousand gallons) | 40,144 | 38,073 | 34,826 | |||||||||
| COIN | ||||||||||||
| Gross Revenue | -0- | -0- | $ | 2,043 | ||||||||
| TOCCO | ||||||||||||
| Cost of Materials | $ | 66,989 | $ | 60,131 | $ | 45,638 | ||||||
| Total Operating Expense | $ | 22,696 | $ | 19,758 | $ | 17,989 | ||||||
| Natural Gas Expense | $ | 6,109 | $ | 5,707 | $ | 4,743 | ||||||
| General & Administrative Expense | $ | 5,687 | $ | 4,600 | $ | 4,281 | ||||||
| COIN | ||||||||||||
| Cost of Materials | -0- | -0- | $ | 503 | ||||||||
| Total Operating Expense | -0- | -0- | $ | 654 | ||||||||
| Natural Gas Expense | -0- | -0- | $ | 294 | ||||||||
| General & Administrative Expense | -0- | -0- | $ | 388 | ||||||||
| Capital Expenditures | $ | 10,799 | $ | 3,734 | $ | 3,491 | ||||||
2008 | 2007 | 2006 | ||||||||||
| TOCCO | (in thousands) | |||||||||||
| Petrochemical Product Sales | $ | 130,264 | $ | 103,205 | $ | 93,855 | ||||||
| Transloading Sales | 20,239 | - | - | |||||||||
| Toll Processing | 4,127 | 5,433 | 4,647 | |||||||||
| Gross Revenue | $ | 154,630 | $ | 108,638 | $ | 98,502 | ||||||
| Volume of sales (thousand gallons) | 46,311 | 40,144 | 38,073 | |||||||||
| Cost of Materials | $ | 131,665 | $ | 66,989 | $ | 60,131 | ||||||
| Total Operating Expense | $ | 27,562 | $ | 22,696 | $ | 19,758 | ||||||
| Natural Gas Expense | $ | 7,310 | $ | 6,109 | $ | 5,707 | ||||||
| General & Administrative Expense | $ | 6,966 | $ | 5,687 | $ | 4,600 | ||||||
| Capital Expenditures | $ | 15,038 | $ | 10,799 | $ | 3,734 | ||||||
Total Cost of Materials increased dramatically in recent years as mentioned in the discussion of Gross Sales. The Petrochemical Company uses natural gasoline as feedstock which is the heavier liquid remaining after butane and propane are removed from liquids produced by natural gas wells. The material is a commodity product in the oil/petrochemical markets and generally is readily available. Alternative uses are in motor gasoline blending, ethanol denaturing, and as a feedstock in other petrochemical processes, including ethylene crackers. The price of natural gasoline historically has an 88% correlation to the price of crude oil.oil although after the 2008 drop in the crude market, the price is more closely aligned with unleaded gasoline price movements. The price of feedstock generally does not carry the day to day volatility of crude oil simply because the market is made by commercial users and there is not the participation of non-commercial speculators as is true with the commodities traded on the public exchanges. The Petrochemical Company triesattempted to maintain, when the market iswas suitable, a hedge position on approximately half of its feedstock needs, buying financial swaps to protect the price for three to nine months in advance as opportunities arise. The numbers in the table above reflect the final price of materials, including results of the realized and unrealized gains and losses of the hedging program. Material purchase costs rose by 32% from 2005 to 2006 and by 11% from 2006 to 2007.2007 and by 96.5% from 2007 to
28
2008. However, when adjusting for the effects of derivative losses, material costs rose by 65% from 2007 to 2008. After the losses generated by the hedging program in the later part of 2008, the Company has exited the derivative markets for the time being and does not intend to re-establish the program until new policies and balances are put into place. The volatility experienced during the last half of 2008 in the petroleum markets has waned to some extent in recent months and hedging against inflation has not been necessary. See Note 20 in the Consolidated Financial Statements.
Operating Expenses for the Petrochemical Company have increased over the past three years, Natural gas and labor are the largest individual expenses and both exhibited significant increases but for different reasons. The cost of natural gas purchases rose 20% from 2005 to 2006, and another 7% from 2006 to 2007.2007, and increased 19.7% from 2007 to 2008. These cost increases are primarily due to price hikes as the volume of gas used was relatively flat over the period being reported upon. The labor increase was significant and not unexpected for 2007 and 2008 as the Company began hiring personnel and reorganizing its operations and maintenance labor force early in the year to allow adequate time to train and season employees prior to starting up the new expanded portion of the operation. Additionally, the number of truck drivers increased in preparation for the greater product volumes to be moved. Total labor costs for operations personnel, maintenance, and truck drivers increased from $5.2 million in 2005, to $5.6 million in 2006, and to $7.3 million in 2007.2007, and to $8.3 million in 2008. In addition to the impact of the increased workforce being melded into the system, the Company gave a 7% cost of living increase to the total workforce in June of 2007.2007 and 10% in 2008. The southeast Texas economy is robust and many of the local refineries and petrochemical plants have large expansion projects underway. The Company must stay competitive on salaries and benefits in order to retain valuable trained and skilled employees. Over time the Company’s pay scales had fallen significantly behind those with whom it must compete for employees and there has been an attempt to alleviate some of the difference over the last several years. The cost of living increase wasincreases were determined by sampling local industry and arriving at an average increase. The otherAs of December 31, 2008, the Company had reduced its workforce to 130 employees which is a level it feels is sustainable under the current economic conditions.
Another cost component whichthat has increased over the past several years is the cost of transportation which is largely passed through to the customer.
29
In 2006 further modifications to a different toll processing unit were completed and operation began in July. Capital costs for expanding the toll processing units are reimbursed by the customers over five years and recorded as a reduction to depreciation expense. No further changes were made in 2007 or 2008 and the increased throughput fees are theexpected as a result of the previous expansion work.
Mining Segment and General Corporate Expenses.
| (in thousands) | 2007 | 2006 | 2005 | |||||||||
| General corporate expenses | $ | 2,178 | $ | 1,242 | $ | 187 | ||||||
| (in thousands) | 2008 | 2007 | 2006 | |||||||||
| General corporate expenses | $ | 2,399 | $ | 2,178 | $ | 1,242 | ||||||
General corporate expenses increased from 2006 to 2007 primarily due to increases in bonus compensation of $139,000, D&O insurance premiums of $128,000, investor related items of $101,000, post retirement obligations of $621,500,$622,000, legal and auditing fees of $91,000 andoffset by a reduction in directors’ fees of $240,750.$241,000. The increase from 20052007 to 20062008 was primarily due to an increaseincreases in investor related expenses of stock based compensation$146,000, audit fees of $589,000$177,000, the impairment loss that the Company took on its investment in conjunction with bonus compensation totaling $160,000.Pioche of $496,000 offset by reductions in post retirement expenses of $270,000 and directors’ fees of $288,000.
None of the Company’s mining operations or investments generate operating or other revenues. The minority interest amount represents Pioche and Coin minority stockholders’ share of the losses from the Pioche and Coin operations for prior years. In 2005 Coin operations were discontinued and no minority interest remains relating to Coin. Pioche losses are primarily attributable to the costs of maintaining the Nevada mining properties.
New Accounting Standards
measurements. In February 2008 the FASBFinancial Accounting Standards Board (“FASB”) issued FASB Staff Position No. 157-1, “Application of FASB Statement No. 157 to FASB Statement No. 13 and Other Accounting Pronouncements That Address Fair Value Measurements for Purposes of Lease Classification or Measurement under Statement 13” (“FSP FAS 157-1”). FSP FAS 157-1 excludes FASB Statement No. 13, Accounting for Leases (“SFAS 13”), as well as other accounting pronouncements that address fair value measurements on lease classification or measurement under Statement 13, from the scope of SFAS 157. FSP FAS 157-1 is effective upon the initial adoption of SFAS 157. The Company believes that upon the adoption of SFAS 157, FSP FAS 157-1 will have no affect on the way the Company accounts for its leases under SFAS 13.
In October 2008 the FASB issued FSP FAS 157-2 states157-3, "Determining the Fair Value of a Financial Asset When the Market for That Asset Is Not Active.” FSP FAS 157-3 clarifies the application of SFAS No. 157 in a market that a measurement is recurring if it happens at least annuallynot active and defines nonfinancial assets and nonfinancial liabilities as all assets and liabilities other than those meetingprovides an example to illustrate key considerations in determining the definitionfair value of a financial asset when the market for that financial asset is not active. FSP FAS 157-3 is effective upon issuance, including prior periods for which financial statements have not been issued. Revisions resulting from a change in the valuation technique or its application should be accounted for as a change in accounting estimate following the guidance in FASB Statement No. 154, “Accounting Changes and Error Corrections.” FSP FAS 157-3 is effective for the financial statements included in the Company’s annual report for the year ended December 31, 2008, and application of FSP FAS 157-3 had no impact on the Company’s consolidated financial statements.
30
In December 2007 the FASB issued Statement No. 160, “Noncontrolling“Non-controlling Interests in Consolidated Financial Statements – an amendment of ARB No. 51 (Consolidated Financial Statements)” (“(“SFAS 160”). SFAS 160 establishes accounting and reporting standards for a noncontrollingnon-controlling interest in a subsidiary and for the deconsolidation of a subsidiary. In addition, SFAS 160 requires certain consolidation procedures for consistency with the requirements of SFAS 141(R), “Business Combinations.” SFAS 160 is effective for fiscal years, and interim periods within those fiscal years, beginning on or after December 15, 2008, with earlier adoption prohibited. The Company is currently evaluating the impact adoption of SFAS 160 may have on the consolidated financial statements.
In December 2007 the FASB issued Statement No. 141(R), “Business Combinations” (“SFAS 141(R)”). SFAS 141(R) expands the definition of transactions and events that qualify as business combinations; requires that the acquired assets and liabilities, including contingencies, be recorded at the fair value determined on the acquisition date and changes thereafter reflected in revenue, not goodwill; changes the recognition timing for restructuring costs; and requires acquisition costs to be expensed as incurred. Adoption of SFAS 141(R) is required for combinations after December 15, 2008. Early adoption and retroactive application of SFAS 141(R) to fiscal years preceding the effective date are not permitted. The Company is currently evaluating the impact adoption of SFAS 141(R) may have on the consolidated financial statements.
In March 2008 FASB issued SFAS No. 161, “Disclosures about Derivative Instruments and Hedging Activities, an amendment of FASB Statement No. 133” (“SFAS 161”). SFAS 161 requires enhanced disclosures about an entity’s derivative and hedging activities. Entities will be required to provide enhanced disclosures about: (a) how and why an entity uses derivative instruments; (b) how derivative instruments and related hedge items are accounted for under SFAS 133 and its related interpretations; and (c) how derivative instruments and related hedge items affect an entity’s financial position, financial performance and cash flows. The Company is required to adopt SFAS 161 beginning in fiscal year 2009. The Company is currently evaluating the impact adoption of SFAS 161 may have on the consolidated financial statements.
In May 2008 the FASB issued Statement No. 162, “The Hierarchy of Generally Accepted Accounting Principles” (“SFAS 162”). The new standard is intended to improve financial reporting by identifying a consistent framework, or hierarchy, for selecting accounting principles to be used in preparing financial statements that are presented in conformity with U.S. generally accepted accounting principles (GAAP) for nongovernmental entities. Prior to the issuance of SFAS 162, GAAP hierarchy was defined in the American Institute of Certified Public Accountants (AICPA) Statement on Auditing Standards (SAS) No. 69, The Meaning of Present Fairly in Conformity With Generally Accepted Accounting Principles. SAS 69 has been criticized because it is directed to the auditor rather than the entity. SFAS 162 addresses these issues by establishing that the GAAP hierarchy should be directed to entities because it is the entity (not its auditor) that is responsible for selecting accounting principles for financial statements that are presented in conformity with GAAP. SFAS 162 is effective November 15, 2008 and is only effective for nongovernmental entities; therefore, the GAAP hierarchy will remain in SAS No. 69 for state and local governmental entities and federal governmental entities. SFAS 162 did not have a material impact on the Company’s consolidated financial statements upon adoption.
31
In June 2008 the FASB issued FSP Emerging Issues Task Force (“EITF”) 03-6-1, “Determining Whether Instruments Granted in Share-Based Payment Transactions Are Participating Securities” (“FSP EITF 03-6-1”). FSP EITF 03-6-1 provides that unvested share-based payment awards that contain nonforfeitable rights to dividends or dividend equivalents (whether paid or unpaid) are participating securities and shall be included in the computation of earnings per share pursuant to the two-class method. FSP EITF 03-6-1 is effective for fiscal years beginning after December 15, 2008, and interim periods within those years. Upon adoption, a company is required to retrospectively adjust its earnings per share data (including any amounts related to interim periods, summaries of earnings and selected financial data) to conform to the provisions of FSP EITF 03-6-1. The Company is currently evaluating the impact adoption of FSP EITF 03-6-1 may have on the consolidated financial statements.
In November 2008 the FASB ratified the consensus reached in EITF 08-06, “Equity Method Investment Accounting Considerations” (“EITF 08-06”). EITF 08-06 was issued to address questions that arose regarding the application of the equity method subsequent to the issuance of SFAS 141(R). EITF 08-06 concluded that equity method investments should continue to be recognized using a cost accumulation model, thus continuing to include transaction costs in the carrying amount of the equity method investment. In addition, EITF 08-06 clarifies that an impairment assessment should be applied to the equity method investment as a whole, rather than to the individual assets underlying the investment. EITF 08-06 is effective for fiscal years beginning on or after December 15, 2008. EITF 08-06 will not have a material impact on the Company’s consolidated financial statements upon adoption.
Critical Accounting Policies
Long-lived Assets
Long-lived assets are reviewed for impairment whenever events or changes in circumstances indicate that the carrying amount may not be recoverable, in accordance with the Statement of Financial Accounting Standards No. 144 (SFAS 144), “Accounting for the Impairment or Disposal of Long-lived Assets.” An impairment loss is recognized when the carrying amount of the asset exceeds the estimated undiscounted future cash flows expected to result from the use of the asset and its eventual disposition. The Company’s long-lived assets primarily include its mineral exploration and development projects. The Company’s most significant long-lived asset iswas the Al Masane mining project in Saudi Arabia.Arabia which was transferred to AMAK in December 2008. In March 2007 (for purposes of estimating future cash flows), price assumptions contained in the 1996 update to the Al Masane project’s feasibility study and prepared by WGM, were updated by an independent consultant. See Item 2. Properties. These price assumptions are averages over the projected ten-year life of the Al Masane mine and are $1.98 per pound for copper, $0.85 per pound for zinc, $492 per ounce for
gold and $9.03 per ounce for silver. Copper and zinc comprise in excess of 80% of the expected value of production.
The Greater Al-Masane area is known to include massive sulphide deposits similar to those found in the Al-Masane area, which has been more thoroughly classified and explored. In consideration of the comparable amount of deposit area included, and the amount expended to date in the exploration efforts, and using current metal prices to evaluate the potential of the area explored, no impairment of this asset existed at December 31, 2007. This asset was transferred to Investment in AMAK in December 2008.
32
Pioche’s properties include 48 patented and 5 unpatented claims totaling approximately 1,500 acres. There is a 300 ton/day processing mill on property owned by Pioche. The mill is not currently in use and a significant expenditure would be required in order to put the mill into continuous operation, if commercial mining iswere to be conducted. However,At December 31, 2008 the Company believes thattook a charge for impairment of the Pioche property due to the condition of the real estate valuemarket in Nevada and elsewhere, and also because of some questions about environmental impairments on the site of the property is such that no impairment of this asset existed at December 31, 2007.ore processing mill.
The Company assesses the carrying values of its assets on an ongoing basis. Factors which may affect carrying values include, but are not limited to, mineral prices, capital cost estimates, the estimated operating costs of any mines and related processing, ore grade and related metallurgical characteristics, the design of any mines and the timing of any mineral production. There are no assurances that, particularly in the event of a prolonged period of depressed mineral prices, the Company will not be required to take a material write-down of any of its mineral properties.
Environmental Liabilities
The Petrochemical Company is subject to the rules and regulations of the TCEQ, which inspects the operations at various times for possible violations relating to air, water and industrial solid waste requirements. As noted in Item 1. Business and Item 3. Legal Proceedings, evidence of groundwater contamination was discovered in 1993. The recovery process, initiated in 1998, is proceeding as planned and is expected to continue for many years.
Also in 1997, the TCEQ notified South Hampton of several alleged violations relating to air quality rules and the storage, processing and disposal of hazardous waste. Some claims have been dropped, some have been settled and others continue to be negotiated. It is the Company’s policy to accrue remediation costs based on estimates of known environmental remediation exposure. During 2007 an additional $75,000 was accrued for potential settlement of these violations. At December 31, 2007, a total liability of $275,000 was accrued to cover the final negotiated settlement costs of these environmental issues. The settlement will bewas paid over a six month period beginning in MarchSeptember 2008 with the last payment being made in December 2008. Approximately one half of the total amount was paid into a fund operated by the State which pays for local environmental enhancement projects. In this case the money was designated to a project connecting low income families to a municipal sewer system in the County in which the Company operates.
Share-Based Compensation
The Company uses the fair value recognition provisions of Financial Accounting Standards No. 123R, "Share Based Payment", which requires the Company to expense the cost of employee services received in exchange for an award of equity instruments based on the grant date fair value of such instruments. The Company uses the Black-Sholes model to calculate the fair value of the equity instrument on the grant date.
Income Taxes
In assessing the realization of deferred tax assets, the Company considers whether it is more likely than not that some portion or all of the deferred tax assets will not be realized. As a result of
33
uncertainty of achieving sufficient taxable income in the future a valuation allowance against a portion of its deferred tax asset has been recorded. If these estimates and assumptions change in the future, the Company may reverse the valuation allowance against deferred tax assets.
In June 2006, the Financial Accounting Standards Board issued FASB Interpretation No. 48, Accounting for Uncertainty in Income Taxes, or FIN 48, — an Interpretation of FASB Statement No. 109, Accounting for Income Taxes, or FASB 109. FIN 48 clarifies the accounting for uncertainty in income taxes in an enterprise’s financial statements in accordance with FASB 109 and prescribes a recognition threshold and measurement attribute for the financial statement recognition and measurement of a tax position taken or expected to be taken in a tax return. FIN 48 also provides guidance on the classification, interest and penalties, accounting in interim periods, disclosure and transition. FIN 48 is effective for fiscal years beginning after December 15, 2006 and we adopted the provisions of FIN 48 effective January 1, 2007. At the adoption date of January 1, 2007, and at December 31, 2007,2008, there were no unrecognized tax benefits.
Derivative Instruments
The Company uses financial commodity swaps to hedge the cost of natural gasoline, the primary source of feedstock, and natural gas used as fuel to operate our plant to manage risks generally associated with price volatility. The contracts are accounted for in accordance with SFAS No. 133, Accounting for Derivative Instruments and Hedging Activities, or SFAS 133. SFAS 133 requires every derivative instrument to be recorded in our consolidated balance sheets as either an asset or liability measured at its fair value. Our derivative agreement are not designated as hedges therefore all changes in estimated fair value are recognized in cost of petrochemical product sales and processing in the consolidated statements of income.operations.
On March 21, 2008, South Hampton entered into an interest rate swap agreement with Bank of America related to the $10.0 million term loan secured by property, pipeline and equipment. The effective date of the interest rate swap agreement is August 15, 2008, and terminates on December 15, 2017. As part of the interest rate swap agreement South Hampton will pay interest based upon the London InterBank Offered Rate (LIBOR) or a base rate plus a markup and will receive from Bank of America an interest rate of 5.83%. South Hampton has designated the transaction as a cash flow hedge according to Statement of Financial Accounting Standard (“SFAS”) No. 133, “Accounting for Derivative Instruments and Hedging Activities”, as amended by SFAS Nos. 138 and 149. Beginning on August 15, 2008, the derivative instrument was reported at fair value with any changes in fair value reported within other comprehensive income (loss) in the Company’s Statement of Stockholders’ Equity. The Company entered into the interest rate swap to minimize the effect of changes in the LIBOR rate. The fair value of the derivative liability associated with the interest rate swap at December 31, 2008 totaled $1,697,079. The cumulative loss of $1,697,079 from the changes in the swaps contract’s fair value that is included in other comprehensive loss will be reclassified into income when interest is paid.
South Hampton assesses the fair value of the interest rate swap using a present value model model that includes quoted LIBOR rates and the nonperformance risk of the Company and Bank of America based on the Credit Default Swap Market (Level 2 of fair value hierarchy).
34
ITEM 7A. Quantitative and Qualitative Disclosures about Market Risk.
The market risk inherent in the Company’s financial instruments represents the potential loss resulting from adverse changes in interest rates, foreign currency rates and commodity prices. The Company’s exposure to interest rate changes results from its variable rate debt instruments which are vulnerable to changes in short term United States prime interest rates. At December 31, 2008, 2007 2006 and 2005,2006, the Company had approximately $28,459,000, $9,059,000 $5,100,000 and $5,000,000,$9,100,000, respectively, in variable rate debt outstanding. A hypothetical 10% change in interest rates underlying these borrowings would result in annual changes in the Company’s earnings and cash flows of approximately $2,846,000, $911,000 $275,000 and $35,000$275,000 at December 31, 2008, 2007 and 2006, and 2005, respectively. However, the interest rate swap will limit this exposure in future periods on the $10.0 million outstanding of term debt.
The Company does not view exchange rates exposure as significant and has not acquired or issued any foreign currency derivative financial instruments.
The Petrochemical Company purchases all of its raw materials, consisting of feedstock and natural gas, on the open market. The cost of these materials is a function of spot market oil and gas prices. As a result, the Petrochemical Company’s revenues and gross margins could be
affected by changes in the price and availability of feedstock and natural gas. As market conditions dictate, the Petrochemical Company from time to time will engage in various hedging techniques including financial swap and option agreements. The Petrochemical Company does not use such financial instruments for trading purposes and is not a party to any leveraged derivatives. The Petrochemical Company’s policy on such hedges is to buy positions as opportunities present themselves in the market and to hold such positions until maturity, thereby offsetting the physical purchase and price of the materials.
At the end of 2007, market risk for 2008 was estimated as a hypothetical 10% increase in the cost of natural gas and feedstock over the market price prevailing on December 31, 2007. To mitigate this risk, at December 31, 2007, the Petrochemical Company had natural gas option agreements in effect expiring in March 2008, which covered from 50% to 100% of the fuel gas requirement. The Petrochemical Company also entered into financial swap agreements covering approximately 50% of the feedstock requirements through the third quarter of 2008. Assuming 2008 total petrochemical product sales volumes at the same rate as 2007, the 10% market risk increase will result in an increase in the cost of natural gas and feedstock of approximately $7,700,000 in fiscal 2008, before considering the effect of the option and swap agreements outstanding as of December 31, 2007.
At the end of 2006,2008, market risk for 20072009 was estimated as a hypothetical 10% increase in the cost of natural gas and feedstock over the market price prevailing on December 31, 2006. To mitigate this risk, at December 31, 2006, the Petrochemical Company had natural gas option agreements in effect expiring in October 2007, which covered from 50% to 100%2008. Because of the fuel gas requirement. The Petrochemicalconditions in the petroleum markets today, with low demand and reasonably low volatility, the Company also entered into financial swap agreements covering approximately 50% ofis not hedging its feedstock costs as it has periodically in the feedstock requirements through the third quarter of 2007.past. Assuming 20072009 total petrochemical product sales volumes at the same rate as 2006,2008 and that feed prices stay in the range they were at the end of the year, the 10% market risk increase will result in an increase in the cost of natural gas and feedstock of approximately $6,500,000$5,400,000 in fiscal 2007, before considering the effect of the option and swap agreements outstanding as of December 31, 2006.2009.
ITEM 8. Financial Statements and Supplementary Data.
The consolidated financial statements of the Company and the consolidated financial statement schedules, including the report of the independent registered public accounting firm thereon, are set forth beginning on Page F-1.
35
ITEM 9. Changes In and Disagreements with Accountants on Accounting and Financial Disclosure.
None
ITEM 9A. Controls and Procedures.
Disclosure Controls and Procedures
Management of the Company has evaluated, under the supervision and with the participation of the Company’s principal executive officer and principal financial officer, the effectiveness of the design and operation of the Company’s “disclosure controls and procedures” (as defined in the Securities Exchange Act of 1934 Rules 13a-15(c) and 15d-15(c)) as of the end of the period covered by this report. Based on this evaluation, the principal executive officer and principal financial officer have
concluded that our disclosure controls and procedures were effective at December 31, 2007,2008, and designed to provide reasonable assurance that material information relating to us and our consolidated subsidiaries is recorded, processed, summarized and reported within the time periods specified in the Securities and Exchange Commission’s rules and forms, and is accumulated and communicated to management, including the Company’s principal executive officer and principal financial officer, as appropriate, to allow timely decisions regarding required disclosure.
Management’s Report on Internal Control Over Financial Reporting.
Management of Arabian American Development Company (the “Company”) is responsible for establishing and maintaining adequate internal control over financial reporting. The Company’s internal control system was designed to provide reasonable assurance regarding the reliability of financial reporting and preparation of financial statements for external purposes in accordance with accounting principles generally accepted in the United States of America. All internal control systems, no matter how well designed, have inherent limitations and may not prevent or detect misstatements. Therefore, even those systems determined to be effective can provide only reasonable assurance with respect to financial statement preparation and presentation. Company management assessed the effectiveness of the Company’s internal control over financial reporting as of December 31, 2007.2008. In making this assessment, itThe Company used the criteria set forth by the Committee of Sponsoring Organizations of the Treadway Commission (COSO) in Internal Control—Integrated Framework. Our management concluded that based on its assessment, our internal control over financial reporting was effective as of December 31, 2007.2008. The effectiveness of our internal control over financial reporting as of December 31, 20072008 was audited by Travis, Wolff & Company, L.L.P. (also know as Moore Stephens Travis Wolff,TravisWolff, L.L.P.), an independent registered public accounting firm, as stated in their report, which appears under Item 8 –Financial Statements and Supplementary Data.
Internal Control Over Financial Reporting
There were no changes in our internal control over financial reporting that occurred during the quarter ended December 31, 2007,2008, that have materially affected, or are reasonably likely to affect materially, the Company’s internal control over financial reporting.
36
ITEM 9B. Other Information.
None
PART III
ITEM 10. Directors and Executive Officers of the Registrant.
The following sets forth the name and age of each director of the Company, the date of his election as a director and all other positions and offices with the Company presently held by him.
| Name; Current Positions Held | Age | Date of Election | |||
Hatem El Khalidi President of the Company since 1975; prior to 1975 Vice President of the Company; Chief Executive Officer of the Company since February 1994 | 84 | April 1968 | |||
Nicholas N. Carter ………………………………………………. Executive Vice President, Chief Executive Officer of the Company since January 2008, President of the Petrochemical Company since 1987 | 62 | August 2004 | |||
Robert E. Kennedy ………………………………………………. Chairman of the Audit and Compensation Committees; Member of Nominating Committee | 65 | January 2007 | |||
Ghazi Sultan Chairman of the Nominating Committee; Member of Compensation and Audit Committees | 71 | September 1993 | |||
Ibrahim Al Moneef Member of the Compensation and Nominating Committees | 68 | April 2007 | |||
Mohammed Al Omair Member of Audit, Compensation and Nominating Committees | 65 | October 2007 | |||
Charles Goehringer, Jr. Member of Compensation and Nominating Committees | 50 | October 2007 |
Each director of the Company is elected on staggering three year terms to serve until his successor is elected and qualified. Each person listed in the foregoing table has served as a director since the date of election indicated.
The Board of Directors of the Company has an Audit Committee which is currently composed of Messrs. Ghazi Sultan, Mohammed Al Omair, and Robert E. Kennedy. The Board has determined that each of the members of the Audit Committee meets the Securities and Exchange Commission and National Association of Securities Dealers standards for independence. The Board has also determined that Ghazi Sultan meets the Securities and Exchange Commission criteria of an “audit committee financial expert.”
The following table sets forth the name of each executive officer of the Company, their age and all the positions and offices with the Company held:
| Name | Positions | Age | ||||
| Hatem El Khalidi | President, Chief Executive Officer and Director | 84 | ||||
| Nicholas N. Carter | Executive Vice President, Chief Operating Officer and Director/President - TOCCO | 62 | ||||
| Connie Cook | Secretary and Treasurer/Secretary - TOCCO | 46 |
Each executive officer of the Company serves for a term extending until his successor is elected and qualified.
The Company has adopted a Code of Ethics that applies to the Company’s principal executive officer, principal financial officer, principal accounting officer and controller, and to persons performing similar functions. A copy of the Code of Ethics has been filed as an exhibit to this Annual Report on Form 10-K.
Section 16(a) Beneficial Ownership Reporting Compliance
Section 16(a) of the Securities Exchange Act 1934 requires the Company’s officers and directors, and persons who own more than 10% of a registered class of the Company’s equity securities, to file reports of ownership and changes in ownership with the SEC. Officers, directors and greater than 10% stockholders are required by SEC regulation to furnish the Company with copies of all Section 16(a) forms they file. To the best of the Company’s knowledge, during the fiscal year ended December 31, 2007,2008, all Section 16(a) filing requirements applicable to its officers, directors and greater than 10% beneficial owners were complied with.
ITEM 11. Executive Compensation.
Compensation Committee Report
This Committee was formed by the Board during March 2007. The individuals serving on the Compensation Committee are Robert E. Kennedy, Ghazi Sultan, Mohammed Al Omair, Ibrahim Al Moneef, and Charles Goehringer, Jr. as of MarchDecember 2008.
It is the intent of the Board that the salaries and other compensation of the Executives of the Company will be recommended to the Board for action at least once annually and will be based upon competitive salaries and financial performance of the Company.
Compensation Discussion and Analysis
General
The compensation programs of the Company are designed to attract and retain qualified individuals upon whom the sustained progress, growth, profitability, and value of the Company depend. It is the plan of the Board that through the Compensation Committee, the Company will develop and implement compensation policies, plans and programs to further these goals by rewarding executives for positive financial performance. Management provides recommendations regarding executive compensation to the Compensation Committee. The Company does not currently engage any consultant related to executive and/or director compensation matters.
Compensation Components
During fiscal 2007,2008, executive compensation included base salary, annual cash and stock incentives, and benefits generally available to all employees.
Base Salary
The base salary of Mr. Carter has been subject to a standard cost of living increase annually over the past several years at the same rate as other Petrochemical segment employees. No other adjustments were made. Mr. El Khalidi’s remuneration has remained fixed at the current level for many years. It is the task of the Compensation Committee to review executive salaries annually and make recommendations as to whether adjustments should be made.
Incentive Compensation
The Full Board has reviewed and acted upon the executive performance awards based upon the financial results for the years ended 20062008 and 2007. The performance awards have been in the form of cash and stock and have been awarded in the first quarter of each year dependent on the results of the previous year. The Compensation Committee has taken over making these recommendations and is developing a formal program per the Policies which are currently under consideration. The total award is calculated based upon performance of the Company compared with the 2005 performance which is considered the base year. The award is paid in the first quarter after the financial results of the year ended are reasonably known.
Stock Option Plan
The Company does not haveadopted a Stock Option plan that is currently in operation. The Company is in the process of developing an updated Stock Option plan to be implemented in 2008, subject to Compensation Committee and Board approval.during 2008.
Other Compensation
There is no other compensation paid to the executive officers.
Termination of Employment Payments
There were no termination payments made to executive officers during 2007.2008.
Tax Considerations
There are no tax considerations which affect the compensation of executives for 2007.2008.
Summary of Executive Compensation
The following Summary Compensation Table sets forth certain information with respect to all compensation paid or earned for services rendered to the Company for the year ending December 31, 20072008 for those persons who served as our Chief Executive Officer, Chief Operating Officer, Chief Financial Officer, and Vice President of Marketing for the Petrochemical Company during the year and who are our four most highly compensated executive officers:
SUMMARY COMPENSATION TABLE
Name and Principal Position | Year | Salary ($) (1) | Bonus ($) | Restricted Stock Award(s) ($) | Stock Award(s) | Non-Equity Incentive Plan Compensation($) | Change in Pension Value and Nonqualified Deferred Compensation Earnings($) | All Other Compensation ($) (2)(3) | Total ($) | ||||||||||||||||||||||||
Hatem El Khalidi, President and Chief Executive Officer, Director | 2007 | $ | 72,000 | -- | -- | -- | -- | -- | $ | 8,000 | $ | 80,000 | |||||||||||||||||||||
| 2006 | $ | 72,000 | -- | -- | -- | -- | -- | $ | 8,000 | $ | 80,000 | ||||||||||||||||||||||
| 2005 | $ | 72,000 | -- | -- | -- | -- | -- | $ | 8,000 | $ | 80,000 | ||||||||||||||||||||||
Nicholas N. Carter, Executive Vice President and Chief Operating Officer President, Petrochemical Company | 2007 | $ | 172,059 | $ | 96,506 | $ | 66,000 | -- | -- | -- | $ | 10,324 | $ | 344,889 | |||||||||||||||||||
| 2006 | $ | 163,044 | $ | 97,994 | $ | 30,000 | -- | -- | -- | $ | 9,783 | $ | 300,821 | ||||||||||||||||||||
| 2005 | $ | 155,748 | $ | 45,705 | -- | -- | -- | -- | $ | 9,288 | $ | 210,741 | |||||||||||||||||||||
Connie J. Cook, Secretary and Treasurer | 2007 | $ | 108,500 | $ | 70,085 | $ | 33,000 | -- | -- | -- | $ | 6,510 | $ | 218,095 | |||||||||||||||||||
| 2006 | $ | 102,816 | $ | 73,057 | $ | 15,000 | -- | -- | -- | $ | 6,169 | $ | 197,042 | ||||||||||||||||||||
| 2005 | $ | 98,215 | $ | 46,067 | -- | -- | -- | -- | $ | 5,893 | $ | 150,175 | |||||||||||||||||||||
Mark D. Williamson, Vice President of Marketing, Petrochemical Company | 2007 | $ | 190,393 | $ | 70,023 | -- | -- | -- | -- | $ | 11,424 | $ | 271,840 | ||||||||||||||||||||
| 2006 | $ | 193,830 | $ | 80,124 | $ | 15,000 | -- | -- | -- | $ | 11,630 | $ | 300,584 | ||||||||||||||||||||
| 2005 | $ | 199,269 | $ | 53,116 | -- | -- | -- | -- | $ | 11,956 | $ | 264,341 | |||||||||||||||||||||
Name and Principal Position | Year | Salary ($) (1) | Bonus ($) | Restricted Stock Award(s) ($) | Stock Award(s) | Non-Equity Incentive Plan Compensation($) | Change in Pension Value and Nonqualified Deferred Compensation Earnings($) | All Other Compensation ($) (2)(3) | Total ($) | ||||||||||||||||||||||||
Hatem El Khalidi, President and Chief Executive Officer, Director | 2008 | $ | 72,000 | -- | -- | -- | -- | -- | $ | 8,000 | $ | 80,000 | |||||||||||||||||||||
| 2007 | $ | 72,000 | -- | -- | -- | -- | -- | $ | 8,000 | $ | 80,000 | ||||||||||||||||||||||
| 2006 | $ | 72,000 | -- | -- | -- | -- | -- | $ | 8,000 | $ | 80,000 | ||||||||||||||||||||||
Nicholas N. Carter, Executive Vice President and Chief Operating Officer President, Petrochemical Company | 2008 | $ | 209,918 | $ | 78,665 | $ | 99,800 | -- | -- | -- | $ | 12,595 | $ | 400,978 | |||||||||||||||||||
| 2007 | $ | 172,059 | $ | 96,506 | $ | 66,000 | -- | -- | -- | $ | 10,324 | $ | 344,889 | ||||||||||||||||||||
| 2006 | $ | 163,044 | $ | 97,994 | $ | 30,000 | -- | -- | -- | $ | 9,783 | $ | 300,821 | ||||||||||||||||||||
Connie J. Cook, Secretary and Treasurer | 2008 | $ | 133,009 | $ | 51,143 | $ | 49,900 | -- | -- | -- | $ | 7,981 | $ | 242,033 | |||||||||||||||||||
| 2007 | $ | 108,500 | $ | 70,085 | $ | 33,000 | -- | -- | -- | $ | 6,510 | $ | 218,095 | ||||||||||||||||||||
| 2006 | $ | 102,816 | $ | 73,057 | $ | 15,000 | -- | -- | -- | $ | 6,169 | $ | 197,042 | ||||||||||||||||||||
Mark D. Williamson, Vice President of Marketing, Petrochemical Company | 2008 | $ | 240,705 | $ | 51,143 | 49,900 | -- | -- | -- | $ | 14,442 | $ | 356,190 | ||||||||||||||||||||
| 2007 | $ | 190,393 | $ | 70,023 | -- | -- | -- | -- | $ | 11,424 | $ | 271,840 | |||||||||||||||||||||
| 2006 | $ | 193,830 | $ | 80,124 | $ | 15,000 | -- | -- | -- | $ | 11,630 | $ | 300,584 | ||||||||||||||||||||
| (1) | Includes $0, $0 and |
| (2) | Includes $8,000 in termination benefits for each of the fiscal years ended December 31, 2008, 2007, |
| (3) | Includes amounts as shown for Mr. Carter, Ms. Cook, and Mr. Williamson that were contributed on the employee’s behalf into the Company’s 401(k) plan. |
Employment Agreements
The Company does not have any Employment Agreements outstanding at this time.
Director Compensation
The Company did not pay any DirectorsDirectors’ fees during 2007; however, fees adopted by the Board and owed for 2007 were accrued in 2007 and paid in the first quarter of 2008. Directors’ fees for 2008 were in the form of stock options. These options were not issued until January 2009. No other form of compensation was paid to Directors for services rendered during 2008.
Compensation Committee Interlocks and Insider Participation
The members of the Compensation Committee as of December 31, 20072008 are Messrs. Robert E. Kennedy, Ghazi Sultan, Charles Goehringer, Jr., Ibrahim Al Moneef, and Mohammed O. Al Omair. None of these gentlemen serve on the Compensation Committees of any other entities. The members of the Compensation Committee are non-employee directors.
OUTSTANDING EQUITY AWARDS AT FISCAL YEAR-END
| Name | Number of Securities Underlying Unexercised Options (#) Exercisable | Number of Securities Underlying Unexercised Options (#) Unexercisable | Equity Incentive Plan Awards: Number of Securities Underlying Unexercised Unearned Options (#) | Option Exercise Price | Option Expiration Date | ||||||||||||
| Hatem El Khalidi | 400,000 | - | - | $ | 1.00 | Undetermined | |||||||||||
| Ghazi Sultan | 100,000 | - | - | $ | 2.00 | 08/28/09 | |||||||||||
OPTION EXERCISES AND STOCK VESTED
| Name | Number of Shares Acquired on Vesting (#) | Value Realized on Vesting ($) | ||||||
| Nicholas N. Carter | 20,000 | $ | 66,000 | |||||
| Connie Cook | 10,000 | $ | 33,000 | |||||
| Name | Number of Shares Acquired on Vesting (#) | Value Realized on Vesting ($) | ||||||
| Nicholas N. Carter | 20,000 | $ | 99,800 | |||||
| Connie Cook | 10,000 | $ | 49,900 | |||||
| Mark Williamson | 10,000 | $ | 49,900 | |||||
GRANTS OF PLAN-BASED AWARDS
| Name | Grant Date | All Other Stock Awards: Number of Shares of Stock or Units (#) | Grant Date Fair Value of Stock Awards | ||||||
| Nicholas N. Carter | March 20, 2007 | 20,000 | $ | 66,000 | |||||
| Connie Cook | March 20, 2007 | 10,000 | $ | 33,000 | |||||
| Name | Grant Date | All Other Stock Awards: Number of Shares of Stock or Units (#) | Grant Date Fair Value of Stock Awards | ||||||
| Nicholas N. Carter | January 15, 2008 | 20,000 | $ | 141,000 | |||||
| Connie Cook | January 15, 2008 | 10,000 | $ | 70,500 | |||||
| Mark Willaimson | January 15, 2008 | 10,000 | $ | 70,500 | |||||
ITEM 12. Security Ownership of Certain Beneficial Owners and Management and Related Stockholder Matters.
The following table sets forth, as of December 31, 2007,2008, information as to the beneficial ownership of the Company’s Common Stock by each person known by the Company to beneficially own more than 5% of the Company’s outstanding Common Stock, by each of the Company’s executive officers named in the Summary Compensation Table, by each of the Company’s directors and by all directors and executive officers of the Company as a group.
Name and Address Of Beneficial Owner | Shares Beneficially Owned (1) | Percent of Class | ||
Fahad Mohammed Saleh Al Athel c/o Saudi Fal P. O. Box 4900 Riyadh, Saudi Arabia 11412 | 3,632,953 | 15.3% | ||
Mohammad Salem ben Mahfouz c/o National Commercial Bank Jeddah, Saudi Arabia | 1,500,000 | 6.3% | ||
Harb S. Al Zuhair P.O. Box 3750 Riyadh, Saudi Arabia | 1,423,750 | 6.0% | ||
Prince Talal Bin Abdul Aziz P. O. Box 930 Riyadh, Saudi Arabia | 1,272,680 | 5.4% | ||
Hatem El Khalidi 10830 North Central Expressway, Suite 175 Dallas, Texas 75231 | 460,000(2) | 1.9% | ||
Ghazi Sultan �� P.O. Box 5360 Jeddah, Saudi Arabia 21422 | 190,000 (3) | 0.8% | ||
Nicholas N. Carter P.O. Box 1636 Silsbee, Texas 77656 | 207,918 | 0.9% | ||
Charles W. Goehringer, Jr. P.O. Box 4915 Beaumont, Texas 77704 | 32,967 | 0.1% | ||
Robert E. Kennedy. 450 Gears Rd., Suite 290 Houston, Texas 77067 | 10,000 | * | ||
Mohammed O. Al Omair. P. O. Box 4900 Riyadh, Saudi Arabia | 1,667 | * |
Name and Address Of Beneficial Owner | Shares Beneficially Owned (1) | Percent of Class | ||||||
Fahad Mohammed Saleh Al Athel c/o Saudi Fal P. O. Box 4900 Riyadh, Saudi Arabia 11412 | 3,603,568 | 15.7 | % | |||||
Mohammad Salem ben Mahfouz c/o National Commercial Bank Jeddah, Saudi Arabia | 1,500,000 | 6.6 | % | |||||
Harb S. Al Zuhair P.O. Box 3750 Riyadh, Saudi Arabia | 1,423,750 | 6.2 | % | |||||
Prince Talal Bin Abdul Aziz P. O. Box 930 Riyadh, Saudi Arabia | 1,272,680 | 5.6 | % | |||||
Hatem El Khalidi 10830 North Central Expressway, Suite 175 Dallas, Texas 75231 | 460,000 | (2) | 2.0 | % | ||||
Ghazi Sultan P.O. Box 5360 Jeddah, Saudi Arabia 21422 | 225,000 | (3) | 1.0 | % | ||||
Nicholas N. Carter P.O. Box 1636 Silsbee, Texas 77656 | 92,500 | * | ||||||
Charles W. Goehringer, Jr. P.O. Box 4915 Beaumont, Texas 77704 | 3,000 | * | ||||||
Robert E. Kennedy. 450 Gears Rd., Suite 290 Houston, Texas 77067 | - | * | ||||||||||
Mohammed O. Al Omair. P. O. Box 4900 Riyadh, Saudi Arabia | - | * | ||||||||||
| Name and Address Of Beneficial Owner | Shares Beneficially Owned (1) | Percent of Class | ||||||||||
Ibrahim Al Moneef. P. O. Box 10850 Riyadh, Saudi Arabia | - | * | 600,000 | 2.5% | ||||||||
Connie J. Cook. P. O. Box 1636 Silsbee, Texas 77656 | 20,000 | * | 32,500 | 0.1% | ||||||||
Mark Williamson. P. O. Box 1636 Silsbee, Texas 77656 | 10,000 | * | 20,000 | 0.1% | ||||||||
All directors and executive officers as a group (8 persons) | 810,500 | (4) | 3.5 | % | 1,555,052(4) | 6.6% | ||||||
| (1) | Unless otherwise indicated, to the knowledge of the Company, all shares are owned directly and the owner has sole voting and investment power. |
| (2) | Includes 400,000 shares which Mr. El Khalidi has the right to acquire through the exercise of presently exercisable stock options. Excludes 385,000 shares owned by Ingrid El Khalidi, Mr. El Khalidi’s wife, and 443,000 shares owned by relatives of Hatem El Khalidi. |
| (3) | Includes 100,000 shares which Mr. Sultan has the right to acquire through the exercise of presently exercisable stock options. |
| (4) | Includes 500,000 shares which certain directors and executive officers have the right to acquire through the exercise of stock options or other rights exercisable presently or within 60 days. Excludes 385,000 shares owned by Ingrid El Khalidi, the wife of Hatem El Khalidi, the President, Chief Executive Officer and a director of the Company, and 443,000 shares owned by relatives of Hatem El Khalidi. |
Based on its stock ownership records, the Company believes that, as of December 31, 2007,2008, Saudi Arabian stockholders currently hold approximately 57% of the Company’s outstanding Common Stock, without giving effect to the exercise of presently exercisable stock options held by certain of such stockholders. Accordingly, if all or any substantial part of the Saudi Arabian stockholders were considered as a group, they could be deemed to “control” the Company as that term is defined in regulations promulgated by the SEC. Although they have orally waived their rights, certain of the Company’s Saudi Arabian stockholders are parties to written agreements providing them with the right to purchase their proportionate share of additional shares sold by the Company.
The management of the Company has welcomed the substantial stock investment by its Saudi stockholders. Saudi investors have contributed vitally needed capital to the Company since 1974. Whether the Company’s Saudi stockholders will be a continuing source of future capital is
unknown at this time. In confronting the need for additional funds, management of the Company will follow the policy of considering all potential sources consistent with prudent business practice and the best interests of all its stockholders. In the course of considering methods of future financing and other matters relating to the operations of the Company, management of the Company anticipates that in the ordinary course of business it will receive recommendations and suggestions from its principal stockholders.
44
ITEM 13. Certain Relationships and Related Transactions.Transactions.
The Company directly owns approximately 55% of the outstanding capital stock of Pioche. Mr. Carter is currently a director and President of Pioche, and Mr. Charles Goehringer, Jr. is currently a director and Vice President of Pioche. The Company is providing funds necessary to cover the Pioche operations. During 20072008 and 2006,2007, the Company made payments of approximately $49,700$65,168 and $37,700,$49,700, respectively, for such purposes. As of December 31, 2007,2008, Pioche owed the Company $202,441$267,609 as a result of advances made by the Company. The indebtedness bears no interest.
During 2007,2008 South Hampton incurred product transportation and equipment costs of approximately $653,000$757,000 with Silsbee Trading and Transportation Corp. (STTC), a private trucking and transportation carrier in which Mr. Carter, President of TOCCO, had a 100% equity interest. Pursuant to a lease agreement, South Hampton leases transportation equipment from STTC. Lease payments at the beginning of 20072008 were approximately $52,100$69,070 per month and were raised to approximately $57,600$70,320 per month as new and additional tractors and trailers were added to the fleet throughout the year. With the increase in volume of the products produced with the new expansion of the facility which is currently underway, additional transportation equipment is expected to be required. Under the lease arrangement, STTC provides transportation equipment and all normal maintenance on such equipment and South Hampton provides drivers, fuel, management of transportation operations and insurance on the transportation equipment. Approximately 95% of STTC’s income will be derived from such lease arrangement. The lease agreement operated on a month-to-month basis until January 1, 2004, when a new five year agreement was signed. STTC also entered into a capital lease with South Hampton for acquisition of a motorized man lift. At the end of the five year lease period, title to the manlift will be transferred to South Hampton for a final payment of one dollar.
ITEM 14. Principal Accounting Fees and Services.
The table below sets forth the fees that Travis, Wolff & Company, L.L.P. (also known as Moore Stephens Travis Wolff, LLPTravisWolff, L.L.P.) billed the Company for the audit of its financial statements for the fiscal years ended December 31, 20072008 and 20062007 and the review of its financial statements for the quarterly periods in the year ended December 31, 2007,2008, and all other fees Moore Stephens Travis Wolff,TravisWolff, LLP billed the Company for services rendered during the fiscal years ended December 31, 20072008 and December 31, 2006,2007, respectively:
| 2007 | 2006 | |||||||||||
| Audit Fees | $ | 209,325 | $ | 192,176 | ||||||||
| Audit-Related Fees | $ | 0 | $ | 0 | ||||||||
| Tax Fees | $ | 23,200 | $ | 16,436 | ||||||||
| All Other Fees | $ | $ | 0 | |||||||||
| 2008 | 2007 | |||||||
| Audit Fees | $ | 335,173 | $ | 209,325 | ||||
| Audit-Related Fees | $ | 0 | $ | 0 | ||||
| Tax Fees | $ | 33,545 | $ | 23,200 | ||||
| All Other Fees | $ | 0 | $ | 0 | ||||
Under its charter, the Audit Committee must pre-approve all auditing services and permitted non-audit services (including the fees and terms thereof) to be performed for the Company by its independent auditor, subject to the de minimis exceptions for non-audit services under the Securities Exchange Act of 1934, as amended, which are approved by the Audit Committee prior to the completion of the audit. The Audit Committee may delegate authority to grant pre-approvals of audit and permitted non-audit services to subcommittees, provided that decisions of the subcommittee to grant pre-approvals must be presented to the full Audit Committee at its
45
next scheduled meeting. During 2007,2008 each new engagement of Travis, Wolff & Company, L.L.P. (also known as Moore Stephens TravisWolff, LLPL.L.P.) was approved in advance by the Audit Committee.
PART IV
ITEM 15. Exhibits, Financial Statement Schedules.
(a)1. The following financial statements are filed with this Report:
| Reports of Independent Registered Public Accounting Firm. |
| Consolidated Balance Sheets dated December 31, |
| Consolidated Statements of |
| Consolidated Statement of Stockholders’ Equity for the three years ended December 31, |
| Consolidated Statements of Cash Flows for the three years ended December 31, |
| Notes to Consolidated Financial Statements. |
2. The following financial statement schedules are filed with this Report:
| Schedule II -- Valuation and Qualifying Accounts for the three years ended December 31, |
3. Independent Auditors’ Report covering the financial statements of Productos Quimicos Coin, S.A. de C.V.
Exhibit Number | Description |
| 3(a) | - Certificate of Incorporation of the Company as amended through the Certificate of Amendment filed with the Delaware Secretary of State on July 19, 2000 (incorporated by reference to Exhibit 3(a) to the Company’s Annual Report on Form 10-K for the year ended December 31, 2000 (File No. 0-6247)). |
| 3(b) | - Restated Bylaws of the Company dated April 26, 2007 (incorporated by reference to Item 5.03 to the Company’s Form 8-K dated April 26, 2007 (File No. 0-6247)). |
| 10(a) | - Loan Agreement dated January 24, 1979 between the Company, National Mining Company and the Government of Saudi Arabia (incorporated by reference to Exhibit 10(b) to the Company’s Annual Report on Form 10-K for the year ended December 31, 1999 (File No. 0-6247)). |
Exhibit
48
POWER OF ATTORNEY KNOW ALL MEN BY THESE PRESENTS that each of Arabian American Development Company, a Delaware corporation, and the undersigned directors and officers of Arabian American Development Company, hereby constitutes and appoints Nicholas Carter its or his true and lawful attorney-in-fact and agent, for it or him and in its or his name, place and stead, in any and all capacities, with full power to act alone, to sign any and all amendments to this Report, and to file each such amendment to the Report, with all exhibits thereto, and any and all other documents in connection therewith, with the Securities and Exchange Commission, hereby granting unto said attorney-in-fact and agent full power and authority to do and perform any and all acts and things requisite and necessary to be done in and about the premises as fully to all intents and purposes as it or he might or could do in person, hereby ratifying and confirming all that said attorney-in-fact and agent may lawfully do or cause to be done by virtue hereof. SIGNATURES Pursuant to the requirements of Section 13 or 15(d) of the Securities Exchange Act of 1934, the Company has duly caused this Report to be signed on its behalf by the undersigned, thereunto duly authorized. ARABIAN AMERICAN DEVELOPMENT COMPANY
Hatem El Khalidi President and Chief Executive Officer Pursuant to the requirements of the Securities Exchange Act of 1934, this Report has been signed below by the following persons on behalf of the Company in the capacities indicated on March
REPORT OF INDEPENDENT REGISTERED PUBLIC ACCOUNTING FIRM Board of Directors Arabian American Development Company and Subsidiaries Dallas, Texas We have audited the accompanying consolidated balance sheets of Arabian American Development Company and Subsidiaries (the We conducted our audits in accordance with the standards of the Public Company Accounting Oversight Board (United States). Those standards require that we plan and perform the In our opinion, the consolidated financial statements referred to above present fairly, in all material respects, the consolidated financial position of Arabian American Development Company and Subsidiaries as of December 31, We also have audited, in accordance with the standards of the Public Company Accounting Oversight Board (United States), Arabian American Development Company and Subsidiaries’ internal control over financial reporting as of December 31, As discussed in /s/ Dallas, Texas March 13, F-1 REPORT OF INDEPENDENT REGISTERED PUBLIC ACCOUNTING FIRM Board of Directors Arabian American Development Company and Subsidiaries Dallas, Texas We have audited Arabian American Development Company and Subsidiaries’ internal control over financial reporting as of December 31, We conducted our audit in accordance with the standards of the Public Company Accounting Oversight Board (United States). Those standards require that we plan and perform the audit to obtain reasonable assurance about whether effective internal control over financial reporting was maintained in all material respects. Our audit of internal control over financial reporting included obtaining an understanding of internal control over financial reporting, assessing the risk that a material weakness exists, and testing and evaluating the design and operating effectiveness of internal control based on A company’s internal control over financial reporting is a process designed to provide reasonable assurance regarding the reliability of financial reporting and the preparation of financial statements for external purposes in accordance with generally accepted accounting principles. A company’s internal control over financial reporting includes those policies and procedures that (1) pertain to the maintenance of records that, in reasonable detail, accurately and fairly reflect the transactions and dispositions of the assets of the company; (2) provide reasonable assurance that transactions are recorded as necessary to permit preparation of financial statements in accordance with generally accepted accounting principles, and that receipts and expenditures of the company are being made only in accordance with authorizations of management and directors of the company; and (3) provide reasonable assurance regarding prevention or timely detection of unauthorized acquisition, use, or disposition of the company’s assets that could have a material effect on the financial statements. Because of its inherent limitations, internal control over financial reporting may not prevent or detect misstatements. Also, projections of any evaluation of effectiveness to future periods are subject to the risk that controls may become inadequate because of changes in conditions, or that the degree of compliance with the policies or procedures may deteriorate. In our opinion, Arabian American Development Company maintained, in all material respects, effective internal control over financial reporting as of December 31, F-2 We have also audited, in accordance with the standards of the Public Company Accounting Oversight Board (United States), the consolidated balance sheets and the related consolidated statements of income, stockholders’ equity and cash flows of Arabian American Development Company, and our report dated March 13, /s/ Travis, Wolff & Company, L.L.P. (also known as Moore Stephens Dallas, Texas March 13, 2009 F-3 ARABIAN AMERICAN DEVELOPMENT COMPANY AND SUBSIDIARIES CONSOLIDATED BALANCE SHEETS
See notes to the consolidated financial statements. F-4 ARABIAN AMERICAN DEVELOPMENT COMPANY AND SUBSIDIARIES CONSOLIDATED BALANCE SHEETS - Continued
See notes to the consolidated financial statements. F-5 ARABIAN AMERICAN DEVELOPMENT COMPANY AND SUBSIDIARIES CONSOLIDATED STATEMENTS OF For the years ended December 31,
See notes to the consolidated financial statements. F-6
ARABIAN AMERICAN DEVELOPMENT COMPANY AND SUBSIDIARIES CONSOLIDATED STATEMENT OF STOCKHOLDERS’ EQUITY For the years ended December 31, 2008, 2007,
See notes to the consolidated financial statements. ARABIAN AMERICAN DEVELOPMENT COMPANY AND SUBSIDIARIES CONSOLIDATED STATEMENTS OF CASH FLOWS For the years ended December 31,
See notes to the consolidated financial statements. ARABIAN AMERICAN DEVELOPMENT COMPANY AND SUBSIDIARIES CONSOLIDATED STATEMENTS OF CASH FLOWS - continued For the years ended December 31,
See notes to the consolidated financial statements.
Arabian American Development Company (the “Company”) was organized as a Delaware corporation in 1967. The Company’s principal business activities include manufacturing various specialty petrochemical products (also referred to as the “Petrochemical Segment”) and developing mineral properties in Saudi Arabia and the United States (also referred to as the “Mining Segment”). All of its mineral properties are presently undeveloped and require significant capital expenditures before beginning any commercial operations (see Notes 2, 8 and 9). In December 2008 mining assets located in Saudi Arabia were transferred into a joint stock company “Al Masane Al Kobra” (AMAK) of which the Company owns fifty percent. The Company’s Petrochemical Segment activities are primarily conducted through a wholly-owned subsidiary, American Shield Refining Company (the “Petrochemical Company”), which owns all of the capital stock of Texas Oil and Chemical Co. II, Inc. (“TOCCO”). TOCCO owns all of the capital stock of South Hampton Resources Inc. (“South Hampton”), and Summary of Significant Accounting Policies Principles of Consolidation – The Company evaluates its equity and other contractual relationships in order to determine whether the guidelines of FASB Interpretation (“FIN”) No. 46, “Consolidation of Variable Interest Entities,” as revised under FIN 46R, should be applied in the consolidated financial statements. FIN 46R addresses consolidation by business enterprises of variable interest entities that possess certain characteristics. A variable interest entity is defined as an entity in which equity investors do not have the characteristics of a controlling financial interest or do not have sufficient equity at risk for the entity to finance its activities without additional subordinated financial support. The primary beneficiary is required to consolidate the financial position and results of the variable interest entity. The Company consolidates its wholly owned interests and all inter-company accounts are eliminated in consolidation. Cash, Cash Equivalents and Short-Term Investments - The Company’s principal banking and short-term investing activities are with local and national financial institutions. Short-term investments with an original maturity of three months or less are classified as cash equivalents. At December 31, Inventories - Finished products and feedstock are recorded at the lower of cost, determined on the last-in, first-out method (LIFO) Accounts Receivable and Allowance for Doubtful Accounts – The Company evaluates the collectibility of its accounts receivable and adequacy of the allowance for doubtful accounts based upon historical experience and any specific customer financial difficulties of which the Company NOTE 1 - BUSINESS AND OPERATIONS OF THE COMPANY AND SUMMARY OF SIGNIFICANT ACCOUNTING POLICIES – Continued becomes aware. For the years ended December 31, 2008 and 2007, the allowance balance was increased by $465,000 and $0, respectively. Notes Receivable – The Company periodically makes changes in or expands its toll processing units at the request of the customer. The cost to make these changes is shared by the customer. Upon completion of the project a non-interest note receivable is recorded with an imputed interest rate. Interest rates used on outstanding notes at December 31, Mineral Exploration and Development Costs - All costs related to the acquisition, exploration, and development of mineral deposits are capitalized until such time as (1) the Company commences commercial exploitation of the related mineral deposits at which time the costs will be amortized, (2) the related project is abandoned and the capitalized costs are charged to operations, or (3) when any or all deferred costs are permanently impaired. In December 2008 all Saudi mining costs were transferred to the Company’s investment in AMAK. At December 31, Plant, Pipeline and Equipment - - Plant, pipeline and equipment are stated at cost. Depreciation is provided over the estimated service lives using the straight-line method. Gains and losses from disposition are included in operations in the period incurred. Maintenance and repairs are expensed as incurred. Major renewals and improvements are capitalized. Interest costs incurred to finance expenditures during construction phase are capitalized as part of the historical cost of constructing the assets. Construction commences with the development of the design and ends when the assets are ready for use. Capitalized interest costs are included in property, pipeline and equipment and are depreciated over the service life of the related assets. Platinum catalyst is included in property, pipeline and equipment at cost. Amortization of the catalyst is based upon Other Assets - Other assets include a license used in petrochemical operations and certain petrochemical assets. Long-Lived Assets Impairment - Long-lived assets are reviewed for impairment whenever events or changes in circumstances indicate that the carrying amount may not be recoverable, in accordance with the Statement of Financial Accounting Standards No. 144 (SFAS 144), “Accounting for the Impairment or Disposal of Long-Lived Assets.” An impairment loss would be recognized when the carrying amount of an asset exceeds the estimated undiscounted future cash flows expected to result from the use of the asset and its eventual disposition. F-11 NOTE 1 - BUSINESS AND OPERATIONS OF THE COMPANY AND SUMMARY OF SIGNIFICANT ACCOUNTING POLICIES – Continued The amount of the impairment loss to be recorded is calculated by the excess of the asset's carrying value over its fair value. Fair value is generally determined using a discounted cash flow Revenue recognition - Sales of petrochemicals are recorded when title passes to the customer. Revenue associated with processing fees is recognized in the period the service is performed. Sales are presented net of discounts and allowances. Freight costs billed to customers are recorded as a component of revenue. Shipping and handling costs - Shipping and handling cost are classified as cost of petrochemical product sales and processing and are expensed as incurred. Retirement plan – The Company offers employees the benefit of participating in a 401(K) plan. The Company matches 100% up to 6% of pay with vesting occurring over 7 years. As of December 31, 2008, 2007, Environmental Liabilities - Remediation costs are accrued based on estimates of known environmental remediation exposure. Ongoing environmental compliance costs, including maintenance and monitoring costs, are expensed as incurred. Other Liabilities – The Company periodically makes changes in or expands its toll processing units at the request of the customer. The cost to make these changes is shared by the customer. Upon completion of the project a note receivable and a deferred liability are recorded to recover the project costs which were Net Income Per Share - The Company computes basic income per common share based on the weighted-average number of common shares outstanding. Diluted income per common share is computed based on the weighted-average number of common shares outstanding plus the number of additional common shares that would have been outstanding if potential dilutive Foreign Currency and Operations - The functional currency for each of the Company’s subsidiaries is the US dollar. Transaction gains or losses as a result of conversion from the subsidiaries local currency to the US dollar are reflected in the statements of income as a foreign exchange transaction gain or loss. The Company does not employ any practices to minimize foreign currency risks. As of December 31, The Company’s foreign operations have been, and will continue to be, affected by periodic changes or developments in the foreign countries’ political and economic conditions, as well as, changes in their laws and regulations. Any such changes could have a material adverse effect on the Company’s financial condition, operating results, or cash flows. Saudi Arabian investors, including certain members of the Company’s Board of Directors, own approximately 57% of the Company’s outstanding common stock at both December 31, 2008 and 2007. NOTE 1 - BUSINESS AND OPERATIONS OF THE COMPANY AND SUMMARY OF SIGNIFICANT ACCOUNTING POLICIES – Continued When the Company’s carrying value in an equity method Investee company is reduced to zero, no further losses are recorded in the Company’s consolidated financial statements unless the Company guaranteed obligations of the Investee company or has committed additional funding. When the Investee company subsequently reports income, the Company will not record its share of such income until it equals the amount of its share of losses not previously recognized. Management Estimates - The preparation of consolidated financial statements in conformity with accounting principles generally accepted in the United States of America requires management to make estimates and assumptions that affect the reported amounts of assets and liabilities and disclosure of contingent assets and liabilities at the date of the consolidated financial statements and the reported amounts of revenues and expenses during the reporting period. Significant estimates include allowance for doubtful accounts Share-Based Compensation – On January 1, 2006, the Company adopted Statement of Financial Accounting Standards No. 123R, “Share-Based Payments” on a prospective basis. Prior to January 1, 2006, the Company had applied the intrinsic value method prescribed by Accounting Principles Board Opinion No. 25 and has adopted the disclosure requirements of Statement of Financial Accounting Standards (SFAS) No. 123, as amended by Statement of Financial Accounting Standards No. 148. Accordingly, the compensation expense of any employee stock options granted is the excess, if any, of the quoted market price of the Company’s common stock at the grant date over the amount the employee must pay to acquire the stock. See Note 14 for additional information relating to stock options. Share-based compensation expense recognized during the period is based on the fair value of the portion of share-based payments awards that is ultimately expected to vest. Share-based compensation expense recognized in the consolidated statement of Derivatives - Statement of Financial Accounting Standard (SFAS) No. 133, “Accounting for Derivative Instruments and Hedging Activities,” as amended by SFAS Nos. 138 and 149, establishes accounting and reporting standards for derivative instruments and hedging activities. SFAS No. 133 establishes accounting and reporting standards requiring that every derivative instrument be recorded in the balance sheet as either an asset or liability measured at its fair value. The statement requires that changes in the derivative instrument’s fair value be recognized currently in earnings unless specific F-13
hedge accounting criteria are met. Special accounting for qualifying hedges allows a derivative instrument’s gains and losses to offset related results on the hedged item in the income statement, to the extent effective, and requires that a company must formally document, designate and assess the effectiveness of transactions that receive hedge accounting. Income Taxes – Deferred tax assets and liabilities are recognized for the future tax consequences attributable to differences between the financial statement carrying amounts of existing assets and liabilities and their respective tax bases. Deferred tax assets and liabilities are measured using enacted tax rates expected to apply to taxable income in the years in which those temporary differences are expected to be recovered or settled. The effect on deferred tax assets and liabilities of a change in tax rates is recognized in income in the period that includes the enactment date. A valuation allowance is recorded if there is uncertainty as to the realization of deferred tax assets. Fair Value of Financial Instruments – The Company’s consolidated financial instruments include cash, cash equivalents, notes payable and long-term debt. The carrying amount of cash, cash equivalents and variable rate long-term debt approximates fair value at December 31, New Accounting Pronouncements measurements. In February 2008 the In October 2008 the In December 2007 F-14
Combinations.” SFAS 160 is effective for fiscal years, and interim periods within those fiscal years, beginning on or after December 15, 2008, with earlier adoption prohibited. The Company is currently evaluating the impact adoption of SFAS 160 may have on the consolidated financial statements. In December 2007 The Company is currently evaluating the impact adoption of SFAS 141(R) may have on the consolidated financial statements. In March 2008 FASB issued SFAS No. 161, “Disclosures about Derivative Instruments and Hedging Activities, an amendment of FASB Statement No. 133” (“SFAS 161”). SFAS 161 requires enhanced disclosures about an entity’s derivative and hedging activities. Entities will be required to provide enhanced disclosures about: (a) how and why an entity uses derivative instruments; (b) how derivative instruments and related hedge items are accounted for under SFAS 133 and its related interpretations; and (c) how derivative instruments and related hedge items affect an entity’s financial position, financial performance and cash flows. The Company is required to adopt SFAS 161 beginning in fiscal year 2009. The Company is currently evaluating the impact adoption of SFAS 161 may have on the consolidated financial statements. In May 2008 the FASB issued Statement No. 162, “The Hierarchy of Generally Accepted Accounting Principles” (“SFAS 162”). The new standard is intended to improve financial reporting by identifying a consistent framework, or hierarchy, for selecting accounting principles to be used in preparing financial statements that are presented in conformity with U.S. generally accepted accounting principles (GAAP) for nongovernmental entities. Prior to the issuance of SFAS 162, GAAP hierarchy was defined in the American Institute of Certified Public Accountants (AICPA) Statement on Auditing Standards (SAS) No. 69, The Meaning of Present Fairly in Conformity With Generally Accepted Accounting Principles. SAS 69 has been criticized because it is directed to the auditor rather than the entity. SFAS 162 addresses these issues by establishing that GAAP hierarchy should be directed to entities because it is the entity (not its auditor) that is responsible for selecting accounting principles for financial statements that are presented in conformity with GAAP. SFAS 162 is effective November 15, 2008 and is only effective for nongovernmental entities; therefore, the GAAP hierarchy will remain in SAS No. 69 for state and local governmental entities and federal governmental entities. SFAS 162 did not have a material impact on the Company’s consolidated financial statements upon adoption. In June 2008 the FASB issued FSP Emerging Issues Task Force (“EITF”) 03-6-1, “Determining Whether Instruments Granted in Share-Based Payment Transactions Are Participating Securities” (“FSP EITF 03-6-1”). FSP EITF 03-6-1 provides that unvested share-based payment awards that contain nonforfeitable rights to dividends or dividend equivalents (whether paid or unpaid) are participating securities and shall be included in the computation of earnings per share pursuant to the two-class method. FSP EITF 03-6-1 is effective for fiscal years beginning after December 15, 2008, F-15
and interim periods within those years. Upon adoption, a company is required to retrospectively adjust its earnings per share data (including any amounts related to interim periods, summaries of earnings and selected financial data) to conform to the provisions of FSP EITF 03-6-1. The Company is currently evaluating the impact adoption of FSP EITF 03-6-1 may have on the consolidated financial statements. In November 2008 the FASB ratified the consensus reached in EITF 08-06, “Equity Method Investment Accounting Considerations” (“EITF 08-06”). EITF 08-06 was issued to address questions that arose regarding the application of the equity method subsequent to the issuance of SFAS 141(R). EITF 08-06 concluded that equity method investments should continue to be recognized using a cost accumulation model, thus continuing to include transaction costs in the carrying amount of the equity method investment. In addition, EITF 08-06 clarifies that an impairment assessment should be applied to the equity method investment as a whole, rather than to the individual assets underlying the investment. EITF 08-06 is effective for fiscal years beginning on or after December 15, 2008. EITF 08-06 will not have a material impact on the Company’s consolidated financial statements upon adoption. NOTE 2 - LIQUIDITY MATTERS, REALIZATION OF ASSETS AND BUSINESS RISKS The accompanying consolidated financial statements have been prepared in conformity with accounting principles generally accepted in the United States of America which contemplate the realization of assets and the satisfaction of liabilities in the normal course of business. As shown in the financial statements, the Company had an excess of current assets over current liabilities of
Over the last F-16 NOTE 2 - LIQUIDITY MATTERS, REALIZATION OF ASSETS AND BUSINESS RISKS The obligation on the financial swaps which are due at the end of January through March of 2009 results in a cash outlay each month of approximately $1.9 million split between two trading partners. The Company has sufficient cash on hand and cash from operations to ensure that it is able to make such payments timely. Additionally, as a safe guard, the Company has received a temporary extension of its line of credit with the bank which will The earnings of the Petrochemical Segment have been sufficient to provide working capital for the operation of the business and for the addition of needed capital improvements. Certain former lenders had restrictions on the amount of dividends the Petrochemical Segment was allowed to pass to the Company. NOTE 3 - CONCENTRATIONS OF REVENUES AND CREDIT RISK The Petrochemical Segment sells its products and services to companies in the chemical and plastics industries. It performs periodic credit evaluations of its customers and generally does not require collateral from its customers. For the year ended December 31, 2008, two customers accounted for 13.2% and 10.6% of total product sales. For the year ended December 31, 2007, two customers accounted for 13.9% and 12.2% of total product sales. For the year ended December 31, 2006, two customers accounted for 10.5% and South Hampton utilizes one major supplier for its feedstock supply. The feedstock is a commodity product commonly available from other suppliers if needed. The percentage of feedstock purchased from the supplier during 2008, 2007, The Company holds its cash with various financial institutions that are insured by the Federal Deposit Insurance Corporation up to F-17 NOTE 4 – FAIR VALUE MEASUREMENTS As discussed in Note 1, “New Accounting Pronouncements,” the Company adopted SFAS 157 effective January 1, 2008, with the exception of the application to non-financial assets and liabilities measured at fair value on a nonrecurring basis (such as other real estate owned and goodwill and other intangible assets for impairment testing) in accordance with FSP 157-2. SFAS 157 defines fair value, establishes a framework for measuring fair value, and expands disclosures about fair value measurements. SFAS 157 applies to reported balances that are required or permitted to be measured at fair value under existing accounting pronouncements; accordingly, the standard amends numerous accounting pronouncements but does not require any new fair value measurements of reported balances. SFAS 157 emphasizes that fair value, among other things, is based on exit price versus entry price, should include assumptions about risk such as nonperformance risk in liability fair values, and is a market-based measurement, not an entity-specific measurement. When considering the assumptions that market participants would use in pricing the asset or liability, SFAS 157 establishes a fair value hierarchy that distinguishes between market participant assumptions based on market data obtained from sources independent of the reporting entity (observable inputs that are classified within Levels 1 and 2 of the hierarchy) and the reporting entity’s own assumptions about market participant assumptions (unobservable inputs classified within Level 3 of the hierarchy). The fair value hierarchy prioritizes inputs used to measure fair value into three broad levels.
In instances where the determination of the fair value measurement is based on inputs from different levels of the fair value hierarchy, the level in the fair value hierarchy within which the entire fair value measurement falls is based on the lowest level input that is significant to the fair value measurement in its entirety. The Company’s assessment of the significance of a particular input to the fair value measurement in its entirety requires judgment and considers factors specific to the asset or liability. Commodity Financial Instruments South Hampton periodically enters into financial instruments to hedge the cost of natural gasoline (the primary feedstock) and natural gas (used as fuel to operate the plant). South Hampton uses financial swaps on feedstock and options on natural gas to limit the effect of significant fluctuations in price on operating results. In the third quarter of 2008 the Company also began using crude oil options as a method of hedging feedstock prices over longer periods of time. South Hampton has not designated these financial instruments as hedging transactions under FAS 133. South Hampton assesses the fair value of the financial swaps on feedstock using quoted prices in active markets for identical assets or liabilities (Level 1 of fair value hierarchy). South Hampton assesses the fair value of the options held to purchase crude oil using a pricing valuation model. This valuation model considers various assumptions, including publicly available forward prices for crude, time value, F-18 NOTE 4 – volatility factors and current market and contractual prices for the underlying instrument, as well as other relevant economic measures (Level 2 of fair value hierarchy). Interest Rate Swaps In The following items are measured at fair value on a recurring basis subject to disclosure requirements of SFAS 157 at December 31, 2008. Assets and Liabilities Measured at Fair Value on a Recurring Basis
The Company has consistently applied valuation techniques in all periods presented and believes it has obtained the most accurate information available for the NOTE 5 - INVENTORIES Inventories include the following at December 31:
Inventory serving as collateral for the Company’s line of credit with a domestic bank was At December 31, 2008, the Company recorded a charge of approximately $1,786,000 to reduce inventory to net realizable value. At December 31, 2007, F-19 NOTE 6 – NOTES RECEIVABLE Notes receivable balances at December 31 were:
NOTE 7 – PROPERTY, PIPELINE AND EQUIPMENT
Property, pipeline, and equipment serve as collateral for a F-20 NOTE 7 – PROPERTY, PIPELINE AND EQUIPMENT - continued Interest capitalized for construction for In August 2007 a contract was entered into for the construction of additional office space at the South Hampton facility. The total amount of the contract was approximately $1.0 million. The Company completed its expansion of the petrochemical facility in October 2008 for a total cost of approximately $18.0 million which is included in property, pipeline and equipment. NOTE 8 - MINERAL EXPLORATION AND DEVELOPMENT COSTS IN SAUDI ARABIA/INVESTMENT IN AL MASANE AL KOBRA MINING COMPANY (“AMAK”) In the accompanying consolidated financial statements, the deferred exploration and development costs have been presented based on the related projects’ geographic location within Saudi Arabia. This includes the “Al Masane Project” (the “Project”) and “Other Interests in Saudi Arabia” which primarily pertains to the costs of rentals, field offices and camps, core drilling and labor incurred at the Wadi Qatan and Jebel Harr properties. All of these costs were transferred to the Company’s Investment in AMAK (called ALAK in prior years) in December 2008. The following is some background of the Saudi mining assets. Al Masane Project The Project, consisting of a mining lease area of approximately 44 square kilometers, contains extensive ancient mineral workings and smelters. From ancient inscriptions in the area, it is believed that mining activities went on sporadically from 1000 BC to 700 AD. The ancients are believed to have extracted mainly gold, silver and copper. The Project includes various quantities of proved zinc, copper, gold and silver reserves. lease is that repayment of this loan will be made in accordance with a repayment schedule to be agreed upon with the Saudi Arabian government from (20) years. Under the lease, the Company is obligated to pay advance surface rental in the amount of 10,000 Saudi Riyals (approximately $2,667) per square kilometer per year (approximately $117,300 annually) during the period of the lease. The F-21 NOTE 8 - MINERAL EXPLORATION AND DEVELOPMENT COSTS IN SAUDI ARABIA/INVESTMENT IN AL MASANE AL KOBRA MINING COMPANY (“AMAK”) – continued In late 2007 the Company and eight Saudi investors formed a Saudi joint stock company under the name Al Masane Al Kobra Mining Company the Chairman of Deferred exploration and development costs of the Al Masane Project at December 31, 2008, 2007
Other Interests in Saudi Arabia In 1971 the Saudi Arabian government awarded the Company exclusive mineral exploration licenses to explore and develop the Wadi Qatan area in southwestern Saudi Arabia. The Company was subsequently awarded an additional license in 1977 for an area north of Wadi Qatan at Jebel Harr. These licenses have expired. On June 22, 1999, the Company submitted a formal application for a five-year exclusive exploration license for the Greater Al Masane area of approximately 2,850 square F-22 NOTE 8 - MINERAL EXPLORATION AND DEVELOPMENT COSTS IN SAUDI ARABIA/INVESTMENT IN AL MASANE AL KOBRA MINING COMPANY (“AMAK”) – continued kilometers that surrounds the Al Masane mining lease area and includes the Wadi Qatan and Jebel Harr areas. Although a license has not been formally granted for the Greater Al Masane area, the Company has been authorized in writing by the Saudi Arabian government to carry out exploration work on the area. The Company previously worked the Greater Al Masane area after obtaining written authorization from the Saudi Ministry of Petroleum and Mineral Resources, and has expended over $2 million in exploration work. Geophysical, geochemical and geologic work and diamond core drilling on the Greater Al Masane area has revealed mineralization similar to that discovered at Al Masane. The license to develop the areas identified by the exploration work will be applied for by The Company on August 5, 2006, signed a one year Financial and Legal Services and Advice Agreement with a Saudi legal firm and a Saudi management consultant in Saudi Arabia to facilitate the: (1) formation of AMAK, (2) transfer of the mining assets and lease into AMAK, and (3) raising of additional capital. The attorney and consultant are to be paid in stock issued by the Company and up to one million shares will be issued in increments as each step is completed. The agreement has been extended on a month to month basis and remains in effect. As of December 31, 2008, 750,000 shares have been issued in payment due to the formation of AMAK and transfer of assets and lease into AMAK. Stock issued had a value of $3,712,500 using the Company’s closing stock price on the date of the issuance of the commercial license and approval of the transfer. The Company accounts for its investment in AMAK using the equity method of accounting. Accordingly, the investment in AMAK is carried at the cost of the net transferred assets and will be adjusted for the Company’s proportionate share of income or loss and reduced for any distributions received. The audited financial statements are not yet available for AMAK; however, management believes their proportionate share of income or loss is not significant for the year ended December 31, 2008. NOTE 9 - MINERAL PROPERTIES IN THE UNITED STATES The principal assets of Pioche are an undivided interest in 48 patented and 5 unpatented mining claims totaling approximately 1,500 acres, and a 300 ton-per-day mill located on the aforementioned properties in the Pioche Mining District in southeast Nevada. In August 2001, 75 unpatented claims were abandoned since they were deemed to have no future value to Pioche. Due to the lack of capital, the properties held by Pioche have not been commercially operated for approximately 35 years. The F-23 NOTE 9 - MINERAL PROPERTIES IN THE UNITED STATES – continued Company has recorded NOTE 10 - NOTES PAYABLE, LONG-TERM DEBT AND LONG-TERM OBLIGATIONS Notes payable, long-term debt and long-term obligations at December 31 are summarized as follows:
F-24
is allowing the Company until mid-June 2009 to repay the overage. Subsequent to year end the Company paid approximately $2.5 million of this amount with approximately $1.5 million outstanding. Interest is paid monthly. Covenants that must be maintained include EBITDA, capital expenditures, dividends payable to parent, and leverage ratio. | |||||||||||||||||||||||||||||||||||||||||||||||||||||||||||||||||||||||||||||||||||||||||||||||||||||||||||||||||||||||||||||||||||||||||||||||||||||||||||||||||||||||||||||||||||||||||||||||||||||||||||||||||||||||||||||||||||||||||||||||||||||||||||||||||||||||||||||||||||||||||||||||||||||||||||||||||||||||||||||||||||||||||||||||||||||||||||||||||||||||||||||||||||||||||||||||||||||||||||||||||||||||||||||||||||||||||||||||||||||||||||||||||||||||||||||||||||||||||||||||||||||||||||||||||||||||||||||||||||||||||||||||||||||||||||||||||||||||||||||||||||||||||||||||||||||||||||||||||||||||||||||||||||||||||||||||||||||||||||||||||||||||||||||||||||||||||||||||||||||||||||||||||||||||||||||||||||||||||||||||||||||||||||||||||||||||||||||||||||||||||||||||||||||||||||||||||||||||||||||||||||||||||||||||||||||||||||||||||||||||||||||||||||||||||||||||||||||||||||||||||||||||||||||||||||||||||||||||||||||||||||||||||||||||||||||||||||||||||||||||||||||||||||||||||||||||||||||||||||||||
| On September 19, 2007 South Hampton entered into a $10.0 million term loan agreement with a domestic bank to finance the expansion of the petrochemical facility. An amendment was entered into on November 26, 2008 which increased the term loan to $14.0 million due to the increased cost of the expansion. This note is secured by property, |
| Principal payments of long-term debt for the next five years and thereafter ending December 31 are as follows: |
Year Ending December 31, | Long-Term Debt | Capital Lease Obligations | ||||||
| 2008 | $ | -- | $ | 33,471 | ||||
| 2009 | 223,384 | 19,523 | ||||||
| 2010 | 6,296,402 | -- | ||||||
| 2011 | 252,883 | -- | ||||||
| 2012 | 2,286,057 | -- | ||||||
| Total | $ | 9,058,726 | 52,994 | |||||
| Less: Amount representing interest | (3,410 | ) | ||||||
| Present value of future minimum lease payments | $ | 49,584 | ||||||
Year Ending December 31, | Long-Term Debt | Capital Lease Obligations | ||||||
| 2009 | $ | 4,901,432 | $ | 19,523 | ||||
| 2010 | 12,032,147 | -- | ||||||
| 2011 | 1,294,165 | -- | ||||||
| 2012 | 1,333,528 | -- | ||||||
| 2013 | 1,374,057 | -- | ||||||
| Thereafter | 7,523,397 | -- | ||||||
| Total | $ | 28,458,726 | 19,523 | |||||
| Less: Amount representing interest | (513 | ) | ||||||
| Present value of future minimum lease payments | $ | 19,010 | ||||||
| NOTE 11 – ACCRUED LIABILITIES |
Accrued liabilities at December 31 are summarized as follows:
| 2007 | 2006 | |||||||
| Accrued state taxes | $ | 258,407 | $ | 554,453 | ||||
| Accrued operating costs | 275,000 | 200,000 | ||||||
| Accrued payroll | 539,947 | 251,971 | ||||||
| Accrued directors’ fees | 288,250 | -- | ||||||
| Post retirement obligation | 180,000 | -- | ||||||
| Accrued officers’ compensation | 100,000 | -- | ||||||
| Other liabilities | 290,218 | 203,630 | ||||||
| Total | $ | 1,931,822 | $ | 1,210,054 | ||||
| 2008 | 2007 | |||||||
| Accrued state taxes | $ | 147,221 | $ | 258,407 | ||||
| Accrued operating costs | -- | 275,000 | ||||||
| Accrued payroll | 514,218 | 539,947 | ||||||
| Accrued directors’ fees | -- | 288,250 | ||||||
| Post retirement obligation | -- | 180,000 | ||||||
| Accrued officers’ compensation | -- | 100,000 | ||||||
| Other liabilities | 368,251 | 290,218 | ||||||
| Total | $ | 1,029,690 | $ | 1,931,822 | ||||
F-25
NOTE 12 – ACCRUED LIABILITIES IN SAUDI ARABIA
Accrued liabilities in Saudi Arabia at December 31 are summarized as follows:
| 2007 | 2006 | |||||||
| Salaries | $ | 603,147 | $ | 866,376 | ||||
| Termination benefits | 783,170 | 758,397 | ||||||
| Other liabilities | 20,484 | 20,484 | ||||||
| Total | $ | 1,406,801 | $ | 1,645,257 | ||||
| 2008 | 2007 | |||||||
| Salaries | $ | 602,503 | $ | 603,147 | ||||
| Termination benefits | 807,944 | 783,170 | ||||||
| Other liabilities | 18,709 | 20,484 | ||||||
| Total | $ | 1,429,156 | $ | 1,406,801 | ||||
NOTE 13 - COMMITMENTS AND CONTINGENCIES
South Hampton has leased, on a month to month basis, various vehicles and equipment from Silsbee Trading and Transportation Corp. (“STTC”), a trucking and transportation company currently owned by the President of TOCCO, at a monthly cost which varies according to the amount of equipment in service. Effective January 1, 2004, South Hampton and STTC entered into a five year lease agreement requiring a monthly rental of $32,835 which was raised to approximately $57,600$70,320 per month at December, 2008, as new and additional tractors and trailers were added to the fleet throughout the years. Total rental costs were approximately $757,000 in 2008, $653,000 in 2007, and $606,000 in 2006 and $507,000 in 2005 (see Note 19).
South Hampton, in 1977, guaranteed a $160,000 note payable of a limited partnership in which it has a 19% interest. Included in Accrued Liabilities at December 31, 2008 and 2007 is $66,570 related to this guaranty.
In May 2006 a $25,000 irrevocable standby letter of credit was issued by a bank in favor of the Railroad Commission of Texas for Gulf State Pipeline operations. The letter of credit was renewed and will expire on July 31, 2009.
Litigation - -
A lawsuit was filed in Jefferson County, Texas in September of 2007 alleging the plaintiff was exposed to benzene due to the negligence of the Company. A preliminary review indicates the Company had no connection to the plaintiff and the Company intends to vigorously defend itself. Insurance policies have provided the defense on the Company’s behalf. The plaintiff filed a notice of “No Suit” which was finalized in August of 2008.
In September 2008 the Bankruptcy Trustee for a former customer filed suit in the U. S. Bankruptcy Court in Delaware to recover approximately $1,388,000 of preference payments. The Company contends the payments were made in the ordinary course of business and feels it has adequate defense to prevent any material refunds of amounts collected during the time period in question. Negotiations are underway to settle the suit for an immaterial amount.
There were no defense or settlement costs recorded in 2008, 2007 or 2006.
Environmental remediation - In 1993, at the request of the Texas Commission on Environmental Quality (“TCEQ”), South Hampton drilled a well to check for groundwater contamination under a spill area. Based on the results, two pools of hydrocarbons were discovered. The recovery process was initiated in June 1998, and is expected to continue for many years until the pools are reduced to an acceptable level.
NOTE 13 - COMMITMENTS AND CONTINGENCIES - Continued
Year Ending December 31 | ||||
| 2008 | $ | 808,500 | ||
| 2009 | 117,300 | |||
| 2010 | 117,300 | |||
| 2011 | 117,300 | |||
| 2012 | 117,300 | |||
| Thereafter | 1,290,300 | |||
| Total | $ | 2,568,000 | ||
In May 2006, a $25,000 irrevocable standby letter of credit was issued by a bank in favor ofAugust 1997 the Railroad Commission of Texas for Gulf State Pipeline operations. The letter of credit was renewed and will expire on July 31, 2008.
Amounts charged to expense for various activities related to environmental monitoring, compliance, and improvements were approximately $518,000 in 2008, $439,000 in 2007 and $372,200 in 2006 and $285,500 in 2005.2006.
NOTE 14 - SHARE-BASED COMPENSATION
Common Stock – In January 2008 the Company issued 30,001 shares of its common stock to non-employee directors as settlement for accrued compensation at December 31, 2007 for services rendered in their capacity as directors. During the same time period, the Company issued 40,000 shares of its common stock to certain employees and executives of the Company for services rendered. Compensation expense recognized in connection with this issuance was $282,000. The Company also issued 750,000 shares of its common stock during 2008 for payment in connection with the “Financial and Legal Services and Advice Agreement” between the Company and consultants working to secure the commercial license and transfer of assets to AMAK. The Company recorded $3,712,500 in its Investment in AMAK in relation to this transaction.
In January 2007 the Company issued 30,000 shares of its common stock to certain employees and executives of the Company for services rendered. Compensation expense recognized in connection with these issuances of common stock was $99,000.
In January 2006 the Company issued 40,000 shares of its common stock to certain employees and executives of the Company for services rendered. In August 2006 the Company issued 100,000 shares of its common stock to an independent director of the Company as recognition for many years of service. Compensation expense recognized in 2006 in connection with these issuances of common stock was $360,000.
Stock Options - In October 1995 the Company granted the President 400,000 options to secure his accrued salary. Upon payment of the accrued salary, the options wouldwill be forfeited.
In August 2006 the Company granted 100,000 stock options to a director of the Company for his many years of service and his assistance with locating the investors who are participating in the proposed Joint Stock Company.Company (AMAK). The options have a three year exercise period at an exercise price of $2. Stock option compensation expense recognized for the year ended December 31, 2006 was $229,000. The fair value of these options was estimated on the date of grant using the fair value option pricing model
with the following assumptions: (1) risk-free interest rate of 4.8%, (2) an expected life of 3 years, (3) 115% volatility and (4) no dividends. The weighted average grant date fair value of the options granted in 2006 was $2.29.
F-27
NOTE 14 - SHARE-BASED COMPENSATION – continued
Additional information with respect to all options outstanding at December 31, 2007,2008, and changes for the three years then ended are as follows:
| 2007 | 2006 | 2005 | ||||||||||||||||||||||
| Shares | Weighted average exercise price | Shares | Weighted average exercise price | Shares | Weighted average exercise price | |||||||||||||||||||
| Outstanding at beginning of year | 500,000 | $ | 1.20 | 400,000 | $ | 1.00 | 400,000 | $ | 1.00 | |||||||||||||||
| Granted | - | 100,000 | $ | 2.00 | - | |||||||||||||||||||
| Forfeited | - | - | - | |||||||||||||||||||||
| Outstanding at end of year | 500,000 | $ | 1.20 | 500,000 | $ | 1.20 | 400,000 | $ | 1.00 | |||||||||||||||
| Options exercisable at end of year | 500,000 | $ | 1.20 | 500,000 | $ | 1.20 | 400,000 | $ | 1.00 | |||||||||||||||
| 2008 | 2007 | 2006 | ||||||||||||||||||||||
| Shares | Weighted average exercise price | Shares | Weighted average exercise price | Shares | Weighted average exercise price | |||||||||||||||||||
| Outstanding at beginning of year | 500,000 | $ | 1.20 | 500,000 | $ | 1.20 | 400,000 | $ | 1.00 | |||||||||||||||
| Granted | - | - | 100,000 | $ | 2.00 | |||||||||||||||||||
| Forfeited | - | - | - | |||||||||||||||||||||
| Outstanding at end of year | 500,000 | $ | 1.20 | 500,000 | $ | 1.20 | 500,000 | $ | 1.20 | |||||||||||||||
| Options exercisable at end of year | 500,000 | $ | 1.20 | 500,000 | $ | 1.20 | 500,000 | $ | 1.20 | |||||||||||||||
Additional information about stock options outstanding at December 31, 20072008 is summarized as follows:
| Options outstanding and exercisable | |||||||
| Number | Remaining contractual life | Exercise price | |||||
| 400,000 | Undetermined | $ | 1.00 | ||||
| 100,000 | 1.7 years | $ | 2.00 | ||||
| Options outstanding and exercisable | |||||||
| Number | Remaining contractual life | Exercise price | |||||
| 400,000 | Undetermined | $ | 1.00 | ||||
| 100,000 | 0.7 years | $ | 2.00 | ||||
The Company awarded options to its non-employee directors in the amount of 7,000 shares each for a total of 35,000 shares to be issued January 2, 2009 for their service during 2008. No compensation expense was recorded during 2008 for this award. The exercise price of the options is $1.39 per share based upon the closing price on January 2, 2009.
On April 7, 2008, the Board of Directors of the Company adopted the Stock Option Plan for Key Employees, as well as, the Non-Employee Director Stock Option Plan (hereinafter collectively referred to as the “Stock Option Plans”), subject to the approval of Company’s shareholders. Shareholders approved the Stock Option Plans at the 2008 Annual Meeting of Shareholders on July 10, 2008. The Company filed Form S-8 to register the 1,000,000 shares allocated to the Stock Option Plans on October 23, 2008.
The Company expects to issue shares upon exercise of the options from its authorized but unissued common stock.
| NOTE 15 – INCOME TAXES |
The provision for (benefit from) income taxes consisted of the following:
| Year ended December 31, | ||||||||
| 2007 | 2006 | |||||||
| Current federal provision | $ | 3,357,184 | $ | 3,196,005 | ||||
| Current state provision (benefit) | (68,103 | ) | 569,903 | |||||
| Deferred federal provision | 141,443 | 222,721 | ||||||
| Deferred state provision (benefit) | (4,281 | ) | 20,787 | |||||
| Income tax expense | $ | 3,426,243 | $ | 4,009,416 | ||||
| Year ended December 31, | ||||||||||||
| 2008 | 2007 | 2006 | ||||||||||
| Current federal provision | $ | 376,030 | $ | 3,357,184 | $ | 3,196,005 | ||||||
| Current state provision (benefit) | 173,323 | (68,103 | ) | 569,903 | ||||||||
| Deferred federal provision (benefit) | (5,388,895 | ) | 141,443 | 222,721 | ||||||||
| Deferred state provision (benefit) | (139,304 | ) | (4,281 | ) | 20,787 | |||||||
| Income tax expense (benefit) | $ | (4,978,846 | ) | $ | 3,426,243 | $ | 4,009,416 | |||||
| 2007 | 2006 | 2005 | ||||||||||
| Income taxes at U.S. statutory rate | $ | 3,807,192 | $ | 4,048,863 | $ | 6,064,431 | ||||||
| State taxes, net of federal benefit | 166,685 | 385,756 | 533,763 | |||||||||
| Prior year overpayments | (145,250 | ) | (358,054 | ) | - | |||||||
| Refund from amended state return | (158,000 | ) | - | - | ||||||||
| Change in valuation allowance | - | - | (3,170,892 | ) | ||||||||
Foreign operations with no benefit (tax) provided | - | - | (2,317,278 | ) | ||||||||
| Permanent and other items | (244,384 | ) | ( 67,149 | ) | 23,763 | |||||||
| Total tax expense | $ | 3,426,243 | $ | 4,009,416 | $ | 1,133,787 | ||||||
NOTE 15 – INCOME TAXES - continued
Income tax expense for the years ended December 31, 2008, 2007, and 2006 differs from the amount computed by applying the applicable U.S. corporate income tax rate of 34.0 in 2008, 34.0 in 2007 and 34.1% in 2006, respectively to net income before income taxes. The reasons for this difference are as follows:
| 2008 | 2007 | 2006 | ||||||||||
| Income taxes at U.S. statutory rate | $ | (4,882,123 | ) | $ | 3,807,192 | $ | 4,048,863 | |||||
| State taxes, net of federal benefit | (42,141 | ) | 166,685 | 385,756 | ||||||||
| Prior year overpayments | (49,872 | ) | (145,250 | ) | (358,054 | ) | ||||||
| Refund from amended state return | - | (158,000 | ) | - | ||||||||
| Permanent and other items | (4,710 | ) | (244,384 | ) | ( 67,149 | ) | ||||||
| Total tax expense (benefit) | $ | (4,978,846 | ) | $ | 3,426,243 | $ | 4,009,416 | |||||
The tax effects of temporary differences that give rise to significant portions of Federal and state deferred tax assets and deferred tax liabilities were as follows:
December 31, | ||||||||
| 2008 | 2007 | |||||||
| Deferred tax liabilities: | ||||||||
| Plant, pipeline and equipment | $ | (4,122,410 | ) | $ | (1,368,531 | ) | ||
| Unrealized gains on swap agreements | -- | (63,370 | ) | |||||
| Deferred tax assets: | ||||||||
| Accounts receivable | 265,901 | 82,250 | ||||||
| Inventory | 635,865 | 33,001 | ||||||
| Mineral interests | 365,293 | 217,051 | ||||||
| Accrued liabilities | -- | 211,158 | ||||||
| Net operating loss and contribution carry-forwards | -- | -- | ||||||
| Capital loss carry-forward | 1,228,090 | 1,228,090 | ||||||
| Deferred gain on sale of property | -- | -- | ||||||
| Unrealized losses on swap agreements | 7,306,270 | -- | ||||||
| Unrealized loss on interest rate swap | 577,007 | -- | ||||||
| Post retirement benefits | 400,149 | 211,310 | ||||||
| Gross deferred tax assets | 10,778,575 | 1,982,860 | ||||||
| Valuation allowance | (1,228,090 | ) | (1,228,090 | ) | ||||
| Net deferred tax assets (liabilities) | $ | 5,428,075 | $ | (677,131 | ) | |||
The current and non-current classifications of the deferred tax balances are as follows:
| 2008 | 2007 | |||||||
| Current deferred tax asset | $ | 8,785,043 | $ | -- | ||||
| Non-current deferred tax liability: | ||||||||
| Deferred tax assets | 1,993,532 | 1,982,860 | ||||||
| Deferred tax liability | (4,122,410 | ) | (1,431,901 | ) | ||||
| Valuation allowance | (1,228,090 | ) | (1,228,090 | ) | ||||
| Non-current deferred tax liability, net | (3,356,968 | ) | (677,131 | ) | ||||
| Deferred tax assets (liabilities), net | $ | 5,428,075 | $ | (677,131 | ) | |||
December 31, | ||||||||||||
| 2007 | 2006 | 2005 | ||||||||||
| Deferred tax liabilities: | ||||||||||||
| Plant, pipeline and equipment | $ | (1,368,531 | ) | $ | (1,462,000 | ) | $ | (907,000 | ) | |||
| Unrealized gains on swap agreements | (63,370 | ) | - | - | ||||||||
| Deferred tax assets: | ||||||||||||
| Accounts receivable | 82,250 | 55,000 | 42,000 | |||||||||
| Inventory | 33,001 | - | - | |||||||||
| Mineral interests | 217,051 | 236,000 | 236,000 | |||||||||
| Accrued liabilities | 211,158 | 255,000 | 215,000 | |||||||||
| Net operating loss and contribution carry-forwards | -- | 75,000 | 55,000 | |||||||||
| Capital loss carry-forward | 1,228,090 | 1,336,000 | 1,336,000 | |||||||||
| Deferred gain on sale of property | -- | 18,000 | 34,000 | |||||||||
| Unrealized losses on swap agreements | -- | 283,000 | 28,000 | |||||||||
| Post retirement benefits | 211,310 | - | - | |||||||||
| Gross deferred tax assets | 1,982,860 | 2,258,000 | 1,946,000 | |||||||||
| Valuation allowance | (1,228,090 | ) | (1,336,000 | ) | (1,336,000 | ) | ||||||
| Net deferred tax liabilities | (677,131 | ) | (540,000 | ) | (297,000 | ) | ||||||
| Net deferred taxes | $ | (677,131 | ) | $ | (540,000 | ) | $ | (297,000 | ) | |||
F-29
NOTE 15 – INCOME TAXES - continued
The Company has provided a valuation allowance in 2008, 2007 2006 and 20052006 against certain deferred tax assets because of uncertainties regarding their realization.
At December 31, 2007,2008, the Company had no net operating loss carry-forwards.
The Company has no Saudi Arabian or Mexican tax liability.
The Company files an income tax return in the U.S. federal jurisdiction and Texas. The Federal and Texas tax returns for the years 20042005 through 20062007 remain open for examination. Subsequent to year end, the Internal Revenue Service (IRS) commenced an examination of the Company's 2007 tax returns that is anticpated to be completed by August 31, 2009. The Company adopted the provisions of FASB Interpretation No. 48, “Accounting for Uncertainty in Income Taxes-An Interpretation of FASB Statement No. 109, Accounting for Income Taxes” (“FIN 48”), on January 1, 2007. As a result of the implementation of FIN 48, the Company recognized no material adjustment in the liability for unrecognized income tax benefits. At the adoption date of January 1, 2007, and at December 31, 2007,2008, there were no unrecognized tax benefits. Interest and penalties related to uncertain tax positions will be recognized in income tax expense. As of December 31, 2007,2008, no interest related to uncertain tax positions had been accrued.
NOTE 16 - SEGMENT INFORMATION
As discussed in Note 1, the Company has two business segments. The Company measures segment profit or loss as operating income (loss), which represents income (loss) before interest, foreign exchange transaction gain and (loss), miscellaneous income and minority interest. Information on segments is as follows:
| December 31, 2008 | ||||||||||||
| Petrochemical | Mining | Total | ||||||||||
| Continuing operations | ||||||||||||
| Revenue from external customers | $ | 154,630,234 | $ | - | $ | 154,630,234 | ||||||
| Depreciation | 1,630,428 | 856 | 1,631,284 | |||||||||
| Operating income (loss) | (11,563,597 | ) | (2,399,134 | ) | (13,962,731 | ) | ||||||
| Total assets | $ | 63,917,729 | $ | 34,228,411 | $ | 98,146,140 | ||||||
| December 31, 2007 | ||||||||||||
| Petrochemical | Mining | Total | ||||||||||
| Continuing operations | ||||||||||||
| Revenue from external customers | $ | 108,638,115 | $ | - | $ | 108,638,115 | ||||||
| Depreciation | 1,073,620 | 1,142 | 1,074,762 | |||||||||
| Operating income (loss) | 13,261,809 | (2,179,101 | ) | 11,082,708 | ||||||||
| Total assets | $ | 42,077,819 | $ | 42,142,946 | $ | 84,220,765 | ||||||
| December 31, 2006 | ||||||||||||
| Petrochemical | Mining | Total | ||||||||||
| Continuing operations | ||||||||||||
| Revenue from external customers | $ | 98,502,157 | $ | - | $ | 98,502,157 | ||||||
| Depreciation | 858,813 | 246 | 859,059 | |||||||||
| Operating income (loss) | 13,130,693 | (1,218,931 | ) | 11,911,762 | ||||||||
| Total assets | $ | 29,638,657 | $ | 41,951,509 | $ | 71,590,166 | ||||||
| December 31, 2005 | ||||||||||||
| Petrochemical | Mining | Total | ||||||||||
| Continuing operations | ||||||||||||
| Revenue from external customers | $ | 80,373,587 | $ | - | $ | 80,373,587 | ||||||
| Depreciation | 651,582 | 25 | 651,607 | |||||||||
| Operating income (loss) | 12,252,223 | (624,993 | ) | 11,627,230 | ||||||||
| Discontinued operations (Coin) | ||||||||||||
| Revenue from external customers | $ | 2,042,676 | $ | - | $ | 2,042,676 | ||||||
| Depreciation | - | - | - | |||||||||
| Operating income (loss) | 497,730 | - | 497,730 | |||||||||
| Total assets | $ | 26,165,931 | $ | 40,808,237 | $ | 66,974,168 | ||||||
| December 31, 2006 | ||||||||||||
| Petrochemical | Mining | Total | ||||||||||
| Continuing operations | ||||||||||||
| Revenue from external customers | $ | 98,502,157 | $ | - | $ | 98,502,157 | ||||||
| Depreciation | 858,813 | 246 | 859,059 | |||||||||
| Operating income (loss) | 13,130,693 | (1,218,931 | ) | 11,911,762 | ||||||||
| Total assets | $ | 29,638,657 | $ | 41,951,509 | $ | 71,590,166 | ||||||
F-30
NOTE 16 - SEGMENT INFORMATION –continued
Information regarding foreign operations for the years ended December 31, 2008, 2007, and 2006 and 2005is as follows (in thousands). Revenues are attributed to countries based upon the origination of the transaction.
| Year ended December 31, | ||||||||||||
| 2007 | 2006 | 2005 | ||||||||||
| Revenues | ||||||||||||
| United States | $ | 108,638 | $ | 98,502 | $ | 80,373 | ||||||
| Mexico (discontinued operations) | - | - | 2,043 | |||||||||
| Saudi Arabia | - | - | - | |||||||||
| $ | 108,638 | $ | 98,502 | $ | 82,416 | |||||||
| Long-lived assets | ||||||||||||
| United States | $ | 20,851 | $ | 11,711 | $ | 9,311 | ||||||
| Mexico (discontinued operations) | - | - | - | |||||||||
| Saudi Arabia | 39,899 | 39,568 | 39,235 | |||||||||
| $ | 60,750 | $ | 51,279 | $ | 48,546 | |||||||
| Year ended December 31, | ||||||||||||
| 2008 | 2007 | 2006 | ||||||||||
| Revenues | ||||||||||||
| United States | $ | 154,630 | $ | 108,638 | $ | 98,502 | ||||||
| Saudi Arabia | - | - | - | |||||||||
| $ | 154,630 | $ | 108,638 | $ | 98,502 | |||||||
| Long-lived assets | ||||||||||||
| United States | $ | 33,123 | $ | 20,851 | $ | 11,711 | ||||||
| Saudi Arabia(A) | 33,002 | 39,899 | 39,568 | |||||||||
| $ | 66,125 | $ | 60,750 | $ | 51,279 | |||||||
(A) Represents the Company’s 50% interest in AMAK at December 30, 2008
NOTE 17 - NET INCOME (LOSS) PER COMMON SHARE
| Year ended December 31, | ||||||||||||
| 2007 | 2006 | 2005 | ||||||||||
| Basic earnings per common share | ||||||||||||
| Income from continuing operations | $ | 0.34 | $ | 0.35 | $ | 0.43 | ||||||
| Discontinued operations | - | - | 0.30 | |||||||||
| Net income | $ | 0.34 | $ | 0.35 | $ | 0.73 | ||||||
| Weighted average shares outstanding | 22,895,394 | 22,804,567 | 22,731,994 | |||||||||
| Diluted earnings per common share | ||||||||||||
| Income from continuing operations | $ | 0.33 | $ | 0.34 | $ | 0.43 | ||||||
| Discontinued operations | - | - | 0.30 | |||||||||
| Net income | $ | 0.33 | $ | 0.34 | $ | 0.73 | ||||||
| Weighted average shares outstanding | 23,291,669 | 23,030,283 | 22,731,994 | |||||||||
| Year ended December 31, | ||||||||||||
| 2008 | 2007 | 2006 | ||||||||||
| Net income (loss) | $ | (8,874,915 | ) | $ | 7,711,381 | $ | 7,875,328 | |||||
| Basic earnings (loss) per common share: | ||||||||||||
| Weighted average shares outstanding | 23,409,458 | 22,895,394 | 22,804,567 | |||||||||
| Per share amount | $ | (0.38 | ) | $ | 0.34 | $ | 0.35 | |||||
| Diluted earnings (loss) per common share: | ||||||||||||
| Weighted average shares outstanding | 23,409,458 | 23,291,669 | 23,030,283 | |||||||||
| Per share amount | $ | (0.38 | ) | $ | 0.33 | $ | 0.34 | |||||
| Year ended December 31, | Year ended December 31, | |||||||||||||||||||||||
| 2007 | 2006 | 2005 | 2008 | 2007 | 2006 | |||||||||||||||||||
Weighted average shares-denominator basic computation | 22,895,394 | 22,804,567 | 22,731,994 | 23,409,458 | 22,895,394 | 22,804,567 | ||||||||||||||||||
| Effect of dilutive stock options | 396,275 | 225,716 | - | - | 396,275 | 225,716 | ||||||||||||||||||
Weighted average shares, as adjusted denominator diluted computation | 23,291,669 | 23,030,283 | 22,731,994 | 23,409,458 | 23,291,669 | 23,030,283 | ||||||||||||||||||
Inclusion of the Company’s options in diluted loss per share for the year ended December 31, 2008, has an anti-dilutive effect because the Company incurred a loss from operations.
F-31
NOTE 18 - QUARTERLY RESULTS OF OPERATIONS (UNAUDITED)
The quarterly results of operations shown below are derived from unaudited financial statements for the eight quarters ended December 31, 20072008 (in thousands, except per share data):
| Year Ended December 31, 2007 | ||||||||||||||||||||
First Quarter | Second Quarter | Third Quarter | Fourth Quarter | Total | ||||||||||||||||
| Revenues | $ | 23,663 | $ | 27,141 | $ | 28,038 | $ | 29,796 | $ | 108,638 | ||||||||||
| Gross profit | 9,263 | 5,168 | 2,441 | 2,905 | 19,777 | |||||||||||||||
| Net income (loss) | 4,641 | 2,172 | 382 | 576 | 7,771 | |||||||||||||||
| Basic EPS | $ | 0.20 | $ | 0.10 | $ | 0.02 | $ | 0.02 | $ | 0.34 | ||||||||||
| Diluted EPS | $ | 0.20 | $ | 0.09 | $ | 0.02 | $ | 0.02 | $ | 0.33 | ||||||||||
| Year Ended December 31, 2008 | ||||||||||||||||||||
First Quarter | Second Quarter | Third Quarter | Fourth Quarter | Total | ||||||||||||||||
| Revenues | $ | 31,234 | $ | 42,611 | $ | 47,742 | $ | 33,043 | $ | 154,630 | ||||||||||
| Gross profit (loss) | 4,878 | 6,846 | (9,110 | ) | (7,211 | ) | (4,597 | ) | ||||||||||||
| Net income (loss) | 1,416 | 3,172 | (6,931 | ) | (6,532 | ) | (8,875 | ) | ||||||||||||
| Basic EPS | $ | 0.06 | $ | 0.14 | $ | (0.30 | ) | $ | (0.28 | ) | $ | (0.38 | ) | |||||||
| Diluted EPS | $ | 0.06 | $ | 0.13 | $ | (0.30 | ) | $ | ( 0.28 | ) | $ | (0.38 | ) | |||||||
| Year Ended December 31, 2006 | ||||||||||||||||||||
First Quarter | Second Quarter | Third Quarter | Fourth Quarter | Total | ||||||||||||||||
| Revenues | $ | 24,316 | $ | 24,082 | $ | 27,541 | $ | 22,563 | $ | 98,502 | ||||||||||
| Gross profit | 5,917 | 6,086 | 2,777 | 3,833 | 18,613 | |||||||||||||||
| Net income (loss) | 2,701 | 2,648 | 514 | 2,012 | 7,875 | |||||||||||||||
| Basic EPS | $ | 0.12 | $ | 0.12 | $ | 0.02 | $ | 0.09 | $ | 0.35 | ||||||||||
| Diluted EPS | $ | 0.12 | $ | 0.11 | $ | 0.02 | $ | 0.09 | $ | 0.34 | ||||||||||
| Year Ended December 31, 2007 | |||||
First Quarter | Second Quarter | Third Quarter | Fourth Quarter | Total | |
| Revenues | $23,663 | $ 27,141 | $ 28,038 | $ 29,796 | $108,638 |
| Gross profit | 9,065 | 4,970 | 2,243 | 2,706 | 18,984 |
| Net income | 4,641 | 2,172 | 382 | 576 | 7,771 |
| Basic EPS | $ 0.20 | $ 0.10 | $ 0.02 | $ 0.02 | $ 0.34 |
| Diluted EPS | $ 0.20 | $ 0.09 | $ 0.02 | $ 0.02 | $ 0.33 |
NOTE 19 - RELATED PARTY TRANSACTIONS
At December 31, 2007,2008, the Company has a liability to its President and Chief Executive Officer of approximately $346,000$353,000 in accrued salary and termination benefits.
South Hampton incurred product transportation and equipment costs of approximately $757,000, $653,000 and $606,000 in 2008, 2007 and $507,000 in 2007, 2006, and 2005, respectively, with STTC, which is currently owned by the President of TOCCO.
On August 1, 2004, South Hampton entered into a $136,876 capital lease with STTC for the purchase of a diesel powered manlift. The lease bears interest at 6.9% for a 5 year term with monthly payments in the amount of $3,250. Title transfers to South Hampton at the end of the term. In 2007,2008 gross payments of $39,000 were made. Capital lease payable to STTC at December 31, 2008, totaled $19,010.
Legal fees in the amount of $81,705 and $99,667 were paid during 2008 and 2007, respectively to the law firm of Germer Gertz, LLP of which Charles Goehringer is a minority partner. Mr. Goehringer acts as corporate counsel for the Company and in November 2007 was appointed to the Board of Directors.
Robert E. Kennedy was paid consulting fees of $24,000 plus minor expense reimbursement during 2007 to assist in locating and evaluating potential merger or acquisition candidates for the petrochemical segment.segment and $3,000 in consulting fees in 2008. Mr. Kennedy was appointed to the Board of Directors in January 2007. The consulting arrangement ended in January 2008.
F-32
NOTE 19 - RELATED PARTY TRANSACTIONS - continued
Ibrahim Al Moneef was issued 375,000 shares of the Company’s common stock for payment relating to the “Financial Services Agreement” between himself and the Company. The Company recorded approximately $1,856,000 in its Investment in AMAK in connection with this transaction. Mr. Al Moneef was appointed to the Board of Directors in April 2007.
| NOTE 20 – DERIVATIVE INSTRUMENTS |
Hydrocarbon based solvent manufacturers such as TOCCO are significantly impacted by changes in feedstock and natural gas prices. Not considering derivative transactions, feedstock and natural gas used for the years ended December 31, 2008, 2007, and 2006, represented approximately 85.4%, 82.0%, and 81.3% of TOCCO’s operating expenses, respectively. Over the past several years, feedstock and natural gas expense have become an increasingly larger portion of TOCCO’s operating expenses due to the dramatic increase in all hydrocarbon prices during this period. TOCCO endeavors to acquire feedstock and natural gas at the lowest possible cost. Because TOCCO’s primary feedstock (natural gasoline) is not generally traded on an organized futures exchange, there are limited opportunities to hedge directly in natural gasoline.
However, TOCCO has found that financial derivative instruments in other commodities such as crude oil can be useful in decreasing its exposure to natural gasoline price volatility. TOCCO does not purchase or hold any derivative financial instruments for trading purposes.
On January 30, 1992, the Board of Directors of TOCCO adopted a resolution authorizing the establishment of a commodities trading account to hedgetake advantage of opportunities to lower the cost of natural gasoline, the primary source of feedstock and natural gas used as fuel to operatefor its subsidiary, South Hampton, through the plant. Since 1992,use of short term commodity swap and option contracts. The policy adopted by the Company has used a varying number of financial swaps on feedstock and options on natural gas to limitBoard specifically prohibits the effect of significant fluctuations in price on operating results. The effect of these agreements
committed to financial swap contracts for a portion of its required monthly feedstock volume with settlement dates through March 2009 and crude option contracts with settlement dates through December 2009. For the years ended December 31, 2008, 2007 2006 and 20052006 the net realized gain (loss) from the derivative agreements was $1,721,064, $3,366,507 (784,048) and $2,408,966,($784,048), respectively. The asset (liability) as of December 31, 2008, 2007, and 2006 and 2005 was ($6,976,231), $206,832, and ($765,672), and $74,752, respectively. The unrealized gain (loss) of ($5,485,914), $972,504, and ($840,424), and $169,951 and the realized gain (loss) for the years ended December 31, 2008, 2007 2006 and 2005,2006, respectively, are recorded in cost of petrochemical product sales and processing in the Consolidated Statements of Income.Operations. In addition, due to changes in the fair value of the derivative instruments at December 31, 2008, $14,103,600 in derivative premiums were written off and were recorded in cost of petrochemical product sales and processing.
The financial swaps for natural gasoline (covering approximately 30% of the feed requirements for the 4th quarter of 2008 and the 1st quarter of 2009) were ultimately bought out in several stages as prices continued to fall and the final loss was fixed. The Company exited that market entirely as of mid-November 2008. In July 2008 as petroleum prices were nearing record highs and there was discussion in the market of further dramatic increases, the Company, after several months of study, determined that crude oil options would provide better and longer term price protection for feedstock versus
| NOTE 20 – DERIVATIVE INSTRUMENTS - continued |
shorter term financial swaps normally used. The Company acquired crude oil options in the form of collars covering the period of August 2008 to December 2009. Collars generally limit the upside of price movements by utilizing a call with a strike at the desired level, and the premium for the call is paid by selling a put at a strike price which is deemed an acceptable floor price. The initial floor of $120 was determined to be an appropriate point as current crude prices were about $133 per barrel for the period in question. A cap of $140 was established as the ceiling. The volume of crude options covered from 15% to 20% of the total expected volume of feedstock for the Company over the timeperiod in question. Beginning in early and mid-August, as it became apparent that the price declines might be more dramatic than normal, the Company began moving the strike price of the floor puts down to levels which seemed more reasonable and would appear to be out of the money in normal circumstances. Moving the floor puts required payment of a premium to buy back the established position and sale of another put to defer the cost of the buyback, with the new floor of the put at a reasonable level under the circumstances. In some cases puts were repurchased with no re-establishment of a new floor. The Company, by mid-November 2008 had neutralized the positions for all crude options by having the same number of puts and calls in place for a particular strike price thereby allowing the options to expire with no further cash effect. In August, September, and October 2008 margin calls were made on the financial derivatives for $10,250,000 due to the decrease in the price of natural gasoline and crude. Prior to December 31, 2008, collateral in the amount of $6,300,000 was returned to the Company leaving a deposit of $3,950,000, the majority of which was returned in January 2009.
Interest Rate Swaps
On March 21, 2008, South Hampton entered into an interest rate swap agreement with a domestic financial institution related to the $10.0 million term loan secured by property, pipeline and equipment. The effective date of the interest rate swap agreement is August 15, 2008, and terminates on December 15, 2017. As part of the interest rate swap agreement South Hampton will pay interest based upon the London InterBank Offered Rate (LIBOR) or a base rate plus a markup and will receive from Bank of America an interest rate of 5.83%. South Hampton has designated the transaction as a cash flow hedge according to Statement of Financial Accounting Standard (“SFAS”) No. 133, “Accounting for Derivative Instruments and Hedging Activities”, as amended by SFAS Nos. 138 and 149. Beginning on August 15, 2008, the derivative instrument was reported at fair value with any changes in fair value reported within other comprehensive income (loss) in the Company’s Statement of Stockholders’ Equity. The Company entered into the interest rate swap to minimize the effect of changes in the LIBOR rate. The fair value of the derivative liability associated with the interest rate swap at December 31, 2008 totaled $1,697,079. The cumulative loss of $1,120,072 (shown net of deferred tax benefit of $577,007) from the changes in the swaps contract’s fair value that is included in other comprehensive loss will be reclassified into income when interest is paid.
NOTE 21- POST RETIREMENT OBLIGATIONS
In January 2007 a retirement agreement was entered into with Jack Crichton, Chairman of the Board. The agreement provides $3,000 per month in benefits to Mr. Crichton for five years after his retirement in addition to a lump sum of $30,000 that was paid upon the signing of the agreement. A liability of approximately $148,000 was recorded at March 31, 2007 based upon the present value of the $3,000 payment per month using the Company’s borrowing rate of approximately 8%. Mr. Crichton passed away in December 2007, and per the agreement, all amounts owing were due at that time. Therefore, an additional $32,000 was recorded in December as a liability. A current liability of $180,000
F-34
NOTE 21- POST RETIREMENT OBLIGATIONS - continued
$180,000 remained outstanding at December 31, 2007 and was included in accrued liabilities. This amount was paid to his estate in 2008.
In February 2007 a retirement agreement was entered into with Hatem El Khalidi, President of the Company. The agreement provided $3,000 per month in benefits to Mr. El Khalidi upon his retirement for the remainder of his life. Additionally, upon his death $2,000 per month would be paid to his surviving spouse for the remainder of her life. A health insurance benefit will also be provided. A long term liability of approximately $441,500 based upon an annuity single premium contract value was outstanding at December 31, 2007 and is included in post retirement benefits.
In January 2008 the retirement agreement entered into in February 2007 with Hatem El Khalidi, President of the Company, was modified. The new agreement provides $6,000 per month in benefits to Mr. El Khalidi upon his retirement for the remainder of his life. Additionally, upon his death $4,000 per month will be paid to his surviving spouse the remainder of her life. A health insurance benefit will also be provided. An additional $382,000 was accrued in January 2008 for the increase in benefits. A long term liability of approximately $823,500 based upon an annuity single premium value contract was outstanding at December 31, 2008 and is included in post retirement benefits.
NOTE 2322 – SUBSEQUENT EVENTS
On January 15, 2008,26, 2009 the Board awarded restricted stock compensationappointed Nicholas Carter to three membersrepresent Company interest on the Board of the management team in the total amount of 40,000 shares. These shares vest overAMAK as a three year period. Total estimated compensation will be $280,000 and will be recognized in the amount of approximately $93,000 per year.
On February 14, 20083, 2009, South Hampton entered into a “Master Lease Agreement” with Silsbee Trading and Transportation. The agreement replaces the Company paidLease Agreement dated August 1, 2004 and contains the annualsame terms and conditions but aligns the lease paymentterms on the individual pieces of $117,300 toequipment with the Ministry of Petroleum and Mineral Resources which covers the calendar year 2008.underlying financing arrangements.
On February 23, 200826, 2009, the applicationBoard passed a resolution to transfer the Al-Masane leasedevelop a comprehensive risk management and procedure policy. In accordance, South Hampton entered into a consulting agreement with GSC Energy to ALAK was submitted to the Ministry of Petroleumassist in developing a policy and Minerals. The Ministry is expected to act within 30 days unless they have some unforeseen requirements which the Company must meet.procedure manual.
REPORT OF INDEPENDENT REGISTERED PUBLIC ACCOUNTING FIRM ON SCHEDULES
Arabian American Development Company and Subsidiaries
Dallas, Texas
We have audited the consolidated financial statements of Arabian American Development Company and Subsidiaries (the “Company”)Company) as of December 31, 20072008 and 20062007 and for each of the three years in the period ended December 31, 2007,2008, and have issued our report thereon dated March 13, 2008.2009. Our audits also include Schedule II for this Form 10-K. This schedule is the responsibility of the Company’s management. Our responsibility is to express an opinion based on our audits.
In our opinion, the Schedule II at December 31, 2008, 2007, 2006, and 20052006 and for the years then ended, when considered in relation to the basic financial statements taken as a whole, presents fairly, in all material respects, the information required to be set forth therein.
/s/ MOORE STEPHENS TRAVIS WOLFF, L.L.P.Travis, Wolff & Company LLP (also known as Moore Stephens Travis Wolff, LLP)
Dallas, Texas
March 13, 20082009
ARABIAN AMERICAN DEVELOPMENT COMPANY AND SUBSIDIARIES
VALUATION AND QUALIFYING ACCOUNTS
Three years ended December 31, 20072008
| Description | Beginning balance | Charged (credited) to earnings | Deductions(a) | Ending balance | ||||||||||||
ALLOWANCE FOR DEFERRED TAX ASSET | ||||||||||||||||
| December 31, 2005 | 3,274,588 | 1,336,451 | (3,274,588 | ) | 1,336,451 | |||||||||||
| December 31, 2006 | 1,336,451 | - | - | 1,336,451 | ||||||||||||
| December 31, 2007 | 1,336,451 | (108,361 | ) | - | 1,228,090 | |||||||||||
| Description | Beginning balance | Charged (credited) to earnings | Deductions(a) | Ending balance | ||||||||||||
ALLOWANCE FOR DEFERRED TAX ASSET | ||||||||||||||||
| December 31, 2006 | 1,336,451 | - | - | 1,336,451 | ||||||||||||
| December 31, 2007 | 1,336,451 | (108,361 | ) | - | 1,228,090 | |||||||||||
| December 31, 2008 | 1,228,090 | - | - | 1,228,090 | ||||||||||||
(a) Utilization of carryforwards
| Description | Beginning balance | Charged to earnings | Deductions | Ending balance | ||||||||||||
ALLOWANCE FOR DOUBTFUL ACCOUNTS | ||||||||||||||||
| December 31, 2005 | - | - | - | - | ||||||||||||
| December 31, 2006 | - | 190,829 | (155,829 | ) | 35,000 | |||||||||||
| December 31, 2007 | 35,000 | - | - | 35,000 | ||||||||||||
| Description | Beginning balance | Charged to earnings | Deductions | Ending balance | ||||||||||||
ALLOWANCE FOR DOUBTFUL ACCOUNTS | ||||||||||||||||
| December 31, 2006 | - | 190,829 | (155,829 | ) | 35,000 | |||||||||||
| December 31, 2007 | 35,000 | - | - | 35,000 | ||||||||||||
| December 31, 2008 | 35,000 | 465,000 | - | 500,000 | ||||||||||||
F-37