UNITED STATES SECURITIES AND EXCHANGE COMMISSION
Washington, D.C. 20549
___________________
FORM 10-K
(MARK ONE)
|
| | | | |
ý☒ | ANNUAL REPORT PURSUANT TO SECTION 13 OR 15(d) OF THE SECURITIES EXCHANGE ACT OF 1934 For The Fiscal Year Ended December 31, 20182020 OR |
| ☐ | TRANSITION REPORT PURSUANT TO SECTION 13 OR 15(d) OF THE SECURITIES EXCHANGE ACT OF 1934
For The Transition Period from ___________ to ________
|
Commission File Number 1-33926
TRECORA RESOURCES
(Exact name of registrant as specified in its charter)
|
| | | | |
Delaware (State or other jurisdiction of incorporation or organization) | 75-1256622 (I.R.S. Employer Identification No.) |
1650 Hwy 6 S, Suite 190 Sugar Land, TX (Address of principal executive offices) | 77478 (Zip code) |
Registrant'sRegistrant’s telephone number, including area code: (281) 980-5522
Securities registered pursuant to Section 12(b) of the Act:
|
| | | | | | | |
Title of Classeach class | Trading Symbol(s) | Name of each exchange on which registered |
Common stock,Stock, par value $0.10 per share | TREC | New York Stock Exchange |
Securities registered pursuant to Section 12(g) of the Act:
None
Indicate by check mark if the registrant is a well-known seasoned issuer, as defined in Rule 405 of the Securities Act. Yes ☐ No ý
Indicate by check mark if the registrant is not required to file reports pursuant to Section 13 or Section 15(d) of the Act. Yes ☐ No ý
_____________________
Indicate by check mark whether the registrant (l) has filed all reports required to be filed by Section 13 or 15(d) of the Securities Exchange Act of 1934 during the preceding 12 months (or for such shorter period that the registrant was required to file such reports), and (2) has been subject to such filing requirements for the past 90 days. Yes ý No ☐
Indicate by check mark whether the registrant has submitted electronically every Interactive Data File required to be submitted pursuant to Rule 405 of Regulation S-T (§232.405 of this chapter) during the preceding 12 months (or for such shorter period that the registrant was required to submit such files). Yes ý No ☐
Indicate by check mark if disclosure of delinquent filers pursuant to Item 405 of Regulation S-K (§229.405 of this chapter) is not contained herein, and will not be contained, to the best of registrant's knowledge, in definitive proxy or information statements incorporated by reference in Part III of this Form 10-K or any amendment to this Form 10-K. ☐
Indicate by check mark whether the registrant is a large accelerated filer, an accelerated filer, a non-accelerated filer, a smaller reporting company, or an emerging growth company. See the definitions of "large“large accelerated filer", "accelerated“accelerated filer", "smaller“smaller reporting company", and "emerging“emerging growth company" in Rule 12b-2 of the Exchange Act.
|
| | | | |
| Large accelerated filer ☐ | Accelerated filer ý |
| Non-accelerated filer ☐ | Smaller reporting company ☐☒ |
Emerging growth company ☐ | |
If an emerging growth company, indicate by check mark if the registrant has elected not to use the extended transition period for complying with any new or revised financial accounting standards provided pursuant to Section 13(a) of the Exchange Act ☐
Indicate by check mark whether the registrant has filed a report on and attestation to its management’s assessment of the effectiveness of its internal control over financial reporting under Section 404(b) of the Sarbanes-Oxley Act (15 U.S.C. 7262(b)) by the registered public accounting firm that prepared or issued its audit report. Yes ☒ No ☐
Indicate by check mark whether the registrant is a shell company (as defined in Rule 12b-2 of the Act.) Yes ☐ No ý
The aggregate market value on June 30, 2018,2020, of the registrant'sregistrant’s voting securities held by non-affiliates was approximately $254$119 million.
Number of shares of registrant'sregistrant’s Common Stock, par value $0.10 per share, outstanding as of March 4, 2019 (excluding 7,540 shares of treasury stock): 24,686,830.February 26, 2021: 24,834,693.
DOCUMENTS INCORPORATED BY REFERENCE
Certain information required to be furnished pursuant to Part III incorporates informationof this Form 10–K will be set forth in, and will be incorporated by reference from, the registrant’s definitive proxy statement for the registrant's2021 Annual Meeting of Stockholders anticipated to be held on or about May 15, 2019.14, 2021 to be filed by the registrant with the Securities and Exchange Commission pursuant to Regulation 14A within 120 days after the registrant’s fiscal year ended December 31, 2020.
TABLE OF CONTENTS
Item Number and Description | | | | | | | | |
|
| |
| | |
| | |
| | |
| | |
| | |
| | |
| | |
| | |
| | |
| | |
| | |
|
| |
| | 1 |
| | 1 |
| | 1 |
| | 3 |
| | 3 |
| | 4 |
| | 4 |
| | 4 |
| | 4 |
| | 8 |
| | |
| ITEM 1A. RISK FACTORS | 8 |
| | |
| 15 |
| | |
| 16 |
| | |
| 20 |
| | |
| 20 |
| | |
|
| 21 |
| | |
| 22 |
| | |
| |
| | 23 |
| | 24 |
| | 24 |
| | 25 |
| | 29 |
| | 38 |
| | 39 |
| | |
| 42 |
| | |
| 42 |
| | |
| 43 |
| | |
| 43 |
| | |
| 46 |
| | |
|
| 46 |
| | |
| 46 |
| | |
| 46 |
| | |
| 46 |
| | |
| 46 |
| | |
|
| 46 |
| |
| |
PART I
ItemITEM 1. Business.
General
Trecora Resources (the "Company"“Company" or “TREC”) was incorporated in the State of Delaware in 1967. The Company's principal business activities are the manufacturing of various specialty petrochemicalpetrochemicals products and syntheticspecialty waxes and the provision of custom processing services. Unless the context requires otherwise, references to "we," "us," "our,"“we,” “us,” “our,” “TREC,” and the "Company"“Company" are intended to mean consolidated Trecora Resources and its subsidiaries.
The Company owns a 33% interest in Al Masane Al Kobra Mining Company ("AMAK"), a Saudi Arabian closed joint stock mining company, which is engaged in the commercial production of copper and zinc concentrates and silver and gold doré. The Company also has a 55% interest in Pioche Ely Valley Mines, Inc. ("PEVM"), a Nevada mining corporation, which presently does not conduct any substantial business activity but owns undeveloped properties in the United States.
This document includes the following abbreviations:
| |
(1) | TREC – Trecora Resources |
| |
(2) | TOCCO – Texas Oil & Chemical Co. II, Inc. – Wholly owned subsidiary of TREC and parent of SHR and TC |
| |
(3) | SHR – South Hampton Resources, Inc. – Specialty petrochemical segment and parent of GSPL |
| |
(4) | GSPL – Gulf State Pipe Line Co, Inc. – Pipeline support for the specialty petrochemical segment |
| |
(5) | TC – Trecora Chemical, Inc. – Specialty wax segment |
a.TOCCO – Texas Oil & Chemical Co. II, Inc. – Wholly owned subsidiary of TREC and parent of SHR and TC
b.SHR – South Hampton Resources, Inc. – Specialty Petrochemicals segment and parent of GSPL
c.GSPL – Gulf State Pipe Line Co, Inc. – Pipeline support for the Specialty Petrochemicals segment d.TC – Trecora Chemical, Inc. – Specialty Waxes segment
e.PEVM – Pioche Ely Valley Mines, Inc. – Inactive mine - 55% ownership
f.AMAK – Al Masane Al Kobra Mining Company – Held-for-sale mining equity investment and discontinued operations (sale of ownership interest completed in September 2020)
Business Segments
We operate in two business segments; the manufacturing of various specialty petrochemicalpetrochemicals products and the manufacturing of specialty synthetic waxes.
Our specialty petrochemical productsSpecialty Petrochemicals segment is conducted through SHR, a Texas corporation. SHR owns and operates a specialty petrochemicalpetrochemicals facility nearin Silsbee, Texas which produces high purity hydrocarbons and other petroleum based products including isopentane, normal pentane, isohexane and hexane. These products are used in the production of polyethylene, packaging, polypropylene, expandable polystyrene, poly-iso/urethane foams, crude oil from the Canadian tar sands, and in the catalyst support industry. Our specialty petrochemicalSpecialty Petrochemicals products are typically transported to customers by rail car, tank truck, iso-container, and by ship. SHR owns all of the capital stock of GSPL, a Texas corporation, which owns and operates pipelines that connect the SHR facility to a natural gas line, to SHR'sSHR’s truck and rail loading terminal and to a major petroleum products pipeline owned by an unaffiliated third party. SHR also provides custom processing services.services at its Silsbee facility.
Our specialty synthetic waxSpecialty Waxes segment is conducted through TC, a Texas corporation, located in Pasadena, Texas which produces specialty polyethylene and poly alpha olefin waxes and provides custom processing services. The specialty polyethylene waxes are used in markets from paints and inks to adhesives, coatings, and PVC lubricants. The highly specialized synthetic poly alpha olefin waxes are used in applications such as toner in printers and as additives for candles. These waxes are sold in solid form as pastilles or, for large adhesive companies, in bulk liquid form.
See Note 17 to the Consolidated Financial Statements for more information.
In addition, on September 28, 2020, we completed the final closing of the sale of our ownership interest in AMAK, a Saudi Arabian closed joint stock company, which owns, operates and is developing mining assets in Saudi Arabia. Our investment was classified as held-for-sale and the equity in earnings (losses) were recorded in discontinued operations. See Note 6 to the Consolidated Financial Statements for more information.
Specialty PetrochemicalPetrochemicals Operations
SHR'sSHR’s specialty petrochemicalpetrochemicals facility is located in Silsbee, Texas approximately 30 miles north of Beaumont and 90 miles east of Houston. The base SHR facility consists of eightfive operating units which, while interconnected, make distinct products through differing processes: (i) a Penhex Unit; (ii) a Reformer Unit; (iii) a Cyclo-pentane Unit; (iv) an Advanced Reformer unit; and (v) an Aromatics Hydrogenation Unit; (vi) a White Oil Fractionation Unit; (vii) a Hydrocarbon Processing Demonstration Unit; and (viii) a P-XyleneIsomerization Unit. All of these units are currently in operation.In addition to the base plant, SHR operates three proprietary chemical production facilities for toll processing customers. The Penhex Unit currently has the permitted capacity to process approximately 11,000 barrels per day of fresh feed. The Reformer Unit, the Advanced Reformer unit, and the Cyclo-Pentane Unit further process streams produced by the Penhex Unit. The Aromatics Hydrogenation Unit was taken out of service and decommissioned in 2018 with the start up of the new Advanced Reformer unit. The White Oils Fractionation Unit has a capacity of approximately 3,000 barrels per day. The Hydrocarbon Processing Demonstration Unit has a capacity of approximately 300 gallons per day. The P-Xylene Unit has a capacity of approximately 20,000 pounds per year.
The facility generally consists of equipment commonly found in most petrochemical facilities such as fractionation towers and hydrogen treaters, except the facility is adapted to produce specialized products that are high purity and very consistent with precise specifications that are utilized in the petrochemical industry as solvents, additives, blowing agents and cooling agents. We produce eight distinct product streams and market several combinations of blends as needed in various customer applications. We do not produce motor fuel products or any other products commonly sold directly to retail consumers or outlets.
We believe we are positioned to benefit from capital investments that we have recently completed. We now have sufficient pentane capacity to maintain our share of market growth for the foreseeable future. We believe that the Advanced Reformer unit will contribute to increased revenue and gross margin over time and as we improve reliability. While petrochemical prices are volatile on a short-term basis, and volumes depend on the demand of our customers' products and overall customer efficiency, our investment decisions are based on our long-term business strategy and outlook.
During 2015, we constructed a new unit which is part of the Penhex Unit, D Train, which began production in the fourth quarter of 2015. The D Train expansion increased our capacity by approximately 6,000 barrels per day of fresh feed. Our present total capacity at our Silsbee facility is 13,000 barrels per day of fresh feed; however, we are currently only permittedour air permits limit us to processa maximum processing rate of 11,000 barrels per day. During 2018, we constructed a 4,000 barrels per day Advanced Reformer unit to increase our capability to upgrade byproductsby-products produced from the PenHexPenhex Unit and to provide security of hydrogen supply to the plant. We believe we have sufficient pentane capacity to maintain our share of market growth for the foreseeable future.
Products from the Penhex Unit, Reformer Unit, Advanced Reformer unit, and Cyclo-pentane Unit are marketed directly to the customer by our marketing personnel. The Penhex Unit had a utilization rate during 2018 of approximately 56% based upon 11,000 barrels per day of capacity. The Penhex Unit had a utilization rate during 2017 of approximately 53% based upon 11,000 barrels per day of capacity. The Penhex Unit had a utilization rate during 2016 of approximately 48% based upon 11,000 barrels per day.
Penhex Unit capacity is now configured in three independent process units. The three unit configuration improves reliability by reducing the amount of total down time due to mechanical and other factors. This configuration also allows us to use spare capacity for new product development. The Advanced Reformer, Reformer and ReformerIsomerization units are operated as needed to support the Penhex and Cyclo-pentane Units. Consequently, utilization rates of these units are driven by production from the Penhex Unit.
Operating utilization rates are affected by product demand, raw material composition, mechanical integrity, and unforeseen natural occurrences, such as weather events. The nature of the petrochemical process demands periodic shut-downs for de-cokingdecoking and other mechanical repairs.
In February 2018, while attempting to commission the new Advanced Reformer unit, the unit overheated and ignited a fire. There was damage to all six heaters in the unit, and the damaged equipment had to be replaced. The total repair cost was approximately $3.5 million. Our insurers covered costs over our $1 million deductible. On July 9, 2018, we announced the safe and successful start up of the Advanced Reformer unit. In mid-September 2018 the Silsbee facility suffered a power outage causing a shutdown of the plant, including the Advanced Reformer unit. In October 2018, after extensive engineering review and consultations with the technology licensor of the Unit it was determined that the unit's catalyst required replacement. We completed the catalyst replacement and successfully restarted the Unit in December 2018. The cost of the catalyst replacement was approximately $3 million. During the time the Advanced Reformer unit was not operation due to the catalyst replacement work, we incurred losses as a result of sales of byproducts at prices well below the cost of feedstock.
In support of the specialty petrochemicalpetrochemicals operation, we own approximately 100 storage tanks with total capacity approaching 285,000294,000 barrels, and 127 acres of land at the plant site, 92107 acres of which are developed. We also own a truck and railroad loading terminal consisting of storage tanks, nine rail spurs, and truck and tank car loading facilities on approximately 63 acres of which 33 acres are developed. As a result of various expansion programs and the toll processing contracts, essentially all of the standing equipment at SHR is operational. We have various surplus equipment stored on-site which may be used in the future to assemble additional processing units as needs arise.
We obtain substantially all our feedstock requirements from a sole supplier. The agreement is primarily a logistics arrangement. Thearrangement whereby the supplier buys or contracts for feedstock material and utilizes their tank and pipeline connections to transport into our pipeline. The supplier's revenue above feed cost is primarily related toWe renewed our contract with this supplier in May 2020 for a period extending through the cost and operationend of the tank, pipelines, and equipment. A contract was signed in August 2015 with a seven year termJuly 2026 with subsequent one year renewals unless canceled by either party with 180 days' notice. In 2015, a pipeline connection to the supplier's dock was added to give alternative means of receiving feedstock.
GSPL owns and operates threetwo 8-inch diameter pipelines and five 4-inch diameter pipelines, aggregating approximately 70 miles in length connecting SHR'sSHR’s facility to (1) a natural gas line, (2) SHR'sSHR’s truck and rail loading terminal and (3) a major petroleum products pipeline system owned by an unaffiliated third party. All pipelines are operated within Texas Railroad Commission and DOT regulations for maintenance and integrity.
We sell our products predominantly to large domestic and international companies. Products are marketed via personal contact and through continued long term relationships. Sales personnel visitOur commercial team has historically prided itself on regular visits at customer facilities regularly and also attendas well as attendance at various petrochemical conferences throughout the world. Due to the COVID-19 pandemic, we pivoted this year to remote contact with customers. We also have a website withprovide information about our products and services.services through our website. We utilize both formula and non-formula based pricing depending upon a customer's requirements.customer’s requirements and competitive situations. Under formula pricing, the price charged to the customer is primarily based on a formula which includes as a component the average cost of feedstock over the prior month. With this pricing mechanism, product prices move in conjunction with feedstock prices. However, because the formulas use an average feedstock price from the prior month, the movement ofmonth. Current formula product sales prices will trail the movement of costs, and formulacurrent market feedstock prices may or may not reflect our actual feedstock cost for the month during which the product is actually sold. In addition, while
formula pricing can reduce product margins during periods of increasing feedstock costs, during periods of decreasing feedstock costs formula pricing will follow feed costs down but will retain higher margins during the period by trailing the movement of costs by approximately 30 days. During 2018See additional discussion of concentration of revenue and 2017, salescorresponding receivables as disclosed in Note 3 to one customer exceeded 10%the Consolidated Financial Statements.
United States Specialty Synthetic WaxWaxes Operations
TC is a leading manufacturer of specialty synthetic waxes and also provides custom processing services from its 27.5 acre plant located in Pasadena, Texas. TC provides custom manufacturing, hydrogenation, distillation, blending, forming and packaging of finished and intermediate products and wax products for coatings, hot melt adhesives and lubricants. Situated near the Houston Ship Channel, the facility allows for easy access to international shipping and direct loading to rail or truck. The location is within reach of major chemical pipelines and on-site access to a steam pipeline and dedicated hydrogen line create a platform for expansion of both wax production capacity and custom processing capabilities. We manufacture a variety of hard, high melting point, low to medium viscosity polyethylene wax products along with a wide range of other waxes and lubricants. These products are used in a variety of applications including: performance additives for hot melt adhesives; penetration and melting point modifiers for paraffin and microcrystalline waxes; lubrication and processing aides for plastics, PVC, rubber;rubber, and dry stir-in additives for inks. In oxidized forms, applications also include use in textile emulsions.
TC also provides turnkey custom manufacturing services including quality assurance, transportation and process optimization. The plant has high vacuum distillation capability for the separation of temperature sensitive materials. We have a fully equipped laboratory and pilot plant facility and a highly trained, technically proficient team of engineers and chemists suited to handle the rapid deployment of new custom processes and development of new wax products. TC'sTC’s custom manufacturing services provide a range of specialized capabilities to chemical and industrial customercustomers including synthesis, hydrogenation, distillation, forming and propoxylation in addition to a number of other chemical processes.
United States Mineral Interests
Our only mineral interest in the United States is ourWe also have a 55% ownership interest in an inactive mining corporation, PEVM. PEVM'sPEVM’s properties include 48 patented and 5 unpatented claims totaling approximately 1,500 acres. All of the claims are located in Lincoln County, NV.
At thisIn November 2019, PEVM entered into a sales contract which, upon completion of due diligence, may lead to liquidation of substantially all of its remaining assets. Upon closing of the sale, PEVM will be dissolved. Any proceeds from the sale will primarily be used to repay outstanding indebtedness of PEVM owed to the Company.
Environmental, Health and Safety Matters
Our operations are subject to a wide range of environmental laws and regulations at the national, state, and local levels. Our facilities and operations are subject to numerous federal, state and local environmental laws and to other laws regarding health and safety matters (the “Environmental and Health Laws”), many of which provide for certain performance obligations, substantial fines and criminal sanctions for violations. Certain Environmental and Health Laws impose strict liability as well as joint and several liability for costs required to remediate and restore sites where hazardous substances, hydrocarbons or solid wastes have been stored or released. We may be required to remediate contaminated properties currently or formerly owned or operated by us or facilities of third parties that received waste generated by our operations regardless of whether such contamination resulted from the conduct of others or from consequences of our own actions that were in compliance with all applicable laws at the time neitherthose actions were taken.
There can be no assurance that we nor PEVMwill not incur material costs or liabilities in complying with such laws or in paying fines or penalties for violation of such laws. Our insurance may not cover all environmental risks and costs or may not provide sufficient coverage if an environmental claim is made against us. The Environmental and Health Laws and enforcement policies thereunder have plansin the past resulted, and could in the future result, in significant compliance expenses, cleanup costs (for our sites or third-party sites where our wastes were disposed of), penalties or other liabilities relating to develop the mining assets near Pioche, NV. Periodically proposalshandling, manufacture, use, emission, discharge or disposal of hazardous or toxic materials at or from our facilities or the use or disposal of certain of its chemical products. Historically, our subsidiaries have incurred significant expenditures in order to comply with the Environmental and Health Laws and are received from outside parties who are interestedreasonably expected to do so in developing or usingthe future. We will also be obligated to manage certain assets. We do not anticipate making any significant domestic mining capital expenditures.
Environmental
discharge water outlets and monitor groundwater contaminants at our chemical facilities should we discontinue the operations of a facility. Matters pertaining to the environment are discussed in Part I, Item 1A. Risk Factors, Part II, Item 7. Management'sManagement’s Discussion and Analysis of Financial Condition and Results of Operations and Notes 2 and 14 to the Consolidated Financial Statements.
In 1993, during remediation of a small spill area, the Texas Commission on Environmental Quality ("TCEQ"(“TCEQ”) required SHR to drill a well to check for groundwater contamination under the spill area. Two pools of hydrocarbons were discovered to be floating on the groundwater at a depth of approximately 25 feet. One pool is under the site of a former gas processing plant owned and operated by Sinclair, Arco and others before its purchase by SHR in 1981. Analysis of the material indicates it entered the ground prior to SHR'sSHR’s acquisition of the property. The other pool is under the original SHR facility and analysis indicates the material was deposited decades ago. Tests conducted have determined that the hydrocarbons are contained on the property and not migrating in any direction. The recovery process was initiated in June 1998 and approximately $53,000 was spent setting up the system. The recovery is proceeding as planned and is expected to continue for many years until the pools are reduced to acceptable levels. Expenses of recovery and periodic migration testing are being recorded as normal operating expenses. Expenses for future recovery are expected to stabilize and be less per annum than the initial set up cost, although there is no assurance of this effect.this. The light hydrocarbon recovered from the former gas plant site is compatible with
our normal Penhex feedstock and is accumulated and transferred into the Penhex feedstock tank. The material recovered from under the original SHR site is accumulated and sold as a by-product. Approximately 144, 80, and 70 barrels were recovered during 2018, 2017, and 2016, respectively. The recovered material had a value of approximately $5,800, $4,200, and $3,200 during 2018, 2017, and 2016, respectively. Consulting engineers estimate that as much as 20,000 barrels of recoverable material may be available to us for use in our process or for sale. The final volume present and the ability to recover it are both highly speculative issues due to the area over which it is spread and the fragmented nature of the pockets of hydrocarbon. We have drilled additional wells periodically to further delineate the boundaries of the pools and to ensure that migration has not taken place. These tests confirmed that no migration of the hydrocarbon pools has occurred. The TCEQ has deemed the current action plan acceptable and reviews the plan on a semi-annual basis.
Human Capital Management
Personnel
TheTrecora Resources and its subsidiaries hire and retain employees by offering competitive pay and benefits while motivating our workforce through a number of recognition and bonus programs. We are proud to provide our regular, U.S. based employees was approximately 280, 324,the opportunity to grow and 310 for the years endedadvance as we invest in their training, education and career development.
As of December 31, 2018, 2017,2020, we had 263 employees, 10 of whom were corporate management and 2016, respectively. Of thesestaff and 253 worked at our plant facilities. We employ regular employees none are covered by collective bargaining agreements. Regular employees are defined as active executive, management, professional, technical and wage employees who work full time or part time for the Company and are covered by our benefit plans and programs. Our workforce has decreased primarily dueWe have not experienced any significant work stoppages, either as a result of the COVID-19 pandemic or otherwise.
We are committed to completionproviding market-competitive pay and benefits. All regular employees are eligible for performance-based cash incentive programs. The incentive plan reinforces and rewards individuals for achievement of capital projects atspecific business goals, including safety, quality and productivity.
We offer comprehensive benefit programs to our facilities includingemployees that provide flexibility of choice through our total rewards framework of pay and recognition, health and wellness, work/life balance, learning and development, and culture and community. We recognize and support the growth and development of our employees and encourage employees to participate in external learning programs.
COVID-19 Response
We took early action regarding employee well-being in response to the COVID-19 pandemic, implementing comprehensive protocols to protect the health and safety of our employees and contractors. Many of our employees were transitioned to a workforce downsizing at SHRremote work environment for the duration of the pandemic. We had no reductions in December 2018.scheduled hours or reductions in force for any of our employees. We also enhanced our benefits programs to offer expanded supplemental paid leave during quarantine periods and waived employee cost-sharing for COVID-19 testing.
Competition
The specialty petrochemical,petrochemicals and specialty wax, and miningwaxes industries are highly competitive. There is competition within the industries and also with other industries in supplying the chemical and mineral needs of both industrial and individual consumers. We compete with other firms in the sale or purchase of needed goods and services and employ all methods of competition which are lawful and appropriate for such purposes. See further discussion in Part I, Item 1A. Risk Factors.
Investment in AMAK
As of December 31, 2018, we owned a 33.4% interest in AMAK.
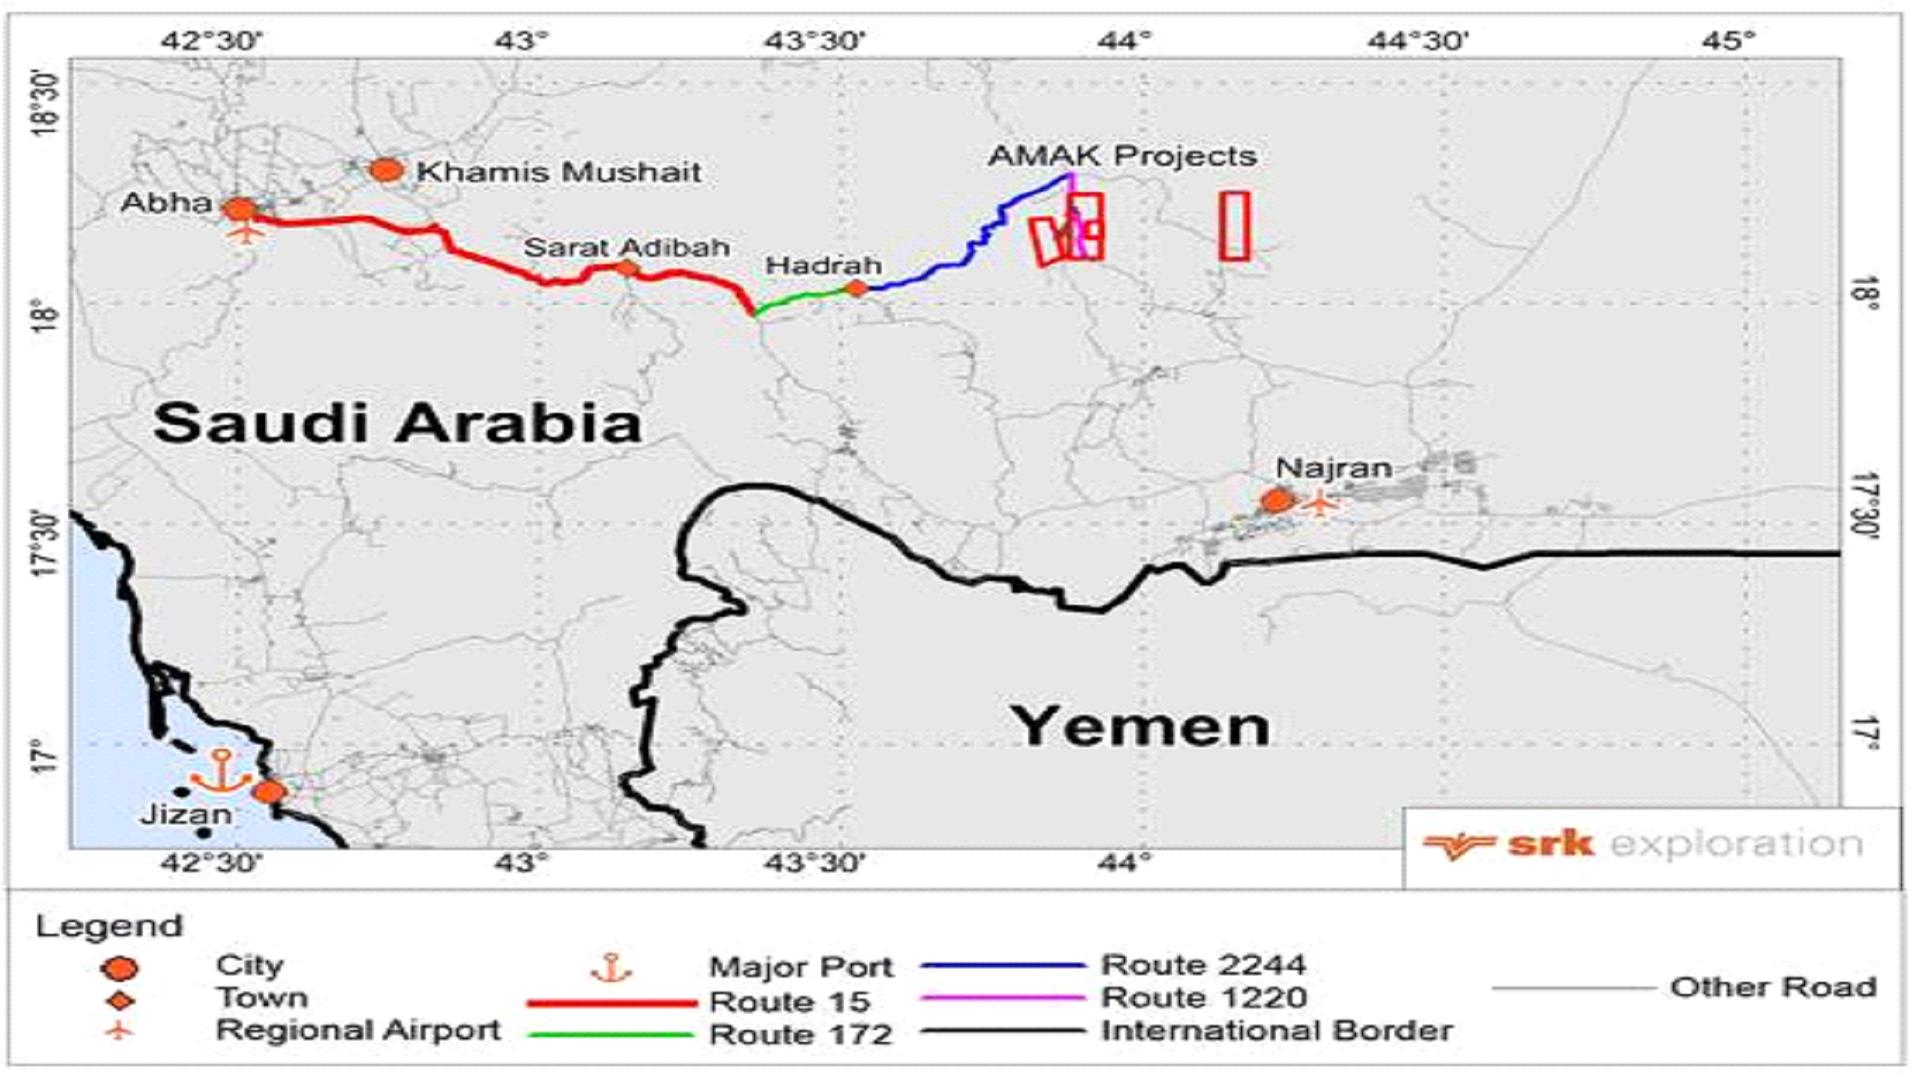
Location, Access and Transportation.
The facility site is located in Najran province in southwestern Saudi Arabia. Najran, the capital of the province of the same name, is approximately 700 km southeast of Jeddah. The site is located 145 km northwest of Najran, midway between the outpost of Rihab and the district town of Sufah. A modern, paved highway extends from Najran through the town of Habuna passing by the project site and on to Sufah. Another modern, paved highway extends west from the town of Tirima about 30 km to the Asir provincial line, becomes a four-lane divided highway, and intersects with a highway leading to Khamis Mushait and Abha. A joining highway then extends down the western slope of the Sarawat mountains to the coastal highway which follows the coast south to the Port of Jazan. The latter is the route AMAK's trucks carry concentrate to the port for export.
Conditions to Retain Title.
The Saudi government granted the Company a mining lease for the Al Masane area comprising approximately 44 square kilometers or approximately 10,870 acres on May 22, 1993 (the "Lease") under Royal Decree No. M/17. The Lease was assigned to AMAK in December 2008. The initial term of the Lease is thirty years beginning May 22, 1993, with AMAK having the option to renew or extend the term of the Lease for additional periods not to exceed twenty years. Under the Lease, AMAK is obligated to pay advance surface rental in the amount of 10,000 Saudi riyals (approximately $2,667 at the current exchange rate) per square kilometer per year (approximately $117,300 annually) during the term of the Lease. In addition, AMAK must pay income tax in accordance with the laws of Saudi Arabia and pay all infrastructure costs. The Lease gives the Saudi Arabian government priority to purchase any gold production from the project, as well as the right to purchase up to 10% of the annual production of other minerals on the same terms and conditions then available to other similar buyers and at current prices then prevailing in the free market. Furthermore, the Lease contains provisions requiring that preferences be given to Saudi Arabian suppliers and contractors and that AMAK employ Saudi Arabian citizens and provide training to Saudi Arabian personnel. In November 2015 AMAK received notification of final approval for additional licenses and leases. The approval includes an additional 151 square kilometers ("km2") of territory contiguous to AMAK's current 44 km2 mine. The new territory comprises the Guyan and Qatan exploration licenses covering 151 km2, and within the Guyan exploration license, a 10 km2 mining lease, which has potential for significant gold recovery. Under the new leases, AMAK is required to pay surface rental of SR 110,000 (approximately $29,333) for a period of 20 years expiring in 2035.
Rock Formations and Mineralization.
Three mineralized zones, the Saadah, Al Houra and Moyeath, have been outlined by diamond drilling. The Saadah and Al Houra zones occur in a volcanic sequence that consists of two mafic-felsic sequences with interbedded exhalative cherts and metasedimentary rocks. The Moyeath zone was discovered after the completion of underground development in 1980. It is located along an angular unconformity with underlying felsic volcanics and shales. The principle sulphide minerals in all of the zones are pyrite, sphalerite, and chalcopyrite. The precious metals occur chiefly in tetrahedrite and as tellurides and electrum.
Description of Current Property Condition.
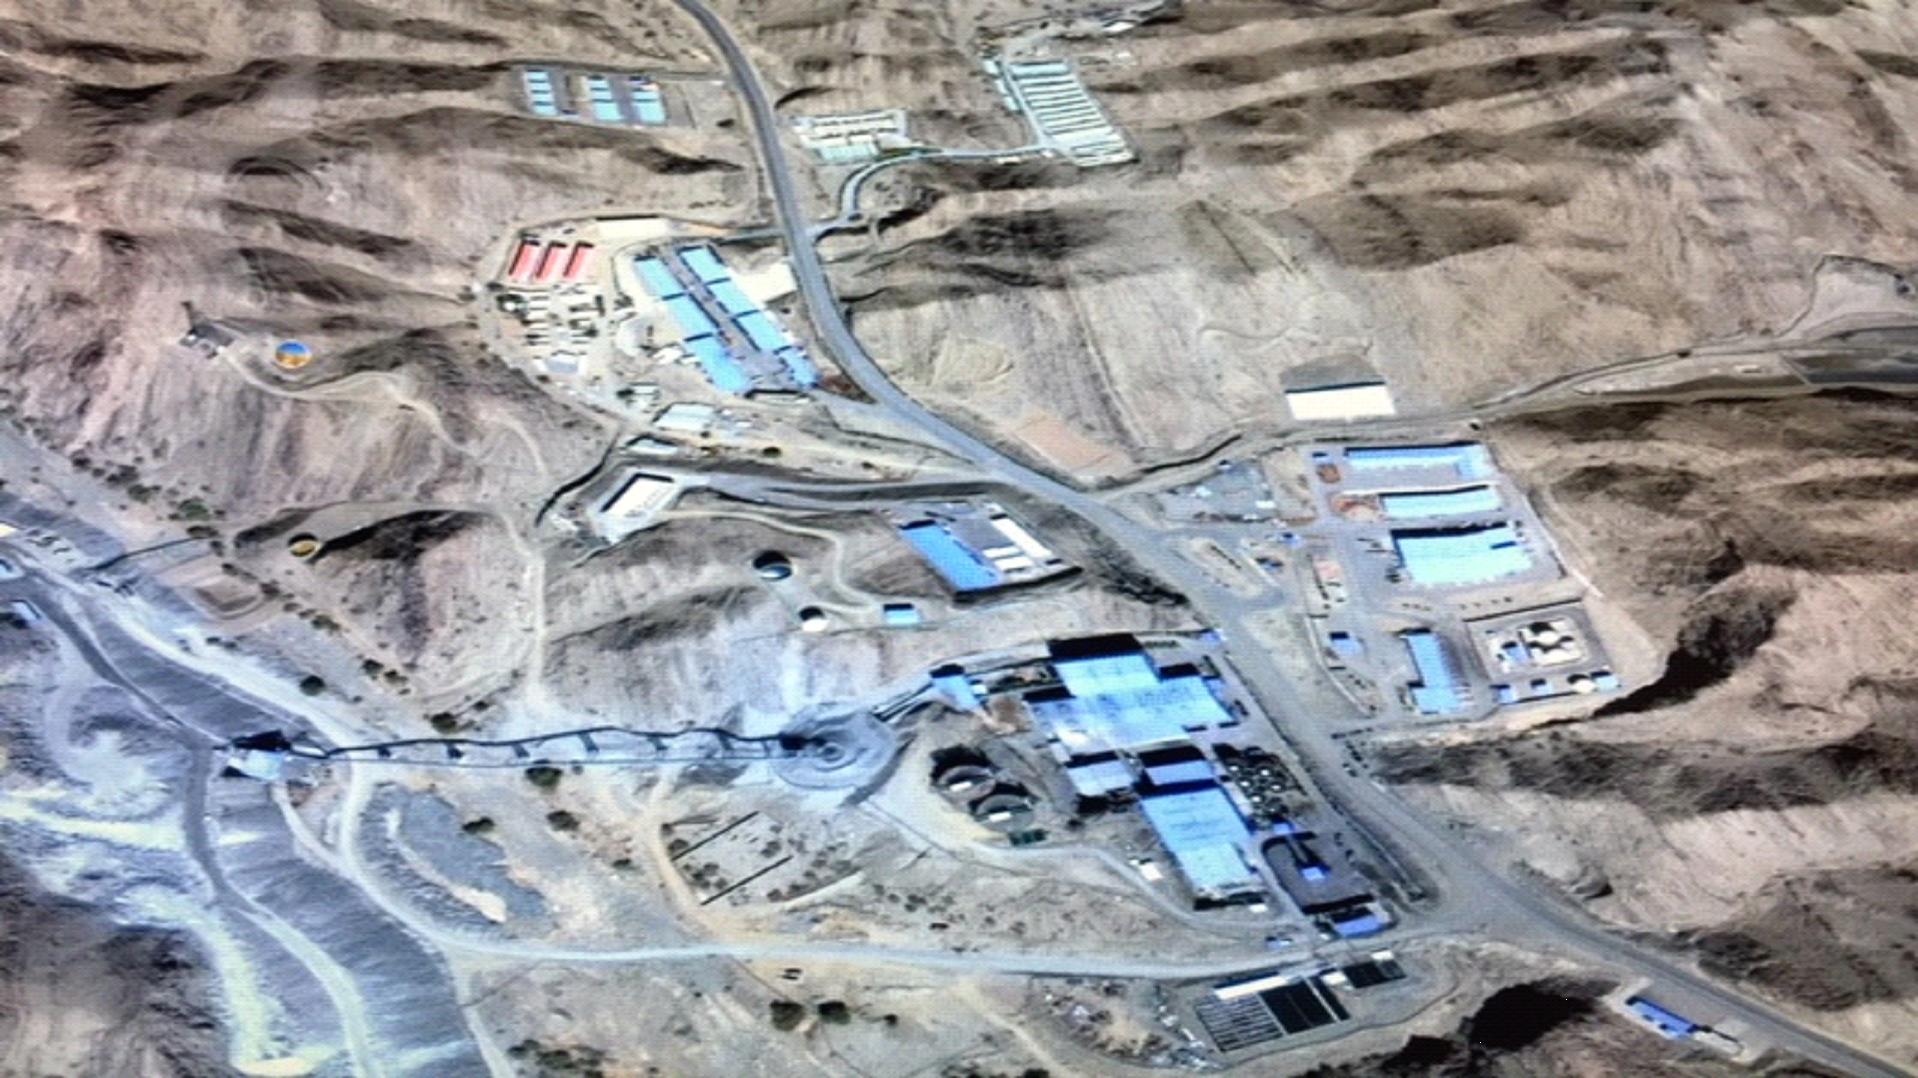
The AMAK facility includes an underground mine, ore-treatment plant and related infrastructures. The ore-treatment plant is comprised of primary crushing, ore storage, SAG milling and pebble crushing, secondary ball milling, pre-flotation, copper and zinc flotation, concentrate thickening, tailings filtration, cyanide leaching, reagent handling, tailings dam and utilities. Related infrastructure includes a 300 man capacity camp for single status accommodation for expatriates and Saudi Arabian employees, an on-site medical facility, a service building for 300 employees, on-site diesel generation of 15 megawatts, potable water supply primarily from an underground aquifer, sewage treatment plant and an assay laboratory. The facilities at the Port of Jazan are comprised of unloading facilities, concentrate storage and reclamation and ship loading facilities. The above-ground ore processing facility became fully operational during the second half of 2012. Late in the fourth quarter of 2015, AMAK temporarily closed the operation to preserve the assets in the ground while initiating steps to improve efficiencies and optimize operations. The plant resumed operation in the fourth quarter of 2016 and operating rates, metal recoveries and concentrate quality has continued to improve throughout 2017 and 2018.
AMAK shipped approximately 58,000, 28,000, and 16,000 metric tons of copper and zinc concentrate to outside smelters during 2018, 2017, and 2016, respectively. In 2014 AMAK initiated operation of its precious metal recovery circuit at the mill and produced gold and silver doré intermittently through 2014 and 2015. The precious metals circuit was recommissioned in the fourth quarter of 2017 and produced commercial quantities of gold and silver bearing doré in 2018.
Saudi Industrial Development Fund ("SIDF") Loan and Guarantee
On October 24, 2010, we executed a limited guarantee in favor of the SIDF guaranteeing up to 41% of the SIDF loan to AMAK in the principal amount of 330,000,000 Saudi Riyals (US$88,000,000) (the "Loan"). As a condition of the Loan, SIDF required all shareholders of AMAK to execute personal or corporate guarantees totaling 162.55% of the overall Loan amount. As ownership percentages have changed over time, the loan guarantee allocation has not changed. The other AMAK shareholders provided personal guarantees. We were the only AMAK shareholder providing a corporate guarantee. The loan was required in order for AMAK to fund construction of the underground and above-ground portions of its mining project in southwest Saudi Arabia and to provide working capital for commencement of operations. See Note 14 to the Consolidated Financial Statements.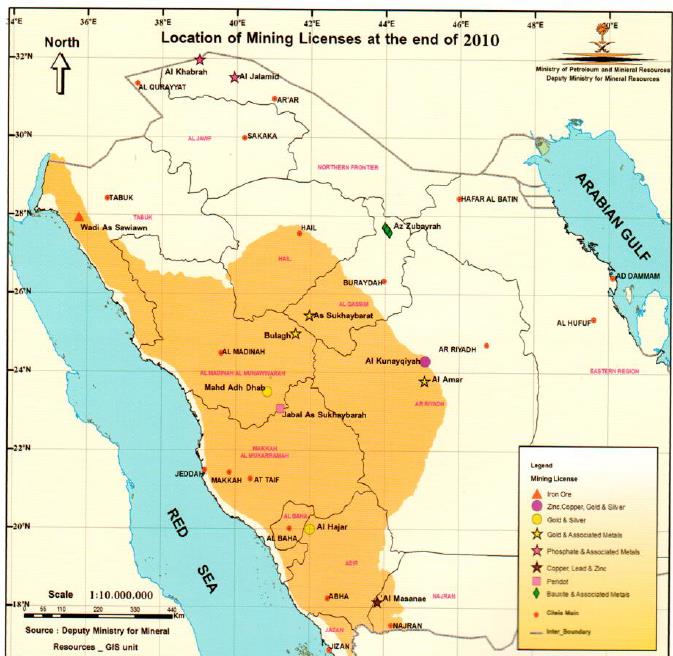
Accounting Treatment of Investment in AMAK.
We have significant influence over the operating and financial policies of AMAK and therefore, account for it using the equity method. We have one representative on the Executive Committee of the Board of Directors of AMAK. We also have one director who serves as Chair on the Commercial Committee of AMAK. AMAK is effectively self-operating under a new, experienced management team. See Note 10 to the Notes to the Consolidated Financial Statements.
We assess our investment in AMAK for impairment when events are identified, or there are changes in circumstances that indicate that the carrying amount of the investment might not be recoverable. We consider recoverable ore reserves, mineral prices,
operational costs, and the amount and timing of the cash flows to be generated by the production of those reserves, as well as recent equity transactions within AMAK.
Available Information
We will provide paper copies of this Annual Report on Form 10-K, our quarterly reports on Form 10-Q, our current reports on Form 8-K and amendments to those reports, all as filed or furnished pursuant to Section 13(a) or 15(d) of the Securities Exchange Act of 1934, as amended (the "Exchange Act"“Exchange Act”), free of charge upon written or oral request to Trecora Resources, 1650 Hwy 6 S, Suite 190, Sugar Land, TX 77478, (281) 980-5522. These reports are also available free of charge on our website, www.trecora.com, as soon as reasonably practicable after they are filed electronically with the U.S. Securities and Exchange Commission ("SEC"(“SEC”). and can also be accessed by visiting the SEC website at www.sec.gov. SHR also has a website at www.southhamptonr.com, and TC has a website at www.trecchem.com, and AMAK has a website at www.amak.com.sa. Thesewww.trecchem.com. Any of the aforementioned websites and the information contained on or connected to them are not incorporated by reference herein to the SEC filings.
ItemITEM 1A. Risk Factors.
We are subject to a variety of risks inherent in the global specialty petrochemical,petrochemicals and specialty wax and mining (due to our investment in AMAK)waxes businesses. Many of these risk factors are not within our control and could adversely affect our business, results of operations or our financial condition.
Risks Related to our Industry and Operations
We rely on a limited number of customers, including one customer that represented more than 10% of our consolidated revenue in 2018.2020. A significant change in customer relationships or in customer demand for our products could materially adversely affect our results of operations, financial positioncondition and cash flows.
We rely on a limited number of customers. Our largest customer, ExxonMobil and its affiliates, represented approximately 17.0%15.4% of our consolidated revenues in 2018.2020. A significant reduction in sales to any of our other key customers could materially adversely affect our results of operations, financial positioncondition and cash flows, and could result from our key customers further
diversifying their product sourcing, experiencing financial difficulty or undergoing consolidation.
Our industry is highly competitive, and we may lose market share to other producers of specialty petrochemicals, specialty waxes or other products that can be substituted for our products, which may adversely affect our results of operations, financial positioncondition and cash flows.
Our industry is highly competitive, and we face significant competition from both large international producers and from smaller regional competitors. Our competitors may improve their competitive position in our core markets by successfully introducing new products, improving their manufacturing processes or expanding their capacity or manufacturing facilities. Further, some of our competitors benefit from advantageous cost positions that could make it increasingly difficult for us to compete in certain markets. If we are unable to keep pace with our competitors'competitors’ product and manufacturing process innovations, cost position or alternative value proposition, it could have a material adverse effect on our results of operations, financial condition and cash flows.
In addition, we face increased competition from companies that may have greater financial resources and different cost structures, alternative values or strategic goals than us. We have a portfolio of businesses across which we must allocate our available resources, while competing companies may specialize in only certain of our product lines. As a result, we may invest less in certain areas of our business than our competitors, and such competitors may have greater financial, technical and marketing resources available to them. Industry consolidation may also affect competition by creating larger, more homogeneous and stronger competitors in the markets in which we compete, and competitors also may affect our business by entering into exclusive arrangements with existing or potential customers or suppliers. We may have to lower the prices of many of our products and services to stay competitive, while at the same time, trying to maintain or improve revenue and gross margin.
Loss of key employees, our inability to attract and retain new qualified employees or our inability to keep our employees focused on our strategies and goals could have an adverse impact on our operations.
In order to be successful, we must attract, retain and motivate executives and other key employees including those in managerial, technical, safety, operations, sales and marketing positions. We must also keep employees focused on our strategies and goals. The failure to hire, or loss of, key employees in a competitive industry could have a significant adverse impact on our operations. In addition, an important component of our competitive performance is our ability to operate safely and efficiently, including our ability to manage expenses and minimize the production of low margin products on an on-going basis. This requires continuous management focus, including technological improvements, safe operations, cost control and productivity enhancements. The extent to which we manage these factors will impact our performance relative to competition.
If the availability of our raw materials is limited, we may be unable to produce some of our products in quantities sufficient to meet customer demand or on favorable economic terms, which could have an adverse effect on our results of operations, financial condition and cash flows.
We douse natural gasoline as a raw material in the production our products in the Specialty Petrochemicals segment. We use polyethylene waxes in our Specialty Waxes segment. Suppliers may not controlbe able to meet our raw material requirements and we may not be able to obtain substitute supplies from alternative suppliers in sufficient quantities, on economic terms, or in a timely manner. A lack of timely availability of our raw materials in the activitiesquantities we require to produce our products (including as a result of AMAKsupply chain issues due to the COVID-19 pandemic or other global economic issues) could result in our inability to meet customer demand and could have a material adverse effect on our results of operations, financial condition and cash flows.
Increases in the costs of our raw materials could have an adverse effect on our financial condition and results of operations if those costs cannot be passed onto our customers.
Our results of operations are dependent on AMAK's managementdirectly affected by the cost of raw materials. Since the cost of these primary raw materials comprise a significant amount of our total cost of goods sold, the selling prices for our products and boardtherefore our total revenue is impacted by movements in these raw material costs, as well as the cost of directors.
Although we believe thatother inputs. In the past we have influence overexperienced erratic and significant changes in the operatingcosts of these raw materials, the cost of which has generally correlated with changes in energy prices, supply and financial policiesdemand factors, and prices for natural gas and crude oil. Moreover, the price of AMAK, we do not control AMAK's activities. The extent toraw materials may also be impacted by other external factors, including uncertainties associated with war, terrorist attacks, weather and natural disasters, health epidemics or pandemics (such as the COVID-19 pandemic), civil unrest, the effects of climate change or political instability, plant or production disruptions, strikes or other labor unrest, breakdown or degradation of transportation infrastructure used in the delivery of raw materials or changes in laws or regulations in any of the countries in which we are able to influence specific operating and financial decisions dependshave significant suppliers. In addition, product mix can have an impact on our ability to persuade other AMAK board membersoverall unit selling prices, since we provide an extensive product offering and management regardingtherefore experience a wide range of unit selling prices. Because of the significant portion of our cost of goods sold represented by these policies. Our ability to persuade them mayraw materials, our gross profit margins could be adversely affected by cultural differences, differing accounting and management practices and differing governmental laws and regulations. changes in the cost of these raw materials if we are unable to pass the increases on to our customers.
In addition, we rely upon AMAK's managementutilize both formula and boardnon-formula based pricing, depending on customer requirements and competitive situations. Under formula pricing the price charged to the customer is primarily based on a formula which includes, as a component, the average cost of directors to directfeedstock over the operationsprior month. With this pricing mechanism, product prices generally move in conjunction with feedstock prices. However, because the formulas use an average feedstock price from the prior month, the movement of AMAK, including employing various engineeringprices will trail the movement of costs, and financial advisors to assistformula prices may or may not reflect our actual feedstock cost for the month during which the product is actually sold. In addition, while formula pricing can reduce product margins during periods of increasing feedstock costs, during periods of decreasing feedstock costs, formula pricing will follow feedstock costs down but will retain higher margins during the period by trailing the movement of costs by approximately 30 days. These timing differences have had and may, in the developmentfuture, have a negative effect on our cash flow. Any raw materials cost increase that we are not able to pass on to our customers could have a material adverse effect on our business, results of operations, financial condition and evaluation of the mining projects in Saudi Arabia. We also rely on management of AMAKliquidity.
Due to provide timely, accurate financial information required for inclusion with our reports filed with the SEC.
Therevolatile raw material prices, there can be no assurance that we can continue to recover raw material costs or retain customers in the future. For example, our investmentlogistics costs have increased substantially within the past three years, narrowing our profit margins. This may force us to increase our pricing, which could cause customers to consider competitors’ products, some of which may be available at a lower cost. Significant loss of customers could result in AMAK willa material adverse effect on our results of operations, financial condition and cash flows.
If we are unable to access third-party transportation for our raw materials and finished products, we may not be able to fulfill our obligations to our customers in a timely manner, which could have a material adverse effect on our results of operations, financial condition and cash flows.
We rely upon transportation provided by third parties (including common carriers, rail companies and trans-ocean cargo companies) to receive raw materials used in the production of our products and to deliver finished products to our customers. While we attempt to offset the risks associated with third-party transportation issues, including by owning and operating a truck fleet to meet certain customer demand as well as managing our supplies of raw materials, such mitigation efforts may not be successful. If we are unable to access third-party transportation at economically attractive rates, or at all, or if there is any other significant disruption in the availability of third-party transportation, we may not be able to obtain sufficient quantities of raw materials (on favorable terms, or at all) to match the pace of production and/or we may not be able to fulfill our obligations to our customers in a timely manner, which could have a material adverse effect on our results of operations, financial condition and cash flows.
Failure to successfully consummate extraordinary transactions, including the integration of other businesses, assets, products or technologies, or realize the financial and strategic goals that were contemplated at the time of any such transaction may adversely affect our future business, results of operations and financial condition.
As part of our business strategy, we from time to time explore possible investments, acquisitions, strategic alliances, joint ventures, divestitures and outsourcing transactions (collectively, “extraordinary transactions”) in order to further our business objectives. To pursue this strategy successfully, we must identify suitable candidates for, and successfully complete, extraordinary transactions, some of which may be large and complex, and manage post-closing issues such as the integration of acquired businesses or employees. The expense and effort incurred in exploring and consummating extraordinary transactions, the time it takes to integrate an acquisition or our failure to integrate businesses successfully, could result in additional and/or unexpected expenses and losses. We also may not be successful in negotiating the terms of any potential extraordinary transactions, conducting thorough due diligence, financing an extraordinary transaction or effectively integrating the acquired business, product or technology into our existing business and operations. Our due diligence may fail to identify all of the problems, liabilities or other shortcomings or challenges of an acquired business, product or technology. Moreover, we may incur significant expenses whether or not a contemplated extraordinary transaction is ultimately consummated.
Additionally, in connection with any extraordinary transaction we consummate, we many not fully realize all of the anticipated synergies and other benefits we expect to achieve (on our expected timeframe, or at all), and we may incur unanticipated expenses, write-downs, impairment charges or unforeseen liabilities that could negatively impacted by the decisions made by AMAK'saffect our business, financial condition and results of operations, disrupt relationships with current and new employees, customers and vendors, incur significant debt or have to delay or not proceed with announced transactions. Further, managing extraordinary transactions requires varying levels of management and boardemployee resources, which may divert our attention from other business operations. We may also face additional challenges and costs after the consummation of directors regarding AMAK's activities,the transaction, including with respectthose related to the selectionintegrating or restructuring our operations, information management and useother technology systems, while carrying on our ongoing business.
Maintenance, expansion and refurbishment of our facilities and the development and implementation of new manufacturing processes involve significant risks which may adversely affect our business, results of operations, financial condition and cash flows.
Our facilities require periodic maintenance, upgrading, expansion, refurbishment or improvement. Any unexpected operational or mechanical failure, including failure associated with breakdowns and forced outages, could reduce our facilities'facilities’ production capacity below expected levels which would reduce our revenues and profitability. Unanticipated expenditures associated with maintaining, upgrading, expanding, refurbishing or improving our facilities may also reduce profitability.
If we make any major modifications to our facilities, such modifications likely would result in substantial additional capital expenditures and may prolong the time necessary to bring the facility on line.online. We may also choose to refurbish or upgrade our facilities based on our assessment that such activity will provide adequate financial returns. However, such activities require time for development before commencement of commercial operations, and key assumptions underpinning a decision to make such an investment may prove incorrect, including assumptions regarding construction costs, demand growth and timing which could have a material adverse effect on our business, results of operations, financial condition and cash flows.
Finally, we may not be successful or efficient in developing or implementing new production processes. Innovation in production processes involves significant expense and carries inherent risks, including difficulties in designing and developing new process technologies, development and production timing delays, lower than anticipated manufacturing yields, and product defects. Disruptions in the production process can also result from errors, defects in materials, delays in obtaining or revising operating permits and licenses, returns of product from customers, interruption in our supply of materials or resources and disruptions at our facilities due to accidents, maintenance issues, or unsafe working conditions, all of which could affect the timing of production ramps and yields. Production issues can lead to increased costs and may affect our ability to meet product demand, which could adversely impact our business, results of operations, financial condition and cash flows.
There are certain hazards and risks inherent in our operations that could adversely affect those operations and results of operations and financial condition.
As a manufacturer and distributor of diversified chemical products, our business is subject to operating risks inherent in chemical manufacturing, storage, handling and transportation. These risks include, but are not limited to, fires, explosions, severe weather and natural disasters, mechanical failure, unscheduled downtime, loss of raw materials or our products, transportation interruptions, remediation, chemical spills, terrorist acts or war, discharges or releases of toxic or hazardous substances or gases. These hazards can cause personal injury and loss of life, severe damage to, or destruction of, property and equipment and environmental contamination. In addition, our suppliers are also subject to similar risks that may adversely impact our production capabilities. A significant limitation on our ability to manufacture products due to disruption of manufacturing operations or related infrastructure could have a material adverse effect on our results of operations and financial condition.
While we adapt our manufacturing and distribution processes and controls to minimize the inherent risk of our operations, to promote workplace safety and to minimize the potential for human error, we cannot completely eliminate the risk of accidental contamination or injury from hazardous or regulated materials, including injury of our employees, individuals who handle our products or goods treated with our products, or others who claim to have been exposed to our products, nor can we completely eliminate the unanticipated interruption or suspension of operations at our facilities due to such events. We may be held liable for significant damages or fines in the event of contamination or injury, and such assessed damages or fines could have a material adverse effect on our results of operations and financial conditions. Our property, business interruption and casualty insurance may not fully insure us against all potential hazards incidental to our business.
Conditions in the global economy may adversely affect our results of operations, financial condition and cash flows.
The demand for our products have historically correlated closely with general economic growth rates. The occurrence of recessions or other periods of low or negative growth will typically have a direct adverse impact on our results of operations, financial condition and cash flows. Other factors that affect general economic conditions in the world or in a major region, such as changes in population growth rates or periods of civil unrest, weather and national disasters or health epidemics and pandemics also impact the demand for our products. Economic conditions that impair the functioning of financial markets and financial institutions also pose risks to us, including risks to the safety of our financial assets and to the ability of our partners and customers to fulfill their commitments to us.
In addition, the revenue and profitability of our operations have historically been subject to fluctuation, which makes future financial results less predictable. Our revenue, gross margin and profit vary among our products, customer groups and geographic markets. Overall gross margins and profitability in any given period are dependent partially on the product, customer and geographic mix reflected in that period’s net revenue. In addition, newer geographic markets may be relatively less profitable due to investments associated with entering those markets and local pricing pressures. Market trends, competitive pressures, increased raw material or shipping costs, regulatory impacts and other factors may result in reductions in revenue or
pressure on gross margins of certain segments in a given period which may necessitate adjustments to our operations.
The global outbreak of COVID-19 has had, and may continue to have, an adverse impact on the business, results of operations, financial position, and liquidity of the Company and/or its customers, suppliers, and other counterparties.
The COVID-19 pandemic has caused, and may continue to cause, a global slowdown of economic activity, particularly, reduced demand in durable goods markets such as automotive and construction, disruptions in global supply chains, significant economic uncertainty and volatility and disruption of financial markets. The COVID-19 pandemic is having an impact on the Company’s operations and financial performance, as well as on the operations and financial performance of many of the Company’s customers and suppliers. Across all of our businesses, we are facing increased operational challenges from the continued need to protect employee health and safety by requiring restrictions on the movement of people, which can cause workplace disruptions, reduced productivity, operational disruptions or shutdowns, and the incurrence of additional costs. Due to the economic slowdown caused by the COVID-19 pandemic, we are also experiencing, and may continue experiencing, lower demand and volume for products and services from our customers, as well as potential restrictions or delays on deliveries of key raw materials from our suppliers. See Part II, Item 7. Management’s Discussion and Analysis of Financial Condition and Results of Operations, for additional information on how we have been impacted and the steps we have taken in response.
Because the severity, magnitude and duration of the COVID-19 pandemic and its economic consequences are uncertain, rapidly changing and difficult to predict, the pandemic’s impact on the Company’s operations and financial performance, as well as its impact on our ability to successfully execute our business strategies and initiatives, remains uncertain and difficult to predict. Additionally, the ultimate impact of the COVID-19 pandemic on our operations and financial performance depends on many factors that are not within our control, including, but not limited, to: governmental, business and individuals’ actions that have been and continue to be taken in response to the pandemic (including restrictions on travel and transport and human capital constraints); the impact of the pandemic and actions taken in response on global and regional economies, travel, and economic activity; the availability of federal, state, local or non-U.S. funding programs; general economic uncertainty in key global markets and financial market volatility; the weakening of demand in certain end markets; prolonged disruption in global logistics channels; global economic conditions and levels of economic growth; and the pace of recovery as the COVID-19 pandemic subsides. We expect that the longer the period of economic and global supply chain and disruption continues, the more material the impact could be on our business operations, financial performance and results of operations, and this could include potential charges, impairments and other adverse financial impacts in future periods.
As the COVID-19 pandemic continues to adversely affect our operating and financial results, it may also have the effect of heightening many of the other risks described in the risk factors herein, the COVID-19 pandemic may also affect our operating and financial results in a manner that is not presently known to us.
Domestic or international natural disasters or other severe weather events, health epidemics or pandemics or terrorist attacks may disrupt our operations or those of our customers or suppliers, decrease demand for our products or otherwise have an adverse impact on our business.
Chemical related assets, and U.S. corporations such as ours, may be at a greater risk of future terrorist attacks (including both physical attacks and cyber–attacks) than other possible targets in the U.S. Moreover, extraordinary events such as natural disasters, other severe weather events or global or local health epidemics (such as the COVID-19 pandemic) could result in significant damage to our facilities, the pipeline systems and other infrastructure we rely on and/or disruption of our operations and may negatively affect local economies, including those of our customers or suppliers. The occurrence of such events cannot be predicted, although their occurrence can be expected to continue to adversely impact the economy in general and our specific markets.
The resulting damage from a natural disaster, other severe weather events or terrorist attack could include loss of life, property damage or site closure. Several of our facilities are located in regions where natural disasters and other severe weather events have previously disrupted, and may in the future disrupt, our ability to manufacture and deliver products from certain facilities. Any damage resulting in stoppage or reduction of our facilities’ production capacity could reduce our revenues and any unanticipated capital expenditures to repair such damage (to the extent not covered by our insurance policies) may reduce profitability. Any, or a combination, of these factors could also adversely impact our results of operations, financial condition and cash flows.
We are exposed to local business risks in different countries, which could have a material adverse effect on our financial condition and results of operations.
Although we do not have production operations and assets outside of the U.S., we do have a global portfolio of customers and thus we are subject to a variety of international market risks including, but not limited to: ongoing instability or changes in a country’s or region’s economic or political conditions, including inflation, recession, interest rate fluctuations, civil unrest and actual or anticipated military or political conflicts; longer accounts receivable cycles and financial instability or credit risk among customers and distributors; trade regulations and procedures and actions affecting production, pricing and marketing of
products, including domestic and foreign customs and tariffs or other trade barriers; regulations favoring local contractors or requiring foreign contractors to employ citizens of, or purchase supplies from, a local jurisdiction; local labor conditions and regulations and the geographical dispersion of the workforce; changes in the regulatory or legal environment; differing technology standards or customer requirements; import, export or other business licensing requirements or requirements relating to making foreign direct investments, which could affect our ability to obtain favorable terms for labor and raw materials or lead to penalties or restrictions; data privacy regulations; risk of non-compliance with the sanction laws or U.S. Foreign Corrupt Practices Act or similar anti-bribery legislation in other countries by agents or other third-party representatives; risk of nationalization of private enterprises by foreign governments; foreign currency exchange restrictions and fluctuations; the outbreak of global or regional health epidemics or pandemics (such as the COVID-19 pandemic); difficulties associated with repatriating cash generated or held abroad in a tax-efficient manner and changes in tax laws; and fluctuations in freight costs and disruptions in the transportation and shipping infrastructure at important geographic points of exit and entry for our products and shipments.
Such economic and political uncertainties may materially and adversely affect our business, financial condition or results of operations in ways that cannot be predicted at this time. Although it is impossible to predict the occurrences or consequences of any such events, they could result in a decrease in demand for our products, make it difficult or impossible to deliver products to our customers or to receive raw materials from our suppliers and create delays and inefficiencies in our supply chain. We are also predominantly uninsured for losses and interruptions caused by terrorist acts, conflicts and wars.
Certain activist stockholders actions could cause us to incur expense and hinder execution of our strategy.
While we seek to actively engage with our stockholders and consider their views on business and strategy, we could be subject to actions or proposals from our stockholders that do not align with our business strategies or the interests of our other stockholders. Responding to these stockholders could be costly and time-consuming, disrupt our business and operations and divert the attention of our management. Furthermore, uncertainties associated with such activities could negatively impact our ability to execute our strategic plan, retain customers and skilled employees and affect long-term growth. In addition, such activities may cause our stock price to fluctuate based on temporary or speculative market perceptions that do not necessarily reflect our business operations.
Delaware law and certain provisions of our organizational documents may make a takeover of our company more difficult.
Provisions of our charter and bylaws may have the effect of delaying, deferring or preventing a change in control of our company. A change of control could be proposed in the form of a tender offer or takeover proposal that might result in a premium over the market price for our common stock. In addition, these provisions could make it more difficult to bring about a change in the composition of our board of directors, which could result in the entrenchment of current management. For example, our charter and bylaws: require that the number of directors be determined, and provide that any vacancy or new board seat may be filled only by the board; do not permit stockholders to call a special meeting; and establish advance notice requirements for nominations for elections to our board of directors or for proposing matters that can be acted upon by stockholders at stockholder meetings.
Our employment agreements and equity arrangements with our executive officers also contain change in control provisions. Under the terms of these arrangements, the executive officers may be entitled to receive significant cash payments, immediate vesting of equity awards and continued medical benefits in the event their employment is terminated under certain circumstances in connection with or in certain circumstances following, a “corporate change”. We disclose in proxy statements filed with the SEC potential payments to our named executive officers in connection with such “corporate change.” Certain change of control transactions may also constitute an event of default under our agreements with our creditors and other third parties.
These arrangements and provisions of our organizational documents and Delaware law may have the effect of delaying, deferring or preventing changes of control or changes in management of our company, even if such transactions or changes would have significant benefits for our stockholders. As a result, these provisions could limit the price some investors might be willing to pay in the future for shares of our common stock.
Risks Related to Legal and Regulatory Matters
We are subject to numerous regulations that could require us to modify our current business practices and incur increased costs.
We are subject to numerous regulations, including customs and international trade laws, export control, data privacy, antitrust laws and zoning and occupancy laws that regulate manufacturers generally and/or govern the importation, promotion and sale of our products, the operation of our facilities and our relationship with our customers, suppliers and competitors. In addition, we face risk associated with trade protection laws, policies and measures and other regulatory requirements affecting trade and investment, including loss or modification of exemptions for taxes and tariffs, imposition of new tariffs and duties and import and export licensing requirements. If these laws or regulations were to change (including as a result of policies that may be adopted by the new Biden administration) or were violated by our management, employees, suppliers, buying agents or trading companies, the costs of certain goods could increase, or we could experience delays in shipments of our goods, be subject to fines or penalties, or suffer reputational harm, which could reduce demand for our products and hurt our business and negatively impact our results of operations. In addition, changes in federal and state minimum wage laws and other laws relating to employee benefits could cause us to incur additional wage and benefits costs, which could negatively impact our profitability.
Legal requirements are frequently changed and subject to interpretation, and we are unable to predict the ultimate cost of compliance with these requirements or their effects on our operations. We may be required to make significant expenditures or modify our business practices to comply with existing or future laws and regulations, which may increase our costs and materially limit our ability to operate our business.
Adverse results of legal proceedings could materially adversely affect us.
We are subject to and may in the future be subject to a variety of legal proceedings and claims that arise out of the ordinary conduct of our business, including legal proceedings brought in non-U.S. jurisdictions. Results of legal proceedings cannot be predicted with certainty. Irrespective of its merits, litigation may be both lengthy and disruptive to our operations and may cause significant expenditure and diversion of management attention. We may be faced with significant monetary damages or injunctive relief against us that could have an adverse impact on our business and results of operations should we fail to prevail in certain matters.
We expect to continue to incur capital expenditures and operating costs as a result of our compliance with existing and future environmental laws and regulations.
Our industry is subject to extensive laws and evolving regulations related to the protection of the environment. These laws and regulations have tended to become more stringent over time, continue to increase in both number and complexity and affect our operations with respect to, among other things: the discharge of pollutants into the environment; emissions into the atmosphere (including greenhouse gas emissions); and restrictions, liabilities and obligations in connection with storage, transportation, treatment and disposal of hazardous substances and waste. We are also subject to laws and regulations that require us to operate and maintain our facilities to the satisfaction of applicable regulatory authorities.
In addition, failure to comply with these laws or regulations, or failure to obtain required permits from applicable regulatory authorities, may expose us to fines, penalties or interruptions in operations. To the extent these capital expenditures or operating costs are not ultimately reflected in the prices of our products and services, or that we are subject to fines, penalties or other interruptions in our operations, our business, results of operations, financial condition and cash flows may be adversely affected.
The adoption of climate change legislation or regulation could result in increased operating costs and reduced demand for our products.
The nature of our operations could make us subject to legislation or regulations affecting the emission of greenhouse gases. The U.S. Environmental Protection Agency has promulgated (and may in the future promulgate) regulations applicable to projects involving greenhouse gas emissions above a certain threshold, and the U.S. and certain states within the U.S. have enacted, or are considering, limitations on greenhouse gas emissions. Jurisdictions outside the U.S. are also addressing greenhouse gases by legislation or regulation. In addition, efforts have been made and continue to be made at the international level toward the adoption of international treaties or protocols that would address global greenhouse gas emissions. These limitations may include the adoption of cap and trade regimes, carbon taxes, restrictive permitting, increased efficiency standards and incentives or mandates for renewable energy. For example, in January 2021, President Biden signed executive orders that represent his administrations first actions to fight climate change, which included an executive order to reenter the Paris Agreement international treaty on climate change that requires member countries to review and progress their intended contributions and set greenhouse gas reduction goals every five years beginning in 2020. The implementation of this treaty and other efforts to reduce greenhouse gas emissions could make our products more expensive, lengthen project implementation times and reduce
demand for hydrocarbons, as well as shift hydrocarbon demand toward relatively lower-carbon sources. Such legislation, regulation, treaties or protocols may also increase our compliance costs, such as for monitoring or sequestering emissions.
Risks Related to Technology
Increased information systems security threats and more sophisticated and targeted computer crime could pose a risk to our systems, networks, products and services.
Increased information systems security threats and more sophisticated, targeted computer crime pose a risk to the security of our systems and networks and the confidentiality, availability, and integrity of our data, operations, and communications. While we attempt to mitigate these risks by employing a number of measures, including security measures, employee training, comprehensive monitoring of our networks and systems, upgrading our equipment and software and maintenance of backup and protective systems, if these measures prove inadequate, we could be adversely affected by, among other things, loss or damage of intellectual property, proprietary and confidential information, and communications or customer data, having our business operations interrupted, our supply chain interrupted and increased costs to prevent, respond to, or mitigate these cyber security threats. Any significant disruption or slowdown of our systems could cause customers to cancel orders, result in us being unable to manufacture or deliver products (or cause delays), harm our reputation or cause standard business processes to become inefficient or ineffective, which could adversely affect our results of operations, financial condition and cash flows.
If we are not able to continue the technological innovation and successful commercial introduction of new products, our customers may turn to other producers to meet their requirements, which may adversely affect our results of operations, financial condition and cash flows.
Our industry and the markets into which we sell our products experience periodic technological change and ongoing product improvements. In addition, our customers may introduce new generations of their own products, adopt new or different risk profiles, or require new technological and increased performance specifications that would require us to develop customized products. Our future growth and profitability will depend on our ability to maintain or enhance technological capabilities, develop and market products and applications that meet changing customer requirements and successfully anticipate or respond to technological changes in a cost effective and timely manner. Our inability to maintain a technological edge, innovate and improve our products could cause a decline in the demand and sales of our products and adversely affect our results of operations, financial condition and cash flows.
Ineffectiveness of our enterprise resource planning (“ERP”) system may adversely affect our business and results of operations or the effectiveness of internal controls over financial reporting.
During the last five years, we implemented a new ERP system at our specialty petrochemicals facility in order to better manage our business, and we continue to implement additional improvements to the system. ERP implementations are complex and time-consuming projects that involve substantial expenditures on system software and implementation activities over a significant period of time. If the ERP system does not operate as intended, it could adversely affect our financial reporting systems and our ability to produce financial reports, the effectiveness of internal controls over financial reporting (including our disclosure controls and procedures), and our business and results of operations.
Risks Related to Financing and Tax
Changes in tax laws or exposure to additional income tax liabilities could affect our future profitability.
Factors that could materially affect our future effective tax rates include but are not limited to: changes in tax laws or the regulatory environment; changes in accounting and tax standards or practices; changes in the composition of operating income by tax jurisdiction; and our operating results before taxes.
We are subject to federal and state income taxes in the United States. Significant judgment is required in determining our provision for income taxes. We believe our tax estimates are reasonable, the final determination of tax audits and any related litigation could be materially different to that which is reflected in our Consolidated Financial Statements. Should any tax authority take issue with our estimates, our results of operations, financial condition and cash flows could be adversely affected.
We are subject to examination by federal and state tax authorities. While we regularly assess the likelihood of favorable or unfavorable outcomes resulting from examinations by the IRS and other tax authorities to determine the adequacy of our provision for income taxes, there can be no assurance that the actual outcome resulting from these examinations will not materially adversely affect our financial condition and operating results.
The covenants in the instruments that govern our outstanding indebtedness may limit our operating and financial flexibility.
The covenants in the instruments that govern our outstanding indebtedness limit our ability to, among other things:
incur indebtedness and liens;
make loans and investments;
prepay, redeem or repurchase debt;
engage in acquisitions, consolidations,
asset dispositions, sale-leaseback transactions and affiliate transactions;
change our business;
amend some of our debt agreements; and
grant negative pledges to other creditors.
In addition, the ARC Agreement (as defined herein) also has financial covenants that require TOCCO to maintain a maximum Consolidated Leverage Ratio and minimum Consolidated Fixed Charge Coverage Ratio (each as defined in the ARC Agreement). See Part II, Item 7. Management'sManagement’s Discussion and Analysis of Financial Condition and Results of Operations-LiquidityOperations under the heading “Liquidity and Capital Resources-Credit Agreement.
Resources.”
A failure by us or our subsidiaries to comply with the covenants and restrictions contained in the agreements governing our indebtedness could result in an event of default under such indebtedness, which could adversely affect our ability to respond to changes in our business and manage our operations. Upon the occurrence of an event of default under any of the agreements
governing our indebtedness, the lenders could elect to declare all amounts outstanding to be due and payable and exercise other remedies as set forth in the agreements. Further, an event of default or acceleration of indebtedness under one instrument may constitute an event of default under another instrument. If any of our indebtedness were to be accelerated, there can be no assurance that our assets would be sufficient to repay this indebtedness in full, which could have a material adverse effect on our ability to continue to operate as a going concern.
Our substantial indebtedness could limit cash flow available for our operations and could adversely affect our ability to service debt or obtain additional financing if necessary.
As of December 31, 2018,2020, we had $18 millionnil in borrowings outstanding under our revolving credit facility (the "Revolving Facility"“Revolving Facility”) and $84.5$46.6 million in borrowings outstanding under our term loan facility (the "Term“Term Loan Facility" and, together with the Revolving Facility, the "Credit Facilities"“Credit Facilities”). Pursuant to the terms of the amended and restated credit agreement (as amended, to the date hereof, the "ARC Agreement"“ARC Agreement”) governing the Credit Facilities, we also have the option, at any time, to request an increase to the commitment under the Revolving Facility and/or the Term Loan Facility by an additional amount of up to $50.0 million in the aggregate, subject to lenders acceptance of the increased commitment and other conditions.
Although the agreements governing our existing indebtedness contain restrictions on the incurrence of additional indebtedness, these restrictions are subject to a number of important exceptions, and additional indebtedness that we may incur from time to time to finance projects or for other reasons in compliance with these restrictions could be substantial. If we incur significant additional indebtedness, the related risks that we face could increase.
For example, in May 2020, SHR and TC received loan proceeds in an aggregate principal amount of approximately $6.1 million under the new Payment Protection Program (“PPP Loans”), which may be partially or fully forgiven if we comply with the provisions of the Coronavirus Aid, Relief, and Economic Security Act of 2020 (“CARES Act”). However, since the enactment of the CARES Act, the Small Business Administration and the Treasury Department issued numerous rules and additional guidance to implement the PPP Loans under the CARES Act, application of which remains to be seen. As a result of this unclear regulatory environment, it is difficult to determine and predict with certainty eligibility and available benefits under the PPP Loans. We expect that our use of the proceeds of the PPP Loans is consistent with the intended purpose for the PPP Loans, such as maintaining the continuity of our workforce, including compensation and benefits. However, no assurance can be provided whether we will obtain forgiveness of the PPP Loans in whole or in part. If we are not successful in obtaining forgiveness of all or a portion of the PPP Loans, the unforgiven portion of such indebtedness could remain outstanding until the maturity which could reduce our liquidity. Additionally, if the SBA conducts an audit of our PPP Loans, there is no guarantee the result will be favorable in determining whether full or partial forgiveness is obtained.
Our current, or any future, indebtedness (including any unforgiven portion of the PPP Loans) could:
limit our flexibility in planning for, or reacting to, changes in the markets in which we compete;
place us at a competitive disadvantage relative to our competitors with less indebtedness;
limit our ability to reinvest in our business;
render us more vulnerable to general adverse economic, regulatory and industry conditions; and
require us to dedicate a substantial portion of our cash flow to service our indebtedness.
Our ability to meet our cash requirements, including our debt service obligations, is dependent upon our ability to maintain our operating performance, which will be subject to general economic and competitive conditions and to financial, business and other factors, many of which are beyond our control. We cannot provide assurance that our business will generate sufficient cash flow from operations to fund our cash requirements and debt service obligations.
Conditions in the global economy may adversely affect our results of operations, financial condition and cash flows.
The demand for our products have historically correlated closely with general economic growth rates. The occurrence of recessions or other periods of low or negative growth will typically have a direct adverse impact on our results of operations, financial condition and cash flows. Other factors that affect general economic conditions in the world or in a major region, such as changes in population growth rates or periods of civil unrest, also impact the demand for our products. Economic conditions that impair the functioning of financial markets and financial institutions also pose risks to us, including risks to the safety of our financial assets and to the ability of our partners and customers to fulfill their commitments to us.
In addition, the revenue and profitability of our operations have historically been subject to fluctuation, which makes future financial results less predictable. Our revenue, gross margin and profit vary among our products, customer groups and geographic markets. Overall gross margins and profitability in any given period are dependent partially on the product, customer and geographic mix reflected in that period's net revenue. In addition, newer geographic markets may be relatively less profitable due to investments associated with entering those markets and local pricing pressures. Market trends, competitive pressures, increased raw material or shipping costs, regulatory impacts and other factors may result in reductions in revenue or pressure on gross margins of certain segments in a given period which may necessitate adjustments to our operations.
To service our current, and any future, indebtedness, we will require a significant amount of cash, which may adversely affect our future results.
Our ability to generate cash depends on many factors beyond our control, and any failure to meet our debt service obligations
could harm our business, results of operations and financial condition. Our ability to make payments on and to refinance our indebtedness, and to fund working capital needs and planned capital expenditures, will depend on our ability to generate cash in the future. This, to a certain extent, is subject to general economic, financial, competitive, business, legislative, regulatory and other factors that are beyond our control.
If our business does not generate sufficient cash flow from operations or if future borrowings are not available to us in an amount sufficient to enable us to pay our indebtedness, or to fund our other liquidity needs, we may need to refinance all or a portion of our indebtedness (or otherwise seek amendment or relief from the terms of our indebtedness), on or before the maturity thereof, sell assets, reduce or delay capital investments or seek to raise additional capital, any of which could have a material adverse effect on our operations. We might not generate sufficient cash flow to repay indebtedness as currently anticipated. In addition, we may not be able to effect any of these actions, if necessary, on commercially reasonable terms or at all. Our ability to restructure or refinance our indebtedness, will depend on the condition of the capital markets and our financial condition at such time. Any refinancing of our indebtedness could be at higher interest rates and may require us to comply with more onerous covenants, which could further restrict our business operations. The terms of existing or future debt instruments may limit or prevent us from taking any of these actions. Our inability to generate sufficient cash flow to satisfy our debt service obligations, or to refinance or restructure our obligations on commercially reasonable terms or at all, would have a material adverse effect on our business, results of operations and financial conditions.
There are certain hazards and risks inherent in our operations that could adversely affect those operations and results of operations and financial condition.
As a manufacturer and distributor of diversified chemical products, our business is subject to operating risks inherent in chemical manufacturing, storage, handling and transportation. These risks include, but are not limited to, fires, explosions, severe weather and natural disasters, mechanical failure, unscheduled downtime, loss of raw materials or our products, transportation interruptions, remediation, chemical spills, terrorist acts or war, discharges or releases of toxic or hazardous substances or gases. These hazards can cause personal injury and loss of life, severe damage to, or destruction of, property and equipment and environmental contamination. In addition, our suppliers are also subject to similar risks that may adversely impact our production capabilities. A significant limitation on our ability to manufacture products due to disruption of manufacturing operations or related infrastructure could have a material adverse effect on our results of operations and financial condition.
While we adapt our manufacturing and distribution processes and controls to minimize the inherent risk of our operations, to promote workplace safety and to minimize the potential for human error, we cannot completely eliminate the risk of accidental contamination or injury from hazardous or regulated materials, including injury of our employees, individuals who handle our products or goods treated with our products, or others who claim to have been exposed to our products, nor can we completely eliminate the unanticipated interruption or suspension of operations at our facilities due to such events. We may be held liable for significant damages or fines in the event of contamination or injury, and such assessed damages or fines could have a material adverse effect on our results of operations and financial conditions. Our property, business interruption and casualty insurance may not fully insure us against all potential hazards incidental to our business.
Increases in the costs of our raw materials could have an adverse effect on our financial condition and results of operations if those costs cannot be passed onto our customers.
Our results of operations are directly affected by the cost of raw materials. Since the cost of these primary raw materials comprise a significant amount of our total cost of goods sold, the selling prices for our products and therefore our total revenue is impacted by movements in these raw material costs, as well as the cost of other inputs. In the past we have experienced erratic and significant changes in the costs of these raw materials, the cost of which has generally correlated with changes in energy prices, supply and demand factors, and prices for natural gas and crude oil. In addition, product mix can have an impact on our overall unit selling prices, since we provide an extensive product offering and therefore experience a wide range of unit selling prices. Because of the significant portion of our cost of goods sold represented by these raw materials, our gross profit margins could be adversely affected by changes in the cost of these raw materials if we are unable to pass the increases on to our customers.
Due to volatile raw material prices, there can be no assurance that we can continue to recover raw material costs or retain customers in the future. For example, our logistics costs have increased substantially within the past three years, narrowing our profit margins. This may force us to increase our pricing, which could cause customers to consider competitors' products, some of which may be available at a lower cost. Significant loss of customers could result in a material adverse effect on our results of operations, financial condition and cash flows.
If the availability of our raw materials is limited, we may be unable to produce some of our products in quantities sufficient to meet customer demand or on favorable economic terms, which could have an adverse effect on our results of operations, financial condition and cash flows.
We use polyethylene waxes in our specialty synthetic wax segment and use additional non-primary raw materials in the production of our products in the specialty petrochemical segment and synthetic wax segment. Suppliers may not be able to meet our raw material requirements and we may not be able to obtain substitute supplies from alternative suppliers in sufficient quantities, on economic terms, or in a timely manner. A lack of timely availability of our raw materials in the quantities we require to produce our products could result in our inability to meet customer demand and could have a material adverse effect on our results of operations, financial condition and cash flows.
Certain activist stockholders actions could cause us to incur expense and hinder execution of our strategy.
While we seek to actively engage with our stockholders and consider their views on business and strategy, we could be subject to actions or proposals from our stockholders that do not align with our business strategies or the interests of our other stockholders. Responding to these stockholders could be costly and time-consuming, disrupt our business and operations and divert the attention of our management. Furthermore, uncertainties associated with such activities could negatively impact our ability to execute our strategic plan, retain customers and skilled employees and affect long-term growth. In addition, such activities may cause our stock price to fluctuate based on temporary or speculative market perceptions that do not necessarily reflect our business operations.
We expect to continue to incur capital expenditures and operating costs as a result of our compliance with existing and future environmental laws and regulations.
Our industry is subject to extensive laws and regulations related to the protection of the environment. These laws and regulations continue to increase in both number and complexity and affect our operations with respect to, among other things: the discharge of pollutants into the environment; emissions into the atmosphere (including greenhouse gas emissions); and restrictions, liabilities and obligations in connection with storage, transportation, treatment and disposal of hazardous substances and waste. We are also subject to laws and regulations that require us to operate and maintain our facilities to the satisfaction of applicable regulatory authorities. In addition, failure to comply with these laws or regulations, or failure to obtain required permits from applicable regulatory authorities, may expose us to fines, penalties or interruptions in operations. To the extent these capital expenditures or operating costs are not ultimately reflected in the prices of our products and services, or that we are subject to fines, penalties or other interruptions in our operations, our business, results of operations, financial position and cash flows may be adversely affected.
If we are unable to access third-party transportation for our raw materials and finished products, we may not be able to fulfill our obligations to our customers in a timely manner, which could have a material adverse effect on our results of operations, financial condition and cash flows.
We rely upon transportation provided by third parties (including common carriers, rail companies and trans-ocean cargo companies) to receive raw materials used in the production of our products and to deliver finished products to our customers. While we attempt to offset the risks associated with third-party transportation issues, including by managing our supplies of raw materials, such mitigation efforts may not be successful. If we are unable to access third-party transportation at economically attractive rates, or at all, or if there is any other significant disruption in the availability of third-party transportation, we may not be able to obtain sufficient quantities of raw materials (on favorable terms, or at all) to match the pace of production and/or we may not be able to fulfill our obligations to our customers in a timely manner, which could have a material adverse effect on our results of operations, financial condition and cash flows.
If we are not able to continue the technological innovation and successful commercial introduction of new products, our customers may turn to other producers to meet their requirements, which may adversely affect our results of operations, financial position and cash flows.
Our industry and the markets into which we sell our products experience periodic technological change and ongoing product improvements. In addition, our customers may introduce new generations of their own products, adopt new or different risk profiles, or require new technological and increased performance specifications that would require us to develop customized products. Our future growth and profitability will depend on our ability to maintain or enhance technological capabilities, develop and market products and applications that meet changing customer requirements and successfully anticipate or respond to technological changes in a cost effective and timely manner. Our inability to maintain a technological edge, innovate and improve our products could cause a decline in the demand and sales of our products and adversely affect our results of operations, financial position and cash flows.
We are subject to numerous regulations that could require us to modify our current business practices and incur increased costs.
We are subject to numerous regulations, including customs and international trade laws, export control, data privacy, antitrust laws and zoning and occupancy laws that regulate manufacturers generally and/or govern the importation, promotion and sale of our products, the operation of our facilities and our relationship with our customers, suppliers and competitors. In addition, we face risk associated with trade protection laws, policies and measures and other regulatory requirements affecting trade and investment, including loss or modification of exemptions for taxes and tariffs, imposition of new tariffs and duties and import and export licensing requirements. If these laws or regulations were to change or were violated by our management, employees, suppliers, buying agents or trading companies, the costs of certain goods could increase, or we could experience delays in shipments of our goods, be subject to fines or penalties, or suffer reputational harm, which could reduce demand for our products and hurt our business and negatively impact our results of operations. In addition, changes in federal and state minimum wage laws and other laws relating to employee benefits could cause us to incur additional wage and benefits costs, which could negatively impact our profitability.
Legal requirements are frequently changed and subject to interpretation, and we are unable to predict the ultimate cost of compliance with these requirements or their effects on our operations. We may be required to make significant expenditures or modify our business practices to comply with existing or future laws and regulations, which may increase our costs and materially limit our ability to operate our business.
Failure to successfully consummate extraordinary transactions, including the integration of other businesses, assets, products or technologies, or realize the financial and strategic goals that were contemplated at the time of any such transaction may adversely affect our future business, results of operations and financial condition.
As part of our business strategy, we from time to time explore possible investments, acquisitions, strategic alliances, joint ventures, divestitures and outsourcing transactions (collectively, "extraordinary transactions") in order to further our business objectives. To pursue this strategy successfully, we must identify suitable candidates for, and successfully complete, extraordinary transactions, some of which may be large and complex, and manage post-closing issues such as the integration of acquired businesses or employees. The expense and effort incurred in exploring and consummating extraordinary transactions, the time it takes to integrate an acquisition or our failure to integrate businesses successfully, could result in additional and/or unexpected expenses and losses. We also may not be successful in negotiating the terms of any potential extraordinary transactions, conducting thorough due diligence, financing an extraordinary transaction or effectively integrating the acquired business, product or technology into our existing business and operations. Our due diligence may fail to identify all of the problems, liabilities or other shortcomings or challenges of an acquired business, product or technology. Moreover, we may incur significant expenses whether or not a contemplated extraordinary transaction is ultimately consummated.
Additionally, in connection with any extraordinary transaction we consummate, we many not fully realize all of the anticipated synergies and other benefits we expect to achieve (on our expected timeframe, or at all), and we may incur unanticipated expenses, write-downs, impairment charges or unforeseen liabilities that could negatively affect our business, financial condition and results of operations, disrupt relationships with current and new employees, customers and vendors, incur significant debt or have to delay or not proceed with announced transactions. Further, managing extraordinary transactions requires varying levels of management and employee resources, which may divert our attention from other business operations.
The adoption of climate change legislation or regulation could result in increased operating costs and reduced demand for our products.
The nature of our operations could make us subject to legislation or regulations affecting the emission of greenhouse gases. The U.S. Environmental Protection Agency has promulgated (and may in the future promulgate) regulations applicable to projects involving greenhouse gas emissions above a certain threshold, and the U.S. and certain states within the U.S. have enacted, or are considering, limitations on greenhouse gas emissions. Jurisdictions outside the U.S. are also addressing greenhouse gases by legislation or regulation. In addition, efforts have been made and continue to be made at the international level toward the adoption of international treaties or protocols that would address global greenhouse gas emissions. These limitations may include the adoption of cap and trade regimes, carbon taxes, restrictive permitting, increased efficiency standards and incentives or mandates for renewable energy. Any such requirements could make our products more expensive, lengthen project implementation times and reduce demand for hydrocarbons, as well as shift hydrocarbon demand toward relatively lower-carbon sources. Such legislation, regulation, treaties or protocols may also increase our compliance costs, such as for monitoring or sequestering emissions.
Adverse results of legal proceedings could materially adversely affect us.
We are subject to and may in the future be subject to a variety of legal proceedings and claims that arise out of the ordinary conduct of our business, including legal proceedings brought in non-U.S. jurisdictions. Results of legal proceedings cannot be predicted with certainty. Irrespective of its merits, litigation may be both lengthy and disruptive to our operations and may cause significant expenditure and diversion of management attention. We may be faced with significant monetary damages or injunctive relief against us that could have an adverse impact on our business and results of operations should we fail to prevail in certain matters.
Cost pressures could negatively impact AMAK's operating margins and expansion plans.
Cost pressures may continue to occur across the resources industry. As the prices for AMAK's products are determined by the global commodity markets in which it operates, AMAK does not generally have the ability to offset these cost pressures through corresponding price increases, which can adversely affect its operating margins or require changes in operations, including, but not limited to, temporary planned shutdowns. Notwithstanding AMAK's efforts to reduce costs, and a number of key cost inputs being commodity price-linked, the inability to reduce costs and a timing lag may adversely impact AMAK's operating margins for an extended period.
An impairment of goodwill could negatively impact our results of operations.
At least annually, we assess goodwill for impairment. If an initial qualitative assessment identifies that it is more likely than not that the carrying value of a reporting unit exceeds its estimated fair value, additional quantitative testing is performed. We may also elect to skip the qualitative testing and proceed directly to quantitative testing. If the quantitative testing indicates that goodwill is impaired, the carrying value of goodwill is written down to fair value with a charge against earnings. Since we utilize a discounted cash flow methodology to calculate the fair value of our operating units, continued weak demand for a specific product line or business could result in an impairment charge. Accordingly, any determination requiring the write-off of a significant portion of goodwill could negatively impact our results of operations.
Our variable rate indebtedness subjects us to interest rate risk, which could cause our debt service obligations to increase significantly.
Borrowings under the Credit Facilities are, and additional borrowings in the future may be, at variable rates of interest that expose us to interest rate risk. If interest rates increase, our debt service obligations on the variable rate indebtedness will increase even though the amount borrowed will remain the same, and our net income and cash flows, including cash available for servicing our indebtedness, will correspondingly decrease. We may in the future enter into, interest rate swaps for our variable rate debt whereby we exchange floating for fixed rate interest payments in order to reduce exposure to interest rate volatility. However, any interest rate swaps into which we enter may not fully mitigate our interest rate risk.
We are exposed to local business risks in different countries, which could have a material adverse effect on our financial condition and results of operations.
Although we do not have production operations and assets outside of the U.S., we do have a global portfolio of customers and thus we are subject to a variety of international market risks including, but not limited to:
ongoing instability or changes in a country's or region's economic or political conditions, including inflation, recession, interest rate fluctuations, civil unrest and actual or anticipated military or political conflicts (including the potential impact of continued hostilities and conflict in Yemen on the operations of AMAK);
longer accounts receivable cycles and financial instability or credit risk among customers and distributors;
trade regulations and procedures and actions affecting production, pricing and marketing of products, including domestic and foreign customs and tariffs or other trade barriers;
regulations favoring local contractors or requiring foreign contractors to employ citizens of, or purchase supplies from, a local jurisdiction;
local labor conditions and regulations and the geographical dispersion of the workforce;
changes in the regulatory or legal environment;
differing technology standards or customer requirements;
import, export or other business licensing requirements or requirements relating to making foreign direct investments, which could affect our ability to obtain favorable terms for labor and raw materials or lead to penalties or restrictions;
data privacy regulations;
risk of non-compliance with the U.S. Foreign Corrupt Practices Act or similar anti-bribery legislation in other countries by agents or other third-party representatives;
risk of nationalization of private enterprises by foreign governments (including the risk that AMAK's mining and exploration leases may be terminated by the Saudi Ministry of Petroleum and Minerals);
foreign currency exchange restrictions and fluctuations;
difficulties associated with repatriating cash generated or held abroad in a tax-efficient manner and changes in tax laws; and
fluctuations in freight costs and disruptions in the transportation and shipping infrastructure at important geographic points of exit and entry for our products and shipments.
Such economic and political uncertainties may materially and adversely affect our business, financial condition or results of operations in ways that cannot be predicted at this time. Although it is impossible to predict the occurrences or consequences of any such events, they could result in a decrease in demand for our products, make it difficult or impossible to deliver products to our customers or to receive raw materials from our suppliers and create delays and inefficiencies in our supply chain. We are also predominantly uninsured for losses and interruptions caused by terrorist acts, conflicts and wars.
We may have additional tax liabilities, which may adversely affect our financial position.
We are subject to income taxes and state taxes in the U.S. Significant judgment is required in determining our provision for income taxes. In the ordinary course of our business, there are many transactions and calculations where the ultimate tax determination is uncertain. Although we believe our tax estimates are reasonable, the final determination of tax audits and any related litigation could be materially different to that which is reflected in our consolidated financial statements. Should any tax authority take issue with our estimates, our results of operations, financial position and cash flows could be adversely affected.
The U.S. Tax Cuts and Jobs Act ("TCJA") was enacted on December 22, 2017, and introduces significant changes to U.S. income tax law. Accounting Standards Codification 740, Accounting for Income Taxes, requires companies to recognize the effects of tax law changes in the period of enactment. Effective in 2018, the TCJA made a number changes, such as reducing the U.S. statutory tax rate from 35% to 21%, creating new taxes on certain foreign sourced earnings and certain related-party payments, which are referred to as the global intangible low taxed income tax and the base erosion tax, respectively, establishing a dividends received deduction for dividends paid by foreign subsidiaries to the U.S., the elimination or limitation of certain deductions, and imposing a mandatory tax on previously unrepatriated earnings accumulated offshore. Due to the timing of the new tax law provided in the TCJA and the substantial changes it brings, the Staff of the SEC issued Staff Accounting Bulletin No. 118, which provides registrants with a measurement period to report the impact of the new US tax law. As a result, the recorded and estimated impacts of the TCJA may change in future periods, which may adversely affect our estimates, our results of operations, financial position and cash flows.
AMAK is also subject to various taxes in Saudi Arabia. While AMAK currently benefits from certain tax credits that reduce its overall tax liability, there can be no assurance that relevant tax authorities will continue to maintain such credits. In addition, there can be no assurances that future changes in tax law in Saudi Arabia will not result in increased tax liability to AMAK. A material increase in tax liability could have an adverse effect on AMAK's results of operations and financial condition, which may in turn have an adverse effect on our investment in AMAK.
We from time to time are subject to contingent liabilities. If any contingent liabilities become actual liabilities, our financial condition may be adversely affected.
We are subject to various contingent liabilities that may affect our liquidity and our ability to meet our obligations, including our limited corporate guarantee to SIDF in connection with AMAK's Loan to fund mining operations. To the extent any of our current or future contingent liabilities become actual liabilities, it may have an adverse effect on our financial condition.
We may be unable to recover our investment in AMAK, which could adversely affect our results of operations and financial condition.
We will only recover our investment in AMAK through the receipt of distributions or future share repurchases from AMAK or the sale of part or all of our interest in AMAK. If AMAK does not continue to be profitable, our ability to recover our investment will be adversely affected. Moreover, if AMAK continues to be profitable, there can be no assurance that the board of directors of AMAK will determine that it is in the best interests of AMAK and its shareholders to make distributions to its shareholders or to initiate additional share repurchases. In addition, we understand that AMAK is required to sell a portion of its equity to the public once AMAK has been profitable for two years. While the proceeds of such a sale might allow us to recover our investment in AMAK, there is no assurance that the market conditions for any such public sale will be favorable enough to allow us to recover our investment or that some or all of our shares in AMAK will be include in any such sale. To the extent we are unable to recover our investments in AMAK, our results of operations and financial condition may be adversely affected.
AMAK may have fewer mineral reserves than its estimates indicate.
Fluctuations in the price of commodities, variation in production costs or different recovery rates could result in AMAK's estimated reserves being revised in the future. If such a revision were to indicate a substantial reduction in proven or probable reserves at one or more of AMAK's projects, it could adversely affect our investment in AMAK.
Domestic or international terrorist attacks may disrupt our operations or otherwise have an adverse impact on our business.
It is possible that further acts of terrorism may be directed against the U.S. domestically or abroad, and such acts of terrorism could be directed against our investment in those locations. Moreover, chemical related assets, and U.S. corporations such as ours, may be at a greater risk of future terrorist attacks than other possible targets. The resulting damage from such an event could include loss of life, property damage or site closure. Any, or a combination, of these factors could adversely impact our results of operations, financial position and cash flows.
Increased information systems security threats and more sophisticated and targeted computer crime could pose a risk to our systems, networks, products and services.
Increased information systems security threats and more sophisticated, targeted computer crime pose a risk to the security of our systems and networks and the confidentiality, availability, and integrity of our data, operations, and communications. While we attempt to mitigate these risks by employing a number of measures, including security measures, employee training, comprehensive monitoring of our networks and systems, and maintenance of backup and protective systems, if these measures prove inadequate, we could be adversely affected by, among other things, loss or damage of intellectual property, proprietary and confidential information, and communications or customer data, having our business operations interrupted and increased costs to prevent, respond to, or mitigate these cyber security threats. Any significant disruption or slowdown of our systems could cause customers to cancel orders or standard business processes to become inefficient or ineffective, which could adversely affect our results of operations, financial position and cash flows.
Implementation of changes to our enterprise resource planning ("ERP") system may adversely affect our business and results of operations or the effectiveness of internal controls over financial reporting.
During 2017, we implemented a new ERP system at our specialty petrochemical facility in order to better manage our business, and we continue to implement additional improvements to the system. ERP implementations are complex and time-consuming projects that involve substantial expenditures on system software and implementation activities over a significant period of time. If we do not effectively implement changes to ERP system, or if the system does not operate as intended, it could adversely affect our financial reporting systems and our ability to produce financial reports, the effectiveness of internal controls over financial reporting (including our disclosure controls and procedures), and our business and results of operations.
ItemITEM 1B. Unresolved Staff Comments.
None.
ItemITEM 2. Properties.
United States Specialty PetrochemicalPetrochemicals Facility
SHR owns and operates a specialty petrochemicalpetrochemicals facility nearlocated in Silsbee, Texas which is approximately 30 miles north of Beaumont Texas, and 90 miles east of Houston. The base SHR facility consists of eightfive operating units which, while interconnected, make distinct products through differentdiffering processes: (i) a Penhex Unit; (ii) a Reformer;Reformer Unit; (iii) a Cyclo-pentane Unit; (iv) an Advanced Reformer unit; and (v) an Aromatics Hydrogenation Unit; (vi)Isomerization Unit. In addition to the base plant, SHR operates three proprietary chemical production facilities for toll processing customers. The Reformer Unit, the Advanced Reformer unit, and the Cyclo-Pentane Unit further process streams produced by the Penhex Unit.
Our present total capacity at our Silsbee facility is 13,000 barrels per day of fresh feed; however, our air permits limit us to a White Oil Fractionation Unit; (vii)maximum processing rate of 11,000 barrels per day. During 2018, we constructed a Hydrocarbon Processing Demonstration Unit, and (viii) a P-Xylene Unit. All of these units are currently in operation. Our new 4,000 barrelbarrels per day Advanced Reformer unit successfully re-started in December 2018. This unit willto increase our capability to upgrade by-products produced from the Penhex Unit and to provide security of hydrogen supply for Penhexto the plant.
In support of the Specialty Petrochemicals segment, we own approximately 100 storage tanks with total capacity of approximately 294,000 barrels, and custom processing projects as well as increase127 acres of land at the valueplant site, 107 acres of our by-products.which are developed. We also own a truck and railroad loading terminal consisting of storage tanks, nine rail spurs, and truck and tank car loading facilities on approximately 63 acres of which 33 acres are developed.
GSPL owns and operates threetwo 8-inch diameter pipelines and five 4-inch diameter pipelines, aggregating approximately 70 miles in length connecting SHR'sSHR’s facility to (1) a natural gas line, (2) SHR'sSHR’s truck and rail loading terminal and (3) a major petroleum products pipeline system owned by an unaffiliated third party. All pipelines are operated within Texas Railroad Commission and DOT regulations for maintenance and integrity.
United States Specialty Polyethylene WaxWaxes Facility
TC owns and operates a specialty synthetic waxwaxes facility from its 27.5 acre plant site located in Pasadena, Texas. After the acquisition of the adjacent BASF facility ("B Plant") in 2016 theThe plant contains several stainless steel reactors ranging in size from 3,300 to 16,000 gallons with overhead condensing systems, two 4,000 gallon glass line reactors, five Sandvik forming belts with pastillating capabilities, five high vacuum wiped film evaporators varying in size from 12 to 20 m2, steel batch column with 10,000 gallon still pot and 20 theoretical stages of structured packing. This plant has the ability to crystallize and recover solids from the crystallization process. There are also three fully equipped, laboratories onsite.on-site laboratories. With a base product offering of polyethylene waxes, TC is well suited to manage high molecular weight materials that must be managed in the molten state. TC offers pastillating for waxes, polymers and resins, flaking capabilities, as well as solids packaging services.
In 2017, TC expanded its processing capabilities with the start-up of the hydrogenation/distillation unit. This $25approximately $29 million investment provides TC's customersTC with state-of-the-art distillation and high-pressure hydrogenation capabilities. During 2018,2019, TC experiencedcontinued to experience issues with the reliable operation of this unit in accordance with its design specifications. Efforts are underway to implementToward the end of 2019 we completed a number of design corrections and fixesother modifications including changes to operating procedures and operator training in order to improve the unit's capability andunit’s operational reliability. TC offers pastillating for waxes, polymers and resins, flaking capabilities, as well as solids packaging services.
Investment in AMAK
As of December 31, 2018, we owned a 33% interest in AMAK.
Prior to December 2008, we held a thirty year mining lease (which commenced on May 22, 1993) covering an approximate 44 square kilometer area in Najran Province in southwestern Saudi Arabia. The lease carried an option to renew or extend the termWhile operational reliability of the lease for additional periodsunit has improved, its performance did not to exceed twenty years. The lease and other related assets located in Saudi Arabia were contributed to AMAK in December 2008. The above-ground ore processing facility became fully operational during the second half of 2012. Late in the fourth quarter of 2015 AMAK temporarily closed the operation to preserve the assets in the ground while initiating steps to improve efficiencies and optimize operations. The facility resumed operation in the fourth quarter of 2016 and operating rates, metal recoveries and concentrate quality continued to improve steadily throughout 2017 and 2018.meet design specifications.
AMAK shipped approximately 58,000, 28,000, and 51,000 metric tons of copper and zinc concentrate to outside smelters during 2018, 2017 and 2016, respectively. In 2014 AMAK initiated operation of its precious metal recovery circuit at the mill and produced gold and silver doré intermittently through 2014 and 2015. The precious metals circuit was recommissioned in fourth quarter of 2017 and produced commercial quantities of gold and silver bearing doré in 2018.
The facility includes an underground mine, ore-treatment plant and related infrastructures. The ore-treatment plant is comprised of primary crushing, ore storage, SAG milling and pebble crushing, secondary ball milling, pre-flotation, copper and zinc flotation, concentrate thickening, tailings filtration, cyanide leaching, reagent handling, tailings dam and utilities. Related infrastructure includes a 300 men capacity camp for single status accommodation for expatriates and Saudi employees, an on-site medical facility, a service building for 300 employees, on-site diesel generation of 10 megawatts, potable water supply, sewage treatment plant and an assay laboratory. The facilities at the Port of Jazan are comprised of unloading facilities, concentrate storage and reclamation and ship loading facilities.
Metal price assumptions follow SEC guidance not to exceed a three year trailing average. The following chart illustrates the change in metal prices from the previous three year average to current levels:
|
| | | | | | | | | | |
| | Average Price For 2016-2018 |
| | Spot Price as of 12/31/18 |
| | Percentage Increase (Decrease) |
|
| Gold per ounce | $ | 1,258.20 |
| | $ | 1,279.00 |
| | (1.65 | )% |
| Silver per ounce | $ | 16.62 |
| | $ | 15.47 |
| | 6.95 | % |
| Copper per pound | $ | 2.93 |
| | $ | 2.98 |
| | (5.78 | )% |
| Zinc per pound | $ | 1.32 |
| | $ | 1.25 |
| | 4.82 | % |
Three mineralized zones, the Saadah, Al Houra and Moyeath, were outlined by initial diamond drilling. Based on the original 1994 WGM feasibility study as updated in 1996, 2005 and 2009 the following tables set forth a summary of the diluted recoverable, proven and probable mineralized materials of AMAK in the Al Masane area along with the estimated average grades of these mineralized materials as adjusted to reflect production that began in July 2012:
|
| | | | | | | | | | | | | | |
| Zone | Proven Reserves (Mtonnes) |
| | Copper (%) |
| | Zinc (%) |
| | Gold (g/t) |
| | Silver (g/t) |
|
| Saadah | 0.45 |
| | 1.5 |
| | 3.7 |
| | 0.8 |
| | 21.0 |
|
| Al Houra | 0.03 |
| | 0.8 |
| | 3.8 |
| | 0.7 |
| | 21.0 |
|
| Moyeath | — |
| | — |
| | — |
| | — |
| | — |
|
| Total | 0.48 |
| | 1.4 |
| | 3.7 |
| | 0.8 |
| | 21.0 |
|
| | | | | | | | | | |
| Zone | Probable Reserves (Mtonnes) |
| | Copper (%) |
| | Zinc (%) |
| | Gold (g/t) |
| | Silver (g/t) |
|
| Saadah | 5.19 |
| | 1.2 |
| | 3.4 |
| | 0.8 |
| | 23.0 |
|
| Al Houra | 1.90 |
| | 0.9 |
| | 3.8 |
| | 1.2 |
| | 39.0 |
|
| Moyeath | 0.70 |
| | 0.8 |
| | 7.2 |
| | 1.0 |
| | 55.0 |
|
| Total | 7.79 |
| | 1.1 |
| | 3.9 |
| | 0.9 |
| | 29.0 |
|
| | | | | | | | | | |
| Total proven and probable reserves | 8.27 |
| | | | | | | | |
| Less production through December 31, 2018 | 3.37 |
| | | | | | | | |
| Remaining proven and probable reserves | 4.90 |
| | | | | | | | |
For purposes of calculating proven and probable mineralized materials, a dilution of 5% at zero grade on the Saadah zone and 15% at zero grade on the Al Houra and Moyeath zones was assumed. A mining recovery of 80% was used for the Saadah zone and 88% for the Al Houra and Moyeath zones. Mining dilution is the amount of wall-rock adjacent to the ore body that is included in the ore extraction process. Base case cutoffs used were 5.0% zinc equivalent. Ore reserves were estimated using metal prices of USD $0.85 per pound for zinc, $2.50 per pound for copper, $800 per ounce for gold and $12.0 per ounce for silver.
Our rights to obtain additional mining licenses to other adjoining areas were also transferred to AMAK in December 2008 as part of our initial capital contribution. AMAK received formal approval in November 2015 of an additional 151 km2 or 37,313 acres of territory relatively close to the current mine. The new territory comprises the Guyan and Qatan exploration licenses covering 151 km2 and within the Guyan exploration license, a 10 km2 or 2,471 acre mining lease which has potential for significant gold recovery. Some exploration holes were drilled in both Guyan and Qatan up to 40 years ago, but no reserves were attributed to these areas. Exploration activities were restarted in both of these areas during 2016, and SRK Consulting prepared a JORC compliant report in May 2017 showing approximately 99,000 ounces at the Jebel Guyan zone excluding other nearby prospects. The diamond drilling program continues at both the Jebel Guyan and Al Aqiq zones, testing depth and extension of mineralization with confirmed mineralization intersected at an additional 50 meters depth the Guyan zone. A JORC compliant reserve update is currently being studied by Mining One (Australia).
Historic three-year average commodity prices are shown in the following table:
|
| | | | | | | | | | | |
| | Average Price in USD |
| | 2014-2016 |
| | 2015-2017 |
| | 2016-2018 |
|
| Gold per ounce | $ | 1,224.96 |
| | $ | 1,222.06 |
| | $ | 1,258.20 |
|
| Silver per ounce | $ | 17.29 |
| | $ | 16.62 |
| | $ | 16.62 |
|
| Copper per pound | $ | 2.60 |
| | $ | 2.50 |
| | $ | 2.93 |
|
| Zinc per pound | $ | 0.94 |
| | $ | 1.05 |
| | $ | 1.32 |
|
Proven mineralized materials are those mineral deposits for which quantity is computed from dimensions revealed in outcrops, trenches, workings or drill holes, and grade is computed from results of detailed sampling. For ore deposits to be proven, the sites for inspection, sampling and measurement must be spaced so closely and the geologic character must be so well defined that the size, shape, depth and mineral content of reserves are well established. Probable mineralized materials are those for which quantity and grade are computed from information similar to that used for proven mineralized materials, but the sites for inspection, sampling
and measurement are farther apart or are otherwise less adequately spaced. However, the degree of assurance, although lower than that for proven mineralized materials, must be high enough to assume continuity between points of observation.
The metallurgical studies conducted on the ore samples taken from the zones indicated that 84.7% of the copper and 78.0% of the zinc could be recovered in copper and zinc concentrates. Overall, gold and silver recovery from the ore was estimated to be 77.3% and 81.3%, respectively, partly into copper concentrate and partly as bullion through cyanide processing of zinc concentrates and mine tailings. Further studies recommended by consultants may improve those recoveries and thus the potential profitability of the project; however, there can be no assurances of this effect.
AMAK contracted with SRK Consulting for a reserves update in 2017 and SRK reported JORC compliant reserves in August 2017. The SRK reserves estimate has since been updated by AMAK resource geologist (Qualified Person - QP as defined in JORC Code) in January 2018 and February 2019 with additional drill-hole data (85 holes and 8,970 meters in 2017 and 91 holes and 9,134 meters in 2018) and more comprehensive geological information from actual mining fronts. AMAK's JORC Compliant Reserves (January 2019) are given below:
|
| | | | | | | | | | | | | | |
Ore Reserves (Probable+Proven) Zone | (Tonnes) (Mtonnes) |
| | Copper (%) |
| | Zinc (%) |
| | Gold (g/t) |
| | Silver (g/t) |
|
| Saadah | 2.8 |
| | 0.98 |
| | 3.39 |
| | 0.74 |
| | 25.43 |
|
| Al Houra | 2.8 |
| | 0.83 |
| | 3.34 |
| | 0.90 |
| | 26.40 |
|
| Moyeath | 0.80 |
| | 0.77 |
| | 6.53 |
| | 0.61 |
| | 41.61 |
|
| Total | 6.4 |
| | 0.89 |
| | 3.78 |
| | 0.79 |
| | 27.87 |
|
Ore reserves were estimated using metal prices of USD $1.11 per pound for zinc, $2.50 per pound for copper, $1,200 per ounce for gold and $15.00 per ounce for silver.
Mineable (recoverable) reserves include:
20% sidewall dilution in the stope production
0.07Mt surface stockpiles
Mineable (recoverable) reserves exclude:
Mining of any mineralization less than mineable width of 1.0m
Sill Pillar (which was previously included). Technically, it is not mineable with current underground infrastructure and backfilling practices, so this pillar (0.6Mt) excluded from Reserves
All of the Moyeath orebody since it is categorized as Inferred
Any low grade (CuEq<1.01%) material (0.4Mt) which has to mined out and stored separately
The updated reserves reflect a 1.5M tonnes increase to the MRE of January 2018, due to additional drilling at Moyeath and Saadah orebodies. The depth of three orebodies are not tested yet and underground drilling will continue in 2019 and coming years to extend the orebody at depth.
Access and all mine services already exist at the Moyeath orebody and AMAK recently started ore mining in the last quarter of 2018. In 2019, AMAK estimates that approximately 50,000 tonnes will be mined out from Moyeath orebody. A drilling program of 8,000 meters (8 months) has been completed at Moyeath, which upgraded 0.8M tonnes of inferred class to indicated class, which eventually mine designed and included in the life of mine schedule. AMAK believes that the Moyeath orebody is high grade for zinc and average grade as a copper. AMAK believes that Moyeath is the most attractive opportunity for an extended life and higher zinc metal recovery through the life of mine.
The metallurgical recoveries are assumed as 83% for copper and 75% for zinc after 2019. Actual metal recoveries in 2018 increased throughout the year so that these recovery assumptions are realistic and in line with actual performance of the process plant.
The following table sets forth tonnage mined historically with average assay values per year:
|
| | | | | | | | |
| Year | Mine Head Grade | | Mill Throughput |
| | %Cu |
| | %Zn |
| | dmt |
|
| 2011 | 1.26 |
| | 3.02 |
| | 9,460 |
|
| 2012 | 1.18 |
| | 3.39 |
| | 399,892 |
|
| 2013 | 1.48 |
| | 3.19 |
| | 699,316 |
|
| 2014 | 1.22 |
| | 3.15 |
| | 670,812 |
|
| 2015 | 1.11 |
| | 3.69 |
| | 591,419 |
|
| 2016 | — |
| | — |
| | — |
|
| 2017 | 1.10 |
| | 3.22 |
| | 385,495 |
|
| 2018 | 1.10 |
| | 3.27 |
| | 699,885 |
|
The following table sets forth tonnage milled with average assay values and metallurgical recoveries per year:
|
| | | | | | | | | | | | | | | | | | | | | | | |
| Year | Copper Concentrate | | Zinc Concentrate |
| | dmt |
| | %Cu |
| | %Zn |
| | Recovery |
| | dmt |
| | %Zn |
| | %Cu |
| | Recovery |
|
| 2011 | 443 |
| | 16.51 |
| | 7.51 |
| | 61.64 |
| | 377 |
| | 40.69 |
| | 3.56 |
| | 53.64 |
|
| 2012 | 15,944 |
| | 23.91 |
| | 5.46 |
| | 80.62 |
| | 20,738 |
| | 50.03 |
| | 1.16 |
| | 76.54 |
|
| 2013 | 35,140 |
| | 25.20 |
| | 4.73 |
| | 85.68 |
| | 33,460 |
| | 49.82 |
| | 0.83 |
| | 74.62 |
|
| 2014 | 28,476 |
| | 24.20 |
| | 4.31 |
| | 84.24 |
| | 31,600 |
| | 51.02 |
| | 0.70 |
| | 76.26 |
|
| 2015 | 24,218 |
| | 22.70 |
| | 5.13 |
| | 84.12 |
| | 35,447 |
| | 48.46 |
| | 0.62 |
| | 78.63 |
|
| 2016 | — |
| | — |
| | — |
| | — |
| | — |
| | — |
| | — |
| | — |
|
| 2017 | 15,492 |
| | 19.10 |
| | 6.20 |
| | 72.80 |
| | 16,544 |
| | 47.20 |
| | 1.10 |
| | 63.40 |
|
| 2018 | 27,508 |
| | 22.59 |
| | 5.25 |
| | 80.78 |
| | 33,735 |
| | 49.36 |
| | 1.27 |
| | 72.73 |
|
The following table sets forth tonnage sold with concentrate assay values and value received per year:
|
| | | | | | | | | | | | | | | | | | | |
| Year | Copper Concentrate | | Zinc Concentrate |
| |
dmt |
| |
%Cu |
| | Value received (in USD millions) |
| |
dmt |
| |
%Zn |
| | Value received (in USD millions) |
|
| 2011 | — |
| | — |
| | — |
| | — |
| | — |
| | — |
|
| 2012 | 5,488 |
| | 23.51 |
| | $ | 6.9 |
| | 15,193 |
| | 47.53 |
| | $ | 8.7 |
|
| 2013 | 35,908 |
| | 23.86 |
| | $ | 80.8 |
| | 38,430 |
| | 47.79 |
| | $ | 24.2 |
|
| 2014 | 25,691 |
| | 24.20 |
| | $ | 42.3 |
| | 29,326 |
| | 50.52 |
| | $ | 21.0 |
|
| 2015 | 26,378 |
| | 23.50 |
| | $ | 34.6 |
| | 24,547 |
| | 49.68 |
| | $ | 16.0 |
|
| 2016 | — |
| | — |
| | — |
| | 15,845 |
| | 48.28 |
| | $ | 9.5 |
|
| 2017 | 13,940 |
| | 19.00 |
| | $ | 17.3 |
| | 14,080 |
| | 47.80 |
| | $ | 16.9 |
|
| 2018 | 26,286 |
| | 22.89 |
| | $ | 37.9 |
| | 31,272 |
| | 48.13 |
| | $ | 29.1 |
|
United States Mineral Interest
Our only mineral interest in the United States is itsour ownership interest in PEVM. See Item 1 – Business – United States Mineral Interests.
Offices
Outside of the facilities that we own, SHR has a leased corporate and sales office in Sugar Land, Texas.
ItemITEM 3. Legal Proceedings.
The Company is periodically named in legal actions arising from normal business activities. We evaluate the merits of these actions and, if we determine that an unfavorable outcome is probable and can be reasonably estimated, we will establish the necessary reserves. We are not currently involved in legal proceedings that could reasonably be expected to have a material adverse effect
on our business, prospects, financial condition or results of operations. We may become involved in material legal proceedings in the future.
ItemITEM 4. Mine Safety Disclosures.
Not applicable.
PART II
ItemITEM 5. Market for Registrant'sRegistrant’s Common Equity, Related Stockholder Matters, and Issuer Purchases of Equity Securities.
Our common stock traded on the New York Stock Exchange ("NYSE"(“NYSE”) under the symbol "TREC".“TREC."
At March 4, 2019,As of February 26, 2021, there were approximately 535427 recorded holders (including brokers' accounts) of the Company'sCompany’s common stock. We have not paid any dividends since our inception and have instead deployed earnings to fund the development of our business. Any future determination to pay dividends will be at the discretion of our board of directors and will depend on our financial condition, results of operations, capital expenditure requirements, restrictions contained in current and future financing instruments, and other factors that our board of directors deems relevant. In addition, our ability to pay dividends depends in part on our receipt of cash dividends and distributions from our subsidiaries. The terms of certain of our current debt instruments restrict the ability of our subsidiaries to pay dividends, as may the terms of any of our future debt or preferred securities.
Total Stockholder Return
The following graph compares the cumulative total stockholder return on our common stock against the NYSE Composite Index and the S&P Specialty Chemical Index, for the five years ending December 31, 2018.2020. The graph was constructed on the assumption that $100 was invested in our common stock and each comparative on December 31, 2013,2015, and that any dividends were fully reinvested.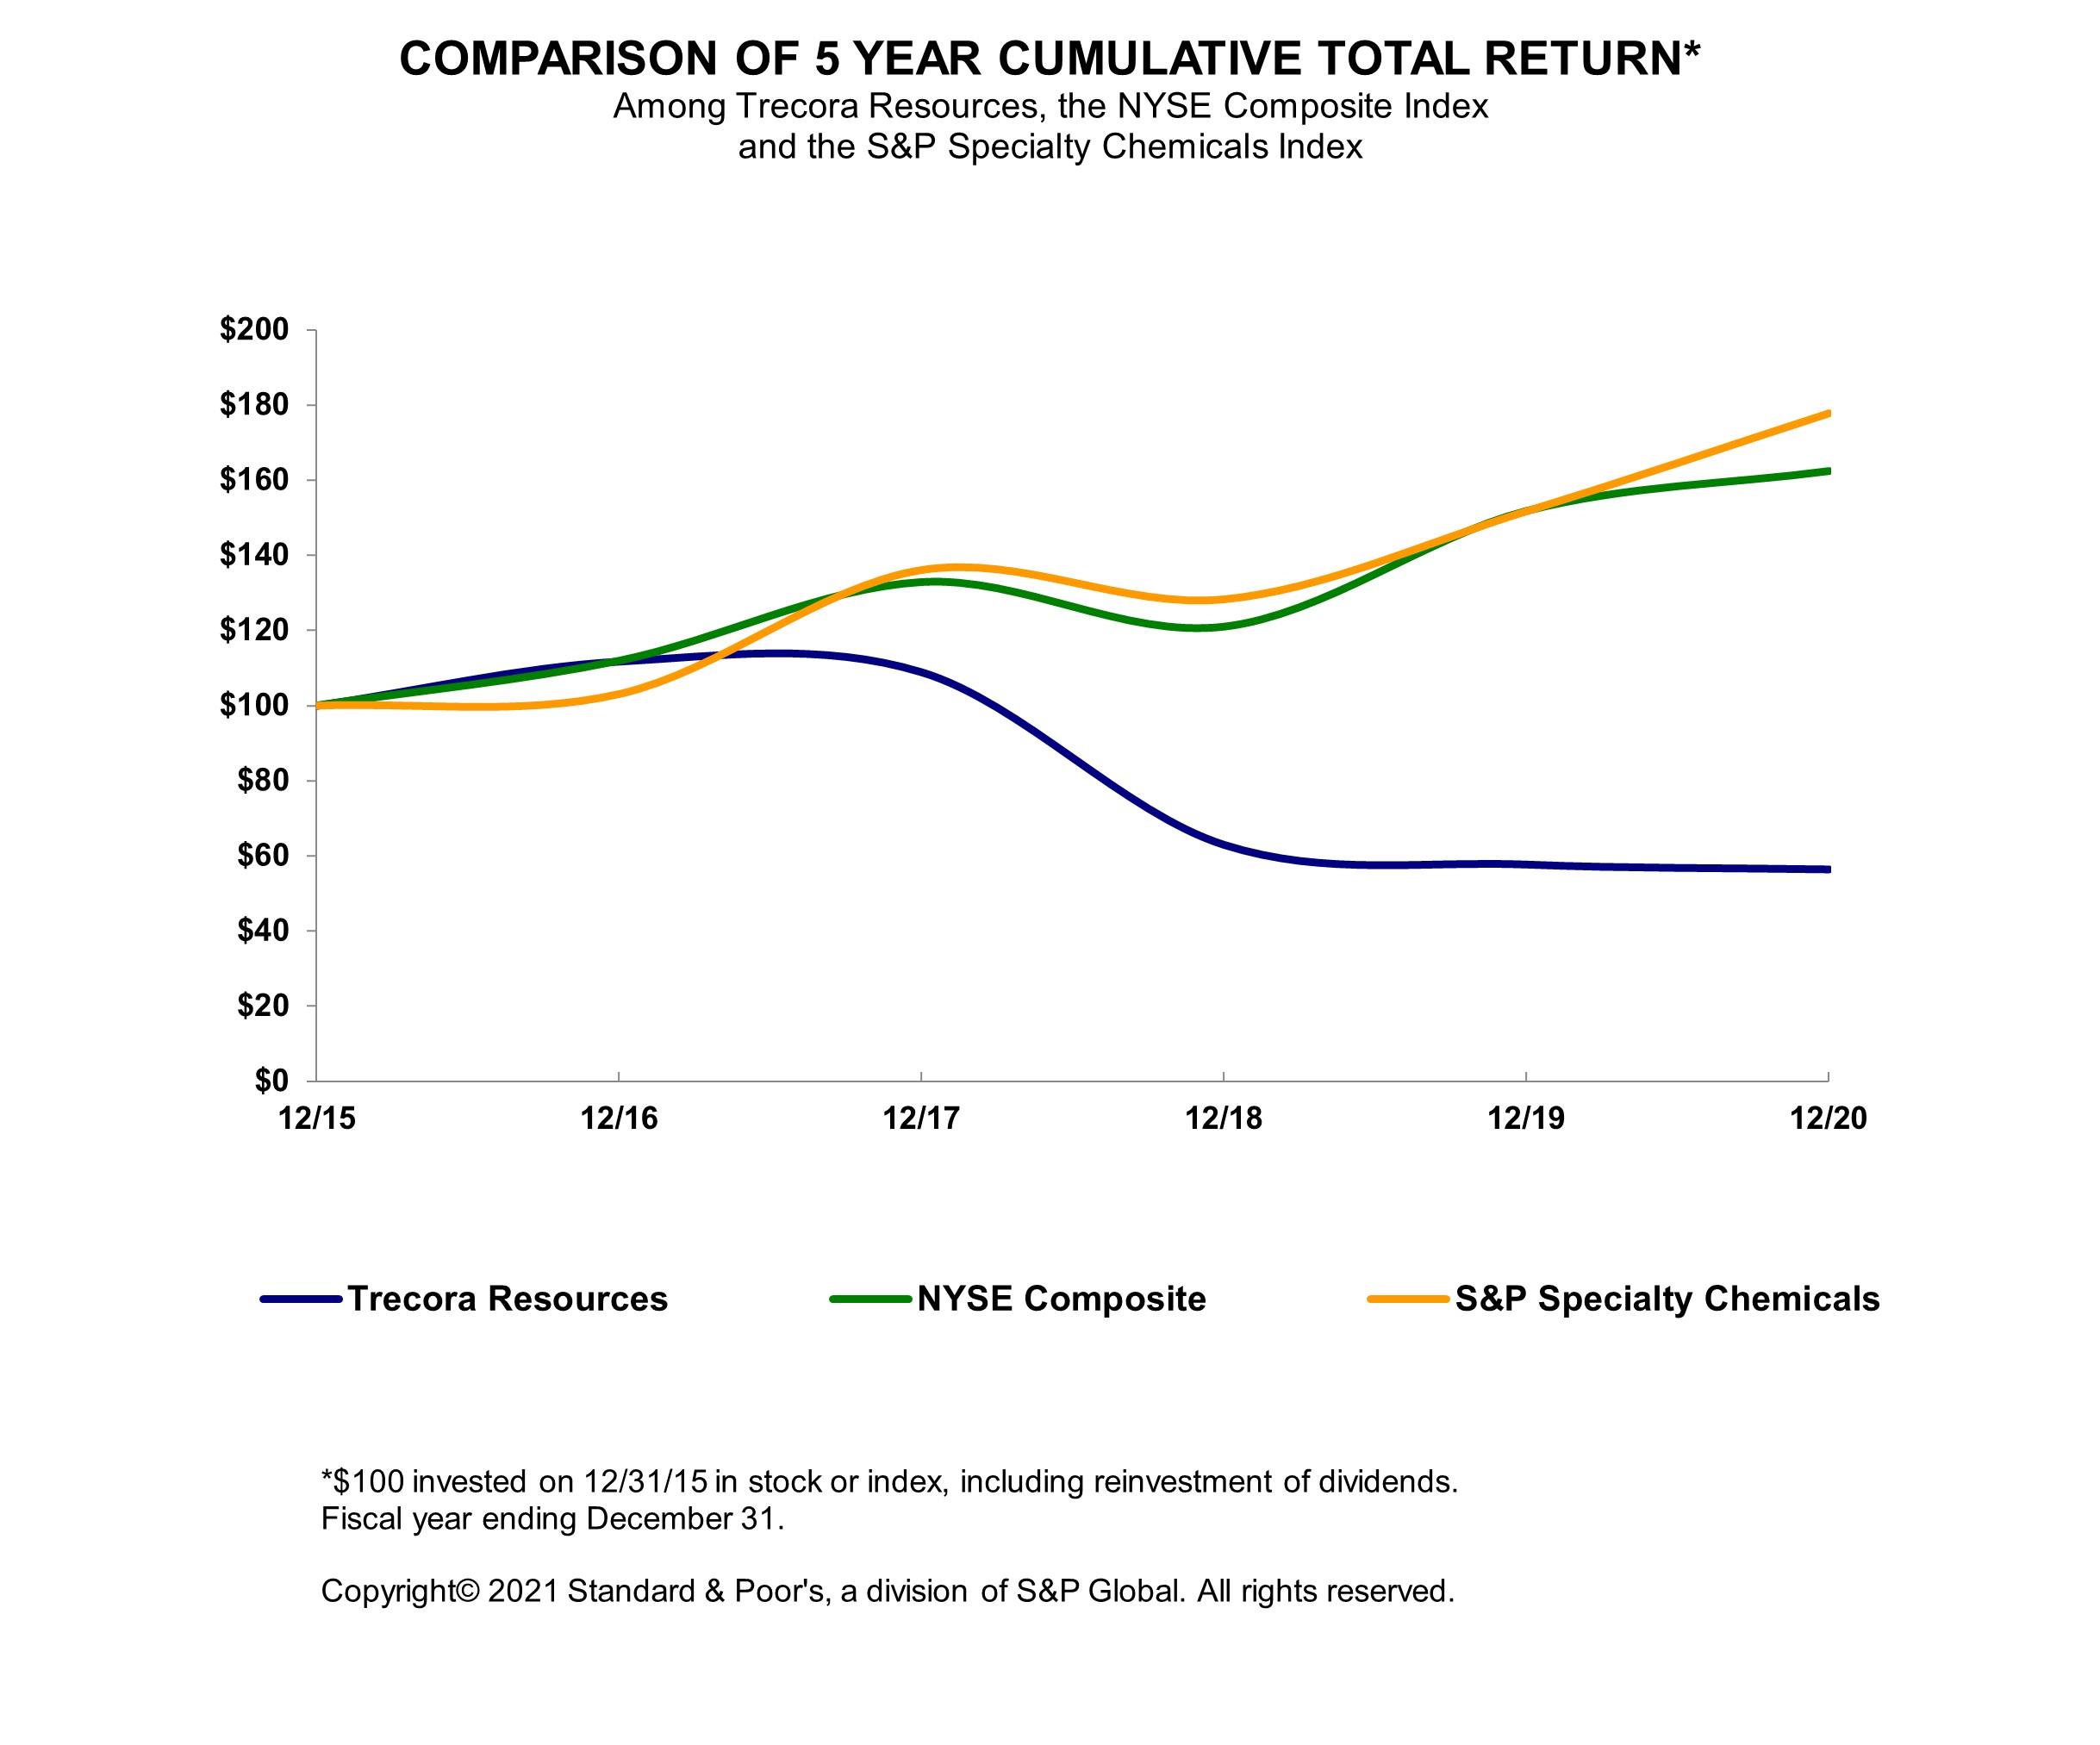
ItemITEM 6. Selected Financial Data.
The following is a five-year summary of selected financial data for years ended December 31 (in thousands, except per share amounts) and should be read in conjunction with the information set forth in Part II, Item 7. Management’s Discussion and Analysis of Financial Condition and Results of Operations and Part II, Item 8. Financial Statements and Supplementary Data:Data. As a result of the sale of our ownership interest in AMAK, which was completed in September 2020, AMAK’s historical financial results are reflected in our Consolidated Financial Statements as discontinued operations for all periods presented below. See additional information related to the sale of the Company’s investment in AMAK in Note 6 to the Consolidated Financial Statements.
| | | | | | | | | | | | | | | | | | | | | | | | | | | | | |
| 2020 | | 2019 | | 2018 | | 2017 | | 2016 |
| (thousands of dollars, except per share information) |
| Revenues | $ | 208,626 | | | $ | 258,959 | | | $ | 287,932 | | | $ | 245,143 | | | $ | 212,399 | |
| | | | | | | | | |
| Income (loss) from continuing operations | 4,966 | | | (12,884) | | | (1,728) | | | 21,512 | | | 17,559 | |
| Income (loss) from discontinued operations, net of tax | 26,209 | | | (2,090) | | | (604) | | | (3,503) | | | 1,869 | |
| Net income (loss) | 31,175 | | | (14,974) | | | (2,332) | | | 18,009 | | | 19,428 | |
| | | | | | | | | |
| Basic income (loss) per common share: | | | | | | | | | |
| Income (loss) from continuing operations (dollars) | 0.20 | | | (0.52) | | | (0.07) | | | 0.89 | | | 0.72 | |
| Income (loss) from discontinued operations, net of tax (dollars) | 1.06 | | | (0.08) | | | (0.02) | | | (0.14) | | | 0.08 | |
| Net income (loss) (dollars) | 1.26 | | | (0.61) | | | (0.10) | | | 0.74 | | | 0.80 | |
| | | | | | | | | |
| Diluted income (loss) per common share: | | | | | | | | | |
| Income (loss) from continuing operations (dollars) | 0.20 | | | (0.52) | | | (0.07) | | | 0.86 | | | 0.70 | |
| Income (loss) from discontinued operations, net of tax (dollars) | 1.03 | | | (0.08) | | | (0.02) | | | (0.14) | | | 0.07 | |
| Net income (loss) (dollars) | 1.23 | | | (0.61) | | | (0.10) | | | (0.72) | | | 0.78 | |
| | | | | | | | | |
| EBITDA from continuing operations (1) | 19,642 | | | 4,890 | | | 16,084 | | | 29,176 | | | 40,310 | |
| Adjusted EBITDA from continuing operations (1) | 21,593 | | | 31,041 | | | 20,168 | | | 31,880 | | | 31,313 | |
| Total Assets | 316,833 | | | 301,819 | | | 329,968 | | | 327,326 | | | 290,484 | |
| Current portion of long-term debt | 4,194 | | | 4,194 | | | 4,194 | | | 8,061 | | | 10,145 | |
| Total long-term debt obligations | 41,901 | | | 79,095 | | | 98,288 | | | 91,021 | | | 73,107 | |
|
| | | | | | | | | | | | | | | | | | | |
| | 2018 |
| | 2017 |
| | 2016 |
| | 2015 |
| | 2014 |
|
| Revenues | $ | 287,932 |
| | $ | 245,143 |
| | $ | 212,399 |
| | $ | 241,976 |
| | $ | 289,643 |
|
| Net (Loss) Income | (2,332 | ) | | 18,009 |
| | 19,428 |
| | 18,598 |
| | 15,571 |
|
| Net (Loss) Income Per Share-Basic | (0.10 | ) | | 0.74 |
| | 0.80 |
| | 0.76 |
| | 0.64 |
|
| Net (Loss) Income Per Share-Diluted | (0.10 | ) | | 0.72 |
| | 0.78 |
| | 0.74 |
| | 0.63 |
|
| EBITDA (1) | 15,319 |
| | 24,742 |
| | 41,694 |
| | 39,639 |
| | 29,814 |
|
| Adjusted EBITDA (1) | 20,619 |
| | 31,710 |
| | 31,008 |
| | 47,317 |
| | 33,027 |
|
| Total Assets | 329,968 |
| | 327,326 |
| | 290,484 |
| | 257,791 |
| | 230,782 |
|
| Current Portion of Long-Term Debt | 4,194 |
| | 8,061 |
| | 10,145 |
| | 8,061 |
| | 6,728 |
|
| Total Long-Term Debt Obligations | 98,288 |
| | 91,021 |
| | 73,107 |
| | 73,169 |
| | 72,430 |
|
| |
(1) | Non-GAAP financial measure. See the information under the heading "Non-GAAP Financial Measures" below for additional information about this measures and a reconciliation to the most directly comparable financial measure under United States generally accepted accounting principles (“GAAP”). |
(1)Non-GAAP financial measure. See the information under the heading “Non-GAAP Financial Measures" below for additional information about this measures and a reconciliation to the most directly comparable financial measure under United States generally accepted accounting principles (“GAAP”).
Non-GAAP Financial Measures
We include in this Annual Report on Form 10-K the non-GAAP financial measures of EBITDA from continuing operations and Adjusted EBITDA and Adjusted Net Income (Loss)from continuing operations and provide reconciliations from our most directly comparable GAAP financial measure to those measures.
We believe these financial measures provide users of our financial statements with supplemental information that may be useful in evaluating our operating performance. We also believe that such non–GAAPnon-GAAP measures, when read in conjunction with our operating results presented under GAAP, can be used to better assess our performance from period to period and relative to performance of other companies in our industry, without regard to financing methods, historical cost basis or capital structure. These measures are not measures of financial performance or liquidity under GAAP and should be considered in addition to, and not as a substitute for, analysis of our results under GAAP.
EBITDA and Adjusted EBITDA: We define EBITDA from continuing operations as net income (loss) from continuing operations plus interest expense, (benefit) including derivative gains and losses, income taxes,tax expense (benefit), depreciation and amortization. We define Adjusted EBITDA from continuing operations as EBITDA from continuing operations plus share–based compensation, plus restructuring and severance expenses, plus impairment losses on extinguishment of debt, plus or minus equity in AMAK's earnings and losses or gains from equity issuances, and plus or minus gains or losses on acquisitions.disposal of assets.
Adjusted Net Income (Loss): We define Adjusted Net Income (Loss) as net income (loss) plus or minus tax effected equity in AMAK's earnings and losses, minus tax effected restructuring and severance expenses, and adjustments for tax law changes in 2017.The following table presents a reconciliation of net income (loss), our most directly comparable GAAP financial performance measure for each of the periods presented, to EBITDA from continuing operations and Adjusted EBITDA and Adjusted Net Income.from continuing operations.
| | | | | | | | | | | | | | | | | | | | | | | | | | | | | |
| 2020 | | 2019 | | 2018 | | 2017 | | 2016 |
| Net income (loss) | $ | 31,175 | | | $ | (14,974) | | | $ | (2,332) | | | $ | 18,009 | | | $ | 19,428 | |
| Income (loss) from discontinued operations, net of tax | 26,209 | | | (2,090) | | | (604) | | | (3,503) | | | 1,869 | |
| Income (loss) from continuing operations | 4,966 | | | (12,884) | | | (1,728) | | | 21,512 | | | 17,559 | |
| | | | | | | | | |
| Interest expense | 2,491 | | | 5,139 | | | 4,100 | | | 2,931 | | | 1,981 | |
| Derivative (gains) losses on interest rate swap | — | | | — | | | — | | | (3) | | | 4 | |
| Depreciation and amortization | 16,148 | | | 16,201 | | | 14,358 | | | 10,961 | | | 9,777 | |
| Income tax (benefit) expense* | (3,963) | | | (3,566) | | | (646) | | | (6,228) | | | 10,989 | |
| EBITDA from continuing operations | 19,642 | | | 4,890 | | | 16,084 | | | 29,173 | | | 40,310 | |
| | | | | | | | | |
| Share-based compensation** | 1,912 | | | 1,319 | | | 1,422 | | | 2,707 | | | 2,552 | |
| Loss on disposal of assets | 39 | | | 680 | | | — | | | — | | | — | |
| Impairment of goodwill and certain intangibles | — | | | 24,152 | | | — | | | — | | | — | |
| Bargain purchase gain | — | | | — | | | — | | | — | | | (11,549) | |
| Loss on extinguishment of debt | — | | | — | | | 315 | | | — | | | — | |
| Restructuring and severance expenses | — | | | — | | | 2,347 | | | — | | | — | |
| Adjusted EBITDA from continuing operations | $ | 21,593 | | | $ | 31,041 | | | $ | 20,168 | | | $ | 31,880 | | | $ | 31,313 | |
|
| | | | | | | | | | | | | | | | | | | |
| | 2018 |
| | 2017 |
| | 2016 |
| | 2015 |
| | 2014 |
|
| Net (Loss) Income | $ | (2,332 | ) | | $ | 18,009 |
| | $ | 19,428 |
| | $ | 18,598 |
| | $ | 15,571 |
|
| | | | | | | | | | |
| Interest expense | 4,100 |
| | 2,934 |
| | 1,981 |
| | 2,232 |
| | 1,042 |
|
| Derivative (gains) losses on interest rate swap | — |
| | (3 | ) | | 4 |
| | (15 | ) | | 378 |
|
| Depreciation and amortization | 14,358 |
| | 10,961 |
| | 9,777 |
| | 9,060 |
| | 5,676 |
|
| Income tax (benefit) expense | (807 | ) | | (7,159 | ) | | 10,504 |
| | 9,764 |
| | 7,147 |
|
| EBITDA | 15,319 |
|
| 24,742 |
|
| 41,694 |
|
| 39,639 |
|
| 29,814 |
|
| | | | | | | | | | |
| Share-based compensation* | 1,422 |
| | 2,707 |
| | 2,552 |
| | 2,353 |
| | 2,141 |
|
| Bargain purchase gain on B Plant | — |
| | — |
| | (11,549 | ) | | — |
| | — |
|
| Equity in losses of AMAK | 901 |
| | 4,261 |
| | 1,479 |
| | 5,325 |
| | 1,072 |
|
| Loss on extinguishment of debt | 315 |
| | — |
| | — |
| | — |
| | — |
|
| Restructuring and severance expenses | 2,347 |
| | — |
| | — |
| | — |
| | — |
|
| Gain from additional equity issuance by AMAK | — |
| | — |
| | (3,168 | ) | | — |
| | — |
|
| Adjusted EBITDA | $ | 20,304 |
|
| $ | 31,710 |
|
| $ | 31,008 |
|
| $ | 47,317 |
|
| $ | 33,027 |
|
| | | | | | | | | | |
| Net Income | $ | (2,332 | ) | | $ | 18,009 |
| | $ | 19,428 |
| | $ | 18,598 |
| | $ | 15,571 |
|
| | | | | | | | | | |
| Bargain purchase gain on B Plant | — |
| | — |
| | (11,549 | ) | | — |
| | — |
|
| Equity in (earnings) losses of AMAK | 901 |
| | 4,261 |
| | 1,479 |
| | 5,325 |
| | 1,072 |
|
| Restructuring and severance expenses | 2,347 |
| | — |
| | — |
| | — |
| | — |
|
| Gain from additional equity issuance by AMAK | — |
| | — |
| | (3,168 | ) | | — |
| | — |
|
| Total of adjustments | 3,248 |
| | 4,261 |
| | (13,238 | ) | | 5,325 |
| | 1,072 |
|
| Taxes at statutory rate** | (682 | ) | | (895 | ) | | 4,633 |
| | (1,864 | ) | | (375 | ) |
| Tax effected adjustments | 2,566 |
|
| 3,366 |
|
| (8,605 | ) |
| 3,461 |
|
| 697 |
|
| Tax benefit of rate change from Tax Cuts and Jobs Act | — |
| | (10,307 | ) | | — |
| | — |
| | — |
|
| Adjusted Net Income | $ | 234 |
| | $ | 11,068 |
| | $ | 10,823 |
| | $ | 22,059 |
| | $ | 16,268 |
|
* Reduced to reflect amount included in Restructuring and Severance Expenses.
** The Company used a statutory rate of 35% for 2014 through 2016. For 2017 and 2018through 2020 the Company estimated current taxable income to be zero and calculated deferred taxes using a statutory rate of 21% based on the enacted tax rate on December 22, 2017 (Noterate. (See Notes 2 and 16)16 to the Consolidated Financial Statements).
** Reduced to reflect amount included in Restructuring and severance expenses. ItemITEM 7. Management'sManagement’s Discussion and Analysis of Financial Condition and Results of Operations.
Management'sManagement’s Discussion and Analysis of Financial Condition and Results of Operations should be read in conjunction with Item 8. Financial Statements and Supplementary Data.
Forward Looking Statements
Some of the statements and information contained in this Annual Report on Form 10-K may constitute forward-looking statements within the meaning of the Private Securities Litigation Reform Act of 1995. Statements regarding the Company'sCompany’s financial position, business strategy and plans and objectives of the Company'sCompany’s management for future operations and other statements that are not historical facts, are forward-looking statements. Forward-looking statements are often characterized by the use of words such as "outlook," "may," "will," "should," "could," "expects," "plans," "anticipates," "contemplates," "proposes," "believes," "estimates," "predicts," "projects," "potential," "continue," "intend,"“outlook,” “may,” “will,” “can,” “shall,” “should,” “could,” “expects,” “plans,” “anticipates,” “contemplates,” “proposes,” “believes,” “estimates,” “predicts,” “projects,” “potential,” “continue,” “intend,” or the negative of such terms and other comparable terminology, or by discussions of strategy, plans or intentions.
Forward-looking statements are subject toinvolve known and unknown risks, uncertainties, assumptions, and other important factors that could cause the actual results, performance or our achievements, or industry results, to differ materially from thosehistorical results, any future results, or performance or achievements expressed or implied by such forward-looking statements. Such risks, uncertainties and factors include, but are not limited to:to the impacts of the COVID-19 pandemic on our business, financial results and financial condition and that of our customers, suppliers, and other counterparties; general economic and financial conditions domestically and internationally; insufficient cash flows from operating activities; difficulties in obtaining financing;our ability to attract and retain key employees; feedstock, and product prices; feedstock availability and our ability to access third party transportation; competition; industry cycles; natural disasters or other severe weather events, health epidemics and pandemics (including the COVID-19 pandemic) and terrorist attacks; our ability to consummate extraordinary transactions, including acquisitions and dispositions, and realize the financial and strategic goals of such transactions; technological developments and our ability to maintain, expand and upgrade our facilities; regulatory changes; environmental matters; lawsuits; outstanding debt and other financial and legal obligations; lawsuits; competition; industry cycles; feedstock, productobligations (including having to return the amounts borrowed under the PPP Loans or failing to qualify for forgiveness of such loans, in whole or in part); difficulties in obtaining additional financing on favorable conditions, or at all; local business risks in foreign countries, including civil unrest and mineral prices; feedstock availability; technological developments;military or political conflict, local regulatory changes; environmental matters; foreign government instability; foreignand legal
environments and political concepts; foreign currency fluctuations; and other risks detailed in this report under the headings Part I, Item 1A. Risk Factors and Part II, Item 7. Management’s Discussion and Analysis of Financial Condition and Results of Operations therein, and in our other filings with the SEC. Many of these risks and uncertainties are currently amplified by and will continue to be amplified by, or in the future may be amplified by, the COVID-19 pandemic and other natural disasters such as severe weather events.
There may be other factors of which we are currently unaware or deem immaterial that may cause our actual results to differ materially from the forward-looking statements. In addition, to the extent any inconsistency or conflict exists between the information included in this report and the information included in our prior releases, reports and other filings with the SEC, the information contained in this report updates and supersedes such information.
Forward-looking statements are based on current plans, estimates, assumptions and projections, and, therefore, you should not place undue reliance on them. Forward-looking statements speak only as of the date they are made, and we undertake no obligation to update them in light of new information or future events.
Overview
The following discussion and analysis of our financial results, as well as the accompanying consolidated financial statementsConsolidated Financial Statements and related notes to consolidated financial statementsConsolidated Financial Statements to which they refer, are the responsibility of the management of the Company.our management. Our accounting and financial reporting fairly reflect our business model involvingwhich is based on the manufacturing and marketing of specialty petrochemicalpetrochemicals products and specialty waxes. Our business model involves the manufacture and sale of tangible productswaxes and providing custom processingmanufacturing services.
Our consistentpreferred supplier position into the specialty petrochemicals market is derived from the combination of our reputation as a reliable supplier established over many years, the very high purity of our products, and a focused approach to providing high purity products and quality servicescustomer service. In specialty waxes, we are able to deliver to our customers has helpeda product performance and price point that we believe is unique to sustain our current position asmarket; while the diversity of our custom processing assets and capabilities offers solutions to our customers that we believe are uncommon along the U.S. Gulf Coast.
Enabling our success in these businesses is a preferred suppliercommitment to operational excellence which establishes a culture that prioritizes the safety of various specialty petrochemical products.our employees and communities in which we operate, the integrity of our assets and regulatory compliance. This commitment drives a change to an emphasis on forward-looking, leading-indicators of our results and proactive steps to continuously improve our performance. We bring the same commitment to excellence to our commercial activities where we focus on the value proposition to our customers while understanding opportunities to maximize our value capture through service and product differentiation, supply chain and operating cost efficiencies and diversified supply options. We believe our focus on execution, meeting the needs of our customers, and growing our business while maintaining prudent control of our costs, will significantly contribute to enhanced shareholder value.
Business Environment and Risk Assessment
We believe we are well-positioned to participate in the US chemical industry growth driven by new investments and overall economic growth. While petrochemical prices are volatile on a short-term basis and depend on the demand of our customers' products, our investment decisions are based on our long-term business outlook using a disciplined approach in selecting and pursuing the most attractive investment opportunities.
The global impact of COVID-19 has resulted in various emergency measures to curb the spread of the virus. We continue to monitor the progression of the COVID-19 pandemic on a daily basis. Our guiding principle is, and has always been, the protection of our people and the communities in which we work, as well as maintaining the overall integrity of our assets. While our essential plant personnel remain on-site, many of our other employees are working remotely. We are continuing to follow the orders and guidance of federal, state, and local governmental agencies, as we maintain our own stringent protocols in an effort to mitigate the spread of the virus and protect the health of our employees, customers, and suppliers as well as the communities in which we work. As an organization, we adopted social distancing behaviors early, executed the necessary changes to enable all possible job duties to be performed remotely and rapidly identified and executed the necessary adjustments to support optimal productivity for all remote workers.
To date, our plants have continued to operate as normal, and our supply chain has generally remained intact, with adequate availability of raw materials. Importantly, under the U.S. Department of Homeland Security guidance issued on April 17, 2020 as updated through August 18, 2020, as well as many related state and local governmental orders, chemical manufacturing sites are considered essential critical infrastructure, and as such, are not currently subject to closure in the locations where we operate. Although there has been some disruption in global logistics channels, we have not experienced significant delays in fulfillment of customer orders.
The COVID-19 pandemic has had an impact on our business, results of operations, financial position and liquidity for the year ended December 31, 2020. In comparison to 2019, we saw reduced demand for our products and services in certain end markets, including durable goods such as automotive and construction, which we attribute to the economic slowdown caused by
the COVID-19 pandemic. This weakened demand in certain end markets is likely to continue into 2021, and could spread more broadly to our other end markets.
Our management will continue to actively monitor the impact of the global pandemic on our business, results of operations, financial condition, liquidity, suppliers, industry, investments, and workforce. We do not currently anticipate any material impairments, with respect to intangible assets, long–lived assets, or right of use assets, increases in allowances for credit losses from our customers, restructuring charges, other expenses, or changes in accounting judgments to have a material impact on our Consolidated Financial Statements.
Specialty Petrochemical OperationsPetrochemicals Segment
SHR's worldwideSHR’s specialty petrochemical demand increased during 2018petrochemicals sales decreased in 2020 compared to 2017.2019. Product sales revenue increased 19.3%decreased 23.6% driven primarily by volume growthdecline of 7.6%. Overall product prices also increased compared to 201711.4%, primarily due to higher feedstock coststhe impact of COVID-19 on our customers and end markets. Product prices were lower in 20182020 compared to 2017. We2019 primarily due to lower feedstock costs. During 2020, SHR continued to emphasize our competitive advantages achieved through our high quality products and outstanding customer service and responsiveness. We are also focused oncontinued to make strides in improving operationssafety and plant reliability.
During 20182020, natural gasoline feedstock pricescosts were about 24%, or $0.28 per gallon, higherapproximately 27% lower than 20172019, reflecting higherlower crude oil prices. After steadily increasing for most of 2018 feedstock prices declined sharply in the fourth quarter of 2018. About 60%Approximately 65% of our prime products are sold under formula pricing whereby feedstock costs areprice is passed along to the customer typically with a one month lag. Thus, whenFalling feedstock prices start rising, we experience lower margins as formula pricing lags feedstock costs. During mostcosts during the first half of 20182020 assisted prime products margins were pressuredwhile we saw a narrowing of margins in the second half of 2020 due to rising feedstock costs and as a result of greater competitive pricing pressure on prime products sales that are based on non-formula pricing.costs. Our byproductby-product margins were under pressure in the fourth quartermaterially lower compared to 2019 due to the Advanced Reformer outagelower by-product component prices.
Specialty Waxes Segment
Sales revenues for our specialty waxes business increased approximately 4.7% in 2020 from 2019 as we sold byproductshad higher wax product revenues and higher custom processing revenues. The increase in revenues was due to an increase in wax feed supply as compared to 2019, where wax feed supply disruptions were impacted due to operating issues at prices below the costour wax feed suppliers.
Our Specialty Waxes products are used in a variety of feedstock.
Specialty Wax Operations
Most wax markets are mature. Key applications including: performance additives for our polyethylene waxes are in hot melt adhesives ("HMA"), plasticadhesives; penetration and melting point modifiers for paraffin and microcrystalline waxes; lubrication and processing aides for plastics, PVC, lubricantsrubber, and inks, paints and coatings, where they act as surface or rheology modifiers. The HMA market is expected to grow at a higher rate than GDP growth due to growthdry stir-in additives for inks. In oxidized forms, applications also include use in the developing markets and increases in packaging requirements due to changes in consumer purchasing (shift to home deliveries via the internet) in developed economies. Road marking paints are also expected to grow at rates exceeding GDP growth based upon an expectation that there will be infrastructure investment in the U.S. The PVC market is expected to grow at GDP rates; however, we expect to get more traction of our products within this market with acceptance of our new PVC grade waxes. The global wax market is benefiting from the reduction of paraffin wax availability from large refiners as they move toward more hydrocracking and hydroisomerization to produce group III lube oils and distillate. Our wax sales volume increased approximately 5% in 2018 from 2017 while revenues increased approximately 13%.
textile emulsions.
Restructuring and Severance Impact
During 2018, the Company incurred restructuring and severance expenses of $2.3 million which arewere included in General and Administrative Expenses. These expenses arewere primarily attributable to the termination of certain executives during 2018 as part of the restructuring of executive management and to the reduction in the workforce at our Silsbee, Texas facility in December 2018. These expenses relaterelated to severance, stock compensation for continued vesting of time-vested shares issued under the Company'sCompany’s long-term incentive plan, and certain employee benefits including medical insurance and vacation. As of December 31, 2018, approximately $1.12019, there was less than $0.1 million had been incurred, and an additional liabilityremaining for accrued restructuring related liabilities. As of $1.2 million was accruedDecember 31, 2020, there were no remaining liabilities related to future benefits.restructuring and severance.
Hurricane Harvey Impact
The financial impact of Hurricane Harvey to our company was significant. Harvey made landfall on the Texas Gulf Coast on August 25, 2017, and affected operations at both SHR and TC. We estimated the total negative impact to 2017 EBITDA ranged from approximately $1.5 million to $1.8 million. This included expenses related to generator rentals, overtime labor, and maintenance and repairs of approximately $0.7 million. This estimate also included lost sales due to outages at customer and supplier facilities. Neither of our facilities suffered any significant damage.
Liquidity and Capital Resources
Working Capital
Our approximate working capital days are summarized as follows:
| | | | December 31, 2018 |
| | December 31, 2017 |
| | December 31, 2016 |
| | December 31, 2020 | | December 31, 2019 | | December 31, 2018 |
| Days sales outstanding in accounts receivable | 34.4 |
| | 38.4 |
| | 38.2 |
| Days sales outstanding in accounts receivable | 40.0 | | | 37.1 | | | 34.4 | |
| Days sales outstanding in inventory | 21.0 |
| | 27.5 |
| | 30.2 |
| Days sales outstanding in inventory | 20.5 | | | 19.2 | | | 21.0 | |
| Days sales outstanding in accounts payable | 24.2 |
| | 27.3 |
| | 22.9 |
| Days sales outstanding in accounts payable | 22.9 | | | 20.6 | | | 24.2 | |
| Days of working capital | 31.1 |
| | 38.5 |
| | 45.5 |
| Days of working capital | 37.7 | | | 35.7 | | | 31.1 | |
Our days sales outstanding in accounts receivable remained steadyincreased from 20162019 to 2017 but decreased from 2017 to 20182020 due to greater increasea recovery in sales revenue relative tolate in the increase infourth quarter of 2020 and the associated timing of related receivables.
Our days sales outstanding in inventory decreasedincreased from 20172019 to 20182020 due to a planned reductionlower daily sales primarily in inventory at TC.our Specialty Petrochemicals segment.
Our days sales outstanding in accounts payable decreasedincreased from 2019 to 2020 due primarily to a decreasehigher accrued payables in payables becauseour Specialty Petrochemicals segment.
Sources and Uses of Cash
Cash and cash equivalents increased by $3.7$49.5 million during the year ended December 31, 2018.2020. The change in cash and cash equivalents is summarized as follows:
| | | | 2018 |
| | 2017 |
| | 2016 |
| | 2020 | | 2019 | | 2018 |
| Net cash provided by (used in) | (in thousands) | Net cash provided by (used in) | (in thousands) |
| Operating activities | $ | 19,895 |
| | $ | 30,828 |
| | $ | 28,514 |
| Operating activities | $ | 25,565 | | | $ | 25,121 | | | $ | 19,895 | |
| Investing activities | (19,871 | ) | | (51,691 | ) | | (40,509 | ) | Investing activities | 55,329 | | | (6,031) | | | (19,871) | |
| Financing activities | 3,683 |
| | 15,502 |
| | 1,761 |
| Financing activities | (31,375) | | | (19,680) | | | 3,683 | |
| Increase (decrease) in cash and equivalents | $ | 3,707 |
|
| $ | (5,361 | ) |
| $ | (10,234 | ) | Increase (decrease) in cash and equivalents | $ | 49,519 | | | $ | (590) | | | $ | 3,707 | |
| Cash and cash equivalents | $ | 6,735 |
| | $ | 3,028 |
| | $ | 8,389 |
| Cash and cash equivalents | 55,664 | | | 6,145 | | | 6,735 | |
Operating Activities
Operating activities generated cash of $19.9$25.6 million during fiscal 20182020 as compared with $30.8$25.1 million of cash provided during fiscal 2017.2019. Net income decreasedincreased by $20.3$46.1 million andwhile cash provided by operations decreasedincreased by $10.9$0.4 million from 20172019 to 2020. Net income for 2020 included net income from discontinued operations related to the sale of AMAK of $26.2 million while net loss for 2019 included a non-cash impairment charge for goodwill and certain intangible assets of $24.2 million.
Operating activities generated cash of $25.1 million during fiscal 2019 as compared with $19.9 million of cash provided during fiscal 2018. Net loss increased by $12.6 million while cash provided by operations increased by $5.2 million from 2018 to 2019 due primarily to the following factors:
•Net incomeloss for 20182019 included a non-cash depreciationimpairment charge for goodwill and amortization chargecertain intangible assets of $14.4 million as compared to 2017 which included a non-cash depreciation$24.2 million; and amortization charge of $11.0 million;
Net income for 2018 included non-cash deferred income tax liability of $1.6 million as compared to non-cash deferred income tax liability of $5.8 million in 2017;
•Trade receivables decreased $1.5$0.8 million in 20182019 as compared to an decreaseincrease of $3.6$1.5 million in 2017;2018.
These significant sources of cash were partially offset by the following decreases in cash provided by operations:
•Accounts payable and accrued liabilities decreased $4.9 million in 2019 (primarily due to payoff of catalyst purchased at the end of 2018) as compared to an increase of $2.2 million in 2018 (also primarily due to catalyst purchases);
•Income taxes receivable decreasedwere flat in 2019, as compared to a decrease of $5.4 million in 2018 (primarily due to collection of federal and state research and development credits, carryback claims, and refunds of tax payments on deposit) as compared to an increase of $1.6 million in 2017 (primarily due to federal and state research and development credits and carryback claims); and
Inventory decreased $1.9 million in 2018 as compared to an increase of $0.6 million in 2017.
These significant sources of cash were partially offset by the following decreases in cash provided by operations:
•Net incomeloss for 2018 included a non-cash equity in loss from AMAK of $0.9 million as compared to a non-cash equity in loss from AMAK of $4.3 million in 2017; and
Accounts payable and accrued liabilities decreased $2.2 million in 2018 as compared to a decrease of $7.0 million in 2017 due to the release of post-retirement obligations to a former director as well as the completion of certain capital projects.
Operating activities generated cash of $30.8 million during fiscal 2017 as compared with $28.5 million of cash provided during fiscal 2016. Net income decreased by $1.4 million from 2016 to 2017; however, cash provided by operations increased by $2.3 million due primarily to the following factors:
Net income for 2017 included a non-cash equity in loss from AMAK of $4.3 million as compared to a non-cash equity in loss from AMAK of $1.5 million and a $3.2 million gain from additional equity issuance by AMAK in 2016;
Net income for 2016 included a non-cash bargain purchase gain from the B Plant acquisition of $11.5 million as compared to 2017 which had no gain;
Net income for 2017 included a non-cash depreciation and amortization charge of $11.0 million as compared to 2016 which included a non-cash depreciation and amortization charge of $9.8 million;
Accounts payable and accrued liabilities increased $7.0 million in 2017 (primarily due to increased construction expenditures) as compared to an increase of $3.2 million in 2016 (also primarily due to construction projects);
Prepaid expenses and other assets increased $0.8 million in 2017 (primarily due to the inventorying of spares parts) as compared to an increase of $1.0 million in 2016 (primarily due to license fees for the Advanced Reformer unit being constructed); and
Inventory increased $0.6 million in 2017 (primarily due to an increase in deferred sales which increases inventory in transit) as compared to an increase of $2.1 million in 2016 (due to lower sales volume).
These significant sources of cash were partially offset by the following decreases in cash provided by operations:
Net income for 20172019 included non-cash deferred income tax liability of $5.8$3.0 million as compared to non-cash deferred income tax benefitliability of $8.7$1.4 million in 2016;
Income taxes receivable increased $1.6 million in 2017 (primarily due to federal and state claims filed for research and development credits and carryback claims) as compared to an decrease of $3.7 million in 2016 (primarily due to overpayments being applied to 2016 estimated taxes); and
Trade receivables increased $3.6 million in 2017 (primarily due to an increase in the average selling price) as compared to an increase of $2.8 million in 2016 (due to an increase in wax sales in December and longer payment terms for some foreign customers because of increased shipping times);2018.
Investing Activities
Cash usedprovided by investing activities during fiscal 20182020 was approximately $19.9$55.3 million, representing an increase of approximately $61.4 million compared to fiscal 2019. The primary source of the funds provided by investing activities was $68.5 million of proceeds, net of the deposit previously paid, received in connection with the sale of our ownership interest in AMAK, discussed in Note 6 to the Consolidated Financial Statements, offset by additions of plant, pipeline and equipment of approximately $13.4 million.
Cash used in investing activities during fiscal 2019 was approximately $6.0 million, representing a decrease of approximately $31.8$13.8 million compared to fiscal 2017.2018. The majority of the decrease was due to the completion of construction projects for the Advanced Reformer unit. During 2018,2019, major capital expenditures included $14.9 millionimprovements to complete the Advanced Reformer unit, which includes $1 million insurance deductible related to the February 2018 fireplant safety and $3 million for the catalyst replacement in December 2018, $1.3 million for a rail spur additionmaintenance projects at SHR and 0.5 million for a loading rackTC and feedstock pipeline maintenance and upgrade work at SHR.
Cash used by investing activities during fiscal 2017 was approximately $51.7 million, representing an increase of approximately $11.2 million over the corresponding period of 2016. The majority of the increase was due to the construction projects for the hydrogenation/distillation unit and the Advanced Reformer unit. During 2017, we expended $10.8 million on the hydrogenation/distillation project, $0.9 million to upgrade B Plant, $32.5 million to construct the Advanced Reformer unit, $1.9 million for railspur addition, $1.0 million for additional tankage and upgrades to existing tankage, $0.9 million for transport trucks, and $3.7 million on various plant improvements and equipment.
Financing Activities
Cash provided byused in financing activities during fiscal 20182020 was approximately $3.7$31.4 million as compared to $19.7 million during fiscal 2019. In the first quarter of 2020, we drew $20.0 million under our Revolving Facility as a precaution in light of the uncertainty caused by the COVID-19 pandemic. We also received PPP Loans of $6.1 million to maintain the continuity of our workforce, including maintaining compensation and benefits. Utilizing a portion of the net proceeds from the sale of our investment in AMAK, together with cash on hand, we repaid our outstanding balance on our Revolving Facility of $23 million at the end of the second quarter and further reduced our debt with a $30 million prepayment toward our Term Loan Facility. We also made scheduled payments of $4.4 million on our Term Loan Facility.
Cash used in financing activities during fiscal 2019 was approximately $19.7 million versus cash provided of $15.5$3.7 million during fiscal 2017.2018. During 2018,2019, we increased our line of credit and consolidated our acquisition and term loans. We made principal payments on our outstanding Credit Facilities of $15.4$21.4 million. We drew $2.0 million on our term debt. We drew $18.2 million on our revolving line of credit, primarily to fund ourRevolving Facility for working capital projects.purposes. See Note 1213 to the Consolidated Financial Statements for additional discussion on long-term debt.
Anticipated Cash provided by financing activitiesNeeds
The COVID-19 pandemic has resulted in significant economic uncertainty and market volatility. In response, we have taken steps to address our liquidity needs during fiscal 2017 was approximately $15.5 million versus cash provided of $1.8 million during the corresponding period of 2016. During 2017 we made principal payments of $8.7 million on our acquisition loan and $1.7 million on our term debt. We drew $26.0 million on our line of credit primarily to fund our capital projects.
Credit Agreement
In October 2014, TOCCO, SHR, GSPL and TC (SHR, GSPL and TC collectively the “Guarantors”) entered into an amended and restated credit agreement (as amended to the date hereof, the “ARC Agreement”), which originally provided (i) a revolving credit facility (which we refer to herein as the “Revolving Facility”) with revolving commitments of $40.0 million and (ii) term loan borrowings consisting of (A) a $70.0 million single advance term loan incurred to partially finance the acquisition of TC (which we refer to as the “acquisition loan”) and (B) a $25.0 multiple advance term loan facility for which borrowing availability ended on December 31, 2015 (which we collectively refer to herein as the “Term Loan Facility” and, together with the Revolving Facility, the “Credit Facilities”).
Only July 31, 2018, TOCCO and the Guarantors entered into a Fourth Amendment to the ARC Agreement (the “Fourth Amendment”) pursuant to which the revolving commitments under the Revolving Facility were increased to $75.0 million. Pursuant to the Fourth Amendment, total borrowings under the Term Loan Facility were increased to $87.5 million under a single combined term loan, which comprised new term loan borrowings together with approximately $60.4 million of previously outstanding term loans under the Term Loan Facility. The $60.4 million of previously outstanding term loans included the remaining outstanding balances on the Acquisition loan and the multiple advance term loan facility described above. Proceeds of the new borrowings under the Term Loan Facility were used to repay a portion of the outstanding borrowings under the Revolving Facility and pay fees and expenses of the transaction.this uncertain period. As of December 31, 2018,2020, we had $18have approximately $55.7 million in borrowings outstanding under the Revolving Facility and $84.5 million in borrowings outstanding under the Term Loan Facility. In addition, we had the ability to borrow an additional approximately $18 million undercash, combined with borrowing availability on our Revolving Facility at December 31, 2018. TOCCO’s abilityof approximately $52.4 million. We also benefited from certain provisions of the CARES Act, including certain changes to make additionalU.S. tax law and borrowings under the Revolving Credit Facility at December 31, 2018 was limited by, and inPPP Loans that we believed were essential to support the future may continue to be limited by,continuity of our obligation to maintain compliance with the covenants contained in the ARC Agreement (including maintenance ofworkforce. As a maximum Consolidated Leverage Ratio and minimum Consolidated Fixed Charge Coverage Ratio (each as defined in the ARC Agreement)).
The maturity date for the ARC Agreement is July 31, 2023. Subject to the lenders acceptance of any increased commitment and other conditions,result, we have the option, at any time, to request an increase to the commitment under the Revolving Facility and/or the Term Loan Facility by an additional amount of up to $50.0 million in the aggregate.
Borrowings under each of the Credit Facilities bear interest on the outstanding principal amount at a rate equal to LIBOR plus an applicable margin of 1.25% to 2.50% or, at our option, the Base Rate plus an applicable margin of 0.25% to 1.50%, in each case, with the applicable margin being determined based on the Consolidated Leverage Ratio of TOCCO. A commitment fee between 0.20% and 0.375% is also payable quarterly on the unused portion of the Revolving Facility. For 2018, the effective interest rate for the Credit Facilities was 4.19%. Borrowings under the Term Loan Facility are subject to quarterly amortization payments based on a commercial style amortization method over a twenty year period; provided, that the final principal installment will be paid on the maturity date and will be in an amount equal to the outstanding borrowings under the Term Loan Facility on such date.
Pursuant to the terms of the ARC Agreement, TOCCO must maintain a maximum Consolidated Leverage Ratio of 4.75 to 1.00 for the four fiscal quarters ended December 31, 2018, 4.25 to 1.00 for the four fiscal quarters ended March 31, 2019, 4.00 to 1.00 for the four fiscal quarters ended June 30, 2019 and 3.75 to 1.00 for the four fiscal quarters ended September 30, 2019. For the four fiscal quarters ended December 31, 2019 and each fiscal quarter thereafter, TOCCO must maintain a Consolidated Leverage Ratio of 3.50 to 1.00 (subject to temporary increase following certain acquisitions). Additionally, TOCCO must maintain a minimum Consolidated Fixed Charge Coverage Ratio as of the end of any fiscal quarter of 1.15 to 1.00.
The ARC Agreement contains, among other things, other customary covenants, including restrictions on the incurrence of additional indebtedness, the granting of additional liens, the making of investments, the disposition of assets and other fundamental changes, transactions with affiliates and the declaration of dividends and other restricted payments. The ARC Agreement further includes customary representations and warranties and events of default, and upon occurrence of such events of default the outstanding obligations under the ARC Agreement may be accelerated and become immediately due and payable and the commitment of the
lenders to make loans under the ARC Agreement may be terminated. We were in compliance with all covenants at December 31, 2018.
Anticipated Cash Needs
We believe that the Company is capable of supportingable to support its operating requirements and capital expenditures through internally generated funds supplemented with cash on our balance sheet and availability under our Revolving Facility.
Capital Resources and Requirements
Capital expenditures increased 32% from 2019 to 2020. The majority of the increase was due to maintenance and upkeep of our GSPL pipeline which is used to transport our feedstock to the Silsbee facility. In addition, we had capital expenditures for storage tank replacements and upgrades and levee upgrades also at SHR. During 2020 we expended approximately $4.5 million on upgrades to the pipeline for GSPL, approximately $1.7 million to replace and upgrade tanks, and $0.4 million on levee upgrades.
At December 31, 2020, there was borrowing availability of approximately $52.4 million on our Revolving Facility. We believe that operating cash flows along with cash on the balance sheet and credit availability will be sufficient to finance our 2021 operations and capital expenditures. See Note 13 to the Consolidated Financial Statements for additional discussion regarding credit availability.
The table below summarizes the following contractual obligations of the Company:
| | | | | | | | | | | | | | | | | | | | | | | | | | | | | |
| Payments due by period |
| Contractual Obligations | Total | | Less than
1 year | | 1-3 years | | 3-5 years | | More than 5 years |
| (thousands of dollars) |
| Operating Lease Obligations | $ | 14,898 | | | $ | 3,703 | | | $ | 6,758 | | | $ | 3,355 | | | $ | 1,082 | |
| Purchase Obligations | 9,799 | | | 9,799 | | | — | | | — | | | — | |
| Long-Term Debt Obligations | 46,563 | | | 4,375 | | | 42,188 | | | — | | | — | |
| Total | $ | 71,260 | | | $ | 17,877 | | | $ | 48,946 | | | $ | 3,355 | | | $ | 1,082 | |
The majority of our operating lease obligations are for railcars as discussed in Note 9 of the Notes to Consolidated Financial Statements. Purchase obligations are primarily related to commitments for our undelivered feedstock and capital construction projects. The anticipated source of funds for payments due within three years that relate to contractual obligations is from a combination of cash flow from continuing operations supplemented with borrowings under our Credit Facilities.credit facility.
Results of Operations
Our Annual Report on Form 10-K for the year ended December 31, 2019 includes a discussion and analysis of our financial condition and results of operations for the year ended December 31, 2018 in Item 7 of Part II, Management’s Discussion and Analysis of Financial Condition and Results of Operations.
Comparison of Years 2018, 2017, 20162020 and 2019
The tables containing financial and operating information set forth below are presented to facilitate the discussion of the results of operations, and should not be considered a substitute for, and should be read in conjunction with, the audited consolidated financial statements.Consolidated Financial Statements.
Specialty PetrochemicalPetrochemicals Segment
| | | | | | | | | | | | 2020 | | 2019 | | Change | | % Change |
| | 2018 |
| | 2017 |
| | Change |
| | %Change |
| | (thousands of dollars) | | |
| | (in thousands) | | | |
| Specialty Petrochemical Product Sales | $ | 242,763 |
| | $ | 203,515 |
| | $ | 39,248 |
| | 19.3 | % | |
| Processing Fees | 6,916 |
| | 6,866 |
| | 50 |
| | 0.7 | % | |
| Specialty Petrochemicals Product Sales | | Specialty Petrochemicals Product Sales | $ | 167,054 | | | $ | 218,743 | | | $ | (51,689) | | | (23.6) | % |
| Processing | | Processing | 5,296 | | | 5,568 | | | (272) | | | (4.9) | % |
| Gross Revenue | $ | 249,679 |
|
| $ | 210,381 |
|
| $ | 39,298 |
| | 18.7 | % | Gross Revenue | $ | 172,350 | | | $ | 224,311 | | | $ | (51,961) | | | (23.2) | % |
| | | | | | | | | |
| Volume of specialty petrochemical sales (thousand gallons) | 89,644 |
| | 83,326 |
| | 6,318 |
| | 7.6 | % | |
| Volume of prime product sales (thousand gallons) | 69,403 |
| | 63,990 |
| | 5,413 |
| | 8.5 | % | |
| Volume of Sales (gallons) | | Volume of Sales (gallons) | |
| Specialty Petrochemicals Products | | Specialty Petrochemicals Products | 75,101 | | | 84,780 | | | (9,679) | | | (11.4) | % |
| Prime Products Sales | | Prime Products Sales | 61,650 | | | 68,099 | | | (6,449) | | | (9.5) | % |
| By-product Sales | | By-product Sales | 13,451 | | | 16,681 | | | (3,230) | | | (19.4) | % |
| | | | | | | | | |
| Cost of Sales | $ | 223,796 |
| | $ | 169,213 |
| | $ | 54,583 |
| | 32.3 | % | Cost of Sales | $ | 145,166 | | | $ | 184,666 | | | $ | (39,500) | | | (21.4) | % |
| Gross Margin | 10.4 | % | | 19.6 | % | | (9.2 | )% | | (46.9 | )% | Gross Margin | 15.8 | % | | 17.7 | % | | (1.9) | % | |
| Total Operating Expense* | 73,096 |
| | 58,740 |
| | 14,356 |
| | 24.4 | % | Total Operating Expense* | 70,224 | | | 72,206 | | | (1,982) | | | (2.7) | % |
| Natural Gas Expense* | 5,645 |
| | 4,912 |
| | 733 |
| | 14.9 | % | Natural Gas Expense* | 3,737 | | | 4,800 | | | (1,063) | | | (22.1) | % |
| Operating Labor Costs* | 18,040 |
| | 15,608 |
| | 2,432 |
| | 15.6 | % | Operating Labor Costs* | 16,138 | | | 14,222 | | | 1,916 | | | 13.5 | % |
| Transportation Costs* | 29,580 |
| | 25,282 |
| | 4,298 |
| | 17.0 | % | Transportation Costs* | 22,181 | | | 28,270 | | | (6,089) | | | (21.5) | % |
| General & Administrative Expense | 11,413 |
| | 10,243 |
| | 1,170 |
| | 11.4 | % | General & Administrative Expense | 10,618 | | | 10,650 | | | (32) | | | (0.3) | % |
| Depreciation** | 8,932 |
| | 6,310 |
| | 2,622 |
| | 41.6 | % | Depreciation** | 10,611 | | | 10,556 | | | 55 | | | 0.5 | % |
| | | | | | | | | |
| Capital Expenditures | $ | 22,431 |
| | $ | 37,569 |
| | $ | (15,138 | ) | | (40.3 | )% | Capital Expenditures | 11,334 | | | 6,955 | | | 4,379 | | | 63.0 | % |
*Included in cost of sales
**Includes $8,333$9,872 and $5,586$9,865 for 20182020 and 20172019 which is included in cost of sales and operating expenses
|
| | | | | | | | | | | | | | |
| | 2017 |
| | 2016 |
| | Change |
| | %Change |
|
| | (in thousands) | | |
| Specialty Petrochemical Product Sales | $ | 203,515 |
| | $ | 173,262 |
| | $ | 30,253 |
| | 17.5 | % |
| Processing Fees | 6,866 |
| | 8,766 |
| | (1,900 | ) | | (21.7 | )% |
| Gross Revenue | $ | 210,381 |
|
| $ | 182,028 |
|
| $ | 28,353 |
| | 15.6 | % |
| | | | | | | | |
| Volume of specialty petrochemical sales (thousand gallons) | 83,326 |
| | 76,372 |
| | 6,954 |
| | 9.1 | % |
| Volume of prime product sales (thousand gallons) | 63,990 |
| | 58,441 |
| | 5,549 |
| | 9.5 | ��% |
| | | | | | | | |
| Cost of Sales | $ | 169,213 |
| | $ | 146,159 |
| | $ | 23,054 |
| | 15.8 | % |
| Gross Margin | 19.6 | % | | 19.7 | % | | (0.1 | )% | | (0.5 | )% |
| Total Operating Expense* | 58,740 |
| | 58,536 |
| | 204 |
| | 0.3 | % |
| Natural Gas Expense* | 4,912 |
| | 3,301 |
| | 1,611 |
| | 48.8 | % |
| Operating Labor Costs* | 15,608 |
| | 16,094 |
| | (486 | ) | | (3.0 | )% |
| Transportation Costs* | 25,282 |
| | 24,138 |
| | 1,144 |
| | 4.7 | % |
| General & Administrative Expense | 10,243 |
| | 9,172 |
| | 1,071 |
| | 11.7 | % |
| Depreciation** | 6,310 |
| | 5,825 |
| | 485 |
| | 8.3 | % |
| | | | | | | | |
| Capital Expenditures | $ | 37,569 |
| | $ | 22,948 |
| | $ | 14,621 |
| | 63.7 | % |
*Included in cost of sales
**Includes $5,586 and $5,187 for 2017 and 2016 which is included in cost of sales and operating expenses
Gross Revenue
2017-2018
Revenues increasedGross revenue for the Specialty Petrochemicals segment decreased from 20172019 to 20182020 by approximately 18.7%23.2% due to an increasea decrease in specialty petrochemicalpetrochemicals sales volume and an increasea decrease in average selling prices. Decline in selling price was primarily attributable to lower feedstock costs in 2020 which impacts pricing for our formula customers.
2016-2017Specialty Petrochemicals Product Sales
Revenues increasedSpecialty petrochemicals product sales revenue decreased 23.6% from 20162019 to 2017 by approximately 15.6%2020 due to an increasea decrease in total sales volume of 9.1%11.4% and an increasea decrease in average selling price of 7.7% partially offset by a decrease5.3%. Much of the decline in processing fees of 21.7%.
Specialty Petrochemical Product Sales
2017-2018
Specialty petrochemical product sales increased 19.3% from 2017 to 2018volume was due to an increase in totallower demand due to the COVID-19 pandemic, primarily driven by lower sales volumeto polyethylene end-use markets as well as lower sales to Canadian oil sands customers. Sales to other end-use markets were also generally weaker compared to 2019. By-product sales volumes declined 19.4% as compared to 2019 primarily due to lower prime product production and sales. By-products are produced as a result of 7.6%prime product production and an increase in average selling price of 10.9%. their margins are significantly lower than margins for our prime products.
Our average selling price increased partlydecreased primarily because of higherlower feedstock costs. A large portion of our prime products sales are contracted with pricing formulas which are tied to prior month Natural Gasolinenatural gasoline prices which is our primary feedstock. Average delivered feedstock price for 20182020 was 21.1% higherapproximately 27% lower than 20172019 as Natural Gasolinenatural gasoline prices rosefell with crude oil prices for most of the year but then declined sharply in the fourth quarter. The increasefirst half of 2020, while partially offset by increases in average selling prices was also due to higher non-formula pricing for our prime products.the second half of 2020. Additionally, prices for byproductsby-products in 20182020 were about 24% higherlower than in 20172019 due to higherlower prices for the components in our byproductsby-products stream. This also contributed to higherlower overall selling prices. Byproduct prices fell significantly during the fourth quarter due to the Advanced Reformer outage and inability to upgrade byproducts. Additionally, in the fourth quarter byproduct prices fell faster than feedstock prices resulting in negative margins.
Prime product sales volume (total specialty petrochemical product sales volume less byproduct sales volume) increased 8.5% from 2017 to 2018 as demand was greater in all of our end-use markets and especially in the Canadian oil sands market. Sales to the Canadian oil sands market continues to be volatile. We believe the volatility in demand is primarily based on continued manufacturing efficiencies at customer sites and by the crude oil pricing environment. Margins on our specialty petrochemical products continued to be negatively impacted by shortfall fees that we incurred due to feedstock purchases below minimum amounts as prescribed by our agreement with suppliers. However the amount of the penalties in 2018 were significantly less than 2017.price.
Foreign sales volume accounted for approximately 25.5%23.6% of specialty petrochemicals sales volume and 27.6%approximately 25.4% of revenue for specialty petrochemicalpetrochemicals product sales during 20182020 as compared to 20.4%approximately 23.3% of volume and 23.3%approximately 23.4% of revenue for specialty petrochemicals product sales during 2017. The increase in foreign sales volume was
due to higher demand in the Canadian oils sands market.2019. Excluding oil sands, foreign sales volumes in 2018 grew2020 declined by 22%approximately 16% from 2017.
2016-2017
Specialty petrochemical product sales increased 17.5% from 2016 to 2017 due to an increase in total sales volume of 9.1% and an increase in average selling price of 7.7%. Our average selling price increased partly because a large portion of our sales are contracted with pricing formulas which are tied to prior month Natural Gasoline prices which is our primary feedstock. Average delivered feedstock price for 2017 was 17.8% higher than 2016. Additionally, prices for byproducts were about 17% higher than in 2016 which also contributed to higher overall selling prices. Prime product sales volume (total specialty petrochemical product sales volume less byproduct sales volume) increased 9.5% from 2016 to 20172019, primarily due to higherreduced customer demand across many of our end-use markets. Salesrelating to the Canadian oil sands market were down from 2016 due to the continued downturn in that market. Margins on our specialty petrochemical products continued to be negatively impacted by shortfall fees that we incurred due to feedstock purchases below minimum amounts as prescribed by our agreement with suppliers. The amountCOVID-19 pandemic.
Foreign sales volume accounted for approximately 20.4% of volume and 23.3% of revenue for specialty petrochemical product sales during 2017 as compared to 22.7% of volume and 26.3% of revenue during 2016. The decline in foreign sales volume was due to lower demand in the Canadian oils sands market. Excluding oil sands, foreign sales volumes in 2017 grew by 8.1% from 2016.
Processing Fees
2017-2018
Processing fee were approximately flat from 2017 to 2018.
2016-2017
Processing fees decreased 21.7%declined approximately 4.9% from 20162019 to 2017 primarily2020 due to a reduction in fees associated with a customer who reimbursed us for installation expenses plus a markup. We were successful in negotiating a contract extension with one of our processing customers whose contract was set to expire atreduced demand impacted by the end of 2017.COVID-19 pandemic.
Cost of Sales(includes but is not limited to raw materials, total operating expense, natural gas, operating labor and transportation)
2017-2018
Cost of Sales increased 32.3%decreased 21.4% from 20172019 to 20182020 due to higherlower raw material costs, higherlower operating expense and the increasedecrease in sales volume. Our average delivered feedstock cost per gallon increaseddecreased approximately 21% over 2017 and volume processed increased about 8%28%. We useOur feedstock is natural gasoline. The market price for natural gasoline as our feedstock which isdeclined 33% from 2019 to 2020 mostly tracking the heavier liquid remaining after ethane, propane and butanes are removed from liquids produced by natural gas wells. The material is a commodity productdecline in the oil/petrochemical markets and generally is readily available.crude oil price. The price of natural gasoline is wellhighly correlated with the price of crude oil. With the start up and stable operation of our Advanced Reformer unit we continue to convert the lower value components in our feed into higher value products, thereby allowing us to sell our byproducts at higher prices than would be realized without the Advanced Reformer unit.
2016-2017
Cost of Sales increased 15.8% from 2016 to 2017 primarily due to the increase in sales volume and higher raw material costs. Our average delivered feedstock cost per gallon increased 17.8% over 2016 and volume processed increased 10.0%. We use naturalNatural gasoline as feedstock which is the heavier liquid component remaining after ethane, propane and mixed butanes are removed from liquids produced by natural gas wells. The material is a commodity product in the oil/petrochemical markets and generally is readily available.
Total Operating Expense(includes but is not limited to natural gas, operating labor, depreciation, and transportation)
2017-2018
Total Operating Expense increased 24.4%decreased 2.7% from 20172019 to 2018 resulting in a $14.4 million increase 2017.2020 or approximately $2.0 million. The key driversdriver for the increase weredecrease was lower transportation costs operating labor and depreciation. Transportation costs increased due to higher sales volume, higher rail freight rates and other logistics costs. Operating labor costs were higher due to higher maintenance and contract labor costs primarily associated with the start-up of the Advanced Reformer unit, maintenance and repair costs associated with a toll processing unit and other maintenance activities. Approximately 12.8% of our labor costs were capitalized in 2018 primarily due to the construction of the Advanced Reformer unit; whereas, in 2017 approximately 28% was capitalized.
We implemented a reorganization and workforce reduction at our Silsbee, Texas facility which reduced the workforce by about 20% at the end of 2018. We expect to realize approximately $2.5 million in annual cost savings as a result of this action. We took a charge of approximately $0.4 million for severance related to this action.lower sales volume.
Natural gas expense increased 14.9%decreased approximately 22% from 20172019 to 20182020 due to an increasea decrease in the average per unit cost and volume consumed. Consumption was greaterlower than in 2017 both2019 primarily due to higherlower sales volume and inefficiencies related to the start-up and operation issues with the Advanced Reformer unit.volume. The average price per MMBTU for 20182020 was up about 3.8%down approximately 4% from 20172019 while volume consumed increaseddecreased to approximately 1,684,0001.5 MMBTU from about 1,509,000approximately 1.7 MMBTU.
2016-2017
Total Operating Expense increased 0.3% from 2016 to 2017. Natural gas, labor, and transportation are the largest individual expenses in this category; however, not all of these increased.
Natural gas expense increased 48.8% from 2016 to 2017 due toThese decreases were partially offset by an increase in the average per unit costoperating labor driven by bonus accruals and volume consumed.compensation increases.
Gross Margin
Gross margin decreased from 17.7% of gross revenue in 2019 to 15.8% of gross revenue in 2020. The average price per MMBTUdecrease in gross margin was driven by a decrease in margins for 2017 was $3.24 whereas, for 2016 the average per unit cost was $2.61. Volume consumed increased to approximately 1,509,000 MMBTU from about 1,294,000 MMBTU.
Labor costs declined 3.0% from 2016 to 2017 despite a 3.8% increase in headcount from year end 2016 to year end 2017. Approximately 19.9% of our labor costsboth prime products and by-products. Prime product margins were capitalized in 2017reduced due to lower feedstock costs and by-product margins were impacted by the construction of the Advanced Reformer unit; whereas,lower component prices and were partially offset by lower operating costs.
Capital Expenditures
Capital expenditures in 20162020 increased 63% or approximately 12.0% was capitalized.
Transportation costs were higher by 4.7%$4.4 million from 2019 primarily due to the increase in sales volume.
Generalmaintenance and Administrative Expense
2017-2018
General and Administrative costs increased 11.4% from 2017 to 2018 primarily due to restructuring and severance costs in 2018. There were no restructuring and severance expenses in 2017.
2016-2017
General and Administrative costs increased 11.7% from 2016 to 2017 primarily due to an increase in property taxes because of the expiration of abatements. Group insurance and administrative labor costs also increased.
Depreciation
2017-2018
Depreciation expense increased 41.6% or approximately $2.6 million from 2017 to 2018 primarily due to the start-up of the Advanced Reformer unit and the resulting increaseupkeep of our depreciable base.
2016-2017
Depreciation expense increased 8.3% from 2016GSPL pipeline which is used to 2017 primarily due to 2016 capital expenditures increasingtransport our depreciable base.
Capital Expenditures
2017-2018
Capital expenditures in 2018 declined $15.1 million from 2017 mostly due to the completion of the Advanced Reformer unit. See discussion under "Capital Resources and Requirements" below for more detail.
2016-2017
Capital expenditures increased 63.7% from 2016 to 2017. See discussion under "Capital Resources and Requirements" below for more detail.
feedstock.
Specialty WaxWaxes Segment
|
| | | | | | | | | | | | | | |
| | 2018 |
| | 2017 |
| | Change |
| | %Change |
|
| | (thousands of dollars) |
| Product Sales | $ | 27,017 |
| | $ | 23,819 |
| | $ | 3,198 |
| | 13.4 | % |
| Processing Fees | 11,236 |
| | 10,943 |
| | 293 |
| | 2.7 | % |
| Gross Revenue | $ | 38,253 |
|
| $ | 34,762 |
|
| $ | 3,491 |
| | 10.0 | % |
| | | | | | | | |
| Volume of wax sales (thousand pounds) | 37,264 |
| | 35,393 |
| | 1,871 |
| | 5.3 | % |
| | | | | | | | |
| Cost of Sales | 36,318 |
| | 34,369 |
| | 1,949 |
| | 5.7 | % |
| Gross Margin | 5.1 | % | | 1.1 | % | | 4.0 | % | | 363.6 | % |
| General & Administrative Expense | 5,053 |
| | 4,931 |
| | 122 |
| | 2.5 | % |
| Depreciation and Amortization* | 5,376 |
| | 4,589 |
| | 787 |
| | 17.1 | % |
| Capital Expenditures | $ | 2,854 |
| | $ | 14,015 |
| | $ | (11,161 | ) | | (79.6 | )% |
| | | | | | | | | | | | | | | | | | | | | | | |
| 2020 | | 2019 | | Change | | % Change |
| (thousands of dollars) |
| Product Sales | $ | 25,321 | | | $ | 24,571 | | | $ | 750 | | | 3.1 | % |
| Processing | 10,955 | | | 10,078 | | | 877 | | | 8.7 | % |
| Gross Revenue | $ | 36,276 | | | $ | 34,649 | | | $ | 1,627 | | | 4.7 | % |
| | | | | | | |
| Volume of specialty waxes sales (pounds) | 36,387 | | | 34,369 | | | 2,018 | | | 5.9 | % |
| | | | | | | |
| Cost of Sales | $ | 34,782 | | | $ | 35,778 | | | $ | (996) | | | (2.8) | % |
| Gross Margin (Loss) | 4.1 | % | | (3.3) | % | | 7.4 | % | | |
| General & Administrative Expense* | 5,160 | | | 4,546 | | | 614 | | | 13.5 | % |
| Impairment of Goodwill and Certain Intangibles | — | | | 24,152 | | | (24,152) | | | (100.0) | % |
| Depreciation and Amortization** | 5,522 | | | 5,593 | | | (71) | | | (1.3) | % |
| Capital Expenditures | 1,995 | | | 3,124 | | | (1,129) | | | (36.1) | % |
*Excludes impairment of goodwill and certain intangibles
**Includes $5,285$5,428 and $4,503$5,497 for 20172020 and 2016,2019, respectively, which is included in cost of sales
|
| | | | | | | | | | | | | | |
| | 2017 |
| | 2016 |
| | Change |
| | %Change |
|
| | (thousands of dollars) |
| Product Sales | $ | 23,819 |
| | $ | 20,319 |
| | $ | 3,500 |
| | 17.2 | % |
| Processing Fees | 10,943 |
| | 10,052 |
| | 891 |
| | 8.9 | % |
| Gross Revenue | $ | 34,762 |
|
| $ | 30,371 |
|
| $ | 4,391 |
| | 14.5 | % |
| | | | | | | | |
| Volume of wax sales (thousand pounds) | 35,393 |
| | 33,891 |
| | 1,502 |
| | 4.4 | % |
| | | | | | | | |
| Cost of Sales | 34,369 |
| | 26,338 |
| | 8,031 |
| | 30.5 | % |
| Gross Margin | 1.1 | % | | 13.3 | % | | (12.2 | )% | | (91.5 | )% |
| General & Administrative Expense | 4,931 |
| | 4,818 |
| | 113 |
| | 2.3 | % |
| Depreciation and Amortization* | 4,589 |
| | 3,908 |
| | 681 |
| | 17.4 | % |
| Capital Expenditures | $ | 14,015 |
| | $ | 17,547 |
| | $ | (3,532 | ) | | (20.1 | )% |
Product Sales
2017-2018
Product sales revenue increased 13.4%3.1% and product sales volume increased 5.3%5.9% from 20172019 to 2018 primarily2020. The increase in revenues was due to higher on-purpose PEan increase in wax sales which benefited from continued growth in growth infeed supply as compared to 2019, where wax feed supply disruptions were impacted due to operating issues at our high value waxes.wax feed suppliers. Polyethylene wax sales saw volume increases of 3.5%8.7% and revenue from polyethylene wax increased approximately 15.4%5.9% both as a result of greaterhigher sales volume and a higher value sales mix. While product revenues and volumes increased in 2020 compared to 2019, customer demand for our specialty wax products was negatively impacted due to the COVID-19 pandemic. Average wax sales price was approximately 9% higherremained relatively flat in 20182020 compared to 2017.
2016-2017
Product sales revenue increased 17.2% and product sales volume increased 4.4% from 2016 to 2017 primarily due to on-purpose PE wax sales which we were distributing in Latin America for a third party as well as, significant growth in our high value waxes. Polyethylene wax sales saw volume increases of 1.3% and revenue increases of 12.8%. 2019.
Processing Fees
2017-2018
Processing fees increased 2.7%8.7% from 20172019 to 20182020 primarily due to greaterhigher revenues from hydrogenation/distillation unit. Growth in custom processing revenue in 2018 continued to be hampered by operational and reliability issues especially related to the hydrogenation/distillation unit which started upprimarily in the second halffirst quarter of 2017.
2016-2017
Processing fees increased 8.9% from 2016 to 2017 primarily due2020. Subsequent to the addition of new customers and an increase in existingfirst quarter, processing fees were significantly impacted by reduced customer volumes. Growth was limiteddemand for custom processing services driven by significant operational issues in existing equipment and in the new hydrogenation/distillation unit.COVID-19 pandemic.
Cost of Sales
2017-2018
Cost of Sales increased 5.7%decreased approximately $1.0 million, or 2.8%, from 20172019 to 2018 due to increases in labor, maintenance, utilities and depreciation which were partially offset2020. This decrease was driven by lower polyethylene wax material costs. Labor increased approximately due to increased overtime and the addition of personnel to support the new hydrogenation/distillation unit which came on line in 2017 as well as to support other custom processing projects. Maintenance costs increased primarily as a result of the start-up of hydrogenation/distillation and the related operating issues in 2018. Utility costs increased mainly due to greater consumption.
2016-2017
Cost of Sales increased 30.5% from 2016 to 2017 due to increases in material cost, labor, freight, equipment maintenance, and natural gas utilities. Material cost increased primarily due to material costs associated with the on-purpose PE wax sales we distributed into Latin America for a third party. Labor increased due to increased overtime and the addition of personnel to operate the new hydrogenation/distillation unit when it came online in 2017. Freight increased due to the increase in shipments and a change in our shipping terms. We now ship most products with destination terms. Equipment maintenance increased primarily due to the addition of B Plant and the introduction of new custom processing projects. Natural gas utilities increased due to an increase in the per unitfeed cost and in volume consumed because of B Plant and the new hydrogenation/distillation unit.reduced operating expenses.
General and Administrative Expense
2017-2018
General and Administrative costs increased 2.5%13.5% from 20172019 to 2018.
2016-2017
General2020 driven by bonus accruals and Administrative costs increased 2.3% from 2016 to 2017 primarily due to an increase in sales personnel, property taxes, and property insurance due to the addition of B Plant.
Depreciation and Amortization
2017-2018
Depreciation and amortization increased 17.1% from 2017 to 2018 primarily due to start up of the hydrogenation/distillation project in the second half of 2017.
2016-2017
Depreciation and amortization increased 17.4% from 2016 to 2017 primarily due to the addition of B Plant and the hydrogenation/distillation project coming online in 2017.costs.
Capital Expenditures
2017-2018
Capital expenditures decreased from approximately $14.0$3.1 million to $2.9$2.0 million or 79.6%36.1% from 20172019 to 20182020, primarily duedriven by purchases of new equipment to facilitate a new customer in 2019 which was not repeated in 2020. The purchase of this specific new equipment in 2019 and 2020 was reimbursed to the completionCompany and will be recognized as an offset to depreciation expense over the useful life of the hydrogenation/distillation project in 2017.
2016-2017
Capital expenditures decreased 20.1% from 2016 to 2017 primarily due to the completion of the hydrogenation/distillation project in 2017.equipment.
Corporate Segment
|
| | | | | | | | | | | | | | |
| | 2018 |
| | 2017 |
| | Change |
| | %Change |
|
| | (in thousands) | | |
| General & Administrative Expense | $ | 8,275 |
| | $ | 7,413 |
| | $ | 862 |
| | 11.6 | % |
| Depreciation | 50 |
| | 62 |
| | $ | (12 | ) | | (19.4 | )% |
| Equity in losses of AMAK | 901 |
| | 4,261 |
| | $ | (3,360 | ) | | (78.9 | )% |
|
| | | | | | | | | | | | | | |
| | 2017 |
| | 2016 |
| | Change |
| | %Change |
|
| | (in thousands) | | |
| General & Administrative Expense | $ | 7,413 |
| | $ | 6,445 |
| | $ | 968 |
| | 15.0 | % |
| Depreciation | 62 |
| | 43 |
| | $ | 19 |
| | 44.2 | % |
| Equity in losses of AMAK | 4,261 |
| | 1,479 |
| | $ | 2,782 |
| | 188.1 | % |
| Gain from additional equity issuance by AMAK | — |
| | (3,168 | ) | | $ | 3,168 |
| | (100.0 | )% |
General and Administrative Expenses
2017-2018 | | | | | | | | | | | | | | | | | | | | | | | |
| 2020 | | 2019 | | Change | | %Change |
| (in thousands) | | |
| General & Administrative Expense | $ | 9,125 | | | $ | 9,190 | | | $ | (65) | | | (0.7) | % |
General corporate expenses increasedwere relatively flat from 20172019 to 2018 primarily due to restructuring and severance expenses, offset by the cancellation and reversal of stock compensation expense and other post retirement benefits awarded to Mr. Hatem El Khalidi. See Note 14 for further discussion.
2016-2017
General corporate expenses increased from 2016 to 2017 primarily due to an increase in officer compensation, accounting fees, and legal fees. Officer compensation increased in 2017 due to the addition of an officer in late 2016 and and an accrual for executive bonuses. Accounting and legal fees increased due to additional time required for restatements issues and other matters.
Equity in Losses of AMAK/Gain on Equity Issuance of AMAK
2017-2018
Equity in Losses of AMAK decreased 78.9% from 2017 to 2018 due to a number of reasons as discussed below.
The mine was fully operational in 2018 as compared to operating on an improving basis throughout 2017. In 2017 costs were increased as the mine was not operating at full capacity. Metal prices remained strong in 2018.
Shipments increased 105% from 2017 to 2018 as indicated in the table below. AMAK volumes in dry metric tons (dmt) for 2018 and 2017 were as follows:
|
| | | | | | | | |
| | 2018 |
| | 2017 |
| | Variance |
|
| Ore tons processed | 699,885 |
| | 385,495 |
| | 314,390 |
|
| Concentrate to the port | | | | | |
| Copper | 26,070 |
| | 15,326 |
| | 10,744 |
|
| Zinc | 31,989 |
| | 16,606 |
| | 15,383 |
|
| | 58,059 |
|
| 31,932 |
|
| 26,127 |
|
| | | | | | |
| Shipments | | | | | |
| Copper | 26,286 |
| | 13,940 |
| | 12,346 |
|
| Zinc | 31,272 |
| | 14,080 |
| | 17,192 |
|
| | 57,558 |
|
| 28,020 |
|
| 29,538 |
|
2016-2017
Equity in Losses of AMAK increased 188.1% from 2016 to 2017 due to a number of reasons as discussed below.
The mine operated on an improving basis throughout 2017 while operations were closed for almost all of 2016. However, in 2017 because the mine was not operating at full capacity but was working toward that goal, costs increased. Also, 2016 was positively affected by the settlement from certain liabilities. Metal prices were strong in 2017 with zinc prices hitting a ten year high during the year. There were no unusual items in 2017.
Capital Resources and Requirements
2017-2018
Capital expenditures decreased 58% from 2017 to 2018. The majority of the decrease was due to completion of the Advanced Reformer unit. During 2018 we expended approximately $14.9 million to complete the Advanced Reformer unit which includes $1 million insurance deductible related to the February 2018 fire and $3 million for the catalyst replacement in December 2018, $1.3 million for a rail spur addition and $0.5 million for a truck loading rack.
2016-2017
Capital expenditures increased 27.4% from 2016 to 2017. The majority of the increase was due to the construction projects for the hydrogenation/distillation unit and the Advanced Reformer unit. During 2017 we expended $10.8 million on the hydrogenation/distillation project, $0.9 million to upgrade B Plant, $32.5 million to construct the Advanced Reformer unit, $1.9 million for railspur addition, $1.0 million for additional tankage and upgrades to existing tankage, $0.9 million for transport trucks, and $3.7 million on various plant improvements and equipment.
At December 31, 2018, there was approximately $18 million available on the Company's line of credit. We believe that operating cash flows along with credit availability will be sufficient to finance our 2019 operations and capital expenditures.
The table below summarizes the following contractual obligations of the Company:
|
| | | | | | | | | | | | | | | | | | | |
| | Payments due by period |
| Contractual Obligations | Total |
| | Less than 1 year |
| | 1-3 years |
| | 3-5 years |
| | More than 5 years |
|
| | (thousands of dollars) |
| Operating Lease Obligations | $ | 18,131 |
| | $ | 3,670 |
| | $ | 7,001 |
| | $ | 5,395 |
| | $ | 2,065 |
|
| Purchase Obligations | 124 |
| | 124 |
| | — |
| | — |
| | — |
|
| Long-Term Debt Obligations | 103,312 |
| | 4,375 |
| | 98,937 |
| | — |
| | — |
|
| Total | $ | 121,567 |
|
| $ | 8,169 |
|
| $ | 105,938 |
|
| $ | 5,395 |
|
| $ | 2,065 |
|
The majority of our operating lease obligations are for railcars as discussed in Note 14 of the Notes to Consolidated Financial Statements. Purchase obligations are primarily related to commitments for our capital construction projects. The anticipated source of funds for payments due within three years that relate to contractual obligations is from a combination of continuing operations supplemented with borrowings under our credit facility.
Impact of Inflation
Our results of operations and financial condition are presented based on historical cost. While it is difficult to accurately measure the impact of inflation, we do not believe the overall effects of inflation, if any, on our results of operations and financial condition have been material.2020.
Investment in AMAK - Discontinued Operations
| | | | | | | | | | | | | | | | | | | | | | | |
| 2020 | | 2019 | | Change | | %Change |
| (in thousands) | | |
| Equity in earnings (losses) of AMAK | $ | 702 | | | $ | (986) | | | $ | 1,688 | | | 171.2 | % |
Information concerning our investment in AMAK is set forth in Note 10 of the Notes6 to Consolidated Financial Statements.
NewRecently Adopted Accounting StandardsPronouncements
In May 2014 theEffective January 1, 2020, we adopted Financial Accounting StandardsStandard Board ("FASB"(“FASB”) issued Accounting Standards Update ("ASU"(“ASU”) 2014-9, Revenue from Contracts with Customers ("ASU 2014-9"). ASU 2014-9 supersedes2016-13, Measurement of Credit Losses on Financial Instruments, which changed the revenueway entities recognize impairment of most financial assets. Short-term and long-term financial assets, as defined by the standard, are impacted by immediate recognition requirements of FASB Accounting Standards Codification ("ASC") Topic 605, Revenue Recognition and most industry-specific guidance throughout the Accounting Standards Codification, resultingestimated credit losses in the creation of FASB ASC Topic 606, Revenue from Contracts with Customers. ASU 2014-9 requires entities to recognize revenue in a way that depictsfinancial statements, reflecting the transfer of promised goods or services to customers in annet amount that reflects the consideration to which the entity expectsexpected to be entitled to in exchange for those goods or services. This ASU provides alternative methods of retrospective adoption and is effective for fiscal years, and interim periods within those years, beginning after December 15, 2017.collected. The Company completed its assessment of the impact of the adoption of ASU 2014-9 across all revenue streams. This included reviewing current accounting policies and practices to identify potential differences that would result from applying the requirements under the new standard. We completed contract reviews and validated results of applying the new revenue guidance (Note 2). See Revenue Recognition policy note.this standard did not have a material impact on our Consolidated Financial Statements.
Recent Accounting Pronouncements Not Yet Adopted
In February 2016,December 2019, the FASB issued ASU No. 2016-02, Leases2019-12, Income Taxes (Topic 842).740): Simplifying the Accounting for Income Taxes (ASU 2019-12), which simplifies the accounting for income taxes. This updateguidance will increase transparency and comparability among organizations by recognizing lease assets and lease liabilities on the balance sheet and disclosing key information about leasing arrangements. This update isbe effective for annualus in the first quarter of 2021 on a prospective basis, and interim reporting periods beginning after December 15, 2018, including interim periods within those fiscal years. Earlyearly adoption is permitted. The Company does not expect that the adoption of this guidance will have a material impact on our Consolidated Financial Statements.
In July 2018,March 2020, the FASB issued ASU No. 2018-11, Targeted Improvements to ASC 842, Leases. ASU 2018-11 provided entities with an alternative modified transition method to elect not to recast2020–04, Reference Rate Reform (Topic 848): Facilitation of the comparative periods presented when adopting ASC 842. The new standard provides a numberEffects of optional practical expedients in transition. The Company expects to elect: (1) the ‘package of practical expedients’Reference Rate Reform on Financial Reporting (ASU 2020-04), which permits it notprovides guidance to reassess underalleviate the new standard its prior conclusions about lease identification, lease classification,burden in accounting for reference rate reform by allowing certain expedients and initial direct costsexceptions in applying generally accepted accounting principles to contracts, hedging relationships, and (2) the use-of-hindsight. In addition, the new standard provides practical expedients for an entity’s ongoing accountingother transactions impacted by reference rate reform. The provisions of ASU 2020-04
apply only to those transactions that the Company anticipates making, such as the (1) the election for certain classes of underlying assetreference LIBOR or another reference rate expected to not separate non-lease componentsbe discontinued due to reference rate reform. This guidance is effective from lease componentsMarch 12, 2020 through December 31, 2022 and (2) the election for short-term lease recognition
exemption for all leases that qualify. The Company will adopt ASU 842 as of January 1, 2019, using the alternative modified transition method. In preparation of adopting ASC 842, the Companyadoption is implementing additional internal controls to enable future preparation of financial information in accordance with ASC 842. The Company has also substantially completed its evaluation ofoptional. We are currently evaluating the impact on the Company’s lease portfolio. The Company believes the largest impact will be on the consolidated balance sheets for the accounting of facilities-related leases, which represents a majority of its operating leases it has entered into as a lessee. These leases will be recognized under the new standard as right of use assets (“ROU”) operating lease liabilities. The Company will also be required to provide expanded disclosures for its leasing arrangements. As of December 31, 2018, the Company had approximately $18.1 million of undiscounted future minimum operating lease commitments that are not recognized on its consolidated balance sheets as determined under the current standard. For a lessee, the results of operations are not expected to significantly change after adoption of the new standard. While substantially complete, the Company is still in the process of finalizing its evaluation of the effect of ASU 8422020-04 on the Company’s financial statements and disclosures, including the determination of the Company’s incremental borrowing rate for each of the operating leases to estimate the interest rate we would have to pay to borrow on a collateralized basis over a similar term for an amount equal to the lease payments. The Company will finalize its accounting assessment and quantitative impact of the adoption during the first quarter of fiscal year 2019.our Consolidated Financial Statements.
In January 2017 the FASB issued ASU No. 2017-4, Intangibles – Goodwill and Other (Topic 350). The amendments in ASU 2017-4 simplify the measurement of goodwill by eliminating Step 2 from the goodwill impairment test. Instead, under these amendments, an entity should perform its annual, or interim, goodwill impairment test by comparing the fair value of a reporting unit with its carrying amount. An entity should recognize an impairment charge for the amount by which the carrying amount exceeds the reporting unit's fair value; however, the loss should not exceed the total amount of goodwill allocated to that reporting unit. The amendments are effective for public business entities for the first interim and annual reporting periods beginning after December 15, 2019. Early adoption is permitted for interim or annual goodwill impairment tests performed on testing dates after January 1, 2017.The amendments also eliminate the requirements for any reporting unit with a zero or negative carrying amount to perform a qualitative assessment and, if it fails that qualitative test, to perform Step 2 of the goodwill impairment test. An entity still has the option to perform the qualitative assessment for a reporting unit to determine if the quantitative impairment test is necessary. The Company has goodwill from prior business combination and performs an annual impairment test or more frequently if changes or circumstances occur that would more-likely-than-not reduce the fair value of the reporting unit below its carrying value. During the year ended December 31, 2018, the Company performed its impairment assessment and determined the fair value of the aggregated reporting units exceed the carrying value, such that the Company's goodwill was not considered impaired. Although the Company cannot anticipate future goodwill impairment assessments, based on the most recent assessment, it is unlikely that an impairment amount would need to be calculated and, therefore, the Company does not anticipate a material impact from these amendments to the Company's financial position and results of operations. The current accounting policies and processes are not anticipated to change, except for the elimination of the Step 2 analysis.
In February 2018 the FASB issued ASU No. 2018-2, Income Statement — Reporting Comprehensive Income (Topic 220): Reclassification of Certain Tax Effects from Accumulated Other Comprehensive Income. ASU 2018-2 was issued to address the income tax accounting treatment of the stranded tax effects within other comprehensive income due to the prohibition of backward tracing due to an income tax rate change that was initially recorded in other comprehensive income due to the enactment of the Tax Cuts and Jobs Act (TCJA) on December 22, 2017, which changed the Company's income tax rate from 35% to 21%. The amendments to the ASU changed US GAAP whereby an entity may elect to reclassify the stranded tax effect from accumulated other comprehensive income to retained earnings. The amendments of the ASU may be adopted in total or in part using a full retrospective or modified retrospective method. The amendments of the ASU are effective for periods beginning after December 15, 2018. The Company believes there will be no material impact to the consolidated financial statements as a result of this update.
In June 2018, the FASB issued ASU No. 2018–07, Improvements to Nonemployee Share–Based Payment Accounting. ASU 2018–07 simplifies the accounting for share–based payments to nonemployees by aligning it with the accounting for share–based payments to employees, with certain exceptions. The amendments in this ASU are effective for public companies for fiscal years beginning after December 15, 2018, including interim periods within that fiscal year. The Company is assessing the effect of ASU 2018–02 on its consolidated financial statements.
Critical Accounting Policies
Our consolidated financial statementsConsolidated Financial Statements are based on the selection and application of significant accounting policies. The preparation of consolidated financial statementsConsolidated Financial Statements in conformity with GAAP requires management to make estimates and assumptions that affect the reported amounts of assets and liabilities and the reported amounts of net sales, expenses and allocated charges during the reported period. Actual results could differ from those estimates. However, we are not currently aware of any reasonably likely events or circumstances that would result in materially different results.
We believe the following accounting policies and estimates are critical to understanding the financial reporting risks present currently. These matters, and the judgments and uncertainties affecting them, are essential to understanding our reported results. See Note 2 to the Notes to the Consolidated Financial Statements for further information.
Discontinued Operations
Assets that are sold or classified as held for sale are classified as discontinued operations provided that the disposal represents a strategic shift that has (or will have) a major effect on our operations and financial results (e.g., a disposal of a major geographical area, a major line of business, a major equity method investment or other major parts of an entity).
Inventories
FinishedFor SHR, finished products and feedstock are recorded at the lower of cost, determined on the first-in, first-out method ("FIFO"(“FIFO”);, or market for SHR.market. For TC, inventory is recorded at the lower of cost or market as follows: (1) raw material cost is calculated using the weighted-average cost method and (2) product inventory cost is calculated using the specific cost method. See Note 7 to the Notes5 to the Consolidated Financial Statements for more information.
Beginning January 1, 2017, due to expansion of our plant assets at SHR and TC, we began inventorying spare parts for the repair and maintenance of our plant, pipeline and equipment.
Revenue recognition
The Company adopted Financial Accounting Standards Board ("FASB") Accounting Standards Codification ("ASC") Topic 606 ("ASC 606"), Revenue from Contracts with Customers, and its amendmentswith a date of the initial application of January 1, 2018. As a result, the Company has changed its accounting policy for revenue recognition as detailed below. ASC 606 outlines a single comprehensive model for an entity to use in accounting for revenue arising from all contracts with customers, except where revenues are in scope of another accounting standard. ASC 606 superseded the revenue recognition requirements in ASC Topic 605, "Revenue Recognition", and most industry specific guidance. ASC Topic 606 sets forth a five-step model for determining when and how revenue is recognized. Under the model, an entity is required to recognize revenue to depict the transfer of goods or services to a customer at an amount reflecting the consideration it expects to receive in exchange for those goods and services. ASC 606 also requires certain additional revenue-related disclosures.
The Company applied the modified retrospective approach under ASC 606 which allows for the cumulative effect of adopting the new guidance on the date of initial application. Use of the modified retrospective approach means the Company's comparative periods prior to initial application are not restated. The initial application was applied to all contracts at the date of the initial application. The Company has determined that the adjustments using the modified retrospective approach did not have a material impact on the date of the initial application along with the disclosure of the effect on prior periods.
Accounting Policy
Beginning on January 1, 2018, revenueRevenue is measured based on a consideration specified in a contract with a customer. The Company recognizes revenue when it satisfies a performance obligation by transferring control over a product or service to a customer. In evaluating when a customer has control of the asset we primarily consider whether the transfer of legal title and physical delivery has occurred, whether the customer has significant risks and rewards of ownership, and whether the customer has accepted delivery and a right to payment exists. Taxes assessed by a governmental authority that are both imposed on and concurrent with a specific revenue-producing transaction, that are collected by the Company from a customer, are excluded from revenue. Shipping and handling costs associated with outbound freight after control over a product has transferred to a customer are accounted for as a fulfillment cost and are included in cost of product sales and processing. The Company does not offer material rights of return or service-type warranties.
For 2017 the Company recognized revenue according to FASB ASC Topic 605 ("ASC 605"), "Revenue Recognition", when: (1) the customer accepted delivery of the product and title had been transferred or when the service was performed and the Company had no significant obligations remaining to be performed; (2) a final understanding as to specific nature and terms of the agreed upon transaction had occurred; (3) price was fixed and determinable; and (4) collection was assured. Product sales generally met these criteria, and revenue was recognized, when the product was delivered or title was transferred to the customer. Sales revenue was presented net of discounts, allowances, and sales taxes. Freight costs billed to customers were recorded as a component of revenue. Revenues received in advance of future sales of products or prior to the performance of services were presented as deferred revenues. Shipping and handling costs were classified as cost of product sales and processing and were expensed as incurred.
Nature of goods and services
The following is a description of principal activities – separated by reportable segments – from which the Company generates its revenue. For more detailed information about reportable segments, disaggregation of revenues, and contract balance disclosures, see Note 17.
17 to the Consolidated Financial Statements.
Specialty petrochemical segmentPetrochemicals Segment
The specialty petrochemicalSpecialty Petrochemicals segment of the Company produces eight high purity hydrocarbons and other petroleum based products including isopentane, normal pentane, isohexane and hexane. These products are used in the production of polyethylene, packaging,
polypropylene, expandable polystyrene, poly-iso/urethane foams, crude oil from the Canadian tar sands, and in the catalyst support industry. SHR's specialty petrochemicalSHR’s Specialty Petrochemicals products are typically transported to customers by rail car, tank truck, iso-container and ship.
Product Sales - The Company sells individual (distinct) products to its customers on a stand-alone basis (point-of-sale) without any further integration. There is no significant modification of any one or more products sold to fulfill another promised product or service within any of the Company'sCompany’s product sale transactions. The amount of consideration received for product sales is stated within the executed invoice with the customer. Payment for prime product sales is typically due and collected 30 to 60 days subsequent to point of sale.
Processing Fees - The Company'sCompany’s services consist of processing customer supplied feedstocks into custom products including, if requested, services for forming, packaging, and arranging shipping. Pursuant to Tolling Agreementstolling agreements the customer retains title to the feedstocks and processed products. The performance obligation in each Tolling Agreementtolling agreement transaction is the processing of customer provided feedstocks into custom products and is satisfied over time. The amount of consideration received for product
sales is stated within the executed invoice with the customer. Payment is typically due and collected within 30 days subsequent to point of sale.
Specialty Wax segmentWaxes Segment
The specialty waxSpecialty Waxes segment of the Company manufactures and sells specialty polyethylene and poly alpha olefin waxes and also provides custom processing services for customers.
Product Sales - The Company sells individual (distinct) products to its customers on a stand-alone basis (point-of-sale) without any further integration. There is no significant modification of any one or more products sold to fulfill another promised product or service within any of the Company'sCompany’s product sale transactions. The amount of consideration received for product sales is stated within the executed invoice with the customer. Payment is typically due and collected within 30 days subsequent to point of sale.
Processing Fees - The Company'sCompany’s promised services consist of processing customer supplied feedstocks into custom products including, if requested, services for forming, packaging, and arranging shipping. Pursuant to Tolling Agreementstolling agreements and Purchase Order Arrangements,purchase order arrangements, the customer typically retains title to the feedstocks and processed products. The performance obligation in each Tolling Agreementtolling agreement transaction and Purchase Order Arrangementpurchase order arrangement is the processing of customer provided feedstocks into custom products and is satisfied over time. The amount of consideration received for product sales is stated within the executed invoice with the customer. Payment is typically due and collected within 30 days subsequent to point of sale.
Long-lived Assets
Long-lived assets are reviewed for impairment whenever events or changes in circumstances indicate that the carrying amount may not be recoverable from estimated future undiscounted cash flows. If the estimated future undiscounted cash flows are less than the carrying value of the assets, we calculate the amount of impairment if the carrying value of the long-lived assets exceeds the fair value of the assets. Our long-lived assets include our specialty petrochemicalpetrochemicals facility and our specialty synthetic waxwaxes facility.
Our specialty petrochemicalpetrochemicals facility and specialty synthetic waxwaxes facility are currently our revenue generating assets. The facilities were in full operation at December 31, 2018.2020.
Goodwill and other intangible assets
Goodwill and indefinite-lived intangible assets are tested for impairment at least annually; however, these tests are performed more frequently when events or changes in circumstances indicate that the asset may be impaired. Impairment exists when carrying value exceeds fair value.
Definite-lived intangible assets are being amortized using discounted estimated future cash flows over the term of the related agreements. We continually evaluate the reasonableness of the useful lives of these assets. Once these assets are fully amortized, they will be removed from the consolidated balance sheets.
See Note 9 to the Notes10 to the Consolidated Financial Statements for additional information.
Investment in AMAK (Held-for-Sale)
We accountPrior to the completion of the sale of our ownership interest in AMAK, we accounted for our investment in AMAK using the equity method of accounting under which we recordrecorded in income our share of AMAK'sAMAK’s income or loss for each period. The amount recorded iswas also adjusted to reflect the amortization of certain differences between the basis in our investment in AMAK and our share of the net assets of AMAK as reflected in AMAK'sAMAK’s financial statements. Any proceeds received from or payments made to AMAK arewere recorded as decreases or increases in the balance of our investment. See Note 10 to the Notes6 to the Consolidated Financial Statements.
We assess our investment in AMAK for impairment when events are identified, or there are changes in circumstances that may have an adverse effect on the fair value of the investment. We consider recoverable ore reserves and the amount and timing of the cash flows to be generated by the production of those reserves, as well as, recent equity transactions within AMAK. Factors which
may affect carrying value include, but are not limited to, mineral prices, capital cost estimates, equity transactions, the estimated operating costs of any mines and related processing, ore grade and related metallurgical characteristics, the design of any mines and the timing of any mineral production. There are no assurances that we will not be required to take a material write-down of any of our mineral properties.
Environmental Liabilities
Our operations are subject to the rules and regulations of the TCEQ which inspects the facilities at various times for possible violations relating to air, water and industrial solid waste requirements. As noted in Item 1. Business, evidence of groundwater contamination was discovered at SHR in 1993. The recovery process, initiated in 1998, is proceeding as planned and is expected to continue for many years. See Note 14 to the Notes to the Consolidated Financial Statements.
Share-Based Compensation
We expense the cost of director and employee services received in exchange for an award of equity instruments based on the grant date fair value of such instruments. For options we use the Black-Sholes model to calculate the fair value of the equity instrument on the grant date. See Note 15 to the Notes to the Consolidated Financial Statements.
Off Balance Sheet Arrangements
Off balance sheet arrangements as defined by the SEC means any transaction, agreement or other contractual arrangement to which an entity unconsolidated with the registrant is a party, under which the registrant has (i) obligations under certain guarantees or contracts, (ii) retained or contingent interest in assets transferred to an unconsolidated entity or similar arrangements, (iii) obligations under certain derivative arrangements, and (iv) obligations arising outIncome Taxes
In determiningWe record deferred tax assets and liabilities to account for the expected future tax consequences of events that have been recognized in our incomefinancial statements and our tax provision, wereturns. We routinely assess the likelihood our deferred tax assets will be recovered through future taxable income. Based on this assessment,and reduce such assets by a valuation allowance against all or a portion of our deferred tax asset that will,if we deem it is more likely than not that some portion, or all, of the deferred tax assets will not be realized. If these estimates, assumptions, or actual resultsIn assessing the need for adjustments to existing valuation allowances, we consider all available positive and negative evidence.
We regularly assess and, if required, establish accruals for uncertain tax positions that could result from assessments of operations change in the future,additional tax by taxing jurisdictions where we may reverse the valuation allowance against deferredoperate. We recognize a tax assets. Incomebenefit from an uncertain tax liabilities are determined based on judgment and estimates assumingposition when it is more likely than not that the position will be sustained upon examination, bybased on the technical merits of the position. These accruals for uncertain tax positions are subject to a taxing authority.significant amount of judgment and are reviewed and adjusted on a periodic basis in light of changing facts and circumstances considering the progress of ongoing tax audits, court proceedings, changes in applicable tax laws, including tax case rulings and legislative guidance, or expiration of the applicable statute of limitations. See Note 16 to the Notes to the Consolidated Financial Statements.
On December 22, 2017, Public Law No. 115-97, also known as, the Tax Cuts and Jobs Act ("TCJA") was enacted. The TCJA included a number of changes to existing U.S. tax laws that impacted the Company, most notably a reduction of the U.S. federal corporate income tax rate from a maximum of 35% to a flat 21% for tax years effective January 1, 2018. The TCJA also implemented a territorial tax system, provided for a one-time deemed repatriation tax on unrepatriated foreign earnings, eliminated the alternative minimum tax ("AMT"), making AMT credit carryforwards refundable, and permits the acceleration of depreciation for certain assets placed into service after September 27, 2017. In addition the TJCA created prospective changes beginning in 2018, including repeal of the domestic manufacturing deduction, acceleration of tax revenue recognition, capitalization of research and development expenditures, additional limitations on executive compensation and limitations on the deductibility of interest.
The Company elected to recognize the income tax effects of the TCJA in its financial statements in accordance with Staff Accounting Bulletin 118 (SAB 118), which provides guidance for the application of ASC Topic 740 Income Taxes, in the reporting period in which the TCJA was signed into law. Under SAB 118 when a Company does not have the necessary information available, prepared, or analyzed (including computations) in reasonable detail to complete the accounting for certain income tax effects of the TCJA it will recognize provisional amounts if a reasonable estimate can be made. After the analysis, the Company did not identify any items for which the income tax effects of the TCJA have not been completed and a reasonable estimate could not be determined as of December 31, 2018.
The changes to existing U.S. tax laws as a result of the TCJA, which will have the most significant impact on the Company's federal income taxes are as follows:
Reduction of the U.S. Corporate Income Tax Rate - The Company uses the asset and liability method of accounting for income taxes. Under this method, deferred tax assets and liabilities are recognized for the future tax consequences attributable to differences between the financial statement carrying amounts of existing assets and liabilities and their respective tax basis. Deferred tax assets and liabilities are measured using enacted tax rates expected to apply to taxable income in the years in which those temporary differences are expected to reverse. As a result of the reduction in the U.S. corporate income tax rate from 35% to 21% under the TCJA, the Company revalued its ending net deferred tax liabilities at December 31, 2017. The reduction in the corporate income tax rate resulted in the Company recording $10.3 million benefit from deferred taxes in the year ending December 31, 2017.
Acceleration of Depreciation - The Company recognized a reduction to net deferred tax assets attributable to the accelerated depreciation for certain assets placed into service after September 27, 2017. This adjustment resulted in an increase in income tax receivable of approximately $961,000 in the year ending December 31, 2017.
ItemITEM 7A. Quantitative and Qualitative Disclosures about Market Risk.
The market risk inherent in our financial instruments represents the potential loss resulting from adverse changes in interest rates, foreign currency rates and commodity prices. Our exposure to interest rate changes results from our variable rate debt instruments which are vulnerable to changes in short term United States prime interest rates. At December 31, 2018, 20172020, 2019 and 2016,2018, we had approximately $103.3$46.6 million, $99.6$83.9 million, and $84.0$103.3 million, respectively, in variable rate debt outstanding, excluding deferred financing costs. A hypothetical 10% change in interest rates underlying these borrowings would result in annual changes in our earnings and cash flows of approximately $433,000, $405,000$0.1 million, $0.4 million, and $275,000$0.4 million at December 31, 2018, 20172020, 2019 and 2016,2018, respectively.
We do not view exchange rates exposure as significant and have not acquired or issued any foreign currency derivative financial instruments.
We purchase all of our raw materials, consisting of feedstock and natural gas, on the open market. The cost of these materials is a function of non-formula market oil and gas prices. As a result, our revenues and gross margins could be affected by changes in the price and availability of feedstock and natural gas. As market conditions dictate, from time to time we engage in various hedging techniques including financial swap and option agreements. We do not use such financial instruments for trading purposes and are not a party to any leveraged derivatives. Our policy on such hedges is to buy positions as opportunities present themselves in the market and to hold such positions until maturity, thereby offsetting the physical purchase and price of the materials.
At the end of 2018,2020, market risk for 20192021 was estimated as a hypothetical 10% increase in the cost of natural gas and feedstock over the market price prevailing on December 31, 2018.2020. Assuming that 20192021 total specialty petrochemicalpetrochemicals product sales volumes stay at the same rate as 2018,2020, the 10% market risk increase will result in an increase in the cost of natural gas and feedstock of approximately $11.9$7.8 million in fiscal 2019.2021.
ItemITEM 8. Financial Statements and Supplementary Data.
The consolidated financial statementsConsolidated Financial Statements of the Company and the consolidated financial statement schedules, including the report of our independent registered public accounting firm thereon, are set forth beginning on Page F-1.
ItemITEM 9. Changes In and Disagreements with Accountants on Accounting and Financial Disclosure.
None.
ItemITEM 9A. Controls and Procedures.
| |
(a) | Disclosure Controls and Procedures. |
(a)Disclosure Controls and Procedures.
We maintain disclosure controls and procedures (as defined in Rule 13a-15(e) and 15d-15(e)) under the Exchange Act that are designed to provide reasonable assurance that the information that we are required to disclose in the reports we file or submit under the Exchange Act is recorded, processed, summarized and reported within the time periods specified in the SEC'sSEC’s rules and forms, and such information is accumulated and communicated to our management, including our Chief Executive Office and Chief Financial Officer, as appropriate, to allow timely decisions regarding required disclosure. It should be noted that because of inherent limitations, our disclosure controls and procedures, however well designed and operated, can provide only reasonable, and not absolute, assurance that the objective of the disclosure controls and procedures are met.
As required by paragraph (b) of Rules 13a-15 and 15d-15 under the Exchange Act, our Chief Executive Officer, and Chief Financial Officer have evaluated the effectiveness of our disclosure controls and procedures (as such term is defined in Rules 13a-15(e) and 15d-15(e) under the Exchange Act) as of the end of the period covered by this report. Based on such evaluation, our Chief Executive Officer and Chief Financial Officer have concluded, as of the end of the period covered by this report, that our disclosure controls and procedures were effective at a reasonable assurance level to ensure that the information that we are required to disclose in the reports we file or submit under the Exchange Act is recorded, processed, summarized and reported within the time periods specified in SEC rules and forms and such information is accumulated and communicated to our
management, including our Chief Executive Officer and Chief Financial Officer as appropriate, to allow timely decisions regarding required disclosure because of the material weakness in our internal control over financial reporting described below.
| |
(b) | Management's Annual Report on Internal Control over Financial Reporting. |
(b)Management’s Annual Report on Internal Control over Financial Reporting.
Our management is responsible for establishing and maintaining adequate internal control over financial reporting. Our internal control over financial reporting is a process that is designed under the supervision of our Chief Executive Officer and Chief Financial Officer, and effected by our Board of Directors, management and other personnel, to provide assurance regarding financial reporting and the preparation of the financial statements for external purposes in accordance with accounting principles generally accepted in the United States. Our internal control of financial reporting includes those policies and procedures that:
•Pertain to the maintenance of records that, in reasonable detail, accurately and fairly reflect the transactions and dispositions of our assets;
•Provide reasonable assurance that transactions are recorded as necessary to permit preparation of financial statements in accordance with accounting principles generally accepted in the United States, and that receipts and expenditures recorded by us are being made only in accordance with authorizations of our management and Board of Directors; and
•Provide reasonable assurance regarding prevention or timely detection of unauthorized acquisition, use or disposition of our assets that could have a material effect on our financial statements.
Internal control over financial reporting has inherent limitations. Internal control over financial reporting is a process that involves human diligence and compliance and is subject to lapses in judgment and breakdowns resulting from human failures. Internal control over financial reporting also can be circumvented by collusion or improper management override. Because of such limitations, there is a risk that material misstatements will not be prevented or detected on a timely basis by internal control over financial reporting. However, these inherent limitations are known features of the financial reporting process. Therefore, it is possible to design into the process safeguards to reduce, though not eliminate, this risk. Also, projections of any evaluation of effectiveness to future periods are subject to the risk that controls may become inadequate because of changes in conditions, or that the degree of compliance with the policies and procedures may deteriorate.
Management has conducted its evaluation of the effectiveness of our internal control over financial reporting as of December 31, 2018,2020, based upon the framework in Internal Control – Integrated Framework (2013) by the Committee of Sponsoring Organizations of the Treadway Commission. Management'sManagement’s assessment included an evaluation of the design of our internal control over financial reporting and testing the operating effectiveness of our internal control over financial reporting. Management reviewed the results of the assessment with the Audit Committee of the Board of Directors. Based on its assessment and review with the Audit Committee, management concluded that our internal control over financial reporting was effective as of December 31, 2018.2020.
| |
(c) | Attestation Report of the Registered Public Accounting Firm. |
(c)Attestation Report of the Registered Public Accounting Firm.
BKM Sowan Horan, LLP, an independent registered public accounting firm, has audited the consolidated financial statementsConsolidated Financial Statements included in this Annual Report on Form 10-K and, as part of their audit, has issued their report, included herein, on the effectiveness of our internal control over financial reporting.
(d) Changes in Internal Control over Financial Reporting.
There have been no changes in our internal control over financial reporting during the fourth quarter of 20182020 that have materially affected, or are reasonable likely to materially affect, our internal control over financial reporting. From time to time, we make changes to our internal control over financial reporting that are intended to enhance its effectiveness and which do not have a material effect on our overall internal control over financial reporting.
REPORT OF INDEPENDENT REGISTERED PUBLIC ACCOUNTING FIRM
To the Board of Directors and
Stockholders of Trecora Resources
Opinion on Internal Control over Financial Reporting
We have audited Trecora Resources’ (the Company’s) internal control over financial reporting as of December 31, 2018,2020, based on criteria established in Internal Control-Integrated Framework (2013) issued by the Committee of Sponsoring Organizations of the Treadway Commission (COSO). In our opinion, the Company maintained, in all material respects, effective internal control over financial reporting as of December 31, 2018,2020, based on criteria established in Internal Control-Integrated Framework (2013) issued by COSO.
We also have audited, in accordance with the standards of the Public Company Accounting Oversight Board (United States) (PCAOB), the balance sheets and the related statements of operations, stockholders’ equity, and cash flows of the Company, and our report dated March 15, 2019,9, 2021, expressed an unqualified opinion.
Basis for Opinion
The Company’s management is responsible for maintaining effective internal control over financial reporting, and for its assessment of the effectiveness of internal control over financial reporting, included in the accompanying Management’s Annual Report on Internal Control Over Financial Reporting.Reporting. Our responsibility is to express an opinion on the Company’s internal control over financial reporting based on our audit. We are a public accounting firm registered with the PCAOB and are required to be independent with respect to the Company in accordance with the U.S. federal securities laws and the applicable rules and regulations of the Securities and Exchange Commission and the PCAOB.
We conducted our audit in accordance with the standards of the PCAOB. Those standards require that we plan and perform the audit to obtain reasonable assurance about whether effective internal control over financial reporting was maintained in all material respects. Our audit of internal control over financial reporting included obtaining an understanding of internal control over financial reporting, assessing the risk that a material weakness exists, and testing and evaluating the design and operating effectiveness of internal control based on the assessed risk. Our audit also included performing such other procedures as we considered necessary in the circumstances. We believe that our audit provides a reasonable basis for our opinion.
Definition and Limitations of Internal Control over Financial Reporting
A company’s internal control over financial reporting is a process designed to provide reasonable assurance regarding the reliability of financial reporting and the preparation of financial statements for external purposes in accordance with generally accepted accounting principles. A company’s internal control over financial reporting includes those policies and procedures that (1) pertain to the maintenance of records that, in reasonable detail, accurately and fairly reflect the transactions and dispositions of the assets of the company; (2) provide reasonable assurance that transactions are recorded as necessary to permit preparation of financial statements in accordance with generally accepted accounting principles, and that receipts and expenditures of the company are being made only in accordance with authorizations of management and directors of the company; and (3) provide reasonable assurance regarding prevention or timely detection of unauthorized acquisition, use, or disposition of the company’s assets that could have a material effect on the financial statements.
Because of its inherent limitations, internal control over financial reporting may not prevent or detect misstatements. Also, projections of any evaluation of effectiveness to future periods are subject to the risk that controls may become inadequate because of changes in conditions, or that the degree of compliance with the policies or procedures may deteriorate.
/s/ BKM Sowan Horan, LLP
Addison, Texas
March 15, 20199, 2021
ItemITEM 9B. Other Information.
None.On March 5, 2021, Joseph M. Tanner, the Senior Vice President, Commercial of the Company, provided notice that he intends to retire effective as of March 15, 2021. The Company has initiated a search for Mr. Tanner’s replacement. To ensure an orderly transition of his responsibilities, Mr. Tanner will provide consulting services to the Company under the terms of a consulting services agreement entered into with the Company on March 5, 2021 (the “Consulting Agreement”). Under the Consulting Agreement, Mr. Tanner will provide commercial support for sales of the Company’s products. The initial term of the Consulting Agreement will begin on the effective date of Mr. Tanner’s retirement, and expire on June 30, 2021, subject to automatic extension for one month periods (unless the Consulting Agreement is otherwise terminated in accordance with its terms by either party). Mr. Tanner will be entitled to a consulting fee of $1,800 per week plus reimbursement of certain out-of-pocket expenses. During the term of the Consulting Agreement, Mr. Tanner will be subject to customary provisions related to confidentiality and use of intellectual property.
The summary description of the Consulting Agreement set forth above does not purport to be complete and is qualified in its entirety by the Consulting Agreement, which is filed with this Annual Report on Form 10-K.
PART III
ItemITEM 10. Directors, Executive Officers and Corporate Governance.
Incorporated by reference from our Proxy Statement for our 20192021 Annual Meeting of Stockholders to be filed with the SEC within 120 days after the end of the year ended December 31, 2018.2020.
We have adopted a code of ethics entitled Standards of Business Conduct that applies to all of the Company'sCompany’s directors, officers and employees, including its principal executive officer, principal financial officer, principal accounting officer and controller, and to persons performing similar functions. A copy of the Standards of Business Conduct is available on our website.website, www.trecora.com.
ItemITEM 11. Executive Compensation.
Incorporated by reference from our Proxy Statement for our 20192021 Annual Meeting of Stockholders to be filed with the SEC within 120 days after the end of the year ended December 31, 2018.2020.
ItemITEM 12. Security Ownership of Certain Beneficial Owners and Management and Related Stockholder Matters.
Incorporated by reference from our Proxy Statement for our 20192021 Annual Meeting of Stockholders to be filed with the SEC within 120 days after the end of the year ended December 31, 2018.2020.
ItemITEM 13. Certain Relationships and Related Transactions, and Director Independence.
Incorporated by reference from our Proxy Statement for our 20192021 Annual Meeting of Stockholders to be filed with the SEC within 120 days after the end of the year ended December 31, 2018.2020.
ItemITEM 14. Principal Accounting Fees and Services.
Incorporated by reference from our Proxy Statement for our 20192021 Annual Meeting of Stockholders to be filed with the SEC within 120 days after the end of the year ended December 31, 2018.2020.
PART IV
ITEM 15. Exhibits, Financial Statement Schedules.
(a)1. The following financial statements are filed with this Report:
Reports of Independent Registered Public Accounting Firm
Consolidated Balance Sheets dated December 31, 20182020 and 20172019
Consolidated Statements of IncomeOperations for the three years ended December 31, 20182020
Consolidated Statement of Stockholders' Equity for the three years ended December 31, 20182020
Consolidated Statements of Cash Flows for the three years ended December 31, 20182020
Notes to Consolidated Financial Statements
2. The following financial statement schedules are filed with this Report:
Schedule II -- Valuation and Qualifying Accounts for the three years ended December 31, 2018.2020
3. The following financial statements are filed with this Report:
The financial statements of Al Masane Al Kobra Mining Company (AMAK) for the nine months ended September 30, 2020 and the years ended December 31, 2018, 2017,2019 and 2016,2018, required by Rule 3-09 of Regulation S-X.S-X
4. The following documents are filed or incorporated by reference as exhibits to this Report. Exhibits marked with an asterisk (*) are filed herewith. Exhibits marked with a plus sign (+) are management contracts or a compensatory plan, contract or arrangement.
The below exhibit marked with a degree sign (°) has been redacted in part, in compliance with Regulation S-K Item 601. The Company agrees to furnish supplementally an unredacted copy of such exhibit to the Securities and Exchange Commission upon its request. |
| | | | |
Exhibit
Number
| Description |
3(a)2.1 | |
| 2.2 | |
| 2.3 | |
| 2.4 | |
| 3.1 | |
3(b)3.2 | |
10(a)+4.1 | |
| 10.1+ | |
10(b)+10.2+ | |
10(c)+10.3+ | |
10(d)*+10.4+ | |
| 10.5+ | |
10(e)+ | |
| 10.6+ | |
10(f)+10.7+ | |
10(g)*+10.8+ | |
10(h)*+ | |
10(i)+ | |
10(j)+10.9+ | |
10(k)+10.10+ | |
| | | | | |
10(l)+Exhibit
Number | Description |
| 10.11+ | |
10(m)10.12+ | |
10(n)10.13+ | |
|
| 10.14+* | |
Exhibit
Number
| Description |
10(o)10.15+* | |
10.16° | |
10(p)10.17 | |
10(q) | Amended and Restated Credit Agreement, dated as of October 1, 2014, among Texas Oil & Chemical Co. II, Inc., as Borrower, certain subsidiaries of the Borrower, as Guarantors, the Lenders from time to time party thereto and Bank of America, N.A., as Administrative Agent, Swingline Lender and an L/C Issuer (incorporated by reference to Exhibit 10.2 to the Company'sCompany’s Form 8–K filed on October 3, 2014 (file No. 001–33926)) |
10(r)10.18 | Second Amendment to Amended and Restated Credit Agreement, dated as of March 28, 2017, among Texas Oil & Chemical Co. II, Inc., as Borrower, certain subsidiaries of the Borrower, as Guarantors, the Lenders from time to time party thereto and Bank of America, N.A., as Administrative Agent, Swingline Lender and an L/C Issuer (incorporated by reference to Exhibit 99.1 to the Company'sCompany’s form 8–K filed on March 30, 2017 (file No. 001-33926)) |
10(s)10.19 | Third Amendment to Amended and Restated Credit Agreement, dated as of July 25, 2017, among Texas Oil & Chemical Co. II, Inc., as Borrower, certain subsidiaries of the Borrower, as Guarantors, the Lenders from time to time party thereto and Bank of America, N.A., as Administrative Agent, Swingline Lender and an L/C Issuer (incorporated by reference to Exhibit 99.1 to the company'scompany’s Form 8–K filed on July 27, 2017 (file No. 001–33926)) |
10(t)10.20 | Fourth Amendment to Amended and Restated Credit Agreement, dated as of July 31, 2018, among Texas Oil & Chemical Co. II, Inc., as Borrower, certain subsidiaries of the Borrower, as Guarantors, the Lenders from time to time party thereto, Citibank, N.A., as an L/C Issuer, and Bank of America, N.A., as Administrative Agent, Swingline Lender and an L/C Issuer (incorporated by reference to Exhibit 10.1 of the Company'sCompany’s Current Report on Form 8-K dated July 31, 2018 (File(file No. 001-33926)) |
10(u)10.21 | Fifth Amendment to Amended and Restated Credit Agreement, dated as of December 19, 2018, among Texas Oil & Chemical Co. II, Inc., as Borrower, certain subsidiaries of the Borrower, as Guarantors, the Lenders from time to time party thereto, Citibank, N.A., as an L/C Issuer, and Bank of America, N.A., as Administrative Agent, Swingline Lender and an L/C Issuer (incorporated by reference to Exhibit 10.1 of the Company'sCompany’s Current Report on Form 8-K dated December 14, 2018 (File(file No. 001-33926)) |
2110.22 | Sixth Amendment to Amended and Restated Credit Agreement, dated as of March 29, 2019, among Texas Oil & Chemical Co. II, Inc., as Borrower, certain subsidiaries of the borrower, as Guarantors, The Lenders from time to time party thereto, Citibank, N.A., as an L/C Issuer, and Bank of America, N.A. as Administrative agent, Swingline Lender and an L/C Issuer (incorporated by reference to Exhibit 10.1 of the Company’s Current Report on Form 8-K filed April 2, 2019 (file No. 001-33926)) |
| 10.23 | Seventh Amendment to Amended and Restated Credit Agreement, dated as of May 8, 2020, among Texas Oil & Chemical Co. II, Inc., as Borrower, certain subsidiaries of the Borrower, as Guarantors, the Lenders from time to time party thereto, Citibank, N.A., as an L/C Issuer, and Bank of America, N.A., as Administrative Agent, Swingline Lender and an L/C Issuer (incorporated by reference to Exhibit 10.1 of the Company’s Quarterly Report on Form 10-Q for the quarter ended June 30, 2020 (file No. 001-33926)) |
| 10.24 | |
| 10.25 | |
| 21 | |
| 23.1* | |
| 23.2* | |
| | | | | |
Exhibit
Number | Description |
| 24* | |
| 31.1* | |
| 31.2* | |
| 32* | |
| 101.INS | XBRL Instance Document |
| 101.SCH | XBRL Taxonomy Schema Document |
| 101.CAL | XBRL Taxonomy Calculation Linkbase Document |
| 101.LAB | XBRL Taxonomy Label Linkbase Document |
| 101.PRE | XBRL Taxonomy Extension Presentation Linkbase Document |
| 101.DEF | XBRL Taxonomy Extension Definition Linkbase Document |
| 104* | Cover Page Interactive Data File (formatted as inline XBRL and included as Exhibit 101) |
| |
(b) | Exhibits required by Regulation 601 S-K |
See (a) 3
ITEM 16. Form 10-K Summary.
None.
| |
(c) | Financial Statement Schedules |
See (a) 2 of this Item 15
SIGNATURES
Pursuant to the requirements of Section 13 or 15(d) of the Securities Exchange Act of 1934, the Registrant has duly caused this Report to be signed on its behalf by the undersigned, thereunto duly authorized.
| | | | | | | | |
| TRECORA RESOURCES |
| | |
| TRECORA RESOURCES |
| | |
Dated: March 15, 201909, 2021 | By: | /s/ Patrick Quarles |
| | Patrick Quarles |
| | Chief Executive Officer and President |
KNOW ALL MEN BY THESE PRESENTS that each of the undersigned directors and officers of Trecora Resources hereby constitutes and appoints Patrick Quarles and Sami Ahmad his or her true and lawful attorney-in-fact and agent, for him or her and in his or her name, place and stead, in any and all capacities, with full power to act alone, to sign any and all amendments to this Report, and to file each such amendment to the Report, with all exhibits thereto, and any and all other documents in connection therewith, with the Securities and Exchange Commission, hereby granting unto said attorney-in-fact and agent full power and authority to do and perform any and all acts and things requisite and necessary to be done in and about the premises as fully to all intents and purposes as he or she might or could do in person, hereby ratifying and confirming all that said attorney-in-fact and agent may lawfully do or cause to be done by virtue hereof.
Pursuant to the requirements of the Securities Exchange Act of 1934, this Report has been signed below by the following persons on behalf of the Registrant in the capacities indicated on March 15, 2019.
|
| | | | |
| Signature | Title |
/s/ Patrick Quarles Patrick Quarles | Chief Executive Officer, President and President Director
(principal executive officer) |
/s/ Sami Ahmad Sami Ahmad | Chief Financial Officer (principal
(principal financial officer)
|
/s/ Christopher Groves Christopher Groves | Corporate Controller (principal
(principal accounting officer)
|
/s/ Karen A. Twitchell Karen A. Twitchell | Chair of the Board and Director |
/s/ Gary K. Adams Gary K. Adams | Director |
/s/ Pamela R. Butcher Pamela R. Butcher | Director |
/s/ Nicholas Carter Nicholas Carter | Director |
/s/ Joseph P. PalmAdam C. Peakes Joseph P. PalmAdam C. Peakes
| Director |
/s/ Janet S. Roemer Janet S. Roemer | Director |
|
| | | | |
| INDEX TO FINANCIAL STATEMENTS | Page |
| |
| |
| |
| |
| |
| |
| |
| |
| |
| |
| |
| |
| INDEX TO FINANCIAL STATEMENT SCHEDULES | |
| |
| |
| |
| |
REPORT OF INDEPENDENT REGISTERED PUBLIC ACCOUNTING FIRM
To the Board of Directors and
Stockholders of Trecora Resources
Opinion on the Consolidated Financial Statements
We have audited the accompanying consolidated balance sheets of Trecora Resources and Subsidiaries (the Company)“Company”) as of December 31, 20182020 and 2017,2019, and the related consolidated statements of income, comprehensive income,operations, stockholders’ equity and cash flows for each of the years in the three–yearthree-year period ended December 31, 20182020 and the related notes and schedules listed in the index at Item 15(a) (collectively referred to as the financial statements)“Consolidated Financial Statements”). In our opinion, the financial statementsConsolidated Financial Statements present fairly, in all material respects, the financial position of the Company as of December 31, 20182020 and 2017,2019, and the results of its operations and its cash flows for each of the years in the three-year period ended December 31, 2018,2020, in conformity with accounting principles generally accepted in the United States of America.
We also have audited, in accordance with the standards of the Public Company Accounting Oversight Board (United States) (PCAOB), the Company’s internal control over financial reporting as of December 31, 2018,2020, based on criteria established in Internal Control—Integrated Framework (2013) issued by the Committee of Sponsoring Organizations of the Treadway Commission (COSO), and our report dated March 15, 2019,9, 2021, expressed an unqualified opinion.
Basis for Opinion
These financial statementsConsolidated Financial Statements are the responsibility of the Company’s management. Our responsibility is to express an opinion on the Company’s financial statementsConsolidated Financial Statements based on our audits. We are a public accounting firm registered with the PCAOB and are required to be independent with respect to the Company in accordance with the U.S. federal securities laws and the applicable rules and regulations of the Securities and Exchange Commission and the PCAOB.
We conducted our audits in accordance with the standards of the PCAOB. Those standards require that we plan and perform the audit to obtain reasonable assurance about whether the financial statementsConsolidated Financial Statements are free of material misstatement, whether due to error or fraud. Our audits included performing procedures to assess the risks of material misstatement of the financial statements,Consolidated Financial Statements, whether due to error or fraud, and performing procedures that respond to those risks. Such procedures included examining, on a test basis, evidence regarding the amounts and disclosures in the financial statements.Consolidated Financial Statements. Our audits also included evaluating the accounting principles used and significant estimates made by management, as well as evaluating the overall presentation of the financial statements.Consolidated Financial Statements. We believe that our audits provide a reasonable basis for our opinion.
Critical Audit Matter
The critical audit matter communicated below is a matter arising from the current-period audit of the Consolidated Financial Statements that were communicated or required to be communicated to the audit committee and that: (1) relates to accounts or disclosures that are material to the Consolidated Financial Statements and (2) involved our especially challenging, subjective, or complex judgments. The communication of a critical audit matter does not alter in any way our opinion on the Consolidated Financial Statements, taken as a whole, and we are not, by communicating the critical audit matters below, providing a separate audit opinion on the critical audit matter or on the accounts or disclosures to which it relates.
Recoverability of the Specialty Waxes segment long-lived assets
The Company’s Specialty Waxes segment has total assets of $83.1 million, including Net Plant, Pipeline, and Equipment of $60.3 million and Net Intangibles Assets of $12.9 million. The Company considers the Specialty Waxes segment to be a single long lived asset group. A long-lived asset (asset group) shall be tested for recoverability whenever events or changes in circumstances indicate that it’s carrying amount may not be recoverable. For the year ended December 31, 2020, the Specialty Waxes segment had a net loss of $3.6 million.
We identified the recoverability of the Specialty Waxes segment long-lived assets as a critical audit matter because of the significant estimates and assumptions management used in the undiscounted cash flow analysis. Performing audit procedures to evaluate the reasonableness of these estimates and assumptions required a high degree of auditor judgment and an increased extent of effort.
How the Critical Audit Matter Was Addressed in the Audit
Our audit procedures related to the following:
•We obtained an understanding and evaluated the design of internal controls over management’s evaluation of the recoverability of long-lived assets based on the Company’s undiscounted cash flows analysis.
•We evaluated management’s ability to forecast future sales, gross profit and future capital needs by comparing actual results to management’s historical forecasts.
•We evaluated the reasonableness of significant assumptions in the undiscounted cash flow analysis, including future sales, operating costs, gross profit, and capitalization rates. In addition, we tested the mathematical accuracy of the undiscounted cash flows analysis.
/s/ BKM Sowan Horan, LLP
We have served as the Company’s auditor since 2010.
Addison, Texas
March 15, 2019
9, 2021
|
| | | | | | | |
| TRECORA RESOURCES AND SUBSIDIARIES |
| CONSOLIDATED BALANCE SHEETS |
| | | | |
| | December 31, |
| | 2018 |
| | 2017 |
|
| | (thousands of dollars) |
| ASSETS | | | |
| CURRENT ASSETS | | | |
| Cash and cash equivalents | $ | 6,735 |
| | $ | 3,028 |
|
| Trade receivables, net (Note 5) | 27,112 |
| | 25,779 |
|
| Inventories (Note 7) | 16,539 |
| | 18,450 |
|
| Prepaid expenses and other assets (Note 6) | 4,664 |
| | 3,645 |
|
| Taxes receivable | 182 |
| | 5,584 |
|
| | | | |
| Total current assets | 55,232 |
| | 56,486 |
|
| | | | |
PLANT, PIPELINE, AND EQUIPMENT – AT COST | 268,419 |
| | 245,761 |
|
| LESS ACCUMULATED DEPRECIATION | (73,762 | ) | | (63,240 | ) |
| | | | |
| PLANT, PIPELINE, AND EQUIPMENT, NET (Note 8) | 194,657 |
| | 182,521 |
|
| | | | |
| GOODWILL (Note 9) | 21,798 |
| | 21,798 |
|
| OTHER INTANGIBLE ASSETS, net (Note 9) | 18,947 |
| | 20,808 |
|
| INVESTMENT IN AMAK (Note 10) | 38,746 |
| | 45,125 |
|
| MINERAL PROPERTIES IN THE UNITED STATES (Note 11) | 588 |
| | 588 |
|
| | | | |
| TOTAL ASSETS | $ | 329,968 |
| | $ | 327,326 |
|
| | | | |
| LIABILITIES | | | |
| CURRENT LIABILITIES | | | |
| Accounts payable | $ | 19,106 |
| | $ | 18,347 |
|
| Accrued liabilities (Note 13) | 5,439 |
| | 3,961 |
|
| Current portion of post-retirement benefit (Note 22) | 19 |
| | 305 |
|
| Current portion of long-term debt (Note 12) | 4,194 |
| | 8,061 |
|
| Current portion of other liabilities | 733 |
| | 870 |
|
| | | | |
| Total current liabilities | 29,491 |
| | 31,544 |
|
| | | | |
| LONG-TERM DEBT, net of current portion (Note 12) | 98,288 |
| | 91,021 |
|
| POST- RETIREMENT BENEFIT, net of current portion (Note 22) | 358 |
| | 897 |
|
| | | | |
| OTHER LIABILITIES , net of current portion | 994 |
| | 1,611 |
|
| DEFERRED INCOME TAXES (Note 16) | 15,676 |
| | 17,242 |
|
| | | | |
| Total liabilities | 144,807 |
| | 142,315 |
|
| | | | |
| COMMITMENTS AND CONTINGENCIES (Note 14) |
|
| |
|
|
| | | | | | | | | | | |
| TRECORA RESOURCES AND SUBSIDIARIES |
| CONSOLIDATED BALANCE SHEETS |
| December 31, |
| 2020 | | 2019 |
| (thousands of dollars) |
| ASSETS | | | |
| CURRENT ASSETS | | | |
| Cash and cash equivalents | $ | 55,664 | | | $ | 6,145 | |
| Trade receivables, net (Note 4) | 25,301 | | | 26,320 | |
| Inventories (Note 5) | 12,945 | | | 13,624 | |
| Investment in AMAK (held-for-sale) (Note 6) | 0 | | | 32,872 | |
| Prepaid expenses and other assets (Note 7) | 9,198 | | | 4,947 | |
| Taxes receivable | 2,788 | | | 182 | |
| Total current assets | 105,896 | | | 84,090 | |
| | | |
| | | |
| | | |
| PLANT, PIPELINE, AND EQUIPMENT, NET (Note 8) | 187,104 | | | 188,919 | |
| OPERATING LEASE ASSETS, NET (Note 9) | 10,528 | | | 13,512 | |
| | | |
| INTANGIBLE ASSETS, NET (Note 10) | 12,893 | | | 14,736 | |
| MINERAL PROPERTIES (Note 11) | 412 | | | 562 | |
| TOTAL ASSETS | $ | 316,833 | | | $ | 301,819 | |
| | | |
| LIABILITIES | | | |
| CURRENT LIABILITIES | | | |
| Accounts payable | $ | 14,447 | | | $ | 14,603 | |
| | | |
| Accrued liabilities (Note 12) | 6,857 | | | 5,742 | |
| | | |
| Current portion of long-term debt (Note 13) | 4,194 | | | 4,194 | |
| Current portion of operating lease (Note 9) | 3,195 | | | 3,174 | |
| Current portion of other liabilities | 891 | | | 922 | |
| Total current liabilities | 29,584 | | | 28,635 | |
| | | |
| CARES ACT, PPP Loans | 6,123 | | | 0 | |
| LONG-TERM DEBT, net of current portion (Note 13) | 41,901 | | | 79,095 | |
| POST- RETIREMENT BENEFIT, net of current portion (Note 22) | 320 | | | 338 | |
| OPERATING LEASE LONG TERM (Note 9) | 7,333 | | | 10,338 | |
| OTHER LIABILITIES, net of current portion | 648 | | | 595 | |
| DEFERRED INCOME TAXES (Note 16) | 26,517 | | | 11,375 | |
| Total liabilities | 112,426 | | | 130,376 | |
| | | |
| COMMITMENTS AND CONTINGENCIES (Note 14) | 0 | | 0 |
| | | |
| EQUITY | | | |
| Common Stock ‑ authorized 40 million shares of $.10 par value; issued 24.8 and 24.6 million in 2020 and 2019, respectively, and outstanding 24.8 and 24.5 million in 2020 and 2019, respectively | 2,483 | | | 2,475 | |
| Additional Paid-in Capital | 61,311 | | | 59,530 | |
| | | |
| Retained Earnings | 140,324 | | | 109,149 | |
| Total Trecora Resources Stockholders' Equity | 204,118 | | | 171,154 | |
| Noncontrolling interest | 289 | | | 289 | |
| Total equity | 204,407 | | | 171,443 | |
| | | |
| TOTAL LIABILITIES AND EQUITY | $ | 316,833 | | | $ | 301,819 | |
|
| | | | | | | |
| TRECORA RESOURCES AND SUBSIDIARIES |
| CONSOLIDATED BALANCE SHEETS |
| | | | |
| | December 31, |
| | 2018 |
| | 2017 |
|
| | (thousands of dollars) |
| | | | |
| EQUITY | | | |
| Common Stock ‑ authorized 40 million shares of $.10 par value; issued 24.6 and 24.5 million in 2018 and 2017, respectively, and outstanding 24.5 and 24.3 million in 2018 and 2017, respectively | 2,463 |
| | 2,451 |
|
| Additional Paid-in Capital | 58,294 |
| | 56,012 |
|
| Common Stock in Treasury, at cost 0.1 million and 0.2 million shares in 2018 and 2017, respectively | (8 | ) | | (196 | ) |
| Retained Earnings | 124,123 |
| | 126,455 |
|
| Total Trecora Resources Stockholders' Equity | 184,872 |
| | 184,722 |
|
| Noncontrolling interest | 289 |
| | 289 |
|
| Total equity | 185,161 |
| | 185,011 |
|
| | | | |
| TOTAL LIABILITIES AND EQUITY | $ | 329,968 |
| | $ | 327,326 |
|
TRECORA RESOURCES AND SUBSIDIARIES
CONSOLIDATED STATEMENTS OF OPERATIONS
For the years ended December 31, |
| | | | | | | | | | | |
| | 2018 |
| | 2017 |
| | 2016 |
|
| | (thousands of dollars) |
| Revenues | | | | | |
| Specialty petrochemical and product sales | $ | 269,780 |
| | $ | 227,334 |
| | $ | 193,581 |
|
| Processing fees | 18,152 |
| | 17,809 |
| | 18,818 |
|
| | 287,932 |
|
| 245,143 |
|
| 212,399 |
|
| Operating costs and expenses | | | | | |
| Cost of specialty petrochemical, product sales, and processing (including depreciation and amortization of $13,618, $10,089, and $9,016, respectively) | 260,114 |
| | 203,582 |
| | 172,497 |
|
| Gross Profit | 27,818 |
|
| 41,561 |
|
| 39,902 |
|
| | | | | | |
| General and Administrative Expenses | | | | | |
| General and administrative | 22,396 |
| | 22,587 |
| | 20,434 |
|
| Restructuring and severance (Note 21) | 2,347 |
| | — |
| | — |
|
| Depreciation | 740 |
| | 872 |
| | 761 |
|
| | 25,483 |
|
| 23,459 |
|
| 21,195 |
|
| | | | | | |
| Operating income | 2,335 |
| | 18,102 |
| | 18,707 |
|
| | | | | | |
| Other income (expense) | | | | | |
| Interest expense | (4,100 | ) | | (2,931 | ) | | (1,985 | ) |
| Loss on extinguishment of debt | (315 | ) | | — |
| | — |
|
| Bargain purchase gain from acquisition (Note 3) | — |
| | — |
| | 11,549 |
|
| Equity in losses of AMAK (Note 10) | (901 | ) | | (4,261 | ) | | (1,479 | ) |
| Gain from additional equity issuance by AMAK (Note 10) | — |
| | — |
| | 3,168 |
|
| Miscellaneous expense | (158 | ) | | (60 | ) | | (28 | ) |
| | (5,474 | ) |
| (7,252 | ) |
| 11,225 |
|
| | | | | | |
| Income (loss) before income tax expense | (3,139 | ) |
| 10,850 |
|
| 29,932 |
|
| | | | | | |
| Income tax benefit (expense) | 807 |
| | 7,159 |
| | (10,504 | ) |
| | | | | | |
| Net income (loss) attributable to Trecora Resources | $ | (2,332 | ) |
| $ | 18,009 |
|
| $ | 19,428 |
|
| | | | | | |
| Net income (loss) per common share | | | | | |
| Basic earnings (loss) per share (dollars) | $ | (0.10 | ) | | $ | 0.74 |
| | $ | 0.80 |
|
| Diluted earnings (loss) per share (dollars) | $ | (0.10 | ) | | $ | 0.72 |
| | $ | 0.78 |
|
| | | | | | |
| Weighted average number of common | | | | | |
| shares outstanding | | | | | |
| Basic | 24,438 |
| | 24,294 |
| | 24,284 |
|
| Diluted | 24,438 |
| | 25,129 |
| | 24,982 |
|
| | | | | | | | | | | | | | | | | |
| TRECORA RESOURCES AND SUBSIDIARIES |
| CONSOLIDATED STATEMENTS OF OPERATIONS |
| For the years ended December 31, |
| 2020 | | 2019 | | 2018 |
| (thousands of dollars) |
| Revenues | | | | | |
| Product sales | $ | 192,375 | | | $ | 243,314 | | | $ | 269,780 | |
| Processing fees | 16,251 | | | 15,645 | | | 18,152 | |
| 208,626 | | | 258,959 | | | 287,932 | |
| Operating costs and expenses | | | | | |
| Cost of sales and processing (including depreciation and amortization of $15,300, $15,361, and $13,618, respectively) | 179,948 | | | 220,444 | | | 260,114 | |
| Gross Profit | 28,678 | | | 38,515 | | | 27,818 | |
| | | | | |
| General and Administrative Expenses | | | | | |
| General and administrative | 24,892 | | | 24,386 | | | 22,532 | |
| Impairment of goodwill and certain intangibles (Note 10) | 0 | | | 24,152 | | | 0 | |
| Restructuring and severance (Note 21) | 0 | | | 0 | | | 2,347 | |
| Depreciation | 848 | | | 840 | | | 740 | |
| 25,740 | | | 49,378 | | | 25,619 | |
| | | | | |
| Operating income (loss) | 2,938 | | | (10,863) | | | 2,199 | |
| | | | | |
| Other expenses | | | | | |
| Interest expense | 2,491 | | | 5,139 | | | 4,100 | |
| Loss on extinguishment of debt | 0 | | | 0 | | | 315 | |
| Loss on disposal of assets | 39 | | | 680 | | | 0 | |
| Miscellaneous (income) expense | (595) | | | (232) | | | 158 | |
| 1,935 | | | 5,587 | | | 4,573 | |
| | | | | |
| Income (loss) from continuing operations before income tax benefit | 1,003 | | | (16,450) | | | (2,374) | |
| | | | | |
| Income tax benefit | 3,963 | | | 3,566 | | | 646 | |
| | | | | |
| | | | | |
| | | | | |
| | | | | |
| | | | | |
| Income (loss) from continuing operations | 4,966 | | | (12,884) | | | (1,728) | |
| | | | | |
| Income (loss) from discontinued operations, net of tax | 26,209 | | | (2,090) | | | (604) | |
| | | | | |
| Net income (loss) | $ | 31,175 | | | $ | (14,974) | | | $ | (2,332) | |
| | | | | |
| Basic income (loss) per common share: | | | | | |
| Net income (loss) from continuing operations (dollars) | $ | 0.20 | | | $ | (0.52) | | | $ | (0.07) | |
| Net income (loss) from discontinued operations, net of tax (dollars) | $ | 1.06 | | | $ | (0.08) | | | $ | (0.02) | |
| Net income (loss) (dollars) | $ | 1.26 | | | $ | (0.61) | | | $ | (0.10) | |
| | | | | |
| Basic weighted average number of common shares outstanding | 24,802 | | | 24,698 | | | 24,438 | |
| | | | | |
| Diluted income (loss) per common share: | | | | | |
| Net income (loss) from continuing operations (dollars) | $ | 0.20 | | | $ | (0.52) | | | $ | (0.07) | |
| Net income (loss) from discontinued operations, net of tax (dollars) | $ | 1.03 | | | $ | (0.08) | | | $ | (0.02) | |
| Net income (loss) (dollars) | $ | 1.23 | | | $ | (0.61) | | | $ | (0.10) | |
| | | | | |
| Diluted weighted average number of common shares outstanding | 25,356 | | | 24,698 | | | 24,438 | |
TRECORA RESOURCES AND SUBSIDIARIES
CONSOLIDATED STATEMENTS OF STOCKHOLDERS' EQUITY
For the years ended December 31, 2018, 2017,2020, 2019, and 20162018
| | | | | | | | | | | | | | | | | | | | | | | | | | | | | | | | | | | | | | | | | | | | | | | |
| TRECORA RESOURCES STOCKHOLDERS | | | | | | | | | | |
| | | | | Additional | | | | | | | | Non- | | |
| Common Stock | | Paid-In | | Treasury | | Retained | | | | Controlling | | Total |
| Shares | | Amount | | Capital | | Stock | | Earnings | | Total | | Interest | | Equity |
| (thousands) | | | | | | | | | | | | | | |
| January 1, 2018 | 24,311 | | | $ | 2,451 | | | $ | 56,012 | | | $ | (196) | | | $ | 126,455 | | | $ | 184,722 | | | $ | 289 | | | $ | 185,011 | |
| | | | | | | | | | | | | | | |
| Stock options | | | | | | | | | | | | | | | |
| Issued to Directors | — | | | — | | | (10) | | | — | | | — | | | (10) | | | — | | | (10) | |
| Issued to Employees | — | | | — | | | 154 | | | — | | | — | | | 154 | | | — | | | 154 | |
| Cancellations (see Note 15) | — | | | — | | | (680) | | | — | | | — | | | (680) | | | — | | | (680) | |
| Restricted stock units | | | | | | | | | | | | | | | |
| Issued to Directors | — | | | — | | | 338 | | | — | | | — | | | 338 | | | — | | | 338 | |
| Issued to Employees | — | | | — | | | 1,939 | | | — | | | — | | | 1,939 | | | — | | | 1,939 | |
| Common stock | | | | | | | | | | | | | | | |
| Issued to Directors | 188 | | | 10 | | | 489 | | | 89 | | | — | | | 588 | | | — | | | 588 | |
| Issued to Employees | 183 | | | 2 | | | 127 | | | 155 | | | — | | | 284 | | | — | | | 284 | |
| Stock Exchange | (65) | | | — | | | (66) | | | (65) | | | — | | | (131) | | | — | | | (131) | |
| Warrants exercised | 9 | | | — | | | (9) | | | 9 | | | — | | | — | | | — | | | 0 | |
| Net Loss | — | | | — | | | — | | | — | | | (2,332) | | | (2,332) | | | — | | | (2,332) | |
| | | | | | | | | | | | | | | |
| December 31, 2018 | 24,626 | | | $ | 2,463 | | | $ | 58,294 | | | $ | (8) | | | $ | 124,123 | | | $ | 184,872 | | | $ | 289 | | | $ | 185,161 | |
| | | | | | | | | | | | | | | |
| | | | | | | | | | | | | | | |
| | | | | | | | | | | | | | | |
| | | | | | | | | | | | | | | |
| Restricted stock units | | | | | | | | | | | | | | | |
| Issued to Directors | — | | | — | | | 353 | | | — | | | — | | | 353 | | | — | | | 353 | |
| Issued to Employees | — | | | — | | | 883 | | | — | | | — | | | 883 | | | — | | | 883 | |
| Common stock | | | | | | | | | | | | | | | |
| Issued to Directors | 20 | | | 1 | | | — | | | 8 | | | — | | | 9 | | | — | | | 9 | |
| Issued to Employees | 104 | | | 11 | | | — | | | — | | | — | | | 11 | | | — | | | 11 | |
| Net Loss | — | | | — | | | — | | | — | | | (14,974) | | | (14,974) | | | — | | | (14,974) | |
| | | | | | | | | | | | | | | |
| December 31, 2019 | 24,750 | | | $ | 2,475 | | | $ | 59,530 | | | $ | 0 | | | $ | 109,149 | | | $ | 171,154 | | | $ | 289 | | | $ | 171,443 | |
| | | | | | | | | | | | | | | |
| | | | | | | | | | | | | | | |
| | | | | | | | | | | | | | | |
| | | | | | | | | | | | | | | |
| Restricted stock units | | | | | | | | | | | | | | | |
| Issued to Directors | — | | | — | | | 1,369 | | | — | | | — | | | 1,369 | | | — | | | 1,369 | |
| Issued to Employees | — | | | — | | | 420 | | | — | | | — | | | 420 | | | — | | | 420 | |
| Common stock | | | | | | | | | | | | | | | |
| Issued to Directors | 56 | | | 5 | | | (5) | | | — | | | — | | | — | | | — | | | 0 | |
| Issued to Employees | 27 | | | 3 | | | (3) | | | — | | | — | | | — | | | — | | | 0 | |
| Net Income | — | | | — | | | — | | | — | | | 31,175 | | | 31,175 | | | — | | | 31,175 | |
| | | | | | | | | | | | | | | |
| December 31, 2020 | 24,833 | | | $ | 2,483 | | | $ | 61,311 | | | $ | 0 | | | $ | 140,324 | | | $ | 204,118 | | | $ | 289 | | | $ | 204,407 | |
|
| | | | | | | | | | | | | | | | | | | | | | | | | | | | | | |
| | TRECORA RESOURCES STOCKHOLDERS | | | | | | | | | | |
| | | | | | Additional | | | | | | | | Non- | | |
| | Common Stock | | Paid-In | | Treasury | | Retained | | | | Controlling | | Total |
| | Shares | | Amount | | Capital | | Stock | | Earnings | | Total | | Interest | | Equity |
| | (thousands) |
| | | | | | | | | | | | | | |
| January 1, 2016 | 24,158 |
| | $ | 2,416 |
| | $ | 50,662 |
| | $ | — |
| | $ | 89,018 |
| | $ | 142,096 |
| | $ | 289 |
| | $ | 142,385 |
|
| | | | | | | | | | | | | | | | |
| Stock options | | | | | | | | | | | | | | | |
| Issued to Directors | — |
| | — |
| | 173 |
| | — |
| | — |
| | 173 |
| | — |
| | 173 |
|
| Issued to Employees | — |
| | — |
| | 1,234 |
| | — |
| | — |
| | 1,234 |
| | — |
| | 1,234 |
|
| Issued to Former Director | — |
| | — |
| | 48 |
| | — |
| | — |
| | 48 |
| | — |
| | 48 |
|
| Restricted common stock | | | | | | | | | | | — |
| | | | — |
|
| Issued to Directors | — |
| | — |
| | 254 |
| | — |
| | — |
| | 254 |
| | — |
| | 254 |
|
| Issued to Employees | — |
| | — |
| | 783 |
| | — |
| | — |
| | 783 |
| | — |
| | 783 |
|
| Common stock | | | | | | | | | | | — |
| | | | — |
|
| Issued to Directors | 13 |
| | 2 |
| | 58 |
| | — |
| | — |
| | 60 |
| | — |
| | 60 |
|
| Issued to Employees | 51 |
| | 3 |
| | (8 | ) | | 16 |
| | — |
| | 11 |
| | — |
| | 11 |
|
| Treasury stock transferred from TOCCO to TREC | — |
| | 30 |
| | 270 |
| | (300 | ) | | — |
| | — |
| | — |
| | — |
|
| Net Income | — |
| | — |
| | — |
| | — |
| | 19,428 |
| | 19,428 |
| | — |
| | 19,428 |
|
| | | | | | | | | | | | | | | | |
| December 31, 2016 | 24,222 |
|
| $ | 2,451 |
|
| $ | 53,474 |
|
| $ | (284 | ) |
| $ | 108,446 |
|
| $ | 164,087 |
|
| $ | 289 |
|
| $ | 164,376 |
|
| | | | | | | | | | | | | | | | |
| Stock options | | | | | | | | | | | | | | | |
| Issued to Directors | — |
| | — |
| | 100 |
| | — |
| | — |
| | 100 |
| | — |
| | 100 |
|
| Issued to Employees | — |
| | — |
| | 1,171 |
| | — |
| | — |
| | 1,171 |
| | — |
| | 1,171 |
|
| Restricted stock units | | | | | | | | | | | | | | | |
| Issued to Directors | — |
| | — |
| | 310 |
| | — |
| | — |
| | 310 |
| | — |
| | 310 |
|
| Issued to Employees | — |
| | — |
| | 1,136 |
| | — |
| | — |
| | 1,136 |
| | — |
| | 1,136 |
|
| Common stock | | | | | | | | | | | | | | | |
| Issued to Directors | 29 |
| | — |
| | (84 | ) | | 29 |
| | — |
| | (55 | ) | | — |
| | (55 | ) |
| Issued to Employees | 57 |
| | — |
| | (92 | ) | | 56 |
| | — |
| | (36 | ) | | — |
| | (36 | ) |
| Warrants exercised | 3 |
| | — |
| | (3 | ) | | 3 |
| | — |
| | — |
| | — |
| | — |
|
| Net Income | — |
| | — |
| | — |
| | — |
| | 18,009 |
| | 18,009 |
| | — |
| | 18,009 |
|
| | | | | | | | | | | | | | | | |
| December 31, 2017 | 24,311 |
|
| $ | 2,451 |
|
| $ | 56,012 |
|
| $ | (196 | ) |
| $ | 126,455 |
|
| $ | 184,722 |
|
| $ | 289 |
|
| $ | 185,011 |
|
| | | | | | | | | | | | | | | | |
| Stock options | | | | | | | | | | | | | | | |
| Issued to Directors | — |
| | — |
| | (10 | ) | | — |
| | — |
| | (10 | ) | | — |
| | (10 | ) |
| Issued to Employees | — |
| | — |
| | 154 |
| | — |
| | — |
| | 154 |
| | — |
| | 154 |
|
| Cancellations (see Note 15) | — |
| | — |
| | (680 | ) | | — |
| | — |
| | (680 | ) | | | | (680 | ) |
| Restricted stock units | | | | | | | | | | | | | | | |
| Issued to Directors | — |
| | — |
| | 338 |
| | — |
| | — |
| | 338 |
| | — |
| | 338 |
|
| Issued to Employees | — |
| | — |
| | 1,939 |
| | — |
| | — |
| | 1,939 |
| | — |
| | 1,939 |
|
| Common stock | | | | | | | | | | | | | | | |
| Issued to Directors | 188 |
| | 10 |
| | 489 |
| | 89 |
| | — |
| | 588 |
| | — |
| | 588 |
|
| Issued to Employees | 183 |
| | 2 |
| | 127 |
| | 155 |
| | — |
| | 284 |
| | — |
| | 284 |
|
| | | | | | | | | | | | | | | | | |
| TRECORA RESOURCES AND SUBSIDIARIES |
| CONSOLIDATED STATEMENTS OF CASH FLOWS |
| For the years ended December 31, |
| | | | | |
| 2020 | | 2019 | | 2018 |
| (thousands of dollars) |
| OPERATING ACTIVITIES | | | | | |
| Net Income (Loss) | $ | 31,175 | | | $ | (14,974) | | | $ | (2,332) | |
| Income (Loss) from Discontinued Operations | 26,209 | | | (2,090) | | | (604) | |
| Income (Loss) from Continuing Operations | $ | 4,966 | | | $ | (12,884) | | | $ | (1,728) | |
| Adjustments to reconcile Income (Loss) from Continuing Operations to Net Cash Provided by Operating Activities: | | | | | |
| Depreciation and Amortization | 14,306 | | | 14,345 | | | 12,497 | |
| Amortization of Intangible Assets | 1,842 | | | 1,856 | | | 1,861 | |
| | | | | |
| Stock-based Compensation | 1,912 | | | 1,250 | | | 1,753 | |
| Deferred Income Taxes | 14,553 | | | (2,993) | | | (1,377) | |
| Postretirement Obligation | (7) | | | (38) | | | (825) | |
| Bad Debt Expense (Recoveries) | 0 | | | (23) | | | 152 | |
| Amortization of Loan Fees | 181 | | | 181 | | | 261 | |
| Loss on Extinguishment of Debt | 0 | | | 0 | | | 315 | |
| Loss on Disposal of Assets | 39 | | | 680 | | | 0 | |
| Impairment of Goodwill and Certain Intangibles | 0 | | | 24,152 | | | 0 | |
| Changes in Operating Assets and Liabilities: | | | | | |
| (Increase) Decrease in Trade Receivables | 1,018 | | | 816 | | | (1,485) | |
| (Increase) Decrease in Taxes Receivable | (2,606) | | | 0 | | | 5,401 | |
| Decrease in Inventories | 680 | | | 2,914 | | | 1,911 | |
| (Increase) Decrease in Prepaid Expenses and Other Assets | (2,403) | | | (304) | | | (1,222) | |
| Increase (Decrease) in Other Liabilities | (5,739) | | | 581 | | | 33 | |
| Increase (Decrease) in Accounts Payable and Accrued Liabilities | 831 | | | (4,944) | | | 2,202 | |
| | | | | |
| Net Cash Provided by Operating Activities - Continuing Operations | 29,573 | | | 25,589 | | | 19,749 | |
| Net Cash (Used in) Provided by Operating Activities - Discontinued Operations | (4,008) | | | (468) | | | 146 | |
| Net Cash Provided by Operating Activities | 25,565 | | | 25,121 | | | 19,895 | |
| INVESTING ACTIVITIES | | | | | |
| Additions to Plant, Pipeline and Equipment | (13,351) | | | (10,079) | | | (25,285) | |
| Proceeds from PEVM | 150 | | | 27 | | | 0 | |
| Net Cash Used in Investing Activities - Continuing Operations | (13,201) | | | (10,052) | | | (25,285) | |
| Net Cash Provided by Investing Activities - Discontinued Operations | 68,530 | | | 4,021 | | | 5,414 | |
| Net Cash Provided by (Used in) Investing Activities | 55,329 | | | (6,031) | | | (19,871) | |
| FINANCING ACTIVITIES | | | | | |
| | | | | |
| Net Cash (Paid) Received Related to Stock-Based Compensation | (123) | | | (305) | | | 860 | |
| Additions to CARES Act, PPP Loans | 6,123 | | | 0 | | | 0 | |
| Additions to Long-Term Debt | 20,000 | | | 2,000 | | | 18,177 | |
| Repayment of Long-Term Debt | (57,375) | | | (21,375) | | | (15,354) | |
| Net Cash (Used in) Provided by Financing Activities | (31,375) | | | (19,680) | | | 3,683 | |
| | | | | |
| NET INCREASE (DECREASE) IN CASH AND CASH EQUIVALENTS | 49,519 | | | (590) | | | 3,707 | |
| CASH AND CASH EQUIVALENTS AT BEGINNING OF YEAR | 6,145 | | | 6,735 | | | 3,028 | |
|
| | | | | | | | | | | | | | | | | | | | | | | | | | | | | | |
| Stock Exchange (see Notes 10 & 18) | (65 | ) | | — |
| | (66 | ) | | (65 | ) | | — |
| | (131 | ) | | — |
| | (131 | ) |
| Warrants | 9 |
| | — |
| | (9 | ) | | 9 |
| | — |
| | — |
| | — |
| | — |
|
| Net Income (Loss) | — |
| | — |
| | — |
| | — |
| | (2,332 | ) | | (2,332 | ) | | — |
| | (2,332 | ) |
| | | | | | | | | | | | | | | | |
| December 31, 2018 | 24,626 |
|
| $ | 2,463 |
|
| $ | 58,294 |
|
| $ | (8 | ) |
| $ | 124,123 |
|
| $ | 184,872 |
|
| $ | 289 |
|
| $ | 185,161 |
|
| | | | | | | | | | | | | | | | | |
| TRECORA RESOURCES AND SUBSIDIARIES |
| CONSOLIDATED STATEMENTS OF CASH FLOWS |
| For the years ended December 31, |
| | | | | |
| 2020 | | 2019 | | 2018 |
| (thousands of dollars) |
| CASH AND CASH EQUIVALENTS AT END OF YEAR | $ | 55,664 | | | $ | 6,145 | | | $ | 6,735 | |
| | | | | |
| Supplemental disclosure of cash flow information: | | | | | |
| Cash payments for interest | $ | 2,266 | | | $ | 4,731 | | | $ | 4,560 | |
| Cash payments (net of refunds) for taxes | $ | (11,069) | | | $ | 53 | | | $ | (4,182) | |
| | | | | |
| Supplemental disclosure of non-cash items: | | | | | |
| Capital expansion amortized to depreciation expense | $ | 821 | | | $ | 792 | | | $ | 787 | |
| Cash held in escrow by AMAK | $ | 1,877 | | | $ | 0 | | | $ | 0 | |
| Foreign taxes paid by AMAK | $ | 270 | | | $ | 0 | | | $ | 0 | |
| Stock exchange (Notes 10 & 18) | $ | 0 | | | $ | 0 | | | $ | 131 | |
|
| | | | | | | | | | | |
| TRECORA RESOURCES AND SUBSIDIARIES |
| | | | | | |
| CONSOLIDATED STATEMENTS OF CASH FLOWS |
| | | | | | |
| For the years ended December 31, |
| | | | | | |
| | 2018 |
| | 2017 |
| | 2016 |
|
| | (thousands of dollars) |
| Operating activities | | | | | |
| Net income (loss) attributable to Trecora Resources | $ | (2,332 | ) | | $ | 18,009 |
| | $ | 19,428 |
|
| Adjustments to reconcile net income (loss) attributable | | | | | |
| to Trecora Resources to net cash provided by operating activities: | | | | | |
| Depreciation | 12,497 |
| | 9,100 |
| | 7,896 |
|
| Amortization of intangible assets | 1,861 |
| | 1,861 |
| | 1,880 |
|
| Unrealized gain on derivative instruments | — |
| | (58 | ) | | (119 | ) |
| Share-based compensation | 1,753 |
| | 2,707 |
| | 2,552 |
|
| Deferred income taxes | (1,566 | ) | | (5,841 | ) | | 8,697 |
|
| Postretirement obligation | (825 | ) | | (11 | ) | | 271 |
|
| Bargain purchase gain from acquisition | — |
| | — |
| | (11,549 | ) |
| Equity in loss of AMAK | 901 |
| | 4,261 |
| | 1,479 |
|
| Gain from additional equity issuance by AMAK | — |
| | — |
| | (3,168 | ) |
| Bad debt expense | 152 |
| | — |
| | 90 |
|
| Amortization of loan fees | 261 |
| | 247 |
| | 272 |
|
| Loss on extinguishment of debt | 315 |
| | — |
| | — |
|
| Changes in operating assets and liabilities: | | | | | |
| Increase in trade receivables | (1,485 | ) | | (3,586 | ) | | (2,809 | ) |
| (Increase) decrease in taxes receivable | 5,401 |
| | (1,601 | ) | | 3,689 |
|
| (Increase) decrease in inventories | 1,911 |
| | (579 | ) | | (2,067 | ) |
| Increase in prepaid expenses and other assets | (1,222 | ) | | (806 | ) | | (1,022 | ) |
| Increase (decrease) in other liabilities | 33 |
| | 142 |
| | (174 | ) |
| Increase in accounts payable and accrued liabilities | 2,240 |
| | 6,983 |
| | 3,168 |
|
| Net cash provided by operating activities | 19,895 |
| | 30,828 |
| | 28,514 |
|
| | | | | | |
| Investing activities | | | | | |
| Additions to plant, pipeline and equipment | (25,285 | ) | | (51,584 | ) | | (38,484 | ) |
| Acquisition of B Plant | — |
| | — |
| | (2,011 | ) |
| Proceeds from AMAK share repurchase (Note 10) | 5,347 |
| | — |
| | — |
|
| Advances to AMAK, net | 67 |
| | (107 | ) | | (14 | ) |
| Net cash used in investing activities | (19,871 | ) | | (51,691 | ) | | (40,509 | ) |
| | | | | | |
| Financing Activities | | | | | |
| Issuance of common stock | — |
| | 25 |
| | 11 |
|
| Net cash received (paid) related to stock-based compensation | 860 |
| | (106 | ) | | — |
|
| Additions to long-term debt | 18,177 |
| | 26,000 |
| | 8,000 |
|
| Repayment of long-term debt | (15,354 | ) | | (10,417 | ) | | (6,250 | ) |
| Net cash provided by in financing activities | 3,683 |
| | 15,502 |
| | 1,761 |
|
|
| | | | | | | | | | | |
| TRECORA RESOURCES AND SUBSIDIARIES |
| | | | | | |
| CONSOLIDATED STATEMENTS OF CASH FLOWS |
| | | | | | |
| For the years ended December 31, |
| | | | | | |
| | 2018 |
| | 2017 |
| | 2016 |
|
| | (thousands of dollars) |
| | | | | | |
| Net increase (decrease) in cash and cash equivalents | 3,707 |
| | (5,361 | ) | | (10,234 | ) |
| | | | | | |
| Cash and cash equivalents at beginning of year | 3,028 |
| | 8,389 |
| | 18,623 |
|
| | | | | | |
| Cash and cash equivalents at end of year | $ | 6,735 |
| | $ | 3,028 |
| | $ | 8,389 |
|
| | | | | | |
| Supplemental disclosure of cash flow information: | | | | | |
| Cash payments for interest | $ | 4,560 |
| | $ | 3,540 |
| | $ | 2,545 |
|
| Cash payments (net of refunds) for taxes | $ | (4,182 | ) | | $ | 92 |
| | $ | (1,630 | ) |
| | | | | | |
| Supplemental disclosure of non-cash items: | | | | | |
| Capital Expansion amortized to depreciation expense | $ | 787 |
| | $ | 840 |
| | $ | 1,047 |
|
| Estimated earnout liability (Note 3) | $ | — |
| | $ | — |
| | $ | 733 |
|
| Stock exchange (Notes 10 & 18) | $ | 131 |
| | $ | — |
| | $ | — |
|
NOTE 1 - BUSINESS AND OPERATIONS OF THE COMPANY
Trecora Resources formerly Arabian American Development Company, (the "Company"“Company”) was organized as a Delaware corporation in 1967. The Company'sCompany’s principal business activities are the manufacturing of various specialty petrochemicalpetrochemicals products, specialty waxes and providing custom processing services. The Company owns 33% of a Saudi Arabian joint stock company, Al Masane Al Kobra Mining Company ("AMAK") (see Note 10) and approximately 55% of the capital stock of a Nevada mining company, Pioche Ely Valley Mines, Inc. ("PEVM"), which does not conduct any substantial business activity but owns undeveloped properties in the United States.
The Company'sCompany’s specialty petrochemicalpetrochemicals operations are primarily conducted through a wholly-owned subsidiary, Texas Oil and Chemical Co. II, Inc. ("TOCCO"(“TOCCO”). TOCCO owns all of the capital stock of South Hampton Resources, Inc. ("SHR"(“SHR”) and Trecora Chemical, Inc. ("TC"(“TC”). SHR owns all of the capital stock of Gulf State Pipe Line Company, Inc. ("GSPL"(“GSPL”). SHR owns and operates a specialty petrochemicalpetrochemicals product facility nearin Silsbee, Texas which manufactures high purity hydrocarbons used primarily in polyethylene, packaging, polypropylene, expandable polystyrene, poly-iso/urethane foams, Canadian tar sands, and in the catalyst support industry. TC owns and operates a facility located in Pasadena, Texas which manufactures specialty waxes and provides custom processing services. These specialty waxes are used in the production of coatings, hot melt adhesives and lubricants. GSPL owns and operates pipelines that connect the SHR facility to a natural gas line, to SHR'sSHR’s truck and rail loading terminal and to a major petroleum pipeline owned by an unaffiliated third party.
The Company owns approximately 55% of the capital stock of a Nevada mining company, Pioche Ely Valley Mines, Inc. (“PEVM”), which does not conduct any substantial business activity but owns undeveloped properties in the United States.
The Company also previously owned 33% of a Saudi Arabian joint stock company, Al Masane Al Kobra Mining Company (“AMAK”). On October 2, 2019, we announced that we had entered into a Share Sale and Purchase Agreement (as amended, the “Purchase Agreement”) pursuant to which we agreed to sell our entire investment in AMAK. The share sale was completed on September 28, 2020. For more information, see Note 6.
We attribute revenues to countries based upon the origination of the transaction. All of our revenues for the years ended December 31, 2018, 2017,2020, 2019, and 2016,2018, originated in the United States. In addition, all of our long-lived assets are in the United States.
For convenience in this report, the terms "Company"“Company", "our"“our", "us"“us", “we" or "we"“TREC" may be used to refer to Trecora Resources and its subsidiaries.
NOTE 2 - SUMMARY OF SIGNIFICANT ACCOUNTING POLICIES
Principles of Consolidation – The consolidated financial statementsConsolidated Financial Statements include the balance sheets, statements of income,operations, stockholders' equity, and cash flows of the Company, TOCCO, TC, SHR, GSPL and PEVM. Other entities which are not controlled but over which the Company has the ability to exercise significant influence such as AMAK, are accounted for using the equity method of accounting. All intercompany profits, transactions and balances have been eliminated.
Cash, Cash Equivalents and Short-Term Investments – Our principal banking and short-term investing activities are with local and national financial institutions. Short-term investments with an original maturity of three months or less are classified as cash equivalents.
Inventories – FinishedFor SHR, finished products and feedstock are recorded at the lower of cost, determined on the first-in, first-out method (FIFO), or market for SHR.market. For TC, inventory is recorded at the lower of cost or market as follows: (1) raw material cost is calculated using the weighted-average cost method and (2) product inventory cost is calculated using the specific cost method.
Trade Receivables and Allowance for Doubtful Accounts – We evaluate the collectability of our trade receivables and adequacy of the allowance for doubtful accounts based upon historical experience and any specific customer financial difficulties of which we become aware. For the year ended December 31, 2020, we decreased the allowance for doubtful accounts balance by $129,000 due to the write off of previously allowed for receivables. For the year ended December 31, 2019, we decreased the balance by $23,000 due to collections of previously allowed for receivables. For the year ended December 31, 2018, we increased the balance by $152,000 due to concerns regarding collectability for a specific customer. For the year ended December 31, 2017, the allowance balance was not increased. In 2016, we increased the balance by $90,000 due to an increase in sales in countries where there is a greater risk of default and limited recourse should this occur. We track customer balances and past due amounts to determine if customers may be having financial difficulties. This, along with historical experience and a working knowledge of each customer, helps determine accounts that should be written off. No amounts wereAmounts written off were $129,000, NaN and NaN in 2020, 2019 and 2018, respectively.
Discontinued Operations – Assets that are sold or 2017. During 2016 we wrote off one accountclassified as held for approximately $93,000.
Notes Receivable – We periodically make changes in or expandsale are classified as discontinued operations provided that the disposal represents a strategic shift that has (or will have) a major effect on our custom processing units at the request of the customer. The cost to make these changes is shared by the customer. Upon completionoperations and financial results (e.g., a disposal of a projectmajor geographical area, a non-interest note receivable is recorded withmajor line of business, a major equity method investment or other major parts of an imputed interest rate. There were no notes receivable outstanding asentity).
Plant, Pipeline and Equipment – Plant, pipeline and equipment are stated at cost. Depreciation is provided over the estimated service lives using the straight-line method. Gains and losses from disposition are included in operations in the period incurred. Maintenance and repairs are expensed as incurred. Major renewals and improvements are capitalized.
Interest costs incurred to finance expenditures during construction phase are capitalized as part of the historical cost of constructing the assets. Construction commences with the development of the design and ends when the assets are ready for use. Capitalized interest costs are included in plant, pipeline and equipment and are depreciated over the service life of the related assets.
Labor costs incurred to self-construct assets are capitalized as part of the historical cost the assets. Construction commences with the development of the design and ends when the assets are ready for use. Capitalized labor costs are included in plant, pipeline and equipment and are depreciated over the service life of the related assets.
Platinum catalyst is included in plant, pipeline and equipment at cost. Amortization of the catalyst is based upon cost less estimated salvage value of the catalyst using the straight line method over the estimated useful life (see Note 8).
Leases – The Company enters into leases as a lessee for rail cars, rail equipment, office space and office equipment in the ordinary course of business. When procuring services, or upon entering into a contract, the Company determines whether an arrangement contains a lease at its inception. As part of that evaluation the Company considers whether there is an implicitly or explicitly identified asset in the arrangement and whether the Company, as the lessee, has the right to control the use of that asset. The Company also reviews all options to extend, terminate, or purchase its right-of-use assets at the inception of the lease and accounts for these options when they are reasonably certain of being exercised. All leases with a term of more than 12 months are recognized as right-of-use (“ROU”) assets and associated lease liabilities in the combined balance sheet. Lease liabilities are measured at the lease commencement date and determined using the present value of the lease payments not yet paid, at the Company’s incremental borrowing rate, which approximates the rate at which the Company would borrow on a secured basis. The interest rate implicit in the lease is generally not determinable in the transactions where the Company is the lessee. The ROU asset equals the lease liability adjusted for any initial direct costs, prepaid rent and lease incentives.
All of the Company’s leases are classified as operating leases. The leases include options to extend or terminate the lease when it is reasonably certain that the Company will exercise that option. The Company made a policy election to not recognize leases with a lease term of 12 months or less in the combined balance sheet. Lease expense for these leases is recognized on a straight-line basis over the lease term.
Goodwill and Other Intangible Assets – Goodwill represents the future economic benefits arising from other assets acquired in the acquisition of TC that are not individually identified and separately recognized. Goodwill and indefinite-lived intangible assets are tested for impairment at least annually; however, these tests are performed more frequently when events or changes in circumstances indicate that the asset may be impaired. Impairment exists when carrying value exceeds fair value. Estimates of fair value are based on appraisals, market prices for comparable assets, or internal estimates of future net cash flows.
Definite-lived intangible assets consist of customer relationships, licenses, permits and developed technology that were acquired as part of the Acquisition of TC.technology. The majority of these assets are being amortized using discounted estimated future cash flows over the term of the related agreements. Intangible assets associated with customer relationships are being amortized using the discounted estimated future cash flows method based upon assumed rates of annual customer attrition. We continually evaluate the reasonableness of the useful lives of these assets. Once these assets are fully amortized, they will be removed from the consolidated balance sheets.
During 2019 we adopted new accounting guidance and removed the second step of the goodwill impairment test. Under step two, an entity was required to determine the fair value of individual assets and liabilities of a reporting unit (including unrecognized assets and liabilities) using the procedure for determining fair values in a business combination. As a result, goodwill impairment is now measured at the amount by which a reporting unit’s carrying amount exceeds its fair value, with any impairment charge limited to the carrying amount of goodwill.
Business Combinations and Related Business Acquisition Costs – Assets and liabilities associated with business acquisitions are recorded at fair value using the acquisition method of accounting. We allocate the purchase price of acquisitions based upon the fair value of each component which may be derived from various observable and unobservable inputs and assumptions. We may use third-party valuation specialists to assist us in this allocation. Initial purchase price allocations are preliminary and subject to revision within the measurement period, not to exceed one year from the date of acquisition. The fair value of property, plant and equipment and intangible assets are based upon the discounted cash flow method that involves inputs that are not observable in the market (Level 3). Goodwill assigned represents the amount of consideration transferred in excess of the fair value assigned to identifiable assets acquired and liabilities assumed.
Business acquisition costs are expensed as incurred and are reported as general and administrative expenses in the consolidated statements of income. We define these costs to include finder'sfinder’s fees, advisory, legal, accounting, valuation, and other professional consulting fees, as well as, travel associated with the evaluation and effort to acquire specific businesses.
Investment in AMAK – We accountPrior to the completion of the sale of our ownership interest in AMAK, we accounted for our investment in AMAK using the equity method of accounting under which we recordrecorded in income our share of AMAK'sAMAK’s income or loss for each period. The amount recorded iswas also adjusted to reflect the amortization of certain differences between the basis in our investment in AMAK and our share of the net assets of AMAK aswas reflected in AMAK'sAMAK’s financial statements (see Note 10)6). Any proceeds received from or payments made to AMAK arewere recorded as decreases or increases in the balance of our investment.
We assess our investment in AMAK for impairment when events are identified, or there are changes in circumstances that may have an adverse effect on the fair value of the investment. We consider recoverable ore reserves, changes in commodity prices, and the amount and timing of the cash flows to be generated by the production of those reserves, as well as, recent equity transactions within AMAK.
Other Assets – Other assets include a license used in specialty petrochemicalpetrochemicals operations, spare parts inventory, insurance receivables and certain specialty petrochemicalpetrochemicals assets. Beginning January 1, 2017, due to the expansion of our plant assets at SHR and TC, we began inventorying spare parts for the repair and maintenance of our plant, pipeline and equipment. Spare parts are accounted for on the first-in, first-out method (FIFO).using FIFO.
Long-Lived Assets Impairment – Long-lived assets are reviewed for impairment whenever events or changes in circumstances indicate that the carrying amount may not be recoverable based on the undiscounted net cash flows to be generated from the asset'sasset’s use. The amount of the impairment loss to be recorded is calculated by the excess of the asset'sasset’s carrying value over its fair value. Fair value is generally determined using a discounted cash flow analysis although other factors including the state of the economy are considered.
Revenue Recognition – The Company adopted Financial Accounting Standards Board ("FASB") Accounting Standards Codification ("ASC") Topic 606 ("ASC 606"), Revenue from Contracts with Customers, and its amendmentswith a date of the initial application of January 1, 2018. As a result, the Company has changed its accounting policy for revenue recognition as detailed below. ASC 606 outlines a single comprehensive model for an entity to use in accounting for revenue arising from all contracts with customers, except where revenues are in scope of another accounting standard. ASC 606 superseded the revenue
recognition requirements in ASC Topic 605, "Revenue Recognition", and most industry specific guidance. ASC Topic 606 sets forth a five-step model for determining when and how revenue is recognized. Under the model, an entity is required to recognize revenue to depict the transfer of goods or services to a customer at an amount reflecting the consideration it expects to receive in exchange for those goods and services. ASC 606 also requires certain additional revenue-related disclosures.
The Company applied the modified retrospective approach under ASC 606 which allows for the cumulative effect of adopting the new guidance on the date of initial application. Use of the modified retrospective approach means the Company's comparative periods prior to initial application are not restated. The initial application was applied to all contracts at the date of the initial application. The Company has determined that the adjustments using the modified retrospective approach did not have a material impact on the date of the initial application along with the disclosure of the effect on prior periods.
Accounting Policy
Beginning on January 1, 2018, revenue is measured based on a consideration specified in a contract with a customer. The Company recognizes revenue when it satisfies a performance obligation by transferring control over a product or service to a customer. In evaluating when a customer has control of the asset we primarily consider whether the transfer of legal title and physical delivery has occurred, whether the customer has significant risks and rewards of ownership, and whether the customer has accepted delivery and a right to payment exists. Taxes assessed by a governmental authority that are both imposed on and concurrent with a specific revenue-producing transaction, that are collected by the Company from a customer, are excluded from revenue. Shipping and handling costs associated with outbound freight after control over a product has transferred to a customer are accounted for as a fulfillment cost and are included in cost of product sales and processing. The Company does not offer material rights of return or service-type warranties.
For the year ended December 31, 2017 the Company recognized revenue according to FASB ASC Topic 605 ("ASC 605"), "Revenue Recognition", when: (1) the customer accepted delivery of the product and title had been transferred or when the service was performed and the Company had no significant obligations remaining to be performed; (2) a final understanding as to specific nature and terms of the agreed upon transaction had occurred; (3) price was fixed and determinable; and (4) collection was assured. Product sales generally met these criteria, and revenue was recognized, when the product was delivered or title was transferred to the customer. Sales revenue was presented net of discounts, allowances, and sales taxes. Freight costs billed to customers were recorded as a component of revenue. Revenues received in advance of future sales of products or prior to the performance of services were presented as deferred revenues. Shipping and handling costs were classified as cost of product sales and processing and were expensed as incurred.
Nature of goods and services
The following is a description of principal activities – separated by reportable segments – from which the Company generates its revenue. For more detailed information about reportable segments, disaggregation of revenues, and contract balance disclosures, see Note 17.
Specialty petrochemicalPetrochemicals segment
The specialty petrochemicalSpecialty Petrochemicals segment of the Company produces eight high purity hydrocarbons and other petroleum based products including isopentane, normal pentane, isohexane and hexane. These products are used in the production of polyethylene, packaging, polypropylene, expandable polystyrene, poly-iso/urethane foams, crude oil from the Canadian tar sands, and in the catalyst support industry. SHR'sSHR’s specialty petrochemicalpetrochemicals products are typically transported to customers by rail car, tank truck, iso-container and ship.
Product Sales – The Company sells individual (distinct) products to its customers on a stand-alone basis (point-of-sale) without any further integration. There is no significant modification of any one or more products sold to fulfill another promised product or service within any of the Company'sCompany’s product sale transactions. The amount of consideration received for product sales is stated within the executed invoice with the customer. Payment for prime product sales is typically due and collected 30 to 60 days subsequent to point of sale.
Processing Fees – The Company'sCompany’s services consist of processing customer supplied feedstocks into custom products including, if requested, services for forming, packaging, and arranging shipping. Pursuant to Tolling Agreements the customer retains title to the feedstocks and processed products. The performance obligation in each Tolling Agreement transaction is the processing of customer provided feedstocks into custom products and is satisfied over time. The amount of consideration received for product sales is stated within the executed invoice with the customer. Payment is typically due and collected within 30 days subsequent to point of sale.
Specialty WaxWaxes segment
The specialty waxSpecialty Waxes segment of the Company manufactures and sells specialty polyethylene and poly alpha olefin waxes and also provides custom processing services for customers.
Product Sales – The Company sells individual (distinct) products to its customers on a stand-alone basis (point-of-sale) without any further integration. There is no significant modification of any one or more products sold to fulfill another promised product or service within any of the Company'sCompany’s product sale transactions. The amount of consideration received for product sales is stated within the executed invoice with the customer. Payment is typically due and collected within 30 days subsequent to point of sale.
Processing Fees – The Company'sCompany’s promised services consist of processing customer supplied feedstocks into custom products including, if requested, services for forming, packaging, and arranging shipping. Pursuant to Tolling Agreements and Purchase Order Arrangements, the customer typically retains title to the feedstocks and processed products. The
performance obligation in each Tolling Agreement transaction and Purchase Order Arrangement is the processing of customer provided feedstocks into custom products and is satisfied over time. The amount of consideration received for product sales is stated within the executed invoice with the customer. Payment is typically due and collected within 30 days subsequent to point of sale.
Shipping and Handling Costs – Shipping and handling costs are classified as cost of product sales and processing and are expensed as incurred.
Retirement Plan – We offer employees the benefit of participating in a 401(k) plan. We match 100% up to 6% of pay with vesting occurring over 2 years. For years ended December 31, 2018, 2017,2020, 2019, and 2016,2018, matching contributions of approximately $1,502,000, $1,412,000,$1,271,000, $1,321,000, and $1,195,000,$1,502,000, respectively, were made on behalf of employees.
Environmental Liabilities – Remediation costs are accrued based on estimates of known environmental remediation exposure. Ongoing environmental compliance costs, including maintenance and monitoring costs, are expensed as incurred.
Other Liabilities – We periodically make changes in or expand our custom processing units at the request of the customer. The cost to make these changes is shared by the customer. Upon completion of a project a note receivable and a deferred liability are recorded to recover the project costs which are then capitalized. At times instead of a note receivable being established, the customer pays an upfront cost. The amortization of other liabilities is recorded as a reduction to depreciation expense over the life of the contract with the customer. As of December 31 of each year, depreciation expense was offset and reduced by approximately $0.8 million, $0.8 million, and $1.0$0.8 million, for 2020, 2019, and 2018, 2017, and 2016, respectively.
Net Income Per Share – We compute basic income per common share based on the weighted-average number of common shares outstanding. Diluted income per common share is computed based on the weighted-average number of common shares outstanding plus the number of additional common shares that would have been outstanding if potential dilutive common shares, consisting of stock options, unvested restricted stock units, and shares which could be issued upon conversion of debt, had been issued (see Note 18).
Foreign Currency – The functional currency for the Company and each of the Company'sCompany’s subsidiaries is the US dollar (USD). Transaction gains or losses as a result of transactions denominated and settled in currencies other than the USD are reflected in the statements of income as foreign exchange transaction gains or losses. We do not employ any practices to minimize foreign currency risks. The functional and reporting currency of AMAK is the Saudi Riyal (SR). In June 1986 the SR was officially pegged to the USD at a fixed exchange rate of 1 USD to 3.75 SR; therefore, we translate SR into our reporting currency of the USD for income statement and balance sheet purposes using the fixed exchange rate. As of December 31, 2018, 20172020, 2019 and 2016,2018, foreign currency translation adjustments were not significant.
Management Estimates – The preparation of consolidated financial statements in conformity with accounting principles generally accepted in the United States of America requires management to make estimates and assumptions that affect the reported amounts of assets and liabilities and disclosure of contingent assets and liabilities at the date of the consolidated financial statements and the reported amounts of revenues and expenses during the reporting periods. Significant estimates include allowance for doubtful accounts receivable and inventory obsolescence; assessment of impairment of our long-lived assets goodwill,and intangible assets and investments,assets; litigation liabilities, post-retirement benefit obligations, guarantee obligations, environmental liabilities, income taxesand current and deferred tax valuation allowances.income taxes. Actual results could differ from these estimates.
In early 2020, the World Health Organization declared the rapidly spreading coronavirus disease (“COVID-19”) outbreak a pandemic. This pandemic has resulted in governments worldwide enacting emergency measures to combat the spread of the virus. The Company considered the impact of COVID-19 on the assumptions and estimates used and determined that there were no material adverse impacts on the Company’s results of operations and financial position at December 31, 2020. The Company is not aware of any specific event or circumstance that would require an update to its estimates or judgments or a revision of the carrying value of its assets or liabilities as of the date of issuance of the financial statements. These estimates may change, as new events occur and additional information is obtained.
Share-Based Compensation – We recognize share-based compensation of stock options granted based upon the fair value of options on the grant date using the Black-Scholes pricing model (see Note 15). Share-based compensation expense recognized during the period is based on the fair value of the portion of share-based payments awards that is ultimately expected to vest. Share-based compensation expense recognized in the consolidated statements of operations for the years ended December 31, 2018, 2017,2020, 2019, and 20162018 includes compensation expense based on the estimated grant date fair value for awards that are ultimately expected to vest, and accordingly has been reduced for estimated forfeitures. Estimated forfeitures at the time of grant are revised, if necessary, in subsequent periods if actual forfeitures differ from those estimates.
Guarantees – We may enter into agreements which contain features that meet the definition of a guarantee under FASB ASC 460 "Guarantees" (see Note 14). These arrangements create two types of obligations:
| |
a) | We have a non-contingent and immediate obligation to stand ready to make payments if certain future triggering events occur. For certain guarantees, a liability is recognized for the stand ready obligation at the inception of the guarantee; and |
| |
b) | We have an obligation to make future payments if those certain future triggering events do occur. A liability for the payment under the guarantee is recognized when 1) it becomes probable that one or more future events will occur, triggering the requirement to make payments under the guarantee and 2) when the payment can be reasonably estimated. |
Fair Value – The carrying value of cash and cash equivalents, trade receivables, taxes receivable, accounts payable, accrued liabilities, and other liabilities approximate fair value due to the immediate or short-term maturity of these financial instruments. The fair value of variable rate long term debt and notes payable reflect recent market transactions and approximate carrying value. We used other observable inputs that would qualify as Level 2 inputs to make our assessment of the approximate fair value of our cash and cash equivalents, trade receivables, taxes receivable, accounts payable, accrued liabilities, other liabilities, notes payable and variable rate long term debt. The fair value of the derivative instruments are described below.
We measure fair value by ASC Topic 820 Fair Value. ASC Topic 820 defines fair value, establishes a framework for measuring fair value, and expands disclosures about fair value measurements. ASC Topic 820 applies to reported balances that are required or permitted to be measured at fair value under existing accounting pronouncements; accordingly, the standard amends numerous accounting pronouncements but does not require any new fair value measurements of reported balances. ASC Topic 820 emphasizes that fair value, among other things, is based on exit price versus entry price, should include assumptions about risk such as nonperformance risk in liability fair values, and is a market-based measurement, not an entity-specific measurement. When considering the assumptions that market participants would use in pricing the asset or liability, ASC Topic 820 establishes a fair value hierarchy that distinguishes between market participant assumptions based on market data obtained from sources independent of the reporting entity (observable inputs that are classified within Levels 1 and 2 of the hierarchy) and the reporting entity'sentity’s own assumptions about market participant assumptions (unobservable inputs classified within Level 3 of the hierarchy). The fair value hierarchy prioritizes inputs used to measure fair value into three broad levels.
In instances where the determination of the fair value measurement is based on inputs from different levels of the fair value hierarchy, the level in the fair value hierarchy within which the entire fair value measurement falls is based on the lowest level input that is significant to the fair value measurement in its entirety. Our assessment of the significance of a particular input to the fair value measurement in its entirety requires judgment and considers factors specific to the asset or liability.
Derivatives – We record derivative instruments as either an asset or liability measured at fair value. Changes in the derivative instrument's fair value are recognized currently in earnings unless specific hedge accounting criteria are met. Special accounting for qualifying hedges allows a derivative instrument's gains and losses to offset related results on the hedged item in the income statement, to the extent effective, and requires that a company must formally document, designate and assess the effectiveness of transactions that receive hedge accounting.
Income Taxes – Deferred tax assets and liabilities are recognized for the future tax consequences attributable to differences between the financial statement carrying amounts of existing assets and liabilities and their respective tax bases. Deferred tax assets and liabilities are measured using enacted tax rates expected to apply to taxable income in the years in which those temporary differences are expected to be recovered or settled. The effect on deferred tax assets and liabilities of a change in tax rates is recognized in income in the period that includes the enactment date. The Company maintains a valuation allowance for a deferred tax asset when it is deemed to be more likely than not that some or all of the deferred tax asset will not be realized.
Our estimate of the potential outcome of any uncertain tax issues is subject to management'smanagement’s assessment of relevant risks, facts, and circumstances existing at that time. We use a more likely than not threshold for financial statement recognition and measurement of tax position taken or expected to be taken in a tax return. To the extent that our assessment of such tax position changes, the change in estimate is recorded in the period in which the determination is made. We report tax-related interest and penalties as a component of income tax expense.
On December 22, 2017, Public Law No. 115-97 known as the Tax Cuts and Jobs Act (TCJA) was enacted. The TCJA included a number of changes to existing U.S. tax laws that impact the Company, most notably a reduction of the U.S. federal corporate income tax rate from a maximum of 35 percent to a flat 21 percent for tax years effective January 1, 2018. The TCJA also implemented a territorial tax system, provided for a one-time deemed repatriation tax on unrepatriated foreign earnings, eliminated the alternative minimum tax (AMT), made AMT credit carryforwards refundable, and permitted the acceleration of depreciation for certain assets placed into service after September 27, 2017. In addition the TJCA created prospective changes beginning in 2018, including repeal of the domestic manufacturing deduction, acceleration of tax revenue recognition,
capitalization of research and development expenditures, additional limitations on executive compensation and limitations on the deductibility of interest.
The Company has elected to recognize the income tax effects of the TCJA in its financial statements in accordance with Staff Accounting Bulletin 118 (SAB 118), which provides guidance for the application of ASC Topic 740 Income Taxes, in the reporting period in which the TCJA was signed into law. Under SAB 118 when a Company does not have the necessary information available, prepared, or analyzed (including computations) in reasonable detail to complete the accounting for certain income tax effects of the TCJA it will recognize provisional amounts if a reasonable estimate can be made. If a reasonable estimate cannot be made then no impact is recognized for the effect of the TCJA. SAB 118 permits an up to one year measurement period to finalize the measurement of the impact of the TCJA.
Reclassifications – Certain reclassifications have been made to prior year balances to conform with the current year presentation.
Subsequent Events – The Company has evaluated subsequent events through March 15, 2019,9, 2021, the date that the consolidated financial statementsConsolidated Financial Statements were approved by management.
NewRecently Adopted Accounting Pronouncements
In May 2014 theEffective January 1, 2020, we adopted Financial Accounting StandardsStandard Board ("FASB"(“FASB”) issued Accounting Standards Update ("ASU"(“ASU”) 2014-9, Revenue from Contracts with Customers ("ASU 2014-9"). ASU 2014-9 supersedes2016-13, Measurement of Credit Losses on Financial Instruments, which changed the revenueway entities recognize impairment of most financial assets. Short-term and long-term financial assets, as defined by the standard, are impacted by immediate recognition requirements of FASB Accounting Standards Codification ("ASC") Topic 605, Revenue Recognition and most industry-specific guidance throughout the Accounting Standards Codification, resultingestimated credit losses in the creation of FASB ASC Topic 606, Revenue from Contracts with Customers. ASU 2014-9 requires entities to recognize revenue in a way that depictsfinancial statements, reflecting the transfer of promised goods or services to customers in annet amount that reflects the consideration to which the entity expectsexpected to be entitled to in exchange for those goods or services. This ASU provides alternative methods of retrospective adoption and is effective for fiscal years, and interim periods within those years, beginning after December 15, 2017.collected. The Company completed its assessment of the impact of the adoption of ASU 2014-9 across all revenue streams. This included reviewing current accounting policies and practices to identify potential differences that would result from applying the requirements under the new standard. We completed contract reviews and validated results of applying the new revenue guidance (Note 2). See Revenue Recognition policy note.this standard did not have a material impact on our Consolidated Financial Statements.
Recent Accounting Pronouncements Not Yet Adopted
In February 2016,December 2019, the FASB issued ASU No. 2016-02, Leases2019-12, Income Taxes (Topic 842).740): Simplifying the Accounting for Income Taxes (ASU 2019-12), which simplifies the accounting for income taxes. This updateguidance will increase transparency and comparability among organizations by recognizing lease assets and lease liabilities on the balance sheet and disclosing key information about leasing arrangements. This update isbe effective for annualus in the first quarter of 2021 on a prospective basis, and interim reporting periods beginning after December 15, 2018, including interim periods within those fiscal years. Earlyearly adoption is permitted. The Company does not expect that the adoption of this guidance will have a material impact on our Consolidated Financial Statements.
In July 2018,March 2020, the FASB issued ASU No. 2018-11, Targeted Improvements to ASC 842, Leases. ASU 2018-11 provided entities with an alternative modified transition method to elect not to recast2020–04, Reference Rate Reform (Topic 848): Facilitation of the comparative periods presented when adopting ASC 842. The new standard provides a numberEffects of optional practical expedients in transition. The Company expects to elect: (1) the ‘package of practical expedients’Reference Rate Reform on Financial Reporting (ASU 2020-04), which permits it notprovides guidance to reassess underalleviate the new standard its prior conclusions about lease identification, lease classification,burden in accounting for reference rate reform by allowing certain expedients and initial direct costsexceptions in applying generally accepted accounting principles to contracts, hedging relationships, and (2) the use-of-hindsight. In addition, the new standard provides practical expedients for an entity’s ongoing accountingother transactions impacted by reference rate reform. The provisions of ASU 2020-04 apply only to those transactions that the Company anticipates making, such as the (1) the election for certain classes of underlying assetreference LIBOR or another reference rate expected to not separate non-lease componentsbe discontinued due to reference rate reform. This guidance is effective from lease componentsMarch 12, 2020 through December 31, 2022 and (2) the election for short-term lease recognition exemption for all leases that qualify. The Company will adopt ASU 842 as of January 1, 2019, using the alternative modified transition method. In preparation of adopting ASC 842, the Companyadoption is implementing additional internal controls to enable future preparation of financial information in accordance with ASC 842. The Company has also substantially completed its evaluation ofoptional. We are currently evaluating the impact on the Company’s lease portfolio. The Company believes the largest impact will be on the consolidated balance sheets for the accounting of rail cars, equipment and office leases, which represents a majority of its operating leases it has entered into as a lessee. These leases will be recognized under the new standard as right of use assets (“ROU”) operating lease liabilities. The Company will also be required to provide expanded disclosures for its leasing arrangements. As of December 31, 2018, the Company had approximately $18.1 million of undiscounted future minimum operating lease commitments that are not recognized on its consolidated balance sheets as determined under the current standard. For a lessee, the results of operations are not expected to significantly change after adoption of the new standard. While substantially complete, the Company is still in the process of finalizing its evaluation of the effect of ASU 8422020-04 on the Company’s financial statements and disclosures, including the determinationour Consolidated Financial Statements.
In January 2017 the FASB issued ASU No. 2017-4, Intangibles – Goodwill and Other (Topic 350). The amendments in ASU 2017-4 simplify the measurement of goodwill by eliminating Step 2 from the goodwill impairment test. Instead, under these amendments, an entity should perform its annual, or interim, goodwill impairment test by comparing the fair value of a reporting unit with its carrying amount. An entity should recognize an impairment charge for the amount by which the carrying amount exceeds the reporting unit's fair value; however, the loss should not exceed the total amount of goodwill allocated to that reporting
unit. The amendments are effective for public business entities for the first interim and annual reporting periods beginning after December 15, 2019. Early adoption is permitted for interim or annual goodwill impairment tests performed on testing dates after January 1, 2017.The amendments also eliminate the requirements for any reporting unit with a zero or negative carrying amount to perform a qualitative assessment and, if it fails that qualitative test, to perform Step 2 of the goodwill impairment test. An entity still has the option to perform the qualitative assessment for a reporting unit to determine if the quantitative impairment test is necessary. The Company has goodwill from prior business combination and performs an annual impairment test or more frequently if changes or circumstances occur that would more-likely-than-not reduce the fair value of the reporting unit below its carrying value. During the year ended December 31, 2018, the Company performed its impairment assessment and determined the fair value of the aggregated reporting units exceed the carrying value, such that the Company's goodwill was not considered impaired. Although the Company cannot anticipate future goodwill impairment assessments, based on the most recent assessment, it is unlikely that an impairment amount would need to be calculated and, therefore, the Company does not anticipate a material impact from these amendments to the Company's financial position and results of operations. The current accounting policies and processes are not anticipated to change, except for the elimination of the Step 2 analysis.
In February 2018 the FASB issued ASU No. 2018-2, Income Statement — Reporting Comprehensive Income (Topic 220): Reclassification of Certain Tax Effects from Accumulated Other Comprehensive Income. ASU 2018-2 was issued to address the income tax accounting treatment of the stranded tax effects within other comprehensive income due to the prohibition of backward tracing due to an income tax rate change that was initially recorded in other comprehensive income due to the enactment of the Tax Cuts and Jobs Act (TCJA) on December 22, 2017, which changed the Company's income tax rate from 35% to 21%. The amendments to the ASU changed US GAAP whereby an entity may elect to reclassify the stranded tax effect from accumulated other comprehensive income to retained earnings. The amendments of the ASU may be adopted in total or in part using a full retrospective or modified retrospective method. The amendments of the ASU are effective for periods beginning after December 15, 2018. The Company believes there will be no material impact to the consolidated financial statements as a result of this update.
In June 2018, the FASB issued ASU No. 2018–07, Improvements to Nonemployee Share–Based Payment Accounting. ASU 2018–07 simplifies the accounting for share–based payments to nonemployees by aligning it with the accounting for share–based payments to employees, with certain exceptions. The amendments in this ASU are effective for public companies for fiscal years beginning after December 15, 2018, including interim periods within that fiscal year. The Company is assessing the effect of ASU 2018–02 on its consolidated financial statements.
NOTE 3 – ACQUISITION OF B PLANT
On May 2, 2016, we purchased the idle BASF facility adjacent to our TC facility in exchange for $2.0 million in cash, transaction costs of approximately $11,000 plus an earnout provision calculated through calendar year 2020 based upon revenue generated by the facility but limited to $1.8 million. The cash payment was funded by working capital. The purchased facility includes production equipment similar to TC's plus equipment that broadens TC's capabilities and potential markets. The 6.5-acre site also includes substantial storage capacity, several rail and truck loading sites and utility tie-ins to TC. We refer to the facility as "B Plant".
We have accounted for the purchase in accordance with the acquisition method of accounting under Financial Accounting Standards Board Accounting Standards Codification Topic 805 "Business Combinations" ("ASC 805"). In accordance with ASC 805, we used our best estimates and assumptions to assign fair value to the tangible assets and liabilities acquired at the acquisition date.
The assets and liabilities acquired have been included in our consolidated balance sheets and our consolidated statements of income since the date of acquisition.
We recorded an $11.5 million bargain purchase gain on the transaction as calculated in the table below (in thousands).
|
| | | | | | | |
| Cash paid | $ | 2,011 |
| | |
| Estimated earnout liability | 733 |
| | |
| Purchase Price | | | $ | 2,744 |
|
| | | | |
| Fixed assets at FMV | | | |
| Land | 980 |
| | |
| Site improvements | 30 |
| | |
| Buildings | 1,350 |
| | |
| Production equipment | 11,933 |
| | |
| | | | 14,293 |
|
| Bargain purchase gain | | | $ | 11,549 |
|
The business acquired had been idle for the periods presented thus proforma financial presentation would be identical to our consolidated results. We began operating the new facility in June 2016.
NOTE 43 - CONCENTRATIONS OF REVENUES AND CREDIT RISK
We sell our products and services to companies in the chemical, plastics, and petroleum industries. We perform periodic credit evaluations of our customers and generally do not require collateral from our customers. For the yearyears ended December 31, 2020, 2019, and 2018, one customer accounted for 17.0%15.4%, 15.0%, and 13.5%, respectively, of consolidated product revenue. For the year ended December 31, 2017, one customer accounted for 19.6% of consolidated product revenue. For the year ended December 31, 2016, one customer accounted for 20.1% of consolidated product revenue. The associated accounts receivable balances for those customersthis customer, ExxonMobil and their affiliates, were approximately $11.0$4.1 million and $4.9 million at December 31, 2018,2020 and $5.8 million at December 31, 2017. The carrying amount of accounts receivable approximates fair value at December 31, 2018, and 2017.
Accounts receivable serves as collateral for our amended and restated loan agreement (see Note 12).2019, respectively.
We market our products in many foreign jurisdictions. For the years ended December 31, 2018, 20172020, 2019, and 2016, specialty petrochemical product sales2018, revenue in foreign jurisdictions accounted for approximately 35.4%24.0%, 20.8%21.9%, and 23.5%25.5% of total product salesconsolidated revenue, respectively.
SHR utilizes one major supplier for itsto purchase all our feedstock supply. The feedstock is a commodity product commonly available from other suppliers if needed. The percentage of feedstock purchased from the supplier during 2018, 2017, and 2016 was 100%, 100.0% and 99%, respectively. At December 31, 2018,2020, and 2017,2019, we owed the supplier approximately $4.7$9.2 million and $8.5$12.4 million, respectively, for feedstock purchases.
We hold our cash with various financial institutions that are insured by the Federal Deposit Insurance Corporation up to $250,000. At times during the year, cash balances may exceed this limit. We have not experienced any losses in such accounts and do not believe we are exposed to any significant risk of loss related to cash.
NOTE 54 – TRADE RECEIVABLES
Trade receivables, net, at December 31, consisted of the following: | | | | | | | | | | | |
| Trade receivables, net, at December 31, consisted of the following: | | | |
| 2020 | | 2019 |
| (thousands of dollars) |
| Trade receivables | $ | 25,601 | | | $ | 26,749 | |
| Less allowance for doubtful accounts | (300) | | | (429) | |
| Trade receivables, net | $ | 25,301 | | | $ | 26,320 | |
|
| | | | | | | |
| | 2018 |
| | 2017 |
|
| | (thousands of dollars) |
| Trade receivables | $ | 27,564 |
| | $ | 26,079 |
|
| Less allowance for doubtful accounts | (452 | ) | | (300 | ) |
| | | | |
| Trade receivables, net | $ | 27,112 |
|
| $ | 25,779 |
|
Trade receivablesAccounts receivable serves as collateral for our amended and restated loan agreement with a domestic bank (see Note 12)13).
NOTE 5 – INVENTORIES
| | | | | | | | | | | |
| Inventories include the following at December 31: | | | |
| 2020 | | 2019 |
| (thousands of dollars) |
| Raw material | $ | 2,580 | | | $ | 2,100 | |
| Work in process | 138 | | | 142 | |
| Finished products | 10,227 | | | 11,382 | |
| Total inventory | $ | 12,945 | | | $ | 13,624 | |
Inventory serves as collateral for our amended and restated loan agreement with a domestic bank (see Note 13).
Inventory included products in transit valued at approximately $3.6 million and $2.9 million at December 31, 2020 and 2019, respectively.
NOTE 6 - INVESTMENT IN AMAK AND DISCONTINUED OPERATIONS
On September 28, 2020, the Company completed the final closing of the previously disclosed sale of its ownership interest in AMAK (the “Share Sale”) to AMAK and certain existing shareholders of AMAK and their assignees (collectively, the “Purchasers”). The Share Sale was completed in multiple closings pursuant to a Share Sale and Purchase Agreement, dated September 22, 2019 (which we refer to herein as the “Purchase Agreement”), among the Company, AMAK, and other Purchasers and resulted in aggregate gross proceeds to the Company of Saudi Riyals (“SAR”) 265 million (approximately $70 million) (before taxes and expenses). As of December 31, 2019, the Company had a non-controlling equity interest of 33.3% in AMAK of approximately $32.9 million.
As a condition to the effectiveness of the Purchase Agreement, the Purchasers advanced 5% of the purchase price (or approximately $3.5 million) in the form of a non-refundable deposit. Pursuant to the Purchase Agreement, (i) with respect to any Purchaser that completed the purchase of all or a portion of the ordinary shares allotted to it under the Purchase Agreement on or before March 31, 2020, the non-refundable deposit paid by such Purchaser (or a portion of such deposit for a partial closing) was credited toward the purchase price of the ordinary shares being purchased and (ii) with respect to any Purchasers that complete the purchase of all or a portion of their allotted ordinary shares after March 31, 2020 but on or
before September 28, 2020, an amount equal to 50% of the non-refundable deposit paid by such Purchasers was forfeited to the Company as liquidated damages and such amount was not applied to the purchase price paid by the applicable Purchaser.
On March 26, 2020, the Company and one Purchaser completed the first closing of the Share Sale (the “First Closing”). In connection with the First Closing, the Company sold 4,000,000 ordinary shares for aggregate gross proceeds (before taxes and transaction expenses) of SAR 40 million (or approximately $10.7 million) (inclusive of the full amount of the Purchaser’s non-refundable deposit previously paid of $0.5 million). The Company recorded a foreign tax payable of approximately $0.3 million related to the First Closing.
During the third quarter of 2020, the Company completed additional closings of the Share Sale with respect to its remaining ownership interest in AMAK. In connection with these closings, the Company sold a total of 22,467,422 ordinary shares for aggregate gross proceeds (before taxes and transaction expenses) of SAR 224 million (or approximately $59.9 million) (inclusive of $1.5 million which constituted 50% of the non-refundable deposits previously paid by certain Purchasers). As none of the third quarter 2020 closings were completed prior to March 31, 2020, the remaining portion of the initial deposits (approximately $1.5 million) were forfeited to the Company as liquidated damages and were not applied to the purchase price. These amounts are included in income from discontinued operations, net of tax. The Company recorded a foreign tax payable of approximately $1.1 million related to the third quarter 2020 closings.
In connection with the completion of the Share Sale, the Company and AMAK entered into an agreement whereby AMAK agreed to withhold approximately $2.1 million of the purchase price to pay the Company’s estimated tax obligations in Saudi Arabia. The Company is in the process of finalizing and filing the necessary tax returns in the Kingdom of Saudi Arabia. Upon payment, the Company will have a foreign tax credit which can be used to offset U.S. taxes. As of December 31, 2020, approximately $0.2 million of foreign taxes have been paid. The remaining funds withheld by AMAK are included in prepaid expenses and other assets on the Company’s consolidated balance sheets as of December 31, 2020. Subsequent to December 31, 2020, the Company instructed AMAK to pay approximately $1.1 million of the accrued foreign tax payable from the amount held by AMAK to cover the Company’s tax obligations in Saudi Arabia.
As previously disclosed, and as a result of the Company’s investment in AMAK, the Company was required to execute a limited guarantee on October 24, 2010 (the “Guarantee”) of up to 41% of a loan (the “Loan”) by the Saudi Industrial Development Fund (“SIDF”) to AMAK to fund the construction of the AMAK facilities and to provide working capital needs. The provision of personal or corporate guarantees, as applicable, by each shareholder of AMAK was a condition to SIDF providing the Loan. Pursuant to the Purchase Agreement, the Purchasers (other than AMAK) agreed, upon the completion of the Share Sale, to assume the Company’s obligation under the Guarantee (proportionately based upon such Purchaser’s percentage acquisition of ordinary shares in the Share Sale). While a formal written release of the Company from the Guarantee was not obtained from SIDF prior to closing, the Company believes that the Purchasers’ assumption of the Company’s obligation under the Guarantee effectively eliminates the Company’s liability arising under the Guarantee.
Included in discontinued operations are the following: | | | | | | | | | | | | | | | | | | | | |
| | | Years Ended December 31, |
| | | 2020 | | 2019 | | 2018 |
| | | (thousands of dollars) |
| Saudi administration and transaction expenses | | $ | (2,452) | | | $ | (187) | | | $ | 136 | |
| Equity in earnings (losses) of AMAK | | 702 | | | (986) | | | (901) | |
| Gain (loss) on sale of equity interest | | 34,926 | | | (1,473) | | | 0 | |
| Income (loss) from discontinued operations before taxes | | 33,176 | | | (2,646) | | | (765) | |
| Tax (expense) benefit | | (6,967) | | | 556 | | | 161 | |
| Income (loss) from discontinued operations, net of tax | | $ | 26,209 | | | $ | (2,090) | | | $ | (604) | |
AMAK’s financial statements were prepared in the functional currency of AMAK which is the SAR. In June 1986 the SAR was officially pegged to the U. S. Dollar at a fixed exchange rate of 1 USD to 3.75 SAR.
The summarized results of operations and financial position for AMAK are as follows: | | | | | | | | | | | | | | | | | | | | |
| Results of Operations | | Nine Months Ended September 30, | | Year Ended December 31, |
| | | 2020 | | 2019 | | 2018 |
| | | (thousands of dollars) |
| Sales | | $ | 62,633 | | | $ | 78,350 | | | $ | 70,234 | |
| Cost of sales | | (55,728) | | | (69,620) | | | (68,084) | |
| Gross profit | | 6,905 | | | 8,730 | | | 2,150 | |
| Selling, general, and administrative | | (4,985) | | | (13,047) | | | (7,860) | |
| Operating income (loss) | | 1,920 | | | (4,317) | | | (5,710) | |
| Other (expense) income | | (346) | | | 558 | | | 86 | |
| Finance and interest expense | | (1,211) | | | (1,450) | | | (1,592) | |
| Income (loss) before Zakat and income taxes | | 363 | | | (5,209) | | | (7,216) | |
| Zakat and income tax (expense) benefit | | (490) | | | (1,801) | | | 487 | |
| Net loss | | $ | (127) | | | $ | (7,010) | | | $ | (6,729) | |
| | | | | | | | | | | | | | |
| Financial Position | | September 30, | | December 31, |
| | | 2020 | | 2019 |
| | | (thousands of dollars) |
| Current assets | | $ | 29,799 | | | $ | 45,354 | |
| Noncurrent assets | | 209,814 | | | 196,564 | |
| Total assets | | $ | 239,613 | | | $ | 241,918 | |
| | | | |
| Current liabilities | | $ | 40,919 | | | $ | 27,645 | |
| Long term liabilities | | 79,122 | | | 79,348 | |
| Stockholders' equity | | 119,572 | | | 134,925 | |
| | | $ | 239,613 | | | $ | 241,918 | |
The equity in the earnings (losses) of AMAK included in income (loss) from discontinued operations, net of tax, on the consolidated statements of operations for the years ended December 31, 2020, 2019, and 2018, is comprised of the following: | | | | | | | | | | | | | | | | | | | | |
| | | Nine Months Ended September 30, | | Year Ended December 31, |
| | | 2020 | | 2019 | | 2018 |
| | | (thousands of dollars) |
| AMAK Net Loss | | (127) | | | (7,010) | | | (6,729) | |
| | | | | | |
| | | | | | |
| Company’s share of loss reported by AMAK | | (308) | | * | (1,996) | | | (2,248) | |
| Amortization of difference between Company’s investment in AMAK and Company’s share of net assets of AMAK | | 1,010 | | | 1,010 | | | 1,347 | |
| Equity in earnings (losses) of AMAK | | 702 | | | (986) | | | (901) | |
| * Percentage of Ownership varies during the period. | | |
NOTE 67 – PREPAID EXPENSES AND OTHER ASSETS
Prepaid expenses and other assets at December 31 are summarized as follows: | | | | | | | | | | | |
| Prepaid expenses and other assets at December 31 are summarized as follows: | | | |
| 2020 | | 2019 |
| (thousands of dollars) |
| Prepaid license | $ | 403 | | | $ | 1,209 | |
| Prepaid insurance | 4,241 | | | 0 | |
| Spare parts | 2,376 | | | 1,857 | |
| Insurance receivable | 0 | | | 1,148 | |
| Cash held by AMAK (see Note 6) | 1,877 | | | 0 | |
| Other prepaid expenses and assets | 301 | | | 733 | |
| Total | $ | 9,198 | | | $ | 4,947 | |
|
| | | | | | | |
| | 2018 | | 2017 |
| | (thousands of dollars) |
| Prepaid license | $ | 2,419 |
| | $ | 1,919 |
|
| Spare parts | 1,597 |
| | 954 |
|
| Other prepaid expenses and assets | 648 |
| | 772 |
|
| Total | $ | 4,664 |
|
| $ | 3,645 |
|
Beginning January 1, 2017, due to the expansion of our plant assets at SHR and TC, we began inventorying spare parts for the repair and maintenance of our plant, pipeline and equipment. Prepaid catalyst has been reclassified into Plant, Pipeline & Equipment to conform to current year reporting.
NOTE 7 – INVENTORIES
Inventories include the following at December 31:
|
| | | | | | | |
| | 2018 |
| | 2017 |
|
| | (thousands of dollars) |
| Raw material | $ | 4,742 |
| | $ | 3,703 |
|
| Work in process | 173 |
| | 27 |
|
| Finished products | 11,624 |
| | 14,720 |
|
| | | | |
| Total inventory | $ | 16,539 |
| | $ | 18,450 |
|
Inventory serves as collateral for our amended and restated loan agreement with a domestic bank (see Note 12).
Inventory included products in transit valued at approximately $4.1 million and $3.7 million at December 31, 2018, and 2017, respectively.
NOTE 8 – PLANT, PIPELINE AND EQUIPMENT
Plant, pipeline and equipment include the following at December 31:
| | | Plant, pipeline and equipment include the following at December 31: | | Plant, pipeline and equipment include the following at December 31: | |
| | 2018 |
| | 2017 |
| | 2020 | | 2019 |
| | (thousands of dollars) | | (thousands of dollars) |
| Platinum catalyst | $ | 1,612 |
| | $ | 1,612 |
| Platinum catalyst | $ | 1,580 | | | $ | 1,580 | |
| Catalyst | 3,131 |
| | 779 |
| Catalyst | 4,325 | | | 4,095 | |
| Land | 5,428 |
| | 5,428 |
| Land | 5,428 | | | 5,428 | |
| Plant, pipeline and equipment | 253,905 |
| | 186,946 |
| Plant, pipeline and equipment | 270,149 | | | 258,651 | |
| Construction in progress | 4,343 |
| | 50,996 |
| Construction in progress | 6,422 | | | 5,052 | |
| Total plant, pipeline and equipment | 268,419 |
| | 245,761 |
| Total plant, pipeline and equipment | 287,904 | | | 274,806 | |
| Less accumulated depreciation | (73,762 | ) | | (63,240 | ) | Less accumulated depreciation | (100,800) | | | (85,887) | |
| Net plant, pipeline and equipment | $ | 194,657 |
| | $ | 182,521 |
| Net plant, pipeline and equipment | $ | 187,104 | | | $ | 188,919 | |
Plant, pipeline and equipment serve as collateral for our amended and restated loan agreement with a domestic bank (see Note 12)13).
Interest capitalized for construction for 2018, 20172020, 2019 and 20162018 was approximately $731,000, $937,000NaN, NaN and $450,000,$0.7 million, respectively.
Labor capitalized for construction for 2018, 20172020, 2019 and 20162018 was approximately $2,307,000, $4,344,000$0.6 million, $0.0 million and $2,889,000,$2.3 million, respectively.
Catalyst amortization relating to the platinum catalyst which is included in cost of sales was approximately $59,000, $25,000$1.2 million, $1.3 million and $98,000$0.1 million for 2018, 20172020, 2019 and 2016,2018, respectively.
NOTE 9 – LEASES
The components of lease expense were as follows:
| | | | | | | | | | | | | | |
| | December 31, |
| ($ in thousands) | Classification in the Consolidated Statements of Operations | 2020 | 2019 | 2018 |
| Operating lease cost (a) | Cost of sales, exclusive of depreciation and amortization | $ | 4,088 | | $ | 4,361 | | $ | 0 | |
| Operating lease cost (a) | Selling, general and administrative | 137 | | 137 | | 0 | |
| Total operating lease cost | | $ | 4,225 | | $ | 4,498 | | $ | 0 | |
| | | | |
| Finance lease cost: | | | | |
| Amortization of right-of-use assets | Depreciation | 0 | | 0 | | 0 | |
| Interest on lease liabilities | Interest Expense | 0 | | 0 | | 0 | |
| Total finance lease cost | | $ | 0 | | $ | 0 | | $ | 0 | |
| | | | |
| Total lease cost | | $ | 4,225 | | $ | 4,498 | | $ | 0 | |
| | | | |
| (a) Short-term lease costs were approximately $0.5 million, $0.1 million and NaN as of December 31, 2020, 2019 and 2018, respectively. |
The Company had 0 variable lease expense during the period. | | | | | | | | | | | | | | |
| | December 31, |
| ($ in thousands) | Classification on the Consolidated Balance Sheets | 2020 | | 2019 |
| Assets: | | | | |
| Operating | Operating lease assets | $ | 10,528 | | | $ | 13,512 | |
| Finance | Property, plant, and equipment | 0 | | | 0 | |
| Total leased assets | | $ | 10,528 | | | $ | 13,512 | |
| | | | |
| Liabilities: | | | | |
| Current | | | | |
| Operating | Current portion of operating lease liabilities | $ | 3,195 | | | $ | 3,174 | |
| Finance | Short-term debt and current portion of long-term debt | 0 | | | 0 | |
| Noncurrent | | | | |
| Operating | Operating lease liabilities | 7,333 | | | 10,338 | |
| Finance | Long-term debt | 0 | | | 0 | |
| Total lease liabilities | | $ | 10,528 | | | $ | 13,512 | |
| | | | | | | | | | | | | | | | | |
| December 31, |
| ($ in thousands) | 2020 | | 2019 | | 2018 |
| Cash paid for amounts included in the measurement of lease liabilities: | | | | | |
| Operating cash flows used for operating leases | $ | 3,713 | | | $ | 4,389 | | | $ | 0 | |
| Operating cash flows used for finance leases | 0 | | | 0 | | | 0 | |
| Financing cash flows used for finance leases | 0 | | | 0 | | | 0 | |
| Right-of-use assets obtained in exchange for lease obligations: | | | | | |
| Operating leases | $ | 206 | | | $ | 81 | | | $ | 0 | |
| Finance leases | 0 | | | 0 | | | 0 | |
| | | | | | | | |
| December 31, |
| | 2020 | 2019 |
| Weighted-average remaining lease term (in years): | | |
| Operating leases | 3.7 | 4.5 |
| Finance leases | 0.0 | 0.0 |
| Weighted-average discount rate: | | |
| Operating leases | 4.5 | % | 4.5 | % |
| Finance leases | 0 | % | 0 | % |
Nearly all of the Company’s lease contracts do not provide a readily determinable implicit rate. For these contracts, the Company’s estimated incremental borrowing rate is based on information available at the inception of the lease.
As of December 31, 2020, maturities of lease liabilities were as follows: | | | | | | | | |
| ($ in thousands) | Operating Leases | Finance Leases |
| 2020 | $ | 3,590 | | $ | 0 | |
| 2021 | 3,268 | | 0 | |
| 2022 | 2,376 | | 0 | |
| 2023 | 1,062 | | 0 | |
| 2024 | 991 | | 0 | |
| Thereafter | 117 | | 0 | |
| Total lease payments | $ | 11,404 | | $ | 0 | |
| Less: Interest | 876 | | 0 | |
| Total lease obligations | $ | 10,528 | | $ | 0 | |
NOTE 910 – GOODWILL AND INTANGIBLE ASSETS, NET
Goodwill
We performed anevaluated our goodwill for impairment analysisduring the fourth quarter of 2019 in connection with our annual review. As part of our review, we assessed 2019 operating performance and its impact on the operating cash flows of our Specialty Waxes reporting unit. We concluded based on this analysis that the estimates of fair value of Goodwill at December 31, 2018, and 2017, and determined that noour Specialty Waxes reporting unit was lower than its book value, including goodwill. As a result, we recorded a non-cash impairment existed.charge of $24.2 million in 2019, representing all of the the goodwill previously allocated to this reporting unit.
Intangible Assets
The following table summarizes the gross carrying amounts and accumulated amortization of intangible assets by major class (in thousands):
| | | | | | | | | | | | | | | | | |
| December 31, 2020 |
Intangible assets subject to amortization
(Definite-lived) | Gross | | Accumulated
Amortization | | Net |
| Customer relationships | $ | 16,852 | | | $ | (7,022) | | | $ | 9,830 | |
| Non-compete agreements | 94 | | | (94) | | | 0 | |
| Licenses and permits | 1,471 | | | (707) | | | 764 | |
| Developed technology | 6,131 | | | (3,832) | | | 2,299 | |
| | | | | |
| | | | | |
| | | | | |
| | | | | |
| Total | $ | 24,548 | | | $ | (11,655) | | | $ | 12,893 | |
|
| | | | | | | | | | | |
| | December 31, 2018 |
Intangible assets subject to amortization (Definite-lived) | Gross |
| | Accumulated Amortization |
| | Net |
|
| Customer relationships | $ | 16,852 |
| | $ | (4,775 | ) | | $ | 12,077 |
|
| Non-compete agreements | 94 |
| | (80 | ) | | 14 |
|
| Licenses and permits | 1,471 |
| | (495 | ) | | 976 |
|
| Developed technology | 6,131 |
| | (2,606 | ) | | 3,525 |
|
| | 24,548 |
|
| (7,956 | ) |
| 16,592 |
|
Intangible assets not subject to amortization (Indefinite-lived) | | | | | |
| Emissions Allowance | 197 |
| | — |
| | 197 |
|
| Trade name | 2,158 |
| | — |
| | 2,158 |
|
| Total | $ | 26,903 |
| | $ | (7,956 | ) | | $ | 18,947 |
|
| | | | December 31, 2017 | | December 31, 2019 |
Intangible assets subject to amortization (Definite-lived) | Gross |
| | Accumulated Amortization |
| | Net |
| Intangible assets subject to amortization
(Definite-lived) | Gross | | Accumulated
Amortization | | Net |
| Customer relationships | $ | 16,852 |
| | $ | (3,651 | ) | | $ | 13,201 |
| Customer relationships | $ | 16,852 | | | $ | (5,898) | | | $ | 10,954 | |
| Non-compete agreements | 94 |
| | (61 | ) | | 33 |
| Non-compete agreements | 94 | | | (94) | | | 0 | |
| Licenses and permits | 1,471 |
| | (390 | ) | | 1,081 |
| Licenses and permits | 1,471 | | | (601) | | | 870 | |
| Developed technology | 6,131 |
| | (1,993 | ) | | 4,138 |
| Developed technology | 6,131 | | | (3,219) | | | 2,912 | |
| | 24,548 |
|
| (6,095 | ) |
| 18,453 |
| |
Intangible assets not subject to amortization (Indefinite-lived) | | | | | | |
| Emissions Allowance | 197 |
| | — |
| | 197 |
| |
| Trade name | 2,158 |
| | — |
| | 2,158 |
| |
| | Total | $ | 26,903 |
|
| $ | (6,095 | ) |
| $ | 20,808 |
| Total | $ | 24,548 | | | $ | (9,812) | | | $ | 14,736 | |
Amortization expense for intangible assets included in cost of sales for the years ended December 31, 2018, 2017,2020, 2019, and 2016,2018, was approximately $1,861,000, $1,861,000,$1.8 million, $1.9 million, and $1,880,000$1.9 million respectively.
Based on identified intangible assets that are subject to amortization as of December 31, 2018,2020, we expect future amortization expenses for each period to be as follows (in thousands):
| | | | | | | | | | | | | | | | | | | | | | | | | | | | | | | | | | | | | | | | | |
| Total | | 2021 | | 2022 | | 2023 | | 2024 | | 2025 | | Thereafter |
| Customer relationships | $ | 9,830 | | | $ | 1,123 | | | $ | 1,123 | | | $ | 1,123 | | | $ | 1,123 | | | $ | 1,123 | | | $ | 4,215 | |
| Licenses and permits | 764 | | | 101 | | | 86 | | | 86 | | | 86 | | | 86 | | | 319 | |
| Developed technology | 2,299 | | | 613 | | | 613 | | | 613 | | | 460 | | | 0 | | | 0 | |
| Total future amortization expense | $ | 12,893 | | | $ | 1,837 | | | $ | 1,822 | | | $ | 1,822 | | | $ | 1,669 | | | $ | 1,209 | | | $ | 4,534 | |
|
| | | | | | | | | | | | | | | | | | | | | | | | | | | |
| | Total |
| | 2019 |
| | 2020 |
| | 2021 |
| | 2022 |
| | 2023 |
| | Thereafter |
|
| Customer relationships | $ | 12,077 |
| | $ | 1,123 |
| | $ | 1,123 |
| | $ | 1,123 |
| | $ | 1,123 |
| | $ | 1,123 |
| | $ | 6,462 |
|
| Non-compete agreements | 14 |
| | 14 |
| | — |
| | — |
| | — |
| | — |
| | — |
|
| Licenses and permits | 976 |
| | 106 |
| | 106 |
| | 101 |
| | 86 |
| | 86 |
| | 491 |
|
| Developed technology | 3,525 |
| | 613 |
| | 613 |
| | 613 |
| | 613 |
| | 613 |
| | 460 |
|
| Total future amortization expense | $ | 16,592 |
|
| $ | 1,856 |
|
| $ | 1,842 |
|
| $ | 1,837 |
|
| $ | 1,822 |
|
| $ | 1,822 |
|
| $ | 7,413 |
|
NOTE 10 - INVESTMENT IN AL MASANE AL KOBRA MINING COMPANY ("AMAK")
We have concluded that we have significant influence over the operating and financial policies of AMAK and, accordingly, should account for our investment in AMAK using the equity method. As of December 31, 2018, and 2017, we had a non-controlling equity interest of approximately $38.7 million and $45.1 million, respectively.
We have received and attached to this Form 10-K the financial statements of AMAK prepared in accordance with generally accepted accounting principles in the United States of America as of December 31, 2018, and 2017, and for each of the three
years ended December 31, 2018. These financial statements have been prepared in the functional currency of AMAK which is the Saudi Riyal (SR). In June 1986 the SR was officially pegged to the U.S. Dollar (USD) at a fixed exchange rate of 1 USD to 3.75 SR.
The summarized results of operation and financial position for AMAK are as follows:
Results of Operations
|
| | | | | | | | | | | |
| | Years Ended December 31, |
| | 2018 |
| | 2017 |
| | 2016 |
|
| | (Thousands of Dollars) |
| Sales | $ | 70,234 |
| | $ | 36,435 |
| | $ | 9,921 |
|
| Cost of sales | (68,084 | ) | | (43,304 | ) | | (27,132 | ) |
| Gross loss | 2,150 |
| | (6,869 | ) | | (17,211 | ) |
| General, administrative and other expenses | 8,879 |
| | 9,903 |
| | 9,690 |
|
| Loss from operations | $ | (6,729 | ) | | $ | (16,772 | ) | | $ | (26,901 | ) |
| Gain on settlement with former operator | — |
| | — |
| | 17,425 |
|
| Net loss | $ | (6,729 | ) | | $ | (16,772 | ) |
| $ | (9,476 | ) |
| Depreciation and amortization | 33,469 |
| | 22,419 |
| | 11,672 |
|
| Net income before depreciation and amortization | $ | 26,740 |
| | $ | 5,648 |
| | $ | 2,196 |
|
Financial Position
|
| | | | | | | |
| | December 31, |
| | 2018 |
| | 2017 |
|
| | (Thousands of Dollars) |
| Current assets | $ | 44,093 |
| | $ | 23,333 |
|
| Noncurrent assets | 212,291 |
| | 237,875 |
|
| Total assets | $ | 256,384 |
|
| $ | 261,208 |
|
| | | | |
| Current liabilities | $ | 17,160 |
| | $ | 24,439 |
|
| Long term liabilities | 77,366 |
| | 68,837 |
|
| Shareholders' equity | 161,858 |
| | 167,932 |
|
| Total liabilities and equity | $ | 256,384 |
|
| $ | 261,208 |
|
The equity in the income or loss of AMAK reflected on the consolidated statements of income for the years ended December 31, 2018, 2017, and 2016, is comprised of the following:
|
| | | | | | | | | | | |
| | 2018 |
| | 2017 |
| | 2016 |
|
| AMAK Net Loss | $ | (6,729 | ) | | $ | (16,772 | ) | | $ | (9,476 | ) |
| Zakat tax applicable to Saudi Arabian shareholders only | — |
| | — |
| | 320 |
|
| AMAK Net Loss before Saudi Arabian shareholders' portion of Zakat | $ | (6,729 | ) |
| $ | (16,772 | ) |
| $ | (9,156 | ) |
| | | | | | |
| Company's share of loss reported by AMAK (33.41% beginning July 10, 2016 and 35.25% prior to July 10, 2016) | $ | (2,248 | ) | | $ | (5,608 | ) | | $ | (2,826 | ) |
| Amortization of difference between Company's investment in AMAK | | | | | |
| and Company's share of net assets of AMAK | 1,347 |
| | 1,347 |
| | 1,347 |
|
| Equity in loss of AMAK | $ | (901 | ) |
| $ | (4,261 | ) |
| $ | (1,479 | ) |
In 2016 the difference between our effective share of income (loss) from our investment and our actual ownership percentage is attributable to the change in our ownership percentage during the third quarter of 2016.
A gain of approximately $16.2 million for the difference between our initial investment in AMAK and our share of AMAK's initial assets recorded at fair value was not recognized in 2008. This basis difference is being amortized over the life of AMAK's
mine which is estimated to be twelve years beginning with its commencement of production in July 2012 as an adjustment to our equity in AMAK's income or loss.
In July 2016 AMAK issued four million shares to provide additional funds for ongoing exploration work and mine start-up activities. Arab Mining Co. ("Armico") purchased 3.75 million shares at SR 20 per share (USD 5.33 per share) and the remaining 250,000 shares are for future use as employee incentives. We did not participate in the offering, thereby reducing our ownership percentage in AMAK to 33.44% from 35.25%. As a result of the equity issuance, our share of the net assets of AMAK increased approximately $3.2 million which we recognized as a gain (with a corresponding increase in our investment) in accordance with ASC 323-10-40-1.
In 2018, we completed an exchange of shares with certain shareholders whereby such shareholders traded 65,000 common shares of TREC in exchange for 24,489 shares of our AMAK stock. The 65,000 shares were accounted for as treasury stock. This transaction reduced our ownership percentage from 33.44% to 33.41%.
The following table shows AMAK shareholders and percentages owned at December 31, 2018:
|
| | |
Name | Percentage Owned |
|
Various Saudi shareholders | 46.73 | % |
Trecora Resources | 33.41 | % |
Armico | 19.86 | % |
Total | 100.00 | % |
As previously announced, AMAK initiated a share repurchase program from its existing shareholders in December 2018. We participated in this share repurchase and received approximately $5.3 million in proceeds from AMAK. We had previously reported, based on information available at the time, that AMAK was repurchasing 10% of its outstanding shares from its existing shareholders on a pro-rata basis. We have since learned that, while a redemption of up to 10% of AMAK's 82 million outstanding shares had been approved by the shareholders, the repurchase program approved by AMAK's board of directors and initiated in December 2018 was with respect to 2.5 million shares. AMAK expects to complete the share repurchase program in 2019, at which point all shares repurchased from AMAK shareholders will be registered as treasury shares. Upon completion of the share repurchase program, the Company does not believe its ownership percentage in AMAK will change from 33.4%.
At December 31, 2018 and 2017, we had a receivable from AMAK of approximately $54,000 and $121,000, respectively, relating to unreimbursed travel and Board expenses which is included in prepaid and other assets.
We assess our investment in AMAK for impairment when events are identified, or there are changes in circumstances that may have an adverse effect on the fair value or recoverability of the investment. We consider recoverable ore reserves and the amount and timing of the cash flows to be generated by the production of those reserves, as well as, recent equity transactions within AMAK. No impairment charges were recorded in 2018, 2017, or 2016.
NOTE 11 - MINERAL PROPERTIES IN THE UNITED STATES
The principal assets of PEVM are an undivided interest in 48 patented and 5 unpatented mining claims totaling approximately 1,500 acres and a 300 ton-per-day mill located on the aforementioned properties in the PEVM Mining District in southeast Nevada. In August 2001 seventy-five unpatented claims were abandoned since they were deemed to have no future value to PEVM. The properties held by PEVM have not been commercially operated for approximately 35 years. In November 2019, PEVM entered into a sales contract which, upon completion of due diligence, may lead to liquidation of substantially all of its remaining assets. Upon closing of the sale, PEVM will be dissolved. Any proceeds from the sale will be used to repay outstanding indebtedness of PEVM owed to the Company. In accordance with the sales contract, in September 2020, approximately $0.2 million of the deposit became non-refundable. The closing of the sale and receipt of remaining proceeds is expected to be completed in late 2021. The sale of PEVM is not anticipated to have a material impact on the Company's Consolidated Financial Statements.
NOTE 12 - LONG-TERM DEBT AND LONG-TERM OBLIGATIONS– ACCRUED LIABILITIES
ARC Agreement | | | | | | | | | | | |
| Accrued liabilities at December 31 are summarized as follows: | | | |
| 2020 | | 2019 |
| (thousands of dollars) |
| Accrued state taxes | $ | 125 | | | $ | 0 | |
| Accrued payroll | 2,282 | | | 1,250 | |
| Accrued royalties | 260 | | 273 |
| Accrued officer compensation | 1,053 | | | 1,687 | |
| Accrued professional expenses | 559 | | | 1,000 | |
| Accrued foreign taxes | 1,054 | | | 0 | |
| Other liabilities | 1,524 | | | 1,532 | |
| Total | $ | 6,857 | | | $ | 5,742 | |
In October 2014, TOCCO, SHR, GSPL and TC (SHR, GSPL and TC collectively the “Guarantors”) entered into an amended and restated credit agreement (as amended to the date hereof, the “ARC Agreement”), which originally provided (i) a revolving credit facility (the “Revolving Facility”) with revolving commitments of $40.0 million and (ii) term loan borrowings consisting of (A) a $70.0 million single advance term loan incurred to partially finance the acquisition of TC (which we refer to as the “Acquisition loan”) and (B) a $25.0 multiple advance term loan facility for which borrowing availability ended on December 31, 2015 (collectively, the “Term Loan Facility” and, together with the Revolving Facility, the “Credit Facilities”).
Only July 31, 2018, TOCCO and the Guarantors entered into a Fourth Amendment to the ARC Agreement (the “Fourth Amendment”) pursuant to which the revolving commitments under the Revolving Facility were increased to $75.0 million. Pursuant to the Fourth Amendment, total borrowings under the Term Loan Facility were increased to $87.5 million under a single combined term loan, which comprised new term loan borrowings together with approximately $60.4 million of previously
outstanding term loans under the Term Loan Facility. The $60.4 million of previously outstanding term loans included the remaining outstanding balances on the Acquisition loan and the multiple advance term loan facility described above. Proceeds of the new borrowings under the Term Loan Facility were used to repay a portion of the outstanding borrowings under the Revolving Facility and pay fees and expenses of the transaction. As of December 31, 2018, we had $18 million in borrowings outstanding under the Revolving Facility and $84.5 million in borrowings outstanding under the Term Loan Facility. In addition, we had approximately $18 million of available borrowings under our Revolving Facility at December 31, 2018. TOCCO’s ability to make additional borrowings under the Revolving Credit Facility at December 31, 2018 was limited by, and in the future may be limited by our obligation to maintain compliance with the covenants contained in the ARC Agreement (including maintenance of a maximum Consolidated Leverage Ratio and minimum Consolidated Fixed Charge Coverage Ratio (each as defined in the ARC Agreement)).
The maturity date for the ARC Agreement is July 31, 2023. Subject to the lenders acceptance of any increased commitment and other conditions, we have the option, at any time, to request an increase to the commitment under the Revolving Facility and/or the Term Loan Facility by an additional amount of up to $50.0 million in the aggregate.
Borrowings under each of the Credit Facilities bear interest on the outstanding principal amount at a rate equal to LIBOR plus an applicable margin of 1.25% to 2.50% or, at our option, the Base Rate plus an applicable margin of 0.25% to 1.50% , in each case, with the applicable margin being determined based on the Consolidated Leverage Ratio of TOCCO. A commitment fee between 0.20% and 0.375% is also payable quarterly on the unused portion of the Revolving Facility. For 2018, the effective interest rate for the Credit Facilities was 4.19%. Borrowings under the Term Loan Facility are subject to quarterly amortization payments based on a commercial style amortization method over a twenty year period; provided, that the final principal installment will be paid on the maturity date and will be in an amount equal to the outstanding borrowings under the Term Loan Facility on such date.
Pursuant to the terms of the ARC Agreement, TOCCO must maintain a maximum Consolidated Leverage Ratio of 4.75 to 1.00 for the four fiscal quarters ended December 31, 2018, 4.25 to 1.00 for the four fiscal quarters ended March 31, 2019, 4.00 to 1.00 for the four fiscal quarters ended June 30, 2019 and 3.75 to 1.00 for the four fiscal quarters ended September 30, 2019. For the four fiscal quarters ended December 31, 2019 and each fiscal quarter thereafter, TOCCO must maintain a Consolidated Leverage Ratio of 3.50 to 1.00 (subject to temporary increase following certain acquisitions). Additionally, TOCCO must maintain a minimum Consolidated Fixed Charge Coverage Ratio as of the end of any fiscal quarter of 1.15 to 1.00.
The ARC Agreement contains, among other things, other customary covenants, including restrictions on the incurrence of additional indebtedness, the granting of additional liens, the making of investments, the disposition of assets and other fundamental changes, transactions with affiliates and the declaration of dividends and other restricted payments. The ARC Agreement further includes customary representations and warranties and events of default, and upon occurrence of such events of default the outstanding obligations under the ARC Agreement may be accelerated and become immediately due and payable and the commitment of the lenders to make loans under the ARC Agreement may be terminated. We were in compliance with all covenants at December 31, 2018.
Principal payments of long-term debt for the next five years and thereafter ending December 31 are as follows:
|
| | |
| Year Ending December 31, | Long-Term Debt |
| | (thousands of dollars) |
| 2019 | 4,375 |
|
| 2020 | 4,375 |
|
| 2021 | 4,375 |
|
| 2022 | 4,375 |
|
| 2023 | 85,812 |
|
| Total | 103,312 |
|
Debt Issuance Costs
Debt issuance costs of approximately $0.9 million were incurred in connection with the Fourth Amendment and the remaining debt issuance costs of $0.3 million from the previous agreements were expensed and are shown as a loss on the extinguishment of debt on the consolidated statements of operations for the year ended December 31, 2018. Unamortized
debt issuance costs of approximately $0.8 million and$0.5 million for the years ended December 31, 2018 and December 31, 2017, have been netted against outstanding loan balances.
Long-term debt and long-term obligations at December 31 are summarized as follows:
|
| | | | | | | |
| | 2018 |
| | 2017 |
|
| | (thousands of dollars) |
| Revolving facility | $ | 18,000 |
| | $ | 35,000 |
|
| Term loan facility | 85,312 |
| | 47,250 |
|
| Acquisition loan | — |
| | 17,333 |
|
| Loan fees | (830 | ) | | (501 | ) |
| | | | |
| Total long-term debt | 102,482 |
|
| 99,082 |
|
| | | | |
| Less current portion including loan fees | 4,194 |
| | 8,061 |
|
| | | | |
| Total long-term debt, less current portion including loan fees | $ | 98,288 |
|
| $ | 91,021 |
|
NOTE 13 – ACCRUED LIABILITIES- LONG-TERM DEBT AND LONG-TERM OBLIGATIONS
Accrued liabilitiesSenior Secured Credit Facilities
As of December 31, 2020, the Company had (i) 0 outstanding borrowings under the senior secured revolving credit facility (the “Revolving Facility”) and (ii) approximately $46.6 million in borrowings outstanding under the senior secured term loan facility (the “Term Loan Facility” and, together with the Revolving Facility, the “Credit Facilities”), in each case, provided by the amended and restated credit agreement, dated as of October 1, 2014 (as amended, the “ARC Agreement”), entered into by TOCCO, SHR, GSPL and TC (SHR, GSPL and TC collectively the “Guarantors”). As of December 31, 2020, the Company had approximately $52.4 million of availability under our Revolving Facility (which has aggregate commitments of $75.0 million under the ARC Agreement). TOCCO’s ability to make additional borrowings under the Revolving Facility at December 31, 2020 was limited by, and in the future may be limited by, the Company’s obligation to maintain compliance with the covenants contained in the ARC Agreement (including maintenance of a maximum Consolidated Leverage Ratio and minimum Consolidated Fixed Charge Coverage Ratio (each as defined in the ARC Agreement)).
The maturity date for the ARC Agreement is July 31, 2023. Subject to the lenders acceptance of any increased commitment and other conditions, TOCCO has the option, at any time, to request an increase to the commitment under the Revolving Facility and/or the Term Loan Facility by an additional amount of up to $50.0 million in the aggregate.
Borrowings under each of the Credit Facilities bear interest on the outstanding principal amount at a rate equal to LIBOR plus an applicable margin of 1.25% to 2.50% or, at our option, the Base Rate plus an applicable margin of 0.25% to 1.50%, in each case, with the applicable margin being determined based on the Consolidated Leverage Ratio of TOCCO. A commitment fee between 0.20% and 0.375% is also payable quarterly on the unused portion of the Revolving Facility. As of December 31, 2020, the year to date effective interest rate for the Credit Facilities was 2.63%. Borrowings under the Term Loan Facility are summarizedsubject to quarterly amortization payments based on a commercial style amortization method over a twenty year period; provided, that the final principal installment will be paid on the maturity date and will be in an amount equal to the outstanding borrowings under the Term Loan Facility on such date.
On May 8, 2020, TOCCO and the Guarantors entered into a Seventh Amendment to the ARC Agreement. Pursuant to the Seventh Amendment, certain amendments were made to the terms of the ARC Agreement, including, among other things, to (a) permit the incurrence of additional indebtedness in the form of loans (the “PPP Loans”) under the United States Small Business Administration Paycheck Protection Program (the “PPP”) and (b) exclude the PPP Loans from the calculation of the Consolidated Leverage Ratio until such time that any portion of the PPP Loans are not forgiven in accordance with the Coronavirus Aid, Relief, and Economic Security Act (the “CARES Act”).
As of the end of each fiscal quarter, TOCCO must maintain a maximum Consolidated Leverage Ratio of 3.50 to 1.00 (subject to temporary increase following certain acquisitions). TOCCO’s Consolidated Leverage Ratio was 1.65 and 2.20 as follows:of December 31, 2020 and December 31, 2019, respectively. Additionally, TOCCO must maintain a minimum Consolidated Fixed Charge Coverage Ratio as of the end of any fiscal quarter of 1.15 to 1.00. TOCCO’s Consolidated Fixed Charge Coverage Ratio was 1.80 and 2.56 as of December 31, 2020 and December 31, 2019, respectively. As noted above, the Consolidated Leverage Ratio specifically excludes the PPP Loans until such time that any portion of the PPP Loans are not forgiven in accordance with the CARES Act. The Company used a portion of the approximately $60 million in net proceeds from the Share Sale, discussed in Note 6, to prepay outstanding borrowings of $30 million under the Term Loan Facility of the Company’s ARC Agreement in September 2020.
|
| | | | | | | |
| | 2018 |
| | 2017 |
|
| | (thousands of dollars) |
| Accrued state taxes | $ | 210 |
| | $ | 272 |
|
| Accrued payroll | 936 |
| | 1,407 |
|
| Accrued interest | 31 |
| | 30 |
|
| Accrued officer compensation | — |
| | 500 |
|
| Accrued restructuring & severance expenses (Note 21) | 1,221 |
| | — |
|
| Accrued foreign taxes | 802 |
| | — |
|
| Other liabilities | 2,239 |
| | 1,752 |
|
| Total | $ | 5,439 |
| | $ | 3,961 |
|
Debt issuance costs of approximately $0.9 million were incurred in connection with the fourth amendment to the ARC Agreement and the remaining debt issuance costs of $0.3 million from the previous agreements were expensed and are shown as a loss on the extinguishment of debt on the consolidated statements of operations for the year ended December 31, 2018. Unamortized debt issuance costs of approximately $0.5 million and $0.6 million for the years ended December 31, 2020 and December 31, 2019, have been netted against outstanding loan balances.
| | | | | | | | | | | |
| Long-term debt and long-term obligations at December 31 are summarized as follows: | | | |
| 2020 | | 2019 |
| (thousands of dollars) |
| Revolving facility | $ | 0 | | | $ | 3,000 | |
| Term loan facility | 46,563 | | | 80,938 | |
| | | |
| Loan fees | (468) | | | (649) | |
| | | |
| Total long-term debt | 46,095 | | | 83,289 | |
| | | |
| Less current portion including loan fees | 4,194 | | | 4,194 | |
| | | |
| Total long-term debt, less current portion including loan fees | $ | 41,901 | | | $ | 79,095 | |
PPP Loans
On May 6, 2020, SHR and TC (collectively, the “Borrowers”) received loan proceeds from the PPP Loans in an aggregate principal amount of approximately $6.1 million under the PPP. The PPP Loans are evidenced by unsecured promissory notes each payable to Bank of America, N.A. The Borrowers fully utilized the PPP Loans to cover payroll and benefits costs in accordance with the relevant terms and conditions of the CARES Act. The PPP Loans mature on May 6, 2022, and bear interest at a stated rate of 1.0% per annum. The Company is pursuing and expects to receive full forgiveness of the PPP Loans in accordance with the provisions of the CARES Act.
NOTE 14 - COMMITMENTS AND CONTINGENCIES
Guarantees
On October 24, 2010, we executed a limited guarantee in favor of the Saudi Industrial Development Fund ("SIDF") whereby we agreed to guaranty up to 41% of the SIDF loan to AMAK in the principal amount of 330.0 million Saudi Riyals (US$88.0 million) (the "Loan"). The term of the loan is currently through June 2022. As a condition of the Loan, SIDF required all shareholders of AMAK to execute personal or corporate guarantees; as a result, the Company's guarantee is for approximately 135.3 million Saudi Riyals (US$36.1 million). The loan was necessary to continue construction of the AMAK facilities and provide working capital needs. Our current assessment is that the probability of contingent performance is remote based on our analysis of the contingent portion of the guarantee which included but was not limited to the following: (1) the SIDF has historically not called guarantees, (2) the value of the assets exceeds the amount of the loan (3) the other shareholders have indicated that they would prioritize their personal guarantees ahead of the corporate guarantee, and (4) according to Saudi Arabian legal counsel, assets outside of Saudi Arabia are protected from the Saudi Court System. We received no consideration in connection with extending the guarantee and did so to maintain and enhance the value of our investment. Our non-contingent and immediate obligation to stand ready to make payments if the events of default under the guarantee occur was not material to the financial statements. The total amount outstanding to the SIDF at December 31, 2018, and 2017 was 305.0 million and 305.0 million Saudi Riyals (US$81.3 million and $81.3 million), respectively.
Operating Lease Commitments
We have operating leases for the rental of approximately 346 railcars for shipping purposes with expiration dates through 2026. Invoices are received and paid on a monthly basis. The total amount of the commitment is approximately $17.3 million over the next 9 years.
We also have an operating lease for our office space in Sugar Land, Texas. The expiration date for this lease is September 2023. The total amount of the commitment is approximately $587,000. In addition, we are required to make periodic payments for property taxes, utilities and common area operating expenses.
In addition, we have operating leases for other equipment such as forklifts and copiers with varying expiration dates through 2023. These commitments are approximately $207,000.
Future minimum property and equipment lease payments under the non-cancelable operating leases at December 31, 2018, are as follows:
|
| | | |
| Year Ending December 31, | |
| | (thousands of dollars) |
| 2019 | $ | 3,670 |
|
| 2020 | 3,583 |
|
| 2021 | 3,418 |
|
| 2022 | 3,107 |
|
| 2023 | 2,288 |
|
| Thereafter | 2,065 |
|
| Total | $ | 18,131 |
|
Rental expense for these operating leases for the years ended December 31, 2018, 2017, and 2016 was $4.4 million, $4.4 million and $4.2 million, respectively.
Litigation
From time to time,The Company is periodically named in legal actions arising from normal business activities. We evaluate the merits of these actions and, if we may become party to litigation or other legal proceedingsdetermine that an unfavorable outcome is probable and can be reasonably estimated, we consider to be a part ofwill establish the ordinary course of our business.necessary reserves. We are not currently involved in any legal proceedings that we believe could reasonably be expected to have a material adverse effect on our business, prospects, financial condition or results of operations. We may become involved in material legal proceedings in the future.
On March 21, 2011, Mr. El Khalidi filed suit againstSupplier Agreements
In accordance with our supplier agreements, on a recurring monthly basis, the Company commits to purchasing a determined volume of feedstock in Texas alleging breachanticipation of contractupcoming requirements. Feedstock purchases are invoiced and other claims. The 88th Judicial District Courtrecorded when they are delivered. As of Hardin County, Texas dismissed all claimsDecember 31, 2020 and counterclaims for want2019, the value of prosecution in this matter on July 24, 2013. The Ninth Court of Appeals subsequently affirmed the dismissal for want of prosecutionremaining undelivered feedstock approximated $9.2 million and the Supreme Court of Texas denied Mr. El Khalidi's petition for review. On May 1, 2014, Mr. El Khalidi refiled his lawsuit against the Company for breach of contract and defamation in the 356th Judicial District Court of Hardin County, Texas. The case was transferred to the 88th Judicial District Court of Hardin County, Texas. The Trial Court dismissed all of Mr. El Khalidi's claims and causes of action with prejudice and the Ninth Court of Appeals affirmed. Mr. El Khalidi filed a petition for review with the Supreme Court of Texas, which was denied April 6, 2018. Mr. El Khalidi filed a motion for rehearing of his petition for review with the Supreme Court of Texas on April 23, 2018. On May 25, 2018, the Supreme Court of Texas denied the motion for rehearing and the matter is considered closed.
Supplier Agreements$12.4 million, respectively.
From time to time, we may incur shortfall fees due to feedstock purchases being below the minimum amounts as prescribed by our agreements with our suppliers. The shortfall fee expenses were not significant$1.1 million, $0.6 million and $0.5 million for the years ended December 31, 2018, 2017,2020, 2019, and 2016.2018.
Environmental Remediation
Amounts charged to expense for various activities related to environmental monitoring, compliance, and improvements were approximately $745,000$0.9 million in 2018, $593,0002020, $0.9 million in 20172019 and $622,000$0.7 million in 2016.2018.
NOTE 15 - SHARE-BASED COMPENSATION
The Stock Option Plan for Key Employees, as well as, the Non-Employee Director Stock Option Plan (hereinafter collectively referred to as the “Stock Option Plans”), were approved by the Company’s shareholders in July 2008. The Stock Option Plans allot for the issuance of up to 1,000,000 shares.
The Trecora Resources Stock and Incentive Plan (the “Plan”) was approved by the Company’s shareholders in June 2012. The Plan allotsallows for the issuance of up to 1,500,0002,500,000 shares in the form of stock options or restricted stock unit awards.
Share-based compensation of approximately $1.8$1.9 million, $2.7$1.3 million, and $2.6$1.8 million was recognized in 2018, 2017,2020, 2019, and 2016,2018, respectively. The Company reclassified approximately $318,000$0.3 million and $0.3 million for 2019 and 2018, respectively, from share-based compensation expense in connection with the restructuring described in Note 21.
Stock Options and Warrant Awards
Stock options and warrants granted under the provisions of the Stock Option Plans permit the purchase of our common stock at exercise prices equal to the closing price of Company common stock on the date the options were granted. The options have terms of 10 years and generally vest ratably over terms of 4 to 5 years. There were no0 stock options or warrant awards issued during 2018, 2017,2020, 2019, or 2016.
A summary of the status of the Company’s stock option and warrant awards is as follows:
|
| | | | | | | | | | | | |
| | Stock Options and Warrants |
| | Weighted Average Exercise Price Per Share |
| | Weighted Average Remaining Contractual Life | | Intrinsic Value (in thousands) |
|
| Outstanding at January 1, 2018 | 1,323,587 |
| | $ | 7.82 |
| | | | |
| Granted | — |
| | — |
| | | | |
| Expired | — |
| | — |
| | | | |
| Exercised | (377,757 | ) | | 5.21 |
| | | | |
| Forfeited | (200,000 | ) | | 3.40 |
| | | | |
| Outstanding at December 31, 2018 | 745,830 |
| | $ | 10.33 |
| | 4.6 | | $ | — |
|
| Expected to vest | — |
| | $ | — |
| | 0.0 | | $ | — |
|
| Exercisable at December 31, 2018 | 745,830 |
| | $ | 10.33 |
| | 4.6 | | $ | — |
|
2018. | | | | | | | | | | | | | | | | | | | | | | | |
| A summary of the status of the Company’s stock option and warrant awards is as follows: |
| Stock Options and Warrants | | Weighted Average Exercise Price Per Share | | Weighted Average Remaining Contractual Life | | Intrinsic
Value
(in thousands) |
| Outstanding at January 1, 2020 | 487,000 | | | $ | 10.87 | | | | | |
| Granted | 0 | | | 0 | | | | | |
| Expired | 0 | | | 0 | | | | | |
| Exercised | 0 | | | 0 | | | | | |
| Forfeited | 0 | | | 0 | | | | | |
| Outstanding at December 31, 2020 | 487,000 | | | $ | 10.87 | | | 2.8 | | $ | 0 | |
| Expected to vest | 0 | | | $ | 0 | | | 0.0 | | $ | 0 | |
| Exercisable at December 31, 2020 | 487,000 | | | $ | 10.87 | | | 2.8 | | $ | 0 | |
The aggregate intrinsic value of options was calculated as the difference between the exercise price of the underlying awards and the quoted price of our common stock. At December 31, 2018,2020, options to purchase approximately 0.50.1 million shares of common stock were in-the-money.
Since no0 options were granted, the weighted average grant-date fair value per share of options granted during the years 2020, 2019, and 2018 2017,was NaN. During 2020, 2019, and 2016 was $0. During 2018 2017, and 2016 the aggregate intrinsic value of options and warrants exercised was approximately $2,630,000, $164,000NaN, $0.1 million and $237,000$2.6 million respectively, determined as of the date of option exercise.
The Company received approximately $912,000, $25,000NaN, NaN and $11,000$0.9 million in cash from the exercise of options during 2018, 20172020, 2019 and 2016,2018, respectively. Of the approximately 378,00085,000 stock options and warrants exercised in 2019, the Company only issued approximately 268,00011,000 shares due to cashless transactions. The tax benefit realized from the exercise in 2019 was insignificant.
A summary of the status of the Company's non-vested options that are expected to vest is presented below:
|
| | | | | | |
| | Shares |
| | Weighted Average Grant-Date Fair Value Per Share |
|
| Non-vested at January 1, 2018 | 325,000 |
| | $ | 6.81 |
|
| Granted | — |
| | — |
|
| Forfeited | (200,000 | ) | | 3.40 |
|
| Vested | (125,000 | ) | | 12.26 |
|
| Non-vested at December 31, 2018 | — |
| | $ | — |
|
Total fair value of options that vested during 2018 was approximately $1,533,000.
As of December 31, 2018,2020, there was no0 unrecognized compensation costs related to non-vested share-based compensation.
Post-retirement compensation of approximately $680,000 and $0$0.7 million during the yearsyear ended December 31, 2018 and 2017, respectively, was reversed related to options awarded to Mr. Hatem El Khalidia former CEO and board member in July 2009. On May 9, 2010, the Board of
Directors determined that Mr. El Khalidihe had forfeited these options and other retirement benefits when he made various demands against the Company and other AMAK shareholders which would benefit him personally and were not in the best interests of the Company and its shareholders. The Company was successful in litigating its right to withdraw the options and benefits and as such, these options and benefits were reversed during the second quarter of 2018.
Restricted Stock and Restricted Stock Unit Awards
Generally, restricted stock and restricted stock unit awards are granted annually to officers and directors of the Company under the provisions of the Plan. Restricted stock units are also granted ad hoc to attract or retain key personnel, and the terms and conditions under which these restricted stock units vest vary by award. The fair market value of restricted stock units granted is equal to the Company’s closing stock price on the date of grant. Restricted stock units granted generally vest ratably over periods ranging from 2.51 to 53 years. Certain awards also include vesting provisions based on performance metrics.
Upon vesting, the restricted stock units are settled by issuing one share of Company common stock per unit.
A summary of the status of the Company's restricted stock units activity is as follows:
|
| | | | | | |
| | Shares of Restricted Stock Units |
| | Weighted Average Grant Date Price per Share |
|
| Outstanding at January 1, 2018 | 387,702 |
| | $ | 11.39 |
|
| Granted | 226,908 |
| | 11.45 |
|
| Forfeited | (103,637 | ) | | 11.39 |
|
| Vested | (105,298 | ) | | 11.99 |
|
| Outstanding at December 31, 2018 | 405,675 |
| | $ | 11.27 |
|
| Expected to vest | 405,675 |
| | |
| | | | | | | | | | | |
| A summary of the status of the Company’s restricted stock units activity is as follows: | | | |
| Shares of Restricted Stock Units | | Weighted Average Grant Date Price per Share |
| Outstanding at January 1, 2020 | 298,864 | | | $ | 9.78 | |
| Granted | 364,637 | | | 6.32 | |
| Forfeited | (15,571) | | | 11.40 | |
| Vested | (71,409) | | | 8.40 | |
| Outstanding at December 31, 2020 | 576,521 | | | $ | 7.51 | |
| Expected to vest | 576,521 | | | |
As of December 31, 2018,2020, there was approximately $2.5$1.3 million of unrecognized compensation costs related to non-vested restricted share-based compensation that is expected to be recognized over a weighted average period of 1.91.1 years.
NOTE 16 – INCOME TAXES
On March 27, 2020, the CARES Act was enacted into law. The provisionCARES Act allows for the deferral of income taxes consisted of the following:
|
| | | | | | | | | | | |
| | Year ended December 31, |
| | 2018 |
| | 2017 |
| | 2016 |
|
| | (thousands of dollars) |
| Current federal provision (benefit) | $ | (74 | ) | | $ | (1,202 | ) | | $ | 1,691 |
|
| Current state provision | 31 |
| | 282 |
| | 18 |
|
| | | | | | |
| Deferred federal provision (benefit) | (974 | ) | | (6,320 | ) | | 8,645 |
|
| Deferred state provision | 210 |
| | 81 |
| | 150 |
|
| | | | | | |
| Income tax expense (benefit) | $ | (807 | ) |
| $ | (7,159 | ) |
| $ | 10,504 |
|
and social security tax payments, a five–year carryback for net operating losses (“NOLs”), changes to interest expense and business loss limitation rules, certain new tax credits, and certain new loans and grants to businesses. In connection with the AMAK share repurchase discussedCARES Act, we recognized $16.5 million in Note 10,NOL carryback claims, of which approximately, $14.1 million was received during the Company anticipates a Saudi Arabianfourth quarter of 2020. In connection with this claim, we received interest income tax liability of approximately $802,000. This amount$0.5 million which is included in accrued liabilitiesmiscellaneous income (expense). Our final refund claim for approximately $2.4 million is still outstanding and will be paid onceis included in taxes receivable on the transaction is complete. We had no Saudi Arabian income tax expense or liability in 2017 or 2016.consolidated balance sheet.
| | | | | | | | | | | | | | | | | |
| The provision (benefit) for income taxes from continuing operations consisted of the following: |
| Year ended December 31, |
| 2020 | | 2019 | | 2018 |
| (thousands of dollars) |
| Current federal benefit | $ | (19,190) | | | $ | 0 | | | $ | (74) | |
| Current state expense | 86 | | | 91 | | | 31 | |
| | | | | |
| Deferred federal expense (benefit) | 15,140 | | | (3,564) | | | (813) | |
| Deferred state expense (benefit) | 1 | | | (93) | | | 210 | |
| | | | | |
| Income tax expense (benefit) | $ | (3,963) | | | $ | (3,566) | | | $ | (646) | |
The difference between the year ended effective tax rate in income tax expense (benefit) and the Federal statutory rate of 21% for the year ended December 31, 2018, and 35% for the years ended December 31 2017 and 2016, is as follows:
| | | | | | | | | | | | | | | | | |
| 2020 | | 2019 | | 2018 |
| (thousands of dollars) |
| Income taxes at U.S. statutory rate | $ | 211 | | | $ | (3,455) | | | $ | (661) | |
| State taxes, net of federal benefit | 71 | | | 256 | | | 234 | |
| Net operating loss carryback | (4,655) | | | 0 | | | 0 | |
| Research and development credits | (518) | | | (203) | | | (263) | |
| Permanent and other items | 928 | | | (164) | | | 44 | |
| | | | | |
| Total tax expense (benefit) | $ | (3,963) | | | $ | (3,566) | | | $ | (646) | |
|
| | | | | | | | | | | |
| | 2018 |
| | 2017 |
| | 2016 |
|
| | (thousands of dollars) |
| Income taxes at U.S. statutory rate | $ | (822 | ) | | $ | 3,885 |
| | $ | 10,476 |
|
| State taxes, net of federal benefit | 234 |
| | 235 |
| | 285 |
|
| Net operating loss carryback | — |
| | (961 | ) | | — |
|
| Research and development credits | (263 | ) | | — |
| | — |
|
| Permanent and other items | 44 |
| | (11 | ) | | (257 | ) |
| Deferred tax impact of US tax reform | — |
| | (10,307 | ) | | — |
|
| Total tax expense (benefit) | $ | (807 | ) |
| $ | (7,159 | ) |
| $ | 10,504 |
|
Permanent differences areThe significant difference in rate is primarily due to the Federal manufacturer's deduction,ability of the Company under the CARES Act to carryback 2018 and 2019 NOLs to a year with a 35% income tax rate. Other permanent differences include the research and development credit, compensation limits, and stock basedstock-based compensation.
The Company has recognized the provisional tax impacts related to the acceleration of depreciation and included these amounts in its consolidated financial statements for the year ended December 31, 2018. After the analysis, the Company did not identify items for which the income tax effects of the TCJA have not been completed and a reasonable estimate could not be determined as of December 31, 2018.
The changes to existing U.S. tax laws as a result of the TCJA, which will have the most significant impact on the Company's federal income taxes are as follows:
Reduction of the U.S. Corporate Income Tax Rate - The Company uses the asset and liability method of accounting for income taxes. Under this method, deferred tax assets and liabilities are recognized for the future tax consequences attributable to differences between the financial statement carrying amounts of existing assets and liabilities and their respective tax basis. Deferred tax assets and liabilities are measured using enacted tax rates expected to apply to taxable income in the years in which those temporary differences are expected to reverse. As a result of the reduction in the U.S. corporate income tax rate from 35% to 21% under the TCJA, the Company revalued its ending net deferred tax liabilities at December 31, 2017.
Acceleration of Depreciation - The Company recognized a provisional reduction to net deferred tax assets attributable to the accelerated depreciation for certain assets placed into service after September 27, 2017. The provisional estimate was finalized including consideration of TCJA on long term construction projects.
Tax effects of temporary differences that give rise to significant portions of federal and state deferred tax assets and deferred tax liabilities were as follows:
|
| | | | | | | |
| | December 31, |
| | 2018 |
| | 2017 |
|
| | (thousands of dollars) |
| Deferred tax liabilities: | | | |
| Plant, pipeline and equipment | $ | (25,169 | ) | | $ | (17,014 | ) |
| Intangible assets | (1,075 | ) | | (778 | ) |
| Other assets | (40 | ) | | (4 | ) |
| Investment in AMAK | (671 | ) | | (1,023 | ) |
| Total deferred tax liabilities | $ | (26,955 | ) |
| $ | (18,819 | ) |
| | | | |
| Deferred tax assets: | | | |
| Accounts receivable | 238 |
| | 198 |
|
| Inventory | 133 |
| | 156 |
|
| Mineral interests | 226 |
| | 226 |
|
| Foreign tax credit | 802 |
| | — |
|
| Net operating loss carryforward | 9,073 |
| | — |
|
| Post-retirement benefits | 79 |
| | 252 |
|
| Stock-based compensation | 954 |
| | 971 |
|
| Gross deferred tax assets | 11,505 |
|
| 1,803 |
|
| Valuation allowance | (226 | ) | | (226 | ) |
| Total net deferred tax assets | $ | 11,279 |
|
| $ | 1,577 |
|
| Net deferred tax liabilities | $ | (15,676 | ) |
| $ | (17,242 | ) |
In connection with the proceeds received from AMAK in connection with its share repurchase program, the Company accrued a deferred tax asset (foreign tax credit) and the corresponding liability for the anticipated Saudi Arabian tax. | | | | | | | | | | | |
| December 31, |
| 2020 | | 2019 |
| (thousands of dollars) |
| Deferred tax liabilities: | | | |
| Plant, pipeline and equipment | $ | (31,119) | | | $ | (29,227) | |
| | | |
| Other assets | (31) | | | (32) | |
| Operating lease asset | (2,211) | | | (2,838) | |
| Total deferred tax liabilities | $ | (33,361) | | | $ | (32,097) | |
| | | |
| Deferred tax assets: | | | |
| Net operating loss carryforward | 0 | | | 11,685 | |
| Intangible assets | 3,396 | | | 3,699 | |
| Operating lease liability | 2,211 | | | 2,838 | |
| Stock-based compensation | 956 | | | 1,093 | |
| Investment in AMAK | 0 | | | 589 | |
| Accounts receivable | 65 | | | 240 | |
| Mineral interests | 226 | | | 226 | |
| Interest expense carryforward | 0 | | | 211 | |
| General business credit | 0 | | | 140 | |
| Inventory | 146 | | | 111 | |
| Post-retirement benefits | 70 | | | 71 | |
| Charitable contributions | 0 | | | 45 | |
| Gross deferred tax assets | 7,070 | | | 20,948 | |
| Valuation allowance | (226) | | | (226) | |
| Total net deferred tax assets | $ | 6,844 | | | $ | 20,722 | |
| Net deferred tax liabilities | $ | (26,517) | | | $ | (11,375) | |
We provided a valuation allowance in 20182020 and 20172019 against certain deferred tax assets because of uncertainties regarding their realization. There was no change inIn connection with the valuation allowance for 2018 or 2017.sale of AMAK, the Company recorded foreign tax expense, recognized as a foreign tax credit, of approximately $1.3 million (See Note 6) during the year ended December 31, 2020.
We file an income tax return in the U.S. federal jurisdiction and a margin tax return in Texas. We received notification from the Internal Revenue Service ("IRS"(“IRS”) in November 2016February 2020 on the selection of theour December 31, 20142017 tax return for audit. The IRS expanded itsAll audit requests are complete and the Company is expecting to includereceive confirmation of the Research and Development ("R&D") Credits for the year ended December 31, 2015. The IRS closed its audit closing without change in March 2018. We alsochange. In prior years, we received notification that Texas will auditselected our R&D credit calculations for 2014 and 2015.2015 for audit. The state of Texas hashad suspended the audit of the Company's R&D credit. Texas istheir examination while they comprehensively reviewingreviewed their audit procedures for consistency. During the fourth quarter of 2019, we received notice that Texas had completed their review of their procedures and initiated additional requests for information. The Company has timely responded to all requested information. We do not expect any changes related to the Federal or Texas audits. Our federal and Texas tax returns remain open for examination for the years 20152016 through 2018.2020.
We recognized no adjustment for uncertain tax positions. As of December 31, 2018,2020, and 2017, no2019, 0 interest or penalties related to uncertain tax positions had been accrued.
NOTE 17 – SEGMENT INFORMATION
We operate in two2 business segments; specialty petrochemicalsegments: Specialty Petrochemicals and specialty waxes.Specialty Waxes. We operate through business segments according to the nature and economic characteristics of our products as well as the manner in which the information is used internally by our key decision maker, who is our Chief Executive Officer. The accounting policies of the reporting segments are the same as those described in Note 2.
Our specialty petrochemicalSpecialty Petrochemicals segment includes SHR and GSPL. Our specialty waxSpecialty Waxes segment includes TC. We also separately identify our corporate overhead which includes financing and administrative activities such as legal, accounting, consulting, investor relations, officer and director compensation, corporate insurance, and other administrative costs.
| | | | | | | | | | | | | | | | | | | | | | | |
| Year Ended December 31, 2020 |
| Specialty Petrochemicals | | Specialty Waxes | | Corporate | | Consolidated |
| (in thousands) |
| Net revenues | $ | 172,350 | | | $ | 36,276 | | | $ | 0 | | | $ | 208,626 | |
| Operating income (loss) before depreciation and amortization | 26,438 | | | 1,762 | | | (9,114) | | | 19,086 | |
| Operating income (loss) | 15,827 | | | (3,760) | | | (9,129) | | | 2,938 | |
| Income (loss) from continuing operations before taxes | 13,294 | | | (3,606) | | | (8,685) | | | 1,003 | |
| Depreciation and amortization | 10,611 | | | 5,522 | | | 16 | | | 16,149 | |
| Capital expenditures | 11,334 | | | 2,017 | | | 0 | | | 13,351 | |
| | | | | | | | | | | | | | | | | | | | | | | | | | | | | |
| Year Ended December 31, 2020 |
| Specialty Petrochemicals | | Specialty Waxes | | Corporate | | Eliminations | | Consolidated |
| | | (in thousands) |
| Intangible assets, net | $ | 0 | | | $ | 12,893 | | | $ | 0 | | | $ | 0 | | | $ | 12,893 | |
| Total assets | 298,198 | | | 83,108 | | | 127,260 | | | (191,733) | | | 316,833 | |
| | | | | | | | | | | | | | | | | | | | | | | |
| Year Ended December 31, 2019 |
| Specialty Petrochemicals | | Specialty Waxes | | Corporate | | Consolidated |
| (in thousands) |
| Net revenues | $ | 224,311 | | | $ | 34,648 | | | $ | 0 | | | $ | 258,959 | |
| Operating income (loss) before depreciation and amortization | 38,860 | | | (24,333) | | | (9,190) | | | 5,337 | |
| Operating income (loss) | 28,304 | | | (29,925) | | | (9,242) | | | (10,863) | |
| Income (loss) from continuing operations before taxes | 23,993 | | | (31,164) | | | (9,279) | | | (16,450) | |
| Depreciation and amortization | 10,556 | | | 5,593 | | | 52 | | | 16,201 | |
| Capital expenditures | 6,955 | | | 3,124 | | | 0 | | | 10,079 | |
| | | | | | | | | | | | | | | | | | | | | | | | | | | | | |
| Year Ended December 31, 2019 |
| Specialty Petrochemicals | | Specialty Waxes | | Corporate | | Eliminations | | Consolidated |
| | | (in thousands) |
| Intangible assets, net | $ | 0 | | | $ | 14,736 | | | $ | 0 | | | $ | 0 | | | $ | 14,736 | |
| Total assets | 289,546 | | | 88,245 | | | 90,203 | | | (166,175) | | | 301,819 | |
|
| | | | | | | | | | | | | | | |
| | Year Ended December 31, 2018 |
| | Specialty Petrochemical |
| | Specialty Wax |
| | Corporate |
| | Consolidated |
|
| | (in thousands) |
| Net revenues | $ | 249,679 |
| | $ | 38,253 |
| | $ | — |
| | $ | 287,932 |
|
| Operating profit (loss) before depreciation and amortization | 23,021 |
| | 1,949 |
| | (8,275 | ) | | 16,695 |
|
| Operating profit (loss) | 14,089 |
| | (3,427 | ) | | (8,327 | ) | | 2,335 |
|
| Profit (loss) before taxes | 10,705 |
| | (4,660 | ) | | (9,184 | ) | | (3,139 | ) |
| Depreciation and amortization | 8,932 |
| | 5,376 |
| | 50 |
| | 14,358 |
|
| Capital expenditures | 22,431 |
| | 2,854 |
| | — |
| | 25,285 |
|
|
| | | | | | | | | | | | | | | | | | | |
| | Year Ended December 31, 2018 |
| | Specialty Petrochemical |
| | Specialty Wax |
| | Corporate |
| | Eliminations |
| | Consolidated |
|
| | | | (in thousands) |
| Goodwill and intangible assets, net | $ | — |
| | $ | 40,745 |
| | $ | — |
| | $ | — |
| | $ | 40,745 |
|
| Total assets | 284,367 |
| | 115,366 |
| | 91,474 |
| | (161,239 | ) | | 329,968 |
|
|
| | | | | | | | | | | | | | | |
| | Year Ended December 31, 2017 |
| | Specialty Petrochemical |
| | Specialty Wax |
| | Corporate |
| | Consolidated |
|
| | (in thousands) |
| Net revenues | $ | 210,381 |
| | $ | 34,762 |
| | $ | — |
| | $ | 245,143 |
|
| Operating profit (loss) before depreciation and amortization | 36,511 |
| | (35 | ) | | (7,413 | ) | | 29,063 |
|
| Operating profit (loss) | 30,201 |
| | (4,624 | ) | | (7,475 | ) | | 18,102 |
|
| Profit (loss) before taxes | 27,852 |
| | (5,238 | ) | | (11,764 | ) | | 10,850 |
|
| Depreciation and amortization | 6,310 |
| | 4,589 |
| | 62 |
| | 10,961 |
|
| Capital expenditures | 38 |
| | 14,015 |
| | — |
| | 14,053 |
|
|
| | | | | | | | | | | | | | | | | | | |
| | Year Ended December 31, 2017 |
| | Specialty Petrochemical |
| | Specialty Wax |
| | Corporate |
| | Eliminations |
| | Consolidated |
|
| | | | (in thousands) |
| Goodwill and intangible assets, net | $ | — |
| | $ | 42,606 |
| | $ | — |
| | $ | — |
| | $ | 42,606 |
|
| Total assets | 265,213 |
| | 117,579 |
| | 97,880 |
| | (153,346 | ) | | 327,326 |
|
NOTE 18 - NET INCOME (LOSS) PER COMMON SHARE
| | | | | | | | | | Year ended December 31, |
| | Year ended December 31, | | 2020 | | 2019 | | 2018 |
| | 2018 |
| | 2017 |
| | 2016 |
| | (thousands of dollars, except per share amounts) |
| Net Income per Common Share - Continuing Operations | | Net Income per Common Share - Continuing Operations | |
| Net income (loss) from continuing operations | | Net income (loss) from continuing operations | $ | 4,966 | | | $ | (12,884) | | | $ | (1,728) | |
| | (thousands of dollars) | |
| Basic income (loss) from continuing operations per common share: | | Basic income (loss) from continuing operations per common share: | |
| Weighted average shares outstanding | | Weighted average shares outstanding | 24,802 | | | 24,698 | | | 24,438 | |
| Per share amount (dollars) | | Per share amount (dollars) | $ | 0.20 | | | $ | (0.52) | | | $ | (0.07) | |
| | Diluted income (loss) from continuing operations per common share: | | Diluted income (loss) from continuing operations per common share: | |
| Weighted average shares outstanding | | Weighted average shares outstanding | 25,356 | | | 24,698 | | | 24,438 | |
| Per share amount (dollars) | | Per share amount (dollars) | $ | 0.20 | | | $ | (0.52) | | | $ | (0.07) | |
| Weighted average shares-denominator
basic computation | | Weighted average shares-denominator
basic computation | 24,802 | | | 24,698 | | | 24,438 | |
| Unvested restricted stock unit grant | | Unvested restricted stock unit grant | 554 | | | 0 | | | 0 | |
| Weighted average shares, as adjusted
denominator diluted computation | | Weighted average shares, as adjusted
denominator diluted computation | 25,356 | | | 24,698 | | | 24,438 | |
| | Net Income per Common Share - Discontinued Operations | | Net Income per Common Share - Discontinued Operations | |
| Net income (loss) from discontinued operations | | Net income (loss) from discontinued operations | $ | 26,209 | | | $ | (2,090) | | | $ | (604) | |
| | Basic income (loss) from discontinued operations per common share: | | Basic income (loss) from discontinued operations per common share: | |
| Weighted average shares outstanding | | Weighted average shares outstanding | 24,802 | | | 24,698 | | | 24,438 | |
| Per share amount (dollars) | | Per share amount (dollars) | $ | 1.06 | | | $ | (0.08) | | | $ | (0.02) | |
| | Diluted income (loss) from discontinued operations per common share: | | Diluted income (loss) from discontinued operations per common share: | |
| Weighted average shares outstanding | | Weighted average shares outstanding | 25,356 | | | 24,698 | | | 24,438 | |
| Per share amount (dollars) | | Per share amount (dollars) | $ | 1.03 | | | $ | (0.08) | | | $ | (0.02) | |
| Weighted average shares-denominator
basic computation | | Weighted average shares-denominator
basic computation | 24,802 | | | 24,698 | | | 24,438 | |
| Unvested restricted stock unit grant | | Unvested restricted stock unit grant | 554 | | | 0 | | | 0 | |
| Weighted average shares, as adjusted
denominator diluted computation | | Weighted average shares, as adjusted
denominator diluted computation | 25,356 | | | 24,698 | | | 24,438 | |
| | Net Income per Common Share | | Net Income per Common Share | |
| Net income (loss) | $ | (2,332 | ) | | $ | 18,009 |
| | $ | 19,428 |
| Net income (loss) | $ | 31,175 | | | $ | (14,974) | | | $ | (2,332) | |
| | | | | | | |
| Basic earnings (loss) per common share: | | | | | | |
| Basic income (loss) per common share: | | Basic income (loss) per common share: | |
| Weighted average shares outstanding | 24,438 |
| | 24,294 |
| | 24,284 |
| Weighted average shares outstanding | 24,802 | | | 24,698 | | | 24,438 | |
| Per share amount (dollars) | | Per share amount (dollars) | $ | 1.26 | | | $ | (0.61) | | | $ | (0.10) | |
| | | | | | | | | | | | |
| Diluted income (loss) per common share: | | Diluted income (loss) per common share: | |
| Weighted average shares outstanding | | Weighted average shares outstanding | 25,356 | | | 24,698 | | | 24,438 | |
| Per share amount (dollars) | $ | (0.10 | ) | | $ | 0.74 |
| | $ | 0.80 |
| Per share amount (dollars) | $ | 1.23 | | | $ | (0.61) | | | $ | (0.10) | |
| Diluted earnings (loss) per common share: | | | | | | |
| Weighted average shares outstanding | 24,438 |
| | 25,129 |
| | 24,982 |
| |
| | | | | | | | | | | | |
| Per share amount (dollars) | $ | (0.10 | ) | | $ | 0.72 |
| | $ | 0.78 |
| |
Weighted average shares-denominator basic computation | 24,438 |
| | 24,294 |
| | 24,284 |
| Weighted average shares-denominator
basic computation | 24,802 | | | 24,698 | | | 24,438 | |
| Unvested restricted stock unit grant | — |
| | 367 |
| | 310 |
| Unvested restricted stock unit grant | 554 | | | 0 | | | 0 | |
| Effect of dilutive stock options | — |
| | 468 |
| | 388 |
| Effect of dilutive stock options | 0 | | | 0 | | | 0 | |
Weighted average shares, as adjusted denominator diluted computation | 24,438 |
| | 25,129 |
| | 24,982 |
| Weighted average shares, as adjusted
denominator diluted computation | 25,356 | | | 24,698 | | | 24,438 | |
At December 31, 2020, 2019, and 2018, 2017,0.5 million, 0.5 million and 2016, 745,830, 1,323,587 and 1,348,4370.7 million potential common stock shares, respectively, were issuable upon the exercise of options and warrants. At December 31, 2018,2020, the Company had 397 unvested restricted stock units and 2640.5 million stock options that were not included in the computation of diluted earnings per share because the effect of conversionsuch options would be anti-dilutive due to the Company incurring net loss for operations for the year ended December 31, 2018.anti-dilutive.
In 2018, we completed an exchange
NOTE 19 - QUARTERLY RESULTS OF OPERATIONS (UNAUDITED)
The quarterly results of operations shown below are derived from unaudited financial statements for the eight quarters ended December 31, 20182020 (in thousands, except per share data, rounding may apply):
| | | | | | | | | | | | | | | | | | | | | | | | | | | | | |
| Year Ended December 31, 2020 |
| First Quarter | | Second Quarter | | Third Quarter | | Fourth Quarter | | Total |
| | | | | | | | | |
| Revenues | $ | 62,067 | | | $ | 40,674 | | | $ | 47,747 | | | $ | 58,138 | | | $ | 208,626 | |
| Gross profit | 8,078 | | | 6,167 | | | 8,457 | | | 5,976 | | | 28,678 | |
| | | | | | | | | |
| Net income (loss) from continuing operations | $ | 5,863 | | | $ | (1,859) | | | $ | 1,108 | | | $ | (146) | | | $ | 4,966 | |
| Net income (loss) from discontinued operations, net of tax | 4,857 | | | (2) | | | 21,324 | | | 30 | | | 26,209 | |
| Net income (loss) | 10,720 | | | (1,861) | | | 22,432 | | | (116) | | | 31,175 | |
| | | | | | | | | |
| Basic EPS (1) from continuing operations | $ | 0.24 | | | $ | (0.07) | | | $ | 0.04 | | | $ | (0.01) | | | $ | 0.20 | |
| Basic EPS (1) from discontinued operations | 0.20 | | | 0 | | | 0.86 | | | 0 | | | 1.06 | |
| Basic EPS (1) | 0.44 | | | (0.07) | | | 0.90 | | | (0.01) | | | 1.26 | |
| | | | | | | | | |
| Diluted EPS (1) from continuing operations | $ | 0.23 | | | $ | (0.07) | | | $ | 0.04 | | | $ | (0.01) | | | $ | 0.20 | |
| Diluted EPS (1) from discontinued operations | 0.19 | | | 0 | | | 0.84 | | | 0 | | | 1.03 | |
| Diluted EPS (1) | 0.42 | | | (0.07) | | | 0.88 | | | (0.01) | | | 1.23 | |
| | | | | | | | | | | | | | | | | | | | | | | | | | | | | |
| Year Ended December 31, 2019 |
| First Quarter | | Second Quarter | | Third Quarter | | Fourth Quarter | | Total |
| | | | | | | | | |
| Revenues | $ | 65,155 | | | $ | 69,371 | | | $ | 62,715 | | | $ | 61,718 | | | $ | 258,959 | |
| Gross profit | 10,073 | | | 10,565 | | | 9,567 | | | 8,310 | | | 38,515 | |
| | | | | | | | | |
| Net income (loss) from continuing operations | $ | 1,797 | | | $ | 2,476 | | | $ | 1,583 | | | $ | (18,740) | | | $ | (12,884) | |
| Net income (loss) from discontinued operations, net of tax | (46) | | | (72) | | | (1,002) | | | (970) | | | (2,090) | |
| Net income (loss) | 1,751 | | | 2,404 | | | 581 | | | (19,710) | | | (14,974) | |
| | | | | | | | | |
| Basic EPS (1) from continuing operations | $ | 0.07 | | | $ | 0.10 | | | $ | 0.06 | | | $ | (0.76) | | | $ | (0.52) | |
| Basic EPS (1) from discontinued operations | 0 | | | 0 | | | (0.04) | | | (0.04) | | | (0.08) | |
| Basic EPS (1) | 0.07 | | | 0.10 | | | 0.02 | | | (0.80) | | | (0.61) | |
| | | | | | | | | |
| Diluted EPS (1) from continuing operations | $ | 0.07 | | | $ | 0.10 | | | $ | 0.06 | | | $ | (0.76) | | | $ | (0.52) | |
| Diluted EPS (1) from discontinued operations | 0 | | | 0 | | | (0.04) | | | (0.04) | | | (0.08) | |
| Diluted EPS (1) | 0.07 | | | 0.10 | | | 0.02 | | | (0.80) | | | (0.61) | |
(1)Basic and diluted earnings per share are computed independently for each of the quarters presented based on the weighted average number of common shares outstanding during that period. Therefore, the sum of quarterly basic and diluted per share information may not equal annual basic and diluted earnings per share.
|
| | | | | | | | | | | | | | | | | | | |
| | Year Ended December 31, 2018 |
| | First Quarter |
| | Second Quarter |
| | Third Quarter |
| | Fourth Quarter |
| | Total |
|
| | | | | | | | | | |
| Revenues | $ | 71,741 |
| | $ | 68,106 |
| | $ | 73,416 |
| | $ | 74,669 |
| | $ | 287,932 |
|
| Gross profit | 10,140 |
| | 8,142 |
| | 6,842 |
| | 2,694 |
| | 27,818 |
|
| Net income (loss) | 2,352 |
| | 2,215 |
| | (1,609 | ) | | (5,290 | ) | | (2,332 | ) |
| Basic EPS (1) | $ | 0.10 |
| | $ | 0.09 |
| | $ | (0.07 | ) | | $ | (0.22 | ) | | $ | (0.10 | ) |
| Diluted EPS (1) | $ | 0.09 |
| | $ | 0.09 |
| | $ | (0.07 | ) | | $ | (0.22 | ) | | $ | (0.10 | ) |
|
| | | | | | | | | | | | | | | | | | | |
| | Year Ended December 31, 2017 |
| | First Quarter |
| | Second Quarter |
| | Third Quarter |
| | Fourth Quarter (2) |
| | Total |
|
| | | | | | | | | | |
| Revenues | $ | 55,542 |
| | $ | 62,115 |
| | $ | 61,508 |
| | $ | 65,978 |
| | $ | 245,143 |
|
| Gross profit | 10,618 |
| | 11,107 |
| | 9,870 |
| | 9,966 |
| | 41,561 |
|
| Net income | 1,487 |
| | 832 |
| | 1,718 |
| | 13,972 |
| | 18,009 |
|
| Basic EPS (1) | $ | 0.06 |
| | $ | 0.03 |
| | $ | 0.07 |
| | $ | 0.58 |
| | $ | 0.74 |
|
| Diluted EPS (1) | $ | 0.06 |
| | $ | 0.03 |
| | $ | 0.07 |
| | $ | 0.56 |
| | $ | 0.72 |
|
| |
(1) | Basic and diluted earnings per share are computed independently for each of the quarters presented based on the weighted average number of common shares outstanding during that period. Therefore, the sum of quarterly basic and diluted per share information may not equal annual basic and diluted earnings per share. |
| |
(2) | As discussed in Note 16 the TCJA changed the federal corporate income tax rates from 35% to 21% resulting in a benefit from deferred taxes of approximately $10.3 million. |
NOTE 20 – RELATED PARTY TRANSACTIONS
Consulting fees of approximately $28,000, $27,000 and $33,000 were incurred during 2018, 2017, and 2016, respectively from IHS Global FZ LLC of whichIn November 2020, Company Director Gary K. Adams heldAdam C. Peakes joined Merichem Company as Executive Vice President and Chief Financial Officer. The Company incurred expenses of less than $0.1 million during each of the position of Chief Advisor – Chemicals until April 1, 2017.years ended December 31, 2020, 2019, and 2018, respectively, for Merichem Company. At December 31, 2018,2020 and 2017,2019, we had no outstanding liabilityliabilities payable to IHS Global FZ LLC.Merichem Company of less than $0.1 million and NaN, respectively.
Consulting fees of approximately $94,000, $74,000NaN , $0.1 million and $73,000$0.1 million were incurred during 2018, 2017,2020, 2019, and 2016,2018, respectively, from Chairman of the Board, Nicholas Carter.Carter, Director and former CEO. Due to his history and experience with the Company and to provide continuity after his retirement, a three year consulting agreement was entered into with Mr. Carter in July 2015. At2015, which terminated effective December 31, 2018, and 2017, we had no outstanding liability payable to Mr. Carter.2019.
NOTE 21 – RESTRUCTURING AND SEVERENCESEVERANCE EXPENSES
During 2018, the Company incurred restructuring and severance expenses of approximately $2.3 million related to changes in executive management and the completion of significant capital projects in our specialty petrochemicalpetrochemicals segment. These expenses relaterelated to severance, stock compensation for continued vesting of time-vested shares issued under the Company'sCompany’s long-term incentive plans, and certain employee benefits including medical insurance and vacation. As of December 31, 2018,2020, there was no remaining unpaid or accrued restructuring or severance expenses. As of December 31, 2019, approximately $1.2$0.02 million remainsremained unpaid and iswas included in accrued liabilities.
NOTE 22-22 – POST-RETIREMENT OBLIGATIONS
In January 2008, an amended retirement agreement was entered into with Mr. Hatem El Khalidi; however, on May 9, 2010, the Board of Directors terminated the agreement due to actions of Mr. El Khalidi. See Note 14. All amounts which had not met termination dates remained recorded until a resolution was achieved. The matter was resolved on May 25, 2018 and as of June 30, 2018, post-retirement obligations of approximately $1.0 million for Mr. El Khalidi have been reversed. As of December 31, 2017, approximately $1.0 million remained outstanding and was included in post-retirement benefits.
In July 2015 and June 2018, we entered into retirement agreements with our former CEO, Nicholas Carter, and our former VP of Accounting & Compliance, Connie Cook. Mr. Carter'sCarter’s agreement provides continued welfare benefits for him and his wife for life at the same cost sharing basis as regular employees. Ms. Cook'sCook’s agreement provides continued welfare benefits for her and her husband until eligible for Medicare. Approximately $377,000$0.3 million and $249,000$0.3 million was outstanding at December 31, 2018,2020, and 2017,2019, respectively, and included in post-retirement benefits. For the period ended December 31, 2018,2020, and 2017,2019, approximately $18,000$0.01 million and $16,000,$0.02 million, respectively, had been paid.
TRECORA RESOURCES AND SUBSIDIARIES
VALUATION AND QUALIFYING ACCOUNTS
Three years ended December 31, 20182020
| | | | | | | | | | | | | | | | | | | | | | | | | | |
| Description | | Beginning
balance | | Charged
(credited)
to earnings | | Deductions | | Ending
balance |
ALLOWANCE FOR DEFERRED
TAX ASSET | | | | | | | | |
| | | | | | | | |
| December 31, 2018 | | 225,622 | | | 0 | | | 0 | | | 225,622 | |
| December 31, 2019 | | 225,622 | | | 0 | | | 0 | | | 225,622 | |
| December 31, 2020 | | 225,622 | | | 0 | | | 0 | | | 225,622 | |
| | | | | | | | | | | | | | | | | | | | | | | | | | |
| Description | | Beginning
balance | | Charged
to earnings | | Deductions | | Ending
balance |
ALLOWANCE FOR DOUBTFUL
ACCOUNTS | | | | | | | | |
| | | | | | | | |
| December 31, 2018 | | 300,000 | | | 152,000 | | | 0 | | | 452,000 | |
| December 31, 2019 | | 452,000 | | | (23,000) | | | 0 | | | 429,000 | |
| December 31, 2020 | | 429,000 | | | 0 | | | (129,000) | | | 300,000 | |
|
| | | | | | | | | | | | |
| Description | | Beginning balance | | Charged (credited) to earnings | | Deductions | | Ending balance |
ALLOWANCE FOR DEFERRED TAX ASSET | | | | | | | | |
| | | | | | | | | |
| December 31, 2016 | | 376,037 |
| | — |
| | — |
| | 376,037 |
|
| December 31, 2017 | | 376,037 |
| | (150,415 | ) | | — |
| | 225,622 |
|
| December 31, 2018 | | 225,622 |
| | — |
| | — |
| | 225,622 |
|
|
| | | | | | | | | | | | |
| Description | | Beginning balance | | Charged to earnings | | Deductions | | Ending balance |
ALLOWANCE FOR DOUBTFUL ACCOUNTS | | | | | | | | |
| | | | | | | | | |
| December 31, 2016 | | 210,000 |
| | 183,339 |
| | (93,339 | ) | | 300,000 |
|
| December 31, 2017 | | 300,000 |
| | — |
| | — |
| | 300,000 |
|
| December 31, 2018 | | 300,000 |
| | 152,000 |
| | — |
| | 452,000 |
|
AL MASANE AL KOBRA MINING COMPANY
Financial Statements
with
Report of Independent Registered Public Accounting Firm
For the nine months ended September 30, 2020
and years ended
December 31, 2018, 2017,2019 and 20162018
AL MASANE AL KOBRA MINING COMPANY
Table of Contents
| | | | | |
| Page |
| |
| Page |
| |
| 1 - 2 |
| |
| |
| |
| 23 - 34 |
| |
| 45 |
| |
| 56 |
| |
| 6 - 7 |
| |
| 8 - 18 |
REPORT OF INDEPENDENT REGISTERED PUBLIC ACCOUNTING FIRM
To the Board of Directors and
Shareholders of Al Masane Al Kobra Mining Company
Najran, Kingdom of Saudi Arabia
Opinion on the Financial Statements
We have audited the accompanying balance sheets of Al Masane Al Kobra Mining Company (the Company)“Company”) as of September 30, 2020 and December 31, 2018 and 2017,2019, and the related statements of operations, changes in shareholders’ equity, and cash flows for the nine months ended September 30, 2020 and each of the years in the three-year period ended December 31, 2019 and 2018, and the related notes (collectively referred to as the financial statements)“Financial Statements”). In our opinion, the financial statementsFinancial Statements present fairly, in all material respects, the financial position of the Company as of September 30, 2020 and December 31, 2018 and 2017,2019, and the results of its operations and its cash flows for the nine months ended September 30, 2020 and each of the years in the three-year period ended December 31, 2019 and 2018, in conformity with accounting principles generally accepted in the United States of America.
Basis for Opinion
These financial statementsFinancial Statements are the responsibility of the Company’s management. Our responsibility is to express an opinion on the Company’s financial statementsFinancial Statements based on our audits. We are a public accounting firm registered with the Public Company Accounting Oversight Board (United States) (PCAOB)(“PCAOB”) and are required to be independent with respect to the Company in accordance with the U.S. federal securities laws and the applicable rules and regulations of the Securities and Exchange Commission and the PCAOB.
We conducted our audits in accordance with the standards of the PCAOB. Those standards require that we plan and perform the audit to obtain reasonable assurance about whether the financial statementsFinancial Statements are free of material misstatement, whether due to error or fraud. The Company is not required to have, nor were we engaged to perform, an audit of its internal control over financial reporting. As part of our audits, we are required to obtain an understanding of internal control over financial reporting, but not for the purpose of expressing an opinion on the effectiveness of the Company’s internal control over financial reporting. Accordingly, we express no such opinion.
Our audits included performing procedures to assess the risks of material misstatement of the financial statements,Financial Statements, whether due to error or fraud, and performing procedures that respond to those risks. Such procedures included examining, on a test basis, evidence regarding the amounts and disclosures in the financial statements.Financial Statements. Our audits also included evaluating the accounting principles used and significant estimates made by management, as well as evaluating the overall presentation of the financial statements.Financial Statements. We believe that our audits provide a reasonable basis for our opinion.
/s/ Mamdouh Al Majed & Faisal Al-Enzi
Certified Public Accountants
We have served as the Company’s auditor since 2013.
Riyadh, Kingdom of Saudi Arabia
March 6, 20194, 2021
AL MASANE AL KOBRA MINING COMPANY
Balance Sheets
| | | | | | | | | | | |
| September 30, | | December 31, |
| 2020 | | 2019 |
| (Expressed in Saudi Riyals) |
| ASSETS | | | |
| Current assets: | | | |
| Cash and cash equivalents | 29,452,821 | | | 52,244,794 | |
| Restricted cash (Note 1) | 7,935,905 | | | 0 | |
| Accounts receivable, net | 8,688,925 | | | 29,643,472 | |
| Inventories | 45,017,824 | | | 35,277,340 | |
| Advances to shareholders (Note 1) | 0 | | | 2,859,341 | |
| Advances to contractors and other | 20,650,315 | | | 50,053,018 | |
| | | |
| Total current assets | 111,745,790 | | | 170,077,965 | |
| | | |
| Non-current assets: | | | |
| Property and equipment, net | 683,014,705 | | | 610,634,432 | |
| Development costs, net | 98,939,725 | | | 121,267,664 | |
| Deferred mine closure costs | 4,849,249 | | | 5,211,505 | |
| | | |
| Total non-current assets | 786,803,679 | | | 737,113,601 | |
| | | |
| 898,549,469 | | | 907,191,566 | |
| | | |
| LIABILITIES AND SHAREHOLDERS' EQUITY | | | |
| Current liabilities: | | | |
| Accounts payable and accrued liabilities | 38,499,280 | | | 40,418,619 | |
| Zakat and income tax liability | 14,966,681 | | | 10,932,026 | |
| | | |
| Capital lease obligation, current portion | 2,479,480 | | | 2,318,301 | |
| Long-term debt, current portion | 97,500,000 | | | 50,000,000 | |
| | | |
| Total current liabilities | 153,445,441 | | | 103,668,946 | |
| | | |
| Non-current liabilities | | | |
| Provision for mine closure costs | 17,030,905 | | | 16,625,347 | |
| Capital lease obligation, net of current portion | 2,022,518 | | | 3,898,002 | |
| Long-term debt, net of current portion and | | | |
| deferred finance costs | 271,626,947 | | | 267,933,847 | |
| End-of-service indemnities | 6,029,921 | | | 4,880,892 | |
| Deferred income taxes | 0 | | | 4,217,658 | |
| | | |
| Total non-current liabilities | 296,710,291 | | | 297,555,746 | |
See accompanying notes to financial statements.
|
| | | | | |
| | December 31, |
| | 2018 |
| | 2017 |
|
| | (Expressed in Saudi Riyals) |
| ASSETS | | | |
| Current assets: | | | |
| Cash and cash equivalents | 31,510,496 |
| | 32,325,537 |
|
| Accounts receivable | 16,235,035 |
| | 8,213,816 |
|
| Inventories | 45,871,120 |
| | 27,226,932 |
|
| Advances to shareholders (Note 1) | 52,562,028 |
| | — |
|
| Advances to contractors and other | 19,168,765 |
| | 19,731,780 |
|
| | | | |
| Total current assets | 165,347,444 |
|
| 87,498,065 |
|
| | | | |
| Non-current assets: | | | |
| Property and equipment, net | 634,856,075 |
| | 693,801,671 |
|
| Development costs, net | 155,281,525 |
| | 191,528,180 |
|
| Deferred mine closure costs | 5,955,999 |
| | 6,700,499 |
|
| | | | |
| Total non-current assets | 796,093,599 |
|
| 892,030,350 |
|
| | | | |
| | 961,441,043 |
|
| 979,528,415 |
|
| | | | |
| LIABILITIES AND SHAREHOLDERS' EQUITY | | | |
| Current liabilities: | | | |
| Accounts payable and accrued liabilities | 28,756,945 |
| | 22,672,618 |
|
| Zakat and income tax liability | 5,400,000 |
| | 3,516,673 |
|
| Due to shareholders | — |
| | 453,816 |
|
| Capital lease obligation, current portion | 193,206 |
| | — |
|
| Long-term debt, current portion | 30,000,000 |
| | 65,000,000 |
|
| | | | |
| Total current liabilities | 64,350,151 |
|
| 91,643,107 |
|
| | | | |
| Non-current liabilities | | | |
| Provision for mine closure costs | 16,063,136 |
| | 15,519,938 |
|
| Capital lease obligation, net of current portion | 359,811 |
| | — |
|
| Long-term debt, net of current portion and | | | |
| deferred finance costs | 266,258,712 |
| | 229,082,810 |
|
| End-of-service indemnities | 3,649,889 |
| | 2,518,529 |
|
| Deferred income taxes | 3,792,785 |
| | 11,017,714 |
|
| | | | |
| Total non-current liabilities | 290,124,333 |
|
| 258,138,991 |
|
AL MASANE AL KOBRA MINING COMPANY
Balance Sheets - (Continued)
| | | | | | | | | | | |
| September 30, | | December 31, |
| 2020 | | 2019 |
| (Expressed in Saudi Riyals) |
| Commitments and contingencies (Note 14) | 0 | | 0 |
| | | |
| Shareholders' equity | | | |
| Share capital | 820,000,000 | | | 820,000,000 | |
| Share premium | (131,808,900) | | | (74,713,350) | |
| Accumulated deficit | (239,797,363) | | | (239,319,776) | |
| | | |
| Total shareholders' equity | 448,393,737 | | | 505,966,874 | |
| | | |
| 898,549,469 | | | 907,191,566 | |
See accompanying notes to financial statements.
|
| | | | | |
| | December 31, |
| | 2018 |
| | 2017 |
|
| | (Expressed in Saudi Riyals) |
| Commitments and contingencies (Note 14) | | | |
| | | | |
| Shareholders' equity | | | |
| Share capital | 820,000 |
| | 780,000 |
|
| Share premium | — |
| | 37,546 |
|
| Accumulated deficit | (213,033 | ) | | (187,800 | ) |
| | | | |
| Total shareholders' equity | 606,967 |
|
| 629,746 |
|
| | | | |
| | 961,441 |
| | 979,528 |
|
AL MASANE AL KOBRA MINING COMPANY
Statements of Operations
For the nine months ended September 30, 2020 and
years ended December 31, 2019 and 2018
| | | | | | | | | | | | | | | | | |
| 2020 | | 2019 | | 2018 |
| (Expressed in Saudi Riyals) |
| Revenues | 234,872,562 | | | 293,811,329 | | | 263,377,273 | |
| | | | | |
| Costs of revenues | 208,980,004 | | | 279,645,705 | | | 255,313,296 | |
| | | | | |
| Operating income | 25,892,558 | | | 14,165,624 | | | 8,063,977 | |
| | | | | |
| General and administrative expenses | 18,693,047 | | | 30,355,423 | | | 29,475,998 | |
| | | | | |
| Income (loss) from operations | 7,199,511 | | | (16,189,799) | | | (21,412,021) | |
| | | | | |
| Other income (expense) | | | | | |
| | | | | |
| | | | | |
| Finance charges | (4,539,975) | | | (5,436,532) | | | (5,969,821) | |
| Other income (expense) (Note 1) | (1,300,258) | | | 2,091,152 | | | 323,575 | |
| | | | | |
| (5,840,233) | | | (3,345,380) | | | (5,646,246) | |
| | | | | |
| Income (loss )before Zakat and income tax | 1,359,278 | | | (19,535,179) | | | (27,058,267) | |
| | | | | |
| Zakat and income tax (expense) benefit | (1,836,865) | | | (6,751,156) | | | 1,824,929 | |
| | | | | |
| Net loss | (477,587) | | | (26,286,335) | | | (25,233,338) | |
See accompanying notes to financial statements.
|
| | | | | | | | |
| | December 31, |
| | 2018 | | 2017 | | 2016 |
| | (Expressed in Saudi Riyals) |
| Revenues | 263,377,273 |
| | 136,629,881 |
| | 37,202,504 |
|
| | | | | | |
| Costs of revenues | 255,313,296 |
| | 162,388,373 |
| | 101,743,839 |
|
| | | | | | |
| Operating income (loss) | 8,063,977 |
|
| (25,758,492 | ) |
| (64,541,335 | ) |
| | | | | | |
| General and | | | | | |
| administrative expenses | 29,475,998 |
| | 28,299,733 |
| | 26,957,555 |
|
| | | | | | |
| Loss from operations | (21,412,021 | ) |
| (54,058,225 | ) |
| (91,498,890 | ) |
| | | | | | |
| Other income (expense) | | | | | |
| Gain on forgiveness of liabilities and | | | | | |
| spare parts (Note 8) | — |
| | — |
| | 65,345,250 |
|
| Finance charges | (5,969,821 | ) | | (6,103,680 | ) | | (6,043,410 | ) |
| Other income | 323,575 |
| | 893,524 |
| | 260,953 |
|
| | | | | | |
| | (5,646,246 | ) |
| (5,210,156 | ) |
| 59,562,793 |
|
| | | | | | |
| Loss before Zakat and income tax | (27,058,267 | ) | | (59,268,381 | ) | | (31,936,097 | ) |
| | | | | | |
| Zakat and income tax benefit (expense) | 1,824,929 |
| | (3,627,193 | ) | | (3,596,244 | ) |
| | | | | | |
| Net loss | (25,233,338 | ) |
| (62,895,574 | ) |
| (35,532,341 | ) |
AL MASANE AL KOBRA MINING COMPANY
Statements of Changes in Shareholders' Equity
| | | | | | | | | | | | | | | | | | | | | | | | | | | | | |
| (Expressed in Saudi Riyals) |
| | | | | | | Retained | | |
| | | | | | | Earnings | | |
| Share | | Share | | Treasury | | (Accumulated | | |
| Capital | | Premium | | Stock at cost | | Deficit) | | Total |
| | | | | | | | | |
| Balance at December 31, 2017 | 780,000,000 | | | 37,546,420 | | | 0 | | | (187,800,103) | | | 629,746,317 | |
| | | | | | | | | |
| Issuance of share premium | — | | | 2,453,580 | | | — | | | — | | | 2,453,580 | |
| | | | | | | | | |
| Conversion of share premium to share capital | 40,000,000 | | | (40,000,000) | | | — | | | — | | | 0 | |
| | | | | | | | | |
| Net loss | — | | | — | | | — | | | (25,233,338) | | | (25,233,338) | |
| | | | | | | | | |
| Balance at December 31, 2018 | 820,000,000 | | | 0 | | | 0 | | | (213,033,441) | | | 606,966,559 | |
| | | | | | | | | |
| Share repurchase (Note 1) | — | | | — | | | (74,713,350) | | | — | | | (74,713,350) | |
| | | | | | | | | |
| Net loss | — | | | — | | | — | | | (26,286,335) | | | (26,286,335) | |
| | | | | | | | | |
| Balance at December 31, 2019 | 820,000,000 | | | 0 | | | (74,713,350) | | | (239,319,776) | | | 505,966,874 | |
| | | | | | | | | |
| Share repurchase (Note 1) | — | | | — | | | (57,095,550) | | | — | | | (57,095,550) | |
| | | | | | | | | |
| Net loss | — | | | — | | | — | | | (477,587) | | | (477,587) | |
| | | | | | | | | |
| Balance at September 30, 2020 | 820,000,000 | | | 0 | | | (131,808,900) | | | (239,797,363) | | | 448,393,737 | |
See accompanying notes to financial statements.
|
| | | | | | | | | | | |
| | (Expressed in Saudi Riyals) |
| | | | | | Retained | | |
| | | | | | Earnings | | |
| | Share | | Share | | (Accumulated | | |
| | Capital | | Premium | | Deficit) | | Total |
| | | | | | | | |
| Balance at December 31, 2015 | 740,000,000 |
| | — |
| | (89,372,188 | ) | | 650,627,812 |
|
| | | | | | | | |
| Issuance of share capital and premium | 40,000,000 |
| | 37,546,420 |
| | — |
| | 77,546,420 |
|
| | | | | | | | |
| Net loss | — |
| | — |
| | (35,532,341 | ) | | (35,532,341 | ) |
| | | | | | | | |
| Balance at December 31, 2016 | 780,000,000 |
|
| 37,546,420 |
|
| (124,904,529 | ) |
| 692,641,891 |
|
| | | | | | | | |
| Net loss | — |
| | — |
| | (62,895,574 | ) | | (62,895,574 | ) |
| | | | | | | | |
| Balance at December 31, 2017 | 780,000,000 |
|
| 37,546,420 |
|
| (187,800,103 | ) |
| 629,746,317 |
|
| | | | | | | | |
| Issuance of share premium | — |
| | 2,453,580 |
| | — |
| | 2,453,580 |
|
| | | | | | | | |
| Conversion of share premium to share capital | 40,000,000 |
| | (40,000,000 | ) | | — |
| | — |
|
| | | | | | | | |
| Net loss | — |
| | — |
| | (25,233,338 | ) | | (25,233,338 | ) |
| | | | | | | | |
| Balance at December 31, 2018 | 820,000,000 |
| | — |
| | (213,033,441 | ) | | 606,966,559 |
|
AL MASANE AL KOBRA MINING COMPANY
|
| | | | | | | | |
| | December 31, |
| | 2018 |
| | 2017 |
| | 2016 |
|
| | (Expressed in Saudi Riyals) |
| Cash flows from operating activities: | | | | | |
| Net loss | (25,233,338 | ) | | (62,895,574 | ) | | (35,532,341 | ) |
| Adjustments to reconcile net loss to net cash | | | | | |
| provided by (used in) operating activities: | | | | | |
| Depreciation and amortization | 125,507,864 |
| | 83,547,586 |
| | 43,768,238 |
|
| Accretion of deferred mine closure costs | 543,198 |
| | 524,829 |
| | 507,081 |
|
| Amortization of deferred finance costs | 2,175,902 |
| | 1,610,733 |
| | 2,147,644 |
|
| Gain on forgiveness of liabilities | — |
| | — |
| | (65,345,250 | ) |
| Deferred income taxes | (7,224,929 | ) | | 417,966 |
| | 1,718,258 |
|
| Changes in operating assets and liabilities: | | | | | |
| Accounts receivable | (8,021,219 | ) | | (8,213,816 | ) | | 28,351,618 |
|
| Inventories | (18,644,188 | ) | | (11,351,752 | ) | | 15,754,952 |
|
| Advances to contractors and other | 563,016 |
| | (3,944,995 | ) | | (6,186,357 | ) |
| Accounts payable and accrued liabilities | 6,084,327 |
| | 9,638,009 |
| | 3,511,632 |
|
| Zakat and income tax liability | 1,883,327 |
| | 1,583,048 |
| | 679,206 |
|
| Pre-export advance payment | — |
| | — |
| | (9,150,880 | ) |
| End-of-service indemnities | 1,131,360 |
| | 1,037,893 |
| | (264,797 | ) |
| | | | | | |
| Net cash provided by (used in) operating activities | 78,765,320 |
|
| 11,953,927 |
|
| (20,040,996 | ) |
| | | | | | |
| Cash flows from investing activities: | | | | | |
| Additions to property and equipment | (28,945,309 | ) | | (31,550,443 | ) | | (29,246,001 | ) |
AL MASANE AL KOBRA MINING COMPANY
Statements of Cash Flows - (Continued)
For the nine months ended September 30, 2020 and
years ended December 31, 2019 and 2018
| | | | | | | | | | | | | | | | | |
| 2020 | | 2019 | | 2018 |
| (Expressed in Saudi Riyals) |
| Cash flows from operating activities: | | | | | |
| Net loss | (477,587) | | | (26,286,335) | | | (25,233,338) | |
| Adjustments to reconcile net loss to net cash provided by (used in) operating activities: | | | | | |
| Depreciation and amortization | 77,148,251 | | | 113,949,259 | | | 125,507,864 | |
| Accretion of deferred mine closure costs | 405,558 | | | 562,211 | | | 543,198 | |
| Amortization of deferred finance costs | 1,193,100 | | | 1,675,135 | | | 2,175,902 | |
| Deferred income taxes | (4,217,658) | | | 424,873 | | | (7,224,929) | |
| Forfeiture of non-refundable deposit | 1,429,670 | | | 0 | | | 0 | |
| Changes in operating assets and liabilities: | | | | | |
| Accounts receivable | 20,954,547 | | | (13,408,437) | | | (8,021,219) | |
| Inventories | (9,740,484) | | | 10,593,780 | | | (18,644,188) | |
| Advances to contractors and other | 29,402,704 | | | (30,884,252) | | | 563,016 | |
| Accounts payable and accrued liabilities | (1,919,339) | | | 11,661,674 | | | 6,084,327 | |
| Zakat and income tax liability | 4,034,655 | | | 5,532,026 | | | 1,883,327 | |
| End-of-service indemnities | 1,149,029 | | | 1,231,003 | | | 1,131,360 | |
| | | | | |
| Net cash provided by operating activities | 119,362,446 | | | 75,050,937 | | | 78,765,320 | |
| | | | | |
| Cash flows from investing activities: | | | | | |
| Additions to property and equipment | (126,838,330) | | | (48,246,282) | | | (28,945,309) | |
| | | | | |
| Cash flows from financing activities: | | | | | |
| Issuance of share capital and premium | 0 | | | 0 | | | 2,453,580 | |
| Payments on capital lease obligations | (1,714,305) | | | (1,059,694) | | | (72,788) | |
| Repurchase of treasury stock | (55,665,879) | | | (22,151,322) | | | 0 | |
| Borrowings from long-term debt | 50,000,000 | | | 50,000,000 | | | 0 | |
| Payments on long-term debt | 0 | | | (30,000,000) | | | 0 | |
| Net advances to shareholders | 0 | | | (2,859,341) | | | (53,015,844) | |
| | | | | |
| Net cash used in financing activities | (7,380,184) | | | (6,070,357) | | | (50,635,052) | |
| | | | | |
| Increase (decrease) in cash and cash equivalents and restricted cash | (14,856,068) | | | 20,734,298 | | | (815,041) | |
| | | | | |
| Cash, cash equivalents and restricted cash, beginning of period | 52,244,794 | | | 31,510,496 | | | 32,325,537 | |
| | | | | |
| Cash, cash equivalents and restricted cash, end of period | 37,388,726 | | | 52,244,794 | | | 31,510,496 | |
| | | | | |
| Supplemental cash flow information | | | | | |
| | | | | |
| Cash paid for interest | 3,346,875 | | | 4,428,545 | | | 3,927,778 | |
| | | | | |
| Cash paid for Zakat and income tax | 2,019,868 | | | 6,086,073 | | | 3,212,813 | |
| | | | | |
| Supplemental disclosure of non-cash items | | | | | |
| | | | | |
| Assets acquired through capital lease obligations | 0 | | | 7,933,140 | | | 625,805 | |
| | | | | |
| Advances to shareholders applied to treasury stock purchase | 1,429,671 | | | 52,562,028 | | | 0 | |
See accopmanying notes to financial statements.
|
| | | | | | | | |
| | December 31, |
| | 2018 | | 2017 | | 2016 |
| | (Expressed in Saudi Riyals) |
| Cash flows from financing activities: | | | | | |
| Issuance of share capital and premium | 2,453,580 |
| | — |
| | 75,092,840 |
|
| Payments on capital lease obligations | (72,788 | ) | | — |
| | — |
|
| Payments on long-term debt | — |
| | (5,000,000 | ) | | — |
|
| Net advances from (to) shareholders | (53,015,844 | ) | | 403,147 |
| | 299,231 |
|
| | | | | | |
| Net cash provided by (used in) financing activities | (50,635,052 | ) |
| (4,596,853 | ) |
| 75,392,071 |
|
| | | | | | |
| Increase (decrease) in cash and cash equivalents | (815,041 | ) | | (24,193,369 | ) | | 26,105,074 |
|
| | | | | | |
| Cash and cash equivalents, beginning of year | 32,325,537 |
| | 56,518,906 |
| | 30,413,832 |
|
| | | | | | |
| Cash and cash equivalents, end of year | 31,510,496 |
|
| 32,325,537 |
|
| 56,518,906 |
|
| | | | | | |
| Supplemental cash flow information | | | | | |
| | | | | | |
| Cash paid for interest | 3,927,778 |
| | 3,686,000 |
| | 3,895,766 |
|
| | | | | | |
| Cash paid for Zakat and income tax | 3,212,813 |
| | 1,626,179 |
| | 1,198,780 |
|
| | | | | | |
| Supplemental disclosure of non-cash items | | | | | |
| | | | | | |
| Assets acquired through capital lease obligations | 625,805 |
| | — |
| | — |
|
Note 1 – Organization and Business
Organization
Al Masane Al Kobra Mining Company (us, we, our, AMAK or the Company) is a Saudi Arabian closed joint stock company approved by the Minister of Commerce and Industry Decree Number 247/Q dated 9/10/1428 (October 21, 2007) and registered in Jeddah under Commercial Registration No. 4030175345 on 7/1/1429 (January 16, 2008). During 2015, the head office was moved from Jeddah to Najran. Accordingly, Najran Commercial Registration No. 5950017523 dated 03/11/1431H (October 11, 2010) was modified to be the main Commercial Registration. Unless the context requires otherwise, references to “we”, “us”, “our”, “AMAK”, and the “Company” are intended to mean Al Masane Al Kobra Mining Company. All amounts are expressed in Saudi Riyals (SR) unless otherwise noted.
During 2009, the authorized capital of the Company was 450,000,000 consisting of 45 million shares of 10SR10 each of which 50% were issued for cash. The remaining 50% were issued for the contribution of mining rights and assets from Trecora Resources (Trecora) subject to Trecora’s liability for a loan in the amount of 41,250,000 due to the Ministry of Finance and National Economy. The mining rights in Al Masane mine were originally granted by Royal Decree Number M/17 effective 1/12/1413 (May 22, 1993) for a period of thirty years, with a right of renewal for a further period of twenty years to Trecora. The mining rights granted Trecora the right of exploitation in Al Masane mine located in Najran, Saudi Arabia, with an area of 44 square kilometers for a surface rental of 10,000 per square kilometer per year, i.e. 440,000 per year. As per the Ministry of Petroleum and Mineral Resources resolution dated 13/9/1429 (13/9/2008) and the ministry subsequent letter dated 2/1/1430 (30/12/2008), the aforementioned rights were transferred to us.
During 2011, the Company increased its authorized share capital by SR50,000,000 to SR500,000,000 and issued 5,000,000 shares of 10 each at a price of SR28 each resulting in a share premium of SR90,000,000. The entire 5,000,000 shares were issued for cash to Arab Mining Company (ARMICO) headquartered in Amman, Jordan.
During 2013, the Company increased its authorized share capital by SR50,000,000 to SR550,000,000 and issued 5,000,000 shares of 10 each at a price of SR30 each resulting in a share premium of SR100,000,000. The shares were issued for cash to existing shareholders.
During 2015, the Company increased its authorized share capital by SR190,000,000 to SR 740,000,000 and issued 19,000,000 shares of 10 each by transferring from share premium accounts.
During 2016, the Company increased its authorized share capital by SR40,000,000 to SR 780,000,000SR780,000,000 and issued 4,000,000 shares of 10 each at a price of SR20 each resulting in a share premium of SR35,092,840.
During 2018, the Company increased share premium by SR2,453,580 for shares that were previously issued.
During 2018 In addition, the Company increased its authorized share capital by SR40,000,000 to SR820,000,000 and issued 4,000,000 shares of 10 each by transferring from share premium accounts.
During the Company’s Extraordinary General Assembly Meeting in October of 2018, the shareholders approved to repurchase up to 2,500,000 shares from the shareholders at a price of SR30 each and to register these shares as treasury shares. In December 2018, the Board unanimously approved this proposal and authorized the CEO to proceed with the repurchase. The Company began advancingadvanced certain shareholders their portion of these proceeds in anticipation2018. During the first quarter of completing2019, the Company finalized the transaction and finalizingrepurchased 2,490,445 shares for approximately SR74,713,000.
On October 2, 2019, the treasury stock repurchaseCompany and certain shareholders of the Company (collectively, the “Purchasers”) entered into a Share Sale and Purchase Agreement (“Purchase Agreement”) with Trecora to purchase their entire equity interest in 2019.the Company for an aggregate gross purchase price of approximately SR264,700,000. The Purchase Agreement contains various representations, warranties and indemnity obligations of the Purchasers and Trecora. As required by the Purchase Agreement, the Purchasers advanced 5% of the purchase price to Trecora as a non-refundable deposit tha twould be applied to the purchase price. The Company’s share of the advance was approximately, SR2,855,000 and was included in advances to shareholders in the accompanying balance sheets as of December 31, 2018,2019.
On January 16, 2020, the Purchasers and Trecora entered into an amendment to extend the close date to March 31, 2020 to allow additional time for the parties to obtain certain required governmental approvals. On March 26, 2020, the Company had advanced SR52,562,028entered into a second amendment that the Purchasers would complete the purchase of their portion of the shares in multiple closings. Purchasers that completed their portion of the sale after March 31, 2020 but on or before September 28, 2020, would forfeit an amount equal to shareholders.50% of their non-refundable deposit as liquidated damages and would not be applied to the purchase price at closing. On April 1, 2020, the Company forfeited SR1,429,726 of their non-refundable deposit and is included in other income (expense) on the accompanying statement of operations.
ExceptOn August 10, 2020, the Company closed their portion of the Purchase Agreement and purchased 5,709,555 shares from Trecora for Trecora and ARMICO, all other shareholders are Saudi nationals or companies wholly owned by Saudi nationals. Our ownership isSR57,095,550. The Company has recorded these shares as follows:treasury stock. On September 24, 2020, the remaining
|
| | | | |
| | Shares | | Ownership Percentage |
| Saudi shareholders | 38,349,184 |
| | 46.8 |
| Trecora (US Company) | 27,402,876 |
| | 33.4 |
| ARMICO (Pan Arab Organization) | 16,247,940 |
| | 19.8 |
| | | | |
| | 82,000,000 |
| | 100.00 |
| | | | | | | | | | | |
| As of September 30, 2020, our ownership is as follows: |
| Shares | | Ownership
Percentage |
| Saudi shareholders | 53,936,081 | | | 73.1 | |
| | | |
| ARMICO (Pan Arab Organization) | 19,502,500 | | | 26.4 | |
| | | |
| Other | 361,419 | | | 0.5 | |
| | | |
| 73,800,000 | | | 100.0 | |
Business and operations
Our principal activity is to produce zinc and copper concentrates and silver and gold doré as per the license Number 993/2 dated 16/7/1428 (July 31, 2007) issued by Saudi Arabian General Investment Authority (SAGIA). We commenced our commercial production on July 1, 2012. During 2015, we received a new mining lease for an area near our current mining area for the Guyan ancient mine.
On 16/11/1428 (November 26, 2007), while Over the Company was in the registration process, the Company signed a contract with China National Geological and Mining Corporation (CGM) for underground mine rehabilitation, pre-production activity, and on-going mine development/production and with Nesma & Partners Contracting Company Limited (Nesma) for engineering, procurement, construction, commissioning and hand over of the concentrator surface works and the related infrastructure facilities. The handover of these facilities was finalized on November 28, 2011. In late 2014,years, we renegotiated a more favorable plant operationshave performed renovations and maintenance contract with CGM. CGM ran our mining operations until November 2015, at which time the Board of Directors cancelled the CGM and Nesma contract and temporarily suspended operations of the Company. See Note 8.
This planned, temporary shutdown of the facility was due to the continued depressed commodity price environment as well as needs for renovation and maintenance. Our focus during the renovation focused on improvingimprove recoveries overall and upgradingupgrade the precious metals circuit through the installation of SART (sulfidization, acidification, recycling, and thickening) modifications which are expected to lower chemical use, thereby reducing operating costs. In February 2016,During 2020 we entered into a new operatingcompleted an analysis of our mineral reserve estimates and rehabilitation contract with a different vendor under more favorable terms.
We resumed operationsextended the life of the mine and have made capital investments in the first quarter of 2017 and generated enough ore for two shipments in 2017. In 2018, we resumed our schedule of 4 shipments a year.Guyan mining area.
Note 2 - Summary of Significant Accounting Policies
The accompanying financial statements have been prepared using U.S. generally accepted accounting principles. The following is a summary of our significant accounting policies:
Cash and cash equivalents
We consider all highly-liquid investments purchased with an original maturity of three months or less to be cash equivalents.
Restricted cash
Restricted cash consists of amounts withheld from non-Saudi shareholders related to the Purchase Agreement for amount sdue to the General Authority of Zakat and Tax (GAZT) in the Kindom of Saudi Arabia for capital gains and income taxes.
Accounts receivable
We evaluate the collectability of our accounts receivable and the adequacy of the allowance for doubtful accounts based upon historical experience and any specific customer financial difficulties of which the Company becomes aware. During the nine months ended September 30, 2020 and years ended December 31, 2018, 2017,2019 and 2016,2018, we sold our concentrates and doré pursuant to a sales contractcontracts with primarily one customer. No amounts have been written off for the nine months ended September 30, 2020 and the years ended December 31, 2018, 2017,2019 and 2016.2018. In addition, we determined that an allowance for doubtful accounts was not necessary at September 30, 2020 and December 31, 2018 and 2017.2019.
Inventories
The components of inventories include mill stockpiles, precious metal doré, chemicals, and mining supplies. Inventories are stated at the lower of weighted-average cost or market. Costs of mill stockpiles inventory include labor and benefits, supplies, energy, depreciation, depletion, amortization, and other necessary costs incurred with the extraction and processing of ore. Corporate general and administrative costs are not included in inventory costs.
Because it is generally impracticable to determine the minerals contained in mill stockpiles by physical count, reasonable estimation methods are employed. The quantity of material delivered to the mill stockpiles is based on surveyed volumes of mined material and daily production records. Expected mineral recovery rates from the mill stockpiles are determined by various metallurgical testing methods.
Property and equipment
Property and equipment is carried at cost less accumulated depreciation. Expenditures for replacements and improvements are capitalized. Costs related to periodic maintenance are expensed as incurred. Depletion of the mining assets is determined using the unit-of-production method based on total estimated proven and probable reserves. Depletion and amortization using the
unit-of-production method is recorded upon extraction of the ore, at which time it is allocated to inventory cost and then included as a component of cost of goods sold. Other assets are depreciated on a straight-line basis over their estimated useful lives ranging from 3 to 20 years.
Borrowing costs that are directly attributable to the acquisition, construction or production of assets are capitalized as part of the cost of those assets. Assets under construction are capitalized in the construction in progress account. Upon completion, the cost of the related asset is transferred to the appropriate category of property and equipment.
Development costs
Mineral exploration costs, as well as drilling and other costs incurred for the purpose of converting mineral resources to proven and probable reserves or identifying new mineral resources are charged to expense as incurred. Development costs are capitalized beginning after proven and probable reserves have been established. Development costs include costs incurred in mine pre-production activities undertaken to gain access to proven and probable reserves, including shafts, drifts, ramps, permanent excavations, infrastructure and removal of overburden. These costs are deferred net of the proceeds from the sale of any production during the development period and then amortized using an estimated unit-of-production method. If a mine is no longer considered economical, the accumulated costs are charged to the statement of operations in the year in which the determination is made.
Asset impairment
We review and evaluate our long-lived assets for impairment when events or changes in circumstances indicate that the carrying amounts may not be recoverable. Long-lived assets are evaluated for impairment under the two-step model. When events or circumstance suggest impairment of long-lived assets, estimated undiscounted future net cash flows are calculated using future estimated commodity prices, proven and probable reserves, and estimated net proceeds from the disposition of assets on retirement, less operating, sustaining capital, and reclamation costs. If it is determined that an impairment exists, an impairment loss is measured as the amount by which the asset carrying value exceeds its fair value. Fair value is generally determined using valuation techniques such as estimated future cash flows. Because the cash flows used to assess recoverability of our long-lived assets and measure fair value of our mining operations require us to make several estimates and assumptions that are subject to risk and uncertainty, changes in these estimates and assumptions could result in the impairment of our long-lived asset values.
Based on our evaluation, we recorded no impairment losses during the nine months ended September 30, 2020 and the years ended December 31, 2018, 20172019 and 2016.
2018.
End-of-service indemnities
Employee end-of-service benefits are accrued for the benefit of employees under the terms and conditions of Saudi Labor Law and Regulations and their employment contracts. End-of-service indemnities are provided for and accrued in the financial statements based on the respective employees' salaries and length of service.
Pre-export Advances
At times we receive advances on a pre-export basis against a portion of our inventory on hand prior to shipment. These advances bear interest at 2.5% and are repaid from the proceeds from final concentrate sales. We did not have an outstanding advance liability at December 31, 2018 and 2017.
Foreign currency
Our functional currency is the Saudi Riyal (SR). In June 1986, the Saudi Riyal was officially pegged to the U.S. Dollar at a fixed exchange rate of 1 U.S. Dollar to 3.75 riyals. Foreign currency transactions are translated into Saudi Riyals at the rates of exchange prevailing at the time of the transactions. Monetary assets and liabilities denominated in foreign currencies at the balance sheet date are translated at the exchange rates prevailing at that date. Any gains and losses from settlement and translation of foreign currency transactions are included in the statement of operations. There were no material foreign-currency exchange gains or losses or translation adjustments during the nine months ended September 30, 2020 and the years ended December 31, 2018, 2017,2019 and 2016.
2018.
Leasing arrangements
We periodically lease operating equipment, facilities, and office buildings. Rentals payable under operating leases are charged to the statements of operations on a straight-line basis over the term of the relevant lease. For any capital leases, the present value of future minimum lease payments at the inception of the lease is reflected as an asset and a liability in the balance sheet. Amounts due within one year are classified as short-term liabilities and the remaining balance as long-term liabilities. Finance charges are charged to the statement of operations.
Operating lease expense amounted to approximately SR2,531,000, SR4,015,000 and SR1,619,000 SR1,454,000for the nine months ended September 30, 2020 and SR442,000 for the years ended December 31, 2019 and 2018, 2017 and 2016, respectively.
Environmental costs
Environmental costs are expensed or capitalized, depending upon their future economic benefits. Accruals for such expenditures are recorded when it is probable that obligations have been incurred and the costs can reasonably be estimated.
Ongoing compliance costs are expensed as incurred.
Asset retirement obligations and costs
We record the fair value of our estimated asset retirement obligations (AROs)(ARO) associated with tangible long-lived assets in the period in which the obligation is incurred. AROsARO associated with long-lived assets are those for which there is a legal obligation to settle under various laws, statues, or regulations. These obligations, which are initially estimated based on discounted cash flow estimates, are accreted to full value over time through charges to cost of revenues. In addition, asset retirement costs (ARCs) are capitalized as part of the related asset’s carrying value and are depreciated (primarily on a unit-of-production basis) over the asset’s respective useful life.
Our AROsARO consist primarily of costs associated with mine reclamation and closure activities and are included in deferred mine closure costs on the accompanying balance sheets. At least annually, we review our ARO estimates for changes in the projected timing and changes in cost estimates and additional AROsARO incurred during the period.
Zakat and income tax
We are subject to the Regulations of the General Authority of Zakat and Tax (GAZT)GAZT in the Kingdom of Saudi Arabia. Under these regulations, Zakat is payable at 2.5% on the basis of the portion of our Zakat base attributable to our Saudi stockholders, and income tax is payable at 20% on the portion of our taxable income attributable to our non-Saudi stockholders. Zakat and income tax are provided on an accrual basis. Any difference in the estimate is recorded when the final assessment is approved, at which time the provision is cleared.
We account for deferred income taxes on non-Saudi owners utilizing an asset and liability method, whereby deferred tax assets and liabilities are recognized based on the tax effects of temporary differences between the financial statements and the income tax basis of assets and liabilities, as measured by the effective tax rate. When appropriate, we evaluate the need for a valuation allowance based on a more likely than not threshold to reduce deferred tax assets to estimated recoverable amounts.
We account for uncertain income tax positions using a threshold and measurement attribute for the financial statement recognition and measurement of a tax position taken or expected to be taken in a tax return. We report tax-related interest and penalties as a component of Zakat and income tax expense. We recognized no material adjustment for unrecognized income tax liabilities. Zakat and income tax returns for the years from 2010 to 2017 are currently under review with GAZT.
Reclassifications
Certain reclassifications have been made to the prior periods to conform with current year presentation.
Revenue recognition
The Company’s revenues primary consists of sales of copper and zinc.
We sell our products pursuant to individual sales contracts entered into with a customer who acts as an intermediary and resells our products to end users. The Company considers each sales contract to be a single performance obligation, represented by the delivery of a series of distinct goods that are substantially the same, with the same pattern of transfer to the Company’s customer. The Company concluded this as, based on the nature of its contracts, the customer receives the benefit of mineral sold as it is shipped per the terms of the commercial invoice at each delivery date. In addition, the Company considers that it has a right to consideration from its customers in an amount that corresponds directly to the value transferred to those customers that being the quantity of mineral delivered at the price per unit delivered. Accordingly, the Company recognizes revenue at the amount to which it has the right to invoice (the invoice practical expedient), as it believes that this method is a faithful depiction of the transfer of goods to its customers.
Revenue is recognized when or as the performance obligations are satisfied, when the Company transfers control of the goods and title and risk of loss passpasses to the customer. Control is transferred generally upon the completion of loading the material as the point of origin. This is the point which the customer and when collectability is reasonably assured. The passing ofobtains legal title and risk of loss to the customer is based on termsproduct as well as the ability to direct the use of and obtain substantially all the remaining benefits of ownership of the sales contract, generally upon shipment or delivery of product.
assets.
Sales are recorded based on a provisional sales price or a final sales price calculated in accordance with the terms specified in the relevant sales contract. Under the long-established structure of sales agreements prevalent in the industry, the copper and zinc contained in concentrate is generally provisionally“provisionally” priced at the time of shipment. The provisional price received at the time of shipment is later adjusted to a final“final” price based on quoted monthly average spot prices on the London Metal Exchange (LME) for a specified future month. We record revenues at the time of shipment (when title and risk of loss pass) based on then-current LME prices, and we account for any changes between the sales price recorded at the time of shipment and subsequent changes in the LME prices through the date of final pricing as gains or losses from a derivative embedded in the sales contract (a futures contract initiated at the date of shipment and settled upon the determination of the final price)“final price”) which is bifurcated and separately accounted for at fair value. See Note 16.
The host contract is the sale of the metals contained in the concentrates at the then-current LME price as defined in the contract. Mark-to-market price fluctuations recorded through the settlement date are reflected in revenues for sales contracts. Our embedded derivatives at September 30, 2020 and December 31, 2019, were not significant to the financial statements.
Revenues from concentrate sales are recorded net of treatment and refining charges. These allowances are a negotiated term of
each contract. Treatment and refining charges represent payments or price adjustments to smelters and refiners and are either fixed, or in certain cases, vary with the price of metals (referred to as price participation).
Management estimates
The preparation of financial statements in conformity with accounting principles generally accepted in the United States of America requires management to make estimates and assumptions that affect the reported amounts of assets and liabilities and disclosure of contingent assets and liabilities at the date of the financial statements and the reported amounts of revenues and expenses during the reporting periods. The most significant areas requiring the use of management estimates include mineral reserve estimation; useful asset lives for depreciation and amortization; zakat and income taxes; environmental obligations; reclamation and closure costs; estimates of recoverable materials in mill stockpiles; fair value of embedded derivatives; end-of-service indemnities; and
asset impairment, including estimates used to derive future cash flows associated with those assets. Actual results could differ from these estimates.
In early 2020, the World Health Organization declared the rapidly spreading coronavirus disease (COVID-19) outbreak a pandemic. This pandemic has resulted in governments worldwide enacting emergency measures to combat the spread of the virus. The Company considered the impact of COVID-19 on the assumptions and estimates used and determined that there were no material adverse impacts on the Company’s results of operations and financial position at September 30, 2020. The Company is not aware of any specific event or circumstance that would require an update to its estimates or judgments or a revision of the carrying value of its assets or liabilities as of the date of issuance of the financial statements. These estimates may change, as new events occur and additional information is obtained.
Recent accounting pronouncements
In May 2014 the Financial Accounting Standards Board ("FASB") issued Accounting Standards Update ("ASU") 2014-09, Revenue from Contracts with Customers ("ASU 2014-09"). ASU 2014-09 supersedes the revenue recognition requirements of FASB Accounting Standards Codification ("ASC") Topic 605, Revenue Recognition and most industry-specific guidance throughout the Accounting Standards Codification, resulting in the creation of FASB ASC Topic 606, Revenue from Contracts with Customers. ASU 2014-09 requires entities to recognize revenue in a way that depicts the transfer of promised goods or services to customers in an amount that reflects the consideration to which the entity expects to be entitled to in exchange for those goods or services. For nonpublic companies this ASU provides alternative methods of retrospective adoption and is effective for fiscal years and interim periods beginning after December 15, 2018. Early adoption is permitted. The Company is evaluating the impact of these amendments, although it does not expect the amendments to have a significant impact to the Company’s financial position or results of operation.
In February 2016 the FASB issued ASU No. 2016-02, Leases (Topic 842), to increase transparency and comparability among organizations by recognizing all lease transactions (with terms in excess of 12 months) on the balance sheet as a lease liability and a right-of-use asset (as defined). The ASU is effective for fiscal years beginning after December 15, 2019,2020, including interim periods within those fiscal years, with earlier application permitted. Upon adoption, the lessee will apply the new standard retrospectively to all periods presented or retrospectively using a cumulative effect adjustment in the year of adoption. The Company has several lease agreements for which the amendments will require the Company to recognize a lease liability to make lease payments and a right-of-use asset which will represent its right to use the underlying asset for the lease term. As permitted by the amendments, the Company is anticipating electing an accounting policy to not recognize lease assets and lease liabilities for leases with a term of twelve months or less. The Company is currently reviewing the amendments to ensure it is fully compliant by the adoption date and does not expect to early adopt. In addition, the Company will change its current accounting policies to comply with the amendments with such changes as mentioned above.
Reclassifications
Certain reclassifications have been made to the prior periods to conform with the current year presentation.
Subsequent events
We have evaluated events and transactions subsequent to the date of the financial statements for matters requiring recognition or disclosure in the financial statements. The accompanying financial statements consider events through March 6, 2019,4, 2021, the date on which the financial statements were available to be issued.
Note 3 – Liquidity and Capital Resources
As shown in the financial statements, we have incurred three3 consecutive years of net losses however, the Company resumed full operations and hadhas operating income and generated cash provided from operations during the year ended December 31, 2018.operations. In addition, during 2020 we expect to updatehave updated our mineral resourcesreserve estimates and extended the life of the mine in 2019 with the expectation that the life of mine will be extended another two to three years. We believe that our continued operations, additional debt financing discussed in Note 10, and the adjusted repayment terms of our outstanding debt will provide us the necessary liquidity and capital resources.
Note 4 – Inventories
Inventories consisted of the following at: | | | | | | | | | | | |
Inventories consisted of the following at:
| | | |
| September 30, | | December 31, |
| 2020 | | 2019 |
| Stockpile ore | 15,623,461 | | | 18,657,218 | |
| Ore concentrates | 20,557,020 | | | 6,294,948 | |
| Precious metal dore | 2,235,799 | | | 4,490,589 | |
| Explosives | 484,169 | | | 326,599 | |
| Chemicals and other | 6,117,375 | | | 5,507,986 | |
| | | |
| 45,017,824 | | | 35,277,340 | |
|
| | | | | |
| | December 31, |
| | 2018 |
| | 2017 |
|
| Ore concentrates | 17,020,657 |
| | 12,118,132 |
|
| Stockpile ore | 19,134,297 |
| | 9,417,626 |
|
| Precious metal dore | 2,159,192 |
| | — |
|
| Explosives | 1,134,728 |
| | 485,668 |
|
| Chemicals and other | 6,422,246 |
| | 5,205,506 |
|
| | | | |
| | 45,871,120 |
|
| 27,226,932 |
|
As discussed in Note 2, we can receive advances on a pre-export basis on our mill stockpiles.
Note 5 – Advances to Contractors and Other
Advances to contractors and other consisted of the following at: | | | | | | | | | | | |
| Advances to contractors and other consisted of the following at: | | | |
| September 30, | | December 31, |
| 2020 | | 2019 |
| Advances to contractors | 13,668,562 | | | 42,672,136 | |
| Prepaid expenses | 2,251,667 | | | 5,185,037 | |
| Other miscellaneous advances and receivables | 4,730,086 | | | 2,195,845 | |
| | | |
| 20,650,315 | | | 50,053,018 | |
|
| | | | | |
| | December 31, |
| | 2018 |
| | 2017 |
|
| Advances to contractors | 15,127,502 |
| | 11,992,870 |
|
| Prepaid expenses | 1,196,218 |
| | 4,385,449 |
|
| Other miscellaneous advances and receivables | 2,845,045 |
| | 3,353,461 |
|
| | | | |
| | 19,168,765 |
|
| 19,731,780 |
|
Note 6 – Property and Equipment
Property | | | | | | | | | | | |
Property and equipment, net consisted of the following at:
| | | |
| September 30, | | December 31, |
| 2020 | | 2019 |
| Buildings | 191,974,662 | | | 191,838,962 | |
| Leasehold improvements | 4,051,062 | | | 1,838,317 | |
| Heavy equipment | 146,801,861 | | | 136,066,275 | |
| Motor vehicles | 22,753,563 | | | 22,467,300 | |
| Civil works | 16,288,221 | | | 16,288,221 | |
| Tailings dam | 23,900,160 | | | 23,900,160 | |
| Plant and machinery | 332,014,825 | | | 326,974,958 | |
| Mining assets – rehabilitation costs | 98,894,826 | | | 98,894,826 | |
| Mining assets – underground development costs | 409,899,633 | | | 299,224,519 | |
| Construction in progress | 3,356,625 | | | 4,789,313 | |
| | | |
| 1,249,935,438 | | | 1,122,282,851 | |
| | | |
| Less accumulated depreciation, depletion and amortization | (566,920,733) | | | (511,648,419) | |
| | | |
| 683,014,705 | | | 610,634,432 | |
During 2020 and equipment, net consisted of2019, additions to Mining Assets - underground development costs relates to capital investments in the following at:
|
| | | | | |
| | December 31, |
| | 2018 |
| | 2017 |
|
| Buildings | 191,041,157 |
| | 191,041,157 |
|
| Leasehold improvements | 1,838,317 |
| | 1,838,317 |
|
| Heavy equipment | 118,125,568 |
| | 110,259,122 |
|
| Motor vehicles | 22,467,300 |
| | 22,783,108 |
|
| Civil works | 15,662,671 |
| | 15,582,921 |
|
| Tailings dam | 23,042,594 |
| | 22,684,394 |
|
| Plant and machinery | 324,372,695 |
| | 315,029,454 |
|
| Mining assets – rehabilitation costs | 98,894,826 |
| | 98,894,826 |
|
| Mining assets – underground development costs | 267,128,896 |
| | 254,832,012 |
|
| Construction in progress | 5,106,409 |
| | 5,532,817 |
|
| | | | |
| | 1,067,680,433 |
|
| 1,038,478,128 |
|
| | | | |
| Less accumulated depreciation, depletion and amortization | (432,824,358 | ) | | (344,676,457 | ) |
| | | | |
| | 634,856,075 |
|
| 693,801,671 |
|
Property and equipment serve as collateral for the SIDF loan agreement (see Note 10).
Depreciation, depletion and amortization expense related to property and equipment was approximately, SR55,000,000, SR79,000,000 and SR88,000,000 for the nine months ended September 30, 2020 and SR64,300,000 forthe years ended December 31, 2019 and 2018, and 2017. During 2016, the mine was temporarily closed for renovation, therefore, no amortization or depletion was recorded on certain mining assets.respectively.
Note 7 – Development Costs
Development costs, net consisted of the following at:
| | | Development costs, net consisted of the following at: | | Development costs, net consisted of the following at: | |
| | December 31, | | September 30, | | December 31, |
| | 2018 |
| | 2017 |
| | 2020 | | 2019 |
| Cost | 289,973,237 |
| | 289,973,237 |
| Cost | 289,973,237 | | | 289,973,237 | |
| Accumulated amortization | (134,691,712 | ) | | (98,445,057 | ) | Accumulated amortization | (191,033,512) | | | (168,705,573) | |
| | | | | |
| | 155,281,525 |
|
| 191,528,180 |
| | 98,939,725 | | | 121,267,664 | |
Development costs are amortized using the unit of production method upon extraction of the ore. Amortization expenses related to development costs was approximately SR36,250,000SR22,328,000, SR34,014,000 and SR 18,200,000SR36,250,000 for the yearnine months ended September 30, 2020 and the years ended December 31, 20182019 and 2017,2018, respectively.
Note 8 – Accounts Payable and Accrued Liabilities and Forgiveness of Liabilities
Accounts payable and accrued liabilities consisted of the following at: | | | | | | | | | | | |
| Accounts payable and accrued liabilities consisted of the following at: | | | |
| September 30, | | December 31, |
| 2020 | | 2019 |
| Accounts payable and accrued liabilities | 33,012,537 | | | 36,571,709 | |
| | | |
| Accrued salaries and payroll | 5,486,743 | | | 3,846,910 | |
| | | |
| 38,499,280 | | | 40,418,619 | |
|
| | | | | |
| | December 31, |
| | 2018 |
| | 2017 |
|
| Accounts payable and accrued liabilities | 26,925,170 |
| | 17,858,012 |
|
| Other | 381,763 |
| | 2,802,493 |
|
| Accrued salaries and payroll expenses | 1,450,012 |
| | 2,012,113 |
|
| | | | |
| | 28,756,945 |
|
| 22,672,618 |
|
On March 31, 2016, the Company entered into finalization and discharge memorandums of understanding (MOU’s) with their former mine operator CGM and subcontractor Nesma where certain contracts were cancelled. These contracts included the EPC Surface Works Contract and Subcontract (CGM/NESMA) dated November 26, 2007, the Underground Mining Contract (CGM) dated June 29, 2010, the 1st Surface Works O&M Contract (CGM) dated July 3, 2011, and the 2nd Surface Works O&M Contract (CGM) dated November 3, 2014 (collectively, the Contracts).
The MOU’s were binding agreements between the Company, CGM and Nesma. All of CGM’s spare parts on site related to the Contracts reverted to and became the property of the Company. CGM received payment of approximately SR4,500,000 and forfeited their rights to the spare parts that had an economic value of approximately SR34,477,500. The spare parts were recorded at SR4,500,000 and were included in property and equipment, net on the balance sheets. Under the MoU’s, CGM and Nesma did not receive any further payments from the Company as full settlement against the deterioration of property, plant and equipment which exceeded normal wear and tear and any other breach of contracts. In recognition of certain financial losses incurred by the Company, CGM and NESMA forfeited the recovery of all remaining amounts due under the Contracts. The total amounts of liabilities recorded on the Company’s books as of March 31, 2016 were approximately SR65,345,000 which were written off to other income on the statement of operations for the year ended December 31, 2016. There were no outstanding or unresolved claims and all parties have fulfilled their obligations in connection with the Contracts.
Note 9 – Zakat and Income Tax
We have submitted our Zakat and income tax return for the year ended December 31, 20172019 and have obtained our 20172019 Zakat certificate. We are in the process of preparing and submitting our Zakat and income tax return for the year 2018.
The Zakat base for the Saudi shareholders was positive in 2018, 20172020, 2019 and 20162018 and the corresponding Zakat expense and liability has been recorded. ThereIn 2020, 2019 and 2018, there was a taxable profit attributable to our non–Saudinon-Saudi (foreign) shareholders in 2018 and the current income tax expense and liability has also been recorded. There was no taxable profit attributable to ourrecorded, also included in the liability is withholding on non-Saudi (foreign) shareholders for 2017 and 2016, therefore, no current income tax liability is duecapital gains taxes in those years.connection with the share repurchase as discussed in Note 1
The components of Zakat and income tax benefit (expense) are as follows:
| | The components of Zakat and income tax expense (benefit) for the nine months ended September 30, 2020 and years ended December 31, 2019 and 2018 are as follows: | | The components of Zakat and income tax expense (benefit) for the nine months ended September 30, 2020 and years ended December 31, 2019 and 2018 are as follows: |
| | | | | | | | | 2020 | | 2019 | | 2018 |
| | Years ended December 31, | |
| | 2018 |
| | 2017 |
| | 2016 |
| |
| Deferred income tax benefit | 12,961,569 |
| | 8,617,706 |
| | 6,694,909 |
| |
| Deferred income tax expense (benefit) | | Deferred income tax expense (benefit) | (3,277,217) | | | 1,737,276 | | | (12,961,569) | |
| Change in valuation allowance | (5,736,640 | ) | | (9,035,670 | ) | | (8,413,167 | ) | Change in valuation allowance | (940,440) | | | (1,312,403) | | | 5,736,640 | |
| Current Zakat and income tax expense | (5,400,000 | ) | | (3,209,229 | ) | | (1,877,986 | ) | Current Zakat and income tax expense | 6,054,522 | | | 6,326,283 | | | 5,400,000 | |
| | | | | | | |
| Zakat and income tax benefit (expense) | 1,824,929 |
|
| (3,627,193 | ) |
| (3,596,244 | ) | |
| Zakat and income tax expense (benefit) | | Zakat and income tax expense (benefit) | 1,836,865 | | | 6,751,156 | | | (1,824,929) | |
The difference between the effective income tax rate and the statutory rate for non-Saudi shareholders of 20% for the nine months ended September 30, 2020 and the years ended December 31, 2019 and 2018 2017, and 2016, relates primarily to changes in the valuation allowance and adjustments to estimates in depreciation.
Tax effects
| | | Tax effects of temporary differences that give rise to significant portions of non-Saudi owners deferred tax assets and deferred tax liabilities were as follows: | | Tax effects of temporary differences that give rise to significant portions of non-Saudi owners deferred tax assets and deferred tax liabilities were as follows: |
| | December 31, | | September 30, | | December 31, |
| | 2018 |
| | 2017 |
| | 2020 | | 2019 |
| Deferred tax assets: | | | | Deferred tax assets: | | | |
| Loss carryforward | 42,194 |
| | 42,884 |
| Loss carryforward | 40,645,080 | | | 41,293,547 | |
| Other | 657 |
| | 469 |
| Other | 449,302 | | | 799,526 | |
| | | | | |
| | 42,851 |
|
| 43,352 |
| | 41,094,382 | | | 42,093,073 | |
| Deferred tax liabilities: | | | | Deferred tax liabilities: | |
| Property and Equipment | (7,806 | ) | | (21,236 | ) | Property and Equipment | (4,509,734) | | | (8,785,642) | |
| | | | | | | | |
| Net deferred tax asset | 35,045 |
|
| 22,116 |
| Net deferred tax asset | 36,584,648 | | | 33,307,431 | |
| Valuation allowance | (38,837 | ) | | (33,134 | ) | Valuation allowance | (36,584,648) | | | (37,525,089) | |
| | | | | | | | |
| Net deferred tax liability | (3,793 | ) |
| (11,018 | ) | Net deferred tax liability | 0 | | | (4,217,658) | |
At September 30, 2020 and December 31, 2018 and 2017,2019, we had tax loss carryforwards totaling approximately SR210,970,000SR203,225,000 and SR214,418,000.SR206,468,000. Tax losses may be carried forward indefinitely subject to certain annual limitations for non-Saudi shareholders. We have provided a valuation allowance in 20182020 and 20172019 against a portion of our gross deferred tax assets because of uncertainties regarding their realization.
Note 10 - Long-term Debt
Saudi Industrial Development Fund (SIDF)
During 2010, the Company entered into a loan agreement with the Saudi Industrial Development Fund (SIDF)SIDF for SR330,000,000 to finish the development of the mine and provide working capital. The loan originally matured in 2019, however, the agreement was amended during 2015 to adjust the maturity date to 2022 as well as the repayment schedule. We did not make certain scheduled loan repayments due in 2017 and 2018 and engaged with SIDF to renegotiate the terms of the debt. In July 2018,May 2020, we amended our agreement with SIDF to adjust the repayment schedule and extend the maturity date toschedule. Payments are due semi-annually starting on May 27, 2021 of approximately SR35,000,000 with a final payment due on April 24, 2024. Under the terms of the agreement with SIDF, we are required to maintain certain financial covenants, among other requirements. The loan agreement is collateralized by all the assets of Company and is guaranteed by the shareholders.
Banque Saudi Fransi (BSF)
Long-term debtsDuring 2019, the Company obtained a credit facility from BSF for SR110,518,400. The facility is to be used to finance capital expenditures related to Guyan and provide bridge financing to SIDF.
The agreement bears interest at Saudi Arabian Interbank Offered Rate (SAIBOR) plus 2.5% per annum. In December 2019, the Company received proceeds of SR50,000,000 which will be repaid starting on March 31, 2021 through equal quarterly installments of approximately SR4,167,000 with the final payment due on December 31, 2023. During 2020, the Company received additional proceeds of SR50,000,000 for bridge financing to SIDF. During December 2020, the Company repaid BSF the SR50,000,000 related to the bridge financing to SIDF.
Under the terms of the agreements with SIDF and BSF, we are summarized as follows at:required to maintain certain financial covenants, among other requirements.
| | | | | | | | | | | |
| Long-term debts are summarized as follows at: | | | |
| September 30, | | December 31, |
| 2020 | | 2019 |
| SIDF | 275,000,000 | | | 275,000,000 | |
| BSF | 100,000,000 | | | 50,000,000 | |
| Deferred finance charges | (5,873,053) | | | (7,066,153) | |
| Total debt | 369,126,947 | | | 317,933,847 | |
| | | |
| Less current portion | 97,500,000 | | | 50,000,000 | |
| | | |
| Total long-term debt, less current portion | 271,626,947 | | | 267,933,847 | |
|
| | | | | |
| | December 31, |
| | 2018 |
| | 2017 |
|
| SIDF loan agreement | 305,000,000 |
| | 305,000,000 |
|
| Deferred finance charges | (8,741,288 | ) | | (10,917,190 | ) |
| Total debt | 296,258,712 |
| | 294,082,810 |
|
| | | | |
| Less current portion | 30,000,000 |
| | 65,000,000 |
|
| | | | |
| Total long-term debt, less current portion | 266,258,712 |
| | 229,082,810 |
|
Deferred finance costs are comprised of SIDF loan origination charges which are capitalized and amortized over the period of the related loan which approximates the interest method. Loan fees of SR8,741,288SR5,873,056 and SR10,917,190SR7,066,153 net of accumulated amortization are included net with long-term debt at September 30, 2020 and December 31, 2018 and 2017.2019. Amortization of loan fees
amounted to approximately SR1,835,000, SR1,639,000, SR1,611,000, and SR2,148,000SR1,639,000 for the nine months ended September 30, 2020 and the years ended December 31, 2019 and 2018, 2017, and 2016, respectively.
The repayment schedule is as follows:
| | | | | |
Years Ending
December 31, | |
| |
| 2020 | 50,000,000 | |
| 2021 | 86,666,668 | |
| 2022 | 91,666,668 | |
| 2023 | 96,666,664 | |
| 2024 | 50,000,000 | |
| |
| |
| 375,000,000 | |
|
| | |
Years Ending December 31, | |
| | |
| 2019 | 30,000,000 |
|
| 2020 | 50,000,000 |
|
| 2021 | 60,000,000 |
|
| 2022 | 60,000,000 |
|
| 2023 | 70,000,000 |
|
| Thereafter | 35,000,000 |
|
| | |
| | 305,000,000 |
|
Note 11 – End-of-Service Indemnities
The change in the end-of-service indemnities provision is as follows: | | | | | | | | | | | |
| The change in the end-of-service indemnities provision is as follows: | | | |
| September 30, | | December 31, |
| 2020 | | 2019 |
| Balance, beginning of period | 4,880,892 | | | 3,649,889 | |
| Provision | 2,198,461 | | | 2,208,156 | |
| Paid | (1,049,432) | | | (977,153) | |
| Balance, end of period | 6,029,921 | | | 4,880,892 | |
|
| | | | | |
| | Years Ended December 31, |
| | 2018 |
| | 2017 |
|
| Balance, beginning of year | 2,518,529 |
| | 1,480,636 |
|
| Provision for the year | 1,347,418 |
| | 1,375,024 |
|
| Paid during the year | (216,058 | ) | | (337,131 | ) |
| Balance, end of year | 3,649,889 |
|
| 2,518,529 |
|
Note 12 – Asset Retirement Obligations
During 2012, we recorded an ARO for deferred mine closure costs of approximately SR12,843,000. These deferred mine closure costs are being amortized over the estimated life of the mine. Amortization expense was approximately SR362,000, SR541,000, and SR745,000 SR1,117,000,for the nine months ended September 30, 2020 and SR1,117,000 for the years ended December 31, 2018, 2017,2019 and 2016.2018.
| | | | | | | | | | | |
| Deferred mine closure costs consisted of the following at: | | | |
| September 30, | | December 31, |
| 2020 | | 2019 |
| Cost | 12,842,625 | | | 12,842,625 | |
| Accumulated amortization | (7,993,376) | | | (7,631,120) | |
| | | |
| 4,849,249 | | | 5,211,505 | |
Deferred mine closure costs consisted of the following at:
|
| | | | | |
| | December 31, |
| | 2018 |
| | 2017 |
|
| Cost | 12,842,625 |
| | 12,842,625 |
|
| Accumulated amortization | (6,886,626 | ) | | (6,142,126 | ) |
| | | | |
| | 5,955,999 |
|
| 6,700,499 |
|
A summary of changes in our provision for mine closure costs is as follows:
|
| | | | | | | | |
| | Years Ended December 31, |
| | 2018 |
| | 2017 |
| | 2016 |
|
| Balance, beginning of year | 15,519,938 |
| | 14,995,109 |
| | 14,488,028 |
|
| Accretion expense | 543,198 |
| | 524,829 |
| | 507,081 |
|
| | | | | | |
| Balance, end of year | 16,063,136 |
|
| 15,519,938 |
|
| 14,995,109 |
|
| | | | | | | | | | | | | | | | | |
| A summary of changes in our provision for mine closure costs is as follows: | | | | | |
| September 30, | | December 31, |
| 2020 | | 2019 | | 2018 |
| Balance, beginning of period | 16,625,347 | | | 16,063,136 | | | 15,519,938 | |
| Accretion expense | 405,558 | | | 562,211 | | | 543,198 | |
| | | | | |
| Balance, end of period | 17,030,905 | | | 16,625,347 | | | 16,063,136 | |
ARO costs may increase or decrease significantly in the future as a result of changes in regulations, changes in engineering designs and technology, permit modifications or updates, changes in mine plans, inflation or other factors and as actual reclamation spending occurs.
Note 13 – General and Administrative Expenses
A summary of general and administrative expenses is as follows: | | | | | | | | | | | | | | | | | |
| A summary of general and administrative expenses is as follows: | | | | | |
| September 30, | | December 31, |
| 2020 | | 2019 | | 2018 |
| Wages, salaries and related costs | 7,823,013 | | | 18,701,126 | | | 17,036,965 | |
| Mine closure and environmental | 767,814 | | | 1,306,705 | | | 1,287,698 | |
| Office expenses and other | 6,494,431 | | | 8,831,910 | | | 9,287,218 | |
| Travel and accommodation | 85,721 | | | 27,182 | | | 593,046 | |
| Professional fees | 3,522,068 | | | 1,488,500 | | | 1,271,071 | |
| | | | | |
| 18,693,047 | | | 30,355,423 | | | 29,475,998 | |
|
| | | | | | | | |
| | Years Ended December 31, |
| | 2018 |
| | 2017 |
| | 2016 |
|
| Wages, salaries and related costs | 17,036,965 |
| | 14,837,901 |
| | 10,195,511 |
|
| Mine closure and environmental | 1,287,698 |
| | 1,641,580 |
| | 1,623,831 |
|
| Office expenses | 9,287,218 |
| | 6,589,090 |
| | 5,491,679 |
|
| Travel and accommodation | 593,046 |
| | 2,958,938 |
| | 1,477,413 |
|
| Professional fees | 1,271,071 |
| | 2,272,224 |
| | 8,169,121 |
|
| | | | | | |
| | 29,475,998 |
|
| 28,299,733 |
|
| 26,957,555 |
|
Note 14 - Commitments and Contingencies
Operating lease obligations
Our lease commitment for our surface mining lease was initially granted for a period of 30 years through 2024. The lease allows for renewal for an additional 20 years. We also have leases for our corporate offices and three residential villas in Najran through 2025. There is also a mining lease that covers the Guyan area for a period of 20 years. years through 2034.
A summary of these commitments are as follows:
| | Years Ending December 31, | | Years Ending
December 31, | |
| | | |
| 2019 | 990,000 |
| |
| 2020 | 990,000 |
| 2020 | 247,500 | |
| 2021 | 990,000 |
| 2021 | 990,000 | |
| 2022 | 990,000 |
| 2022 | 990,000 | |
| 2023 | 550,000 |
| 2023 | 550,000 | |
| 2024 | | 2024 | 550,000 | |
| 2025 | | 2025 | 110,000 | |
| Thereafter | 1,650,000 |
| Thereafter | 990,000 | |
| | | |
| | 6,160,000 |
| | 4,427,500 | |
Capital lease obligations
We lease certain equipment vehicles under capital lease obligations that are set to expire at various dates through 2021.2022. The future minimum lease payments under the capital lease obligations are as follows for the years ending December 31,:of September 30, 2020:
| | | | | |
| 2020 | 723,727 | |
| 2021 | 2,791,921 | |
| 2022 | 1,482,543 | |
| Total minimum lease payments | 4,998,191 | |
| Less deferred financial charges | (496,193) | |
| Total capital lease obligations | 4,501,998 | |
| Less: current portion of capital lease obligations | 2,479,480 | |
| Total long term portion, net current portion | 2,022,518 | |
|
| | |
| 2019 | 250,526 |
|
| 2020 | 250,526 |
|
| 2021 | 147,558 |
|
| Total minimum lease payments | 648,610 |
|
| Less deferred financial charges | (95,593 | ) |
| Total capital lease obligations | 553,017 |
|
| Less: current portion of capital lease obligations | 193,206 |
|
| Total long term portion, net current portion | 359,811 |
|
Note 15 - Fair Value Measurement
Fair value accounting guidance includes a hierarchy that prioritizes the inputs to valuation techniques used to measure fair value. The hierarchy gives the highest priority to unadjusted quoted prices in active markets for identical assets or liabilities (Level 1 inputs) and the lowest priority to unobservable inputs (Level 3 inputs).
|
| | | | |
| Level 1 | Unadjusted quoted prices in active markets that are accessible at the measurement date for identical, unrestricted assets or liabilities; |
|
| |
| Level 2 | Quoted prices in markets that are not active, quoted prices for similar assets or liabilities in active markets, inputs other than quoted prices that are observable for the asset or liability, or inputs that are derived principally from or corroborated by observable market data by correlation or other means; and |
|
| |
| Level 3 | Prices or valuation techniques that require inputs that are both significant to the fair value measurement and unobservable (supported by little or no market activity). |
We did not have any significant transfers in or out of Levels 1, 2, or 3 in 20182020 or 2017.2019. The embedded derivatives in our provisional sales contracts are considered Level 2 measurements.
Note 16–Embedded Derivatives
As described in Note 2 under Revenue Recognition, our concentrate sales contracts provide for provisional pricing based on the LME price at the time of shipment as specified in the contract. Sales contracts with a provisional sales price contain an embedded derivative (i.e., the price settlement mechanism that is settled after the time of delivery) that is required to be bifurcated from the host contract. The host contract is the sale of the metals contained in the concentrates at the then-current LME price as defined in the contract. Mark-to-market price fluctuations recorded through the settlement date are reflected in revenues for sales contracts. Our embedded derivatives at December 31, 2018 and 2017, were not significant to the financial statements.