UNITED STATES
SECURITIES AND EXCHANGE COMMISSION
Washington, D.C. 20549
FORM 10-K
(Mark One)
|
| | | | |
| ☑ | ANNUAL REPORT PURSUANT TO SECTION 13 OR 15(d) OF THE SECURITIES EXCHANGE ACT OF 1934 |
For the Fiscal Year Ended December 31, 20192021
Or
|
| | | | |
| ☐ | TRANSITION REPORT PURSUANT TO SECTION 13 OR 15(d) OF THE SECURITIES EXCHANGE ACT OF 1934 |
Commission File No. 001-35049
EARTHSTONE ENERGY, INC.
(Exact name of registrant as specified in its charter)
|
| | | | | | | |
| Delaware | | 84-0592823 |
(State or other jurisdiction
of incorporation or organization)
| | (I.R.S. Employer
Identification No.)
|
1400 Woodloch Forest Drive, Suite 300
The Woodlands, Texas 77380
(Address of principal executive offices)
Registrant’s telephone number, including area code: (281) 298-4246
Securities registered pursuant to Section 12(b) of the Act:
|
| | | | | | | |
| Title of each class | Trading Symbol | Name of each exchange on which registered |
| Class A Common Stock, $0.001 par value per share | ESTE | New York Stock Exchange (NYSE) |
Securities registered under Section 12(g) of the Act:
None
Indicate by check mark if the registrant is a well-known seasoned issuer, as defined in Rule 405 of the Securities Act. Yes ☐ No ☑
Indicate by check mark if the registrant is not required to file reports pursuant to Section 13 or 15(d) of the Exchange Act. Yes ☐ No ☑
Indicate by check mark whether the registrant (1) has filed all reports required to be filed by Section 13 or 15(d) of the Securities Exchange Act of 1934 during the preceding 12 months (or for such shorter period that the registrant was required to file such reports), and (2) has been subject to the filing requirements for the past 90 days. Yes ☑ No ☐
Indicate by check mark whether the registrant has submitted electronically every Interactive Data File required to be submitted and posted pursuant to Rule 405 of Regulation S-T during the preceding 12 months (or for such shorter period that the registrant was required to post such files). Yes ☑ No ☐
Indicate by check mark whether the registrant is a large accelerated filer, an accelerated filer, a non-accelerated filer, a smaller reporting company, or an emerging growth company. See the definitions of “large accelerated filer”, “accelerated filer”, “smaller reporting company” and “emerging growth company” in Rule 12b-2 of the Exchange Act:
|
| | | | | | | | | | | | | | | | | | | |
| Large accelerated filer | | ☐ | | Accelerated filer | | ☑ |
| Non-accelerated filer | | ☐ | | Smaller reporting company | | ☑☐ |
| Emerging growth Company | ☐ | | | | |
If an emerging growth company, indicate by check mark if the registrant has elected not to use the extended transition period for complying with any new or revised financial accounting standards provided pursuant to Section 13(a) of the Exchange Act. ☐
Indicate by check mark whether the registrant has filed a report on and attestation to its management’s assessment of the effectiveness of its internal control over financial reporting under Section 404(b) of the Sarbanes-Oxley Act (15 U.S.C. 7262(b)) by the registered public accounting firm that prepared or issued its audit report. ☑
Indicate by check mark whether the registrant is a shell company (as defined in Rule 12b-2 of the Exchange Act). Yes ☐ No ☑
The aggregate market value of voting and non-voting common equity held by non-affiliates computed by reference to the price of $6.12$11.07 per share at which the common equity was last sold, as of the last business day of the registrant’s most recently completed second fiscal quarter was approximately $133,695,647.$263,687,345.
As of March 5, 2020, 29,481,4403, 2022, 73,301,255 shares of the registrant’s Class A Common Stock and 35,248,68034,302,535 shares of Class B Common Stock were outstanding.
DOCUMENTS INCORPORATED BY REFERENCE
Portions of the Registrant’s Definitive Proxy Statement for its 20202022 Annual Meeting of Stockholders (the “Proxy Statement”), are incorporated by reference into Part III of this Annual Report on Form 10-K.
TABLE OF CONTENTS
|
| | | | | | | |
| | Page |
| |
| | |
| |
| Item 1. | | |
| Item 1A. | | |
| Item 1B. | | |
| Item 2. | | |
| Item 3. | | |
| Item 4. | | |
| |
| Item 5. | | |
| Item 6. | | |
| Item 7. | | |
| Item 7A. | | |
| Item 8. | | |
| Item 9. | | |
| Item 9A. | | |
| Item 9B. | | |
| Item 9C. | | |
| |
| Item 10. | | |
| Item 11. | | |
| Item 12. | | |
| Item 13. | | |
| Item 14. | | |
| |
| Item 15. | | |
| Item 16. | | |
| |
CAUTIONARY STATEMENT CONCERNING FORWARD-LOOKING STATEMENTS
Certain statements contained in this report may contain “forward-looking statements” within the meaning of Section 27A of the Securities Act of 1933, as amended (the “Securities Act”), and Section 21E of the Securities Exchange Act of 1934, as amended (the “Exchange Act”). All statements other than statements of historical facts contained in this report are forward-looking statements. These forward-looking statements can generally be identified by the use of words such as “may,” “will,” “could,” “should,” “project,” “intends,” “plans,” “pursue,” “target,” “continue,” “believes,” “anticipates,” “expects,” “estimates,” “guidance,” “possible,” “probable,” “predicts,” or “potential,” the negative of such terms or variations thereon, or other comparable terminology. Statements that describe our future plans, strategies, intentions, expectations, objectives, goals, potential acquisitions or mergers or prospects are also forward-looking statements. Actual results could differ materially from those anticipated in this filing or these forward-looking statements. Readers should consider carefully the risks described under the “Risk Factors” section of this report and other sections of this report which describe factors that could cause our actual results to differ from those anticipated in forward-looking statements, including, but not limited to, the following factors:
•continued volatility and weakness in commodity prices for oil, natural gas and natural gas liquids and the effect of prices set or influenced by action of the Organization of Petroleum Exporting Countries (“OPEC”), its members and other oil and natural gas producing countries;
substantial changes in estimates of our proved reserves;
substantial declines in the estimated values of our proved oil and natural gas reserves;
our ability to replace our oil and natural gas reserves;
the risk of the actual presence or recoverability of oil and natural gas reserves and that future production rates will be less than estimated;
the potential for production decline rates and associated production costs for our wells to be greater than we forecast;
the timing and extent of our success in developing, acquiring, discovering and producing oil and natural gas reserves;
the ability and willingness of our partners under our joint operating agreements to join in our plans for future exploration, development and production activities;
our ability to acquire additional mineral leases;
the cost and availability of high-quality goods and services with fully trained and adequate personnel, such as contract drilling rigs and completion equipment on a timely basis and at reasonable prices;
risks in connection with potential acquisitions and the integration of significant acquisitions or assets acquired through merger or otherwise;
the possibility that acquisitions and divestitures may involve unexpected costs or delays, and that acquisitions may not achieve intended benefits;
the possibility that potential divestitures may not occur or could be burdened with unforeseen costs;
unanticipated reductions in the borrowing base under the credit agreement we are party to;
risks incidental to the drilling and operation of oil and natural gas wells including mechanical failures;
our dependence on the availability, use and disposal of water in our drilling, completion and production operations;
the availability of sufficient pipeline and other transportation facilities to carry our production to market and the impact of these facilities on realized prices;
significant competition for oil and natural gas acreage and acquisitions;
•the effect of existing and future laws, governmental regulations and the political and economic climates of the United States particularly with respect to climate change, alternative energy and similar topical movements;
•substantial changes in estimates of our proved reserves;
•substantial declines in the estimated values of our proved oil and natural gas reserves;
•our ability to replace our oil and natural gas reserves;
•impacts of world health events, including the coronavirus (“COVID-19”) pandemic;
•the risk of the actual presence or recoverability of oil and natural gas reserves and that future production rates may be less than estimated;
•the potential for production decline rates and associated production costs for our wells to be greater than we forecast;
•the timing and extent of our success in acquiring, discovering, developing and producing oil and natural gas reserves;
•the financial ability and willingness of our partners under our joint operating agreements to join in our plans for future exploration, development and production activities;
•our ability to acquire additional mineral leases;
•the cost and availability of high-quality equipment and services with fully trained and adequate personnel, such as contract drilling rigs and completion equipment on a timely basis and at reasonable prices;
•risks in connection with potential acquisitions and the integration of significant acquisitions or assets acquired through merger or otherwise;
•the possibility that acquisitions and divestitures may involve unexpected costs or delays, and that acquisitions may not achieve intended benefits;
•the possibility that potential divestitures may not occur or could be burdened with unforeseen costs;
•unanticipated reductions in the borrowing base under the credit agreement we are party to;
•risks incidental to the drilling and operation of oil and natural gas wells including mechanical failures;
•our dependence on the availability, use and disposal of water in our drilling, completion and production operations;
•the availability of sufficient pipeline and other transportation facilities to carry our production to market and the impact of these facilities on realized prices;
•significant competition for oil and natural gas acreage and acquisitions;
•our ability to retain key members of senior management and key technical and financial employees;
•changes in environmental laws and the regulation and enforcement related to those laws;
•the identification of and severity of adverse environmental events and governmental responses to these or other environmental events;
•legislative or regulatory changes, including retroactive royalty or production tax regimes, hydraulic-fracturing regulations, derivatives reform, and changes in federal and state income taxes;
•future ESG compliance developments and increased attention to such matters which could adversely affect our ability to raise equity and debt capital;
•general economic conditions, whether internationally, nationally or in the regional and local market areas in which we conduct business, may be less favorable than expected, including the possibility that economic conditions in the United States could deteriorate and that capital markets for equity and debt could be disrupted or unavailable;
•social unrest, political instability or armed conflict in major oil and natural gas producing regions outside the United States and acts of terrorism or sabotage;
•our insurance coverage may not adequately cover all losses that may be sustained in connection with our business activities;
•other economic, competitive, governmental, regulatory, legislative, including federal state and tribalstate regulations and laws, geopolitical and technological factors that may negatively impact our business, operations or oil and natural gas prices;
•the effect of our oil and natural gas derivative activities;
•title to the properties in which we have an interest may be impaired by title defects;
•our dependency on the skill, ability and decisions of third partythird-party operators of oil and natural gas properties in which we have non-operated working interests; and
•possible adverse results from litigation and the use of financial resources to defend ourselves.
All forward-looking statements are expressly qualified in their entirety by the cautionary statements in this section and elsewhere in this report. Other than as required under the applicable securities laws, we do not assume a duty to update these forward-looking statements, whether as a result of new information, subsequent events or circumstances, changes in expectations or otherwise. You should not place undue reliance on these forward-looking statements. All forward-looking statements speak only as of the date of this report or, if earlier, as of the date they were made.
For further information regarding these and other factors, risks and uncertainties affecting us, see Part I, Item 1A. Risk Factors of this report.
GLOSSARY OF CERTAIN OIL AND NATURAL GAS TERMS
The following are abbreviations and definitions of terms commonly used in the oil and natural gas industry and within this report.
3-D seismic – An advanced technology method of detecting accumulation of hydrocarbons identified through a three-dimensional picture of the subsurface created by the collection and measurement of the intensity and timing of sound waves transmitted into the earth as they reflect back to the surface.
Bbl – One barrel or 42 U.S. gallons liquid volume of oil or other liquid hydrocarbons.
Bcf – One billion cubic feet of natural gas.
Boe – Barrel of oil equivalent, determined using a ratio of six Mcf of natural gas equal to one barrel of oil equivalent. The ratio does not assume price equivalency and, given price differentials, the price for a barrel of oil equivalent for natural gas differs significantly from the price for a barrel of oil. A barrel of NGLs also differs significantly in price from a barrel of oil.
Btu – British thermal unit, the quantity of heat required to raise the temperature of one pound of water by one-degree Fahrenheit.
Completion – The process of treating and hydraulically fracturing a drilled well followed by the installation of permanent equipment for the production of oil or natural gas, or in the case of a dry hole, the reporting of abandonment to the appropriate regulatory agency.
Developed acreage – The number of acres which are allotted or assignable to producing wells or wells capable of production.
Development activities – Activities following exploration including the drilling and completion of additional wells and the installation of production facilities.
Development well – A well drilled within the proved area of an oil or natural gas reservoir to the depth of a stratigraphic horizon known to be productive.
Dry hole or well – A well found to be incapable of producing hydrocarbons economically.
ESG – Environmental, Social and Governance.
Exploitation – A development or other project which may target proven or unproven reserves (such as probable or possible reserves), but which generally has a lower risk than that associated with exploration projects.
Exploratory well – A well drilled to find and produce oil or natural gas reserves in an area or a potential reservoir not classified as proved.
Farm-in or Farm-out – An agreement whereby the owner of a working interest in an oil and natural gas lease assigns or contractually conveys, subject to future assignment, the working interest or a portion thereof to another party who desires to drill on the leased acreage. Generally, the farmee is required to drill one or more wells in order to earn its interest in the acreage. The farmor usually retains a royalty and/or an after-payout interest in the lease. The interest received by the farmee is a “farm-in” while the interest transferred by the farmor is a “farm-out.”
Field – An area consisting of a single reservoir or multiple reservoirs all grouped on or related to the same individual geological structural feature and/or stratigraphic condition.
Gross acres or gross wells – The total acres or wells, as the case may be, in which a working interest is owned.
Horizontal drilling – A drilling technique that permits the operator to drill horizontally within a specified targeted reservoir and thus exposes a larger portion of the producing horizon to a wellbore than would otherwise be exposed through conventional vertical drilling techniques.
Hydraulic fracture or Frac – A well stimulation method by which fluid, comprised largely of water and proppant (purposely sized particles used to hold open an induced fracture) is injected downhole and into the producing formation at high pressures and rates in order to exceed the rock strength and create a fracture such that the proppant material can be placed into the fracture to enhance the productive capability of the formation.
Injection well – A well which is used to inject gas, water, or liquefied petroleum gas under high pressure into a producing formation to maintain sufficient pressure to produce the recoverable reserves.
Joint Operating Agreement or JOA – Any agreement between working interest owners concerning the duties and responsibilities of the operator and rights and obligations of the non-operators.
MBbls – One thousand barrels of crude oil or other liquid hydrocarbons.
MBoe –One thousand barrels of oil equivalent, determined using a ratio of six Mcf of natural gas equal to one barrel of oil equivalent.
MMBoe –One million barrels of oil equivalent, determined using a ratio of six Mcf of natural gas equal to one barrel of oil equivalent.
MMBtu – One million Btu.
Mcf – One thousand cubic feet.
MMcf – One million cubic feet.
Net acres or net wells – The sum of the fractional working interests owned in gross acres or gross wells.
NGLs – Natural gas liquids measured in barrels. NGLs are made up of ethane, propane, isobutane, normal butane and natural gasoline, each of which have different uses and different pricing characteristics.
NYMEX – The New York Mercantile Exchange.
Plugging and abandonment or P&A – Refers to the sealing off of fluids in the strata penetrated by a well so that the fluids from one stratum will not escape into another stratum or to the surface.
PV-10 – The present value of estimated future revenues, discounted at 10% annually, to be generated from the production of proved reserves determined in accordance with the SEC guidelines, net of estimated production and future development costs, using prices and costs as of the date of estimation without future escalation, without giving effect to (i) non-property related expenses such as general and administrative expenses, debt service and future income tax expense, or (ii) depreciation, depletion and amortization.
Productive well – A well that is found to be capable of producing hydrocarbons in sufficient quantities such that proceeds from the sale of such production exceeds production expenses and taxes.
Proppant – A solid material, typically treated sand or man-made ceramic materials, designed to keep an induced hydraulic fracture open, during or following a fracturing treatment.
Proved developed nonproducing reserves or PDNP – Hydrocarbons in a potentially producing horizon penetrated by a wellbore, the production of which has been postponed pending completion activities and the installation of surface equipment or gathering facilities or pending the production of hydrocarbons from another formation penetrated by the wellbore. The hydrocarbons are classified as proved developed but nonproducing reserves.
Proved developed producing reserves or PDP – Reserves that can be expected to be recovered from existing wells and completions with existing equipment and operating methods.
Proved developed reserves or PD – The estimated quantities of oil, natural gas and NGLs that geological and engineering data demonstrate with reasonable certainty to be commercially recoverable in future years from known reservoirs under existing economic and operating conditions.
Proved reserves – Those quantities of oil and natural gas, which, by analysis of geoscience and engineering data, can be estimated with reasonable certainty to be economically producible—from a given date forward, from known reservoirs, and under existing economic conditions, operating methods, and government regulations—prior to the time at which contracts providing the right to operate expire, unless evidence indicates that renewal is reasonably certain, regardless of whether deterministic or probabilistic methods are used for the estimation. The project to extract the hydrocarbons must have commenced or the operator must be reasonably certain that it will commence the project within a reasonable time. The area of the reservoir considered as proved includes (i) the area identified by drilling and limited by fluid contacts, if any, and (ii) adjacent undrilled portions of the reservoir that can, with reasonable certainty, be judged to be continuous with it and to contain economically producible oil or gas on the basis of available geoscience and engineering data. In the absence of data on fluid contacts, proved quantities in a reservoir are limited by the lowest known hydrocarbons (“LKH”), as seen in a well penetration unless geoscience, engineering, or performance data and reliable technology establishes a lower contact with reasonable certainty. Where direct observation from well penetrations has defined a highest known oil (“HKO”), elevation and the potential exists for an associated gas cap, proved oil reserves may be assigned in the structurally higher portions of the reservoir only if geoscience, engineering, or performance data and reliable technology establish the higher contact with reasonable certainty. Reserves which can be produced economically through application of improved recovery techniques (including, but not limited to, fluid injection) are included in the proved classification when (i) successful testing by a pilot project in an area of the reservoir with properties no more favorable than in the reservoir as a whole, the operation of an installed program in the reservoir or an analogous reservoir, or other evidence using reliable technology establishes the reasonable certainty of the engineering analysis on which the project or program was based; and (ii) the project has been approved for development by all necessary parties and entities, including governmental entities. Existing economic conditions include prices and costs at which economic producibility from a reservoir is to be determined. The price shall be the average price during the 12-month period prior to the ending date of the period covered by the report, determined as an unweighted arithmetic average of the first-day-of-the-month price for each month within such period, unless prices are defined by contractual arrangements, excluding escalations based upon future conditions.certain.
Proved undeveloped reserves or PUD – Proved reserves that are expected to be recovered from new wells on undrilled acreage or from existing wells where a relatively major expenditure is required for recompletion. Reserves on undrilled acreage shall be limited to those directly offsetting development spacing areas that are reasonably certain of production when drilled, unless evidence
using reliable technology exists that establishes reasonable certainty of economic producibility at greater distances. Undrilled locations can be classified as having undeveloped reserves only if a development plan has been adopted indicating that they are scheduleto be drilled within five yearsunless specific circumstances justify a longer time. Under no circumstances shall estimates for proved undeveloped reserves be attributable to any acreage for which an application of fluid injection or other improved recovery technique is contemplated, unless such techniques have been proved effective by actual projects in the same reservoir or an analogous reservoir, or by other evidence using reliable technology establishing reasonable certainty.
Recompletion – The completion for production of an existing well bore in another formation from that in which the well has been previously completed.
Re-engineering – A process involving a comprehensive review of the mechanical conditions associated with wells and equipment in producing fields. Our re-engineering practices typically result in a capital expenditure plan which is implemented over time to workover (see below) and re-complete wells and modify down hole artificial lift equipment and surface equipment and facilities. The programs are designed specifically for individual fields to increase and maintain production, reduce down-time and mechanical failures, lower per-unit operating expenses, and therefore, improve field economics.
Reservoir – A permeable underground formation containing a natural accumulation of producible oil and/or natural gas that is confined by impermeable rock or water barriers and is individual and separate from other reservoirs.
Royalty interest – An interest in an oil and natural gas property entitling the owner to a share of oil or natural gas production free of costs of production.
SEC – United States Securities and Exchange Commission.
Shut-in reserves – Those reserves expected to be recovered from completion intervals that were open at the time the reserve was estimated but were not producing due to market conditions, mechanical difficulties or because production equipment or pipelines were not yet installed. These reserves are included in the PDNP category in our reserve report.
Standardized Measure – The present value of estimated future net revenue to be generated from the production of proved reserves, determined in accordance with the rules and regulations of the SEC (using prices and costs in effect as of the date of estimation), less future development, production and income tax expenses, and discounted at 10% per annum to reflect the timing of future net revenue.
Undeveloped acreage – Lease acreage on which wells have not been drilled or completed to a point that would permit the production of commercial quantities of oil and natural gas regardless of whether such acreage contains proved reserves.
Working interest orWI– The ownership interest, generally defined in a JOA, that gives the owner the right to drill, produce and/or conduct operating activities on the property and share in the sale of production, subject to all royalties, overriding royalties and other burdens and obligates the owner of the interest to share in all costs of exploration, development operations and all risks in connection therewith.
Workover – Operations on a producing well to restore or increase production.
WTI – West Texas Intermediate light sweet crude oil, a benchmark in crude oil pricing.
PART I
Item 1. Business
Overview
Earthstone Energy, Inc., a Delaware corporation (“Earthstone” and together with our consolidated subsidiaries, the “Company,” “our,” “we,” “us,” or similar terms), is a growth-oriented independent oil and gas company engaged in the acquisition and development of oil and gas reserves through activities that include the acquisition, drilling and development of undeveloped leases, as well as asset and corporate acquisitions and mergers. Our operations are all in the upstream segment of the oil and natural gas industry and all our properties are onshore in the United States. At present, ourOur assets are currently located in the Midland Basin of westin West Texas, and the Eagle Ford Trend in South Texas and the Delaware Basin in New Mexico.
2021 Highlights
The following are highlights of south Texas.our 2021 activities:
Our primary focus is concentrated•Signed Purchase and Sale Agreement on the Chisholm Acquisition on December 15, 2021 which was closed on February 15, 2022
•Closed the Foreland Acquisition and the BCC Acquisition on November 2, 2021
•Closed the Tracker Acquisition and the Sequel Acquisition on July 20, 2021
•Closed the Eagle Ford Acquisitions during the second quarter of 2021
•Closed the IRM Acquisition on January 7, 2021
•Full year 2021 average daily sales volumes of 24,809 Boepd exceeded our production goals and increased 62% over 2020
•Maintained strong balance sheet and liquidity position with $330.0 million of undrawn capacity on a $650.0 million senior revolving credit facility and a cash balance of $4.0 million as of December 31, 2021
•Continued development of our properties which included drilling 29 gross / 25.4 net operated wells and completing 19 gross / 15.4 net operated wells
We spent a total of approximately $280.4 million, net of customary purchase price adjustments, and issued 21,530,705 shares of our Class A common stock with an acquisition date fair value of $166.5 million, related to the four acquisitions that were closed during 2021. In the aggregate, these acquisitions added significant scale by increasing our proved reserves by 60.0 MMBoe, increasing sales volumes by 3.4 MMBoe and expanding our Permian Basin acreage footprint by approximately 199% gross / 266% net.
Recent Developments
Bighorn Agreement
On January 30, 2022, Earthstone, Earthstone Energy Holdings, LLC, a subsidiary of Earthstone (“EEH”), and Bighorn Asset Company, LLC, a Delaware limited liability company (“Bighorn”), as seller, entered into a Purchase and Sale Agreement (the “Bighorn Agreement”) that was previously reported on Form 8-K filed with the SEC on February 2, 2022. Pursuant to the Bighorn Agreement, EEH will acquire (the “Bighorn Acquisition”) interests in the Midland Basin of west Texas, a high oil and liquids rich resource basin which provides us with multiple horizontal targets with proven production results, long-lived reservesgas leases and historically high drilling success rates. Utilizing one rig for the entiretyrelated property of 2019 and two rigs for portions of the second and third quarters, we successfully drilled 17 gross / 12.7 net operated wellsBighorn located in the Midland Basin in 2019. Additionally,West Texas, for a purchase price (the “Bighorn Purchase Price”) of $770 million in cash and 6,808,511 shares of Class A common stock, $0.001 par value per share of Earthstone (the “Class A Common Stock”). The Bighorn Purchase Price is subject to customary purchase price adjustments with an effective date of January 1, 2022. In connection with the Bighorn Agreement, EEH deposited $50 million in cash into a third-party escrow account as a deposit pursuant to the Bighorn Agreement, which will be credited against the Bighorn Purchase Price upon closing of the Bighorn Acquisition. The Bighorn Acquisition is expected to close in the second quarter of 2022.
Credit Agreement
On January 30, 2022, Earthstone, EEH, as Borrower, Wells Fargo Bank, National Association (“Wells Fargo”) as Administrative Agent, the lenders party thereto (the “Lenders”) and the guarantors party thereto entered into an amended and restated Fifth Amendment (the “Amendment”) to the Credit Agreement dated November 21, 2019, by and among EEH, as Borrower, Earthstone, as Parent, Wells Fargo, as Administrative Agent and Issuing Bank, Royal Bank of Canada, as Syndication Agent, Truist Bank, Citizens Bank, N.A., KeyBank National Association, U.S. Bank National Association, Fifth
Third Bank, PNC Bank, National Association, and Bank of America, N.A., as Documentation Agents, and the Lenders party thereto (together with all amendments or other modifications, the “Credit Agreement”). Among other things, the Amendment increased the borrowing base and corresponding elected commitments from $650 million to $825 million upon the closing (“Chisholm Closing”) of that certain Purchase and Sale Agreement dated as December 15, 2021 (the “Chisholm Agreement”) by and among Earthstone, EEH, Chisholm Energy Operating, LLC (“OpCo”) and Chisholm Energy Agent, Inc. (“Agent” and collectively with OpCo, “Chisholm”); provides that upon the closing of the Bighorn Acquisition, the borrowing base and corresponding elected commitments would increase to $1.325 billion, unless Earthstone completes an unsecured senior notes offering (“Notes Offering”) prior to the closing of the Bighorn Acquisition in which case the elected commitments will be reduced by the amount of the net proceeds from a Notes Offering up to $500 million; provides for an increase in interest rates by 0.50% in the event a Notes Offering has not been completed prior to the closing of the Bighorn Acquisition; provides mechanics relating to the transition from LIBOR to a benchmark replacement rate, the Secured Overnight Financing Rate (“SOFR”), to be effective contemporaneously with the effectiveness of the Amendment on January 30, 2022; adds certain hedging requirements relating to anticipated oil and natural gas production of the properties to be acquired pursuant to the Bighorn Acquisition; adjusts some financial covenants; redefines the limitations on certain restricted payments the Borrower may make; and made certain administrative changes to the Credit Agreement.
Securities Purchase Agreement
As previously reported on Form 8-K filed with the SEC on February 2, 2022, on January 30, 2022 Earthstone entered into a securities purchase agreement (the “Securities Purchase Agreement”) with EnCap Capital Energy Fund XI, L.P. (“EnCap Fund XI”), an affiliate of EnCap Investments L.P. (“EnCap”), and Cypress Investments, LLC, a fund managed by Post Oak Energy Capital, LP (“Post Oak” and collectively with EnCap Fund XI, the “Investors”) to sell, in a private placement (the “Private Placement”), 280,000 shares of newly authorized Series A convertible preferred stock, $0.001 par value per share of Earthstone (the “Preferred Stock”), each share of which will be convertible into 90.0900900900901 shares of Class A Common Stock for anticipated gross proceeds of $280.0 million, at a price of $1,000.00 per share of Preferred Stock (or $11.10 per share of Class A Common Stock on an as-converted basis). The Private Placement is contingent upon the closing of the Bighorn Acquisition. The Company intends to use the net proceeds from the sale of the Preferred Stock to partially fund the Bighorn Acquisition. The Preferred Stock will convert automatically on the 20th calendar day after Earthstone mails a definitive information statement to holders of its Class A Common Stock and Class B common stock, $0.001 par value per share of Earthstone (“Class B Common Stock” and collectively, with the Class A Common Stock, the “Common Stock”) notifying them that holders of a majority of the outstanding shares of Common Stock have consented to the conversion feature of the Preferred Stock and the issuance of Class A Common Stock upon conversion of the Preferred Stock. As of January 30, 2022, Earthstone had received written consent for the conversion feature of the Preferred Stock and the issuance of the Class A Common Stock issuable upon conversion of the Preferred Stock from stockholders representing more than 50% of Earthstone’s outstanding shares of Common Stock. As of the date of the Securities Purchase Agreement, EnCap and its affiliates beneficially owned approximately 46.5% of the outstanding voting power of Earthstone. Two members of the board of directors of Earthstone (the “Board”) are employed by EnCap. The Securities Purchase Agreement and the Private Placement were evaluated and unanimously approved by the audit committee (the “Audit Committee”) of the Board and unanimously approved by the Board.
Chisholm Acquisition
On February 15, 2022, Earthstone, EEH, Chisholm, as seller, consummated the transactions contemplated in the Chisholm Agreement that was previously reported on Form 8-K filed with the SEC on December 17, 2021. At the closing of the Chisholm Agreement, among other things, EEH acquired (the “Chisholm Acquisition”) interests in oil and gas leases and related property of Chisholm located in Lea County and Eddy County, New Mexico, for aggregate consideration consisting of: (i) approximately $314.7 million in cash, net of preliminary and customary purchase price adjustments and remains subject to post-closing settlement between EEH and Chisholm paid at the closing of the Chisholm Acquisition, (ii) $70 million in cash to be paid as follows: $40 million to be paid six months after the closing of the Chisholm Acquisition and $30 million to be paid 12 months after the closing of the Chisholm Acquisition, subject to acceleration in the event that Earthstone receives gross proceeds of more than $450 million from a high yield bond offering or more than $50 million in gross proceeds from an offering of Class A Common Stock or preferred stock; and (iii) 19,417,476 shares of Class A Common Stock. See further discussion in Note 14. Related Party Transactions and Note 19. Subsequent Events in the Notes to Consolidated Financial Statements.
Cash consideration for the Chisholm Acquisition was funded by borrowings under our senior secured revolving credit facility whose borrowing base was increased from $650 million to $825 million upon consummation of the Chisholm Acquisition.
Foreland-BCC Acquisition
On November 2, 2021, Earthstone, EEH and Foreland Investments LP, a Delaware limited partnership (“Foreland”), consummated the transactions contemplated in the Purchase and Sale Agreement dated as of September 30, 2021 by and among
Earthstone, EEH and Foreland (the “Foreland Purchase Agreement”) that was previously reported on Form 8-K filed with the SEC on October 4, 2021. At the closing of the Foreland Purchase Agreement, EEH acquired (the “Foreland Acquisition”) interests in oil and gas leases and related property of Foreland located in Irion County and Crockett County, Texas, for a purchase price consisting of: (i) $16.3 million in cash, and (ii) 2,611,111 shares of Class A Common Stock.
Also, on November 2, 2021, Earthstone, EEH and BCC-Foreland LLC, a Delaware limited liability company (“BCC”), consummated the transactions contemplated in the Purchase and Sale Agreement dated as of September 30, 2021 by and among Earthstone, EEH and BCC (the “BCC Purchase Agreement”) that was previously reported on Form 8-K filed with the SEC on October 4, 2021. At the closing of the BCC Purchase Agreement, EEH acquired (the “BCC Acquisition” and with the Foreland Acquisition, the “Foreland-BCC Acquisition”) certain well-bore interests and related equipment held by BCC that were part of a joint development agreement between Foreland, Foreland Operating, LLC, and BCC involving portions of the acreage covered by the Foreland Purchase Agreement for a purchase price of $23.0 million in cash. See further discussion in Note 3. Acquisitions and Divestitures in the Notes to Consolidated Financial Statements.
Tracker/Sequel Acquisitions
On July 20, 2021, Earthstone, EEH, Tracker Resource Development III, LLC (“Tracker OpCo”), and TRD III Royalty Holdings (TX), LP (“RoyaltyCo” and collectively with Tracker OpCo, the “Tracker”) consummated the transactions contemplated in the Purchase and Sale Agreement dated March 31, 2021 by and among Earthstone, EEH and Seller (the “Tracker Agreement”) that was previously reported on Form 8-K filed with the SEC on April 5, 2021. At the closing of the Tracker Agreement, EEH acquired (the “Tracker Acquisition”) interests in oil and gas leases and related property of Tracker located in Irion County, Texas (the “Tracker Assets”) for aggregate consideration consisting of: (i) $18.8 million in cash, and (ii) 4.7 million shares of Class A Common Stock.
Also, on July 20, 2021, Earthstone, EEH, SEG-TRD LLC, a Delaware limited liability company (“SEG-I”), and SEG-TRD II LLC, a Delaware limited liability company (“SEG-II” and collectively with SEG-I, “Sequel”), consummated the transactions contemplated in the Purchase and Sale Agreement dated March 31, 2021 by and among Earthstone, EEH and Sequel that was previously reported on Form 8-K filed with the SEC on April 5, 2021. At the closing of the Sequel Agreement, EEH acquired (the “Sequel Acquisition”) certain well-bore interests and related equipment held by Sequel that were part of a joint development agreement between Tracker and Sequel involving portions of the acreage covered by the Tracker Agreement for aggregate consideration consisting of: (i) $41.4 million in cash, and (ii) 1.5 million shares of Class A Common Stock. See further discussion in Note 3. Acquisitions and Divestitures and Note 14. Related Party Transactions in the Notes to Consolidated Financial Statements.
Cash consideration for the Tracker Acquisition and the Sequel Acquisition was funded by borrowings under our senior secured revolving credit facility whose borrowing base was increased from $475 million to $550 million on July 20, 2021.
Eagle Ford Acquisitions
During the second quarter of 2021, we spudacquired working interests in certain assets we operate in southern Gonzales County, Texas (the “Eagle Ford Acquisitions”) from four separate sellers for approximately $45.2 million in cash. We funded the Eagle Ford Acquisitions with cash on hand and drilled vertical sectionsborrowings under our senior secured revolving credit facility. The effective date of eight gross / 7.5 net operated wells latethe Eagle Ford Acquisitions was April 1, 2021. One of the four sellers was a related party entity. See further discussion in 2019. We completed Note 3. Acquisitionsand brought onlineDivestitures and Note 14. Related Party Transactions in the Notes to Consolidated Financial Statements.
IRM Acquisition
On January 7, 2021, Earthstone, EEH, Independence Resources Holdings, LLC (“Independence”), and Independence Resources Manager, LLC (“Independence Manager” and collectively with Independence, the “Seller”) consummated the transactions contemplated in the Purchase and Sale Agreement dated December 17, gross / 12.6 net operated wells2020 (the “IRM Purchase Agreement”) that was previously reported on Form 8-K filed with the SEC on December 22, 2020. At the closing of the IRM Purchase Agreement, EEH acquired (the “IRM Acquisition”) all of the issued and had 3.4 net non-operated wells brought onlineoutstanding limited liability company interests in certain wholly owned subsidiaries of Independence and Independence Manager for aggregate consideration consisting of: (i) cash of approximately $140.5 million and (ii) 12,719,594 shares of Class A Common Stock.
Our Properties
As operator, across the majority of our acreage in the Midland and Delaware Basins, we manage and are able to directly influence development and production of our operated properties. Independent contractors engaged by us provide all the equipment and personnel associated with drilling and completion activities. We employ petroleum engineers, geologists and land professionals who work on improving drilling and completion processes, operating costs, production rates and reserves. Our producing properties have reasonably predictable production profiles and cash flows, subject to commodity price and cost fluctuations. Our status as an operator has allowed us to pursue the development of undeveloped acreage, further develop existing properties and generate new projects.
As is common in our industry, we selectively participate in drilling and developmental activities in non-operated properties. Decisions to participate in non-operated properties are dependent upon the technical and economic nature of the projects and the operating expertise and financial standing of the operators.
As of December 31, 2021, our estimated proved oil and natural gas reserves were approximately 147,587 MBoe based on the reserve report prepared by Cawley, Gillespie & Associates, Inc. (“CG&A”), our independent petroleum engineers. Based on this report, at December 31, 2021, our estimated proved reserve quantities were approximately 41% oil, 32% natural gas and 26% NGLs with 63% of those reserves classified as proved developed.
As a result of the Chisholm Acquisition, we added an estimated 54.3 MBoe of proved reserves which were approximately 64% oil, 19% natural gas and 17% NGLs.
Midland Basin
As of December 31, 2021, we had approximately 102,100 net acres in the core of the Midland Basin that are highly contiguous on a project-by-project basis which allow us to drill multi-well pads. Of this acreage, 94% is operated and 6% is non-operated. We hold an approximate 96% working interest in 2019. Additionally,our operated acreage and an approximate 39% working interest in lateour non-operated acreage. As of December the operator of a 15-well non-operated project completed31, 2021, we had interests in approximately five891 gross / one822 net well, which had previously been anticipated to occur in early 2020. Completions on this 15vertical and 298 gross / 3.1219 net well project are continuinghorizontal producing wells, of which we operate 804 vertical and all 15 wells are anticipated to be brought online during the first quarter of 2020.
218 horizontal wells. With 445474 potential gross horizontal drilling locations (299 operated / 175 non-operated) in the Midland Basin as of December 31, 2021, we are focused on developmental drilling and completion operations in the area. During 2019, we began increasing the spacing between our wells in order to reduce well to well interference which in turn increases capital efficiency and productivity. In certain areas, our acreage may support different spacing designs and we will drill accordingly in seeking to maximize economics and recovery.
We continue to pursue acreage trades orand bolt-on acreage acquisitions in the Midland Basin with the intent of increasing our operated acreage and drilling inventory, drilling and completing longer laterals and realizing greater operating efficiencies.
Delaware Basin
Upon the consummation of the Chisholm Acquisition on February 15, 2022, we acquired approximately 36,100 net acres located in the Delaware Basin in New Mexico with approximately 85% held by production and approximately 92% operated. We now have interests in approximately 333 gross / 169 net producing wells, of which we operate 190 gross / 149 net producing wells. We have identified approximately 29,100414 gross / 237 net acrespotential drilling locations in the corethis acreage.
Eagle Ford Trend
As of the Midland Basin that are highly contiguous on a project by project basis which allow us to drill multi-well pads. Of this acreage, 79% is operated and 21% is non-operated. We hold an approximate 94% working interest in our operated acreage and an approximate 40% working interest in our non-operated acreage. Our operated acreage in the Midland Basin is primarily located in Reagan, Upton and Midland counties. Our non-operated acreage in the Midland Basin is located primarily in Howard, Glasscock, Martin, Midland and Reagan counties. In total,December 31, 2021, we have an interest in 212 gross producing wells in the Midland Basin. We havehad approximately 14,50012,700 net leasehold acres in the Eagle Ford Trend, which primarily consists of approximately 14,100 operated net leasehold acres in the crude oil window in Fayette, Gonzales and Karnes counties with working interests ranging from approximately 12% to 67%. We have an interest in 116which include 37 gross / 32 net operated producing wells and six83 gross / 36 net non-operated producing wells in the Eagle Ford Trend.
At December 31, 2019, our estimated proved oil and natural gas reserves were approximately 94,336 MBOE based on the reserve report prepared by Cawley, Gillespie & Associates, Inc. (“CG&A”), our independent petroleum engineers. Based on this report, at December 31, 2019, our proved reserve quantities were approximately 56% oil, 19% natural gas, 25% NGLs with 33% of those reserves classified as proved developed. The calculated percentages include proved developed non-producing reserves. Of these interests, approximately 51,426 MBOE are attributable to noncontrolling interests. See Note 9.Noncontrolling Interest in the Notes to Consolidated Financial Statements.wells.
Our Business Strategy
We believe that the recent trend of consolidation in the industry environment will continue and will result in further consolidation opportunities. We continue to pursue value-accretive and scale-enhancing consolidation opportunities, as we believe we are in a position to operate effectively despite volatility in commodity prices. We are focusing our attention on acquisition and corporate merger opportunities that would increase the scale of our operations in a financially accretive manner, without materially altering our debt metrics in relation to our cash flows and capital structure. In addition, we believe that our recent track record of successful consolidation will create further consolidation opportunities for us based on our increased scale, financial strength and success at acquiring and integrating assets in a financially prudent manner. At the same time, we will seek to block up acreage in the Midland Basin and Delaware Basin that would allow for longer horizontal laterals and should therefore provide for higher economic returns. In summary, we believe we are well qualified to be a consolidator which would increase the scale of our operations and add value to our shareholders.
Our current business strategy is to focus on the economic development of our existing acreage, increase our acreage and horizontal well locations in the Midland Basinand Delaware Basins and increase stockholder value through the following:
•developing our acreage and profitably growing our production while seeking to achieve Free Cash Flow (defined in “Non-GAAP Measures” below);maximize operating cash flows;
•operating our properties efficiently and continuing to improve our operating margins;
•deploying capital efficiently by drilling multi-well pads, reducing drilling times and increasing completions per day;
•leveraging both our increased operational and financial scale to achieve economies related to such scale where available;
•operating our assets in a safe and environmentally sensitive manner;
•continuing to hedge commodity prices as opportunities arise;
•pursuing value-accretive acquisition and corporate merger opportunities, which could increase the scale and profitability of our operations;
•maximizing operating margins and corporate level cash flows by minimizing operating and overhead costs;
•expanding our acreage positions and drilling inventory in our primary areas of interest through acquisitions and farm-in opportunities, with an emphasis on operated positions;
•blocking up acreage to allow for longer horizontal lateral drilling locations which provide higher economic returns; and
•maintaining a strong balance sheet and financial flexibility.
Our Strengths
We believe that the following strengths are beneficial in achieving our business goals:
•history of successful asset acquisitions and merger transactions;
•extensive horizontal development potential in onetwo of the most oil rich basins of the United States;
•experienced management team with substantial technical and operational expertise;
•ability to attract technical personnel with experience in our core area of operations;
history of successful acquisition and merger transactions;
•operating control over the majority of our production and development activities;
•financial discipline;
•conservative balance sheet; and
•commitment to cost efficient operations.operations;
2019 Highlights•a management team that is well known and respected throughout the industry; and
In addition•ability to efficiently integrate acquisitions, allowing us to improve operating margins, as well as reducing lead time on additional acquisition opportunities.
COVID-19
Despite the recoveries in commodity prices, recent surges from COVID-19 variants continue to impact the global economy, disrupt global supply chains and may create significant volatility and disruption of financial and commodity markets. The extent of the impact of the COVID-19 pandemic on our drilling program described above, the following are additional highlights ofoperational and financial performance, including our 2019 activities comparedability to activity in 2018:
Full year 2019 average daily sales volumes of 13,429 Boepd exceededexecute our production goalsbusiness strategies and increased 35%
Increased drilling efficiencies by drilling multi-well pads and longer lateral length wells averaging 10,700 feetinitiatives in the Midland Basin
Improved frac efficiency from 8 to 12 stages per day
Reduced total drillingexpected time frame, is uncertain and completion costs by approximately 16%
Increased Proved Developed reserves by 33%
Increased Adjusted EBITDAX by 51% (reconciled in “Non-GAAP Measures” below)
Improved our operating margins by 10%
Realized $15.9 million from our hedge positions thereby mitigating commodity price volatility
Strong balance sheetdepends on various factors, including how the pandemic and liquidity position with $155 million of undrawn capacity on a $325 million senior secured revolving credit facility and a cash balance of $13.8 million as of December 31, 2019
Recent Developments
Sharp Decline in Oil Prices
Subsequent to December 31, 2019, oil prices have declined sharplymeasures taken in response to drastic price cuttingits impact on demand for oil and increased production by Saudi Arabia coupled with reduced demand caused bynatural gas, the global coronavirus outbreak. Prioravailability of personnel, equipment and services critical to our ability to operate our properties and the impact of potential governmental restrictions on travel, transports and operations. There is uncertainty around the extent and duration of disruption, including any resurgence, and we expect that the longer the duration of any such disruption, the greater the adverse impact may be on our business.
Operational Status
As a producer of oil, natural gas and NGLs, we are recognized as an essential business under various federal, state and local regulations related to the recent declineCOVID-19 pandemic. We have continued to operate as permitted under these regulations while taking mitigation efforts and steps to protect the health and safety of our employees. The safety of our employees is paramount, and we have emphasized the respective guidelines to support our mitigation efforts. Our field personnel are performing their job
responsibilities and practicing mitigation guidelines with no issues to date. While our non-field personnel returned to the office in mid-2020 and were fully in the office during 2021 with minimal disruptions, we remain flexible to working remotely, using information technology in which we previously invested if needed. We have managed and conducted both field and non-field functions effectively thus far, including our day-to-day operations, our accounting and financial reporting systems and our internal control over financial reporting. We will continue to focus on the health and safety of our employees in conformity with the applicable jurisdictional mitigation guidelines. We will continue to monitor CDC guidelines and respond appropriately.
Operational/Financial Challenges
It is difficult to model and predict how our operations and financial status may change as a result of COVID-19. In our industry, any forecast, plans and changes to operations and financial status are a function of commodity prices. If oil prices decline due to a resurgence of COVID-19, we announcedbelieve we can continue to operate and produce our 2020 capital budget of $160-170 million which assumedproperties at a one-rig operated programminimum in a cash flow neutral position for the next 12 months. A significant driver in the Midland Basinfuture may be the financial institutions’ view on commodity prices with respect to borrowing base redeterminations. If a resurgence of COVID-19 triggers additional volatility in our business or global economies, our borrowing base could be reduced. Significant reductions in the borrowing base under our Credit Agreement could create a borrowing base deficiency depending on our loans then outstanding which may lead to a default. We believe global as well as non-operated activitynational mitigation efforts currently in progress, which was expectedbeing implemented to result in bringing 19 gross / 16.2 net operated wellsfight COVID-19 have had, and 3.1 net non-operated wells online in 2020. Duemay continue to the recent oil price volatility, we are currently evaluating our 2020 capital program.
New Credit Agreement
On November 21, 2019, we entered intohave, a new credit agreement with respectmaterial impact on commodity prices and may continue to present significant challenges to our senior secured revolvingindustry.
The effects of COVID-19, including a substantial decrease in economic activity, have contributed to significant credit, facility (the “Credit Agreement”). The Credit Agreement has a maturity datedebt and equity market volatility. Similar to other producers in our business, we experienced volatility in the price of November 21, 2024 with a maximum credit amount of $1.5
billion and an initial borrowing base of $325 million. The Credit Agreement replaced the prior credit agreement, which was terminated on November 21, 2019.
Officer Appointments
On January 30, 2020, we announced that our current Chairman and Chief Executive Officer, Mr. Frank A. Lodzinski, will be appointed Executive Chairman and our current President, Mr. Robert J. Anderson, will be appointed Chief Executive Officer and President, effective on April 1, 2020.Class A Common Stock.
Organizational Structure
Earthstone is the sole managing member of EEH, with a controlling interest in EEH. Earthstone, together with its wholly-owned subsidiary, Lynden Energy Corp., a corporation organized under the laws of British Columbia (“Lynden Corp”), and Lynden Corp’s wholly-owned consolidated subsidiary, Lynden USA, Inc. (“Lynden US”) and also a member of EEH, consolidates the financial results of EEH and records a noncontrolling interest in the Consolidated Financial Statements representing the economic interests of EEH’s members other than Earthstone and Lynden US.
Our Operations
We are currently the operator of properties containing approximately 92% of our proved oil and natural gas reserves and 89% of our proved PV-10 as of December 31, 2019 (see reconciliation of PV-10 to the standardized measure of discounted future net cash flows in Item 2. Properties). As operator, we manage and are able to directly influence development and production of our operated properties. Independent contractors engaged by us provide all the equipment and personnel associated with drilling and completion activities. We employ petroleum engineers, geologists and land professionals who work on improving operating cost, production rates and reserves. Our producing properties have reasonably predictable production profiles and cash flows, subject to commodity price and cost fluctuations. Our status as an operator has allowed us to pursue the development of undeveloped acreage, further develop existing properties and generate new projects.
As is common in our industry, we selectively participate in drilling and developmental activities in non-operated properties. Decisions to participate in non-operated properties are dependent upon the technical and economic nature of the projects and the operating expertise and financial standing of the operators.
Operational Risks
Oil and natural gas exploitation, development and production involve a high degree of risk, which even a combination of experience, knowledge and careful evaluation may not be able to overcome. There is no assurance that we will acquire, discover or produce additional oil and natural gas in commercial quantities. Oil and natural gas operations also involve the risk that well fires, blowouts, equipment failure, human error and other events may cause accidental leakage or spills of toxic or hazardous materials, such as petroleum liquids or drilling fluids into the environment or cause significant injury to persons or property. In such event, substantial liabilities to third parties or governmental entities may be incurred, the satisfaction of which could substantially reduce our available cash and possibly result in loss of oil and natural gas properties. Such hazards may also cause damage to or destruction of wells, producing formations, production facilities and pipeline or other processing facilities.
As is common in the oil and natural gas industry, we do not insure fully against all risks associated with our business either because such insurance is not available or because we believe the premium costs are prohibitive. A loss not fully covered by insurance could have a material effect on our operating results, financial position and cash flows. For further discussion of these risks see Item 1A. Risk Factors of this report.
Marketing and Customers
We market the majority of the production from properties we operate for both our account and the account of the other working interest owners in these properties. We sell our production to purchasers at market prices.
We normally sell production to a relatively small number of customers, as is customary in the exploration, development and production business. For the year ended December 31, 20192021, two purchasers accounted for 34% and 13%, respectively, of our revenue during the period. For the year ended December 31, 2020, three purchasers accounted for 30%32%, 14%15% and 12%, respectively, of our revenue during the period. For the year ended December 31, 2018,2019, three purchasers accounted for 27%30%, 11%14% and 10%12%, respectively, of our revenue during the period. No other customer accounted for more than 10% of our revenue during these periods. If a major customer stopped purchasing oil and natural gas from us, revenue could decline and our operating results and financial condition could be harmed. However, we believe that the loss of any one or all of our major purchasers would not have a materially adverse effect on our financial condition or results of operations, as crude oil and natural gas are fungible products in our area of operations with well-established markets and numerous purchasers.
Transportation
During the planning stage of our prospective and productive units and acreage, we consider required flow-lines, gathering and delivery infrastructure. Our oil is transported from the wellhead to our tank batteries or delivery points through our flow-lines or gathering systems. Purchasers of our oil take delivery at (i) our tank batteries and transport the oil by truck, or (ii) at a pipeline delivery point.point or (ii) at our tank batteries for transport by truck. Our natural gas is transported from the wellhead to the purchaser’s meter and pipeline interconnection point through our gathering systems. We have implemented a Leak Detection and Repair program, or LDAR, to locate and repair leaking components including valves, pumps and connectors in order to minimize the emission of fugitive volatile organic compounds and hazardous air pollutants. In addition, we have started installinginstall vapor recovery units in our newernewly installed tank batteries.
In October 2019, we entered into a buy/sell arrangement for a certain portion of our oil production that effects a change in location with required repurchase of oil at a delivery point. This activity is recorded on a net basis and the residual transportation fee is included in Lease operating expenses in the Consolidated Statements of Operations. Arrangements such as this not only reduce our transportation costs by eliminating truck transportation butbatteries which also provide additional flexibility in delivery points for our product. The decrease in transportation by truck also translates into reduced truckreduces emissions.
Our produced salt water is generally moved by pipeline connected to our operated salt water disposal wells or by pipeline to commercial disposal facilities.
Commodity Hedging
Consistent with our disciplined approach to financial management, we have an active commodity hedging program through which we seek to hedge a meaningful portion of our expected oil and gas production, reducing our exposure to downside commodity prices and enabling us to protect cash flows and maintain liquidity to fund our capital program.
Competition
The domestic oil and natural gas industry is intensely competitive in the acquisition of acreage, production and oil and gas reserves and in producing, transporting and marketing activities. Our competitors include national oil companies, major oil and natural gas companies, independent oil and natural gas companies, drilling partnership programs, individual producers, natural gas marketers, and major pipeline companies, as well as participants in other industries supplying energy and fuel to consumers. Many of our competitors are large, well-established companies. They may be able to pay more for seismic information and lease rights on prospective oil and natural gas properties and to define, evaluate, bid for and purchase a greater number of properties, than our financial or human resources permit. Our ability to acquire additional properties in the future, and our ability to fund the acquisition of such properties, will be dependent upon our ability to evaluate and select suitable properties and to consummate related transactions in a highly competitive environment.
There is also competition between oil and natural gas producers and other industries producing energy and fuel. Furthermore, competitive conditions may be substantially affected by various forms of energy legislation and/or regulation considered from time to time by the governments of the United States and the jurisdictions in which we operate. It is not possible to predict the nature of any such legislation or regulation which may ultimately be adopted or its effects upon our future operations. Such laws and regulations may substantially increase the costs of exploring for, developing or producing oil and natural gas and may prevent or delay the commencement or continuation of a given operation. Our larger competitors may be able to absorb the burden of existing and any changes to, federal, state and local laws and regulations more easily than we can, which would adversely affect our competitive position.
Segment Information and Geographic Area
Operating segments are defined under accounting principles generally accepted in the United States (“GAAP”) as components of an enterprise that (i) engage in activities from which it may earn revenues and incur expenses (ii) for which separate operational financial information is available and is regularly evaluated by the chief operating decision maker for the purpose of allocating resources and assessing performance.
Based on our organization and management, we have only one reportable operating segment, which is oil and natural gas acquisition, exploration, development and production. All of our operations are currently conducted in Texas.Texas and New Mexico.
Seasonality of Business
Weather conditions often affect the demand for, and prices of, natural gas and can also delay oil and natural gas drilling, completion and production activities, disrupting our overall business plans. Demand for natural gas is typically higher during the winter, resulting in higher natural gas prices for our natural gas production during our first and fourth fiscal quarters. Due to these seasonal fluctuations, our results of operations for individual quarterly periods may not be indicative of the results that we may realize on an annual basis.
Markets for Sale of Production
Our ability to market oil and natural gas found and produced, depends on numerous factors beyond our control, the effect of which cannot be accurately predicted or anticipated. Some of these factors include, without limitation, the availability of other
domestic and foreign production, the marketing of competitive fuels, the proximity and capacity of pipelines, fluctuations in supply and demand, the availability of a ready market, the effect of United States federal and state regulation of production, refining, transportation and sales and general national and worldwide economic conditions. Additionally, we may experience delays in marketing natural gas production and fluctuations in natural gas prices and we may experience short-term delays in marketing oil due to trucking and refining constraints. There is no assurance that we will be able to market anysignificant amounts of oil or natural gas produced, or, if such oil or natural gas is marketed, that favorable prices can be obtained.
The United States natural gas market has undergone several significant changes over the past few decades. The majority of federal price ceilings were removed in 1985 and the remainder were lifted by the Natural Gas Wellhead Decontrol Act of 1989. Thus, currently, the United States natural gas market is operating in a free market environment in which the price of gas is determined by market forces rather than by regulations. At the same time, the domestic natural gas industry has also seen a dramatic change in the manner in which gas is bought, sold and transported. In most cases, natural gas is no longer sold to a pipeline company. Instead, the pipeline company now primarily serves the role of transporter and gas producers are free to sell their product to marketers, local distribution companies, end users or a combination thereof.
In recent years, oil, natural gas and NGLs prices have been under considerable pressure due to oversupply and other market conditions, including constrained pipeline capacity. Specifically, increased domestic and foreign production and increased efficiencies in horizontal drilling and completion, combined with increased development of shale fields in North America, have dramatically increased global oil and natural gas production, which has led to significantly lower market prices for these commodities. In view of the many uncertainties affecting the supply and demand for oil, natural gas and NGLs, we are unable to accurately predict future oil, natural gas and NGLs prices or the overall effect, if any, that the decline in demand for and the oversupply of such products will have on our financial condition or results of operations.
Title to Properties
We believe that the title to our oil and natural gas properties is good and defensible in accordance with standards generally accepted in the oil and natural gas industry, subject to such exceptions which, in our opinion, are not so material as to detract substantially from the use or value of our oil and natural gas properties. Our oil and natural gas properties are typically subject, in one degree or another, to one or more of the following:
•royalties and other burdens and obligations, express or implied, under oil and natural gas leases;
•overriding royalties and other burdens created by us or our predecessors in title;
•a variety of contractual obligations (including, in some cases, development obligations) arising under operating agreements, farmout agreements, participation agreements, production sales contracts and other agreements that may affect the properties or their titles;
•back-ins and reversionary interests existing under various agreements and leasehold assignments;
•liens that arise in the normal course of operations, such as those for unpaid taxes, statutory liens securing obligations to unpaid suppliers and contractors and contractual liens under operating agreements;
•pooling, unitization and other agreements, declarations and orders; and
•easements, restrictions, rights-of-way and other matters that commonly affect property.
To the extent that such burdens and obligations affect our rights to production revenues, they have been taken into account in calculating our net revenue interests and in estimating the quantity and value of our reserves. We believe that the burdens and obligations affecting our oil and natural gas properties are common in our industry with respect to the types of properties we own.
Operational Regulations
All of the jurisdictions in which we own or operate producing oil and natural gas properties have statutory and regulatory provisions affecting drilling, completion, and production activities, including, but not limited to, provisions related to permits for the drilling of wells, bonding requirements to drill or operate wells, the location of wells, the method of drilling and casing wells, the surface use and restoration of properties upon which wells are drilled, sourcing and disposal of water used in the drilling and completion process, and the plugging and abandonment of wells. Moreover, the current administration has indicated that it expects to impose additional federal regulations limiting access to and production from federal lands. The effect of these regulations is to limit the amount of oil and natural gas that we can produce from our wells and to limit the number of wells or the locations at which we can drill. Our operations are also subject to various conservation laws and regulations. These laws and regulations govern the size of drilling and spacing units, the density of wells that may be drilled in oil and natural gas properties and the unitization or pooling of oil and natural gas properties. In this regard, while some states, including New Mexico, allow the forced pooling or integration of land and leases to facilitate development, other states including Texas, where we operate, rely primarily
or exclusively on voluntary pooling of land and leases. Accordingly, it may be difficult for us to form spacing units and therefore difficult to develop a project if we own or control less than 100% of the leasehold. In addition, state conservation laws establish maximum rates of production from oil and natural gas wells, generally prohibit the venting or flaring of natural gas, and impose specified requirements regarding the ratability of production. On some occasions, local authorities have imposed moratoria or
other restrictions on exploration, development and production activities pending investigations and studies addressing potential local impacts of these activities before allowing oil and natural gas exploration, development and production to proceed.
The effect of these regulations is to limit the amount of oil and natural gas that we can produce from our wells and to limit the number of wells or the locations at which we can drill, although we can apply for exceptions to such regulations or to have reductions in well spacing. Failure to comply with applicable laws and regulations can result in substantial penalties. The regulatory burden on the industry increases the cost of doing business and negatively affects profitability. Moreover, each state generally imposes a production or severance tax with respect to the production and sale of oil, natural gas and natural gas liquidsNGLs within its jurisdiction.
Regulation of Transportation of Natural Gas
The transportation and sale, or resale, of natural gas in interstate commerce are regulated by the Federal Energy Regulatory Commission (“FERC”) under the Natural Gas Act of 1938 (“NGA”), the Natural Gas Policy Act of 1978 (“NGPA”) and regulations issued under those statutes. FERC regulates interstate natural gas transportation rates and service conditions, which affects the marketing of natural gas that we produce, as well as the revenues we receive for sales of our natural gas.
Intrastate natural gas transportation is also subject to regulation by state regulatory agencies. The basis for intrastate regulation of natural gas transportation and the degree of regulatory oversight and scrutiny given to intrastate natural gas pipeline rates and services varies from state to state. Insofar as such regulation within a particular state will generally affect all intrastate natural gas shippers within the state on a comparable basis, we believe that the regulation of similarly situated intrastate natural gas transportation in any states in which we operate and ship natural gas on an intrastate basis will not affect our operations in any way that is of material difference from those of our competitors. Like the regulation of interstate transportation rates, the regulation of intrastate transportation rates affects the marketing of natural gas that we produce, as well as the revenues we receive for sales of our natural gas.
Regulation of Sales of Oil, Natural Gas and Natural Gas LiquidsNGLs
The prices at which we sell oil, natural gas and natural gas liquidsNGLs are not currently subject to federal regulation and, for the most part, are not subject to state regulation. FERC, however, regulates interstate natural gas transportation rates, and terms and conditions of transportation service, which affects the marketing of the natural gas we produce, as well as the prices we receive for sales of our natural gas. Similarly, the price we receive from the sale of oil and natural gas liquidsNGLs is affected by the cost of transporting those products to market. FERC regulates the transportation of oil and liquids on interstate pipelines under the provision of the Interstate Commerce Act, the Energy Policy Act of 1992 and regulations issued under those statutes. Intrastate transportation of oil, natural gas liquids,NGLs, and other products, is dependent on pipelines whose rates, terms and conditions of service are subject to regulation by state regulatory bodies under state statutes. In addition, while sales by producers of natural gas and all sales of crude oil, condensate, and natural gas liquidsNGLs can currently be made at uncontrolled market prices, Congress could reenact price controls in the future.
Changes in FERC or state policies and regulations or laws may adversely affect the availability and reliability of firm and/or interruptible transportation service on interstate pipelines, and we cannot predict what future action that FERC or state regulatory bodies will take. We do not believe, however, that any regulatory changes will affect us in a way that materially differs from the way they will affect other natural gas producers, gatherers and marketers with which we compete.
Environmental Regulations
Our operations are also subject to stringent federal, state and local laws regulating the discharge of materials into the environment or otherwise relating to health and safety or the protection of the environment. Numerous governmental agencies, such as the United States Environmental Protection Agency (the “EPA”) issue regulations to implement and enforce these laws, which often require difficult and costly compliance measures. Among other things, environmental regulatory programs typically govern the permitting, construction and operation of a well or production related facility. Many factors, including public perception, can materially impact the ability to secure an environmental construction or operation permit. Failure to comply with environmental laws and regulations may result in the assessment of substantial administrative, civil and criminal penalties, as well as the issuance of injunctions limiting or prohibiting our activities. In addition, some laws and regulations relating to protection of the environment may, in certain circumstances, impose strict liability for environmental contamination, which could result in liability for environmental damages and cleanup costs without regard to negligence or fault on our part.
Beyond existing requirements, new programs and changes in existing programs, may affect our business including oil and natural gas exploration and production, air emissions, waste management, and underground injection of waste material. Environmental
laws and regulations have been subject to frequent changes over the years, and the imposition of more stringent requirements could have a material adverse effect on our financial condition and results of operations. The following is a summary of the more significant existing environmental, health and safety laws and regulations to which our business
operations are subject and for which compliance in the future may have a material adverse impact on our capital expenditures, earnings and competitive position.
Hazardous Substances and Wastes
The federal Comprehensive Environmental Response, Compensation, and Liability Act of 1980 (“CERCLA”), also known as the Superfund law, and comparable state laws impose liability, without regard to fault or the legality of the original conduct on certain categories of persons that are considered to be responsible for the release of a hazardous substance into the environment. These persons may include the current or former owner or operator of the site or sites where the release occurred and companies that disposed or arranged for the disposal of hazardous substances found at the site. Under CERCLA, these potentially responsible persons may be subject to strict, joint and several liability for the costs of investigating and cleaning up hazardous substances that have been released into the environment, for damages to natural resources and for the costs of certain health studies. In addition, it is not uncommon for neighboring landowners and other third parties to file claims for personal injury and property damage allegedly caused by hazardous substances or other pollutants released into the environment. We are able to control directly the operation of only those wells with respect to which we act as operator. Notwithstanding our lack of direct control over wells operated by others, the failure of an operator other than us to comply with applicable environmental regulations may, in certain circumstances, be attributed to us. We generate materials in the course of our operations that may be regulated as hazardous substances, but we are not presently aware of any liabilities for which we may be held responsible that would materially or adversely affect us.
The Resource Conservation and Recovery Act of 1976 (“RCRA”), and comparable state statutes, regulate the generation, treatment, storage, transportation, disposal and clean-up of hazardous and solid (non-hazardous) wastes. With the approval of the EPA, the individual states can administer some or all of the provisions of RCRA, and some states have adopted their own, more stringent requirements. Drilling fluids, produced waters and most of the other wastes associated with the exploration, development and production of oil and natural gas are currently regulated under RCRA’s solid (non-hazardous) waste provisions. However, legislation has been proposed from time to time and various environmental groups have filed lawsuits that, if successful, could result in the reclassification of certain oil and natural gas exploration and production wastes as “hazardous wastes,” which would make such wastes subject to much more stringent handling, disposal and clean-up requirements. A loss of the RCRA exclusion for drilling fluids, produced waters and related wastes could result in an increase in our, as well as the oil and natural gas E&P industry’s, costs to manage and dispose of generated wastes, which could have a material adverse effect on the industry as well as on our business.
From time to time, releases of materials or wastes have occurred at locations we own or at which we have operations. These properties and the materials or wastes released thereon may be subject to CERCLA, RCRA and analogous state laws. Under these laws, we have been and may be required to remove or remediate such materials or wastes.
Water Discharges
The federal Clean Water Act and analogous state laws impose restrictions and strict controls with respect to the discharge of pollutants, including spills and leaks of oil and other substances, into waters of the United States. The discharge of pollutants into regulated waters, including jurisdictional wetlands, is prohibited, except in accordance with the terms of a permit issued by the EPA or an analogous state agency. In September 2015, the EPA and U.S. Army Corps of Engineers (the “Corps”) rule defining the scope of federal jurisdiction over Waters of the United States (the “WOTUS rule”) became effective. Following the change in U.S. Presidential Administrations, there have been several attempts to modify or eliminate this rule. For example, on January 23, 2020, the EPA and the Corps finalized the Navigable Waters Protection Rule, which narrows the definition of “waters of the United States” relative to the prior 2015 rulemaking. However, legal challengesIn November 2021, the EPA and the Corps issued a proposed rule to broaden the applicability of the definition of WOTUS. The agencies did not announce a date for official publication in the Federal Register of the new rule are expected, and multiple challengesrule. However, future rulemakings regarding the definition of WOTUS will likely be subject to the EPA’s prior rulemakings remain pending.litigation. As a result of these developments, the scope of federal jurisdiction under the Clean Water Act is uncertain at this time.
The process for obtaining permits has the potential to delay our operations. Spill prevention, control and countermeasure requirements of federal laws require appropriate containment berms and similar structures to help prevent the contamination of navigable waters by a petroleum hydrocarbon tank spill, rupture or leak. In addition, the Clean Water Act and analogous state laws require individual permits or coverage under general permits for discharges of storm water runoff from certain types of facilities. Federal and state regulatory agencies can impose administrative, civil and criminal penalties as well as other enforcement mechanisms for non-compliance with discharge permits or other requirements of the Clean Water Act and analogous state laws and regulations. The Clean Water Act and analogous state laws provide for administrative, civil and criminal penalties for unauthorized discharges and, together with the Oil Pollution Act of 1990 (“OPA”), impose rigorous requirements for spill prevention and response planning, as well as substantial potential liability for the costs of removal, remediation, and damages in connection with any unauthorized discharges.
Our oil and natural gas production also generates salt water, which we dispose of by underground injection. The federal Safe Drinking Water Act (“SDWA”) regulates the underground injection of substances through the Underground Injection Control (“UIC”) program, and related state programs regulate the drilling and operation of salt watersaltwater disposal wells. The EPA directly administers the UIC program in some states, and in others it is delegated to the state for administering. In New Mexico, the New Mexico Oil Conservation Division (“NMOCD”) administers the UIC program for all injection wells that are related to oil and natural gas production. In Texas, the Texas Railroad Commission (“RRC”) regulates the disposal of produced water by injection well. Permits must be obtained before drilling salt watersaltwater disposal wells, and casing integrity monitoring must be conducted periodically to ensure the casing is not leaking salt water to groundwater. Contamination of groundwater by oil and natural gas drilling, production, and related operations may result in fines, penalties, and remediation costs, among other sanctions and liabilities under the SDWA and state laws. In response to recent seismic events near underground injection wells used for the disposal of oil and natural gas-related waste waters, federal and some state agencies have begun investigating whether such wells have caused increased seismic activity, and some states have shut down or placed volumetric injection limits on existing wells or imposed moratoria on the use of such injection wells. In response to concerns related to induced seismicity, regulators in some states have already adopted or are considering additional requirements related to seismic safety. For example, the RRC has adopted rules for injection wells to address these seismic activity concerns in Texas. Among other things, the rules require companies seeking permits for disposal wells to provide seismic activity data in permit applications, provide for more frequent monitoring and reporting for certain wells and allow the RRC to modify, suspend, or terminate permits on grounds that a disposal well is likely to be, or determined to be, causing seismic activity. In 2021, the NMOCD announced a new plan for responding to increased seismic activity in the Permian Basin. Under the new plan, pending permits for wastewater injection in certain areas will be subject to additional reporting and monitoring requirements. More stringent regulation of injection wells could lead to reduced construction or the capacity of such wells, which could in turn impact the availability of injection wells for disposal of wastewater from our operations. Increased costs associated with the transportation and disposal of produced water, including the cost of complying with regulations concerning produced water disposal, may reduce our profitability. The costs associated with the disposal of proposed water are commonly incurred by all oil and natural gas producers, however, and we do not believe that these costs will have a material adverse effect on our operations. In addition, third partythird-party claims may be filed by landowners and other parties claiming damages for alternative water supplies, property damages, and bodily injury.
Hydraulic Fracturing
Our completion operations are subject to regulation, which may increase in the short- or long-term. In particular, the well completion technique known as hydraulic fracturing which is used to stimulate production of oil and natural gas has come under increased scrutiny by the environmental community, and many local, state and federal regulators. Hydraulic fracturing involves the injection of water, sand and additives under pressure, usually down casing that is cemented in the wellbore, into prospective rock formations at depthsin order to stimulate oil and natural gas production. We engage third parties to provide hydraulic fracturing or other well stimulation services to us in connection with substantially all of the wells for which we are the operator.
The SDWA regulates the underground injection of substances through the UIC program. Hydraulic fracturing is generally exempt from regulation under the UIC program, and the hydraulic fracturing process is typically regulated by state oil and gas commissions. However, legislation has been proposed in recent sessions of Congress to amend the SDWA to repeal the exemption for hydraulic fracturing from the definition of “underground injection,” to require federal permitting and regulatory control of hydraulic fracturing, and to require disclosure of the chemical constituents of the fluids used in the fracturing process.
Furthermore, several federal agencies have asserted regulatory authority over certain aspects of the fracturing process. For example, the EPA has taken the position that hydraulic fracturing with fluids containing diesel fuel is subject to regulation under the UIC program, specifically as “Class II” UIC wells.
In addition, on June 28, 2016, the EPA published a final rule prohibiting the discharge of wastewater from onshore unconventional oil and natural gas extraction facilities to publicly owned wastewater treatment plants. The EPA is also conducting a study of private wastewater treatment facilities (also known as centralized waste treatment (“CWT”) facilities) accepting oil and natural gas extraction wastewater. The EPA is collecting data and information related to the extent to which CWT facilities accept such wastewater, available treatment technologies (and their associated costs), discharge characteristics, financial characteristics of CWT facilities, and the environmental impacts of discharges from CWT facilities.
Furthermore, there are certain governmental reviews either underway or being proposed that focus on environmental aspects of hydraulic fracturing practices. On December 13, 2016, the EPA released a study examining the potential for hydraulic fracturing activities to impact drinking water resources, finding that, under some circumstances, the use of water in hydraulic fracturing activities can impact drinking water resources. Also, on February 6, 2015, the EPA released a report with findings and recommendations related to public concern about induced seismic activity from disposal wells. The report recommends strategies for managing and minimizing the potential for significant injection-induced seismic events. Other governmental agencies, including the U.S. Department of Energy, the U.S. Geological Survey, and the U.S. Government Accountability
Office, have evaluated or are evaluating various other aspects of hydraulic fracturing. These ongoing or proposed studies could spur initiatives to further regulate hydraulic fracturing and could ultimately make it more difficult or costly for us to perform fracturing and increase our costs of compliance and doing business.
Several states, including Texas, have adopted or are considering adopting regulations that could restrict or prohibit hydraulic fracturing in certain circumstances, impose more stringent operating standards and/or require the disclosure of the composition of hydraulic fracturing fluids. For example, Texas law requires that the well operator disclose the list of chemical ingredients subject to the requirements of the federal Occupational Safety and Health Act (“OSHA”) for disclosure on a website and also file the list of chemicals with the RRC with the well completion report. The total volume of water used to hydraulically fracture a well must also be disclosed to the public and filed with the RRC. Additionally, New Mexico has adopted regulations that require the disclosure of information regarding the substances used in the hydraulic fracturing process. If new or more stringent state or local legal restrictions relating to the hydraulic fracturing process are adopted in areas where we operate, we could incur potentially significant added costs to comply with such requirements, experience delays or curtailment in the pursuit of exploration, development or production activities, and perhaps even be precluded from drilling wells.
There has been increasing public controversy regarding hydraulic fracturing with regard to the use of fracturing fluids, induced seismic activity, impacts on drinking water supplies, use of water and the potential for impacts to surface water, groundwater and the environment generally. A number ofSeveral lawsuits and enforcement actions have been initiated across the country implicating hydraulic fracturing practices. If new laws or regulations that significantly restrict hydraulic fracturing are adopted, such laws could make it more difficult or costly for us to perform fracturing to stimulate production from tight formations as well as make it easier for third parties opposing the hydraulic fracturing process to initiate legal proceedings based on allegations that specific chemicals used in the fracturing process could adversely affect groundwater. In addition, if hydraulic fracturing is further regulated at the federal, state or local level, our fracturing activities could become subject to additional permitting and financial assurance requirements, more stringent construction specifications, increased monitoring, reporting and recordkeeping obligations, plugging and abandonment requirements and also to attendant permitting delays and potential increases in costs. Such legislative changes could cause us to incur substantial compliance costs, and compliance or the consequences of any failure to comply by us could have a material adverse effect on our financial condition and results of operations. At this time, it is not possible to estimate the impact on our business of newly enacted or potential federal, state or local laws governing hydraulic fracturing.
From time to time, legislation has been introduced, but not enacted, in the U.S. Congress to provide for federal regulation of hydraulic fracturing and to require disclosure of the chemicals used in the hydraulic fracturing process. In addition, certain candidates running for the office of President of the United States in 2020 have pledged to ban hydraulic fracturing and, onOn January 28, 2020, one of those candidates introduced Senate Bill 3247 that,was introduced and if enacted as proposed, would ban hydraulic fracturing nationwide by 2025.
Air Emissions
The federal Clean Air Act (“CAA”) and comparable state laws restrict emissions of various air pollutants through permitting programs and the imposition of other requirements. In addition, the EPA has developed and continues to develop stringent regulations governing emissions of toxic air pollutants at specified sources, including oil and natural gas production. Federal and state regulatory agencies can impose administrative, civil and criminal penalties for non-compliance with air permits or other requirements of the CAA and associated state laws and regulations. Our operations, or the operations of service companies engaged by us, may in certain circumstances and locations be subject to permits and restrictions under these statutes for emissions of air pollutants.
In 2012 and 2016, the EPA issued New Source Performance Standards to regulate emissions of sources of volatile organic compounds (“VOCs”), sulfur dioxide, air toxics and methane from various oil and natural gas exploration, production, processing and transportation facilities. In particular, onOn May 12, 2016, the EPA amended its regulations to impose new standards for methane and volatile organic compounds emissions for certain new, modified, and reconstructed equipment, processes, and activities across the oil and natural gas sector. However, in a March 28, 2017 executive order, Presidentthe Trump Administration directed the EPA to review the 2016 regulations and, if appropriate, to initiate a rule making to rescind or revise them consistent with the stated policy of promoting clean and safe development of the nation’s energy resources, while at the same time avoiding regulatory burdens that unnecessarily encumber energy production. Following the change in U.S. Presidential Administrations, there have been attempts to modify these regulations. Most recently, in August 2019,In September 2020, the EPA proposedfinalized amendments to the 2016 standards that among other things, would remove sources inremoved the transmission and storage segment from the oil and natural gas source category and rescindrescinded the methane-specific requirements applicable to sources in thefor production and processing segmentsfacilities. However, President Biden signed an executive order on his first day in office calling for the suspension, revision, or rescission of the industry. As an alternative,September 2020 rule and the reinstatement or issuance of methane emission standards for new, modified, and existing oil and gas facilities. Given the long-term trend toward increasing regulation, future federal Greenhouse Gas (“GHG”) regulations of the oil and gas industry remain a possibility, and several states have separately imposed their own regulations on methane emissions from oil and gas production activities. In November 2021, the EPA also proposed new source performance standards and emissions guidelines to rescind the methane-specific requirements that apply to allreduce methane and other pollution from new and existing sources in the oil and gas industry. The proposed rule would include, among other things, a comprehensive monitoring program for new and existing well sites, zero-emissions standards for new and
existing pneumatic controls, and standards to eliminate venting of associated gas and requirements for the capture and sale of natural gas industry, without removing the transmissionwhere a sales line is available. If adopted, these requirements could increase our costs to operate and storage sources from the current source category. Under either alternative, the EPA plans to retain emissions limits for VOCs for covered oil and natural gas facilities and equipment. Legal challenges to any final rulemaking that rescinds the 2016 standards are expected.control pollution. These standards, as well as any future laws and their implementing regulations, may require us to obtain pre-approval for the expansion or modification of existing facilities or the construction of new facilities expected to produce air emissions, impose stringent air permit requirements, or mandate the use of specific equipment or technologies to control emissions. WeUntil these rules are formally adopted, we cannot predict the final regulatory requirements or the cost to comply with such requirements with any certainty.
In October 2015, the EPA announced that it was lowering the primary national ambient air quality standardsNational Ambient Air Quality Standards (“NAAQS”) for ozone from 75 parts per billion to 70 parts per billion. Since that time, the EPA has issued area designations with respect to ground-level ozone. In December 2020, the EPA announced its intention to leave the ozone NAAQS unchanged at 70 parts per billion rather than lower them further. However, as discussed above, that action could be subject to reversal following the Biden Administration’s January 2021 executive order. In 2022, the New Mexico Environment Department is expected to issue final rules imposing more stringent limits on ozone pollution from the oil and gas industry operating in the state. Reclassification of areas of state implementation of the revised NAAQS could result in stricter permitting requirements, delay, or prohibit our ability to obtain such permits, and result in increased expenditures for pollution control equipment, the costs of which could be significant.
Moreover, the NMOCD recently adopted new rules, which require oil and gas operators to capture 98 percent of their natural gas waste by the end of 2026. The new rules went into effect on May 25, 2021. While the State of Texas has not formally conducted a recent rulemaking related to air emissions, scrutiny of oil and natural gas operations and the rules affecting them have increased in recent years. For example, the EPA and environmental non-governmental organizations have conducted flyovers with optical gas imaging cameras to survey emissions from oil and natural gas production facilities and transmission infrastructure. In addition, the RRC has increased oversight related to flaring, with reporting reviews and site inspections. While none of these activities increases our compliance obligations, they signal the potential for increased enforcement and possible rulemaking in the future.
Climate Change
In response to findings that emissions of carbon dioxide, methane and other greenhouse gases (“GHGs”)GHGs endanger public health and the environment, the EPA has adopted regulations under existing provisions of the CAA that, among other things, establish construction and operating permit reviews for GHG emissions certain large stationary sources, require the monitoring and annual reporting of GHG emissions from certain petroleum and natural gas system sources in the United States, implement New Source Performance Standards directing the reduction of methane from certain new, modified, or reconstructed facilities in the oil and natural gas sector, and together with the Department of Transportation (the “DOT”), implement GHG emissions limits on vehicles manufactured for operation in the United States. Additionally, various states and groups of states have adopted or are considering adopting legislation, regulations or other regulatory initiatives that are focused on such areas as GHG cap and trade programs, carbon taxes, reporting and tracking programs, and restriction of emissions. At the international level, there is an agreement, the United Nations-sponsored “Paris Agreement,” for nations to limit their GHG emissions through non-binding, individually-determined reduction goals every five years after 2020, although2020. President Biden pledged the United States has announced its withdrawal from such agreement, effective November 4, 2020.
Governmental, scientific, and public concern over the threat of climate change arising from GHG emissions has resulted in increasing political risks in the United States, including climate change related pledges made by certain candidates seeking the office of the Presidentrenewed participation of the United States on his first day in 2020. Two critical declarations madeoffice. In November 2021, the United States participated in the United Nations Climate Change Conference in Glasgow, Scotland, United Kingdom (“COP26”). COP26 resulted in a pact among approximately 200 countries, including the United States, called the Glasgow Climate Pact. Relatedly, the United States and European Union jointly announced the launch of the “Global Methane Pledge,” which aims to cut global methane pollution at least 30% by one2030 relative to 2020 levels, including “all feasible reductions” in the energy sector. In conjunction with COP26, the United States committed to an economy-wide target of reducing net greenhouse gas emissions by 50-52 percent below 2005 levels by 2030. Also in November 2021, President Biden signed a $1 trillion dollar infrastructure bill into law. The new infrastructure law includes several climate-focused investments, including upgrades to power grids to accommodate increased use of renewable energy and expansion of electric vehicle infrastructure. Although it is not possible at this time to predict what additional domestic legislation may be adopted in light of the Paris Agreement or more candidates runningthe Glasgow Climate Pact, or how legislation or new regulations that may be adopted based on the Paris Agreement or the Glasgow Climate Pact to address GHG emissions would impact our business, any such future laws and regulations imposing reporting obligations on, or limiting emissions of GHGs from, our equipment and operations could require us to incur costs to reduce emissions of GHGs associated with our operations and could decrease demand for the Democratic nomination for President include threats to take actions banning hydraulic fracturing of oil and natural gas wellsgas.
Additionally, various states and banning new leases for productiongroups of mineralsstates have adopted or are considering adopting legislation, regulations or other regulatory initiatives that are focused on federal properties, including onshore landssuch areas as GHG cap and offshore waters. Other actions that could be pursued by presidential candidates may includetrade programs, carbon taxes, reporting and tracking programs, and restriction of emissions. For example, the impositionNew Mexico Environment Department has adopted regulations to restrict the venting or flaring of more restrictive requirements for the establishment of pipeline infrastructure or the permitting of liquefied natural gas (“LNG”) export facilities, as well as the reversal of the United States’ withdrawalmethane from the Paris Agreement in November 2020. both upstream and midstream operations.
Litigation risks are also increasing, as a number of cities and other local governments have sought to bring suit against the largest oil and natural gas exploration and production companies in state or federal court, alleging, among other things, that such companies created public nuisances by producing fuels that contributed to global warming effects, such as rising sea levels, and therefore are responsible for roadway and infrastructure damages, or alleging that the companies have been aware of the adverse effects of climate change for some time but defrauded their investors by failing to adequately disclose those impacts.
There are also increasing financial risks for fossil fuel producers as shareholders currently invested in fossil-fuel energy companies concerned about the potential effects of climate change may elect in the future to shift some or all of their investments into non-energy related sectors. Institutional lenders who provide financing to fossil-fuel energy companies also have become more attentive to sustainable lending practices and some of them may elect not to provide funding for fossil fuel energy companies. Additionally, the lending practices of institutional lenders have been the subject of intensive lobbying efforts in recent years, oftentimes public in nature, by environmental activists, proponents of the international Paris Agreement, and foreign citizenry concerned about climate change not to provide funding for fossil fuel producers. Limitation of investments in and financings for fossil fuel energy companies could result in the restriction, delay or cancellation of drilling programs or development or production activities.
The adoption and implementation of new or more stringent international, federal or state legislation, regulations or other regulatory initiatives that impose more stringent standards for GHG emissions from the oil and natural gas sector or otherwise restrict the areas in which this sector may produce oil and natural gas or generate GHG emissions could result in increased costs of compliance or costs of consuming, and thereby reduce demand for, oil and natural gas. Additionally, political, litigation and financial risks may result in us restricting or cancelling production activities, incurring liability for infrastructure damages as a result of climatic changes, or having an impaired ability to continue to operate in an economic manner. One or more of these developments could have a material adverse effect on our business, financial condition and results of operation. We also are aware that the SEC intends to propose new and additional rules regarding company disclosure of climate change risk. We will monitor and comply with any such promulgated rules.
Threatened and endangered species, migratory birds and natural resources
Various federal and state statutes prohibit certain actions that adversely affect endangered or threatened species and their habitat, migratory birds, wetlands, and natural resources. These statutes include the Endangered Species Act (“ESA”), the Migratory Bird Treaty Act (“MBTA”) and the Clean Water Act. The U.S. Fish and Wildlife Service (“FWS”) may designate critical habitat areas that it believes are necessary for survival of threatened or endangered species. As a result of a 2011 settlement agreement, the FWS was required to determine whether to identify more than 250 species as endangered or threatened under the FSAESA by no later than completion of the agency’s 2017 fiscal year. The FWS missed the deadline but reportedly continues to review new species for protected status under the ESA pursuant to the settlement agreement. A critical habitat designation could result in further
material restrictions on federal land use or on private land use and could delay or prohibit land access or development. Where takings of or harm to species or damages to wetlands, habitat, or natural resources occur or may occur, government entities or at times private parties may act to prevent or restrict oil and natural gas exploration activities or seek damages for any injury, whether resulting from drilling or construction or releases of oil, wastes, hazardous substances or other regulated materials, and in some cases, criminal penalties may result. Similar protections are offered to migratory birds under the MBTA. Recently, there have been renewed calls to review protections currently in place for the dunes sagebrush lizard, whose habitat includes portions of the Permian Basin, and to reconsider listing the species under the ESA. While some of our operations may be located in areas that are designated as habitats for endangered or threatened species or that may attract migratory birds, we believe that we are in substantial compliance with the ESA and the MBTA, and we are not aware of any proposed ESA listings that will materially affect our operations. Nevertheless, we are monitoring proposed listings by the FWS, such as the January 2022 proposal to list the Sacramento Mountains checkerspot butterfly in New Mexico, to ensure continued compliance. The federal government in the past has issued indictments under the MBTA to several oil and natural gas companies after dead migratory birds were found near reserve pits associated with drilling activities. However, inIn January 2020, thea new U.S. Department of the Interior proposed new regulations(“DOI”) rule went into effect clarifying that only the intentional taking of protected migratory birds is subject to prosecution under the MTBA. In December 2021, however, that rule was revoked, and a new rule took effect reinstating the prohibition on incidental takes under the MTBA. The identification or designation of previously unprotected species as threatened or endangered in areas where underlying property operations are conducted could cause us to incur increased costs arising from species protection measures or could result in limitations on our development activities that could have an adverse impact on our ability to develop and produce our oil and natural gas reserves. If we were to have a portion of our leases designated as critical or suitable habitat, it could adversely impact the value of our leases.
Hazard communications and community right to know
We are subject to federal and state hazard communication and community right to know statutes and regulations. These regulations, including, but not limited to, the federal Emergency Planning & Community Right-to-Know Act, govern record keeping and reporting of the use and release of hazardous substances and may require that information be provided to state and local government authorities, as well as the public.
Occupational Safety and Health Act
We are subject to a number of federal and state laws and regulations, including OSHA, and comparable state statutes that regulate the protection of the health and safety of workers. In 2016, there were substantial revisions to the regulations under OSHA that may have an impact to our operations. These changes include among other items; record keeping and reporting, revised crystalline silica standard (which requires the oil and gas industry to implement engineering controls and work practices to limit exposures below the new limits by June 23, 2021), naming oil and gas as a high hazard industry and requirements for a safety and health management system. In addition, OSHA hazard communication standard requires that information be maintained about hazardous materials used or produced in operations and that this information be provided to employees, state and local government authorities and citizens.
State Regulation
Texas regulatesand New Mexico regulate the drilling for, and the production, gathering and sale of, oil and natural gas, including imposing severance taxes and requirements for obtaining drilling permits. Texas and New Mexico currently imposesimpose a 4.6% severance tax on oil production of 4.6% and 3.75%, respectively, and a 7.5% severance tax on natural gas production.and NGL production of 7.5% and 3.75%, respectively. States also regulate the method of developing new fields, the spacing and operation of wells and the prevention of waste of oil and natural gas resources. States may regulate rates of production and may establish maximum daily production allowablesallowable from oil and natural gas wells based on market demand or resource conservation, or both. States do not regulate wellhead prices or engage in other similar direct economic regulation, but we cannot assure our stockholders that they will not do so in the future. The effect of these regulations may be to limit the amount of oil and natural gas that may be produced from our wells and to limit the number of wells or locations we can drill.
The petroleum industry is also subject to compliance with various other federal, state and local regulations and laws. Some of those laws relate to resource conservation and equal employment opportunity. We do not believe that compliance with these laws will have a material adverse effect on us.
Related Insurance
We maintain insurance against some risks associated with above or underground contamination that may occur as a result of our exploration, development and production activities. However, this insurance is limited to activities at the well site, and there can be no assurance that this insurance will continue to be commercially available or that this insurance will be available at premium levels that justify its purchase by us. The occurrence of a significant event that is not fully insured or indemnified against could have a materially adverse effect on our financial condition and operations.
Although we have not experienced any material adverse effect from compliance with environmental requirements, there is no assurance that this will continue. We did not have any material capital or other non-recurring expenditures in connection with
complying with environmental laws or environmental remediation matters in 2019,2021, nor do we anticipate that such expenditures will be material in 2020.2022.
Employees
As of December 31, 2019,2021, we had 6981 full-time employees, of which 1112 are management, 2217 are technical personnel, 17 are administrative personnel and 1935 are field operations employees. Our employees are not covered under a collective bargaining agreement nor are any employees represented by a union. We consider all relations with our employees to be satisfactory.
Office LeasesLocations
As of December 31, 2019, we leasedOur corporate headquarters are located at 1400 Woodloch Forest Drive, the Woodlands, Texas, with an additional office space as set forth in the following table:located at 600 North Marienfeld Street, Midland, Texas.
|
| | | | | | |
| | Approximate Size | | Lease Expiration Date | | Intended Use |
The Woodlands, Texas | | 19,600 sq. ft. | | March 31, 2025 | | Office |
Midland, Texas | | 9,200 sq. ft. | | June 30, 2022 | | Office |
During 2019, aggregate rental payments for our office facilities totaled approximately $0.8 million.
Information about our Executive Officers
The following table sets forth, as of March 1, 2020,2022, certain information regarding the executive officers of Earthstone:
| | | | | | | | | | | | | | |
| Name | | Age | | Position |
| Frank A. Lodzinski | | 72 | | Executive Chairman of the Board |
| Robert J. Anderson | | 60 | | President and Chief Executive Officer |
| Tony Oviedo | | 68 | | Executive Vice President, Accounting and Administration |
| Mark Lumpkin, Jr. | | 48 | | Executive Vice President and Chief Financial Officer |
| Steven C. Collins | | 57 | | Executive Vice President, Chief Operating Officer |
| Timothy D. Merrifield | | 66 | | Executive Vice President, Geological and Geophysical |
| | | | |
Name | | Age | | Position |
Frank A. Lodzinski | | 70 | | Chairman of the Board and Chief Executive Officer |
Robert J. Anderson | | 58 | | President |
Tony Oviedo | | 66 | | Executive Vice President, Accounting and Administration |
Mark Lumpkin, Jr. | | 46 | | Executive Vice President and Chief Financial Officer |
Steven C. Collins | | 55 | | Executive Vice President, Completions and Operations |
Timothy D. Merrifield | | 64 | | Executive Vice President, Geological and Geophysical |
The following biographies describe the business experience of our executive officers:
Frank A. Lodzinski has served as our Chairman since December 2014 and as Executive Chairman since April 1, 2020. He served as our Chief Executive Officer sincefrom December 2014.2014 through March 2020. He also served as our President from December 2014 through April 2018. Previously, he served as President and Chief Executive Officer of Oak Valley Resources, LLC (“Oak Valley”) from its formation in December 2012 until the closing of its strategic combination with Earthstone in December 2014. Prior to his service with Oak Valley, Mr. Lodzinski was Chairman, President and Chief Executive Officer of GeoResources, Inc. from April 2007 until its merger with Halcón Resources Corporation (“Halcón”) in August 2012 and from September 2012 until December 2012 he conducted pre-formation activities for Oak Valley. He has over 4547 years of oil and gas industry experience. In 1984, he formed Energy Resource Associates, Inc., which acquired management and controlling interests in oil and gas limited partnerships, joint ventures and producing properties. Certain partnerships were exchanged for common shares of Hampton Resources Corporation in 1992, which Mr. Lodzinski joined as a director and President. Hampton was sold in 1995 to Bellwether Exploration Company. In 1996, he formed Cliffwood Oil & Gas Corp. and in 1997, Cliffwood shareholders acquired a controlling interest in Texoil, Inc., where Mr. Lodzinski served as Chief Executive Officer and President. In 2001, Mr. Lodzinski was appointed Chief Executive Officer and President of AROC, Inc., to direct the restructuring and ultimate liquidation of that company. In 2003, AROC completed a monetization of oil and gas assets with an institutional investor and began a plan of liquidation in 2004. In 2004, Mr. Lodzinski formed Southern Bay Energy, LLC, the general partner of Southern Bay Oil & Gas, L.P., which acquired the residual assets of AROC, Inc., and he served as President of Southern Bay Energy, LLC upon its formation. The Southern Bay entities were merged into GeoResources in April 2007. Mr. Lodzinski has served as a director and member of the nominating and governance committee, audit committee and compensation committee of Yuma Energy, Inc. (“Yuma”) since April 2019 and previously served on its audit committee from September 2014 to October 2016 and its compensation committee from October 2016 to April 2019. HeOn April 15, 2020, Yuma, together with its subsidiaries, filed voluntary Chapter 11 petitions for relief under the United States Bankruptcy Code in the U.S. Bankruptcy Court for the Northern District of Texas. On October 20, 2020 the Bankruptcy Court issued an order to convert the Cases to a Chapter 7 liquidation. Mr. Lodzinski holds a BSBA degree in Accounting and Finance from Wayne State University in Detroit, Michigan.
Robert J. Anderson is a petroleum engineer with over 30 years of diversified domestic and international oil and gas experience. He has served as our President and Chief Executive Officer since April 2020, having previously served as President since April 2018. From December 2014 through April 2018, he served as our Executive Vice President, Corporate Development and Engineering. Previously, he served in a similar capacity with Oak Valley from March 2013 until the closing of its strategic combination with the Company in December 2014. Prior to joining Oak Valley, he served from August 2012 to February 2013 as Executive Vice President and Chief Operating Officer of Halcón. Mr. Anderson was employed by GeoResources, Inc. from April 2007 until its merger with Halcón in August 2012, ultimately serving as a director and Executive Vice President, Chief Operating Officer - Northern Region. He was involved in the formation of Southern Bay Energy in September
2004 as Vice President, Acquisitions until its merger with GeoResources in April 2007. From March 2004 to August 2004, Mr. Anderson was employed by AROC, a predecessor company to Southern Bay Energy, as Vice President, Acquisitions and Divestitures. From September 2000Prior to FebruaryMarch 2004 he was employed byin technical and supervisory roles with Anadarko Petroleum Corporation, as a petroleum engineer. In addition, he has worked with major oil companies including ARCO International/Vastar Resources, and independent oil companies, including Hugoton Energy, Hunt Oil Hugoton Energy, and Pacific Enterprises Oil Company. His professional experience of over 30 years includes acquisition evaluation, reservoir and production engineering, field development, project economics, budgeting and planning, and capital markets. His domestic acquisition and divestiture experience includes Texas and Louisiana (offshore and onshore), Mid-Continent, and the Rocky Mountain states, and his international experience includes Canada, South America, and Russia. Mr. Anderson has a B.S. degree in Petroleum Engineering from the University of Wyoming and an MBA from the University of Denver.
Tony Oviedo has served as our Executive Vice President - Accounting and Administration (Principal Accounting Officer) since February 10, 2017. Mr. Oviedo has over 30 years of professional experience with both private and public companies. Prior to joining the Company, he was employed by GeoMet, Inc., where, since 2006, he served as the Senior Vice President, Chief Financial Officer, Chief Accounting Officer and Controller. In addition, prior to joining GeoMet, Mr. Oviedo was
employed by Resolution Performance Products, LLC, where he was Compliance Director and has held positions as Chief Accounting Officer, Controller, and Director of Financial Reporting with various companies in the oil and gas industry. Prior to the aforementioned experience, he served in the audit practice of KPMG LLP’s Energy Group. Mr. Oviedo holds a Bachelor’s degree in Business Administration with a concentration in accounting and tax from the University of Houston and is a Certified Public Accountant in the state of Texas.
Mark Lumpkin, Jr. has over 2223 years of experience including over 1516 years of oil and gas finance experience. He has served as our Executive Vice President and Chief Financial Officer since August 2017. Immediately prior to joining Earthstone, he served as Managing Director at RBC Capital Markets in the Oil and Gas Corporate Banking group, beginning in 2011 with a focus on upstream and midstream debt financing. From 2006 until 2011, he was employed by The Royal Bank of Scotland (“RBS”) in the Oil and Gas group within the Corporate and Investment Banking division, focusing primarily on the upstream subsector. Prior to RBS, he spent two years focused on capital markets and mergers and acquisitions primarily in the upstream sector at a boutique investment bank. Mr. Lumpkin graduated with a B.A. degree in Economics from Louisiana State University and graduated with a Master of Business Administration degree with a Finance concentration from Tulane University.
Steven C. Collinsis a petroleum engineer with over 30 years of operations and related experience. He has served as our Executive Vice President and Chief Operating Officer since December 2014 (however, his title was Executive Vice President, Completions and Operations sincefrom December 2014.2014 to January 2022 with the same position, authority and duties from December 2014 to present). Previously, he served in a similar capacity with Oak Valley from its formation in December 2012 until the closing of its strategic combination with the Company in December 2014. Mr. Collins was employed by GeoResources, Inc. from April 2007 until its merger with Halcón in August 2012 and directed field operations, including well completion, production and workover operations. Prior to employment by GeoResources, he served as Vice President of Operations for Southern Bay, AROC, and Texoil, and as a petroleum and operations engineer at Hunt Oil Company and Pacific Enterprises Oil Company. His experience includes Texas, Louisiana (onshore and offshore), North Dakota, Montana, and the Mid-Continent. Mr. Collins graduated with a B.S. degree in Petroleum Engineering from the University of Texas.
Timothy D. Merrifield has over 39 years of oil and gas industry experience. He has served as our Executive Vice President, Geology and Geophysics since December 2014. Previously, he served in a similar capacity with Oak Valley from its formation in December 2012 until the closing of its strategic combination with the Company in December 2014. Prior to employment by Oak Valley, he served from August 2012 to November 2012 as a consultant to Halcón upon its merger with GeoResources, Inc. in August 2012. From April 2007 to August 2012, Mr. Merrifield led all geology and geophysics efforts at GeoResources. He has held previous roles at AROC, Force Energy, Great Western Resources and other independents. His domestic experience includes Texas, Louisiana (onshore and offshore), North Dakota, Montana, New Mexico, Rocky Mountain States, and the Mid-Continent. In addition, he has international experience in Peru and the East Irish Sea. Mr. Merrifield attended Texas Tech University.
Available Information
Our principal executive offices are located at 1400 Woodloch Forest Drive, Suite 300, The Woodlands, Texas 77380. Our telephone number is (281) 298-4246. You can find more information about us at our website located at www.earthstoneenergy.com. Our Annual Report on Form 10-K, our Quarterly Reports on Form 10-Q, our Current Reports on Form 8-K and any amendments to those reports are available free of charge on or through our website, which is not part of this report. These reports are available as soon as reasonably practicable after we electronically file these materials with, or furnish them to, the SEC. The SEC maintains a website at www.sec.gov that contains reports, proxy and information statements, and other information regarding issuers that file electronically with the SEC, including us.
Item 1A. Risk Factors
Our business is subject to various risks and uncertainties in the ordinary course of our business. The following summarizes significant risks and uncertainties that may adversely affect our business, financial condition or results of operations. We cannot assure you that any of the events discussed in the risk factors below will not occur. Further, the risks and uncertainties described below are not the only ones we face. Additional risks not presently known to us or that we currently deem immaterial may also materially affect our business. When considering an investment in our shares of Class A Common Stock, $0.001 par value per share (“Class A Common Stock”), youReaders should carefully consider the risk factors included below as well as those matters referenced in this report under “Cautionary Statement Concerning Forward-Looking Statements” and other information included and incorporated by reference into this report.
Summary Risk Factors
The following is a summary of the material risks and uncertainties we have identified, which should be read in conjunction with the more detailed description of each risk factor contained below.
General Business and Industry Risks
•Effects of the COVID-19 pandemic and responses;
•Volatility in prices for oil, natural gas and NGLs;
•Our oil and natural gas reserves are estimated and may not reflect the actual volumes we will recover, and we may be required to write down the carrying value of our proved properties under accounting rules;
•The borrowing base under our Credit Agreement is subject to periodic redetermination, and we are subject to interest rate risk under our Credit Agreement;
•Our ability to replace our oil and natural gas reserves;
•Uncertainties associated with estimating reserves and future net cash flows;
•Development of our reserves may take longer and may require higher levels of capital expenditures than we currently anticipate;
•The standardized measure of discounted future net cash flows from our estimated proved reserves may not be the same as the current market value of our estimated oil and natural gas reserves;
•Our level of success in development and production activities;
•Acquired properties may not produce as projected;
•Certain of our properties are in areas that may have been partially depleted or drained by offset wells, and certain of our wells may be adversely affected by actions of other operators;
•Multi-well pad drilling may result in volatility in our operating results;
•Unavailability or high cost of additional oilfield services;
•The unavailability or high cost of equipment, supplies, personnel and oilfield services used to drill and complete wells could adversely affect our ability to execute our development plans within our budget and on a timely basis;
•Ability to obtain required capital or financing on satisfactory terms;.
•A negative shift in stakeholder sentiment towards the oil and gas industry;
•Our ability to obtain future hedges and effectiveness of our commodity derivative activities;
•Competition in the oil and gas industry;
•Inability to complete additional acquisitions;
•Risks associated with recent transactions and exposure to contingent liabilities;
•Ability to effectively manage our expanded operations;
•Incurrence of substantial losses and liability claims as a result of our oil and gas operations, and risks our insurance may be inadequate to protect us against these losses;
•Exposure to significant compliance costs and liabilities;
•Federal and state legislation and regulatory initiatives relating to hydraulic fracturing and water disposal wells;
•Extreme weather conditions affecting our ability to conduct drilling, completion and production activities;
•Adoption of climate change legislation or regulations restricting emissions of “greenhouse gases” and potential physical effects of climate change;
•Restrictions on drilling activities intended to protect certain species of wildlife;
•Geographic concentration of our operations;
•Changes in tax laws and regulations;
•Availability, use and disposal of water;
•Regulations that restrict our ability to acquire federal leases in the future;
•The marketability of our production is dependent upon gathering, processing and transportation facilities;
•Failure of third parties to fulfill their commitments to our projects;
•Incurrence of significant additional amounts of debt;
•We have limited control over activities on properties we do not operate;
•Cybersecurity threats and other disruptions in our electronic systems; and
•Our ability to attract, train and retain qualified personnel.
Risks Related to the Bighorn Acquisition
•Delays in completing the Bighorn Acquisition;
•Inability to successfully integrate Bighorn’s operations or to realize anticipated cost savings, revenues or other benefits of the Bighorn Acquisition;
•Limited recourse against Bighorn for losses and liabilities arising or discovered after closing;
•Incurrence of significant transaction and acquisition-related costs;
•We are subject to various uncertainties and contractual restrictions while the Bighorn Acquisition is pending;
•We may be the target of securities class action and derivative lawsuits which could result in substantial costs and may delay or prevent the Bighorn Acquisition from being completed; and
•Incurrence of substantial indebtedness in connection with the Bighorn Acquisition.
Risks Related to the Ownership of our Class A Common Stock
•As a holding company and the sole manager of EEH our only material asset is our equity interest in EEH;
•Our principal stockholders hold substantial voting power of our Common Stock;
•Holders of Class B Common Stock have the right to exchange their EEH Units and shares of Class B Common Stock for our Class A Common Stock;
•Future sales of our Class A Common Stock could reduce our stock price;
•We have no plans to pay dividends on our Class A Common Stock;
•Our Board of Directors can, without stockholder approval, cause preferred stock to be issued on terms that could adversely affect our common stockholders;
•The price of our Class A Common Stock may fluctuate significantly;
•Anti-takeover provisions could make a third-party acquisition difficult; and
•Our stockholders may act by unilateral written consent.
General Business and Industry Risks
Our business and operations have been and will likely continue to be adversely affected by the ongoing COVID-19 pandemic.
The spread of COVID-19 and variants caused, and is continuing to cause, severe disruptions in the worldwide and U.S. economies, including contributing to the reduced global and domestic demand for oil and natural gas, which has had and will likely continue to have an adverse effect on our business, financial condition and results of operations. Moreover, since the beginning of January 2020, the COVID-19 pandemic has caused significant disruption in the financial markets both globally and in the United States. The continued spread of COVID-19 and variants could also negatively impact the availability of key personnel necessary to conduct our business. If COVID-19 continues to spread or the response to contain or mitigate the COVID-19 pandemic through the development and availability of effective treatments and vaccines, including the vaccines approved by the FDA for emergency use in the U.S., is unsuccessful, we could continue to experience material adverse effects on our business, financial condition and results of operations. Due to the rapid development and fluidity of this situation, we cannot make any prediction as to the ultimate material adverse impact of the COVID-19 pandemic on our business, financial condition and results of operations.
Oil, natural gas and natural gas liquidsNGL prices are volatile. Their prices at times since 2014 have adversely affected, and in the future may adversely affect, our business, financial condition and results of operations and our ability to meet our capital expenditure obligations and financial commitments. Volatile and lower prices may also negatively impact our stock price.
The prices we receive for our oil, natural gas and natural gas liquidsNGL production heavily influence our revenues, profitability, access to capital and future rate of growth. These hydrocarbons are commodities, and therefore, their prices may be subject to wide fluctuations in response to relatively minor changes in supply and demand. Historically, the market for oil, natural gas and natural gas liquidsNGL has been volatile. For example, during the period from January 1, 2014 through December 31, 2019,2021, the West Texas Intermediate (“WTI”)WTI spot price for oil declined from a high of $107.95 per Bbl in June 2014 to $26.19-$36.98 per Bbl in February 2016.April 2020. The Henry Hub spot price for natural gas has declined from a high of $8.15 per MMBtu in February 2014 to a low of $1.49$1.33 per MMBtu in March 2016.September 2020. During 2019,2021, WTI spot prices ranged from $46.31$47.47 to $65.96$85.64 per Bbl and the Henry Hub spot price of natural gas ranged from $1.75$2.43 to $4.25$23.86 per MMBtu. Likewise, natural gas liquids,NGL, which are made up of ethane, propane, isobutane, normal butane and natural gasoline, each of which have different uses and different pricing characteristics, have experienced significant declines in realized prices since the fall of 2014. The prices we receive for oil, natural gas and natural gas liquidsNGL we produce and our production levels depend on numerous factors beyond our control, including:
•worldwide, regional and local economic and financial conditions impacting supply and demand;
•the level of global exploration, development and production;
•the level of global supplies, in particular due to supply growth from the United States;
•the price and quantity of oil, natural gas and NGLs imports to and exports from the U.S.;
•political conditions in or affecting other oil, natural gas and natural gas liquidsNGL producing countries and regions, including the current conflicts in the Middle East, Asia and Eastern Europe;
•the outbreak of military hostilities, including armed conflict between Russia and Ukraine and the potential destabilizing effect such conflict may pose for the European continent or the global oil and natural gas markets;
•actions of the OPEC and state-controlled oil companies relating to production and price controls;
•the extent to which U.S. shale producers become swing producers adding or subtracting to the world supply totals;
•future regulations prohibiting or restricting our ability to apply hydraulic fracturing to our wells;
•current and future regulations regarding well spacing;
•prevailing prices and pricing differentials on local oil, natural gas and natural gas liquidsNGL price indices in the areas in which we operate;
•localized and global supply and demand fundamentals and transportation, gathering and processing availability;
•weather conditions;
•technological advances affecting fuel economy, energy supply and energy consumption;
•the effect of energy conservation measures, alternative fuel requirements and increasing demand for alternatives to oil and natural gas;
•global or national health concerns, including health epidemics such as the coronavirus outbreakCOVID-19 pandemic at the beginning of 2020;
•the price and availability of alternative fuels; and
•domestic, local and foreign governmental regulation and taxes.
Lower oil, natural gas and natural gas liquidsNGL prices have and may continue to reduce our cash flows and borrowing capacity. We may be unable to obtain needed capital or financing on satisfactory terms, which could lead to a decline in our hydrocarbon reserves
as existing reserves are depleted. A decrease in prices could render development projects and producing properties uneconomic, potentially resulting in a loss of mineral leases. Low commodity prices have, at times, caused significant downward adjustments to our estimated proved reserves, and may cause us to make further downward adjustments in the future. Furthermore, our borrowing capacity could be significantly affected by decreased prices. Under the Credit Agreement, our borrowing base is subject to semi-annual redeterminations (on or about May 1 and November 1) and our lenders have the right to call for an interim determination of the borrowing base under certain circumstances. A sustained decline in oil, natural gas and natural gas liquidsNGL prices could adversely impact our borrowing base in future borrowing base redeterminations, which could trigger repayment obligations under the Credit Agreement to the extent our outstanding borrowings exceed the redetermined borrowing base and could otherwise materially and adversely affect our future business, financial condition, results of operations, liquidity or ability to finance planned capital expenditures. In addition, lower oil, natural gas and natural gas liquids gasNGL prices may typically cause a decline in the market price of our shares.
As a result of previous low prices for oil, natural gas and natural gas liquids,NGL, we may be required to take significant future write-downs of the financial carrying values of our properties.properties in the future.
Accounting rules require that we periodically review the carrying value of our proved and unproved properties for possible impairment. Based on prevailing commodity prices and specific market factors and circumstances at the time of prospective impairment reviews, and the continuing evaluation of development plans, production data, economics and other factors, we may be required to significantly write-down the financial carrying value of our oil and natural gas properties, which constitutes a non-cash charge to earnings. We may incur impairment charges in the future, which could have a material adverse effect on our results of operations for the periods in which such charges are recorded.
A write-down could occur when oil and natural gas prices are low or if we have substantial downward adjustments to our estimated proved oil and natural gas reserves, if operating costs or development costs increase over prior estimates, or if exploratory drilling is unsuccessful.
The capitalized costs of our oil and natural gas properties, on a field-by-field basis, may exceed the estimated future net cash flows of that field. If so, we would record impairment charges to reduce the capitalized costs of such field to our estimate of the field’s fair market value. Unproved properties are evaluated at the lower of cost or fair market value. These types of charges will reduce our earnings and stockholders’ equity and could adversely affect our stock price.
We periodically assess our properties for impairment based on future estimates of proved and non-proved reserves, oil and natural gas prices, production rates and operating, development and reclamation costs based on operating budget forecasts. Once incurred, an impairment charge cannot be reversed at a later date even if price increases of oil and/or natural gas occur and in the event of increases in the quantity of our estimated proved reserves.
If oil, natural gas and natural gas liquidsNGL prices fall below current levels for an extended period of time and all other factors remain equal, we may incur impairment charges in the future. Such charges could have a material adverse effect on our results of operations for the periods in which they are recorded. See Note 7. Oil and Natural Gas Properties to the Notes to Consolidated Financial Statements included in this report for additional information.
Any significant reduction in our borrowing base under theour Credit Agreement as a result of a periodic borrowing base redetermination or otherwise may negatively impact our liquidity and, consequently, our ability to fund our operations, including capital expenditures, and we may not have sufficient funds to repay borrowings under theour Credit Agreement or any other obligation if required as a result of a borrowing base redetermination.
Availability under the Credit Agreement is currently subject to a borrowing base of $325.0 million.$825 million, as increased with the closing of the Chisholm Acquisition on February 15, 2022. The borrowing base is subject to scheduled semiannual redeterminations (on or about May 1 and November 1), as well as other lender-elective borrowing base redeterminations. The lenders can unilaterally adjust the borrowing base and the borrowings permitted to be outstanding under the Credit Agreement. Reductions in estimates of our oil, natural gas and natural gas liquidsNGL reserves may result in a reduction in our borrowing base under the Credit Agreement (if prices are kept constant). Reductions in our borrowing base under the Credit Agreement could also arise from other factors, including but not limited to:
•lower commodity prices or production;
•increased leverage ratios;
•inability to drill or unfavorable drilling results;
•changes in oil, natural gas and natural gas liquidsNGL reserve engineering techniques;
•increased operating and/or capital costs;
•the lenders’ inability to agree to an adequate borrowing base; or
•adverse changes in the lenders’ practices (including required regulatory changes) regarding estimation of reserves.
As of December 31, 2019,2021, we had $170.0$320 million of borrowings outstanding under the Credit Agreement.Agreement with a borrowing base of $650 million. When adjusted to include the closing of the Chisholm Acquisition on February 15, 2022, we had $604 million of long-term debt outstanding under the Credit Agreement with a borrowing base of $825 million. We may make further borrowings under the Credit Agreement in the future. Any significant reduction in our borrowing base under the Credit Agreement as a result of borrowing base redeterminations or otherwise will negatively impact our liquidity and our ability to fund our operations and, as a result, could have a material adverse effect on our financial position, results of operations and cash flows. Further, if the outstanding borrowings under the Credit Agreement were to exceed the borrowing base as a result of any such redetermination, we could be required to repay the excess.
Unless we replace our reserves, our production and estimated reserves will decline, which may adversely affect our financial condition, results of operations and/or cash flows.
Producing oil and natural gas reservoirs are generally characterized by declining production rates that may vary depending upon reservoir characteristics and other factors. Decline rates are typically greatest early in the productive life of a well, particularly horizontal wells. Estimates of the decline rate of an oil or natural gas well are inherently imprecise and may be less precise with respect to new or emerging oil and natural gas formations with limited production histories than for more developed formations with established production histories. Our production levels and the reserves that we currently expect to recover from our wells will change if production from our existing wells declines in a different manner than we have estimated and can change under other circumstances. Thus, our estimated future oil and natural gas reserves and production and, therefore, our cash flows and results of operations are highly dependent upon our success in efficiently developing and exploiting our current properties and economically finding or acquiring additional recoverable reserves. We may not be able to develop, find or acquire additional reserves to replace our current and future production at acceptable costs. If we are unable to replace our current and future production, our cash flows and the value of our reserves may decrease, adversely affecting our business, financial condition and results of operations.
Estimates of proved oil and natural gas reserves involve assumptions and any material inaccuracies in these assumptions will materially affect the quantities and the value of those reserves.
This report contains estimates of our proved oil and natural gas reserves. These estimates are based upon various assumptions, including assumptions required by SEC regulations relating to oil and natural gas prices, drilling and operating expenses, capital expenditures, taxes and availability of funds. The process of estimating oil and natural gas reserves is complex and requires significant decisions, complex analyses and assumptions in evaluating available geological, geophysical, engineering and economic data for each reservoir. Therefore, these estimates are inherently imprecise.
Our actual future production, oil and natural gas prices, revenues, taxes, development expenditures, operating expenses and quantities of recoverable oil and natural gas reserves will vary from those estimated. Any significant variance will likely materially affect the estimated quantities and the estimated value of our reserves. In addition, we may later adjust estimates of proved reserves to reflect production history, results of exploration and development activities, prevailing oil and natural gas prices and other factors, many of which are beyond our control.
Quantities of estimated proved reserves are based on economic conditions in existence during the period of assessment. Changes to oil, natural gas and natural gas liquidsNGL prices in the markets for these commodities may shorten the economic lives of certain fields because it may become uneconomical to produce all recoverable reserves in such fields, which may reduce proved reserves estimates.
Negative revisions in the estimated quantities of proved reserves have the effect of increasing the rates of depletion on the affected properties, which decrease earnings or result in losses through higher depletion expense. These revisions, as well as revisions in the assumptions of future estimated cash flows of those reserves, may also trigger impairment losses on certain properties, which may result in non-cash charges to earnings. See Note 7. Oil and Natural Gas Properties to the Notes to Consolidated Financial Statements included in this report.
The development of our estimated provedundevelopedreserves may take longer and may require higher levels of capital expenditures than we currently anticipate. Therefore, our estimated provedundevelopedreserves may not be ultimately developed or produced.
At December 31, 2019,2021, approximately 66%37% of our estimated proved reserves were classified as proved undeveloped. The development of our estimated proved undeveloped reserves of 62,815 MBOE54,012 MBoe will require an estimated $628.1$455.1 million of development capital over the next five years. Development of these reserves may take longer and require higher levels of capital expenditures than we currently anticipate. The future development of our proved undeveloped reserves is dependent on successful drilling and completion results, future commodity prices, costs and economic assumptions that align with our internal forecasts, as well as access to liquidity sources, such as the capital markets, the Credit Agreement and derivative contracts. Delays
in the development of our reserves, increases in costs to drill and develop such reserves, or decreases in commodity prices will reduce the PV-10 value of our estimated proved undeveloped reserves and future net revenues estimated for such reserves and may result in some projects becoming uneconomic. Moreover, under the applicable SEC regulations, we may be required to write down our proved undeveloped reserves if we do not drill or have a development plan to drill wells within a prescribed five-year period. The estimated reserve data assumes that we will make specified capital expenditures to timely develop our reserves. TheWhere estimates of these oil and natural gas reserves and the costs associated with development of these reserves have been prepared in accordance with SEC regulations; however,regulations the actual capital expenditures may vary from estimated capital expenditures, development may not occur as scheduled and actual results may not be asless than estimated.
The standardized measure of discounted future net cash flows from our estimated proved reserves may not be the same as the current market value of our estimated oil and natural gas reserves.
YouA reader should not assume that the standardized measure of discounted future net cash flows from our estimated proved reserves set forth in this report is the current market value of our estimated oil and natural gas reserves. In accordance with SEC requirements in effect at December 31, 20192021, 2020 and 2018,2019, we based the discounted future net cash flows from our proved reserves on the 12-month first-day-of-the-month oil and natural gas unweighted arithmetic average prices without giving effect to derivative transactions and costs in effect as of the date of the estimate, holding prices and costs constant through the life of the properties. Actual future net cash flows from our oil and natural gas properties will be affected by factors such as:
the actual prices we receive for oil and natural gas;
the actual cost of development and production expenditures;
the amount and timing of actual production; and
changes in governmental regulations or taxation.
The timing of both our production and incurring expenses related to developing and producing oil and natural gas properties will affect the timing and amount of actual future net revenues from proved reserves, and thus their actual present value. In addition, the 10% discount factor we use when calculating standardized measure may not be the most appropriate discount factor based on interest rates in effect from time to time and risks associated with our business or the oil and natural gas industry in general. As a corporation, we are treated as a taxable entity for statutory income tax purposes and our future income taxes will be dependent on our future taxable income. Actual future prices and costs may differ materially from those used in the estimates included in this report which could have a material effect on the value of our estimated reserves.
Our development and exploratory drilling efforts and our well operations may not be profitable or achieve our targeted returns.
We have acquired significant amounts of unproved property in order to further our development efforts and expect to continue to undertake acquisitions in the future. Development and exploratory drilling and production activities are subject to many risks, including the risk that no commercially productive reservoirs will be discovered. We acquire unproved properties and lease undeveloped acreage that we believe will enhance our growth potential and increase our results of operations over time. However, we cannot assure you that all prospects will be economically viable or that we will not abandon our leaseholds. Additionally, we cannot assure you that unproved property acquired by us or undeveloped acreage leased by us will be profitably developed, that wells drilled by us in prospects that we pursue will be productive or that we will recover all or any portion of our investment in such unproved property or wells.
Properties we acquire may not produce as projected and we may be unable to determine reserve potential, identify liabilities associated with the properties that we acquire or obtain protection from sellers against such liabilities.
Acquiring oil and natural gas properties requires us to assess reservoir and infrastructure characteristics, including recoverable reserves, development and operating costs and potential environmental and other liabilities. Such assessments are inexact and inherently uncertain.uncertain and include properties with which we do not have a long operational history. In connection with the assessments, we perform a review of the subject properties, but such a review will not reveal all existing or potential problems. In the course of our due diligence, we may not inspect every well or pipeline. We cannot necessarily observe structural and environmental problems, such as pipe corrosion, when an inspection is made. We may not be able to obtain contractual indemnities from the seller for liabilities created prior to our purchase of a property. We may be required to assume the risk of the physical condition of properties in addition to the risk that they may not perform in accordance with our expectations. If properties we acquire do not produce as projected or have liabilities we were unable to identify, we could experience a decline in our reserves and production, which could adversely affect our business, financial condition and results of operations.
Future drilling and completion activities associated with identified drilling locations may be adversely affected by factors that could materially alter the occurrence or timing of their drilling and completion, which in certain instances could prevent production prior to the expiration date of mineral leases for such locations.
Although our management team has identified numerous potential drilling locations as a part of our long-range planning related to future drilling activities on our existing acreage, our ability to drill and develop these locations depends on a number of factors, which are beyond our control, including, the availability and cost of capital, oil, natural gas and natural gas liquidsNGL prices, drilling and production costs, the availability of drilling services and equipment, drilling results (including the impact of increased horizontal drilling density and longer laterals), lease expirations, gathering systems, marketing and pipeline transportation constraints, regulatory permits and approvals and other factors. In addition, we may alter the spacing between our anticipated drilling locations, which could impact the number of our drilling locations, the number of wells that we drill, and the volumes of oil and gas we ultimately recover. As such, our actual drilling and completion activities, may materially differ from those presently anticipated. Accordingly, it is uncertain to what degree that these potential drilling locations will be developed or if we will be able to produce significant oil, natural gas and natural gas liquidsNGLs from these or any other potential drilling locations. Unless production is established, in accordance with the terms of mineral leases that are associated with these locations, such leases could expire.
Many of our properties are in areas that may have been partially depleted or drained by offset wells and certain of our wells may be adversely affected by actions we or other operators may take when drilling, completing, or operating wells that we or they own.
Many of our properties are in reservoirs that may have already been partially depleted or drained by earlier offset drilling. The owners of leasehold interests adjoining any of our properties could take actions, such as drilling and completing additional wells, which could adversely affect our operations. When a new well is completed and produced, the pressure differential in the vicinity of the well causes the migration of reservoir fluids toward the new wellbore (and potentially away from existing wellbores). As a result, the drilling and production of these potential locations by us or other operators could cause depletion of our proved reserves and may inhibit our ability to further develop our proved reserves. In addition, completion operations and other activities conducted on adjacent or nearby wells by us or other operators could cause production from our wells to be shut in for indefinite periods of time, could result in increased lease operating expenses and could adversely affect the production and reserves from our wells after they re-commence production. We have no control over the operations or activities of offsetting operators.
Multi-well pad drilling may result in volatility in our operating results.
We utilize multi-well pad drilling where practical. Because wells drilled on a pad are not brought into production until all wells on the pad are drilled and completed and the drilling rig is moved from the location, multi-well pad drilling delays the commencement of production from a given pad, which may cause volatility in our operating results. In addition, problems affecting one pad could adversely affect production from all wells on such pad. As a result, multi-well pad drilling can cause delays in the scheduled commencement of production or interruptions in ongoing production.
The unavailability or high cost of additional drilling rigs, equipment, supplies, personnel and oilfield services used to drill and complete wells could adversely affect our ability to execute our development plans within our budget and on a timely basis.
The demand for drilling rigs, pipe and other equipment and supplies, as well as for qualified and experienced field personnel to drill wells and conduct field operations, geologists, geophysicists, engineers and other professionals in the oil and natural gas industry, can fluctuate significantly, often in correlation with oil and natural gas prices, causing periodic shortages. Our operations are concentrated in areas in which activity has increased rapidly, and as a result, demand for such drilling rigs,
equipment and personnel, as well as access to transportation, processing and refining facilities in these areas, has increased, as have the costs for those items. In addition, to the extent our suppliers source their products or raw materials from foreign markets, the cost of such equipment could be impacted if the United States imposes tariffs on imported goods from countries where these goods are produced. For example, the steel we use for pipes, valve fittings and other equipment is generally imported from other countries, and the price for steel rose significantly in 2018 due at least in part to the 25% tariff imposed by United States on imported steel. We cannot predict whether these conditions will exist in the future and, if so, what their timing and duration will be. Such shortages or cost increases could delay or cause us to incur significant expenditures that are not provided for in our capital budget, which could have a material adverse effect on our business, financial condition or results of operations.
Our acquisition, development and exploitation projects require substantial capital expenditures. We may be unable to obtain required capital or financing on satisfactory terms, which could limit growth or lead to a decline in our reserves.
The oil and natural gas industry is capital intensive. We make and expect to continue to make substantial capital expenditures for the acquisition and development of oil and natural gas reserves. We expect to fund our 20202022 capital expenditures with cash on hand, cash generated by operations, borrowings under the Credit Agreement and possibly through additional capital market transactions. The actual amount and timing of our future capital expenditures may differ materially from our estimates as a result of, among other things, oil and natural gas prices, actual drilling results, the availability of high-quality drilling rigs and other services and equipment and regulatory, technological and competitive developments. A significant reduction in commodity prices from current levels may result in a decrease in our actual capital expenditures, which would negatively impact our ability to grow production.
Our cash flow from operations and access to capital are subject to a number of variables, including:
our proved reserves;
the level of hydrocarbons we are able to produce from existing wells;
the prices at which our production is sold;
our ability to acquire, locate and produce reserves; and
our ability to borrow under the Credit Agreement.
If our revenues or the borrowing base under the Credit Agreement decrease as a result of low oil and natural gas prices, operating difficulties, declines in reserves or for any other reason, we may have limited ability to obtain the capital necessary to sustain our operations and growth at current levels. If additional capital is needed, we may not be able to obtain debt or equity financing on terms acceptable to us, if at all. The failure to obtain additional financing could result in a curtailment of our operations relating to development of our properties, which in turn could lead to a decline in our reserves and production and would adversely affect our business, financial condition and results of operations.
A negative shift in investorstakeholder sentiment towards the oil and gas industry and increased attention to ESG matters and conservation matters could adversely affect our ability to raise equity and debt capital.
Much of the investor community has developed negative sentiment towards investing in our industry.industry over the past few years. Recent equity returns in the sector versus other industry sectors have led to lower oil and gas representation in certain key equity market indices. Some investors, including certain public and private fund management firms, pension funds, university endowments and family foundations, have stated policies to reduce or eliminate their investments in the oil and gas sector based on environmental, social and governance considerations. Certain other stakeholders have pressured private equity firms and commercial and investment banks to stop funding oil and gas projects. Such developments have resulted and could continue to result in downward pressure on the stock prices of oil and gas companies, including ours. This may also result in a reduction of available capital funding for potential development projects, further impacting our future financial results.
Increasing attention to climate change, societal expectations on companies to address climate change, investor and societal expectations regarding voluntary ESG disclosures, and consumer demand for alternative forms of energy may result in increased costs, reduced demand for our products, reduced profits, increased investigations and litigation, and negative impacts on our stock price and access to capital markets. Increasing attention to climate change and environmental conservation, for example, may result in demand shifts for oil and natural gas products and additional governmental investigations and private litigation against us or our operators.To the extent that societal pressures or political or other factors are involved, it is possible that such liability could be imposed without regard to our causation of or contribution to the asserted damage, or to other mitigating factors.
Moreover, while we may create and publish voluntary disclosures regarding ESG matters from time to time, many of the statements in those voluntary disclosures are based on hypothetical expectations and assumptions that may or may not be representative of current or actual risks or events or forecasts of expected risks or events, including the costs associated therewith. Such expectations and assumptions are necessarily uncertain and may be prone to error or subject to misinterpretation given the long timelines involved and the lack of an established single approach to identifying, measuring and reporting on many ESG matters.
In addition, organizations that provide information to investors on corporate governance and related matters have developed ratings processes for evaluating companies on their approach to ESG matters. Such ratings are used by some investors to inform their investment and voting decisions. Unfavorable ESG ratings and recent activism directed at shifting funding away from companies with energy-related assets could lead to increased negative investor sentiment toward us and our industry and to the
diversion of investment to other industries, which could have a negative impact on our access to and costs of capital. Also, institutional lenders may decide not to provide funding for fossil fuel energy companies based on climate change related concerns, which could affect our access to capital for potential growth projects.
We have incremental cash inflows and outflows as a result of our hedging activities. To the extent we are unable to obtain future hedges at attractive prices or our derivative activities are not effective, our cash flows and financial condition may be adversely impacted.
In an effort to achieve more predictable cash flows and reduce our exposure to adverse fluctuations in the prices of oil and natural gas, we often enter into derivative instrument contracts for a portion of our oil and natural gas production, including fixed price swaps, collars, putsbasis swaps and basis swaps.costless collars. We recognize all derivatives as either assets or liabilities, measured at fair value, and recognize changes in the fair value of derivatives in current earnings. Accordingly, our earnings may fluctuate significantly and our results of operations may be significantly and adversely affected because of changes in the fair market value of our derivative instruments.instruments, especially during periods of oil and gas price increases. As our derivative instrument contracts expire, there is no assurance that we will be able to replace them comparably.
Derivative instruments can expose us to the risk of financial loss in varying circumstances, including, but not limited to, when:
production is less than the volume covered by the derivative instruments;
the counter-party to the derivative instrument defaults on its contractual obligations;
there is an increase in the differential between the underlying price stated in the derivative instrument contract and actual prices received; or
there are issues with regard to legal enforceability of such instruments.
For additional information regarding our hedging activities, please see Item 7. Management’s Discussion and Analysis of Financial Condition and Results of Operations and Note 6.Derivative Financial Instruments in the Notes to Consolidated Financial Statements included in this report for additional information.
Derivatives reform legislation and related regulations could have an adverse effect on our ability to hedge risks associated with our business.
The Dodd-Frank Wall Street Reform and Consumer Protection Act (the “Dodd-Frank Act”) provides for federal oversight of the over-the-counter derivatives market and entities that participate in that market and mandates that the Commodity Futures Trading Commission (the “CFTC”), the SEC, and federal regulators of financial institutions adopt rules or regulations implementing the Dodd-Frank Act and providing definitions of terms used in the Dodd-Frank Act.
The CFTC has finalized other regulations implementing the Dodd-Frank Act’s provisions regarding trade reporting, margin, clearing, and trade execution; however, some regulations remain to be finalized and it is not possible at this time to predict when
the CFTC will adopt final rules. For example, the CFTC has re-proposed regulations setting position limits for certain futures and option contracts in the major energy markets and for swaps that are their economic equivalents. Certain bona fide hedging transactions are expected to be made exempt from these limits. Also, it is possible that under recently adopted margin rules, some registered swap dealers may require us to post initial and variation margins in connection with certain swaps not subject to central clearing.
The Dodd-Frank Act and any additional implementing regulations could significantly increase the cost of some commodity derivative contracts (including through requirements to post collateral, which could adversely affect our available liquidity), materially alter the terms of some commodity derivative contracts, limit our ability to trade some derivatives to hedge risks, reduce the availability of some derivatives to protect against risks we encounter, and reduce our ability to monetize or restructure our existing commodity derivative contracts. If we reduce our use of derivatives as a consequence, our results of operations may become more volatile and our cash flows may be less predictable, which could adversely affect our ability to plan for and fund capital expenditures. Increased volatility may make us less attractive to certain types of investors. Finally, the Dodd-Frank Act was intended, in part, to reduce the volatility of oil and natural gas prices, which some legislators attributed to speculative trading in derivatives and commodity instruments related to oil and natural gas. If the implementing regulations result in lower commodity prices, our revenues could be adversely affected. Any of these consequences could adversely affect our business, financial condition and results of operations.report.
The oil and natural gas industry is highly competitive, and our small size putsmay put us at a disadvantage in competing for resources.
The oil and natural gas industry is highly competitive particularly in the Permian Basin of Texasand the Delaware Basin where our properties and operations are concentrated. We compete with major integrated and larger independent oil and natural gas companies in seeking to acquire desirable oil and natural gas properties and leases and for the equipment and services required to develop and operate properties. Many of our competitors have financial and other resources that are substantially greater than ours, which makes acquisitions of acreage or producing properties at economic prices difficult. Significant competition also exists in attracting and retaining technical personnel, including geologists, geophysicists, engineers, landmen and other specialists, as well as financial and administrative personnel hence we may be at a competitive disadvantage to companies with larger financial resources than ours.
Failure to complete additional acquisitions could limit our potential growth.
Our future success is highly dependent on our ability to acquire and develop mineral leases and oil and gas properties with economically recoverable oil and natural gas reserves. Without continued successful acquisition of economiceconomically attractive development projects, our current estimated oil and natural gas reserves will decline due to continued production activities. Acquiring additional oil and natural gas properties, or businesses that own or operate such properties is an important component of our business strategy. If we identify an appropriate acquisition candidate, management may be unable to negotiate mutually acceptable terms with the seller, finance the acquisition or obtain the necessary regulatory approvals. Our limited access to financial resources compared to larger, better capitalized companies may limit our ability to make future acquisitions. If we are unable to complete suitable acquisitions, it may be more difficult to replace and increase our reserves, and an inability to replace our reserves may have a material adverse effect on our financial condition and results of operations.
Acquisitions involve a number of risks, including the risk that we will discover unanticipated liabilities or other problems associated with the acquired business or property.
In assessing potential acquisitions, we consider information available in the public domain and information provided by the seller. In the event publicly available data is limited, then, by necessity, we may rely to a large extent on information that may only be available from the seller, particularly with respect to drilling and completion costs and practices, geological, geophysical and petrophysical data, detailed production data on existing wells, and other technical and cost data not available in the public domain. Accordingly, the review and evaluation of businesses or properties to be acquired may not uncover all existing or relevant data, obligations or actual or contingent liabilities that could adversely impact any business or property to be acquired and, hence, could adversely affect us as a result of the acquisition. These issues may be material and could include, among other things, unexpected environmental liabilities, title defects, unpaid royalties, taxes or other liabilities. If we acquire properties on an “as-is” basis, we may have limited or no remedies against the seller with respect to these types of problems.
The success of any acquisition that we complete will depend on a variety of factors, including our ability to accurately assess the reserves associated with the acquired properties, assumptions related to future oil and natural gas prices and operating costs, potential environmental and other liabilities and other factors. These assessments are often inexact and subjective. As a result, we may not recover the purchase price of a property from the sale of production from the property or recognize an acceptable return from such sales or operations.
Our ability to achieve the benefits that we expect from an acquisition will also depend on our ability to efficiently integrate the acquired operations. Management may be required to dedicate significant time and effort to the integration process, which could divert its attention from other business opportunities and concerns. The challenges involved in the integration process may include
retaining key employees and maintaining employee morale, addressing differences in business cultures, processes and systems and developing internal expertise regarding acquired properties.
Our future results will suffer if we do not effectively manage our expanded operations.
As a result of our recent acquisitions, the size and geographic footprint of our business has increased. Our future success will depend, in part, upon our ability to manage this expanded business, which may pose substantial challenges for management, including challenges related to the management and monitoring of new operations and basins and associated increased costs and complexity. We may also face increased scrutiny from governmental authorities as a result of the increase in the size of our business. There can be no assurances that we will be successful or that we will realize the expected benefits currently anticipated from our recent acquisitions.
We may incur substantial losses and be subject to substantial liability claims as a result of our oil and natural gas operations, including our drilling operations.
Oil and natural gas exploration, development and production activities are subject to numerous significant operating risks, including the possibility of:
•unanticipated, abnormally pressured formations;
•significant mechanical difficulties, such as stuck drilling and service tools and casing collapses;
•blowouts, fires and explosions;
•personal injuries and death;
•uninsured or underinsured losses; and
•environmental hazards, such as uncontrollable flows of oil, natural gas, brine, well fluids, toxic gas or other pollution into the environment, including groundwater contamination.
Any of these operating hazards could cause damage to properties, reduced cash flows, serious injuries, fatalities, oil spills, discharge of hazardous materials, remediation and clean-up costs and other environmental damages, which could expose us to significant liabilities. We may elect not to obtain insurance for any or all of these risks if we believe that the cost of available insurance is excessive relative to the risks presented. In addition, pollution and environmental risks generally are not fully insurable. The occurrence of an event that is not fully covered by insurance could have a material adverse effect on our business, financial condition and results of operations.
The nature of our business and assets exposes us to significant compliance costs and liabilities.
Our operations involving the exploration, development and production of hydrocarbons are subject to stringent federal, state, and local laws and regulations governing the discharge of materials into the environment as well as protection of the environment, operational safety, and related employee health and safety matters. Laws and regulations applicable to us include those relating but not limited to the following:
land use restrictions;
delivery of our oil and natural gas to market;
drilling bonds and other financial responsibility requirements;
spacing of wells;
air emissions;
property unitization and pooling;
habitat and endangered species protection, reclamation and remediation;
containment and disposal of hazardous substances, oil field waste and other waste materials;
drilling permits;
use of saltwater injection wells, which affects the disposal of saltwater from our wells;
safety precautions;
prevention of oil spills;
operational reporting; and
taxation and royalties.
Compliance with these laws and regulations is a significant cost of doing business. Failure to comply with applicable laws and regulations may result in the assessment of administrative, civil, and criminal penalties; the imposition of investigatory and remedial liabilities; the issuance of injunctions that may restrict, inhibit or prohibit our operations; and claims of damages to property or persons.
Some environmental laws and regulations impose strict liability, which means that in some situations we could be exposed to liability for clean-up costs and other damages as a result of conduct that was lawful at the time it occurred or for the conduct of
prior operators of properties we acquired or of other third parties. Similarly, some environmental laws and regulations impose joint and several liability, meaning that we could be held responsible for more than our share of a particular reclamation or other obligation, and potentially the entire obligation, where other parties were involved in the activity giving rise to the
liability. In addition, we may be required to make large and unanticipated capital expenditures to comply with applicable laws and regulations, for example by installing and maintaining pollution control devices. Similarly, our actual plugging and abandonment obligations may be more than our estimates. It is not possible for us to estimate reliably the amount and timing of all future expenditures related to environmental matters, but we estimate that they will be material. Environmental risks are generally not fully insurable.
Federal, state and local legislation and regulatory initiatives relating to hydraulic fracturing could result in increased costs and additional operating restrictions or delays.
We engage third parties to provide hydraulic fracturing or other well stimulation services to us in connection with many of the wells for which we are the operator. Federal, state and local governments have been adopting or considering restrictions on or prohibitions of fracturing in areas where we currently conduct operations, or in the future plan to conduct operations. Consequently, we could be subject to additional levels of regulation, operational delays or increased operating costs and could have additional regulatory burdens imposed upon us that could make it more difficult to perform hydraulic fracturing and increase our costs of compliance and doing business.
From time to time, for example, legislation has been proposed in Congress to amend the SDWA to require federal permitting of hydraulic fracturing and the disclosure of chemicals used in the hydraulic fracturing process. Further, the EPA completed a study finding that hydraulic fracturing could potentially harm drinking water resources under adverse circumstances such as injection directly into groundwater or into production wells lacking mechanical integrity. Other governmental reviews have also been recently conducted or are under way that focus on environmental aspects of hydraulic fracturing. At this time, it is uncertain when, or if, the rules will be implemented, and what impact they would have on our operations. Further, legislation to amend the SDWA to repeal the exemption for hydraulic fracturing (except when diesel fuels are used) from the definition of “underground injection” and require federal permitting and regulatory control of hydraulic fracturing, as well as legislative proposals to require disclosure of the chemical constituents of the fluids used in the fracturing process, have been proposed in recent sessions of Congress. Several states and local jurisdictions in which we operate also have adopted or are considering adopting regulations that could restrict or prohibit hydraulic fracturing in certain circumstances, impose more stringent operating standards and/or require the disclosure of the composition of hydraulic fracturing fluids.
We may be subject to regulation that restricts our ability to discharge water produced as part of our oil, natural gas and NGL production operations. Productive zones frequently contain water that must be removed for the oil, natural gas and NGL to produce, and our ability to remove and dispose of sufficient quantities of water from the various zones will determine whether we can produce oil, natural gas and NGL in commercial quantities. The produced water must be transported from the leasehold and/or injected into disposal wells. The availability of disposal wells with sufficient capacity to receive all of the water produced from our wells may affect our ability to produce our wells. Also, the cost to transport and dispose of that water, including the cost of complying with regulations concerning water disposal, may reduce our profitability. We have entered into various water management services agreements in Texas and New Mexico which provide for the disposal of our produced water by established counterparties with large integrated pipeline networks. If these counterparties fail to perform, we may have to shut in wells, reduce drilling activities, or upgrade facilities for water handling or treatment. The costs to dispose of this produced water may increase for a number of reasons, including if new laws and regulations require water to be disposed in a different manner.
More recently, federal and state governments have begun investigating whether the disposal of produced water into underground injection wells has caused increased seismic activity in certain areas. States such as Texas and New Mexico have adopted, or are considering adopting, laws and regulations that may restrict or prohibit oilfield fluid disposal in certain areas or underground disposal wells, and state agencies implementing those requirements may issue orders directing certain wells in areas where seismic incidents have occurred to restrict or suspend disposal well operations or impose standards related to disposal well construction and monitoring. For example, the RRC recently issued a notice to operators in December 2016, the EPA released its final report regardingMidland area to reduce daily injection volumes following multiple earthquakes above a 3.5 magnitude over an 18-month period. The notice also required disposal well operators to provide injection data to RRC staff to further analyze seismicity in the potential impactsarea. In 2021, the NMOCD announced a new plan for responding to increased seismic activity in the Permian Basin. Under the new plan, pending permits for wastewater injection in certain areas will be subject to additional reporting and monitoring requirements. While we cannot predict the ultimate outcome of hydraulic fracturing on drinking water resources, concludingthis notice, any action that “water cycle” activities associated with hydraulic fracturing may impact drinking water resources under certain circumstances such as water withdrawalstemporarily or permanently restricts the availability of disposal capacity for fracturing in times or areas of low water availability, surface spills during the management of fracturing fluids, chemicals or produced water injection of fracturingor other fluids into wells with inadequate mechanical integrity, injection of fracturing fluids directly into groundwater resources, discharge of inadequately treated fracturing wastewater to surface waters, and disposalmay increase our costs or storage of fracturing wastewater in unlined pits. The results of these studies could lead federal and state governments and agencies to develop and implement additional regulations. In addition,have other adverse impacts on June 28, 2016, the EPA published a final rule prohibiting the discharge of wastewater from onshore unconventional oil and natural gas extraction facilities to publicly owned wastewater treatment plants. The EPA is also conducting a study of private wastewater treatment facilities (also known as centralized waste treatment (“CWT”) facilities) accepting oil and natural gas extraction wastewater. The EPA is collecting data and information related to the extent to which CWT facilities accept such wastewater, available treatment technologies (and their associated costs), discharge characteristics, financial characteristics of CWT facilities, and the environmental impacts of discharges from CWT facilities.our operations.
The proliferation of regulations may limit our ability to operate. If the use of hydraulic fracturing is limited, prohibited or subjected to further regulation, these requirements could delay or effectively prevent the extraction of oil and natural gas from formations which would not be economically viable without the use of hydraulic fracturing. This could have a material adverse effect on our business, financial condition, results of operations and cash flows.
Extreme weather conditions, which could become more frequent or severe due to climate change, could adversely affect our ability to conduct drilling, completion and production activities in the areas where we operate.
Our exploitation and development activities and equipment could be adversely affected by extreme weather conditions, such as hurricanes or freezing temperatures, which may cause a loss of production from temporary cessation of activity from regional power outages or lost or damaged facilities and equipment. Such extreme weather conditions could also impact access to our drilling and production facilities for routine operations, maintenance and repairs and the availability of and our access to, necessary third-party services, such as gathering, processing, compression and transportation services. These constraints and the
resulting shortages or high costs could delay or temporarily halt our operations and materially increase our operation and capital costs, which could have a material adverse effect on our business, financial condition and results of operations.
ClimateOur operations are subject to a series of risks arising out of the threat of climate change legislation or regulations restricting emissions of "greenhouse gases"that could result in increased operating costs, limit the areas in which we may conduct oil, natural gas and reducedNGL exploration and production activities, and reduce demand for the oil, natural gas and natural gas liquidsNGL we produce.
The threat of climate change continues to attract considerable attention in the United States and in foreign countries. Numerous proposals have been made and could continue to be made at the international, national, regional and state levels of government to monitor and limit existing emissions of GHGs as well as to restrict or eliminate such future emissions. As a result, our operations as well as the operations of our oil and natural gas exploration and production customers are subject to a series of regulatory, political, litigation, and financial risks associated with the production and processing of fossil fuels and emission of GHGs.
In the United States, no comprehensive climate change legislation has been implemented at the federal level. However, following the U.S. Supreme Court finding that GHG emissions constitute a pollutant under the Clean Air Act,CAA, the EPA has adopted regulations that, among other things, establish construction and operating permit reviews for GHG emissions from certain large stationary sources, require the monitoring and annual reporting of GHG emissions from certain petroleum and natural gas system sources in the United States, implement New Source Performance Standards directing the reduction of methane from certain new, modified, or reconstructed facilities in the oil and natural gas sector, and together with the DOT, implement GHG emissions limits on vehicles manufactured for operation in the United States. Additionally, various statesThe federal regulation of methane from oil and groupsgas facilities has been subject to uncertainty in recent years. In September 2020, the Trump Administration revised prior regulations to rescind certain methane standards and remove the transmission and storage segments from the source category for certain regulations. However, shortly after taking office, President Biden issued an executive order directing all federal agencies to review and take action to address any federal regulations, orders, guidance documents, policies and similar agency actions promulgated during the prior administration that may be inconsistent with the current administration’s policies. In response, the U.S. Congress has approved, and President Biden has signed into law, a resolution under the Congressional Review Act to repeal the September 2020 revisions to the methane standards, effectively reinstating the prior standards. In November 2021, as required by President Biden’s executive order, the EPA proposed new regulations to establish comprehensive standards of states have adoptedperformance and emission guidelines for methane and volatile organic compound emissions from existing operations in the oil and gas sector, including the exploration and production, transmission, processing, and storage segments. The EPA is currently seeking public comments on its proposal, which the EPA hopes to finalize by the end of 2022. Once finalized, the regulations will also need to be incorporated in state implementation plans and approved by EPA. However, all of these regulatory actions will likely be subject to legal challenges. As a result, we cannot predict the scope of any final methane regulatory requirements or are considering adopting legislation,the cost to comply with such requirements. However, given the long-term trend toward increasing regulation, future federal GHG regulations or other regulatory initiatives that are focused on such areas as GHG capof the oil and trade programs, carbon taxes, reporting and tracking programs, and restriction of emissions. At the international level, there is an agreement, the United Nations-sponsored “Paris Agreement,” for nations to limit their GHG emissions through non-binding, individually-determined reduction goals every five years after 2020, although the United States has announced its withdrawal from such agreement, effective November 4, 2020.gas industry remain a significant possibility.
Governmental, scientific, and public concern over the threat of climate change arising from GHG emissions has resulted in increasing political risks in the United States, including climate change related pledges made by certain candidates seekingelected to public office. President Biden has issued several executive orders focused on addressing climate change, including items that may impact our costs to produce, or demand for, oil and gas. Additionally, in November 2021, the office of the PresidentBiden Administration released “The Long-Term Strategy of the United States: Pathways to Net-Zero Greenhouse Gas Emissions by 2050,” which establishes a roadmap to net zero emissions in the United States in 2020. Two critical declarations made by one or more candidates running2050 through, among other things, improving energy efficiency; decarbonizing energy sources via electricity, hydrogen, and sustainable biofuels; and reducing non-CO2 GHG emissions, such as methane and nitrous oxide. The Biden Administration is also considering revisions to the leasing and permitting programs for the Democratic nomination for President include threats to take actions banning hydraulic fracturing of oil and natural gas wells and banning new leases for production of mineralsdevelopment on federal properties, including onshore lands and offshore waters. Other actions that could be pursued by presidential candidates may include the imposition of more restrictive requirements for the establishment of pipeline infrastructure or the permitting of LNG export facilities, as well as the reversal of the United States’ withdrawal from the Paris Agreement in November 2020.lands. Litigation risks are also increasing, as a number of cities and other local governmentsentities have sought to bring suit against the largest oil and natural gas exploration and production companies in state or federal court, alleging, among other things, that such companies created public nuisances by producing fuels that contributed to global warming effects,climate change. Suits have also been brought against such as rising sea levels,companies under shareholder and therefore are responsible for roadway and infrastructure damages, orconsumer protection laws, alleging that the companies have been aware of the adverse effects of climate change for some time but defrauded their investors by failingfailed to adequately disclose those impacts.
There are also increasing financial risks for fossil fuel producers as shareholders currently invested in fossil-fuel energy companies concerned about the potential effects of climate change may elect in the future to shift some or all of their investments into non-energy relatedother sectors. Institutional lenders who provide financing to fossil-fuel energy companies also have become more attentive to sustainable lending practices and some of them may elect not to provide funding for fossil fuel energy companies. Additionally,For example, at COP26, the lending practicesGlasgow Financial Alliance for Net Zero (“GFANZ”) announced that commitments from over 450 firms across 45 countries had resulted in over $130 trillion in capital committed to net zero goals. The various sub-alliances of institutional lendersGFANZ generally require participants to set short-term, sector-specific targets to transition their financing, investing, and/or underwriting activities to net zero emissions by 2050. There is also a risk that financial institutions will be required to adopt policies that have been the subjecteffect of intensive lobbying effortsreducing the funding provided to the fossil fuel sector. President Biden signed an executive order calling for the development of a “climate finance plan” and, separately, the Federal Reserve has joined the Network for Greening the Financial System (“NGFS”), a consortium of financial regulators focused on addressing climate-related risks in recent years, oftentimes publicthe financial sector. More recently, in nature, by environmental activists, proponentsNovember 2021, the Federal Reserve issued a statement in support of the international Paris Agreement,efforts of the NGFS to identify key issues and foreign citizenry concerned about climate change notpotential solutions for the climate-related challenges most relevant to provide funding for fossil fuel producers.central banks and supervisory authorities. Limitation of investments in and financings for fossil fuel energy companies could result in the restriction, delay or cancellation of drilling programs or development or production activities.
The adoption and implementation of new or more stringent international, federal or state legislation, regulations or other regulatory initiatives that impose more stringent standards for GHG emissions from the oil and natural gas sector or otherwise
restrict the areas in which this sector may produce oil and natural gas or generate GHG emissions could result in increased costs of compliance or costs of consuming, and thereby reduce demand for, oil and natural gas. Additionally, political, litigation and financial risks may result in us restricting or cancelling production activities, incurring liability for infrastructure damages as a result of climatic changes, or having an impaired ability to continue to operate in an economic manner. One or more of these developments could have a material adverse effect on our business, financial condition and results of operation.operations.
Finally, many scientistsAs a final note, climate change could have concluded that increasing concentrations of GHGs inan effect on the Earth’s atmosphere may produce climate changes that have significant physical effects, such as increased frequency and severity of storms, floodsweather (including hurricanes, droughts and other climatic events.floods), sea levels, the arability of farmland, water availability and quality, and meteorological patterns. If any such effects were to occur, theyour development and production operations have the potential to be adversely affected.
Potential adverse effects could include damages to our facilities from powerful winds, extreme temperatures, or rising waters in low lying areas, disruption of our production activities either because of climate related damages to our facilities or in our costs of operation potentially arising from such climatic effects, less efficient or non- routine operating practices necessitated by climate effects or increased costs for insurance coverage in the aftermath of such effects. Significant physical effects of climate change could also have an indirect effect on our financing and operations by disrupting the transportation or process-related services provided by midstream companies, service companies or suppliers with whom we have a business relationship. Additionally, changing meteorological conditions, particularly temperature, may result in changes to the amount, timing, or location of demand for energy or the products we produce. We may not be able to recover through insurance some or any of the damages, losses or costs that may result from potential physical effects of climate change. At this time, we have not developed a comprehensive plan to address the legal, economic, social or physical impacts of climate change on our operations.
Restrictions on drilling activities intended to protect certain species of wildlife may adversely affect our resultsability to conduct drilling activities in some of operations.the areas where we operate.
Oil and natural gas operations in our operating areas can be adversely affected by seasonal or permanent restrictions on drilling activities designed to protect certain wildlife, such as those restrictions imposed under the federal ESA. Seasonal restrictions may limit our ability to operate in protected areas and can intensify competition for drilling rigs, oilfield equipment, services, supplies and qualified personnel, which may lead to periodic shortages when drilling is allowed. These constraints and the resulting shortages or high costs could delay our operations and materially increase our operating and capital costs. Permanent restrictions imposed to protect endangered species could prohibit drilling in certain areas or require the implementation of expensive mitigation measures. The designation of previously unprotected species in areas where we operate as threatened or endangered could cause us to incur increased costs arising from species protection measures or could result in limitations on our exploration, development and production activities that could have an adverse impact on our ability to develop and produce our reserves.
Our oil, natural gas and natural gas liquidsNGLs are sold in a limited number of geographic markets so an oversupply in any of those areas could have a material negative effect on the price we receive.
Our oil, natural gas and natural gas liquidsNGLs are primarily sold in two geographic markets in Texas and one in New Mexico which each have a fixed amount of storage and processing capacity. As a result, if such markets become oversupplied with oil, natural gas and/or natural gas liquids,
NGLs, it could have a material negative effect on the prices we receive for our products and therefore an adverse effect on our financial condition and results of operations. There is a risk that refining capacity in the U.S. Gulf Coast may be insufficient to refine all of the light sweet crude oil being produced in the United States. If light sweet crude oil production remains at current levels or continues to increase, demand for our light crude oil production could result in widening price discounts to the world crude prices and potential shut-in of production due to a lack of sufficient markets despite the lift on prior restrictions on the exporting of oil and natural gas.
WePotential future legislation or the imposition of new or increased taxes or fees may incur more taxes and certaingenerally affect the taxation of our projects may become uneconomic if certain federal income tax deductions currently available with respect to oil and natural gas exploration and development are eliminated as a result of future legislation.companies and may adversely affect our operations and cash flows.
In past years, federal and state level legislation has been proposed that would, if enacted into law, make significant changes to U.S. tax laws, including to certain key U.S. federal and state income tax provisions currently available to oil and natural gas exploration and development and production companies. For example, President Biden has set forth several tax proposals that would, if enacted into law, make significant changes to U.S. tax laws. Such legislative changes have included,proposals include, but are not limited to, (i) an increase in the repealU.S. income tax rate applicable to corporations and (ii) the elimination of tax subsidies for fossil fuels. Congress could consider some or all of these proposals in connection with tax reform to be undertaken by the percentage depletion allowance forBiden administration. It is unclear whether these or similar changes will be enacted and, if enacted, how soon any such changes could take effect. Additionally, states in which we operate or own assets may impose new or increased taxes or fees on oil and natural gas properties, (ii)extraction. The passage of any legislation as a result of these proposals and other similar changes in federal income tax laws or the eliminationimposition of current deductions for intangible drilling and development costs, (iii) the elimination of the deduction for certain domestic production activities, and (iv) an extension of the amortization period for certain geological and geophysical expenditures. The Tax Cuts and Jobs Act of 2017 (the “TCJA”) did not directly affect deductions currently available to thenew or increased taxes or fees on oil and natural gas industry but any future changes in U.S. federal income tax lawsextraction could eliminate or postpone certain tax deductions that currently are available with respect to oil and natural gas development, or increase costs, and any such changes could have an adverse effect onadversely affect our financial position, results of operations and cash flows.
Our operations are substantially dependent on the availability, use and disposal of water. New legislation and regulatory initiatives or restrictions relating to water disposal wells could have a material adverse effect on our future business, financial condition, operating results and prospects.
Water is an essential component of our drilling and hydraulic fracturing processes. If we are unable to obtain water to use in our operations from local sources, we may be unable to economically produce oil, natural gas and natural gas liquids,NGLs, which could have an adverse effect on our business, financial condition and results of operations. Wastewaters from our operations typically are disposed of via underground injection. Some studies have linked earthquakes in certain areas to underground injection, which is leading to greater public scrutiny of disposal wells. Any new environmental initiatives or regulations that restrict injection of fluids, including, but not limited to, produced water, drilling fluids and other wastes associated with the exploration, development or production of oil and gas, or that limit the withdrawal, storage or use of surface water or ground water necessary for hydraulic fracturing of our wells, could increase our operating costs and cause delays, interruptions or cessation of our operations, the extent of which cannot be predicted, and all of which would have an adverse effect on our business, financial condition, results of operations and cash flows.
Any change to government regulation or administrative practices may have a negative impact on our ability to operate and our profitability.
Oil and natural gas operations are subject to substantial regulation under federal, state and local laws relating to the exploration for, and the development, upgrading, marketing, pricing, taxation, and transportation of, oil and natural gas and related products and other associated matters. Amendments to current laws and regulations governing operations and activities of oil and natural gas exploration and development operations could have a material adverse impact on our business. In addition, there can be no assurance that income tax laws, royalty regulations and government programs related to our oil and natural gas properties and the oil and natural gas industry generally will not be changed in a manner which may adversely affect our progress or cause delays.
Permits, leases, licenses, and approvals are required from a variety of regulatory authorities at various stages of exploration and development. There can be no assurance that the various government permits, leases, licenses and approvals sought will be granted in respect of our activities or, if granted, will not be cancelled or will be renewed upon expiration. There is no assurance that such permits, leases, licenses, and approvals will not contain terms and provisions which may adversely affect our exploration and development activities.
The current presidential administration, acting through the executive branch and/or in coordination with Congress, already has ordered or proposed, and could enact additional rules and regulations that restrict our ability to acquire federal leases in the future.
We are affected by the adoption of laws, regulations and policy directives that, for economic, environmental protection or other policy reasons, could curtail exploration and development drilling for oil and gas. For example, in January 2021, President Biden signed an Executive Order directing the DOI to temporarily pause new oil and gas leases on federal lands and waters pending completion of a comprehensive review of the federal government’s existing oil and gas leasing and permitting program. In June 2021, a federal district court enjoined the DOI from implementing the pause and leasing resumed, although litigation over the leasing pause remains ongoing. In February 2022, another judge ruled that the Biden Administration’s efforts to raise the cost of climate change in its environmental assessments, would increase energy costs and damage state revenues from energy production. This ruling has cause federal agencies to delay issuing new oil and gas leases and permits on federal lands and waters.
The marketability of our production is dependent upon gathering systems, transportation facilities and processing facilities that we do not own or control. If these facilities or systems are unavailable, our oil and natural gas production can be interrupted and our revenues reduced.
The marketability of our oil and natural gas production is dependent upon the availability, proximity and capacity of pipelines, natural gas gathering systems, transportation and processing facilities owned by third parties. In general, we will not control these facilities, and our access to them may be limited or denied due to circumstances beyond our control. A significant disruption in the availability of these facilities could adversely impact our ability to deliver to market the hydrocarbons we produce and thereby cause a significant interruption in our operations. In some cases, our ability to deliver to market our hydrocarbons is dependent upon coordination among third parties that own transportation and processing facilities we use, and any inability or unwillingness
of those parties to coordinate efficiently could also interrupt our operations. The lack of availability or the lack of capacity on these systems and facilities could result in the curtailment of production or the delay or discontinuance of drilling plans. This is more likely in areas with recent increased production, such as our Permian Basin area where we have significant development activities. These are risks for which we generally will not maintain insurance.
We operate or participate in oil and natural gas leases with third parties who may not be able to fulfill their commitments to our projects.
In some cases, we operate but own less than 100% of the working interest in the oil and natural gas leases on which we conduct operations, and other parties own the remaining portion of the working interest. Financial risks are inherent in any operation where the cost of drilling, equipping, completing and operating wells is shared by more than one person. We could be held liable for joint activity obligations of other working interest owners, such as nonpayment of costs and liabilities arising from the actions of other working interest owners. In addition, declines in oil, natural gas and natural gas liquidsNGL prices may increase the likelihood that some of these working interest owners, particularly those that are smaller and less established, are not able to fulfill their joint activity obligations. A partner may be unable or unwilling to pay its share of project costs, and, in some cases, a partner may declare bankruptcy. In the event any of our project partners do not pay their share of such costs, we would likely have to pay those costs, and we may be unsuccessful in any efforts to recover these costs from our partners, which could materially adversely affect our financial position.
Use of debt financing may adversely affect our strategy.strategy and financial viability.
We may useincur substantial additional debt to fund a portion of our future acquisition, development and/or operating activities. Any temporary or sustained inability to service or repay such debt will likely have a material adverse effect on our ability to access financing markets and pursue our operating strategies, as well as impair our ability to respond to adverse economic changes in oil and natural gas markets and the economy in general.
Non-operated properties are controlled by third parties that may not allow us to proceed with our planned capital expenditures. Activities on our operated properties could also be limited or subject to penalties.
We currently are not the operator of some of our existing properties and, therefore, may not be able to influence production operations or further development activities. Joint ownership is customary in the oil and natural gas industry and is generally conducted under the terms of a joint operating agreement (“JOA”), where one of the working interest owners is designated as the “operator” of the property. For non-operated properties, subject to the specific terms and conditions of the applicable JOA, if we disagree with the decision of a majority of working interest owners, we may be required, among other things, to postpone proposed activity or decline to participate in drilling and completing of wells. If we decline to participate, we might be forced to relinquish our interest through “in-or-out” elections or may be subject to certain non-consent penalties, as provided in a JOA. In-or-out elections may require a joint owner to participate or forever relinquish its position, typically only in specific wells or drilling units, although such relinquished positions could be of a larger scope. Non-consent penalties typically allow participating working interest owners to recover from the proceeds of production, if any, an amount equal to 200% to 500% of the non-participating working interest owner’s share of the cost of such operations. Further, even for properties operated by us, there may be instances where decisions related to drilling, completion and operating cannot be made in our sole discretion. In such instances, we could be limited in our development operations and subject to penalties as specified above if we choose not to participate in operations proposed by a majority of working interest owners.
Because we cannot control activities on properties we do not operate, we cannot directly control the timing of exploitation. If we are unable to fund required capital expenditures with respect to non-operated properties, our interests in those properties may be reduced or forfeited.
Our ability to exercise influence over operations and costs for the properties we do not operate is limited. Our dependence on the operatoroperators and other working interest owners for these projects and our limited ability to influence operations and associated costs could prevent the realization of our targeted returns on capital with respect to acquisition, exploration orand development activities. The success and timing of development, exploitation orand exploration activities on properties operated by others depend upon a number of factors that may be outside our control, including but not limited to:
the timing and amount of capital expenditures;
the operator’s expertise and financial resources;
the approval of other participants in drilling wells; and
the selection of technology.
Where we are not the majority owner or operator of a particular oil and natural gas project, we may have no control over the timing or amount of capital expenditures associated with the project. If we are not willing or able to fund required capital expenditures relating to a project when required by the majority owner(s) or operator, our interests in the project may be reduced or forfeited. Also, we could be responsible for plugging and abandonment costs, as well as other liabilities in excess of our proportionate interest in the property.
A cyber incident could result in information theft, data corruption, operational disruption and/or financial loss.
The oil and natural gas industry has become increasingly dependent on digital technologies to conduct day-to-day operations including certain exploration, development and production activities. For example, software programs are used to interpret seismic data, manage drilling rigs, production equipment and gathering and transportation systems, as well as conduct reservoir modeling and reserve estimation for compliance reporting.
We are dependent on digital technologies including information systems and related infrastructure, to process and record financial and operating data, communicate with our employees, business partners, and stockholders, analyze 3-D seismic and drilling information, estimate quantities of oil and natural gas reserves as well as other activities related to our business. Our business partners, including vendors, service providers, purchasers of our production and financial institutions are also dependent on digital technology. The technologies needed to conduct oil and natural gas exploration, development and production activities make certain information the target of theft or misappropriation.
As dependence on digital technologies has increased, cyber incidents, including deliberate attacks or unintentional events, have also increased. A cyber-attack could include gaining unauthorized access to digital systems for the purposes of misappropriating assets or sensitive information, corrupting data, causing operational disruption, or result in denial-of-service on websites.
Our technologies, systems, networks, and those of our business partners may become the target of cyber-attacks or information security breaches that could result in the unauthorized release, gathering, monitoring, misuse, loss or destruction of proprietary and other information, or other disruption of our business operations. In addition, certain cyber incidents, such as surveillance, may remain undetected for an extended period of time. In particular, our implementation of various procedures and controls to monitor and mitigate security threats and to increase security for our information, data, facilities and infrastructure may result in increased capital and operating costs. Costs for insurance may also increase as a result of security threats, and some insurance coverage may become more difficult to obtain, if available at all. Moreover, there can be no assurance that such procedures and controls will be sufficient to prevent security breaches from occurring. As cyber threats continue to evolve, we may be required to expend significant additional resources to continue to modify or enhance our protective measures or to investigate and
remediate any information security vulnerabilities. A cyber incident involving our information systems and related infrastructure, or that of our business partners, could disrupt our business plans and negatively impact our operations.
We are subject to litigation relating to Bold and the Bold Transaction, and we may be subject to additional litigation, any of which could adversely affect our business, financial condition and operating results.
Olenik v. Lodzinski et al.:On June 2, 2017, Nicholas Olenik filed a purported shareholder class and derivative action in the Delaware Court of Chancery against Earthstone’s Chief Executive Officer, along with other members of the Board, EnCap Investments L.P. (“EnCap”), Bold Energy III LLC (“Bold”), Bold Energy Holdings, LLC (“Bold Holdings”) and Oak Valley Resources, LLC. The complaint alleges that Earthstone’s directors breached their fiduciary duties in connection with the contribution agreement dated as of November 7, 2016 and as amended on March 21, 2017 (the “Bold Contribution Agreement”), by and among Earthstone, EEH, Lynden US, Lynden USA Operating, LLC, Bold Holdings and Bold. The Plaintiff asserts that the directors negotiated the business combination pursuant to the Bold Contribution Agreement (the “Bold Transaction”) to benefit EnCap and its affiliates, failed to obtain adequate consideration for the Earthstone shareholders who were not affiliated with EnCap or Earthstone management, did not follow an adequate process in negotiating and approving the Bold Transaction and made materially misleading or incomplete proxy disclosures in connection with the Bold Transaction. The suit seeks unspecified damages and purports to assert claims derivatively on behalf of Earthstone and as a class action on behalf of all persons who held Common Stock up to March 13, 2017, excluding defendants and their affiliates. On July 20, 2018, the Delaware Court of Chancery granted the defendants’ motion to dismiss and entered an order dismissing the action in its entirety with prejudice. The Plaintiff filed an appeal with the Delaware Supreme Court. On February 6, 2019, the Delaware Supreme Court heard oral arguments from the Plaintiff’s and Defendants’ counsel. On April 5, 2019, the Delaware Supreme Court affirmed the Delaware Court of Chancery’s dismissal of the proxy disclosure claims but reversed the Delaware Court of Chancery’s dismissal of the other claims, holding that the allegations with respect to those claims were sufficient for pleading purposes. Earthstone and each of the other defendants believe the claims are entirely without merit and intend to mount a vigorous defense. The ultimate outcome of this suit is uncertain, and while Earthstone is confident in its position, any potential monetary recovery or loss to Earthstone cannot be estimated at this time.
The loss or unavailability of any of our executive officers or other key employees could have a material adverse effect on our business.
We depend greatly on the efforts of our executive officers and other key employees to manage our operations. The loss or unavailability of any of our executive officers or other key employees could have a material adverse effect on our business.
Risks Related to the Bighorn Acquisition
Delays in completing the Bighorn Acquisition may substantially reduce the expected benefits of the Bighorn Acquisition.
Satisfying the conditions to, and completion of, the Bighorn Acquisition may take longer than, and could cost more than, we expect. Any delay in completing the Bighorn Acquisition or any additional conditions imposed in order to complete the Bighorn Acquisition may materially adversely affect the synergies and other benefits that we expect to achieve from the Bighorn Acquisition and the integration of the respective business. In addition, each of EEH and Bighorn has the right to terminate the Bighorn Agreement if the Bighorn Acquisition is not completed by May 16, 2022, subject to a limited right to extend the closing until July 13, 2022.
We may be unable to successfully integrate Bighorn’s operations or to realize anticipated cost savings, revenues or other benefits of the Bighorn Acquisition.
Our ability to achieve the anticipated benefits of the Bighorn Acquisition, if consummated, will depend in part upon whether we can successfully integrate Bighorn’s assets and operations into our existing business in a timely, efficient and effective manner. The beneficial acquisition of producing and non-producing properties and undeveloped acreage that can be economically developed, including the assets acquired from Bighorn, requires an assessment of several factors, including:
•recoverable reserves;
•future natural gas and oil prices and their appropriate differentials;
•availability and cost of transportation of production to markets;
•availability and cost of drilling equipment and of skilled personnel;
•development and operating costs and potential environmental and other liabilities; and
•regulatory, permitting and similar matters.
The accuracy of these assessments is inherently uncertain. In connection with these assessments, we have performed, and will continue to perform, a review of the subject properties, including properties that are subject to certain customary acreage swaps in process, that we believe to be generally consistent with industry practices. Our review may not reveal all existing or potential problems or permit us to become sufficiently familiar with the properties to fully assess their deficiencies and potential recoverable reserves. Inspections will not always be performed on every well, and environmental problems are not necessarily observable even when an inspection is undertaken. Even if problems are identified, the contractual protection provided with respect to all or a portion of the underlying deficiencies may prove ineffective or insufficient. The integration process may be subject to delays or changed circumstances, and we can give no assurance that the acquired properties will perform in accordance with our expectations or that our expectations with respect to integration or cost savings as a result of the Bighorn Acquisition will materialize. Significant acquisitions, including the Bighorn Acquisition, and other strategic transactions may involve other risks that may cause negative impacts on our business, including:
•diversion of our management’s attention to evaluating, negotiating and integrating significant acquisitions and strategic transactions;
•the challenge and cost of integrating acquired assets and operations with those of our existing assets and operations while carrying on our ongoing business; and
•the failure to realize the full benefit that we expect in estimated proved reserves, production volume, cost savings from operating synergies or other benefits anticipated from an acquisition, or to realize these benefits within the expected time frame.
We will only have limited recourse against Bighorn regarding the properties acquired in the Bighorn Acquisition for losses and liabilities arising or discovered after closing.
Under the terms of the Bighorn Agreement, we will have only limited recourse against Bighorn for losses and liabilities arising or discovered after the closing of the Bighorn Acquisition. We have limited indemnification rights in the event of a breach of a representation or warranty by Bighorn, any environmental defect, a breach of a covenant by Bighorn and certain third-party costs related to title defects. We also have limited rights to assert title defects or environmental defects, and any claims for title defects which were not timely asserted by us by March 16, 2022 have been deemed waived. As is customary in oil and gas transactions, we have agreed to assume various liabilities associated with the Bighorn Acquisition, including environmental liabilities, plugging and abandonment obligations, and unpaid royalties, regardless of when such liabilities arose.
The representations and warranties provided by Bighorn are limited as to scope and in many cases, qualified by knowledge and materiality thresholds. We must bring any claims for indemnification for a breach of a representation or warranty not involving title defects within the time period after the closing specified in the Bighorn Agreement, and for many representations and warranties, this time period is limited to 12 months.
Indemnification claims are subject to an individual claim threshold of $100,000 and Bighorn is only required to indemnify us for claims totaling in excess of 2% of the purchase price, or approximately $17 million based on a $850 million purchase price for the Bighorn Agreement. In addition, our right of recovery in most circumstances is limited to $63.8 million. We have conducted, and will continue to conduct prior to closing, an investigation of the properties to be acquired in the Bighorn Acquisition, but our investigation may not uncover all events or conditions that might negatively affect the value of the assets within such time periods. The total amount of uncured title defect claims or unremedied environmental claims must be more than 2.5% of the purchase price, or $21.3 million, respectively, before we will be entitled to a downward adjustment to the purchase price consideration for either type of claim. The short period for asserting claims for indemnification increases the likelihood that we may incur or uncover liabilities for which we have no recourse.
In addition, we may be obligated to complete the closing of the Bighorn Acquisition, even if Bighorn may have breached certain representations, warranties or covenants, as long as the breaches do not result in a material adverse effect with respect to the properties to be acquired in the Bighorn Acquisition. In such instance, our post-closing right to indemnification for such breaches by Bighorn may be very limited, as described above.
We have incurred and expect to continue to incur significant transaction and acquisition-related costs in connection with the Bighorn Acquisition.
We have incurred and expect to continue to incur significant non-recurring expenses in connection with the Bighorn Agreement and consummation of the Bighorn Acquisition and related financings. Additional unanticipated costs may be incurred, including, without limitation, unexpected costs and other expenses in the course of the integration of the businesses of Earthstone and Bighorn. In addition, we cannot be certain that the elimination of duplicative costs or the realization of other efficiencies related to the integration of the two businesses will offset the integration costs in the near term, or at all.
We will be subject to various uncertainties and contractual restrictions while the Bighorn Acquisition is pending that could adversely affect our financial results.
Uncertainty about the effect of the Bighorn Acquisition on employees, service providers, suppliers and industry partners may have an adverse effect on us, and potentially on Bighorn’s operations. These uncertainties may impair our ability to attract, retain and motivate key personnel until the Bighorn Acquisition is completed and for a period of time thereafter, and could cause service providers, suppliers and others who deal with Bighorn to seek to change their existing business relationships. Employee retention and recruitment may be particularly challenging prior to completion of the Bighorn Acquisition, as employees and prospective employees may experience uncertainty about their future roles with the combined company.
The pursuit of the Bighorn Acquisition and the preparation for the integration of the businesses of the two companies will place a significant burden on our management and internal resources. Any significant diversion of management attention away from ongoing business and any difficulties encountered in the transition and integration process could adversely affect our financial results or the financial results of the combined company.
We may be the target of securities class action and derivative lawsuits which could result in substantial costs and may delay or prevent the Bighorn Acquisition from being completed.
Securities class action lawsuits and derivative lawsuits are often brought against public companies that have entered into significant acquisition agreements. Even if the lawsuits are without merit, defending against these claims can result in substantial costs and divert management time and resources. An adverse judgment could result in monetary damages, which could have a negative impact on our liquidity and financial condition. Any such lawsuit could also seek, among other things, injunctive relief or other equitable relief, including a request to rescind parts of the Bighorn Agreement already implemented
and to otherwise enjoin the parties from consummating the Bighorn Acquisition. If a plaintiff is successful in obtaining an injunction prohibiting completion of the Bighorn Acquisition, then that injunction may delay or prevent the Bighorn Acquisition from being completed, which may adversely affect our business, financial position and results of operation.
One of the conditions to the closing of the Bighorn Acquisition is that no injunction by any court or other tribunal of competent jurisdiction has been entered and continues to be in effect and no law has been adopted or is effective, in either case that prohibits or makes illegal the closing of the Bighorn Acquisition. Consequently, if a lawsuit is filed and a plaintiff is successful in obtaining an injunction prohibiting completion of the Bighorn Acquisition, then that injunction may delay or prevent the Bighorn Acquisition from being completed within the expected timeframe or at all, which may adversely affect our business, financial position and results of operations.
We expect to incur substantial indebtedness in connection with the Bighorn Acquisition, which combined with our current debt may limit our financial flexibility and adversely affect our financial results.
Under the Bighorn Agreement, we have agreed to pay $770 million of the purchase price in cash. As of December 31, 2021, after giving effect to the Chisholm Acquisition and the Bighorn Acquisition, we would have had approximately $1.094 billion of total long-term debt and additional borrowing capacity of approximately $231 million under our senior secured revolving credit facility, assuming that the borrowing base is increased to $1.325 billion upon the closing of the Bighorn Acquisition.
Any increase in our indebtedness could have adverse effects on our financial condition and results of operations, including:
•increasing the difficulty of satisfying our obligations with respect to our debt obligations;
•diverting a significant portion of our cash flows to service our indebtedness, which could reduce the funds available to us for operations and other purposes;
•increasing our vulnerability to general adverse economic and industry conditions;
•placing us at a competitive disadvantage compared to our competitors that are less leveraged and, therefore, may be able to take advantage of opportunities that we would be unable to pursue due to our indebtedness;
•limiting our ability to access the capital markets to raise capital on favorable terms;
•impairing our ability to obtain additional financing in the future for working capital, capital expenditures, acquisitions, general corporate or other purposes; and
•increasing our vulnerability to interest rate increases, as our borrowings under our senior secured revolving credit facility are at variable interest rates.
A high level of indebtedness increases the risk that we may default on our debt obligations. Our ability to meet our debt obligations and to reduce our level of indebtedness depends on our future performance. Our future performance depends on many factors independent of the Bighorn Acquisition, some of which are beyond our control, such as general economic conditions and oil and natural gas prices. We may not be able to generate sufficient cash flows to pay the interest on our debt, and future working capital, borrowings or equity financing may not be available to pay or refinance such debt.
Risks Related to the Ownership of our Class A Common Stock
We are a holding company and the sole manager of EEH. Our only material asset is our equity interest in EEH and, accordingly, we are dependent upon distributions from EEH to cover our corporate and other overhead expenses and pay taxes.
We are a holding company and the sole manager of EEH. We have no material assets other than our equity interest in EEH. We have no independent means of generating revenue. We expect EEH to reimburse us for our corporate and other overhead expenses, and to the extent EEH has available cash, we intend to cause EEH to make distributions to the holders of membership units of EEH (“EEH Units”), including us, as well as our wholly owned subsidiaries, Lynden Corp and Lynden US, in an amount sufficient to cover all applicable U.S. federal, state and local income taxes and non-U.S. tax liabilities of Earthstone, Lynden Corp and Lynden US, if any, at assumed tax rates. We will likely be limited, however, in our ability to cause EEH and its subsidiaries to make these and other distributions due to the restrictions under the Credit Agreement. To the extent that we need funds, and EEH or its subsidiaries are restricted from making such distributions under applicable law or regulation or under the terms of their financing arrangements, or are otherwise unable to provide such funds, it could materially adversely affect our liquidity and financial condition.
We are a “controlled company” within the meaning of the NYSE rules and, as a result, qualify for and rely on exemptions from certain corporate governance requirements.
EnCap controls a majority of the combined voting power of all classes of our outstanding voting stock. As a result, we are a controlled company within the meaning of the NYSE corporate governance standards. Under the NYSE rules, a company of which more than 50% of the voting power is held by another person or group of persons acting together is a controlled company and may elect not to comply with certain NYSE corporate governance requirements, including the requirements that:
a majority of the board of directors consist of independent directors;
the nominating and governance committee be composed entirely of independent directors with a written charter addressing the committee’s purpose and responsibilities; and
the compensation committee be composed entirely of independent directors with a written charter addressing the committee’s purpose and responsibilities.
These requirements will not apply to us as long as we remain a controlled company. Accordingly, you may not have the same protections afforded to stockholders of companies that are subject to all of the corporate governance requirements of the NYSE.
Our principal stockholders hold a substantial majority of the voting power of our Class A Common Stock and Class B Common Stock.
Holders of Class A Common Stock and our Class B Common Stock, $0.001 par value per share (“Class B Common Stock”), will vote together as a single class on all matters presented to our stockholders for their vote or approval, except as otherwise required by applicable law or ourEarthstone's Third Amended and Restated Certificate of Incorporation.Incorporation, as amended (the “Certificate of Incorporation”). Subsequent to the IRM Acquisition and the Chisholm Acquisition, EnCap and the Warburg Parties may be deemed to beneficially own approximately 60.6%38.0% and 21.4%, respectively, of our voting interests. As a significant stockholder, EnCapinterests and, certain of itsalong with their affiliates, could limit the ability of our other stockholders to approve transactions they may deem to be in the best interests of our Company or delaying or preventing changes in control or changes in our management.
As long as EnCap and certain of its affiliates and the Warburg Parties continue to control a significant amount of our outstanding voting securities, they will have the authority to exercise significant influence over management and all matters requiring stockholder approval, regardless of whether or not other stockholders believe that a potential transaction is in their own best interests. Also, in any of these matters, the interests of our management team may differ or conflict with the interests of our stockholders. In addition, EnCap and its affiliates and the Warburg Parties may, from time to time, acquire interests in businesses that directly or indirectly compete with our business, as well as businesses that are significant existing or potential acquisition candidates or industry partners. EnCap and its affiliates and the Warburg Parties may acquire or seek to acquire assets that we seek to acquire and, as a result, those acquisition opportunities may not be available to us or may be more expensive for us to pursue. Moreover, this concentration of stock ownership may also adversely affect the trading price of our Class A Common Stock to the extent investors perceive a disadvantage in owning stock of a company with stockholders who own such a controlling stockholder.significant percentage of our voting securities.
Bold Holdings (controlled by EnCap) and its permitted transferees have the right to exchange their EEH Units and shares of Class B Common Stock for our Class A Common Stock pursuant to the terms of the EEH LLC Agreement.
As of March 1, 2022, there were approximately 34.3 million shares of our Class A Common Stock that are issuable upon redemption or exchange of EEH Units and shares of Class B Common Stock that are held by Bold Holdings, an investment fund managed by EnCap, or its permitted transferees. Pursuant to the First Amended and Restated Limited Liability Company Agreement of EEH (the “EEH LLC Agreement”), subject to certain restrictions therein, holders of EEH Units and our Class B Common Stock are entitled to exchange such EEH Units and shares of Class B Common Stock for shares of our Class A Common Stock at any time.
Future sales of our Class A Common Stock in the public market, or the perception that such sales may occur, could reduce our stock price, and any additional capital raised by us through the sale of equity may dilute your ownership in us.
We may sell additional shares of Class A Common Stock or securities convertible into shares of our Class A Common Stock in subsequent offerings. WePursuant to the Securities Purchase Agreement, Earthstone has agreed to issue 280,000 shares of Preferred Stock which will convert into approximately 25.2 million shares of Class A Common Stock automatically on the 20th calendar day after Earthstone mails a definitive information statement to holders of its Common Stock notifying them that holders of a majority of the outstanding shares of Common Stock have consented to the conversion feature of the Preferred Stock and the issuance of Class A Common Stock upon conversion of the Preferred Stock. Additionally, we cannot predict the size of other future issuances of our Class A Common Stock or other securities convertible into Class A Common Stock or the effect, if any, that future issuances and sales of shares of our Class A Common Stock will have on the market price of our Class A Common Stock. Sales of substantial amounts of our Class A Common Stock (including shares issued in connection with an acquisition), or the perception that such sales could occur, may adversely affect prevailing market prices of our Class A Common Stock.
Bold Holdings and its permitted transferees have the right to exchange their EEH Units and shares of Class B Common Stock for our Class A Common Stock pursuant to the terms of the EEH LLC Agreement.
As of March 1, 2020, there were approximately 35.2 million shares of our Class A Common Stock that are issuable upon redemption or exchange of EEH Units and shares of Class B Common Stock that are held by Bold Holdings, a fund managed by EnCap, or its permitted transferees. Pursuant to the First Amended and Restated Limited Liability Company Agreement of EEH (the “EEH LLC Agreement”), subject to certain restrictions therein, holders of EEH Units and our Class B Common Stock are entitled to exchange such EEH Units and shares of Class B Common Stock for shares of our Class A Common Stock at any time. We also entered into a registration rights agreement pursuant to which the shares of Class A Common Stock which may be issued upon redemption or exchange of EEH Units and shares of Class B Common Stock, subject to certain limitations set forth therein, have been registered for subsequent offers and sales by Bold Holdings and its permitted transferees.
We have no plans to pay dividends on our Class A Common Stock. Stockholders may not receive funds without selling their shares.
We do not anticipate paying any cash dividends on our Class A Common Stock in the foreseeable future. We currently intend to retain future earnings, if any, to finance the expansion of our business. Our future dividend policy is within the discretion of our Board and will depend upon various factors, including our business, financial condition, results of operations, capital requirements, and investment opportunities. In addition, the Credit Agreement does not allow EEH to make any significant payments to us, which makes it highly unlikely that we would be in a position to pay cash dividends on our Class A Common Stock.
Our Board of Directors can, without stockholder approval, cause preferred stock to be issued on terms that could adversely affect our common stockholders.
Under our Third Amended and Restatedthe Certificate of Incorporation, our Board is authorized to cause Earthstone to issue up to 20,000,000 shares of preferred stock, of which none are issued and outstanding as of the date of this report.report; provided, however, we have agreed to issue 280,000 shares of Preferred Stock upon the closing of the Securities Purchase Agreement. Each share of Preferred Stock will be convertible into 90.0900900900901 shares of Class A Common Stock or an aggregate of approximately 25.2 million shares of Class A Common Stock. Also, our Board, without stockholder approval, may determine the price, rights, preferences,
privileges, and restrictions, including voting rights, of those shares. If the Board causes shares of preferred stock to be issued, the rights of the holders of our Class A Common Stock and Class B Common Stock would likely be subordinate to those of preferred holders and therefore could be adversely affected. The Board’s ability to determine the terms of preferred stock and to cause its issuance, while providing desirable flexibility in connection with possible acquisitions and other corporate purposes, could have the effect of making it more difficult for a third partythird-party to acquire a majority of our outstanding voting stock or otherwise seek to acquire us. Shares of preferred stock issued by us could include voting rights, or even super voting rights, which could shift the ability to control Earthstone to the holders of the preferred stock. Preferred stock could also have conversion rights into shares of Class A Common Stock at a discount to the market price of the Class A Common Stock which could negatively affect the market for our Class A Common Stock. In addition, preferred stock could have preference in the event of liquidation of Earthstone, which means that the holders of preferred stock would be entitled to receive the net assets of Earthstone distributed in liquidation before the Class A common stockholders receive any distribution of the liquidated assets. We have no current plans to issue any shares of preferred stock.
The price of our Class A Common Stock may fluctuate significantly, which could negatively affect us and holders of our Class A Common Stock.
Our Class A Common Stock trades on the New York Stock Exchange. The trading price of our Class A Common Stock may fluctuate significantly in response to a number of factors, many of which are beyond our control. For instance, ifAdverse events including changes in production volumes, worldwide demand and prices for crude oil and natural gas, regulatory developments, and changes in securities analysts’ estimates of our financial results are below the expectations of securities analysts and investors,performance could negatively impact the market price of our Class A Common Stock could decrease, perhaps significantly. Other factors that may affectStock. General market conditions, including the market pricelevel of, our Class A Common Stock include:
changes in oil and natural gas prices;
actual or anticipated fluctuations in, our quarterly resultsthe trading prices of operations;
our liquidity;
sales of Class A Common Stock by our stockholders;
changes in our cash flow from operations or earnings estimates;
publication of research reports about us or the oil and natural gas exploration and production industry generally;
competition for, among other things, capital, acquisition of reserves, undeveloped land, and skilled personnel;
increases in market interest rates that may increase our cost of capital;
changes in applicable laws or regulations, court rulings, and enforcement and legal actions;
changes in market valuations ofstocks generally could also have a similar companies;
adverse market reaction to any indebtedness we may incur in the future;
additions or departures of key management personnel;
actions by our stockholders;
commencement of or involvement in litigation;
news reports relating to trends, concerns, technological or competitive developments, regulatory changes, and other related issues in our industry;
speculation in the press or investment community regarding our business;
political conditions in oil and natural gas producing regions of the world;
general market and economic conditions; and
domestic and international economic, legal, and regulatory factors unrelated to our performance.
In addition, U.S. securitiesnegative impact. The stock markets have experienced significantregularly experience price and volume fluctuations. These fluctuations often have been unrelatedvolatility that affects many companies’ stock prices without regard to the operating performance of companies in these markets. Market fluctuations and broad market, economic, and industry factorsthose companies. Volatility of this type may negatively affect the price of our Class A Common Stock, regardless of our operating performance. Any volatility or a significant decrease in the market price of our Class A Common Stock could also negatively affect our ability to make acquisitions using Class A Common Stock. Further, if we were to be the object of securities class action litigation as a result of volatility in our Class A Common Stock price or for other reasons, it could result in substantial costs and diversion of our management’s attention and resources, which could negatively affect our financial results.
We are subject to certain requirements of Section 404 of the Sarbanes-Oxley Act. If we fail to comply with the requirements of Section 404 or if we or our auditors identify and report material weaknesses in internal control over financial reporting, our investors may lose confidence in our reported information and our stock price may be negatively affected.
As of December 31, 2019, we are required to comply with certain provisions of Section 404 of the Sarbanes-Oxley Act of 2002 (the “Sarbanes-Oxley Act”). Section 404 requires that we document and test our internal control over financial reporting and issue our management’s assessment of our internal control over financial reporting. This section also requires that our independent registered public accounting firm issue an attestation report on such internal control. If we fail to comply with the requirements of Section 404 of the Sarbanes-Oxley Act, or if we or our auditors identify and report material weaknesses in our internal control over financial reporting, the accuracy and timeliness of the filing of our annual and quarterly reports may be materially adversely affected and could cause investors to lose confidence in our reported financial information, which could have a negative effect on the trading price of our Class A Common Stock. In addition, a material weakness in the effectiveness of our internal control over financial reporting could result in an increased chance of fraud, reduce our ability to obtain financing and require additional expenditures to comply with these requirements, each of which could have a material adverse effect on our business, results of operations and financial condition.
Anti-takeover provisions could make a third-party acquisition difficult.
Our Third Amended and RestatedThe Certificate of Incorporation provides for a classified board of directors, with each member serving a three-year term. Provisions in our Third Amended and Restatedthe Certificate of Incorporation could make it more difficult for a third partythird-party to acquire us without the approval of our Board. In addition, the Delaware corporate statutes also contain certain provisions that could make an acquisition by a third partythird-party more difficult.
Our stockholders may act by unilateral written consent.
Under our Third Amended and Restatedthe Certificate of Incorporation and as expressly permitted by the Delaware General Corporation Law (the "DGCL"), any action required to be taken at any annual or special meeting of our stockholders, or any action which may be taken at any annual or special meeting of such stockholders, may be taken without a meeting, without prior notice and without a vote, if a consent in writing, setting forth the action so taken, is signed by the holders of outstanding stock having not less than the minimum number of votes that would be necessary to authorize or take such action at a meeting at which all shares entitled to vote thereon were present and voted. Thus, consents of this type can be effected without the participation or input of minority stockholders.
Item 1B. Unresolved Staff Comments
None.
Item 2. Properties
Summary of Oil and Gas Properties
Midland Basin
We have an operated positionAs of December 31, 2021, we had approximately 23,000102,100 net acres in the core of the Midland Basin of west Texas across Reagan, Upton,that are highly contiguous on a project-by-project basis which allow us to drill multi-well pads. Of this acreage, 94% is operated and Midland counties with6% is non-operated. We hold an averageapproximate 96% working interest of approximately 94%.in our operated acreage and an approximate 39% working interest in our non-operated acreage. As of December 31, 2019,2021, we had 13interests in approximately 891 gross vertical and 67298 gross horizontal operated producing wells, of which we operate 804 vertical and 218 horizontal wells. Current internal estimates indicate 269With 474 potential gross largely de-risked, operatedhorizontal drilling locations the vast majority of which are in various benches of the Wolfcamp and the Spraberry formations, which are expected to have an average working interest of 82%.
We also have a non-operated position of approximately 6,100 net acres(299 operated / 175 non-operated) in the Midland Basin as of west Texas,December 31, 2021, we are focused on developmental drilling and completion operations in the area. We continue to pursue acreage trades or bolt-on acreage acquisitions in the Midland Basin with the intent of increasing our operated acreage and drilling inventory, drilling and completing longer laterals and realizing greater operating efficiencies.
During 2021, we completed and began producing from 19 gross / 15.4 net operated wells and 8 gross / 0.8 net non-operated wells. We exited 2021 with 14 gross / 13.7 net operated wells that were in various stages of drilling and completion, of which 5 gross / 5 net wells have been completed as of March 1, 2022. We expect to complete and bring the remaining 9 gross / 8.7 net wells online in the second quarter of 2022.
Consistent with our operations from the latter part of 2021, we are running two drilling rigs in the Midland Basin, and we plan to do so throughout 2022. We anticipate spudding 40 gross / 35.8 net operated wells and bringing online 40 gross / 36.7 net operated wells on our Midland Basin properties during 2022.
Delaware Basin
Upon the consummation of the Chisholm Acquisition on February 15, 2022, we acquired approximately 36,100 net acres located in Howard, Glasscock, Martinthe Delaware Basin, located in Lea County and Midland counties, Texas. As of December 31, 2019, we had an interestEddy County, New Mexico, with approximately 85% held by production and approximately 92% operated. We now have interests in 92approximately 333 gross vertical and 40 gross horizontal non-operated/ 168.6 net producing wells, with an average working interest of approximately 36%.
which we operate 190 gross / 149.5 net producing wells. We have identified 176approximately 414 gross / 237.1 net potential gross horizontal non-operated drilling locations in various benches ofthis acreage.
We are currently utilizing two drilling rigs on our recently acquired Chisholm acreage, and we plan to do so throughout 2022 and we plan to spud 20 gross / 11.8 net operated wells and bring online 18 gross / 11.6 net operated wells in the Wolfcamp and Spraberry formations with an estimated average working interest of approximately 29%.Delaware Basin.
Eagle Ford Trend
As of December 31, 2019,2021, we held approximately 28,50024,300 gross (14,100(12,700 net) operated leasehold acres primarily in Fayette, Gonzales and Karnes counties, Texas. The acreage is located in the crude oil window of the Eagle Ford shale trend of southSouth Texas and is prospective for the Eagle Ford, Austin Chalk and Upper Eagle Ford formations. We serve as the operator withOur working interests rangingrange from approximately 12%15% to 67%100%.
As of December 31, 2019,2021, we operated 10337 gross Eagle Ford wells and 13 gross Austin Chalkproducing wells and had non-operated interests in five83 gross producing Eagle Ford wells and one gross producing Austin Chalk well.wells. We have identified a total of 6224 potential gross Eagle Ford drilling locations in this acreage. In addition, because our acreage position is prospective for the Austin Chalk and Upper Eagle Ford formations, we may have additional future economic locations. The majority of our acreage is covered by an approximately 173 square mile 3-D seismic survey.
Oil and Natural Gas Reserves
As of December 31, 2019,2021, all of our oil and natural gas reserves were located in the state of Texas. We expect to further develop these properties through additional drilling and completion operations. Our reserve estimates have been prepared by Cawley, Gillespie & Associates, Inc. (“CG&A”), an independent petroleum engineering firm. The scope and results of CG&A’s procedures are summarized in a letter which is included as an exhibit to this report. For further information on estimated reserves, including information on estimated future net cash flows and the standardized measure of discounted future net cash flows, please refer to the Note 21. Supplemental Information onOn Oil and Gas Exploration and Production Activities (Unaudited) in Part II, Item 8 of the Notes to Consolidated Financial Statements of this report.
As of December 31, 2019,2021, our estimated proved reserves totaled 94,336 MBOE147,587 MBoe and had a PV-10 value of approximately $820.0$2,016.7 million (reconciled in “Non-GAAP Measures” below) and a Standardized Measure of Discounted Future Net Cash Flows of approximately $789.6$1,818.4 million, all of which relate to our properties in Texas. WeDuring 2021, we incurred approximately $210.4$130.5 million in capital expenditures, primarily drilling and completion costs, during 2019.costs. We expect to further develop our properties through additional drilling.
20192021 Activity in Proved Reserves
From January 1, 20192021 to December 31, 2019,2021, our total estimated proved reserves decreased 5%increased 87% from 98,847 MBOE78,875 MBoe to 94,336 MBOE.147,587 MBoe. Of that, estimated proved developed reserves increased 33%144% from 23,646 MBOE38,298 MBoe to 31,521 MBOE93,575 MBoe and estimated proved undeveloped reserves decreased 16%increased 33% from 75,201 MBOE40,577 MBoe to 62,815 MBOE.54,012 MBoe. The overall proved reserves decreases are primarily attributable to productionmost significant increase resulted from our consolidation efforts and negative revisions due to reduced commodity prices.related purchases of minerals in place.
Proved Reserves as of December 31, 20192021
The below table sets forth a summary of our estimated crude oil, natural gas and natural gas liquidsNGL reserves as of December 31, 2019,2021, based on the annual reserve estimate prepared by CG&A. In preparing this reserve report, CG&A evaluated 100% of our properties at December 31, 2019.2021. The prices used in estimating proved reserves are based on the unweighted arithmetic average of the first-day-of-the-month price for each month within the 12-month period for the year. All prices and costs associated with operating wells were held constant in accordance with the SEC guidelines.
Our proved reserve categories as of December 31, 20192021 are summarized in the table below:
| | | | Oil (MBbl) | | Natural Gas (MMcf) | | NGLs (MBbl) | | Total (MBOE)(2) | | % of Total Proved | | Undiscounted Future Net Cash Flows ($ in thousands) | | PV-10 ($ in thousands) | | Standardized Measure of Discounted Future Net Cash Flows ($ in thousands) | | Future Capital Expenditures ($ in thousands) | | Oil
(MBbl) | | Natural Gas
(MMcf) | | NGLs
(MBbl) | | Total (MBoe)(2) | | % of Total
Proved | | Undiscounted Future Net Cash Flows
($ in thousands) | | PV-10
($ in thousands) | | Standardized Measure of Discounted Future Net Cash Flows
($ in thousands) | | Future Capital Expenditures
($ in thousands) |
| PDP | 17,732 |
| | 34,584 |
| | 7,371 |
| | 30,867 |
| | 33 | % | | $ | 679,847 |
| | $ | 434,881 |
| | $ | 418,751 |
| | $ | — |
| PDP | 33,306 | | | 184,239 | | | 24,870 | | | 88,884 | | | 60 | % | | $ | 2,352,990 | | | $ | 1,283,778 | | | $ | 1,157,536 | | | $ | — | |
| PDNP | 488 |
| | 536 |
| | 76 |
| | 654 |
| | 1 | % | | 18,217 |
| | 13,652 |
| | 13,146 |
| | 586 |
| PDNP | 2,518 | | | 6,760 | | | 1,047 | | | 4,692 | | | 3 | % | | 158,783 | | | 87,919 | | | 79,273 | | | 14,950 | |
| PUD | 34,430 |
| | 72,870 |
| | 16,241 |
| | 62,815 |
| | 66 | % | | 896,648 |
| | 371,459 |
| | 357,680 |
| | 628,106 |
| PUD | 25,251 | | | 93,882 | | | 13,114 | | | 54,011 | | | 37 | % | | 1,419,598 | | | 644,989 | | | 581,563 | | | 455,058 | |
Total proved (1) | 52,650 |
| | 107,990 |
| | 23,688 |
| | 94,336 |
| | 100 | % | | $ | 1,594,712 |
| | $ | 819,992 |
| | $ | 789,577 |
| | $ | 628,692 |
| Total proved (1) | 61,075 | | | 284,881 | | | 39,031 | | | 147,587 | | | 100 | % | | $ | 3,931,371 | | | $ | 2,016,686 | | | $ | 1,818,372 | | | $ | 470,008 | |
| |
(1) | Includes 28.7 MMBbl of oil, 58.9 Bcf of natural gas and 12.9 MMBbl of NGLs reserves attributable to noncontrolling interests. Additionally, $447.0 million of PV-10 and $430.4 million of standardized measure of discounted future net cash flows were attributable to noncontrolling interests. |
| |
(2) | Barrels of oil equivalent have been calculated on the basis of six thousand cubic feet (Mcf) of natural gas equal to one barrel of oil equivalent (BOE). |
(1)Includes 23.9 MMBbl of oil, 111.4 Bcf of natural gas and 15.3 MMBbl of NGLs reserves attributable to noncontrolling interests. Additionally, $788.8 million of PV-10 and $711.2 million of standardized measure of discounted future net cash flows were attributable to noncontrolling interests.
(2)Barrels of oil equivalent have been calculated on the basis of six thousand cubic feet (Mcf) of natural gas equal to one barrel of oil equivalent (Boe).
Non-GAAP Measures
PV-10
PV-10 is a non-GAAP measure that differs from a measure under GAAP known as “standardized measure of discounted future net cash flows” in that PV-10 is calculated without including future income taxes. Management believes that the presentation of the PV-10 value of its oil and natural gas properties is relevant and useful to investors because it presents the estimated discounted future net cash flows attributable to our estimated proved reserves independent of our income tax attributes, thereby isolating the intrinsic value of the estimated future cash flows attributable to our reserves. We believe the use of a pre-tax measure provides greater comparability of assets when evaluating companies because the timing and quantification of future income taxes is dependent on company-specific factors, many of which are difficult to determine. For these reasons, management uses and believes that the industry generally uses the PV-10 measure in evaluating and comparing acquisition candidates and assessing the potential rate of return on investments in oil and natural gas properties. PV-10 does not necessarily represent the fair market value of oil and natural gas properties. PV-10 is not a measure of financial or operational performance under GAAP, nor should it be considered in isolation or as a substitute for the standardized measure of discounted future net cash flows as defined under GAAP.
The table below provides a reconciliation of PV-10 to the standardized measure of discounted future net cash flows (in thousands):
|
| | | |
Present value of estimated future net revenues (PV-10) (1) | $ | 819,992 |
|
| Future income taxes, discounted at 10% | (30,415 | ) |
Standardized measure of discounted future net cash flows (2) | $ | 789,577 |
|
| | | | | |
Present value of estimated future net revenues (PV-10) (1) | Includes $447.0 million attributable to noncontrolling interests.$ |
| 2,016,686 | |
(2)Future income taxes, discounted at 10% | Includes $430.4 million attributable to noncontrolling interests. |
Free Cash Flow
Free cash flow is a measure that we use as an indicator of our ability to fund our development activities. We define free cash flow as Adjusted EBITDAX (defined below), less interest expense, less accrual-based capital expenditures.
Adjusted EBITDAX
The non-GAAP financial measure of Adjusted EBITDAX, as calculated by us below, is intended to provide readers with meaningful information that supplements our financial statements prepared in accordance with accounting principles generally accepted in the United States (“GAAP”). Further, this non-GAAP measure should only be considered in conjunction with financial statements and disclosures prepared in accordance with GAAP and should not be considered in isolation or as a substitute for GAAP measures, such as net income or loss, operating income or loss or any other GAAP measure of financial position or results of operations. Adjusted EBITDAX is presented herein and reconciled from the GAAP measure of net income because of its wide acceptance by the investment community as a financial indicator.
We define “Adjusted EBITDAX” as net income plus, when applicable, accretion of asset retirement obligations; impairment expense; depletion, depreciation and amortization; interest expense, net; transaction costs; (gain) on sale of oil and gas properties, net; exploration expense; unrealized loss (gain) on derivative contracts; stock-based compensation (non-cash); and income tax expense.
Our Adjusted EBITDAX measure provides additional information that may be used to better understand our operations. Adjusted EBITDAX is one of several metrics that we use as a supplemental financial measurement in the evaluation of our business and should not be considered as an alternative to, or more meaningful than, net (loss) income as an indicator of operating performance. Certain items excluded from Adjusted EBITDAX are significant components in understanding and assessing a company’s financial performance, such as a company’s cost of capital and tax structure, as well as the historic cost of depreciable and depletable assets. Adjusted EBITDAX, as used by us, may not be comparable to similarly titled measures reported by other companies. We believe that Adjusted EBITDAX is a widely followed measure of operating performance and is one of many metrics used by our management team and by other users of our consolidated financial statements. For example, Adjusted EBITDAX can be used to assess our operating performance and return on capital in comparison to other independent exploration and production companies without regard to financial or capital structure and to assess the financial performance of our assets and our Company without regard to capital structure or historical cost basis.
The following table provides a reconciliation of Net income to Adjusted EBITDAX for the periods indicated (in thousands):
|
| | | | | |
| | Years Ended |
| | December 31, |
| | 2019 | | 2018 |
| Net income | 1,580 |
| | 95,213 |
|
| Accretion of asset retirement obligations | 214 |
| | 169 |
|
| Impairment expense | — |
| | 4,581 |
|
| Depletion, depreciation and amortization | 69,243 |
| | 47,568 |
|
| Interest expense, net | 6,566 |
| | 2,898 |
|
| Transaction costs | 1,077 |
| | 14,337 |
|
| (Gain) on sale of oil and gas properties, net | (3,222 | ) | | (1,919 | ) |
| Exploration expense | 653 |
| | 630 |
|
| Unrealized loss (gain) on derivative contracts | 59,849 |
| | (76,037 | ) |
Stock based compensation (non-cash)(1) | 8,648 |
| | 7,071 |
|
| Income tax expense | 1,665 |
| | 2,470 |
|
| Adjusted EBITDAX | 146,273 |
| | 96,981 |
|
| | | | |
| (198,314) | |
(1)Standardized measure of discounted future net cash flows (2) | Included in General and administrative expense in the Consolidated Statements of Operations.$ | 1,818,372 | |
(1)Includes $788.8 million attributable to noncontrolling interests.
(2)Includes $711.2 million attributable to noncontrolling interests.
Reserve Quantity Information
The following table illustrates our estimated net proved reserves, including changes, and proved developed and proved undeveloped reserves for the periods indicated. The oil pricesprice as of December 31, 2019 and 2018, are2021 is based on the respective 12-month unweighted average of the first of the month prices of the WTI spot prices which equates to $55.69$66.56 per barrel and $65.56 per barrel, respectively.barrel. The natural gas pricesprice as of December 31, 2019 and 2018 are2021 is based on the respective 12-month unweighted average of the first of month prices of the Henry Hub spot price which equates to $2.58$3.60 per MMBtu and $3.10 per MMBtu,
respectively.MMBtu. The natural gas liquids pricesNGL price used to value reserves as of December 31, 2019 and 20182021 averaged $16.17$30.16 per barrel and $28.81 per barrel, respectively.barrel. All prices are adjusted by lease or field for energy content, transportation fees, and market differentials, resulting in the aforementioned oil, natural gas and natural gas liquidsNGL reserves as of December 31, 20192021 being valued using prices of $52.60$65.64 per barrel, $0.91$3.01 per MMBtu and $16.17$30.16 per barrel, respectively. All prices are held constant in accordance with SEC guidelines.
A summary of our changes in quantities of proved oil, natural gas and NGLsNGL reserves for the yearsyear ended December 31, 2019 and 20182021 are as follows:
| | | | | | | | | | | | | | | | | | | | | | | |
| Oil
(MBbl) | | Natural Gas
(MMcf) | | NGLs
(MBbl) | | Total
(MBoe) |
| Balance - December 31, 2020 | 40,090 | | | 111,215 | | | 20,249 | | | 78,875 | |
| Extensions and discoveries | 7,016 | | | 49,846 | | | 6,532 | | | 21,856 | |
| Sales of minerals in place | (8) | | | (1) | | | — | | | (8) | |
| Purchases of minerals in place | 25,114 | | | 106,539 | | | 17,103 | | | 59,973 | |
| Production | (4,381) | | | (14,505) | | | (2,257) | | | (9,055) | |
| Revision to previous estimates | (6,756) | | | 31,787 | | | (2,596) | | | (4,054) | |
| Balance - December 31, 2021 | 61,075 | | | 284,881 | | | 39,031 | | | 147,587 | |
| | | | | | | |
| Proved developed reserves: | 35,824 | | | 190,999 | | | 25,917 | | | 93,575 | |
| | | | | | | |
| Proved undeveloped reserves: | 25,251 | | | 93,882 | | | 13,114 | | | 54,012 | |
|
| | | | | | | | | | | |
| | Oil (MBbl) | | Natural Gas (MMcf) | | NGLs (MBbl) | | Total (MBOE) |
| Balance - December 31, 2017 | 47,327 |
| | 91,088 |
| | 17,468 |
| | 79,976 |
|
| Extensions and discoveries | 10,148 |
| | 17,673 |
| | 3,116 |
| | 16,209 |
|
| Sales of minerals in place | (2,651 | ) | | (14,300 | ) | | (1,562 | ) | | (6,596 | ) |
| Purchases of minerals in place | 3,532 |
| | 9,890 |
| | 1,629 |
| | 6,810 |
|
| Production | (2,370 | ) | | (3,610 | ) | | (655 | ) | | (3,627 | ) |
| Revision to previous estimates | 3,048 |
| | 12,476 |
| | 947 |
| | 6,075 |
|
| Balance - December 31, 2018 | 59,034 |
| | 113,217 |
| | 20,943 |
| | 98,847 |
|
| Extensions and discoveries | 3,598 |
| | 4,476 |
| | 721 |
| | 5,065 |
|
| Sales of minerals in place | (31 | ) | | (4 | ) | | (1 | ) | | (32 | ) |
| Production | (3,086 | ) | | (4,760 | ) | | (1,022 | ) | | (4,902 | ) |
| Revision to previous estimates | (6,865 | ) | | (4,939 | ) | | 3,047 |
| | (4,642 | ) |
| Balance - December 31, 2019 | 52,650 |
| | 107,990 |
| | 23,688 |
| | 94,336 |
|
| Proved developed reserves: | | | | | | | |
| December 31, 2017 | 11,949 |
| | 23,336 |
| | 4,123 |
| | 19,961 |
|
| December 31, 2018 | 14,325 |
| | 26,110 |
| | 4,969 |
| | 23,646 |
|
| December 31, 2019 | 18,220 |
| | 35,120 |
| | 7,447 |
| | 31,521 |
|
| Proved undeveloped reserves: | | | | | | | |
| December 31, 2017 | 35,378 |
| | 67,752 |
| | 13,345 |
| | 60,015 |
|
| December 31, 2018 | 44,709 |
| | 87,107 |
| | 15,974 |
| | 75,201 |
|
| December 31, 2019 | 34,430 |
| | 72,870 |
| | 16,241 |
| | 62,815 |
|
The table below presents the quantities of proved oil, natural gas and NGLsNGL reserves attributable to noncontrolling interests as of December 31, 2019 and 2018:2021:
| | | | | | | | | | | Oil
(MBbl) | | Natural Gas
(MMcf) | | NGLs
(MBbl) | | Total
(MBoe) |
| As of December 31, 2019 | Oil
(MBbl) | | Natural Gas
(MMcf) | | NGLs
(MBbl) | | Total
(MBOE) | |
| Proved developed | 9,933 |
| | 19,146 |
| | 4,060 |
| | 17,183 |
| Proved developed | 14,011 | | | 74,702 | | | 10,137 | | | 36,598 | |
| Proved undeveloped | 18,769 |
| | 39,724 |
| | 8,853 |
| | 34,243 |
| Proved undeveloped | 9,876 | | | 36,719 | | | 5,129 | | | 21,125 | |
| Total proved | 28,702 |
| | 58,870 |
| | 12,913 |
| | 51,426 |
| Total proved | 23,887 | | | 111,421 | | | 15,266 | | | 57,723 | |
| | | | | | | | | | | | | | | | |
| As of December 31, 2018 | Oil
(MBbl) | | Natural Gas
(MMcf) | | NGLs
(MBbl) | | Total
(MBOE) | |
| Proved developed | 7,917 |
| | 14,430 |
| | 2,746 |
| | 13,068 |
| |
| Proved undeveloped | 24,709 |
| | 48,140 |
| | 8,828 |
| | 41,560 |
| |
| Total proved | 32,626 |
| | 62,570 |
| | 11,574 |
| | 54,628 |
| |
Notable changes in proved reserves for the year ended December 31, 20192021 included the following:
•Extensions and discoveries. In 2019, total2021, extensions and discoveries of 5.1 MMBOE was21.9 MMBoe were primarily the result of successful drilling results and well performance primarily related toin the Midland Basin.
Sales•Purchases of minerals in place. Sales of minerals In 2021, we completed multiple acquisitions that resulted in place totaled 32.0 MBOE during 2019, resulting from the disposition of certain non-operated properties60.0 MMBoe in the Midland Basin. See additional reserves, as disclosed in Note 3. Acquisitions and Divestituresin the Notes to Consolidated Financial Statements.
Statements.•Revision to previous estimates. In 2019,2021, the downward revisions of prior reserves of 4.6 MMBOE were primarily due to reduced commodity prices.
Notable4.1 MMBoe consisted of changes in proved reserves for the year ended December 31, 2018 included the following:
Extensionsanticipated well densities and discoveries. In 2018, total extensionschanges in performance and discoveriesother economic factors totaling 9.2 MMBoe and 5.5 MMBoe, respectively, offset by a positive revision of 16.2 MMBOE was a result of successful drilling results and well performance primarily10.6 MMBoe related to the Midland Basin.
Sales of mineralschanges in place. Sales of minerals in place totaled 6.6 MMBOE during 2018, which consisted of 4.7 MMBOE resulting from the disposition of non-operated properties in the Midland Basin as part of an acreage trade and 1.9 MMBOE related to the disposition of non-operated Eagle Ford properties, both further described in Note 3. Acquisitions and Divestitures in the Notes to Consolidated Financial Statements.
Purchases of minerals in place. In 2018, total purchases of minerals in place of 6.8 MMBOE were primarily attributable to developed non-producing wells and undeveloped acreage acquired in the Midland Basin as part of an acreage trade, as further described in Note 3. Acquisitions and Divestitures in the Notes to Consolidated Financial Statements.
Revision to previous estimates. In 2018, the upward revisions of prior reserves of 6.1 MMBOE consisted of improved PUD reserves of 5.8 MMBOE with improved proved developed reserves of 0.3 MMBOE. PUD revisions are a result of our successful drilling efforts in the Midland Basin as well as improved commodity prices.
Proved Undeveloped Reserves
Proved undeveloped reserves (“PUDs”) decreasedincreased from 75,201 MBOE40,577 MBoe to 62,815 MBOE54,012 MBoe or 16%33%, as of December 31, 20192021 compared to December 31, 2018.2020. PUDs represent 66%37% of our total proved reserves. Certain previously booked PUDs were reclassified as proved developed reserves due to successful drilling efforts. Revisions of prior estimates include certain PUDs that were reclassified to unproved categories due to development plan changes and increased well spacing. In accordance with our 2019December 31, 2021 year-end independent engineering reserve report, we plan to drill all of our individual PUD drilling locations within the five years of original classification.
Changes in our PUD reserves for the yearsyear ended December 31, 2019 and 20182021 were as follows (in MBOEMBoe):
|
| | | | |
Proved undeveloped reserves at December 31, 2017(1)2020 (1) | 60,01540,577 |
|
| Conversions to developed | (4,419(8,274) | ) |
| Extensions and discoveries | 13,73420,521 |
|
Sales of minerals in place | (4,702 | ) |
| Purchases of minerals in place | 4,73511,577 |
|
| Revision to previous estimates | 5,838(10,389) |
|
| |
Proved undeveloped reserves at December 31, 20182021 (2) | 75,20154,012 |
|
Conversions to developed | (10,254 | ) |
Extensions and discoveries | 1,230 |
|
Revision to previous estimates | (3,362 | ) |
Proved undeveloped reserves at December 31, 2019 (3) | 62,815 |
|
| |
(1) | Includes 34,029 MBOE attributable to noncontrolling interests. |
| |
(2) | Includes 41,560 MBOE attributable to noncontrolling interests. |
| |
(3) | Includes 34,243 MBOE attributable to noncontrolling interests. |
2019(1)Includes 21,737 MBoe attributable to noncontrolling interests.
(2)Includes 21,125 MBoe attributable to noncontrolling interests.
2021 Changes in Proved Undeveloped Reserves
Conversions to developed. In our year-end 20182020 plan to develop ourits PUDs within five years, weit was estimated that $103.8$41.1 million of capital would be expended in 20192021 for the conversion of 3013 gross / 12.310.5 net PUDs to add 9.9 MMBOE, which was consistent with the $111.56.7 MMBoe. In 2021, due to improved commodity prices, we spent $55.1 million actually spent to convert 3216 gross / 13.413.1 net PUDs adding 10.3 MMBOE8.3 MMBoe to developed reserves.developed.
Extensions and discoveries. Additionally, 1.2 MMBOE were added as extensions and discoveries due to successful drilling results on our acreage positions because of the wells we drilled. The increase was also supported by successful drilling results by other operators directly offsetting and in close proximity to our acreage.
Revision to previous estimates.Revisions Downward revisions of 3.4 MMBOE were primarily due to reduced commodity prices.
2018 Changes in Proved Undeveloped Reserves
Conversions to developed. In our year-end 2017 plan to develop our PUDs within five years, we estimated that $41.5 millionprior reserves of capital would be expended in 2018 for the conversion of 14 gross / 6.2 net PUDs to add 4.3 MMBOE, which was consistent with the $55.4 million actually spent to convert 11 gross / 6.8 net PUDs adding 4.4 MMBOE to developed.
Extensions and discoveries. Additionally, 13.7 MMBOE were added as extensions and discoveries due to successful drilling results on our acreage positions because of the wells we drilled. The increase was also supported by successful drilling results by other operators directly offsetting and in close proximity to our acreage. All of these drilling results increased the confidence of the reservoir continuity and performance of the associated reservoirs which increased the number of PUDs primarily in the Midland Basin.
Sales of minerals in place. Sales of minerals in place totaled 4.7 MMBOE during 2018, which10.4 MMBoe consisted of 3.7 MMBOE resulting from the dispositionchanges in anticipated well densities and changes in performance and other economic factors totaling 9.2 MMBoe and 2.9 MMBoe, respectively, offset by a positive revision of non-operated properties in the Midland Basin as part of an acreage trade and 1.0 MMBOE1.7 MMBoe related to the disposition of non-operated Eagle Ford properties, both further describedchanges in Note 3. Acquisitions and Divestitures in the Notes to Consolidated Financial Statements.
Purchases of minerals in place. In 2018, purchases of minerals in place of, 4.7 MMBOE were attributable to developed non-producing wells and undeveloped acreage acquired in the Midland Basin as part of an acreage trade, as further described in Note 3. Acquisitions and Divestitures in the Notes to Consolidated Financial Statements.
Revision to previous estimates. Revisions of 5.8 MMBOE were primarily due to our successful drilling efforts in the Midland Basin as well as improved commodity prices.
Estimated Costs Related to Conversion of Proved Undeveloped Reserves to Proved Developed Reserves
The following table sets forth the estimated timing and cash flows of developing our proved undeveloped reserves at December 31, 20192021 ($ in thousands):
| | | | | | | | | | | | | | | | | | | | | | | | | | | | | | | | |
Years Ended December 31, (1) | | Future Production (MBoe) (2) | | Future Cash Inflows (3) | | Future Production Costs | | Future Development Costs | | Future Net Cash Flows |
| 2022 | | 2,672 | | | $ | 142,171 | | | $ | 18,705 | | | $ | 231,755 | | | $ | (108,289) | |
| 2023 | | 5,802 | | | 290,866 | | | 37,673 | | | 147,888 | | | 105,305 | |
| 2024 | | 6,885 | | | 326,645 | | | 42,730 | | | 75,415 | | | 208,500 | |
| 2025 | | 4,856 | | | 208,241 | | | 30,173 | | | — | | | 178,068 | |
| 2026 | | 3,542 | | | 147,700 | | | 22,846 | | | — | | | 124,854 | |
| Thereafter | | 30,255 | | | 1,228,430 | | | 317,270 | | | — | | | 911,160 | |
| Total | | 54,012 | | | $ | 2,344,053 | | | $ | 469,397 | | | $ | 455,058 | | | $ | 1,419,598 | |
|
| | | | | | | | | | | | | | | | | | | |
Years Ended December 31, (1) | | Future Production (MBOE) (2) | | Future Cash Inflows (3) | | Future Production Costs | | Future Development Costs | | Future Net Cash Flows |
| 2020 | | 1,541 |
| | $ | 66,705 |
| | $ | 8,048 |
| | $ | 111,077 |
| | $ | (52,420 | ) |
| 2021 | | 3,954 |
| | 160,948 |
| | 22,784 |
| | 193,341 |
| | (55,177 | ) |
| 2022 | | 6,164 |
| | 240,946 |
| | 37,450 |
| | 191,197 |
| | 12,299 |
|
| 2023 | | 7,983 |
| | 300,405 |
| | 46,810 |
| | 112,631 |
| | 140,964 |
|
| 2024 | | 5,949 |
| | 208,057 |
| | 37,115 |
| | 19,860 |
| | 151,082 |
|
| Thereafter | | 37,224 |
| | 1,145,081 |
| | 445,181 |
| | — |
| | 699,900 |
|
| Total | | 62,815 |
| | $ | 2,122,142 |
| | $ | 597,388 |
| | $ | 628,106 |
| | $ | 896,648 |
|
| |
(1) | Beginning in 2020(1)Beginning in 2022 and thereafter, the production and cash flows represent the drilling results from the respective year plus the incremental effects from the results of proved undeveloped drilling from previous years. These production volumes, inflows, expenses, development costs and cash flows are limited to the PUD reserves and do not include any production or cash flows from the Proved Developed category which will also help to fund our capital program.(2)Barrels of oil equivalent have been calculated on the basis of six thousand cubic feet (Mcf) of natural gas equal to one barrel of oil equivalent (Boe). (3)Computation is based on SEC pricing of (i) $65.64 per Bbl (WTI-Cushing oil spot prices, adjusted for differentials), (ii) $3.01 per Mcf (Henry Hub spot natural gas price), as adjusted for location and quality by property, and (iii) $30.16 per Bbl for NGL. PUD reserves and do not include any production or cash flows from the Proved Developed category which will also help to fund our capital program. |
| |
(2) | Barrels of oil equivalent have been calculated on the basis of six thousand cubic feet (Mcf) of natural gas equal to one barrel of oil equivalent (BOE). |
| |
(3) | Computation is based on SEC pricing of (i) $52.60 per Bbl (WTI-Cushing oil spot prices, adjusted for differentials), (ii) $0.91 per Mcf (Henry Hub spot natural gas price), as adjusted for location and quality by property and (iii) $16.17 per Bbl for natural gas liquids. |
PUDs are expected to be recovered from new wells on undrilled acreage or from existing wells where additional capital expenditures are required, such as from drilled but uncompleted (DUC)("DUC") wells. Our development plan contemplates production to commence from all these wells in the first and second quarter 2020.by 2025.
Historically, our drilling programs have been substantially funded from our cash flow and borrowings under our credit facility.Credit Agreement. Based on current commodity prices and our current expectations over the next five years of our cash flows and drilling programs, which includes drilling of proved undeveloped and unproven locations, we believe that we can continue to substantially fund our drilling activities from our cash flow and with borrowings under the Credit Agreement.
Preparation of Reserve Estimates
We engaged an independent petroleum engineering consulting firm, CG&A, to prepare our annual reserve estimates and we have relied on CG&A’s expertise to ensure that our reserve estimates are prepared in compliance with SEC guidelines.
The technical person primarily responsible for the preparation of the reserve report is Mr. W. Todd Brooker, President of CG&A. He graduated with honors from the University of Texas at Austin in 1989 with a Bachelor of Science degree in Petroleum Engineering. Mr. Brooker is a Registered Professional Engineer in the State of Texas (License No. 83462) and has more than 25 years of experience in the estimation and evaluation of oil and natural gas reserves. He is also a member of the Society of Petroleum Engineers.
Geoffrey A. Vernon, our Vice President of Reservoir Engineering and A&D, is responsible for reservoir engineering, is a qualified reserve estimator and auditor and is primarily responsible for overseeing CG&A during the preparation of our annual
reserve estimates. His professional qualifications meet or exceed the qualifications of reserve estimators and auditors set forth in the “Standards Pertaining to Estimation and Auditing of Oil and Natural Gas Reserves Information” promulgated by the Society of Petroleum Engineers. His qualifications include a Bachelor of Science degree in Chemical Engineering from Texas Tech University in 2007; a Master of Business Administration degree from Rice University in 2014; member of the Society of Petroleum Engineers since 2007; and more than 1214 years of practical experience in estimating and evaluating reserve information with more than eightnine of those years being in charge of estimating and evaluating reserves.
We maintain adequate and effective internal controls over our reserve estimation process as well as the underlying data upon which reserve estimates are based. The primary inputs to the reserve estimation process are technical information, financial data, ownership interest and production data. The relevant field and reservoir technical information, which is updated, at least, annually, is assessed for validity when CG&A has technical meetings with our engineers, geologists, operations and land personnel. Current revenue and expense information is obtained from our accounting records, which are subject to external quarterly reviews, annual audits and our own set of internal controls over financial reporting. Internal controls over financial reporting are assessed for effectiveness annually using criteria set forth in Internal Control – Integrated Framework, (2013 Version) issued by the Committee of Sponsoring Organizations of the Treadway Commission. All current financial data such as commodity prices, lease operating expenses, production taxes and field level commodity price differentials are updated in the reserve database and then analyzed to ensure that they have been entered accurately and that all updates are complete. Our current ownership in mineral interests and well production data are also subject to our internal controls, over financial reporting, and they are incorporated in our reserve database as well and verified internally by our personnel to ensure their accuracy and completeness. Once the reserve database has been updated with current information, and the relevant technical support material has been assembled, CG&A meets with our technical personnel to review field performance and future development plans in order to further verify the validity of estimates. Following these reviews, the reserve database is furnished to CG&A so that it can prepare its independent reserve estimates and final report. The reserve estimates prepared by CG&A are reviewed and compared to our internal estimates by Mr. Vernon, our Vice President of Reservoir Engineering and A&D. Material reserve estimation differences are reviewed between CG&A and us, and additional data is provided to address the differences. If the supporting documentation will not justify additional changes, the CG&A reserves are accepted. In the event that additional data supports a reserve estimation adjustment, CG&A will analyze the additional data, and may make changes it solely deems necessary. Additional data is usually comprised of updated production information on new wells. Once the review is completed and all material differences are reconciled, the reserve report is finalized and our reserve database is updated with the final estimates provided by CG&A.
Net Oil, Natural Gas and Natural Gas LiquidsNGL Production, Average Price and Average Production Cost
The net quantities of oil, natural gas and natural gas liquidsNGLs produced and sold by us for the years ended December 31, 20192021, 2020 and 2018,2019, the average sales price per unit sold (excluding hedges) and the average production cost per unit are presented below:
| | | | | | | | | | | | | | | | | |
| | Years Ended December 31, |
| | 2021 | | 2020 | | 2019 |
| Sales Volumes: | | | | | |
| Oil (MBbl) | 4,381 | | | 3,180 | | | 3,086 | |
| Natural gas (MMcf) | 14,505 | | | 7,282 | | | 4,760 | |
| Natural gas liquids (MBbl) | 2,257 | | | 1,198 | | | 1,022 | |
| Barrels of oil equivalent (MBoe)* | 9,055 | | | 5,591 | | | 4,902 | |
| Average daily production (Boe per day) | 24,809 | | | 15,276 | | | 13,429 | |
| Average prices realized:** | | | | | |
| Oil (per Bbl) | $ | 67.83 | | | $ | 37.85 | | | $ | 55.71 | |
| Natural gas (per Mcf) | $ | 3.50 | | | $ | 1.18 | | | $ | 0.82 | |
| Natural gas liquids (per Bbl) | $ | 31.76 | | | $ | 13.03 | | | $ | 15.09 | |
| Barrels of oil equivalent (per Boe) | $ | 46.34 | | | $ | 25.85 | | | $ | 39.02 | |
| Production cost per Boe | $ | 5.45 | | | $ | 5.21 | | | $ | 5.85 | |
* Barrels of oil equivalent have been calculated on the basis of six thousand cubic feet (Mcf) of natural gas equal to one barrel of oil equivalent (Boe).
** Amounts exclude the impact of cash paid/received on settled derivative contracts as we did not elect to apply hedge accounting. Our derivatives for 2021, 2020 and 2019 have been marked-to-market in our Consolidated Statements of Operations and both the realized and unrealized amounts are reported as other income/expense.
|
| | | | | | | |
| | Years Ended December 31, |
| | 2019 | | 2018 |
| Sales Volumes: | | | |
| Oil (MBbl) | 3,086 |
| | 2,370 |
|
| Natural gas (MMcf) | 4,760 |
| | 3,610 |
|
| Natural gas liquids (MBbl) | 1,022 |
| | 655 |
|
| Barrels of oil equivalent (MBOE)* | 4,902 |
| | 3,627 |
|
| Average daily production (BOE per day) | 13,429 |
| | 9,937 |
|
| Average prices realized:** | |
| | |
|
| Oil (per Bbl) | $ | 55.71 |
| | $ | 59.40 |
|
| Natural gas (per Mcf) | $ | 0.82 |
| | $ | 2.05 |
|
| Natural gas liquids (per Bbl) | $ | 15.09 |
| | $ | 26.23 |
|
| Barrels of oil equivalent (per BOE) | $ | 39.02 |
| | $ | 45.59 |
|
| Production cost per BOE | $ | 5.85 |
| | $ | 5.66 |
|
| |
* | Barrels of oil equivalent have been calculated on the basis of six thousand cubic feet (Mcf) of natural gas equal to one barrel of oil equivalent (BOE). |
| |
** | Amounts exclude the impact of cash paid/received on settled derivative contracts as we did not elect to apply hedge accounting. Our derivatives for 2019 and 2018 have been marked-to-market in our Consolidated Statements of Operations and both the realized and unrealized amounts are reported as other income/expense. |
The following tables summarize the net quantities of oil, natural gas and natural gas liquidsNGLs produced and sold by us, the average sales price per unit sold (excluding hedges) and the average production cost per unit for each of our core areas for the years ended December 31, 20192021, 2020 and 2018.2019.
Midland Basin
| | | | | | | | | | | | | | | | | |
| | Years Ended December 31, |
| | 2021 | | 2020 | | 2019 |
| Sales Volumes: | | | | | |
| Oil (MBbl) | 3,817 | | | 2,687 | | | 2,599 | |
| Natural gas (MMcf) | 14,263 | | | 7,079 | | | 4,558 | |
| Natural gas liquids (MBbl) | 2,191 | | | 1,141 | | | 965 | |
| Barrels of oil equivalent (MBoe)* | 8,385 | | | 5,007 | | | 4,324 | |
| Average daily production (Boe per day) | 22,972 | | | 13,681 | | | 11,846 | |
| Average prices realized:** | | | | | |
| Oil (per Bbl) | $ | 67.75 | | | $ | 37.68 | | | $ | 55.05 | |
| Natural gas (per Mcf) | $ | 3.50 | | | $ | 1.15 | | | $ | 0.75 | |
| Natural gas liquids (per Bbl) | $ | 31.81 | | | $ | 13.08 | | | $ | 15.07 | |
| Barrels of oil equivalent (per Boe) | $ | 45.10 | | | $ | 24.83 | | | $ | 37.25 | |
| Production cost per Boe | $ | 4.95 | | | $ | 4.81 | | | $ | 5.22 | |
|
| | | | | | | |
| | Years Ended December 31, |
| | 2019 | | 2018 |
| Sales Volumes: | | | |
| Oil (MBbl) | 2,599 |
| | 1,835 |
|
| Natural gas (MMcf) | 4,558 |
| | 3,080 |
|
| Natural gas liquids (MBbl) | 965 |
| | 571 |
|
| Barrels of oil equivalent (MBOE)* | 4,324 |
| | 2,920 |
|
| Average daily production (BOE per day) | 11,846 |
| | 7,999 |
|
| Average prices realized:** | |
| | |
|
| Oil (per Bbl) | $ | 55.05 |
| | $ | 56.96 |
|
| Natural gas (per Mcf) | $ | 0.75 |
| | $ | 1.89 |
|
| Natural gas liquids (per Bbl) | $ | 15.07 |
| | $ | 26.38 |
|
| Barrels of oil equivalent (per BOE) | $ | 37.25 |
| | $ | 42.95 |
|
| Production cost per BOE | $ | 5.22 |
| | $ | 4.57 |
|
| |
* | Barrels of oil equivalent have been calculated on the basis of six thousand cubic feet (Mcf) of natural gas equal to one barrel of oil equivalent (BOE). |
| |
** | ** Amounts exclude the impact of cash paid/received on settled derivative contracts as we did not elect to apply hedge accounting. |
Eagle Ford Trend
| | | | | | | | | | | | | | | | | |
| | Years Ended December 31, |
| | 2021 | | 2020 | | 2019 |
| Sales Volumes: | | | | | |
| Oil (MBbl) | 565 | | | 493 | | | 487 | |
| Natural gas (MMcf) | 243 | | | 204 | | | 202 | |
| Natural gas liquids (MBbl) | 65 | | | 57 | | | 57 | |
| Barrels of oil equivalent (MBoe)* | 670 | | | 584 | | | 578 | |
| Average daily production (Boe per day) | 1,837 | | | 1,595 | | | 1,583 | |
| Average prices realized:** | | | | | |
| Oil (per Bbl) | $ | 68.35 | | | $ | 38.82 | | | $ | 59.20 | |
| Natural gas (per Mcf) | $ | 3.89 | | | $ | 1.95 | | | $ | 2.43 | |
| Natural gas liquids (per Bbl) | $ | 29.94 | | | $ | 11.96 | | | $ | 15.41 | |
| Barrels of oil equivalent (per Boe) | $ | 61.88 | | | $ | 34.62 | | | $ | 52.29 | |
| Production cost per Boe | $ | 11.68 | | | $ | 8.61 | | | $ | 10.58 | |
* Barrels of oil equivalent have been calculated on the basis of six thousand cubic feet (Mcf) of natural gas equal to one barrel of oil equivalent (Boe).
** Amounts exclude the impact of cash paid/received on settled derivative contracts as we did not elect to apply hedge accounting.
|
| | | | | | | |
| | Years Ended December 31, |
| | 2019 | | 2018 |
| Sales Volumes: | | | |
| Oil (MBbl) | 487 |
| | 535 |
|
| Natural gas (MMcf) | 202 |
| | 530 |
|
| Natural gas liquids (MBbl) | 57 |
| | 84 |
|
| Barrels of oil equivalent (MBOE)* | 578 |
| | 707 |
|
| Average daily production (BOE per day) | 1,583 |
| | 1,937 |
|
| Average prices realized:** | |
| | |
|
| Oil (per Bbl) | $ | 59.20 |
| | $ | 67.78 |
|
| Natural gas (per Mcf) | $ | 2.43 |
| | $ | 2.98 |
|
| Natural gas liquids (per Bbl) | $ | 15.41 |
| | $ | 25.20 |
|
| Barrels of oil equivalent (per BOE) | $ | 52.29 |
| | $ | 56.49 |
|
| Production cost per BOE | $ | 10.58 |
| | $ | 10.11 |
|
| |
* | Barrels of oil equivalent have been calculated on the basis of six thousand cubic feet (Mcf) of natural gas equal to one barrel of oil equivalent (BOE). |
| |
** | Amounts exclude the impact of cash paid/received on settled derivative contracts as we did not elect to apply hedge accounting. |
Gross and Net Productive Wells
The following table summarizes our gross and net productive oil and natural gas wells by area as of December 31, 2019.2021. A net well represents our percentage of ownership of a gross well.
| | | | Oil | | Natural Gas | | Total | | Oil | | Natural Gas | | Total |
| | Gross | | Net | | Gross | | Net | | Gross | | Net | | Gross | | Net | | Gross | | Net | | Gross | | Net |
| Midland Basin | 210 |
| | 116 |
| | 2 |
| | 1 |
| | 212 |
| | 117 |
| Midland Basin | 924 | | | 783 | | | 265 | | | 259 | | | 1,189 | | | 1,042 | |
| Eagle Ford Trend | 122 |
| | 52 |
| | — |
| | — |
| | 122 |
| | 52 |
| Eagle Ford Trend | 120 | | | 69 | | | — | | | — | | | 120 | | | 69 | |
Acreage
The following table summarizes our gross and net developed and undeveloped acreage by area and state as of December 31, 2019.2021. Net acreage represents our percentage ownership of gross acreage.
| | | | Developed | | Undeveloped | | Total | | Developed | | Undeveloped | | Total |
| | Gross | | Net | | Gross | | Net | | Gross | | Net | | Gross | | Net | | Gross | | Net | | Gross | | Net |
| Midland Basin | 7,280 |
| | 4,532 |
| | 32,744 |
| | 24,553 |
| | 40,024 |
| | 29,085 |
| Midland Basin | 28,125 | | | 22,669 | | | 87,719 | | | 79,453 | | | 115,844 | | | 102,122 | |
| Eagle Ford Trend | 29,450 |
| | 12,621 |
| | 2,889 |
| | 1,840 |
| | 32,339 |
| | 14,461 |
| Eagle Ford Trend | 22,164 | | | 11,042 | | | 2,179 | | | 1,638 | | | 24,343 | | | 12,680 | |
| Texas | 36,730 |
| | 17,153 |
| | 35,633 |
| | 26,393 |
| | 72,363 |
| | 43,546 |
| Texas | 50,289 | | | 33,711 | | | 89,898 | | | 81,091 | | | 140,187 | | | 114,802 | |
The following table summarizes, as of December 31, 2019,2021, the portion of our gross and net acreage subject to expiration over the next three years if not successfully developed or renewed.
| | | | | | | | | | | | | | | | | | | | | | | | | | | | | | | | | | | | | | | | | | | | | | | |
| | Expiring Acreage |
| | 2022 | | 2023 | | 2024 | | Total |
| | Gross | | Net | | Gross | | Net | | Gross | | Net | | Gross | | Net |
| Midland Basin | 559 | | | 535 | | | 40 | | | 10 | | | 1,336 | | | 609 | | | 1,935 | | | 1,154 | |
| Eagle Ford Trend | 2,732 | | | 2,040 | | | 46 | | | 41 | | | 1,388 | | | 635 | | | 4,166 | | | 2,716 | |
| Total | 3,291 | | | 2,575 | | | 86 | | | 51 | | | 2,724 | | | 1,244 | | | 6,101 | | | 3,870 | |
|
| | | | | | | | | | | | | | | | | | | | | | | |
| | Expiring Acreage |
| | 2020 | | 2021 | | 2022 | | Total |
| | Gross | | Net | | Gross | | Net | | Gross | | Net | | Gross | | Net |
| Midland Basin | 1,365 |
| | 1,109 |
| | 40 |
| | 10 |
| | 518 |
| | 495 |
| | 1,923 |
| | 1,614 |
|
| Eagle Ford Trend | 882 |
| | 188 |
| | 793 |
| | 453 |
| | 2,546 |
| | 1,737 |
| | 4,221 |
| | 2,378 |
|
| Total | 2,247 |
| | 1,297 |
| | 833 |
| | 463 |
| | 3,064 |
| | 2,232 |
| | 6,144 |
| | 3,992 |
|
We have development agreements related to certain of our operated leases in the Midland Basin which require us to drill 11 gross wells (10 net wells) over the next three years. If we do not drill the required wells, we would be in default of the agreements. All
of the aforementioned wells are included in management’s five-year development plan. Approximately 88%99% of the Midland Basin net acreage is held by production and approximately 87%85% of the Eagle Ford net acreage is held by production. On a combined basis, our total net acreage is approximately 88%97% held by production.
Drilling Activities
The following table sets forth information with respect to (i) wells drilled and completed during the periods indicated and (ii) wells drilled in a prior period but completed in the periods indicated.
| | | | | | | | | | | | | | | | | | | | | | | | | | | | | | | | | | | |
| Years Ended December 31, |
| | 2021 | | 2020 | | 2019 |
| Gross | | Net | | Gross | | Net | | Gross | | Net |
| Development wells: | | | | | | | | | | | |
| Productive | 27 | | | 16 | | | 24 | | | 13 | | | 42 | | | 21 | |
Dry(1) | — | | | — | | | — | | | — | | | 1 | | | — | |
| Exploratory wells: | | | | | | | | | | | |
| Productive | — | | | — | | | — | | | — | | | — | | | — | |
| Dry | — | | | — | | | — | | | — | | | — | | | — | |
| Total wells: | | | | | | | | | | | |
| Productive | 27 | | | 16 | | | 24 | | | 13 | | | 42 | | | 21 | |
| Dry | — | | | — | | | — | | | — | | | 1 | | | — | |
| Total | 27 | | | 16 | | | 24 | | | 13 | | | 43 | | | 21 | |
| | | | | | | | | | | |
|
| | | | | | | | | | | |
| | Years Ended December 31, |
| | 2019 | | 2018 |
| | Gross | | Net | | Gross | | Net |
| Development wells: | | | | | | | |
| Productive | 42 |
| | 21 |
| | 40 |
| | 20 |
|
Dry(1) | 1 |
| | — |
| | — |
| | — |
|
| Exploratory wells: | | | | | | | |
| Productive | — |
| | — |
| | — |
| | — |
|
| Dry | — |
| | — |
| | — |
| | — |
|
| Total wells: | | | | | | | |
| Productive | 42 |
| | 21 |
| | 40 |
| | 20 |
|
| Dry | 1 |
| | — |
| | — |
| | — |
|
| Total | 43 |
| | 21 |
| | 40 |
| | 20 |
|
| | | | | | | | |
| |
(1) | The dry hole category includes one gross (0.2 net) non-operated well that was unsuccessful due to mechanical issues. |
The figures in the table above do not include 13nine gross wells (5.3(7.3 net) that were drilled and uncompleted or in the process of being completed at December 31, 2019,2021, all of which are classified as PUDs as of that date and are expected to begin producing in the first and second quartersquarter of 2020. Additionally, we had seven gross (6.8 net) operated wells for which drilling was in progress at December 31, 2019.2022.
Item 3. Legal Proceedings
In the ordinary course of business, we may be involved in litigation and claims arising out of our operations. As of December 31, 2019,2021, and through the filing date of this report, we do not believe the ultimate resolution of any such actions or potential actions of which we are currently aware will have a material effect on our consolidated financial position or results of operations.
A description of our legal proceedings is included in Note. 16.15. Commitments and Contingencies in the Notes to Consolidated Financial Statements included in Item 8 of this report.
Item 4. Mine Safety Disclosures
Not applicable.
PART II
Item 5. Market for Registrant’s Common Equity, Related Stockholder Matters and Issuer Purchases of Equity Securities
Market Information
Shares of our Class A Common Stock are listed on the NYSE under the symbol “ESTE.”
Holders
As of March 1, 2020,2022, there were approximately 2,9001,800 holders of record of our Class A Common Stock and approximately 20eight holders of record of our Class B Common Stock. There is no public market for our Class B Common Stock.
DividendsUnregistered Sales of Equity Securities
None, except to the extent previously included by Earthstone in a Quarterly Report on Form 10-Q or Current Report on Form 8-K.
Dividends
We have never paid dividends on our Class A Common Stock or Class B Common Stock and do not have current plans to pay a dividend. Furthermore, the Credit Agreement restricts the payment of cash dividends. The payment of future cash dividends on our Class A Common Stock, if any, will be reviewed periodically by our Board and will depend upon, but not be limited to, our financial condition, funds available for operations, the amount of anticipated capital and other expenditures, our future business prospects and any restrictions imposed by our present or future financing arrangements.
Repurchase of Equity Securities
The following table sets forth information regarding our acquisition of shares of Class A Common Stock for the periods presented:
| | | | | | | | | | | | | | | | | | | | | | | |
| | Total Number of Shares Purchased (1) | | Average Price Paid Per Share | | Total Number of Shares Purchased as Part of Publicly Announced Plans or Programs | | Maximum Number (or Approximate Dollar Value) of Shares that May Yet Be Purchased Under the Plan or Programs |
| October 2021 | — | | | — | | | — | | | — | |
| November 2021 | — | | | — | | | — | | | — | |
| December 2021 | 64,270 | | | $ | 11.28 | | | — | | | — | |
(1)All of the shares were surrendered by employees (via net settlement) in satisfaction of tax obligations upon the vesting of restricted stock unit awards. The acquisition of the surrendered shares was not part of a publicly announced program to repurchase shares of our Class A Common Stock.
Performance Graph
The following graph reflects a comparison of the cumulative total stockholder return of our Class A Common Stock beginning December 31, 2016 through December 31, 2021, relative to the cumulative total returns of the S&P 500 Index and the S&P Oil & Gas Exploration & Production Select Industry Index. The graph assumes the investment of $100 on December 31, 2016 in our Class A Common Stock and each index and the reinvestment of all dividends, if any. The identity of the companies included in the S&P Oil & Gas Exploration & Production Select Industry Index will be provided upon request.
|
| | | | | | | | | | | | |
| | Total Number of Shares Purchased (1) | | Average Price Paid Per Share | | Total Number of Shares Purchased as Part of Publicly Announced Plans or Programs | | Maximum Number (or Approximate Dollar Value) of Shares that May Yet Be Purchased Under the Plan or Programs |
| October 2019 | — |
| | — |
| | — |
| | — |
|
| November 2019 | — |
| | — |
| | — |
| | — |
|
| December 2019 | 51,678 |
| | $ | 5.94 |
| | — |
| | — |
|
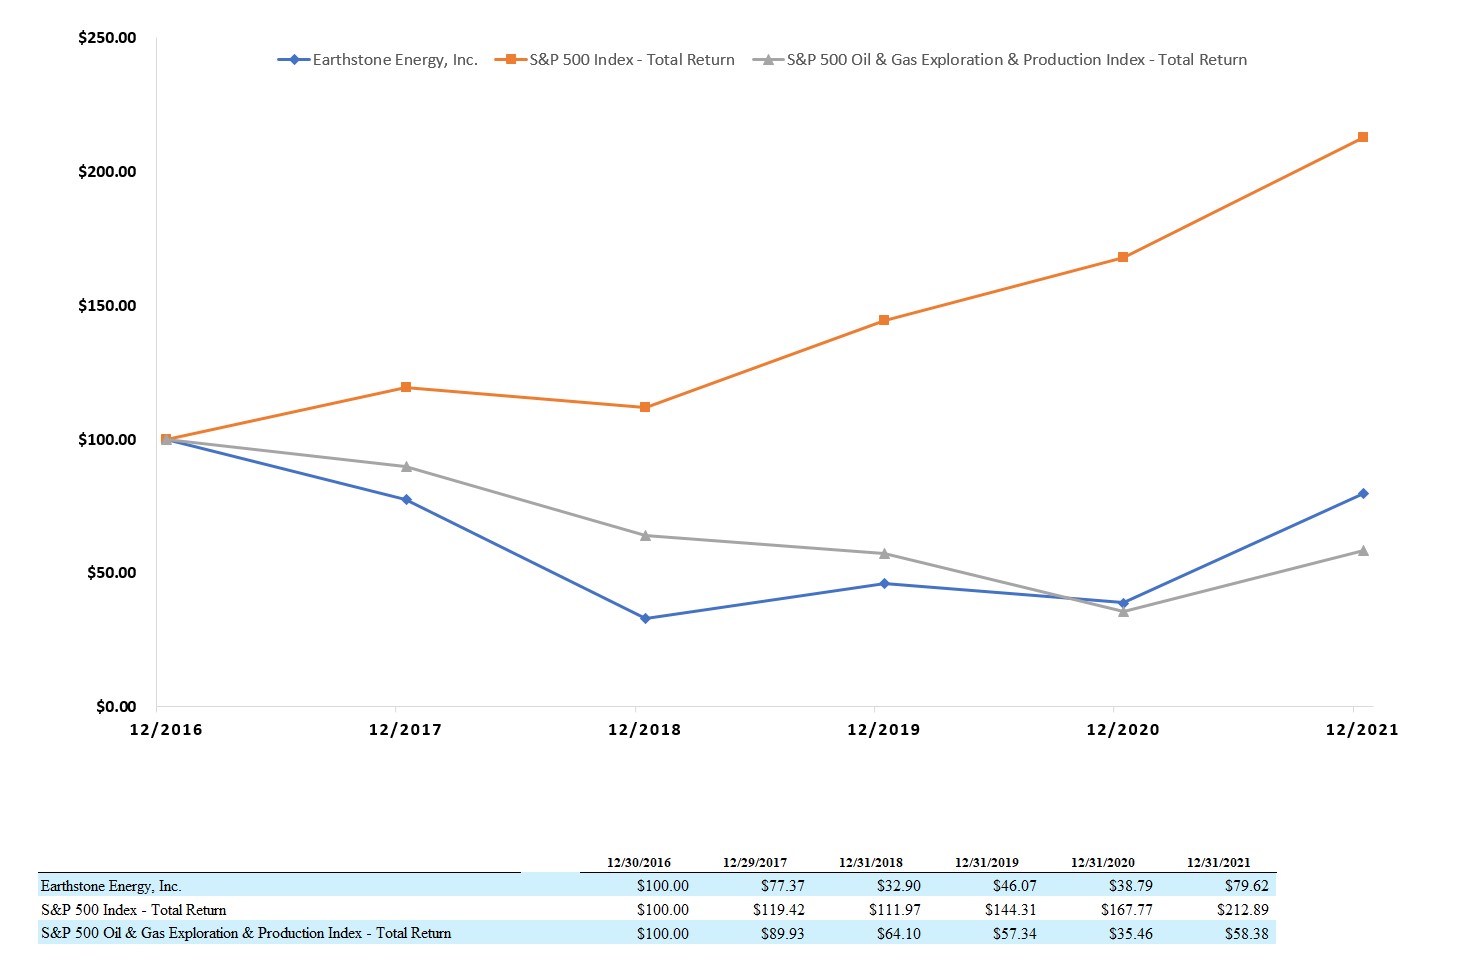
| |
(1) | All of the shares were surrendered by employees (via net settlement) in satisfaction of tax obligations upon the vesting of restricted stock unit awards. The acquisition of the surrendered shares was not part of a publicly announced program to repurchase shares of our Class A Common Stock. |
Item 6. Selected Financial DataReserved
We are a smaller reporting company as defined by Rule 12b-2 of the Exchange Act and therefore are not required to provide the information required under this item.
Item 7. Management’s Discussion and Analysis of Financial Condition and Results of Operations
This discussion and other items in this Annual Report on Form 10-K contain forward-looking statements and information that are based on management’s beliefs, as well as assumptions made by, and information currently available to, management. When used in this document, the words “believe,” “anticipate,” “estimate,” “expect,” “intend,” “may,” “will,” “project,” “forecast,” “plan,” and similar expressions are intended to identify forward-looking statements. Although management believes that the expectations reflected in these forward-looking statements are reasonable, it can give no assurance that these expectations will prove to have been correct. These statements are subject to numerous risks, uncertainties and assumptions. See Cautionary Statement Concerning Forward-Looking Statements in this report. Certain of these risks are summarized in this report under Item 1A. Risk Factors, which you should read carefully in connection with our forward-looking statements. Should one or more of these risks or uncertainties materialize, or should underlying assumptions prove incorrect, actual results may vary materially from those anticipated. We undertake no obligation to release publicly any revisions to these forward-looking statements that may be made to reflect events or circumstances after the date hereof or to reflect the occurrence of unanticipated events.
For a discussion and analysis of our financial condition and results of operations for the year ended December 31, 2020 compared to December 31, 2019, see “Part II, Item 7. Management's Discussion and Analysis of Financial Condition and Results of Operations” of our Annual Report on Form 10-K for the year ended December 31, 2020, which was filed with the SEC on March 10, 2021.
Overview
We are a growth-oriented independent oil and gas company engaged in the acquisition and development of oil and gas reserves through activities that include the acquisition, drilling and development of undeveloped leases, asset and corporate acquisitions and mergers. Our operations are all in the upstream segment of the oil and natural gas industry and all our properties are onshore in the United States. At present, ourOur assets are currently located in the Midland Basin of westin West Texas, and the Eagle Ford Trend of south Texas.
in South Texas, and the Delaware Basin in New Mexico.
Earthstone is the sole managing member of Earthstone Energy Holdings, LLC, a Delaware limited liability company (together with its wholly-owned consolidated subsidiaries, “EEH”), with a controlling interest in EEH. Earthstone, together with its
wholly-owned subsidiary, Lynden Corp, and Lynden Corp’s wholly-owned consolidated subsidiary, Lynden US and also a member of EEH, consolidates the financial results of EEH and records a noncontrolling interest in the Consolidated Financial Statements representing the economic interests of EEH’s members other than Earthstone and Lynden US (collectively, the “Company” “our,” “we,” “us,” or similar terms).
Bighorn Agreement
On January 30, 2022, Earthstone, EEH, and Bighorn entered into the Bighorn Agreement. Pursuant to the Bighorn Agreement, EEH will acquire (the “Bighorn Acquisition”) interests in oil and gas leases and related property of Bighorn located in the Midland Basin in West Texas, for a purchase price (the “Bighorn Purchase Price”) of $770 million in cash and 6,808,511 shares of Class A Common Stock. The Bighorn Purchase Price is subject to customary purchase price adjustments with an effective date of January 1, 2022. In connection with the Bighorn Agreement, EEH deposited $50 million in cash into a third-party escrow account as a deposit pursuant to the Bighorn Agreement, which will be credited against the Bighorn Purchase Price upon closing of the Bighorn Acquisition. The Bighorn Acquisition is expected to close in the second quarter of 2022.
Credit Agreement
On January 30, 2022, Earthstone, EEH, as Borrower, Wells Fargo, as Administrative Agent, the lenders party thereto (the “Lenders”) and the guarantors party thereto entered into an amended and restated Fifth Amendment (the “Amendment”) to the Credit Agreement dated November 21, 2019, by and among EEH, as Borrower, Earthstone, as Parent, Wells Fargo, as Administrative Agent and Issuing Bank, Royal Bank of Canada, as Syndication Agent, Truist Bank, Citizens Bank, N.A., KeyBank National Association, U.S. Bank National Association, Fifth Third Bank, PNC Bank, National Association, and Bank of America, N.A., as Documentation Agents, and the Lenders party thereto (together with all amendments or other modifications, the “Credit Agreement”). Among other things, the Amendment increased the borrowing base and corresponding elected commitments from $650 million to $825 million upon the Chisholm Closing; provides that upon the closing of the Bighorn Acquisition, the borrowing base and corresponding elected commitments would increase to $1.325 billion, unless Earthstone completes a Notes Offering prior to the closing of the Bighorn Acquisition in which case the elected commitments will be reduced by the amount of the net proceeds from a Notes Offering up to $500 million; provides for an increase in interest rates by 0.50% in the event a Notes Offering has not been completed prior to the closing of the Bighorn Acquisition; provides mechanics relating to the transition from LIBOR to a benchmark replacement rate, SOFR, to be effective contemporaneously with the effectiveness of the amendment on January 30, 2022; adds certain hedging requirements relating to anticipated oil and natural gas production of the properties to be acquired pursuant to the Bighorn Acquisition; adjusts some financial covenants; redefines the limitations on certain restricted payments the Borrower may make; and made certain administrative changes to the Credit Agreement.
Securities Purchase Agreement
On January 30, 2022, Earthstone entered into the Securities Purchase Agreement with EnCap Fund XI and Post Oak to sell, in a private placement (the “Private Placement”), 280,000 shares of Preferred Stock, each share of which will be convertible into 90.0900900900901 shares of Class A Common Stock for anticipated gross proceeds of $280.0 million, at a price of $1,000.00 per share of Preferred Stock (or $11.10 per share of Class A Common Stock on an as-converted basis). The Private Placement is contingent upon the closing of the Bighorn Acquisition. The Company intends to use the net proceeds from the sale of the Preferred Stock to partially fund the Bighorn Acquisition. The Preferred Stock will convert automatically on the 20th calendar day after Earthstone mails a definitive information statement to holders of its Common Stock notifying them that holders of a majority of the outstanding shares of Common Stock have consented to the conversion feature of the Preferred Stock and the issuance of Class A Common Stock upon conversion of the Preferred Stock. As of January 30, 2022, Earthstone had received written consent for the conversion feature of the Preferred Stock and the issuance of the Class A Common Stock issuable upon conversion of the Preferred Stock from stockholders representing more than 50% of Earthstone’s outstanding shares of Common Stock. As of the date of the Securities Purchase Agreement, EnCap and its affiliates beneficially owned approximately 46.5% of the outstanding voting power of Earthstone. Two members of the Board are employed by EnCap. The Securities Purchase Agreement and the Private Placement were evaluated and unanimously approved by the Audit Committee and unanimously approved by the Board.
Chisholm Acquisition
On February 15, 2022, Earthstone, EEH, and Chisholm, as seller, consummated the transactions contemplated in the Chisholm Agreement. At the closing of the Chisholm Agreement, among other things, EEH acquired (the “Chisholm Acquisition”) interests in oil and gas leases and related property of Chisholm located in Lea County and Eddy County, New Mexico, for aggregate consideration consisting of: (i) approximately $314.7 million in cash, net of preliminary and customary purchase price adjustments and remains subject to post-closing settlement between EEH and Chisholm paid at the closing of the
Chisholm Acquisition, (ii) $70 million in cash to be paid as follows: $40 million to be paid six months after the closing of the Chisholm Acquisition and $30 million to be paid 12 months after the closing of the Chisholm Acquisition, subject to acceleration in the event that Earthstone receives gross proceeds of more than $450 million from a high yield bond offering or more than $50 million in gross proceeds from an offering of Class A Common Stock or preferred stock; and (iii) 19,417,476 shares of Class A Common Stock. See further discussion in Note 3. Acquisitions and Divestitures and Note 14. Related Party Transactions in the Notes to Consolidated Financial Statements.
Cash consideration for the Chisholm Acquisition was funded by borrowings under our senior secured revolving credit facility whose borrowing base was increased from $650 million to $825 million upon consummation of the Chisholm Acquisition.
Liquidity Update
As of March 1, 2022, we had approximately $1 million in cash and $652 million of long-term debt outstanding under our Credit Agreement, as amended, with a borrowing base of $825 million. With the $173 million of undrawn borrowing base capacity and $1 million in cash, we had total liquidity of approximately $174 million.
Areas of Operation
At present, our primary effortsassets are concentratedlocated almost entirely in the Midland Basin of westand Delaware Basins in West Texas a highand New Mexico, respectively, along with some oil and liquids rich resource basin which provides us with multiple horizontal targets, extensive production histories, long-lived reserves and historically high drilling success rates. natural gas assets in the Eagle Ford Trend of South Texas.
Midland Basin
We believe that the Midland Basin continues to have attractive economics and we expect to continue growing our footprint through development drilling, acreage trades, asset acquisitions, and corporate merger and acquisition opportunities.
In the Midland Basin, we utilized one rig for the entirety of 2019 and two rigs for portions of the second and third quarters, and we plan to maintain a one-rig program throughout 2020. We are currently drilling on a five-well project in Upton County, Texas on our Hamman 30 Unit and anticipate keeping the rig in Upton County and drilling the six-well pad in our Ratliff project. Having ended 2019 with three wells waiting on completion, we plan to commence completions on those three wells in Reagan County in the first quarter of 2020 followed by five wells in Upton County, with all eight wells expected to be brought online throughout the second quarter of 2020.
We continue to be active in acreage trades and acquisitions in the Midland Basin which generally allow for longer laterals, increased operated inventory and greater operating efficiency.
Eagle Ford Trend
During 2019,2021, we drilled, completed and brought online 10began producing from 19 gross / 5.115.4 net operated wells and 8 gross / 0.8 net non-operated wells. We exited 2021 with 14 gross / 13.7 net operated wells that were in various stages of drilling and completion, of which 5 gross / 5 net wells have been completed as of March 1, 2022. We expect to complete and bring the remaining 9 gross / 8.7 net wells online in southern Gonzales County, Texas. We do notthe second quarter of 2022.
Consistent with our operations from the latter part of 2021, we are running two drilling rigs in the Midland Basin, and we plan to drill anydo so throughout 2022. We anticipate spudding 40 gross / 35.8 net operated wells and bringing online 40 gross / 36.7 net operated wells on our Midland Basin properties during 2022.
Delaware Basin
Upon the consummation of the Chisholm Acquisition on February 15, 2022, we acquired approximately 36,100 net acres located in the Delaware Basin with approximately 85% held by production and approximately 92% operated. We now have interests in approximately 333 gross / 168.6 net producing wells, of which we operate 190 gross / 149.5 net producing wells. We have identified approximately 414 gross / 237.1 net potential drilling locations in this acreage.
We are currently utilizing two drilling rigs on our recently acquired Chisholm acreage, and we plan to do so throughout 2022 and we plan to spud 20 gross / 11.8 net operated wells and bring online 18 gross / 11.6 net operated wells in this area during 2020 but may consider drilling if there are improvements in oil and natural gas commodity prices.the Delaware Basin.
On November 21, 2019, we entered into a new credit agreement with respect to our senior secured revolving credit facility. The Credit Agreement has a maturity date of November 21, 2024 with a maximum credit amount of $1.5 billion and an initial borrowing base of $325 million. The Credit Agreement replaced the prior credit agreement, which was terminated on November 21, 2019.
Officer Appointments
On January 30, 2020, we announced that our current Chairman and Chief Executive Officer, Mr. Frank A. Lodzinski, will be appointed Executive Chairman and our current President, Mr. Robert J. Anderson, will be appointed Chief Executive Officer and President, effective on April 1, 2020.
Results of Operations
Year ended December 31, 20192021 compared to the year ended December 31, 20182020
| | | | | Years Ended December 31, | | | | | Years Ended December 31, | | |
| | | 2019 | | 2018 | | Change | | | 2021 | | 2020 | | Change |
| Sales volumes: | | | | | | | Sales volumes: | | | | | | |
| Oil (MBbl) | | 3,086 |
| | 2,370 |
| | 30 | % | Oil (MBbl) | | 4,381 | | | 3,180 | | | 38 | % |
| Natural gas (MMcf) | | 4,760 |
| | 3,610 |
| | 32 | % | Natural gas (MMcf) | | 14,505 | | | 7,282 | | | 99 | % |
| Natural gas liquids (MBbl) | | 1,022 |
| | 655 |
| | 56 | % | Natural gas liquids (MBbl) | | 2,257 | | | 1,198 | | | 88 | % |
Barrels of oil equivalent (MBOE) (1) | | 4,902 |
| | 3,627 |
| | 35 | % | |
Barrels of oil equivalent (MBoe) (1) | | Barrels of oil equivalent (MBoe) (1) | | 9,055 | | | 5,591 | | | 62 | % |
| Average daily production (BOE per day) | | 13,429 |
| | 9,937 |
| | 35 | % | Average daily production (BOE per day) | | 24,809 | | | 15,276 | | | 62 | % |
| | | | | | | | |
| Average prices realized: | | | | | | | Average prices realized: | | | | | | |
| Oil (per Bbl) | | $ | 55.71 |
| | $ | 59.40 |
| | (6 | )% | Oil (per Bbl) | | $ | 67.83 | | | $ | 37.85 | | | 79 | % |
| Natural gas (per Mcf) | | $ | 0.82 |
| | $ | 2.05 |
| | (60 | )% | Natural gas (per Mcf) | | $ | 3.50 | | | $ | 1.18 | | | 197 | % |
| Natural gas liquids (per Bbl) | | $ | 15.09 |
| | $ | 26.23 |
| | (42 | )% | Natural gas liquids (per Bbl) | | $ | 31.76 | | | $ | 13.03 | | | 144 | % |
| | | | | | | | |
| Average prices adjusted for realized derivatives settlements: | | | | | | | Average prices adjusted for realized derivatives settlements: | |
| Oil ($/Bbl) | | $ | 59.82 |
| | $ | 53.13 |
| | 13 | % | Oil ($/Bbl) | | $ | 52.32 | | | $ | 54.95 | | | (5) | % |
| Natural gas ($/Mcf) | | $ | 1.49 |
| | $ | 1.98 |
| | (25 | )% | Natural gas ($/Mcf) | | $ | 2.89 | | | $ | 1.42 | | | 104 | % |
| Natural gas liquids ($/Bbl) | | $ | 15.09 |
| | $ | 26.23 |
| | (42 | )% | Natural gas liquids ($/Bbl) | | $ | 31.76 | | | $ | 13.03 | | | 144 | % |
| | | | | | | | |
| (In thousands) | | | | | | | (In thousands) | | | | | | |
| Oil revenues | | $ | 171,925 |
| | $ | 140,775 |
| | 22 | % | Oil revenues | | $ | 297,177 | | | $ | 120,355 | | | 147 | % |
| Natural gas revenues | | 3,913 |
| | 7,396 |
| | (47 | )% | Natural gas revenues | | 50,809 | | | 8,567 | | | 493 | % |
| Natural gas liquids revenues | | 15,424 |
| | 17,185 |
| | (10 | )% | Natural gas liquids revenues | | 71,657 | | | 15,601 | | | 359 | % |
| Total revenues | | $ | 191,262 |
| | $ | 165,356 |
| | 16 | % | Total revenues | | $ | 419,643 | | | $ | 144,523 | | | 190 | % |
| | | | | | | | | | | | | |
| Lease operating expense | | $ | 28,683 |
| | $ | 18,746 |
| | 53 | % | Lease operating expense | | $ | 49,321 | | | $ | 29,131 | | | 69 | % |
| Production and ad valorem taxes | | $ | 11,871 |
| | $ | 9,836 |
| | 21 | % | Production and ad valorem taxes | | $ | 26,409 | | | $ | 9,411 | | | 181 | % |
| Impairment expense | | $ | — |
| | $ | 4,581 |
| | NM |
| Impairment expense | | $ | — | | | $ | 64,498 | | | NM |
| Depreciation, depletion and amortization | | $ | 69,243 |
| | $ | 47,568 |
| | 46 | % | Depreciation, depletion and amortization | | $ | 106,367 | | | $ | 96,414 | | | 10 | % |
| | | | | | | | |
| General and administrative expense (excluding stock-based compensation) | | $ | 18,963 |
| | $ | 20,275 |
| | (6 | )% | General and administrative expense (excluding stock-based compensation) | | $ | 20,908 | | | $ | 18,179 | | | 15 | % |
| Stock-based compensation | | $ | 8,648 |
| | $ | 7,071 |
| | 22 | % | Stock-based compensation | | $ | 21,014 | | | $ | 10,054 | | | 109 | % |
| General and administrative expense | | $ | 27,611 |
| | $ | 27,346 |
| | 1 | % | General and administrative expense | | $ | 41,922 | | | $ | 28,233 | | | 48 | % |
| | | | | | | | |
| Transaction costs | | $ | 1,077 |
| | $ | 14,337 |
| | (92 | )% | Transaction costs | | $ | 4,875 | | | $ | 622 | | | 684 | % |
| Gain on sale of oil and gas properties, net | | $ | 3,222 |
| | $ | 1,919 |
| | 68 | % | |
| | Interest expense, net | | $ | (6,566 | ) | | $ | (2,898 | ) | | 127 | % | Interest expense, net | | $ | (10,796) | | | $ | (5,232) | | | 106 | % |
| Write-off of deferred financing costs | | $ | (1,242 | ) | | $ | — |
| | NM |
| |
| | | | | | | | | |
| Unrealized (loss) gain on derivative contracts | | $ | (59,849 | ) | | $ | 76,037 |
| | (179 | )% | Unrealized (loss) gain on derivative contracts | | $ | (40,795) | | | $ | 3,855 | | | (1,158) | % |
| Realized gain (loss) on derivative contracts | | $ | 15,866 |
| | $ | (15,090 | ) | | (205 | )% | |
| Realized (loss) gain on derivative contracts | | Realized (loss) gain on derivative contracts | | $ | (75,966) | | | $ | 56,044 | | | (236) | % |
| (Loss) gain on derivative contracts, net | | $ | (43,983 | ) | | $ | 60,947 |
| | (172 | )% | (Loss) gain on derivative contracts, net | | $ | (116,761) | | | $ | 59,899 | | | (295) | % |
| | | | | | | | |
| Litigation settlement | | $ | — |
| | $ | (4,675 | ) | | NM |
| |
| Income tax expense | | $ | (1,665 | ) | | $ | (2,470 | ) | | (33 | )% | |
| | Income tax (expense) benefit | | Income tax (expense) benefit | | $ | (1,859) | | | $ | 112 | | | (1,760) | % |
(1)Barrels of oil equivalent have been calculated on the basis of six thousand cubic feet (Mcf) of natural gas equals one barrel of oil equivalent (Boe).
| |
(1) | Barrels of oil equivalent have been calculated on the basis of six thousand cubic feet (Mcf) of natural gas equals one barrel of oil equivalent (BOE). |
NM – Not meaningful
Results of Operations Highlights
The IRM Acquisition, the Eagle Ford Acquisitions, the Tracker Acquisition, the Sequel Acquisition, the Foreland Acquisition and the BCC Acquisition (collectively, the “Acquisitions”) have had a significant and pervasive impact on our results of operations when compared to the prior year and, as it relates to the year ended December 31, 2020, diminished somewhat by operating results due to voluntary production shut-ins resulting from low commodity prices. In addition, commodity prices in 2021 have improved compared to the prior corresponding periods further impacting our results of operations. Below is a detailed discussion highlighting the impact of our recent acquisitions.
Oil revenues
For the year ended December 31, 2019,2021, oil revenues increased by approximately $31.2$176.8 million or 22% relative147% compared to the comparable period in 2018.2020. Of the increase, approximately $39.9$95.3 million was attributable to increased sales volumes, partially offset by a decrease of $8.7an increase in our realized price and $81.5 million duewas attributable to lower realized prices.an increase in volume. Our average realized price per Bbl decreasedincreased from $59.40$37.85 for the year ended December 31, 20182020 to $55.71$67.83 or 6%79% for the year ended December 31, 2019.2021. We had a net increase in the volume of oil sold of 7161,202 MBbls or 30%38%, primarily duewhich included an increase of 1,562 MBbls related to the wells acquired in the Acquisitions and new wells broughtcoming online partiallyrelated to our 2021 drilling program, offset by the impacta decrease of divestitures360 MBbls in the latter half of 2018.our other wells primarily resulting from natural declines and shut-ins resulting from Winter Storm Uri in February 2021.
Natural gas revenues
For the year ended December 31, 2019,2021, natural gas revenues decreasedincreased by $3.5$42.2 million or 47% relative493% compared to the comparable period in 2018.2020. Of the decrease, approximately $4.4increase, $25.3 million was due to increased sales volumes and $16.9 million was attributable to lower realized prices, partially offset by an increase of $0.9 million attributable to increased sales volumes.in realized price. Our average realized price per Mcf decreased 60%increased 197% from $2.05$1.18 for the year ended December 31, 20182020 to $0.82$3.50 for the year ended December 31, 2019. Approximately 96% of our natural gas sales volumes for the year was from the Midland Basin, which, since the fourth quarter of 2018, has been experiencing a lack of sufficient pipeline transportation that is connected to markets which are purchasing the gas. This has resulted in negative gas prices at times, whereby the seller is actually paying the purchaser to take the gas.2021. The total volume of natural gas produced and sold increased 1,1507,223 MMcf or 32%99% which included an increase of 5,910 MMcf related to the wells acquired in the Acquisitions and an increase of 1,313 MMcf in our other wells primarily due toresulting from new wells broughtcoming online partially offsetrelated to our 2021 drilling program, as well as prior year volumes being impacted by the impact of 2018 gas well divestitures.voluntary production shut-ins.
Natural gas liquidsNGL revenues
For the year ended December 31, 2019, natural gas liquids2021, NGL revenues decreasedincreased by $1.8$56.1 million or 10% relative359% compared to the comparable period in 2018.2020. Of the decrease, approximately $7.3increase, $33.6 million was attributable to lower realized prices, partially offset byhigher sales volumes and $22.5 million was due to an increase of $5.5 million attributable to increased sales volumes. Approximately 94% ofin our natural gas liquids sales volumes for the period was from the Midland Basin. Since the fourth quarter of 2018, the price for fractionated natural gas liquids has decreased, and after also taking into account the cost to transport our natural gas liquids, has resulted in significant decreases in prices received.realized price. The volume of natural gas liquidsNGLs produced and sold increased by 3671,059 MBbls or 56%88%, which included an increase of 870 MBbls related to the wells acquired in the Acquisitions and an increase of 189 MBbls in our other wells primarily due toresulting from new wells broughtcoming online partially offsetrelated to our 2021 drilling program, as well as prior year period volumes being impacted by the impact of divestitures in the latter half of 2018.voluntary production shut-ins.
Lease operating expense (“LOE”)
LOE includes all costs incurred to operate wells and related facilities for both operated and non-operated properties. In addition to direct operating costs such as labor, repairs and maintenance, re-engineering and workovers, equipment rentals, materials and supplies, fuel and chemicals, LOE includes product marketing and transportation fees, insurance and overhead charges provided for in operating agreements.
LOE increased by $9.9$20.2 million or 53%69% for the year ended December 31, 2019 relative2021 compared to the comparable period in 2018,2020, primarily due to additional producing wells brought online, which drove a 35% increase in production volume, in addition to a $3.6$16.1 million increase drivenresulting from the LOE of the properties acquired in the Acquisitions and a $4.1 million increase resulting from new wells coming online related to our 2021 drilling program, as well as prior year period volumes being impacted by a greater number of workover projects as compared to the prior year.voluntary production shut-ins.
Production and ad valorem taxes
Production and ad valorem taxes for the year ended December 31, 20192021 increased by $2.0$17.0 million or 21% relative to the comparable period in 2018, as the impact of increased volume was largely offset by the impact of decreased commodity prices. As a percentage of revenues from oil, natural gas, and natural gas liquids, production taxes remained flat when181% compared to 2020, due to a $10.6 million increase resulting from the properties acquired in the Acquisitions and a $6.4 million increase related to our existing wells resulting from improved commodity prices, as well as prior year.year period volumes being impacted by voluntary production shut-ins.
Impairment
During the year ended December 31, 2018,2021, we recognized $4.6did not record any non-cash impairments with respect to our oil and natural gas assets. During the year ended December 31, 2020, we recorded non-cash impairments totaling $64.5 million which consisted of non-cash asset impairments$25.3 million to ourproved oil and natural gas properties, $21.6 million to unproved oil and natural gas properties resulting from certain acreage expirations relatedand $17.6
million to our Eagle Ford Trend properties.goodwill. See Note 7. Oil and Natural Gas Properties in the Notes to Consolidated Financial Statements for a discussion of how impairments are measured.
Depreciation, depletion and amortization (“DD&A”)
DD&A increased for the year ended December 31, 20192021 by $21.7$10.0 million, or 46% relative10% compared to the comparable period in 2018,2020, primarily due to development activity that resulted in increased costs subject to depletion and ana $28.9 million increase in production primarilyDD&A related to the assets acquired in the Midland Basin.
Acquisitions, offset by an $18.9 million decrease in DD&A related to our other wells primarily resulting from lower prior year period volumes due to the impact of voluntary production shut-ins, as well as additional volumes added to the depletable base of our properties resulting from the impact of improved commodity prices on our estimated proved reserves.
General and administrative expense (“G&A”)
These expenses consist primarily of employee remuneration, professional and consulting fees and other overhead expenses. G&A increased by $0.3 million for the year ended December 31, 2019 relative2021 increased by $13.7 million, or 48% compared to the comparable period in 2018,2020, primarily due to a $0.3an increase of $11.0 million increase in employee costs in the current year resulting from a larger average headcount, as well as a $1.6 million increase in non-cash stock-based compensation expense partially offset by a $1.6of which $7.9 million decrease in bonus awards recordedresulted from the modification of an equity award and $3.1 million resulted from an increase in the current year.market value of our Class A Common Stock. The remainder of the increase was due to $1.7 million resulting from the reinstatement of our short-term incentive program which was suspended in the prior year period and an increase of $1.0 million related to professional fees and lower administrative overhead reimbursements.
Transaction costs
For the year ended December 31, 2019, transactions2021, transaction costs consistedincreased by $4.3 million compared to 2020, primarily due to $6.1 million in legal and professional fees and severance costs primarily associated with the Acquisitions and other potential acquisitions, partially offset by $1.2 million of $1.1 million,net reimbursements received related to the Olenik litigation. During the year ended December 31, 2020, we recorded transaction costs primarily due to legal, consulting and other fees for ongoing litigationof approximately $1.0 million related to the IRM Acquisition which was consummated on January 7, 2021 and $0.3 million related to other potential transactions, offset by net reimbursements of $0.7 million related to the business combination (the “Bold Transaction”) pursuant to the Bold TransactionContribution Agreement (as defined below) which closed on May 9, 2017. During the year ended December 31, 2018, we recorded $14.3 million in transaction costs including $13.4 million associated with the terminated Sabalo Acquisition, and $0.8 million of legal fees for litigation related to the Bold Transaction which closed on May 9, 2017. See Note 3. Acquisitions and Divestitures in the Notes to Consolidated Financial Statements.
Interest expense, net
Interest expense includes commitment fees, amortization of deferred financing costs, and interest on outstanding indebtedness. Interest expense increased from $5.2 million for the year ended December 31, 2019 was $6.6 million compared2020, to $2.9$10.8 million for the comparable period in 2018. The $3.7 million increase in interest expense was primarilyyear ended December 31, 2021 due to higher average borrowings outstanding compared to the prior year period.primarily resulting from borrowings related to the Acquisitions. See Note13.12. Long-Term Debt in the Notes to Consolidated Financial Statements.
Write-off of deferred financing costs
During the year ended December 31, 2019, in connection with the termination of the prior credit agreement, $1.2 million of remaining unamortized deferred financing costs were expensed and included in Write-off of deferred financing costs in the Consolidated Statements of Operations. See Note13. Long-Term Debt in the Notes to Consolidated Financial Statements.
Gain on sale of oil and gas properties, net
During the year ended December 31, 2019, we sold certain non-operated oil and gas properties located in the Midland Basin, recording gains totaling $3.2 million. During the year ended December 31, 2018, we sold certain non-core oil and gas properties including our non-operated Eagle Ford assets located in south Texas, recording gains totaling $1.9 million. See Note 3. Acquisitions and Divestitures in the Notes to Consolidated Financial Statements..
(Loss) gain on derivative contracts, net
For the year ended December 31, 2019,2021, we recorded a net loss on derivative contracts of $44.0$116.8 million, consisting of unrealized mark-to-marketnet realized losses on settlements of $59.8our commodity hedges of $76.9 million, partially offset by net realized gains on settlementsour interest rate swap of $15.9 million.$0.9 million, along with unrealized mark-to-market losses of $41.2 million related to our commodity hedges, partially offset by unrealized mark-to-market gains of $0.4 million related to our interest rate swap. For the year ended December 31, 2018,2020, we recorded a net gain on derivative contracts of $60.9$59.9 million, consisting of net realized gains on settlements of $56.0 million and unrealized mark-to-market gains of $76.0 million, partially offset by net realized losses on settlements of $15.1$3.9 million.
Litigation Settlement
On August 18, 2017, litigation captioned Trinity Royalty Partners, LP v. Bold Energy III LLC, et al. was filed with the 142nd Judicial District of the District Court in Midland County, Texas, asserting breach of contract and indemnity claims for alleged damages from loss of property relating to two oil and natural gas wells in which Bold was the operator. Trinity Royalty Partners, LP (“Trinity”) claimed that Bold was required to indemnify Trinity under the terms of an assignment and a Participation and Joint Development Agreement between Bold and Trinity. Damages were claimed to include costs incurred in attempting to repair and restore an oil and natural gas well and for the loss of future reserves attributable to both wells. On November 16, 2018 Trinity and Bold entered into a Confidential Settlement Agreement and Mutual Release whereby Trinity and Bold agreed to settle the lawsuit and release all claims and counterclaims asserted by the parties. As a result, a $4.7 million expense has been recorded to Litigation settlement in the Consolidated Statements of Operations for the year ended December 31, 2018.
Income tax expense(expense) benefit
During the year ended December 31, 2019, we2021, the Company recorded total income tax expense of $1.7$1.9 million which included (1) deferred income tax expense for Lynden US of $0.1$0.9 million as a result of its share of the distributable income from EEH, (2) deferred income tax expense for Earthstone of $0.4$6.3 million as a result of its share of the distributable incomeloss from EEH, which was used to reduce theoffset by a valuation allowance recorded against its deferred tax asset as future realization of the net deferred tax asset cannot be assured and (3) current income tax expense of $0.63 million and (4) deferred income tax expense of $1.6$0.33 million related to the Texas Margin Tax. Lynden Corp incurred no material income or loss, or related income tax expense or benefit, for the year ended December 31, 2019.
2021.
During the year ended December 31, 2018, we2020, the Company recorded a total income tax expensebenefit of $2.5$0.11 million which included (1) deferred income tax expense for Lynden US of $1.9$0.15 million as a result of its share of the distributable income from EEH, offset by a $0.5 million discrete income tax benefit related to refundable AMT tax credits resulting from the TCJA, (2) deferred income tax expensebenefit for Earthstone of $7.4$0.61 million as a result of its share of the distributable incomeloss from EEH, which was used to reduce theoffset by a valuation allowance recorded against its deferred tax asset as future realization of the net deferred tax asset cannot be assured and (3) deferredcurrent income tax expense of $1.1$0.55 million offset by deferred income tax benefit of $0.51 million related to the Texas Margin Tax. Lynden Corp incurred no material income or loss, or related income tax expense or benefit, for the year ended December 31, 2018.2020.
Liquidity and Capital Resources
We have significant undeveloped acreage and future drilling locations. Drilling horizontal wells, generally consisting of 7,500 to 12,000-foot lateral lengths, in the Midland Basinand Delaware Basins is capital intensive. AtAs of December 31, 2019,2021, we had approximately $13.8$4.0 million in cash and approximately $155.0$320.0 million of long-term debt outstanding under our Credit Agreement with a borrowing base of $650.0 million. With the $330.0 million of undrawn borrowing base capacity and $4.0 million in unused borrowing capacity undercash, we had total liquidity of approximately $334.0 million. Subsequent to year-end, Earthstone closed on its previously announced Chisholm Acquisition and amended the Credit Agreement. As of March 1, 2022, we had approximately $1 million in cash and $652 million of long-term debt outstanding under our Credit Agreement, (discussed below) foras amended, with a borrowing base of $825 million. With the $173 million of undrawn borrowing base capacity and $1 million in cash, we had total liquidity of approximately $168.8 million in funds available for operational and capital funding.$174 million.
Subsequent to December 31, 2019, oil prices have declined sharply in response to drastic price cutting and increased production by Saudi Arabia coupled with reduced demand caused by the global coronavirus outbreak.
Prior to the sharp decline in oil prices, we anticipated 2020 capital expenditures of $160-170 million which assumed a one-rig, 19-well operated programWith two drilling rigs operating in the Midland Basin and estimated expenditures for our non-operated Midlandtwo additional rigs operating in the Delaware Basin, properties. We are currently evaluating our 2020 capital plans as low oil prices for extended periods of time may negatively impact our stock price and cash flows and may result in non-cash impairment charges to the carrying values of our oil and gas properties.
Despite the significant decline in oil prices, we believe we are well positioned to manage the current low-price environment due to our low leverage and strong hedge position. Additionally, we have no long-term service contracts nor significant drilling obligations which would allow us to curtail our capital program should we so choose. Based on our production profile, cost structure and the hedge positions we have in place, we expect to generate free cash flow to reduce debt in the second half of 2020 should we significantly curtailspend $410-$440 million based on our capital program. As a result, wecurrent 2022 drilling plan. We believe we will have sufficient liquidity with cash flows from operations and borrowings under the Credit Agreement to meet our cash requirements for the next 12 months.
Working Capital
Working Capital defined herein as Total current assets less Total current liabilities as set forth in our Consolidated Balance Sheets,(presented below) was a deficit of $39.9$89.2 million as of December 31, 20192021 compared to a deficit of $18.3$20.8 million as of December 31, 20182020, representing an increase in the deficit of $68.4 million. Of the $68.4 million increase in the working capital deficit, $50.3 million resulted from a decrease in the net fair value of our derivative contracts expected to settle in the 12 months subsequent to December 31, 2021 resulting from increased oil price futures as of December 31, 2021. The remaining decrease of $18.1 million primarily resulted from increased drilling in the current year. The components of working capital are presented below:
| | | | | | | | | | | |
| | December 31, |
| (in thousands) | 2021 | | 2020 |
| Current assets: | | | |
| Cash | $ | 4,013 | | | $ | 1,494 | |
| Accounts receivable: | | | |
| Oil, natural gas, and natural gas liquids revenues | 50,575 | | | 16,255 | |
| Joint interest billings and other, net of allowance of $19 and $19 at December 31, 2021 and 2020, respectively | 2,930 | | | 7,966 | |
| Derivative asset | 1,348 | | | 7,509 | |
| Prepaid expenses and other current assets | 2,549 | | | 1,509 | |
| Total current assets | 61,415 | | | 34,733 | |
| | | |
| Current liabilities: | | | |
| Accounts payable | $ | 31,397 | | | $ | 6,232 | |
| Revenues and royalties payable | 36,189 | | | 27,492 | |
| Accrued expenses | 31,704 | | | 16,504 | |
| Asset retirement obligation | 395 | | | 447 | |
| Derivative liability | 45,310 | | | 1,135 | |
| Advances | 4,088 | | | 2,277 | |
| Operating lease liability | 681 | | | 773 | |
| Finance lease liability | — | | | 69 | |
| Other current liabilities | 851 | | | 565 | |
| | | |
| Total current liabilities | 150,615 | | | 55,494 | |
| | | |
| Working Capital (deficit) | $ | (89,200) | | | $ | (20,761) | |
|
| | | | | | | | | | | |
| | December 31, | | | |
| | 2019 | | 2018 | | Change | |
| Current assets: | | | | | | |
| Cash | $ | 13,822 |
| | $ | 376 |
| | 13,446 |
| |
| Accounts receivable: | | | | | | |
| Oil, natural gas, and natural gas liquids revenues | 29,047 |
| | 13,683 |
| | 15,364 |
| (1) |
| Joint interest billings and other, net of allowance of $83 and $134 at December 31, 2019 and 2018, respectively | 6,672 |
| | 4,166 |
| | 2,506 |
| |
| Derivative asset | 8,860 |
| | 43,888 |
| | (35,028 | ) | (2) |
| Prepaid expenses and other current assets | 1,867 |
| | 1,443 |
| | 424 |
| |
| Total current assets | 60,268 |
| | 63,556 |
| | | |
| | | | | | | |
| Current liabilities: | | | | | | |
| Accounts payable | $ | 25,284 |
| | $ | 26,452 |
| | (1,168 | ) | |
| Revenues and royalties payable | 35,815 |
| | 28,748 |
| | 7,067 |
| (1) |
| Accrued expenses | 19,538 |
| | 22,406 |
| | (2,868 | ) | |
| Asset retirement obligation | 308 |
| | 557 |
| | (249 | ) | |
| Derivative liability | 6,889 |
| | 528 |
| | 6,361 |
| (2) |
| Advances | 11,505 |
| | 3,174 |
| | 8,331 |
| (3) |
| Operating lease liability | 570 |
| | — |
| | 570 |
| |
| Finance lease liability | 206 |
| | — |
| | 206 |
| |
| Other current liability | 43 |
| | — |
| | 43 |
| |
| Total current liabilities | 100,158 |
| | 81,865 |
| | | |
| | | | | | | |
| Working Capital | $ | (39,890 | ) | | $ | (18,309 | ) | | (21,581 | ) | |
| |
(1) | Primarily the result of increased December production in 2019 as compared to the same period in 2018. |
| |
(2) | Primarily the result of a net decrease in fair value of our derivative contracts expected to settle over the next 12 months due to increased oil price futures. |
| |
(3) | At December 31, 2019, we had received advances of $2.5 million related to our Eagle Ford drilling and completion activities and $9.0 million related to our Midland drilling and completion activities. |
We expect that changes in receivables and payables related to our pace of development, production volumes, changes in our hedging activities, realized commodity prices and differentials to NYMEX prices for our oil and natural gas production will continue to be the largest variables affecting our working capital.
We expect to finance future development activities with cash flows from operating activities, borrowings under the Credit Agreement and, various means of corporate and project financing. In addition, as indicated above,Additionally, we may continue to partially finance our
drilling activities through the sale of participating rights to financial institutions or industry participants, and we could structure such arrangements on a promoted basis, whereby we may earn working interests in reserves and production greater than our proportionate share of capital costs.
In July 2019, we entered into a Wellbore Development Agreement (“WDA”) with a non-affiliated industry partner. This WDA will reduce our working interestCash Flows from Operating Activities
Cash flows provided by operating activities for the year ended December 31, 2021 increased to $230.9 million compared to $131.5 million for the year ended December 31, 2020, primarily due to the impact of oil and natural gas property acquisitions and the timing of payments and receipts partially offset by the cash settlement of derivative contracts as compared to the prior year.
Cash Flows from Investing Activities
Cash flows used in certain wellsinvesting activities for the year ended December 31, 2021 increased to $426.2 million from $87.8 million for the year ended December 31, 2020, primarily due to acquisitions of oil and gas properties.
Cash Flows from Financing Activities
Cash flows provided by financing activities were $197.9 million for the year ended December 31, 2021 as compared to cash flows used in Reagan County. The industry partner is obligatedfinancing activities of $56.0 million for the year ended December 31, 2020, primarily due to pay a promoted (proportionately higher) shareborrowings required to fund acquisitions of the capital expenditures on an initial eight wells, with an option to participate, on the same basis, in up to 11 additional wells, to earn 35% of the working interest in these wells.oil and gas properties.
Capital Expenditures
Our accrual basis capital expenditures for the years ended December 31, 20192021, 2020 and 20182019 were as follows:
|
| | | | | | | |
| | Years Ended December 31, |
| | 2019 | | 2018 |
| Drilling and completions | $ | 202,332 |
| | $ | 151,059 |
|
| Leasehold costs | 8,098 |
| | 2,102 |
|
| Total capital expenditures | $ | 210,430 |
| | $ | 153,161 |
|
Credit Agreement
On November 21, 2019, we entered into a new credit agreement with respect to our senior secured revolving credit facility. The Credit Agreement has a maturity date of November 21, 2024 with a maximum credit amount of $1.5 billion and an initial borrowing base of $325 million. As of December 31, 2019, we had $170.0 million of borrowings outstanding, bearing annual interest of 3.860%, resulting in a remaining $155.0 million of borrowing base availability under the Credit Agreement. | | | | | | | | | | | | | | | | | |
| | Years Ended December 31, |
| (In thousands) |
| 2021 | | 2020 | | 2019 |
| Drilling and completions | $ | 127,884 | | | $ | 66,580 | | | $ | 202,332 | |
| Leasehold costs | 2,608 | | | 208 | | | 8,098 | |
| | | | | |
| Total capital expenditures | $ | 130,492 | | | $ | 66,788 | | | $ | 210,430 | |
| | | | | |
Hedging Activities
The following table sets forth our outstanding derivative contracts at December 31, 2019.2021. When aggregating multiple contracts, the weighted average contract price is disclosed.
| | | | | | | | | | | | | | | | | | | | |
| Period | | Commodity | | Volume
(Bbls / MMBtu) | | Price
($/Bbl / $/MMBtu) |
| 2022 | | Crude Oil Swap | | 2,768,250 | | $57.69 |
| 2022 | | Crude Oil Basis Swap(1) | | 3,832,500 | | $0.51 |
| 2022 | | Natural Gas Swap | | 5,900,000 | | $3.20 |
| 2022 | | Natural Gas Basis Swap(2) | | 9,100,000 | | $(0.26) |
| 2023 | | Natural Gas Swap | | 1,375,000 | | $3.27 |
| | | | | | |
| | | | | | |
| | | | | | |
| | | | | | |
(1)The basis differential price is between WTI Midland Argus Crude and the WTI NYMEX.
(2)The basis differential price is between W. Texas (WAHA) and the Henry Hub NYMEX.
| | | | | | | | | | | | | | | | | | | | | | | | | | |
| | | Costless Collars | | |
| Period | | Commodity | | Volume
(Bbls / MMBtu) | | Bought Floor
($/Bbl / $/MMBtu) | | Sold Ceiling
($/Bbl / $/MMBtu) |
| 2022 | | Crude Oil Costless Collar | | 730,000 | | | $ | 60.00 | | | $ | 73.73 | |
| 2023 | | Crude Oil Costless Collar | | 365,000 | | | $ | 55.00 | | | $ | 71.75 | |
| 2022 | | Natural Gas Costless Collar | | 4,037,500 | | | $ | 3.43 | | | $ | 5.10 | |
| 2023 | | Natural Gas Costless Collar | | 888,000 | | | $ | 3.25 | | | $ | 5.13 | |
|
| | | | | | |
| Period | | Commodity | | Volume (Bbls / MMBtu) | | Price ($/Bbl / $/MMBtu) |
| 2020 | | Crude Oil Swap | | 2,928,000 | | $60.31 |
| 2020 | | Crude Oil Basis Swap (1) | | 366,000 | | $2.55 |
| 2020 | | Crude Oil Basis Swap (2) | | 2,562,000 | | $(1.40) |
| 2020 | | Natural Gas Swap | | 2,562,000 | | $2.85 |
| 2020 | | Natural Gas Basis Swap (3) | | 2,562,000 | | $(1.07) |
| 2021 | | Crude Oil Swap | | 1,095,000 | | $55.00 |
| 2021 | | Crude Oil Basis Swap (2) | | 1,095,000 | | $0.89 |
| |
(1) | The basis differential price is between WTI Houston and the WTI NYMEX. |
| |
(2) | The basis differential price is between WTI Midland Argus Crude and the WTI NYMEX. |
| |
(3) | The basis differential price is between W. Texas (WAHA) and the Henry Hub NYMEX. |
The following table sets forth our outstanding derivative contracts at March 1, 2022. When aggregating multiple contracts, the weighted average contract price is disclosed.
| | | | | | | | | | | | | | | | | | | | |
| Period | | Commodity | | Volume
(Bbls / MMBtu) | | Price
($/Bbl / $/MMBtu) |
| 2022 | | Crude Oil Swap | | 3,930,750 | | $64.33 |
| 2022 | | Crude Oil Basis Swap(1) | | 4,322,500 | | $0.51 |
| 2023 | | Crude Oil Swap | | 1,277,500 | | $76.20 |
| 2023 | | Crude Oil Basis Swap(1) | | 730,000 | | $0.49 |
| 2022 | | Natural Gas Swap | | 8,782,000 | | $3.49 |
| 2022 | | Natural Gas Basis Swap(2) | | 9,100,000 | | $(0.26) |
| 2023 | | Natural Gas Swap | | 3,670,000 | | $3.35 |
| 2023 | | Natural Gas Basis Swap(2) | | 25,550,000 | | $(1.28) |
| 2024 | | Natural Gas Basis Swap(2) | | 25,620,000 | | $(1.04) |
| | | | | | |
| | | | | | |
| | | | | | |
| | | | | | |
(1)The basis differential price is between WTI Midland Argus Crude and the WTI NYMEX.
(2)The basis differential price is between W. Texas (WAHA) and the Henry Hub NYMEX.
| | | | | | | | | | | | | | | | | | | | | | | | | | |
| | | Costless Collars | | |
| Period | | Commodity | | Volume
(Bbls / MMBtu) | | Bought Floor
($/Bbl / $/MMBtu) | | Sold Ceiling
($/Bbl / $/MMBtu) |
| 2022 | | Crude Oil Costless Collar | | 1,740,000 | | $ | 68.45 | | | $ | 82.57 | |
| 2023 | | Crude Oil Costless Collar | | 1,715,500 | | $ | 62.98 | | | $ | 80.34 | |
| 2022 | | Natural Gas Costless Collar | | 14,987,500 | | $ | 3.67 | | | $ | 5.47 | |
| 2023 | | Natural Gas Costless Collar | | 13,188,000 | | $ | 3.28 | | | $ | 4.84 | |
Obligations and Commitments
We had the following contractual obligations and commitments as of December 31, 2019:2021:
| | | | | | | | | | | | | | | | | | | | | | | | | | | | | | | | | | | |
| (In thousands) | 2022 | | 2023 | | 2024 | | 2025 | | 2026 | | Thereafter |
Debt (1) | $ | 648 | | | $ | — | | | $ | 320,000 | | | $ | — | | | $ | — | | | $ | — | |
| Derivative liabilities | 45,310 | | | 571 | | | — | | | — | | | — | | | — | |
| Asset retirement obligations | 395 | | | 140 | | | 441 | | | — | | | 497 | | | 14,392 | |
| | | | | | | | | | | |
| Office leases | 696 | | | 595 | | | 605 | | | 152 | | | — | | | — | |
| | | | | | | | | | | |
| Total | $ | 47,049 | | | $ | 1,306 | | | $ | 321,046 | | | $ | 152 | | | $ | 497 | | | $ | 14,392 | |
| | | | | | | | | | | |
|
| | | | | | | | | | | | | | | | | | | | | | | |
| (In thousands) | 2020 | | 2021 | | 2022 | | 2023 | | 2024 | | Thereafter |
Debt (1) | $ | 39 |
| | $ | — |
| | $ | — |
| | $ | — |
| | $ | 170,000 |
| | $ | — |
|
| Derivative liabilities | 6,889 |
| | — |
| | — |
| | — |
| | — |
| | — |
|
| Asset retirement obligations | 308 |
| | — |
| | 100 |
| | 258 |
| | — |
| | 1,498 |
|
Gas contracts (2) | 1,647 |
| | 680 |
| | — |
| | — |
| | — |
| | — |
|
| Office leases | 632 |
| | 791 |
| | 696 |
| | 596 |
| | 605 |
| | 152 |
|
| Automobile leases | 219 |
| | 84 |
| | 5 |
| | — |
| | — |
| | — |
|
| Total | $ | 9,734 |
| | $ | 1,555 |
| | $ | 801 |
| | $ | 854 |
| | $ | 170,605 |
| | $ | 1,650 |
|
| | | | | | | | | | | | |
| |
(1) | 2020 amount represents interest payable under the Credit Agreement as of December 31, 2019. |
| |
(2) | We have a non-cancelable fixed cost agreement of $1.6 million per year through May 2021 to reserve pipeline capacity of 10,000 MMBtu per day for gathering and processing related to certain Eagle Ford assets in south Texas. As the operator of the properties dedicated to this contract, the gross amount of obligation is provided; however, our net share is approximately 31%. |
Environmental Regulations
Our operations are subject to risks normally associated with the exploration for and the production of oil and natural gas, including blowouts, fires, and environmental risks such as oil spills or natural gas leaks that could expose us to liabilities associated with these risks.
In our acquisition of existing or previously drilled well bores, we may not be aware of prior environmental safeguards, if any, that were taken at the time such wells were drilled or during such time the wells were operated. We maintain comprehensive insurance coverage that we believe is adequate to mitigate the risk of any adverse financial effects associated with these risks.
However, should it be determined that a liability exists with respect to any environmental cleanup or restoration, the liability to cure such a violation could still accrue to us. No claim has been made, nor are we aware of any liability which we may have, as it relates to any environmental cleanup, restoration, or the violation of any rules or regulations relating thereto.
Critical Accounting Policies and Estimates
Our discussion of financial condition and results of operations is based upon the information reported in our consolidated financial statements. The preparation of these statements requires us to make certain assumptions and estimates that affect the reported amounts of assets, liabilities, revenues and expenses as well as the disclosure of contingent assets and liabilities at the date of our financial statements. We base our assumptions and estimates on historical experience and other sources that we believe to be reasonable at the time. Actual results may vary from our estimates due to changes in circumstances, weather, politics, global economics, mechanical problems, general business conditions and other risks. We have outlined below certain of these policies as being of particular importance to the portrayal of our financial position and results of operations and which require the application of significant judgment by our management.
Oil and Natural Gas Properties
We use the successful efforts method of accounting for oil and natural gas operations. Under this method, costs to acquire oil and natural gas properties, drill successful exploratory wells, drill and equip development wells, and install production facilities are capitalized. Exploration costs, including unsuccessful exploratory wells, geological and geophysical are charged to operations as incurred. Depreciation, depletion and amortization of the leasehold and development costs that are capitalized for proved oil and natural gas properties are computed using the units-of-production method, at the field level, based on total proved reserves and proved developed reserves, respectively, as estimated by independent petroleum engineers. Oil and natural gas properties are periodically assessed for impairment whenever changes in facts and circumstances indicate a possible significant deterioration in the future cash flows expected to be generated by an asset group, but at least annually. Individual assets are grouped for impairment purposes at the lowest level for which there are identifiable cash flows that are largely independent of the cash flows of other groups of assets, generally on a field-by-field basis. All of our properties are located within the continental United States.
Oil and Natural Gas Reserve Quantities
Reserve quantities and the related estimates of future net cash flows affect our periodic calculations of depletion, impairment of our oil and natural gas properties, and asset retirement obligations. Proved oil and natural gas reserves are the estimated quantities of oil, natural gas and natural gas liquidsNGLs which geological and engineering data demonstrate with reasonable certainty to be recoverable in future periods from known reservoirs under existing economic and operating conditions. Reserve quantities and future cash flows included in this report are prepared in accordance with guidelines established by the SEC and the Financial Accounting Standards Board (“FASB”). The accuracy of our reserve estimates is a function of:
•The quality and quantity of available data;
•The interpretation of that data;
•The accuracy of various mandated economic assumptions; and
•The judgments of the persons preparing the estimates.
Our proved reserves information included in this report is based on estimates prepared by our independent petroleum engineers, CG&A. The independent petroleum engineers evaluated 100% of our estimated proved reserve quantities and their related future net cash flows as of December 31, 2019.2021. Estimates prepared by others may be higher or lower than our estimates. Because these estimates depend on many assumptions, all of which may differ substantially from actual results, reserve estimates may be different from the quantities of oil and natural gas that are ultimately recovered. We make revisions to reserve estimates throughout the year as additional information becomes available. We make changes to depletion rates, impairment calculations, and asset retirement obligations in the same period that changes to reserve estimates are made.
Depreciation, Depletion and Amortization
Our rate of recording DD&A is dependent upon our estimates of total proved and proved developed reserves, which estimates incorporate various assumptions and future projections. If the estimates of total proved or proved developed reserves decline, the rate at which we record DD&A expense increases, reducing our net income. Such a decline in reserves may result from lower commodity prices, which may make it uneconomic to drill for and produce higher cost fields. We are unable to predict changes in reserve quantity estimates as such quantities are dependent on the success of our exploitation and development program, as well as future economic conditions.
Impairment of Oil and Natural Gas Properties
We review the value of our oil and natural gas properties whenever management judges that events and circumstances indicate that the recorded carrying value of properties may not be recoverable. Impairments of producing properties are determined by comparing the pretax future net undiscounted cash flows to the net book value at the end of each period. If the net capitalized cost exceeds undiscounted future cash flows, the cost of the property is written down to “fair value,” which is determined based on expected future cash flows using discount rates commensurate with the risks involved, using prices and costs consistent with those used for internal decision making. Different pricing assumptions or discount rates could result in a different calculated impairment. We provide for impairments on significant undeveloped properties when we determine that the property will not be developed or a permanent impairment in value has occurred.
Asset Retirement Obligation
Our asset retirement obligations (“AROs”) consist primarily of estimated future costs associated with the plugging and abandonment of oil and natural gas wells, removal of equipment and facilities from leased acreage, and land restoration in accordance with applicable local, state and federal laws. The discounted fair value of an ARO liability is required to be recognized in the period in which it is incurred, with the associated asset retirement cost capitalized as part of the carrying cost of the oil and natural gas asset. The recognition of an ARO requires that management make numerous assumptions regarding such factors as the estimated probabilities, amounts and timing of settlements; the credit-adjusted risk-free rate to be used; inflation rates; and future advances in technology. In periods subsequent to the initial measurement of the ARO, we must recognize period-to-period changes in the liability resulting from the passage of time and revisions to either the timing or the amount of the original estimate of undiscounted cash flows. Increases in the ARO liability due to passage of time impact net income as accretion expense. The related capitalized cost, including revisions thereto, is charged to expense through DD&A over the life of the field.
Derivative Instruments and Hedging Activity
We are exposed to certain risks relating to our ongoing business operations, such as commodity price risk. Derivative contracts are utilized to economically hedge our exposure to price fluctuations and reduce the variability in our cash flows associated with anticipated sales of future oil and natural gas production. We follow FASB Accounting Standards Codification (“ASC”) Topic 815, Derivatives and Hedging, to account for our derivative financial instruments. We do not enter into derivative contracts for speculative trading purposes. It is our policy to enter into derivative contracts only with counterparties that are creditworthy financial institutions deemed by management as competent and competitive. We did not post collateral under any of these contracts.
Our crude oil and natural gas derivative positions consist of swaps.fixed price swaps, basis swaps and costless collars. Swaps are designed so that we receive or make payments based onexchange floating price risk in the future for a differential between fixed price at the time of the hedge. Costless collars set both a maximum (sold ceiling) and variable prices for crude oil and natural gas.a minimum (bought floor) future price. We have elected to not designate any of our derivative contracts for hedge accounting. Accordingly, we record the net change in the mark-to-market valuation of these derivative contracts, as well as all payments and receipts on settled derivative contracts, in “(Loss) gain on derivative contracts, net” on the Consolidated Statements of Operations. All derivative contracts are recorded at fair market value and are included in the Consolidated Balance Sheets as assets or liabilities.
Stock-Based Compensation
The Company recognized stock-based compensation expense associated with restricted stock units, which include both time- and performance-based awards. The Company accounts for forfeitures of equity-based incentive awards as they occur. Stock-based compensation expense related to time-based restricted stock units is based on the price of the Class A common stock, $0.001 par value per share of Earthstone (“Class A Common Stock”), on the grant date and recognized over the vesting period using the straight-line method. The Company classifies grants to be settled in shares as equity awards and awards to be settled in cash a liability awards. The Company accounts for these awards based on a grant date Monte Carlo Simulation pricing model, which calculates multiple potential outcomes for an award and establishes fair value based on the most likely outcome, and is recognized over the vesting period using the straight-line method. The fair value of the liability awards is updated on a quarterly basis.
Income Taxes and Uncertain Tax Positions
We are a U.S. company operating in Texas, as of December 31, 2019,2021, as well as one foreign legal entity, Lynden Corp, which is a Canadian company. Consequently, our tax provision is based upon the tax laws and rates in effect in the applicable jurisdiction in which our operations are conducted and income is earned. The income tax rates imposed and methods of computing taxable income in these jurisdictions vary. Therefore, as a part of the process of preparing the consolidated financial statements, we are required to estimate the income taxes in each of these jurisdictions. This process involves estimating the
actual current tax exposure together with assessing temporary differences resulting from differing treatment of items, such as depreciation, amortization and certain accrued liabilities for tax and accounting purposes. Our effective tax rate for financial statement purposes will continue to fluctuate from year to year as our operations are conducted in different taxing jurisdictions.
Our corporate structure requires the filing of two separate consolidated U.S. Federal income tax returns and one Canadian income tax return resulting from Earthstone’s acquisition of Lynden Corp in 2016 (the “Lynden Arrangement”) that includes Lynden US,
Earthstone, and Lynden Corp. As such, taxable income of Earthstone cannot be offset by tax attributes, including net operating losses, of Lynden US, nor can taxable income of Lynden US be offset by tax attributes of Earthstone. Earthstone and Lynden US record a tax provision, respectively, for their share of the book income or loss of EEH, net of the noncontrolling interest, as well as any standalone income or loss generated by each company. As EEH is treated as a partnership for U.S. Federal income tax purposes, it is not subject to income tax at the federal level and only recognizes the Texas Margin Tax.
On January 7, 2021, upon closing of the IRM Acquisition, the acquired entity, Independence Resources Management, LLC (along with its wholly owned subsidiaries, collectively “IRM”), became a wholly owned subsidiary of EEH. IRM’s results will be reported on the U.S. Return of Partnership Income (Form 1065) and will flow to EEH through Schedule K-1 (Form 1065). As IRM is treated as a Partnership, for federal and state income tax purposes, it is not subject to income taxes at the federal level. At the state level, IRM only operates in Texas and is subject to the Texas Margin Tax.
Our deferred tax expense or benefit represents the change in the balance of deferred tax assets or liabilities reported in our Consolidated Balance Sheets. Valuation allowances are established to reduce deferred tax assets when it is more likely than not that some portion or all of the deferred tax assets will not be realized. At December 31, 20192021 and 2018,2020, we recorded a valuation allowance for our deferred tax assets in the Consolidated Balance Sheets.
On February 15, 2022, as a result of the completion of the Chisholm Acquisition, which included the issuance of 19,417,476 shares of our Class A Common Stock, a limitation was triggered under Section 382 of the Internal Revenue Code of 1986, as amended (the “Code”). We are currently assessing the impact of the limitation on both our NOL and our deferred tax asset.
We apply the accounting standards related to uncertainty in income taxes. This accounting guidance clarifies the accounting for uncertainties in income taxes by prescribing a minimum recognition threshold that a tax position is required to meet before being recognized in the consolidated financial statements. It requires that we recognize in the consolidated financial statements the financial effects of a tax position, if that position is more likely than not of being sustained upon examination, including resolution of any appeals or litigation processes, based upon the technical merits of the position. It also provides guidance on measurement, classification, interest, penalties and disclosure. Our tax positions related to our pass-through status and state income tax liability, including deductibility of expenses, have been reviewed by our management and they believe those positions would more likely than not be sustained upon examination. Accordingly, we have not recorded an income tax liability for uncertain tax positions at December 31, 20192021 or 2018.2020.
Revenue Recognition
We predominantly derive our revenue from the sale of produced oil, natural gas and natural gas liquids.NGLs. Revenues are recognized when the recognition criteria of FASB ASC Topic 606, Revenue from Contracts with Customers, are met, which generally occurs at the point in which title passes to the customers. We receive payment from one to three months after delivery. At the end of each quarter, we estimate the amount of production delivered to purchasers and the price we will receive. Variances between our estimated revenue and actual payment are recorded in the month the payment is received. Historically, however, differences have been insignificant.
Accounting for Business Combinations
Our business has grown substantially through acquisitions, and our business strategy is to continue to pursue acquisitions as opportunities arise. We have accounted for all of our business combinations to date using the purchase method.
Under the purchase method of accounting, a business combination is accounted for at a purchase price based upon the fair value of the consideration given. The assets and liabilities acquired are measured at their fair value including the recognition of acquisition-related costs that are separate from the acquired net assets. The purchase price is allocated to the assets and liabilities based upon these fair values. The excess of the cost of an acquired entity, if any, over the net amounts assigned to assets acquired and liabilities assumed is recognized as goodwill. The excess of the fair value of assets acquired and liabilities assumed over the cost of an acquired entity, if any, is allocated as a pro rata reduction of the amounts that otherwise would have been assigned to certain acquired assets.
Determining the fair values of the assets and liabilities acquired involves the use of judgment, since some of the assets and liabilities acquired do not have fair values that are readily determinable. Different techniques may be used to determine fair values, including market prices (where available), appraisals, and comparison to transactions for similar assets and liabilities,
and present value of estimated future cash flows, among others. Since these estimates involve the use of significant judgment, they can change as new information becomes available.
Goodwill
We account for goodwill in accordance with FASB ASC Topic 350, Intangibles – Goodwill and Other. Goodwill represents the excess of the purchase price over the estimated fair value of the assets acquired net of the fair value of the liabilities assumed in an acquisition. ASC Topic 350 requires that goodwill be evaluated on an annual basis for impairment or more frequently if an event occurs or circumstances change that could potentially result in an impairment.
We conduct a qualitative goodwill impairment assessment by examining relevant events and circumstances which could have a negative impact on our goodwill such as, industry and market conditions, including commodity prices, costs factors, and other company specific events. If we conclude that it is not more likely than not that the fair value of a reporting unit is less than its carrying value, then we do not have to perform the two-step impairment test. If after assessing the totality of events or circumstances described, we determine that it is more likely than not that the fair value of a reporting unit is less than its carrying amount, the two-step goodwill test is performed. The two-step goodwill impairment test is also performed whenever events or changes in circumstances indicate that the carrying value may not be recoverable. If, after performing the two-step goodwill test, it is determined
that the carrying value of goodwill is impaired, the amount of goodwill is reduced and a corresponding charge is made to earnings in the period in which the goodwill is determined to be impaired
Noncontrolling Interest
We account for noncontrolling interest in accordance with FASB ASC Topic 810, Consolidation, which requires the recording of a noncontrolling interest component of Net income (loss), as well as a noncontrolling interest component within equity. Noncontrolling interest represents third-party equity ownership of EEH and is presented as a component of equity in the Consolidated Balance Sheet as of December 31, 20192021 and 2018,2020, as well as an adjustment to Net income (loss) in the Consolidated Statement of Operations for the years ended December 31, 20192021 and 2018.2020.
As of December 31, 2019,2021, Earthstone and Lynden US held 45.5%60.9% of the outstanding membership interests in EEH while Bold Holdings, the noncontrolling party, held the remaining 54.5%39.1%. See further discussion in Note 9.8. Noncontrolling Interest in the Notes to Consolidated Financial Statements.Statements.
Recently Issued Accounting Standards
See Note 2. Summary of Significant Accounting Policies in the Notes to Consolidated Financial Statements under Item 8 of this report for a discussion of recently issued accounting standards affecting us.
Item 7A. Quantitative and Qualitative Disclosures About Market Risk
We are exposed to market risks associated with interest rate risks, commodity price risk and credit risk. We have established risk management processes to monitor and manage these market risks.
Commodity Price Risk, Derivative Instruments and Hedging Activity
We are exposed to various risks including energy commodity price risk. When oil, natural gas and NGL prices decline significantly our ability to finance our capital budget and operations may be adversely impacted. We expect energy prices to remain volatile and unpredictable. Our hedging activities consist of derivative instruments entered into in order to hedge against changes in oil and natural gas prices through the use of fixed price swaps, basis swaps and costless collars. Swaps exchange floating price risk in the future for a smaller reporting company as defined by Rule 12b-2fixed price at the time of the Exchange Acthedge. Costless collars set both a maximum (sold ceiling) and thereforea minimum (bought floor) future price.
We have entered into a series of derivative instruments to hedge a significant portion of our expected oil and natural gas production through December 31, 2023. Typically, these derivative instruments require payments to (receipts from) counterparties based on specific indices as required by the derivative agreements. Although not risk free, we believe these instruments reduce our exposure to oil and natural gas price fluctuations and, thereby, allow us to achieve a more predictable cash flow.
The following is a summary of our open oil and natural gas derivative contracts as of December 31, 2021:
| | | | | | | | | | | | | | | | | | | | |
| Period | | Commodity | | Volume
(Bbls / MMBtu) | | Price
($/Bbl / $/MMBtu) |
| 2022 | | Crude Oil Swap | | 2,768,250 | | $57.69 |
| 2022 | | Crude Oil Basis Swap(1) | | 3,832,500 | | $0.51 |
| 2022 | | Natural Gas Swap | | 5,900,000 | | $3.20 |
| 2022 | | Natural Gas Basis Swap(2) | | 9,100,000 | | $(0.26) |
| 2023 | | Natural Gas Swap | | 1,375,000 | | $3.27 |
| | | | | | |
(1)The basis differential price is between WTI Midland Argus Crude and the WTI NYMEX.
(2)The basis differential price is between W. Texas (WAHA) and the Henry Hub NYMEX.
| | | | | | | | | | | | | | | | | | | | | | | | | | |
| | | Costless Collars | | |
| Period | | Commodity | | Volume
(Bbls / MMBtu) | | Bought Floor
($/Bbl / $/MMBtu) | | Sold Ceiling
($/Bbl / $/MMBtu) |
| 2022 | | Crude Oil Costless Collar | | 730,000 | | | $ | 60.00 | | | $ | 73.73 | |
| 2023 | | Crude Oil Costless Collar | | 365,000 | | | $ | 55.00 | | | $ | 71.75 | |
| 2022 | | Natural Gas Costless Collar | | 4,037,500 | | | $ | 3.43 | | | $ | 5.10 | |
| 2023 | | Natural Gas Costless Collar | | 888,000 | | | $ | 3.25 | | | $ | 5.13 | |
Changes in fair value of commodity derivative instruments are not requiredreported in earnings in the period in which they occur. Our open commodity derivative instruments were in a net liability position with a fair value of $44.4 million at December 31, 2021. Based on the published commodity futures price curves for the underlying commodity as of December 31, 2021, a 10% increase in per unit commodity prices would cause the total fair value of our commodity derivative financial instruments to providedecrease by approximately $22.6 million to an overall net liability position of $21.8 million. A 10% decrease in per unit commodity prices would cause the total fair value of our commodity derivative financial instruments to increase by approximately $22.6 million to an overall net liability position of $67.0 million. There would also be a similar increase or decrease in (Loss) gain on derivative contracts, net in the Consolidated Statements of Operations.
Interest Rate Sensitivity
We are also exposed to market risk related to adverse changes in interest rates. Our interest rate risk exposure results primarily from fluctuations in short-term rates, which are based on LIBOR and, upon the closing of the Chisholm Acquisition, SOFR,and the prime rate and may result in reductions of earnings or cash flows due to increases in the interest rates we pay on these obligations.
At December 31, 2021, the outstanding borrowings under the Credit Agreement were $320.0 million bearing interest at rates described in Note 12. Long-Term Debt in the Notes to Consolidated Financial Statements. Fluctuations in interest rates will cause our annual interest costs to fluctuate. At December 31, 2021, the interest rate on borrowings under the Credit Agreement was 3.110% per year. If borrowings at December 31, 2021 were to remain constant, a 10% change in interest rates would impact our future cash flows by approximately $1.0 million per year.
Disclosure of Limitations
Because the information required under this item. above included only those exposures that existed at December 31, 2021, it does not consider those exposures or positions which could arise after that date. As a result, our ultimate realized gain or loss with respect to interest rate and commodity price fluctuations will depend on the exposures that arise during future periods.
Item 8. Financial Statements and Supplementary Data
See Index to Consolidated Financial Statements and Supplementary Information on Page F-1.
Item 9. Changes in and Disagreements with Accountants on Accounting and Financial Disclosure
None.
Item 9A. Controls and Procedures
Internal Control Over Financial Reporting
Evaluation of Disclosure Controls and Procedures
(a) Disclosure Controls and Procedures
We maintain disclosure controls and procedures that are designed to provide reasonable assurance that information required to be disclosed by us in the reports that we file or submit to the SEC under the Exchange Act, is recorded, processed, summarized and reported within the time periods specified by the SEC’s rules and forms, and that information is accumulated and communicated
to our management, including our Chief Executive Officer and Principal Accounting Officer, as appropriate to allow timely decisions regarding required disclosure.
In accordance with Rules 13a-15(b) and 15d-15(b) under the Exchange Act, we carried out an evaluation, under the supervision and with the participation of management, including our Chief Executive Officer and Principal Accounting Officer, of the
effectiveness of our disclosure controls and procedures (as defined by Rules 13a-15(e) and 15d-15(e) under the Exchange Act) as of the end of the period covered by this Annual Report on Form 10-K. As described below under paragraph (b) within Management’s Annual Report on Internal Control over Financial Reporting, our Chief Executive Officer and Principal Accounting Officer have concluded that, as of the end of the period covered by this Annual Report on Form 10-K, our disclosure controls and procedures were effective to provide reasonable assurance that information required to be disclosed by us in the reports that we file or submit to the SEC under the Exchange Act is recorded, processed, summarized and reported within the time periods specified by the SEC’s rules and that such information is accumulated and communicated to our management, including our Chief Executive Officer and Principal Accounting Officer, as appropriate to allow timely decisions regarding required disclosure.
The audit report of our independent registered public accounting firm, which is included in this Annual Report on Form 10-K, expressed an unqualified opinion on our consolidated financial statements.
(b) Management’s Annual Report on Internal Control over Financial Reporting
Our management is responsible for establishing and maintaining adequate internal control over financial reporting as defined in Rules 13a-15(f) and 15d-15(f) under the Exchange Act. Our internal control over financial reporting is designed to provide reasonable assurance regarding the reliability of financial reporting and the preparation of financial statements for external purposes in accordance with generally accepted accounting principles. Our internal control over financial reporting includes those policies and procedures that:
•pertain to the maintenance of records that, in reasonable detail, accurately and fairly reflect our transactions and dispositions of our assets;
•provide reasonable assurance that transactions are recorded as necessary to permit preparation of financial statements in accordance with generally accepted accounting principles, and that our receipts and expenditures are being made only in accordance with authorizations of our management; and
•provide reasonable assurance regarding prevention or timely detection of unauthorized acquisition, use, or disposition of our assets that could have a material effect on the financial statements.
While “reasonable assurance” is a high level of assurance, it does not mean absolute assurance. Because of its inherent limitations, internal control over financial reporting may not prevent or detect every misstatement and instance of fraud. Controls are susceptible to manipulation, especially in instances of fraud caused by collusion of two or more people. Also, projections of any evaluation of effectiveness to future periods are subject to the risk that controls may become inadequate because of changes in conditions, or that the degree of compliance with the policies or procedures may deteriorate.
Under the supervision and with the participation of our Chief Executive Officer and Principal Accounting Officer, our management conducted an evaluation of the effectiveness of our internal control over financial reporting as of December 31, 2019.2021. In making this evaluation, management used the Internal Control – Integrated Framework (2013) issued by the Committee of Sponsoring Organizations of the Treadway Commission (“COSO”). Based on the results of our evaluation, our management concluded that our internal control over financial reporting was effective, at the reasonable assurance level, as of December 31, 2019.2021.
Our independent registered public accounting firm that audited our consolidated financial statements, has also issued its own audit report on the effectiveness of our internal control over financial reporting as of December 31, 2019,2021, which is included herein.
(c) Changes in Internal Control over Financial Reporting
There have not been any changes in our internal control over financial reporting during the quarter ended December 31, 20192021 that have materially affected, or are reasonably likely to materially affect, our internal control over financial reporting.
Report of Independent Registered Public Accounting Firm
To the Shareholders and the Board of Directors of
Earthstone Energy, Inc.
Opinion on Internal Control over Financial Reporting
We have audited Earthstone Energy, Inc. and subsidiaries’subsidiaries (the “Company”) internal control over financial reporting as of December 31, 2019,2021, based on criteria established in Internal Control - Integrated Framework(2013) issued by the Committee of Sponsoring Organizations of the Treadway Commission (“COSO”). In our opinion, the Company maintained, in all material respects, effective internal control over financial reporting as of December 31, 2019,2021, based on criteria established in Internal Control - Integrated Framework (2013) issued by COSO.
We also have audited, in accordance with the standards of the Public Company Accounting Oversight Board (United States) (“PCAOB”), the consolidated balance sheets of Earthstone Energy, Inc. and subsidiaries as of December 31, 20192021 and 2018,2020, the related consolidated statements of operations, equity, and cash flows for each of the three years thenin the period ended December 31, 2021, and the related notes (collectively referred to as the “consolidatedfinancial statements”) and our report dated March 11, 20209, 2022 expressed an unqualified opinion on those consolidated financial statements.those.
Basis for Opinion
The Company’s management is responsible for maintaining effective internal control over financial reporting and for its assessment of the effectiveness of internal control over financial reporting, included in the accompanying Management Report on Internal Control over Financial Reporting included in Item 9A. Our responsibility is to express an opinion on the Company’s internal control over financial reporting based on our audit. We are a public accounting firm registered with the PCAOB and are required to be independent with respect to the Company in accordance with the U.S. federal securities laws and the applicable rules and regulations of the Securities and Exchange Commission and the PCAOB.
We conducted our audit in accordance with the standards of the PCAOB. Those standards require that we plan and perform the audit to obtain reasonable assurance about whether effective internal control over financial reporting was maintained in all material respects. Our audit included obtaining an understanding of internal control over financial reporting, assessing the risk that a material weakness exists, and testing and evaluating the design and operating effectiveness of internal control based on the assessed risk. Our audit also included performing such other procedures as we considered necessary in the circumstances. We believe that our audit provides a reasonable basis for our opinion.
Definition and Limitations of Internal Control Over Financial Reporting
A company’s internal control over financial reporting is a process designed to provide reasonable assurance regarding the reliability of financial reporting and the preparation of financial statements for external purposes in accordance with generally accepted accounting principles. A company’s internal control over financial reporting includes those policies and procedures that (1) pertain to the maintenance of records that, in reasonable detail, accurately and fairly reflect the transactions and dispositions of the assets of the company; (2) provide reasonable assurance that transactions are recorded as necessary to permit preparation of financial statements in accordance with generally accepted accounting principles, and that receipts and expenditures of the company are being made only in accordance with authorizations of management and directors of the company; and (3) provide reasonable assurance regarding prevention or timely detection of unauthorized acquisition, use, or disposition of the company’s assets that could have a material effect on the financial statements.
Because of its inherent limitations, internal control over financial reporting may not prevent or detect misstatements. Also, projections of any evaluation of effectiveness to future periods are subject to the risk that controls may become inadequate because of changes in conditions, or that the degree of compliance with the policies or procedures may deteriorate.
/s/Moss Adams LLP
Houston, Texas
March 11, 20209, 2022
We have served as the Company’s auditor since 2018.
Item 9B. Other Information
None.
Item 9C. Disclosure Regarding Foreign Jurisdictions that Prevent Inspections
Not applicable.
PART III
Item 10.Directors, Executive Officers and Corporate Governance
See list of “Information about our Executive Officers” under Item 1 of this report, which is incorporated herein by reference.
The other information required by this item is incorporated herein by reference to the 20192021 Proxy Statement, which will be filed with the SEC not later than 120 days subsequent to December 31, 2019.2021.
Item 11. Executive Compensation
The information required by this item is incorporated herein by reference to the 20192021 Proxy Statement, which will be filed with the SEC not later than 120 days subsequent to December 31, 2019.2021.
Item 12. Security Ownership of Certain Beneficial Owners and Management and Related Stockholder Matters
The information required by this item is incorporated herein by reference to the 20192021 Proxy Statement, which will be filed with the SEC not later than 120 days subsequent to December 31, 2019.2021.
Item 13. Certain Relationships and Related Transactions, and Director Independence
The information required by this item is incorporated herein by reference to the 20192021 Proxy Statement, which will be filed with the SEC not later than 120 days subsequent to December 31, 2019.2021.
Item 14. Principal AccountingAccountant Fees and Services
The information required by this item is incorporated herein by reference to the 20192021 Proxy Statement, which will be filed with the SEC not later than 120 days subsequent to December 31, 2019.
2021.
PART IV
Item 15. Exhibits,Exhibit and Financial Statement Schedules
| | | | | | | | | | | | | | | | | | | | | | | | | | | | | | | | | | | | | | | | | | | | |
| | | | | Incorporated by Reference | | | | |
Exhibit
No. | | Description | | Form | | SEC File No. | | Exhibit | | Filing Date | | Filed
Herewith | | Furnished
Herewith |
| 2.1 | | Contribution Agreement dated November 7, 2016, by and among Earthstone Energy, Inc., Earthstone Energy Holdings, LLC, Lynden USA Inc., Lynden USA Operating, LLC, Bold Energy Holdings, LLC and Bold Energy III LLC. | | 8-K | | 001-35049 | | 2.1 | | November 8, 2016 | | | | |
| 2.1(a) | | First Amendment to the Contribution Agreement dated March 21, 2017, by and among Earthstone Energy, Inc., Earthstone Energy Holdings, LLC, Lynden USA Inc., Lynden USA Operating, LLC, Bold Energy Holdings, LLC and Bold Energy III LLC. | | 8-K | | 001-35049 | | 2.1 | | March 23, 2017 | | | | |
| 2.2 | | | | 8-K | | 001-35049 | | 2.1 | | December 22, 2020 | | | | |
| 2.3 | | | | 8-K | | 001-35049 | | 2.1 | | April 5, 2021 | | | | |
| 2.4 | | | | 8-K | | 001-35049 | | 2.2 | | April 5, 2021 | | | | |
| 2.5 | | | | 8-K | | 001-35049 | | 2.1 | | October 4, 2021 | | | | |
| 2.6 | | | | 8-K | | 001-35049 | | 2.2 | | October 4, 2021 | | | | |
| 2.7 | | | | 8-K | | 001-35049 | | 2.1 | | December 17, 2021 | | | | |
| 2.8 | | | | 8-K | | 001-35049 | | 2.1 | | February 2, 2022 | | | | |
| 3.1 | | | | 8-A | | 001-35049 | | 3.1 | | May 9, 2017 | | | | |
| 3.1(a) | | | | 8-K | | 001-35049 | | 3.1 | | July 23, 2021 | | | | |
| | | | | | | Incorporated by Reference | | | | | |
Exhibit No. | | Description | | Form | | SEC File No. | | Exhibit | | Filing Date | | Filed Herewith | | Furnished Herewith | |
| 2.1 | | Contribution Agreement dated November 7, 2016, by and among Earthstone Energy, Inc., Earthstone Energy Holdings, LLC, Lynden USA Inc., Lynden USA Operating, LLC, Bold Energy Holdings, LLC and Bold Energy III LLC. | | 8-K | | 001-35049 | | 2.1 | | November 8, 2016 | | | | | |
| 2.2(a) | | First Amendment to the Contribution Agreement dated March 21, 2017, by and among Earthstone Energy, Inc., Earthstone Energy Holdings, LLC, Lynden USA Inc., Lynden USA Operating, LLC, Bold Energy Holdings, LLC and Bold Energy III LLC. | | 8-K | | 001-35049 | | 2.1 | | March 23, 2017 | | | | | |
| 2.3 | | | | 8-K | | 001-35049 | | 2.1 | | October 17, 2018 | | | | | |
| 3.1 | | | | 8-A | | 001-35049 | | 3.1 | | May 9, 2017 | | | | | |
| 3.2 | | | | 8-K | | 001-35049 | | 3(ii) | | March 3, 2010 | | | | | 3.2 | | | | 8-K | | 001-35049 | | 3(ii) | | March 3, 2010 | | | | |
| 3.2(a) | | | | 8-K | | 001-35049 | | 3(ii)c | | November 23, 2011 | | | | | 3.2(a) | | | | 8-K | | 001-35049 | | 3(ii)c | | November 23, 2011 | | | | |
| 3.2(b) | | | | 8-K | | 001-35049 | | 3.2 | | October 26, 2015 | | | | | 3.2(b) | | | | 8-K | | 001-35049 | | 3.2 | | October 26, 2015 | | | | |
| 4.1 | | | | 8-K | | 001-35049 | | 4.1 | | May 15, 2017 | | 4.1 | | | | 8-K | | 001-35049 | | 4.1 | | May 15, 2017 | |
| 4.2 | | | | X | | 4.2 | | | | 10-K | | 001-35049 | | 4.2 | | March 11, 2020 | |
| 10.1† | | | | 8-K | | 001-35049 | | 10.3 | | December 29, 2014 | | 10.1† | | | | 8-K | | 001-35049 | | 10.3 | | December 29, 2014 | |
| 10.1(a)† | | | | 8-K | | 001-35049 | | 10.1 | | October 26, 2015 | | 10.1(a)† | | | | 8-K | | 001-35049 | | 10.1 | | October 26, 2015 | |
| 10.1(b)† | | | | 8-K | | 001-35049 | | 10.6 | | May 15, 2017 | | 10.1(b)† | | | | 8-K | | 001-35049 | | 10.6 | | May 15, 2017 | |
| 10.2 | | | | 8-K | | 001-35049 | | 10.5 | | December 29, 2014 | | 10.2 | | | | 8-K | | 001-35049 | | 10.5 | | December 29, 2014 | |
| 10.3† | | | | 8-K | | 001-35049 | | 10.1 | | June 2, 2016 | | 10.3† | | | | 8-K | | 001-35049 | | 10.1 | | June 2, 2016 | |
| 10.4† | | | | 8-K | | 001-35049 | | 10.2 | | June 2, 2016 | | 10.4† | | | | 8-K | | 001-35049 | | 10.2 | | June 2, 2016 | |
| 10.5 | | | | 8-K | | 001-35049 | | 10.1 | | May 15, 2017 | | 10.5 | | | | 8-K | | 001-35049 | | 10.1 | | May 15, 2017 | |
| 10.6 | | 10.6 | | | | 8-K | | 001-35049 | | 10.3 | | May 15, 2017 | | | |
| 10.7 | | 10.7 | | | | 8-K | | 001-35049 | | 10.4 | | May 15, 2017 | | | |
| 10.7(a) | | 10.7(a) | | | | 8-K | | 001-35049 | | 10.1 | | April 24, 2020 | |
| 10.8† | | 10.8† | | | | 8-K | | 001-35049 | | 10.2 | | March 2, 2018 | | | |
| 10.9† | | 10.9† | | | | 8-K | | 001-35049 | | 10.1 | | June 6, 2018 | |
| 10.9(a) | | 10.9(a) | | | | 8-K | | 001-35049 | | 10.1 | | June 5, 2020 | |
| 10.9(b) | | 10.9(b) | | | | 8-K | | 001-35049 | | 10.5 | | July 23, 2021 | |
| 10.10† | | 10.10† | | | | 8-K | | 001-35049 | | 10.2 | | February 1, 2019 | |
| 10.11† | | 10.11† | | | | 8-K | | 001-35049 | | 10.1 | | January 29, 2021 | |
|
| | | | | | | | | | | | | | |
| 10.6 | | | | 8-K | | 001-35049 | | 10.3 | | May 15, 2017 | | | | |
| 10.7 | | | | 8-K | | 001-35049 | | 10.4 | | May 15, 2017 | | | | |
| 10.8† | | | | 8-K | | 001-35049 | | 10.2 | | March 2, 2018 | | | | |
| 10.9† | | | | 8-K | | 001-35049 | | 10.1 | | June 6, 2018 | | | | |
| 10.10† | | | | 8-K | | 001-35049 | | 10.2 | | February 1, 2019 | | | | |
| 10.11† | | | | 8-K | | 001-35049 | | 10.1 | | April 12, 2019 | | | | |
| 10.12 | | Credit Agreement dated November 21, 2019, by and among Earthstone Energy Holdings, LLC, as Borrower, Earthstone Energy, Inc., as Parent, Wells Fargo Bank, National Association as Administrative Agent and Issuing Bank, BOKF, NA dba Bank of Texas, as Issuing Bank with respect to Existing Letters of Credit, Royal Bank of Canada, as Syndication Agent, SunTrust Bank, as Documentation Agent, and the Lenders party thereto. | | 8-K | | 001-35049 | | 10.1 | | November 22, 2019 | | | | |
| 10.13† | | | | 8-K | | 001-35049 | | 10.1 | | January 31, 2020 | | | | |
| 10.14† | | | | 8-K | | 001-35049 | | 10.2 | | January 31, 2020 | | | | |
| 10.15† | | | | 8-K | | 001-35049 | | 10.3 | | January 31, 2020 | | | | |
| 14.1 | | | | | | | | | | | | X | | |
| 21.1 | | | | | | | | | | | | X | | |
| 23.1 | | | | | | | | | | | | X | | |
| 23.2 | | | | | | | | | | | | X | | |
| 31.1 | | | | | | | | | | | | X | | |
| 31.2 | | | | | | | | | | | | X | | |
| 32.1 | | | | | | | | | | | | | | X |
| 32.2 | | | | | | | | | | | | | | X |
| 99.1 | | | | | | | | | | | | X | | |
| 101.INS | | XBRL Instance Document. | | | | | | | | | | X | | |
| 101.SCH | | XBRL Schema Document. | | | | | | | | | | X | | |
| 101.CAL | | XBRL Calculation Linkbase Document. | | | | | | | | | | X | | |
| 101.DEF | | XBRL Definition Linkbase Document. | | | | | | | | | | X | | |
| 101.LAB | | XBRL Label Linkbase Document. | | | | | | | | | | X | | |
| | | | | | | | | | | | | | | | | | | | | | | | | | | | | | | | | | | | | | | | | | | | |
| 10.12 | | Credit Agreement dated November 21, 2019, by and among Earthstone Energy Holdings, LLC, as Borrower, Earthstone Energy, Inc., as Parent, Wells Fargo Bank, National Association as Administrative Agent and Issuing Bank, BOKF, NA dba Bank of Texas, as Issuing Bank with respect to Existing Letters of Credit, Royal Bank of Canada, as Syndication Agent, SunTrust Bank, as Documentation Agent, and the Lenders party thereto. | | 8-K | | 001-35049 | | 10.1 | | November 22, 2019 | | | | |
| 10.12(a) | | First Amendment to Credit Agreement dated September 28, 2020, by and among Earthstone Energy Holdings, LLC, as Borrower, Earthstone Energy, Inc., as Parent, the Guarantors party thereto, Wells Fargo Bank, National Association as Administrative Agent, and the Lenders party thereto. | | 8-K | | 001-35049 | | 10.1 | | October 1, 2020 | | | | |
| 10.12(b) | | Second Amendment to Credit Agreement dated December 17, 2020, by and among Earthstone Energy Holdings, LLC, as Borrower, Earthstone Energy, Inc., as Parent, the Guarantors party thereto, Wells Fargo Bank, National Association as Administrative Agent, and the Lenders party thereto. | | 8-K | | 001-35049 | | 10.1 | | December 22, 2020 | | | | |
| 10.12(c) | | Third Amendment to Credit Agreement dated as of April 20, 2021, by and among Earthstone Energy Holdings, LLC, as Borrower, Earthstone Energy, Inc., as Parent, Wells Fargo Bank, National Association as Administrative Agent, and the Lenders and guarantors party thereto. | | 8-K | | 001-35049 | | 10.1 | | April 20, 2021 | | | | |
| 10.12(d) | | Fourth Amendment to Credit Agreement dated as of September 17, 2021, by and among Earthstone Energy Holdings, LLC, as Borrower, Earthstone Energy, Inc., as Parent, Wells Fargo Bank, National Association as Administrative Agent, and the Lenders and guarantors party thereto. | | 8-K | | 001-35049 | | 10.1 | | September 20, 2021 | | | | |
| 10.12(e) | | Fifth Amendment to Credit Agreement dated as of December 24, 2021, by and among Earthstone Energy Holdings, LLC, as Borrower, Earthstone Energy, Inc., as Parent, Wells Fargo Bank, National Association as Administrative Agent, and the Lenders and guarantors party thereto. | | 8-K | | 001-35049 | | 10.1 | | December 29, 2021 | | | | |
| 10.12(f) | | Amended and Restated Fifth Amendment to Credit Agreement dated as of January 30, 2022, among Earthstone Energy Holdings, LLC, as Borrower, Earthstone Energy, Inc., as Parent, Wells Fargo Bank, National Association, as Administrative Agent, the lenders and guarantors party thereto. | | 8-K | | 001-35049 | | 10.1 | | February 2, 2022 | | | | |
| 10.13† | | | | 8-K | | 001-35049 | | 10.1 | | January 31, 2020 | | | | |
| 10.14† | | | | 8-K | | 001-35049 | | 10.2 | | January 31, 2020 | | | | |
| 10.15† | | | | 8-K | | 001-35049 | | 10.3 | | January 31, 2020 | | | | |
| | | | | | | | | | | | | | | | | | | | | | | | | | | | | | | | | | | | | | | | | | | | |
| 10.16 | | | | 8-K | | 001-35049 | | 10.1 | | January 13, 2021 | | | | |
| 10.17 | | Voting Agreement dated January 7, 2021, by and among Earthstone Energy, Inc., EnCap Investments L.P., Warburg Pincus Private Equity (E&P) XI – A, L.P., Warburg Pincus XI (E&P) Partners – A, L.P., WP IRH Holdings, L.P., Warburg Pincus XI (E&P) Partners – B IRH, LLC, Warburg Pincus Energy (E&P)-A, LP, Warburg Pincus Energy (E&P) Partners-A, LP, Warburg Pincus Energy (E&P) Partners-B IRH, LLC, WP Energy Partners IRH Holdings, L.P., and WP Energy IRH Holdings, L.P. | | 8-K | | 001-35049 | | 10.2 | | January 13, 2021 | | | | |
| 10.18 | | Lock-up Agreement dated January 7, 2021, by and among Earthstone Energy, Inc., Warburg Pincus Private Equity (E&P) XI – A, L.P., Warburg Pincus XI (E&P) Partners – A, L.P., WP IRH Holdings, L.P., Warburg Pincus XI (E&P) Partners – B IRH, LLC, Warburg Pincus Energy (E&P)-A, LP, Warburg Pincus Energy (E&P) Partners-A, LP, Warburg Pincus Energy (E&P) Partners-B IRH, LLC, WP Energy Partners IRH Holdings, L.P., and WP Energy IRH Holdings, L.P. | | 8-K | | 001-35049 | | 10.3 | | January 13, 2021 | | | | |
| 10.19† | | | | 8-K | | 001-35049 | | 10.1 | | January 29, 2021 | | | | |
| 10.20 | | Support and Voting Agreement dated March 31, 2021, by and among Earthstone Energy, Inc., Earthstone Energy Holdings, LLC, Tracker Resource Development III, LLC, TRD III Royalty Holdings (TX), LP, SEG-TRD LLC, SEG-TRD II LLC, Warburg Pincus Private Equity (E&P) XI – A, L.P., Warburg Pincus XI (E&P) Partners – A, L.P., WP IRH Holdings, L.P., Warburg Pincus XI (E&P) Partners – B IRH, LLC, Warburg Pincus Energy (E&P)-A, LP, Warburg Pincus Energy (E&P) Partners-A, LP, Warburg Pincus Energy (E&P) Partners-B IRH, LLC, WP Energy Partners IRH Holdings, L.P., and WP Energy IRH Holdings, L.P. | | 8-K | | 001-35049 | | 10.1 | | April 5, 2021 | | | | |
| 10.21 | | Registration Rights Agreement dated July 20, 2021, by and among Earthstone Energy, Inc., Tracker Resource Development III, LLC, EnCap Energy Capital Fund VIII, L.P., ZIP Ventures I, L.L.C, and Tracker III Holdings, LLC. | | 8-K | | 001-35049 | | 10.1 | | July 23, 2021 | | | | |
| 10.22 | | | | 8-K | | 001-35049 | | 10.2 | | July 23, 2021 | | | | |
| | | | | | | | | | | | | | | | | | | | | | | | | | | | | | | | | | | | | | | | | | | | |
| 10.23 | | | | 8-K | | 001-35049 | | 10.3 | | July 23, 2021 | | | | |
| 10.24 | | | | 8-K | | 001-35049 | | 10.4 | | July 23, 2021 | | | | |
| 10.25 | | | | 8-K | | 001-35049 | | 10.1 | | November 2, 2021 | | | | |
| 10.26 | | | | 8-K | | 001-35049 | | 10.2 | | November 2, 2021 | | | | |
| 10.27 | | | | 8-K | | 001-35049 | | 10.2 | | February 2, 2022 | | | | |
| 10.28 | | | | 8-K | | 001-35049 | | 10.1 | | February 18, 2022 | | | | |
| 10.29 | | | | 8-K | | 001-35049 | | 10.2 | | February 18, 2022 | | | | |
| 10.30 | | Amended and Restated Voting Agreement dated February 15, 2022, by and among Earthstone Energy, Inc., EnCap Investments L.P., Warburg Pincus Private Equity (E&P) XI – A, L.P., Warburg Pincus XI (E&P) Partners – A, L.P., WP IRH Holdings, L.P., Warburg Pincus XI (E&P) Partners – B IRH, LLC, Warburg Pincus Energy (E&P)-A, LP, Warburg Pincus Energy (E&P) Partners-A, LP, Warburg Pincus Energy (E&P) Partners-B IRH, LLC, WP Energy Partners IRH Holdings, L.P., and WP Energy IRH Holdings, L.P., WP Energy Chisholm Holdings, L.P., WP Energy Partners Chisholm Holdings, L.P., Warburg Pincus Energy (E&P) Partners-B Chisholm, LLC, Warburg Pincus Private Equity (E&P) XII (A), L.P., WP XII Chisholm Holdings, L.P., Warburg Pincus XII (E&P) Partners-2 Chisholm, LLC, Warburg Pincus Private Equity (E&P) XII-D (A), L.P., Warburg Pincus Private Equity (E&P) XII-E (A), L.P., Warburg Pincus XII (E&P) Partners-1, L.P., and WP XII (E&P) Partners (A), L.P. | | 8-K | | 001-35049 | | 10.3 | | February 18, 2022 | | | | |
| 14.1 | | | | 8-K | | 001-35049 | | 14 | | January 13, 2021 | | | | |
| 21.1 | | | | | | | | | | | | X | | |
| 23.1 | | | | | | | | | | | | X | | |
| 23.2 | | | | | | | | | | | | X | | |
| 31.1 | | | | | | | | | | | | X | | |
| 31.2 | | | | | | | | | | | | X | | |
| | | | | | | | | | | | | | | | | | | | | | | | | | | | | | | | | | | | | | | | | | | | |
| 32.1 | | | | | | | | | | | | | | X |
| 32.2 | | | | | | | | | | | | | | X |
| 99.1 | | | | | | | | | | | | X | | |
| 101.INS | | XBRL Instance Document. | | | | | | | | | | X | | |
| 101.SCH | | XBRL Schema Document. | | | | | | | | | | X | | |
| 101.CAL | | XBRL Calculation Linkbase Document. | | | | | | | | | | X | | |
| 101.DEF | | XBRL Definition Linkbase Document. | | | | | | | | | | X | | |
| 101.LAB | | XBRL Label Linkbase Document. | | | | | | | | | | X | | |
| 101.PRE | | XBRL Presentation Linkbase Document. | | | | | | | | | | X | | |
| 104 | | Cover Page Interactive Data File (embedded within the Inline XBRL document). | | | | | | | | | | X | | |
| † | | Indicates management contract or compensatory plan or arrangement. |
| | | | | | | | | | | | | | |
101.PRE | | XBRL Presentation Linkbase Document. | | | | | | | | | | X | | |
† | | Indicates management contract or compensatory plan or arrangement. |
Item 16. Form 10-K Summary
None.
SIGNATURES
Pursuant to the requirements of Section 13 or 15(d) of the Securities Exchange Act of 1934, the registrant has duly caused this report to be signed on its behalf by the undersigned, thereunto duly authorized.
|
| | | | | | | | | | | | | |
| | EARTHSTONE ENERGY, INC. |
| | | | |
| | | | |
| | By: | | /s/ Frank A. LodzinskiRobert J. Anderson |
| | Name: | | Frank A. LodzinskiRobert J. Anderson |
| Date: | March 11, 20209, 2022 | Title: | | President, Chief Executive Officer and Director |
| | | | (Principal Executive Officer) |
Pursuant to the requirements of the Securities Exchange Act of 1934, this report has been signed below by the following persons on behalf of the registrant and in the capacities and on the dates indicated.
|
| | | | | | | | | | | | | |
| Signature | | Title | | Date |
| | | | |
/s/ Frank A. LodzinskiRobert J. Anderson | | Chairman of the Board, Director andPresident, Chief Executive Officer (Principaland Director
(Principal Executive Officer) | | March 11, 20209, 2022 |
Frank A. LodzinskiRobert J. Anderson | | | |
| | | | |
| /s/ Tony Oviedo | | Executive Vice President, Accounting and Administration (Principal Financial Officer and Principal Accounting Officer) | | March 11, 20209, 2022 |
| Tony Oviedo | | | |
| | | | |
| /s/ Frank A. Lodzinski | | Executive Chairman | | March 9, 2022 |
| Frank A. Lodzinski | | | |
| | | | |
| /s/ David S. Habachy | | Director | | March 9, 2022 |
| David S. Habachy | | | |
| | | | |
| /s/ Jay F. Joliat | | Director | | March 11, 20209, 2022 |
| Jay F. Joliat | | | |
| | | | |
| /s/ Phil D. Kramer | | Director | | March 11, 20209, 2022 |
| Phil D. Kramer | | | | |
| | | | |
| /s/ Ray Singleton | | Director | | March 11, 20209, 2022 |
| Ray Singleton | | | |
| | | | |
| /s/ Wynne M. Snoots, Jr. | | Director | | March 11, 20209, 2022 |
| Wynne M. Snoots, Jr. | | | | |
| | | | |
/s/ Douglas E. Swanson, Jr. | | Director | | March 11, 2020 |
Douglas E. Swanson, Jr. | | | |
| | | | |
| /s/ Brad A. Thielemann | | Director | | March 11, 20209, 2022 |
| Brad A. Thielemann | | | |
| | | | |
| /s/ Zachary G. Urban | | Director | | March 11, 20209, 2022 |
| Zachary G. Urban | | | |
| | | | |
| /s/ Robert L. Zorich | | Director | | March 11, 20209, 2022 |
| Robert L. Zorich | | | |
EARTHSTONE ENERGY, INC.
Index to Consolidated Financial Statements and Supplementary Information
|
| | | | |
| Page |
Audited Financial Statements: | |
| |
| Audited Financial Statements: | |
| |
| |
| |
| |
| |
| Unaudited Information: | |
| |
Report of Independent Registered Public Accounting Firm
To the Shareholders and the Board of Directors of
Earthstone Energy, Inc.
Opinion on the Financial Statements
We have audited the accompanying consolidated balance sheets of Earthstone Energy, Inc. and subsidiaries (the “Company”) as of December 31, 20192021 and 2018,2020, the related consolidated statements of operations, equity, and cash flows for each of the three years thenin the period ended December 31, 2021, and the related notes (collectively referred to as the “consolidated financial statements”). In our opinion, the consolidated financial statements present fairly, in all material respects, the consolidated financial position of the Company as of December 31, 20192021 and 2018,2020, and the consolidated results of its operations and its cash flows for each of the three years thenin the period ended December 31, 2021, in conformity with accounting principles generally accepted in the United States of America.
We also have audited, in accordance with the standards of the Public Company Accounting Oversight Board (United States) (“PCAOB”), the Company’s internal control over financial reporting as of December 31, 2019,2021, based on criteria established in Internal Control - Integrated Framework (2013) issued by the Committee of Sponsoring Organizations of the Treadway Commission and our report dated March 11, 20209, 2022 expressed an unqualified opinion on the Company’s internal control over financial reporting.
Basis for Opinion
These consolidatedfinancial statements are the responsibility of the Company’s management. Our responsibility is to express an opinion on the Company’s consolidated financial statements based on our audits. We are a public accounting firm registered with the PCAOB and are required to be independent with respect to the Company in accordance with the U.S. federal securities laws and the applicable rules and regulations of the Securities and Exchange Commission and the PCAOB.
We conducted our audits in accordance with the standards of the PCAOB. Those standards require that we plan and perform the audit to obtain reasonable assurance about whether the consolidated financial statements are free of material misstatement, whether due to error or fraud. Our audits included performing procedures to assess the risks of material misstatement of the consolidatedfinancial statements, whether due to error or fraud, and performing procedures to respond to those risks. Such procedures included examining, on a test basis, evidence regarding the amounts and disclosures in the consolidated financial statements. Our audits also included evaluating the accounting principles used and significant estimates made by management, as well as evaluating the overall presentation of the consolidated financial statements. We believe that our audits provide a reasonable basis for our opinion.
Critical Audit Matters
The critical audit matters communicated below are matters arising from the current period audit of the consolidated financial statements that were communicated or required to be communicated to the audit committee and that (1) relate to accounts or disclosures that are material to the consolidated financial statements and (2) involved our especially challenging, subjective, or complex judgments. The communication of critical audit matters does not alter in any way our opinion on the consolidated financial statements, taken as a whole, and we are not, by communicating the critical audit matters below, providing a separate opinion on the critical audit matters or on the accounts or disclosures to which they relate.
Assessment of the Estimated Proved Oil and Gas Reserves on the Determination of Depreciation, Depletion, and Amortization Expense related to Proved Oil and Natural Gas Properties and Impairment of Proved Oil and Natural Gas Properties
The Company’s net proved oil and natural gas properties balance was $1,235.1 million as of December 31, 2021, and the associated depreciation, depletion, and amortization (DD&A) expense for the year ended December 31, 2021 was $105.7 million. The Company recorded no impairment expense for the year ended December 31, 2021. As described in Note 7 to the consolidated financial statements, the Company follows the successful efforts method of accounting for its oil and natural gas properties. The Company’s lease acquisition costs and development costs of proved oil and natural gas properties are amortized using the units-of-production method, at the field level, based on total estimated proved oil and natural gas reserves and estimated proved developed oil and natural gas reserves, respectively. Proved oil and natural gas properties are reviewed for impairment on a periodic basis. If impairment is indicated, the impairment charge reduces the carrying values to their estimated fair values. These fair value measurements are classified as Level 3 measurements and include many unobservable inputs. Fair value is calculated as the estimated discounted future net cash flows attributable to the assets. The Company’s primary assumptions in preparing the estimated discounted future net cash flows to be recovered from oil and natural gas properties are based on (i) proved reserves, (ii) forward commodity prices and assumptions as to costs and expenses, and (iii) the estimated discount rate that would be used by potential purchasers to determine the fair value of the assets.
The principal considerations for our determination that performing procedures relating to the impact of proved oil and natural gas reserves on proved net oil and natural gas properties is a critical audit matter are there was (i) significant judgment by management, including the use of specialists, when developing the fair value measurement of proved oil and natural gas reserves; (ii) a high degree of auditor judgment, subjectivity and effort in performing procedures and evaluating management’s significant assumptions related to developing those estimates, including future production amounts and costs, oil and natural gas prices, future pricing differentials, and future development costs including the Company’s ability to convert proved undeveloped reserves to producing properties within five years of their initial proved booking as well as the weighted average cost of capital; and (iii) the audit effort involved the use of professionals with specialized skill and knowledge.
Addressing the matter involved performing procedures and evaluating audit evidence in connection with forming our overall opinion on the consolidated financial statements. The procedures we performed to address this critical audit matter included:
(i)Testing the operating effectiveness of internal controls relating to management’s estimates of proved oil and natural gas reserves, the calculation of DD&A expense, and the impairment assessment of proved oil and natural gas properties;
(ii)Evaluating the significant assumptions used by management in developing these estimates, including future production, future and historical oil and gas prices, pricing differentials, and future development costs;
(iii)Evaluating management’s development plan for compliance with the SEC rule that undrilled locations are scheduled to be drilled within five years, unless specific circumstances justify a longer time, by assessing consistency of the development projections with the Company’s drill plan and the availability of capital relative to the drill plan;
(iv)Utilizing the work of management’s specialists to evaluate the reasonableness of the estimates of proved oil and natural gas reserves. As a basis for this work, the specialists’ qualifications and objectivity were assessed, as well as the reasonableness of methods and assumptions used by the specialists. The procedures performed also included testing the data used by the specialists and evaluating the specialists’ findings. Evaluating the significant assumptions relating to the estimates of proved oil and natural gas reserves also involved obtaining evidence to support whether the assumptions used were consistent with the past performance of the Company and whether they were consistent with evidence obtained in other areas of the audit;
(v)Testing management’s impairment assessment of proved oil and natural gas properties, including evaluating management’s cash flow analysis related to the proved oil and natural gas properties. In addition, we involved internal valuation professionals with specialized skills and knowledge, who assisted in evaluating the discount rate used in the valuation by comparing it against a discount rate range that was independently developed using publicly available market data for comparable entities;
(vi)Testing the inputs of and recalculating management’s DD&A calculation.
Acquisition of Independence Resources Holdings, LLC and Independence Resources Manager, LLC (collectively “IRM”) - Valuation of Proved Natural Gas and Oil Properties
As described in Note 3 to the consolidated financial statements, $224.1 million was allocated to proved oil and natural gas properties related to the purchase price of IRM on January 7, 2021. As disclosed by management, the Company accounts for business combinations under the acquisition method of accounting. Accordingly, the Company recognizes amounts for identifiable assets acquired and liabilities assumed equal to their estimated acquisition date fair values. The fair value estimate of proved oil and natural gas properties as of an acquisition date was based on estimated proved oil and natural gas reserves and related future net cash flows discounted using a weighted average cost of capital, including estimates and assumptions of future commodity prices and costs, the timing of development activities, projections of oil and natural gas reserves, and estimates to abandon and reclaim producing wells. As disclosed by management, the accuracy of the reserve estimates is a function of the quality of data available and of engineering and geological interpretation and judgment. In addition, estimates of reserves may be revised based on actual production, results of subsequent exploration and development activities, recent commodity prices, operating costs, and other factors. The estimates of oil and natural gas reserves have been developed by specialists, specifically petroleum engineers.
The principal considerations for our determination that performing procedures relating to the allocation and valuation of proved oil and natural gas properties acquired in the IRM acquisition is a critical audit matter are the (i) significant judgment by management, including the use of management’s specialists, when developing the fair value measurement of proved natural gas and oil properties; (ii) a high degree of auditor judgment, subjectivity and effort in performing procedures and evaluating management’s significant assumptions related to future production volumes and commodity prices, as well as the weighted average cost of capital; and (iii) the audit effort involved the use of professionals with specialized skill and knowledge.
Addressing the matter involved performing procedures and evaluating audit evidence in connection with forming our overall opinion on the consolidated financial statements. The primary procedures we performed to address this critical audit matter included:
(i)Testing the operating effectiveness of internal controls relating to the valuation of the acquired proved natural gas and oil properties;
(ii)Testing management’s process for developing the fair value measurement of proved natural gas and oil properties;
(iii)Evaluating the appropriateness of the discounted cash flow model, which included testing the completeness and accuracy of underlying data used in the model and evaluating significant assumptions used by management related to future production volumes and commodity prices, as well as the weighted average cost of capital. The evaluation of management’s assumption related to future commodity prices involved comparing the prices against observable market data. Professionals with specialized skill and knowledge were used to assist in the evaluation of the weighted average cost of capital assumption and the appropriateness of the discounted cash flow model.
(iv)Evaluating the professional qualifications and objectivity of the Company’s engineer primarily responsible for overseeing the preparation of the reserve estimates by the internal engineering staff.
/s/Moss Adams LLP
Houston, Texas
March 11, 20209, 2022
We have served as the Company’s auditor since 2018.
EARTHSTONE ENERGY, INC.
CONSOLIDATED BALANCE SHEETS
(In thousands, except share and per share amounts)
| | | | | | | | | | | |
| | December 31, |
| ASSETS | 2021 | | 2020 |
| Current assets: | | | |
| Cash | $ | 4,013 | | | $ | 1,494 | |
| Accounts receivable: | | | |
| Oil, natural gas, and natural gas liquids revenues | 50,575 | | | 16,255 | |
| Joint interest billings and other, net of allowance of $19 and $19 at December 31, 2021 and 2020, respectively | 2,930 | | | 7,966 | |
| Derivative asset | 1,348 | | | 7,509 | |
| Prepaid expenses and other current assets | 2,549 | | | 1,509 | |
| Total current assets | 61,415 | | | 34,733 | |
| | | |
| Oil and gas properties, successful efforts method: | | | |
| Proved properties | 1,625,367 | | | 1,017,496 | |
| Unproved properties | 222,025 | | | 233,767 | |
| Land | 5,382 | | | 5,382 | |
| Total oil and gas properties | 1,852,774 | | | 1,256,645 | |
| Accumulated depreciation, depletion and amortization | (395,625) | | | (291,213) | |
| Net oil and gas properties | 1,457,149 | | | 965,432 | |
| | | |
| Other noncurrent assets: | | | |
| | | |
| Office and other equipment, net of accumulated depreciation of $4,547 and $3,675 at December 31, 2021 and 2020, respectively | 1,986 | | | 931 | |
| Derivative asset | 157 | | | 396 | |
| Operating lease right-of-use assets | 1,795 | | | 2,450 | |
| Other noncurrent assets | 33,865 | | | 1,315 | |
| TOTAL ASSETS | $ | 1,556,367 | | | $ | 1,005,257 | |
| LIABILITIES AND EQUITY | | | |
| Current liabilities: | | | |
| Accounts payable | $ | 31,397 | | | $ | 6,232 | |
| Revenues and royalties payable | 36,189 | | | 27,492 | |
| Accrued expenses | 31,704 | | | 16,504 | |
| Asset retirement obligation | 395 | | | 447 | |
| Derivative liability | 45,310 | | | 1,135 | |
| Advances | 4,088 | | | 2,277 | |
| Operating lease liability | 681 | | | 773 | |
| Finance lease liability | — | | | 69 | |
| Other current liabilities | 851 | | | 565 | |
| | | |
| Total current liabilities | 150,615 | | | 55,494 | |
| | | |
| Noncurrent liabilities: | | | |
| Long-term debt | 320,000 | | | 115,000 | |
| Asset retirement obligation | 15,471 | | | 2,580 | |
| Derivative liability | 571 | | | 173 | |
| Deferred tax liability | 15,731 | | | 14,497 | |
| Operating lease liability | 1,276 | | | 1,840 | |
| Finance lease liability | — | | | 5 | |
| Other noncurrent liabilities | 6,442 | | | 132 | |
| Total noncurrent liabilities | 359,491 | | | 134,227 | |
| | | |
| Commitments and Contingencies (Note 15) | 0 | | 0 |
| | | |
| Equity: | | | |
| Preferred stock, $0.001 par value, 20,000,000 shares authorized; none issued or outstanding | — | | | — | |
| | | |
| Class A Common Stock, $0.001 par value, 200,000,000 shares authorized; 53,467,307 and 30,343,421 issued and outstanding at December 31, 2021 and 2020, respectively | 53 | | | 30 | |
|
| | | | | | | |
| | December 31, |
| ASSETS | 2019 | | 2018 |
| Current assets: | | | |
| Cash | $ | 13,822 |
| | $ | 376 |
|
| Accounts receivable: | | | |
| Oil, natural gas, and natural gas liquids revenues | 29,047 |
| | 13,683 |
|
| Joint interest billings and other, net of allowance of $83 and $134 at December 31, 2019 and 2018, respectively | 6,672 |
| | 4,166 |
|
| Derivative asset | 8,860 |
| | 43,888 |
|
| Prepaid expenses and other current assets | 1,867 |
| | 1,443 |
|
| Total current assets | 60,268 |
| | 63,556 |
|
| | | | |
| Oil and gas properties, successful efforts method: | | | |
| Proved properties | 970,808 |
| | 755,443 |
|
| Unproved properties | 260,271 |
| | 266,140 |
|
| Land | 5,382 |
| | 5,382 |
|
| Total oil and gas properties | 1,236,461 |
| | 1,026,965 |
|
| Accumulated depreciation, depletion and amortization | (195,567 | ) | | (127,256 | ) |
| Net oil and gas properties | 1,040,894 |
| | 899,709 |
|
| | | | |
| Other noncurrent assets: | | | |
| Goodwill | 17,620 |
| | 17,620 |
|
| Office and other equipment, net of accumulated depreciation of $3,180 and $2,490 at December 31, 2019 and 2018, respectively | 1,311 |
| | 662 |
|
| Derivative asset | 770 |
| | 21,121 |
|
| Operating lease right-of-use assets | 3,108 |
| | — |
|
| Other noncurrent assets | 1,572 |
| | 1,640 |
|
| TOTAL ASSETS | $ | 1,125,543 |
| | $ | 1,004,308 |
|
| LIABILITIES AND EQUITY | | | |
| Current liabilities: | | | |
| Accounts payable | $ | 25,284 |
| | $ | 26,452 |
|
| Revenues and royalties payable | 35,815 |
| | 28,748 |
|
| Accrued expenses | 19,538 |
| | 22,406 |
|
| Asset retirement obligation | 308 |
| | 557 |
|
| Derivative liability | 6,889 |
| | 528 |
|
| Advances | 11,505 |
| | 3,174 |
|
| Operating lease liability | 570 |
| | — |
|
| Finance lease liability | 206 |
| | — |
|
| Other current liability | 43 |
| | — |
|
| Total current liabilities | 100,158 |
| | 81,865 |
|
| | | | |
| Noncurrent liabilities: | | | |
| Long-term debt | 170,000 |
| | 78,828 |
|
| Asset retirement obligation | 1,856 |
| | 1,672 |
|
| Derivative liability | — |
| | 1,891 |
|
| Deferred tax liability | 15,154 |
| | 13,489 |
|
| Operating lease liability | 2,539 |
| | — |
|
| Finance lease liability | 85 |
| | — |
|
| Other noncurrent liabilities | — |
| | 71 |
|
| Total noncurrent liabilities | 189,634 |
| | 95,951 |
|
| | | | |
| Commitments and Contingencies (Note 16) |
|
| |
|
|
| | | | |
| Equity: | | | |
| Preferred stock, $0.001 par value, 20,000,000 shares authorized; none issued or outstanding | — |
| | — |
|
| Class A Common Stock, $0.001 par value, 200,000,000 shares authorized; 29,421,131 and 28,696,321 issued and outstanding at December 31, 2019 and 2018, respectively | 29 |
| | 29 |
|
| | | Class B Common Stock, $0.001 par value, 50,000,000 shares authorized; 35,260,680 and 35,452,178 issued and outstanding at December 31, 2019 and 2018, respectively | 35 |
| | 35 |
| |
| Class B Common Stock, $0.001 par value, 50,000,000 shares authorized; 34,344,532 and 35,009,371 issued and outstanding at December 31, 2021 and 2020, respectively | | Class B Common Stock, $0.001 par value, 50,000,000 shares authorized; 34,344,532 and 35,009,371 issued and outstanding at December 31, 2021 and 2020, respectively | 34 | | | 35 | |
| Additional paid-in capital | 527,246 |
| | 517,073 |
| Additional paid-in capital | 718,181 | | | 540,074 | |
| Accumulated deficit | (181,711 | ) | | (182,497 | ) | Accumulated deficit | (159,774) | | | (195,258) | |
| | Total Earthstone Energy, Inc. equity | 345,599 |
| | 334,640 |
| Total Earthstone Energy, Inc. equity | 558,494 | | | 344,881 | |
| Noncontrolling interest | 490,152 |
| | 491,852 |
| Noncontrolling interest | 487,767 | | | 470,655 | |
| Total equity | 835,751 |
| | 826,492 |
| Total equity | 1,046,261 | | | 815,536 | |
| | | | | | | | |
| TOTAL LIABILITIES AND EQUITY | $ | 1,125,543 |
| | $ | 1,004,308 |
| TOTAL LIABILITIES AND EQUITY | $ | 1,556,367 | | | $ | 1,005,257 | |
The accompanying notes are an integral part of these consolidated financial statements.
EARTHSTONE ENERGY, INC.
CONSOLIDATED STATEMENTS OF OPERATIONS
(In thousands, except share and per share amounts)
| | | | Years Ended December 31, | | Years Ended December 31, |
| | 2019 | | 2018 | | 2021 | | 2020 | | 2019 |
| REVENUES | | | | REVENUES | | | | | |
| Oil | $ | 171,925 |
| | $ | 140,775 |
| Oil | $ | 297,177 | | | $ | 120,355 | | | $ | 171,925 | |
| Natural gas | 3,913 |
| | 7,396 |
| Natural gas | 50,809 | | | 8,567 | | | 3,913 | |
| Natural gas liquids | 15,424 |
| | 17,185 |
| Natural gas liquids | 71,657 | | | 15,601 | | | 15,424 | |
| Total revenues | 191,262 |
| | 165,356 |
| Total revenues | 419,643 | | | 144,523 | | | 191,262 | |
| OPERATING COSTS AND EXPENSES |
| |
| OPERATING COSTS AND EXPENSES | | | | | |
| Lease operating expense | 28,683 |
| | 18,746 |
| Lease operating expense | 49,321 | | | 29,131 | | | 28,683 | |
| Production and ad valorem taxes | 11,871 |
| | 9,836 |
| Production and ad valorem taxes | 26,409 | | | 9,411 | | | 11,871 | |
| Rig idle and termination expense | | Rig idle and termination expense | — | | | 426 | | | — | |
| Impairment expense | — |
| | 4,581 |
| Impairment expense | — | | | 64,498 | | | — | |
| Depreciation, depletion and amortization | 69,243 |
| | 47,568 |
| Depreciation, depletion and amortization | 106,367 | | | 96,414 | | | 69,243 | |
| General and administrative expense | 27,611 |
| | 27,346 |
| General and administrative expense | 41,922 | | | 28,233 | | | 27,611 | |
| Transaction costs | 1,077 |
| | 14,337 |
| Transaction costs | 4,875 | | | 622 | | | 1,077 | |
| Accretion of asset retirement obligation | 214 |
| | 169 |
| Accretion of asset retirement obligation | 1,065 | | | 307 | | | 214 | |
| Exploration expense | 653 |
| | 630 |
| Exploration expense | 341 | | | 298 | | | 653 | |
| Total operating costs and expenses | 139,352 |
| | 123,213 |
| Total operating costs and expenses | 230,300 | | | 229,340 | | | 139,352 | |
| Gain on sale of oil and gas properties, net | 3,222 |
| | 1,919 |
| Gain on sale of oil and gas properties, net | 738 | | | 204 | | | 3,222 | |
| Income from operations | 55,132 |
| | 44,062 |
| |
| Income (loss) from operations | | Income (loss) from operations | 190,081 | | | (84,613) | | | 55,132 | |
| OTHER INCOME (EXPENSE) | | | | OTHER INCOME (EXPENSE) | |
| Interest expense, net | (6,566 | ) | | (2,898 | ) | Interest expense, net | (10,796) | | | (5,232) | | | (6,566) | |
| Write-off of deferred financing costs | (1,242 | ) | | — |
| Write-off of deferred financing costs | — | | | — | | | (1,242) | |
| (Loss) gain on derivative contracts, net | (43,983 | ) | | 60,947 |
| (Loss) gain on derivative contracts, net | (116,761) | | | 59,899 | | | (43,983) | |
| Litigation settlement | — |
| | (4,675 | ) | |
| | Other income (expense), net | (96 | ) | | 247 |
| Other income (expense), net | 841 | | | 400 | | | (96) | |
| Total other income (expense) | (51,887 | ) | | 53,621 |
| |
| Income before income taxes | 3,245 |
| | 97,683 |
| |
| Income tax expense | (1,665 | ) | | (2,470 | ) | |
| Net income | 1,580 |
| | 95,213 |
| |
| Less: Net income attributable to noncontrolling interest | 861 |
| | 52,888 |
| |
| Net income attributable to Earthstone Energy, Inc. | $ | 719 |
| | $ | 42,325 |
| |
| Net income per common share attributable to Earthstone Energy, Inc.: | | | | |
| Total other (expense) income | | Total other (expense) income | (126,716) | | | 55,067 | | | (51,887) | |
| Income (loss) before income taxes | | Income (loss) before income taxes | 63,365 | | | (29,546) | | | 3,245 | |
| Income tax (expense) benefit | | Income tax (expense) benefit | (1,859) | | | 112 | | | (1,665) | |
| Net income (loss) | | Net income (loss) | 61,506 | | | (29,434) | | | 1,580 | |
| Less: Net income (loss) attributable to noncontrolling interest | | Less: Net income (loss) attributable to noncontrolling interest | 26,022 | | | (15,887) | | | 861 | |
| Net income (loss) attributable to Earthstone Energy, Inc. | | Net income (loss) attributable to Earthstone Energy, Inc. | $ | 35,484 | | | $ | (13,547) | | | $ | 719 | |
| Net income (loss) per common share attributable to Earthstone Energy, Inc.: | | Net income (loss) per common share attributable to Earthstone Energy, Inc.: | | | | | |
| Basic | $ | 0.02 |
| | $ | 1.50 |
| Basic | $ | 0.75 | | | $ | (0.45) | | | $ | 0.02 | |
| Diluted | $ | 0.02 |
| | $ | 1.50 |
| Diluted | $ | 0.71 | | | $ | (0.45) | | | $ | 0.02 | |
| Weighted average common shares outstanding: | | | | Weighted average common shares outstanding: | |
| Basic | 28,983,354 |
| | 28,153,885 |
| Basic | 47,169,948 | | | 29,911,625 | | | 28,983,354 | |
| Diluted | 29,360,885 |
| | 28,217,774 |
| Diluted | 49,952,093 | | | 29,911,625 | | | 29,360,885 | |
The accompanying notes are an integral part of these consolidated financial statements.
EARTHSTONE ENERGY, INC.
CONSOLIDATED STATEMENTS OF EQUITY
(In thousands, except share amounts)
| | | | | | | | | | | | | | | | | | | | | Issued Shares | | | | | | | | | | | | | | |
| | Issued Shares | | | | | | | | | | | | | | | | Class A Common Stock | | Class B Common Stock | | Class A Common Stock | | Class B Common Stock | | Additional Paid-in Capital | | Accumulated Deficit | | Earthstone Energy, Inc. Equity | | Noncontrolling Interest | | Total Equity |
| | Class A Common Stock | | Class B Common Stock | | Class A Common Stock | | Class B Common Stock | | Additional Paid-in Capital | | Accumulated Deficit | | Total Earthstone Energy, Inc. Stockholders’ Equity | | Noncontrolling Interest | | Total Equity | |
| At January 1, 2018 | 27,584,638 |
| | 36,052,169 |
| | $ | 28 |
| | $ | 36 |
| | $ | 503,932 |
| | $ | (224,822 | ) | | $ | 279,174 |
| | $ | 446,558 |
| | $ | 725,732 |
| |
| Stock-based compensation expense | — |
| | — |
| | — |
| | — |
| | 7,071 |
| | — |
| | 7,071 |
| | — |
| | 7,071 |
| |
| Vesting of restricted stock units, net of taxes paid | 511,692 |
| | — |
| | — |
| | — |
| | — |
| | — |
| | — |
| | — |
| | — |
| |
| Class A Common Stock retained by the Company in exchange for payment of recipient mandatory tax withholdings | 169,893 |
| | — |
| | — |
| | — |
| | (1,524 | ) | | — |
| | (1,524 | ) | | — |
| | (1,524 | ) | |
| Cancellation of treasury shares | (169,893 | ) | | — |
| | — |
| | — |
| | — |
| | — |
| | — |
| | — |
| | — |
| |
| Class B Common Stock converted to Class A Common Stock | 599,991 |
| | (599,991 | ) | | 1 |
| | (1 | ) | | 7,594 |
| | — |
| | 7,594 |
| | (7,594 | ) | | — |
| |
| Net income | — |
| | — |
| | — |
| | — |
| | — |
| | 42,325 |
| | 42,325 |
| | 52,888 |
| | 95,213 |
| |
| At December 31, 2018 | 28,696,321 |
| | 35,452,178 |
| | $ | 29 |
| | $ | 35 |
| | $ | 517,073 |
| | $ | (182,497 | ) | | $ | 334,640 |
| | $ | 491,852 |
| | $ | 826,492 |
| |
| At January 1, 2019 | | At January 1, 2019 | 28,696,321 | | | 35,452,178 | | | $ | 29 | | | $ | 35 | | | $ | 517,073 | | | $ | (182,497) | | | $ | 334,640 | | | $ | 491,852 | | | $ | 826,492 | |
| ASC 842 implementation | — |
| | — |
| | — |
| | — |
| | — |
| | 67 |
| | 67 |
| | 99 |
| | 166 |
| ASC 842 implementation | — | | | — | | | — | | | — | | | — | | | 67 | | | 67 | | | 99 | | | 166 | |
| Stock-based compensation expense | — |
| | — |
| | — |
| | — |
| | 8,648 |
| | — |
| | 8,648 |
| | — |
| | 8,648 |
| Stock-based compensation expense | — | | | — | | | — | | | — | | | 8,648 | | | — | | | 8,648 | | | — | | | 8,648 | |
| Vesting of restricted stock units, net of taxes paid | 533,312 |
| | — |
| | — |
| | — |
| | — |
| | — |
| | — |
| | — |
| | — |
| Vesting of restricted stock units, net of taxes paid | 533,312 | | | — | | | — | | | — | | | — | | | — | | | — | | | — | | | — | |
| Vested restricted stock units retained by the Company in exchange for payment of recipient mandatory tax withholdings | 203,394 |
| | — |
| | — |
| | — |
| | (1,135 | ) | | — |
| | (1,135 | ) | | — |
| | (1,135 | ) | Vested restricted stock units retained by the Company in exchange for payment of recipient mandatory tax withholdings | 203,394 | | | — | | | — | | | — | | | (1,135) | | | — | | | (1,135) | | | — | | | (1,135) | |
| Cancellation of treasury shares | (203,394 | ) | | — |
| | — |
| | — |
| | — |
| | — |
| | — |
| | — |
| | — |
| Cancellation of treasury shares | (203,394) | | | — | | | — | | | — | | | — | | | — | | | — | | | — | | | — | |
| Class B Common Stock converted to Class A Common Stock | 191,498 |
| | (191,498 | ) | | — |
| | — |
| | 2,660 |
| | — |
| | 2,660 |
| | (2,660 | ) | | — |
| Class B Common Stock converted to Class A Common Stock | 191,498 | | | (191,498) | | | — | | | — | | | 2,660 | | | — | | | 2,660 | | | (2,660) | | | — | |
| Net income | — |
| | — |
| | — |
| | — |
| | — |
| | 719 |
| | 719 |
| | 861 |
| | 1,580 |
| Net income | — | | | — | | | — | | | — | | | — | | | 719 | | | 719 | | | 861 | | | 1,580 | |
| At December 31, 2019 | 29,421,131 |
| | 35,260,680 |
| | $ | 29 |
| | $ | 35 |
| | $ | 527,246 |
| | $ | (181,711 | ) | | $ | 345,599 |
| | $ | 490,152 |
| | $ | 835,751 |
| At December 31, 2019 | 29,421,131 | | | 35,260,680 | | | $ | 29 | | | $ | 35 | | | $ | 527,246 | | | $ | (181,711) | | | $ | 345,599 | | | $ | 490,152 | | | $ | 835,751 | |
| | Stock-based compensation expense | | Stock-based compensation expense | — | | | — | | | — | | | — | | | 10,054 | | | — | | | 10,054 | | | — | | | 10,054 | |
| Vesting of restricted stock units, net of taxes paid | | Vesting of restricted stock units, net of taxes paid | 670,981 | | | — | | | 1 | | | — | | | (1) | | | — | | | — | | | — | | | — | |
| Vested restricted stock units retained by the Company in exchange for payment of recipient mandatory tax withholdings | | Vested restricted stock units retained by the Company in exchange for payment of recipient mandatory tax withholdings | 243,924 | | | — | | | — | | | — | | | (835) | | | — | | | (835) | | | — | | | (835) | |
| Cancellation of treasury shares | | Cancellation of treasury shares | (243,924) | | | — | | | — | | | — | | | — | | | — | | | — | | | — | | | — | |
| Class B Common Stock converted to Class A Common Stock | | Class B Common Stock converted to Class A Common Stock | 251,309 | | | (251,309) | | | — | | | — | | | 3,610 | | | — | | | 3,610 | | | (3,610) | | | — | |
| Net loss | | Net loss | — | | | — | | | — | | | — | | | — | | | (13,547) | | | (13,547) | | | (15,887) | | | (29,434) | |
| At December 31, 2020 | | At December 31, 2020 | 30,343,421 | | | 35,009,371 | | | $ | 30 | | | $ | 35 | | | $ | 540,074 | | | $ | (195,258) | | | $ | 344,881 | | | $ | 470,655 | | | $ | 815,536 | |
| Stock-based compensation expense | | Stock-based compensation expense | — | | | — | | | — | | | — | | | 9,132 | | | — | | | 9,132 | | | — | | | 9,132 | |
| Modification of performance units | | Modification of performance units | — | | | — | | | — | | | — | | | (2,276) | | | — | | | (2,276) | | | — | | | (2,276) | |
| Shares issued in connection with IRM Acquisition | | Shares issued in connection with IRM Acquisition | 12,719,594 | | | — | | | 13 | | | — | | | 76,559 | | | — | | | 76,572 | | | — | | | 76,572 | |
| Shares issued in connection with Tracker Acquisition | | Shares issued in connection with Tracker Acquisition | 6,200,000 | | | — | | | 6 | | | — | | | 61,808 | | | — | | | 61,814 | | | — | | | 61,814 | |
| Shares issued in connection with Foreland Acquisition | | Shares issued in connection with Foreland Acquisition | 2,611,111 | | | — | | | 2 | | | — | | | 28,119 | | | — | | | 28,121 | | | — | | | 28,121 | |
| Vesting of restricted stock units, net of taxes paid | | Vesting of restricted stock units, net of taxes paid | 928,342 | | | — | | | 1 | | | — | | | (1) | | | — | | | — | | | — | | | — | |
| Class A Shares retained by the Company in exchange for payment of recipient mandatory tax withholdings | | Class A Shares retained by the Company in exchange for payment of recipient mandatory tax withholdings | 453,483 | | | — | | | — | | | — | | | (4,144) | | | — | | | (4,144) | | | — | | | (4,144) | |
| Cancellation of treasury shares | | Cancellation of treasury shares | (453,483) | | | — | | | — | | | — | | | — | | | — | | | — | | | — | | | — | |
| Class B Common Stock converted to Class A Common Stock | | Class B Common Stock converted to Class A Common Stock | 664,839 | | | (664,839) | | | 1 | | | (1) | | | 8,910 | | | — | | | 8,910 | | | (8,910) | | | — | |
| Net income | | Net income | — | | | — | | | — | | | — | | | — | | | 35,484 | | | 35,484 | | | 26,022 | | | 61,506 | |
| At December 31, 2021 | | At December 31, 2021 | 53,467,307 | | | 34,344,532 | | | $ | 53 | | | $ | 34 | | | $ | 718,181 | | | $ | (159,774) | | | $ | 558,494 | | | $ | 487,767 | | | $ | 1,046,261 | |
|
The accompanying notes are an integral part of these consolidated financial statements.
EARTHSTONE ENERGY, INC.
CONSOLIDATED STATEMENTS OF CASH FLOWS
(In thousands)
| | | | Years Ended December 31, | | Years Ended December 31, |
| | 2019 | | 2018 | | 2021 | | 2020 | | 2019 |
| Cash flows from operating activities: | |
| | | Cash flows from operating activities: | | | | | |
| Net income | $ | 1,580 |
| | $ | 95,213 |
| |
| Adjustments to reconcile net income to net cash provided by operating activities: | | | | |
| Net income (loss) | | Net income (loss) | $ | 61,506 | | | $ | (29,434) | | | $ | 1,580 | |
| Adjustments to reconcile net income (loss) to net cash provided by operating activities: | | Adjustments to reconcile net income (loss) to net cash provided by operating activities: | |
| Impairment of proved and unproved oil and gas properties | — |
| | 4,581 |
| Impairment of proved and unproved oil and gas properties | — | | | 46,878 | | | — | |
| Depreciation, depletion and amortization | 69,243 |
| | 47,568 |
| Depreciation, depletion and amortization | 106,367 | | | 96,414 | | | 69,243 | |
| Accretion of asset retirement obligations | 214 |
| | 169 |
| Accretion of asset retirement obligations | 1,065 | | | 307 | | | 214 | |
| Impairment of goodwill | | Impairment of goodwill | — | | | 17,620 | | | — | |
| Gain on sale of oil and gas properties, net | (3,222 | ) | | (1,919 | ) | Gain on sale of oil and gas properties, net | (738) | | | (204) | | | (3,222) | |
| Gain on sale of office and other equipment | | Gain on sale of office and other equipment | (140) | | | — | | | — | |
| Settlement of asset retirement obligations | (374 | ) | | (79 | ) | Settlement of asset retirement obligations | (185) | | | (195) | | | (374) | |
| | Total loss (gain) on derivative contracts, net | 43,983 |
| | (60,947 | ) | Total loss (gain) on derivative contracts, net | 116,761 | | | (59,899) | | | 43,983 | |
| Operating portion of net cash received (paid) in settlement of derivative contracts | 15,866 |
| | (15,090 | ) | |
| Operating portion of net cash received in settlement of derivative contracts | | Operating portion of net cash received in settlement of derivative contracts | (75,966) | | | 56,044 | | | 15,866 | |
| Stock-based compensation | 8,648 |
| | 7,071 |
| Stock-based compensation | 21,014 | | | 10,054 | | | 8,648 | |
| Deferred income taxes | 1,665 |
| | 2,470 |
| Deferred income taxes | 1,859 | | | (657) | | | 1,665 | |
| Write-off of deferred financing costs | 1,242 |
| | — |
| Write-off of deferred financing costs | — | | | — | | | 1,242 | |
| Amortization of deferred financing costs | 412 |
| | 325 |
| Amortization of deferred financing costs | 856 | | | 322 | | | 412 | |
| Changes in assets and liabilities: | | | | Changes in assets and liabilities: | |
| (Increase) decrease in accounts receivable | (18,035 | ) | | (8,195 | ) | (Increase) decrease in accounts receivable | (19,061) | | | 11,914 | | | (18,035) | |
| (Increase) decrease in prepaid expenses and other current assets | 66 |
| | (376 | ) | (Increase) decrease in prepaid expenses and other current assets | 58 | | | (203) | | | 66 | |
| Increase (decrease) in accounts payable and accrued expenses | (10,438 | ) | | 1,132 |
| Increase (decrease) in accounts payable and accrued expenses | 9,293 | | | 481 | | | (10,438) | |
| Increase (decrease) in revenues and royalties payable | 7,067 |
| | 31,869 |
| Increase (decrease) in revenues and royalties payable | 5,985 | | | (8,323) | | | 7,067 | |
| Increase (decrease) in advances | 8,331 |
| | (1,413 | ) | Increase (decrease) in advances | 2,200 | | | (9,617) | | | 8,331 | |
| Net cash provided by operating activities | 126,248 |
| | 102,379 |
| Net cash provided by operating activities | 230,874 | | | 131,502 | | | 126,248 | |
| Cash flows from investing activities: | | | | Cash flows from investing activities: | | | | | |
| | Acquisition of oil and gas properties | — |
| | (32,551 | ) | Acquisition of oil and gas properties | (311,324) | | | — | | | — | |
| Additions to oil and gas properties | (204,268 | ) | | (149,999 | ) | Additions to oil and gas properties | (114,521) | | | (88,097) | | | (204,268) | |
| Additions to office and other equipment | (527 | ) | | (170 | ) | Additions to office and other equipment | (1,365) | | | (114) | | | (527) | |
| Proceeds from sale of oil and gas properties | 4,184 |
| | 5,965 |
| Proceeds from sale of oil and gas properties | 975 | | | 414 | | | 4,184 | |
| | Net cash used in investing activities | (200,611 | ) | | (176,755 | ) | Net cash used in investing activities | (426,235) | | | (87,797) | | | (200,611) | |
| Cash flows from financing activities: | | | | Cash flows from financing activities: | | | | | |
| Proceeds from borrowings | 234,680 |
| | 156,830 |
| Proceeds from borrowings | 744,132 | | | 136,056 | | | 234,680 | |
| Repayments of borrowings | (143,508 | ) | | (103,002 | ) | Repayments of borrowings | (539,132) | | | (191,056) | | | (143,508) | |
| Cash paid related to the exchange and cancellation of Class A Common Stock | (1,135 | ) | | (1,524 | ) | Cash paid related to the exchange and cancellation of Class A Common Stock | (4,144) | | | (836) | | | (1,135) | |
| Cash paid for finance leases | (392 | ) | | — |
| Cash paid for finance leases | (70) | | | (130) | | | (392) | |
| Deferred financing costs | (1,836 | ) | | (507 | ) | Deferred financing costs | (2,906) | | | (67) | | | (1,836) | |
| Net cash provided by financing activities | 87,809 |
| | 51,797 |
| |
| | Net cash (used in) provided by financing activities | | Net cash (used in) provided by financing activities | 197,880 | | | (56,033) | | | 87,809 | |
| Net increase (decrease) in cash | 13,446 |
| | (22,579 | ) | Net increase (decrease) in cash | 2,519 | | | (12,328) | | | 13,446 | |
| Cash at beginning of period | 376 |
| | 22,955 |
| Cash at beginning of period | 1,494 | | | 13,822 | | | 376 | |
| Cash at end of period | $ | 13,822 |
| | $ | 376 |
| Cash at end of period | $ | 4,013 | | | $ | 1,494 | | | $ | 13,822 | |
| Supplemental disclosure of cash flow information | | | | Supplemental disclosure of cash flow information | | | | | |
| Cash paid for: | | | | Cash paid for: | |
| Interest | $ | 6,405 |
| | $ | 2,290 |
| Interest | $ | 9,648 | | | $ | 4,588 | | | $ | 6,405 | |
| Income taxes | | Income taxes | $ | 325 | | | $ | — | | | $ | — | |
| Non-cash investing and financing activities: | | | | Non-cash investing and financing activities: | |
| | Class A Common Stock issued in IRM Acquisition | | Class A Common Stock issued in IRM Acquisition | $ | 76,572 | | | $ | — | | | $ | — | |
| Class A Common Stock issued in Tracker/Sequel Acquisition | | Class A Common Stock issued in Tracker/Sequel Acquisition | $ | 61,814 | | | $ | — | | | $ | — | |
| Class A Common Stock issued in Foreland Acquisition | | Class A Common Stock issued in Foreland Acquisition | $ | 28,121 | | | $ | — | | | $ | — | |
| Accrued capital expenditures | $ | 28,356 |
| | $ | 22,801 |
| Accrued capital expenditures | $ | 23,558 | | | $ | 7,328 | | | $ | 28,356 | |
| Lease asset additions - ASC 842 | $ | 3,722 |
| | $ | — |
| Lease asset additions - ASC 842 | $ | — | | | $ | — | | | $ | 3,722 | |
| Asset retirement obligations | $ | 105 |
| | $ | 252 |
| Asset retirement obligations | $ | 2,178 | | | $ | 762 | | | $ | 105 | |
|
The accompanying notes are an integral part of these consolidated financial statements.
EARTHSTONE ENERGY, INC.
NOTES TO CONSOLIDATED FINANCIAL STATEMENTS
Note 1. – Organization and Basis of Presentation
Earthstone Energy, Inc., a Delaware corporation (“Earthstone” and together with its consolidated subsidiaries, the “Company”), is a growth-oriented independent oil and natural gas development and production company. In addition, the Company is active in corporate mergers and the acquisition of oil and natural gas properties that have production and future development opportunities. The Company’s operations are all in the up-stream segment of the oil and natural gas industry and all its properties are onshore in the United States.
Earthstone is the sole managing member of Earthstone Energy Holdings, LLC, a Delaware limited liability company (together with its wholly-owned consolidated subsidiaries, “EEH”), with a controlling interest in EEH. Earthstone, together with its wholly-owned subsidiary, Lynden Energy Corp., a corporation organized under the laws of British Columbia (“Lynden Corp”), and Lynden Corp’s wholly-owned consolidated subsidiary, Lynden USA Inc., a Utah corporation (“Lynden US”) and also a member of EEH, consolidates the financial results of EEH and records a noncontrolling interest in the Consolidated Financial Statements representing the economic interests of EEH’s members other than Earthstone and Lynden US.
Certain prior period amounts have been reclassified to conform to current period presentation within the Consolidated Financial Statements. Prior period ad valorem taxes previously included in Lease operating expenses within the Operating Costs and Expenses section of the Consolidated Statements of Operations have been reclassified from Lease operating expenses, combined with the previously presented Severance taxes line-item and the combined total presented as Production and ad valorem taxes, also within Operating Costs and Expenses, to conform to current period presentation. Additionally, prior period legal expenses related to a previously completed transaction and previously included in General and administrative expense within Operating Costs and Expenses have been reclassified to Transaction costs, also within Operating Costs and Expenses, to conform to current period presentation. These reclassifications had no effect on Income from operations or any other subtotal in the Consolidated Statements of Operations.
Note 2. – Summary of Significant Accounting Policies
Principles of Consolidation
The Consolidated Financial Statements include the accounts and balances of the Company and have been prepared in accordance with accounting principles generally accepted in the United States (“GAAP”). All intercompany accounts and transactions, including revenues and expenses, are eliminated in consolidation.
Use of Estimates
The preparation of the Company’s Consolidated Financial Statements in conformity with GAAP requires the Company’s management to make estimates and assumptions that affect the reported amounts of assets and liabilities and disclosure of contingent assets and liabilities, if any, at the date of the Consolidated Financial Statements and the reported amounts of revenues and expenses during the respective reporting periods then ended.
Estimated quantities of crude oil, natural gas and natural gas liquids reserves are the most significant of the Company’s estimates. All reserve data used in the preparation of the Consolidated Financial Statements, as well as included in Note 20.21. Supplemental Information On Oil And Gas Exploration And Production Activities (Unaudited), are based on estimates. Reservoir engineering is a subjective process of estimating underground accumulations of crude oil, natural gas and natural gas liquids. There are numerous uncertainties inherent in estimating quantities of proved crude oil, natural gas and natural gas liquids reserves. The accuracy of any reserve estimate is a function of the quality of available data and of engineering and geological interpretation and judgment. As a result, reserve estimates may be different from the quantities of crude oil, natural gas and natural gas liquids that are ultimately recovered.
Other items subject to estimates and assumptions include, but are not limited to, the carrying amounts of property, plant and equipment, goodwill, asset retirement obligations, valuation allowances for deferred income tax assets, valuation of derivative instruments and valuation of certain performance-based restricted stock unit awards. Management evaluates estimates and assumptions on an ongoing basis using historical experience and other factors, including the current economic and commodity price environment. The volatility of commodity prices results in increased uncertainty inherent in such estimates and assumptions. See Note 20.21.Supplemental Information onOn Oil and Gas Exploration and Production Activities (Unaudited).
Although management believes these estimates are reasonable, actual results may differ from estimates and assumptions of future events and these revisions could be material. Future production may vary materially from estimated oil and natural gas proved reserves. Actual future prices may vary significantly from price assumptions used for determining proved reserves and for financial reporting.
EARTHSTONE ENERGY, INC.
NOTES TO CONSOLIDATED FINANCIAL STATEMENTS (continued)
Accounts Receivable
Accounts receivable include estimated amounts due from crude oil, natural gas, and natural gas liquids purchasers, other operators for which the Company holds an interest, and from non-operating working interest owners. Accrued crude oil, natural gas, and natural gas liquids sales from purchasers and operators consist of accrued revenues due under normal trade terms, generally requiring payment within 60 days of production. For receivables from joint interest owners, the Company typically has the ability to withhold future revenue disbursements to recover any non-payment of joint interest billings.
EARTHSTONE ENERGY, INC.
NOTES TO CONSOLIDATED FINANCIAL STATEMENTS (continued)
An allowance for doubtful accounts is established based on reviews of individual customer accounts, recent loss experience, current economic conditions, and other pertinent factors. Accounts deemed uncollectible are charged to the allowance.
Provisions for bad debts and recoveries on accounts previously charged off are added to the allowance. The Company routinely assesses the recoverability of all material trade receivables and other receivables to determine their collectability. Allowance for uncollectible accounts receivable was $0.1$0.02 million and $0.1$0.02 million at December 31, 20192021 and 2018,2020, respectively.
Derivative Instruments
The Company utilizes derivative instruments in order to manage exposure to commodity price riskrisks associated with future oilfluctuating commodity prices and natural gas production.interest rates. The Company recognizes all derivatives as either assets or liabilities, measured at fair value, and recognizes changes in the fair value of derivatives in current earnings. The Company has elected to not designate any of its positions under the hedge accounting rules. Accordingly, these derivative contracts are mark-to-market and any changes in the estimated values of derivative contracts held at the balance sheet date are recognized in (Loss) gain on derivative contracts, net in the Consolidated Statements of Operations as unrealized gains or losses on derivative contracts. Realized gains or losses on derivative contracts are also recognized in (Loss) gain on derivative contracts, net in the Consolidated Statements of Operations.
Oil and Natural Gas Properties
The method of accounting for oil and natural gas properties determines what costs are capitalized and how these costs are ultimately matched with revenues and expenses. The Company uses the successful efforts method of accounting for oil and natural gas properties. For more information see Note 7.Oil and Natural Gas Properties.
Goodwill
Goodwill represents the excess of the purchase price of assets acquired over the fair value of those assets and is tested for impairment annually, or more frequently if events or changes in circumstances indicate that the carrying value of goodwill may not be recoverable. Such test includes an assessment of qualitative and quantitative factors. The Company had no goodwill recorded in the Consolidated Balance Sheets at December 31, 2021 or 2020.
There were no impairments to Goodwill recorded in the year ended December 31, 2021. A discounted future cash flow analysis of the properties to which the Goodwill was associated was performed based on commodity price futures as of March 31, 2020. The resulting fair value was lower than the net book value of the associated properties. Additionally, the Company’s enterprise value, calculated as the combined market capitalization of the Company’s equity and long-term debt, was lower than the book value of its assets, without allocating between the Company's two major properties, Midland properties and Eagle Ford properties. Accordingly, the entire $17.6 million balance of Goodwill was impaired on that date, resulting in no remaining amounts subject to impairment. There were no impairments to Goodwill recorded in the year ended December 31, 2019.
Office and Other Equipment
Office and other equipment primarily includes leasehold improvements, vehicles, computer equipment and software, office furniture and fixtures and field equipment. These items are recorded at cost, or fair value if acquired, and are depreciated using the straight-line method based on expected lives of the individual assets or group of assets ranging from two years to 10 years. The Company had office and other equipment of $2.0 million and $0.9 million, net of accumulated depreciation and amortization of $4.5 million and $3.7 million, at December 31, 2021 and 2020, respectively. During the years ended December 31, 2021, 2020 and 2019, the Company recognized depreciation expense of $0.7 million, $0.5 million and 2018, respectfully. For further discussion, see $0.7 million, respectively. See separate finance lease disclosures in Note 8. Goodwill18. Leases.
Noncontrolling Interest
Noncontrolling Interest represents third-party equity ownership of EEH and is presented as a component of equity in the Consolidated Balance SheetSheets as of December 31, 20192021 and 2018,2020, as well as an adjustment to Net income in the Consolidated StatementStatements of Operations for the years ended December 31, 20192021 and 2018.2020. As of December 31, 2019,2021, Earthstone and Lynden US owned a 45.5%60.9% membership interest in EEH while Bold Energy Holdings, LLC (“Bold Holdings”), the noncontrolling third party,third-party, owned the remaining 54.5%39.1%. See further discussion in Note 9.8. Noncontrolling Interest.
Segment Reporting
Operating segments are components of an enterprise that (i) engage in activities from which it may earn revenues and incur expenses (ii) for which separate operational financial information is available and is regularly evaluated by the chief operating decision maker for the purpose of allocating resources and assessing performance.
EARTHSTONE ENERGY, INC.
NOTES TO CONSOLIDATED FINANCIAL STATEMENTS (continued)
Based on the Company’s organization and management, it has only one1 reportable operating segment, which is oil and natural gas exploration and production.
Comprehensive Income
The Company has no elements of comprehensive income other than net income.
Asset Retirement Obligations
Asset retirement obligations associated with the retirement of long-lived assets are recognized as liabilities with an increase to the carrying amounts of the related long-lived assets in the period incurred. The cost of the asset, including the asset retirement cost, is depreciated over the useful life of the asset. Asset retirement obligations are recorded at estimated fair value, measured by
EARTHSTONE ENERGY, INC.
NOTES TO CONSOLIDATED FINANCIAL STATEMENTS (continued)
reference to the expected future cash outflows required to satisfy the retirement obligations discounted at the Company’s credit-adjusted risk-free interest rate. Accretion expense is recognized over time as the discounted liabilities are accreted to their expected settlement value. If estimated future costs of asset retirement obligations change, an adjustment is recorded to both the asset retirement obligations and the long-lived asset. Revisions to estimated asset retirement obligations can result from changes in retirement cost estimates, revisions to estimated inflation rates, and changes in the estimated timing of abandonment. For further discussion, see Note 14.13.Asset Retirement Obligations.
Business Combinations
The Company accounts for its acquisitions of oil and gas properties not commonly controlled in accordance with Financial Accounting Standards Board (“FASB”) Accounting Standards Codification (“ASC”) Topic 805, Business Combinations, which, among other things, requires the Company to determine if an asset or a business has been acquired. If the Company determines an asset(s) has been acquired, the asset(s) acquired, as well as any liabilities assumed, are measured and recorded at the acquisition date cost. If the Company determines a business has been acquired, the assets acquired and liabilities assumed are measured and recorded at their fair values as of the acquisition date, recording goodwill for amounts paid in excess of fair value.
Revenue Recognition
The Company’s revenues are comprised solely of revenues from customers and include the sale of oil, natural gas and natural gas liquids. The Company believes that the disaggregation of revenue into these three major product types, as presented in the Consolidated Statements of Operations, appropriately depicts how the nature, amount, timing and uncertainty of revenue and cash flows are affected by economic factors based on its single geographic region. Revenues are recognized when the recognition criteria of ASC 606 “Revenue from Contracts with Customers,” (“ASC 606”) are met, which generally occurs at a point in time when production is sold to a purchaser at a determinable price, delivery has occurred, control has transferred and collection of the revenue is probable. The Company fulfills its performance obligations under its customer contracts through delivery of oil, natural gas and natural gas liquids and revenues are recorded on a monthly basis and the Company receives payment from one to three months after delivery. Generally, each unit of product represents a separate performance obligation. The prices received for oil, natural gas and natural gas liquids sales under the Company’s contracts are generally derived from stated market prices which are then adjusted to reflect deductions including transportation, fractionation and processing. As a result, revenues from the sale of oil, natural gas and natural gas liquids will decrease if market prices decline. The sales of oil, natural gas and natural gas liquids, as presented on the Consolidated Statements of Operations, represent the Company’s share of revenues net of royalties and excluding revenue interests owned by others. When selling oil, natural gas and natural gas liquids on behalf of royalty or working interest owners, the Company is acting as an agent and thus reports the revenue on a net basis. To the extent actual volumes and prices of oil and natural gas sales are unavailable for a given reporting period because of timing or information not received from third parties, the expected sales volumes and prices for those properties are estimated and recorded. Variances between the Company’s estimated revenue and actual payment are recorded in the month the payment is received. Historically, however, differences have been insignificant.
At the end of each month when the performance obligation is satisfied, the variable consideration can be reasonably estimated and amounts due from customers are recorded in “Accounts receivable: oil, natural gas, and natural gas liquids revenues” in the Consolidated Balance Sheets. As of December 31, 20192021 and 2018, receivables2020, amounts receivable from contracts with customers were $29.0$50.6 million and $13.7$16.3 million, respectively. Taxes assessed by governmental authorities on oil, natural gas and NGL sales are presented separately from such revenues in the Consolidated Statements of Operations.
Oil Sales
Oil production is transported from the wellhead to tank batteries or delivery points through flow-lines or gathering systems. Purchasers of the oil take delivery at (i) the tank batteries and transport the oil by truck, or (ii) at a pipeline delivery point and the Company collects a market price, net of pricing differentials. Revenue is recognized when control transfers to the purchaser
EARTHSTONE ENERGY, INC.
NOTES TO CONSOLIDATED FINANCIAL STATEMENTS (continued)
at the net price received by the Company. Starting in October 2019, certain of the Company’s oil sales activity involves buy/sell arrangements that effect a change in location with required repurchase of oil at a delivery point. Because the Company acts as the agent in these transactions, the buy/sell activity is recorded on a net basis and the residual transportation fee is included in Lease operating expenses in the Consolidated Statements of Operations.
Natural Gas and NGL Sales
Under the Company’s natural gas sales arrangements, the purchaser takes control of wet gas at a delivery point near the wellhead or at the inlet of the purchaser’s processing facility. The purchaser gathers and processes the wet gas and remits proceeds to the Company for the resulting natural gas and NGL sales. Based on the nature of these arrangements, the Company is the agent and the purchaser is the Company’s customer, thus, the Company recognizes natural gas and NGL sales based on the net amount of proceeds received from the purchaser.
Imbalances
EARTHSTONE ENERGY, INC.
NOTES TO CONSOLIDATED FINANCIAL STATEMENTS (continued)
The Company recognizes revenue for all oil, natural gas and NGL sold to purchasers regardless of whether the sales are proportionate to the Company’s ownership interest in the property. Production imbalances are recognized as a liability to the extent an imbalance on a specific property exceeds the Company’s share of remaining proved oil, NGL and natural gas reserves. The Company is also subject to natural gas pipeline imbalances, which are recorded as accounts receivable or payable at values consistent with contractual arrangements with the owner of the pipeline. The Company had no imbalances as of December 31, 20192021 or 2018.2020.
Contract Balances
Under the Company’s product sales contracts, the Company invoices customers once performance obligations have been satisfied, at which point payment is unconditional. Accordingly, the Company’s product sales contracts do not give rise to contract assets or liabilities under ASC 606.
Transaction Price Allocated to Remaining Performance Obligations
Substantially all of the Company’s product sales are short-term in nature, with a contract term of one year or less. For these contracts, the Company has utilized the practical expedient in ASC 606 which exempts the Company from the requirements to disclose the transaction price allocated to remaining performance obligations if the performance obligation is part of a contract that has an original expected duration of one year or less.
For the Company’s product sales that have a contract term greater than one year, the Company has utilized the practical expedient in ASC 606 which states the Company is not required to disclose the transaction price allocated to remaining performance obligations if the variable consideration is allocated entirely to a wholly unsatisfied performance obligation. Under these contracts, each unit of product generally represents a separate performance obligation; therefore, future volumes are wholly unsatisfied, and disclosure of the transaction price allocated to remaining performance obligations is not required.
Prior-Period Performance Obligations
The Company records revenue in the month that product is delivered to the purchaser. Settlement statements for certain natural gas and NGLs sales, however, may not be received for 30 to 90 days after the date the product is delivered, and as a result the Company is required to estimate the amount of product delivered to the purchaser and the price that will be received for the sale of the product. In these situations, the Company records the differences between its estimates and the actual amounts received for product sales in the month that payment is received from the purchaser. Any identified differences between the Company’s revenue estimates and actual revenue received have historically been insignificant. For the years ended December 31, 20192021 and 2018,2020, revenue recognized in the reporting period related to performance obligations satisfied in prior reporting periods was not material.
Concentration of Credit Risk
Credit risk represents the actual or perceived financial loss that the Company would record if its purchasers, operators, or counterparties failed to perform pursuant to contractual terms.
The purchasers of the Company’s oil, natural gas, and natural gas liquids production consist primarily of independent marketers, major oil and natural gas companies and natural gas pipeline companies. Historically, the Company has not experienced any significant losses from uncollectible accounts. In 2019,the year ended December 31, 2021, two purchasers accounted for 34% and 13%, respectively, of the Company’s oil, natural gas, and natural gas liquids revenues. In the year ended December 31, 2020, three purchasers accounted for 30%32%, 14%15% and 12%, respectively, of the Company’s oil, natural gas, and natural gas liquids revenues. In 2018,the year ended December 31, 2019, three purchasers accounted for 27%30%, 11%14% and 10%12%, respectively, of the Company’s oil, natural gas, and natural gas liquids revenues. No other purchaser accounted for 10% or more of the Company’s oil, natural gas, and natural gas liquids revenues during 2019 and 2018.the years ended December 31, 2021, 2020 or 2019. Additionally, at December 31, 2019,2021, three purchasers accounted for 46%26%, 14%21% and 10%12%, respectively, of the Company’s oil, natural gas and
EARTHSTONE ENERGY, INC.
NOTES TO CONSOLIDATED FINANCIAL STATEMENTS (continued)
natural gas liquids receivables. At December 31, 2018, five2020, three purchasers accounted for 22%18%, 17%, 13%, 11% and 11%16%, respectively, of the Company’s oil, natural gas, and natural gas liquids receivables. No other purchaser accounted for 10% or more of the Company’s oil, natural gas, and natural gas liquids receivables at December 31, 20192021 and 2018.2020.
The Company holds working interests in oil and natural gas properties for which a third partythird-party serves as operator. The operator sells the oil, natural gas, and NGLs to the purchaser, collects the cash, and distributes the cash to the Company. In 2019the year ended December 31, 2021, one operator distributed 13% of the Company’s oil, natural gas and 2018,natural gas liquids revenues. In the year ended December 31, 2020 one operator distributed 15% of the Company’s oil, natural gas and natural gas liquids revenues. In the year ended December 31, 2019, no operator distributed 10% or more of the Company’s oil, natural gas and natural gas liquids revenues.
The derivative instruments of the Company are with a small number of counterparties and, from time-to-time, may represent material assets in the Consolidated Balance Sheets. At December 31, 2019,2021, the Company had a net derivative assetliability position of $2.7$44.4 million. At December 31, 2018,2020, the Company had $62.6$6.6 million of derivative contracts that were in a material asset position.
The Company regularly maintains its cash in bank deposit accounts. Balances held by the Company at its banks typically exceed Federal Deposit Insurance Corporation (“FDIC”) insurance coverage and, as a result, there is a concentration of credit risk related to the amounts of deposit in excess of FDIC insurance coverage.
Stock-Based Compensation
EARTHSTONE ENERGY, INC.
NOTES TO CONSOLIDATED FINANCIAL STATEMENTS (continued)
The Company recognized stock-based compensation expense associated with restricted stock units, which include both time- and performance-based awards. The Company accounts for forfeitures of equity-based incentive awards as they occur. Stock-based compensation expense related to time-based restricted stock units is based on the price of the Class A common stock, $0.001 par value per share of Earthstone (“Class A Common Stock”), on the grant date and recognized over the vesting period using the straight-line method. Stock-based compensation expense relatedThe Company classifies grants to performance-based restricted stock units, which cliff vest, isbe settled in shares as equity awards and awards to be settled in cash a liability awards. The Company accounts for these awards based on a grant date Monte Carlo Simulation pricing model, which calculates multiple potential outcomes for an award and establishes fair value based on the most likely outcome, and is recognized over the vesting period using the straight-line method. The fair value of the liability awards is updated on a quarterly basis. See Note 12.11. Stock-Based Compensation for further details.
Income Taxes
The Company is a U.S. company operating in Texas, as of December 31, 2019, as well as2021, and includes one foreign legal entity, Lynden Corp, which is a Canadian company. Consequently, the Company’s tax provision is based upon the tax laws and rates in effect in the applicable jurisdiction in which its operations are conducted and income is earned. The income tax rates imposed and methods of computing taxable income in these jurisdictions vary. Therefore, as a part of the process of preparing the Consolidated Financial Statements, the Company is required to estimate the income taxes in each of these jurisdictions. This process involves estimating the actual current tax exposure together with assessing temporary differences resulting from differing treatment of items, such as depreciation, amortization and certain accrued liabilities for tax and accounting purposes. The Company’s effective tax rate for financial statement purposes will continue to fluctuate from year to year as its operations are conducted in different taxing jurisdictions.
The Company records an income tax provision consistent with its status as a corporation. The Company’s corporate structure requires the filing of two separate consolidated U.S. Federal income tax returns and one Canadian income tax return resulting from Earthstone’s acquisition of Lynden Corp in May 2016 (the “Lynden Arrangement”) that includes Lynden US, Earthstone, and Lynden Corp. As such, taxable income of Earthstone cannot be offset by tax attributes, including net operating losses, of Lynden US, nor can taxable income of Lynden US be offset by tax attributes of Earthstone. Earthstone and Lynden US record a tax provision, respectively, for their share of the book income or loss of EEH, net of the noncontrolling interest, as well as any standalone income or loss generated by each company. As EEH is treated as a partnership for U.S. Federal income tax purposes, it is not subject to income tax at the federal level and only recognizes the Texas Margin Tax.
The Company’s deferred tax expense or benefit represents the change in the balance of deferred tax assets or liabilities reported in the Consolidated Balance Sheets. Valuation allowances are established to reduce deferred tax assets when it is more likely than not that some portion or all of the deferred tax assets will not be realized. At December 31, 20192021 and 2018,2020, the Company has recorded a valuation allowance for its deferred tax assets in the Consolidated Balance Sheets.
The Company applies the accounting standards related to uncertainty in income taxes. This accounting guidance clarifies the accounting for uncertainties in income taxes by prescribing a minimum recognition threshold that a tax position is required to meet before being recognized in the Consolidated Financial Statements. It requires that the Company recognize in the Consolidated Financial Statements the financial effects of a tax position, if that position is more likely than not of being sustained upon examination, including resolution of any appeals or litigation processes, based upon the technical merits of the
EARTHSTONE ENERGY, INC.
NOTES TO CONSOLIDATED FINANCIAL STATEMENTS (continued)
position. It also provides guidance on measurement, classification, interest, penalties and disclosure. The Company’s tax positions related to its pass-through status and state income tax liability, including deductibility of expenses, have been reviewed by the Company’s management and they believe those positions would more likely than not be sustained upon examination. Accordingly, the Company has not recorded an income tax liability for uncertain tax positions at December 31, 20192021 or 2018.
On December 22, 2017, the United States enacted tax reform legislation commonly known as the Tax Cuts and Jobs Act (the “TCJA”), resulting in significant modifications to existing law. The Company’s Consolidated Financial Statements for the year ended December 31, 2017, reflect certain effects of the TCJA, which includes the federal corporate income tax rate reduction to 21%. Consistent with SEC Staff Accounting Bulletin (“SAB”) No. 118, which provides for a measurement period of one year from the enactment date to finalize the accounting for effects of the TCJA, the Company provisionally recorded income tax expense of $7.8 million related to the TCJA in 2017. In accordance with SEC guidance, provisional amounts may be refined as a result of additional guidance from, and interpretations by, U.S. regulatory and standard-setting bodies, and changes in assumptions. In the subsequent period, provisional amounts will be adjusted for the effects, if any, of interpretative guidance issued after December 31, 2017, by the U.S. Department of the Treasury. As of December 31, 2018, the Company has finalized the accounting for the enactment of the TCJA.2020.
Recently Issued Accounting Standards
Leases - In February 2016, the FASB issued Accounting Standards Update (“ASU”) No. 2016-02, Leases (Topic 842): Amendments to the FASB Accounting Standards Codification (“ASU 2016-02”). In January 2018, the FASB issued ASU No. 2018-01, Leases (Topic 842): Land Easement Practical Expedient for Transition to Topic 842 (“ASU 2018-01”). In July 2018, the FASB issued
EARTHSTONE ENERGY, INC.
NOTES TO CONSOLIDATED FINANCIAL STATEMENTS (continued)
ASU No. 2018-11, Leases (Topic 842): Targeted Improvements (“ASU 2018-11”). Together these related amendments to GAAP represent ASC Topic 842, Leases (“ASC Topic 842”).
ASU 2016-02 requires lessees to recognize lease assets and liabilities (with terms in excess of 12 months) on the balance sheet and disclose key quantitative and qualitative information about leasing arrangements. The Company completed a comprehensive assessment of existing contracts, as well as future potential contracts, to determine the impact of the new accounting guidance on its Consolidated Financial Statements and related disclosures. The evaluation process included review of contracts for drilling rigs, office facilities, compression services, field vehicles and equipment, general corporate leased equipment, and other existing arrangements to support its operations that may contain a lease component. The Company’s evaluation process did not include review of its mineral leases as they are outside the scope of ASC Topic 842.
The Company adopted this guidance on January 1, 2019, the transition date, using the simplified transition method described in ASU 2018-11 which allows entities to continue to apply historical accounting guidance in the comparative periods presented in the year of adoption. Accordingly, prior period amounts in the Company’s financial statements are not adjusted and continue to be reported in accordance with historical accounting guidance.
The Company elected the package of practical expedients within ASU 2016-02 that allows an entity to not reassess, prior to the effective date, (i) whether any expired or existing contracts are or contain leases, (ii) the lease classification for any expired or existing leases or (iii) initial direct costs for any existing leases. Additionally, the Company elected the practical expedient under ASU 2018-01 to not evaluate existing or expired land easements not previously accounted for as leases prior to the effective date.
The Company made an accounting policy election not to apply the lease recognition requirements to short-term leases.
The adoption of ASC Topic 842 did not have a material impact on the Consolidated Financial Statements, resulted in increases of less than 1% to each of its total assets and total liabilities on the balance sheet, and resulted in an immaterial decrease to accumulated deficit as of the beginning of 2019. See Note 19. Leases for further information.
Intangibles – Goodwill and Other – In January 2017, the FASB issued updated guidance simplifying the test for goodwill impairment. The update eliminates the requirement to determine the implied value of goodwill in measuring an impairment loss. Upon adoption, the measurement of a goodwill impairment will represent the excess of the reporting unit’s carrying value over its fair value and will be limited to the carrying value of goodwill. An entity still has the option to perform the qualitative assessment for a reporting unit to determine if the quantitative impairment test is necessary. The update is effective for annual and interim periods beginning after December 15, 2019 and early adoption is permitted for interim or annual goodwill impairment tests performed after January 1, 2017. The Company adopted the update effective January 1, 2020 and the impact was not material to the Consolidated Financial Statements.
Fair Value Measurements – In August 2018, the FASB issued an update which modifies the disclosure requirements on fair value measurements in Topic 820. The ASU is effective for fiscal years beginning after December 15, 2019 and early adoption is permitted. The Company adopted the update effective January 1, 2020 and the impact was not material to the Consolidated Financial Statements.
Income Taxes - In December 2019, the FASB issued an update that simplifies the accounting for income taxes by removing certain exceptions to the general principles in Topic 740. The amendments also improve consistent application of and simplify GAAP for other areas of Topic 740 by clarifying and amending existing guidance. The amendments in this update are effective for fiscal years, and interim periods within those fiscal years, beginning after December 15, 2020 and early adoption is permitted. The Company is in the process of evaluating the impact of this update, if any, on its Consolidated Financial Statements.
Credit Losses - In June 2016, the FASB issued an update that requires changes to the recognition of credit losses on financial instruments not accounted for at fair value through net income, including loans, debt securities, trade receivables, net investments in leases and available-for-sale debt securities. The amended standard broadens the information that an entity must consider in developing its estimate of expected credit losses, requiring an entity to estimate credit losses over the life of an exposure based on historical information, current information and reasonable and supportable forecasts. The guidance is effective for interim and annual periods beginning after December 15, 2019. The Company adopted the update effective January 1, 20202021 and the impact was not material to the Consolidated Financial Statements.
Reference Rate Reform - In March 2020, the FASB issued an update that provides optional guidance for a limited period of time to ease the transition from LIBOR to an alternative reference rate. The ASU intends to address certain concerns relating to accounting for contract modifications and hedge accounting. These optional expedients and exceptions to applying GAAP, assuming certain criteria are met, are allowed through December 31, 2022. The Company is currently evaluating the provisions of this update and has not yet determined whether it will elect the optional expedients. The Company does not expect the transition to an alternative rate to have a material impact on its business, operations or liquidity. Note 3. Acquisitions and Divestitures
The initial accounting for acquisitions and divestitures may not be complete and adjustments to provisional amounts, or recognition of additional assets acquired or liabilities assumed, may occur as additional information is obtained about the facts and circumstances that existed as of the acquisition dates.
Exchange Involving Monetary ConsiderationIRM Acquisition
As part of the execution of its growth strategy to further increase its scale, on January 7, 2021, the Company completed the acquisition (the “IRM Acquisition”) of all of the issued and outstanding limited liability company interests in Independence Resources Management, LLC (“IRM”) and certain wholly owned subsidiaries for consideration consisting of (i) net cash of approximately $140.5 million and (ii) 12,719,594 shares of Class A Common Stock. The fair value of each share of Class A Common Stock was determined using the closing price of $6.02 per share on January 7, 2021. The purchase agreement contained customary representations and warranties for transactions of this nature. The Company obtained representation and warranty insurance to provide coverage in the event of certain breaches of representations and warranties of the seller contained in the purchase agreement, which are subject to various exclusions, deductibles and other terms and conditions set forth therein.
The IRM Acquisition was accounted for as a business combination using the acquisition method of accounting, with Earthstone identified as the acquirer. The consideration transferred, fair value of assets acquired and liabilities assumed by Earthstone were recorded as follows (in thousands, except share amounts and stock price):
EARTHSTONE ENERGY, INC.
NOTES TO CONSOLIDATED FINANCIAL STATEMENTS (continued)
| | | | | |
| Consideration: | |
| Shares of Class A Common Stock issued | 12,719,594 | |
| Class A Common Stock price as of January 7, 2021 | $ | 6.02 | |
| Class A Common Stock consideration | 76,572 | |
| Cash consideration | 140,507 | |
| |
| Total consideration transferred | $ | 217,079 | |
| |
| Fair value of assets acquired: | |
| Cash | $ | 4,763 | |
| Other current assets | 11,524 | |
| Oil and gas properties | 224,112 | |
| Other non-current assets | 252 | |
| Amount attributable to assets acquired | $ | 240,651 | |
| |
| Fair value of liabilities assumed: | |
| Derivative liability | $ | 10,177 | |
| Other current liabilities | 5,196 | |
| Asset retirement obligation - noncurrent | 8,199 | |
| Amount attributable to liabilities assumed | $ | 23,572 | |
Tracker/Sequel Acquisitions
On October 5, 2018,March 31, 2021, Earthstone, EEH, Tracker Resource Development III, LLC, a Delaware limited liability company (“Tracker Opco”), and TRD III Royalty Holdings (TX), LP, a Delaware limited partnership (“RoyaltyCo” and collectively with Tracker Opco, “Tracker”), entered into a purchase and sale agreement (the “Tracker Agreement”), which provided that EEH would acquire (the “Tracker Acquisition”) interests in oil and gas leases and related property of Tracker located in Irion County, Texas (the “Tracker Assets”). Also on March 31, 2021, Earthstone, EEH, SEG-TRD LLC, a Delaware limited liability company (“SEG-I”), and SEG-TRD II LLC, a Delaware limited liability company (“SEG-II” and collectively with SEG-I, “Sequel”) entered into a purchase and sale agreement (the “Sequel Agreement” and collectively with the Company closed a transactionTracker Agreement, the “Tracker/Sequel Purchase Agreements”), which provided that EEH would acquire (the “Sequel Acquisition” and collectively with the Tracker Acquisition, the “Tracker/Sequel Acquisitions”) certain well-bore interests and related equipment (the “Sequel Assets”).
On July 20, 2021, Earthstone, EEH and Tracker consummated the transactions contemplated in the Midland Basin that included producing propertiesTracker Agreement. At the closing of the Tracker Agreement, among other things, EEH acquired the Tracker Assets for aggregate consideration consisting of: (i) $18.8 million in cash, net of customary purchase price adjustments, and undeveloped acreage (the “Exchange”). GAAP required(ii) 4.7 million shares of Class A Common Stock. Also, on July 20, 2021, Earthstone, EEH and Sequel consummated the assets received bytransactions contemplated in the CompanySequel Agreement. At the closing of the Sequel Agreement, among other things, EEH acquired the Sequel Assets for aggregate consideration consisting of: (i) $41.4 million in cash, net of customary purchase price adjustments, and (ii) 1.5 million shares of Class A Common Stock. The Significant Shareholder, as described in the Note referenced below, owned approximately 49% of Tracker as of the closing of the Tracker Acquisition. See Note 14. Related Party Transactions for further discussion.
In accordance with ASC Topic 805, Business Combinations (referred to be treated as a business combination, under ASC 805, and“ASC 805”), the assets conveyed to the other party to be treatedTracker/Sequel Acquisitions have been accounted for as a disposition of assets (discussed in Divestitures below).
Anasset acquisitions. The preliminary allocation of the total purchase price was prepared using, among other things, a reserve report prepared by qualified reserve engineersin the Tracker/Sequel Acquisitions is based upon management’s estimates of and pricedassumptions related to the relative fair value of assets acquired and liabilities assumed. Although the purchase price allocation is substantially complete as of the date of this filing, there may be further adjustments to the acquired oil and natural gas properties. These amounts will be finalized no later than one year from the acquisition date. The market assumptionsconsideration transferred, fair value of assets acquired and liabilities assumed by Earthstone were recorded as follows (in thousands, except share amounts and stock price):
EARTHSTONE ENERGY, INC.
NOTES TO CONSOLIDATED FINANCIAL STATEMENTS (continued)
| | | | | | | | | | |
| | | | | | Total |
| Consideration: | | | | | | |
| Shares of Earthstone Class A Common Stock issued | | | | | | 6,200,000 | |
| Earthstone Class A Common Stock price as of July 20, 2021 | | | | | | $ | 9.97 | |
| Class A Common Stock consideration | | | | | | 61,814 | |
Cash consideration (1) | | | | | | 60,159 | |
Direct transaction costs (2) | | | | | | 1,579 | |
| Total consideration transferred | | | | | | $ | 123,552 | |
| | | | | | |
| Fair value of assets acquired: | | | | | | |
| Oil and gas properties | | | | | | $ | 124,152 | |
| Amount attributable to assets acquired | | | | | | $ | 124,152 | |
| | | | | | |
| Fair value of liabilities assumed: | | | | | | |
| Noncurrent liabilities - ARO | | | | | | 600 | |
| Amount attributable to liabilities assumed | | | | | | $ | 600 | |
| | | | | | |
(1)Includes customary purchase price adjustments.
(2)Represents $1.6 million of transaction costs associated with the Tracker Acquisition and the Sequel Acquisition that have been capitalized in accordance with ASC 805-50.
The following unaudited supplemental pro forma condensed results of operations present consolidated information as though the IRM Acquisition and Tracker/Sequel Acquisitions had been completed as of January 1, 2020. The unaudited supplemental pro forma financial information was derived from the historical consolidated and combined statements of operations for IRM, Tracker, Sequel and Earthstone and adjusted to include depletion expense applied to the adjusted basis of the properties acquired. These unaudited supplemental pro forma results of operations are provided for illustrative purposes only and do not purport to be indicative of the actual results that would have been achieved by the Company for the periods presented or that may be achieved by the Company in the future. Future results may vary significantly from the results reflected in this unaudited pro forma financial information (in thousands, except per share amounts):
| | | | | | | | | | | | | | |
| | | Years Ended December 31, |
| | | 2021 | | 2020 |
| Revenue | | $ | 460,948 | | | $ | 287,359 | |
| Income (loss) before taxes | | 88,917 | | | (239,752) | |
| Net income (loss) | | 87,058 | | | (239,980) | |
| Less: Net income (loss) attributable to noncontrolling interest | | 36,833 | | | (99,695) | |
| Net income (loss) attributable to Earthstone Energy, Inc. | | 50,226 | | | (140,285) | |
| Pro forma net income (loss) per common share attributable to Earthstone Energy, Inc.: | | | | |
| Basic | | $ | 1.06 | | | $ | (2.87) | |
| Diluted | | $ | 1.01 | | | $ | (2.87) | |
| | | | |
The Company has included in its Consolidated Statements of Operations, revenues of $95.1 million and operating expenses of $44.4 million for the period from January 7, 2021 to December 31, 2021 related to the IRM Acquisition. During the year ended December 31, 2021, the Company recorded $4.0 million of legal and professional fees, and employee severance costs related to the IRM Acquisition which are included in Transaction costs in the Consolidated Statements of Operations.
Additionally, the Company has included in its Consolidated Statements of Operations, revenues of $40.5 million and operating expenses of $11.5 million for the period July 20, 2021 to December 31, 2021 related to the Tracker/Sequel Acquisitions.
The fair value measurements of assets acquired and liabilities assumed are based on inputs that are not observable in the market and therefore represent Level 3 inputs. The fair value of oil and gas properties and asset retirement obligations were measured using the discounted cash flow technique of valuation.
Significant inputs to the valuation of oil and gas properties include estimates of: (i) reserves, (ii) future operating and development costs, (iii) future commodity prices, projections(iv) future plugging and abandonment costs, (v) estimated future cash flows,
EARTHSTONE ENERGY, INC.
NOTES TO CONSOLIDATED FINANCIAL STATEMENTS (continued)
and (vi) a market-based weighted average cost of estimated quantitiescapital rate. These inputs require significant judgments and estimates and are the most sensitive and subject to change.
Eagle Ford Acquisitions
In May and June 2021, the Company completed acquisitions of working interests in certain assets it operates located in southern Gonzales County, Texas (collectively, the “Eagle Ford Acquisitions”) from 4 separate sellers. The aggregate purchase price of the Eagle Ford Acquisitions was approximately $45.2 million. One of the 4 separate sellers was a related party. See Note 14. Related Party Transactions for further discussion. The Eagle Ford Acquisitions have been accounted for as asset acquisitions in accordance with ASC 805. The preliminary allocation of each purchase was based upon management’s estimates of and assumptions related to the relative fair value of assets acquired and liabilities assumed. Although the purchase price allocation is substantially complete as of the date of this filing, there may be further adjustments to the acquired oil and natural gas reserves, expectations for timingproperties. These amounts will be finalized no later than one year from the acquisition date.
Foreland-BCC Acquisition
On November 2, 2021, Earthstone, EEH and amountForeland Investments LP, a Delaware limited partnership (“Foreland”), consummated the transactions contemplated in the Purchase and Sale Agreement dated as of September 30, 2021 by and among Earthstone, EEH and Foreland (the “Foreland Purchase Agreement”). At the closing of the future development and operating costs, projections of future rates of production, expected recovery rate and risk adjusted discount rates used by the Company to estimate the fair value of theForeland Purchase Agreement, EEH acquired (the “Foreland Acquisition”) interests in oil and natural gas properties represent Level 3 inputs; see Note 5. Fair Value Measurements, below.
Asleases and related property of Foreland located in Irion County and Crockett County, Texas, for a result, the Company, in exchange for cash of $25.9 million and value for the assets conveyed of $37.1 million, the Company recorded $65.8purchase price consisting of: (i) $16.3 million in Oil and gas properties, as well as $2.8 million in accounts payable related knowncash, net of customary purchase price adjustments, and (ii) 2,611,111 shares of Class A Common Stock.
Also, on November 2, 2021, Earthstone, EEH and BCC-Foreland LLC, a Delaware limited liability company (“BCC”), consummated the transactions contemplated in its Consolidated Balance Sheetthe Purchase and Sale Agreement dated as of December 31, 2018. The effective dateSeptember 30, 2021 by and among Earthstone, EEH and BCC (the “BCC Purchase Agreement”). At the closing of the Exchange was September 1, 2018.BCC Purchase Agreement, EEH acquired (the “BCC Acquisition” and with the Foreland Acquisition, the “Foreland-BCC Acquisition”) certain well-bore interests and related equipment held by BCC that were part of a joint development agreement between Foreland, Foreland Operating, LLC, and BCC involving portions of the acreage covered by the Foreland Purchase Agreement for a purchase price of $23.0 million in cash, net of customary purchase price adjustments.
Divestitures
There were no material divestitures during the years ended December 31, 2021 or 2020. During the year ended December 31, 2019, the Company sold certain of its non-operated oil and gasnon-core properties located in the Midland Basin for approximately $4.2 million in cash, resulting in a gain of approximately $3.6 million recorded in Gain on sale of oil and gas properties, net in the Consolidated Statements of Operations.
During the year ended December 31, 2018, the Company sold certain non-core properties for approximately $6.0 million in cash, while eliminating approximately $0.8 million of future abandonment obligations. The sales resulted in net gains of approximately $4.7 million recorded in Gain on sale of oil and gas properties, net in the Consolidated Statements of Operations.
In association with the Exchange, the Company received value of $37.1 million for Net oil and gas properties conveyed of $39.9 million and recognized a $2.8 million loss on sale of oil and gas properties recorded in Gain on sale of oil and gas properties, net for the year ended December 31, 2018.
Note 4. Transaction Costs
During the year ended December 31, 2019,2021, the Company recorded transaction costs totaling approximately $1.1 million primarily due to legal, consulting and other fees of approximately $4.0 million related to the IRM Acquisition, $1.8 million related to the Chisholm Acquisition and $0.3 million related to other potential transactions, offset by net reimbursements of $1.2 million related to the business combination (the “Bold Transaction”) pursuant to the Bold Contribution Agreement (as defined below) which closed on May 9, 2017, as described in under the “Legal” section of Note 16. Commitments and Contingencies.
On October 17, 2018, Earthstone, EEH and Sabalo Holdings, LLC (“Sabalo Holdings”) entered into a contribution agreement (the “Contribution Agreement”) which provided for the contribution by Sabalo Holdings of all its interests in Sabalo Energy, LLC (“Sabalo Energy”) and Sabalo Energy, Inc. to EEH (the “Sabalo Acquisition”). On December 21, 2018, Earthstone, EEH and Sabalo Holdings entered into a termination agreement (the “Termination Agreement”), pursuant to which the parties terminated the Contribution Agreement.
In connection with the Termination Agreement, Earthstone, EEH and Sabalo Holdings also agreed to release each other from certain claims and liabilities arising out of or related to the Contribution Agreement and the transactions contemplated thereby. All other related agreements were also terminated in conjunction with the termination of the Contribution Agreement.2017.
During the year ended December 31, 2018,2020, the Company recorded transaction costs primarily due to legal, consulting and other fees of approximately $1.0 million related to the acquisition noted above and $0.3 million related to other potential transactions, offset by net reimbursements of $0.7 million related to the Bold Transaction.
During the year ended December 31, 2019, the Company recorded transaction costs totaling approximately $14.3$1.1 million including $13.4 million associated with the terminated Sabalo Acquisition, and $0.8 million of legal fees relatedprimarily due to the Bold Transaction which closed on May 9, 2017.Transaction.
Note 5. Fair Value Measurements
FASB ASC Topic 820, defines fair value as the price that would be received to sell an asset, or paid to transfer a liability, in an orderly transaction between market participants at the measurement date. ASC Topic 820 provides a framework for measuring fair value, establishes a three-level hierarchy for fair value measurements based upon the transparency of inputs to the valuation of an asset or liability as of the measurement date and requires consideration of the counterparty’s creditworthiness when valuing certain assets.
The three-level fair value hierarchy for disclosure of fair value measurements defined by ASC Topic 820 is as follows:
EARTHSTONE ENERGY, INC.
NOTES TO CONSOLIDATED FINANCIAL STATEMENTS (continued)
Level 1 – Unadjusted, quoted prices in active markets that are accessible at the measurement date for identical, unrestricted assets or liabilities. An active market is defined as a market where transactions for the financial instrument occur with sufficient frequency and volume to provide pricing information on an ongoing basis.
Level 2 – Inputs, other than quoted prices within Level 1, that are either directly or indirectly observable for the asset or liability through correlation with market data at the measurement date and for the duration of the instrument’s anticipated life.
EARTHSTONE ENERGY, INC.
NOTES TO CONSOLIDATED FINANCIAL STATEMENTS (continued)
Level 3 – Prices or valuations that require unobservable inputs that are both significant to the fair value measurement and unobservable. Valuation under Level 3 generally involves a significant degree of judgment from management.
A financial instrument’s level within the fair value hierarchy is based on the lowest level of any input that is significant to the fair value measurement. Where available, fair value is based on observable market prices or parameters or derived from such prices or parameters. Where observable prices or inputs are not available, valuation models are applied. These valuation techniques involve some level of management estimation and judgment, the degree of which is dependent on the price transparency for the instruments or market and the instrument’s complexity. The Company reflects transfers between the three levels at the beginning of the reporting period in which the availability of observable inputs no longer justifies classification in the original level. There were no transfers between fair value hierarchy levels for the year ended December 31, 2019.2021.
Fair Value on a Recurring Basis
Derivative Financial Instruments
Derivative financial instruments are carried at fair value and measured on a recurring basis. The derivative financial instruments consist of fixed price swaps, basis swaps and costless collars for crude oil and natural gas.gas and interest rate swaps. The Company’s commodity price hedges and interest rate swaps are valued based on a discounted future cash flow model. The primary input for the model ismodels that are primarily based on published forward commodity price curves. The swapscurves and published LIBOR forward curves; thus, these inputs are also designated as Level 2 within the valuation hierarchy.
The fair values of commodity derivative instruments in an asset positionpositions include a measuremeasures of counterparty nonperformance risk, and the fair values of commodity derivative instruments in a liability positionpositions include a measuremeasures of the Company’s nonperformance risk. These measurements were not material to the Consolidated Financial Statements.
Share-based Compensation Liability
Certain of our performance-based stock awards (“PSUs”) may be payable in cash. The Company classifies the awards that may be settled in cash as liability awards. These awards are valued quarterly utilizing the Monte Carlo Simulation pricing model, which calculates multiple potential outcomes for an award and establishes grant date fair value based on the most likely outcome. The inputs for the Monte Carlo model are designated as Level 2 within the valuation hierarchy. The share-based compensation liability related to the PSU liability awards is included in Accrued expenses and Other noncurrent liabilities in the Consolidated Balance Sheet as of December 31, 2021.
EARTHSTONE ENERGY, INC.
NOTES TO CONSOLIDATED FINANCIAL STATEMENTS (continued)
The following table summarizes the fair value of the Company’s financial assets and liabilities, by level within the fair-value hierarchy (in thousands):
| | | December 31, 2019 | Level 1 | | Level 2 | | Level 3 | | Total | |
| December 31, 2021 | | December 31, 2021 | Level 1 | | Level 2 | | Level 3 | | Total |
| Financial assets | | Financial assets | | | | | | | |
| Derivative asset- current | | Derivative asset- current | $ | — | | | $ | 1,348 | | | $ | — | | | $ | 1,348 | |
| Derivative asset- noncurrent | | Derivative asset- noncurrent | — | | | 157 | | | — | | | 157 | |
| Total financial assets | | Total financial assets | $ | — | | | $ | 1,505 | | | $ | — | | | $ | 1,505 | |
| Financial liabilities | | Financial liabilities | | | | | | | |
| Derivative liability - current | | Derivative liability - current | $ | — | | | $ | 45,310 | | | $ | — | | | $ | 45,310 | |
| Derivative liability - noncurrent | | Derivative liability - noncurrent | — | | | 571 | | | — | | | 571 | |
| Share-based compensation liability - noncurrent | | Share-based compensation liability - noncurrent | — | | | 14,159 | | | — | | | 14,159 | |
| Total financial liabilities | | Total financial liabilities | $ | — | | | $ | 60,040 | | | $ | — | | | $ | 60,040 | |
| December 31, 2020 | | December 31, 2020 | | | | | | | |
| Financial assets | | | | | | | | Financial assets | | | | | | | |
| Derivative asset- current | $ | — |
| | $ | 8,860 |
| | $ | — |
| | $ | 8,860 |
| Derivative asset- current | $ | — | | | $ | 7,509 | | | $ | — | | | $ | 7,509 | |
| Derivative asset- noncurrent | — |
| | 770 |
| | — |
| | 770 |
| Derivative asset- noncurrent | — | | | 396 | | | — | | | 396 | |
| Total financial assets | $ | — |
| | $ | 9,630 |
| | $ | — |
| | $ | 9,630 |
| Total financial assets | $ | — | | | $ | 7,905 | | | $ | — | | | $ | 7,905 | |
| Financial liabilities | | | | | | | | Financial liabilities | | | | | | | |
| Derivative liability - current | $ | — |
| | $ | 6,889 |
| | $ | — |
| | $ | 6,889 |
| Derivative liability - current | $ | — | | | $ | 1,135 | | | $ | — | | | $ | 1,135 | |
| Derivative liability - noncurrent | — |
| | — |
| | — |
| | — |
| Derivative liability - noncurrent | — | | | 173 | | | — | | | 173 | |
| Total financial liabilities | $ | — |
| | $ | 6,889 |
| | $ | — |
| | $ | 6,889 |
| Total financial liabilities | $ | — | | | $ | 1,308 | | | $ | — | | | $ | 1,308 | |
| December 31, 2018 | | | | | | | | |
| Financial assets | | | | | | | | |
| Derivative asset- current | $ | — |
| | $ | 43,888 |
| | $ | — |
| | $ | 43,888 |
| |
| Derivative asset- noncurrent | — |
| | 21,121 |
| | — |
| | 21,121 |
| |
| Total financial assets | $ | — |
| | $ | 65,009 |
| | $ | — |
| | $ | 65,009 |
| |
| Financial liabilities | | | | | | | | |
| Derivative liability - current | $ | — |
| | $ | 528 |
| | $ | — |
| | $ | 528 |
| |
| Derivative liability - noncurrent | — |
| | 1,891 |
| | — |
| | 1,891 |
| |
| Total financial liabilities | $ | — |
| | $ | 2,419 |
| | $ | — |
| | $ | 2,419 |
| |
Other financial instruments include cash, accounts receivable and payable, and revenue royalties. The carrying amount of these instruments approximates fair value because of their short-term nature. The Company’s long-term debt obligation bears interest at floating market rates, therefore carrying amounts and fair value are approximately equal.
Fair Value on a Nonrecurring Basis
The Company applies the provisions of the fair value measurement standard on a non-recurring basis to its non-financial assets and liabilities, including oil and gas properties, goodwill, business combinations and goodwill.asset retirement obligations. These assets and liabilities are not measured at fair value on an ongoing basis but are subject to fair value adjustments onlyif events or changes in certain circumstances.
Proved Oilcircumstances indicate that adjustments may be necessary. Due to significant declines in commodity prices and Natural Gas Properties
Provedglobal demand for oil and natural gas products resulting from the COVID-19 pandemic, the Company assessed the fair values of its oil and natural gas properties are reviewed forand goodwill resulting in non-cash impairment on a nonrecurring basis. The impairment charge reducescharges during the carrying values to their estimated fair values. These fair value measurements are classified as Level 3 measurements and include
EARTHSTONE ENERGY, INC.
NOTES TO CONSOLIDATED FINANCIAL STATEMENTS (continued)
many unobservable inputs. Fair value is calculated as the estimated discounted future net cash flows attributable to the assets. The Company’s primary assumptions in preparing the estimated discounted future net cash flows to be recovered from oil and natural gas properties are based on (i) proved reserves, (ii) forwardthree months ended March 31, 2020. Since then, commodity prices have recovered and assumptions as to costs and expenses, and (iii)no other such triggering events that require further assessment were observed during the estimated discount rate that would be used by potential purchasers to determine the fair value of the assets. See Note 7. Oil and Natural Gas Properties.year ended December 31, 2021.
Goodwill
Goodwill represents the excess of the purchase price of assets acquired over the fair value of those assets and is tested for impairment annually, or more frequently if events or changes in circumstances dictate that the fair value of goodwill may be less than its carrying amount. Such test includes an assessment of qualitative and quantitative factors. See Note 8. Goodwill.
Business Combinations
The Company records the identifiable assets acquired and liabilities assumed at fair value at the date of acquisition on a nonrecurring basis. Fair value may be estimated using comparable market data, a discounted cash flow method, or a combination of the two. In the discounted cash flow method, estimated future cash flows are based on management’s expectations for the future and include estimates of future oil and natural gas production, commodity prices based on NYMEX commodity futures price strips as of the date of the estimate, operating and development costs, and a risk-adjusted discount rate. The future oil and natural gas pricing used in the valuation is a Level 2 assumption. Significant Level 3 assumptions associated with the calculation of discounted cash flows used in the determination of fair value of the acquisition include the Company’s estimate operating and development costs, anticipated production of proved reserves, appropriate risk-adjusted discount rates and other relevant data. The Company’s acquisitions are discussed in Note 3.Acquisitions and Divestitures.
Asset Retirement Obligations
The asset retirement obligation estimates are derived from historical costs and management’s expectation of future cost environments; and therefore, the Company has designated these liabilities as Level 3. The significant inputs to this fair value measurement include estimates of plugging, abandonment and remediation costs, well life, inflation and credit-adjusted risk-free rate. See Note 14.Asset Retirement Obligations for a reconciliation of the beginning and ending balances of the liability for the Company’s asset retirement obligations.
Note 6. Derivative Financial Instruments
Commodity Derivative Instruments
The Company’s hedging activities consist of derivative instruments entered into in order to hedge against changes in oil and natural gas prices through the use of fixed price swaps, and basis swaps agreements.and costless collars. Swaps exchange floating price risk in the future for a fixed price at the time of the hedge. Costless collars set both a maximum (sold ceiling) and a minimum (bought floor) future price. Consistent with its hedging policy, the Company has entered into a series of derivative instruments to hedge a significant portion of its expected oil and natural gas production through December 31, 2020.2021. Typically, these derivative instruments require payments to (receipts from) counterparties based on specific indices as required by the derivative agreements. Although not risk free, the Company believes these instruments reduce its exposure to oil and natural gas price fluctuations and, thereby, allow the Company to achieve a more predictable cash flow.
The Company’s derivative instruments are cash flow hedge transactions in which it is hedging the variability of cash flow related to a forecasted transaction. The Company does not enter into derivative instruments for trading or other speculative purposes. These transactions are recorded in the Consolidated Financial Statements in accordance with FASB ASC Topic 815. The Company has accounted for these transactions using the mark-to-market accounting method. Generally, the Company
EARTHSTONE ENERGY, INC.
NOTES TO CONSOLIDATED FINANCIAL STATEMENTS (continued)
incurs accounting losses on derivatives during periods where prices are rising and gains during periods where prices are falling which may cause significant fluctuations in the Consolidated Balance Sheets and Consolidated Statements of Operations.
The Company nets its derivative instrument fair value amounts executed with each counterparty pursuant to an International Swap Dealers Association Master Agreement (“ISDA”), which provides for net settlement over the term of the contract. The ISDA is a standard contract that governs all derivative contracts entered into between the Company and the respective counterparty. The ISDA allows for offsetting of amounts payable or receivable between the Company and the counterparty, at the election of both parties, for transactions that occur on the same date and in the same currency.
EARTHSTONE ENERGY, INC.
NOTES TO CONSOLIDATED FINANCIAL STATEMENTS (continued)
The following table sets forth the Company’s outstanding derivative contracts at December 31, 2019.2021. When aggregating multiple contracts, the weighted average contract price is disclosed.
| | | | | | | | | | | | | | | | | | | | |
| Period | | Commodity | | Volume
(Bbls / MMBtu) | | Price
($/Bbl / $/MMBtu) |
| 2022 | | Crude Oil Swap | | 2,768,250 | | $57.69 |
| 2022 | | Crude Oil Basis Swap(1) | | 3,832,500 | | $0.51 |
| 2022 | | Natural Gas Swap | | 5,900,000 | | $3.20 |
| 2022 | | Natural Gas Basis Swap(2) | | 9,100,000 | | $(0.26) |
| 2023 | | Natural Gas Swap | | 1,375,000 | | $3.27 |
| | | | | | |
| | | | | | |
| | | | | | |
| | | | | | |
|
| | | | | | |
| Period | | Commodity | | Volume (Bbls / MMBtu) | | Price ($/Bbl / $/MMBtu) |
| 2020 | | Crude Oil Swap | | 2,928,000 | | $60.31 |
| 2020 | | Crude Oil Basis Swap (1) | | 366,000 | | $2.55 |
| 2020 | | Crude Oil Basis Swap (2) | | 2,562,000 | | $(1.40) |
| 2020 | | Natural Gas Swap | | 2,562,000 | | $2.85 |
| 2020 | | Natural Gas Basis Swap (3) | | 2,562,000 | | $(1.07) |
| 2021 | | Crude Oil Swap | | 1,095,000 | | $55.00 |
| 2021 | | Crude Oil Basis Swap (2) | | 1,095,000 | | $0.89 |
| |
(1) | The basis differential price is between WTI Houston and the WTI NYMEX. |
| |
(2) | The basis differential price is between WTI Midland Argus Crude and the WTI NYMEX. |
| |
(3) | The basis differential price is between W. Texas (WAHA) and the Henry Hub NYMEX. |
(2)The basis differential price is between W. Texas (WAHA) and the Henry Hub NYMEX.
| | | | | | | | | | | | | | | | | | | | | | | | | | |
| | | Costless Collars | | |
| Period | | Commodity | | Volume
(Bbls / MMBtu) | | Bought Floor
($/Bbl / $/MMBtu) | | Sold Ceiling
($/Bbl / $/MMBtu) |
| 2022 | | Crude Oil Costless Collar | | 730,000 | | $60.00 | | $73.73 |
| 2023 | | Crude Oil Costless Collar | | 365,000 | | $55.00 | | $71.75 |
| 2022 | | Natural Gas Costless Collar | | 4,037,500 | | $3.43 | | $5.10 |
| 2023 | | Natural Gas Costless Collar | | 888,000 | | $3.25 | | $5.13 |
Interest Rate Swaps
At times, the Company’s hedging activities include the use of interest rate swaps entered into in order to manage cash flow variability resulting from changes in interest rates. These derivative instruments are not accounted for under hedge accounting.
In December 2021, the Company unwound its interest rate swap contracts, receiving a one-time settlement payment of $1.1 million. The Company had no interest rate swaps in place as of December 31, 2021.
The following table summarizes the location and fair value amounts of all derivative instruments in the Consolidated Balance Sheets as well as the gross recognized derivative assets, liabilities, and amounts offset in the Consolidated Balance Sheets (in thousands):
| | | | | | | December 31, 2019 | | December 31, 2018 | | | | | December 31, 2021 | | December 31, 2020 |
Derivatives not designated as hedging contracts under ASC Topic 815 | | Balance Sheet Location | | Gross Recognized Assets / Liabilities | | Gross Amounts Offset | | Net Recognized Assets / Liabilities | | Gross Recognized Assets / Liabilities | | Gross Amounts Offset | | Net Recognized Assets / Liabilities | Derivatives not
designated as hedging
contracts under ASC
Topic 815 | | Balance Sheet Location | | Gross
Recognized
Assets /
Liabilities | | Gross
Amounts
Offset | | Net
Recognized
Assets /
Liabilities | | Gross
Recognized
Assets /
Liabilities | | Gross
Amounts
Offset | | Net
Recognized
Assets /
Liabilities |
| Commodity contracts | | Derivative asset - current | | $ | 13,321 |
| | $ | (4,461 | ) | | $ | 8,860 |
| | $ | 48,662 |
| | $ | (4,774 | ) | | $ | 43,888 |
| Commodity contracts | | Derivative asset - current | | $ | 3,191 | | | $ | (1,843) | | | $ | 1,348 | | | $ | 11,071 | | | $ | (3,562) | | | $ | 7,509 | |
| Commodity contracts | | Derivative liability - current | | $ | 11,350 |
| | $ | (4,461 | ) | | $ | 6,889 |
| | $ | 5,302 |
| | $ | (4,774 | ) | | $ | 528 |
| Commodity contracts | | Derivative liability - current | | $ | 47,153 | | | $ | (1,843) | | | $ | 45,310 | | | $ | 4,492 | | | $ | (3,562) | | | $ | 930 | |
| | Interest rate swaps | | Interest rate swaps | | Derivative liability - current | | $ | — | | | $ | — | | | $ | — | | | $ | 205 | | | $ | — | | | $ | 205 | |
| Commodity contracts | | Derivative asset - noncurrent | | $ | 1,031 |
| | $ | (261 | ) | | $ | 770 |
| | $ | 23,605 |
| | $ | (2,484 | ) | | $ | 21,121 |
| Commodity contracts | | Derivative asset - noncurrent | | $ | 2,721 | | | $ | (2,564) | | | $ | 157 | | | $ | 396 | | | $ | — | | | $ | 396 | |
| Commodity contracts | | Derivative liability - noncurrent | | $ | 261 |
| | $ | (261 | ) | | $ | — |
| | $ | 4,375 |
| | $ | (2,484 | ) | | $ | 1,891 |
| Commodity contracts | | Derivative liability - noncurrent | | $ | 3,135 | | | $ | (2,564) | | | $ | 571 | | | $ | — | | | $ | — | | | $ | — | |
| Interest rate swaps | | Interest rate swaps | | Derivative liability - noncurrent | | $ | — | | | $ | — | | | $ | — | | | $ | 173 | | | $ | — | | | $ | 173 | |
EARTHSTONE ENERGY, INC.
NOTES TO CONSOLIDATED FINANCIAL STATEMENTS (continued)
The follow table summarizes the location and amounts of the Company’s realized and unrealized gains and losses on derivatives instruments in the Company’s Consolidated Statements of Operations and Consolidated Statements of Cash Flows (in thousands):
| | | | | | | | | | | | | | | | | | | | | | | | | | | | | | | | |
| Derivatives not designated as hedging contracts under ASC Topic 815 | | Years Ended December 31, |
| | Statement of Cash Flows Location | | Statement of Operations Location | | 2021 | | 2020 | | 2019 |
| Unrealized (loss) gain | | Not presented separately | | Not presented separately | | $ | (40,795) | | | $ | 3,855 | | | $ | (59,849) | |
| Realized (loss) gain | | Operating portion of net cash received in settlement of derivative contracts | | Not presented separately | | (75,966) | | | 56,044 | | | 15,866 | |
| | Total loss (gain) on derivative contracts, net | | (Loss) gain on derivative contracts, net | | $ | (116,761) | | | $ | 59,899 | | | $ | (43,983) | |
| | | | | | | | | | |
|
| | | | | | | | | | | | |
| Derivatives not designated as hedging contracts under ASC Topic 815 | | Years Ended December 31, |
| | | Statement of Cash Flows Location | | Statement of Operations Location | | 2019 | | 2018 |
| Unrealized (loss) gain | | Not presented separately | | Not presented separately | | $ | (59,849 | ) | | $ | 76,037 |
|
| Realized gain (loss) | | Operating portion of net cash paid in settlement of derivative contracts | | Not presented separately | | 15,866 |
| | (15,090 | ) |
| | | Total loss (gain) on derivative contracts, net | | (Loss) gain on derivative contracts, net | | $ | (43,983 | ) | | $ | 60,947 |
|
| | | | | | | | | |
Note 7. Oil and Natural Gas Properties
The Company follows the successful efforts method of accounting for its oil and natural gas properties. Under this method, costs to acquire oil and natural gas properties, drill and equip exploratory wells that find proved reserves, and drill and equip development wells are capitalized. Exploration costs, including unsuccessful exploratory wells and geological and geophysical costs, are charged to operations as incurred. Upon sale or retirement of oil and natural gas properties, the costs and related accumulated depreciation, depletion and amortization are eliminated from the accounts and the resulting gain or loss is recognized.
Costs incurred to maintain wells and related equipment, lease and well operating costs, and other exploration costs are charged to expense as incurred. Gains and losses arising from the sale of properties are included in operating income in the Consolidated Statements of Operations.
The Company’s lease acquisition costs and development costs of proved oil and natural gas properties are amortized using the units-of-production method, at the field level, based on total proved reserves and proved developed reserves, respectively. Depletion
EARTHSTONE ENERGY, INC.
NOTES TO CONSOLIDATED FINANCIAL STATEMENTS (continued)
expense for oil and natural gas producing property and related equipment was $68.5$105.7 million, $95.9 million and $47.1$68.5 million for the years ended December 31, 20192021, 2020 and 2018,2019, respectively.
Proved Oil and Natural Gas Properties
Proved oil and natural gas properties are reviewed for impairment on a nonrecurring basis. The impairment charge reduces the carrying values to their estimated fair values. These fair value measurements are classified as Level 3 measurements and include many unobservable inputs. Fair value is calculated as the estimated discounted future net cash flows attributable to the assets. The Company’s primary assumptions in preparing the estimated discounted future net cash flows to be recovered from oil and natural gas properties are based on (i) proved reserves, (ii) forward commodity prices and assumptions as to costs and expenses, and (iii) the estimated discount rate that would be used by potential purchasers to determine the fair value of the assets.
Unproved Oil and Natural Gas Properties
Unproved properties consist of costs incurred to acquire undeveloped leases as well as the cost to acquire unproved reserves. Undeveloped lease costs and unproved reserve acquisition costs are capitalized. Unproved oil and natural gas leases are generally for a primary term of three to five years. In most cases, the term of the unproved leases can be extended by paying delay rentals, meeting contractual drilling obligations, or by the presence of producing wells on the leases. Unproved costs related to successful exploratory drilling are reclassified to proved properties and depleted on a units-of-production basis.
The Company reviews its unproved properties periodically for impairment. In determining whether an unproved property is impaired, the Company considers numerous factors including, but not limited to, current exploration and development plans, favorable or unfavorable exploration activity on the property being evaluated and/or adjacent properties, the Company’s geologists’ evaluation of the property, and the remaining months in the lease term for the property.
Impairments to Oil and Natural Gas Properties
The Company recorded no non-cash asset impairment charges for the year ended December 31, 2021.
During the year ended December 31, 2020, primarily as a result of the decline in crude oil price futures, the Company recorded non-cash impairment charges of $25.3 million to its proved oil and natural gas properties and $13.2 million to its unproved oil and natural gas properties, located in the Eagle Ford Trend. As a result of certain acreage expirations, the Company recorded
EARTHSTONE ENERGY, INC.
NOTES TO CONSOLIDATED FINANCIAL STATEMENTS (continued)
non-cash impairment charges of $8.4 million to its unproved oil and natural gas properties during the year ended December 31, 2020.
The Company recorded no non-cash asset impairment charges for the year ended December 31, 2019. During the year ended December 31, 2018, the Company recorded non-cash asset impairments of $4.6 million to its unproved oil and natural gas properties resulting from certain acreage expirations related to its Eagle Ford Trend properties.
Accumulated impairments to proved and unproved oil and natural gas properties as of December 31, 20192021 and 20182020 were $121.1 million.$168.0 million and $168.0 million, respectively.
Note 8. Goodwill
Goodwill represents the excess of the purchase price of assets acquired over the fair value of those assets and is tested for impairment annually, or more frequently if events or changes in circumstances dictate that the carrying value of goodwill may not be recoverable. Such test includes an assessment of qualitative and quantitative factors.
The Company did not have any non-cash impairment charges to its goodwill for the years ended December 31, 2019 or 2018.
Accumulated impairments to Goodwill as of December 31, 2019 and 2018 were $19.1 million.
Note 9.8. Noncontrolling Interest
Earthstone consolidates the financial results of EEH and its subsidiaries, and records a noncontrolling interest for the economic interest in Earthstone held by the members of EEH other than Earthstone and Lynden US. Net income attributable to noncontrolling interest in the Consolidated Statements of Operations for the year ended December 31, 20192021 represents the portion of net income attributable to the economic interest in the Company held by the members of EEH other than Earthstone and Lynden US. Noncontrolling interest in the Consolidated Balance Sheet as of December 31, 20192021 represents the portion of net assets of the Company attributable to the members of EEH other than Earthstone and Lynden US.
The following table presents the changes in noncontrolling interest for the year ended December 31, 2019:2021:
| | | | | | | | | | | | | | | | | | | | | | | | | | | | | |
| | EEH Units Held By Earthstone and Lynden US | | % | | EEH Units Held By Others | | % | | Total EEH Units Outstanding |
| As of December 31, 2020 | 30,343,421 | | | 46.4 | % | | 35,009,371 | | | 53.6 | % | | 65,352,792 | |
| EEH Units issued in connection with the IRM Acquisition | 12,719,594 | | | | | — | | | | | 12,719,594 | |
| EEH Units issued in connection with the Tracker/Sequel Acquisitions | 6,200,000 | | | | | — | | | | 6,200,000 | |
| EEH Units issued in connection with the Foreland Acquisition | 2,611,111 | | | | | — | | | | 2,611,111 | |
| EEH Units issued in connection with the vesting of restricted stock units | 928,342 | | | | | — | | | | 928,342 | |
| EEH Units and Class B Common Stock converted to Class A Common Stock | 664,839 | | | | | (664,839) | | | | | — | |
| As of December 31, 2021 | 53,467,307 | | | 60.9 | % | | 34,344,532 | | | 39.1 | % | | 87,811,839 | |
|
| | | | | | | | | | | | | | |
| | EEH Units Held By Earthstone and Lynden US | | % | | EEH Units Held By Others | | % | | Total EEH Units Outstanding |
| As of December 31, 2018 | 28,696,321 |
| | 44.7 | % | | 35,452,178 |
| | 55.3 | % | | 64,148,499 |
|
| EEH Units issued in connection with the vesting of restricted stock units | 533,312 |
| | | | — |
| | | | 533,312 |
|
| EEH Units and Class B Common Stock converted to Class A Common Stock | 191,498 |
| | | | (191,498 | ) | | | | — |
|
| As of December 31, 2019 | 29,421,131 |
| | 45.5 | % | | 35,260,680 |
| | 54.5 | % | | 64,681,811 |
|
Note 10.9. Net Income (Loss) Per Common Share
EARTHSTONE ENERGY, INC.
NOTES TO CONSOLIDATED FINANCIAL STATEMENTS (continued)
Net income (loss) per common share—basic is calculated by dividing Net income (loss) by the weighted average number of shares of common stock outstanding during the period. Net income (loss) per common share—diluted assumes the conversion of all potentially dilutive securities and is calculated by dividing Net income (loss) by the sum of the weighted average number of shares of common stock, as defined above, outstanding plus potentially dilutive securities. Net income (loss) per common share—diluted considers the impact of potentially dilutive securities except in periods in which there is a loss because the inclusion of the potential common shares, as defined above, would have an anti-dilutive effect.
A reconciliation of Net income (loss) per common share is as follows:
| | | | | | | | | | | | | | | | | |
| | Years Ended December 31, |
| (In thousands, except per share amounts) | 2021 | | 2020 | | 2019 |
| Net income (loss) attributable to Earthstone Energy, Inc. | $ | 35,484 | | | $ | (13,547) | | | $ | 719 | |
| Net income (loss) per common share attributable to Earthstone Energy, Inc.: | | | | | |
| Basic | $ | 0.75 | | | $ | (0.45) | | | $ | 0.02 | |
| Diluted | $ | 0.71 | | | $ | (0.45) | | | $ | 0.02 | |
| Weighted average common shares outstanding | | | | | |
| Basic | 47,169,948 | | | 29,911,625 | | | 28,983,354 | |
| Add potentially dilutive securities: | | | | | |
| Unvested restricted stock units | 539,803 | | | — | | | — | |
| Unvested performance units | 2,242,342 | | | — | | | 377,531 | |
| Diluted weighted average common shares outstanding | 49,952,093 | | | 29,911,625 | | | 29,360,885 | |
|
| | | | | | | |
| | Years Ended December 31, |
| (In thousands, except per share amounts) | 2019 | | 2018 |
| Net income attributable to Earthstone Energy, Inc. | $ | 719 |
| | $ | 42,325 |
|
| Net income per common share attributable to Earthstone Energy, Inc.: | | | |
| Basic | $ | 0.02 |
| | $ | 1.50 |
|
| Diluted | $ | 0.02 |
| | $ | 1.50 |
|
| Weighted average common shares outstanding | | | |
| Basic | 28,983,354 |
| | 28,153,885 |
|
| Add potentially dilutive securities: | | | |
| Unvested restricted stock units | — |
| | 63,889 |
|
| Unvested performance units | 377,531 |
| | — |
|
| Diluted weighted average common shares outstanding | 29,360,885 |
| | 28,217,774 |
|
EARTHSTONE ENERGY, INC.
NOTES TO CONSOLIDATED FINANCIAL STATEMENTS (continued)
The Class B common stock, $0.001 par value per share of Earthstone (the “Class B Common Stock”), has been excluded, as its conversion would eliminate noncontrolling interest and Net income attributable to noncontrolling interest of $26.0 million for the year ended December 31, 2021, Net loss attributable to noncontrolling interest of $15.9 million for the year ended December 31, 2020, and Net income attributable to noncontrolling interest of $0.9 million for the year ended December 31, 2019 would be added back to Net income (loss) attributable to Earthstone Energy, Inc. for the yearyears then ended, having no dilutive effect on Net income (loss) per common share attributable to Earthstone Energy, Inc. For the year ended December 31, 2020, the Company excluded 1.1 million and 1.9 million shares, respectively, for the dilutive effect of restricted stock units and performance units in calculating diluted earnings per share as the effect was anti-dilutive due to the net loss incurred for the period.
Note 11.10. Common Stock
Class A Common Stock
At December 31, 20192021 and 2018,2020, there were 29,421,13153,467,307 and 28,696,32130,343,421 shares of Class A Common Stock issued and outstanding, respectively. During the year ended December 31, 2021, Earthstone issued a total of approximately 21.5 million shares of Class A Common Stock in connection with the IRM Acquisition, Tracker/Sequel Acquisitions and the Foreland Acquisition. No shares were issued in connection with acquisitions during 2020 or 2019. During the years ended December 31, 20192021, 2020 and 2018,2019, as a result of the vesting and settlement of restricted stock units under the Earthstone Amended and Restated 2014 Long-Term Incentive Plan, as amended (the “2014 Plan”), Earthstone issued 736,7061,381,825, 914,905 and 681,585736,706 shares of Class A Common Stock, respectively, of which 203,394453,483, 243,924 and 169,893203,394 shares of Class A Common Stock, respectively, were retained as treasury stock and canceled to satisfy the related employee income tax liability.
Class B Common Stock
At December 31, 20192021 and 2018,2020, there were 35,260,68034,344,532 and 35,452,17835,009,371 shares of Class B Common Stock issued and outstanding, respectively. Each share of Class B Common Stock, together with one1 EEH Unit, is convertible into one1 share of Class A Common Stock. During the years ended December 31, 2021, 2020 and 2019, 664,839, 251,309 and 2018, 191,498 and 599,991 shares, respectively, of Class B Common Stock and EEH Units were exchanged for an equal number of shares of Class A Common Stock.
Note 12.11. Stock-Based Compensation
Restricted Stock Units
The 2014 Plan allows, among other things, for the grant of restricted stock units (“RSUs”). As of December 31, 2019,2021, the maximum number of shares of Class A Common Stock that may be issued under the 2014 Plan was 6.412.0 million shares.
Each RSU represents the contingent right to receive one1 share of Class A Common Stock. The holders of outstanding RSUs do not receive dividends or have voting rights prior to vesting and settlement. The Company determines the fair value of granted RSUs based on the market price of the Class A Common Stock on the date of the grant. Compensation expense for granted RSUs is recognized on a straight-line basis over the vesting term and is net of forfeitures, as incurred. Stock-based compensation is included in General and administrative expense in the Consolidated Statements of Operations and is recorded with a corresponding increase in Additional paid-in capital within the Consolidated Balance Sheets.
The table below summarizes unvested RSU activity for the year ended December 31, 2019:2021:
| | | | | | | Shares | | Weighted-Average Grant Date Fair Value |
| | Shares | | Weighted-Average Grant Date Fair Value | |
| Unvested RSUs at December 31, 2018 | 810,995 |
| | $ | 8.83 |
| |
| Unvested RSUs at December 31, 2020 | | Unvested RSUs at December 31, 2020 | 1,050,908 | | | $ | 5.55 | |
| Granted | 1,079,150 |
| | $ | 6.04 |
| Granted | 668,000 | | | $ | 6.16 | |
| Forfeited | (45,643 | ) | | $ | 7.16 |
| Forfeited | (20,266) | | | $ | 5.09 | |
| Vested | (736,706 | ) | | $ | 8.06 |
| Vested | (926,825) | | | $ | 5.71 | |
| Unvested RSUs at December 31, 2019 | 1,107,796 |
| | $ | 6.69 |
| |
| Unvested RSUs at December 31, 2021 | | Unvested RSUs at December 31, 2021 | 771,817 | | | $ | 5.91 | |
During the year ended December 31, 2019,2021, Earthstone granted 1,005,350548,000 RSUs to employees and 73,800120,000 RSUs to certain members of the Board with vesting periods ranging from 12 to 36 months. The total grant date fair value of the RSUs granted during the years ended December 31, 2021, 2020 and 2019 and 2018 were $6.5$4.1 million, $4.4 million and $4.8$6.5 million, respectively, with a weighted average grant date fair value per share of $6.04$6.16, $5.07 and $8.41,6.04, respectively. The total vesting date fair value of the RSUs that vested during 2021, 2020 and 2019 and 2018 was $4.2$8.8 million, $3.0 million and $6.2$4.2 million, respectively. As of December 31, 2019,2021, there was approximately $6.8$4.5 million of total unrecognized stock-based compensation expense related to unvested
RSUs, which will be amortized over the remaining vesting periods. The weighted average remaining vesting period of the unrecognized compensation expense is 1.031.04 years.
For the years ended December 31, 20192021, 2020 and 2018,2019, stock-based compensation related to RSUs was $5.9$5.2 million, $5.4 million and $6.1$5.9 million, respectively.
Performance Units
The table below summarizes performance unit (“PSU”) activity for the year ended December 31, 2019:2021:
| | | | | | | | | | | | | | |
| | | Shares | | Weighted-Average Grant Date Fair Value |
| Unvested PSUs at December 31, 2020 | | 1,879,425 | | | $ | 7.65 | |
| Granted | | 1,099,800 | | | $ | 10.85 | |
| | | | |
| Vested | | (227,500) | | | $ | 13.75 | |
| Unvested PSUs at December 31, 2021 | | 2,751,725 | | | $ | 8.42 | |
| | | | |
|
| | | | | | | |
| | | Shares | | Weighted-Average Grant Date Fair Value |
| Unvested PSUs at December 31, 2018 | | 252,500 |
| | $ | 13.75 |
|
| Granted | | 669,550 |
| | $ | 9.30 |
|
| Forfeited | | (86,425 | ) | | $ | 10.59 |
|
| Unvested PSUs at December 31, 2019 | | 835,625 |
| | $ | 10.51 |
|
| | | | | |
For the years ended December 31, 2021, 2020 and 2019, stock-based compensation related to the PSUs was approximately $15.8 million, $4.6 million and $2.7 million, respectively.
On January 28, 2019,27, 2021, the Board of Directors of Earthstone (the “Board”) granted 1,099,800 PSUs (the “2021 PSUs”) to certain officers pursuant to the 2014 Plan (the “2021 Grant”). The 2021 PSUs are payable in cash or shares of Class A Common Stock upon the achievement by the Company over a period commencing on January 1, 2021 and ending on December 31, 2023 of certain performance criteria established by the Board. The Company classifies these awards that will be settled in cash as liability awards. PSU grants to be settled in shares are classified as equity awards.
The 2021 PSUs are eligible to be earned based on the annualized Total Shareholder Return (“TSR”) of the Class A Common Stock during a three-year period beginning on February 1, 2021. Between 0x to 2.0x of the Performance Units are eligible to be earned based on Earthstone achieving an annualized TSR based on the following pre-established goals:
| | | | | |
| Earthstone’s Annualized TSR | TSR Multiplier |
| 20.5% or greater | 2.0 |
| 14.5% | 1.0 |
| 7.7% | 0.5 |
| Less than 7.7% | 0.0 |
In the event that greater than 1.0x of the 2021 PSUs are earned, such additional PSUs may be paid in cash rather than the issuance of shares of Class A Common Stock.
The Company accounts for these awards as market-based awards which are valued quarterly utilizing the Monte Carlo Simulation pricing model, which calculates multiple potential outcomes for an award and establishes grant date fair value based on the most likely outcome. For the 2021 PSUs, assuming a risk-free rate of 0.3% and volatility of 86.0%, the Company calculated the weighted average grant date fair value per PSU to be $10.85. Based on the fair value of the 2021 PSUs, the Company recorded stock-based compensation expense of $6.3 million during the year ended December 31, 2021. A corresponding liability of $6.3 million related to the 2021 PSUs is included in Other noncurrent liabilities in the Consolidated Balance Sheet as of December 31, 2021.
On January 30, 2020, the Board granted 1,043,800 PSUs (the “2020 PSUs”) to certain officers pursuant to the 2014 Plan (the “2020 Grant”). The 2020 Grant was subject to the approval of an amendment to the 2014 Plan to increase the number of available shares available thereunder (the “2014 Plan Amendment”). The 2014 Plan Amendment was approved at the 2020 annual meeting of stockholders held on June 3, 2020. The 2020 PSUs are payable in shares of Class A Common Stock based upon the achievement by the Company over a period commencing on February 1, 2020 and ending on January 31, 2023 of certain performance criteria established by the Board.
The 2020 PSUs are eligible to be earned based on the annualized TSR of the Class A Common Stock during a three-year period beginning on February 1, 2020. Between 0x to 2.0x of the Performance Units are eligible to be earned based on Earthstone achieving an annualized TSR based on the following pre-established goals:
| | | | | |
| Earthstone’s Annualized TSR | TSR Multiplier |
| 23.9% or greater | 2.0 |
| 14.5% | 1.0 |
| 8.4% | 0.5 |
| Less than 8.4% | 0.0 |
In the event that greater than 1.0x of the 2020 PSUs are earned, such additional PSUs may be paid in cash rather than the issuance of shares of Class A Common Stock, solely at the discretion of the Board.
The Company accounts for these awards as market-based awards which are valued utilizing the Monte Carlo Simulation pricing model, which calculates multiple potential outcomes for an award and establishes grant date fair value based on the most likely outcome. For the 2020 PSUs, assuming a risk-free rate of 1.4% and volatility of 62.0%, the Company calculated the weighted average grant date fair value per PSU to be $5.36.
On January 28, 2019, the Board granted 669,550 PSUs (the “2019 PSUs”) to certain executive officers pursuant to the 2014 Plan. The PSUs are payable in shares of Class A Common Stock based upon the achievement by the Company over a period commencing on February 1, 2019 and ending on January 31, 2022 (the “Performance Period”) of performance criteria established by the Board.
The number of shares of Class A Common Stock that may be issued will be determined by multiplying the number of PSUs granted by the Relative Total Shareholder Return (“TSR”)TSR Percentage (0% to 200%). The “Relative TSR Percentage” is the percentage, if any, achieved by attainment of a certain predetermined range of targets for the Performance Period.three-year period beginning on February 1, 2019.
TSR for the Company and each of the peer companies is generally determined by dividing (A) the volume weighted average price of a share of stock for the trading days during the thirty calendar days ending on and including the last calendar day of the Performance Periodapplicable performance period minus the volume weighted average price of a share of stock for the trading days during the thirty calendar days ending on and including the first day of the Performance Periodapplicable performance period plus cash dividends paid over the Performance Periodapplicable performance period by (B) the volume weighted average price of a share of stock for the trading days during the thirty calendar days ending on and including the first day of the Performance Period.applicable performance period.
The Company accounts for these awards as market-based awards which are valued utilizing the Monte Carlo Simulation pricing model, which calculates multiple potential outcomes for an award and establishes grant date fair value based on the most likely outcome. For the PSUs granted on January 28, 2019, assuming a risk-free rate of 2.6% and volatilities ranging from 40.1% to 114.1%, the Company calculated the weighted average grant date fair value per PSU to be $9.30.
Modification of Performance Units
The 2019 PSUs were initially classified as equity awards as the intention was to fully settle in shares. As of December 31, 2021, and at discretion of the Board, the 2019 therePSUs in excess of 100% were to be settled in cash. This event was $5.1treated as a modification of the award with the bifurcated cash settled portion of the award being remeasured and classified as a liability award. The Company calculated the fair value of the cash settled portion of the award to be $13.66, resulting in $5.5 million of unrecognizedadditional stock-based compensation expense related toduring the PSU awards which will be amortized over a weighted average period of 0.97 years.
For the yearsyear ended December 31, 2019 and 2018,2021, $2.3 million of stock-based compensation related topreviously recognized in Additional Paid-in Capital being reclassified with a corresponding liability of $7.8 million included in Accrued Expenses in the Consolidated Balance Sheet as of December 31, 2021. The 2019 PSUs was approximately $2.7 millionwere settled on February 9, 2022 resulting in the issuance of 608,125 shares of Class A Common Stock and $1.0 million, respectively.cash payments totaling $8.1 million.
Note 13.12. Long-Term Debt
EARTHSTONE ENERGY, INC.
NOTES TO CONSOLIDATED FINANCIAL STATEMENTS (continued)
Credit Agreement
On November 21, 2019, Earthstone, Earthstone Energy Holdings, LLC, a subsidiary of Earthstone (“EEH” or theEEH (the “Borrower”), Wells Fargo Bank, National Association, as Administrative Agent and Issuing Bank (“Wells Fargo”), Royal Bank of Canada, as Syndication Agent, BOKF, NA dba Bank of Texas, (“BOKF”) as Issuing Bank with respect to Existing Letters of Credit, Royal Bank of Canada, as Syndication Agent, Truist Bank, as successor by merger to SunTrust Bank, as Documentation Agent, and the Lenders party thereto (collectively, the “Parties”) entered into a credit agreement (the “Credit Agreement”), which replaced the prior credit facility, which was terminated on November 21, 2019.
On December 17, 2020, Earthstone, EEH, as Borrower, Wells Fargo, as Administrative Agent, the guarantors party thereto, and the lenders party thereto (the “Lenders”) entered into a credit agreementan amendment (the “Credit Agreement”“Second Amendment”). to the Credit Agreement. The Credit Agreement replacedSecond Amendment was effective upon the Prior Credit Agreement (as defined below), which was terminatedclosing of the IRM Acquisition described in Note 3. Acquisitions and Divestitures.
EARTHSTONE ENERGY, INC.
NOTES TO CONSOLIDATED FINANCIAL STATEMENTS (continued)
Among other things, the Second Amendment (i) joined certain financial institutions as additional lenders, increased the borrowing base from $240.0 million to $360.0 million, (ii) increased the interest rate on November 21, 2019.outstanding borrowings; and (iii) adjusted some of the financial covenants.
Concurrently withOn April 20, 2021, the effectiveness ofParties entered into an amendment (the “Third Amendment”) to the Credit Agreement under which the Company terminated that certain credit agreement, datedborrowing base increased from $360 million to $475 million in connection with its regularly scheduled redetermination. Further, the Third Amendment provided for an increase in the borrowing base from $475 million to $550 million which became effective on July 20, 2021 upon closing of the Tracker/Sequel Purchase Agreements described in Note 3. Acquisitions and Divestitures.
On September 17, 2021, Earthstone, EEH, as of May 9, 2017Borrower, Wells Fargo as Administrative Agent and Issuing Bank, the lenders party thereto (the “Prior Credit Agreement”“Lenders”), by and among the Borrower, Earthstone Operating, LLC, EF Non-Op, LLC, Sabine River Energy, LLC, Earthstone Legacy Properties, LLC, Lynden USA Operating, LLC, Bold Energy III LLC (“Bold”), Bold Operating, LLC the guarantors party thereto entered into an amendment (the “Fourth Amendment”) to the lenders party thereto, and BOKF, as administrative agent. InCredit Agreement. Among other things, the Fourth Amendment increased the borrowing base from $550 million to $650 million in connection with its regularly scheduled semi-annual redetermination, added provisions to provide for the terminationeventual replacement of LIBOR as a benchmark interest rate, made certain changes to the Prior Credit Agreement, $1.2 million of remaining unamortized deferred financing costs were expensed and included in Write-off of deferred financing costs in the Consolidated Statements of Operations.
The initial borrowing base of the credit facilitylenders under the Credit Agreement, and made certain other administrative changes to the Credit Agreement.
The next regularly scheduled redetermination of the borrowing base is $325.0 million, and is subjectexpected to redeterminationoccur on or around May 1, 2022. Subsequent redeterminations are expected to occur on or about each November 1st and May 1st of each year.thereafter. The amounts borrowed under the Credit Agreement bear annual interest rates at either (a) the adjusted LIBOSOFR Rate (as customarily defined) (the “Adjusted LIBOTerm SOFR Rate”) plus 1.75%2.50% to 2.75%4.25% or (b) the sum of (i) the greatest of (A) the prime rate of Wells Fargo, (B) the federal funds rate plus ½ of 1.0%, and (C) the Adjusted LIBOTerm SOFR Rate for an interest rate period of one month plus 1.0%, (ii) plus 0.75%1.50% to 1.75%3.25%, depending on the amount borrowed under the credit facility.Credit Agreement. Principal amounts outstanding under the credit facilityCredit Agreement are due and payable in full at maturity on November 21, 2024. All of the obligations under the Credit Agreement, and the guarantees of those obligations, are secured by substantially all of EEH’s assets. Additional payments due under the Credit Agreement include paying a commitment fee of 0.375% to 0.50% per year, depending on the amount borrowed under the credit facility,Credit Agreement, to the Lenders in respect of the unutilized commitments thereunder. EEH is also required to pay customary letter of credit fees.
The Credit Agreement contains a number of covenants that, among other things, restrict, subject to certain exceptions, EEH’s ability to incur additional indebtedness, create liens on assets, make investments, pay dividends and distributions or repurchase its limited liability interests, engage in mergers or consolidations, sell certain assets, sell or discount any notes receivable or accounts receivable and engage in certain transactions with affiliates.
In addition, the Credit Agreement requires EEH to maintain the following financial covenants: a current ratio, (as such term is defined in the Credit Agreement) of not less than 1.0 to 1.0 and for the four preceding quarters a consolidated leverage ratio of not greater than 4.03.5 to 1.0. Consolidated leverage ratio means the ratio of (i) the aggregate debt of EEH and its consolidated subsidiaries as at the last day of the fiscal quarter to (ii) EBITDAX for the applicable period, which was calculated as EBITDAX for the four consecutive fiscal quarters ending on such fiscal quarter.date. The term “EBITDAX” means, for any period, the sum of consolidated net income (loss) for such period plus (a) the following expenses or charges to the extent deducted from consolidated net income (loss) in such period: (i) interest, (ii) taxes, (iii) depreciation, (iv) depletion, (v) amortization, (vi) certain distributions to employees related to the stock compensation, (vii) certain transaction related expenses, (viii) reimbursed indemnification expenses related to certain dispositions and investments, (ix) non-cash extraordinary, usual, or nonrecurring expenses or losses, (x) other non-cash charges and minus (b) to the extent included in consolidated net income (loss) in such period: (i) non-cash income, and (ii) gains on asset dispositions, disposals and abandonments outside of the ordinary course of business.
business and (iii) to the extent not otherwise deducted from consolidated net income (loss), the aggregate amount of any pass-through cash distributions received by Borrower during such period in an amount equal to the aggregate amount of pass-through cash distributions actually made by Borrower during such period.
The Credit Agreement contains customary affirmative covenants and defines events of default to include failure to pay principal or interest, breach of covenants, breach of representations and warranties, insolvency, judgment default and a change in control. Upon the occurrence and continuance of an event of default, the Lenders have the right to accelerate repayment of the loans and exercise their remedies with respect to the collateral. AtAs of December 31, 2019, the Company2021, EEH was in compliance with allthe covenants under the Credit Agreement.
As of December 31, 2019,2021, the Company had a $325.0$650.0 million borrowing base under the Credit Agreement, of which $170.0$320.0 million was outstanding, bearing annual interest of 3.860%3.110%, resulting in an additional $155.0$330.0 million of borrowing base availability under the Credit Agreement. At December 31, 2018,2020, there were $78.8$115.0 million of borrowings outstanding under the Prior Credit Agreement.
For the year ended December 31, 2019,2021, the Company had borrowings of $234.7$744.1 million and $143.5$539.1 million in repayments of borrowings.
EARTHSTONE ENERGY, INC.
NOTES TO CONSOLIDATED FINANCIAL STATEMENTS (continued)
For the years ended December 31, 20192021, 2020 and 2018,2019, interest on all outstanding debt averaged 4.42%3.40%, 2.83% and 4.16%4.42% per annum, respectively, which excluded commitment fees of $0.7$0.9 million, $0.6 million and $0.8$0.7 million for each period ended, respectively, and amortization of deferred financing costs of $0.4$0.9 million, $0.3 million and $0.3$0.4 million for each period ended, respectively.
EARTHSTONE ENERGY, INC.
NOTES TO CONSOLIDATED FINANCIAL STATEMENTS (continued)
The Company capitalized $2.8 million of costs associated with the Credit Agreement for the year ended December 31, 2021. No costs associated with the Credit Agreement were capitalized during the year ended December 31, 2020. The Company capitalized $1.6 million and $0.5 million, respectively, of costs associated with the credit agreementsCredit Agreement for the yearsyear ended December 31, 2019 and 2018.2019. These capitalized costs are included in Other noncurrent assets in the Consolidated Balance Sheets. The Company’s policy is to capitalize the financing costs associated with its debt and amortize those costs on a straight-line basis over the term of the associated debt, which approximates the effective interest method over the term of the related debt.
Note 14.13. Asset Retirement Obligations
The Company has asset retirement obligations associated with the future plugging and abandonment of oil and natural gas properties and related facilities. Revisions to the liability typically occur due to changes in the estimated abandonment costs, well economic lives, and the discount rate.
The following table summarizes the Company’s asset retirement obligation transactions recorded during the years ended December 31, 20192021 and 2018 2020 (in thousands):
| | | | | | | | | | | |
| | 2021 | | 2020 |
| Beginning asset retirement obligations | $ | 3,027 | | | $ | 2,164 | |
| Associated with acquisitions | 9,821 | | | — | |
| Liabilities incurred | 163 | | | 106 | |
| Property dispositions | (41) | | | (10) | |
| Liabilities settled | (185) | | | (195) | |
| Accretion expense | 1,065 | | | 307 | |
| Revision of estimates | 2,016 | | | 655 | |
| Ending asset retirement obligations | $ | 15,866 | | | $ | 3,027 | |
|
| | | | | | | |
| | 2019 | | 2018 |
| Beginning asset retirement obligations | $ | 2,229 |
| | $ | 2,354 |
|
Liabilities acquired (1) | — |
| | 298 |
|
| Liabilities incurred | 105 |
| | 102 |
|
Property dispositions (1) | (10 | ) | | (766 | ) |
| Liabilities settled | (374 | ) | | (79 | ) |
| Accretion expense | 214 |
| | 169 |
|
| Revision of estimates | — |
| | 151 |
|
| Ending asset retirement obligations | $ | 2,164 |
| | $ | 2,229 |
|
| |
(1) | See Note 3.Acquisitions and Divestitures for additional information on the Company’s acquisition and property disposition activities.
|
Note 15.14. Related Party Transactions
FASB ASC Topic 850,, Related Party Disclosures,, requires that information about transactions with related parties that would make a difference in decision making shall be disclosed so that users of the financial statements can evaluate their significance.
Flatonia Energy, LLC (“Flatonia”), which owns approximately 7% The Audit Committee of the outstanding Class A Common StockBoard independently reviews and approximately 3.2% of the combined voting power of the Company’s outstanding Class A and Class B Common Stock as of December 31, 2019, is aapproves all related party to a joint operating agreement (the “Operating Agreement”) with the Company. The Operating Agreement covers certain jointly owned oil and natural gas properties located in the Eagle Ford Trend of south Texas. In connection with the Operating Agreement, the Company made payments to Flatonia of $15.3 million and $12.4 million, and received payments from Flatonia of $6.4 million and $6.1 million, respectively, for the years ended December 31, 2019 and 2018. At December 31, 2019 and 2018, amounts receivable due from Flatonia in connection with the Operating Agreement were $0.6 million and $0.8 million, respectively. Payables related to revenues outstanding and due to Flatonia as of December 31, 2019 and 2018 were $1.1 million and $1.6 million, respectively. transactions.
Earthstone’s majority shareholder consistsEarthstone has 2 significant shareholders that consist of various investment funds managed by a venture capital firmeach of the two private equity firms who may manage other investments in entities with which the Company interacts in the normal course of business. business (the “Significant Shareholders” or separately, each a “Significant Shareholder”).
On October 31, 2019,February 12, 2020, the Company sold certain of its interests in oil and natural gas leases and wells located in Martin County, Texas in an arm’s length transaction to a portfolio company of Earthstone’s majority shareholdera Significant Shareholder (not under common control) for cash consideration of approximately $3.6$0.4 million.
In connection with the Olenik v. Lodzinski et al. (described below)lawsuit described below in Note 15. Commitments and Contingencies, Earthstone’s majority shareholdera Significant Shareholder was also named in the lawsuit. TheAs a result of a settlement agreement relating to the lawsuit, the Company is currently in negotiationsagreed with its insurance carrier aroundregarding an allocation of litigationdefense costs and settlement contributions above its deductible for all the parties named in the lawsuit. OnceIn connection with the allocation is agreed upon, cost willCourt approved settlement, the Significant Shareholder was billed approximately $1.1 million in fiscal 2020 and all amounts have been received.
As discussed in Note 3. Acquisitions and Divestitures, on March 31, 2021, the Company entered into the Tracker/Sequel Purchase Agreements. The Tracker/Sequel Acquisitions were consummated on July 20, 2021, whereby the Company acquired the Tracker Assets for a purchase price of $18.8 million in cash and 4.7 million shares of Class A Common Stock. A Significant Shareholder owned approximately 49% of Tracker as of the closing of the Tracker Acquisition. A majority of the stockholders of Earthstone not affiliated with the Significant Shareholder approved the issuance of 6.2 million shares of Class A Common Stock in connection with the closing of the Tracker/Sequel Purchase Agreements at Earthstone’s Annual Meeting of Stockholders held on July 20, 2021.
As discussed in Note 3. Acquisitions and Divestitures, during the second quarter of 2021, the Company completed the Eagle Ford Acquisitions for a purchase price of approximately $45.2 million in cash. A Significant Shareholder controlled one of the
4 sellers. After participating in a competitive sales process, the Company acquired the aforementioned assets for $8.2 million in cash from that related party entity.
On February 15, 2022, Earthstone, EEH, Chisholm Energy Operating, LLC (“OpCo”) and Chisholm Energy Agent, Inc. (“Agent” and collectively with OpCo, “Chisholm”), as seller, consummated the transaction (the “Chisholm Closing”) contemplated in that certain Purchase and Sale Agreement dated December 15, 2021 (the “Chisholm Agreement”) by and among Earthstone, EEH and Chisholm. At the closing of the Chisholm Agreement, among other things, EEH acquired (the “Chisholm Acquisition”) interests in oil and gas leases and related property of Chisholm located in Lea County and Eddy County, New Mexico, for aggregate consideration consisting of: (i) approximately $314.7 million in cash, net of preliminary and customary purchase price adjustments and remains subject to post-closing settlement between EEH and Chisholm paid at the closing of the Chisholm Acquisition, (ii) $70 million in cash to be assignedpaid as follows: $40 million to each party affected. Asbe paid six months after the closing of the Chisholm Acquisition and $30 million to be paid 12 months after the closing of the Chisholm Acquisition, subject to acceleration in the event that Earthstone receives gross proceeds of more than $450 million from a high yield bond offering or more than $50 million in gross proceeds from an offering of Class A Common Stock or preferred stock; and (iii) 19,417,476 shares of Class A Common Stock. On December 17, 2021, in accordance with the Chisholm Agreement and prior to the Chisholm Closing, Earthstone provided a deposit in the amount of $30.5 million which was recorded in Other noncurrent assets in the Consolidated Balance Sheeet as of December 31, 2019, the Company has not recorded a receivable for prospective insurance settlement proceeds. Charges associated with this legal action are2021, as well as included in Transaction costsAcquisition of oil and gas properties in Cash flows from investing activities in the Consolidated Statements of Operations. Any proceeds received fromCash Flows for the Company’s insurance carrier will be recordedyear then ended. A Significant Shareholder was the majority owner of Chisholm as a reduction of Transactions coststhe closing of the Chisholm Acquisition. A majority of the stockholders of Earthstone not affiliated with the Significant Shareholder approved the issuance of 19,417,476 shares of Class A Common Stock in connection with the period received.closing of the Chisholm Acquisition.
Note 16.15. Commitments and Contingencies
Contractual Commitments
Future minimum contractual commitments as of December 31, 20192021 under non-cancelable agreements having initial or remaining terms in excess of one year are as follows:
EARTHSTONE ENERGY, INC.
NOTES TO CONSOLIDATED FINANCIAL STATEMENTS (continued)
|
| | | | | | | | | | | | | | | | | | | | | | | |
| | 2020 | | 2021 | | 2022 | | 2023 | | 2024 | | Thereafter |
| Gas contract | $ | 1,647 |
| | $ | 680 |
| | $ | — |
| | $ | — |
| | $ | — |
| | $ | — |
|
| Office leases | 632 |
| | 791 |
| | 696 |
| | 596 |
| | 605 |
| | 152 |
|
| Automobile leases | 219 |
| | 84 |
| | 5 |
| | — |
| | — |
| | — |
|
| Total | $ | 2,498 |
| | $ | 1,555 |
| | $ | 701 |
| | $ | 596 |
| | $ | 605 |
| | $ | 152 |
|
The Company has a non-cancelable fixed cost agreement of $1.6 million per year through May 2021 to reserve pipeline capacity of 10,000 MMBtu per day for gathering and processing related to certain Eagle Ford assets in south Texas. As the operator of the properties dedicated to this contract, the gross amount of obligation is provided; however, the Company’s net share is approximately 31%. | | | | | | | | | | | | | | | | | | | | | | | | | | | | | | | | | | | |
| | 2022 | | 2023 | | 2024 | | 2025 | | 2026 | | Thereafter |
| | | | | | | | | | | |
| Office leases | 696 | | | 595 | | | 605 | | | 152 | | | — | | | — | |
| | | | | | | | | | | |
| Total | $ | 696 | | | $ | 595 | | | $ | 605 | | | $ | 152 | | | $ | — | | | $ | — | |
Additionally, the Company leases corporate office space in The Woodlands, Texas and Midland, Texas. Rent expense was approximately $0.8 million, $0.8 million and $0.9$0.8 million, for the years ended December 31, 20192021, 2020 and 2018,2019, respectively. Minimum lease payments under the terms of non-cancelable operating leases as of December 31, 20192021 are shownincluded in the table above.
Environmental
The Company’s operations are subject to risks normally associated with the drilling, completion and production of oil and gas, including blowouts, fires, and environmental risks such as oil spills or gas leaks that could expose the Company to liabilities associated with these risks.
In the Company’s acquisition of existing or previously drilled well bores, the Company may not be aware of prior environmental safeguards, if any, that were taken at the time such wells were drilled or during such time the wells were operated. The Company maintains comprehensive insurance coverage that it believes is adequate to mitigate the risk of any adverse financial effects associated with these risks.
However, should it be determined that a liability exists with respect to any environmental cleanup or restoration, the liability to cure such a violation could still fall upon the Company. No claim has been made, nor is the Company aware of any liability which the Company may have, as it relates to any environmental cleanup, restoration, or the violation of any rules or regulations relating thereto except for the matter discussed above.
Legal
From time to time, Earthstone and its subsidiaries may be involved in various legal proceedings and claims in the ordinary course of business.
Olenik v. Lodzinski et al.:On June 2, 2017, Nicholas Olenik filed a purported shareholder class and derivative action in the Delaware Court of Chancery was filed against Earthstone’s Chief Executive Officer, along with other members of the Board, EnCap Investments L.P. (“EnCap”), Bold Energy Holdings, LLC (“Bold HoldingsHoldings”), and Bold Energy III LLC (“Bold”) and Oak Valley Resources,
EARTHSTONE ENERGY, INC.
NOTES TO CONSOLIDATED FINANCIAL STATEMENTS (continued)
LLC. The complaint allegesalleged that Earthstone’s directors breached their fiduciary duties in connection with the contribution agreement dated as of November 7, 2016 and as amended on March 21, 2017 (the “Bold Contribution Agreement”), by and among Earthstone, EEH, Lynden US, Lynden USA Operating, LLC, Bold Holdings and Bold. The Plaintiff assertsasserted that the directors negotiated the business combination pursuant to the Bold TransactionContribution Agreement (the “Bold Transaction”) to benefit EnCap and its affiliates, failed to obtain adequate consideration forthe detriment of the Earthstone shareholdersstockholders who were not affiliated with EnCap or Earthstone management, did not follow an adequate process in negotiating and approving the Bold Transaction and made materially misleading or incomplete proxy disclosures in connection with the Bold Transaction. The suit seeks unspecified damages and purports to assert claims derivatively on behalf of Earthstone and as a class action on behalf of all persons who held common stock up to March 13, 2017, excluding defendants and their affiliates. On July 20, 2018, the Delaware Court of Chancery granted the defendants’ motion to dismiss and entered an order dismissing the action in its entirety with prejudice. The Plaintiff filed an appeal with the Delaware Supreme Court. On February 6, 2019, the Delaware Supreme Court heard oral arguments from the Plaintiff’s and Defendants’ counsel. On April 5, 2019, the Delaware Supreme Court affirmed the Delaware Court of Chancery’s dismissal of the proxy disclosure claims but reversed the Delaware Court of Chancery’s dismissal of the other claims, holding that the allegations with respect to those claims were sufficient for pleading purposes. Earthstone and eachAfter engaging in extensive pre-trial discovery, the parties entered into a settlement agreement that was approved by the Delaware Court of Chancery on March 31, 2021. The principal terms of the othersettlement agreement are: (i) a $3.5 million all-in cash settlement payment (the “Fund”) to be funded by defendants believeand/or their insurers into an escrow account, (ii) a bi-lateral complete and full release of all claims against defendants and plaintiffs, and (iii) 55% of the claims are entirely without merit and intend to mount a vigorous defense. The ultimate outcome of this suit is uncertain, and while Earthstone is confident in its position, any potential monetary recovery or lossFund (the derivative payment) be paid to Earthstone cannotto be estimated at this time.used as determined by management, 45% of the Fund (the class payment) be paid to members of the class or current stockholders of Earthstone. Earthstone paid the $3.5 million settlement in April 2021 and the insurance carriers reimbursed their agreed upon allocation of the settlement totaling $2.8 million. In addition, Earthstone has received $1.3 million from the derivative portion of the settlement, which was included as a reduction of Transaction costs in the Consolidated Statement of Operations for the year ended December 31, 2021.
Note 17.16. Income Taxes
On December 22, 2017, President Trump signed into law the TCJA that significantly changed the federal income taxation of business entities. The TCJA, among other things, reduced the corporate income tax rate to 21%, partially limited the deductibility of business interest expense and net operating losses, imposed a one-time tax on unrepatriated earnings from certain foreign subsidiaries, taxed offshore earnings at reduced rates regardless of whether they are repatriated and allows the immediate deduction
EARTHSTONE ENERGY, INC.
NOTES TO CONSOLIDATED FINANCIAL STATEMENTS (continued)
of certain capital expenditures instead of deductions for depreciation expense over time. As of December 31, 2018, the Company had finalized the accounting for the enactment of the TCJA.
The Company’s corporate structure requires the filing of two separate consolidated U.S. Federal income tax returns and one Canadian income tax return which include Lynden US, Earthstone, and Lynden Corp. As such, taxable income of Earthstone cannot be offset by tax attributes, including net operating losses, of Lynden US, nor can taxable income of Lynden US be offset by tax attributes of Earthstone. Earthstone and Lynden US record a tax provision, respectively, for their share of the book income or loss of EEH, net of the non-controlling interest. As EEH is treated as a partnership for U.S. Federal income tax purposes, it is not subject to income tax at the federal level and only recognizes the Texas Margin Tax.
The following table shows the components of the Company’s income tax provision for the years ended December 31, 2021, 2020 and 2019 and 2018 (in thousands):
| | | | | | | | | | | | | | | | | |
| | Years Ended December 31, |
| | 2021 | | 2020 | | 2019 |
| Current: | | | | | |
| Federal | $ | — | | | $ | — | | | $ | — | |
| State | (625) | | | (545) | | | — | |
| Total current | (625) | | | (545) | | | — | |
| Deferred: | | | | | |
| Federal | (901) | | | 147 | | | (95) | |
| State | (333) | | | 510 | | | (1,570) | |
| Total deferred | (1,234) | | | 657 | | | (1,665) | |
| Total income tax (expense) benefit | $ | (1,859) | | | $ | 112 | | | $ | (1,665) | |
| | | | | |
|
| | | | | | | |
| | Years Ended December 31, |
| | 2019 | | 2018 |
| Current: | |
| | |
|
| Federal | $ | — |
| | $ | — |
|
| State | — |
| | — |
|
| Total current | — |
| | — |
|
| Deferred: | | | |
| Federal | (95 | ) | | (1,398 | ) |
| State | (1,570 | ) | | (1,072 | ) |
| Total deferred | (1,665 | ) | | (2,470 | ) |
| Total income tax (expense) benefit | $ | (1,665 | ) | | $ | (2,470 | ) |
| | | | |
EARTHSTONE ENERGY, INC.
NOTES TO CONSOLIDATED FINANCIAL STATEMENTS (continued)
Effective Tax Rate
A reconciliation of the effective tax rate to the federal statutory rate for the years ended December 31, 20192021, 2020 and 20182019 is as follows (in thousands, except percentages):
| | | | | | | | | | | | | | | | | |
| | Years Ended December 31, |
| | 2021 | | 2020 | | 2019 |
| Net income (loss) before income taxes | $ | 63,365 | | | $ | (29,546) | | | $ | 3,245 | |
| Statutory rate | 21 | % | | 21 | % | | 21 | % |
| Tax (expense) benefit computed at statutory rate | (13,307) | | | 6,204 | | | (681) | |
| Noncontrolling interest | 5,613 | | | (3,349) | | | 374 | |
| | | | | |
| | | | | |
| Non-deductible general and administrative expenses | 455 | | | (1,943) | | | (230) | |
| State return to accrual | — | | | (157) | | | (286) | |
| | | | | |
| State income taxes, net of Federal benefit | (958) | | | (35) | | | (1,285) | |
| Valuation allowance | 6,338 | | | (608) | | | 443 | |
| | | | | |
| | | | | |
| | | | | |
| Total income tax (expense) benefit | $ | (1,859) | | | $ | 112 | | | $ | (1,665) | |
| Effective tax rate | (2.9) | % | | (0.4) | % | | (51.3) | % |
| | | | | |
|
| | | | | | | | | | | | | | | | | | | | | | | |
| | Years Ended December 31, |
| | 2019 | | 2018 |
| | U.S. | | Canada | | Total | | U.S. | | Canada | | Total |
| Net income (loss) before income taxes | $ | 3,245 |
| | $ | — |
| | $ | 3,245 |
| | $ | 97,683 |
| | $ | — |
| | $ | 97,683 |
|
| Statutory rate | 21 | % | | 27 | % | | | | 21 | % | | 27 | % | | |
| Tax expense computed at statutory rate | 681 |
| | — |
| | 681 |
| | 20,513 |
| | — |
| | 20,513 |
|
| Noncontrolling interest | (374 | ) | | — |
| | (374 | ) | | (11,475 | ) | | — |
| | (11,475 | ) |
| Non-deductible general and administrative expenses | 230 |
| | — |
| | 230 |
| | 94 |
| | — |
| | 94 |
|
| State return to accrual | 286 |
| | — |
| | 286 |
| | — |
| | — |
| | — |
|
| Refundable tax credits | — |
| | — |
| | — |
| | (505 | ) | | — |
| | (505 | ) |
| State income taxes, net of Federal benefit | 1,285 |
| | — |
| | 1,285 |
| | 1,208 |
| | — |
| | 1,208 |
|
| Valuation allowance | (443 | ) | | — |
| | (443 | ) | | (7,393 | ) | | — |
| | (7,393 | ) |
| State rate change | — |
| | — |
| | — |
| | 28 |
| | — |
| | 28 |
|
| Total income tax expense | $ | 1,665 |
| | $ | — |
| | $ | 1,665 |
| | $ | 2,470 |
| | $ | — |
| | $ | 2,470 |
|
| Effective tax rate | 51.3 | % | | — | % | | 51.3 | % | | 2.5 | % | | — | % | | 2.5 | % |
| | | | | | | | | | | | |
During the year ended December 31, 2020, the Company recorded total income tax benefit of $0.11 million which included (1) deferred income tax benefit for Lynden US of $0.15 million as a result of its share of the distributable income from EEH, (2) deferred income tax benefit for Earthstone of $0.61 million as a result of its share of the distributable income from EEH, which was offset by a valuation allowance as future realization of the net deferred tax asset cannot be assured and (3) current income tax expense of $0.55 million, offset by deferred income tax benefit of $0.51 million related to the Texas Margin Tax. Lynden Corp incurred no material income or loss, or related income tax expense or benefit, for the year ended December 31, 2020.
During the year ended December 31, 2019, the Company recorded total income tax expense of $1.7 million which included (1) deferred income tax expense for Lynden US of $0.1 million as a result of its share of the distributable income from EEH, (2) deferred income tax expense for Earthstone of $0.4 million as a result of its share of the distributable income from EEH, which was used to reduce the valuation allowance recorded against its deferred tax asset as future realization of the net deferred tax asset cannot be assured and (3) deferred income tax expense of $1.6 million related to the Texas Margin Tax. Lynden Corp incurred no material income or loss, or related income tax expense or benefit, for the year ended December 31, 2019.
During the year ended December 31, 2018, the Company recorded total income tax expense of $2.5 million which included (1) deferred income tax expense for Lynden US of $1.9 million as a result of its share of the distributable income from EEH, offset
EARTHSTONE ENERGY, INC.
NOTES TO CONSOLIDATED FINANCIAL STATEMENTS (continued)
by a $0.5 million discrete income tax benefit related to refundable AMT tax credits resulting from the TCJA, (2) deferred income tax expense for Earthstone of $7.4 million as a result of its share of the distributable income from EEH, which was used to reduce the valuation allowance recorded against its deferred tax asset as future realization of the net deferred tax asset cannot be assured and (3) deferred income tax expense of $1.1 million related to the Texas Margin Tax. Lynden Corp incurred no material income or loss, or related income tax expense or benefit, for the year ended December 31, 2018.
Deferred Tax Assets and Liabilities
The Company’s deferred tax position reflects the net tax effects of the temporary differences between the carrying amounts of assets and liabilities for financial reporting purposes and the amounts used for income tax reporting. Significant components of the deferred tax assets and liabilities at December 31, 20192021 and 20182020 are as follows (in thousands):
| | | | December 31, | | Years Ended December 31, |
| | 2019 | | 2018 | | 2021 | | 2020 |
| Deferred noncurrent income tax assets (liabilities): | |
| | |
| Deferred noncurrent income tax assets (liabilities): | | | |
| | Oil & gas properties | $ | 20,633 |
| | $ | 11,164 |
| Oil & gas properties | $ | 20,909 | | | $ | 18,929 | |
| | Basis difference in subsidiary obligation | (2,211 | ) | | (2,211 | ) | Basis difference in subsidiary obligation | (2,211) | | | (2,211) | |
| | Investment in Partnerships | (31,722 | ) | | (18,517 | ) | Investment in Partnerships | (27,463) | | | (25,760) | |
| Federal net operating loss carryforward | 14,597 |
| | 12,940 |
| Federal net operating loss carryforward | 16,544 | | | 11,590 | |
| Net deferred noncurrent tax assets | 1,297 |
| | 3,376 |
| |
| | Net deferred noncurrent tax (liability) asset | | Net deferred noncurrent tax (liability) asset | 7,779 | | | 2,548 | |
| Valuation allowance | (16,451 | ) | | (16,865 | ) | Valuation allowance | (23,510) | | | (17,044) | |
| Net deferred tax liability | $ | (15,154 | ) | | $ | (13,489 | ) | Net deferred tax liability | $ | (15,731) | | | $ | (14,496) | |
| | | | | | | | |
As of December 31, 2019,2021, the Company had a valuation allowance recorded against its deferred tax assetsasset of $16.5$23.5 million which is in excess of its net deferred noncurrent tax assetsliabilities of $1.3$7.8 million, as presented above. The Company’s corporate
EARTHSTONE ENERGY, INC.
NOTES TO CONSOLIDATED FINANCIAL STATEMENTS (continued)
organizational structure requires the filing of two separate consolidated U.S. Federal corporate income tax returns, one separate U.S. Federal partnership income tax return and one Canadian income tax return. As a result, tax attributes of one group cannot be offset by the tax attributes of another. At December 31, 2019,2021, the deferred tax assets and liabilities related to the two U.S. Federal corporate income tax returns, one Canadian income tax return and one related to the Texas Margin Tax are a $12.7$19.7 million deferred tax asset, a $9.7$10.4 million deferred tax liability, a $3.8 million deferred tax asset and a $5.5$5.3 million deferred tax liability, respectively, before considering the valuation allowance of $16.5$23.5 million.
As of December 31, 2018,2020, the Company had a valuation allowance recorded against its deferred tax assets of $16.9$17.0 million which is in excess of its Net deferred noncurrent tax assets of $3.4$2.5 million, as presented above. The Company’s corporate organizational structure requires the filing of two separate consolidated U.S. Federal income tax returns, one separate U.S. Federal partnership income tax return and one Canadian income tax return. As a result, tax attributes of one group cannot be offset by the tax attributes of another. At December 31, 2018,2020, the deferred tax assets and liabilities related to the two U.S. Federal income tax returns, one Canadian income tax and one related to the Texas Margin Tax were a $13.1$13.3 million deferred tax asset, a $9.6 million deferred tax liability, a $3.8 million deferred tax asset and a $3.9$4.8 million deferred tax liability, respectively, before considering the valuation allowance of $16.9$17.0 million.
As of December 31, 2019, the Company2021, (1) Earthstone had estimated U.S. net operating loss carryforwards of $56.5$29.1 million, the first expiring in 20342036 and the last in 2039,2037 and $14.4 million with an indefinite carryforward life (“ICL”), (2) Lynden US had estimated U.S. net operating loss carryforwards of $31.9 million, expiring from 2032 through 2037 and $2.6 million with an indefinite carryforward life, and, (3) Lynden Corp had Canadian net operating loss carryforwards of $10.0 million, the first expiring in 2024 and the last in 2037. TheICL loss deductions are limited to 80% of the excess of taxable income in the year utilized. Additionally, the ability to utilize net operating losses and other tax attributes could be subject to a significant limitation if the Company were to undergo an ownership change for the purposes of Section 382 (“Sec 382”) of the Internal Revenue Code of 1986, as amended (the “Code”). The Company has an additional estimated U.S. net operating loss carryforward of $28.2$65.9 million limited by Sec 382 resulting from the Lynden Arrangement. The Company continues to evaluate the impact, if any, of potential Sec 382 limitations.
The Company’s tax returns are subject to periodic audits by the various jurisdictions in which the Company operates. These audits canOn February 15, 2022, as a result in adjustments of taxes due or adjustments of the completion of the Chisholm Acquisition, which included the issuance of 19,417,476 shares of our Class A Common Stock, a limitation was triggered under Section 382 of the Code. The Company is currently assessing the impact of the limitation on both its NOL carryforwards that are available to offset future taxable income. Generally, the Company’s incomeand its deferred tax years 2013 through 2018 remain open and subject to examination by the Internal Revenue Service or state tax jurisdictions where it conducts operations. In certain jurisdictions, the Company operates through more than one legal entity, each of which may have different open years subject to examination.asset.
Uncertain Tax Positions
FASB ASC Topic 740, Income Taxes (“ASC 740”) prescribes a recognition threshold and a measurement attribute for the financial statement recognition and measurement of income tax positions taken or expected to be taken in an income tax return. For those
EARTHSTONE ENERGY, INC.
NOTES TO CONSOLIDATED FINANCIAL STATEMENTS (continued)
benefits to be recognized, an income tax position must be more-likely-than-not to be sustained upon examination by taxing authorities. As of December 31, 2019,2021, the Company had no material uncertain tax positions. The Company’s uncertain tax positions may change in the next twelve months; however, the Company does not expect any possible change to have a significant impact on its results of operations or financial position.
The Company files two Federal income tax returns, one Canadian income tax return and various combined and separate filings in several state and local jurisdictions. The Company’s practice is to recognize estimated interest and penalties, if any, related to potential underpayment of income taxes as a component of income tax expense in its Consolidated Statement of Operations. As of December 31, 2019,2021, the Company did not have any accrued interest or penalties associated with any uncertain tax liabilities.
Note 18.17. Defined Contribution Plan
The Company sponsors a 401(k) defined contribution plan (the “401(k) Plan”) for substantially all of its employees, which was initiated in April 2017. Eligible employees may make contributions to the 401(k) Plan by electing to contribute up to 100% of their annual compensation, not to exceed annual limits established by the federal government. The Company makes matching contributions of 100% of employee contributions, not to exceed six6 percent of the employee’s annual eligible compensation. The Company’s matching contributions vest immediately. The Company’s contributions to the 401(k) Plan for the years ended December 31, 2021, 2020 and 2019 and 2018 were $0.5 million, $0.5 million and $0.5 million, respectively.
Note 19.18. Leases
The Company’s operating lease activities consist of leases for office space. The Company’s finance lease activities consist of leases for vehicles. Leases with an initial term of 12 months or less are not recorded on the balance sheet. Most leases include one1 or more options to renew, with renewal terms generally ranging from one to three years. The exercise of lease renewal options is at the Company’s sole discretion. Certain leases also include options to purchase the leased property. The depreciable life of assets and leasehold improvements is limited by the expected lease term, unless there is a transfer of title or purchase
option reasonably certain of exercise. None of the lease agreements include variable lease payments. The lease agreements do not contain any material residual value guarantees or material restrictive covenants. See discussion
The following table shows the classification and location of the January 1, 2019 implementation impact at Note 2. Summary of Significant Accounting Policies.
Supplemental balance sheet information as of December 31, 2019 for the Company’s leases is as follows on the Consolidated Balance Sheets (in thousands):
| | | | | | | | | | | | | | | | | | | | |
| | | | December 31, |
| Leases | | Balance Sheet Location | | 2021 | | 2020 |
| Assets | | | | | | |
| Noncurrent: | | | | | | |
| Operating | | Operating lease right-of-use assets | | $ | 1,795 | | | $ | 2,450 | |
| Finance | | Office and other equipment, net of accumulated depreciation and amortization | | — | | | 74 | |
| Total lease assets | | | | $ | 1,795 | | | $ | 2,524 | |
| | | | | | |
| Liabilities | | | | | | |
| Current: | | | | | | |
| Operating | | Operating lease liabilities | | $ | 681 | | | $ | 773 | |
| Finance | | Finance lease liabilities | | — | | | 69 | |
| Noncurrent: | | | | | | |
| Operating | | Operating lease liabilities | | 1,276 | | | 1,840 | |
| Finance | | Finance lease liabilities | | — | | | 5 | |
| Total lease liabilities | | | | $ | 1,957 | | | $ | 2,687 | |
| | | | | | |
|
| | | | | | |
| Leases | | Balance Sheet Location | | |
| Assets | | | | |
| Noncurrent: | | | | |
| Operating | | Operating lease right-of-use assets | | $ | 3,108 |
|
| Finance | | Office and other equipment, net of accumulated depreciation and amortization | | 614 |
|
| Total lease assets | | | | $ | 3,722 |
|
| | | | | |
| Liabilities | | | | |
| Current: | | | | |
| Operating | | Operating lease liabilities | | $ | 570 |
|
| Finance | | Finance lease liabilities | | 206 |
|
| Noncurrent: | | | | |
| Operating | | Operating lease liabilities | | 2,539 |
|
| Finance | | Finance lease liabilities | | 85 |
|
| Total lease liabilities | | | | $ | 3,400 |
|
| | | | | |
*The difference between assetsfollowing table shows the classification and liabilities includes a $0.1 million adjustment to NCI and a $0.07 million adjustment to accumulated deficit, both at the beginninglocation of the period as part of the ASC 842 implementation adjustment.
OperatingCompany’s lease expenses for the year ended December 31, 2019 were $0.8 million and are included in General and administrative expense incosts on the Consolidated Statements of Operations. Finance lease expenses for the year ended December 31, 2019 were $0.3 million and are included Operations (in depreciation, depletion and amortization expense and interest expense, net in the Consolidated Statements of Operations. thousands):
| | | | | | | | | | | | | | | | | | | | | | | | | | |
| | | | Years Ended December 31, |
| | Statement of Operations Location | | 2021 | | 2020 | | 2019 |
| Operating lease expense | | General and administrative expense | | $ | 803 | | | $ | 786 | | | $ | 754 | |
| Finance lease expense: | | | | | | | | |
| Amortization of right-of-use assets | | Depreciation, depletion and amortization | | $ | 74 | | | $ | 217 | | | $ | 298 | |
| Interest on lease liability | | Interest expense, net | | 2 | | | 13 | | | 33 | |
| Total lease expense | | | | $ | 879 | | | $ | 1,016 | | | $ | 1,085 | |
| | | | | | | | |
Additionally, the Company capitalized as part of oil and gas properties $6.4 million, $2.9 million and $11.4 million of short-term lease costs related to drilling rig contracts during the yearyears ended December 31, 2021, 2020 and 2019. All of the Company’s drilling rig contracts have enforceable terms of less than one year.
Minimum contractual obligations for the Company’s leases (undiscounted) as of December 31, 20192021 were as follows (in thousands):
| | | | | | | | | | | | | | |
| | Operating | | Finance |
| 2022 | | $ | 696 | | | $ | — | |
| 2023 | | 595 | | | — | |
| 2023 | | 605 | | | — | |
| 2025 | | 152 | | | — | |
| 2026 | | — | | | — | |
| Thereafter | | — | | | — | |
| Total lease payments | | $ | 2,048 | | | $ | — | |
| Less imputed interest | | (91) | | | — | |
| Total lease liability | | $ | 1,957 | | | $ | — | |
| | | | |
|
| | | | | | | | |
| | | Operating | | Finance |
| 2020 | | $ | 632 |
| | $ | 219 |
|
| 2021 | | 791 |
| | 84 |
|
| 2022 | | 696 |
| | 5 |
|
| 2023 | | 596 |
| | — |
|
| 2024 | | 605 |
| | — |
|
| Thereafter | | 152 |
| | — |
|
| Total lease payments | | $ | 3,472 |
| | $ | 308 |
|
| Less imputed interest | | (363 | ) | | (17 | ) |
| Total lease liability | | $ | 3,109 |
| | $ | 291 |
|
| | | | | |
Cash payments for the Company’s operating and finance leases for the year ended December 31, 2019 were $0.8 million and $0.4 million, respectively. For the year ended December 31, 2019, there were $3.2 million of right-of-use assets obtained in exchange for lease obligations for operating leases. The amounts related to the Company’s finance leases were not material to the consolidated financial statements.
As of December 31, 2019,following table shows the weighted average remaining lease terms ofterm and the Company’s operating and finance leases were 4.8 years and 1.4 years, respectively. The weighted average discount rates used to determine the lease liabilities as of December 31, 2019rate for the Company’s operating and finance leases were 4.35% and 6.75%, respectively. as of the dates indicated:
| | | | | | | | | | | | | | | | | | | | | | | | | | |
| | December 31, 2021 | | December 31, 2020 |
| | Operating Leases | | Finance Leases | | Operating Leases | | Finance Leases |
| Weighted-average remaining lease term (in years) | | 2.9 | | n/a | | 3.9 | | 1.0 |
| Weighted-average discount rate (1) | | 4.35 | % | | n/a | | 4.35 | % | | 6.71 | % |
(1)The discount rate used for operating leases is based on the Company’s incremental borrowing rate.rate at lease commencement and may be adjusted if modifications to lease terms or lease reassessments occur. The discount rate used for finance leases is based on the rates implicit in the leases.
AsThe following table includes other quantitative information for the Company’s leases (in thousands):
| | | | | | | | | | | | | | |
| | Years Ended December 31, |
| | 2021 | | 2020 |
| Cash paid for amounts included in the measurement of lease liabilities: | | | | |
| Cash payments for operating leases | | $ | 778 | | | $ | 632 | |
| Cash payments for finance leases | | 70 | | | 130 | |
| Right-of-use assets obtained in exchange for new operating lease liabilities | | — | | | — | |
| | | | |
Note 19. Subsequent Event
Chisholm Acquisition
On February 15, 2022, Earthstone, EEH, Chisholm Energy Operating, LLC (“OpCo”) and Chisholm Energy Agent, Inc. (“Agent” and collectively with OpCo, “Chisholm”), as seller, consummated the transactions (the “Chisholm Closing”) contemplated in the Chisholm Agreement. At the closing of the Chisholm Agreement, among other things, EEH acquired (the “Chisholm Acquisition”) interests in oil and gas leases and related property of Chisholm located in Lea County and Eddy County, New Mexico, for aggregate consideration consisting of: (i) approximately $314.7 million in cash, net of preliminary and customary purchase price adjustments and remains subject to post-closing settlement between EEH and Chisholm paid at the closing of the Chisholm Acquisition, (ii) $70 million in cash to be paid as follows: $40 million to be paid six months after the closing of the Chisholm Acquisition and $30 million to be paid 12 months after the closing of the Chisholm Acquisition, subject to acceleration in the event that Earthstone receives gross proceeds of more than $450 million from a high yield bond offering or more than $50 million in gross proceeds from an offering of Class A Common Stock or preferred stock; and (iii) 19,417,476 shares of Class A Common Stock. On December 17, 2021, in accordance with the Chisholm Agreement and prior to the Chisholm Closing, Earthstone provided a deposit in the amount of $30.5 million which was recorded in Other noncurrent assets in the Consolidated Balance Sheeet as of December 31, 2018, minimum future contractual2021, as well as included in Acquisition of oil and gas properties in Cash flows from investing activities in the Consolidated Statements of Cash Flows for the year then ended. A Significant Shareholder was the majority owner of Chisholm as of the closing of the Chisholm Acquisition. A majority of the stockholders of Earthstone not affiliated with the Significant Shareholder approved the issuance of 19,417,476 shares of Class A Common Stock in connection with the closing of the Chisholm Acquisition.
Cash consideration for the Chisholm Acquisition was funded by borrowings under the Credit Agreement whose borrowing base was increased from $650 million to $825 million at the closing of the Chisholm Acquisition on February 15, 2022.
Bighorn Agreement
On January 30, 2022, Earthstone, EEH, and Bighorn Asset Company, LLC, a Delaware limited liability company (“Bighorn”), as seller, entered into a Purchase and Sale Agreement (the “Bighorn Agreement”). Pursuant to the Bighorn Agreement, EEH will acquire (the “Bighorn Acquisition”) interests in oil and gas leases and related property of Bighorn located in the Midland Basin, Texas, for a purchase price (the “Bighorn Purchase Price”) of $770 million in cash and 6,808,511 shares of Class A Common Stock. The Bighorn Purchase Price is subject to customary purchase price adjustments with an effective date of January 1, 2022. In connection with the Bighorn Agreement, EEH deposited $50 million in cash into a third-party escrow account as a deposit pursuant to the Bighorn Agreement, which will be credited against the Bighorn Purchase Price upon closing of the Bighorn Acquisition.
Credit Agreement
On January 30, 2022, Earthstone, EEH, as Borrower, Wells Fargo Bank, National Association (“Wells Fargo”) as Administrative Agent, the lenders party thereto (the “Lenders”) and the guarantors party thereto entered into an amended and restated Fifth Amendment (the “Amendment”) to the Credit Agreement. Among other things, the Amendment increases the borrowing base and corresponding elected commitments from $650 million to $825 million upon the closing (“Chisholm Closing”) of the Chisholm Agreement; provides that upon the closing of the Bighorn Acquisition (assuming the occurrence of the Chisholm Closing), the borrowing base and corresponding elected commitments will increase to $1.325 billion, unless Earthstone completes an unsecured senior notes offering (the “Notes Offering”) prior to the closing of the Bighorn Acquisition in which case the elected commitments will be reduced by the amount of the net proceeds from a Notes Offering up to $500 million; provides for an increase in interest rates by 0.50% in the event a Notes Offering has not been completed prior to the closing of the Bighorn Acquisition; provides mechanics relating to the transition from LIBOR to a benchmark replacement rate to be effective contemporaneously with the effectiveness of the Amendment on January 30, 2022; adds certain hedging requirements relating to anticipated oil and natural gas production of the properties to be acquired pursuant to the Bighorn Acquisition; adjusts some financial covenants; redefines the limitations on certain restricted payments the Borrower may make; and makes certain administrative changes to the Credit Agreement.
Securities Purchase Agreement
On January 30, 2022, Earthstone entered into a securities purchase agreement (the “Securities Purchase Agreement”) with EnCap Capital Energy Fund XI, L.P. (“EnCap Fund XI”), an affiliate of EnCap, and Cypress Investments, LLC, a fund managed by Post Oak Energy Capital, LP (“Post Oak” and collectively with EnCap Fund XI, the “Investors”) to sell, in a private placement (the “Private Placement”), 280,000 shares of newly authorized convertible preferred stock, $0.001 par value per share (the “Preferred Stock”), each share of which will be convertible into 90.0900900900901 shares of Class A Common Stock for long-term leases under ASC 840anticipated gross proceeds of $280.0 million, at a price of $1,000.00 per share of Preferred Stock (or $11.10 per share of Class A Common Stock on an as-converted basis). The Private Placement is contingent upon the closing of the Bighorn Acquisition. The Company intends to use the net proceeds from the sale of the Preferred Stock to partially fund the Bighorn Acquisition. As of the date of the Securities Purchase Agreement, EnCap and its affiliates beneficially owned approximately 46.5% of the outstanding voting power of Earthstone. NaN of Earthstone’s directors are employed by EnCap. The Securities Purchase Agreement and the Private Placement were as follows (in thousands):evaluated and approved by the Audit Committee of the Board and unanimously approved by the Board.
|
| | | | | | | | |
| | | Operating | | Finance |
| 2019 | | $ | 723 |
| | $ | 419 |
|
| 2020 | | — |
| | 223 |
|
| 2021 | | — |
| | 77 |
|
| 2022 | | — |
| | — |
|
| 2023 | | — |
| | — |
|
| Thereafter | | — |
| | — |
|
| Total lease payments | | $ | 723 |
| | $ | 719 |
|
| | | | | |
Note 20. Supplemental Selected Quarterly Financial Data (Unaudited)
| | | | | | | | | | | | | | | | | | | | | | | | | | |
| (In thousands, except per share data) | | First Quarter | | Second Quarter | | Third Quarter | | Fourth Quarter |
| 2021 | | | | | | | | |
| Oil and gas revenues | | $ | 75,572 | | | $ | 89,671 | | | $ | 110,384 | | | $ | 144,016 | |
| Income from operations | | 24,513 | | | 37,059 | | | 54,947 | | | 73,562 | |
| Net (loss) income attributable to Earthstone Energy, Inc. | | (5,833) | | | (8,871) | | | 10,418 | | | 39,770 | |
| | | | | | | | | |
| Net (loss) income per common share attributable to Earthstone Energy, Inc.: | | | | | | | | |
| Basic | | $ | (0.14) | | | $ | (0.20) | | | $ | 0.21 | | | $ | 0.76 | |
| Diluted | | $ | (0.14) | | | $ | (0.20) | | | $ | 0.20 | | | $ | 0.72 | |
| | | | | | | | | |
| 2020 | | | | | | | | |
| Oil and gas revenues | | $ | 45,138 | | | $ | 21,663 | | | $ | 41,047 | | | $ | 36,675 | |
| Loss from operations | | (60,368) | | | (15,067) | | | (4,484) | | | (4,694) | |
| Net income (loss) attributable to Earthstone Energy, Inc. | | 16,708 | | | (16,339) | | | (5,445) | | | (8,471) | |
| | | | | | | | | |
| Net income (loss) per common share attributable to Earthstone Energy, Inc.: | | | | | | | | |
| Basic and diluted | | $ | 0.57 | | | $ | (0.55) | | | $ | (0.18) | | | $ | (0.28) | |
| | | | | | | | |
| 2019 | | | | | | | | |
| Oil and gas revenues | | $ | 40,728 | | | $ | 44,542 | | | $ | 39,204 | | | $ | 66,788 | |
| Income from operations | | 10,444 | | | 12,348 | | | 9,564 | | | 22,776 | |
| Net (loss) income attributable to Earthstone Energy, Inc. | | (17,204) | | | 8,777 | | | 11,770 | | | (2,624) | |
| | | | | | | | |
| Net income (loss) per common share attributable to Earthstone Energy, Inc.: | | | | | | | | |
| Basic and diluted | | $ | 0.60 | | | $ | 0.30 | | | $ | 0.41 | | | $ | (0.09) | |
First quarter 2020 loss from operations includes non-cash impairment charges of $42.8 million to the Company’s oil and natural gas properties, as well as a non-cash impairment charge of $17.6 million related to the Company’s goodwill. Third quarter 2020 loss from operations includes a non-cash impairment charge of $2.1 million to the Company’s oil and natural gas properties. Fourth quarter 2020 loss from operations includes a non-cash impairment charge of $2.0 million to the Company’s oil and natural gas properties. Impairments to oil and natural gas properties are discussed in Note 7. Oil and Natural Gas Properties.
Note 21. Supplemental Information On Oil And Gas Exploration And Production Activities (Unaudited)
Costs Incurred Related to Oil and Gas Activities
Capitalized costs include the cost of properties, equipment, and facilities for oil and natural gas producing activities. Capitalized costs for proved properties include costs for oil and natural gas leaseholds where proved reserves have been identified, development wells, and related equipment and facilities, including development wells in progress. Capitalized costs for unproved properties include costs for acquiring oil and natural gas leaseholds where no proved reserves have been identified, including costs of exploratory wells that are in the process of drilling or in active completion, and costs of exploratory wells suspended or waiting on completion.
The Company’s oil and natural gas activities for 20192021, 2020 and 20182019 were entirely within the United States of America. Costs incurred in oil and natural gas producing activities were as follows (in thousands):
| | | | | | | | | | | | | | | | | |
| | Years Ended December 31, |
| | 2021 | | 2020 | | 2019 |
Acquisition cost (1): | | | | | |
| Proved | $ | 465,144 | | | $ | — | | | $ | (141) | |
| Unproved | 43 | | | — | | | (125) | |
| Exploration costs: | | | | | |
| Abandonment costs | — | | | — | | | 653 | |
| Geological and geophysical | 341 | | | 298 | | | — | |
| Development costs | 134,035 | | | 67,550 | | | 210,520 | |
| Total additions | $ | 599,563 | | | $ | 67,848 | | | $ | 210,907 | |
(1)Acquisition costs incurred during 2019 consisted primarily of purchase price adjustments related to 2018 acquisitions.
|
| | | | | | | |
| | Years Ended December 31, |
| | 2019 | | 2018 |
Acquisition cost (1): | | | |
| Proved | $ | (141 | ) | | $ | 41,569 |
|
| Unproved | (125 | ) | | 31,268 |
|
| Exploration costs: | | | |
| Abandonment costs | 653 |
| | — |
|
| Geological and geophysical | — |
| | 630 |
|
| Development costs | 210,520 |
| | 153,161 |
|
| Total additions | $ | 210,907 |
| | $ | 226,628 |
|
| |
(1) | Acquisition costs incurred during 2019 consisted primarily of purchase price adjustments related to 2018 acquisitions and during 2018 consisted primarily of an acreage trade in the Midland Basin.
|
During the years ended December 31, 20192021, 2020 and 2018,2019, additions to oil and natural gas properties of $0.1$2.2 million, $0.8 million and $0.3$0.1 million, respectively, were recorded for estimated costs of future abandonment related to new wells drilled or acquired.
During the years ended December 31, 20192021, 2020 and 2018,2019, the Company had no capitalized exploratory well costs, nor capitalized costs related to share-based compensation, general corporate overhead or similar activities.
Capitalized Costs
Capitalized costs, impairment, and depreciation, depletion and amortization relating to the Company’s oil and natural gas properties producing activities, all of which are conducted within the continental United States as of December 31, 20192021 and 2018,2020, are summarized below (in thousands):
| | | | December 31, | | December 31, |
| | 2019 | | 2018 | | 2021 | | 2020 |
| Oil and gas properties, successful efforts method: | | | | Oil and gas properties, successful efforts method: | | | |
| Proved properties | $ | 1,046,208 |
| | $ | 830,843 |
| Proved properties | $ | 1,726,019 | | | $ | 1,118,148 | |
| Accumulated impairment to proved properties | (75,400 | ) | | (75,400 | ) | Accumulated impairment to proved properties | (100,652) | | | (100,652) | |
| Proved properties, net of accumulated impairments | 970,808 |
| | 755,443 |
| Proved properties, net of accumulated impairments | 1,625,367 | | | 1,017,496 | |
| Unproved properties | 305,961 |
| | 311,828 |
| Unproved properties | 289,341 | | | 301,083 | |
| Accumulated impairment to Unproved properties | (45,690 | ) | | (45,688 | ) | Accumulated impairment to Unproved properties | (67,316) | | | (67,316) | |
| Unproved properties, net of accumulated impairments | 260,271 |
| | 266,140 |
| Unproved properties, net of accumulated impairments | 222,025 | | | 233,767 | |
| Land | 5,382 |
| | 5,382 |
| Land | 5,382 | | | 5,382 | |
| Total oil and gas properties, net of accumulated impairments | 1,236,461 |
| | 1,026,965 |
| Total oil and gas properties, net of accumulated impairments | 1,852,774 | | | 1,256,645 | |
| Accumulated depreciation, depletion and amortization | (195,567 | ) | | (127,256 | ) | Accumulated depreciation, depletion and amortization | (395,625) | | | (291,213) | |
| Net oil and gas properties | $ | 1,040,894 |
| | $ | 899,709 |
| Net oil and gas properties | $ | 1,457,149 | | | $ | 965,432 | |
Oil and Natural Gas Reserves
Users of this information should be aware that the process of estimating quantities of “proved” and “proved developed” oil and natural gas reserves is very complex, requiring significant subjective decisions in the evaluation of all available geological, engineering and economic data for each reservoir. The data for a given reservoir may also change substantially over time as a result of numerous factors including, but not limited to, additional development activity, evolving production history and continual reassessment of the viability of production under varying economic conditions. As a result, revisions to existing reserve estimates may occur from time to time. Although every reasonable effort is made to ensure reserve estimates reported represent the most accurate assessments possible, the subjective decisions and variances in available data for various reservoirs make these estimates generally less precise than other estimates included in the financial statement disclosures.
Proved reserves represent estimated quantities of oil, natural gas and natural gas liquids that geological and engineering data demonstrate, with reasonable certainty, to be recoverable in future years from known reservoirs under economic and operating
conditions in effect when the estimates were made. Proved developed reserves represent estimated quantities expected to be recovered through wells and equipment in place and under operating methods used when the estimates were made.
The proved reserves estimates shown herein for the years ended December 31, 20192021, 2020 and 20182019 have been prepared by Cawley, Gillespie & Associates, Inc., independent petroleum engineers. Proved reserves were estimated in accordance with guidelines established by the SEC, which require that reserve estimates be prepared under existing economic and operating conditions based upon the 12-month unweighted average of the first-day-of-the-month prices.
The reserve information in these Consolidated Financial Statements represents only estimates. There are a number of uncertainties inherent in estimating quantities of proved reserves, including many factors beyond the Company’s control, such as commodity pricing. Reserve engineering is a subjective process of estimating underground accumulations of oil and natural gas that cannot be measured in an exact manner. The accuracy of any reserve estimate is a function of the quality of available data and engineering and geological interpretation and judgment. As a result, estimates by different engineers may vary. In addition, results of drilling, testing and production subsequent to the date of an estimate may lead to revising the original estimate. Accordingly, initial reserve estimates are often different from the quantities of oil and natural gas that are ultimately recovered. The meaningfulness of such estimates depends primarily on the accuracy of the assumptions upon which they were based. Except to the extent the Company acquires additional properties containing proved reserves or conducts successful exploration and development activities or both, the Company’s proved reserves will decline as reserves are produced.
The following table illustrates the Company’s estimated net proved reserves, including changes, and proved developed and proved undeveloped reserves for the periods indicated. The oil prices as of December 31, 20192021, 2020 and 20182019 are based on the respective 12-month unweighted average of the first of the month prices of the West Texas Intermediate (“WTI”) spot prices which equates to $55.69$66.56 per barrel, $39.57 per barrel and $65.56$55.69 per barrel, respectively. The natural gas prices as of December 31, 20192021, 2020 and 20182019 are based on the respective 12-month unweighted average of the first of month prices of the Henry Hub spot price which equates to $2.58$3.60 per MMBtu, $1.99 per MMBtu and $3.10$2.58 per MMBtu, respectively. Natural gas liquids are made up of ethane, propane, isobutane, normal butane and natural gasoline, each of which have different uses and different pricing characteristics. The natural gas liquids prices used to value reserves as of December 31, 2021, 2020 and 2019 and 2018 averaged $16.17$30.16 per barrel, $11.61 per barrel and $28.81$16.17 per barrel, respectively. All prices are adjusted by lease or field for energy content, transportation fees, and market differentials, resulting in the aforementioned oil, natural gas and natural gas liquids reserves as of December 31, 20192021 being valued using prices of $52.60$65.64 per barrel, $0.91$3.01 per MMBtu and $16.17$30.16 per barrel, respectively. All prices are held constant in accordance with SEC guidelines.
A summary of the Company’s changes in quantities of proved oil, natural gas and NGLsNGL reserves for the years ended December 31, 20192021, 2020 and 20182019 are as follows:
| | | | | | | | | | | | | | | | | | | | | | | |
| Oil
(MBbl) | | Natural Gas
(MMcf) | | NGLs
(MBbl) | | Total
(MBoe) |
| Balance - December 31, 2018 | 59,034 | | | 113,217 | | | 20,943 | | | 98,847 | |
| Extensions and discoveries | 3,598 | | | 4,476 | | | 721 | | | 5,065 | |
| Sales of minerals in place | (31) | | | (4) | | | (1) | | | (32) | |
| | | | | | | |
| Production | (3,086) | | | (4,760) | | | (1,022) | | | (4,902) | |
| Revision to previous estimates | (6,865) | | | (4,939) | | | 3,047 | | | (4,642) | |
| Balance - December 31, 2019 | 52,650 | | | 107,990 | | | 23,688 | | | 94,336 | |
| Extensions and discoveries | 420 | | | 1,258 | | | 230 | | | 860 | |
| | | | | | | |
| | | | | | | |
| Production | (3,180) | | | (7,282) | | | (1,237) | | | (5,630) | |
| Revision to previous estimates | (9,800) | | | 9,249 | | | (2,432) | | | (10,691) | |
| Balance - December 31, 2020 | 40,090 | | | 111,215 | | | 20,249 | | | 78,875 | |
| Extensions and discoveries | 7,016 | | | 49,846 | | | 6,532 | | | 21,856 | |
| Sales of minerals in place | (8) | | | (1) | | | — | | | (8) | |
| Purchases of minerals in place | 25,114 | | | 106,539 | | | 17,103 | | | 59,973 | |
| Production | (4,381) | | | (14,505) | | | (2,257) | | | (9,055) | |
| Revision to previous estimates | (6,756) | | | 31,787 | | | (2,596) | | | (4,054) | |
| Balance - December 31, 2021 | 61,075 | | | 284,881 | | | 39,031 | | | 147,587 | |
| Proved developed reserves: | | | | | | | |
| December 31, 2018 | 14,325 | | | 26,110 | | | 4,969 | | | 23,646 | |
| December 31, 2019 | 18,220 | | | 35,120 | | | 7,447 | | | 31,521 | |
| December 31, 2020 | 18,878 | | | 55,764 | | | 10,125 | | | 38,298 | |
| December 31, 2021 | 35,824 | | | 190,999 | | | 25,917 | | | 93,575 | |
| Proved undeveloped reserves: | | | | | | | |
| December 31, 2018 | 44,709 | | | 87,107 | | | 15,974 | | | 75,201 | |
| December 31, 2019 | 34,430 | | | 72,870 | | | 16,241 | | | 62,815 | |
| December 31, 2020 | 21,212 | | | 55,450 | | | 10,123 | | | 40,577 | |
| December 31, 2021 | 25,251 | | | 93,882 | | | 13,114 | | | 54,012 | |
|
| | | | | | | | | | | |
| | Oil (MBbl) | | Natural Gas (MMcf) | | NGLs (MBbl) | | Total (MBOE) |
| Balance - December 31, 2017 | 47,327 |
| | 91,088 |
| | 17,468 |
| | 79,976 |
|
| Extensions and discoveries | 10,148 |
| | 17,673 |
| | 3,116 |
| | 16,209 |
|
| Sales of minerals in place | (2,651 | ) | | (14,300 | ) | | (1,562 | ) | | (6,596 | ) |
| Purchases of minerals in place | 3,532 |
| | 9,890 |
| | 1,629 |
| | 6,810 |
|
| Production | (2,370 | ) | | (3,610 | ) | | (655 | ) | | (3,627 | ) |
| Revision to previous estimates | 3,048 |
| | 12,476 |
| | 947 |
| | 6,075 |
|
| Balance - December 31, 2018 | 59,034 |
| | 113,217 |
| | 20,943 |
| | 98,847 |
|
| Extensions and discoveries | 3,598 |
| | 4,476 |
| | 721 |
| | 5,065 |
|
| Sales of minerals in place | (31 | ) | | (4 | ) | | (1 | ) | | (32 | ) |
| Production | (3,086 | ) | | (4,760 | ) | | (1,022 | ) | | (4,902 | ) |
| Revision to previous estimates | (6,865 | ) | | (4,939 | ) | | 3,047 |
| | (4,642 | ) |
| Balance - December 31, 2019 | 52,650 |
| | 107,990 |
| | 23,688 |
| | 94,336 |
|
| Proved developed reserves: | | | | | | | |
| December 31, 2017 | 11,949 |
| | 23,336 |
| | 4,123 |
| | 19,961 |
|
| December 31, 2018 | 14,325 |
| | 26,110 |
| | 4,969 |
| | 23,646 |
|
| December 31, 2019 | 18,220 |
| | 35,120 |
| | 7,447 |
| | 31,521 |
|
| Proved undeveloped reserves: | | | | | | | |
| December 31, 2017 | 35,378 |
| | 67,752 |
| | 13,345 |
| | 60,015 |
|
| December 31, 2018 | 44,709 |
| | 87,107 |
| | 15,974 |
| | 75,201 |
|
| December 31, 2019 | 34,430 |
| | 72,870 |
| | 16,241 |
| | 62,815 |
|
The table below presents the quantities of proved oil, natural gas and NGLs reserves attributable to noncontrolling interests as of December 31, 20192021 and 2018:2020:
| | | | | | | | | | | | | | | | | | | | | | | |
| As of December 31, 2021 | Oil
(MBbl) | | Natural Gas
(MMcf) | | NGLs
(MBbl) | | Total
(MBoe) |
| Proved developed | 14,011 | | | 74,702 | | | 10,137 | | | 36,598 | |
| Proved undeveloped | 9,876 | | | 36,719 | | | 5,129 | | | 21,125 | |
| Total proved | 23,887 | | | 111,421 | | | 15,266 | | | 57,723 | |
| | | | | | | |
| As of December 31, 2020 | Oil
(MBbl) | | Natural Gas
(MMcf) | | NGLs
(MBbl) | | Total
(MBoe) |
| Proved developed | 10,113 | | | 29,873 | | | 5,424 | | | 20,516 | |
| Proved undeveloped | 11,363 | | | 29,704 | | | 5,423 | | | 21,737 | |
| Total proved | 21,476 | | | 59,577 | | | 10,847 | | | 42,253 | |
| | | | | | | |
| As of December 31, 2019 | Oil
(MBbl) | | Natural Gas
(MMcf) | | NGLs
(MBbl) | | Total
(MBoe) |
| Proved developed | 9,933 | | | 19,146 | | | 4,060 | | | 17,183 | |
| Proved undeveloped | 18,769 | | | 39,724 | | | 8,853 | | | 34,243 | |
| Total proved | 28,702 | | | 58,870 | | | 12,913 | | | 51,426 | |
|
| | | | | | | | | | | |
| As of December 31, 2019 | Oil
(MBbl) | | Natural Gas
(MMcf) | | NGLs
(MBbl) | | Total
(MBOE) |
| Proved developed | 9,933 |
| | 19,146 |
| | 4,060 |
| | 17,183 |
|
| Proved undeveloped | 18,769 |
| | 39,724 |
| | 8,853 |
| | 34,243 |
|
| Total proved | 28,702 |
|
| 58,870 |
| | 12,913 |
| | 51,426 |
|
| | | | | | | | |
| As of December 31, 2018 | Oil
(MBbl) | | Natural Gas
(MMcf) | | NGLs
(MBbl) | | Total
(MBOE) |
| Proved developed | 7,917 |
| | 14,430 |
| | 2,746 |
| | 13,068 |
|
| Proved undeveloped | 24,709 |
| | 48,140 |
| | 8,828 |
| | 41,560 |
|
| Total proved | 32,626 |
| | 62,570 |
| | 11,574 |
| | 54,628 |
|
•Extensions and discoveries. In 2021, extensions and discoveries of 21.9 MMBoe were primarily the result of successful drilling results in the Midland Basin.
•Purchases of mineral in place. In 2021, the Company completed multiple acquisitions that resulted in 60.0 MMBoe in additional reserves, as disclosed above in Note 3. Acquisitions and Divestitures.
•Revision to previous estimates. In 2021, the downward revisions of prior reserves of 4.1 MMBoe consisted of changes in anticipated well densities and changes in performance and other economic factors totaling 9.2 MMBoe and 5.5 MMBoe, respectively, offset by a positive revision of 10.6 MMBoe related to changes in prices.
Notable changes in proved reserves for the year ended December 31, 2020 included the following:
•Extensions and discoveries. In 2020, total extensions and discoveries of 860.0 MBoe were primarily the result of successful drilling results in the Midland Basin.
•Revision to previous estimates. In 2020, the downward revisions of prior reserves of 10.7 MMBoe were composed of negative revisions due to the reclassification of 11.9 MMBoe of reserves from proved undeveloped to non-proved due to the SEC's five-year development rule and negative revisions of 2.7 MMBoe due to changes in price offset by revisions of 3.9 MMBoe related to changes in performance and other economic factors.
Notable changes in proved reserves for the year ended December 31, 2019 included the following:
•Extensions and discoveries.In 2019, total extensions and discoveries of 5.1 MMBOE wasMMBoe were primarily the result of successful drilling results and well performance primarily related toin the Midland Basin.
•Sales of minerals in place. Sales of minerals in place totaled 32.0 MBOEMBoe during 2019, resulting from the disposition of certain non-operated properties in the Midland Basin. See Note 3. Acquisitions and Divestitures.
in the Notes to Consolidated Financial Statements.•Revision to previous estimates. In 2019, the downward revisions of prior reserves of 4.6 MMBOEMMBoe were primarily due to reduced commodity prices.
Notable changes in proved reserves for the year ended December 31, 2018 included the following:
Extensions and discoveries. In 2018, total extensions and discoveries of 16.2 MMBOE was a result of successful drilling results and well performance primarily related to the Midland Basin.
Sales of minerals in place. Sales of minerals in place totaled 6.6 MMBOE during 2018, which consisted of 4.7 MMBOE resulting from the disposition of non-operated properties in the Midland Basin as part of an acreage trade and 1.9 MMBOE related to the disposition of non-operated Eagle Ford properties, both further described in Note 3. Acquisitions and Divestitures.
Purchases of minerals in place. In 2018, total purchases of minerals in place of 6.8 MMBOE were primarily attributable to developed non-producing wells and undeveloped acreage acquired in the Midland Basin as part of an acreage trade, as further described in Note 3. Acquisitions and Divestitures.
Revision to previous estimates. In 2018, the upward revisions of prior reserves of 6.1 MMBOE consisted of improved PUD reserves of 5.8 MMBOE with improved proved developed reserves of 0.3 MMBOE. PUD revisions are a result of the Company’s successful drilling efforts in the Midland Basin as well as improved commodity prices.
For wells classified as proved developed producing where sufficient production history existed, reserves were based on individual well performance evaluation and production decline curve extrapolation techniques. For undeveloped locations and wells that lack sufficient production history, reserves were based on analogy to producing wells within the same area exhibiting similar geologic and reservoir characteristics. Well spacing was determined from drainage patterns derived from a combination of performance-based recoveries and analogous producing wells for each area or field. PUD locations were limited to areas of uniformly high-quality reservoir properties, between existing commercial producers where the reservoir can, with reasonable certainty, be judged to be continuous with existing producers and contain economically producible oil and natural gas on the basis of available geoscience and engineering data.
Changes in PUD reserves for the years ended December 31, 20192021, 2020 and 20182019 were as follows (in MBOEMBoe):
|
| | | | |
Proved undeveloped reserves at December 31, 2017 (1)2018(1) | 60,01575,201 |
|
| Conversions to developed | (4,419(10,254) | ) |
| Extensions and discoveries | 13,7341,230 |
|
Sales of minerals in place | (4,702 | ) |
Purchases of minerals in place | 4,735 |
|
| Revision to previous estimates | 5,838(3,362) |
|
Proved undeveloped reserves at December 31, 2018 (2) | 75,201 |
|
Conversions to developed | (10,254 | ) |
Extensions and discoveries | 1,230 |
|
Revision to previous estimates | (3,362 | ) |
Proved undeveloped reserves at December 31, 2019 (3)(2) | 62,815 |
|
| Conversions to developed | (8,200) | |
| |
(1) | Includes 34,029 MBOE attributable to noncontrolling interests. |
| |
(2)Revision to previous estimates | Includes 41,560 MBOE attributable(14,038) | |
| Proved undeveloped reserves at December 31, 2020 (3) | 40,577 | |
Conversions to noncontrolling interests.developed | (8,274) | |
| Extensions and discoveries | 20,521 | |
| |
(3)Purchases of minerals in place | Includes 34,243 MBOE attributable11,577 | |
Revision to noncontrolling interests.previous estimates | (10,389) | |
| Proved undeveloped reserves at December 31, 2021 (4) | 54,012 | |
2019(1)Includes 41,560 MBoe attributable to noncontrolling interests.
(2)Includes 34,243 MBoe attributable to noncontrolling interests.
(3)Includes 21,737 MBoe attributable to noncontrolling interests.
(4)Includes 21,125 MBoe attributable to noncontrolling interests.
2021 Changes in Proved Undeveloped Reserves
Conversions to developed. In the Company’sCompany's year-end 2020 plan to develop its PUDs within five years, it was estimated that $41.1 million of capital would be expended in 2021 for the conversion of 13 gross / 10.5 net PUDs to add 6.7 MMBoe. In 2021, due to improved commodity prices, the Company spent $55.1 million to convert 16 gross / 13.1 net PUDs adding 8.3 MMBoe to developed.
Revision to previous estimates. Downward revisions of prior reserves of 10.4 MMBoe consisted of changes in anticipated well densities and changes in performance and other economic factors of 9.2 MMBoe and 2.9 MMBoe, respectively, offset by a positive revision of 1.7 MMBoe related to changes in prices.
2020 Changes in Proved Undeveloped Reserves
Conversions to developed. In the Company's year-end 2019 plan to develop its PUDs within five years, the Company estimated that $111.1 million of capital would be expended in 2020 for the conversion of 28 gross / 17.6 net PUDs to add 11.3 MMBoe. In 2020, due to unforeseeable conditions previously described, the Company spent $67.8 million to convert 18 gross / 10.3 net PUDs adding 8.2 MMBoe to developed.
Revision to previous estimates. The Company maintains a five-year development plan, reviewed annually to ensure capital is allocated to the wells that have the highest risk-adjusted rates of return within the Company's inventory of undrilled well locations. In response to lower commodity prices, the Company reduced the pace of activity in its five-year development plan. This resulted in the reclassification of 11.9 MMBoe of reserves from proved undeveloped to non-proved during the year ended December 31, 2020 due to the five-year development rule. Based on the Company's then-current acreage position, strip prices, anticipated well economics, and its development plans at the time these reserves were classified as proved, the Company's management believes the previous classification of these locations as proved undeveloped was appropriate. The remaining revisions of 2.1 MMBoe were primarily due to reduced commodity prices.
2019 Changes in Proved Undeveloped Reserves
Conversions to developed. In the Company's year-end 2018 plan to develop its PUDs within five years, the Company estimated that $103.8 million of capital would be expended in 2019 for the conversion of 30 gross / 12.3 net PUDs to add 9.9 MMBOE,MMBoe, which was consistent with the $111.5 million actually spent to convert 32 gross / 13.4 net PUDs adding 10.3 MMBOEMMBoe to developed.developed reserves.
Extensions and discoveries. Additionally, 1.2 MMBOEMMBoe were added as extensions and discoveries due to successful drilling results on the Company’sCompany's acreage positions because of the wells itthe Company drilled. The increase was also supported by successful drilling results by other operators directly offsetting and in close proximity to the Company’sCompany's acreage.
Revision to previous estimates. Revisions of 3.4 MMBOEMMBoe were primarily due to reduced commodity prices.
2018 Changes in Proved Undeveloped Reserves
Conversions to developed. In the Company’s year-end 2017 plan to develop its PUDs within five years, the Company estimated that $41.5 million of capital would be expended in 2018 for the conversion of 14 gross / 6.2 net PUDs to add 4.3 MMBOE, which was consistent with the $55.4 million actually spent to convert 11 gross / 6.8 net PUDs adding 4.4 MMBOE to developed.
Extensions and discoveries. Additionally, 13.7 MMBOE were added as extensions and discoveries due to successful drilling results on the Company’s acreage positions because of the wells it drilled. The increase was also supported by successful drilling results by other operators directly offsetting and in close proximity to the Company’s acreage. All of these drilling results increased the confidence of the reservoir continuity and performance of the associated reservoirs which increased the number of PUDs primarily in the Midland Basin.
Sales of minerals in place. Sales of minerals in place totaled 4.7 MMBOE during 2018, which consisted of 3.7 MMBOE resulting from the disposition of non-operated properties in the Midland Basin as part of an acreage trade and 1.0 MMBOE related to the disposition of non-operated Eagle Ford properties, both further described in Note 3. Acquisitions and Divestitures.
Purchases of minerals in place. In 2018, purchases of minerals in place of 4.7 MMBOE were attributable to developed non-producing wells and undeveloped acreage acquired in the Midland Basin as part of an acreage trade, as further described in Note 3. Acquisitions and Divestitures.
Revision to previous estimates. Revisions of 5.8 MMBOE were primarily due to the Company’s successful drilling efforts in the Midland Basin as well as improved commodity prices.
Standardized Measure of Discounted Future Net Cash Flows Relating to Proved Oil and Natural Gas Reserves
The following Standardized Measure of Discounted Future Net Cash Flows (Standardized Measure) has been developed utilizing FASB ASC Topic 932, Extractives Activities – Oil and Gas (“ASC 932”) procedures and based on oil and natural gas reserve and production volumes estimated by the Company’s third-party petroleum engineering firm. It can be used for some comparisons, but should not be the only method used to evaluate the Company or its performance. Further, the information in the following
table may not represent realistic assessments of future cash flows, nor should the Standardized Measure be viewed as representative of the current value of the Company.
The Company believes that the following factors should be taken into account when reviewing the following information:
•Future costs and commodity prices will probably differ from those required to be used in these calculations;
•Due to future market conditions and governmental regulations, actual rates of production in future years may vary significantly from the rate of production assumed in the calculations;
•A 10% discount rate may not be reasonable as a measure of the relative risk inherent in realizing future net oil and natural gas revenues; and
•Future net revenues may be subject to different rates of income taxation.
At December 31, 20192021, 2020 and 2018,2019, as specified by the SEC, the prices for oil and natural gas used in this calculation were the unweighted 12-month average of the first day of the month prices, except for volumes subject to fixed price contracts. Prices used to estimate reserves are included in Oil and Natural Gas Reserves above. Future production costs include per-well overhead expenses allowed under joint operating agreements, abandonment costs (net of salvage value), and a non-cancelable fixed cost agreement to reserve pipeline capacity of 10,000 MMBtu per day for gathering and processing. Estimates of future income taxes are computed using current statutory income tax rates including consideration for estimated future statutory depletion and tax credits. The resulting net cash flows are reduced to present value amounts by applying a 10% discount factor.
The Standardized Measure at December 31, 2021, 2020 and 2019 is as follows (in thousands):
| | | | | | | | | | | | | | | | | |
| | December 31, |
| | 2021 | | 2020 | | 2019 |
| Future cash inflows | $ | 6,042,508 | | | $ | 1,902,073 | | | $ | 3,250,868 | |
| Future production costs | (1,641,130) | | | (633,248) | | | (1,027,464) | |
| Future development costs | (470,008) | | | (285,088) | | | (628,692) | |
| Future income tax expense | (381,663) | | | (35,557) | | | (58,824) | |
| Future net cash flows | 3,549,707 | | | 948,180 | | | 1,535,888 | |
| 10% annual discount for estimated timing of cash flows | (1,731,335) | | | (487,327) | | | (746,311) | |
Standardized measure of discounted future net cash flows (1) | $ | 1,818,372 | | | $ | 460,853 | | | $ | 789,577 | |
|
| | | | | | | |
| | December 31, |
| | 2019 | | 2018 |
| Future cash inflows | $ | 3,250,868 |
| | $ | 4,479,757 |
|
| Future production costs | (1,027,464 | ) | | (1,013,131 | ) |
| Future development costs | (628,692 | ) | | (963,536 | ) |
| Future income tax expense | (58,824 | ) | | (90,570 | ) |
| Future net cash flows | 1,535,888 |
| | 2,412,520 |
|
| 10% annual discount for estimated timing of cash flows | (746,311 | ) | | (1,453,068 | ) |
Standardized measure of discounted future net cash flows (1) | $ | 789,577 |
| | $ | 959,452 |
|
| |
(1) | At December 31, 2019 and 2018, the portion of the standardized measure of discounted future net cash flows attributable to noncontrolling interests was $430.4 million and $530.2 million, respectively. |
(1)At December 31, 2021, 2020 and 2019, the portion of the standardized measure of discounted future net cash flows attributable to noncontrolling interests was $711.2 million, $246.9 million and $430.4 million, respectively.
Changes in Standardized Measure of Discounted Future Net Cash Flows Relating to Proved Oil and Natural Gas Reserves
The following is a summary of the changes in the Standardized Measure for the Company’s proved oil and natural gas reserves during each of the years in the two-yearthree-year period ended December 31, 20192021 (in thousands):
| | | | | | | | | | | | | | | | | |
| | December 31, |
| | 2021 | | 2020 | | 2019 |
| Beginning of year | $ | 460,853 | | | $ | 789,577 | | | $ | 959,452 | |
| Sales of oil and gas produced, net of production costs | (343,914) | | | (105,555) | | | (150,708) | |
| Sales of minerals in place | 14 | | | 14 | | | (458) | |
| Net changes in prices and production costs | 1,346,851 | | | (381,769) | | | (565,240) | |
| Extensions, discoveries, and improved recoveries | 216,583 | | | 14,644 | | | 127,182 | |
| Changes in income taxes, net | (185,757) | | | 17,826 | | | 12,697 | |
| Previously estimated development costs incurred during the period | 41,120 | | | 66,788 | | | 210,520 | |
| Net changes in future development costs | (104,223) | | | 258,741 | | | 118,348 | |
| Purchases of minerals in place | 465,187 | | | — | | | — | |
| Revisions of previous quantity estimates | (151,748) | | | (273,781) | | | (35,588) | |
| Accretion of discount | 76,121 | | | 81,999 | | | 107,432 | |
| Changes in timing of estimated cash flows and other | (2,715) | | | (7,631) | | | 5,940 | |
End of year (1) | $ | 1,818,372 | | | $ | 460,853 | | | $ | 789,577 | |
(1)At December 31, 2021, 2020 and 2019, the portion of the standardized measure of discounted future net cash flows attributable to noncontrolling interests was $711.2 million, $246.9 million and $430.4 million, respectively.
|
| | | | | | | |
| | December 31, |
| | 2019 | | 2018 |
| Beginning of year | $ | 959,452 |
| | $ | 592,700 |
|
| Sales of oil and gas produced, net of production costs | (150,708 | ) | | (136,143 | ) |
| Sales of minerals in place | (458 | ) | | (41,320 | ) |
| Net changes in prices and production costs | (565,240 | ) | | 319,486 |
|
| Extensions, discoveries, and improved recoveries | 127,182 |
| | 185,540 |
|
| Changes in income taxes, net | 12,697 |
| | (43,108 | ) |
| Previously estimated development costs incurred during the period | 210,520 |
| | 153,161 |
|
| Net changes in future development costs | 118,348 |
| | (316,765 | ) |
| Purchases of minerals in place | — |
| | 57,013 |
|
| Revisions of previous quantity estimates | (35,588 | ) | | 144,356 |
|
| Accretion of discount | 107,432 |
| | 51,222 |
|
| Changes in timing of estimated cash flows and other | 5,940 |
| | (6,690 | ) |
End of year (1) | $ | 789,577 |
| | $ | 959,452 |
|
| |
(1) | At December 31, 2019 and 2018, the portion of the standardized measure of discounted future net cash flows attributable to noncontrolling interests was $430.4 million and $530.2 million, respectively.
|