Table of Contents
SECURITIES AND EXCHANGE COMMISSION

Amendment No. 1 to
FORM 10-K
10-K/AANNUAL REPORT PURSUANT TO SECTION 13 OR 15(d) OF
THE SECURITIES EXCHANGE ACT OF 1934
For the Fiscal Year Ended December 31, 20162018
Commission File Number 1-5277
(Exact name of Registrant as specified in its charter)
Missouri | | 43-0178130 |
| | |
Missouri | | 43-0178130 |
(State or other jurisdiction of | | (I.R.S. Employer |
incorporation or organization) | | Identification No.) |
One Neenah Center, 4th Floor, P.O. Box 669,2301 Industrial Drive, Neenah, Wisconsin 54957-066954956
(Address of principal executive offices)
Registrant’s telephone number, including area code: (920) 527-5000
Securities registered pursuant to Section 12(b) of the Act:
|
| | |
Title of Each Class |
|
on Which Registered
|
Common Stock, par value $0.10 per share | | New York Stock Exchange |
Securities registered pursuant to section 12(g) of the Act: NoneNone
Indicate by check mark if the Registrant is a well-known seasoned issuer, as defined in Rule 405 of the Securities Act. YES ýx NO o
Indicate by check mark if the Registrant is not required to file reports pursuant to Section 13 or Section 15(d) of the Act. YES o NO xý
Indicate by check mark whether the registrant: (1) has filed all reports required to be filed by Section 13 or 15(d) of the Securities Exchange Act of 1934 during the preceding 12 months (or for such shorter period that the registrant was required to file such reports), and (2) has been subject to such filing requirements for the past 90 days. YES ýx NO o
Indicate by check mark whether the registrant has submitted electronically and posted on its corporate Web site, if any, every Interactive Data File required to be submitted and posted pursuant to Rule 405 of Regulation S-T (§232.405 of this chapter) during the preceding 12 months (or for such shorter period that the registrant was required to submit and post such files). YES ýx NO o
Indicate by check mark if disclosure of delinquent filers pursuant to Item 405 of Regulation S-K (§232.405) is not contained herein, and will not be contained, to the best of the Registrant’s knowledge, in definitive proxy or information statements incorporated by reference in Part III of this Form��Form 10-K or any amendment to this Form 10-K. ýx
Indicate by check mark whether the Registrant is a large accelerated filer, an accelerated filer, a non-accelerated filer, or a smaller reporting company, or an emerging growth company. See the definitions of “large accelerated filer,” “accelerated filer”filer,” “smaller reporting company,” and “smaller reporting“emerging growth company” in Rule 12b-2 of the Exchange Act. (Check one):
|
| | |
Large Accelerated Filer x | | |
| | Smaller Reporting Company o |
(Do not check if a smaller reporting company)Emerging growth company o | | |
If an emerging growth company, indicate by check mark if the registrant has elected not to use the extended transition period for complying with any new or revised financial accounting standards provided pursuant to Section 13(a) of the Exchange Act. o
Indicate by check mark whether the Registrant is a shell company (as defined in Rule 12b-2 of the Act). YES o NO xý
The aggregate market value of the voting and non-voting common equity held by nonaffiliates of the Registrant on
June 30, 2016,29, 2018, based on a closing price of $51.49$42.21 per share as reported on the New York Stock Exchange, was $4,876,642,461.$3,841,516,355.As of
February 15, 2017,13, 2019, the Registrant had 92,450,46891,165,312 shares of Common Stock issued and outstanding.
Documents IncorporatedTable of Contents
EXPLANATORY NOTE
This Amendment No. 1 to Form 10-K/A (the “Amendment”) amends the Annual Report on Form 10-K of Bemis Company, Inc. (the “Company” “our” “us” or “we”) for the year ended December 31, 2018, which was originally filed with the Securities and Exchange Commission (the “SEC”) on February 15, 2019 (the “Original Filing”), and is being filed solely for the purpose of providing certain information required by Reference
Items 10, 11, 12, 13, and 14 of Part III.PortionsThis information was previously omitted from the Original Filing in reliance on General Instruction G(3) to Form 10-K, which permits the information in the above-referenced items to be incorporated in the Form 10-K by reference from our definitive proxy statement if such statement is filed no later than 120 days after our fiscal year end. We are filing this Amendment to include Part III information in our Form 10-K because a definitive proxy statement containing this information will not be filed by us within 120 days after the end of the Proxy Statement - Annual Meetingfiscal year covered by the Form 10-K. The reference on the cover of Shareholders May 4, 2017 -the Original Filing to the incorporation by reference to portions of a definitive proxy statement or amendment to our Form 10-K into Part III of the Original Filing is hereby deleted.
In accordance with Rule 12b-15 under the Securities Exchange Act of 1934, as amended, Part III, Items 10 through 14 of the Original Filing are hereby amended and restated in their entirety, and Part IV, Item 15 of the Original Filing is hereby amended and restated in its entirety, with the only change being the addition of Exhibits 31.3 and 31.4 filed herewith.
Except as specifically set forth herein, this Amendment does not amend or otherwise update any other information in the Original Filing. Accordingly, this Amendment should be read in conjunction with the Original Filing and with our filings with the SEC subsequent to the Original Filing.
ANNUAL REPORT ON FORM 10-K
Forward-Looking Statements
Unless otherwise indicated, references to "Bemis Company," the "Company," "we," "our," and "us" in this Annual Report on Form 10-K refer to Bemis Company, Inc. and its consolidated subsidiaries.
This Annual Report contains certain estimates, predictions, and other “forward-looking statements” (as defined in the Private Securities Litigation Reform Act of 1995, and within the meaning of Section 27A of the Securities Act of 1933, as amended, and Section 21E of the Securities Exchange Act of 1934, as amended). Forward-looking statements are generally identified with the words “believe,” “expect,” “anticipate,” “intend,” “estimate,” “target,” “may,” “will,” “plan,” “project,” “should,” “continue,” “outlook,” “approximately,” “would,” “could,” or the negative thereof or other similar expressions, or discussion of future goals or aspirations, which are predictions of or indicate future events and trends and which do not relate to historical matters. Such statements are based on information available to management as of the time of such statements and relate to, among other things, expectations of the business environment in which we operate, projections of future performance (financial and otherwise), including those of acquired companies, perceived opportunities in the market and statements regarding our strategy and vision. Forward-looking statements involve known and unknown risks, uncertainties, and other factors, which may cause actual results, performance, or achievements to differ materially from anticipated future results, performance or achievements expressed or implied by such forward-looking statements. We undertake no obligation to publicly update or revise any forward-looking statement, whether as a result of new information, future events, or otherwise.
Factors that could cause actual results to differ from those expected include, but are not limited to:
The costs, availability, and terms of acquiring our raw materials (particularly for polymer resins and adhesives), as well as our ability to pass any price changes on to our customers;
Our ability to retain and build upon the relationships and sales of our key customers;
The potential loss of business or increased costs due to customer or vendor consolidation;
The ability of our foreign operations to maintain working efficiencies, as well as properly adjust to continuing changes in global politics, legislation, and economic conditions;
Variances in key exchange rates that could affect the translation of the financial statements of our foreign entities.
Our ability to effectively implement and update our global enterprise resource planning ("ERP") systems;
Our ability to realize the benefits of our acquisitions and divestitures, and whether we are able to properly integrate those businesses we have acquired;
Fluctuations in interest rates and our borrowing costs, along with other key financial variables;
A potential failure in our information technology infrastructure or applications and their ability to protect our key functions from cyber-crime and other malicious content;
Unexpected outcomes in our current and future administrative and litigation proceedings;
Changes in governmental regulations, particularly in the areas of environmental, health and safety matters, fiscal incentives, and foreign investment;
Changes in the competitive conditions within our markets, as well as changes in the demand for our goods;
Our ability to effectively introduce new products into the market and to protect or retain our intellectual property rights;
Changes in our ability to attract and retain high performance employees;
Changes in the value of our goodwill and other intangible assets;
Changes in import and export regulation that could subject us to liability or impair our ability to compete in international markets;
Our ability to manage all costs associated with our pension plan;
Changes in our credit rating; and
A failure to realize the full potential of our restructuring activities.
These and other risks, uncertainties, and assumptions identified from time to time in our filings with the Securities and Exchange Commission, including without limitation, those described under Item 1A "Risk Factors" of this Annual Report on Form 10-K and our quarterly reports on Form 10-Q, could cause actual future results to differ materially from those projected in the forward-looking statements. In addition, actual future results could differ materially from those projected in the forward-looking statements as a result of changes in the assumptions used in making such forward-looking statements.
PART I
ITEM 1 — BUSINESS
Bemis Company, Inc., a Missouri corporation (the “Registrant” or “Company”), continues a business formed in 1858. We were incorporated in 1885 as Bemis Bro. Bag Company with the name changed to Bemis Company, Inc. in 1965. We are a global manufacturer of packaging products.
Our strategic objectives are to accelerate growth, focus innovation, and continuously improve, all focused at delivering strong long-term financial performance. In support of the strategic objectives, our vision is: passionate commitment to the growth and success of our customers will make Bemis the clear choice for inspired packaging solutions.
The majority of our products are sold to customers in the food industry. Other customers include companies in the following types of businesses: chemical, agribusiness, medical, pharmaceutical, personal care, electronics, construction, and other consumer goods. Further information about our operations in our business segments and geographic areas is available in Note 20 to the Consolidated Financial Statements included in Item 8 of this Annual Report on Form 10-K.
As of December 31, 2016, we had approximately 17,500 employees worldwide. Approximately 8,500 of these employees were in the U.S., with approximately 40 percent of the 6,000 hourly production employees covered by collective bargaining agreements involving six different unions. Of the approximately 9,000 employees who were outside the U.S., over half of the hourly production employees and some of the salaried workforce are covered by collective bargaining agreements and are represented by numerous unions.
Working capital fluctuates throughout the year in relation to business volume and other marketplace conditions. We maintain inventory levels that provide a reasonable balance between obtaining raw materials at favorable prices and maintaining adequate inventory levels to enable us to fulfill our commitment to promptly fill customer orders. Manufacturing backlogs are not a significant factor in the industries in which we operate. The business of each of the reportable segments is not seasonal to any significant extent.
We are the owner or licensee of a number of United States and foreign patents and patent applications that relate to certain of our products, manufacturing processes, and equipment. We also have a number of trademarks and trademark registrations in the United States and in foreign countries. Our patents, licenses, and trademarks collectively provide a competitive advantage. However, the loss of any single patent or license alone would not have a material adverse effect on our results as a whole or those of any of our segments.
Our business activities are organized around our two reportable business segments, U.S. Packaging (65 percent of 2016 net sales) and Global Packaging (35 percent). Both internal and external reporting conform to this organizational structure. A summary of our business activities reported by our two reportable business segments follows.
U.S. Packaging Segment
The U.S. Packaging segment represents all food, consumer, and industrial products packaging-related manufacturing operations located in the United States. This segment manufactures multilayer polymer, blown and cast film structures which are then converted to produce packaging for processed and fresh meat, dairy, liquids, frozen foods, cereals, snacks, cheese, coffee, condiments, candy, pet food, bakery, lawn and garden, tissue, fresh produce, personal care and hygiene, disposable diapers, and agribusiness.
Global Packaging Segment
The Global Packaging segment includes all packaging-related manufacturing operations located outside of the United States as well as global medical device and pharmaceutical packaging-related manufacturing operations. This segment manufactures multilayer polymer, blown and cast film structures to produce packaging sold for a variety of food, medical, pharmaceutical, personal care, electronics, and industrial applications. Additional products include injection molded and thermoformed plastic and folding carton packaging. These products include processed and fresh meat, dairy, liquids, snacks, cheese, coffee, condiments, candy, bakery, tissue, fresh produce, personal care and hygiene, disposable diapers, agribusiness, pharmaceutical, and medical devices.
Marketing, Distribution, and Competition
While our sales are made through a variety of distribution channels, substantially all sales are made by our direct sales force. Sales offices and plants are located throughout North America, Latin America, Europe, and Asia-Pacific to provide prompt and economical service to thousands of customers. Our technically trained sales force is supported by product development engineers, design technicians, field service technicians, and a customer service organization.
Sales to the Kraft Heinz Company, and its subsidiaries, accounted for approximately 11 and 12 percent of our sales in 2016 and 2015, respectively. Business arrangements with them and certain large customers require a large portion of the manufacturing capacity at a few individual manufacturing sites. Any change in the business arrangement would typically occur over a period of time, which would allow for an orderly transition for both our manufacturing sites and the customer.
The major markets in which we sell our products are highly competitive. Areas of competition include service, innovation, quality, and price. This competition is significant as to both the size and the number of competing firms. Competitors include Amcor Limited, Berry Plastics Group, Inc., Bryce Corporation, Coveris Holdings S.A., Printpack, Inc., Sealed Air Corporation, Sonoco Products Company, Wipak OY, Winpak Ltd, and a variety of other privately held companies.
We consider ourselves to be a significant participant in the markets in which we serve; however, due to the diversity of our business, our precise competitive position in these markets is not reasonably determinable. Advertising is limited primarily to business and trade publications emphasizing our product features and related technical capabilities.
Raw Materials
Polymer resins and films, paper, inks, adhesives, aluminum, and chemicals constitute the major raw materials used by us. These are purchased from a variety of global industry sources, and we are not significantly dependent on any one supplier for our raw materials. While temporary industry-wide shortages of raw materials may occur, we expect to continue to successfully manage raw material supplies without significant supply interruptions. Currently, raw materials are readily available.
Environmental Matters
Our operations and the real property we own or lease are subject to broad environmental laws and regulations by multiple jurisdictions. These laws and regulations pertain to the discharge of certain materials into the environment, handling and disposition of waste, and cleanup of contaminated soil and ground water as well as various other protections of the environment. We believe that we are in substantial compliance with applicable environmental laws and regulations based on implementation of our Environmental, Health, and Safety Management System and regular audits. However, we cannot predict with certainty that we will not in the future incur liability with respect to noncompliance with environmental laws and regulations due to contamination of sites formerly or currently owned or operated by us (including contamination caused by prior owners and operators of such sites) or the off-site disposal of regulated materials, which could be material. In addition, these laws and regulations are constantly changing and we cannot always anticipate these changes.
See Note 19 to the Consolidated Financial Statements included in Item 8 of this Annual Report on Form 10-K for further information regarding certain environmental matters.
Available Information
We are a large accelerated filer (as defined in Exchange Act Rule 12b-2) and are also an electronic filer. Electronically filed reports (Forms 4, 8-K, 10-K, 10-Q, S-3, S-8, etc.) can be accessed at the Securities and Exchange Commission (SEC) website (http://www.sec.gov) or by visiting the SEC’s Public Reference Room located at 100 F St., N.E., Washington, DC 20549 (call 1-202-551-8090 or 1-800-732-0330 for hours of operation). Electronically filed and furnished reports can also be accessed through our own website (http://www.bemis.com), under Investors/SEC Filings or by writing for free information, including SEC filings, to Investor Relations, Bemis Company, Inc., One Neenah Center, 4th Floor, P.O. Box 669, Neenah, Wisconsin 54957-0669, or calling (920) 527-5000. In addition, our Board Committee charters, Principles of Corporate Governance, and our Code of Conduct can be electronically accessed at our website under About Bemis/Corporate Governance or, free of charge, by writing directly to the Company, Attention: Corporate Secretary. We will post any amendment to, or waiver from, a provision of the Code of Conduct that applies to our principal executive officer, principal financial officer, principal accounting officer, and other persons performing similar functions on the Investor Relations section of our website (www.bemis.com) promptly following the date of such amendment or waiver.
Explanation of Terms Describing the Company’s Products
Aseptic packaging — Packaging used in a flash-heating process in which a food product and its packaging are sterilized separately and then combined and sealed under sterile conditions. This process retains more nutrients and uses less energy than conventional sterilization techniques and extends the shelf life of processed food without using preservatives.
Barrier products — Products that provide protection and extend the shelf life of the package contents. These products provide protection from oxygen, moisture, light, odor, or other environmental factors by combining different types of plastics and additives into a multilayered plastic package.
Cast film — A plastic film that is extruded through a straight slot die as a flat sheet during its manufacturing process.
Coextruded film — A blown or cast film extruded with multiple layers extruded simultaneously.
CSD labels — Carbonated soft drink labels.
Extruded film — A plastic film manufactured by forcing heated resin through a shaped die. This forms a tube of thin plastic film which is then expanded by an internal column of air to produce a continuous ribbon of film.
EZ Open packaging — Package technologies such as peelable closures or laser scoring used to allow the consumer easy access to a packaged product. EZ Open packaging may be combined with reclose features such as plastic zippers to allow for convenient storage of the packaged material once opened.
Film laminate — A multilayer plastic film made by laminating two or more films together with the use of adhesive or a molten plastic to achieve a barrier for the packaged contents.
Flexible pouches — A packaging option that delivers a semi-finished package, instead of rollstock, to a customer for filling product and sealing/closing the package for distribution.
Flexographic printing — The most common flexible packaging printing process using a raised rubber or alternative material image mounted on a printing cylinder.
Forming films — A flexible plastic film that is designed to take the shape determined by a cavity when subjected to heat and vacuum.
Injection molded plastic — Plastic that is created through a manufacturing process where heated plastic is injected into a die or mold.
Multipack — A film manufactured by a modified extrusion process that is used for wrapping and holding multipacks of products such as canned goods and bottles of liquids, replacing corrugate and fiberboard.
Narrow-web rolls — Films that are produced one-across at widths typically less than one meter and can be produced in either tube or roll form depending on the application.
Retort packaging — A multilayer flexible or rigid package able to withstand the thermal processing used for sterilization, similar to the process used for pressure cooking. The food is prepared and sealed in a package and then heated to approximately 250 degrees Fahrenheit under high pressure. This process extends the food product’s shelf life under normal room temperature conditions.
Rigid packaging — A form of packaging in which the shape of the package is retained as its contents are removed. Bottles, trays and clamshell packaging are examples of rigid packaging options.
Rollstock — The principal form in which flexible packaging material is delivered to a customer. Finished film wound on a core is converted in a process at the end user’s plant that forms, fills, and seals the package of product for delivery to customers.
Rotogravure printing — A high quality printing process utilizing a metal engraved cylinder.
Shrink bags/films — An extruded packaging film that is cooled, reheated, and stretched at a temperature near its melting point. The film is made to shrink around a product by an application of thermal treatment, and can be a barrier product if a layer of oxygen barrier material is added.
Specialty film — Plastic films that are produced for non-food applications and are typically used as either secondary packaging
or incorporated into a film structure to impart specific physical and /or performance characteristics.
Sterilization packaging — Packaging materials and preformed packaging systems that support the sterilization process, physical and sterile barrier protection through global distribution, and aseptic operating room presentation of life saving medical devices and technologies.
Thermoformed plastic packaging — A package formed by applying heat to a film to shape it into a tray or cavity and then sealing a flat film on top of the package after it has been filled.
Vacuum skin packaging ("VSP") — Vacuum skin packaging combines the benefits of traditional vacuum packs in terms of shelf life extension and premium second-skin presentation of meats, fish, and ready-made meals. VSP systems include multilayer high barrier top webs and adapted forming webs and trays.
ITEM 1A — RISK FACTORS
The following factors, as well as factors described elsewhere in this Form 10-K, or in other filings by the Company with the Securities and Exchange Commission, could adversely affect the Company’s consolidated financial position, results of operations or cash flows. Other factors not presently known to us or that we presently believe are not material could also affect our business operations and financial results.
Raw materials — Raw material cost increases or shortages could adversely affect our results of operations.
As a manufacturer, our sales and profitability are dependent on the availability and cost of raw materials, which are subject to price fluctuations. Inflationary and other increases in the costs of raw materials have occurred in the past and are expected to recur, and our performance depends in part on our ability to reflect changes in costs in selling prices for our products. We have generally been successful in managing the impact of higher raw material costs by increasing selling prices through our contractual pass-through mechanisms with most of our customers. The disruption of raw materials from certain single-source providers could impact our supply chain. Additionally, natural disasters, such as hurricanes, tornadoes, and fires, may also negatively impact the production or delivery capacity of our raw material suppliers in the chemical and paper industries. This could result in increased raw material costs or supply shortages, which may have a negative impact on our profitability if the cost increases are sustained sequentially over multiple periods or, in the case of a shortage, if we are unable to secure raw materials from alternative sources.
Key customers — The loss of key customers or a significant reduction in sales to those customers could significantly reduce our revenues.
Our customer base includes key (generally large) customers that are important to our success and represent a sizable portion of sales. Our required response to continued marketplace competition could result in lower than expected net pricing of our products. Furthermore, if key customers experience financial pressure, they could request more favorable contractual terms, which could place additional pressure on our margins and cash flows.
Consolidation of customer base — A significant consolidation of our customer base could negatively impact our business.
Many of our largest customers have acquired companies with similar or complementary product lines. This consolidation has increased the concentration of our business with our largest customers. Such consolidation may be accompanied by pressure from customers for lower prices, reflecting the increase in the total volume of products purchased or the elimination of a price differential between the acquiring customer and the company acquired. While we have generally been successful at managing customer consolidations, increased pricing pressures from our customers could have a material adverse effect on results of operations.
Global operations — Changing conditions in the U.S. and foreign countries, may significantly impact our reported results of operations.
We have operations globally. Our revenues and net income may be adversely affected by economic conditions, political situations, and changing laws and regulations, as to which we have no control. Additionally, our operations could be disrupted by geopolitical conditions such as boycotts and sanctions, acts of war, terrorist activity or other similar events. Such events could make it difficult or impossible to manufacture or deliver products to our customers, receive production materials from our suppliers, or perform critical functions, which could adversely affect our business globally or in certain regions. While we maintain similar manufacturing capacities at different locations and coordinate multi source supplier programs on many of our materials which would better enable us to respond to these types of events, we cannot be sure that our plans will fully protect us from all such disruptions. Similarly, more ordinary course disruptions that are directly attributable to the foreign nature of our business, such as flight and shipping delays or cancellations, could also significantly impact business operations.
Restructuring activities — Our restructuring activities and cost saving initiatives may not achieve the results we anticipate.
We have undertaken and may continue to undertake restructuring activities and cost reduction initiatives to optimize our asset base, improve operating efficiencies and generate cost savings. We cannot be certain that we will be able to complete these initiatives as planned or that the estimated operating efficiencies or cost savings from such activities will be fully realized or maintained over time. In addition, we may not be successful in migrating production from one facility to another.
Exchange rates — We have foreign currency conversion and transaction risks that may adversely affect our operating results.
In 2016, approximately 30 percent of our sales were generated by entities operating outside of the United States. Because of this, variations in exchange rates may have a sizable effect on the translation of the financial statements of our foreign entities. Our primary foreign exchange exposure is to the Brazilian Real, but we also have foreign exchange exposure to
the Euro, Argentine Peso, Mexican Peso, British Pound, and other currencies. A strengthening U.S. dollar relative to foreign currencies has a dilutive conversion effect on our financial statements. Conversely, a weakening U.S. dollar has an additive translation effect. In some cases, we sell products denominated in a currency different from the currency in which the related costs are incurred. In short, the volatility of currency exchange rates may impact our operating results.
Implementing our ERP system — We face risks related to the implementation of our global enterprise resource planning system.
We are currently engaged in a multi-year process of conforming the majority of our operations onto one global ERP system. The ERP system is designed to improve the efficiency of our supply chain and financial transaction processes, accurately maintain our books and records, and provide information important to the operation of the business to our management team. The ERP system will continue to require significant investment of human and financial resources, and we may experience significant delays, increased costs and other difficulties as a result. Any significant disruption or deficiency in the design and implementation of the ERP system could adversely affect our ability to fulfill and invoice customer orders, apply cash receipts, place purchase orders with suppliers, and make cash disbursements, and could negatively impact data processing and electronic communications among business locations, which may have a material adverse effect on our business, consolidated financial condition or results of operations. We also face the challenge of supporting our older systems and implementing necessary upgrades to those systems while we implement the new ERP system. While we have invested significant resources in planning and project management, significant implementation issues may arise.
Acquisitions and divestitures — We may not be able to successfully integrate businesses that we acquire or limit ongoing costs associated with the operations we divest.
We have made numerous acquisitions in the past and are regularly considering new acquisitions that we believe will provide meaningful opportunities to grow our business and improve performance in the future. Acquired businesses may not achieve the levels of revenue, profit, productivity, or otherwise perform as we expect. Acquisitions involve special risks, including, without limitation, the potential assumption of unanticipated liabilities and contingencies as well as difficulties in integrating acquired businesses. While we believe that our acquisitions will improve our competitiveness and future financial performance, we can give no assurance that acquisitions will be successful.
We also make strategic divestitures from time to time and we may agree to indemnify acquiring parties for certain liabilities arising from our former businesses which could negatively impact future results.
Interest rates — An increase in interest rates could reduce our reported results of operations.
At December 31, 2016, our variable rate borrowings approximated $828.1 million (which includes $400 million fixed rate notes that have been effectively converted to variable rate debt through the use of a fixed to variable rate interest rate swap). Fluctuations in interest rates can increase borrowing costs and have an adverse impact on results of operations. Accordingly, increases in short-term interest rates will directly impact the amount of interest we pay. For each one percent increase in variable interest rates, our annual interest expense would increase by approximately $8.3 million on the $828.1 million of variable rate debt outstanding as of December 31, 2016.
Information technology — A failure in our information technology systems could negatively affect our business.
We depend on information technology to record and process customers' orders, manufacture and ship products in a timely manner, and maintain the financial accuracy of our business records. Increased global information technology (“IT”) security threats and more sophisticated cyber-crime pose a potential risk to the security and availability of our IT systems, networks, and services, including those that are managed, hosted, provided, or used by third parties, as well as the confidentiality, availability, and integrity of our data. Other malicious activity, such as unauthorized access attempts, phishing, attempts at monetary theft through our IT systems, computer viruses or other malignant codes may also pose a threat to our operations. If the IT systems, networks, or service providers we rely upon fail to function properly, or if we suffer a loss or disclosure of business or other sensitive information, due to any number of causes, ranging from catastrophic events to power outages to security breaches, and our business continuity plans do not effectively and timely address these failures, we may suffer interruptions in our ability to manage operations and reputational, competitive, or business harm, which may adversely affect our business operations or financial condition.
Litigation — Litigation or regulatory developments could adversely affect our business operations and financial performance.
We are, and in the future will become, involved in lawsuits, regulatory inquiries, and governmental and other legal proceedings arising out of the ordinary course of our business. As we expand our global footprint, we become exposed to more uncertainty regarding the regulatory environment. The timing of the final resolutions to lawsuits, regulatory inquiries, and
governmental and other legal proceedings is typically uncertain. Additionally, the possible outcomes of, or resolutions to, these proceedings could include adverse judgments or settlements, either of which could require substantial payments. See “Legal Proceedings" included in Item 3 of this Annual Report on Form 10-K.
Environmental, health, and safety regulations — Changing government regulations in environmental, health, and safety matters may adversely affect our company.
Numerous legislative and regulatory initiatives have been passed and anticipated in response to concerns about Greenhouse Gas emissions and climate change. We are a manufacturing entity that utilizes petrochemical-based raw materials to produce many of our products. Increased environmental legislation or regulation could result in higher costs for us in the form of higher raw materials, as well as energy and freight costs. It is possible that certain materials might cease to be permitted to be used in our processes. We could also incur additional compliance costs for monitoring and reporting emissions and for maintaining permits. Additionally, a sizable portion of our business comes from healthcare packaging and food packaging, both highly regulated markets. If we fail to comply with these regulatory requirements, our results of operations could be adversely impacted.
Changes in market demand and competition — Changes in consumer demand or buying habits for our goods, an increase in substitutions, or significant innovation by our competitors, may adversely affect our business.
Our success depends on our ability to respond timely to changes in customer product needs and market acceptance of our products. We must produce products that meet the quality, performance, and price expectations of our customers. Additionally, because many of our products are used to package consumer goods, our sales and profitability could be negatively impacted by changes in consumer preferences for those underlying products. We also operate in a highly competitive industry. Our response to marketplace competition may result in lower than expected net pricing of our products.
Patents and proprietary technology — Our success is dependent on our ability to develop and successfully introduce new products and to develop, acquire and retain intellectual property rights.
Our success depends in large part on our proprietary technology. We rely on intellectual property rights, including patents, trademarks and trade secrets, as well as confidentiality provisions and licensing arrangements, to establish our proprietary rights. If we are unable to enforce our intellectual property rights, our competitive position may suffer. Our pending patent applications, and our pending trademark registration applications, may not be allowed or competitors may challenge the validity or scope of our patents or trademarks. In addition, our patents, trademarks and other intellectual property rights may not provide us a significant competitive advantage. We may need to spend significant resources monitoring our intellectual property rights. Our competitive position may be harmed if we cannot detect infringement and enforce our intellectual property rights quickly or at all. Competitors might avoid infringement by designing around our intellectual property rights or by developing non-infringing competing technologies. Intellectual property rights and our ability to enforce them may be unavailable or limited in some countries which could make it easier for competitors to capture market share and could result in lost revenues.
Attracting and retaining key personnel — If we are unable to attract and retain key personnel, we may be adversely affected.
Our continued success depends, in large part, on our ability to identify, attract, motivate, train and retain qualified personnel in key functions and geographic areas. Losing the services of key employees in any of our operations could make it difficult to meet our objectives. To effectively manage our global business, we will need to continue to recruit, train, assimilate, motivate and retain employees who actively promote and meet the standards of a high performance culture.
Goodwill and other intangible assets — A significant write-down of goodwill and/or other intangible assets would have a material adverse effect on our reported results of operations and net worth.
We review our goodwill balance for impairment at least once a year using the business valuation methods allowed in accordance with current accounting standards. These methods include the use of a weighted-average cost of capital to calculate the present value of the expected future cash flows of our reporting units. Future changes in the cost of capital, expected cash flows, or other factors may cause our goodwill and/or other intangible assets to be impaired, resulting in a non-cash charge against results of operations to write down these assets for the amount of the impairment. In addition, if we make changes in our business strategy or if external conditions adversely affect our business operations, we may be required to record an impairment charge for goodwill or intangibles, which would lead to decreased assets and reduced net operating results. If a significant write down is required, the charge would have a material adverse effect on our reported results of operations and net worth. We have identified the valuation of intangibles as a critical accounting estimate. See “Management’s Discussion and Analysis of Financial Condition and Results of Operations—Critical Accounting Estimates and Judgments—Intangible assets and goodwill” included in Item 7 of this Annual Report on Form 10-K.
Imports and exports — We are subject to governmental export and import controls that could subject us to liability or impair our ability to compete in international markets.
Certain of our products are subject to export controls and may be exported only with the required export license or through an export license exception. If we were to fail to comply with export licensing, customs regulations, economic sanctions and other laws, we could be subject to substantial civil and criminal penalties, including fines for the Company and incarceration for responsible employees and managers, and the possible loss of export or import privileges. In addition, if our distributors fail to obtain appropriate import, export or re-export licenses or permits, we may also be adversely affected through reputational harm and penalties. Obtaining the necessary export license for a particular sale may be time-consuming and may result in the delay or loss of sales opportunities.
Furthermore, export control laws and economic sanctions prohibit the shipment of certain products to embargoed or sanctioned countries, governments and persons. While we train our employees to comply with these regulations, we cannot assure that a violation will not occur, whether knowingly or inadvertently. Any such shipment could have negative consequences including government investigations, penalties, fines, civil and criminal sanctions, and reputational harm. Any change in export or import regulations, economic sanctions or related legislation, shift in the enforcement or scope of existing regulations, or change in the countries, governments, persons or technologies targeted by such regulations, could result in our decreased ability to export or sell our products to existing or potential customers with international operations. Any limitation on our ability to export or sell our products could adversely affect our business, financial condition and results of operations.
Funded status of pension plans — Recognition of pension liabilities may cause a significant reduction in stockholders’ equity.
In December of 2013, new amendments to our U.S. pension plan for salaried and non-union hourly employees were implemented. These amendments froze all further benefit accruals for all persons entitled to benefits under the plan. While the amendments reduced some risk related to future service costs, there is still risk associated with ongoing liability re-measurement and plan asset valuations. Current accounting standards issued by the Financial Accounting Standards Board ("FASB") require balance sheet recognition of the funded status of our defined benefit pension and postretirement benefit plans. If the fair value of our pension plans’ assets at a future reporting date decreases or if the discount rate used to calculate the projected benefit obligation ("PBO") as of that date decreases, we will be required to record the incremental change in the excess of PBO over the fair value of the assets as a reduction of stockholders’ equity. The resulting non-cash after-tax charge would represent future expense and would be recorded directly as a decrease in the Accumulated Other Comprehensive Income component of stockholders’ equity. While we cannot estimate the future funded status of our pension liability with any certainty at this time, we believe that if the market value of assets or the discount rate used to calculate our pension liability materially decreases, the adjustment could significantly reduce our stockholders’ equity. A significant reduction in stockholders’ equity may impact our compliance with debt covenants or could cause a downgrade in our credit ratings that could also adversely impact our future cost and speed of borrowing and have an adverse effect on our financial condition, results of operations and liquidity. We have identified pension assumptions as a critical accounting estimate. See “Management’s Discussion and Analysis of Financial Condition and Results of Operations — Critical Accounting Estimates and Judgments — Pension costs” and “— Pension assumptions sensitivity analysis” included in Item 7 of this Annual Report on Form 10-K.
Credit rating — A downgrade in our credit rating could increase our borrowing costs and negatively affect our financial condition and results of operations.
In addition to using cash provided by operations, we regularly issue commercial paper to meet our short-term liquidity needs. Our credit ratings are important to our ability to issue commercial paper at favorable rates of interest. A downgrade in our credit rating could increase the cost of borrowing by increasing the spread over prevailing market rates that we pay for our commercial paper or the fees associated with our bank credit facility.
ITEM 1B — UNRESOLVED STAFF COMMENTS
None.
ITEM 2 — PROPERTIES
Properties utilized by us at December 31, 2016, were as follows:
U.S. Packaging Segment
This segment has 27 manufacturing plants located in 13 states, of which 26 are owned directly by us or our subsidiaries and one is leased from an outside party.
Global Packaging Segment
This segment has 32 manufacturing plants located in two states within the U.S., the Commonwealth of Puerto Rico, and eleven other countries, of which 27 are owned directly by us or our subsidiaries and five are leased from outside parties. Initial building lease terms generally provide for minimum terms of five to twenty years and have one or more renewal options.
Corporate and General
We consider our plants and other physical properties to be suitable, adequate, and of sufficient productive capacity to meet the requirements of our business. The manufacturing plants operate at varying levels of utilization depending on the type of operation and market conditions. Our executive offices, which are leased, are located in Neenah, Wisconsin.
ITEM 3 — LEGAL PROCEEDINGS
We are involved in a number of lawsuits incidental to our business, including environmental-related litigation and routine litigation arising in the ordinary course of business. Although it is difficult to predict the ultimate outcome of these cases, we believe, except as discussed below, that any ultimate liability would not have a material adverse effect on the Company’s consolidated financial condition or results of operations.
Environmental Matters
We are a potentially responsible party ("PRP") pursuant to the Comprehensive Environmental Response, Compensation and Liability Act of 1980 (commonly known as “Superfund”) and similar state and foreign laws in proceedings associated with 17 sites around the United States and one in Brazil. These proceedings were instituted by the United States Environmental Protection Agency and certain state and foreign environmental agencies at various times beginning in 1983. Superfund and similar state and foreign laws create liability for investigation and remediation in response to releases of hazardous substances in the environment. Under these statutes, joint and several liability may be imposed on waste generators, site owners and operators, and others regardless of fault. Although these regulations could require us to remove or mitigate the effects on the environment at various sites, perform remediation work at such sites, or pay damages for loss of use and non-use values, we expect our liability in these proceedings to be limited to monetary damages. We expect our future liability relative to these sites to be insignificant, individually and in the aggregate.
We are involved in other environmental-related litigation arising in the ordinary course of business. We accrue environmental costs when it is probable that these costs will be incurred and can be reasonably estimated. Our reserve for environmental liabilities at December 31, 2016 and 2015 was $3.5 million and $5.6 million, respectively.
Brazil Tax Dispute - Goodwill Amortization
During October 2013, Dixie Toga, Ltda ("Dixie Toga") received an income tax assessment in Brazil for the tax years 2009 through 2011 that relates to the amortization of certain goodwill generated from the acquisition of Dixie Toga. The income tax assessed for those years is approximately $11.7 million, translated to U.S. dollars at the December 31, 2016 exchange rate. We expect that tax examinations for years after 2011 will include similar assessments as we continue to claim the tax benefits associated with the goodwill amortization. An ultimate adverse resolution on these assessments, including interest and penalties, could be material to our consolidated results of operations and/or cash flows.
We have been advised by our legal and tax advisors that our position with respect to the deductions is allowable under the tax laws of Brazil. We are contesting the disallowance and believe it is more likely than not the tax benefit will be sustained in its entirety and consequently have not recorded a liability. We intend to litigate the matter if it is not resolved at the administrative appeals levels. The ultimate outcome will not be determined until the Brazilian tax appeal process is complete, which could take several years. At this time, we believe that final resolution of the assessment will not have a material impact on our consolidated financial statements.
Brazil Investigation
On September 18, 2007, the Secretariat of Economic Law, a governmental agency in Brazil, which has now been replaced by the General Superintendence of the Administrative Council for Economic Defense (“CADE”), initiated an investigation into possible anti-competitive practices in the Brazilian flexible packaging industry against a number of Brazilian companies including a Dixie Toga subsidiary. The investigation relates to periods prior to our acquisition of control of Dixie Toga and its subsidiaries.
In late November 2016, the investigative arm of CADE issued an advisory opinion recommending, among other actions, the imposition of fines on Itap Bemis, a Dixie Toga subsidiary. The case will now be sent to the CADE Tribunal, which will decide to either accept or decline the recommendation. We expect that the Tribunal decision will be issued in 2017.
In the event of an adverse decision, it is difficult to predict possible fines, but based on CADE's current fining practice, the fines assessed could be as high as $60 million, depending on CADE’s determination of the applicable revenue base for the calculation of the fine. We intend to vigorously defend our position and plan to appeal any adverse decision by the Tribunal. Upon appeal, we would likely be required to post bond, deposit funds equal to the assessed fines, or provide other collateral. We are unable at this time to predict the outcome of this matter, but believe it is not probable that an adverse judgment would stand after exhausting all appeals which are likely to take several years and therefore no provision has been made in the consolidated financial statements.
ITEM 4 — MINE SAFETY DISCLOSURES
Not applicable.
PART II
ITEM 5 — MARKET FOR REGISTRANT’S COMMON EQUITY,RELATED SHAREHOLDER MATTERS AND ISSUER PURCHASES OF EQUITY SECURITIES
|
| | | | | | | | | | | | | |
| | | (a) | | (b) | | (c) | | (d) |
| Period | | Total Number of Shares Purchased | | Average Price Paid per Share | | Total Number of Shares Purchased as Part of Publicly Announced Plans or Programs | | Maximum Number of Shares That May Yet Be Purchased Under the Plans or Programs |
| January 1-31, 2016 | | 787,231 |
| | $ | 43.89 |
| | 787,231 |
| | 2,570,660 |
|
| February 1-29, 2016 | | 212,769 |
| | 45.88 |
| | 212,769 |
| | 22,357,891 |
|
| August 1-31, 2016 | | 889,700 |
| | 50.90 |
| | 889,700 |
| | 21,468,191 |
|
| September 1-30, 2016 | | 110,300 |
| | 52.34 |
| | 110,300 |
| | 21,357,891 |
|
| November 1-30, 2016 | | 1,000,000 |
| | 48.50 |
| | 1,000,000 |
| | 20,357,891 |
|
| | | | | | | | | |
| | | | | $ | 47.96 |
| | 3,000,000 |
| | 20,357,891 |
|
Our common stock is traded on the New York Stock Exchange under the symbol BMS. On December 31, 2016, there were 3,130 registered holders of record of our common stock. On February 4, 2016, our Board of Directors authorized an additional 20 million shares for repurchase. As of December 31, 2016, under authority granted by the Board of Directors, we have remaining authorization to repurchase an additional 20,357,891 shares of our common stock.
Dividends paid and the high and low common stock prices per share were as follows:
|
| | | | | | | | | | | | | | | | |
| For the Quarterly Periods Ended: | | March 31 | | June 30 | | September 30 | | December 31 |
| | | | | | | | | |
| 2016 | | |
| | |
| | |
| | |
|
| Dividend paid per common share | | $ | 0.29 |
| | $ | 0.29 |
| | $ | 0.29 |
| | $ | 0.29 |
|
| Common stock price per share | | |
| | |
| | |
| | |
|
| High | | 54.19 |
| | 53.88 |
| | 53.32 |
| | 51.44 |
|
| Low | | 42.45 |
| | 47.28 |
| | 49.85 |
| | 47.22 |
|
| | | | | | | | | |
| 2015 | | |
| | |
| | |
| | |
|
| Dividend paid per common share | | 0.28 |
| | 0.28 |
| | 0.28 |
| | 0.28 |
|
| Common stock price per share | | |
| | |
| | |
| | |
|
| High | | 49.44 |
| | 47.65 |
| | 47.51 |
| | 47.59 |
|
| Low | | 43.74 |
| | 43.50 |
| | 38.91 |
| | 39.48 |
|
| | | | | | | | | |
| 2014 | | |
| | |
| | |
| | |
|
| Dividend paid per common share | | 0.27 |
| | 0.27 |
| | 0.27 |
| | 0.27 |
|
| Common stock price per share | | |
| | |
| | |
| | |
|
| High | | 40.99 |
| | 41.58 |
| | 41.02 |
| | 47.20 |
|
| Low | | 37.01 |
| | 39.13 |
| | 37.72 |
| | 34.34 |
|
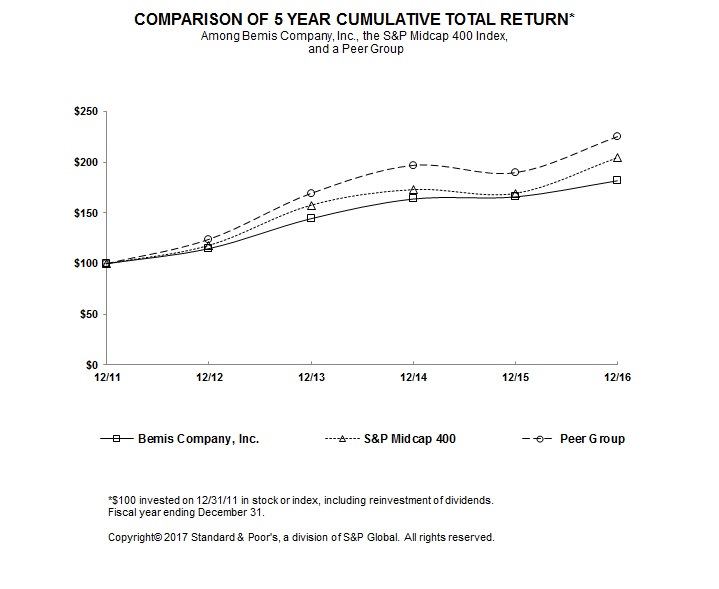
The graph below matches the cumulative 5-Year total return of holders of Bemis Company, Inc.'s common stock with the cumulative total returns of the S&P Midcap 400 index and a customized peer group of twenty one companies, which aligns with the Company's incentive compensation plans, that includes: Albemarle Corp, AptarGroup Inc., Ashland Global Holdings Inc., Avery Dennison Corporation, Ball Corporation, Berry Plastics Group Inc., Crown Holdings Inc., Graphic Packaging Holding Company, Greif Inc., Minerals Technologies Inc., Newmarket Corp, Owens-Illinois Inc., Packaging Corp. of America, Polyone Corp, RPM International Inc., Sealed Air Corporation, Sensient Technologies Corp, Silgan Holdings Inc., Sonoco Products Company, The Valspar Corporation and Westrock Co. The graph assumes that the value of the investment in our common stock, in each index, and in the peer group (including reinvestment of dividends) was $100 on 12/31/2011 and tracks it through 12/31/2016.
|
| | | | | | | | | | | | | | | | | | |
| | | 12/31/11 | | 12/31/12 | | 12/31/13 | | 12/31/14 | | 12/31/15 | | 12/31/16 |
| Bemis Company, Inc. | | 100.00 |
| | 114.83 |
| | 144.32 |
| | 163.68 |
| | 165.77 |
| | 181.62 |
|
| S&P Midcap 400 | | 100.00 |
| | 117.88 |
| | 157.37 |
| | 172.74 |
| | 168.98 |
| | 204.03 |
|
| Peer Group | | 100.00 |
| | 123.97 |
| | 169.27 |
| | 196.92 |
| | 189.73 |
| | 225.27 |
|
The stock price performance included in this graph is not necessarily indicative of future stock price performance.
ITEM 6 — SELECTED FINANCIAL DATA
FIVE-YEAR CONSOLIDATED REVIEW
(dollars in millions, except per share amounts)
|
| | | | | | | | | | | | | | | | | | | | |
| Years Ended December 31, | | 2016 | | 2015 | | 2014 | | 2013 | | 2012 |
| Operating Data | | |
| | |
| | |
| | |
| | |
|
| Net sales | | $ | 4,004.4 |
| | $ | 4,071.4 |
| | $ | 4,343.5 |
| | $ | 4,476.6 |
| | $ | 4,583.6 |
|
| Income from continuing operations | | 236.2 |
| | 241.9 |
| | 239.1 |
| | 192.5 |
| | 148.9 |
|
| | | | | | | | | | | |
| Common Share Data | | |
| | |
| | |
| | |
| | |
|
| Basic earnings per share from continuing operations | | 2.51 |
| | 2.50 |
| | 2.39 |
| | 1.86 |
| | 1.43 |
|
| Diluted earnings per share from continuing operations | | 2.48 |
| | 2.47 |
| | 2.36 |
| | 1.85 |
| | 1.42 |
|
| Dividends per share | | 1.16 |
| | 1.12 |
| | 1.08 |
| | 1.04 |
| | 1.00 |
|
| Book value per share | | 13.59 |
| | 12.70 |
| | 14.59 |
| | 16.53 |
| | 15.88 |
|
| | | | | | | | | | | |
| Weighted-average shares outstanding for computation of diluted earnings per share | | 95.1 |
| | 97.9 |
| | 101.2 |
| | 104.0 |
| | 105.0 |
|
| Common shares outstanding at December 31, | | 92.7 |
| | 95.1 |
| | 98.2 |
| | 101.9 |
| | 103.3 |
|
| | | | | | | | | | | |
| Capital Structure and Other Data | | |
| | |
| | |
| | |
| | |
|
| Current ratio | | 2.0x |
| | 1.9x |
| | 2.7x |
| | 2.5x |
| | 2.4x |
|
| Working capital | | $ | 589.4 |
| | $ | 529.9 |
| | $ | 806.4 |
| | $ | 902.6 |
| | $ | 882.0 |
|
| Total assets | | 3,715.7 |
| | 3,489.8 |
| | 3,610.8 |
| | 4,105.6 |
| | 4,179.8 |
|
| Short-term debt | | 17.3 |
| | 35.4 |
| | 31.3 |
| | 14.9 |
| | 8.9 |
|
| Long-term debt | | 1,527.8 |
| | 1,353.9 |
| | 1,311.6 |
| | 1,416.8 |
| | 1,411.7 |
|
| Total equity | | 1,259.7 |
| | 1,207.4 |
| | 1,433.0 |
| | 1,684.8 |
| | 1,640.9 |
|
| Depreciation and amortization | | 162.1 |
| | 158.1 |
| | 180.6 |
| | 190.3 |
| | 204.3 |
|
| Capital expenditures | | 208.3 |
| | 219.4 |
| | 185.2 |
| | 139.8 |
| | 136.4 |
|
| | | | | | | | | | | |
| Number of common shareholders | | 3,130 |
| | 3,154 |
| | 3,284 |
| | 3,416 |
| | 3,481 |
|
| Number of employees | | 17,678 |
| | 17,696 |
| | 16,944 |
| | 19,106 |
| | 19,564 |
|
ITEM 7 — MANAGEMENT’S DISCUSSION AND ANALYSIS OFFINANCIAL CONDITION AND RESULTS OF OPERATIONS
Management’s Discussion and Analysis
Three Years Ended December 31, 2016
Management’s Discussion and Analysis should be read in conjunction with the Consolidated Financial Statements and related Notes included in Item 8 of this Annual Report on Form 10-K.
Three-year review of results
|
| | | | | | | | | | | | | | | | | | | | | |
| (dollars in millions) | | 2016 | | 2015 | | 2014 |
| Net sales | | $ | 4,004.4 |
| | 100.0 | % | | $ | 4,071.4 |
| | 100.0 | % | | $ | 4,343.5 |
| | 100.0 | % |
| Cost of products sold | | 3,138.2 |
| | 78.4 |
| | 3,198.0 |
| | 78.5 |
| | 3,484.4 |
| | 80.2 |
|
| Gross profit | | 866.2 |
| | 21.6 |
| | 873.4 |
| | 21.5 |
| | 859.1 |
| | 19.8 |
|
| | | | | | | | | | | | | |
| Operating expenses: | | | | | | | | | | | | |
| Selling, general, and administrative expenses | | 392.2 |
| | 9.8 |
| | 420.0 |
| | 10.3 |
| | 416.6 |
| | 9.6 |
|
| Research and development | | 46.5 |
| | 1.2 |
| | 44.1 |
| | 1.1 |
| | 44.1 |
| | 1.0 |
|
| Restructuring and acquisition-related costs | | 28.6 |
| | 0.7 |
| | 12.1 |
| | 0.3 |
| | — |
| | — |
|
| Other operating income | | (10.4 | ) | | (0.3 | ) | | (12.4 | ) | | (0.3 | ) | | (9.3 | ) | | (0.2 | ) |
| Operating income | | 409.3 |
| | 10.2 |
| | 409.6 |
| | 10.1 |
| | 407.7 |
| | 9.4 |
|
| | | | | | | | | | | | | |
| Interest expense | | 60.2 |
| | 1.5 |
| | 51.7 |
| | 1.3 |
| | 60.8 |
| | 1.4 |
|
| Other non-operating income | | (1.8 | ) | | — |
| | (6.0 | ) | | (0.1 | ) | | (16.8 | ) | | (0.4 | ) |
| Income from continuing operations before income taxes | | 350.9 |
| | 8.8 |
| | 363.9 |
| | 8.9 |
| | 363.7 |
| | 8.4 |
|
| | | | | | | | | | | | | |
| Provision for income taxes | | 114.7 |
| | 2.9 |
| | 122.0 |
| | 3.0 |
| | 124.6 |
| | 2.9 |
|
| | | | | | | | | | | | | |
| Income from continuing operations | | 236.2 |
| | 5.9 |
| | 241.9 |
| | 5.9 |
| | 239.1 |
| | 5.5 |
|
| | | | | | | | | | | | | |
| Loss from discontinued operations | | — |
| | — |
| | (2.6 | ) | | (0.1 | ) | | (48.0 | ) | | (1.1 | ) |
| | | | | | | | | | | | | |
| Net income | | $ | 236.2 |
| | 5.9 | % | | $ | 239.3 |
| | 5.9 | % | | $ | 191.1 |
| | 4.4 | % |
| | | | | | | | | | | \ |
| | |
| Effective income tax rate | | |
| | 32.7 | % | | |
| | 33.5 | % | | |
| | 34.3 | % |
| | | | | | | | | | | | | |
| Diluted earnings per share from continuing operations | | $ | 2.48 |
| | | | $ | 2.47 |
| | | | $ | 2.36 |
| | |
Overview
Bemis Company, Inc. is a major supplier of flexible and rigid plastic packaging used by leading food, consumer products, healthcare, and other companies worldwide. Historically, about 80 percent of our total net sales are to customers in the food industry. Sales of our packaging products are widely diversified among food categories and can be found in nearly every aisle of the grocery store. Our emphasis on supplying packaging to the food industry has typically provided a more stable market environment for our U.S. Packaging and Global Packaging business segments.
Market Conditions
The markets into which our products are sold are highly competitive. Our leading market positions in packaging for perishable food and medical device products in many regions reflect our focus on value-added, proprietary products that provide food safety and sterility benefits. We also manufacture products for which our technical know-how and economies of scale offer us a competitive advantage. The primary raw materials for our business segments are polymer resins and films, paper, inks, adhesives, aluminum, and chemicals.
Sales by Geography and Category
|
| | | | | | | | | | | | |
Sales by Geographic Area (in millions) | | 2016 | | 2015 | | 2014 |
| United States | | $ | 2,820.3 |
| | $ | 2,937.8 |
| | $ | 3,040.8 |
|
| Brazil | | 483.5 |
| | 442.5 |
| | 581.5 |
|
| Other Americas | | 244.6 |
| | 273.5 |
| | 273.2 |
|
| Europe | | 263.5 |
| | 233.9 |
| | 258.8 |
|
| Asia-Pacific | | 192.5 |
| | 183.7 |
| | 189.2 |
|
| Total | | $ | 4,004.4 |
| | $ | 4,071.4 |
| | $ | 4,343.5 |
|
The categories specifically disclosed below include those that had historically benefited our profits most, due to their value-added features and functions. The introduction and success of our asset recapitalization program in recent years minimizes the usefulness of analyzing our business by these categories, as our asset recapitalization program allows us to expand margins in all areas of our business as we install new, efficient converting equipment.
The line items labeled "Other" below include a wide variety of packaging solutions for applications such as bakery goods, beverages, confectionery and snack foods, dry foods, frozen foods, lawn and garden products, and others. None of these categories within "Other" are greater than ten percent of the reportable segment's total sales.
|
| | | | | | | | | |
Sales by Category (proportion of sales) | | 2016 | | 2015 | | 2014 |
| U.S. Packaging | | | | | | |
| Meat & Cheese | | 35 | % | | 34 | % | | 33 | % |
| Dairy & Liquid | | 13 | % | | 13 | % | | 12 | % |
| Other | | 52 | % | | 53 | % | | 55 | % |
| Total | | 100 | % | | 100 | % | | 100 | % |
|
| | | | | | | | | |
| Global Packaging | | | | | | |
| Meat & Cheese | | 18 | % | | 19 | % | | 18 | % |
| Dairy & Liquid | | 12 | % | | 14 | % | | 14 | % |
| Healthcare (Medical Device & Pharmaceutical) | | 26 | % | | 26 | % | | 24 | % |
| Other | | 44 | % | | 41 | % | | 44 | % |
| Total | | 100 | % | | 100 | % | | 100 | % |
Sales within the listed categories did not significantly change. During 2015 and 2016, the success of our asset recapitalization program allowed us to pursue business across the breadth of our entire portfolio, in line with our strategy.
Restructuring
To improve efficiencies and reduce fixed costs, we initiated a restructuring program during the second quarter of 2016. As a part of this program, four Latin American facilities within the Global Packaging segment will be closed. Most of the production from these facilities will be transferred to other facilities. As of December 31, 2016, manufacturing operations have ceased at two of these four manufacturing facilities and the remaining closures are expected to be completed in 2017. We expect total project costs of approximately $28 to $30 million, with employee termination costs accounting for $15 to $16 million of the total and the balance in other restructuring costs which include fixed asset accelerated depreciation of approximately $3 million. Cost reductions from the program are expected to reach the full run rate of approximately $16 million annually during 2018. As the economic environment in Latin America continues to challenge consumers, as well as our customers in the region, this consolidation program, in part, helps us offset these headwinds and keeps us on track in achieving our long-term margin targets in the Global Packaging segment.
We recorded $21.6 million of charges associated with the restructuring program during the year ended December 31, 2016. These costs have been recorded on the consolidated statement of income as restructuring and acquisition-related costs. Cash payments in 2016 totaled $8.3 million. Cash payments in 2017 are expected to be approximately $15 million.
Discontinued Operations
On November 7, 2014, we completed the sale of our global Pressure Sensitive Materials business. Proceeds of the transaction totaled $150.5 million. Of the total proceeds, $136.9 was received in fiscal 2014 and $13.6 million was received in April 2015 which related to settlement of customary post-closing adjustments.
The Pressure Sensitive Materials business meets the criteria to be classified as a discontinued operation, which requires retrospective application to certain financial information for all periods presented. Amounts included in the consolidated statement of income have been recast to exclude Pressure Sensitive Materials amounts. The consolidated statement of cash flows for all periods includes both continuing and discontinued operations.
Loss from discontinued operations in 2015 resulted from additional impairment charges, net of tax, reflecting finalization of post-closing adjustments. Loss from discontinued operations in 2014 includes the operating results of the Pressure Sensitive Materials business, goodwill impairment charges, direct transaction costs associated with the divestiture, $25.0 million of plant closure costs associated with our Stow, Ohio facility ($0.16 per share after tax), and the associated income tax effects of these items. The pre-tax $44.7 million ($0.50 per share after tax) non-cash goodwill impairment charge is to reduce net assets held for sale to estimated fair value, less costs to sell.
Acquisitions and Other Divestitures
Acquisition of SteriPack Group
On April 29, 2016, we acquired the medical device packaging operations and related value-added services of SteriPack Group, a global manufacturer of sterile packaging solutions for medical device and pharmaceutical applications. This acquisition includes a facility in Ireland as well as packaging production assets in Malaysia and the U.S. These operations recorded annual net sales of approximately $65 million in fiscal 2015. The cash purchase price was $115.5 million.
Acquisition of Emplal Participacoes S.A.
On December 1, 2015, we acquired the rigid plastic packaging operations of Emplal Participações S.A. ("Emplal"), a privately-owned Brazilian manufacturer of plastic packaging for food and consumer applications. The acquisition supports our growth strategy to expand in markets that fit our strengths and capabilities. The cash purchase price was $66.0 million.
Divestiture of Paper Packaging Division
On March 31, 2014, we completed the sale of our Paper Packaging Division. Annual net sales by this division were approximately $160 million. Net proceeds of the transaction totaled $78.7 million. A $9.3 million pre-tax gain on the sale was recorded as part of other non-operating income during 2014.
Results of Operations
Consolidated Overview — Continuing Operations
|
| | | | | | | | | | | | |
| (in millions, except per share amounts) | | 2016 | | 2015 | | 2014 |
| Net sales | | $ | 4,004.4 |
| | $ | 4,071.4 |
| | $ | 4,343.5 |
|
| Income from continuing operations | | 236.2 |
| | 241.9 |
| | 239.1 |
|
| Diluted earnings per share from continuing operations | | 2.48 |
| | 2.47 |
| | 2.36 |
|
2016 versus 2015
Net sales for the year ended December 31, 2016 decreased 1.6 percent from the same period of 2015. The impact of currency translation reduced net sales by 3.5 percent. The Emplal Participações S.A. and SteriPack acquisitions increased net sales by 2.4 percent in the current year.
Diluted earnings per share from continuing operations for the year ended December 31, 2016 were $2.48 compared to $2.47 reported in the same period of 2015. Results for 2016 included a $0.16 per share charge for restructuring costs related primarily to planned plant closures and related severance in Latin America. Results also included a $0.07 per share charge for acquisition-related costs comprised primarily of costs associated with the Emplal Participações S.A. and SteriPack acquisitions. These costs were recorded both in operating income and interest expense. A $0.02 per share gain on the sale of land and building was also recorded in 2016. The net impact of currency translation decreased operating profit during 2016 by approximately $0.06 of total Company earnings per share. Results for 2015 included a $0.05 charge from a healthcare packaging plant closure and a $0.03 charge for acquisition-related costs comprised of direct acquisition costs associated with the Emplal Participações S.A. acquisition and charges related to contingent liabilities associated with a prior acquisition.
2015 versus 2014
Net sales for the year ended December 31, 2015 decreased 6.3 percent from the same period of 2014. Currency translation reduced net sales by 6.2 percent. The divestiture of the Paper Packaging Division in 2014 reduced sales by 0.9 percent. The acquisition of Emplal Participações S.A. in 2015 increased net sales by 0.1 percent in 2015. The remaining 0.7 percent increase in net sales represents a net benefit of increased selling prices and sales mix partially offset by an approximate 1 percent net sales reduction from lower volume.
Diluted earnings per share from continuing operations for the year ended December 31, 2015 were $2.47 compared to $2.36 reported in the same period of 2014. Results for 2015 included a $0.05 charge from a healthcare packaging plant closure and a $0.03 charge for acquisition-related costs comprised of direct acquisition costs associated with the Emplal Participações S.A. acquisition and charges related to contingent liabilities associated with a prior acquisition. The net impact of currency translation decreased earnings per share during 2015 by approximately $0.16 of total Company earnings per share. Results for 2014 included a $0.06 gain on the sale of the Paper Packaging Division.
U.S. Packaging Business Segment
Our U.S. Packaging segment represents all food, consumer, and industrial products packaging-related manufacturing operations located in the United States. Our U.S. Packaging business segment provides packaging for a variety of applications used in packaging meat and cheese, dairy and liquids, confectionery and snack foods, frozen foods, lawn and garden products, health and hygiene products, beverages, bakery goods, and dry foods.
|
| | | | | | | | | | | | |
| (dollars in millions) | | 2016 | | 2015 | | 2014 |
| Net sales | | $ | 2,621.1 |
| | $ | 2,747.5 |
| | $ | 2,860.7 |
|
| Operating profit | | 400.0 |
| | 391.8 |
| | 375.8 |
|
| Operating profit as a percentage of net sales | | 15.3 | % | | 14.3 | % | | 13.1 | % |
2016 versus 2015
U.S. Packaging net sales of $2.6 billion for the full year 2016 represented a decrease of 4.6 percent compared to the same period of 2015. Compared to the prior year, unit volumes were up nearly one percent. The decrease in net sales was driven by the contractual pass through of lower raw material costs as well as the mix of products sold, which reflects the success of our asset recapitalization program.
Operating profit increased to $400.0 million for the full year 2016, or 15.3 percent of net sales, compared to $391.8 million, or 14.3 percent of net sales, in 2015. This margin increase primarily reflects continued operational improvements attributable to manufacturing efficiencies from our asset recapitalization program.
2015 versus 2014
U.S. Packaging net sales decreased 4.0 percent in the year ended December 31, 2015 compared to the same period of 2014. The first quarter 2014 divestiture of the Paper Packaging Division reduced sales by 1.3 percent. Excluding the impact of divestitures, net sales would have decreased by 2.7 percent. Unit volumes declined by approximately 2 percent for the full year. The remaining change in net sales was driven by the contractual pass through of lower raw material costs throughout the year, partially offset by favorable sales mix.
Operating profit increased to $391.8 million in 2015, or 14.3 percent of net sales, compared to $375.8 million, or 13.1 percent of net sales in 2014. This margin improvement reflects sales mix benefits, driven by our focus on innovation, as well as continued operational improvements, primarily attributable to our asset recapitalization program.
Global Packaging Business Segment
Our Global Packaging business segment includes all of our packaging-related manufacturing operations located outside of the United States as well as our global medical device and pharmaceutical packaging manufacturing operations. Our Global Packaging business segment provides packaging to a variety of applications used in packaging meat and cheese, dairy and liquids, confectionery and snack foods, frozen foods, lawn and garden products, health and hygiene products, beverages, medical and pharmaceutical products, bakery goods, and dry foods. In the fourth quarter of 2016, the table below was recasted to more clearly reflect that operating segment performance is evaluated based on operating profit before restructuring and acquisition-related costs.
|
| | | | | | | | | | | | |
| (dollars in millions) | | 2016 | | 2015 | | 2014 |
| Net sales | | $ | 1,383.3 |
| | $ | 1,323.9 |
| | $ | 1,482.8 |
|
| Operating profit | | 114.0 |
| | 116.5 |
| | 113.3 |
|
| Operating profit as a percentage of net sales | | 8.2 | % | | 8.8 | % | | 7.6 | % |
2016 versus 2015
Global Packaging net sales for the full year 2016 of $1.4 billion represent an increase of 4.5 percent compared to the same period in 2015. Currency translation reduced net sales by 10.7 percent. Acquisitions increased net sales by 7.3 percent. Excluding the impact of currency translation and acquisitions, net sales would have increased by 7.9 percent, primarily reflecting increased selling prices along with increased unit volumes of approximately 1 percent.
Operating profit for the full year 2016 was $114.0 million, compared to $116.5 million, for the same period in 2015. The net impact of currency translation decreased operating profit during the year by $8.3 million as compared to the prior year, or approximately $0.06 of total Company earnings per share, primarily due to currencies in Latin America. Operating profit during the year reflects the positive impact of selling prices and mix, partially offset by approximately $15 million of operational inefficiencies at one of our healthcare packaging facilities throughout the year and in Latin America during the first quarter.
2015 versus 2014
Global Packaging net sales of $1.3 billion for 2015 represent a decrease of 10.7 percent compared to 2014. Currency translation reduced net sales by 18.2 percent, primarily due to currencies in Latin America. The December 2015 acquisition of Emplal Participações S. A. increased full year net sales by 0.3 percent. Excluding the impact of currency translation and the acquisition, net sales would have increased by 7.2 percent, fully driven by positive sales price and mix.
Operating profit was $116.5 million in 2015, or 8.8 percent of net sales, compared to $113.3 million, or 7.6 percent of net sales in 2014. The net impact of currency translation reduced operating profit during 2015 by $24.0 million as compared to the prior year, or approximately $0.16 of total Company earnings per share, primarily due to currencies in Latin America. Margin improvement in the Global Packaging segment reflects strong operating performance and the overall favorable impact of increased sales of sophisticated, value-added packaging.
Consolidated Gross Profit
|
| | | | | | | | | | | | |
| (dollars in millions) | | 2016 | | 2015 | | 2014 |
| Gross profit | | $ | 866.2 |
| | $ | 873.4 |
| | $ | 859.1 |
|
| Gross profit as a percentage of net sales | | 21.6 | % | | 21.5 | % | | 19.8 | % |
Gross profit in 2016 and 2015 reflects the benefits of improvements in selling prices and mix and operational efficiencies.
Consolidated Selling, General, and Administrative Expenses
|
| | | | | | | | | | | | |
| (dollars in millions) | | 2016 | | 2015 | | 2014 |
| Selling, general, and administrative expenses (SG&A) | | $ | 392.2 |
| | $ | 420.0 |
| | $ | 416.6 |
|
| SG&A as a percentage of net sales | | 9.8 | % | | 10.3 | % | | 9.6 | % |
Selling, general, and administrative expenses ("SG&A") declined in 2016 due primarily to our pay-for-performance practices, along with currency and strong cost controls.
SG&A expenses as a percent of sales increased in 2015 primarily due to sales declines related to the impact of contractual pass through associated with lower raw material prices.
Research and Development (R&D)
|
| | | | | | | | | | | | |
| (dollars in millions) | | 2016 | | 2015 | | 2014 |
| Research and development (R&D) | | $ | 46.5 |
| | $ | 44.1 |
| | $ | 44.1 |
|
| R&D as a percentage of net sales | | 1.2 | % | | 1.1 | % | | 1.0 | % |
R&D expenses were consistent during the periods presented and reflect our continued investment in research and development projects that are expected to create long-term growth opportunities.
Other Operating Income
|
| | | | | | | | | | | | |
| (dollars in millions) | | 2016 | | 2015 | | 2014 |
| Other operating income | | $ | (10.4 | ) | | $ | (12.4 | ) | | $ | (9.3 | ) |
Other operating income includes fiscal incentives, income of unconsolidated affiliates and foreign currency transactional gains and losses. Fiscal incentives are the largest component ($9.9 million in 2016) and are associated with net sales in South America and are included in Global Packaging segment operating profit.
Interest Expense
|
| | | | | | | | | | | | |
| (dollars in millions) | | 2016 | | 2015 | | 2014 |
| Interest expense | | $ | 60.2 |
| | $ | 51.7 |
| | $ | 60.8 |
|
| Effective interest rate | | 4.1 | % | | 3.8 | % | | 4.4 | % |
Interest expense in 2016 increased primarily as a result of higher debt balances due to recent acquisitions and higher interest rates on commercial paper and other variable-rate debt. The increase was also a result of new notes that were issued in September 2016 and $0.9 million of fees paid in 2016 to extinguish portions of the debt assumed related to the Emplal Participações S.A. acquisition. Interest expense in 2015 declined primarily as a result of refinancing bonds that matured August 1, 2014 with lower cost variable rate debt.
Other Non-operating Income
|
| | | | | | | | | | | | |
| (dollars in millions) | | 2016 | | 2015 | | 2014 |
| Other non-operating income | | $ | (1.8 | ) | | $ | (6.0 | ) | | $ | (16.8 | ) |
In 2016 we recorded interest income of $2.5 million and foreign exchange losses of $0.7 million.
In 2015 we recorded a $2.2 million pre-tax gain on the sale of land and $3.8 million of interest income.
In 2014 we recorded a $9.3 million pre-tax gain related to the sale of our Paper Packaging Division and $7.6 million of interest income.
Income Taxes
|
| | | | | | | | | | | | |
| (dollars in millions) | | 2016 | | 2015 | | 2014 |
| Income taxes | | $ | 114.7 |
| | $ | 122.0 |
| | $ | 124.6 |
|
| Effective tax rate | | 32.7 | % | | 33.5 | % | | 34.3 | % |
Other than the differences noted below, the difference between our overall tax rate and the U.S. statutory rate of 35 percent in each of the three years presented principally relates to state and local income taxes, net of federal income tax benefits, and the differences between tax rates in the various foreign jurisdictions in which we operate.
Our overall tax expense is primarily driven by our operations within the jurisdictions of the United States and Brazil. Our foreign tax rate differential is largely the result of lower statutory rates in the jurisdictions of our European operations as well as generally lower statutory rates in the remainder of our foreign operating jurisdictions.
The reduction in the effective tax rate to 32.7 percent in 2016 from 33.5 percent for 2015 and 34.3 percent in 2014, is primarily due to differences in the geographic mix of income and the realization of unrecognized tax benefits.
Liquidity and Capital Resources
Net Debt to Total Capitalization
Net debt to total capitalization (which includes total debt net of cash balances divided by total debt net of cash balances plus equity) was 53.9 percent at December 31, 2016, compared to 52.4 percent at December 31, 2015. Total debt as of December 31, 2016 and 2015 was approximately $1.5 billion and $1.4 billion, respectively.
Credit Rating
Our capital structure and financial practices have earned us investment grade credit ratings from two nationally recognized credit rating agencies. These credit ratings are important to our ability to issue commercial paper at favorable rates of interest.
Cash Flow
Net cash provided by operations totaled $437.4 million for the year ended December 31, 2016, compared to $552.4 million in 2015 and $248.1 million in 2014. Operating cash flow in 2015 reflects the initial benefits of programs implemented to drive improvements in working capital. Lower operating cash flow in 2014 reflects high levels of working capital associated with sales growth initiatives. Net cash provided by operations was reduced by income tax payments of $93.1 million, $84.7 million and $134.8 million during 2016, 2015, and 2014, respectively. Net cash provided by operations was reduced by contributions to our defined benefit pension plans of $20.7 million, $2.9 million and $10.8 million during 2016, 2015, and 2014, respectively. Cash payments related to restructuring were $12.2 million, $0.4 million, and $20.8 million in 2016, 2015, and 2014, respectively.
Net cash used in investing activities totaled $311.2 million for the year ended December 31, 2016 compared to cash used in investing activities in 2015 totaling $262.6 million and cash provided by investing activities in 2014 totaling $40.5 million. Capital expenditures totaled $208.3 million, $219.4 million, and $185.2 million for the full year 2016, 2015, and 2014, respectively, reflecting continued investment in new capacity to support growth initiatives and productivity improvements.
Cash used for acquisitions totaled $114.5 million for 2016, primarily related to our SteriPack acquisition and $66.4 million for 2015, primarily related to our Emplal acquisition. In 2016, we received approximately $10.1 million as net proceeds from the sales of land and buildings in Brazil and Mexico related to a previous restructuring program. The cash proceeds from divesting our Pressure Sensitive Materials business and Paper Packaging Division more than offset increased capital expenditure spending in 2014.
Net cash used in financing activities for the years ended December 31, 2016, 2015, and 2014 included share repurchases of $143.9 million, $150.1 million, and $152.1 million, respectively. Net change in total debt was borrowings of $157.1 million, borrowings of $3.7 million, and repayments of $102.9 million for 2016, 2015, and 2014, respectively.
Available Financing
In addition to using cash provided by operations, we issue commercial paper to meet our short-term liquidity needs. At year-end, our commercial paper debt outstanding was $221.3 million. Based on our current credit rating, we enjoy ready access to the commercial paper markets.
On July 22, 2016, we amended our revolving credit facility of $1.1 billion extending the term of the agreement from August 12, 2018 to July 22, 2021. Our revolving credit facility is supported by a group of major U.S. and international banks. Covenants imposed by the revolving credit facility include minimum net worth calculations and a maximum ratio of debt to total capitalization. The revolving credit agreement includes a $100 million multicurrency limit to support the financing needs of our international subsidiaries. As of December 31, 2016, there was $221.3 million of debt outstanding supported by this credit facility, leaving $878.7 million of available credit. If we were not able to issue commercial paper, we would expect to meet our financial liquidity needs by accessing the bank market, which would increase our borrowing costs. Borrowings under the credit agreement are subject to a variable interest rate.
On September 15, 2016, we issued $300 million aggregate principal amount of senior notes due in 2026 with a fixed interest rate of 3.1 percent. The proceeds were used to repay outstanding commercial paper and for general corporate purposes. Public notes totaling $400 million matured in August 2014. On July 15, 2014, we amended our revolving credit facility to provide for a $200 million term loan. This term loan has an eight-year term and a variable interest rate based on the one-month London Interbank Offered Rate (LIBOR) plus a fixed spread. We used this term loan combined with commercial paper borrowings to refinance the $400 million public notes which matured in August 2014.
Liquidity Outlook
As of December 31, 2016, cash and cash equivalents outside of the United States was $69.5 million. We use a notional pooling arrangement with an international bank to help manage global liquidity requirements. Under this pooling arrangement, our participating subsidiaries maintain either a cash deposit or borrowing position through local currency accounts with the bank, so long as the aggregate position of the global pool is a notionally calculated net cash deposit. This notional pooling arrangement allows reasonable access to our cash in foreign subsidiaries, and provides a financing option to foreign subsidiaries beyond our multi-currency credit facility.
Management expects cash flow from operations and available liquidity described above to be sufficient to support operations going forward. There can be no assurance, however, that the cost or availability of future borrowings will not be impacted by future capital market disruptions. In addition, increases in raw material costs would increase our short term liquidity needs.
Capital Expenditures
Capital expenditures were $208.3 million during 2016, compared to $219.4 million in 2015, and $185.2 million in 2014. We expect capital expenditures for 2017 of approximately $200 million to support productivity and efficiency projects as well as growth projects. We expect to fund 2017 capital expenditures with cash provided by operating activities.
Dividends
We increased our quarterly cash dividend by 3.6 percent during the first quarter of 2016 to $0.29 per share from $0.28 per share. This follows increases of 3.7 percent in 2015 and 3.8 percent in 2014. In February 2017, the Board of Directors approved the 34th consecutive annual increase in the quarterly cash dividend on common stock to $0.30 per share, a 3.4 percent increase.
Share Repurchases
On February 4, 2016, our Board of Directors authorized an additional 20 million shares for repurchase. We purchased 3.0 million, 3.3 million, and 3.8 million shares of our common stock in the open market during 2016, 2015 and 2014, respectively. As of December 31, 2016, a total of 20.4 million shares remained available on our authorizations to purchase common stock for the treasury.
Contractual Obligations
The following table provides a summary of contractual obligations including our debt payment obligations, operating lease obligations, and certain other purchase obligations as of December 31, 2016. Obligations under capital leases are insignificant.
|
| | | | | | | | | | | | | | | | | | | | | | | | | | | | |
| | | Contractual Payments Due by Period |
| (in millions) | | Total | | 2017 | | 2018 | | 2019 | | 2020 | | 2021 | | Thereafter |
| Long-term debt obligations (1) | | $ | 1,533.9 |
| | $ | — |
| | $ | 1.7 |
| | $ | 403.7 |
| | $ | 1.7 |
| | $ | 623.0 |
| | $ | 503.8 |
|
| Interest expense (2) | | 306.3 |
| | 60.3 |
| | 64.5 |
| | 55.6 |
| | 41.8 |
| | 36.3 |
| | 47.8 |
|
| Operating leases (3) | | 64.7 |
| | 9.9 |
| | 8.1 |
| | 6.4 |
| | 5.1 |
| | 4.9 |
| | 30.3 |
|
| Purchase obligations (4) | | 706.2 |
| | 676.1 |
| | 17.1 |
| | 9.0 |
| | 2.2 |
| | 1.1 |
| | 0.7 |
|
| Postretirement obligations (5) | | 32.9 |
| | 3.4 |
| | 1.7 |
| | 3.5 |
| | 2.6 |
| | 2.5 |
| | 19.2 |
|
| Total | | $ | 2,644.0 |
| | $ | 749.7 |
| | $ | 93.1 |
| | $ | 478.2 |
| | $ | 53.4 |
| | $ | 667.8 |
| | $ | 601.8 |
|
| 34 |
(1) | Long-term debt maturing in 2017 is $221.3 million. These amounts have been classified as long-term liabilities in accordance with the Company’s ability and intent to refinance such obligations on a long-term basis. This debt is commercial paper backed by a bank credit facility that expires on July 22, 2021. See Note 14 to the Consolidated Financial Statements for additional information about our long term debt.Signatures | 37 |
| |
(2) | A portion of the interest expense disclosed is subject to variable interest rates. The amounts disclosed above that relate to commercial paper, the term loan, and the interest rate swap were calculated using forward-looking rates. All other amounts assume that future variable interest rates are equal to rates at December 31, 2016. |
| |
(3) | We enter into operating leases in the normal course of business. Substantially all lease agreements have fixed payment terms based on the passage of time. Some lease agreements provide us with the option to renew the lease. Our future operating lease obligations would change if we exercised these renewal options and if we entered into additional operating lease agreements. |
| |
(4) | Purchase obligations represent contracts or commitments for the purchase of raw materials, utilities, capital equipment and various other goods and services. |
| |
(5) | Postretirement obligations represent contracts or commitments for postretirement healthcare benefits and benefit payments for the unfunded Bemis Supplemental Retirement Plan. See Note 11 to the Consolidated Financial Statements for additional information about our postretirement benefit obligations. Postretirement obligations due in 2017 have been recorded in other current liabilities. |
We also have long-term obligations related to our income tax liabilities associated with uncertain tax positions, environmental liabilities, and pension defined benefit plans. These liabilities have been excluded from the table above due to the high degree of uncertainty as to amounts and timing regarding future payments. See Consolidated Financial Statements and related Notes.
Market Risks and Foreign Currency Exposures
We enter into contractual arrangements (derivatives) in the ordinary course of business to manage foreign currency exposure and interest rate risks. We do not enter into derivative transactions for speculative trading purposes. Our use of derivative instruments is subject to internal policies that provide guidelines for control, counterparty risk, and ongoing reporting. These derivative instruments are designed to reduce the income statement volatility associated with movement in foreign exchange rates and to achieve greater exposure to variable interest rates.
A portion of the interest expense on our outstanding debt is subject to short-term interest rates. As such, increases in short-term interest rates will directly impact the amount of interest we pay. For each one percent increase in variable interest
rates, the annual interest expense on $828.1 million of variable rate debt outstanding (which includes $400 million fixed rate notes that have been effectively converted to variable rate debt through the use of a fixed to variable rate interest rate swap) would increase by approximately $8.3 million.
We enter into interest-rate swap contracts to economically convert a portion of our fixed-rate debt to variable rate debt. During the fourth quarter of 2011, we entered into four interest rate swap agreements with a total notional amount of $400 million. These contracts were designated as hedges of our $400 million 4.50 percent fixed-rate debt due in 2021. The variable rate for each of the interest rate swaps is based on the six-month London Interbank Offered Rate (LIBOR), set in arrears, plus a fixed spread. The variable rates are reset semi-annually at each net settlement date. The net settlement benefit to us, which is recorded as a reduction in interest expense, was $4.7 million, $7.2 million, and $8.2 million in 2016, 2015, and 2014, respectively. At December 31, 2016 and 2015, the fair value of these interest rate swaps was $1.3 million and $5.2 million in our favor, respectively, using discounted cash flow or other appropriate methodologies. Asset positions are included in deferred charges and other assets with a corresponding increase in long-term debt. Liability positions are included in other liabilities and deferred credits with a corresponding decrease in long-term debt.
Our international operations enter into forward foreign currency exchange contracts to manage foreign currency exchange rate exposures associated with certain foreign currency denominated receivables and payables. At December 31, 2016 and 2015, we had outstanding forward exchange contracts with notional amounts aggregating $4.1 million and $3.8 million, respectively. Forward exchange contracts generally have maturities of less than six months. Counterparties to the forward exchange contracts are major financial institutions. Credit loss from counterparty nonperformance is not anticipated. We have not designated these derivative instruments as hedging instruments. The net settlement amount (fair value) related to the active forward foreign currency exchange contracts is recorded on the balance sheet within current assets or current liabilities and as an element of other operating income which offsets the related transactions gains and losses on the related foreign denominated asset or liability. Amounts recognized in income related to forward exchange contracts were $0.8 million of expense and $0.7 million of income in the years ended December 31, 2016 and 2015, respectively.
Critical Accounting Estimates and Judgments
Our discussion and analysis of our financial condition and results of operations is based on our consolidated financial statements, which have been prepared in accordance with GAAP. The preparation of these financial statements requires us to make estimates and assumptions that affect the reported amounts of assets and liabilities and the disclosure of contingent assets and liabilities at the date of the financial statements and the reported amounts of expenses during the reporting period. On an ongoing basis, management evaluates its estimates and judgments, including those related to retirement benefits, intangible assets, goodwill, and expected future performance of operations. Our estimates and judgments are based on historical experience and on various other factors that are believed to be reasonable under the circumstances. Actual results may differ from these estimates under different assumptions or conditions.
We believe the following are critical accounting estimates used in the preparation of our consolidated financial statements.
•The calculation of annual pension costs and related assets and liabilities; and
•The valuation of intangible assets and goodwill.
Pension costs
We recognize amounts in our financial statements related to our defined benefit pension plans which are frozen for the majority of participants on an actuarial basis. The accounting for our pension plans requires us to recognize the overfunded or underfunded status of the pension plans on our balance sheet. A substantial portion of our pension amounts relate to our defined benefit plans in the United States. Net periodic pension cost recorded in 2016 was $10.4 million, compared to pension cost of $10.9 million in 2015 and $9.4 million in 2014. We expect pension expense before the effect of income taxes for 2017 to be approximately $5 million.
One element used in determining annual pension income and expense in accordance with accounting rules is the expected return on plan assets. Beginning in 2013, we adopted a liability responsive asset allocation policy that becomes more conservative as the funded status of the plans improve. The majority of pension plan assets relate to U.S. plans and the target allocation is currently to invest approximately 65 percent in long-term corporate fixed income securities and approximately 35 percent in return seeking funds.
To develop the expected long-term rate of return on assets assumption, we considered compound historical returns and future expectations based on our target asset allocation. For the historical long-term investment periods of 10, 15, 20 and 25
years ending December 31, 2016, our U.S. pension plan assets earned annualized rates of return of 6.0 percent, 5.7 percent, 7.2 percent, and 7.9 percent, respectively. Using our U.S. target asset allocation of plan assets, our outside actuaries have used their independent economic models to calculate a range of expected long-term rates of return and, based on their results, we have determined our U.S. asset return assumptions to be reasonable.
This assumed long-term rate of return on assets is applied to a calculated value of plan assets, which recognizes changes in the fair value of plan assets in a systematic manner over approximately three years. This process calculates the expected return on plan assets that is included in pension income or expense. The difference between this expected return and the actual return on plan assets is generally deferred and recognized over subsequent periods. The net deferral of asset gains and losses affects the calculated value of pension plan assets and, ultimately, future pension income and expense.
At the end of each year, we determine the discount rate to be used to calculate the present value of pension plan liabilities. This discount rate is an estimate of the current interest rate at which the pension liabilities could be effectively settled at the end of the year. In estimating this rate, we look to changes in rates of return on high quality, fixed income investments that receive one of the two highest ratings given by a recognized ratings agency. At December 31, 2016, for our U.S. defined benefit pension plans we determined this rate to be 4.25 percent, no change from the rate used at December 31, 2015.
For our non-U.S. pension plans, we follow similar methodologies in determining the appropriate expected rates of return on assets and discount rates to be used in our actuarial calculations in each individual country.
U.S. Pension assumptions sensitivity analysis
The following charts depict the sensitivity of estimated 2017 pension expense to incremental changes in the discount rate and the expected long-term rate of return on assets.
|
| | | | | | | | | | |
| Discount rate | | Total increase (decrease) to pension expense from current assumption (in millions) | | Rate of Return on Plan Assets | | Total increase (decrease) to pension expense from current assumption (in millions) |
| 3.25 percent | | $ | 8.5 |
| | 6.25 percent | | $ | 6.3 |
|
| 3.50 percent | | 6.2 |
| | 6.50 percent | | 4.7 |
|
| 3.75 percent | | 4.0 |
| | 6.75 percent | | 3.1 |
|
| 4.00 percent | | 2.0 |
| | 7.00 percent | | 1.6 |
|
4.25 percent — Current Assumption | | — |
| | 7.25 percent — Current Assumption | | — |
|
| 4.50 percent | | (1.9 | ) | | 7.50 percent | | (1.6 | ) |
| 4.75 percent | | (3.7 | ) | | 7.75 percent | | (3.1 | ) |
| 5.00 percent | | (5.4 | ) | | 8.00 percent | | (4.7 | ) |
| 5.25 percent | | (7.1 | ) | | 8.25 percent | | (6.3 | ) |
|
| | | | |
| | | Total increase (decrease) in Accumulated Other Comprehensive |
| Discount rate | | Income, net of taxes, from current assumptions (in millions) |
| 3.25 percent | | $ | (94.7 | ) |
| 3.50 percent | | (69.1 | ) |
| 3.75 percent | | (44.9 | ) |
| 4.00 percent | | (21.8 | ) |
| 4.25 percent — Current Assumption | | — |
|
| 4.50 percent | | 20.7 |
|
| 4.75 percent | | 40.4 |
|
| 5.00 percent | | 59.0 |
|
| 5.25 percent | | 76.9 |
|
Intangible assets and goodwill
The purchase price of each new acquisition is allocated to tangible assets, identifiable intangible assets, liabilities assumed, and goodwill. Determining the portion of the purchase price allocated to identifiable intangible assets and goodwill requires us to make significant estimates. The amount of the purchase price allocated to intangible assets is generally determined by estimating the future cash flows of each asset and discounting the net cash flows back to their present values. The discount rate used is determined at the time of the acquisition in accordance with accepted valuation methods.
Goodwill represents the excess of the aggregate purchase price over the fair value of net assets acquired, including intangible assets. Goodwill is not amortized, but instead tested annually or when events and circumstances indicate an impairment may have occurred. Our reporting units each contain goodwill that is assessed for potential impairment. All goodwill is assigned to reporting units, which is defined as the operating segment, or one level below the operating segment. We have three reporting units, of which two are included in the Global Packaging reportable segment. The other reporting unit is the U.S. Packaging segment.
Goodwill for our reporting units is reviewed for impairment annually in the fourth quarter of each year using a two-step process. In the first step, we compare the fair value of each reporting unit to its carrying value, including goodwill. Our determination of the estimated fair value of the reporting units utilizes both a discounted cash flow valuation and a market multiple method. Significant inputs to the discounted cash flow valuation method include discount rates, long-term sales growth rates and forecasted operating margins. The market multiple method estimates fair value by comparing the Company to similar public companies. If the fair value exceeds the carrying value, step two is not required and an impairment loss is not recognized. If step two were required, we would calculate the implied fair value of goodwill by deducting the fair value of all tangible and intangible net assets, including unrecognized intangible assets, of the reporting unit from the fair value of the reporting unit. If the implied fair value of goodwill is less than the carrying value of goodwill, we would recognize an impairment loss, in the period identified, equal to the difference.
ContentsOur estimates associated with the goodwill impairment tests are considered critical due to the amount of goodwill recorded on our consolidated balance sheet and the judgment required in determining fair value amounts, including projected future cash flows. Judgment is used in assessing whether goodwill should be tested more frequently for impairment than annually. Factors such as a significant decrease in expected net earnings, adverse equity market conditions, and other external events may require more frequent assessments. The annual goodwill impairment testing has been completed and, as the fair value of each reporting unit was at least 20 percent in excess of the respective reporting unit’s carrying value, it has been determined that our $1.0 billion of goodwill is not impaired as of December 31, 2016. We perform sensitivity analyses of key factors including discount rates and long-term sales growth rates. There were no key factors that a one percentage point change would result in an impairment.
Intangible assets consist primarily of purchased customer relationships, technology, trademarks, and tradenames and are amortized using the straight-line method over their estimated useful lives, which range from one to 30 years, when purchased. We review these intangible assets for impairment as changes in circumstances or the occurrence of events suggest that the remaining value is not recoverable. The test for impairment requires us to make estimates about fair value, most of which are based on projected future cash flows. These estimates and projections require judgments as to future events, condition, and amounts of future cash flows. We have no indefinite-lived intangible assets.
New Accounting Pronouncements
There has been no new accounting guidance issued or effective during 2016 that is expected to have a material impact on our consolidated financial position, results of operations, or cash flows in 2016 or 2017. Refer to Note 3 - New Accounting Guidance for additional detail.
ITEM 7A — QUANTITATIVE AND QUALITATIVE DISCLOSURES ABOUT MARKET RISK
The information required by this Item 7A is included in Note 8 to the Consolidated Financial Statements included in Item 8 of this Annual Report on Form 10-K, and under the caption “Market Risks and Foreign Currency Exposures” which is part of Management’s Discussion and Analysis included in Item 7 of this Annual Report on Form 10-K. Certain of our locations have assets and liabilities denominated in currencies other than their functional currencies. We enter into foreign currency forward exchange contracts to offset the transaction gains or losses associated with some of these assets and liabilities. For assets and liabilities without offsetting foreign currency forward exchange contracts, a 10 percent adverse change in the underlying foreign currency exchange rates would reduce our pre-tax income by approximately $5 million.
ITEM 8 — FINANCIAL STATEMENTS AND SUPPLEMENTARY DATA
Management’s Responsibility Statement
The management of Bemis Company, Inc. is responsible for the integrity, objectivity, and accuracy of the financial statements of the Company. The financial statements are prepared by the Company in accordance with accounting principles generally accepted in the United States of America, and using management’s best estimates and judgments, where appropriate. The financial information presented throughout this Annual Report on Form 10-K is consistent with that in the financial statements.
The management of Bemis Company, Inc. is responsible for establishing and maintaining adequate internal control over financial reporting, as such term is defined in Exchange Act Rule 13a-15(f). Under the direction, supervision, and participation of the Chief Executive Officer and the Chief Financial Officer, the Company’s management conducted an evaluation of the effectiveness of internal control over financial reporting based on the framework in Internal Control - Integrated Framework issued by the Committee of Sponsoring Organizations of the Treadway Commission (COSO-Framework (2013)). Based on the results of this evaluation, management has concluded that internal control over financial reporting was effective as of December 31, 2016. Item 9A of this Annual Report on Form 10-K contains management’s favorable assessment of internal controls over financial reporting based on their review and evaluation utilizing the COSO-Framework (2013) criteria.
The Audit Committee of the Board of Directors, which is composed solely of outside directors, meets quarterly with management, the Internal Audit Director, and independent accountants to review the work of each and to satisfy itself that the respective parties are properly discharging their responsibilities. PricewaterhouseCoopers LLP and the Internal Audit Director have had and continue to have unrestricted access to the Audit Committee, without the presence of Company management.
|
| | | | |
/s/ William F. Austen | | /s/ Michael B. Clauer | | /s/ Jerry S. Krempa |
William F. Austen, President and Chief Executive Officer | | Michael B. Clauer, Senior Vice President and Chief Financial Officer | | Jerry S. Krempa, Vice President and Chief Accounting Officer |
Report of Independent Registered Public Accounting Firm
To the Board of Directors and Shareholders of Bemis Company, Inc.:
In our opinion, the accompanying consolidated balance sheets and the related consolidated statements of income, comprehensive income, equity and cash flows present fairly, in all material respects, the financial position of Bemis Company, Inc. and its subsidiaries at December 31, 2016 and December 31, 2015, and the results of their operations and their cash flows for each of the three years in the period ended December 31, 2016 in conformity with accounting principles generally accepted in the United States of America. In addition, in our opinion, the financial statement schedule listed in the index appearing under Item 15(a)(2) presents fairly, in all material respects, the information set forth therein when read in conjunction with the related consolidated financial statements. Also in our opinion, the Company maintained, in all material respects, effective internal control over financial reporting as of December 31, 2016, based on criteria established in Internal Control - Integrated Framework (2013) issued by the Committee of Sponsoring Organizations of the Treadway Commission (COSO). The Company's management is responsible for these financial statements and financial statement schedule, for maintaining effective internal control over financial reporting and for its assessment of the effectiveness of internal control over financial reporting, included in Management's Report on Internal Control over Financial Reporting under Item 9A. Our responsibility is to express opinions on these financial statements, on the financial statement schedule, and on the Company's internal control over financial reporting based on our integrated audits. We conducted our audits in accordance with the standards of the Public Company Accounting Oversight Board (United States). Those standards require that we plan and perform the audits to obtain reasonable assurance about whether the financial statements are free of material misstatement and whether effective internal control over financial reporting was maintained in all material respects. Our audits of the financial statements included examining, on a test basis, evidence supporting the amounts and disclosures in the financial statements, assessing the accounting principles used and significant estimates made by management, and evaluating the overall financial statement presentation. Our audit of internal control over financial reporting included obtaining an understanding of internal control over financial reporting, assessing the risk that a material weakness exists, and testing and evaluating the design and operating effectiveness of internal control based on the assessed risk. Our audits also included performing such other procedures as we considered necessary in the circumstances. We believe that our audits provide a reasonable basis for our opinions.
A company’s internal control over financial reporting is a process designed to provide reasonable assurance regarding the reliability of financial reporting and the preparation of financial statements for external purposes in accordance with generally accepted accounting principles. A company’s internal control over financial reporting includes those policies and procedures that (i) pertain to the maintenance of records that, in reasonable detail, accurately and fairly reflect the transactions and dispositions of the assets of the company; (ii) provide reasonable assurance that transactions are recorded as necessary to permit preparation of financial statements in accordance with generally accepted accounting principles, and that receipts and expenditures of the company are being made only in accordance with authorizations of management and directors of the company; and (iii) provide reasonable assurance regarding prevention or timely detection of unauthorized acquisition, use, or disposition of the company’s assets that could have a material effect on the financial statements.
Because of its inherent limitations, internal control over financial reporting may not prevent or detect misstatements. Also, projections of any evaluation of effectiveness to future periods are subject to the risk that controls may become inadequate because of changes in conditions, or that the degree of compliance with the policies or procedures may deteriorate.
|
| |
/s/ PricewaterhouseCoopers LLP | |
PricewaterhouseCoopers LLP |
Milwaukee, Wisconsin |
February 17, 2017 |
BEMIS COMPANY, INC. AND SUBSIDIARIES
CONSOLIDATED STATEMENT OF INCOME
(in millions, except per share amounts)
|
| | | | | | | | | | | | |
| For the years ended December 31, | | 2016 | | 2015 | | 2014 |
| Net sales | | $ | 4,004.4 |
| | $ | 4,071.4 |
| | $ | 4,343.5 |
|
| Cost of products sold | | 3,138.2 |
| | 3,198.0 |
| | 3,484.4 |
|
| | | | | | | |
| Gross profit | | 866.2 |
| | 873.4 |
| | 859.1 |
|
| | | | | | | |
| Operating expenses: | | |
| | |
| | |
|
| Selling, general, and administrative expenses | | 392.2 |
| | 420.0 |
| | 416.6 |
|
| Research and development | | 46.5 |
| | 44.1 |
| | 44.1 |
|
| Restructuring and acquisition-related costs | | 28.6 |
| | 12.1 |
| | — |
|
| Other operating income | | (10.4 | ) | | (12.4 | ) | | (9.3 | ) |
| | | | | | | |
| Operating income | | 409.3 |
| | 409.6 |
| | 407.7 |
|
| | | | | | | |
| Interest expense | | 60.2 |
| | 51.7 |
| | 60.8 |
|
| Other non-operating income | | (1.8 | ) | | (6.0 | ) | | (16.8 | ) |
| | | | | | | |
| Income from continuing operations before income taxes | | 350.9 |
| | 363.9 |
| | 363.7 |
|
| | | | | | | |
| Provision for income taxes | | 114.7 |
| | 122.0 |
| | 124.6 |
|
| | | | | | | |
| Income from continuing operations | | 236.2 |
| | 241.9 |
| | 239.1 |
|
| | | | | | | |
| Loss from discontinued operations | | — |
| | (2.6 | ) | | (48.0 | ) |
| | | | | | | |
| Net income | | $ | 236.2 |
| | $ | 239.3 |
| | $ | 191.1 |
|
| | | | | | | |
| | | | | | | |
| Basic earnings per share: | | | | | | |
| Income from continuing operations | | $ | 2.51 |
| | $ | 2.50 |
| | $ | 2.39 |
|
| Loss from discontinued operations | | — |
| | (0.03 | ) | | (0.48 | ) |
| Net income | | $ | 2.51 |
| | $ | 2.47 |
| | $ | 1.91 |
|
| | | | | | | |
| Diluted earnings per share: | | | | | | |
| Income from continuing operations | | $ | 2.48 |
| | $ | 2.47 |
| | $ | 2.36 |
|
| Loss from discontinued operations | | — |
| | (0.03 | ) | | (0.47 | ) |
| Net income | | $ | 2.48 |
| | $ | 2.44 |
| | $ | 1.89 |
|
| | | | | | | |
| | | | | | | |
| Cash dividends paid per share | | $ | 1.16 |
| | $ | 1.12 |
| | $ | 1.08 |
|
See accompanying notes to consolidated financial statements.
BEMIS COMPANY, INC. AND SUBSIDIARIES
CONSOLIDATED STATEMENT OF COMPREHENSIVE INCOME
(in millions)
|
| | | | | | | | | | | | |
| For the years ended December 31, | | 2016 | | 2015 | | 2014 |
| Net income | | $ | 236.2 |
| | $ | 239.3 |
| | $ | 191.1 |
|
| Other comprehensive income (loss): | | | | | | |
| Translation adjustments | | 35.8 |
| | (215.2 | ) | | (129.4 | ) |
| Pension and other postretirement liability adjustments, net of tax (a) | | 26.3 |
| | (3.0 | ) | | (48.3 | ) |
| Reclassification from accumulated other comprehensive loss from discontinued operations to net income | | — |
| | — |
| | (15.3 | ) |
| Other comprehensive income (loss) | | 62.1 |
| | (218.2 | ) | | (193.0 | ) |
| Total comprehensive income (loss) | | $ | 298.3 |
| | $ | 21.1 |
| | $ | (1.9 | ) |
| | | | | | | |
| | | | | | | |
| (a) - Tax (expense) benefit related to pension and other postretirement liability adjustments | | $ | (17.8 | ) | | $ | 3.1 |
| | $ | 30.3 |
|
See accompanying notes to consolidated financial statements.
BEMIS COMPANY, INC. AND SUBSIDIARIES
CONSOLIDATED BALANCE SHEET
(in millions, except per share amounts)
|
| | | | | | | | |
| As of December 31, | | 2016 | | 2015 |
| ASSETS | | |
| | |
|
| Current assets: | | |
| | |
|
| Cash and cash equivalents | | $ | 74.2 |
| | $ | 59.2 |
|
| Trade receivables | | 461.9 |
| | 451.3 |
|
| Inventories | | 549.4 |
| | 525.9 |
|
| Prepaid expenses and other current assets | | 80.0 |
| | 82.6 |
|
| Total current assets | | 1,165.5 |
| | 1,119.0 |
|
| | | | | |
| Property and equipment: | | |
| | |
|
| Land and land improvements | | 51.8 |
| | 53.3 |
|
| Buildings and leasehold improvements | | 620.2 |
| | 589.3 |
|
| Machinery and equipment | | 1,952.1 |
| | 1,776.9 |
|
| Total property and equipment | | 2,624.1 |
| | 2,419.5 |
|
| Less accumulated depreciation | | (1,340.3 | ) | | (1,213.2 | ) |
| Net property and equipment | | 1,283.8 |
| | 1,206.3 |
|
| | | | | |
| Other long-term assets: | | |
| | |
|
| Goodwill | | 1,028.8 |
| | 949.5 |
|
| Other intangible assets, net | | 155.2 |
| | 149.8 |
|
| Deferred charges and other assets | | 82.4 |
| | 65.2 |
|
| Total other long-term assets | | 1,266.4 |
| | 1,164.5 |
|
| TOTAL ASSETS | | $ | 3,715.7 |
| | $ | 3,489.8 |
|
| | | | | |
| LIABILITIES | | |
| | |
|
| Current liabilities: | | |
| | |
|
| Current portion of long-term debt | | $ | 2.0 |
| | $ | 5.8 |
|
| Short-term borrowings | | 15.3 |
| | 29.6 |
|
| Accounts payable | | 378.0 |
| | 334.8 |
|
| Employee-related liabilities | | 79.6 |
| | 93.3 |
|
| Accrued income and other taxes | | 31.2 |
| | 35.2 |
|
| Other current liabilities | | 70.0 |
| | 90.4 |
|
| Total current liabilities | | 576.1 |
| | 589.1 |
|
| | | | | |
| Long-term debt, less current portion | | 1,527.8 |
| | 1,353.9 |
|
| Deferred taxes | | 219.7 |
| | 172.4 |
|
| Other liabilities and deferred credits | | 132.4 |
| | 167.0 |
|
| Total liabilities | | 2,456.0 |
| | 2,282.4 |
|
| | | | | |
| Commitments and contingencies (See Note 19) | |
|
| |
|
|
| | | | | |
| EQUITY | | |
| | |
|
| Bemis Company, Inc. shareholders’ equity: | | |
| | |
|
| Common stock, $0.10 par value: | | |
| | |
|
| Authorized — 500.0 shares | | |
| | |
|
| Issued — 128.8 and 128.2 shares, respectively | | 12.9 |
| | 12.8 |
|
| Capital in excess of par value | | 581.5 |
| | 573.2 |
|
| Retained earnings | | 2,341.7 |
| | 2,216.0 |
|
| Accumulated other comprehensive loss | | (447.8 | ) | | (509.9 | ) |
| Common stock held in treasury (36.1 and 33.1 shares at cost, respectively) | | (1,228.6 | ) | | (1,084.7 | ) |
| TOTAL EQUITY | | 1,259.7 |
| | 1,207.4 |
|
| | | | | |
| TOTAL LIABILITIES AND EQUITY | | $ | 3,715.7 |
| | $ | 3,489.8 |
|
See accompanying notes to consolidated financial statements.
BEMIS COMPANY, INC. AND SUBSIDIARIES
CONSOLIDATED STATEMENT OF CASH FLOWS
(in millions)
|
| | | | | | | | | | | | |
| For the years ended December 31, | | 2016 | | 2015 | | 2014 |
| Cash flows from operating activities: | | |
| | |
| | |
|
| Net income | | $ | 236.2 |
| | $ | 239.3 |
| | $ | 191.1 |
|
| Adjustments to reconcile net income to net cash provided by operating activities: | | |
| | |
| | |
|
| Depreciation and amortization | | 162.1 |
| | 158.1 |
| | 180.6 |
|
| Excess tax benefit from share-based payment arrangements | | (4.5 | ) | | (1.9 | ) | | (0.7 | ) |
| Share-based compensation | | 18.1 |
| | 18.4 |
| | 12.4 |
|
| Deferred income taxes | | 26.2 |
| | 14.2 |
| | (0.5 | ) |
| Income of unconsolidated affiliated company | | (2.2 | ) | | (1.9 | ) | | (1.7 | ) |
| Cash dividends received from unconsolidated affiliated company | | 2.7 |
| | 1.7 |
| | — |
|
| Non-cash impairment charge of discontinued operations | | — |
| | 3.2 |
| | 44.7 |
|
| Gain on sale of property and equipment | | (0.1 | ) | | (1.9 | ) | | (0.6 | ) |
| Gain on divestitures | | — |
| | — |
| | (9.3 | ) |
| Changes in operating assets and liabilities, excluding effect of acquisitions, divestitures, and currency: | | | | |
| | |
|
| Trade receivables | | 7.5 |
| | (3.3 | ) | | (63.9 | ) |
| Inventories | | (7.5 | ) | | 16.0 |
| | (48.0 | ) |
| Prepaid expenses and other current assets | | 1.0 |
| | 5.3 |
| | (8.6 | ) |
| Accounts payable | | 37.8 |
| | 77.5 |
| | (7.6 | ) |
| Employee-related liabilities | | (15.6 | ) | | 8.8 |
| | 7.5 |
|
| Accrued income and other taxes | | (0.7 | ) | | 17.1 |
| | (3.7 | ) |
| Other current liabilities | | (22.9 | ) | | 3.5 |
| | (25.9 | ) |
| Other liabilities and deferred credits | | 17.6 |
| | 6.0 |
| | (0.2 | ) |
| Deferred charges and other assets | | (18.3 | ) | | (7.7 | ) | | (17.5 | ) |
| Net cash provided by operating activities | | 437.4 |
| | 552.4 |
| | 248.1 |
|
| | | | | | | |
| Cash flows from investing activities: | | |
| | |
| | |
|
| Additions to property and equipment | | (208.3 | ) | | (219.4 | ) | | (185.2 | ) |
| Business acquisitions and adjustments, net of cash acquired | | (114.5 | ) | | (66.4 | ) | | — |
|
| Proceeds from sales of property and equipment | | 11.6 |
| | 9.6 |
| | 10.1 |
|
| Proceeds from divestitures | | — |
| | 13.6 |
| | 215.6 |
|
| Net cash (used in) provided by investing activities | | (311.2 | ) | | (262.6 | ) | | 40.5 |
|
| | | | | | | |
| Cash flows from financing activities: | | |
| | |
| | |
|
| Proceeds from issuance of long-term debt | | 299.0 |
| | 2.0 |
| | 199.4 |
|
| Repayment of long-term debt | | (23.8 | ) | | (0.9 | ) | | (400.2 | ) |
| Net (repayment) borrowing of commercial paper | | (110.0 | ) | | 12.2 |
| | 76.8 |
|
| Net (repayment) borrowing of short-term debt | | (8.1 | ) | | (9.6 | ) | | 21.1 |
|
| Cash dividends paid to shareholders | | (113.9 | ) | | (109.7 | ) | | (108.4 | ) |
| Common stock purchased for the treasury | | (143.9 | ) | | (150.1 | ) | | (152.1 | ) |
| Deferred payments for business acquisitions | | — |
| | (4.3 | ) | | (6.6 | ) |
| Excess tax benefit from share-based payment arrangements | | 4.5 |
| | 1.9 |
| | 0.7 |
|
| Stock incentive programs and related withholdings | | (14.2 | ) | | (6.8 | ) | | (1.5 | ) |
| Net cash used in financing activities | | (110.4 | ) | | (265.3 | ) | | (370.8 | ) |
| | | | | | | |
| Effect of exchange rates on cash and cash equivalents | | (0.8 | ) | | (12.4 | ) | | (12.4 | ) |
| | | | | | | |
| Net increase (decrease) in cash and cash equivalents | | 15.0 |
| | 12.1 |
| | (94.6 | ) |
| Cash and cash equivalents balance at beginning of year | | 59.2 |
| | 47.1 |
| | 141.7 |
|
| | | | | | | |
| Cash and cash equivalents balance at end of year | | $ | 74.2 |
| | $ | 59.2 |
| | $ | 47.1 |
|
| | | | | | | |
| Interest paid during the year | | $ | 57.4 |
| | $ | 48.5 |
| | $ | 68.4 |
|
| Income taxes paid during the year | | $ | 93.1 |
| | $ | 84.7 |
| | $ | 134.8 |
|
See accompanying notes to consolidated financial statements
BEMIS COMPANY, INC. AND SUBSIDIARIES
CONSOLIDATED STATEMENT OF EQUITY
(in millions)
|
| | | | | | | | | | | | | | | | | | | | | | | | |
| | | Common Stock | | Capital In Excess of Par Value | | Retained Earnings | | Accumulated Other Comprehensive Loss | | Common Stock Held In Treasury | | Total |
| Balance as of December 31, 2013 | | $ | 12.8 |
| | $ | 548.1 |
| | $ | 2,005.1 |
| | $ | (98.7 | ) | | $ | (782.5 | ) | | $ | 1,684.8 |
|
| | | | | | | | | | | | | |
| Net income | | |
| | |
| | 191.1 |
| | |
| | |
| | 191.1 |
|
| Other comprehensive loss | | |
| | |
| | |
| | (193.0 | ) | | |
| | (193.0 | ) |
| Cash dividends declared on common stock | | |
| | |
| | (109.4 | ) | | |
| | |
| | (109.4 | ) |
| Stock incentive programs and related tax withholdings (0.1 shares) | |
|
| | (1.5 | ) | | |
| | |
| | |
| | (1.5 | ) |
| Excess tax benefit from share-based compensation arrangements | | |
| | 0.7 |
| | |
| | |
| | |
| | 0.7 |
|
| Share-based compensation | | |
| | 12.4 |
| | |
| | |
| | |
| | 12.4 |
|
| Purchase of 3.8 shares of common stock for the treasury | | | | | | | | | | (152.1 | ) | | (152.1 | ) |
| Balance as of December 31, 2014 | | 12.8 |
| | 559.7 |
| | 2,086.8 |
| | (291.7 | ) | | (934.6 | ) | | 1,433.0 |
|
| | | | | | | | | | | | | |
| Net income | | |
| | |
| | 239.3 |
| | |
| | |
| | 239.3 |
|
| Other comprehensive loss | | |
| | |
| | |
| | (218.2 | ) | | |
| | (218.2 | ) |
| Cash dividends declared on common stock | | |
| | |
| | (110.1 | ) | | |
| | |
| | (110.1 | ) |
| Stock incentive programs and related tax withholdings (0.2 shares) | |
|
| | (6.8 | ) | | |
| | |
| | |
| | (6.8 | ) |
| Excess tax benefit from share-based compensation arrangements | | | | 1.9 |
| | |
| | |
| | |
| | 1.9 |
|
| Share-based compensation | | |
| | 18.4 |
| | |
| | |
| | |
| | 18.4 |
|
| Purchase of 3.3 shares of common stock for the treasury | | | | | | | | | | (150.1 | ) | | (150.1 | ) |
| Balance as of December 31, 2015 | | 12.8 |
| | 573.2 |
| | 2,216.0 |
| | (509.9 | ) | | (1,084.7 | ) | | 1,207.4 |
|
| | | | | | | | | | | | | |
| Net income | | | | | | 236.2 |
| | | | | | 236.2 |
|
| Other comprehensive income | | | | | | | | 62.1 |
| | |
| | 62.1 |
|
| Cash dividends declared on common stock | | | | | | (110.5 | ) | | | | | | (110.5 | ) |
| Stock incentive programs and related tax withholdings (0.6 shares) | | 0.1 |
| | (14.3 | ) | | | | | | | | (14.2 | ) |
| Excess tax benefit from share-based compensation arrangements | | | | 4.5 |
| | | | | | | | 4.5 |
|
| Share-based compensation | | | | 18.1 |
| | | | | | | | 18.1 |
|
| Purchase of 3.0 shares of common stock for the treasury | | | | | | | | | | (143.9 | ) | | (143.9 | ) |
| Balance as of December 31, 2016 | | $ | 12.9 |
| | $ | 581.5 |
| | $ | 2,341.7 |
| | $ | (447.8 | ) | | $ | (1,228.6 | ) | | $ | 1,259.7 |
|
See accompanying notes to consolidated financial statements.
NOTES TO CONSOLIDATED FINANCIAL STATEMENTS
Note 1 — BUSINESS DESCRIPTION
Bemis Company, Inc. (the "Company"), a Missouri corporation, was founded in 1858 and incorporated in 1885 as Bemis Bro. Bag Company. In 1965 the name was changed to Bemis Company, Inc. Based in Neenah, Wisconsin, at December 31, 2016, the Company employed approximately 17,500 individuals and had 59 manufacturing facilities. The Company manufactures and sells packaging products globally.
The Company’s business activities are organized around its two business segments, U.S. Packaging (65 percent of 2016 net sales) and Global Packaging (35 percent). The Company’s packaging businesses have a strong technical base in polymer chemistry, film extrusion, coating, laminating, printing, and converting. The Company’s products are primarily sold in the food industry, which accounted for approximately 80 percent of net sales in 2016. The Company’s packaging products are widely diversified among food categories and can be found in nearly every aisle of the grocery store. Other markets include chemical, agribusiness, medical, pharmaceutical, personal care products, electronics, construction, and other consumer goods. All markets are considered to be highly competitive as to price, innovation, quality, and service.
Note 2 — SIGNIFICANT ACCOUNTING POLICIES
Discontinued operations presentation: The consolidated statement of income and related notes reflects our Pressure Sensitive Materials business as a discontinued operation (see Note 6 — Divestitures and Plant Closures). The consolidated statement of cash flows for all periods includes both continuing and discontinued operations.
Principles of consolidation: The consolidated financial statements include the accounts of the Company and its majority owned subsidiaries. All intercompany transactions and accounts have been eliminated. Joint ventures which are not majority controlled are accounted for by the equity method of accounting with earnings of $2.2 million, $1.9 million, and $1.7 million in 2016, 2015, and 2014, respectively, included in other operating income on the accompanying consolidated statement of income. Investments in joint ventures of $6.2 million and $5.4 million as of December 31, 2016 and 2015, respectively, are included in deferred charges and other assets on the accompanying consolidated balance sheet.
Estimates and assumptions required: The preparation of financial statements in conformity with accounting principles generally accepted in the United States of America requires management to make estimates and assumptions that affect the reported amounts of assets and liabilities at the date of the financial statements and the reported amounts of revenues and expenses during the reporting period. Actual results could differ from those estimates.
Translation of foreign currencies:The Company considers the local currency to be the functional currency for substantially all foreign subsidiaries. Assets and liabilities are translated at the exchange rate as of the balance sheet date. All revenue and expense accounts are translated at average exchange rates in effect during the year. Translation gains or losses are recorded in the foreign currency translation component in accumulated other comprehensive loss in shareholders’ equity. Foreign currency transaction gains of $0.4 million in 2016 and losses of $1.4 million and $3.5 million in 2015 and 2014, respectively, are included as a component of other operating income. Foreign currency transaction losses of $0.7 million were recorded within non-operating income in 2016. There were no foreign currency transaction losses recorded within non-operating income in 2015 or 2014.
Revenue recognition:Sales and related costs of products sold are recognized when persuasive evidence of an arrangement exists, title and risk of ownership have been transferred to the customer, the sales price is fixed or determinable, and collectability is reasonably assured. These conditions are typically fulfilled upon shipment of products. All costs associated with revenue, including customer rebates and provisions for estimates of sales returns and allowances, are recognized as a deduction from revenue in the period in which the associated revenue is recorded. Customer rebates are accrued using sales data and rebate percentages specific to each customer agreement. Shipping and handling costs are classified as a component of cost of products sold while amounts billed to customers for shipping and handling are classified as a component of sales. The Company accrues for estimated warranty costs when specific issues are identified and the amounts are determinable and also considers the history of actual claims paid. Taxes assessed by governmental authorities on revenue producing transactions, including sales, value added, excise and use taxes, are recorded on a net basis (excluded from revenue).
Research and development: Research and development expenditures are expensed as incurred.
Restructuring costs: Restructuring costs are recognized when the liability is incurred. The Company calculates severance obligations based on its standard customary practices. Accordingly, the Company records provisions for severance when probable and estimable and the Company has committed to the restructuring plan. In the absence of a standard customary practice or established local practice for locations outside the U.S., liabilities for severance are recognized when incurred. If fixed assets are to be disposed of as a result of the Company’s restructuring efforts, the assets are written off when the Company commits to dispose of them and they are no longer in use. Depreciation is accelerated on fixed assets for the period of time the asset continues to be used until the asset ceases to be used. Other restructuring costs, including costs to relocate equipment, are generally recorded as the cost is incurred or the service is provided.
Cash and cash equivalents:The Company considers all highly liquid temporary investments with a maturity of three months or less when purchased to be cash equivalents. Cash equivalents include certificates of deposit that can be readily liquidated without penalty at the Company’s option. Cash equivalents are carried at cost which approximates fair market value.
Trade receivables:Trade accounts receivable are stated at the amount the Company expects to collect, which is net of an allowance for sales returns and the estimated losses resulting from the inability of its customers to make required payments. When determining the collectability of specific customer accounts, a number of factors are evaluated, including: customer creditworthiness, past transaction history with the customer, and changes in customer payment terms or practices. In addition, overall historical collection experience, current economic industry trends, and a review of the current status of trade accounts receivable are considered when determining the required allowance for doubtful accounts. Based on management’s assessment, the Company provides for estimated uncollectible amounts through a charge to earnings and a credit to allowance for doubtful accounts. Balances that remain outstanding after the Company has used reasonable collection efforts are written off through a charge to the allowance for doubtful accounts and a credit to trade receivables. Trade receivables are presented net of an allowance for doubtful accounts of $18.2 million and $18.0 million at December 31, 2016 and 2015, respectively.
The Company enters into supply chain financing programs from time to time to sell trade receivables without recourse to third-party financial institutions. Sales of trade receivables are reflected as a reduction of trade receivables on the consolidated balance sheets and the proceeds are included in the cash flows from operating activities in the consolidated statements of cash flows. During the years ended December 31, 2016 and 2015, the Company sold without recourse trade receivables representing approximately 12 percent and 10 percent, respectively, of net sales, and the associated discount on sale of trade receivables was not significant.
Inventory valuation: Inventories are valued at the lower of cost, as determined by the first-in, first-out ("FIFO") method, or net realizable value. Inventory values using the FIFO method of accounting approximate replacement cost. Inventories are summarized at December 31, as follows:
|
| | | | | | | | |
| (in millions) | | 2016 | | 2015 |
| Raw materials and supplies | | $ | 172.2 |
| | $ | 169.3 |
|
| Work in process and finished goods | | 377.2 |
| | 356.6 |
|
| Total inventories | | $ | 549.4 |
| | $ | 525.9 |
|
Property and equipment: Property and equipment are stated at cost. Maintenance and repairs that do not improve efficiency or extend economic life are expensed as incurred. Plant and equipment are depreciated for financial reporting purposes principally using the straight-line method over the estimated useful lives of assets as follows: land improvements, 15-30 years; buildings, 15-45 years; leasehold and building improvements, the lesser of the lease term or 8-20 years; and machinery and equipment, 3-16 years. For tax purposes, the Company generally uses accelerated methods of depreciation. The tax effect of the difference between book and tax depreciation has been provided as deferred income taxes. Depreciation expense was $146.1 million, $144.2 million, and $154.6 million for 2016, 2015, and 2014, respectively. On sale or retirement, the asset cost and related accumulated depreciation are removed from the accounts and any related gain or loss is reflected in income. Interest costs, which are capitalized during the construction of major capital projects, totaled $0.5 million, $0.4 million, and $0.2 million in 2016, 2015, and 2014, respectively.
The Company reviews its long-lived assets for impairment when events or changes in circumstances indicate that the carrying amount of the assets may not be recoverable. If impairment indicators are present and the estimated future undiscounted cash flows are less than the carrying value of the assets, the carrying values are reduced to the estimated fair value.
The Company capitalizes direct costs (internal and external) of materials and services used in the development and purchase of internal-use software. Amounts capitalized are amortized on a straight-line basis over a period of three to twelve years and are reported as a component of machinery and equipment within property and equipment.
The Company is in the process of developing and implementing a new Enterprise Resource Planning ("ERP") system. Certain costs incurred during the application development stage have been capitalized in accordance with authoritative accounting guidance related to accounting for costs of computer software developed or obtained for internal use. The net book value of capitalized costs for this new ERP system were approximately $60.8 million and $65.7 million as of December 31, 2016 and 2015, respectively. These costs are being amortized over the system’s estimated useful life as the ERP system is placed in service.
Goodwill:Goodwill represents the excess of cost over the fair value of net assets acquired in business combinations. Goodwill is not amortized, but instead tested annually or when events and circumstances indicate an impairment may have occurred. The Company's reporting units each contain goodwill that is assessed for potential impairment. All goodwill is assigned to reporting units, which is defined as the operating segment, or one level below the operating segment. The Company has three reporting units, of which two are included in the Global Packaging reportable segment. The other reporting unit is the U.S. Packaging segment.
Goodwill for the reporting units is reviewed for impairment annually in the fourth quarter of each year using a two-step process. In the first step, the fair value of each reporting unit is compared to its carrying value, including goodwill. The determination of the estimated fair value of the reporting units utilizes both a discounted cash flow valuation and a market multiple method. Significant inputs to the discounted cash flow valuation method include discount rates, long-term sales growth rates and forecasted operating margins. The market multiple method estimates fair value by comparing the Company to similar public companies. If the fair value exceeds the carrying value, step two is not required and an impairment loss is not recognized. If step two were required, the implied fair value of goodwill would be calculated by deducting the fair value of all tangible and intangible net assets, including unrecognized intangible assets, of the reporting unit from the fair value of the reporting unit. If the implied fair value of goodwill is less than the carrying value of goodwill, an impairment loss would be recognized equal to the difference.
The annual impairment test indicated no impairment for the years ended December 31, 2016, 2015, or 2014, nor does the Company have any accumulated impairment losses.
Intangible assets: Contractual or separable intangible assets that have finite useful lives are amortized against income using the straight-line method over their estimated useful lives, with original periods ranging from one to thirty years. The straight-line method of amortization reflects an appropriate allocation of the costs of the intangible assets to earnings in proportion to the amount of economic benefits obtained by the Company in each reporting period. The Company tests finite-lived intangible assets for impairment whenever there is an impairment indicator. Intangible assets are tested for impairment by comparing anticipated undiscounted future cash flows from operations to net book value.
Financial instruments:The Company recognizes all derivative instruments on the balance sheet at fair value. Derivatives not designated as hedging instruments are adjusted to fair value through income. Depending on the nature of derivatives designated as hedging instruments, changes in the fair value are either offset against the change in fair value of the hedged assets, liabilities, or firm commitments through earnings or recognized in shareholders’ equity through other comprehensive income until the hedged item is recognized. Gains or losses, if any, related to the ineffective portion of any hedge are recognized through earnings in the current period.
Note 8 contains expanded details relating to specific derivative instruments included on the Company’s balance sheet, such as forward foreign currency exchange contracts, currency swap contracts, and interest rate swap arrangements.
Other liabilities and deferred credits:Other liabilities and deferred credits balances include non-current pension and other postretirement liability amounts of $59.5 million and $99.8 million at December 31, 2016 and 2015, respectively.
Treasury stock: Treasury stock purchases are stated at cost and presented as a separate reduction of shareholders’ equity. During 2016, the Company purchased 3.0 million shares of common stock in the open market for $143.9 million. During 2015, the Company purchased 3.3 million shares of common stock in the open market for $150.1 million. During 2014, the Company purchased 3.8 million shares of common stock in the open market for $152.1 million. At December 31, 2016, approximately
20.4 million common shares can be repurchased, at management’s discretion, under authority granted by the Company’s Board of Directors in 2016.
Note 3 — NEW ACCOUNTING GUIDANCE
In August 2016, the Financial Accounting Standards Board ("FASB") issued guidance to simplify elements of cash flow classification. The guidance is intended to reduce diversity in practice in how certain transactions are classified in the statement of cash flows. The new guidance requires cash payments for debt prepayment or debt extinguishment costs to be classified as cash outflows for financing activities. It also requires cash payments made soon after an acquisition's consummation date (approximately three months or less) to be classified as cash outflows for investing activities. Payments made thereafter should be classified as cash outflows for financing activities up to the amount of the original contingent consideration liability. Payments made in excess of the amount of the original contingent consideration liability should be classified as cash outflows for operating activities. The guidance is required to be applied by the Company in the first quarter of 2018, but early adoption is permitted. The Company is currently evaluating the impact of this standard on its consolidated financial statements.
In March 2016, the FASB issued guidance that will change certain aspects of accounting for share-based payments to employees. The new guidance will require all income tax effects of awards to be recognized in the income statement when the awards vest or are settled and recognized in the statement of cash flows as operating cash flows. The guidance will also allow employee tax withholdings above the minimum statutory requirement without triggering liability accounting. Finally, the Company will be able to make a policy election to account for forfeitures as they occur. This guidance will be adopted by the Company in the first quarter of 2017 and applied prospectively.
If this guidance was adopted in the first quarter of 2016, diluted earnings per share in the first quarter would have increased by $0.04 from $0.59 to $0.63 due to a reduction in income tax expense. The impact to operating cash flow in the first quarter of 2016 would have been an increase of $4.2 million with a corresponding decrease in financing cash flows. Stock awards typically vest in the first quarter so the impact is concentrated in the first three months of each year. The impact in future years will be dependent on Bemis stock performance and the number of shares vesting each year. The impact in 2017 will be a $0.9 million reduction of income tax expense and an equivalent benefit to operating cash flow.
In February 2016, the FASB issued guidance that requires lessees to put most leases on their balance sheets but recognize expenses on their income statements in a manner similar to today's accounting. The guidance also eliminates today's real estate-specific provisions and changes the guidance on sale-leaseback transactions, initial direct costs and lease executory costs for all entities. All entities will classify leases to determine how to recognize lease-related revenue and expense. The guidance is required to be applied by the Company in the first quarter of 2019, but early adoption is permitted. The Company is currently evaluating the impact of this standard on its consolidated financial statements.
In September 2015, the FASB issued guidancethat eliminates the current requirement for an acquirer in a business combination to account for measurement-period adjustments retrospectively. Instead, acquirers must recognize measurement-period adjustments during the period in which they determine the amounts, including the effect on earnings of any amounts they would have recorded in previous periods if the accounting had been completed at the acquisition date. The guidance was adopted in the first quarter of 2016 and did not have a material impact on its consolidated financial statements.
In April 2015, the FASB issued guidance on the recognition of fees paid by a customer for cloud computing arrangements. The new guidance clarifies that if a cloud computing arrangement includes a software license, the customer should account for the software license consistent with the acquisition of other software licenses. If the arrangement does not include a software license, the customer should account for the arrangement as a service contract. The guidance was adopted in the first quarter of 2016 and did not have a material impact on the Company's consolidated financial statements.
In May 2014, the FASB issued new guidance which supersedes current revenue recognition requirements. This guidance is based on the principle that revenue is recognized to depict the transfer of goods or services to customers in an amount that reflects the consideration to which the entity expects to be entitled in exchange for those goods or services. In July 2015, the FASB voted to defer for one year the effective date of the new revenue standard. The guidance is required to be applied by the Company in the first quarter of fiscal 2018 using one of two retrospective applications methods. The FASB also decided to permit entities to early adopt the standard.
The Company has elected to adopt the new revenue guidance as of January 1, 2018. In preparation for adoption of the new guidance, the Company has reviewed representative samples of contracts and other forms of agreements with customers globally and has evaluated the provisions under the five-step model specified by the new guidance. Based on its procedures to date, the Company has preliminarily concluded the new revenue recognition guidance will not have a material impact on its consolidated financial statements. However, this conclusion could change as the Company finalizes its assessment during 2017. The Company will decide which retrospective application to apply once the assessment is finalized.
Note 4 — RESTRUCTURING
During the second quarter of 2016, the Company initiated a restructuring program to improve efficiencies and reduce fixed costs. As a part of this program, four Latin American facilities within the Global Packaging segment will be closed. Most of the production from these facilities will be transferred to other facilities. As of December 31, 2016, manufacturing operations had ceased at two of these manufacturing facilities. Based on current estimates and actual charges to date, the Company expects total restructuring costs of approximately $28 to $30 million, with employee termination costs accounting for $15 to $16 million of the total and the balance in other restructuring costs which includes fixed asset accelerated depreciation of approximately $3 million. Expenses for the twelve months ended December 31, 2016 were $21.6 million.
An analysis of the 2016 program accruals follows:
|
| | | | | | | | | | | | | | | | |
| (in millions) | | Employee Costs | | Fixed Asset Related | | Other Costs | | Total Restructuring Costs |
| Net expense accrued | | $ | 15.4 |
| | $ | 1.9 |
| | $ | 4.3 |
| | $ | 21.6 |
|
| Utilization (cash payments or otherwise settled) | | (6.3 | ) | | (1.9 | ) | | (2.0 | ) | | (10.2 | ) |
| Translation adjustments and other | | 0.3 |
| | — |
| | — |
| | 0.3 |
|
| Reserve balance at December 31, 2016 | | $ | 9.4 |
| | $ | — |
| | $ | 2.3 |
| | $ | 11.7 |
|
Plant closings associated with the program are expected to be completed in 2017. Cash payments in 2016 totaled $8.3 million. Cash payments in 2017 are expected to be approximately $15 million. The costs related to restructuring activities have been recorded on the consolidated statement of income as restructuring and acquisition-related costs. The accruals related to restructuring activities have been recorded on the consolidated balance sheet as other current liabilities.
Note 5 — ACQUISITIONS
SteriPack
On April 29, 2016, the Company acquired the medical device packaging operations and related value-added services of SteriPack Group, a global manufacturer of sterile packaging solutions for medical device and pharmaceutical applications. This acquisition includes a facility in Ireland as well as packaging production assets in Malaysia and the United States. The cash purchase price was $115.5 million. The preliminary allocation of the purchase price resulted in approximately $66.8 million of goodwill for the Global Packaging segment, the majority of which is not expected to be tax deductible. The goodwill identified by this acquisition reflects the benefits expected to be derived from product line expansion. The fair value and weighted average useful lives that have been assigned to the acquired identifiable intangible assets of this acquisition are:
|
| | | | | | |
| (in millions, except useful life) | | Fair Value | | Weighted Average Useful Life |
| Customer relationships | | $ | 21.8 |
| | 8 years |
| Order backlog | | 1.7 |
| | 2 months |
| Total | | $ | 23.5 |
| | |
The fair value of assets and liabilities acquired was $131.3 million and $15.8 million, respectively. Pro forma financial information and allocation of the purchase price are not presented as the effects of this acquisition are not material to the Company's results of operations or financial position.
Emplal Participações S.A.
On December 1, 2015, Bemis acquired the rigid plastic packaging operations of Emplal Participações S.A. ("Emplal"), a privately-owned Brazilian manufacturer of plastic packaging for food and consumer applications. The acquisition supports the Company's growth strategy to expand in markets that fit the Company's strengths and capabilities. The cash purchase price was $66.0 million. The allocation of the purchase price resulted in approximately $41.3 million of goodwill for the Global Packaging segment, which is expected to be tax deductible. The fair value and weighted average useful life that has been assigned to the acquired identifiable intangible asset of this acquisition is:
|
| | | | | | |
| (in millions, except useful life) | | Fair Value | | Weighted Average Useful Life |
| Customer relationships | | $ | 4.5 |
| | 10 years |
The fair value of assets and liabilities acquired was $143.8 million and $77.8 million, respectively. Deferred charges and other assets include an amount of approximately $16.9 million to record assets related to the indemnity provisions of the sale and purchase agreement, and are primarily related to tax matters. Pro forma financial information and allocation of the purchase price are not presented as the effects of this acquisition are not material to the Company's results of operations or financial position.
Note 6 — DIVESTITURES AND PLANT CLOSURES
Bemis Healthcare Packaging Plant Closure
In January 2015, the Company announced that it would close a plant in Philadelphia, Pennsylvania, one of its healthcare packaging facilities. Production from this facility was transferred to other healthcare facilities throughout 2015. During the twelve months ended December 31, 2015, plant closure costs of $7.8 million were recorded. These costs were recorded within restructuring and acquisition-related costs and included the Company's best estimate of a withdrawal liability for a multi-employer pension plan settlement. Operations ceased at this location in January 2016. The majority of approximately $7 million of cash payments were disbursed in 2016.
Divestiture of Pressure Sensitive Materials Business
On November 7, 2014, the Company completed the sale its global Pressure Sensitive Materials business. Proceeds of the transaction totaled $150.5 million. Of the total proceeds, $136.9 million was received in fiscal 2014 and $13.6 million was received in April 2015 which related to settlement of customary post-closing adjustments. At September 30, 2014, the Company determined that the Pressure Sensitive Materials business met the criteria to be classified as a discontinued operation, which required retrospective application to certain financial information for all periods presented.
The following table summarizes the results of the Pressure Sensitive Materials business, reclassified as discontinued operations for the twelve month periods ended December 31, 2015 and 2014:
|
| | | | | | | |
| | Twelve Months Ended |
| | December 31, |
| (in millions) | 2015 | | 2014 |
| Net sales | $ | — |
| | $ | 480.9 |
|
| | | | |
| Loss from discontinued operations before income taxes | $ | (3.7 | ) | | $ | (39.4 | ) |
| (Benefit) provision for income taxes on discontinued operations | (1.1 | ) | | 8.6 |
|
| Loss from discontinued operations, net of tax | $ | (2.6 | ) | | $ | (48.0 | ) |
| | | | |
Loss from discontinued operations in 2015 resulted from additional impairment charges, net of tax, reflecting finalization of post-closing adjustments. Loss from discontinued operations in 2014 includes the operating results of the Pressure Sensitive Materials business, goodwill impairment charges, direct transaction costs associated with the divestiture, plant closure costs associated with the Stow, Ohio plant, and the associated income tax effects of these items.
Assets and liabilities classified as held for sale are required to be recorded at the lower of carrying value or fair value less costs to sell. Accordingly, the Company recorded goodwill impairment charges of $44.7 million in the third quarter of 2014 when it became apparent the business would sell for less than its carrying value.
In March 2014, the Company announced the closure of its plant in Stow, Ohio, one of its Pressure Sensitive Materials manufacturing facilities. Operations ceased at this location in May 2014. During the twelve months ended December 31, 2014, plant closure costs of $25.0 million were recorded and approximately $20.8 million of cash payments were made. These costs are included within loss from discontinued operation and included a final withdrawal payment for a multi-employer pension plan.
Divestiture of Paper Packaging Division
On March 31, 2014, the Company completed the sale of its Paper Packaging Division. Annual net sales by this division were approximately $160 million. Net proceeds of the transaction totaled $78.7 million. A $9.3 million pre-tax gain on the sale was recorded as part of other non-operating income for the twelve months ended December 31, 2014.
Note 7 — FINANCIAL ASSETS AND FINANCIAL LIABILITIES MEASURED AT FAIR VALUE
The fair values of the Company’s financial assets and financial liabilities listed below reflect the amounts that would be received to sell the assets or paid to transfer the liabilities in an orderly transaction between market participants at the measurement date (exit price).
The Company’s non-derivative financial instruments include cash and cash equivalents, trade receivables, accounts payable, short-term borrowings, and long-term debt. At December 31, 2016 and 2015, the carrying value of these financial instruments, excluding long-term debt, approximates fair value because of the short-term maturities of these instruments.
Fair value disclosures are classified based on the fair value hierarchy. Level 1 fair value measurements represent exchange-traded securities which are valued at quoted prices (unadjusted) in active markets for identical assets or liabilities that the Company has the ability to access as of the reporting date. Level 2 fair value measurements are determined using input prices that are directly observable for the asset or liability or indirectly observable through corroboration with observable market data. Level 3 fair value measurements are determined using unobservable inputs, such as internally developed pricing models for the asset or liability due to little or no market activity for the asset or liability.
The fair value measurements of the Company’s long-term debt represent non-active market exchange-traded securities which are valued at quoted prices or using input prices that are directly observable or indirectly observable through corroboration with observable market data. The carrying values and estimated fair values of long-term debt at December 31, 2016 and 2015 follow:
|
| | | | | | | | | | | | | | | | |
| | | December 31, 2016 | | December 31, 2015 |
| | | Carrying | | Fair Value | | Carrying | | Fair Value |
| (in millions) | | Value | | (Level 2) | | Value | | (Level 2) |
| Total long-term debt | | $ | 1,527.8 |
| | $ | 1,592.3 |
| | $ | 1,353.9 |
| | $ | 1,421.6 |
|
The fair values for derivatives are based on inputs other than quoted prices that are observable for the asset or liability. These inputs include interest rates. The financial assets and financial liabilities are primarily valued using standard calculations / models that use as their basis readily observable market parameters. Industry standard data providers are the primary source for forward and spot rate information for both interest rates and currency rates, with resulting valuations periodically validated through third-party or counterparty quotes. The fair value of the Company's derivatives follow:
|
| | | | | | | | |
| | | Fair Value As of | | Fair Value As of |
| | | December 31, 2016 | | December 31, 2015 |
| (in millions) | | (Level 2) | | (Level 2) |
| Interest rate swaps — net asset position | | $ | 1.3 |
| | $ | 5.2 |
|
Note 8 — DERIVATIVE INSTRUMENTS
The Company enters into derivative transactions to manage exposures arising in the normal course of business. The Company does not enter into derivative transactions for speculative or trading purposes. The Company recognizes all derivative instruments on the balance sheet at fair value. Derivatives not designated as hedging instruments are adjusted to fair value through income. Depending on the nature of derivatives designated as hedging instruments, changes in the fair value are either offset against the change in fair value of the hedged assets, liabilities, or firm commitments through earnings or recognized in shareholders' equity through other comprehensive income until the hedged item is recognized. Gains or losses, if any, related to the ineffective portion of any hedge are recognized through earnings in the current period.
The Company enters into interest-rate swap contracts to economically convert a portion of the Company’s fixed-rate debt to variable rate debt. During the fourth quarter of 2011, the Company entered into four interest rate swap agreements with a total notional amount of $400 million. These contracts were designated as fair value hedges of the Company’s $400 million4.5% fixed-rate debt due in 2021. The variable rate for each of the interest rate swaps is based on the six-month London Interbank Offered Rate (LIBOR), set in arrears, plus a fixed spread. The variable rates are reset semi-annually at each net settlement date. Fair values of these interest rate swaps are determined using discounted cash flow or other appropriate methodologies. Asset positions are included in deferred charges and other assets with a corresponding increase in long-term debt. Liability positions are included in other liabilities and deferred credits with a corresponding decrease in long-term debt.
The Company enters into forward exchange contracts to manage foreign currency exchange rate exposures associated with certain foreign currency denominated receivables and payables. Forward exchange contracts generally have maturities of less than six months and relate primarily to the U.S. dollar for the Company’s Brazilian operations. The Company has not designated these derivative instruments as hedging instruments. At December 31, 2016 and 2015, the Company had outstanding forward exchange contracts with notional amounts aggregating $4.1 million and $3.8 million, respectively. The net settlement amount (fair value) related to active forward exchange contracts is recorded on the balance sheet as either a current or long-term asset or liability and as an element of other operating income which offsets the related transaction gains or losses. The net settlement amounts are immaterial for all periods presented.
The Company is exposed to credit loss in the event of non-performance by counterparties in forward exchange contracts and interest-rate swap contracts. Collateral is generally not required of the counterparties or of the Company. In the event a counterparty fails to meet the contractual terms of a currency swap or forward exchange contract, the Company’s risk is limited to the fair value of the instrument. The Company actively monitors its exposure to credit risk through the use of credit approvals and credit limits, and by selecting major international banks and financial institutions as counterparties. The Company has not had any historical instances of non-performance by any counterparties, nor does it anticipate any future instances of non-performance.
The fair values, balance sheet presentation, and the hedge designation status of derivative instruments at December 31, 2016 and 2015 are presented in the table below:
|
| | | | | | | | | | |
| | | | | Fair Value (Level 2) as of |
| (in millions) | | Balance Sheet Location | | December 31, 2016 | | December 31, 2015 |
| Asset Derivatives | | | | |
| | |
|
| Interest rate swaps — designated as hedge | | Deferred charges and other assets | | $ | 1.3 |
| | $ | 5.2 |
|
The income statement impact of derivatives are presented in the table below:
|
| | | | | | | | | | | | | | |
| | | | | Amount of Gain (Loss) Recognized in Income on Derivatives |
| (in millions) | | Income Statement Location | | 2016 | | 2015 | | 2014 |
| Designated as hedges | | | | | | | | |
| Interest rate swaps | | Interest expense | | $ | 4.7 |
| | $ | 7.2 |
| | $ | 8.2 |
|
| Not designated as hedges | | | | | | | | |
| Forward exchange contracts | | Other operating income | | (0.8 | ) | | 0.7 |
| | (0.4 | ) |
| Total | | | | $ | 3.9 |
| | $ | 7.9 |
| | $ | 7.8 |
|
Note 9 — GOODWILL AND OTHER INTANGIBLE ASSETS
Changes in the carrying amount of goodwill attributable to each reportable business segment follow:
|
| | | | | | | | | | | | |
| (in millions) | | U.S. Packaging Segment | | Global Packaging Segment | | Total |
| Reported balance at December 31, 2014 | | $ | 634.0 |
| | $ | 329.1 |
| | $ | 963.1 |
|
| Acquisition | | — |
| | 44.9 |
| | 44.9 |
|
| Currency translation | | (1.9 | ) | | (56.6 | ) | | (58.5 | ) |
| Reported balance at December 31, 2015 | | 632.1 |
| | 317.4 |
| | 949.5 |
|
| Acquisition and acquisition adjustments | | — |
| | 63.2 |
| | 63.2 |
|
| Currency translation | | 0.3 |
| | 15.8 |
| | 16.1 |
|
| Reported balance at December 31, 2016 | | $ | 632.4 |
| | $ | 396.4 |
| | $ | 1,028.8 |
|
Acquisition and acquisition adjustments are comprised of opening balance sheet adjustments related to the Emplal Participações S.A and SteriPack acquisitions.
The components of amortized intangible assets follow:
|
| | | | | | | | | | | | | | | | |
| | | December 31, 2016 | | December 31, 2015 |
| (in millions) | | Gross Carrying Amount | | Accumulated Amortization | | Gross Carrying Amount | | Accumulated Amortization |
| Contract based | | $ | 8.9 |
| | $ | (1.0 | ) | | $ | 10.0 |
| | $ | (1.2 | ) |
| Technology based | | 79.5 |
| | (52.0 | ) | | 79.6 |
| | (47.5 | ) |
| Marketing related | | 14.2 |
| | (8.9 | ) | | 12.7 |
| | (7.8 | ) |
| Customer based | | 203.9 |
| | (89.4 | ) | | 180.4 |
| | (76.4 | ) |
| Reported balance | | $ | 306.5 |
| | $ | (151.3 | ) | | $ | 282.7 |
| | $ | (132.9 | ) |
Amortization expense for intangible assets during 2016, 2015, and 2014 was $16.0 million, $14.3 million, and $15.4 million, respectively. Estimated annual amortization expense is $17.6 million for 2017 and 2018, $17.5 million for 2019, $16.5 million for 2020, and $15.3 million for 2021.
The Company completed its annual impairment tests in the fourth quarter of 2016 with no indications of impairment of goodwill found. The Company does not have any accumulated impairment losses.
Note 10 — PENSION PLANS
Total defined benefit, defined contribution, and multiemployer plan pension expense in 2016, 2015, and 2014 was $32.1 million, $41.2 million, and $37.2 million, respectively.
The Company sponsors a 401(k) savings plan (a defined contribution plan) for substantially all U.S. employees. From 2014 through 2016, the Company contributed $0.50 for every pre-tax $1.00 an employee contributed on the first four percent of eligible compensation plus $0.25 for every pre-tax $1.00 an employee contributed on the next four percent of eligible compensation for the plans that included a company match. The Company contributions were invested in Company stock and were fully vested after three years of service. Effective January 1, 2017, the Company will contribute $1.00 for every pre-tax $1.00 an employee contributes up to eight percent of eligible compensation for the plans that include a company match. The Company contributions will be invested in target retirement date funds based on employees’ ages and are fully vested after three years of service. Total Company contributions for 2016, 2015, and 2014 were $10.6 million, $10.2 million, and $10.6 million, respectively.
Through December 31, 2016, for employees not participating in defined benefit pension plans, the Company contributed to the Bemis Investment Profit Sharing Plan (BIPSP), a defined contribution plan which was subject to achievement
of certain financial performance goals of the Company. The BIPSP has been terminated for years after 2016. Total contribution expense for BIPSP and other defined contribution plans (including a multiemployer defined contribution plan and excluding 401(k) plans above) was $11.1 million in 2016, $20.0 million in 2015, and $16.5 million in 2014. As of December 31, 2016, the Company has withdrawn from all multiemployer defined benefit pension plans. Amounts contributed to the multiemployer plans in 2016, 2015, and 2014 totaled $0.0 million, $0.1 million, and $0.7 million, respectively (refer to Note 12 - Multiemployer Defined Benefit Pension Plans).
Two of the Company's three U.S. defined benefit plans were frozen as of December 31, 2013. The frozen plans are the salaried retirement plan that covered certain salaried employees and the unfunded supplemental retirement plan that provided senior management with benefits in excess of limits under the federal tax law. The Company’s defined benefit pension plans continue to cover a number of U.S. hourly employees, and the non-U.S. defined benefit plans cover select employees at various international locations. The benefits under the plans are based on years of service and salary levels. Certain plans covering hourly employees provide benefits of stated amounts for each year of service. In 2014, the Society of Actuaries released updated mortality tables and a mortality projection scale which the Company adopted to measure defined benefit plan liabilities. In 2015 and 2016, the Society of Actuaries published new mortality projection scales which were used in conjunction with 2014 mortality tables in measuring defined benefit plan liabilities in 2015 and 2016.
In 2016, the Company recognized a $5.8 million pension settlement charge related to lump sum payments from the U.S. supplemental pension plan. The lump sum payments totaled $18.1 million and are reflected as benefits paid in the “Change in Benefit Obligation” and the “Change in Plan Assets” tables. Also during 2016, a lump sum window was offered to certain participants of the other two U.S. defined benefit pension plans which resulted in lump sum payments of $26.3 million. These payments are also reflected as benefits paid. Lump sum payments decrease the benefit obligation and decrease plan assets.
Net periodic pension cost for defined benefit plans included the following components for the years ended December 31, 2016, 2015, and 2014:
|
| | | | | | | | | | | | | |
| | | | | | | | |
| (in millions) | | 2016 |
| 2015 |
| 2014 | |
| Service cost - benefits earned during the year | | $ | 7.6 |
| | $ | 7.8 |
| | $ | 7.5 |
| |
| Interest cost on projected benefit obligation | | 32.7 |
| | 32.6 |
| | 34.0 |
| |
| Expected return on plan assets | | (51.4 | ) | | (50.7 | ) | | (47.9 | ) | |
| Settlement loss | | 6.1 |
| | 0.1 |
| | 1.8 |
| |
| Curtailment loss | | — |
| | — |
| | 0.6 |
| |
| Amortization of unrecognized transition obligation | | — |
| | 0.1 |
| | 0.2 |
| |
| Amortization of prior service cost | | 0.8 |
| | 0.9 |
| | 1.4 |
| |
| Recognized actuarial net loss | | 14.6 |
| | 20.1 |
| | 11.8 |
| |
| Net periodic pension cost | | $ | 10.4 |
| | $ | 10.9 |
| | $ | 9.4 |
| |
Changes in benefit obligations and plan assets, and a reconciliation of the funded status at December 31, 2016 and 2015, were as follows:
|
| | | | | | | | | | | | | | | | |
| | | U.S. Pension Plans | | Non-U.S. Pension Plans |
| (in millions) | | 2016 | | 2015 | | 2016 | | 2015 |
| Change in Benefit Obligation: | | |
| | |
| | |
| | |
|
| Benefit obligation at the beginning of the year | | $ | 750.4 |
| | $ | 774.6 |
| | $ | 57.3 |
| | $ | 65.9 |
|
| Service cost | | 6.2 |
| | 6.1 |
| | 1.4 |
| | 1.7 |
|
| Interest cost | | 30.7 |
| | 30.3 |
| | 2.0 |
| | 2.3 |
|
| Participant contributions | | — |
| | — |
| | 0.1 |
| | 0.2 |
|
| Plan amendments | | 0.1 |
| | 1.2 |
| | 0.6 |
| | — |
|
| Benefits paid | | (79.4 | ) | | (34.1 | ) | | (6.2 | ) | | (2.2 | ) |
| Actuarial (gain) loss | | (14.3 | ) | | (27.7 | ) | | 10.2 |
| | (5.8 | ) |
| Foreign currency exchange rate changes | | — |
| | — |
| | (8.6 | ) | | (4.8 | ) |
| Benefit obligation at the end of the year | | $ | 693.7 |
| | $ | 750.4 |
| | $ | 56.8 |
| | $ | 57.3 |
|
| | | | | | | | | |
| Accumulated benefit obligation at the end of the year | | $ | 693.7 |
| | $ | 750.4 |
| | $ | 51.0 |
| | $ | 51.7 |
|
|
| | | | | | | | | | | | | | | | |
| | | U.S. Pension Plans | | Non-U.S. Pension Plans |
| (in millions) | | 2016 | | 2015 | | 2016 | | 2015 |
| Change in Plan Assets: | | |
| | |
| | |
| | |
|
| Fair value of plan assets at the beginning of the year | | $ | 641.3 |
| | $ | 685.7 |
| | $ | 54.2 |
| | $ | 57.2 |
|
| Actual return on plan assets | | 60.4 |
| | (11.6 | ) | | 8.7 |
| | 1.5 |
|
| Employer contributions | | 19.1 |
| | 1.3 |
| | 1.6 |
| | 1.6 |
|
| Participant contributions | | — |
| | — |
| | 0.1 |
| | 0.2 |
|
| Benefits paid | | (79.4 | ) | | (34.1 | ) | | (6.2 | ) | | (2.2 | ) |
| Foreign currency exchange rate changes | | — |
| | — |
| | (8.2 | ) | | (4.1 | ) |
| Fair value of plan assets at the end of the year | | $ | 641.4 |
| | $ | 641.3 |
| | $ | 50.2 |
| | $ | 54.2 |
|
| | | | | | | | | |
| Unfunded status at year end: | | $ | (52.3 | ) | | $ | (109.1 | ) | | $ | (6.6 | ) | | $ | (3.1 | ) |
|
| | | | | | | | | | | | | | | | |
| | | U.S. Pension Plans | | Non-U.S. Pension Plans |
| (in millions) | | 2016 | | 2015 | | 2016 | | 2015 |
| Amount recognized in consolidated balance sheet consists of: | | |
| | |
| | |
| | |
|
| Prepaid benefit cost, non-current | | $ | — |
| | $ | — |
| | $ | — |
| | $ | 1.9 |
|
| Accrued benefit liability, current | | (3.0 | ) | | (19.2 | ) | | (0.2 | ) | | (0.4 | ) |
| Accrued benefit liability, non-current | | (49.3 | ) | | (89.9 | ) | | (6.4 | ) | | (4.6 | ) |
| Sub-total | | (52.3 | ) | | (109.1 | ) | | (6.6 | ) | | (3.1 | ) |
| Deferred tax asset | | 71.4 |
| | 89.7 |
| | 1.9 |
| | 1.3 |
|
| Accumulated other comprehensive loss | | 113.1 |
| | 142.0 |
| | 7.3 |
| | 4.5 |
|
| Net amount related to pension plans | | $ | 132.2 |
| | $ | 122.6 |
| | $ | 2.6 |
| | $ | 2.7 |
|
Accumulated other comprehensive loss related to pension benefit plans is as follows:
|
| | | | | | | | | | | | | | | | |
| | | U.S. Pension Plans | | Non-U.S. Pension Plans |
| (in millions) | | 2016 | | 2015 | | 2016 | | 2015 |
| Unrecognized net actuarial losses | | $ | 180.9 |
| | $ | 227.3 |
| | $ | 8.3 |
| | $ | 5.4 |
|
| Unrecognized net prior service costs | | 3.6 |
| | 4.4 |
| | 0.6 |
| | 0.1 |
|
| Unrecognized net transition costs | | — |
| | — |
| | 0.3 |
| | 0.3 |
|
| Tax benefit | | (71.4 | ) | | (89.7 | ) | | (1.9 | ) | | (1.3 | ) |
| Accumulated other comprehensive loss, end of year | | $ | 113.1 |
| | $ | 142.0 |
| | $ | 7.3 |
| | $ | 4.5 |
|
Estimated amounts in accumulated other comprehensive income expected to be reclassified to net period cost during 2017 are as follows:
|
| | | | | | | | |
| | | | | Non-U.S. |
| (in millions) | | U.S. Pension Plans | | Pension Plans |
| Net actuarial losses | | $ | 13.6 |
| | $ | 0.3 |
|
| Net prior service costs | | 0.8 |
| | 0.1 |
|
| Total | | $ | 14.4 |
| | $ | 0.4 |
|
The accumulated benefit obligation for all defined benefit pension plans was $744.7 million and $802.1 million at December 31, 2016 and 2015, respectively.
Presented below are the projected benefit obligation, accumulated benefit obligation, and fair value of plan assets for pension plans with projected benefit obligations in excess of plan assets and pension plans with accumulated benefit obligations in excess of plan assets as of December 31, 2016 and 2015.
|
| | | | | | | | | | | | | | | | | | | | | | | | | | | | | | | | |
| | | Projected Benefit Obligation Exceeds the Fair Value of Plan’s Assets | | Accumulated Benefit Obligation Exceeds the Fair Value of Plan’s Assets |
| | | U.S. Plans | | Non-U.S. Plans | | U.S. Plans | | Non-U.S. Plans |
| (in millions) | | 2016 | | 2015 | | 2016 | | 2015 | | 2016 | | 2015 | | 2016 | | 2015 |
| Projected benefit obligation | | $ | 693.7 |
| | $ | 750.4 |
| | $ | 56.8 |
| | $ | 17.2 |
| | $ | 693.7 |
| | $ | 750.4 |
| | $ | 7.9 |
| | $ | 11.7 |
|
| Accumulated benefit obligation | | 693.7 |
| | 750.4 |
| | 51.0 |
| | 14.1 |
| | 693.7 |
| | 750.4 |
| | 6.3 |
| | 10.4 |
|
| Fair value of plan assets | | 641.4 |
| | 641.3 |
| | 50.2 |
| | 12.2 |
| | 641.4 |
| | 641.3 |
| | 3.6 |
| | 7.5 |
|
The Company’s general funding policy is to make contributions as required by applicable regulations and when beneficial to the Company for tax purposes. The employer contributions for the years ended December 31, 2016 and 2015, were $20.7 million and $2.9 million, respectively. Total expected cash contributions for 2017 are $4.0 million which are expected to satisfy plan and regulatory funding requirements.
For the years ended December 31, 2016 and 2015, the U.S. pension plans represented approximately 93 percent and 92 percent, respectively, of the Company’s total plan assets and approximately 92 percent and 93 percent, respectively, of the Company’s total projected benefit obligation. Considering the significance of the U.S. pension plans in comparison with the Company’s total pension plans, the critical pension assumptions related to the U.S. pension plans and the non-U.S. pension plans are separately presented and discussed below.
The Company’s actuarial valuation date is December 31. The weighted-average discount rates and rates of increase in future compensation levels used in determining the actuarial present value of the projected benefit obligation for the years ended December 31 are as follows:
|
| | | | | | | | | | | | |
| | | U.S. Pension Plans | | Non-U.S. Pension Plans |
| | | 2016 | | 2015 | | 2016 | | 2015 |
| Weighted-average discount rate | | 4.25 | % | | 4.25 | % | | 3.05 | % | | 3.96 | % |
| Rate of increase in future compensation levels | | — |
| | — |
| | 3.48 | % | | 3.71 | % |
The weighted-average discount rates, expected returns on plan assets, and rates of increase in future compensation levels used to determine the net benefit cost for the years ended December 31 are as follows:
|
| | | | | | | | | | | | | | | | | | |
| | | U.S. Pension Plans | | Non-U.S. Pension Plans |
| | | 2016 | | 2015 | | 2014 | | 2016 | | 2015 | | 2014 |
| Weighted-average discount rate | | 4.25 | % | | 4.00 | % | | 4.89 | % | | 3.96 | % | | 3.67 | % | | 4.25 | % |
| Expected return on plan assets | | 7.50 | % | | 7.50 | % | | 7.50 | % | | 6.08 | % | | 6.00 | % | | 5.78 | % |
| Rate of increase in future compensation levels | | — |
| | — |
| | — |
| | 3.71 | % | | 3.66 | % | | 3.93 | % |
The following benefit payments, which reflect expected future service, as appropriate, are expected to be paid: |
| | | | | | | | |
| (in millions) | | U.S. Pension Plans | | Non-U.S. Pension Plans |
| 2017 | | $ | 38.4 |
| | $ | 1.2 |
|
| 2018 | | 37.7 |
| | 1.2 |
|
| 2019 | | 40.2 |
| | 1.4 |
|
| 2020 | | 40.0 |
| | 1.6 |
|
| 2021 | | 40.6 |
| | 1.8 |
|
| Years 2022-2026 | | 207.7 |
| | 10.2 |
|
The Company's ERISA Benefit Plan Committee is responsible for overseeing the investments of the pension plans. The overall investment strategy is to achieve a long-term rate of return that maintains an adequate funded ratio and minimizes the need for future contributions through diversification of asset types, investment strategies, and investment managers. A target asset allocation policy is used to balance investments in equity securities with investments in fixed income securities. Beginning in 2013, the Company adopted a liability responsive asset allocation policy that becomes more conservative as the funded status of the plans improve. The majority of pension plan assets relate to U.S. plans and the target allocation is currently to invest approximately 65 percent in long-term corporate fixed income securities and approximately 35 percent in return seeking funds. The return seeking funds primarily include investments in diversified portfolios of domestic large cap and small cap companies. Fixed income securities include diversified investments across a broad spectrum of primarily investment-grade debt securities. To develop the expected long-term rate of return on assets assumption, the Company considered historical returns and future expectations. Using the Company’s 2017 target asset allocation based on a liability responsive asset allocation, the Company’s outside actuaries have used their independent economic model to calculate a range of expected long-term rates of return and, based on their results, the Company has determined these assumptions to be reasonable.
The pension plan assets measured at fair value at December 31, 2016 and 2015 follow:
|
| | | | | | | | | | | | | | | | | | | | | | | | |
| | | 2016 |
| | | U.S. Pension Plans | | Non-U.S. Pension Plans |
| | | Quoted Price In Active Markets for Identical Assets | | Significant Other Observable Inputs | | Significant Unobservable Inputs | | Quoted Price In Active Markets for Identical Assets | | Significant Other Observable Inputs | | Significant Unobservable Inputs |
| (in millions) | | (Level 1) | | (Level 2) | | (Level 3) | | (Level 1) | | (Level 2) | | (Level 3) |
| Cash and cash equivalents | | $ | 9.0 |
| | $ | 2.2 |
| | $ | — |
| | $ | — |
| | $ | — |
| | $ | — |
|
| Corporate debt securities | | — |
| | 248.5 |
| | — |
| | — |
| | — |
| | — |
|
| U.S. government debt securities | | 5.4 |
| | — |
| | — |
| | — |
| | — |
| | — |
|
| State and municipal debt securities | | — |
| | 18.4 |
| | — |
| | — |
| | — |
| | — |
|
| Registered investment company funds | | — |
| | — |
| | — |
| | 44.7 |
| | — |
| | — |
|
| Common trust funds | | — |
| | 357.9 |
| | — |
| | — |
| | 4.3 |
| | — |
|
| General insurance account | | — |
| | — |
| | — |
| | — |
| | — |
| | 1.2 |
|
| Balance at December 31, 2016 | | $ | 14.4 |
| | $ | 627.0 |
| | $ | — |
| | $ | 44.7 |
| | $ | 4.3 |
| | $ | 1.2 |
|
|
| | | | | | | | | | | | | | | | | | | | | | | | |
| | | 2015 |
| | | U.S. Pension Plans | | Non-U.S. Pension Plans |
| | | Quoted Price In Active Markets for Identical Assets | | Significant Other Observable Inputs | | Significant Unobservable Inputs | | Quoted Price In Active Markets for Identical Assets | | Significant Other Observable Inputs | | Significant Unobservable Inputs |
| (in millions) | | (Level 1) | | (Level 2) | | (Level 3) | | (Level 1) | | (Level 2) | | (Level 3) |
| Cash and cash equivalents | | $ | 18.8 |
| | $ | 8.8 |
| | $ | — |
| | $ | — |
| | $ | — |
| | $ | — |
|
| Corporate debt securities | | — |
| | 235.5 |
| | — |
| | — |
| | — |
| | — |
|
| U.S. government debt securities | | 2.5 |
| | — |
| | — |
| | — |
| | — |
| | — |
|
| State and municipal debt securities | | — |
| | 42.0 |
| | — |
| | — |
| | — |
| | — |
|
| Corporate common stock | | 151.9 |
| | 16.2 |
| | — |
| | — |
| | — |
| | — |
|
| Registered investment company funds | | 10.6 |
| | 144.9 |
| | — |
| | 44.9 |
| | — |
| | — |
|
| Common trust funds | | — |
| | 10.1 |
| | — |
| | — |
| | 4.0 |
| | — |
|
| General insurance account | | — |
| | — |
| | — |
| | — |
| | — |
| | 5.3 |
|
| Balance at December 31, 2015 | | $ | 183.8 |
| | $ | 457.5 |
| | $ | — |
| | $ | 44.9 |
| | $ | 4.0 |
| | $ | 5.3 |
|
Cash and cash equivalents. This category consists of direct cash holdings and institutional short-term investment vehicles. Direct cash holdings are valued based on cost, which approximates fair value and are classified as Level 1. Institutional short-term investment vehicles are valued daily and are classified as Level 2.
Corporate, U.S. government, state, and municipal debt securities. These securities are valued using market inputs including benchmark yields, reported trades, broker/dealer quotes, issuer spreads, benchmark securities, bids, offers and reference data including market research publications. Inputs may be prioritized differently at certain times based on market conditions.
Corporate common stock. This category includes common and preferred stocks and index mutual funds that track U.S. and foreign indices. Fair values for the common and preferred stocks are based on quoted prices in active markets and were therefore classified within Level 1 of the fair value hierarchy. The mutual funds were valued at the unit prices established by the funds' sponsors based on the fair value of the assets underlying the funds. Since the units of the funds are not actively traded, the fair value measurements have been classified within Level 2 of the fair value hierarchy.
Registered investment company funds. This category includes mutual funds that are actively traded on public exchanges. The funds are invested in equity and debt securities that are actively traded on public exchanges.
Common trust funds. Common trust funds consist of shares in commingled funds that are not publicly traded. The funds are invested in equity and debt securities that are actively traded on public exchanges.
General insurance account. The general insurance account is primarily comprised of insurance contracts that guarantee a minimum return.
The reconciliation of the beginning and ending balances of the fair value measurements using significant unobservable inputs (Level 3) for the years ended December 31, 2016 and 2015 follows:
|
| | | | |
| (in millions) | | General Insurance Account |
| Fair value of plan assets at December 31, 2014 | | $ | 5.5 |
|
| Actual return on plan assets | | 0.3 |
|
| Foreign currency exchange rate changes | | (0.5 | ) |
| Fair value of plan assets at December 31, 2015 | | 5.3 |
|
| Actual return on plan assets | | 0.2 |
|
| Purchases, sales and settlements, net | | (4.3 | ) |
| Fair value of plan assets at December 31, 2016 | | $ | 1.2 |
|
Note 11 — POSTRETIREMENT BENEFITS OTHER THAN PENSIONS
The Company sponsors several defined postretirement benefit plans that cover a majority of salaried and a portion of nonunion hourly employees in the U.S. These plans provide healthcare benefits and, in some instances, provide life insurance benefits. Postretirement health care plans are contributory, with retiree contributions adjusted annually. Further health care benefit accruals for all persons entitled to benefits under these plans were frozen as of March 31, 2014. The Company recorded a plan curtailment gain of $3.0 million related to the amendments in 2014. Effective February 1, 2016, participants under the age of 50 as of March 1, 2016, are no longer eligible for the postretirement health care plans. Life insurance plans are noncontributory.
Net periodic postretirement benefit costs included the following components for the years ended December 31, 2016, 2015, and 2014:
|
| | | | | | | | | | | | |
| (in millions) | | 2016 | | 2015 | | 2014 |
| Service cost - benefits earned during the year | | $ | — |
| | $ | — |
| | $ | 0.1 |
|
| Interest cost on accumulated postretirement benefit obligation | | 0.2 |
| | 0.3 |
| | 0.3 |
|
| Amortization of prior service credit | | (0.3 | ) | | — |
| | (0.2 | ) |
| Recognized actuarial net gain | | (0.7 | ) | | (0.3 | ) | | (0.3 | ) |
| Curtailment gain | | — |
| | — |
| | (3.6 | ) |
| Net periodic postretirement benefit income | | $ | (0.8 | ) | | $ | — |
| | $ | (3.7 | ) |
Changes in benefit obligation and plan assets, and a reconciliation of the funded status at December 31, 2016 and 2015, are as follows:
|
| | | | | | | | |
| (in millions) | | 2016 | | 2015 |
| Change in Benefit Obligation | | |
| | |
|
| Benefit obligation at the beginning of the year | | $ | 5.7 |
| | $ | 7.1 |
|
| Interest cost | | 0.2 |
| | 0.3 |
|
| Participant contributions | | 0.7 |
| | 0.8 |
|
| Plan amendments | | (1.1 | ) | | — |
|
| Actuarial gain | | (0.3 | ) | | (1.0 | ) |
| Benefits paid | | (1.0 | ) | | (1.5 | ) |
| Benefit obligation at the end of the year | | $ | 4.2 |
| | $ | 5.7 |
|
| | | | | |
| Change in Plan Assets | | |
| | |
|
| Fair value of plan assets at the beginning of the year | | $ | — |
| | $ | — |
|
| Participant contributions | | 0.7 |
| | 0.8 |
|
| Employer contributions | | 0.3 |
| | 0.7 |
|
| Benefits paid | | (1.0 | ) | | (1.5 | ) |
| Fair value of plan assets at the end of the year | | $ | — |
| | $ | — |
|
| | | | | |
| Unfunded status at year end: | | $ | (4.2 | ) | | $ | (5.7 | ) |
|
| | | | | | | | |
| (in millions) | | 2016 | | 2015 |
| Amount recognized in consolidated balance sheet consists of: | | |
| | |
|
| Accrued benefit liability, current | | $ | (0.4 | ) | | $ | (0.4 | ) |
| Accrued benefit liability, non-current | | (3.8 | ) | | (5.3 | ) |
| Sub-total | | (4.2 | ) | | (5.7 | ) |
| Deferred tax liability | | (2.2 | ) | | (2.0 | ) |
| Accumulated other comprehensive income | | (3.3 | ) | | (3.1 | ) |
| Net amount related to postretirement benefit plans | | $ | (9.7 | ) | | $ | (10.8 | ) |
Accumulated other comprehensive income related to other postretirement benefit plans is as follows:
|
| | | | | | | | |
| (in millions) | | 2016 | | 2015 |
| Unrecognized net actuarial gains | | $ | (4.7 | ) | | $ | (5.1 | ) |
| Net prior service costs | | (0.7 | ) | | — |
|
| Tax expense | | 2.1 |
| | 2.0 |
|
| Accumulated other comprehensive income, end of year | | $ | (3.3 | ) | | $ | (3.1 | ) |
Estimated amounts in accumulated other comprehensive income expected to be reclassified to net period cost during 2017 are as follows:
|
| | | |
| (in millions) | |
| Net actuarial gains | $ | 0.8 |
|
| Net prior service costs | 0.3 |
|
| Net amount to be reclassified to net period cost | $ | 1.1 |
|
The following benefit payments, which reflect expected future service, as appropriate, are expected to be paid:
|
| | | |
| (in millions) | Benefit Payments |
| 2017 | $ | 0.4 |
|
| 2018 | 0.4 |
|
| 2019 | 0.4 |
|
| 2020 | 0.4 |
|
| 2021 | 0.4 |
|
| Years 2022 - 2026 | 2.1 |
|
The employer contributions for the years ended December 31, 2016 and 2015 were $0.3 million and $0.7 million, respectively. The expected contribution for 2017 is $0.4 million which is expected to satisfy plan funding requirements.
The health care cost trend rate assumption affects the amounts reported. For measurement purposes, the assumed annual rate of increase in the per capita cost of covered health care benefits was 6.75 percent for 2016 and 7.5 percent for 2015; each year's estimated rate was assumed to decrease 0.25 percent annually to 5.0 percent and remain at that level thereafter. A one-percentage point change in assumed health care trends would have a nominal effect on both the total of service and interest cost components for 2016 and the post retirement benefit obligations at December 31, 2016.
The Company’s actuarial valuation date is December 31. The weighted-average discount rate used to determine the actuarial present value of the net postretirement projected benefit obligation for each of the years ended December 31, 2016 and 2015 was 4.25 percent. The weighted-average discount rates used to determine the net postretirement benefit cost was 4.25 percent, 4.00 percent, and 4.62 percent for the years ended December 31, 2016, 2015, and 2014, respectively.
Note 12 — MULTIEMPLOYER DEFINED BENEFIT PENSION PLANS
As of December 31, 2016, the Company no longer contributes to any multiemployer defined benefit pension plans.
In 2016, the Company withdrew from the Warehouse Employees Local 169 & Employers Joint Pension Fund as part of the closure of a Bemis Healthcare Packaging plant in Philadelphia, PA (refer to Note 6 - Divestitures and Plant Closures). The withdrawal liability was settled and paid in the January 2017. Company contributions to the plan were $0.0 million, $0.1 million, and $0.1 million in the years ended December 31, 2016, 2015, and 2014, respectively.
In 2014, the Company settled and paid a withdrawal liability for the withdrawal from the Central States Southeast and Southwest Areas Pension Fund as part of a Pressure Sensitive Materials plant closure in Stow, OH (refer to Note 6). Company contributions to the plan were $0.6 million in the year ended December 31, 2014.
Note 13 — STOCK INCENTIVE PLANS
In 2014, the Company adopted the 2014 Stock Incentive Plan, which replaced the 2007 Stock Incentive Plan. The 2014 Stock Incentive Plan provides for the issuance of up to 3,282,170 shares of common stock to certain employees and the Company's Board of Directors. The number of shares available under the 2014 Stock Incentive Plan represented the number of shares that were remaining available for issuance under the 2007 Stock Incentive Plan when the new plan was adopted as no further awards would be made under the prior plan. As of December 31, 2016, 2,448,067 shares were available for future grants under the 2014 Stock Incentive Plan. Shares subject to awards that are forfeited by an employee under the 2014 Stock Incentive Plan or the 2007 Stock Incentive Plan become available for future grants under the 2014 Stock Incentive Plan. Distribution of stock awards is made in the form of shares of the Company’s common stock on a one for one basis. Distribution of the shares will normally be made not less than three years, nor more than six years, from the date of the stock award grant to an employee. Prior to 2016, stock awards for directors were fully vested upon grant. Beginning in 2016, stock awards for directors generally vest one year from the date of the grant. All other stock awards granted under the plans are subject to restrictions as to continuous employment, except in the case of death, permanent disability, retirement or change in control.
Total compensation expense related to stock incentive plans was $18.1 million in 2016, $18.4 million in 2015, and $14.0 million in 2014. As of December 31, 2016, the unrecorded compensation cost for stock awards was $18.3 million and
will be recognized over the remaining vesting period for each grant which ranges between 2017 and 2019. The remaining weighted-average life of all stock awards outstanding as of December 31, 2016 was 0.96 years. These awards are considered equity-based awards and are therefore classified as a component of additional paid-in capital.
Cash payments equal to dividends on awards are distributed at the same time as the shares of common stock to which they relate.
Time-Based Stock Awards
The cost of time-based stock awards is based on the fair market value of the Company's common stock on the date of grant and is charged to income on a straight-line basis over the requisite service period. The per share fair value of time-based stock awards granted during the years ended December 31, 2016, 2015 and 2014 was $45.56, $45.18, and $40.65, respectively.
Performance-Based Stock Awards
Certain officers and key employees are also eligible to receive performance-based stock awards. Grantees of performance-based awards will be eligible to receive shares of the Company's common stock depending upon the Company's total shareholder return, assuming reinvestment of all dividends, relative to the performance of the Company's comparator group over a three-year period. The per share fair value of performance-based awards granted during the years ended December 31, 2016, 2015 and 2014 was $48.48, $53.14, and $46.42, respectively, which the Company determined using a Monte Carlo simulation and the following assumptions:
|
| | | | | | | | |
| | 2016 | | 2015 | | 2014 |
| Average risk-free interest rate | 1.31 | % | | 1.07 | % | | 0.76 | % |
| Expected volatility (Bemis Company, Inc.) | 16.3 | % | | 15.1 | % | | 19.7 | % |
The average risk-free interest rate is based on the three-year U.S. treasury security rate in effect as of the grant date. The expected volatilities were determined using daily historical volatility for the most recent three-year period as of the grant date. In 2017, there was a 94.7 percent payout of 2014 awards, and the balance was canceled. In 2016, there was a 93.7 percent payout of 2013 awards, and the balance was canceled. In 2015, there was a 59.5 percent payout of 2012 awards, and the balance was canceled. In 2014, there was no payout of 2011 awards and all awards were canceled.
The following table summarizes stock awards unit activity for the year ended December 31, 2016:
|
| | | | | | | | | | | | | |
| | Time-Based | | Performance-Based |
| | Weighted-average grant date share value | | Stock Awards (in thousands) | | Weighted-average grant date share value | | Stock Awards (in thousands) |
| Outstanding units granted at the beginning of the year | $ | 35.55 |
| | 1,425 |
| | $ | 44.68 |
| | 333 |
|
| Units granted | 45.56 |
| | 212 |
| | 48.48 |
| | 241 |
|
| Units paid (in shares) | 31.58 |
| | (854 | ) | | 37.32 |
| | (122 | ) |
| Units forfeited / canceled | 42.99 |
| | (37 | ) | | 41.89 |
| | (14 | ) |
| Outstanding units granted at the end of the year | 42.05 |
| | 746 |
| | 49.43 |
| | 438 |
|
Note 14 — LONG-TERM DEBT
Debt consisted of the following at December 31,
|
| | | | | | | | |
| (dollars in millions) | | 2016 | | 2015 |
| Commercial paper payable | | $ | 221.3 |
| | $ | 329.5 |
|
| 6.8% notes payable in 2019 | | 400.0 |
| | 400.0 |
|
| 4.5% notes payable in 2021 | | 400.0 |
| | 400.0 |
|
| Notes payable in 2022 | | 200.0 |
| | 200.0 |
|
| 3.1% notes payable in 2026 | | 300.0 |
| | — |
|
| Other debt, including debt of subsidiaries | | 14.7 |
| | 30.5 |
|
| Interest rate swap of 2021 notes (See Note 8) | | 1.3 |
| | 5.2 |
|
| Unamortized discounts and debt issuance costs | | (7.5 | ) | | (5.5 | ) |
| | | | | |
| Total debt | | 1,529.8 |
| | 1,359.7 |
|
| Less current portion | | 2.0 |
| | 5.8 |
|
| Total long-term debt | | $ | 1,527.8 |
| | $ | 1,353.9 |
|
Commercial paper has been classified as long-term debt to the extent of available long-term backup credit agreements, in accordance with the Company’s intent and ability to refinance such obligations on a long-term basis. The weighted-average interest rate of commercial paper outstanding at December 31, 2016, was 1.0 percent. The maximum amount of commercial paper outstanding during 2016 was $575.5 million, and the average outstanding during 2016 was $393.5 million. The weighted-average interest rate during 2016 was 0.8 percent.
As of December 31, 2016, the Company had available from its banks a $1.1 billion revolving credit facility. On July 22, 2016, the Company amended the revolving credit facility extending the terms of the agreement from August 12, 2018 to July 22, 2021. The revolving credit facility is supported by a group of major U.S. and international banks. Covenants imposed by the revolving credit facility include limits on the sale of businesses, minimum net worth calculations, and a maximum ratio of debt to total capitalization. The revolving credit agreement includes a combined $100 million multicurrency limit to support the financing needs of the Company’s international subsidiaries.
The $200 million term loan has an eight-year term and a variable interest rate based on the one-month London Interbank Offered Rate (LIBOR) plus a fixed spread. On September 15, 2016, the Company issued $300 million aggregate principal amount of senior notes due in 2026 with a fixed interest rate of 3.1 percent.
The scheduled maturities of the Company's long-term debt obligations for the next five years as of December 31, 2016, are as follows:
|
| | | | |
| Year | | Dollars (in millions) |
| 2017 | | $ | 221.3 |
|
| 2018 | | 1.7 |
|
| 2019 | | 403.7 |
|
| 2020 | | 1.7 |
|
| 2021 | | 401.7 |
|
Commercial paper has been classified as long-term liabilities in accordance with the Company's ability and intent to refinance such obligations on a long-term basis. The Company is in compliance with all debt covenants.
Note 15 — LEASES
The Company has leases for manufacturing plants, land, warehouses, machinery and equipment, and administrative offices that generally expire at various times over the next 15 years. Under most leasing arrangements, the Company pays the property taxes, insurance, maintenance, and other expenses related to the leased property. Total rental expense under operating leases was approximately $12.4 million in 2016, $13.9 million in 2015, and $13.3 million in 2014.
Minimum future obligations on leases in effect at December 31, 2016 were:
|
| | | |
| | Operating |
| (in millions) | Leases |
| 2017 | $ | 9.9 |
|
| 2018 | 8.1 |
|
| 2019 | 6.4 |
|
| 2020 | 5.1 |
|
| 2021 | 4.9 |
|
| Thereafter | 30.3 |
|
| Total minimum obligations | $ | 64.7 |
|
Note 16 — INCOME TAXES
|
| | | | | | | | | | | | |
| (in millions) | | 2016 | | 2015 | | 2014 |
| U.S. income before income taxes | | $ | 283.6 |
| | $ | 260.1 |
| | $ | 255.3 |
|
| Non-U.S. income before income taxes | | 67.3 |
| | 103.8 |
| | 108.4 |
|
| Income from continuing operations before income taxes | | $ | 350.9 |
| | $ | 363.9 |
| | $ | 363.7 |
|
| | | | | | | |
| Income tax expense consists of the following components: | | |
| | |
| | |
|
| Current tax expense: | | |
| | |
| | |
|
| U.S. federal | | $ | 63.2 |
| | $ | 71.8 |
| | $ | 82.6 |
|
| Foreign | | 20.1 |
| | 28.0 |
| | 31.2 |
|
| State and local | | 5.2 |
| | 8.0 |
| | 11.3 |
|
| Total current tax expense | | 88.5 |
| | 107.8 |
| | 125.1 |
|
| Deferred tax expense (benefit): | | |
| | |
| | |
|
| U.S. federal | | 26.7 |
| | 11.5 |
| | 1.0 |
|
| Foreign | | (3.9 | ) | | 2.1 |
| | (0.7 | ) |
| State and local | | 3.4 |
| | 0.6 |
| | (0.8 | ) |
| Total deferred tax expense (benefit) | | 26.2 |
| | 14.2 |
| | (0.5 | ) |
| Total income tax expense | | $ | 114.7 |
| | $ | 122.0 |
| | $ | 124.6 |
|
The tax effects of temporary differences that give rise to the deferred tax assets and deferred tax liabilities are presented below.
|
| | | | | | | | |
| (in millions) | | 2016 | | 2015 |
| Deferred Tax Assets: | | |
| | |
|
| Trade receivables, principally due to allowances for returns and doubtful accounts | | $ | 4.1 |
| | $ | 4.4 |
|
| Inventories, principally due to additional costs inventoried for tax purposes | | 22.9 |
| | 19.8 |
|
| Employee compensation and benefits accrued for financial reporting purposes | | 60.6 |
| | 92.1 |
|
| Foreign net operating losses | | 25.7 |
| | 21.7 |
|
| Foreign tax credits | | 24.1 |
| | 24.1 |
|
| Other | | 12.8 |
| | 12.0 |
|
| Total deferred tax assets | | 150.2 |
| | 174.1 |
|
| Less valuation allowance | | (40.3 | ) | | (42.0 | ) |
| Total deferred tax assets, after valuation allowance | | $ | 109.9 |
| | $ | 132.1 |
|
| | | | | |
| (in millions) | | 2016 | | 2015 |
| Deferred Tax Liabilities: | | |
| | |
|
| Plant and equipment, principally due to differences in depreciation and capitalized interest | | $ | 130.9 |
| | $ | 123.1 |
|
| Goodwill and intangible assets, principally due to differences in amortization | | 195.2 |
| | 177.6 |
|
| Total deferred tax liabilities | | 326.1 |
| | 300.7 |
|
| | | | | |
| Deferred tax liabilities, net | | $ | 216.2 |
| | $ | 168.6 |
|
The net deferred tax liabilities are reflected in the balance sheet as follows:
|
| | | | | | | | |
| (in millions) | | 2016 | | 2015 |
| Deferred charges and other assets | | $ | 3.5 |
| | $ | 3.8 |
|
| Deferred tax liabilities | | 219.7 |
| | 172.4 |
|
| Net deferred tax liabilities | | $ | 216.2 |
| | $ | 168.6 |
|
The Company’s effective tax rate differs from the federal statutory rate due to the following items:
|
| | | | | | | | | | | | | | | | | | | | | |
| | | 2016 | | 2015 | | 2014 |
| (dollars in millions) | | Amount | | % of Income Before Tax | | Amount | | % of Income Before Tax | | Amount | | % of Income Before Tax |
| Computed “expected” tax expense on income before taxes at federal statutory rate | | $ | 122.8 |
| | 35.0 | % | | $ | 127.4 |
| | 35.0 | % | | $ | 127.3 |
| | 35.0 | % |
| Increase (decrease) in taxes resulting from: | | |
| | |
| | |
| | |
| | |
| | |
|
| State and local income taxes net of federal income tax benefit | | 5.6 |
| | 1.6 |
| | 5.6 |
| | 1.5 |
| | 6.8 |
| | 1.9 |
|
| Foreign tax rate differential | | (7.4 | ) | | (2.1 | ) | | (7.5 | ) | | (2.1 | ) | | (7.4 | ) | | (2.0 | ) |
| Manufacturing tax benefits | | (5.8 | ) | | (1.7 | ) | | (6.7 | ) | | (1.8 | ) | | (7.5 | ) | | (2.1 | ) |
| Other | | (0.5 | ) | | (0.1 | ) | | 3.2 |
| | 0.9 |
| | 5.4 |
| | 1.5 |
|
| Actual income tax expense | | $ | 114.7 |
| | 32.7 | % | | $ | 122.0 |
| | 33.5 | % | | $ | 124.6 |
| | 34.3 | % |
The Company's overall tax expense is primarily driven by operations within the jurisdictions of the United States and Brazil. The Company's foreign tax rate differential is largely the result of lower statutory rates in the jurisdictions of its European operations as well as generally lower statutory rates in the remainder of the Company's foreign operating jurisdictions.
As of December 31, 2016, the Company had foreign net operating loss carryovers of approximately $85.3 million that are available to offset future taxable income. Approximately $23.9 million of the carryover expires over the period 2017-2033. The remaining balance has no expiration. In addition, the Company had $24.1 million of foreign tax credit carryover that is available to offset future tax. This carryover expires over the period 2018-2024.
Current authoritative guidance issued by the FASB requires that a valuation allowance be established when it is more likely than not that all or a portion of deferred tax assets will not be realized. The Company has, and continues to generate, both net operating losses and deferred tax assets in certain jurisdictions for which a valuation allowance is required. The Company’s management determined that a valuation allowance of $40.3 million and $42.0 million against deferred tax assets primarily associated with the foreign net operating loss carryover and the foreign tax credit carryover was necessary at December 31, 2016 and 2015, respectively.
Provision has not been made for U.S. or additional foreign taxes on $287.5 million of undistributed earnings of foreign subsidiaries because those earnings are considered to be indefinitely reinvested in the operations of those subsidiaries. It is not practical to estimate the amount of tax that might be payable on the eventual remittance of such earnings.
The Company had total unrecognized tax benefits of $32.9 million and $30.7 million at December 31, 2016 and 2015, respectively. The approximate amount of unrecognized tax benefits that would impact the effective income tax rate if recognized in any future periods was $32.9 million and $30.7 million for the years ended December 31, 2016 and 2015, respectively.
A reconciliation of the beginning and ending amount of unrecognized tax benefits, in millions, is as follows:
|
| | | | | | | | |
| | | 2016 | | 2015 |
| Balance at beginning of year | | $ | 30.7 |
| | $ | 24.1 |
|
| Additions based on tax positions related to the current year | | 2.3 |
| | 2.6 |
|
| Additions for tax positions of prior years | | 7.0 |
| | 11.5 |
|
| Reductions for tax positions of prior years | | (4.5 | ) | | (1.6 | ) |
| Reductions due to a lapse of the statute of limitations | | (1.7 | ) | | (4.7 | ) |
| Settlements | | (0.9 | ) | | (1.2 | ) |
| Balance at end of year | | $ | 32.9 |
| | $ | 30.7 |
|
The Company recognizes interest and penalties related to unrecognized tax benefits as components of income tax expense. The Company recognized $1.2 million, $1.5 million, and $0.4 million of net tax benefit related to interest and penalties during the years ended December 31, 2016, 2015, and 2014, respectively. The Company had approximately $13.2 million and $11.8 million accrued for interest and penalties, net of tax benefits, at December 31, 2016 and 2015, respectively.
As a result of acquisitions, the Company recorded $2.6 million and $6.8 million of unrecognized tax benefits in 2016 and 2015, respectively and $2.5 million and $7.2 million of interest and penalties related to pre-acquisition tax positions in 2016 and 2015, respectively. Corresponding assets related to these indemnified provisions have also been recorded for these amounts.
During the next 12 months it is reasonably possible that a reduction of gross unrecognized tax benefits will occur in an amount of up to $6.0 million, exclusive of currency movements, as a result of the resolution of positions taken on previously filed returns.
The Company and its subsidiaries are subject to U.S. federal and state income tax as well as income tax in multiple international jurisdictions. The Company's U.S. federal income tax returns prior to 2013 are no longer subject to examination. With few exceptions, the Company is no longer subject to examinations by tax authorities for years prior to 2011 in the significant jurisdictions in which it operates.
Note 17 — ACCUMULATED OTHER COMPREHENSIVE LOSS
The components and activity of accumulated other comprehensive loss are as follows:
|
| | | | | | | | | | | | |
| (in millions) | | Foreign Currency Translation | | Pension And Other Postretirement Liability Adjustment | | Accumulated Other Comprehensive Loss |
| December 31, 2013 | | $ | (8.0 | ) | | $ | (90.7 | ) | | $ | (98.7 | ) |
| Other comprehensive loss before reclassifications | | (129.4 | ) | | (59.1 | ) | | (188.5 | ) |
| Amounts reclassified from accumulated other comprehensive loss | | (13.9 | ) | | 9.4 |
| | (4.5 | ) |
| Net current period other comprehensive loss | | (143.3 | ) | | (49.7 | ) | | (193.0 | ) |
| December 31, 2014 | | (151.3 | ) | | (140.4 | ) | | (291.7 | ) |
| Other comprehensive loss before reclassifications | | (215.2 | ) | | (15.9 | ) | | (231.1 | ) |
| Amounts reclassified from accumulated other comprehensive loss | | — |
| | 12.9 |
| | 12.9 |
|
| Net current period other comprehensive loss | | (215.2 | ) | | (3.0 | ) | | (218.2 | ) |
| December 31, 2015 | | (366.5 | ) | | (143.4 | ) | | (509.9 | ) |
| Other comprehensive income before reclassifications | | 35.8 |
| | 13.8 |
| | 49.6 |
|
| Amounts reclassified from accumulated other comprehensive loss | | — |
| | 12.5 |
| | 12.5 |
|
| Net current period other comprehensive income | | 35.8 |
| | 26.3 |
| | 62.1 |
|
| December 31, 2016 | | $ | (330.7 | ) | | $ | (117.1 | ) | | $ | (447.8 | ) |
The following table summarizes amounts reclassified from accumulated other comprehensive loss:
|
| | | | | | | | |
| | | Twelve Months Ended December 31, |
| (in millions) | | 2016 | | 2015 |
| Pension and postretirement costs (See Notes 10 and 11) | | $ | 20.5 |
| | $ | 21.2 |
|
| Tax benefit | | (8.0 | ) | | (8.3 | ) |
| Pension and postretirement costs, net of tax | | $ | 12.5 |
| | $ | 12.9 |
|
Accumulated other comprehensive loss associated with pension and other postretirement liability adjustments are net of tax effects of $71.2 million and $89.0 million as of December 31, 2016 and 2015, respectively.
Note 18 — EARNINGS PER SHARE COMPUTATIONS
A reconciliation of basic and diluted earnings per share is below:
|
| | | | | | | | | | | | |
| (in millions, except per share amounts) | | 2016 | | 2015 | | 2014 |
| Numerator | | |
| | |
| | |
|
| Net income | | $ | 236.2 |
| | $ | 239.3 |
| | $ | 191.1 |
|
| | | | | | | |
| Denominator | | |
| | |
| | |
|
| Weighted-average common shares outstanding — basic | | 94.3 |
| | 96.7 |
| | 100.2 |
|
| Dilutive shares | | 0.8 |
| | 1.2 |
| | 1.0 |
|
| Weighted-average common and common equivalent shares outstanding — diluted | | 95.1 |
| | 97.9 |
| | 101.2 |
|
| | | | | | | |
| Per common share income | | |
| | |
| | |
|
| Basic | | $ | 2.51 |
| | $ | 2.47 |
| | $ | 1.91 |
|
| Diluted | | $ | 2.48 |
| | $ | 2.44 |
| | $ | 1.89 |
|
Certain stock awards outstanding were not included in the computation of diluted earnings per share above because they would not have had a dilutive effect. There were no anti-dilutive stock awards outstanding at December 31, 2016 and 2015. The excluded stock awards represented an aggregate of 0.3 million shares at December 31, 2014.
Note 19 — COMMITMENTS AND CONTINGENCIES
The Company is involved in a number of lawsuits incidental to its business, including environmental-related litigation and routine litigation arising in the ordinary course of business. Although it is difficult to predict the ultimate outcome of these cases, the Company believes, except as discussed below, that any ultimate liability would not have a material adverse effect on the Company’s consolidated financial condition or results of operations.
Environmental Matters
The Company is a potentially responsible party ("PRP") pursuant to the Comprehensive Environmental Response, Compensation and Liability Act of 1980 (commonly known as “Superfund”) and similar state and foreign laws in proceedings associated with 17 sites around the United States and one in Brazil. These proceedings were instituted by the United States Environmental Protection Agency and certain state and foreign environmental agencies at various times beginning in 1983. Superfund and similar state and foreign laws create liability for investigation and remediation in response to releases of hazardous substances in the environment. Under these statutes, joint and several liability may be imposed on waste generators, site owners and operators, and others regardless of fault. Although these regulations could require the Company to remove or mitigate the effects on the environment at various sites, perform remediation work at such sites, or pay damages for loss of use and non-use values, the Company expects its liability in these proceedings to be limited to monetary damages. The Company expects its future liability relative to these sites to be insignificant, individually and in the aggregate.
The Company is involved in other environmental-related litigation arising in the ordinary course of business. The Company accrues environmental costs when it is probable that these costs will be incurred and can be reasonably estimated. The Company's reserve for environmental liabilities at December 31, 2016 and 2015 was $3.5 million and $5.6 million, respectively.
Brazil Tax Dispute - Goodwill Amortization
During October 2013, Dixie Toga, Ltda ("Dixie Toga") received an income tax assessment in Brazil for the tax years 2009 through 2011 that relates to the amortization of certain goodwill generated from the acquisition of Dixie Toga. The income tax assessed for those years is approximately $11.7 million, translated to U.S. dollars at the December 31, 2016 exchange rate. The Company expects that tax examinations for years after 2011 will include similar assessments as the Company continues to claim the tax benefits associated with the goodwill amortization. An ultimate adverse resolution on
these assessments, including interest and penalties, could be material to the Company's consolidated results of operations and/or cash flows.
The Company has been advised by its legal and tax advisors that its position with respect to the deductions is allowable under the tax laws of Brazil. The Company is contesting the disallowance and believes it is more likely than not the tax benefit will be sustained in its entirety and consequently has not recorded a liability. The Company intends to litigate the matter if it is not resolved at the administrative appeals levels. The ultimate outcome will not be determined until the Brazilian tax appeal process is complete, which could take several years. At this time, the Company believes that final resolution of the assessment will not have a material impact on the Company's consolidated financial statements.
Brazil Investigation
On September 18, 2007, the Secretariat of Economic Law, a governmental agency in Brazil, which has now been replaced by the General Superintendence of the Administrative Council for Economic Defense (“CADE”), initiated an investigation into possible anti-competitive practices in the Brazilian flexible packaging industry against a number of Brazilian companies including a Dixie Toga subsidiary. The investigation relates to periods prior to the Company's acquisition of control of Dixie Toga and its subsidiaries.
In late November 2016, the investigative arm of CADE issued an advisory opinion recommending, among other actions, the imposition of fines on Itap Bemis, a Dixie Toga subsidiary. The case will now be sent to the CADE Tribunal, which will decide to either accept or decline the recommendation. The Company expects that the Tribunal decision will be issued in 2017.
In the event of an adverse decision, it is difficult to predict possible fines, but based on CADE's current fining practice, the fines assessed could be as high as $60 million, depending on CADE’s determination of the applicable revenue base for the calculation of the fine. The Company intends to vigorously defend its position and plans to appeal any adverse decision by the Tribunal. Upon appeal, the Company would likely be required to post bond, deposit funds equal to the assessed fines, or provide other collateral. The Company is unable at this time to predict the outcome of this matter, but believes it is not probable that an adverse judgment would stand after exhausting all appeals which are likely to take several years and therefore no provision has been made in the consolidated financial statements.
Note 20 — SEGMENTS OF BUSINESS
The Company's business activities are organized around and aggregated into its two principal business segments, U.S. Packaging and Global Packaging, based on their similar economic characteristics, products, production process, types of customers, and distribution methods. Both internal and external reporting conforms to this organizational structure, with no significant differences in accounting policies applied. Intersegment sales (which are not significant) are generally priced to reflect nominal markups.
The Company evaluates the performance of its segments and allocates resources to them based primarily on operating profit, which is defined as profit before restructuring and acquisition-related costs, general corporate expense, interest expense, other non-operating income, and income taxes. In the fourth quarter of 2016, the tables below were recasted to more clearly reflect that operating segment performance is evaluated based on operating profit before restructuring and acquisition-related costs.
Sales to the Kraft Heinz Company, and its subsidiaries, accounted for approximately 11 and 12 percent of the Company's sales in 2016 and 2015, respectively. The Company primarily sells to Kraft Heinz Company in the U.S. Packaging segment.
Products produced within the U.S. and Global Packaging business segments service packaging applications for markets such as food, medical devices, pharma, personal care, agribusiness, chemicals, pet food, and consumer products.
A summary of the Company’s business activities reported by its two business segments follows:
|
| | | | | | | | | | | | |
| Business Segments (in millions) | | 2016 | | 2015 | | 2014 |
| Sales including intersegment sales: | | | | |
| | |
|
| U.S. Packaging | | $ | 2,646.8 |
| | $ | 2,772.8 |
| | $ | 2,889.5 |
|
| Global Packaging | | 1,403.4 |
| | 1,345.6 |
| | 1,507.6 |
|
| | | | | | | |
| Intersegment sales: | | | | | | |
| U.S. Packaging | | (25.7 | ) | | (25.3 | ) | | (28.8 | ) |
| Global Packaging | | (20.1 | ) | | (21.7 | ) | | (24.8 | ) |
| Total net sales | | $ | 4,004.4 |
| | $ | 4,071.4 |
| | $ | 4,343.5 |
|
| | | | | | | |
| Segment operating profit | | | | |
| | |
|
| U.S. Packaging | | $ | 400.0 |
| | $ | 391.8 |
| | $ | 375.8 |
|
| Global Packaging | | 114.0 |
| | 116.5 |
| | 113.3 |
|
| | | | | | | |
| Restructuring and acquisition-related costs | | 28.6 |
| | 12.1 |
| | — |
|
| General corporate expenses | | 76.1 |
| | 86.6 |
| | 81.4 |
|
| Operating income | | 409.3 |
| | 409.6 |
| | 407.7 |
|
| | | | | | | |
| Interest expense | | 60.2 |
| | 51.7 |
| | 60.8 |
|
| Other non-operating income | | (1.8 | ) | | (6.0 | ) | | (16.8 | ) |
| | | | | | | |
| Income from continuing operations before income taxes | | $ | 350.9 |
| | $ | 363.9 |
| | $ | 363.7 |
|
|
| | | | | | | | | | | | |
| Business Segments (in millions) | | 2016 | | 2015 | | 2014 |
| Total assets (1): | | | | | | |
| U.S. Packaging | | $ | 2,007.7 |
| | $ | 1,982.5 |
| | $ | 1,977.9 |
|
| Global Packaging | | 1,485.3 |
| | 1,291.5 |
| | 1,345.3 |
|
| Corporate assets (2) | | 222.7 |
| | 215.8 |
| | 287.6 |
|
| Total | | $ | 3,715.7 |
| | $ | 3,489.8 |
| | $ | 3,610.8 |
|
| | | | | | | |
| Restructuring and acquisition-related costs (3): | | | | | | |
| Global Packaging | | $ | 26.6 |
| | $ | 9.4 |
| | $ | — |
|
| Corporate | | 2.0 |
| | 2.7 |
| | — |
|
| Total | | $ | 28.6 |
| | $ | 12.1 |
| | $ | — |
|
| | | | | | | |
| Depreciation and amortization: | | | | | | |
| U.S. Packaging | | $ | 93.7 |
| | $ | 97.8 |
| | $ | 96.3 |
|
| Global Packaging | | 54.1 |
| | 47.7 |
| | 62.1 |
|
| Corporate | | 14.3 |
| | 12.6 |
| | 11.7 |
|
| Total continuing operations | | 162.1 |
| | 158.1 |
| | 170.1 |
|
| Discontinued operations | | — |
| | — |
| | 10.5 |
|
| Total | | $ | 162.1 |
| | $ | 158.1 |
| | $ | 180.6 |
|
| | | | | | | |
| Additions to property and equipment: | | | | | | |
| U.S. Packaging | | $ | 131.2 |
| | $ | 127.5 |
| | $ | 105.5 |
|
| Global Packaging | | 69.7 |
| | 79.4 |
| | 51.0 |
|
| Corporate | | 7.4 |
| | 12.5 |
| | 23.8 |
|
| Total continuing operations | | 208.3 |
| | 219.4 |
| | 180.3 |
|
| Discontinued operations | | — |
| | — |
| | 4.9 |
|
| Total | | $ | 208.3 |
| | $ | 219.4 |
| | $ | 185.2 |
|
| | | | | | | |
|
| | | | | | | | | | | | |
| Operations by geographic area (in millions) | | 2016 | | 2015 | | 2014 |
| Net sales (4): | | |
| | |
| | |
|
| United States | | $ | 2,820.3 |
| | $ | 2,937.8 |
| | $ | 3,040.8 |
|
| Brazil | | 483.5 |
| | 442.5 |
| | 581.5 |
|
| Other Americas | | 244.6 |
| | 273.5 |
| | 273.2 |
|
| Europe | | 263.5 |
| | 233.9 |
| | 258.8 |
|
| Asia-Pacific | | 192.5 |
| | 183.7 |
| | 189.2 |
|
| Total | | $ | 4,004.4 |
| | $ | 4,071.4 |
| | $ | 4,343.5 |
|
| | | | | | | |
| Long-lived assets (5): | | |
| | |
| | |
|
| United States | | $ | 949.2 |
| | $ | 897.4 |
| | $ | 831.8 |
|
| Brazil | | 212.9 |
| | 173.1 |
| | 159.0 |
|
| Other Americas | | 44.1 |
| | 53.1 |
| | 55.7 |
|
| Europe | | 75.1 |
| | 68.6 |
| | 68.1 |
|
| Asia-Pacific | | 81.3 |
| | 75.6 |
| | 72.4 |
|
| Total | | $ | 1,362.6 |
| | $ | 1,267.8 |
| | $ | 1,187.0 |
|
| |
(1) | Total assets by business segment include only those assets that are specifically identified with each segment’s operations. |
| |
(2) | Corporate assets are principally cash and cash equivalents, prepaid expenses, prepaid income taxes, prepaid pension benefit costs, and corporate tangible and intangible property. The Company utilizes a global cash pooling arrangement. The Company treats all cash and cash equivalents, including the net cash position in the cash pooling arrangement, as Corporate assets. |
| |
(3) | These amounts are excluded from segment operating profit and general corporate expenses. |
| |
(4) | Net sales are attributed to geographic areas based on location of the Company’s manufacturing or selling operation. |
| |
(5) | Long-lived assets include net property and equipment, long-term receivables, deferred charges, and investment in affiliates. |
Note 21 — QUARTERLY FINANCIAL INFORMATION — UNAUDITED
|
| | | | | | | | | | | | | | | | | | | | |
| | | Quarter Ended |
| (in millions, except per share amounts) | | March 31 | | June 30 | | September 30 | | December 31 | | Total |
| 2016 | | |
| | |
| | |
| | |
| | |
|
| Net sales | | $ | 967.9 |
| | $ | 1,021.3 |
| | $ | 1,027.2 |
| | $ | 988.0 |
| | $ | 4,004.4 |
|
| Gross profit | | 208.8 |
| | 217.0 |
| | 224.8 |
| | 215.6 |
| | 866.2 |
|
| Net income | | 56.2 |
| | 50.9 |
| | 68.6 |
| | 60.5 |
| | 236.2 |
|
| | | | | | | | | | | |
| Basic earnings per share: | | | | | | | | | | |
| Net income | | 0.59 |
| | 0.54 |
| | 0.73 |
| | 0.65 |
| | 2.51 |
|
| | | | | | | | | | | |
| Diluted earnings per share: | | | | | | | | | | |
| Net income | | 0.59 |
| | 0.53 |
| | 0.72 |
| | 0.64 |
| | 2.48 |
|
| | | | | | | | | | | |
| 2015 | | |
| | |
| | |
| | |
| | |
|
| Net sales | | $ | 1,040.1 |
| | $ | 1,030.3 |
| | $ | 1,018.3 |
| | $ | 982.7 |
| | $ | 4,071.4 |
|
| Gross profit | | 217.5 |
| | 221.2 |
| | 221.8 |
| | 212.9 |
| | 873.4 |
|
| Income from continuing operations | | 57.0 |
| | 65.6 |
| | 62.5 |
| | 56.8 |
| | 241.9 |
|
| Loss from discontinued operations | | (2.6 | ) | | — |
| | — |
| | — |
| | (2.6 | ) |
| Net income | | 54.4 |
| | 65.6 |
| | 62.5 |
| | 56.8 |
| | 239.3 |
|
| | | | | | | | | | | |
| Basic earnings per share: | | | | | | | | | | |
| Income from continuing operations | | 0.58 |
| | 0.68 |
| | 0.65 |
| | 0.59 |
| | 2.50 |
|
| Loss from discontinued operations | | (0.03 | ) | | — |
| | — |
| | — |
| | (0.03 | ) |
| Net income | | 0.55 |
| | 0.68 |
| | 0.65 |
| | 0.59 |
| | 2.47 |
|
| | | | | | | | | | | |
| Diluted earnings per share: | | | | | | | | | | |
| Income from continuing operations | | 0.58 |
| | 0.67 |
| | 0.64 |
| | 0.58 |
| | 2.47 |
|
| Loss from discontinued operations | | (0.03 | ) | | — |
| | — |
| | — |
| | (0.03 | ) |
| Net income | | 0.55 |
| | 0.67 |
| | 0.64 |
| | 0.58 |
| | 2.44 |
|
ITEM 9 — CHANGES IN AND DISAGREEMENTS WITH ACCOUNTANTS ON ACCOUNTING AND FINANCIAL DISCLOSURE
None.
ITEM 9A — CONTROLS AND PROCEDURES
(a) Management’s Conclusion Regarding the Effectiveness of Disclosure Controls and Procedures
The Company’s management, under the direction, supervision, and involvement of the Chief Executive Officer and the Chief Financial Officer, has carried out an evaluation, as of the end of the period covered by this report, of the effectiveness of the design and operation of the disclosure controls and procedures (as defined in Exchange Act Rules 13a-15(e) under the Securities Exchange Act of 1934 (the “Exchange Act”)) of the Company. Based on this evaluation, the Chief Executive Officer and the Chief Financial Officer have concluded that disclosure controls and procedures in place at the Company are effective to ensure that information required to be disclosed by the Company in the reports that it files or submits under the Exchange Act is recorded, processed, summarized, and reported within the time periods specified by the Securities and Exchange Commission’s rules and forms and is accumulated and communicated to our management, including the Chief Executive Officer and the Chief Financial Officer, as appropriate to allow timely decisions regarding required disclosure.
(b) Management’s Report on Internal Control Over Financial Reporting
The management of Bemis Company, Inc. is responsible for establishing and maintaining adequate internal control over financial reporting, as such term is defined in Exchange Act Rule 13a-15(f). Under the direction, supervision, and participation of the Chief Executive Officer and the Chief Financial Officer, the Company’s management conducted an evaluation of the effectiveness of internal control over financial reporting based on the framework in Internal Control - Integrated Framework (2013) issued by the Committee of Sponsoring Organizations of the Treadway Commission (COSO-Framework (2013)). Based on the results of this evaluation, management has concluded that internal control over financial reporting was effective as of December 31, 2016.
The effectiveness of our internal control over financial reporting as of December 31, 2016, has been audited by PricewaterhouseCoopers LLP, an independent registered public accounting firm, as stated in their report, which appears on page 30 of this Form 10-K.
(c) Changes in Internal Control Over Financial Reporting
There were no changes in the Company’s internal control over financial reporting during the most recent fiscal quarter that have materially affected, or is reasonably likely to materially affect, the Company’s internal control over financial reporting.
ITEM 9B — OTHER INFORMATION
None.
PART III
ITEM 10 — DIRECTORS, EXECUTIVE OFFICERS AND CORPORATE GOVERNANCE
The information required to be submitted in response to this item with respect to directors is omitted because a definitive proxy statement containing such information will be filed with the Securities and Exchange Commission pursuant to Regulation 14A within 120 days after December 31, 2016, and such information is expressly incorporated herein by reference.
The following sets forth the name, age, and business experience for at least the last five years of the principal executive officers of the Company. Unless otherwise indicated, positions shown are with the Company.
|
| | | | |
Name (Age) |
| Positions Held |
| Period The Position
Was Held |
William F. Austen (58)(60) | | President and Chief Executive Officer | | 2014 to present |
| | Executive Vice President and Chief Operating Officer | | 2013 to 2014 |
| | Group President | | 2012 to 2013 |
| | Vice President — Operations | | 2004 to 2012 |
| | President and Chief Executive Officer — Morgan Adhesives Company (1) | | 2000 to 2004 |
| | | | |
Michael B. Clauer (59)(61) | | Senior Vice President and Chief Financial Officer | | 2017 to present |
| | Vice President and Chief Financial Officer | | 2014 to 2016 |
| | Executive Vice President and Chief Financial Officer — BWAY Corporation | | 2009 to 2014 |
| | | | |
Sheri H. Edison (60)(62) | | Senior Vice President, Chief Legal Officer and Secretary | | 2017 to present |
| | Vice President, General Counsel, and Secretary | | 2010 to 2016 |
| | Senior Vice President and Chief Administrative Officer, Hill-Rom, Inc. | | 2007 to 2010 |
| | Vice President, General Counsel, and Secretary, Hill-Rom, Inc. | | 2003 to 2007 |
| | | | |
Timothy S. Fliss (54)(56) | | Senior Vice President and Chief Human Resources Officer | | 2017 to present |
| | Vice President — Human Resources | | 2010 to 2016 |
| | Executive Vice President — Human Resources, Schneider National, Inc. | | 2003 to 2009 |
| | Vice President — Human Resources, Schneider National, Inc. | | 1995 to 2003 |
| | Various operational positions within Schneider National, Inc. | | 1990 to 1995 |
| | | | |
William E. Jackson (54)(56) | | Senior Vice President and Chief Technology Officer | | 2017 to present |
| | Vice President and Chief Technology Officer | | 2013 to 2016 |
| | Vice President of Global Research and Development — Dow Building and Construction | | 2007 to 2013 |
| | Various management positions — General Electric | | 1992 to 2007 |
| | | | |
Jerry S. Krempa (56)(58) | | Vice President and Chief Accounting Officer | | 2017 to present |
| | Vice President and Controller | | 2011 to 2016 |
| | Various finance management positions within the Company | | 1998 to 2011 |
| | | | |
James W. Ransom (56)Louis “Fred” Stephan (53) | | President, Bemis North America | | 2017 to present |
| | Senior Vice President & General Manager of the Insulation Systems - Johns Manville | | 20142011 to present |
| | President — Bemis North America | | 2014 to present |
| | Group President | | 2012 to 2014 |
| | Vice President — Operations | | 2007 to 2012 |
| | Various management positions within the Company | | 2002 to 20062017 |
(1) Identified operation was a 100 percent owned subsidiary or division of the Company.