|
| |||
Delaware | 64-0500378 | |||
| (State or other Jurisdiction of Incorporation or Organization) | (I.R.S. Employer Identification No.) | |||
39209-3409
| Title of each Class: | Name of exchange on which registered: | |||
Common Stock, $0.01 par value per share | The NASDAQ Global Select Market | |||
Yes ☒x No ☐
¨
Yes ☐¨ No ☒
x
Yes ☒x No ☐
¨
Yes ☒x No ☐
¨
Large accelerated filer | Accelerated filer | |
Non-accelerated filer (Do not check if a smaller reporting company) | Smaller reporting company | |
Emerging growth company ¨ | ||
If an emerging growth company, indicate by check mark if the registrant has elected not to use the extended transition period for complying with any new or revised financial accounting standards provided pursuant to Section 13(a) of the Exchange Act ¨ | ||
Yes ☐¨ No ☒
x
$1,239,719,614.
1
TABLE OF CONTENTS
| Item | Page Number | ||
| 1. | |||
| 1A. | |||
| 1B. | |||
| 2. | |||
| 3. | |||
| 4. | |||
| 5. | |||
| 6. | |||
| 7. | |||
| 7A. | |||
| 8. | |||
| 9. | |||
| 9A. | |||
| 9B. | |||
| 10. | |||
| 11. | |||
| 12. | |||
| 13. | |||
| 14. | |||
| 15. | |||
|
|
| |
Item |
| Page Number | |
|
| ||
| Part I |
| |
|
| ||
| 3 | |||
1. | 3 | ||
1A. | 8 | ||
1B. | 13 | ||
2. | 13 | ||
3. | 13 | ||
4. | 15 | ||
|
|
| |
| Part II |
| |
|
|
| |
5. | Market for the Registrant’s Common Equity, Related Stockholder Matters and Issuer Purchases of |
| |
| 16 | ||
6. | 18 | ||
7. | Management’s Discussion and Analysis of Financial Condition and Results of Operations | 19 | |
7A. | 34 | ||
8. | 35 | ||
9. | Changes in and Disagreements with Accountants on Accounting and Financial Disclosure | 65 | |
9A. | 65 | ||
9B. | 67 | ||
|
|
| |
| Part III |
| |
|
|
| |
10. | 67 | ||
11. | 67 | ||
12. | Security Ownership of Certain Beneficial Owners and Management and Related Stockholder Matters. | 67 | |
13. | Certain Relationships and Related Transactions, and Director Independence | 67 | |
14. | 68 | ||
|
|
| |
|
|
| |
| Part IV |
| |
|
|
| |
15. | 69 | ||
|
|
| |
| 72 | ||
2
PART I
We operate in a single segment. Our primary business
retailers.
3
market, and distribute private label specialty shell eggs to several customers.
eventually above pre-AI levels, with a younger, more productive hen population, along with reduced demand for egg products resulted in an oversupply of eggs, leading to decreased egg prices in fiscal 2017.
2018.
As a resultWe continue to upgrade and modify our facilities, and invest in new facilities, to meet changing demand as many food service customers, restaurant chains, and retailers have committed to exclusive offerings of our strategy, ourcage-free eggs over the next several years.
4
We continue to pursue opportunities to acquire companies engaged in the production and sale of shell eggs. We will continue to evaluate and selectively pursue acquisitions that will expand our shell egg production capabilities in existing markets and broaden our geographic reach. We have extensive experience identifying, valuing, executing, and integrating acquisitions and we intend to leverage that experience in the evaluation and execution of future acquisitions. We will seek to acquire regional shell egg businesses with significant market share and long-standing customer relationships. We believe enhancing our national presence will help us further strengthen our relationships with existing customers, many of whom have operations across the U.S.
5
Egg production activities are subject to risks inherent in the agriculture industry, such as weather conditions and disease. These risks are outside our control and could have a material adverse effect on our operations. The marketability of shell eggs is subject to risks such as possible changes in food consumption preferences and practices reflecting perceived health concerns.
6
Specialty Eggs.We produce specialty eggs such as Egg-Land’s Best®, Land O’ Lakes®, 4Grain®, and Farmhouse® branded eggs. Specialty eggs are intended to meet the demands of consumers who are sensitive to environmental, health and/or animal welfare issues. Specialty shell eggs are becoming a more significant segment of the shell egg market. During our fiscal 2016 an increasing number of large restaurant chains, food service companies and grocery chains, including our largest customers, announced goals to transition to a cage-free egg supply chain by specified future dates. For fiscal 2015,2017, specialty eggs accounted for 27.2%43.6% of our shell egg dollar sales and 19.8%22.9% of our shell egg dozens sold, as compared to 24.3%29.1% of shell egg dollar sales and 17.2%22.9% of shell egg dozens sold in fiscal 2014.2016. Additionally, specialty eggs sold through our co-pack arrangements accounted for an additional 2.8%3.1% of shell egg dollar sales and 1.6% of shell egg dozens sold in fiscal 2017, compared with 2.7% of shell egg dollar sales and 2.0% of shell egg dozens sold in fiscal 2015, compared with 3.8% of shell egg dollar sales and 2.7% of shell egg dozens sold in fiscal 2014.2016. We produce and process Egg-Land’s Best® and Land O’ Lakes®branded eggs under license from EB at our facilities under EB guidelines. The product is marketed to our established base of customers at premium prices compared to non-specialty shell eggs. Egg-Land’s Best® branded eggs accounted for approximately 15.5%23.2% of our shell egg dollar sales in fiscal 2015,2017, compared to 14.4%16.8% in fiscal 2014.2016. Based on dozens sold, Egg-Land’s Best® branded eggs accounted for 11.4%12.5% of dozens sold for fiscal 2015,2017, compared to 10.1%13.6% in fiscal 2014.2016. Land O’ Lakes® branded eggs are produced by hens that are fed a whole grain diet, with nofree of animal fat and no animal by-products. Farmhouse® brand eggs are produced at our facilities by cage freecage-free hens that are provided with a diet of all grain, vegetarian feed. OurWe market organic, wholesome, cage-free, vegetarian, and omega-3 eggs under our 4Grain® 4-Grain® brand, which consists of both caged and cage freecage-free eggs. Farmhouse®, Land O’ Lakes®, 4Grain® and other non-Egg-Land’s Best® specialty eggs accounted for 11.7%20.4% of our shell egg dollar sales in fiscal 2015,2017, compared to 9.9%12.3% in fiscal 2014,2016, and 8.4%10.4% of dozens sold for fiscal 2015,2017, compared to 7.1%9.3% for fiscal 2014.2016.
In addition, rules are often proposed that, if adopted as proposed, could increase our costs. For example, in April 2016 the USDA Agricultural Marketing Service proposed rules that, if adopted, will change requirements, and increase our costs to produce organic eggs. As of July 2017, the proposed rules have not become effective.
7
Employees. As of May 30, 2015,June 3, 2017, we had 2,8723,578 employees, of whom 2,1902,976 worked in egg production, processing and marketing, 175178 worked in feed mill operations and 422424 were administrative employees, including our executive officers. Approximately 4.3%3.9% of our personnel are part-time. None of our employees are covered by a collective bargaining agreement. We consider our relations with employees to be good.
under pressure and do not expect to see meaningful improvement until there is a better balance of supply and demand.
8
A decline in consumer demand for shell eggs can negatively impact our business.
| will identify suitable acquisition candidates; |
| can consummate acquisitions on acceptable terms; |
| can successfully integrate an acquired business into our operations; or |
| can successfully manage the operations of an acquired business. |
9
The consideration we pay in connection with any acquisition also affects our financial results. If we pay cash, we could be required to use a portion of our available cash to consummate the acquisition. To the extent we issue shares of our Common Stock, existing stockholders may be diluted. In addition, acquisitions may result in the incurrence of debt.
In addition, rules are often proposed that, if adopted as proposed, could increase our costs. For example, in April 2016 the USDA Agricultural Marketing Service proposed rules that, if adopted, would change requirements, and increase our costs to produce organic eggs. As of July 2017, the proposed rules have not become effective.
10
Beginning inFrom April ofthrough June 2015, our industry has experienced a significant avian influenza outbreak, primarily in the upper Midwestern United States. At the time of this filing, basedU.S. Based on several published industry estimates, we believe that approximately 13%12% of the national flock of laying hens has beenwas affected. The affected laying hens havewere either been destroyed by the disease or euthanized. The effect this outbreak has had on our industry and our company is discussed throughout this filing.report. There have been no positive tests for avian influenza at any of our locations, and we arelocations. We have significantly increasingincreased the biosecurity measures at all of our facilities,facilities; however we cannot be certain that our flocks will not be affected.
affected by AI or other diseases in the future.
11
The Adams family intendsand Baker families intend to retain ownership of a sufficient amount of Common Stock and Class A Common Stock to assure its continued ownership of over 50% of the combined voting power of our outstanding shares of capital stock. Such ownership will make an unsolicited acquisition of the Company more difficult and discourage certain types of transactions involving a change of control of our Company, including transactions in which the holders of Common Stock might otherwise receive a premium for their shares over then current market prices. In addition, certain provisions of our Certificate of Incorporation require that our Class A Common Stock be issued only to Fred R. Adams, Jr. and members of his immediate family, and if shares of our Class A Common Stock, by operation of law or otherwise, are deemed not to be owned by Mr. Adams or a member of his immediate family, the voting power of any such shares shall be automatically reduced to one vote per share. The Adams family’sand Baker families’ controlling ownership of our capital stock may adversely affect the market price of our Common Stock.
12
The efficient operation of our business depends on our information technology systems. We rely on our information technology systems to effectively manage our business data, communications, logistics, accounting and other business processes. If we do not allocate and effectively manage the resources necessary to build and sustain an appropriate technology environment, our business or financial results could be negatively impacted. In addition, our information technology systems may be vulnerable to damage or interruption from circumstances beyond our control, including systems failures, viruses, ransomware, security breaches or cyber incidents such as intentional cyber-attacks aimed at theft of sensitive data or inadvertent cyber-security compromises.
13
Egg Antitrust Litigation
Since September 25, 2008, the Company has been named as one of several defendants in numerous antitrust cases involving the United States shell egg industry. In some of these cases, the named plaintiffs allege that they purchased eggs or egg products directly from a defendant and have sued on behalf of themselves and a putative class of others who claim to be similarly situated. In other cases, the named plaintiffs allege that they purchased shell eggs and egg products directly from one or more of the defendants but sue only for their own alleged damages and not on behalf of a putative class. In the remaining cases, the named plaintiffs are individuals or companies who allege that they purchased shell eggs indirectly from one or more of the defendants - that is, they purchased from retailers that had previously purchased from defendants or other parties – and have sued on behalf of themselves and a putative class of others who claim to be similarly situated.
The Judicial Panel on Multidistrict Litigation consolidated all of the putative class actions (as well as certain other cases in which the Company was not a named defendant) for pretrial proceedings in the United States District Court for the Eastern District of Pennsylvania. The Pennsylvania court has organized the putative class actions around two groups (direct purchasers and indirect purchasers) and has named interim lead counsel for the named plaintiffs in each group.
The Direct Purchaser Putative Class Action. The direct purchaser putative class cases were consolidated into In re: Processed Egg Products Antitrust Litigation, No. 2:08-md-02002-GP, in the United States District Court for the Eastern District of Pennsylvania. On November 25, 2014, after approving the parties’ settlement of the case, the Court entered final judgment dismissing all claims against the Company with prejudice and dismissing the Company from this direct purchaser class action. On January 23, 2015, direct action plaintiffs Kraft Foods Global, Inc., General Mills, Inc., Nestle USA, Inc., and The Kellogg Company filed a motion either to exclude themselves from the settlement between the direct purchaser plaintiffs and the Company or to enlarge their time to opt-out of the settlement between the direct purchaser plaintiffs and the Company and modify the final judgment entered on November 25, 2014. On February 13, 2015, the Company filed its response in opposition. On July 1, 2015, the Court held an evidentiary hearing on this motion. The Court has not ruled on this motion.
The Indirect Purchaser Putative Class Action. The indirect purchaser putative class cases were consolidated into In re: Processed Egg Products Antitrust Litigation, No. 2:08-md-02002-GP, in the United States District Court for the Eastern District of Pennsylvania. The court granted with prejudice the defendants’ renewed motion to dismiss damages claims arising outside the limitations period applicable to most causes of action. On April 20-21, 2015, the Court held an evidentiary hearing on the indirect purchaser plaintiffs’ motion for class certification. The Court has not ruled on that motion. On July 2, 2015, the Company filed and joined several motions for summary judgment that sought either dismissal of the entire case or, in the alternative, dismissal of portions of the case. On July 2, 2015, the indirect purchaser plaintiffs filed motions for summary judgment seeking dismissal of certain affirmative defenses based on statutory immunities from federal and state antitrust laws. Briefing on the parties’ respective motions for summary judgment will continue over the next two months, and the Court has not indicated when it will rule on these motions.
The Non-Class Cases. Six of the cases in which plaintiffs do not seek to certify a class have been consolidated with the putative class actions into In re: Processed Egg Products Antitrust Litigation, No. 2:08-md-02002-GP, in the United States District Court for the Eastern District of Pennsylvania. The court granted with prejudice the defendants’ renewed motion to dismiss the non-class plaintiffs’ claims for damages arising before September 24, 2004. The parties have completed nearly all fact discovery related to these cases. On July 2, 2015, the Company filed and joined several motions for summary judgment that sought either dismissal of all of the claims in all of these cases or, in the alternative, dismissal of portions of these cases. On July 2, 2015, the non-class plaintiffs filed a motion for summary judgment seeking dismissal of certain affirmative defenses based on statutory immunities from federal antitrust law. Briefing on the parties’ respective motions for summary judgment will continue over the next two months, and the Court has not indicated when it will rule on these motions.
Allegations in Each Case. In all of the cases described above, the plaintiffs allege that the Company and certain other large domestic egg producers conspired to reduce the domestic supply of eggs in a concerted effort to raise the price of eggs to artificially high levels. In each case, plaintiffs allege that all defendants agreed to reduce the domestic supply of eggs by: (a) agreeing to limit production; (b) manipulating egg exports; and (c) implementing industry-wide animal welfare guidelines that reduced the number of hens and eggs.
The named plaintiffs in the remaining indirect purchaser putative class action seek treble damages and injunctive relief on behalf of themselves and all other putative class members in the United States. Although plaintiffs allege a class period starting on January 1, 2000 and running “through the present,” the Court ruled that the plaintiffs cannot recover damages allegedly incurred outside the state-specific statute of limitations period applicable to most causes of action asserted, with the precise damages period
14
determined on a state-by-state and claim-by-claim basis. The indirect purchaser putative class action seeks injunctive relief under the Sherman Act and damages under certain statutes and the common-law of various states.
Five of the original six non-class cases remain pending against the Company. In four of the remaining non-class cases, the plaintiffs seek damages and injunctive relief under the Sherman Act. In the other remaining non-class case, the plaintiff seeks damages and injunctive relief under the Sherman Act and the Ohio antitrust act (known as the Valentine Act).
The Pennsylvania court has entered a series of orders related to case management, discovery, class certification, and scheduling. The Pennsylvania court has not set a trial date for any of the Company’s remaining consolidated cases (non-class and indirect purchaser cases).
The Company intends to continue to defend the remaining cases as vigorously as possible based on defenses which the Company believes are meritorious and provable. While management believes that the likelihood of a material adverse outcome in the overall egg antitrust litigation has been significantly reduced as a result of the settlements described above, there is still a reasonable possibility of a material adverse outcome in the remaining egg antitrust litigation. At the present time, however, it is not possible to estimate the amount of monetary exposure, if any, to the Company because of these cases. Accordingly, adjustments, if any, which might result from the resolution of these remaining legal matters, have not been reflected in the financial statements.
Florida Civil Investigative Demand
Environmental Information Request
In July 2011, the Company received an information request from the United States Environmental Protection Agency (“EPA”) pursuant to Section 308 of the Clean Water Act (“Act”). The Request stated that the information was sought by the EPA to investigate compliance with the Act and requested information pertaining to facilities involved in animal feeding operations, which are owned or operated by the Company or its affiliates. The Company timely responded to the Request by providing information on each of the subject facilities. The EPA subsequently sent a notice of noncompliance to the Company dated March 29, 2012 related only to the Company’s Edwards, Mississippi facility. The Company previously announced a settlement with the EPA and the Mississippi Department of Environmental Quality related to the notice, and a Consent Decree memorializing the settlement was entered on June 30, 2015 in the United States of America and State of Mississippi, by and through the Mississippi Commission on Environmental Quality v. Cal-Maine Foods, Inc. Civil Action No. 3:15-cv-00278-HTW-LRA, in the U.S. District Court for the Southern District of Mississippi, Northern Division. The terms and conditions of the settlement related only to the Edwards, Mississippi facility and are not expected to have a material impact to the Company’s results of operations. Management believes the risk of material loss related to non-settled matters relating to the 2011 notice to be remote.
Miscellaneous
15
ISSUER PURCHASES OF EQUITY SECURITIES
|
|
|
|
|
|
|
|
|
|
| ||||
|
|
| Sales Price |
|
|
| ||||||||
Fiscal Year Ended | Fiscal Quarter |
| High |
| Low |
|
| Dividends (1) | ||||||
|
|
|
|
|
|
|
|
|
|
| ||||
May 31, 2014 | First Quarter |
| $ | 25.94 |
| $ | 22.35 |
| $ | 0.034 | ||||
| Second Quarter |
|
| 27.48 |
|
| 22.92 |
|
| 0.181 | ||||
| Third Quarter |
|
| 30.31 |
|
| 24.71 |
|
| 0.296 | ||||
| Fourth Quarter |
|
| 34.88 |
|
| 27.74 |
|
| 0.217 | ||||
|
|
|
|
|
|
|
|
|
|
| ||||
May 30, 2015 | First Quarter |
| $ | 39.65 |
| $ | 34.58 |
| $ | 0.191 | ||||
| Second Quarter |
|
| 47.98 |
|
| 39.86 |
|
| 0.252 | ||||
| Third Quarter |
|
| 44.18 |
|
| 34.94 |
|
| 0.350 | ||||
| Fourth Quarter |
|
| 59.86 |
|
| 35.86 |
|
| 0.317 | ||||
| Sales Price | ||||||||||||||
| Fiscal Year Ended | Fiscal Quarter | High | Low | Dividends (1) | ||||||||||
| May 28, 2016 | First Quarter | $ | 57.94 | $ | 44.13 | $ | 0.983 | |||||||
| Second Quarter | 63.25 | 50.27 | 0.751 | |||||||||||
| Third Quarter | 56.50 | 44.94 | 0.441 | |||||||||||
| Fourth Quarter | 55.43 | 44.65 | — | |||||||||||
| June 3, 2017 | First Quarter | $ | 45.75 | $ | 40.11 | $ | — | |||||||
| Second Quarter | 46.15 | 36.50 | — | |||||||||||
| Third Quarter | 45.45 | 37.95 | — | |||||||||||
| Fourth Quarter | 41.25 | 36.35 | — | |||||||||||
| (1) | Represents dividends paid with respect to such quarter, after the end of the quarter. See “Dividends” below. |
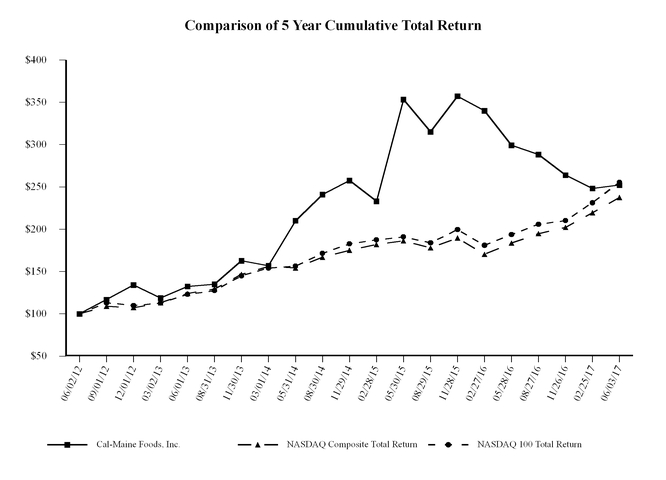
stock or index. Each date plotted indicates the last day of a fiscal quarter.
16
Recent Sales of Unregistered Securities
June 3, 2017.
Equity Compensation Plan Information | |||||||||||||||
| (a) |
| (b) | (c) | |||||||||||
| Number of securities to be issued upon exercise of outstanding options, warrants and rights | Weighted average exercise price of outstanding options, warrants and rights | Number of securities remaining available for future issuance under equity compensation plans (excluding securities reflected in column (a) | |||||||||||||
Equity compensation plans approved by shareholders |
| — |
| — | 503,242 | ||||||||||
Equity compensation plans not approved by shareholders |
| — |
|
| — | ||||||||||
Total |
| — |
| — | 503,242 | ||||||||||
| (a) | There were no outstanding options, warrants or rights as of |
| (b) | There were no outstanding options, warrants or rights as of |
| (c) | Shares available for future issuance as of |
17
|
|
|
|
|
|
|
|
|
|
|
|
|
| Fiscal Years Ended | |||||||||
|
|
| May 30 |
| May 31 |
| June 1 |
| June 02 |
| May 28 |
|
|
| 2015 |
| 2014 * |
| 2013 + |
| 2012 |
| 2011 |
|
|
| 52 wks |
| 52 wks |
| 52 wks |
| 53 wks |
| 52 wks |
Statement of Operations Data (in thousands, except per shares data) |
|
|
|
|
|
|
|
|
|
|
|
Net sales |
| $ | 1,576,128 | $ | 1,440,907 | $ | 1,288,104 | $ | 1,113,116 | $ | 941,981 |
Cost of sales |
|
| 1,180,407 |
| 1,138,143 |
| 1,073,555 |
| 911,334 |
| 757,050 |
Gross profit |
|
| 395,721 |
| 302,764 |
| 214,549 |
| 201,782 |
| 184,931 |
Selling, general and administrative |
|
| 160,386 |
| 156,712 |
| 126,956 |
| 113,130 |
| 101,448 |
Legal settlement expense |
|
| - |
| - |
| 28,000 |
| - |
| - |
Operating income |
|
| 235,335 |
| 146,052 |
| 59,593 |
| 88,652 |
| 83,483 |
Other income (expense): |
|
|
|
|
|
|
|
|
|
|
|
Interest expense, net of interest income |
|
| (515) |
| (2,656) |
| (3,906) |
| (3,758) |
| (6,022) |
Loss on early extinguishment of debt |
|
| - |
| - |
| - |
| - |
| (2,648) |
Equity in income of affiliates |
|
| 2,657 |
| 3,512 |
| 3,480 |
| 7,495 |
| 4,701 |
Gain on sale of investment in Eggland’s Best® |
|
| - |
| - |
| - |
| - |
| 4,829 |
Distribution from Eggland’s Best® |
|
| - |
| - |
| - |
| 38,343 |
| - |
Patronage dividends |
|
| 6,893 |
| 6,139 |
| 14,300 |
| 6,607 |
| 4,885 |
Other, net |
|
| 2,179 |
| 8,795 |
| 2,101 |
| 1,738 |
| 2,443 |
Total other income |
|
| 11,214 |
| 15,790 |
| 15,975 |
| 50,425 |
| 8,188 |
Income before income tax and noncontrolling interest |
|
| 246,549 |
| 161,842 |
| 75,568 |
| 139,077 |
| 91,671 |
Income tax expense |
|
| 84,268 |
| 52,035 |
| 24,807 |
| 49,110 |
| 33,403 |
Net income including noncontrolling interest |
|
| 162,281 |
| 109,807 |
| 50,761 |
| 89,967 |
| 58,268 |
Less: Net income (loss) attributable to noncontrolling interest |
|
| 1,027 |
| 600 |
| 338 |
| 232 |
| (2,571) |
Net income attributable to Cal-Maine Foods, Inc. |
| $ | 161,254 | $ | 109,207 | $ | 50,423 | $ | 89,735 | $ | 60,839 |
Net income per common share: |
|
|
|
|
|
|
|
|
|
|
|
Basic |
| $ | 3.35 | $ | 2.27 | $ | 1.05 | $ | 1.88 | $ | 1.28 |
Diluted |
| $ | 3.33 | $ | 2.26 | $ | 1.05 | $ | 1.88 | $ | 1.27 |
|
|
|
|
|
|
|
|
|
|
|
|
Cash dividends per common share |
| $ | 1.11 | $ | 0.73 | $ | 0.38 | $ | 0.63 | $ | 0.43 |
|
|
|
|
|
|
|
|
|
|
|
|
Weighted average shares outstanding: |
|
|
|
|
|
|
|
|
|
|
|
Basic |
|
| 48,136 |
| 48,095 |
| 47,967 |
| 47,750 |
| 47,710 |
Diluted |
|
| 48,437 |
| 48,297 |
| 48,088 |
| 47,884 |
| 47,884 |
Balance Sheet Data (in thousands) |
|
|
|
|
|
|
|
|
|
|
|
Working capital |
| $ | 377,027 | $ | 324,292 | $ | 284,686 | $ | 301,546 | $ | 247,559 |
Total assets |
|
| 928,653 |
| 811,661 |
| 745,627 |
| 726,316 |
| 640,843 |
Total debt (including current maturities) |
|
| 50,860 |
| 61,093 |
| 65,020 |
| 76,220 |
| 88,161 |
Total stockholders’ equity |
|
| 704,562 |
| 594,745 |
| 518,044 |
| 479,328 |
| 418,877 |
|
|
|
|
|
|
|
|
|
|
|
|
Operating Data: |
|
|
|
|
|
|
|
|
|
|
|
Total number of layers at period-end (thousands) |
|
| 33,696 |
| 32,372 |
| 30,967 |
| 26,174 |
| 26,819 |
Total shell eggs sold (millions of dozens) |
|
| 1,063.1 |
| 1,013.7 |
| 948.5 |
| 884.3 |
| 821.4 |
* Results for fiscal 2014 include the results of operations (subsequent to acquisition) of our joint venture partner’s 50% interest in Delta Egg Farm, LLC, which was consolidated with our operations as of March 1, 2014. Prior to March 1, 2014, our equity in earnings in Delta Egg Farm, LLC are included in Equity in income of affiliates.
+ Results for fiscal 2013 include the results of operations (subsequent to acquisition) of the commercial egg assets acquired from Pilgrim’s Pride Corporation, which were consolidated with our operations as of August 10, 2012, and the commercial egg assets from Maxim Production Co., Inc., which were consolidated with our operations as of November 15, 2012.
18
| Fiscal Years Ended | ||||||||||||||||||||
| Statement of Operations Data (in thousands, except per share data) | June 3, 2017 ^ | May 28, 2016 | May 30, 2015 | May 31, 2014 * | June 1, 2013 † | |||||||||||||||
| 53 wks | 52 wks | 52 wks | 52 wks | 52 wks | ||||||||||||||||
| Net sales | $ | 1,074,513 | $ | 1,908,650 | $ | 1,576,128 | $ | 1,440,907 | $ | 1,288,104 | ||||||||||
| Cost of sales | 1,028,963 | 1,260,576 | 1,180,407 | 1,138,143 | 1,073,555 | |||||||||||||||
| Gross profit | 45,550 | 648,074 | 395,721 | 302,764 | 214,549 | |||||||||||||||
| Selling, general and administrative | 173,980 | 177,760 | 160,386 | 156,712 | 126,956 | |||||||||||||||
| Loss (gain) on disposal of fixed assets | 3,664 | (1,563 | ) | 568 | 651 | 1,496 | ||||||||||||||
| Legal settlement expense | — | — | — | — | 28,000 | |||||||||||||||
| Operating income (loss) | (132,094 | ) | 471,877 | 234,767 | 145,401 | 58,097 | ||||||||||||||
| Other income (expense): | ||||||||||||||||||||
| Interest income (expense), net | 2,785 | 3,158 | (515 | ) | (2,656 | ) | (3,906 | ) | ||||||||||||
| Equity in income of affiliates | 1,390 | 5,016 | 2,657 | 3,512 | 3,480 | |||||||||||||||
| Patronage dividends | 7,665 | 6,930 | 6,893 | 6,139 | 14,300 | |||||||||||||||
| Other, net | 5,960 | 268 | 2,747 | 9,446 | 3,597 | |||||||||||||||
| Total other income | 17,800 | 15,372 | 11,782 | 16,441 | 17,471 | |||||||||||||||
| Income (loss) before income tax and noncontrolling interest | (114,294 | ) | 487,249 | 246,549 | 161,842 | 75,568 | ||||||||||||||
| Income tax expense (benefit) | (39,867 | ) | 169,202 | 84,268 | 52,035 | 24,807 | ||||||||||||||
| Net income (loss) including noncontrolling interest | (74,427 | ) | 318,047 | 162,281 | 109,807 | 50,761 | ||||||||||||||
| Less: Net income (loss) attributable to noncontrolling interest | (149 | ) | 2,006 | 1,027 | 600 | 338 | ||||||||||||||
| Net income (loss) attributable to Cal-Maine Foods, Inc. | $ | (74,278 | ) | $ | 316,041 | $ | 161,254 | $ | 109,207 | $ | 50,423 | |||||||||
| Net income (loss) per common share: | ||||||||||||||||||||
| Basic | $ | (1.54 | ) | $ | 6.56 | $ | 3.35 | $ | 2.27 | $ | 1.05 | |||||||||
| Diluted | $ | (1.54 | ) | $ | 6.53 | $ | 3.33 | $ | 2.26 | $ | 1.05 | |||||||||
| Cash dividends per common share | $ | — | $ | 2.18 | $ | 1.11 | $ | 0.73 | $ | 0.38 | ||||||||||
| Weighted average shares outstanding: | ||||||||||||||||||||
| Basic | 48,362 | 48,195 | 48,136 | 48,095 | 47,967 | |||||||||||||||
| Diluted | 48,362 | 48,365 | 48,437 | 48,297 | 48,088 | |||||||||||||||
| Balance Sheet Data (in thousands) | ||||||||||||||||||||
| Working capital | $ | 371,527 | $ | 542,832 | $ | 407,418 | $ | 354,743 | $ | 304,681 | ||||||||||
| Total assets | 1,033,094 | 1,111,765 | 928,653 | 811,661 | 745,627 | |||||||||||||||
| Total debt (including current maturities) | 10,939 | 25,570 | 50,860 | 61,093 | 65,020 | |||||||||||||||
| Total stockholders’ equity | 844,493 | 917,361 | 704,562 | 594,745 | 518,044 | |||||||||||||||
Operating Data: | ||||||||||||||||||||
| Total number of layers at period-end (thousands) | 36,086 | 33,922 | 33,696 | 32,372 | 30,967 | |||||||||||||||
| Total shell eggs sold (millions of dozens) | 1,031.1 | 1,053.6 | 1,063.1 | 1,013.7 | 948.5 | |||||||||||||||
| ^ | Results for fiscal 2017 include the results of operations (subsequent to acquisition) of the commerical egg assets acquired from Foodonics International, Inc., which were consolidated with our operations as of October 16, 2016, and the commercial egg assets of Happy Hen Egg Farms, Inc., which were consolidated with our operations as of February 19, 2017. |
| * | Results for fiscal 2014 include the results of operations (subsequent to acquisition) of our joint venture partner’s 50% interest in Delta Egg Farm, LLC, which was consolidated with our operations as of March 1, 2014. Prior to March 1, 2014, our equity in earnings in Delta Egg Farm, LLC are included in Equity in income of affiliates. |
| † | Results for fiscal 2013 include the results of operations (subsequent to acquisition) of the commercial egg assets acquired from Pilgrim’s Pride Corporation, which were consolidated with our operations as of August 10, 2012, and the commercial egg assets from Maxim Production Co., Inc., which were consolidated with our operations as of November 15, 2012. |
Beginning in
Additionally, there continues to be uncertainty in the industry surrounding the implementation of California’s Proposition 2 and Assembly Bill 1437, which relate to egg production standards, including minimum cage space, for eggs sold in that state. This legislation was effective January 1, 2015. During January 2015, egg prices increased sharply and subsequently moderated. Currently, egg prices in California reflect a premium to other regions that is higher than historical levels. It is anticipated that future California pricesfarms will be higher than other regions of the countryenvironments that are cage-free or with equipment that can easily be converted to reflect the higher cost of production relatedcage-free, based on a timeline to the California standards. These new rules could impact future sales in California, and could also affect national egg production and supply, thereby increasing or decreasing prices throughout the country. meet our customer’s needs.
19
For fiscal 2015,2017, we produced approximately 75%84% of the total number of shell eggs sold by us, with approximately 6%8% of such shell egg production provided by contract producers. Contract producers utilize their facilities to produce shell eggs from layers owned by us. We own the shell eggs produced under these arrangements. For fiscal 2015,2017, approximately 25%16% of the total number of shell eggs sold by us waswere purchased from outside producers for resale.
ingredients in fiscal 2018.
Georgia, Alabama, and Florida. The acquisition of our joint venture partner’s 50%Company acquired Foodonics' interest in DeltaAmerican Egg Farm,Products, LLC (“Delta Egg”("AEP") and the purchasesEggland's Best franchise with licensing rights for certain markets in Alabama, Florida, and Georgia as well as Puerto Rico, Bahamas and Cuba. The Company now owns 100% of AEP. The acquired operations of Foodonics are included in the accompanying financial statements as of October 16, 2016.
February 19, 2017. The Company closed this acquisition on March 3, 2017.
|
|
|
|
|
|
|
|
|
| May 30, 2015 |
|
| May 31, 2014 |
|
| June 1, 2013 |
|
|
|
|
|
|
|
|
|
|
Net sales | 100.0 | % |
| 100.0 | % |
| 100.0 | % |
Cost of sales | 74.9 |
|
| 79.0 |
|
| 83.3 |
|
Gross profit | 25.1 |
|
| 21.0 |
|
| 16.7 |
|
Selling, general & administrative expenses | 10.2 |
|
| 10.9 |
|
| 9.9 |
|
Legal settlement expense | - |
|
| - |
|
| 2.2 |
|
Operating income | 14.9 |
|
| 10.1 |
|
| 4.6 |
|
Other income | 0.7 |
|
| 1.1 |
|
| 1.2 |
|
Income before taxes | 15.6 |
|
| 11.2 |
|
| 5.8 |
|
Income tax expense | 5.3 |
|
| 3.6 |
|
| 1.9 |
|
Net income including noncontrolling interests | 10.3 |
|
| 7.6 |
|
| 3.9 |
|
Less: Net income (loss) attributable to noncontrolling interests | 0.1 |
|
| 0.0 |
|
| 0.0 |
|
Net income attributable to Cal-Maine Foods, Inc. | 10.2 | % |
| 7.6 | % |
| 3.9 | % |
20
| June 3, 2017 | May 28, 2016 | May 30, 2015 | |||||||
| Net sales | 100.0 | % | 100.0 | % | 100.0 | % | |||
| Cost of sales | 95.8 | % | 66.0 | % | 74.9 | % | |||
| Gross profit | 4.2 | % | 34.0 | % | 25.1 | % | |||
| Selling, general and administrative | 16.2 | % | 9.3 | % | 10.2 | % | |||
| Loss (gain) on disposal of fixed assets | 0.3 | % | (0.1 | )% | — | % | |||
| Operating income (loss) | (12.3 | )% | 24.8 | % | 14.9 | % | |||
| Other income | 1.7 | % | 0.8 | % | 0.7 | % | |||
| Income (loss) before income taxes and noncontrolling interest | (10.6 | )% | 25.6 | % | 15.6 | % | |||
| Income tax expense (benefit) | (3.7 | )% | 8.9 | % | 5.3 | % | |||
| Net income (loss) including noncontrolling interest | (6.9 | )% | 16.7 | % | 10.3 | % | |||
| Less: Net income (loss) attributable to noncontrolling interest | — | % | 0.1 | % | 0.1 | % | |||
| Net income (loss) attributable to Cal-Maine Foods, Inc. | (6.9 | )% | 16.6 | % | 10.2 | % | |||
|
|
|
|
|
|
|
Fiscal Year ended |
| May 30, 2015 |
| May 31, 2014 |
| June 1, 2013 |
|
|
|
|
|
|
|
Net income attributable to Cal-Maine Foods, Inc. - (in thousands) |
| $ 161,254 |
| $ 109,207 |
| $ 50,423 |
Gross profit (in thousands) |
| 395,721 |
| 302,764 |
| 214,549 |
Net average shell egg selling price (rounded) |
| 1.43 |
| 1.36 |
| 1.30 |
Average Urner Barry Spot Egg Market Quotations1 |
| 1.53 |
| 1.43 |
| 1.35 |
Feed cost per dozen produced |
| 0.439 |
| 0.493 |
| 0.540 |
|
|
|
|
|
|
|
| Fiscal Year ended | June 3, 2017 | May 28, 2016 | May 30, 2015 | |||||||||
| Net income (loss) attributable to Cal-Maine Foods, Inc. - (in thousands) | $ | (74,278 | ) | $ | 316,041 | $ | 161,254 | |||||
| Gross profit (in thousands) | 45,550 | 648,074 | 395,721 | |||||||||
| Net average shell egg selling price (rounded) | 1.01 | 1.74 | 1.43 | |||||||||
Average Urner Barry Spot Egg Market Quotations1 | 0.85 | 1.79 | 1.53 | |||||||||
| Feed cost per dozen produced | 0.399 | 0.414 | 0.439 | |||||||||
| 1- |
|
prices.
28, 2016
21
|
|
|
|
|
|
|
|
|
|
| Fiscal Years Ended |
| Quarters Ended | ||||
|
| (52 weeks) |
| (13 weeks) | ||||
|
| May 30, 2015 |
| May 31, 2014 |
| May 30, 2015 |
| May 31, 2014 |
|
| (Amounts in thousands) |
| (Amounts in thousands) | ||||
Total net sales |
| $ 1,576,128 |
| $ 1,440,907 |
| $ 403,011 |
| $ 371,582 |
|
|
|
|
|
|
|
|
|
Non-specialty shell egg sales |
| 1,059,070 |
| 990,073 |
| 268,625 |
| 252,869 |
Specialty shell egg sales |
| 416,127 |
| 337,243 |
| 110,696 |
| 90,632 |
Co-pack specialty shell egg sales |
| 43,282 |
| 52,786 |
| 10,278 |
| 13,950 |
Other |
| 11,769 |
| 7,590 |
| 2,710 |
| 1,759 |
Net shell egg sales |
| $ 1,530,248 |
| $ 1,387,692 |
| $ 392,309 |
| $ 359,210 |
|
|
|
|
|
|
|
|
|
Net shell egg sales as a percent of total net sales |
| 97% |
| 96% |
| 97% |
| 97% |
|
|
|
|
|
|
|
|
|
Non- specialty shell egg dozens sold |
| 830,770 |
| 812,031 |
| 204,138 |
| 195,555 |
Specialty shell egg dozens sold |
| 210,606 |
| 174,364 |
| 55,699 |
| 46,681 |
Co-pack specialty shell egg dozens sold |
| 21,710 |
| 27,301 |
| 5,046 |
| 7,203 |
Total dozens sold |
| 1,063,086 |
| 1,013,696 |
| 264,883 |
| 249,439 |
|
|
|
|
|
|
|
|
|
Net average selling price per dozen |
| $ 1.429 |
| $ 1.362 |
| $ 1.471 |
| $ 1.433 |
| Fiscal Years Ended | Quarters Ended | ||||||||||||||||||||||||||
| (53 weeks) | (52 weeks) | (14 weeks) | (13 Weeks) | ||||||||||||||||||||||||
| June 3, 2017 | May 28, 2016 | June 3, 2017 | May 28, 2016 | ||||||||||||||||||||||||
| (Amounts in thousands) | (Amounts in thousands) | ||||||||||||||||||||||||||
| Total net sales | $ | 1,074,513 | $ | 1,908,650 | $ | 274,584 | $ | 303,020 | |||||||||||||||||||
| Non-specialty shell egg sales | 548,858 | 52.3 | % | 1,243,377 | 67.7 | % | 145,454 | 54.3 | % | 163,882 | 55.6 | % | |||||||||||||||
| Specialty shell egg sales | 457,617 | 43.6 | % | 534,754 | 29.1 | % | 112,744 | 42.0 | % | 118,356 | 40.2 | % | |||||||||||||||
| Co-pack specialty shell egg sales | 32,689 | 3.1 | % | 49,282 | 2.7 | % | 7,198 | 2.7 | % | 9,021 | 3.1 | % | |||||||||||||||
| Other sales | 10,423 | 1.0 | % | 10,533 | 0.5 | % | 2,594 | 1.0 | % | 3,245 | 1.1 | % | |||||||||||||||
| Net shell egg sales | $ | 1,049,587 | 100.0 | % | $ | 1,837,946 | 100.0 | % | $ | 267,990 | 100.0 | % | $ | 294,504 | 100.0 | % | |||||||||||
| Net shell egg sales as a percent of total net sales | 98 | % | 96 | % | 98 | % | 97 | % | |||||||||||||||||||
| Dozens sold: | |||||||||||||||||||||||||||
| Non-specialty shell egg | 778,538 | 75.5 | % | 791,058 | 75.1 | % | 207,428 | 76.0 | % | 189,850 | 75.0 | % | |||||||||||||||
| Specialty shell egg | 236,067 | 22.9 | % | 241,603 | 22.9 | % | 61,862 | 22.7 | % | 58,856 | 23.3 | % | |||||||||||||||
| Co-pack specialty shell egg | 16,525 | 1.6 | % | 20,936 | 2.0 | % | 3,725 | 1.3 | % | 4,371 | 1.7 | % | |||||||||||||||
| Total dozens sold | 1,031,130 | 100.0 | % | 1,053,597 | 100.0 | % | 273,015 | 100.0 | % | 253,077 | 100.0 | % | |||||||||||||||
| Net average selling price per dozen: | |||||||||||||||||||||||||||
| All shell eggs | $ | 1.007 | $ | 1.735 | $ | 0.973 | $ | 1.152 | |||||||||||||||||||
| Non-specialty shell eggs | $ | 0.705 | $ | 1.572 | $ | 0.701 | $ | 0.863 | |||||||||||||||||||
| Specialty shell eggs | $ | 1.939 | $ | 2.213 | $ | 1.823 | $ | 2.011 | |||||||||||||||||||
2017 and 2016, respectively.
This effect was particularly evident in recent quarters as non-specialty egg prices declined more than specialty egg prices. However, as non-specialty egg prices declined, we experienced some margin and volume pressures on specialty egg sales.
28, 2016. Our net average selling price for specialty eggs was $1.823 per dozen for the fiscal 2017 fourth quarter compared to $2.011 per dozen for the fiscal 2016 fourth quarter.
22
consolidated subsidiaries wholly-owned subsidiary American Egg Products, LLC (“AEP”) and our consolidated subsidiary Texas Egg Products, LLC (“TEP”). For fiscal 2015 our2017 egg product sales were $45.4$24.9 million, an increasea decrease of $3.6$45.8 million, or 8.6%64.7%, compared to $41.8$70.7 million for fiscal 2014. Our2016. Egg products volume of egg products sold for fiscal 20152017 was 51.065.3 million pounds, an increase of 2.16.8 million pounds, or 4.3%11.6%, compared to 48.958.5 million pounds for fiscal 2014.2016. In fiscal 2017, the selling price per pound was $0.382 compared to $1.213 for fiscal 2016, a decrease of 68.5%. The increasesdecrease in sales volume and market prices for egg products in the current fiscal year wereis due to increased industryreduced demand for egg products drivenand extraordinarily high prices for the prior fiscal year which reflected the shortage of supply caused by the quick serve restaurant industry as well as export sales. In fiscal 2015, the price per pound of egg products sold was $0.891 compared to $0.855 for fiscal 2014, an increase of 4.2%.
AI.
|
|
|
|
|
|
|
|
|
|
|
|
|
|
|
|
|
|
|
|
|
|
|
|
|
|
|
|
|
|
|
|
|
|
|
|
|
|
|
| Fiscal Year Ended |
| Quarter Ended | ||||||||||||||
(Amounts in thousands) |
| May 30, 2015 |
| May 31, 2014 |
| Percent Change |
| May 30, 2015 |
| May 31, 2014 |
| Percent Change | ||||||
Cost of sales: |
|
|
|
|
|
|
|
|
|
|
|
|
|
|
|
|
|
|
Farm production |
| $ | 558,580 |
| $ | 575,392 |
| (2.9) | % |
| $ | 138,580 |
| $ | 171,140 |
| (19.0) | % |
Processing and packaging |
|
| 173,181 |
|
| 156,088 |
| 11.0 | % |
|
| 45,056 |
|
| 41,983 |
| 7.3 | % |
Outside egg purchases and other |
|
| 413,863 |
|
| 371,885 |
| 11.3 | % |
|
| 101,029 |
|
| 57,336 |
| 76.2 | % |
Total shell eggs |
|
| 1,145,624 |
|
| 1,103,365 |
| 3.8 | % |
|
| 284,665 |
|
| 270,459 |
| 5.3 | % |
Egg products |
|
| 33,886 |
|
| 33,509 |
| 1.1 | % |
|
| 8,640 |
|
| 9,436 |
| (8.4) | % |
Other |
|
| 897 |
|
| 1,269 |
| (29.3) | % |
|
| 311 |
|
| 396 |
| (21.5) | % |
Total |
| $ | 1,180,407 |
| $ | 1,138,143 |
| 3.7 | % |
| $ | 293,616 |
| $ | 280,291 |
| 4.8 | % |
|
|
|
|
|
|
|
|
|
|
|
|
|
|
|
|
|
|
|
|
|
|
|
|
|
|
|
|
|
|
|
|
|
|
|
|
|
|
Farm production cost (per dozen produced) |
|
|
|
|
|
|
|
|
|
|
|
|
|
|
|
|
|
|
Feed |
| $ | 0.44 |
| $ | 0.49 |
| (10.2) | % |
| $ | 0.41 |
| $ | 0.48 |
| (14.6) | % |
Other |
|
| 0.26 |
|
| 0.25 |
| 4.0 | % |
|
| 0.27 |
|
| 0.26 |
| 3.8 | % |
Total |
| $ | 0.70 |
| $ | 0.74 |
| (5.4) | % |
| $ | 0.68 |
| $ | 0.74 |
| (8.1) | % |
|
|
|
|
|
|
|
|
|
|
|
|
|
|
|
|
|
|
|
Outside egg purchases (average cost per dozen) |
| $ | 1.41 |
| $ | 1.37 |
| 2.9 | % |
| $ | 1.43 |
| $ | 1.44 |
| (0.7) | % |
|
|
|
|
|
|
|
|
|
|
|
|
|
|
|
|
|
|
|
Dozen produced |
|
| 798,842 |
|
| 750,302 |
| 6.5 | % |
|
| 201,763 |
|
| 195,630 |
| 3.1 | % |
Dozen sold |
|
| 1,063,086 |
|
| 1,013,696 |
| 4.9 | % |
|
| 264,883 |
|
| 249,439 |
| 6.2 | % |
| Fiscal Year Ended | Quarter Ended | |||||||||||||||||||||
| (53 weeks) | (52 weeks) | (14 weeks) | (13 weeks) | |||||||||||||||||||
| (Amounts in thousands) | June 3, 2017 | May 28, 2016 | Percent Change | June 3, 2017 | May 28, 2016 | Percent Change | ||||||||||||||||
| Cost of sales: | ||||||||||||||||||||||
| Farm production | $ | 598,412 | $ | 562,521 | 6.4 | % | $ | 159,482 | $ | 135,187 | 18.0 | % | ||||||||||
| Processing and packaging | 202,225 | 184,586 | 9.6 | % | 54,896 | 45,089 | 21.8 | % | ||||||||||||||
| Outside egg purchases and other | 207,495 | 464,008 | (55.3 | )% | 41,663 | 75,311 | (44.7 | )% | ||||||||||||||
| Total shell eggs | 1,008,132 | 1,211,115 | (16.8 | )% | 256,041 | 255,587 | 0.2 | % | ||||||||||||||
| Egg products | 19,766 | 48,584 | (59.3 | )% | 6,075 | 6,473 | (6.1 | )% | ||||||||||||||
| Other | 1,065 | 877 | 21.4 | % | 462 | 280 | 65.0 | % | ||||||||||||||
| Total | $ | 1,028,963 | $ | 1,260,576 | (18.4 | )% | $ | 262,578 | $ | 262,340 | 0.1 | % | ||||||||||
| Farm production cost (per dozen produced) | ||||||||||||||||||||||
| Feed | $ | 0.399 | $ | 0.414 | (3.6 | )% | $ | 0.381 | $ | 0.396 | (3.8 | )% | ||||||||||
| Other | 0.294 | 0.279 | 5.4 | % | 0.298 | 0.290 | 2.8 | % | ||||||||||||||
| Total | $ | 0.693 | $ | 0.693 | — | % | $ | 0.679 | $ | 0.686 | (1.0 | )% | ||||||||||
| Outside egg purchases (average cost per dozen) | $ | 1.01 | $ | 1.72 | (41.3 | )% | $ | 0.90 | $ | 1.11 | (18.9 | )% | ||||||||||
| Dozen produced | 870,252 | 819,307 | 6.2 | % | 237,006 | 198,950 | 19.1 | % | ||||||||||||||
| Dozen sold | 1,031,130 | 1,053,597 | (2.1 | )% | 273,015 | 253,077 | 7.9 | % | ||||||||||||||
Costthe thirteen weeks ended May 28, 2016, cost of sales forincreased $238,000, or 0.1%, from $262.3 million in the thirteen-week period ended May 30, 2015 was $293.6fourth quarter of fiscal 2016, to $262.6 million an increase of $13.3 million, or 4.8%, compared to $280.3 million forin the thirteen-week period ended May 31, 2014.current period. Feed cost per dozen for the fourth quarter of fiscal 20152017 was $0.41,$0.381, compared to $0.48$0.396 for comparablethe same quarter of fiscal 2014 fourth quarter,2016, a decrease of 14.6%3.8%.
23
|
|
|
|
|
|
|
|
| Fiscal Years Ended | ||||
|
| 52 Weeks | ||||
(Amounts in thousands) |
| May 30, 2015 |
| May 31, 2014 |
| Change |
Stock compensation expense |
| $ 2,955 |
| $ 1,794 |
| $ 1,161 |
Specialty egg expense |
| 53,966 |
| 46,298 |
| 7,668 |
Payroll and overhead |
| 31,965 |
| 29,413 |
| 2,552 |
Other expenses |
| 24,501 |
| 36,161 |
| (11,660) |
Delivery expense |
| 46,999 |
| 43,046 |
| 3,953 |
Total |
| $ 160,386 |
| $ 156,712 |
| $ 3,674 |
| Fiscal Years Ended | |||||||||||||||
| 53 Weeks | 52 Weeks | ||||||||||||||
| (Amounts in thousands) | June 3, 2017 | May 28, 2016 | Change | Change | |||||||||||
| Specialty egg | $ | 56,522 | $ | 61,294 | $ | (4,772 | ) | (7.8 | )% | ||||||
| Delivery expense | 53,282 | 49,629 | 3,653 | 7.4 | % | ||||||||||
| Payroll and overhead | 35,101 | 39,149 | (4,048 | ) | (10.3 | )% | |||||||||
| Stock compensation | 3,427 | 3,018 | 409 | 13.6 | % | ||||||||||
| Other expenses | 25,648 | 24,670 | 978 | 4.0 | % | ||||||||||
| Total | $ | 173,980 | $ | 177,760 | $ | (3,780 | ) | (2.1 | )% | ||||||
|
|
|
|
|
|
|
|
| Quarters Ended | ||||
|
| 13 Weeks | ||||
(Amounts in thousands) |
| May 30, 2015 |
| May 31, 2014 |
| Change |
Stock compensation expense |
| $ 1,290 |
| $ 753 |
| $ 537 |
Specialty egg expense |
| 14,217 |
| 12,414 |
| 1,803 |
Payroll and overhead |
| 8,920 |
| 9,507 |
| (587) |
Other expenses |
| 6,679 |
| 9,499 |
| (2,820) |
Delivery expense |
| 11,738 |
| 11,590 |
| 148 |
Total |
| $ 42,844 |
| $ 43,763 |
| $ (919) |
Selling, general, and administrative
| Quarters Ended | |||||||||||||||
| 14 Weeks | 13 Weeks | ||||||||||||||
| (Amounts in thousands) | June 3, 2017 | May 28, 2016 | Change | Change | |||||||||||
| Specialty egg | $ | 14,364 | $ | 13,768 | $ | 596 | 4.3 | % | |||||||
| Delivery expense | 13,712 | 11,945 | 1,767 | 14.8 | % | ||||||||||
| Payroll and overhead | 11,156 | 9,450 | 1,706 | 18.1 | % | ||||||||||
| Stock compensation | 947 | 843 | 104 | 12.3 | % | ||||||||||
| Other expenses | 7,816 | 6,398 | 1,418 | 22.2 | % | ||||||||||
| Total | $ | 47,995 | $ | 42,404 | $ | 5,591 | 13.2 | % | |||||||
Payroll and overhead increased $1.7 million, or 18.1%, compared to the same period of last year due to the Foodonics and Happy Hen acquisitions as well as the extra week in the fiscal 2017 fourth quarter, partially offset by reduced bonus accruals in 2017. Delivery expense increased $1.8 million for the fourteen weeks ended June 3, 2017 compared to the corresponding thirteen week period ended May 28, 2016, primarily due to the Foodonics acquisition. Other expenses for the fourteen weeks ended June 3, 2017 are up $1.4 million, or 22.2%, compared to the corresponding thirteen week period ended May 28, 2016, primarily due to an extra week in the current period, an increase in legal and audit fees in the current period, and the impact of the acquisitions.
(LOSS)
24
OTHER INCOME (EXPENSE)
Other2016.
applicable fees, was $5.5 million.
Other itemsfourth quarter of fiscal 2017.
2016.
2016.
On a comparable basis, excluding the Acquisitions, net sales for fiscal 2014 were $1,277.8 million, an increase of $90.7 million, or 7.6%, compared to net sales of $1,187.1 for fiscal 2013. Dozens sold for fiscal 2014, excluding the Acquisitions, were 884.4 million, an increase of 18.4 million, or 2.1% as compared to 866.0 million for fiscal 2013.
25
Fiscal Years Ended Quarters Ended (52 weeks) (13 weeks) May 31, 2014 June 1, 2013 May 31, 2014 June 1, 2013 (Amounts in thousands) (Amounts in thousands) Total net sales $ 1,440,907 $ 1,288,104 $ 371,582 $ 325,933 Non-specialty shell egg sales Specialty shell egg sales Co-pack specialty shell egg sales Other Net shell egg sales $ 1,387,692 $ 1,239,368 $ 359,210 $ 313,222 Net shell egg sales as a percent of total net sales Non- specialty shell egg dozens sold Specialty shell egg dozens sold Co-pack specialty shell egg dozens sold Total dozens sold 2016 and 2015, respectively. of 2015. This effect was particularly evident in our fourth fiscal quarter of 2016, as non-specialty egg prices declined more than specialty egg prices. However, as non-specialty egg prices have declined, we are experiencing some margin and volume pressures on specialty egg sales. Fiscal Year Ended Quarter Ended (Amounts in thousands) May 31, 2014 June 1, 2013 Percent Change May 31, 2014 June 1, 2013 Percent Change Cost of sales: Farm production $ $ % $ $ % Processing and packaging % % Outside egg purchases and other % % Total shell eggs % % Egg products % % Other % % Total $ $ % $ $ % Farm production cost (per dozen produced) Feed $ $ % $ $ % Other % % Total $ $ % $ $ % Outside egg purchases (average cost per dozen) $ $ % $ $ % Dozen produced % % Dozen sold % % Fiscal Years Ended 52 Weeks Actual Adjusted for Acquisitions (Amounts in thousands) May 31, 2014 June 1, 2013 Change May 31, 2014 June 1, 2013 Change Stock compensation expense $ 1,794 $ 603 $ 1,191 $ 1,794 $ 603 $ 1,191 Specialty egg expense Payroll and overhead Other expenses Delivery expense Total $ 156,712 $ 126,956 $ 29,756 $ 137,209 $ 119,597 $ 17,612 Quarters Ended 13 Weeks & 14 Weeks Actual Adjusted for Acquisitions (Amounts in thousands) May 31, 2014 June 1, 2013 Change May 31, 2014 June 1, 2013 Change Stock compensation expense $ 753 $ (109) $ 862 $ 753 $ (109) $ 862 Specialty egg expense Payroll and overhead Other expenses Delivery expense Total $ 43,763 $ 30,770 $ 12,993 $ 35,877 $ 28,871 $ 7,006 2015. 2016 and 2015, respectively. as well as increased income from specialty egg sales and patronage dividends in our other unconsolidated specialty egg joint ventures. 2015. 2015. is highest in the last and first fiscal quarters ending in May and August, respectively, when egg prices are normally at seasonal lows. We have $3.7 million in outstanding standby letters of credit, which are collateralized with cash. Our long-term debt and capital leases at operations. 28, 2016. 2015. May 30, 2015. Location Project Projected Completion Projected Cost Spent as of Remaining Projected Cost Okeechobee, FL Layer House Expansions August 2015 $ $ $ South Texas Cage Free Layer & Pullet Houses August 2015 Bremen, KY Cage Free Layer & Pullet Houses October 2015 Wharton, TX Layer House Expansions August 2015 Shady Dale, GA Pullet Houses & Layer Houses October 2015 Chase, KS Organic Facility Expansion May 2016 Delta, UT California Compliant Layer House Expansions April 2017 - $ $ $ Total Fiscal 2016 Fiscal 2017 Fiscal 2018 Fiscal 2019 Fiscal 2020 Over 5 years Long-Term Debt (Principal) $ 50,860 $ 10,065 $ 20,265 $ 8,439 $ 5,091 $ 3,300 $ 3,700 Long-Term Debt (Interest) Operating Leases - Total $ 59,044 $ 13,342 $ 22,812 $ 9,745 $ 5,731 $ 3,614 $ 3,800 are included in other income. The cost basis for realized gains and losses on available-for-sale securities is determined on the specific identification method. Fiscal Year Description Amount 1999 Acquisition of Hudson Brothers, Inc. 2006 Acquisition of Hillandale Farms, LLC 2007 Acquisition of Green Forest Foods, LLC 2008 Revised Hillandale incremental purchase price 2009 Revised Hillandale incremental purchase price 2009 Acquisition of Zephyr Egg, LLC 2009 Acquisition of Tampa Farms, LLC 2010 Revised Hillandale incremental purchase price 2013 Acquisition of Maxim Production Co., Inc. 2014 Purchase of joint venture partner’s 50% in Delta Egg Total Goodwill INCOME TAXES Feed ingredient Approximate change in Approximate impact on feed costs per dozen Approximate dollar impact on farm production cost for the current fiscal year Corn $ change in the average market price per bushel $ 0.01 $ 7,988,420 Soybean Meal $ change in the average market price per ton $ 0.01 $ 7,988,420 meal. June 3, 2017. May 30 May 31 2015 2014 Assets Current assets: Cash and cash equivalents $ $ Investment securities available-for-sale Receivables: Trade receivables, less allowance for doubtful accounts of $513 in 2015 and $430 in 2014 Other Inventories Prepaid expenses and other current assets Total current assets Other assets: Other investments Notes receivable – noncurrent - Goodwill Other intangible assets Other long-lived assets Property, plant and equipment, less accumulated depreciation Total assets $ $ Liabilities and stockholders' equity Current liabilities: Trade accounts payable $ $ Accrued dividends payable Accrued wages and benefits Accrued income taxes payable Accrued expenses and other liabilities Current maturities of long-term debt Deferred income taxes Total current liabilities Long-term debt, less current maturities Other noncurrent liabilities Deferred income taxes Total liabilities Commitments and contingencies – See Notes 8, 9, and 14 Stockholders' equity: Common stock, $.01 par value Authorized shares - 120,000 in 2015 and 2014 Issued 70,261 shares in 2015 and 2014 with 43,698 and 43,562 shares outstanding, respectively Class A convertible common stock, $.01 par value Authorized shares - 4,800 in 2015 and 2014 Issued and outstanding shares - 4,800 in 2015 and 2014 Paid-in capital Retained earnings Accumulated other comprehensive income, net of tax Common stock in treasury, at cost –26,563 shares in 2015 and 26,699 in 2014 Total Cal-Maine Foods, Inc. stockholders' equity Noncontrolling interest in consolidated entities Total stockholders’ equity Total liabilities and stockholders' equity $ $ See accompanying notes.The table below represents an analysis of our non-specialty and specialty, as well as co-pack specialty, shell egg sales. Following the table is a discussion of the information presented in the table. 990,073 900,259 252,869 223,518 337,243�� 293,201 90,632 76,868 52,786 40,175 13,950 11,051 7,590 5,733 1,759 1,785 96% 96% 97% 96% 812,031 772,140 195,555 197,739 174,364 155,569 46,681 39,932 27,301 20,747 7,203 5,609 1,013,696 948,456 249,439 243,280 In fiscal 2014, we identified an additional category of specialty sales that are sold primarily through co-pack arrangements, a common practice in the industry whereby production and processing of certain products is outsourced to another producer. Shell egg sales in this category represented 27.3 million and 20.7 million dozen for the fiscal years 2014 and 2013, respectively. These dozens were previously reported under non-specialty shell egg sales. Our non-specialty Fiscal Years Ended Quarters Ended (52 weeks) (13 weeks) May 28, 2016 May 30, 2015 May 28, 2016 May 30, 2015 (Amounts in thousands) (Amounts in thousands) Total net sales $ 1,908,650 $ 1,576,128 $ 303,020 $ 403,011 Non-specialty shell egg sales 1,243,377 67.7 % 1,059,070 69.2 % 163,882 55.6 % 268,625 68.5 % Specialty shell egg sales 534,754 29.1 % 416,127 27.2 % 118,356 40.2 % 110,696 28.2 % Co-pack specialty shell egg sales 49,282 2.7 % 43,282 2.8 % 9,021 3.1 % 10,278 2.6 % Other sales 10,533 0.6 % 11,769 0.8 % 3,245 1.1 % 2,710 0.7 % Net shell egg sales $ 1,837,946 100.0 % $ 1,530,248 100.0 % $ 294,504 100.0 % $ 392,309 100.0 % Net shell egg sales as a percent of total net sales 96 % 97 % 97 % 97 % Dozens sold: Non- specialty shell egg 791,058 75.1 % 830,770 78.1 % 189,850 75 % 204,138 77.1 % Specialty shell egg 241,603 22.9 % 210,606 19.8 % 58,856 23.3 % 55,699 21 % Co-pack specialty shell egg 20,936 2 % 21,710 2.1 % 4,371 1.7 % 5,046 1.9 % Total dozens sold 1,053,597 100 % 1,063,086 100 % 253,077 100 % 264,883 100 % Net average selling price per dozen $ 1.74 $ 1.43 $ 1.15 $ 1.47 Non-specialty shell eggs include all shell egg sales not specifically identified as specialty or co-pack specialty shell egg sales. The non-specialty shell eggThis market is characterized generally by an inelasticity of demand, and small increases in production or decreases in demand can have a large adverse effect on prices and vice-versa. In fiscal 2014,2016, non-specialty shell eggs represented approximately 71.3%67.7% of our shell egg dollar sales,revenue, compared to 72.6%69.2% for fiscal 2013.2015. Sales of non-specialty shell eggs accounted for approximately 80.1%75.1% and 78.1% of our total shell egg dozen volumes in fiscal 2014, compared to 81.4% in fiscal 2013.For the thirteen-week period ended May 31, 2014,28, 2016, non-specialty shell eggs represented approximately 70.4%55.6% of our shell egg dollar sales,revenue, compared to 71.4%68.5% for the thirteen-week period ended June 1, 2013.May 30, 2015, reflecting the large decrease in net average selling price for non-specialty eggs during the fiscal 2016 fourth quarter compared to the same period of the prior year. For the thirteen-week period ended May 31, 2014,28, 2016, non-specialty shell eggs accounted for approximately 78.4%75.0% of the total shell egg dozen volume, compared to 81.3%77.1% for the thirteen-weekcomparable period ended June 1, 2013.Specialty eggs, which include nutritionally enhanced, cage free,cage-free, organic and brown eggs, continued to make up a significantlarger portion of our total shell egg sales dollarsrevenue and dozens in fiscal 2014.2016. For fiscal 2014,2016, specialty eggs accounted for 24.3%29.1% of shell egg dollar sales,revenue, compared to 23.7%27.2% in fiscal 2013,2015, and 17.2%22.9% of shell egg dozens soldvolume in fiscal 2014,2016, compared to 16.4%19.8% in fiscal 2013.2015. Additionally, for fiscal 2014,2016, specialty eggs sold through co-pack arrangements accounted for 3.8% of shell egg dollar sales, compared to 3.2% in fiscal 2013, and 2.7% of shell egg dozens soldrevenue, compared to 2.8% in fiscal 2014, compared to 2.2%2015, and 2.0% of shell egg volume in fiscal 2013.2016 and 2015. Specialty egg retail prices are less cyclical than non-specialty shell egg prices and are generally higher due to consumer willingness to pay for the perceived increased benefits from these products. For the thirteen-week period ended May 31, 2014,28, 2016, specialty shell eggs and specialty shell eggs sold through co-pack arrangements represented approximately 25.2%40.2% and 3.9%3.1%, of our shell egg dollar sales,revenue, compared to 24.5%28.2% and 3.5%2.6%, respectively, for the thirteen-weekcomparable period ended June 1, 2013, respectively.of fiscal 2015. As previously discussed, selling prices for non-specialty eggs decreased during the fiscal 2016 fourth quarter resulting in a larger percentage of our shell egg sales being attributable to the less cyclical specialty shell eggs. For the thirteen-week period ended May 31, 2014,28, 2016, specialty shell eggs and specialty shell eggs sold through co-pack arrangements accounted for approximately 18.7%23.3% and 2.9%1.7% of the total shell egg dozen volume, compared to 16.4%21.0% and 2.3%1.9%, respectively, for the thirteen-weekcomparable period ended June 1, 2013, respectively.26fiscal 2015.As discussed above, while egg prices increased substantially after the AI outbreak during the early part of our fiscal 2016, egg prices declined to a decade-low level during our fiscal 2016 fourth quarter, and were 21.7 percent lower than our average selling price in our fiscal 2015 fourth quarter. In addition, our sales for the fourth quarter of fiscal 2016 reflect lower volumes primarily related to the loss of a portion of a major customer’s co-pack business.The shell egg sales classified as “Other”“Other sales” represent hard cooked eggs, hatching eggs, and other egg products, hens, and manure, which are included with our shell egg operations.Egg products are shell eggs that are broken and sold in liquid, frozen, or dried form. Our egg products are sold through our consolidated subsidiaries American Egg Products, LLC (“AEP”) and Texas Egg Products, LLC (“TEP”). For fiscal 2014 our2016 egg product sales were $41.8$70.7 million, an increase of $6.5$25.3 million, or 18.4%55.7%, compared to $35.3$45.4 million for fiscal 2013. Our2015. Egg products volume of egg products sold for fiscal 20142016 was 48.958.5 million pounds, a decreasean increase of 3.17.5 million pounds, or 6.0%14.7%, compared to 52.051.0 million pounds for fiscal 2013.2015. The decreaseincreases in our sales volume for fiscal 2014 was offset by significantly higherand market prices for liquid whole eggs and egg whitesproducts in the current fiscal year were due to increased industry demand fora shortage of supply from the AI affected locations of other producers, as the AI outbreak had a disproportionately large impact on suppliers of egg products, driven by the quick serve restaurant industry as well as export sales.products. In fiscal 2014,2016, the selling price per pound of egg products sold was $0.855$1.213 compared to $0.679$0.891 for fiscal 2013,2015, an increase of 25.9%36.1%.COST OF SALESCost of sales consists of costs directly related to producing, processing and packing shell eggs, purchases of shell eggs from outside producers, processing and packing of liquid and frozen egg products and other non-egg costs. Farm production costs are those costs incurred at the egg production facility, including feed, facility, hen amortization, and other related farm production costs. The following table presents the key variables affecting our cost of sales:575,392 545,253 5.5 171,140 137,827 24.2 156,088 137,494 13.5 41,983 36,358 15.5 371,885 360,257 3.2 57,336 92,540 (38.0) 1,103,365 1,043,004 5.8 270,459 266,725 1.4 33,509 29,549 13.4 9,436 7,584 24.4 1,269 1,002 26.6 396 135 193.3 1,138,143 1,073,555 6.0 280,291 274,444 2.1 0.49 0.54 (9.3) 0.48 0.52 (7.7) 0.25 0.24 4.2 0.26 0.25 4.0 0.74 0.78 (5.1) 0.74 0.77 (3.9) 1.37 1.29 6.0 1.44 1.28 12.5 750,302 704,388 6.5 195,630 181,005 8.1 1,013,696 948,456 6.9 249,439 243,280 2.5 Fiscal Year Ended Quarter Ended (Amounts in thousands) May 28, 2016 May 30, 2015 Percent Change May 28, 2016 May 30, 2015 Percent Change Cost of sales: Farm production $ 562,521 $ 558,580 0.7 % $ 135,187 $ 138,580 (2.4 )% Processing and packaging 184,586 173,181 6.6 % 45,089 45,056 0.1 % Outside egg purchases and other 464,008 413,863 12.1 % 75,311 101,029 (25.5 )% Total shell eggs 1,211,115 1,145,624 5.7 % 255,587 284,665 (10.2 )% Egg products 48,584 33,886 43.4 % 6,473 8,640 (25.1 )% Other 877 897 (2.2 )% 280 311 (10 )% Total $ 1,260,576 $ 1,180,407 6.8 % $ 262,340 $ 293,616 (10.7 )% Farm production cost (per dozen produced) Feed $ 0.414 $ 0.439 (5.7 )% $ 0.396 $ 0.406 (2.5 )% Other 0.279 0.266 4.9 % 0.29 0.272 6.6 % Total $ 0.693 $ 0.705 (1.7 )% $ 0.686 $ 0.678 1.2 % Outside egg purchases (average cost per dozen) $ 1.72 $ 1.41 22 % $ 1.11 $ 1.43 (22.4 )% Dozen produced 819,307 798,842 2.6 % 198,950 201,763 (1.4 )% Dozen sold 1,053,597 1,063,086 (0.9 )% 253,077 264,883 (4.5 )% Cost of sales for the fiscal year ended May 31, 201428, 2016 was $1,138.1$1,260.6 million, an increase of $64.5$80.2 million, or 6.0%6.8%, compared to $1,073.6$1,180.4 million for fiscal 2013. Dozens2015. Comparing fiscal 2016 to fiscal 2015, dozens produced increased and dozensaverage cost per dozen purchased from outside shell egg producers increased for fiscal 2014 while cost of feed ingredients decreased indecreased. During our fiscal 2014 compared to fiscal 2013. This fiscal year2016 we produced 74.0%77.8% of the eggs sold by us, as compared to 74.3%75.1% for the previous year.fiscal 2015. Feed cost for fiscal 20142016 was $0.49$0.414 per dozen, compared to $0.54$0.439 per dozen for the prior fiscal year, a decrease of 9.3%5.7%. Gross profit increased from 16.7% of net sales for fiscal 2013 to 21.0% of net sales for fiscal 2014, primarily asThe decrease in feed cost per dozen resulted in a result of lower feed costs and increased egg prices.On a comparable basis, excluding the Acquisitions, cost of sales for the fiscal year ended May 31, 2014 were $1,005.6 million, an increase of $21.6 million, or 2.2%, compared todecrease in cost of sales of $984.0$20.6 million for fiscal 2016 compared with 2015. For the fiscal yearthirteen weeks ended June 1, 2013. CostMay 28, 2016, compared to the same period of 2015, cost of sales fordecreased from $293.6 million in the thirteen-week period ended May 31, 2014 was $280.3fourth quarter of fiscal 2015, to $262.3 million an increasein the fourth quarter of $5.9fiscal 2016. This decrease of $31.3 million, or 2.1%10.7%, comparedwas primarily the result of decreased cost of outside egg purchases from $1.43 per dozen in the fourth quarter of fiscal 2015 to $274.4 million for$1.11 in the thirteen-weekcomparable period ended June 1, 2013.of fiscal 2016. Feed cost per dozen for the fourth quarter of fiscal 20142016 was $0.48,$0.396, compared to $0.52$0.406 for comparablethe same quarter of fiscal 2013 fourth quarter,2015, a decrease of 7.7%2.5%.27net sales for fiscal 2015, to 34.0% of net sales for fiscal 2016. The improvement is the result of lower feed costs and increased egg selling prices.SELLING, GENERAL, AND ADMINISTRATIVE EXPENSES46,298 36,926 9,372 45,667 36,490 9,177 29,413 27,003 2,410 26,683 25,201 1,482 36,161 24,309 11,852 26,131 22,223 3,908 43,046 38,115 4,931 36,934 35,080 1,854 Fiscal Years Ended 52 Weeks (Amounts in thousands) May 28, 2016 May 30, 2015 Change Change Stock compensation expense $ 3,018 $ 2,955 $ 63 2.1 % Specialty egg expense 61,294 53,966 7,328 13.6 % Payroll and overhead 39,149 31,965 7,184 22.5 % Other expenses 24,670 24,501 169 0.7 % Delivery expense 49,629 46,999 2,630 5.6 % Total $ 177,760 $ 160,386 $ 17,374 10.8 % Selling, general and administrative expensesSG&A, which include costs of marketing, distribution, accounting and corporate overhead. Selling, general and administrative expense was $156.7overhead, were $177.8 million in fiscal 2014,2016, an increase of $29.8$17.4 million, or 23.4%10.8%, compared to $127.0$160.4 million for fiscal 2013. Excluding the Acquisitions, selling, general, and administrative expense for fiscal year 2014 was $137.2 million, an increase of $17.6 million, or 14.7%, compared to $119.6 million in fiscal year 2013. Stock compensation expense increased $1.2 million for the current fiscal year. Stock compensation expense is dependent on the closing price of the Company’s Common Stock. For our stock compensation arrangements classified as equity awards (e.g. restricted stock), we recognized stock compensation expense ratably over the vesting period. For our stock compensation arrangements classified as liability awards, we recognize increases or decreases in the value of such awards as increases or decreases, respectively, to stock compensation expense. 2015. The increase in specialty egg expense for fiscal 20142016 compared to fiscal 20132015 is attributable to a 12.1%14.7% increase in specialty shell egg dozens sold resulting in an increase in advertising promotions and franchise expense. Excluding the Acquisitions, payrollPayroll and overhead increased $7.2 million, or 22.5%, compared to the same period theof prior year primarily due to general salary increases.increased bonus accruals in the 2016 fiscal year. As a percentage of net sales, payroll and overhead is 2.1% 2.0% for fiscal 20142016 and fiscal 2013.2015, respectively. Excluding the Acquisitions, other expenses, which include expenses As a percentage of net sales, delivery expense is 2.6% and 3.0% for repairs, professional fees,fiscal 2016 and insurance, increased as a result of a confidential legal settlement and related legal fees as well as increases in audit and other tax expense. During fiscal 2014 we recognized $4.4 million in expense resulting from the increase in fair value of contingent consideration applicable to acquisitions compared to fiscal 2013 when we recognized $1.3 million in income from the decrease in the fair value of the contingent consideration, both of which are reflected in other expenses. See Note 16 to Notes to Consolidated Financial Statements for additional information. Delivery expense increased compared to fiscal 2013 due to an increase in contract trucking.2015, respectively. As a percent of net sales, selling, general and administrative expense increaseddecreased from 10.1%10.2% in fiscal 20132015 to 10.9%9.3% in fiscal 2014.2016.12,414 8,864 3,550 12,230 8,727 3,503 9,507 8,898 609 8,444 8,279 165 9,499 3,624 5,875 4,806 3,683 1,123 11,590 9,493 2,097 9,644 8,291 1,353 28 Quarters Ended 13 Weeks (Amounts in thousands) May 28, 2016 May 30, 2015 Change Change Stock compensation expense $ 843 $ 1,290 $ (447 ) (34.7 )% Specialty egg expense 13,768 14,217 (449 ) (3.2 )% Payroll and overhead 9,450 8,920 530 5.9 % Other expenses 6,398 6,679 (281 ) (4.2 )% Delivery expense 11,945 11,738 207 1.8 % Total $ 42,404 $ 42,844 $ (440 ) (1 )% Selling, general, and administrativeSG&A expense was $43.8$42.4 million for the thirteen-week period ended May 31, 2014, an increase28, 2016, a decrease of $13.0 million,$440,000, or 42.2%1.0%, compared to $30.8$42.8 million for the thirteen-week period ended June 1, 2013. ExcludingMay 30, 2015. LOSS (GAIN) ON DISPOSAL OF FIXED ASSETSIn fiscal 2016 we recorded a gain on the Acquisitions, selling, general, and administrative expense for the thirteen-week period ended May 31, 2014 was $35.9disposal of fixed assets of $1.6 million an increase of $7.0 million, or 24.3%, compared to $28.9 million for the thirteen-week period ended June 1, 2013. The increase in specialty egg expense for the thirteen-week period ended May 31, 2014 compareddue to the same periodsale of property in Albuquerque, New Mexico, compared with a loss on the disposal of fixed assets of $568,000 in fiscal 2013 is attributable to a 16.9% increase specialty shell egg dozens sold resulting in an increase in advertising promotions and franchise expense.OPERATING INCOMEAs a result of the above, our operating income was $146.1$470.3 million for fiscal 2014,2016, compared to $59.6$235.3 million for fiscal 2013.2015. Operating income as a percent of net sales was 24.7% and 14.9% for fiscal 2014 was 10.1%, compared to 4.6% for fiscal 2013. In fiscal 2013 we recorded legal settlement expense of $28.0 million related to the previously disclosed settlement reached in the In re Processed Egg Products Antitrust litigation.OTHER INCOME (EXPENSE)Total other income (expense) consists of income (expenses) not directly charged to, or related to, operations such as interest expense, royaltyinterest income, and patronage income,dividends, and equity in earnings of affiliates, among other items. Total otherother income for fiscal 20142016 was $15.8$15.4 million compared to $16.0$11.8 million for fiscal 2013.2015. As a percent of net sales, total other income was 1.1%0.8% for fiscal 2014,2016, compared to 1.2%0.7% for fiscal 2013.Patronage2015.Net interest income for fiscal 2016 was $6.1$3.2 million compared to net interest expense of $515,000 for fiscal 2015. Interest income from available for sale securities increased due to higher average invested balances and higher rates of return. The reduction of interest expense resulted from the Company reducing outstanding debt.Equity in income of affiliates for fiscal 2016 was $5.0 million compared to $2.7 million for fiscal 2014, a decrease2015. The increase of $8.2$2.3 million compared to $14.3 million for fiscal 2013is primarily due to a decrease in patronage refunds received from Eggland’s Best, Inc.Other income, net, increased from $2.1 million in fiscal 2013 to $8.8 million in fiscal 2014 primarily due to a non-taxable, non-cash gain of $4.0 million for the remeasurement of our equity interest in Deltathe Southwest Specialty Egg, to the fair value in connection with the purchase of ourLLC joint venture partner’s 50% membership interest on March 1, 2014. INCOME TAXESFor the fiscal year ended May 31, 2014,28, 2016, our pre-tax income was $161.8$487.2 million, compared to $75.6$246.5 million for fiscal 2013.2015. Income tax expense of $52.0$169.2 million was recorded for fiscal 20142016 with an effective income tax rate of 32.1%34.8%, compared to $24.8$84.3 million for fiscal 20132015 with an effective income tax rate of 32.8%34.3%. Included in fiscal 2014 income tax expense are items related to the acquisition of Delta Egg, which resulted in a $3.3 million decrease to deferred income tax expense related to the outside basis of our equity investment in Delta Egg, with a corresponding non-recurring, non-cash $1.5 million reduction to income taxes expense on the non-taxable remeasurement gain associated with the acquisition.Other itemsItems causing our effective rate to differ from the federal statutory income tax rate of 35% are state income taxes and certain items included in income or loss for financial reporting purposes that are not included in taxable income or loss for income tax purposes, including tax exempt interest income, the domestic manufacturers deduction, and net income or loss attributable to noncontrolling interest.NET INCOME ATTRIBUTABLE TO NONCONTROLLING INTERESTNet income attributable to noncontrolling interest in AEP and TEP for fiscal 20142016 was $600,000 as$2.0 million compared to $338,000$1.0 million for fiscal 2013.NET INCOME ATTRIBUTABLE TO CAL-MAINE FOODS, INC.As a result of the above, net income for fiscal 20142016 was $109.2$316.0 million, or $2.27$6.56 per basic share and $2.26$6.53 per diluted share, compared to $50.4$161.3 million, or $1.05$3.35 per basic share and $3.33 per diluted share for fiscal 2013. CAPITAL RESOURCES AND LIQUIDITYOur working capital at May 30, 2015June 3, 2017 was $377.0$371.5 million, compared to $324.3$542.8 million at May 31, 2014.28, 2016. The calculation of working capital is defined as current assets less current liabilities. Our current ratio was 3.866.74 at June 3, 2017 compared to 7.50 at May 30, 2015 compared to 3.68 at May 31, 2014.28, 2016. The current ratio is calculated by dividing current assets by current liabilities. Our need for working capital generally29May 30, 2015,June 3, 2017, including current maturities, amounted to $50.9$10.9 million, compared to $61.1$25.6 million at May 31, 2014.28, 2016. See Note 9 in the notesNotes to consolidated financial statementsConsolidated Financial Statements for information regarding our long-term debt instruments.Net cash used in operating activities was $49.3 million for fiscal year 2017 compared with net cash provided by operating activities was $195.3 million and $123.9of $381.8 million for the fiscal years 2015 and 2014, respectively. Improved operating income as a result of improvedyear 2016. Decreased gross profit margins resulting from lower egg prices contributed greatly to our positivedecrease in cash flow from operations in fiscal 2015 compared to fiscal 2014, as well as fiscal 2014 payment of a $28.0 million legal settlement described in Note 14 to Notes to Consolidated Financial Statements. As discussed above, our gross profit margins increased in fiscal 2015 primarily as a result of an increase in egg prices and dozens sold and a decrease in feed costs compared to fiscal 2014. For fiscal 2015,2017, approximately $146.8$251.7 million was provided from the sale of short-term investments, $202.5$29.8 million was used for theto purchase of short-term investments and net payments of $2.0$6.6 million were received from notes receivable and investments in affiliates. We used $8.2$85.8 million for our investmentto acquire assets from Foodonics and Happy Hen. We invested $19.9 million in Southwest Specialtythe Red River Valley Egg Farm LLC joint venture. For additional information see Note 3 to Notes to Consolidated Financial Statements. Approximately $82.3$66.7 million was used for purchases ofto purchase property, plant and equipment. Refer to the table of material construction projects presented below for additional information on purchases of property, plant and equipment. Approximately $48.9 million was used for payment of dividends on common stock and $10.2$16.5 million was used for principal payments on long-term debt. The net result of these and other activities was a decrease in cash of $5.9$11.5 million from May 31, 2014.For the fiscal year ended May 31, 2014, $123.928, 2016, $381.8 million in net cash was provided by operating activities. This compares to $57.5$195.3 million of net cash provided by operating activities for the fiscal year ended June 1, 2013.May 30, 2015. Improved operating income as a result of improved gross profit margins contributed greatly to our positive cash flow from operations which increased despite the payment in the first quarter of fiscal 2014 of a $28.0 million legal settlement described in Note 142016 compared to the Notes to the Consolidated Financial Statements.fiscal 2015. As discussed above, our gross profit margins increased in fiscal 20142016 primarily as a result of an increase in egg prices and dozens sold and a decrease in feed costs compared to fiscal 2013. For fiscal 2014,2016, approximately $108.1$292.5 million was provided from the sale of short-term investments, $142.6$403.2 million was used for theto purchase of short-term investments and net payments of $5.0$5.4 million were received from notes receivable and investments in affiliates. We used $11.5invested $34.0 million forin the purchase of ourRed River Valley Egg Farm LLC joint venture partner’s 50% interest in Delta Egg.venture. Approximately $59.2$76.1 million was used to purchase property, plant and equipment. Approximately $24.5$120.9 million was used for payment ofto pay dividends on common stock and $10.7$25.3 million was used for principal payments on long-term debt. The net result of these and other activities was a decreasean increase in cash of $10.5$20.4 million from June 1, 2013.Certain property, plant, and equipment is pledged as collateral on our notes payable and senior secured notes. Unless otherwise approved by our lenders, we are required by provisions of our loan agreements to (1) maintain minimum levels of working capital (current ratio of not less than 1.25 to 1) and net worth (minimum of $90.0 million tangible net worth, plus 45% of cumulative net income since the fiscal year ended May 28, 2005); (2) limit dividends paid in any given quarter to not exceed an amount equal to one third of the previous quarter’s consolidated net income (allowed if no events of default); (3) maintain minimum total funded debt to total capitalization (debt to total tangible capitalization ratio not to exceed 55%); and (4) maintain various cash-flow coverage ratios (1.25 to 1), among other restrictions. At May 30, 2015,June 3, 2017, we were in compliance with the financial covenant requirements of all loan agreements. Under certain of the loan agreements, the lenders have the option to require the prepayment of any outstanding borrowings in the event we undergo a change in control, as defined in the applicable loan agreement. Our debt agreements require Fred R. Adams, Jr., our Founder and Chairman Emeritus, or his family, to maintain ownership of Company shares representing not less than 50% of the outstanding voting power of the Company. 30The Company expectsIn recent years we have made significant investments in new and remodeled facilities to fund its 50% share of approximately $73 million of constructionmeet the increasing demand for cage-free, organic and startup costs for theother specialty eggs, including through our previously discussed Red River joint venture. We have contributed $53.9 million to the joint venture during fiscal 2016.to fund our share of construction, startup costs, and operating losses. We estimate that we will make additional contributions of approximately $8 million to fund our share of remaining construction costs. Additionally, the following table represents material construction projects approved as of July 17, 201520, 2017 (in thousands):
May 30, 201512,400 11,226 1,174 50,910 47,475 3,435 16,470 14,686 1,784 5,910 5,370 540 7,872 6,234 1,638 17,175 9,518 7,657 10,700 10,700 121,437 94,509 26,928 Project Location Projected Completion Projected Cost Spent as of
June 3, 2017 Remaining Projected Cost Refurbish Cage-Free Layer Houses Shady Dale, GA July 2017 $ 5,264 $ 4,898 $ 366 Cage-Free Layer Houses Lake City, FL July 2017 8,785 8,415 370 Convertible/Cage-Free Layer Houses Green Forest, AR September 2017 8,991 8,583 408 Cage-Free Layer Houses South Texas September 2017 4,104 3,404 700 Layer Complex Improvements Bethune, SC September 2017 1,758 1,605 153 Convertible/Cage-Free Layer House with Pullets South Texas September 2017 12,350 11,350 1,000 Convertible/Cage-Free Layer Houses with Pullets Guthrie, KY January 2018 13,252 9,841 3,411 $ 54,504 $ 48,096 $ 6,408 Looking forward to the next fiscal year, we believe current cash balances, investments, borrowing capacity, and cash flows from operations will be sufficient to fund our current and projected capital needs.CONTRACTUAL OBLIGATIONS The following table summarizes by fiscal year the future estimated cash payments, in thousands, to be made under existing contractual obligations. Further information on debt obligations is contained in Note 9, and on lease obligations in Note 8, in the Notes to the Consolidated Financial Statements. 6,876 2,784 2,106 996 583 307 100 1,308 493 441 310 57 7 Total 2018 2019 2020 2021 2022 Thereafter Long-Term Debt & Capital Leases (Principal) $ 10,939 $ 4,826 $ 3,533 $ 1,696 $ 205 $ 215 $ 464 Long-Term Debt & Capital Leases (Interest) 901 506 247 70 34 25 19 Operating Leases 1,182 502 208 162 160 150 — Total $ 13,022 $ 5,834 $ 3,988 $ 1,928 $ 399 $ 390 $ 483 IMPACT OF RECENTLY ISSUED ACCOUNTING STANDARDSFor information on changes in accounting principles and new accounting principles, see “Impact of Recently Issued Accounting Standards” in Note 1 to the Consolidated Financial Statements.CRITICAL ACCOUNTING POLICIESThe preparation of financial statements in accordance with U.S. generally accepted accounting standards requires management to make estimates and assumptions that affect the reported amounts of assets and liabilities at the date of the financial statements and the reported amounts of revenues and expenses during the reporting period. Actual results could differ from these estimates.Management suggests our Summary of Significant Accounting Policies, as described in Note 1 of the notes to consolidated financial statements, be read in conjunction with this Management’s Discussion and Analysis of Financial Condition and Results of Operations. We believe the critical accounting policies that most impact our consolidated financial statements are described below.INVESTMENTS IN SECURITIES AVAILABLE-FOR-SALEOur investment securities are accounted for in accordance with ASC 320, “Investments-Debt and Equity Securities” (“ASC 320”). The Company considers all of its investment securities for which there is a determinable fair market value and there are no restrictions on the Company's ability to sell within the next 12 months as available-for-sale. Available-for-sale securities are carriedavailable-for-sale, and carries them at fair value, with unrealized gains and losses reported as a separate component of stockholders' equity. Realized gains and losses31ALLOWANCE FOR DOUBTFUL ACCOUNTS In the normal course of business, we extend credit to our customers on a short-term basis. Although credit risk associated with our customers is considered minimal, we routinely review our accounts receivable balances and make provisions for probable doubtful accounts. In circumstances where management is aware of a specific customer’s inability to meet its financial obligations to us (e.g. bankruptcy filings), a specific reserve is recorded to reduce the receivable to the amount expected to be collected. For all other customers, we recognize reserves for bad debt based on the length of time the receivables are past due, generally 100% for amounts more than 60 days past due.INVENTORIES Inventories of eggs, feed, supplies and livestock are valued principally at the lower of cost (first-in, first-out method) or market. If market prices for eggs and feed grains move substantially lower, we would record adjustments to write-down the carrying values of eggs and feed inventories to fair market value. The cost associated with flock inventories, consisting principally of chick purchases, feed, labor, contractor payments and overhead costs, are accumulated during the growing period of approximately 22 weeks. Capitalized flock costs are then amortized over the flock’s productive lives of the flocks,life, generally one to two years. Flock mortality is charged to cost of sales as incurred. High mortality from disease or extreme temperatures would result in abnormal adjustmentswrite-downs to write-down flock inventories. Management continually monitors each flock and attempts to take appropriate actions to minimize the risk of mortality loss.LONG-LIVED ASSETSDepreciable long-lived assets are primarily comprised of buildings and improvements and machinery and equipment. Depreciation is provided by the straight-line method over the estimated useful lives, which are 15 to 25 years for buildings and improvements and 3 to 12 years for machinery and equipment. An increase or decrease in the estimated useful lives would result in changes to depreciation expense. When property and equipment are retired, sold, or otherwise disposed of, the asset’s carrying amount and related accumulated depreciation are removed from the accounts and any gain or loss is included in operations. We continually reevaluate the carrying value of our long-lived assets, for events or changes in circumstances which indicate the carrying value may not be recoverable from the estimated future cash flows expected to result from its use and eventual disposition. If the sum of the expected future cash flows (undiscounted and without interest charges) are less than the carrying amount of the asset, an impairment loss is recognized to reduce the carrying value of the long-lived asset to the estimated fair value of the asset.INTANGIBLE ASSETSIncluded in other intangible assets are separable intangible assets acquired in business acquisitions, which include franchise fees, non-compete agreements and customer relationship intangibles, andintangibles. They are amortized over their estimated useful lives of 3 to 25 years. The gross cost and accumulated amortization of intangible assets are removed when the recorded amounts have beenare fully amortized and the asset is no longer in use. Included in other long-lived assets are loan acquisition costs, which are amortized over the life of the related loan.INVESTMENT IN AFFILIATESWe have invested in other companies engaged in the production, processing and distribution of shell eggs and egg products. Our ownership percentages in these companies range from less than 20% to 50%. These investments are recorded using the cost or equity method, and accordingly,are not consolidated in our financial statements. Changes in the ownership percentages of these investments might alter the accounting methods currently used. Our investment in these companies amounted to $13.1$65.7 million at May 30, 2015.June 3, 2017. The combined total assets and total liabilities of these companies were approximately $357.4$299.9 million and $57.1$37.1 million, respectively, at May 30, 2015.June 3, 2017.32GOODWILLGOODWILLAt May 30, 2015,June 3, 2017, goodwill represented 3.1%3.4% of total assets and 4.1%4.2% of stockholders’ equity. Goodwill relates to the following:$3,147 869 179 9,257 2,527 1,876 4,600 (338) 2,300 4,779 $29,196 Fiscal Year Description Amount 1999 Acquisition of Hudson Brothers, Inc. $ 3,147 2006 Acquisition of Hillandale Farms, LLC 869 2007 Acquisition of Green Forest Foods, LLC 179 2008 Revised Hillandale incremental purchase price 9,257 2009 Revised Hillandale incremental purchase price 2,527 2009 Acquisition of Zephyr Egg, LLC 1,876 2009 Acquisition of Tampa Farms, LLC 4,600 2010 Revised Hillandale incremental purchase price (338 ) 2013 Acquisition of Maxim Production Co., Inc. 2,300 2014 Purchase of joint venture partner’s 50% in Delta Egg 4,779 2017 Acquisition of Foodonics International, Inc. 3,389 2017 Acquisition of Happy Hen Egg Farms, Inc. 2,940 Total Goodwill $ 35,525 Goodwill is evaluated for impairment annually by first performing a qualitative assessment to determine whether a quantitative goodwill test is necessary. After assessing the totality of events or circumstances, if we determine it is more likely than not that the fair value of a reporting unit is less than its carrying amount, then we perform additional quantitative tests to determine the magnitude of any impairment.REVENUE RECOGNITION AND DELIVERY COSTSThe Company recognizes revenue only when all of the following criteria have been met:·Persuasive evidence of an arrangement exists;·Delivery has occurred;
Persuasive evidence of an arrangement exists;·The fee for the arrangement is determinable; and
Delivery has occurred;·Collectability is reasonably assured.The fee for the arrangement is determinable; andCollectability is reasonably assured.The Company believes the above criteria are met upon delivery and acceptance of the product by our customers. Costs to deliver product to customers are included in selling, general and administrative expenses in the accompanying Consolidated Statements of IncomeOperations and totaled $47.0$53.3 million, $43.0$49.6 million, and $38.1$47.0 million in fiscal years 2015, 2014,2017, 2016, and 2013,2015, respectively. Sales revenue reported in the accompanying consolidated statementsConsolidated Statements of incomeOperations is reduced to reflect estimated returns and allowances. The Company records an estimated sales allowance for returns and discounts at the time of sale using historical trends based on actual sales returns and sales.SALES INCENTIVES PROVIDED TO CUSTOMERSThe Company periodically provides incentive offers to its customers to encourage purchases. Such offers include current discount offers (e.g., percentage discounts off current purchases), inducement offers (e.g., offers for future discounts subject to a minimum current purchase), and other similar offers. Current discount offers, when accepted by customers, are treated as a reduction to the sales price of the related transaction, while inducement offers, when accepted by customers, are treated as a reduction to sales price based on estimated future redemption rates. Redemption rates are estimated using the Company’s historical experience for similar inducement offers. Current discount and inducement offers are presented as a net amount in ‘‘Net sales.’’STOCK BASED COMPENSATIONWe account for share-based compensation in accordance with ASC 718, “Compensation-Stock Compensation” (“ASC 718”). ASC 718 requires all share-based payments to employees, including grants of employee stock options, restricted stock and performance-based shares to be recognized in the income statement of operations based on their fair values. ASC718 requires the benefits of tax deductions in excess of recognized compensation cost to be reported as a financing cash flow. See Note 11: Stock Compensation Plans in the notesNotes to the consolidated financial statementsConsolidated Financial Statements for more information.33We determine our effective tax rate by estimating our permanent differences resulting from differing treatment of items for tax and accounting purposes. We are periodically audited by taxing authorities. Any audit adjustments affecting permanent differences could have an impact on our effective tax rate.COMMODITY PRICE RISKOur primary exposure to market risk arises from changes in the prices of eggs, corn and soybean meal, which are commodities subject to significant price fluctuations due to market conditions that are largely beyond our control. For example, feed costs, which during fiscal 2015 averaged 62% of our total farm egg production cost, decreased 11% per dozen produced year-over-year. WeFWe are focused on growing our specialty shell egg business because the selling prices of specialty shell eggs are generally not as volatile as genericnon-specialty shell egg prices. The following table outlines the impact of price changes for corn and soybean meal on feed cost per dozen:
feed ingredient cost0.25 25.00 Feed ingredient Approximate change in feed ingredient cost Approximate impact on feed costs per dozen Approximate dollar impact on farm production cost for the 2017 fiscal year Corn $ 0.25 change in the average market price per bushel $ 0.01 $ 8,702,520 Soybean Meal $ 25.00 change in the average market price per ton $ 0.01 $ 8,702,520 We generally do not enter into long-term contracts to purchase corn and soybean meal or hedge against increases in the price of corn and soybean meal, except to the limited extent described in Note 20 to Consolidated Financial Statements.INTEREST RATE RISKThe fair value of our debt is sensitive to changes in the general level of U.S. interest rates. We maintain all of our debt as fixed rate in nature to mitigate the impact of fluctuations in interest rates. Under our current policies, we do not use interest rate derivative instruments to manage our exposure to interest rate changes. A 1% adverse move (decrease) in interest rates would adversely affect the net fair value of our debt by $1.1 million$144,000 at May 30, 2015. We are not a party to noany other material market risk sensitive instruments requiring disclosure.34Board of Directors and StockholdersCal-Maine Foods, Inc. and SubsidiariesJackson, MississippiWe have audited the accompanying consolidated balance sheets of Cal-Maine Foods, Inc. and Subsidiaries as of May 30, 2015June 3, 2017 and May 31, 2014,28, 2016, and the related consolidated statements of income,operations, comprehensive income (loss), stockholders’ equity and cash flows for each of the years in the three-year period ended May 30, 2015.June 3, 2017. Our audits also included the consolidated financial statement schedule listed in the Index at Item 15(a). These consolidated financial statements are the responsibility of the entity’s management. Our responsibility is to express an opinion on these consolidated financial statements based on our audits. We conducted our audits in accordance with the standards of the Public Company Accounting Oversight Board (United States). Those standards require that we plan and perform the audits to obtain reasonable assurance about whether the consolidated financial statements are free of material misstatement. An audit includes examining, on a test basis, evidence supporting the amounts and disclosures in the consolidated financial statements. An audit also includes assessing the accounting principles used and significant estimates made by management, as well as evaluating the overall financial statement presentation. We believe our audits provide a reasonable basis for our opinion.In our opinion, the consolidated financial statements referred to above present fairly, in all material respects, the financial position of Cal-Maine Foods, Inc. and Subsidiaries as of May 30, 2015June 3, 2017 and May 31, 2014,28, 2016, and the results of their operations and their cash flows for each of the years in the three-year period ended May 30, 2015,June 3, 2017, in conformity with accounting principles generally accepted in the United States of America. In addition, in our opinion, the related financial statement schedule, when considered in relation to the basic consolidated financial statements taken as a whole, presents fairly in all material respects the information set forth therein.We also have audited, in accordance with the standards of the Public Company Accounting Oversight Board (United States), Cal-Maine Foods, Inc. and Subsidiaries internal control over financial reporting as of May 30, 2015,June 3, 2017, based on criteria established in2013 Internal Control – Integrated Frameworkissued by the Committee of Sponsoring Organizations of the Treadway Commission, and our report dated July 17, 2015,21, 2017, expressed an unqualified opinion./s/Frost, PLLCLittle Rock, ArkansasJuly 17, 201521, 201735Consolidated Balance Sheets(in thousands, except for par value amounts) June 3,
2017 May 28,
2016 8,667 14,521 $ 17,564 $ 29,046 249,961 194,738 138,462 360,499 99,013 82,978 Trade receivables, less allowance for doubtful accounts of $386 in 2017 and $727 in 2016 61,261 62,012 Income tax receivable 52,691 11,830 2,964 4,538 3,248 5,436 101,977 87,516 117,200 79,278 146,260 146,117 160,692 154,799 2,099 2,501 2,288 2,661 508,964 445,393 436,206 626,283 18,843 6,786 69,296 53,975 211 29,196 29,196 35,525 29,196 7,560 10,423 29,149 4,958 5,300 4,717 4,734 5,079 60,899 51,333 138,704 93,208 358,790 314,935 Property, plant and equipment, less accumulated depreciation 458,184 392,274 928,653 811,661 $ 1,033,094 $ 1,111,765 44,709 38,974 $ 30,629 $ 36,262 15,372 10,497 16,939 15,205 15,809 23,198 5,288 2,983 9,173 12,775 13,415 7,671 10,065 10,216 4,826 16,320 30,391 30,451 131,937 121,101 64,679 83,451 40,795 50,877 6,113 9,250 5,745 4,436 7,527 6,321 45,614 40,502 110,282 95,382 224,091 216,916 188,601 194,404 Commitments and contingencies – See Notes 8, 9, and 13 703 351 120,000 shares authorized and 70,261 shares issued in 2017 and 2016 43,777 and 43,737 shares outstanding in 2017 and 2016, respectively 703 703 48 24 4,800 shares authorized, issued and outstanding in 2017 and 2016, respectively 48 48 43,304 40,476 49,932 46,404 679,969 572,874 816,046 890,440 22 561 (20,482) (20,453) Accumulated other comprehensive loss, net of tax (128 ) (48 ) Common stock in treasury, at cost – 26,484 and 26,524 shares in 2017 and 2016, respectively (23,914 ) (22,272 ) 703,564 593,833 842,687 915,275 998 912 1,806 2,086 704,562 594,745 844,493 917,361 928,653 811,661 $ 1,033,094 $ 1,111,765
36
Cal-Maine Foods, Inc. and Subsidiaries
Operations
|
|
|
|
|
|
|
|
|
|
|
|
|
|
| Fiscal years ended | |||||
|
| May 30 |
| May 31 |
| June 1 |
|
| 2015 |
| 2014 |
| 2013 |
Net sales | $ | 1,576,128 | $ | 1,440,907 | $ | 1,288,104 |
Cost of sales |
| 1,180,407 |
| 1,138,143 |
| 1,073,555 |
Gross profit |
| 395,721 |
| 302,764 |
| 214,549 |
Selling, general and administrative |
| 160,386 |
| 156,712 |
| 126,956 |
Legal settlement expense (see Note 14) |
| - |
| - |
| 28,000 |
Operating income |
| 235,335 |
| 146,052 |
| 59,593 |
|
|
|
|
|
|
|
Other income (expense): |
|
|
|
|
|
|
Interest expense |
| (2,313) |
| (3,755) |
| (4,488) |
Interest income |
| 1,798 |
| 1,099 |
| 582 |
Patronage dividends |
| 6,893 |
| 6,139 |
| 14,300 |
Equity in income of affiliates |
| 2,657 |
| 3,512 |
| 3,480 |
Other, net |
| 2,179 |
| 8,795 |
| 2,101 |
Total other income |
| 11,214 |
| 15,790 |
| 15,975 |
Income before income taxes and noncontrolling interest |
| 246,549 |
| 161,842 |
| 75,568 |
Income tax expense |
| 84,268 |
| 52,035 |
| 24,807 |
Net income including noncontrolling interest |
| 162,281 |
| 109,807 |
| 50,761 |
Less: Net income attributable to noncontrolling interest |
| 1,027 |
| 600 |
| 338 |
Net income attributable to Cal-Maine Foods, Inc. | $ | 161,254 | $ | 109,207 | $ | 50,423 |
|
|
|
|
|
|
|
Net income per share: |
|
|
|
|
|
|
Basic | $ | 3.35 | $ | 2.27 | $ | 1.05 |
Diluted | $ | 3.33 | $ | 2.26 | $ | 1.05 |
Weighted average shares outstanding: |
|
|
|
|
|
|
Basic |
| 48,136 |
| 48,095 |
| 47,967 |
Diluted |
| 48,437 |
| 48,297 |
| 48,088 |
| Fiscal years ended | ||||||||||||
| June 3, 2017 | May 28, 2016 | May 30, 2015 | ||||||||||
| Net sales | $ | 1,074,513 | $ | 1,908,650 | $ | 1,576,128 | ||||||
| Cost of sales | 1,028,963 | 1,260,576 | 1,180,407 | |||||||||
| Gross profit | 45,550 | 648,074 | 395,721 | |||||||||
| Selling, general and administrative | 173,980 | 177,760 | 160,386 | |||||||||
| (Gain) loss on disposal of fixed assets | 3,664 | (1,563 | ) | 568 | ||||||||
| Operating income (loss) | (132,094 | ) | 471,877 | 234,767 | ||||||||
| Other income (expense): | ||||||||||||
| Interest expense | (318 | ) | (1,156 | ) | (2,313 | ) | ||||||
| Interest income | 3,103 | 4,314 | 1,798 | |||||||||
| Patronage dividends | 7,665 | 6,930 | 6,893 | |||||||||
| Equity in income of affiliates | 1,390 | 5,016 | 2,657 | |||||||||
| Other, net | 5,960 | 268 | 2,747 | |||||||||
| Total other income | 17,800 | 15,372 | 11,782 | |||||||||
| Income (loss) before income taxes and noncontrolling interest | (114,294 | ) | 487,249 | 246,549 | ||||||||
| Income tax expense (benefit) | (39,867 | ) | 169,202 | 84,268 | ||||||||
| Net income (loss) including noncontrolling interest | (74,427 | ) | 318,047 | 162,281 | ||||||||
| Less: Net income (loss) attributable to noncontrolling interest | (149 | ) | 2,006 | 1,027 | ||||||||
| Net income (loss) attributable to Cal-Maine Foods, Inc. | $ | (74,278 | ) | $ | 316,041 | $ | 161,254 | |||||
| Net income (loss) per share: | ||||||||||||
| Basic | $ | (1.54 | ) | $ | 6.56 | $ | 3.35 | |||||
| Diluted | $ | (1.54 | ) | $ | 6.53 | $ | 3.33 | |||||
| Weighted average shares outstanding: | ||||||||||||
| Basic | 48,362 | 48,195 | 48,136 | |||||||||
| Diluted | 48,362 | 48,365 | 48,437 | |||||||||
37
Fiscal years ended May 30 May 31 June 1 2015 2014 2013 Net income, including noncontrolling interests $ $ $ Other comprehensive income, before tax: Unrealized holding gain (loss) on available-for-sale securities, net of reclassification adjustments (Increase) decrease in accumulated postretirement benefits obligation, net of reclassification adjustments Other comprehensive income (loss), before tax Income tax (benefit) expense related to items of other comprehensive income (loss) Other comprehensive income (loss), net of tax Comprehensive income Less: comprehensive income attributable to the noncontrolling interest Comprehensive income attributable to Cal-Maine Foods, Inc. $ $ $ Cal-Maine Foods, Inc. and Subsidiaries Common Stock Class A Class A Treasury Treasury Paid-In Retained Accum. Other Noncontrolling Shares Amount Shares Amount Shares Amount Capital Earnings Comp. Income Interests Total Balance at June 2, 2012 $ 351 $ 24 $ (20,843) $ 33,651 $ 466,164 $ (222) $ 203 $ 479,328 Dividends Issuance of common stock from treasury Issuance of restricted stock from treasury, net of forfeitures - Restricted stock compensation expense Tax benefit on nonqualifying disposition of incentive stock options Reclassification equity of Texas Egg Products, LLC in connection with acquisitions - see Note 2 - Net income for fiscal 2013 Other comprehensive income Balance at June 1, 2013 $ 351 $ 24 $ (20,572) $ 39,052 $ 498,711 $ 166 $ 312 $ 518,044 Dividends Issuance of restricted stock from treasury, net of forfeitures - Purchase of company stock - shares withheld to satisfy withholding obligation in connection with the vesting of restricted stock Proceeds from stock option exercise Restricted stock compensation expense Tax benefit on nonqualifying disposition of incentive stock options Net income for fiscal 2014 Other comprehensive income Balance at May 31, 2014 $ 351 $ 24 $ (20,453) $ 40,476 $ 572,874 $ 561 $ 912 $ 594,745 Dividends 2-for-1 stock split effected in the form of a dividend - Issuance of restricted stock from treasury, net of forfeitures - Purchase of company stock - shares withheld to satisfy withholding obligation in connection with the vesting of restricted stock - Proceeds from stock option exercise Restricted stock compensation expense Tax benefit on nonqualifying disposition of incentive stock options Distribution to noncontrolling interest partners Net income for fiscal 2015 Other comprehensive loss, net of tax Balance at May 30, 2015 $ 703 $ 48 $ (20,482) $ 43,304 $ 679,969 $ 22 $ 998 $ 704,562 Cal-Maine Foods, Inc. and Subsidiaries Fiscal year ended May 30 May 31 June 1 2015 2014 2013 Cash flows from operating activities Net income including noncontrolling interests $ $ $ Adjustments to reconcile net income to net cash provided by operating activities: Depreciation and amortization Deferred income taxes Equity in income of affiliates Non-cash gain on Delta Egg acquisition — — Loss on disposal of property, plant and equipment Stock compensation expense, net of amounts paid Impairment (recovery) of note receivable — (Gain) loss on fair value adjustment of contingent consideration Change in operating assets and liabilities, net of effects from acquisitions: Increase in receivables and other assets (Increase) decrease in inventories Decrease in accrued expenses for payment of legal settlement expense — — Increase (decrease) in accounts payable, accrued expenses and other liabilities Net cash provided by operating activities Cash flows from investing activities Purchases of investments Sales of investments Acquisition of businesses, net of cash acquired — Investment in Southwest Specialty Egg LLC — — Payments received on notes receivable and from investments in affiliates Purchases of property, plant and equipment Increase in notes receivable and investments in affiliates — — Net proceeds from disposal of property, plant and equipment Net cash used in investing activities Cash flows from financing activities Principal payments on long-term debt Distributions to noncontrolling interest partners — — Proceeds from issuance of common stock from treasury (including tax benefit on nonqualifying disposition of incentive stock options) Payments of dividends Net cash used in financing activities Decrease in cash and cash equivalents Cash and cash equivalents at beginning of year Cash and cash equivalents at end of year $ $ $ Supplemental cash flow information: Cash paid during the year for: Income taxes, net of refunds received $ $ $ Interest (net of amount capitalized) Supplemental schedule of non-cash investing and financing activity: Issuance of stock from treasury (see Note 2) — — Contingent consideration recognized in acquisition of business — — Cal-Maine Foods, Inc. and Subsidiaries Treasury Stock Stock Based Compensation May 30, 2015 May 31, 2014 June 1, 2013 Net income attributable to Cal-Maine Foods, Inc. $ 161,254 $ 109,207 $ 50,423 Basic weighted-average common shares (including Class A) Effect of dilutive securities: Common stock options and restricted stock Dilutive potential common shares Net income per common share: Basic $ 3.35 $ 2.27 $ 1.05 Diluted $ 3.33 $ 2.26 $ 1.05 requirements retrospectively to all prior periods presented, or apply the requirements in the year of adoption, through a cumulative adjustment. Alabama, Florida, and Georgia as well as Puerto Rico, Bahamas and Cuba. The Company now owns 100% of AEP. The acquired operations of Foodonics are included in the accompanying financial statements as of October 16, 2016. For the fiscal year ended May 30, 2015 May 31, 2014 June 1, 2013 Sales to affiliates $ $ $ Purchases from affiliates Dividends from affiliates May 30, 2015 May 31, 2014 Accounts receivable from affiliates $ $ Accounts payable to affiliates May 30, 2015 May 31, 2014 Flocks, net of accumulated amortization $ 87,280 $ 90,152 Eggs 15,507 11,747 Feed and supplies 43,473 44,218 $ 146,260 $ 146,117 For the fiscal year ended May 30, 2015 May 31, 2014 June 1, 2013 Amortization $ $ $ Mortality Total flock costs charge to cost of sales $ $ $ May 30, 2015 May 31, 2014 Prepaid insurance $ 1,526 $ 1,029 Other prepaid expenses Other current assets $ 2,099 $ 2,501 Other Intangibles Franchise Customer Non-compete Right of use Water Total other Goodwill rights relationships agreements intangible rights intangibles Balance June 1, 2013 $ 24,417 $ 1,831 $ 10,407 $ 88 $ - $ - $ 12,326 Additions - - - Amortization - - - Balance May 31, 2014 Additions - - - - - - - Amortization - - Balance May 30, 2015 $ 29,196 $ 870 $ 5,773 $ 48 $ 149 $ 720 $ 7,560 May 30, 2015 May 31, 2014 Gross carrying Accumulated Gross carrying Accumulated amount amortization amount amortization Other intangible assets: Franchise rights $ 5,284 $ (4,414) $ 5,284 $ (3,930) Customer relationships Non-compete agreements Right of use intangible - Water rights * - - Total $ 23,939 $ (16,379) $ 23,939 $ (13,516) For fiscal period Estimated amortization expense 2016 $ 2,623 2017 2018 2019 2020 Thereafter Total $ 6,840 May 30 May 31 2015 2014 Land and improvements $ $ Buildings and improvements Machinery and equipment Construction-in-progress Less: accumulated depreciation $ $ recoveries related to business interruption are classified as operating cash flows and recoveries related to property damage are classified as investing cash flows in the statement of cash flows. Insurance claims incurred or finalized during the fiscal years ended 2016 $ 2017 2018 2019 2020 Total minimum lease payments $ May 30 May 31 2015 2014 Note payable at 6.20%, due in monthly principal installments of $250,000, plus interest, maturing in 2019 $ $ Note payable at 5.99%, due in monthly principal installments of $150,000, plus interest, maturing in 2021 Note payable at 6.35%, due in monthly principal installments of $100,000, plus interest, maturing in 2017 Series A Senior Secured Notes at 5.45%, due in monthly principal installments of $175,500, plus interest, maturing in 2018 Note payable at 5.40%, due in monthly principal installments of $125,000, plus interest, maturing in 2018 Note payable at 6.40%, due in monthly principal installments of $35,000, plus interest, maturing in 2018 Note payable at 2.00%, due in semi-annual principal and interest payments of $20,790, maturing in 2019 Note payable at 6.07%, due in monthly principal installments of $33,300, plus interest, maturing in 2015 - Total debt Less: current maturities Long-term debt, less current maturities $ $ 2016 $ 2017 2018 2019 2020 Thereafter $ June 3, 2017. 28, 2016. In December 2006, the Company adopted an additional deferred compensation plan to provide deferred compensation to named officers of the Company. The awards issued under this plan were issued and outstanding shares of the Company’s common stock for all corporate purposes during the period of restriction including the right to receive dividends. Compensation expense is a fixed amount based on the grant date closing price and is amortized over the vesting period. Weighted Weighted Average Number Exercise Remaining Aggregate of Price Contractual Intrinsic Options Per Share Life (in Years) Value Outstanding, June 1, 2013 $ Granted - - Exercised Forfeited - - Outstanding, May 31, 2014 $ Granted - - Exercised Forfeited - - Outstanding, May 30, 2015 - $ - - $ - Exercisable, May 30, 2015 - $ - - $ - Weighted Number Average of Grant Date Shares Fair Value Outstanding, June 1, 2013 $ Granted Vested Forfeited Outstanding, May 31, 2014 $ Granted Vested Forfeited Outstanding, May 30, 2015 $ Weighted Weighted Average Number Average Remaining Aggregate Of Strike Price Contractual Intrinsic Rights Per Right Life (in Years) Value Outstanding, June 1, 2013 $ Granted - - Exercised Forfeited - - Outstanding, May 31, 2014 $ Granted - - Exercised Forfeited - - Outstanding, May 30, 2015 $ $ Exercisable, May 30, 2015 $ $ May 30, 2015 May 31, 2014 June 1, 2013 Risk-free interest rate 0.26% 0.10% 0.13% Dividend yield 1.25% 1.66% 2.66% Volatility factor of the expected market price of our stock 36.59% 37.36% 23.65% Weighted-avg. expected life of the rights 1 yr. 1 yr. 1 yr. Fiscal year ended May 30 May 31 June 1 2015 2014 2013 Current: Federal $ $ $ State Deferred: Federal State $ $ $ May 30 May 31 2015 2014 Deferred tax liabilities: Property, plant and equipment $ $ Cash basis temporary differences Inventories Investment in affiliates Other comprehensive income Other Total deferred tax liabilities Deferred tax assets: Accrued expenses Other Total deferred tax assets Net deferred tax liabilities $ $ Fiscal year end May 30 May 31 June 1 2015 2014 2013 Statutory federal income tax $ $ $ State income taxes, net Domestic manufacturers deduction Reversal of outside basis in equity investment-Delta Egg - - Non-taxable remeasurement gain upon consolidation of Delta Egg - - Tax exempt interest income Other, net $ $ $ Florida Civil Investigative Demand and Class A Common to Common Stock concurrently. stock. The primary purpose of the amendment was to provide a sufficient number of authorized shares in order to effect a 2-for-1 stock split of the Company’s common stock and Class A common stock. The amendment was approved by the Company’s stockholders at the Company’s annual meeting on October 3, 2014 and the Board of Directors approved the 2-for-1 stock split on the same day. The new shares were distributed on October 31, 2014 to shareholders of record at the close of business on October 17, 2014. May 30, 2015 May 31, 2014 Carrying Value Fair Value Carrying Value Fair Value 2.00 – 6.80% Notes payable $ $ $ $ Series A Senior Secured Notes at 5.45% $ $ $ $ May 30, 2015 Quoted Prices in Active Significant Markets for Other Significant Identical Observable Unobservable Instruments Inputs Inputs Total (Level 1) (Level 2) (Level 3) Balance Assets US government and agency obligations $ - $ $ - $ Municipal bonds - - Certificates of deposit - - Commercial paper - - Corporate bonds - - Foreign government obligations - - Asset backed securities - - Mutual Funds - - Commodity contracts - - Total assets measured at fair value $ $ $ - $ Liabilities Contingent consideration - - Total liabilities measured at fair value $ - $ - $ $ May 31, 2014 Quoted Prices in Active Significant Markets for Other Significant Identical Observable Unobservable Instruments Inputs Inputs Total (Level 1) (Level 2) (Level 3) Balance Assets US government and agency obligations $ - $ $ - $ Municipal bonds - - Certificates of deposit - - Commercial paper - - Corporate bonds - - Foreign government obligations - - Variable rate demand notes - - Mutual Funds - - Commodity contracts - - Total assets measured at fair value $ $ $ - $ Liabilities Contingent consideration - - Total liabilities measured at fair value $ - $ - $ $ The Company applies fair value accounting guidance to measure non-financial assets and liabilities associated with business acquisitions. These assets and liabilities are measured at fair value for the initial purchase price allocation and are subject to recurring revaluations. The fair value of non-financial assets acquired is determined internally. Our internal valuation methodology for non-financial assets takes into account the remaining estimated life of the assets acquired and what management believes is the market value for those assets. Investment securities consisted of the following (in thousands): May 30, 2015 Gains in Losses in Accumulated Accumulated Estimated Amortized Other Other Fair Cost Comprehensive Comprehensive Value Income Income US government and agency obligations $ 9,609 $ 21 $ - $ 9,630 Municipal bonds - Certificates of deposit - Commercial paper - Corporate bonds - Foreign government obligations - Asset backed securities - Mutual funds - Total current investment securities $ 249,896 $ 116 $ 51 $ 249,961 Mutual funds - Total noncurrent investment securities $ 1,199 $ 548 $ - $ 1,747 May 31, 2014 Gains in Losses in Accumulated Accumulated Estimated Amortized Other Other Fair Cost Comprehensive Comprehensive Value Income Income US government and agency obligations $ 8,847 $ 12 $ - $ 8,859 Municipal bonds - Certificates of deposit - Commercial paper - Corporate bonds - Foreign government obligations - Variable rate demand notes - - Mutual funds - Total current investment securities $ 194,434 $ 304 $ - $ 194,738 Mutual funds - Total noncurrent investment securities $ 999 $ 452 $ - $ 1,451 Actual maturities may differ from contractual maturities because some borrowers have the right to call or prepay obligations with or without call or prepayment penalties. Contractual maturities of investment securities at June 3, 2017, are as follows (in thousands): Fiscal Year 2015 First Second Third Fourth Quarter Quarter Quarter Quarter Net sales $ $ $ $ Gross profit Net income attributable to Cal-Maine Foods, Inc. Net income per share: Basic $ $ $ $ Diluted $ $ $ $ Fiscal Year 2014 First Second Third Fourth Quarter Quarter Quarter Quarter Net sales $ $ $ $ Gross profit Net income attributable to Cal-Maine Foods, Inc. Net income per share: Basic $ $ $ $ Diluted $ $ $ $ Contracts outstanding at period end Commodity Units Fair Value Corn bushels Soybean meal tons Balance at Charged to Balance at Beginning of Cost and Write-off End of Description Period Expense of Accounts Period Year ended May 30, 2015 Allowance for doubtful accounts $ $ $ $ Year ended May 31, 2014 Allowance for doubtful accounts $ $ $ $ Year ended June 1, 2013 Allowance for doubtful accounts $ $ $ $ Report of Independent Registered Public Accounting Firm III. IV. June 3, 2017, May 28, 2016, and May 30, 2015 June 3, 2017, May 28, 2016, and May 30, 2015 Exhibit Number Exhibit 3.1 3.2 10.1* 21** 23.1** 31.1** 31.2** 32*** 99.1 101.INS***+ XBRL Instance Document Exhibit 101.SCH***+ XBRL Taxonomy Extension Schema Document Exhibit 101.CAL***+ XBRL Taxonomy Extension Calculation Linkbase Document Exhibit 101.DEF***+ XBRL Taxonomy Extension Definition Linkbase Document Exhibit 101.LAB***+ XBRL Taxonomy Extension Label Linkbase Document Exhibit 101.PRE***+ XBRL Taxonomy Extension Presentation Linkbase Document Mississippi. Adolphus B. Baker President, Chief Executive Officer and Chairman of the Board President, Chief Executive July Adolphus B. Baker Officer and Chairman of the Board (Principal Executive Officer) /s/ Timothy A. Dawson Vice President, Chief Financial July Timothy A. Dawson Officer and Director (Principal Financial Officer) /s/ Michael D. Castleberry Vice President, Controller July Michael D. Castleberry (Principal Accounting Officer) /s/ Sherman Miller Vice President, Chief Operating July Sherman Miller Officer and Director /s/ Letitia C. Hughes Director July Letitia C. Hughes /s/ James E. Poole Director July James E. Poole /s/ Steve W. Sanders Director July Steve W. SandersCal-Maine Foods, Inc. and Subsidiaries(in thousands)162,281 109,807 50,761 (143) 392 724 (741) 255 (89) (884) 647 635 (345) 252 247 (539) 395 388 161,742 110,202 51,149 1,027 600 338 160,715 109,602 50,811 Fiscal years ended June 3,
2017 May 28,
2016 May 30,
2015Net income (loss), including noncontrolling interests $ (74,427 ) $ 318,047 $ 162,281 Other comprehensive income, before tax: Unrealized holding gain (loss) on available-for-sale securities, net of reclassification adjustments 177 (25 ) (143 ) Increase in accumulated postretirement benefits obligation, net of reclassification adjustments (334 ) (118 ) (741 ) Other comprehensive loss, before tax (157 ) (143 ) (884 ) Income tax benefit related to items of other comprehensive income (loss) (77 ) (73 ) (345 ) Other comprehensive loss, net of tax (80 ) (70 ) (539 ) Comprehensive income (loss) (74,507 ) 317,977 161,742 Less: comprehensive income (loss) attributable to the noncontrolling interest (149 ) 2,006 1,027 Comprehensive income (loss) attributable to Cal-Maine Foods, Inc. $ (74,358 ) $ 315,971 $ 160,715 See accompanying notes.38(in thousands)35,130 2,400 13,609 (18,105) (18,105) (114) 174 4,826 5,000 (63) 97 (97) 292 292 380 380 229 (229) 50,423 338 50,761 388 388 35,130 2,400 13,432 (35,044) (35,044) (63) 98 (98) 1 (9) (9) (20) 30 88 118 1,274 1,274 160 160 109,207 600 109,807 395 395 35,130 2,400 13,350 (53,784) (53,784) 35,131 352 2,400 24 13,340 (133) 132 (375) (91) 70 (70) (2) 2 (36) 36 101 137 2,268 2,268 395 395 (941) (940) 161,254 1,027 162,281 (539) (539) 70,261 4,800 26,563 Common Stock Class A Class A Treasury Treasury Paid In Retained Accum. Other Noncontrolling Shares Amount Shares Amount Shares Amount Capital Earnings Comp. Income (Loss) Interest Total Balance at May 31, 2014 35,130 $ 351 2,400 $ 24 13,350 $ (20,453 ) $ 40,476 $ 572,874 $ 561 $ 912 $ 594,745 Dividends (53,784 ) (53,784 ) 2-for-1 stock split effected in the form of a dividend 35,131 352 2,400 24 13,340 (133 ) 132 (375 ) — Issuance of restricted stock from treasury, net of forfeitures (91 ) 70 (70 ) — Purchase of company stock - shares withheld to satisfy withholding obligation in connection with the vesting of restricted stock (2 ) 2 — Proceeds from stock option exercise (36 ) 36 101 137 Restricted stock compensation expense 2,268 2,268 Tax benefit on nonqualifying disposition of incentive stock options 395 395 Distribution to noncontrolling interest partners (941 ) (941 ) Net income for fiscal 2015 $ 161,254 $ 1,027 162,281 Other comprehensive loss, net of tax (539 ) (539 ) Balance at May 30, 2015 70,261 $ 703 4,800 $ 48 26,563 $ (20,482 ) $ 43,304 $ 679,969 $ 22 $ 998 $ 704,562 Dividends (105,570 ) (105,570 ) Issuance of restricted stock from treasury, net of forfeitures (76 ) 58 (58 ) — Purchase of company stock - shares withheld to satisfy withholding obligation in connection with the vesting of restricted stock 37 (1,848 ) (1,848 ) Restricted stock compensation expense 3,071 3,071 Tax benefit on nonqualifying disposition of incentive stock options 87 87 Distribution to noncontrolling interest partners (918 ) (918 ) Net income for fiscal 2016 316,041 2,006 318,047 Other comprehensive loss, net of tax (70 ) (70 ) Balance at May 28, 2016 70,261 $ 703 4,800 $ 48 26,524 $ (22,272 ) $ 46,404 $ 890,440 $ (48 ) $ 2,086 $ 917,361 Issuance of restricted stock from treasury, net of forfeitures (80 ) 73 (73 ) — Purchase of company stock - shares withheld to satisfy withholding obligation in connection with the vesting of restricted stock 40 (1,715 ) (1,715 ) Restricted stock compensation expense 3,427 3,427 Cumulative adjustment to restricted stock compensation from the adoption of ASU 2016-09 174 (174 ) — Reclass of equity portion of American Egg Products in connection with Foodonics' acquisition 58 (58 ) — Distribution to noncontrolling interest partners (73 ) (73 ) Net loss for fiscal 2017 (74,278 ) (149 ) (74,427 ) Other comprehensive loss, net of tax (80 ) (80 ) Balance at June 3, 2017 70,261 $ 703 4,800 $ 48 26,484 $ (23,914 ) $ 49,932 $ 816,046 $ (128 ) $ 1,806 $ 844,493 See accompanying notes.39Consolidated Statements of Cash Flows(in thousands)162,281 109,807 50,761 40,708 37,203 34,173 5,108 7,625 (5,747) (2,657) (3,512) (3,480) (3,976) 568 651 1,496 2,268 1,273 411 (584) 912 256 4,359 (1,250) (18,961) (2,282) (21,670) (143) 8,909 (6,377) (28,000) 6,486 (8,137) 8,309 195,330 123,920 57,538 (202,506) (142,585) (181,721) 146,779 108,117 188,110 (11,548) (74,907) (8,160) 2,019 5,003 6,640 (82,263) (59,188) (26,290) (294) 2,499 818 124 (141,632) (99,383) (88,338) (10,233) (10,745) (11,200) (940) 531 279 380 (48,910) (24,534) (30,524) (59,552) (35,000) (41,344) (5,854) (10,463) (72,144) 14,521 24,984 97,128 8,667 14,521 24,984 75,533 41,626 42,667 2,313 3,152 3,543 5,000 2,500 Fiscal year ended June 3,
2017 May 28,
2016 May 30,
2015Cash flows from operating activities Net income (loss) including noncontrolling interests $ (74,427 ) $ 318,047 $ 162,281 Adjustments to reconcile net income (loss) to net cash provided by (used in) operating activities: Depreciation and amortization 49,113 44,592 40,708 Deferred income taxes 14,833 19,392 5,108 Equity in income of affiliates (1,390 ) (5,016 ) (2,657 ) (Gain) loss on disposal of property, plant and equipment 3,664 (1,563 ) 568 Stock compensation expense, net of amounts paid 3,427 3,071 2,268 Recovery of note receivable — (798 ) (584 ) Loss on fair value adjustment of contingent consideration — — 256 Other (209 ) — — Change in operating assets and liabilities, net of effects from acquisitions: (Increase) decrease in receivables and other assets (37,222 ) 21,160 (18,961 ) (Increase) decrease in inventories 2,386 (8,539 ) (143 ) Increase (decrease) in accounts payable, accrued expenses and other liabilities (9,491 ) (8,508 ) 6,486 Net cash provided by (used in) operating activities (49,316 ) 381,838 195,330 Cash flows from investing activities Purchases of investments (29,849 ) (403,204 ) (202,506 ) Sales of investments 251,690 292,452 146,779 Acquisition of businesses, net of cash acquired (85,822 ) — — Investment in Southwest Specialty Egg LLC — — (8,160 ) Investment in Red River Valley Egg Farm LLC (19,900 ) (33,959 ) — Payments received on notes receivable and from investments in affiliates 6,586 5,427 2,019 Purchases of property, plant and equipment (66,657 ) (76,125 ) (82,263 ) Net proceeds from disposal of property, plant and equipment 84 2,860 2,499 Net cash provided by (used in) investing activities 56,132 (212,549 ) (141,632 ) Cash flows from financing activities Principal payments on long-term debt (16,510 ) (25,290 ) (10,233 ) Distributions to noncontrolling interest partners (73 ) (918 ) (940 ) (Purchase of) proceeds from common stock by treasury (including tax benefit on nonqualifying disposition of incentive stock options) (1,715 ) (1,760 ) 531 Payments of dividends — (120,942 ) (48,910 ) Net cash used in financing activities (18,298 ) (148,910 ) (59,552 ) Increase (decrease) in cash and cash equivalents (11,482 ) 20,379 (5,854 ) Cash and cash equivalents at beginning of year 29,046 8,667 14,521 Cash and cash equivalents at end of year $ 17,564 $ 29,046 $ 8,667 Supplemental cash flow information: Cash paid during the year for: Income taxes paid (refunds received), net $ (15,233 ) $ 166,840 $ 75,533 Interest (net of amount capitalized) 317 1,067 2,313 See accompanying notes.40Notes to Consolidated Financial StatementsMay 30, 2015June 3, 20171. Significant Accounting PoliciesPrinciples of ConsolidationThe consolidated financial statements include the accounts of Cal-Maine Foods, Inc. and its subsidiaries (“we,” “us,” “our,” or the “Company”). All significant intercompany transactions and accounts have been eliminated in consolidation.BusinessThe Company is principally engaged in the production, processing and distribution of shell eggs. The Company’s operations are significantly affected by the market price fluctuation of its principal product, shell eggs, and the costs of its principal feed ingredients, corn, soybean meal, and other grains.The Company sells shell eggs to a diverse group of customers, including national and local grocery store chains, club stores, foodservice distributors, and egg product consumers. Primarily all of theThe Company’s sales are primarily in the southeastern, southwestern, mid-western and mid-Atlantic regions of the United States. Credit is extended based upon an evaluation of each customer’s financial condition and credit history and generally collateral is not required. Credit losses have consistently been within management’s expectations. Two customers, Wal-Mart and Sam’s Club, on a combined basis, accounted for 25.7%28.9%, 28.2%28.9% and 30.0%25.7% of the Company’s net sales in fiscal years 2017, 2016, and 2015, 2014, and 2013, respectively.Fiscal YearThe Company’s fiscal year-end is on the Saturday nearest May 31, which was June 3, 2017 (53 weeks), May 28, 2016 (52 weeks), and May 30, 2015 May 31, 2014, and June 1, 2013(52 weeks) for the most recent three fiscal years. All three years fiscal years were 52 week years.Use of EstimatesThe preparation of the consolidated financial statements in conformity with U.S. generally accepted accounting principles requires management to make estimates and assumptions that affect the amounts reported in the consolidated financial statements and accompanying notes. Actual results could differ from those estimates.Cash EquivalentsThe Company considers all highly liquid investments with a maturity of three months or less when purchased to be cash equivalents. We maintain bank accounts that are insured by the Federal Deposit Insurance Corporation (“FDIC”) up to $250,000. At May 30, 2015, May 31, 2014, June 3, 2017 and at various timesroutinely throughout these years, the Company maintained cash balances with certain financial institutions in excess of federally insured amounts.amounts. The Company has not experienced any losses in such accounts. The Company manages this risk through maintaining cash deposits and other highly liquid investments in high quality financial institutions. We primarily utilize a cash management system with a series of separate accounts consisting of lockbox accounts for receiving cash, concentration accounts where funds are moved to, and several zero-balance disbursement accounts for funding payroll and accounts payable. Checks issued, but not presented to the banks for payment, may result in negative book cash balances, which are included in accounts payablepayable. At June 3, 2017, and other current liabilities. AtMay 30, 2015, andMay 31, 2014,28, 2016, checks outstanding in excess of related book cash balances totaled approximately$1.8$2.0 million and$1.5 million,zero, respectively.41Investment SecuritiesOur investment securities are accounted for in accordance with ASC 320, “Investments-Debt and Equity Securities” (“ASC 320”). The Company considers all of its investment securities for which there is a determinable fair market value and there are no restrictions on the Company's ability to sell within the next 12 months as available-for-sale. Available-for-sale securities are carried at fair value, with unrealized gains and losses reported as a separate component of stockholders' equity. We had unrealized gains, net of tax, of $372,000$473,000 and $460,000$363,000 at May 30, 2015June 3, 2017 and May 31, 2014,28, 2016, respectively, which are included in the line item “Accumulated other comprehensive income (loss), net of tax” on our Consolidated Balance Sheet. Realized gains and losses are included in other income. The cost basis for realized gains and losses on available-for-sale securities is determined on the specific identification method.At May 30, 2015June 3, 2017 and May 31, 2014,28, 2016, we had $250.0$138.5 million and $194.7$360.5 million, respectively, of current investment securities available-for-sale consisting of commercial paper, certificates of deposit, time deposits, U.S. government obligations, government agency bonds, taxable municipal bonds, tax-exempt municipal bonds, zero coupon municipal bonds and corporate bonds with maturities of three months or longer when purchased. We classified these securities as current, because the amounts invested are available for current operations. At May 30, 2015June 3, 2017 and May 31, 2014,28, 2016 we had $1.7$2.5 million and $1.5$1.9 million, respectively, of investments in mutual funds which are considered long term and are a part of “Other Investments” in the Consolidated Balance Sheet. Investment in AffiliatesThe equity method of accounting is used when the Company has a 20% to 50% interest in other entities or when the Company exercises significant influence over the entity. Under the equity method, original investments are recorded at cost and adjusted by the Company’s share of undistributed earnings or losses of these entities. Nonmarketable investments in which the Company has less than a 20% interest and in which it does not have the ability to exercise significant influence over the investee are initially recorded at cost, and periodically reviewed for impairment.Trade Receivables and Allowance for Doubtful AccountsTrade receivables are comprised primarily of amounts owed to the Company from customers, which amounted to $99.0$61.3 million at June 3, 2017 and $62.0 million at May 30, 2015 and $83.0 million at May 31, 2014.28, 2016. They are presented net of an allowance for doubtful accounts of $513,000$386,000 at June 3, 2017 and $727,000 at May 30, 2015 and $430,000 at May 31, 2014.28, 2016. The Company extends credit to customers based upon an evaluation of each customer’s financial condition and credit history. Although credit risks associated with our customers are considered minimal, we routinely review our accounts receivable balances and make provisions for probable doubtful accounts. In circumstances where management is aware of a specific customer’s inability to meet its financial obligations to us (e.g., bankruptcy filings), a reserve is recorded to reduce the receivable to the amount expected to be collected. For all other customers, we recognize reserves for bad debt based on the length of time the receivables are past due, generally 100% for amounts more than 60 days past due. Collateral is generally not required. Credit losses have consistently been within management’s expectations. At both May 30, 2015June 3, 2017 and May 31, 201428, 2016 two customers accounted for approximately 24%27% and 28%29% of the Company’s trade accounts receivable, respectively.InventoriesInventories of eggs, feed, supplies and livestock are valued principally at the lower of cost (first-in, first-out method) or market.The cost associated with flocks, consisting principally of chick purchases, feed, labor, contractor payments and overhead costs, are accumulated during a growing period of approximately 22 weeks. Flock costs are amortized to cost of sales over the productive lives of the flocks, generally one to two years. Flock mortality is charged to cost of sales as incurred.The Company does not disclose the gross cost and accumulated amortization with respect to its flock inventories since this information is not utilized by management in the operation of the Company.42Property, Plant and EquipmentProperty, plant and equipment are stated at cost. Depreciation is provided by the straight-line method over the estimated useful lives, which are 15 to 25 years for buildings and improvements and 3 to 12 years for machinery and equipment. Repairs and maintenance are expensed as incurred. Expenditures that increase the value or productive capacity of assets are capitalized. When property, plant, and equipment are retired, sold, or otherwise disposed of, the asset’s carrying amount and related accumulated depreciation are removed from the accounts and any gain or loss is included in operations. The Company capitalizes interest cost incurred on funds used to construct property, plant, and equipment as part of the asset to which it relates, and is amortized over the asset’s estimated useful life.Impairment of Long-Lived AssetsThe Company reviews the carrying value of long-lived assets, other than goodwill, for impairment whenever events and circumstances indicate the carrying value of an asset may not be recoverable from the estimated future cash flows expected to result from its use and eventual disposition. In cases where expected future cash flows (undiscounted and without interest charges) are less than the carrying value, an impairment loss is recognized equal to an amount by which the carrying value exceeds the fair value of assets. The factors considered by management in performing this assessment include current operating results, trends and prospects, the manner in which the property is used, and the effects of obsolescence, demand, competition, and other economic factors.Intangible AssetsIncluded in other intangible assets are separable intangible assets acquired in business acquisitions, which include franchise fees, non-compete agreements and customer relationship intangibles, and are amortized over their estimated useful lives of 3 to 25 years. The gross cost and accumulated amortization of intangible assets are removed when the recorded amounts have been fully amortized and the asset is no longer in use or the contract has expired. Included in other long-lived assets are loan acquisition costs, which are amortized over the life of the related loan.GoodwillGoodwill represents the excess of the purchase price over the fair value of the identifiable net assets acquired. Goodwill is evaluated for impairment annually by first performing a qualitative assessment to determine whether a quantitative goodwill test is necessary. After assessing the totality of events or circumstances, if we determine it is more likely than not that the fair value of a reporting unit is less than its carrying amount, then we perform additional quantitative tests to determine the magnitude of any impairment.Accrued Self InsuranceWe use a combination of insurance and self-insurance mechanisms to provide for the potential liabilities for health and welfare, workers’ compensation, auto liability and general liability risks. Liabilities associated with our risks retained are estimated, in part, by considering claims experience, demographic factors, severity factors and other actuarial assumptions. DividendsCal-Maine pays a dividend to shareholders of its Common Stock and Class A Common Stock on a quarterly basis for each quarter for which the Company reports net income computed in accordance with generally accepted accounting principles in an amount equal to one-third (1/3) of such quarterly income. Dividends are paid to shareholders of record as of the 60th60th day following the last day of such quarter, except for the fourth fiscal quarter. For the fourth quarter, the Company will pay dividends to shareholders of record on the 65th65th day after the quarter end. Dividends are payable on the 15th15th day following the record date. Following a quarter for which the Company does not report net income, the Company will not pay a dividend for a subsequent profitable quarter until the Company is profitable on a cumulative basis computed from the date of the last quarter for which a dividend was paid. Dividends payable, were $15.4 million and $10.5 million at May 30, 2015 and May 31, 2014, respectively. These amountswhich would represent accrued unpaid dividends applicable to the Company’sCompany's fourth quarter, net income for each fiscal year.were zero at June 3, 2017 and May 28, 2016. At June 3, 2017, cumulative losses that must be recovered prior to paying a dividend were $74.7 million.43Treasury stock purchases are accounted for under the cost method whereby the entire cost of the acquired stock is recorded as treasury stock. The grant of restricted stock through the Company’s share-based compensation plans is funded through the issuance of treasury stock. Gains and losses on the subsequent reissuance of shares in accordance with the Company’s share-based compensation plans are credited or charged to paid-in capital in excess of par value using the average-cost method.Revenue Recognition and Delivery CostsThe Company recognizes revenue only when all of the following criteria have been met:·Persuasive evidence of an arrangement exists;·Delivery has occurred;
Persuasive evidence of an arrangement exists;·The fee for the arrangement is determinable; and
Delivery has occurred;·Collectability is reasonably assured.The fee for the arrangement is determinable; andCollectability is reasonably assured.The Company believes the above criteria are met upon delivery and acceptance of the product by our customers. Costs to deliver product to customers are included in selling, general and administrative expenses in the accompanying Consolidated Statements of IncomeOperations and totaled $47.0$53.3 million, $43.0$49.6 million, and $38.1$47.0 million in fiscal years 2015, 2014,2017, 2016, and 2013,2015, respectively. Sales revenue reported in the accompanying consolidated statements of income is reduced to reflect estimated returns and allowances. The Company records an estimated sales allowance for returns and discounts at the time of sale using historical trends based on actual sales returns and sales.Sales Incentives provided to CustomersThe Company periodically provides incentive offers to its customers to encourage purchases. Such offers include current discount offers (e.g., percentage discounts off current purchases), inducement offers (e.g., offers for future discounts subject to a minimum current purchase), and other similar offers. Current discount offers, when accepted by customers, are treated as a reduction to the sales price of the related transaction, while inducement offers, when accepted by customers, are treated as a reduction to sales price based on estimated future redemption rates. Redemption rates are estimated using the Company’s historical experience for similar inducement offers. Current discount and inducement offers are presented as a net amount in ‘‘Net sales.’’Advertising CostsThe Company expensesexpensed advertising costs as incurred. Advertising costs totaled $9.3incurred of $12.1 million, $8.5$10.3 million, and $5.1$9.3 million in fiscal 2017, 2016, and 2015, 2014, and 2013, respectively. Income TaxesIncome taxes are provided using the liability method. Deferred income taxes reflect the net tax effects of temporary differences between the carrying amounts of assets and liabilities for financial reporting purposes and the amounts used for income tax purposes. The Company’s policy with respect to evaluating uncertain tax positions is based upon whether management believes it is more likely than not the uncertain tax positions will be sustained upon review by the taxing authorities. The tax positions must meet the more-likely-than-not recognition threshold with consideration given to the amounts and probabilities of the outcomes that could be realized upon settlement using the facts, circumstances and information at the reporting date. The Company will reflect only the portion of the tax benefit that will be sustained upon resolution of the position and applicable interest on the portion of the tax benefit not recognized. The Company shall initially and subsequently measure the largest amount of tax benefit that is greater than 50% likely of being realized upon settlement with a taxing authority that has full knowledge of all relevant information. Based upon management’s assessment, there are no uncertain tax positions expected to have a material impact on the Company’s consolidated financial statements.44We account for share-based compensation in accordance with ASC 718, “Compensation-Stock Compensation” (“ASC 718”). ASC 718 requires all share-based payments to employees, including grants of employee stock options, restricted stock and performance-based shares to be recognized in the income statement of operations based on their fair values. ASC 718 requires the benefits of tax deductions in excess of recognized compensation cost to be reported as a financing cash flow. See Note 11: Stock Compensation Plans for more information.Net Income (Loss) per Common ShareBasic net income per share is based on the weighted average common and Class A shares outstanding. Diluted net income per share includes any dilutive effects of stock options outstanding and unvested restricted shares.Basic net income per share was calculated by dividing net income by the weighted-average number of common and Class A shares outstanding during the period. Diluted net income per share was calculated by dividing net income by the weighted-average number of common shares outstanding during the period plus the dilutive effects of stock options and unvested restricted shares. Due to the net loss in the year ended June 3, 2017, restricted shares in the amount of 131,292 were excluded from the calculation of diluted earnings per share because their inclusion would have been antidilutive. The computations of basic net income per share and diluted net income per share are as follows (in thousands):48,136 48,095 47,967 301 202 121 48,437 48,297 48,088 June 3, 2017 May 28, 2016 May 30, 2015 Net income (loss) attributable to Cal-Maine Foods, Inc. $ (74,278 ) $ 316,041 $ 161,254 Basic weighted-average common shares (including Class A) 48,362 48,195 48,136 Effect of dilutive securities: Common stock options and restricted stock — 170 301 Dilutive potential common shares 48,362 48,365 48,437 Net income (loss) per common share: Basic $ (1.54 ) $ 6.56 $ 3.35 Diluted $ (1.54 ) $ 6.53 $ 3.33 ContingenciesCertain conditions may exist as of the date the financial statements are issued that may result in a loss to the Company but which will only be resolved when one or more future events occur or fail to occur. The Company’s management and its legal counsel assess such contingent liabilities, and such assessment inherently involves an exercise of judgment. In assessing loss contingencies related to legal proceedings that are pending against the Company or unasserted claims that may result in such proceedings, the Company’s legal counsel evaluates the perceived merits of any legal proceedings or unasserted claims as well as the perceived merits of the amount of relief sought or expected to be sought therein.If the assessment of a contingency indicates it is probable that a material loss has been incurred and the amount of the liability can be estimated, the estimated liability would be accrued in the Company’s financial statements. If the assessment indicates a potentially material loss contingency is not probable, but is reasonably possible, or is probable but cannot be estimated, then the nature of the contingent liability, together with an estimate of the range of possible loss if determinable and material, would be disclosed. Loss contingencies considered remote are generally not disclosed unless they involve guarantees, in which case the nature of the guarantee would be disclosed. The Company expenses the costs of litigation as they are incurred.Impact of Recently Issued Accounting StandardsIn May 2014, the FASBFinancial Accounting Standards Board (“FASB”) issued Accounting Standard Update No. 2014-09, Revenue from Contracts with Customers (ASU 2014-09). The standard provides companies with a single model for use in accounting for revenue arising from contracts with customers and supersedes current revenue recognition guidance, including industry-specific revenue guidance. The core principle of the model is to recognize revenue when control of the goods or services transfers to the customer in an amount that reflects the consideration that is expected to be received for those goods or services. In August 2015, FASB issued ASU 2015-14 which deferred the effective date of ASU 2014-09 is effective foruntil annual reporting periods beginning after December 15, 2016.2017. Early adoption is not permitted. The guidance permits companies to either apply the45TheTo date the Company’s assessments efforts include evaluation of certain revenue contracts with customers and the method of retrospective application, either full or modified. We currently expect to utilize the full retrospective transition on date of adoption. Based on the findings to date, the Company does notexpectASU 2014-09to have a material impacton the results of operations or financial position; however, the Company’s assessment is not complete. The Company plans to complete its review and method of adoption in fiscal 2018. In February 2016, the FASB issued ASU 2016-02, Leases. The purpose of the standard is to improve transparency and comparability related to the accounting and reporting of leasing arrangements. The guidance will require balance sheet recognition for assets and liabilities associated with rights and obligations created by leases with terms greater than twelve months. ASU 2016-02 is effective for annual reporting periods beginning after December 15, 2018, and interim periods within those annual periods. Early adoption is permitted. Based on the findings to date, the Company does notexpectASU 2016-02to have a material impacton the results of operations or financial position; however, the Company’s assessment is not complete. In March 2016, the FASB issued ASU 2016-09,Improvements to Employee Share-Based Compensation Accounting. ASU2016-09 requires recording excess tax benefits on the statement of operations as opposed to additional paid-in-capital, and treated as an operating activity on the statement of cash flows. ASU 2016-09 also allows companies to make an accounting policy election to either estimate the number of awards that are expected to vest or account for forfeitures when they occur. ASU 2016-09is effective for annual reporting periods beginning after December 15, 2017 with early adoption permitted. The Company adopted ASU 2016-09 during the third quarter of fiscal 2017 and it did not have a material impact on the consolidated financial statement presentation.In January 2017, the FASB issued ASU 2017-04, Simplifying the Test for Goodwill Impairment, which removes step 2 from the goodwill impairment test. As a result, an entity should perform its annual, or interim, goodwill impairmenttest by comparing the fair value of a reporting unit with its carrying amount and should recognize an impairment charge for the amount by which the carrying amount exceeds the reporting units' fair value. The guidance is effective for annual or interim goodwill impairment tests in fiscal years beginning after December 15, 2019, our fiscal 2021. Early adoption is permitted for annual or interim goodwill impairment tests performed on testing dates after January 1, 2017, and the prospective transition method should be applied. We do not expect the adoption of this guidance to have a material impact on our consolidated financial statements.ReclassificationCertain prior period amounts have been reclassified to conform with current presentation. Such reclassifications had no impact on previously reported net income or shareholders' equity.2. AcquisitionFoodonics AcquisitionOn August 10, 2012,October 16, 2016, the Company purchasedacquired substantially all of the egg production assets and assumed certain liabilities of Foodonics International, Inc. and its related entities doing business as Dixie Egg Company (collectively, "Foodonics") for $68.6 million of cash and $3.0 million of deferred purchase price. The acquired assets include commercial egg assets of Pilgrim’s Pride Corporation (“PPC”) for approximately $16.3 million in cash at closing, plus contingent cash consideration of $1.4 million. The assets acquired included two production complexesand processing facilities with capacity for approximately 1.41.6 million laying hens, contract grower arrangements for an additional 1.5 million laying hens, and PPC’s 13.6%related feed production, milling and distribution facilities in Georgia, Alabama, and Florida. The Company also acquired Foodonics' interest in TexasAmerican Egg Products, LLC (“TEP”("AEP"), which gave us a majority ownership interest and the Eggland's Best franchise with licensing rights for certain markets in TEP. The following table presents the final fair values of the assets acquired and liabilities assumed (in thousands):Inventory $ 7,669 Property, plant and equipment 38,590 Intangible assets 24,000 Liabilities assumed (2,034 ) Total identifiable net assets 68,225 Goodwill 3,389 Purchase price 71,614 Deferred purchase price (3,000 ) Cash consideration paid $ 68,614 Happy Hen AcquisitionOn November 15, 2012,February 19, 2017, the Company acquired substantially all of the egg production, processing and distribution assets of Happy Hen Egg Farms, Inc. and its affiliates (collectively, "Happy Hen"). The assets include commercial egg assets of Maxim Productions Co. Inc. (“MPC”). The Company acquired the MPC assets for approximately $64.9 million consisting of approximately $58.6 million in cashproduction and 114,103 shares of common stock. The assets included a feed mill, two production complexesprocessing facilities with current capacity for 3.5 million350,000 laying hens and related distribution facilities located near Harwood and Wharton, Texas. The site is designed for capacity of up to 1.2 million laying hens. The operations of Happy Hen are included in the accompanying financial statements as of February 19, 2017. The Company closed this acquisition on March 3, 2017.The following table presents the final fair values of the assets acquired (in thousands):Inventory $ 609 Property, plant and equipment 11,259 Intangible assets 2,400 Total identifiable net assets 14,268 Goodwill 2,940 Cash consideration paid $ 17,208 These fair value measurements were primarily based on significant inputs that are not observable in the markets. The cost approach, which estimates value by determining the current cost of replacing an asset with another of equivalent economic utility, was utilized for certain property, plant and equipment. The cost to replace given assets reflects the estimated reproduction or replacement cost of the asset, less an allowance for loss in value due to depreciation. The market approach, which indicates value for a pullet grow out facility,subject asset based on available market pricing for comparable assets, was utilized for inventory and MPC’s 21.8% interestthe Eggland's Best franchise of Foodonics. The cost of the Eggland's Best franchise will be amortized over a period of 15 years. Customer relationships and trademarks will be amortized over a period of 8 years. Non-compete agreements will be amortized over a period of 10 years. Goodwill on business combination recognizes the difference in TEP, which gave us a 72.1% interest in TEP. The MPC acquisition included an earn-out contingency of $4.4 million, the fair value of which is remeasured at each reporting date until the contingency is settled inassets acquired and liabilities assumed, net of the second quarter of fiscal year 2016. Effective March 1, 2014, the Company purchased our joint venture partner’s 50% interest in Delta Egg Farm, LLC (“Delta Egg”) for $17.0 million. The Company previously owned 50% of Delta Egg through a joint venture with Moark, LLC. In conjunctionacquisition price. Goodwill associated with the acquisition the Company recognized a non-recurring, non-cash gain of $4.0 millionis tax deductible over 15 years.Pro-forma information, which is usually presented for the excess in purchase price over the carrying value of the 50% investment in the unconsolidated joint venture. This gain was recorded in “Other Income” in the Company’s Consolidated Statements of Income for fiscal 2014. The gaininformation purposes only and is non-taxable, and therefore resulted in a $1.5 million reduction to the Company’s income tax expense for fiscal 2014. Additionally, the Company recorded a $3.3 million decrease to deferred income tax liabilities related to the outside basis of our equity investment in Delta Egg. Delta Egg’s assets include a feed mill and a production complex with capacity for approximately 1.2 million laying hens near Delta, Utah, as well as an organic complex with capacity for approximately 400,000 laying hens near Chase, Kansas. The results of the Company’s operation of these assets are included in the Company’s consolidated financial statements since the respective dates of acquisition. Included in the Company’s consolidated financial statements for fiscal 2014 are revenues and net income from Delta Egg of $4.7 million and $1.3 million, respectively. Prior to the acquisition date the Company’s 50% share of net income was recorded “Equity in income of affiliates”.The following unaudited pro forma information was prepared assuming the acquisition of the commercial egg assets of PPC and MPC had taken place at the beginning of fiscal year 2013. In preparing pro forma information, various assumptions were made; therefore, the Company does not imply that the future results will benecessarily indicative of the following pro forma information (in thousands):Year EndedJune 1, 2013Net sales$1,344,279 Net income attributable to Cal-Maine Foods, Inc.$50,053 Net income per share attributable to Cal-Maine Foods, Inc.:Basic net income per share$1.05 Diluted net income per share$1.04 463. Investment in AffiliatesOn April 9, 2015,The Company has several in non-consolidated affiliates that are accounted for using the equity method of accounting. As of June 3, 2017, the Company entered into theowns 50% of each of Red River Valley Egg Farm, LLC, (“Red River”) joint venture with Rose Acre Farms, Inc. The joint venture will build and operate a state of the art shell egg production complex near Bogata, Red River County, Texas. The plans for the complex provide capacity for approximately 1.8 million cage-free laying hens. Constuction of the complex has commenced, and the initial flocks are expected to be placed in November 2015. The company did not incur material costs associated with the joint venture in fiscal 2015. The Company expects to fund its 50% share of approximately $73 million of construction and startup costs for the Red River joint venture during fiscal 2016. On July 25, 2014, the Company entered into the Southwest Specialty Eggs, LLC, (“SWS”) joint venture with Hickman’s Egg Ranch. The SWS joint venture subsequently acquired the Egg-Land’s Best franchise for Arizona, southern California and Clark County (including Las Vegas), Nevada. The Company owns 50% of the SWS joint venture.The Company owns 50% of each ofSouthwest Specialty, Eggs LLC, and Dallas Reinsurance, Co., LTD. as of May 30, 2015. At June 1, 2013, the Company also owned 50% of Delta Egg Farm. During fiscal 2014 the Company purchased our joint venture partner’s 50% interest in Delta Egg Farm (Refer to Note 2 – Acquisitions). Investment in affiliates recorded using the equity method of accounting, are included in “Other Investments” in the accompanying Consolidated Balance Sheets and totaled $13.1$62.8 million and $3.5$47.5 million at May 30, 2015June 3, 2017 and at May 31, 2014,28, 2016, respectively. Equity in income of $2.7affiliates of $1.4 million, $3.5$5.0 million, and $3.5$2.7 million from these entities has been included in the Consolidated Statements of IncomeOperations for fiscal 2017, 2016, and 2015, 2014, and 2013, respectively.The condensed consolidated financial information for the Company's unconsolidated joint ventures was as follows: For the fiscal year ended June 3, 2017 May 28, 2016 May 30, 2015 Net sales 86,072 91,320 61,632 Net income 2,804 10,090 5,323 Total assets 131,871 100,700 30,739 Total liabilities 6,543 5,697 4,659 Total equity 125,328 95,003 26,080 The Company is also a member of Eggland’s Best, Inc. (“EB”), which is a cooperative. At May 30, 2015June 3, 2017 and May 31, 2014,28, 2016, “Other Investments” as shown on the Company’s Consolidated Balance Sheet includes the cost of the Company’s investment in EB plus any qualified written allocations. The Company cannot exert significant influence over EB’s operating and financial activities; therefore, the Company accounts for this investment using the cost method. The carrying value of this investment at May 30, 2015June 3, 2017 and May 31, 201428, 2016 was $3.1$2.9 million and $768,000,$3.5 million, respectively.The Company regularly transacts business with its cost and equity method affiliates. The following relates to the Company’s transactions with these unconsolidated affiliates (in thousands): 40,746 44,798 43,270 62,659 74,325 71,325 1,250 4,650 5,875 4,253 2,619 2,118 3,720 47 For the fiscal year ended June 3, 2017 May 28, 2016 May 30, 2015 Sales to affiliates $ 59,073 $ 61,094 $ 46,989 Purchases from affiliates 73,713 79,419 62,659 Dividends from affiliates 6,581 4,550 1,250 June 3, 2017 May 28, 2016 Accounts receivable from affiliates $ 4,643 $ 3,483 Accounts payable to affiliates 3,617 1,464 4. InventoriesInventories consisted of the following (in thousands): June 3, 2017 May 28, 2016 Flocks, net of accumulated amortization $98,059 $94,312 Eggs 14,911 11,519 Feed and supplies 47,722 48,968 $160,692 $154,799 We grow and maintain flocks of layers (mature female chickens), pullets (female chickens, under 18 weeks of age), and breeders (male and female chickens used to produce fertile eggs to hatch for egg production flocks). Our total flock at June 3, 2017, consisted of approximately 9.5 million pullets and breeders and 36.1 million layers.The Company chargedexpensed amortization and mortality expense associated with the flocks to cost of sales as follows (in thousands):108,570 98,556 88,601 3,803 3,818 3,667 112,373 102,374 92,268 June 3, 2017 May 28, 2016 May 30, 2015 Amortization $ 118,859 $ 106,459 $ 108,570 Mortality 5,213 3,665 3,803 Total flock costs charge to cost of sales $ 124,072 $ 110,124 $ 112,373 5. Prepaid Expenses and Other Current AssetsPrepaid expenses and other current assets consisted of the following (in thousands):420 116 153 1,356 6. Goodwill and Other Intangible AssetsGoodwill and other intangibles consisted of the following (in thousands):4,779 191 720 911 (477) (2,317) (20) (2,814) 29,196 1,354 8,090 68 191 720 10,423 (484) (2,317) (20) (42) (2,863) 48 Other Intangibles Franchise Customer Non-compete Right of use Water Total other Goodwill rights relationships agreements intangible rights Trademark intangibles Balance May 30, 2015 $ 29,196 $ 870 $ 5,773 $ 48 $ 149 $ 720 $ — $ 7,560 Additions — — — — — — — — Amortization — (473 ) (2,088 ) (20 ) (21 ) — — (2,602 ) Balance May 28, 2016 29,196 397 3,685 28 128 720 — 4,958 Additions 6,329 24,000 1,900 100 — — 400 26,400 Amortization — (1,183 ) (925 ) (24 ) (62 ) — (15 ) (2,209 ) Balance June 3, 2017 $ 35,525 $ 23,214 $ 4,660 $ 104 $ 66 $ 720 $ 385 $ 29,149 For the Other Intangibles listed above, the gross carrying amounts and accumulated amortization are as follows (in thousands):17,644 (11,871) 17,644 (9,554) 100 (52) 100 (32) 191 (42) 191 720 720 * Water rights are an indefinite life intangible asset. June 3, 2017 May 28, 2016 Gross carrying Accumulated Gross carrying Accumulated amount amortization amount amortization Other intangible assets: Franchise rights $ 29,284 $ (6,070 ) $ 5,284 $ (4,887 ) Customer relationships 19,544 (14,884 ) 17,644 (13,959 ) Non-compete agreements 200 (96 ) 100 (72 ) Right of use intangible 191 (125 ) 191 (63 ) Water rights * 720 — 720 — Trademark 400 (15 ) — — Total $ 50,339 $ (21,190 ) $ 23,939 $ (18,981 ) * Water rights are an indefinite life intangible asset. No significant residual value is estimated for these intangible assets. Aggregate amortization expense for the fiscal years ended 2017, 2016, and 2015 2014, and 2013 totaled $2.9$2.2 million, $2.8$2.6 million, and $2.5$2.9 million, respectively. The following table represents the total estimated amortization of intangible assets for the five succeeding years (in thousands):1,076 939 897 873 432 7.For fiscal period Estimated amortization expense 2018 $ 2,818 2019 2,790 2020 2,765 2021 2,228 2022 1,864 Thereafter 15,964 Total $ 28,429 6. Property, Plant and EquipmentProperty, plant and equipment consisted of the following (in thousands):77,064 74,999 270,076 244,782 364,209 323,117 42,893 32,826 754,242 675,724 395,452 360,789 358,790 314,935 June 3,
2017 May 28,
2016Land and improvements $ 87,276 $ 80,775 Buildings and improvements 342,933 291,888 Machinery and equipment 460,218 399,804 Construction-in-progress 36,752 50,178 927,179 822,645 Less: accumulated depreciation 468,995 430,371 $ 458,184 $ 392,274 Depreciation expense was $37.3$48.8 million, $33.5$41.4 million and $31.2$37.3 million in fiscal years 2017, 2016 and 2015, 2014 and 2013, respectively.The Company maintains insurance for both property damage and business interruption relating to catastrophic events, such as the fires. Insurance recoveries received for property damage and business interruption in excess of the net bookvalue of damaged assets, clean-up and demolition costs, and post-event costs are recognized as income in the period received or committed when all contingencies associated with the recoveries are resolved. Gains on insurance recoveries related to business interruption are recorded within “Cost of sales” and any gains or losses related to property damage are recorded within “Other income (expense).” Insurance492015, 2014,2017, 2016, and 2013 2015In the second quarter of fiscal 2014,2015, acontract producer owned pulletcomplexin Floridawas damaged by fire. The fire destroyedtwocontract producer owned pullet houses that contained the Company’s flocks. In the third quarter of fiscal 2014,2015, theCompany’sShady Dale, Georgia complex was damaged by a fire. The fire destroyedtwopullet houses. These claims were resolved in fiscal 20152016 and did not have a material impact on the Company’s results of operations.8.7. LeasesFuture minimum payments under non-cancelable operating leases that have initial or remaining non-cancelable terms in excess of one year at May 30, 2015June 3, 2017 are as follows (in thousands):493 441 310 57 7 1,308 2018 $ 502 2019 208 2020 162 2021 160 2022 150 Total minimum lease payments $ 1,182 Substantially all of the leases provide thatrequire the Company paysto pay taxes, maintenance, insurance and certain other operating expenses applicable to the leased assets. Vehicle rent expense totaled $101,000, $174,000$475,000, $190,000 and $382,000$101,000 in fiscal 2015, 20142017, 2016 and 2013,2015, respectively. Rent expense excluding vehicle rent was $3.0$3.5 million, $2.7$3.9 million, and $2.9$3.0 million in fiscal 2015, 20142017, 2016 and 2013,2015, respectively, primarily for the lease of certain operating facilities and equipment. 9.8. Credit Facilities and Long-Term DebtLong-term debt consisted of the following (in thousands except interest rate and installment data):13,500 16,500 12,700 14,500 10,300 11,500 6,311 8,417 4,750 6,250 3,140 3,560 159 197 169 50,860 61,093 10,065 10,216 40,795 50,877 50 June 3,
2017 May 28,
2016Note payable at 6.20%, due in monthly principal installments of $250,000, plus interest, maturing in fiscal 2020 $ 7,500 $ 10,500 Note payable at 6.35%, due in monthly principal installments of $100,000, plus interest, paid off in fiscal 2017 — 9,100 Note payable at 5.40%, due in monthly principal installments of $125,000, plus interest, maturing in fiscal 2019 1,750 3,250 Note payable at 6.40%, due in monthly principal installments of $35,000, plus interest, paid off in fiscal 2017 — 2,720 Capital lease obligations 1,689 — Total debt 10,939 25,570 Less: current maturities 4,826 16,320 Long-term debt, less current maturities $ 6,113 $ 9,250 The aggregate annual fiscal year maturities of long-term debt at May 30, 2015June 3, 2017 are as follows (in thousands):10,065 20,265 8,439 5,091 3,300 3,700 50,860 2018 $ 4,826 2019 3,533 2020 1,696 2021 205 2022 215 Thereafter 464 $ 10,939 Certain property, plant, and equipment is pledged as collateral on our notes payable and senior secured notes. Unless otherwise approved by our lenders, we are required by provisions of our loan agreements to (1) maintain minimum levels of working capital (ratio of not less than 1.25 to 1) and net worth (minimum of $90.0 million tangible net worth, plus 45% of cumulative net income); (2) limit dividends paid in any given quarter to not exceed an amount equal to one third of the previous quarter’s consolidated net income (allowed if no events of default), (3) maintain minimum total funded debt to total capitalization (debt to total tangible capitalization not to exceed 55%); and (4) maintain various current and cash-flow coverage ratios (1.25 to 1), among other restrictions. At May 30, 2015,June 3, 2017, we were in compliance with the financial covenant requirements of all loan agreements. Under certain of the loan agreements, the lenders have the option to require the prepayment of any outstanding borrowings in the event we undergo a change in control, as defined in the applicable loan agreement. Our debt agreements require Fred R. Adams, Jr., the Company’s Founder and Chairman Emeritus, or his family, to maintain ownership of Company shares representing not less than 50% of the outstanding voting power of the Company. We are in compliance with those covenants at May 30, 2015.Interest, net of amount capitalized,of $2.3 million, $3.2$317,000, $1.1 million, and $3.5$2.3 million was paid during fiscal2017, 2016and2015, 2014 and 2013, respectively. Interest of $1.2$1.1 million, $1.1 million $603,000, and $383,000 $1.2 millionwas capitalized for construction of certain facilities during fiscal2017, 2016and2015, 2014 and 2013, respectively.10.9. Employee Benefit PlansThe Company maintains a medical plan that is qualified under Section 401(a) of the Internal Revenue Code and is not subject to tax under present income tax laws. The plan is funded by contributions from the Company and its employees. Under its plan, the Company self-insures its portion of medical claims for substantially all full-time employees. The Company uses stop-loss insurance to limit its portion of medical claims to $225,000 per occurrence. The Company's expenses including accruals for incurred but not reported claims were approximately $9.6$14.0 million, $9.8$11.8 million, and $7.4$9.6 million in fiscal years 2015, 20142017, 2016 and 2013,2015, respectively. The liability recorded for incurred but not reported claims was $700,000$900,000 as of bothJune 3, 2017 and $770,000 as of May 30, 2015 and May 31, 2014.The Company has a KSOP plan that covers substantially all employees (“the Plan”). The Company makes cash contributions to the Plan at a rate of 3% of participants' eligible compensation, plus an additional amount determined at the discretion of the Board of Directors. Contributions can be made in cash or the Company's Common Stock,common stock, and vest immediately. The Company's cash contributions to the Plan were $2.8$3.2 million, $3.0$2.9 million, and $1.8$2.8 million in fiscal years 2015, 20142017, 2016 and 2013,2015, respectively. The Company did not make direct contributions of the Company’s common stock in fiscal years 2015, 2014,2017, 2016, or 2013.2015. Dividends on the Company’s common stock are paid to the Plan in cash. The Plan acquires the Company’s common stock, which is listed on the NASDAQ, by using the dividends and the Company’s cash contribution to purchase shares in the public markets. The Plan sold common stock on the NASDAQ to pay benefits to Plan participants. Participants may make contributions to the Plan up to the maximum allowed by the Internal Revenue Service regulations. The Company does not match participant contributions.The Company has deferred compensation agreements with certain officers for payments to be made over specified periods beginning when the officers reach age 65 or over as specified in the agreements. Amounts accrued for the agreements are based upon deferred compensation earned over the estimated remaining service period of each officer. Payments made under the plan were $97,000, $50,000,$110,000, $102,000, and $50,000$97,000 in fiscal years 2015, 2014,2017, 2016, and 2013,2015, respectively. The liability recorded related to these agreements was $1.6 million at June 3, 2017 and May 30, 2015 and $1.7 million at May 31, 2014. 28, 2016. 51$241,000, $202,000,$290,000, $284,000, and $156,000$241,000 in fiscal 2015, 20142017, 2016 and 2013,2015, respectively. Payments made under the plan were $116,000$147,000 and zero$128,000 in fiscal 20152017 and 2014,2016, respectively. The liability recorded related to these agreements was $1.7$2.5 million and $1.5$1.9 million at May 30, 2015June 3, 2017 and May 31, 2014,28, 2016, respectively.Deferred compensation expense for both plans totaled $470,000, $425,000$616,000, $347,000 and $786,000$470,000 in fiscal 2017, 2016 and 2015, 2014 and 2013, respectively.Postretirement Medical PlanThe Company maintains an unfunded postretirement medical plan to provide limited health benefits to certain qualified retired employees and officers. Retired non-officers and spouses are eligible for coverage until attainment of Medicare eligibility, at which time coverage ceases. Retired officers and spouses are eligible for lifetime benefits under the plan. Officers and their spouses, who retired prior to May 1, 2012, must participate in Medicare Plans A and B. Officers, and their spouses, who retire on or after May 1, 2012 must participate in Medicare Plans A, B, and D. The plan is accounted for in accordance with ASC 715, “Compensation – Retirement Benefits”, under whichwhereby an employer recognizes the funded status of a defined benefit postretirement plan as an asset or liability, and recognizes changes in thatthe funded status in the year the change occurs through comprehensive income. Additionally, this expense is recognized on an accrual basis over the employees’ approximate period of employment. The liability associated with the plan was $1.5$2.3 million and $683,000$1.8 million as of May 30, 2015June 3, 2017 and May 31, 2014,28, 2016, respectively. The remaining disclosures associated with ASC 715 are immaterial to the company’sCompany’s financial statements.11.10. Stock Compensation PlansOn July 28, 2005, the Company’s Board of Directors approved the Cal-Maine Foods, Inc. 2005 Incentive Stock Option Plan (the "ISO Plan") and reserved 1,000,000 shares for issuance upon exercise of options granted under the ISO Plan. Options issued pursuant to the ISO Plan may be granted to any of the Company’s employees. The options may have a term of up to ten years and generally will vest ratably over five years. On August 17, 2005, the Company issued 720,000 options with an exercise price of $2.97. The options have ten-year terms and vest over five years beginning from the date of grant. The ISO Plan was ratified by the Company’s shareholders at the annual meeting of shareholders on October 13, 2005. No options were outstanding under the ISO Plan as of May 30, 2015.On July 28, 2005, the Company’s Board of Directors approved the Cal-Maine Foods, Inc. Stock Appreciation Rights Plan (the "Rights Plan"). The Rights Plan covers 2,000,000 shares of Common Stock of the Company. Stock Appreciation Rights ("SARs") may be granted to any employee or non-employee member of the Board of Directors. Upon exercise of a SAR, the holder will receive cash equal to the difference between the fair market value of a single share of Common Stock at the time of exercise and the strike price which is equal to the fair market value of a single share of Common Stock on the date of the grant. The SARs have a ten-year term and vest over five years. On August 17, 2005, the Company issued 1,185,000 SARs under the Rights Plan with a strike price of $2.97 and, on August 26, 2005, the Company issued 90,000 SARs with a strike price of $3.36. On August 24, 2006, the Company issued 30,000 SARs with a strike price of $3.47. The Rights Plan was ratified by the Company’s shareholders at the annual meeting of shareholders on October 13, 2005.On October 5, 2012, shareholders approved the Cal-Maine Foods, Inc. 2012 Omnibus Long-Term Incentive Plan (“2012 Plan”). The purpose of the 2012 Plan is to assist us and our subsidiaries in attracting and retaining selected individuals who, serving as our employees, outside directors and consultants, are expected to contribute to our success and to achieve long-term objectives which will benefit our shareholders through the additional incentives inherent in the awards under the 2012 Plan. The maximum number of shares of common stock that are available for awards under the 2012 Plan is 1,000,000 shares issuable from the Company’s treasury stock. Awards may be granted under the 2012 Plan to any employee, any non-employee member of the Company’s Board of Directors, and any consultant who is a natural person and provides services to us or one of our subsidiaries (except for incentive stock options which may be granted only to our employees).OnIn January 15, 2013, January 15, 2014, and January 15, 2015,2017, the Company granted 86,215 restricted shares from treasury in the amounts of 126,000, 127,200, and 91,540, respectively.treasury. The restricted shares vest three years from the grant date, or upon death or disability, change in control, or retirement (subject to certain requirements). The restricted shares contain no other service or performance conditions. Restricted stock is awarded in the name of the recipient and except for the right of disposal, constitutes52Our unrecognized compensation expense as a result of non-vested shares atwas $5.9 million as of June 3, 2017 and $5.6 million as of May 30, 2015 and May 31, 2014 was $5.6 million and $4.3 million, respectively.28, 2016. The unrecognized compensation expense will be amortized to stock compensation expense over a period of 1.92.1 years.The Company recognized stock compensation expense of $3.4 million, $1.7 million, and $2.3 million for equity awards and $749,000 for liability awards in fiscal 2015. In fiscal 2014 the Company recognized stock compensation expense of $1.3 million for equity awards2017, 2016, and $521,000 for liability awards. In fiscal 2013, the Company recognized stock compensation expense of $291,000 for equity awards and $312,000 for liability awards.A summary of our equity award activity and related information for our stock options is as follows:86,000 2.97 (40,000) 2.97 46,000 2.97 (46,000) 2.97 The intrinsic value of stock options exercised totaled $1.6 million, $911,000, and zero in fiscal years 2015, 2014, and 2013, respectively.A summary of our equity award activity and related information for our restricted stock is as follows:126,000 20.54 127,200 26.77 (5,940) 22.85 (2,060) 20.54 245,200 27.24 91,540 36.63 (400) 23.65 (1,200) 23.65 335,140 27.24 53 Weighted Number Average of Grant Date Shares Fair Value Outstanding, May 30, 2015 335,140 $ 27.24 Granted 78,560 49.39 Vested (122,140 ) 20.76 Forfeited (2,660 ) 31.29 Outstanding, May 28, 2016 288,900 $ 35.97 Granted 86,215 43.00 Vested (121,148 ) 26.90 Forfeited (6,232 ) 39.66 Outstanding, June 3, 2017 247,735 $ 42.76 On July 28, 2005, the Company’s Board of ContentsDirectors approved the Cal-Maine Foods, Inc. Stock Appreciation Rights Plan (the "Rights Plan"). The Rights Plan covers 2,000,000 shares of Common Stock of the Company. Stock Appreciation Rights ("SARs") were granted to employees or non-employee members of the Board of Directors. Upon exercise of a SAR, the holder received cash equal to the difference between the fair market value of a single share of Common Stock at the time of exercise and the strike price which is equal to the fair market value of a single share of Common Stock on the date of the grant. The SARs had a ten year term and vested over five years. The last remaining SARs were exercised during fiscal 2016 which effectively terminated this plan.A summary of our liability award activity and related information is as follows:53,000 3.19 (16,400) 2.97 36,600 3.29 (9,700) 2.97 26,900 3.40 1.13 1,414 26,900 3.40 1.13 1,414 We determined the fair value of our obligation related to unexercised liability awards as of May 30, 2015 and May 31, 2014 was $1.4 million and $1.1 million, respectively. Weighted Weighted Average Number Average Remaining Aggregate Of Strike Price Contractual Intrinsic Rights Per Right Life (in Years) Value Outstanding, May 30, 2015 26,900 $ 3.40 Granted — — Exercised (26,900 ) 3.40 Forfeited — — Outstanding, May 28, 2016 — $ — — $ — Total payments for liability awards exercised totaled $407,000,zero, $1.4 million, and $373,000 and $192,000 for fiscal 2017, 2016 and 2015, 2014 and 2013, respectively.The fair value of liability awards was estimated as of May 30, 2015, May 31, 2014, and June 1, 2013, using a Black-Scholes option pricing model using the following weighted-average assumptions:12.11. Income TaxesIncome tax expense (benefit) consisted of the following: 70,900 38,940 28,144 8,260 5,470 2,410 79,160 44,410 30,554 4,503 6,474 (4,937) 605 1,151 (810) 5,108 7,625 (5,747) 84,268 52,035 24,807 54 Fiscal year ended June 3,
2017 May 28,
2016 May 30,
2015Current: Federal $ (48,030 ) $ 132,250 $ 70,900 State (6,670 ) 17,560 8,260 (54,700 ) 149,810 79,160 Deferred: Federal 13,076 17,096 4,503 State 1,757 2,296 605 14,833 19,392 5,108 $ (39,867 ) $ 169,202 $ 84,268 Significant components of the Company’s deferred tax liabilities and assets were as follows:48,117 41,393 478 637 32,689 34,163 240 487 238 294 3,379 3,800 85,141 80,774 2,553 3,122 6,583 6,699 9,136 9,821 76,005 70,953 Effective May 29, 1988, the Company could no longer use cash basis accounting for its farming subsidiary because of tax law changes. The Taxpayer Relief Act of 1997 provides that taxes on the cash basis temporary differences as of that date are generally payable over 20 years beginning in fiscal 1999 or in full in the first fiscal year in which there is a change in ownership control. The Company uses the farm-price method for valuing inventories for income tax purposes. June 3,
2017 May 28,
2016Deferred tax liabilities: Property, plant and equipment $ 68,830 $ 60,998 Inventories 38,270 39,068 Investment in affiliates 8,563 1,438 Other comprehensive income 290 223 Other 4,656 4,343 Total deferred tax liabilities 120,609 106,070 Deferred tax assets: Accrued expenses 4,308 3,374 Other 6,019 7,314 Total deferred tax assets 10,327 10,688 Net deferred tax liabilities $ 110,282 $ 95,382 The differences between income tax expense (benefit) at the Company’s effective income tax rate and income tax expense at the statutory federal income tax rate were as follows:85,933 56,435 26,331 5,762 4,303 1,040 (7,308) (3,810) (2,860) (3,295) (1,392) (184) (143) (76) 65 (63) 372 84,268 52,035 24,807 Federal and state income taxes of $75.5 million, $41.6 million, and $42.7 million were paid in fiscal years 2015, 2014, and 2013, respectively. Federal and state income taxes of zero, zero, and $12,000 were refunded in fiscal years 2015, 2014, and 2013, respectively. Fiscal year end June 3,
2017 May 28,
2016 May 30,
2015 Statutory federal income tax (benefit) $ (39,950 ) $ 169,835 $ 85,933 State income tax (benefit) (3,193 ) 12,906 5,762 Domestic manufacturers deduction 4,095 (13,332 ) (7,308 ) Tax exempt interest income (206 ) (233 ) (184 ) Other, net (613 ) 26 65 $ (39,867 ) $ 169,202 $ 84,268 We had no significant unrecognized tax benefits at May 30, 2015June 3, 2017 or at May 31, 2014.28, 2016. Accordingly, we do not have any accrued interest or penalties related to uncertain tax positions. However, if interest or penalties were to be incurred related to uncertain tax positions, such amounts would be recognized in income tax expense.We are under a limited scope audit by the IRS for the fiscal years 2013 through 2015. We are subject to income tax in many jurisdictions within the U.S., and certain jurisdictions are under audit by state and local tax authorities. The resolutions of these audits are not expected to be material to our consolidated financial statements. Tax periods for all years after fiscal year 20112013 remain open to examination by the federal and state taxing jurisdictions to which we are subject.5513.12. ContingenciesFinancial InstrumentsThe Company maintains standby letters of credit (“LOC”) with a bank totaling $3.7 million at May 30, 2015.June 3, 2017. These LOCs are collateralized with cash. The cash that collateralizes the LOCs is included in the line item “Other assets” in the consolidated balance sheets. The outstanding LOCs are for the benefit of certain insurance companies. None of the LOCs are recorded as a liability on the Consolidated Balance Sheets.LitigationThe Company is a defendant in certain legal actions, and intends to vigorously defend its position in these actions. The Company assesses the likelihood of material adverse judgments or outcomes to the extent losses are reasonably estimable. If the assessment of a contingency indicates it is probable that a material loss has been incurred and the amount of the liability can be reasonably estimated, the estimated liability is accrued in the Company’s financial statements. If the assessment indicates a potentially material loss contingency is not probable, but is reasonably possible, or is probable but cannot be estimated, then the nature of the contingent liability, together with an estimate of the range of possible loss if determinable and material, would be disclosed.Egg Antitrust LitigationSince September 25, 2008, the Company has been named as one of several defendants in numerous antitrust cases involving the United States shell egg industry. In some of these cases, the named plaintiffs allege that they purchased eggs or egg products directly from a defendant and have sued on behalf of themselves and a putative class of others who claim to be similarly situated. In other cases, the named plaintiffs allege that they purchased shell eggs and egg products directly from one or more of the defendants but sue only for their own alleged damages and not on behalf of a putative class. In the remaining cases, the named plaintiffs are individuals or companies who allege that they purchased shell eggs indirectly from one or more of the defendants - that is, they purchased from retailers that had previously purchased from defendants or other parties - and have sued on behalf of themselves and a putative class of others who claim to be similarly situated.The Judicial Panel on Multidistrict Litigation consolidated all of the putative class actions (as well as certain other cases in which the Company was not a named defendant) for pretrial proceedings in the United States District Court for the Eastern District of Pennsylvania. The Pennsylvania court organized the putative class actions around two groups (direct purchasers and indirect purchasers) and named interim lead counsel for the named plaintiffs in each group.The Direct Purchaser Putative Class Action. The direct purchaser putative class cases were consolidated into In re: Processed Egg Products Antitrust Litigation, No. 2:08-md-02002-GP, in the United States District Court for the Eastern District of Pennsylvania. As previously reported, in November 2014, the Court approved the Company’s settlement with the direct purchaser plaintiff class and entered final judgment dismissing with prejudice the class members’ claims against the Company.The Indirect Purchaser Putative Class Action. The indirect purchaser putative class cases were consolidated into In re: Processed Egg Products Antitrust Litigation, No. 2:08-md-02002-GP, in the United States District Court for the Eastern District of Pennsylvania. On April 20-21, 2015, the Court held an evidentiary hearing on the indirect purchaserplaintiffs’ motion for class certification. On September 18, 2015, the Court denied the indirect purchaser plaintiffs’ motion for class certification of 21 separate classes seeking damages under the laws of 21 states, holding that the plaintiffs were not able to prove that their purported method for ascertaining class membership was reliable or administratively feasible, that common questions would predominate, or that their proposed class approach would be manageable in a single trial. In addition to barring any right to pursue a class monetary remedy under state law, the Court also denied indirect purchaser plaintiffs’ request for certification of an injunctive-relief class under federal law. However, the court allowed the indirect purchaser plaintiffs to renew their motion for class certification seeking a federal injunction. The plaintiffs filed their renewed motion to certify an injunctive-relief class on October 23, 2015. The Company joined the other defendants in opposing that motion on November 20. The plaintiffs filed their reply memorandum on December 11, 2015, and on March 7, 2017, the Court heard arguments on the renewed motion for injunctive class certification. On June 27, 2017, the Court denied plaintiffs’ renewed motion for injunctive class certification. The plaintiffs also filed a petition with the United States Court of Appeals for the Third Circuit, asking the court to hear an immediate appeal of the trial court’s denial of the motion to certify 21 state-law damages classes. On December 3, 2015, the Third Circuit entered an order staying its consideration of the plaintiffs’ request for an immediate appeal of the damages-class ruling pending the trial court’s resolution of the plaintiffs’ renewed motion to certify an injunctive-relief class. On July 11, 2017 the plaintiffs filed a petition with the Third Circuit asking the court to hear an appeal of the June 27 order denying plaintiffs’ renewed motion for injunctive class certification. On July 21, 2017, the Company joined other defendants in a response filed with the Third Circuit opposing the plaintiffs' petition.The Non-Class Cases. Six of the cases in which plaintiffs do not seek to certify a class have been consolidated with the putative class actions into In re: Processed Egg Products Antitrust Litigation, No. 2:08-md-02002-GP, in the United States District Court for the Eastern District of Pennsylvania. The court granted with prejudice the defendants’ renewed motion to dismiss the non-class plaintiffs’ claims for damages arising before September 24, 2004. On July 2, 2015, the Company filed and joined several motions for summary judgment that sought either dismissal of all of the claims in all of these cases or, in the alternative, dismissal of portions of these cases. On July 2, 2015, the non-class plaintiffs filed a motion for summary judgment seeking dismissal of certain affirmative defenses based on statutory immunities from federal antitrust law. The Court heard oral argument on the motions for summary judgment on February 22 and 23, 2016. On September 6, 2016, the Court granted the defendants’ motion for summary judgment against the plaintiffs’ claims arising from their purchases of egg products, dismissing those claims with prejudice. On September 9, 2016, the Court granted in part the Company’s motion for summary judgment on liability, dismissing as a matter of law the plaintiffs’ allegations of a side agreement to cease construction of new facilities and ruling that the plaintiffs’ allegations against United Egg Producers (UEP) animal-welfare guidelines must be evaluated at trial under the rule of reason. On September 12, 2016, the Court granted in part the Company’s motion for summary judgment on damages, ruling that plaintiffs cannot recover damages on purchases of eggs from non-defendants and cannot recover any relief on eggs and egg products produced or sold in Arizona after October 1, 2009, the date that Arizona mandated that all eggs sold or produced in that state must be produced in compliance with the 2008 version of the UEP animal-welfare guidelines. On September 13, 2016, the Court granted in part the plaintiffs’ motion for summary judgment as to the applicability of the Capper-Volstead defense, ruling that United States Egg Marketers (an industry cooperative of which the Company is a member) may invoke the defense at trial but that UEP (another industry cooperative of which the Company is a member) cannot. The Capper-Volstead defense is a defense pursuant to the Capper-Volstead Act (the Co-operative Marketing Associations Act), enacted by Congress in 1922, which gives certain associations of farmers certain exemptions from antitrust laws. On October 4, 2016, certain direct action plaintiffs (Kraft Food Global, Inc., General Mills, Inc., Nestle USA, Inc., and The Kellogg Company) filed an appeal to the United States Court of Appeals for the Third Circuit from the District Court’s Order dated September 6, 2016, granting defendants’ motion for summary judgment and dismissing with prejudice all claims based on the purchase of egg products. These plaintiffs filed their opening brief on March 7, 2017. The defendants filed their response brief on April 20. These plaintiffs filed their reply brief on May 18. The court of appeals heard oral argument on July 11, 2017, but has not issued a ruling. On November 22, 2016, the non-class plaintiffs filed a motion asking the Court to hold a status conference and asking the court to set the non-class cases for trial in June of 2017. The parties in all of the remaining class and non-class cases submitted several different proposed trial schedules to the court, and a status conference was held on February 9, 2017. A trial date has not yet been set.Allegations in Each Case. In all of the cases described above, the plaintiffs allege that the Company and certain other large domestic egg producers conspired to reduce the domestic supply of eggs in a concerted effort to raise the price of eggs to artificially high levels. In each case, plaintiffs allege that all defendants agreed to reduce the domestic supply of eggs by: (a) agreeing to limit production; (b) manipulating egg exports; and (c) implementing industry-wide animal welfare guidelines that reduced the number of hens and eggs.The named plaintiffs in the remaining indirect purchaser putative class action seek treble damages under the statutes and common-law of various states and injunctive relief under the Sherman Act on behalf of themselves and all other putative class members in the United States. Although plaintiffs allege a class period starting in October, 2006 and running “through the present,” the Court denied the plaintiffs’ motion to certify classes seeking damages under the laws of 21 states and denied without prejudice the plaintiffs’ motion to certify an injunctive-relief class, although the plaintiffs have filed a renewed motion to certify an injunctive-relief class, as discussed above.Five of the original six non-class cases remain pending against the Company. The principal plaintiffs in these cases are: The Kroger Co.; Publix Super Markets, Inc.; SUPERVALU, Inc.; Safeway, Inc.; Albertsons LLC; H.E. Butt Grocery Co.; The Great Atlantic & Pacific Tea Company, Inc.; Walgreen Co.; Hy-Vee, Inc.; and Giant Eagle, Inc. In four of these remaining non-class cases, the plaintiffs seek treble damages and injunctive relief under the Sherman Act. In one of those four cases, the plaintiffs purchased only egg products, and as noted above, the Court dismissed with prejudice all claims arising from the purchase of egg products. On October 4, 2016, the four plaintiffs in that case (Kraft Food Global, Inc., General Mills, Inc., Nestle USA, Inc., and The Kellogg Company) appealed that decision to the United States Court of Appeals for the Third Circuit. In the fifth remaining non-class case, the plaintiff seeks treble damages and injunctive relief under the Sherman Act and the Ohio antitrust act (known as the Valentine Act).The Pennsylvania court has entered a series of orders related to case management, discovery, class certification, summary judgment, and scheduling. The Court has also denied all four motions that the plaintiffs filed to exclude testimony from certain expert witnesses retained by the defendants. The Pennsylvania court has not set a trial date for any of the Company’s remaining consolidated cases (non-class and indirect purchaser cases). As noted above, the court held a hearing on the parties’ proposed trial schedules but has not yet set a trial date.The Company intends to continue to defend the remaining cases as vigorously as possible based on defenses which the Company believes are meritorious and provable. While management believes that the likelihood of a material adverse outcome in the overall egg antitrust litigation has been significantly reduced as a result of the settlements and rulings described above, there is still a reasonable possibility of a material adverse outcome in the remaining egg antitrust litigation. At the present time, however, it is not possible to estimate the amount of monetary exposure, if any, to the Company because of these cases. Accordingly, adjustments, if any, which might result from the resolution of these remaining legal matters, have not been reflected in the financial statements.State of Oklahoma Watershed Pollution LitigationOn June 18, 2005, the State of Oklahoma filed suit, in the United States District Court for the Northern District of Oklahoma, against Cal-Maine Foods, Inc. and Tyson Foods, Inc. and affiliates, Cobb-Vantress, Inc., Cargill, Inc. and its affiliate, George’s, Inc. and its affiliate, Peterson Farms, Inc. and Simmons Foods, Inc. The State of Oklahoma claims that through the disposal of chicken litter the defendants have polluted the Illinois River Watershed. This watershed provides water to eastern Oklahoma. The complaint seeks injunctive relief and monetary damages, but the claim for monetary damages has been dismissed by the court. Cal-Maine Foods, Inc. discontinued operations in the watershed. Accordingly, we do not anticipate that Cal-Maine Foods, Inc. will be materially affected by the request for injunctive relief unless the court orders substantial affirmative remediation. Since the litigation began, Cal-Maine Foods, Inc. purchased 100% of the membership interests of Benton County Foods, LLC, which is an ongoing commercial shell egg operation within the Illinois River Watershed. Benton County Foods, LLC is not a defendant in the litigation.The trial in the case began in September 2009 and concluded in February 2010. The case was tried to the court without a jury and the court has not yet issued its ruling. Management believes the risk of material loss related to this matter to be remote.Egg Antitrust LitigationSince September 25, 2008, the Company has been named as one of several defendants in numerous antitrust cases involving the United States shell egg industry. In some of these cases, the named plaintiffs allege that they purchased eggs or egg products directly from a defendant and have sued on behalf of themselves and a putative class of others who claim to be similarly situated. In other cases, the named plaintiffs allege that they purchased shell eggs and egg products directly from one or more of the defendants but sue only for their own alleged damages and not on behalf of a putative class. In the remaining cases, the named plaintiffs are individuals or companies who allege that they purchased shell eggs indirectly from one or more of the defendants - that is, they purchased from retailers that had previously purchased from defendants or other parties – and have sued on behalf of themselves and a putative class of others who claim to be similarly situated.The Judicial Panel on Multidistrict Litigation consolidated all of the putative class actions (as well as certain other cases in which the Company was not a named defendant) for pretrial proceedings in the United States District Court for the Eastern District of Pennsylvania. The Pennsylvania court has organized the putative class actions around two groups (direct purchasers and indirect purchasers) and has named interim lead counsel for the named plaintiffs in each group.The Direct Purchaser Putative Class Action. The direct purchaser putative class cases were consolidated into In re: Processed Egg Products Antitrust Litigation, No. 2:08-md-02002-GP, in the United States District Court for the Eastern District of Pennsylvania. On November 25, 2014, after approving the parties’ settlement of the case, the Court entered final judgment dismissing all claims against the Company with prejudice and dismissing the Company from this direct purchaser class action. On56January 23, 2015, direct action plaintiffs Kraft Foods Global, Inc., General Mills, Inc., Nestle USA, Inc., and The Kellogg Company filed a motion either to exclude themselves from the settlement between the direct purchaser plaintiffs and the Company or to enlarge their time to opt-out of the settlement between the direct purchaser plaintiffs and the Company and modify the final judgment entered on November 25, 2014. On February 13, 2015, the Company filed its response in opposition. On July 1, 2015, the Court held an evidentiary hearing on this motion. The Court has not ruled on this motion.The Indirect Purchaser Putative Class Action. The indirect purchaser putative class cases were consolidated into In re: Processed Egg Products Antitrust Litigation, No. 2:08-md-02002-GP, in the United States District Court for the Eastern District of Pennsylvania. The court granted with prejudice the defendants’ renewed motion to dismiss damages claims arising outside the limitations period applicable to most causes of action. On April 20-21, 2015, the Court held an evidentiary hearing on the indirect purchaser plaintiffs’ motion for class certification. The Court has not ruled on that motion. On July 2, 2015, the Company filed and joined several motions for summary judgment that sought either dismissal of the entire case or, in the alternative, dismissal of portions of the case. On July 2, 2015, the indirect purchaser plaintiffs filed motions for summary judgment seeking dismissal of certain affirmative defenses based on statutory immunities from federal and state antitrust laws. Briefing on the parties’ respective motions for summary judgment will continue over the next two months, and the Court has not indicated when it will rule on these motions.The Non-Class Cases. Six of the cases in which plaintiffs do not seek to certify a class have been consolidated with the putative class actions into In re: Processed Egg Products Antitrust Litigation, No. 2:08-md-02002-GP, in the United States District Court for the Eastern District of Pennsylvania. The court granted with prejudice the defendants’ renewed motion to dismiss the non-class plaintiffs’ claims for damages arising before September 24, 2004. The parties have completed nearly all fact discovery related to these cases. On July 2, 2015, the Company filed and joined several motions for summary judgment that sought either dismissal of all of the claims in all of these cases or, in the alternative, dismissal of portions of these cases. On July 2, 2015, the non-class plaintiffs filed a motion for summary judgment seeking dismissal of certain affirmative defenses based on statutory immunities from federal antitrust law. Briefing on the parties’ respective motions for summary judgment will continue over the next two months, and the Court has not indicated when it will rule on these motions.Allegations in Each Case. In all of the cases described above, the plaintiffs allege that the Company and certain other large domestic egg producers conspired to reduce the domestic supply of eggs in a concerted effort to raise the price of eggs to artificially high levels. In each case, plaintiffs allege that all defendants agreed to reduce the domestic supply of eggs by: (a) agreeing to limit production; (b) manipulating egg exports; and (c) implementing industry-wide animal welfare guidelines that reduced the number of hens and eggs.The named plaintiffs in the remaining indirect purchaser putative class action seek treble damages and injunctive relief on behalf of themselves and all other putative class members in the United States. Although plaintiffs allege a class period starting on January 1, 2000 and running “through the present,” the Court ruled that the plaintiffs cannot recover damages allegedly incurred outside the state-specific statute of limitations period applicable to most causes of action asserted, with the precise damages period determined on a state-by-state and claim-by-claim basis. The indirect purchaser putative class action seeks injunctive relief under the Sherman Act and damages under certain statutes and the common-law of various states.Five of the original six non-class cases remain pending against the Company. In four of the remaining non-class cases, the plaintiffs seek damages and injunctive relief under the Sherman Act. In the other remaining non-class case, the plaintiff seeks damages and injunctive relief under the Sherman Act and the Ohio antitrust act (known as the Valentine Act).The Pennsylvania court has entered a series of orders related to case management, discovery, class certification, and scheduling. The Pennsylvania court has not set a trial date for any of the Company’s remaining consolidated cases (non-class and indirect purchaser cases).The Company intends to continue to defend the remaining cases as vigorously as possible based on defenses which the Company believes are meritorious and provable. While management believes that the likelihood of a material adverse outcome in the overall egg antitrust litigation has been significantly reduced as a result of the settlements described above, there is still a reasonable possibility of a material adverse outcome in the remaining egg antitrust litigation. At the present time, however, it is not possible to estimate the amount of monetary exposure, if any, to the Company because of these cases. Accordingly, adjustments, if any, which might result from the resolution of these remaining legal matters, have not been reflected in the financial statements.57On November 4, 2008, the Company received an antitrust civil investigative demand from the Attorney General of the State of Florida. The demand seeks production of documents and responses to interrogatories relating to the production and sale of eggs and egg products. The Company is cooperating with this investigation and has, on three occasions, entered into an agreement with the State of Florida tolling the statute of limitations applicable to any supposed claims the State is investigating. No allegations of wrongdoing have been made against the Company in this matter.Environmental Information RequestIn July 2011, the Company received an information request from the United States Environmental Protection Agency (“EPA”) pursuant to Section 308 of the Clean Water Act (“Act”). The Request stated that the information was sought by the EPA to investigate compliance with the Act and requested information pertaining to facilities involved in animal feeding operations, which are owned or operated by the Company or its affiliates. The Company timely responded to the Request by providing information on each of the subject facilities. The EPA subsequently sent a notice of noncompliance to the Company dated March 29, 2012 related only to the Company’s Edwards, Mississippi facility. The Company previously announced a settlement with the EPA and the Mississippi Department of Environmental Quality related to the notice, and a Consent Decree memorializing the settlement was entered on June 30, 2015 in the United States of America and State of Mississippi, by and through the Mississippi Commission on Environmental Quality v. Cal-Maine Foods, Inc. Civil Action No. 3:15-cv-00278-HTW-LRA, in the U.S. District Court for the Southern District of Mississippi, Northern Division. The terms and conditions of the settlement related only to the Edwards, Mississippi facility and are not expected to have a material impact to the Company’s results of operations. Management believes the risk of material loss related to non-settled matters relating to the 2011 notice to be remote.MiscellaneousOther MattersIn addition to the above, the Company is involved in various other claims and litigation incidental to its business. Although the outcome of these matters cannot be determined with certainty, management, upon the advice of counsel, is of the opinion that the final outcome should not have a material effect on the Company’s consolidated results of operations or financial position.At this time, it is not possible for us to predict the ultimate outcome of the matters set forth above.14.13. Description of Rights and Privileges of Capital Stock—Capital Structure Consists of CommonStockThe Company has two classes of capital stock: Common Stock and Class A Common Stock. Holders of shares of the Company’s capital stock vote as a single class on all matters submitted to a vote of the stockholders, with each share of Common Stock entitled to one vote and each share of Class A Common Stock entitled to ten votes. The Common Stock and Class A Common Stock have equal liquidation rights and the same dividend rights. In the case of any stock dividend, holders of Common Stock are entitled to receive the same percentage dividend (payable only in shares of Common Stock) as the holders of Class A Common Stock receive (payable only in shares of Class A Common Stock). Upon liquidation, dissolution, or winding-up of the Company, the holders of Common Stock are entitled to share ratably with the holders of Class A Common Stock in all assets available for distribution after payment in full of creditors. The Class A Common Stock may only be issued to Fred R. Adams, Jr., the Company’s Founder and Chairman Emeritus, and members of his immediate family, as defined.defined in the Company's articles of incorporation. In the event any share of Class A Common Stock, by operation of law or otherwise is, or shall be deemed to be owned by any person other than Mr. Adams or a member of his immediate family, the voting power of such stock will be reduced from ten votes per share to one vote per share. Also, shares of Class A Common Stock shall be automatically converted into Common Stock on a share per share basis in the event the beneficial or record ownership of any such share of Class A Common Stock is transferred to any person other than Mr. Adams or a member of his immediate family. Each share of Class A Common Stock is convertible, at the option of its holder, into one share of Common Stock at any time. The holders of Common Stock and Class A Common Stock are not entitled to preemptive or subscription rights. In any merger, consolidation or business combination, the consideration to be received per share by holders of Common Stock must be identical to that received by holders of Class A Common Stock, except that if any such transaction in which shares of Capital Stock are distributed, such shares may differ as to voting rights to the extent that voting rights now differ among the classes of capital stock. No class of capital stock may be combined or subdivided unless the other classes of capital stock are combined or subdivided in the same proportion. No dividend may be declared and paid on Class A Common Stock unless the dividend is payable only to the holders of Class A Common Stock and a dividend payable to Common Stock is declared and paid concurOn July 25, 2014, the Board of Directors approved an amendment to the Company’s Amended and Restated Certificate of Incorporation to authorize an additional 60,000,000 shares of common stock and an additional 2,400,000 shares of Class A common58Unless otherwise noted, all prior period share and per share information contained in this report was adjusted to reflect the effect of the stock split.15.14. Fair Value MeasuresThe Company is required to categorize both financial and nonfinancial assets and liabilities based on the following fair value hierarchy. The fair value of an asset is the price at which the asset could be sold in an orderly transaction between unrelated, knowledgeable, and willing parties able to engage in the transaction. A liability’s fair value is defined as the amount that would be paid to transfer the liability to a new obligor in a transaction between such parties, not the amount that would be paid to settle the liability with the creditor.·Level 1 - Quoted prices in active markets for identical assets or liabilities.·Level 2 - Inputs other than quoted prices included in Level 1 that are observable for the asset or liability, either directly or indirectly.·Level 3 - Unobservable inputs for the asset or liability supported by little or no market activity and are significant to the fair value of theLevel 1 - Quoted prices in active markets for identical assets or liabilities.Level 2 - Inputs other than quoted prices included in Level 1 that are observable for the asset or liability, either directly or indirectly.Level 3 - Unobservable inputs for the asset or liability supported by little or no market activity and are significant to the fair value of the assets or liabilities.The disclosure of fair value of certain financial assets and liabilities recorded at cost are as follows:Cash and cash equivalents, accounts receivable, and accounts payable: The carrying amount approximates fair value due to the short maturity of these instruments.Long-term debt: The carrying value of the Company’s long-term debt is at its stated value. We have not elected to carry our long-term debt at fair value. Fair values for debt are based on quoted market prices or published forward interest rate curves, which are level 2 inputs. Estimated fair values are management’s estimates, which is a level 3 input; however, when there is no readily available market data, the estimated fair values may not represent the amounts that could be realized in a current transaction, and the fair values could change significantly. The fair value of the Company’s debt is sensitive to changes in the general level of U.S. interest rates. The Company maintains all of its debt as fixed rate in nature to mitigate the impact of fluctuations in interest rates. Under its current policies, the Company does not use interest rate derivative instruments to manage its exposure to interest rate changes. A one percent (1%) adverse move (i.e. decrease) in interest rates would adversely affect the net fair value of the Company’s debt by $1.0 million$144,000 at May 30, 2015.June 3, 2017. The fair value and carrying value of the Company’s long-term debt were as follows (in thousands):44,549 45,158 52,676 53,387 6,311 6,312 8,417 8,396 50,860 51,470 61,093 61,783 59 June 3, 2017 May 28, 2016 Carrying Value Fair Value Carrying Value Fair Value 5.40 – 6.40% Notes payable $ 9,250 $ 9,295 $ 25,570 $ 25,824 Long-term leases 1,689 1,520 — — $ 10,939 $ 10,815 $ 25,570 $ 25,824 Assets and Liabilities Measured at Fair Value on a Recurring BasisIn accordance with the fair value hierarchy described above, the following table shows the fair value of our financial assets and liabilities that are required to be measured at fair value on a recurring basis as of May 30, 2015June 3, 2017 and May 31, 201428, 2016 (in thousands):9,630 9,630 76,311 76,311 2,002 2,002 7,496 7,496 136,364 136,364 1,045 1,045 14,352 14,352 4,508 4,508 82 82 4,508 247,282 251,790 1,024 1,024 1,024 1,024 8,859 8,859 71,834 71,834 351 351 3,930 3,930 102,685 102,685 1,066 1,066 2,000 2,000 5,464 5,464 1,255 1,255 5,464 191,980 197,444 2,985 2,985 2,985 2,985 June 3, 2017 Quoted Prices in Active Significant Markets for Other Significant Identical Observable Unobservable Instruments Inputs Inputs Total (Level 1) (Level 2) (Level 3) Balance Assets US government and agency obligations $ — $ 20,216 $ — $ 20,216 Municipal bonds — 36,873 — 36,873 Corporate bonds — 75,790 — 75,790 Asset backed securities — 5,583 — 5,583 Mutual funds 2,459 — — 2,459 Total assets measured at fair value $ 2,459 $ 138,462 $ — $ 140,921 May 28, 2016 Quoted Prices in Active Significant Markets for Other Significant Identical Observable Unobservable Instruments Inputs Inputs Total (Level 1) (Level 2) (Level 3) Balance Assets US government and agency obligations $ — $ 18,814 $ — $ 18,814 Municipal bonds — 79,643 — 79,643 Corporate bonds — 240,537 — 240,537 Foreign government obligations — 2,046 — 2,046 Asset backed securities — 15,893 — 15,893 Mutual funds 5,503 — — 5,503 Total assets measured at fair value $ 5,503 $ 356,933 $ — $ 362,436 Our investment securities – available-for-sale classified as level 2 consist of certificates of deposit, time deposits, U.S. government and agency obligations, taxable and tax exempt municipal bonds, zero coupon municipal bonds, asset-backed securities, foreign government obligations, and corporate bonds with maturities of three months or longer when purchased. We classified these securities as current, because amounts invested are available for current operations. Observable inputs for these securities are yields, credit risks, default rates, and volatility.60Liabilities for contingent consideration (earn-outs) take into account commodity prices based on published forward commodity price curves, projected future egg prices as of the date of the estimate, and projected future cash flows expected to be received as a result of business acquisitions (Refer to Note 2 – Acquisitions). 15. Investment Given the unobservable nature of these inputs, they are deemed to be Level 3Securitiesfair value measurements. During fiscal 2015 we recognized a $239,000 loss resulting from the increase in fair value of the contingent consideration. In fiscal 2014 we recognized a $4.4 million loss. Both the losses were recognized in earnings as an increase of selling, general, and administrative expenses. Changes in the fair value of contingent consideration obligations for fiscal 2015 were as follows (in thousands):Year endedMay 30, 2015Balance at beginning of year$2,985 (Gains)/Losses recognized in earnings239 Payments(2,200)Balance at end of year$1,024 6116. Investment Securities76,225 83 76,308 2,001 1 2,002 7,491 5 7,496 136,411 47 136,364 1,042 3 1,045 14,356 4 14,352 2,761 3 2,764 1,199 548 1,747 71,659 175 71,834 350 1 351 3,927 3 3,930 102,587 98 102,685 1,064 2 1,066 2,000 2,000 4,000 13 4,013 999 452 1,451 June 3, 2017 Gains in Losses in Accumulated Accumulated Estimated Amortized Other Other Fair Cost Comprehensive Comprehensive Value Income Income US government and agency obligations $ 20,259 $ — 43 $ 20,216 Municipal bonds 36,839 34 — 36,873 Corporate bonds 75,769 21 — 75,790 Asset backed securities 5,583 — — 5,583 Mutual funds — — — — Total current investment securities $ 138,450 $ 55 $ 43 $ 138,462 Mutual funds 1,706 753 — 2,459 Total noncurrent investment securities $ 1,706 $ 753 — $ 2,459 May 28, 2016 Gains in Losses in Accumulated Accumulated Estimated Amortized Other Other Fair Cost Comprehensive Comprehensive Value Income Income US government and agency obligations $ 18,809 $ 5 — $ 18,814 Municipal bonds 79,481 162 — 79,643 Corporate bonds 240,593 — 56 240,537 Foreign government obligations 2,044 2 — 2,046 Asset backed securities 15,908 — 15 15,893 Mutual funds 3,565 1 — 3,566 Total current investment securities $ 360,400 $ 170 $ 71 $ 360,499 Mutual funds 1,448 489 — 1,937 Total noncurrent investment securities $ 1,448 $ 489 — $ 1,937 Proceeds from the sales of available-for-sale securities were $146.8$251.7 million, $108.1$292.5 million, and $188.1$146.8 million during fiscal 2015, 2014,2017, 2016, and 2013,2015, respectively. Gross realized gains on those sales during fiscal2017, 2016,and 2015 2014,were $231,000, $131,000, and 2013 were $82,000, $8,000, and $24,000, respectively. Gross realized losses on those sales during fiscal 2015, 2017, 2016, and2014 and 2013 were $7,000, $2,000,$110,000, and $676,000,$7,000, respectively. For purposes of determining gross realized gains and losses, the cost of securities sold is based on the specific identification method.Unrealized holding gains and (losses), net of tax on available-for-sale securities classified as current in the amount of $(149,000), $149,000,taxes, for fiscal 2017, 2016, and $256,000 for the years ended May 30, 2015 May 31, 2014, and June 1, 2013, respectively, have been included in accumulated other comprehensive income (loss). Unrealized holding gains net of tax on long term available-for-sale securities in the amount of $59,000 and $90,000 for the years ended May 30, 2015 and May 31, 2014 have been included in other comprehensive income (loss).62Contractual maturities of investment securities at May 30, 2015, arewere as follows (in thousands):Estimated Fair ValueWithin one year $ 129,2971-3 years June 3, 2017 May 28, 2016 May 30, 2015 Current Investments (54 ) 22 (146 ) Noncurrent Investments 164 (31 ) 59 Total unrealized holding gains (losses) 110 (9 ) (87 ) 117,900 $ 247,197 Estimated Fair Value Within one year $ 82,331 1-3 years 56,131 $ 138,462 17.16. Quarterly Financial Data: (unaudited, amount in thousands, except per share data):356,944 378,617 437,556 403,011 81,101 92,709 112,517 109,394 27,655 36,603 50,882 46,114 0.57 0.76 1.06 0.96 0.57 0.76 1.05 0.95 Fiscal Year 2017 First Second Third Fourth Quarter Quarter Quarter Quarter 319,528 354,275 395,522 371,582 $ 239,845 $ 253,544 $ 306,540 $ 274,584 44,911 74,667 91,895 91,291 (9,569 ) 3,948 39,165 12,006 8,756 26,106 42,853 31,492 Net income (loss) attributable to Cal-Maine Foods, Inc. (30,936 ) (23,010 ) 4,139 (24,471 ) Net income (loss) per share: 0.18 0.54 0.89 0.66 $ (0.64 ) $ (0.48 ) $ 0.09 $ (0.51 ) 0.18 0.54 0.89 0.65 $ (0.64 ) $ (0.48 ) $ 0.09 $ (0.51 ) 18. Derivative Financial InstrumentsDuring the Company's fourth quarter of fiscal 2017, we decided to carry back fiscal 2017 net operating losses to recover taxes paid in fiscal 2015, which affects the comparability between quarters. The Company holds commodity futures contractsnet operating loss carryback resulted in a $4.1 million decrease in the formincome tax benefit, as the carryback reduced prior year taxable income and as a result reduced the benefit of call options, the costprior year domestic manufacturers deductions, a portion of which is paid for by customers, to protect against increaseswere therefore reversed in the pricefourth quarter of corn and soybean meal purchases required to support that portion of its shell egg production sold on a cost of production formula. The contracts are generally for durations of less than six months. The Company elected to mark the unrealized changes in derivative instrument fair value to market; however, the net realized cost of these contracts is paid by customers, so there is no net impact to the Company’s Consolidated Statement of Income. The fair value of all derivative instruments outstanding is included as a component of “Prepaid Expenses and Other Current Assets” on the Consolidated Balance Sheets as follows (in thousands):fiscal 2017.3,410 $57 36 $26 63 Fiscal Year 2016 First Second Third Fourth Quarter Quarter Quarter Quarter Net sales $ 609,895 $ 545,975 $ 449,760 $ 303,020 Gross profit 263,071 211,597 132,726 40,680 Net income (loss) attributable to Cal-Maine Foods, Inc. 143,023 109,230 64,164 (376 ) Net income (loss) per share: Basic $ 2.97 $ 2.27 $ 1.33 $ (0.01 ) Diluted $ 2.95 $ 2.26 $ 1.33 $ (0.01 ) Years endedJune 3, 2017,May 28, 2016,andMay 30, 2015 May 31, 2014, and June 1, 2013(in thousands)430 432 349 513 771 (323) 18 430 589 1,410 1,228 771 64 Balance at Charged to Balance at Beginning of Cost and Write-off End of Description Period Expense of Accounts Period Year ended June 3, 2017 Allowance for doubtful accounts $ 727 $ (176 ) $ 165 $ 386 Year ended May 28, 2016 Allowance for doubtful accounts $ 513 $ 225 $ 11 $ 727 Year ended May 30, 2015 Allowance for doubtful accounts $ 430 $ 432 $ 349 $ 513 ITEM 9. CHANGES IN AND DISAGREEMENTS WITH ACCOUNTANTS ON ACCOUNTING AND FINANCIAL DISCLOSURENone.Disclosure Controls and ProceduresOur disclosure controls and procedures are designed to provide reasonable assurance that information required to be disclosed by us in the reports we file or submit under the Securities Exchange Act of 1934, as amended (the “Exchange Act”) is recorded, processed, summarized and reported, within the time periods specified in the Securities and Exchange Commission’s rules and forms. Disclosure controls and procedures include, without limitation, controls and procedures designed to ensure that information required to be disclosed by us in the reports that we file or submit under the Exchange Act is accumulated and communicated to management, including our principal executive and principal financial officers, or persons performing similar functions, as appropriate to allow timely decisions regarding required disclosure. Based on an evaluation of our disclosure controls and procedures conducted by our Chief Executive Officer and Chief Financial Officer, together with other financial officers, such officers concluded that our disclosure controls and procedures were effective as of May 30, 2015June 3, 2017 at the reasonable assurance level.Internal Control Over Financial Reporting(a)Management’s Report on Internal Control Over Financial Reporting(a) Management’s Report on Internal Control Over Financial Reporting The following sets forth, in accordance with Section 404(a) of the Sarbanes-Oxley Act of 2002 and Item 308 of the Securities and Exchange Commission’s Regulation S-K, the report of management on our internal control over financial reporting.1.1. Our management is responsible for establishing and maintaining adequate internal control over financial reporting. “Internal control over financial reporting” is a process designed by, or under the supervision of, our Chief Executive Officer and Chief Financial Officer, together with other financial officers, and effected by our Board of Directors, management and other personnel, to provide reasonable assurance regarding the reliability of financial reporting and the preparation of financial statements for external purposes in accordance with generally accepted accounting principles and includes those policies and procedures that: Pertain to the maintenance of records that in reasonable detail accurately and fairly reflect the transactions and dispositions of our assets;Provide reasonable assurance that transactions are recorded as necessary to permit preparation of financial statements in accordance with generally accepted accounting principles, and includes those policiesthat our receipts and procedures that:expenditures are being made only in accordance with authorizations of our management and directors; andProvide reasonable assurance regarding prevention or timely detection of unauthorized acquisition, use or disposition of our assets that could have a material effect on the financial statements.·2. Pertain to the maintenance of records that in reasonable detail accurately and fairly reflect the transactions and dispositions of our assets;·Provide reasonable assurance that transactions are recorded as necessary to permit preparation of financial statementsOur management, in accordance with generally accepted accounting principles,Rule 13a-15(c) under the Exchange Act and with the participation of our Chief Executive Officer and Chief Financial Officer, together with other financial officers, evaluated the effectiveness of our internal control over financial reporting as of June 3, 2017. The framework on which management’s evaluation of our internal control over financial reporting is based is the “Internal Control – Integrated Framework”published in 2013 by the Committee of Sponsoring Organizations (“COSO”) of the Treadway Commission.3. Management has determined that our receipts and expenditures are being made only in accordance with authorizationsinternal control over financial reporting as of June 3, 2017 is effective. It is noted that internal control over financial reporting cannot provide absolute assurance of achieving financial reporting objectives, but rather reasonable assurance of achieving such objectives.4. The attestation report of FROST, PLLC on our internal control over financial reporting, which includes that firm’s opinion on the effectiveness of our management and directors; andinternal control over financial reporting, is set forth below.·(b) Provide reasonable assurance regarding prevention or timely detectionAttestationReport of unauthorized acquisition, use or disposition of our assets that could have a material effect on the financial statements.Registrant’s Public Accounting Firm2.Our management, in accordance with Rule 13a-15(c) under the Exchange Act and with the participation of our Chief Executive Officer and Chief Financial Officer, together with other financial officers, evaluated the effectiveness of our internal control over financial reporting as of May 30, 2015. The framework on which management’s evaluation of our internal control over financial reporting is based is the “Internal Control – Integrated Framework”published in 2013 by the Committee of Sponsoring Organizations (“COSO”) of the Treadway Commission.3.Management has determined that our internal control over financial reporting as of May 30, 2015 is effective. It is noted that internal control over financial reporting cannot provide absolute assurance of achieving financial reporting objectives, but rather reasonable assurance of achieving such objectives.4.The attestation report of FROST, PLLC on our internal control over financial reporting, which includes that firm’s opinion on the effectiveness of our internal control over financial reporting, is set forth below.(b)AttestationReport of the Registrant’s Public Accounting Firm65on Internal Control Over Financial ReportingBoard of Directors and StockholdersCal-Maine Foods, Inc. and SubsidiariesJackson, MississippiWe have audited Cal-Maine Foods, Inc. and Subsidiaries’ internal control over financial reporting as of May 30, 2015,June 3, 2017, based on criteria established in 2013Internal Control – Integrated Framework issued by the Committee of Sponsoring Organizations of the Treadway Commission (“COSO”). Cal-Maine Foods, Inc. and Subsidiaries’ management is responsible for maintaining effective internal control over financial reporting and for its assessment of the effectiveness of internal control over financial reporting, included in the accompanying Management’s Report on Internal Control Over Financial Reporting in Item 9A. Our responsibility is to express an opinion on the entity’s internal control over financial reporting based on our audit.We conducted our audit in accordance with the standards of the Public Company Accounting Oversight Board (United States). Those standards require that we plan and perform the audit to obtain reasonable assurance about whether effective internal control over financial reporting was maintained in all material respects. Our audit of internal control over financial reporting included obtaining an understanding of internal control over financial reporting, assessing the risk that a material weakness exists, and testing and evaluating the design and operating effectiveness of internal control based on the assessed risk. Our audit also included performing such other procedures as we considered necessary in the circumstances. We believe our audit provides a reasonable basis for our opinion.An entity’s internal control over financial reporting is a process designed to provide reasonable assurance regarding the reliability of financial reporting and the preparation of consolidated financial statements for external purposes in accordance with accounting principles generally accepted in the United States of America. An entity’s internal control over financial reporting includes those policies and procedures that (1) pertain to the maintenance of records that, in reasonable detail, accurately and fairly reflect the transactions and dispositions of the assets of the entity; (2) provide reasonable assurance that transactions are recorded as necessary to permit preparation of consolidated financial statements in accordance with generally accepted accounting principles, and that receipts and expenditures of the entity are being made only in accordance with authorizations of management and directors of the entity; and (3) provide reasonable assurance regarding prevention or timely detection of unauthorized acquisition, use, or disposition of the entity’s assets that could have a material effect on the consolidated financial statements.Because of its inherent limitations, internal control over financial reporting may not prevent or detect misstatements. Also, projections of any evaluation of effectiveness to future periods are subject to the risk that controls may become inadequate because of changes in conditions, or that the degree of compliance with the policies or procedures may deteriorate.In our opinion, Cal-Maine Foods, Inc. and Subsidiaries maintained, in all material respects, effective internal control over financial reporting as of May 30, 2015,June 3, 2017, based on criteria established in2013Internal Control-Integrated Frameworkissued by the COSO. We have also audited, in accordance with the standards of the Public Company Accounting Oversight Board (United States), the consolidated balance sheets and the related consolidated statements of income,operations, comprehensive income (loss), stockholders’ equity and cash flows of Cal-Maine Foods, Inc. and Subsidiaries, and our report dated July 17, 2015,21, 2017, expressed an unqualified opinion./s/Frost, PLLCLittle Rock, ArkansasJuly 17, 201521, 201766(c) Changes in Internal Control Over Financial Reporting (c)Changes in Internal Control Over Financial ReportingIn connection with its evaluation of the effectiveness, as of May 30, 2015,June 3, 2017, of our internal control over financial reporting, management determined that there was no change in our internal control over financial reporting that occurred during the fourth quarter ended May 30, 2015,June 3, 2017, that has materially affected, or is reasonably likely to materially affect, our internal control over financial reporting.Not applicable.PART IIIExcept as set forth below, the information concerning directors, executive officers and corporate governance is incorporated by reference from our definitive proxy statement which is to be filed pursuant to Regulation 14A under the Securities Exchange Act of 1934 in connection with our 20152017 Annual Meeting of Shareholders.We have adopted a Code of Conduct and Ethics for Directors, Officers and Employees, including the chief executive and principal financial and accounting officers of the Company. We will provide a copy of the code free of charge to any person that requests a copy by writing to:Cal-Maine Foods, Inc.P.O. Box 2960Jackson, Mississippi 39207Attn.: Investor RelationsRequests can be made by phone at (601) 948-6813A copy is also available at our website www.calmainefoods.com. We intend to disclose any amendments to, or waivers from, the Code of Conduct and Ethics for Directors, Officers and Employees on our website promptly following the date of any such amendment or waiver. Information contained on our website is not a part of this report.The information concerning executive compensation is incorporated by reference from our definitive proxy statement which is to be filed pursuant to Regulation 14A under the Securities Exchange Act of 1934 in connection with our 20152017 Annual Meeting of Shareholders.ITEM 12. SECURITY OWNERSHIP OF CERTAIN BENEFICIAL OWNERS ANDMANAGEMENT AND RELATED STOCKHOLDER MATTERSThe information concerning security ownership of certain beneficial owners and management and related stockholder matters is incorporated by reference from our definitive proxy statement which is to be filed pursuant to Regulation 14A under the Securities Exchange Act of 1934 in connection with our 20152017 Annual Meeting of Shareholders.The information concerning certain relationships and related transactions, and director independence is incorporated by reference from our definitive proxy statement which is to be filed pursuant to Regulation 14A under the Securities Exchange Act of 1934 in connection with our 20152017 Annual Meeting of Shareholders.67The information concerning principal accounting fees and services is incorporated by reference from our definitive proxy statement which is to be filed pursuant to Regulation 14A under the Securities Exchange Act of 1934 in connection with our 20152017 Annual Meeting of Shareholders.68PART IV(a)(1)Financial StatementsThe following consolidated financial statements and notes thereto of Cal-Maine Foods, Inc. and subsidiaries are included in Item 8 and are filed herewith:353637 May 31, 2014, and June 1, 2013.38 May 31, 2014, and June 1, 2013.3940(a)(a)(2) Financial Statement Schedule64All other schedules are omitted either because they are not applicable or required, or because the required information is included in the financial statements or notes thereto.(a)(3)Exhibits Required by Item 601 of Regulation S-KSee Part (b) of this Item 15.(b) Exhibits Required by Item 601 of Regulation S-K(b) Exhibits Required by Item 601 of Regulation S-K The following exhibits are filed herewith or incorporated by reference:69Wage Continuation Plan, dated as of July 1, 1986, between Jack Self and the Registrant, as amended on September 2, 1994 (incorporated by reference to Exhibit 10.7 in the Registrant’s Form S-1 Registration Statement No. 333-14809, filed October 25, 1996).10.2*10.3*Redemption Agreement, dated March 7, 1994, between the Registrant and Fred R. Adams, Jr. (incorporated by reference to Exhibit 10.9 in the Registrant’s Form S-1 Registration Statement No. 333-14809, filed October 25, 1996).10.4*Wage Continuation Plan, dated as of January 14, 1999, among Stephen Storm, Charles F. Collins, Bob Scott and the Registrant (incorporated by reference to Exhibit 10.11 in the Registrant’s Form 10-K for fiscal year ended May 29, 1999, filed August 25, 1999).10.5*2005 Incentive Stock Option Plan (incorporated by reference to Appendix B to the Registrant’s Proxy Statement for the Annual Meeting held October 13, 2005, filed September 9, 2005).10.6*2005 Stock Appreciation Rights Plan (incorporated by reference to Appendix C to the Registrant’s Proxy Statement for the Annual Meeting held October 13, 2005, filed September 9, 2005).10.7*10.8 Loan Agreement, dated as of November 13, 2006, between Metropolitan Life Insurance Company and the Registrant (incorporated by reference to Exhibit 10.15 in the Registrant’s Form 10-Q for the quarter ended December 2, 2006, filed January 9, 2007).10.9 10.10*10.11*10.12*10.13**Management contract or compensatory plan or arrangement**Filed herewith as an Exhibit***Furnished herewith as an Exhibit+Submitted electronically with this Annual Report on Form 10-K* Management contract or compensatory plan or arrangement ** Filed herewith as an Exhibit *** Furnished herewith as an Exhibit † Submitted electronically with this Annual Report on Form 10-K The Company has not filed instruments with respect to long-term debt where the total amount of securities authorized thereunder does not exceed ten percent of the total assets of the Company and its subsidiaries on a consolidated basis. The Company agrees to furnish to the Securities and Exchange Commission, upon request, copies of any such instrument.70(c) Financial Statement Schedules Required by Regulation S-X (c)Financial Statement Schedules Required by Regulation S-XThe financial statement schedule required by Regulation S-X is filed at page 78.73. All other schedules for which provision is made in the applicable accounting regulations of the Securities and Exchange Commission are not required under the related instructions or are inapplicable and therefore have been omitted.71SIGNATURESPursuant to the requirements of Section 13 or 15(d) of the Securities Exchange Act of 1934, the registrant has duly caused this report to be signed on its behalf by the undersigned, thereunto duly authorized, in Jackson, Mississippi, on this 20thday of July 2015.CAL-MAINE FOODS, INC./s/ Adolphus B. Baker Date: July 21, 2017 Pursuant to the requirements of the Securities Exchange Act of 1934, this report has been signed below by the following persons on behalf of the registrant and in the capacities and on the dates indicated:SignatureTitleDateSignature Title Date /s/ Adolphus B. Baker 20, 201520, 201520, 201520, 201520, 201520, 201520, 20157279