PART II
ITEM 5. MARKET FOR REGISTRANT'S COMMON EQUITY, RELATED SHAREHOLDER MATTERS AND ISSUER PURCHASES OF EQUITY SECURITIES
Share Priceperformance and Dividend Information
CP's Common Shares are listedcost of managementThe graph below shows the total shareholder return (TSR) of $100 invested in CP shares compared to the two major market indices over the last five years ending December 31, 2018 and assumes reinvestment of dividends.
The S&P 500 Index return over that time frame was aided by the Tax Cuts and Jobs Act of 2017. The graph shows that shareholder value continues to perform as the total direct compensation (TDC) paid to our named executives has declined and stabilized with our new team. Our share price on the TSX was $223.75 at the beginning of the performance period (US$192.69 on the NYSE) compared to $242.24 at the end of 2018 (US$177.62 on the NYSE), a growth in share appreciation of 8.3% on the TSX. Our total shareholder return over the five-year period was 12.5% on the TSX, assuming reinvestment of dividends.
The total compensation value for NEOs as disclosed in the summary compensation table is 0.3% of our total revenues of $7.3 billion for 2018.
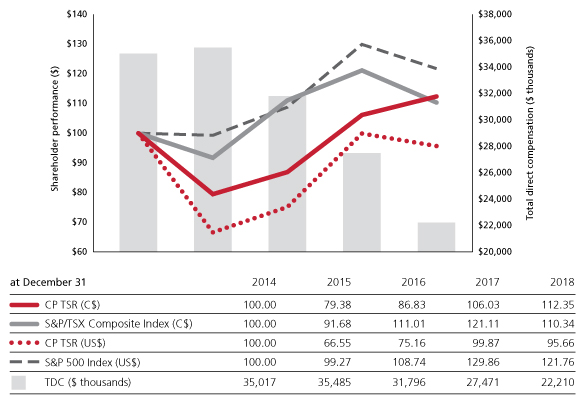
at December 31CP TSR (C$)CP TSR (US$)S&P/TSX Composite Index (C$)S&P 500 Index (US$)TDC ($ thousands)2014100.00100.00100.00100.0035,017201579.3866.5591.6899.2735,485201686.8375.16111.01108.7431,7962017106.0399.87121.11129.8627,4712018112.3595.66110.34121.7622,210
Notes:
| • | | Total direct compensationis the total compensation awarded to the named executives, as reported in the summary compensation table in prior years. |
In years where there weremore than five named executives, we used the following to calculate total direct compensation in the table above:
2018: Keith Creel, Nadeem Velani, Robert Johnson, Laird Pitz and John Brooks
2017: Keith Creel, Nadeem Velani, Robert Johnson, Laird Pitz and Jeffrey Ellis
2016: Hunter Harrison, Nadeem Velani, Keith Creel, Robert Johnson and Laird Pitz
2015: Hunter Harrison, Mark Erceg, Keith Creel, Laird Pitz and Mark Wallace
2014: Hunter Harrison, Bart Demosky, Keith Creel, Robert Johnson and Anthony Marquis
Mr. Harrison was, and Mr. Creel, Mr. Johnson, Mr. Brooks and Mr. Pitz are, paid in U.S. dollars and their amounts have been converted using the following average exchange rates: $1.2957 for 2018, $1.2986 for 2017, $1.3248 for 2016, $1.2787 for 2015 and $1.1045 for 2014
39
EXECUTIVE COMPENSATION DETAILS
Summary compensation table
The table below shows compensation for our five named executives for the three fiscal years ended December 31, 2018.
For all the named executives except Mr. Velani, their compensation has been converted to Canadian dollars using the average exchange rates for the year: $1.2957 for 2018, $1.2986 for 2017 and $1.3248 for 2016.
| | | | | | | | | | | | | | | | | | | | | | | | | | | | | | | | | | | | |
| | | | | | | | | | | | | | | Non-equity Incentive
plan compensation
($) | | | | | | | | | | |
Name and principal position | | Year | | | Salary ($) | | | Share-based
awards ($) | | | Option-based
awards ($) | | | Annual
incentive
plans | | | Long-term
incentive
plans | | | Pension
values
($) | | | All other
compensation
($) | | | Total
compensation
($) | |
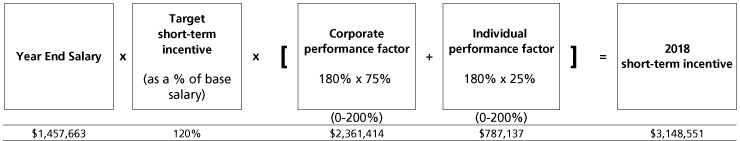
Keith E. Creel | | | 2018 | | | | 1,453,595 | | | | 4,369,757 | | | | 2,519,163 | | | | 3,148,551 | | | | - | | | | 452,209 | | | | 543,332 | | | | 12,486,607 | |
President and Chief | | | 2017 | | | | 1,436,594 | | | | 4,407,788 | | | | 10,516,630 | | | | 2,419,292 | | | | - | | | | 398,894 | | | | 926,402 | | | | 20,105,600 | |
Executive Officer | | | 2016 | | | | 1,261,123 | | | | 2,403,912 | | | | 2,131,126 | | | | 1,900,765 | | | | - | | | | 348,529 | | | | 833,257 | | | | 8,878,712 | |
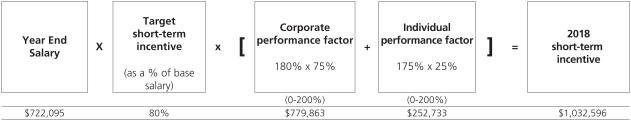
Nadeem S. Velani | | | 2018 | | | | 666,946 | | | | 1,199,385 | | | | 688,327 | | | | 1,032,596 | | | | - | | | | 138,925 | | | | 57,680 | | | | 3,783,859 | |
Executive Vice-President | | | 2017 | | | | 451,355 | | | | 806,073 | | | | 202,650 | | | | 490,763 | | | | - | | | | 101,027 | | | | 49,523 | | | | 2,101,391 | |
and Chief Financial Officer | | | 2016 | | | | 298,838 | | | | 131,634 | | | | 105,305 | | | | 373,500 | | | | - | | | | 49,682 | | | | 42,015 | | | | 1,000,974 | |
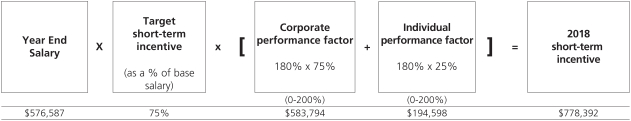
Robert A. Johnson | | | 2018 | | | | 572,808 | | | | 950,363 | | | | 547,936 | | | | 778,392 | | | | - | | | | 105,825 | | | | 63,858 | | | | 3,019,182 | |
Executive Vice-President, | | | 2017 | | | | 564,891 | | | | 958,705 | | | | 556,073 | | | | 597,372 | | | | - | | | | 114,037 | | | | 54,819 | | | | 2,845,897 | |
Operations | | | 2016 | | | | 532,056 | | | | 358,674 | | | | 317,991 | | | | 648,324 | | | | - | | | | 86,189 | | | | 54,931 | | | | 1,998,165 | |
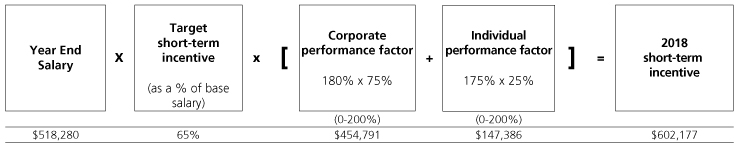
John K. Brooks | | | 2018 | | | | 499,384 | | | | 424,798 | | | | 244,922 | | | | 602,177 | | | | - | | | | 166,898 | | | | 61,456 | | | | 1,999,635 | |
Senior Vice-President and | | | 2017 | | | | 436,359 | | | | 428,442 | | | | 125,582 | | | | 420,251 | | | | - | | | | 144,378 | | | | 59,567 | | | | 1,614,579 | |
Chief Marketing Officer | | | 2016 | | | | 344,448 | | | | 188,819 | | | | 100,674 | | | | 310,003 | | | | - | | | | 93,143 | | | | 36,365 | | | | 1,073,452 | |
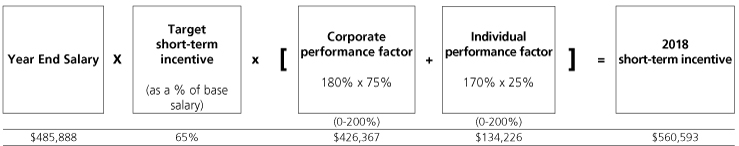
Laird J. Pitz | | | 2018 | | | | 482,486 | | | | 444,139 | | | | 256,132 | | | | 560,593 | | | | - | | | | 87,126 | | | | 42,346 | | | | 1,872,822 | |
Senior Vice-President | | | 2017 | | | | 457,901 | | | | 394,237 | | | | 228,694 | | | | 435,601 | | | | - | | | | 82,361 | | | | 41,137 | | | | 1,639,931 | |
and Chief Risk Officer | | | 2016 | | | | 437,720 | | | | 397,394 | | | | 279,071 | | | | 417,312 | | | | - | | | | 74,178 | | | | 41,203 | | | | 1,646,878 | |
Notes:
Salary
Salary earned during the year. Salary differs from annualized salary because annual increases generally go into effect on April 1. Mr. Velani’s salary is set in U.S. dollars and was paid based on a foreign exchange rate of $1.2959.
Share-based awards
PSUs were granted on February 15, 2018. The 2018 grant date accounting fair value of the awards shown in the summary compensation table is $230.12 per share granted on the TSX or $184.29 per share granted on the NYSE under the symbol "CP". The tables below present, for the quarters indicated, information on the dividends declared and the high and low share price of CP's Common Shares. The decision to declare any future cash dividend, including the amount of any such dividend and the establishment of record and payment dates, will be determined, in each quarter, by the Company's Board of Directors, in its sole discretion.
The following table indicates share data of CP's Common Shares listed on the TSX (in Canadian dollars):
|
| | | | | | |
| | | Q1 | Q2 | Q3 | Q4 | YTD |
| 2016 | Dividends | $0.3500 | $0.5000 | $0.5000 | $0.5000 | $1.8500 |
| | Common Share Price | | | | | |
| | High | $178.83 | $193.88 | $203.29 | $209.12 | $209.12 |
| | Low | $140.02 | $156.01 | $165.65 | $186.21 | $140.02 |
| | | | | | | |
| 2015 | Dividends | $0.3500 | $0.3500 | $0.3500 | $0.3500 | $1.4000 |
| | Common Share Price | | | | | |
| | High | $245.05 | $241.73 | $212.06 | $204.40 | $245.05 |
| | Low | $205.95 | $195.69 | $172.01 | $168.12 | $168.12 |
The following table indicates share data of CP's Common Shares listed on the NYSE (in U.S. dollars):
|
| | | | | | |
| | | Q1 | Q2 | Q3 | Q4 | YTD |
| 2016 | Dividends | $0.2670 | $0.3900 | $0.3790 | $0.3680 | $1.4040 |
| | Common Share Price | | | | | |
| | High | $135.77 | $151.38 | $157.34 | $156.71 | $157.34 |
| | Low | $97.09 | $119.50 | $127.02 | $139.29 | $97.09 |
| | | | | | | |
| 2015 | Dividends | $0.2800 | $0.2840 | $0.2640 | $0.2520 | $1.0800 |
| | Common Share Price | | | | | |
| | High | $194.66 | $198.44 | $163.39 | $157.82 | $198.44 |
| | Low | $173.69 | $158.04 | $129.83 | $122.27 | $122.27 |
Share Capital
At February 14, 2017, the latest practicable date, there were 146,366,093 Common Shares and no preferred shares issued and outstanding, which consists of 14,931 holders of record of the Company's Common Shares. In addition, CP has a Managementaccordance with FASB ASC Topic 718: Compensation – Stock Option Incentive Plan (“MSOIP”), under which key officers and employees are granted options to purchase CP Common Shares. Each option granted can be exercised for one Common Share. At February 14, 2017, 2.0 million options were outstanding under the Company’s MSOIP and stand-alone option agreements entered into with Mr. Keith Creel and former CEO, Mr. E. Hunter Harrison. There are 1.5 million options available to be issued by the Company’s MSOIP in the future.
CP has a Director's Stock Option Plan (“DSOP”), under which directors are granted options to purchase CP Common Shares. There are no outstanding options under the DSOP, which has 0.3 million options available to be issued in the future.
Securities Authorized for Issuance Under Equity Compensation Plans
For further details, refer toCompensation. See Item 12. Security Ownership of Certain Beneficial Owners and Management and Related Stockholder Matters for information about securities authorized for issuance under our equity compensation plan.
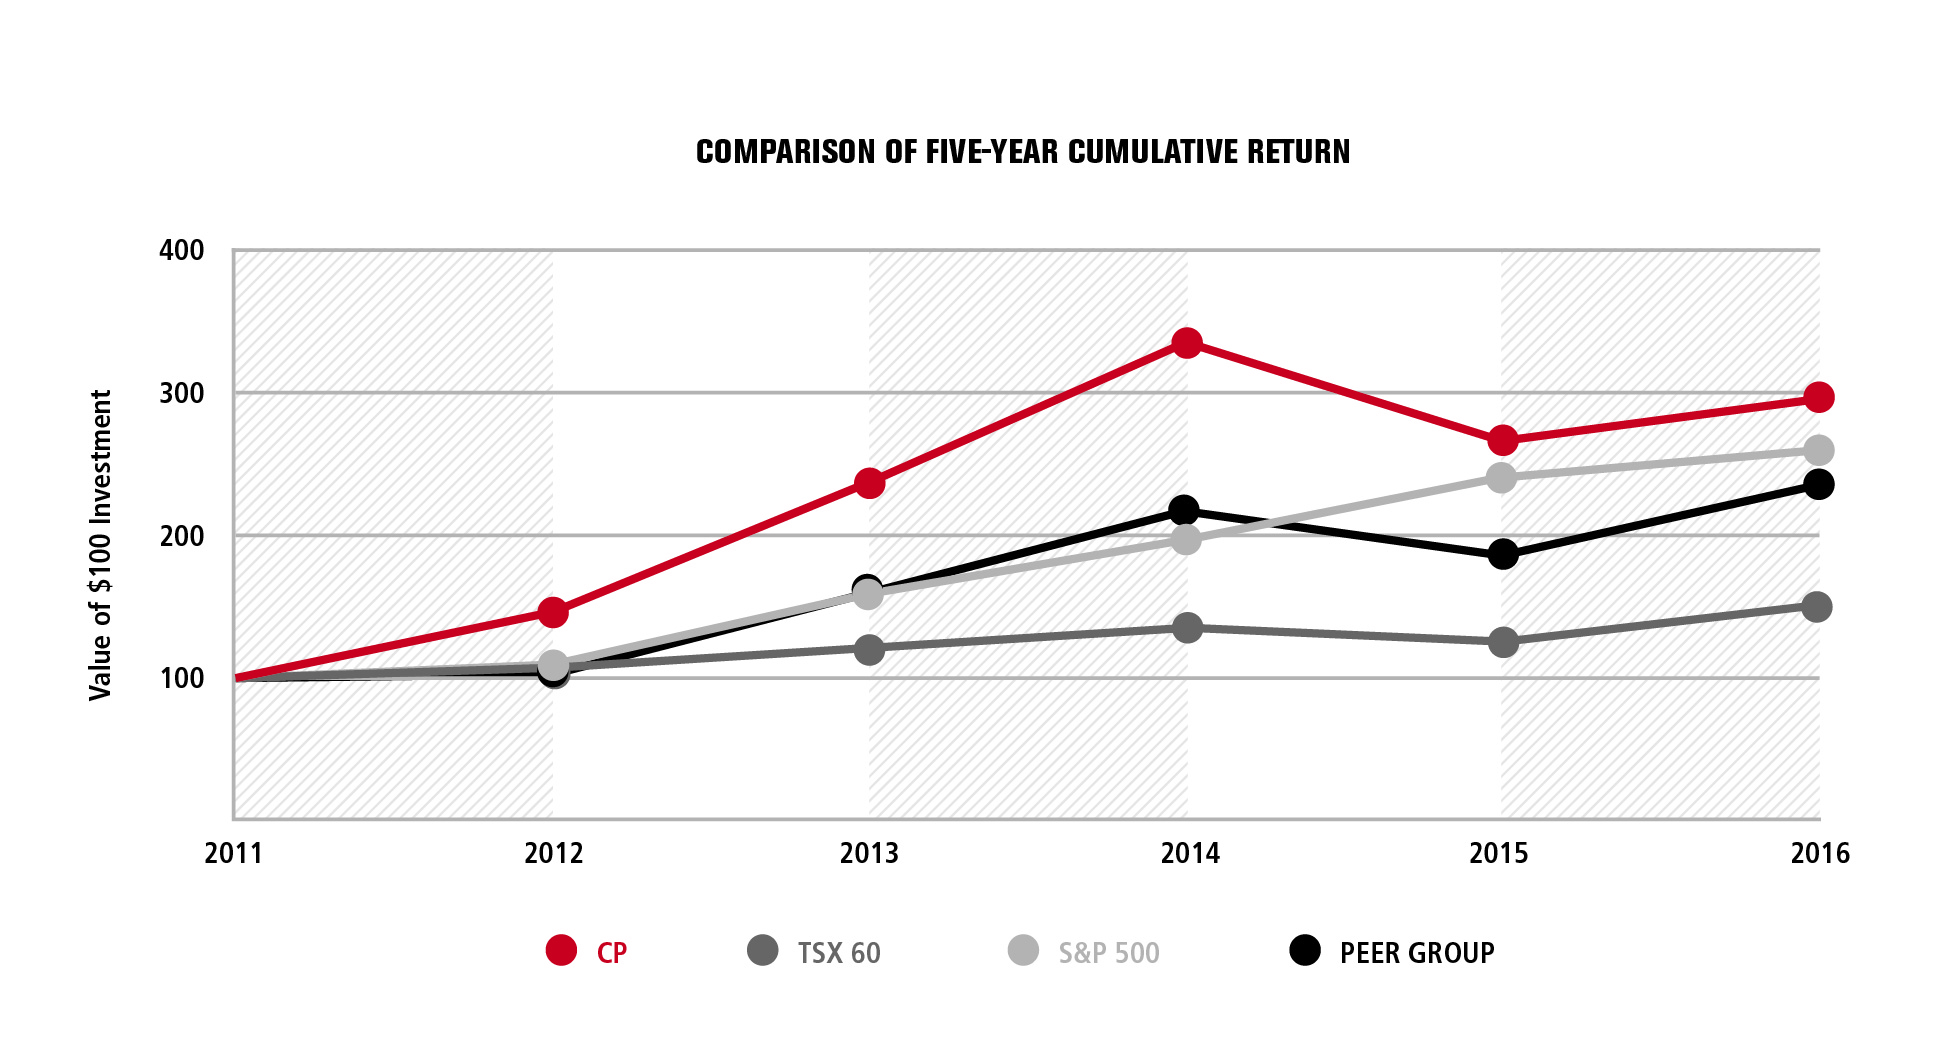
Stock Performance Graph
The following graph provides an indicator of cumulative total shareholder return on the Company’s Common Shares, of an assumed investment of $100, as compared to the TSX 60 Index (“TSX 60”), the Standard & Poor's 500 Stock Index (“S&P 500”), and the peer group index (comprising CN, KCS, UP, NS and CSX) on December 31 for each of the years indicated. The values for the assumed investments depicted on the graph and in the table have been calculated assuming that any dividends are reinvested.
Issuer Purchase of Equity Securities
During 2016, CP repurchased 6.9 million Common Shares for $1,210 million at an average price of $175.08. There were no Common Shares repurchased during each of the months for the fourth quarter of 2016.
For further details, refer to the Share repurchase section in Item 8.8, Financial Statements and Supplementary Data, Note 19 Shareholders' Equity.
ITEM 6. SELECTED FINANCIAL DATA
22: Stock-based compensation in our annual report on Form10-K filed with the SEC on February 15, 2019 for more details.To calculate the number of PSUs granted to a named executive, we use the Willis Towers Watson expected life binomial methodology. Using this methodology, the grant date expected fair value was $186.40 on the TSX and US$149.27 on the NYSE. The following table presents as of, andWillis Towers Watson expected life binomial methodology for the years ended, December 31, selected financial data related toPSUs are calculated based on the Company’s financial results for the last five fiscal years. The selected financial data should be read in conjunction with Item 7. Management’s Discussion and Analysis of Financial Condition and Results of Operations and Item 8. Financial Statements and Supplementary Data.
|
| | | | | | | | | | | | | | | |
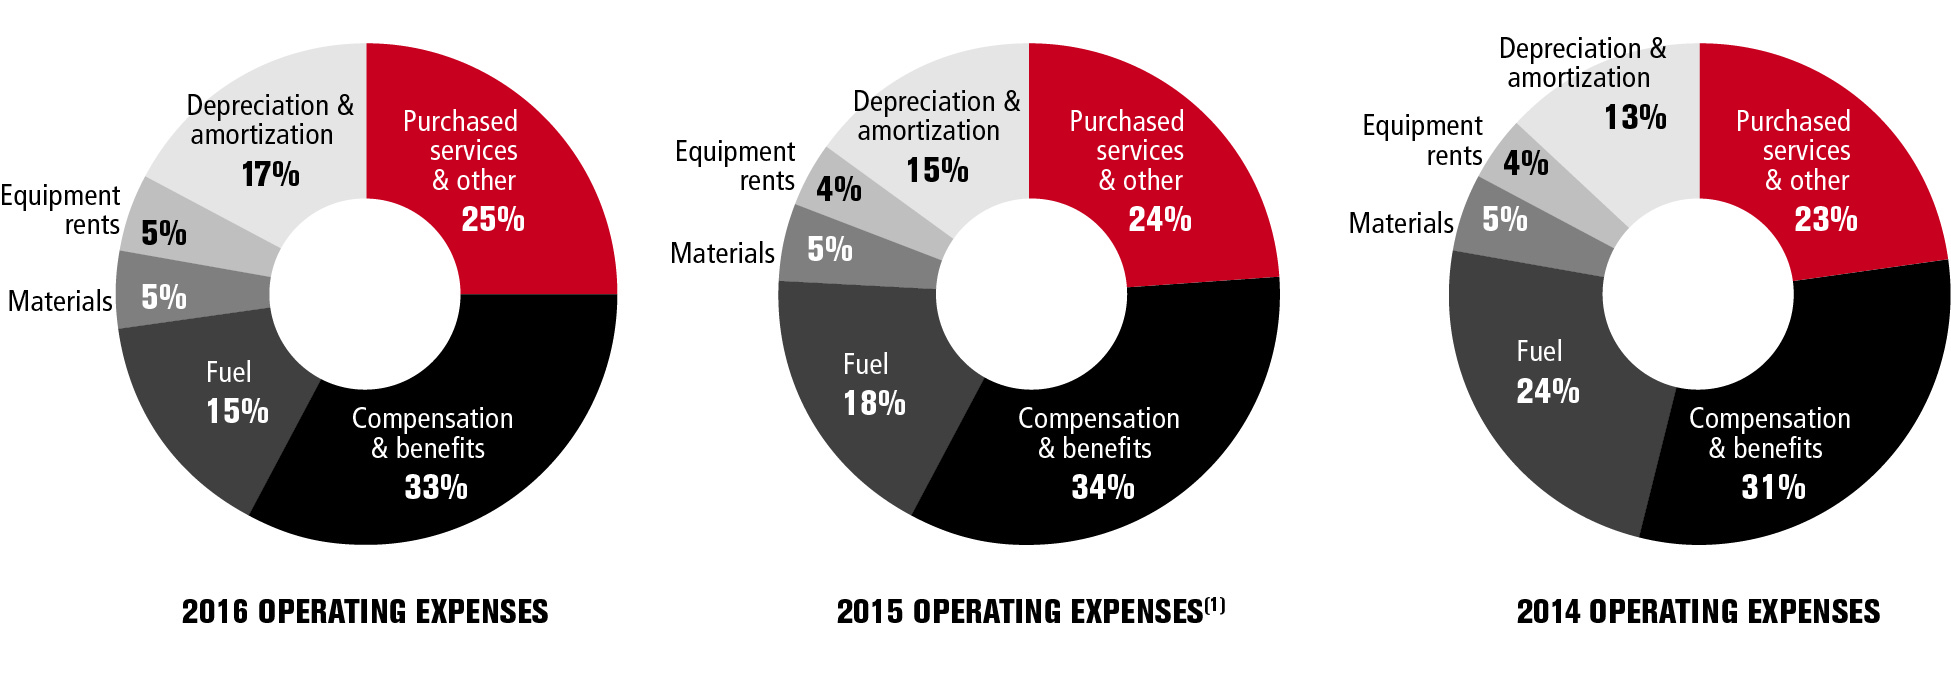
| (in millions, except per share data, percentage and ratios) | 2016 |
| 2015 |
| 2014 |
| 2013 |
| 2012 |
|
| Financial Performance |
|
|
|
|
|
| Revenues | $ | 6,232 |
| $ | 6,712 |
| $ | 6,620 |
| $ | 6,133 |
| $ | 5,695 |
|
| Operating income | 2,578 |
| 2,688 |
| 2,339 |
| 1,420 |
| 949 |
|
Adjusted operating income(1) | 2,578 |
| 2,620 |
| 2,335 |
| 1,844 |
| 1,309 |
|
| Net income | 1,599 |
| 1,352 |
| 1,476 |
| 875 |
| 484 |
|
Adjusted income(1) | 1,549 |
| 1,625 |
| 1,482 |
| 1,132 |
| 753 |
|
| Basic earnings per share ("EPS") | 10.69 |
| 8.47 |
| 8.54 |
| 5.00 |
| 2.82 |
|
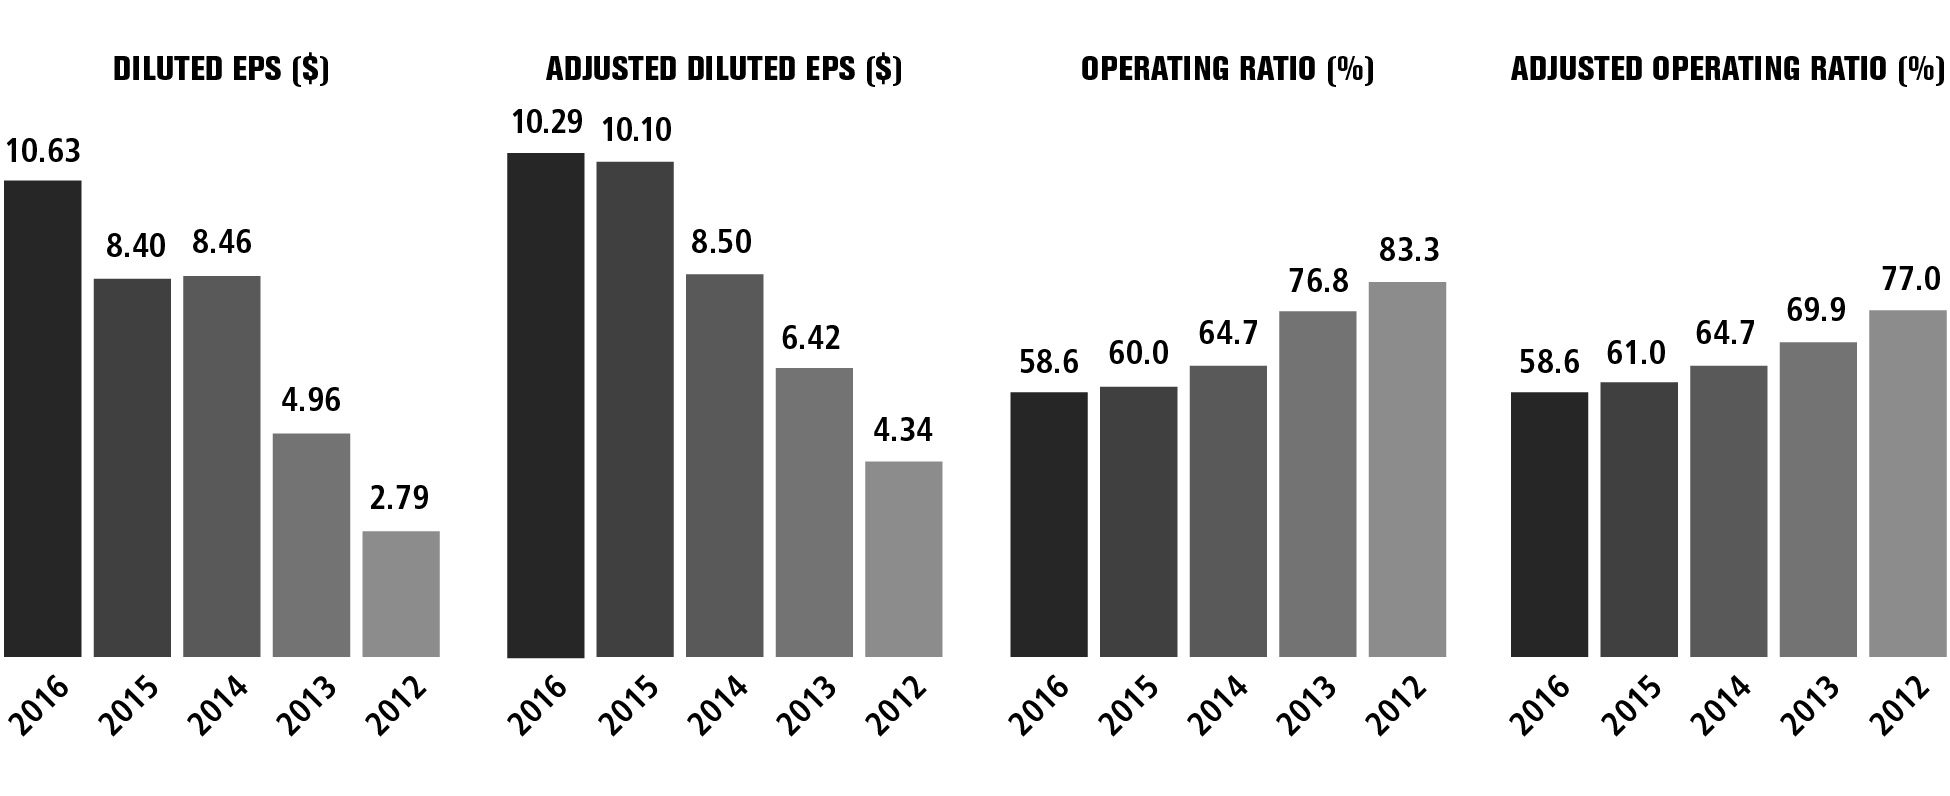
| Diluted EPS | 10.63 |
| 8.40 |
| 8.46 |
| 4.96 |
| 2.79 |
|
Adjusted diluted EPS(1) | 10.29 |
| 10.10 |
| 8.50 |
| 6.42 |
| 4.34 |
|
| Dividends declared per share | 1.8500 |
| 1.4000 |
| 1.4000 |
| 1.4000 |
| 1.3500 |
|
| Financial Position |
|
|
|
|
|
| Total assets | $ | 19,221 |
| $ | 19,637 |
| $ | 16,550 |
| $ | 16,680 |
| $ | 14,433 |
|
Total long-term obligations(2) | 8,737 |
| 9,012 |
| 5,712 |
| 4,747 |
| 4,696 |
|
| Shareholders’ equity | 4,626 |
| 4,796 |
| 5,610 |
| 7,097 |
| 5,097 |
|
| Cash provided by operating activities | 2,089 |
| 2,459 |
| 2,123 |
| 1,950 |
| 1,328 |
|
Free cash(1) | 1,007 |
| 1,381 |
| 969 |
| 774 |
| 316 |
|
| Financial Ratios |
|
|
|
|
|
Return on invested capital (“ROIC”)(1) | 14.4 | % | 12.9 | % | 14.4 | % | 10.1 | % | 7.3 | % |
Adjusted ROIC(1) | 14.0 | % | 15.2 | % | 14.5 | % | 12.3 | % | 10.0 | % |
Operating ratio(3) | 58.6 | % | 60.0 | % | 64.7 | % | 76.8 | % | 83.3 | % |
Adjusted operating ratio(1) | 58.6 | % | 61.0 | % | 64.7 | % | 69.9 | % | 77.0 | % |
following assumptions: | | |
(1)
Assumptions | These measures have no standardized meanings prescribed by accounting principles generally accepted in the United States of America ("GAAP") and, therefore may not be comparable to similar measures presented by other companies. These measures are defined and reconciled in Non-GAAP Measures in Item 7. Management’s Discussion and Analysis of Financial Condition and Results of Operations. |
| |
(2)
| Excludes deferred income taxes of $3,571 million, $3,391 million, $2,717 million, $2,559 million and $1,838 million, and other non-financial deferred liabilities of $940 million, $991 million, $1,100 million, $898 million and $1,574 million at December 31, 2016, 2015, 2014, 2013 and 2012 respectively. |
| |
(3)
| Operating ratio is defined as operating expenses divided by revenues. |
ITEM 7. MANAGEMENT'S DISCUSSION AND ANALYSIS OF FINANCIAL CONDITION AND RESULTS OF OPERATIONS
INDEX TO MANAGEMENT'S DISCUSSION AND ANALYSIS
|
| Willis Towers Watson expected life binomial valuation |
| | PageTSX / NYSE |
Executive SummaryTerm | | 3 years |
2017 OutlookVesting Schedule | | 3 year cliff |
Performance IndicatorsPayout Range % (threshold-target-max) | | 50-100-200 |
ResultsRisk of OperationsForfeiture | | 5% |
ImpactPSU Value (as a % of Foreign Exchange on Earningsgrant price) | |
Impact of Fuel Price on Earnings | |
Impact of Share Price on Earnings | |
Operating Revenues | |
Operating Expenses | |
Other Income Statement Items | |
Liquidity and Capital Resources | |
Non-GAAP Measures | |
Off-Balance Sheet Arrangements | |
Critical Accounting Estimates | |
Forward-Looking Information | 81% |
40
Option awards
Stock options were granted on January 22, 2018. The following discussion and analysis should be readgrant date fair value of stock option awards granted to each named executive has been calculated in conjunctionaccordance with FASB ASC Topic 718: Compensation—Stock Compensation. We used the Company’s Consolidated Financial Statements andBlack-Scholes option-pricing model (with reference to the related notesshares underlying the options). The grant date accounting fair value of the awards shown in the summary compensation table is $51.91 per share granted on the TSX or $45.06 per share granted on the NYSE.See Incentive plan awardson page 22 for details about the 2018 awards. See Item 8.8, Financial Statements and Supplementary Data, Note 22: Stock-based compensation in our annual report on Form10-K filed with the SEC on February 15, 2019 for more details.
To calculate the number of options that an executive receives, we use Willis Towers Watson’s expected life binomial methodology which is fundamentally similar to the methodology used to determine the accounting fair value; however, some of the underlying assumptions are different. For example, the binomial methodology assumes a slightly lower historical volatility, a higher risk-free rate and includes a discount to account for vesting restrictions.
The grant price on January 22, 2018 was $231.66 on the TSX with an underlying value of $48.65 and was US$185.85 on the NYSE with an underlying value of US$42.75. The Willis Towers Watson expected life binomial methodology for the stock options are calculated based on the following assumptions:
| | | | | | | | | | |
| Assumptions | | Willis Towers Watson expected life binomial valuation | | | |
| | | NYSE | | | TSX | | | |
Option Term | | | 7 years | | | | 7 years | | | |
Vesting Schedule | | | 4 year pro-rated | | | | 4 year pro-rated | | | |
Expected Life | | | 4.75 years | | | | 4.75 years | | | |
Dividend Yield (1-year historical) | | | 1.00% | | | | 0.99% | | | |
Volatility (3-year daily) | | | 24.0% | | | | 21.7% | | | |
Risk-free Rate (yield curve) | | | 2.5 - 3.1% | | | | 2.0 - 2.5% | | | |
Risk of Forfeiture | | | 5% | | | | 5% | | | |
Stock Option Value (as a % of grant price) | | | 23% | | | | 21% | | | |
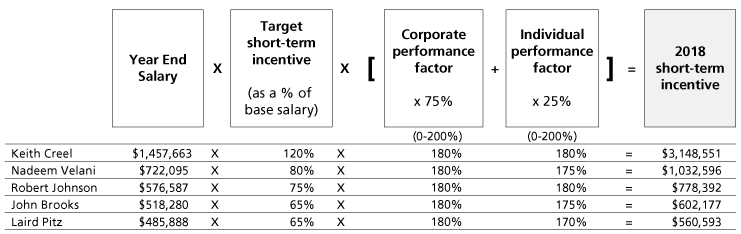
Non-equity incentive plan compensation
Cash bonus earned under our short-term incentive plan for 2018 and paid in February 2019. In respect of their short-term incentive compensation, Mr. Velani and Mr. Brooks elected to receive part of their 2018 bonus in DSUs once the bonus is paid out.
Pension value
Mr. Creel and Mr. Velani participate in the Canadian defined contribution plan and in the defined contribution supplemental plan.
Mr. Creel, Mr. Johnson and Mr. Pitz participate in the U.S. defined contribution plan and the U.S. supplemental executive retirement plan.
Mr. Brooks participates in the CP pension plan for U.S. Management Employees
SeeRetirement planson page 47 for more details.
41
All other compensation
The named executives also receive certain benefits and perquisites which are competitive with our comparator group. The table below shows the breakdown of all other compensation for 2018. The values in the table have been converted to Canadian dollars using the 2018 average exchange rate of $1.2957.
| | | | | | | | | | | | | | | | | | | | | | | | | | | | | | | | | | | | |
| | | Perquisites | | | Other
compensation | | | | |
| Name | | Personal
use of
company
aircraft | | | Auto
benefits | | | Housing
allowance | | | Financial
and tax
planning | | | Additional
medical | | | Club
benefits | | | 401K
match | | | Employer
share
purchase
plan
match | | | Total | |
Keith Creel | | | 411,562 | | | | 28,992 | | | | 18,443 | | | | 32,393 | | | | 1,322 | | | | 14,761 | | | | 6,997 | | | | 28,862 | | | | 543,332 | |
Nadeem Velani | | | - | | | | 31,226 | | | | - | | | | - | | | | 2,048 | | | | 11,200 | | | | - | | | | 13,206 | | | | 57,680 | |
Robert Johnson | | | - | | | | 27,997 | | | | - | | | | - | | | | 867 | | | | 14,512 | | | | 9,140 | | | | 11,342 | | | | 63,858 | |
John Brooks | | | - | | | | 26,949 | | | | - | | | | - | | | | 1,042 | | | | 14,512 | | | | 9,151 | | | | 9,802 | | | | 61,456 | |
Laird Pitz | | | - | | | | 19,256 | | | | - | | | | - | | | | - | | | | 14,512 | | | | 8,578 | | | | - | | | | 42,346 | |
Notes:
| | |
| Use of company aircraft | | The value is calculated by multiplying the variable cost per air hour by the number of hours used for travel and includes costs for fuel, maintenance, landing fees and other miscellaneous costs. As an executive of a Calgary-based company, enabling the CEO to visit his family in the Eastern and Southern United States is an important retention tool.Non-corporate use of the corporate jet has been limited to family visits and limited to the CEO only. |
| Auto benefits | | Includes a company-leased vehicle and reimbursement of related operating costs as well as taxable reimbursement of auto benefits for eligible vehicles. |
Housing allowance | | The incremental cost to provide reasonable accommodation for Mr. Creel in Calgary. |
Financial and tax planning | | For Mr. Creel, financial and tax planning services according to his current contract. |
Additional Medical | | CP encourages executives to participate in the executive medical program. Under the U.S. medical benefit plan, available to all U.S. employees, the majority of the cost of a medical examination is covered by the plan. Only additional services for the executive medical are paid for by CP. In Canada, executive medicals are not covered under any general benefit plan. |
Club memberships | | Included in the perquisites program available to all senior executives. |
| 401K plan | | Mr. Creel, Mr. Johnson, Mr. Brooks and Mr. Pitz also receive matching contributions to the 401k plan. |
| ESPP match | | Includes company contributions to the employee share purchase plan (ESPP). The named executives participate in the ESPP on the same terms and using the same formulas as for other participants. See page 46 to read more about the ESPP. |
Employment agreements
Except for Mr. Creel, employment agreements for executive officers are set out in a standard offer letter template. The letters contain the standard terms as described in the CD&A and include an annual salary, participation in the short- and long-term incentive plans as approved annually by the Compensation Committee, participation in the benefit plans or programs generally available to management employees, and modest perquisites.
As of the publication of this proxy circular, all of our NEOs, have atwo-yearnon-compete,non-solicitation agreement tied to their CP employment.
Mr. Creel’s employment agreement includes:
reasonable living accommodation in Calgary
use of the corporate jet for business commuting and family visits within North America
non-disclosure,non-solicitation covenants
severance provisions as described on page 49
reimbursement for club memberships of up to US$25,000 annually
reimbursement for financial services of up to US$25,000 annually
42
Incentive plan awards
Outstanding share-based awards and option-based awards
The table below shows all vested and unvested equity incentive awards that were outstanding as of December 31, 2018. SeeLong-term incentivesbeginning on page 19 for more information about our stock option and share-based awards.
| | | | | | | | | | | | | | | | | | | | | | | | | | | | | | | | | | |
| | | | | | Option-based awards | | | | | Share-based awards | |
| Name | | Grant date | | | Number of
securities
underlying
unexercised
options (#) | | | Option
exercise
price ($) | | | Option expiration
date | | | Value of
unexercised
in-the-money
options ($) | | | Grant
type | | Number of
shares or units
of shares that
have not
vested (#) | | | Market or
payout value of
share-based
awards that
have not vested ($) | | | Market or payout
value of vested
share-based
awards not paid
out or distributed ($) | |
Keith Creel | | | 4-Feb-2013 | | | | 59,325 | | | | 115.78 | | | | 4-Feb-2023 | | | | 7,502,240 | | | | | | | | | | | | | | | |
| | | 22-Feb-2013 | | | | 53,350 | | | | 119.18 | | | | 22-Feb-2023 | | | | 6,565,251 | | | | | | | | | | | | | | | |
| | | 31-Jan-2014 | | | | 39,900 | | | | 168.84 | | | | 31-Jan-2024 | | | | 2,928,660 | | | | | | | | | | | | | | | |
| | | 24-Jul-2014 | | | | 47,940 | | | | 210.32 | | | | 24-Jul-2024 | | | | 1,530,245 | | | | | | | | | | | | | | | |
| | | 23-Jan-2015 | | | | 33,910 | | | | 175.92 | | | | 23-Jan-2025 | | | | 78,642 | | | | | | | | | | | | | | | |
| | | 22-Jan-2016 | | | | 55,250 | | | | 116.80 | | | | 22-Jan-2026 | | | | 4,584,128 | | | | | | | | | | | | | | | |
| | | 20-Jan-2017 | | | | 33,884 | | | | 150.99 | | | | 20-Jan-2024 | | | | 1,230,960 | | | | | | | | | | | | | | | |
| | | 1-Feb-2017 | | | | 18,762 | | | | 151.14 | | | | 1-Feb-2024 | | | | 677,759 | | | | | | | | | | | | | | | |
| | | 1-Feb-2017 | | | | 177,225 | | | | 151.14 | | | | 1-Feb-2024 | | | | 6,402,079 | | | | | | | | | | | | | | | |
| | | 22-Jan-2018 | | | | 43,148 | | | | 185.85 | | | | 22-Jan-2025 | | | | - | | | | | | | | | | | | | | | |
| | | 6-Feb-2013 | | | | | | | | | | | | | | | | | | | DSU | | | | | | | | | | | 7,639,983 | |
| | | 23-Feb-2016 | | | | | | | | | | | | | | | | | | | PSU | | | | | | | | | | | 7,171,365 | |
| | | 21-Feb-2017 | | | | | | | | | | | | | | | | | | | PSU | | | 22,691 | | | | 5,498,153 | | | | | |
| | | 15-Feb-2018 | | | | | | | | | | | | | | | | | | | PSU | | | 18,437 | | | | 4,467,496 | | | | | |
Total | | | | | | | 562,694 | | | | | | | | | | | | 31,499,964 | | | | | | 41,128 | | | | 9,965,649 | | | | 14,811,348 | |
Nadeem Velani | | | 2-Apr-2013 | | | | 2,310 | | | | 126.34 | | | | 2-Apr-2023 | | | | 267,729 | | | | | | | | | | | | | | | |
| | | 31-Jan-2014 | | | | 1,820 | | | | 168.84 | | | | 31-Jan-2024 | | | | 133,588 | | | | | | | | | | | | | | | |
| | | 23-Jan-2015 | | | | 1,539 | | | | 218.78 | | | | 23-Jan-2025 | | | | 36,105 | | | | | | | | | | | | | | | |
| | | 22-Jan-2016 | | | | 2,927 | | | | 165.74 | | | | 22-Jan-2026 | | | | 223,916 | | | | | | | | | | | | | | | |
| | | 20-Jan-2017 | | | | 4,644 | | | | 201.49 | | | | 20-Jan-2024 | | | | 189,243 | | | | | | | | | | | | | | | |
| | | 22-Jan-2018 | | | | 13,260 | | | | 231.66 | | | | 22-Jan-2025 | | | | 140,291 | | | | | | | | | | | | | | | |
| | | 26-Feb-2014 | | | | | | | | | | | | | | | | | | | DSU | | | | | | | | | | | 162,106 | |
| | | 19-Feb-2015 | | | | | | | | | | | | | | | | | | | DSU | | | | | | | | | | | 82,016 | |
| | | 24-Feb-2017 | | | | | | | | | | | | | | | | | | | DSU | | | 123 | | | | 29,760 | | | | 119,041 | |
| | | 23-Feb-2016 | | | | | | | | | | | | | | | | | | | PSU | | | | | | | | | | | 369,992 | |
| | | 21-Feb-2017 | | | | | | | | | | | | | | | | | | | PSU | | | 3,973 | | | | 962,328 | | | | | |
| | | 15-Feb-2018 | | | | | | | | | | | | | | | | | | | PSU | | | 5,251 | | | | 1,272,015 | | | | | |
Total | | | | | | | 26,500 | | | | | | | | | | | | 990,872 | | | | | | 9,347 | | | | 2,264,103 | | | | 733,155 | |
Robert Johnson | | | 2-Jul-2013 | | | | 3,640 | | | | 129.54 | | | | 2-Jul-2023 | | | | 410,228 | | | | | | | | | | | | | | | |
| | | 31-Jan-2014 | | | | 5,870 | | | | 168.84 | | | | 31-Jan-2024 | | | | 430,858 | | | | | | | | | | | | | | | |
| | | 23-Jan-2015 | | | | 5,198 | | | | 175.92 | | | | 23-Jan-2025 | | | | 12,055 | | | | | | | | | | | | | | | |
| | | 22-Jan-2016 | | | | 8,244 | | | | 116.80 | | | | 22-Jan-2026 | | | | 684,010 | | | | | | | | | | | | | | | |
| | | 20-Jan-2017 | | | | 11,557 | | | | 150.99 | | | | 20-Jan-2024 | | | | 419,850 | | | | | | | | | | | | | | | |
| | | 22-Jan-2018 | | | | 9,385 | | | | 185.85 | | | | 22-Jan-2025 | | | | - | | | | | | | | | | | | | | | |
| | | 24-Jun-2013 | | | | | | | | | | | | | | | | | | | DSU | | | | | | | | | | | 1,361,630 | |
| | | 27-Feb-2018 | | | | | | | | | | | | | | | | | | | DSU | | | 160 | | | | 38,713 | | | | 154,852 | |
| | | 23-Feb-2016 | | | | | | | | | | | | | | | | | | | PSU | | | | | | | | | | | 1,070,185 | |
| | | 21-Feb-2017 | | | | | | | | | | | | | | | | | | | PSU | | | 4,935 | | | | 1,195,862 | | | | | |
| | | 15-Feb-2018 | | | | | | | | | | | | | | | | | | | PSU | | | 4,010 | | | | 971,619 | | | | | |
Total | | | | | | | 43,894 | | | | | | | | | | | | 1,957,001 | | | | | | 9,105 | | | | 2,206,194 | | | | 2,586,667 | |
John Brooks | | | 25-Feb-2010 | | | | 900 | | | | 51.17 | | | | 25-Feb-2020 | | | | 171,963 | | | | | | | | | | | | | | | |
| | | 24-Feb-2011 | | | | 3,200 | | | | 65.06 | | | | 24-Feb-2021 | | | | 566,976 | | | | | | | | | | | | | | | |
| | | 1-Apr-2012 | | | | 2,850 | | | | 75.71 | | | | 1-Apr-2022 | | | | 474,611 | | | | | | | | | | | | | | | |
| | | 7-Dec-2012 | | | | 2,345 | | | | 97.70 | | | | 7-Dec-2022 | | | | 338,946 | | | | | | | | | | | | | | | |
| | | 22-Feb-2013 | | | | 1,900 | | | | 119.18 | | | | 22-Feb-2023 | | | | 233,814 | | | | | | | | | | | | | | | |
| | | 31-Jan-2014 | | | | 1,440 | | | | 168.84 | | | | 31-Jan-2024 | | | | 105,696 | | | | | | | | | | | | | | | |
| | | 23-Jan-2015 | | | | 2,506 | | | | 175.92 | | | | 23-Jan-2025 | | | | 5,812 | | | | | | | | | | | | | | | |
| | | 22-Jan-2016 | | | | 4,340 | | | | 116.80 | | | | 22-Jan-2026 | | | | 360,093 | | | | | | | | | | | | | | | |
| | | 20-Jan-2017 | | | | 2,610 | | | | 150.99 | | | | 20-Jan-2024 | | | | 94,818 | | | | | | | | | | | | | | | |
| | | 22-Jan-2018 | | | | 4,195 | | | | 185.85 | | | | 22-Jan-2025 | | | | - | | | | | | | | | | | | | | | |
| | | 6-Sep-2012 | | | | | | | | | | | | | | | | | | | DSU | | | | | | | | | | | 242,014 | |
| | | 23-Feb-2016 | | | | | | | | | | | | | | | | | | | PSU | | | | | | | | | | | 563,488 | |
| | | 21-Feb-2017 | | | | | | | | | | | | | | | | | | | PSU | | | 2,206 | | | | 534,426 | | | | | |
| | | 15-Feb-2018 | | | | | | | | | | | | | | | | | | | PSU | | | 1,792 | | | | 434,299 | | | | | |
| | | | | | | | 26,286 | | | | | | | | | | | | 2,352,729 | | | | | | 3,998 | | | | 968,725 | | | | 805,502 | |
43
| | | | | | | | | | | | | | | | | | | | | | | | | | | | | | | | | | |
| | | | | | Option-based awards | | | | | Share-based awards | |
| Name | | Grant date | | | Number of
securities
underlying
unexercised
options (#) | | | Option
exercise
price ($) | | | Option expiration
date | | | Value of
unexercised
in-the-money
options ($) | | | Grant
type | | Number of
shares or units
of shares that
have not
vested (#) | | | Market or
payout value of
share-based
awards that
have not vested ($) | | | Market or payout
value of vested
share-based
awards not paid
out or distributed ($) | |
Laird Pitz | | | 23-Jan-2015 | | | | 4,584 | | | | 175.92 | | | | 23-Jan-2025 | | | | 10,631 | | | | | | | | | | | | | | | |
| | | 22-Jan-2016 | | | | 5,426 | | | | 116.80 | | | | 22-Jan-2026 | | | | 450,199 | | | | | | | | | | | | | | | |
| | | 20-Jan-2017 | | | | 4,753 | | | | 150.99 | | | | 20-Jan-2024 | | | | 172,670 | | | | | | | | | | | | | | | |
| | | 22-Jan-2018 | | | | 4,387 | | | | 185.85 | | | | 22-Jan-2025 | | | | - | | | | | | | | | | | | | | | |
| | | 19-Feb-2015 | | | | | | | | | | | | | | | | | | | DSU | | | | | | | | | | | 428,961 | |
| | | 23-Feb-2016 | | | | | | | | | | | | | | | | | | | DSU | | | 524 | | | | 126,954 | | | | 507,817 | |
| | | 23-Feb-2016 | | | | | | | | | | | | | | | | | | | PSU | | | | | | | | | | | 938,983 | |
| | | 21-Feb-2017 | | | | | | | | | | | | | | | | | | | PSU | | | 2,029 | | | | 491,761 | | | | | |
| | | 15-Feb-2018 | | | | | | | | | | | | | | | | | | | PSU | | | 1,874 | | | | 454,073 | | | | | |
Total | | | | | | | 19,150 | | | | | | | | | | | | 633,500 | | | | | | 4,427 | | | | 1,072,788 | | | | 1,875,761 | |
Notes:
Options
In general, regular options granted before 2017 vest 25% each year for four years beginning on the anniversary of the grant date and expire 10 years from the grant date. Grants made in this report. Except where otherwise indicated, all financial information reflected herein is expressed2017 and onwards expire 7 years from the grant date.
All exercise prices for grants received prior to 2015 are shown in Canadian dollars.
Executive Summary
2016 Results
With respect to Mr. Creel, Mr. Johnson, Mr. Brooks and Mr. Pitz, exercise prices for option awards that were granted in 2015 or later are shown in U.S. dollars. Prior to 2015, all exercise prices are in Canadian dollars and all of Mr. Velani’s exercise prices are shown in Canadian dollars.Value of unexercisedFinancialin-the-money options at 2018year-end
Based on $242.24, our closing share price on the TSX on December 31, 2018. For all the named executives, except Mr. Velani, option awards made in 2015 or later have been valued based on US$177.62, our closing share price on the NYSE on December 31, 2018 and converted into Canadian dollars using ayear-end exchange rate of $1.3642.
Mr. Creel was awarded performance – In 2016,stock options on July 24, 2014. These options vested upon meeting certain performance hurdles: 50% of the options vested upon CP reported Diluted EPS of $10.63 while Adjusted diluted EPS climbed to a record $10.29, a 2% improvement compared to the Adjusted diluted EPS of $10.10 in 2015. CP’s commitment to operational efficiency produced a best-ever full-yearachieving an annual operating ratio of 58.6%63%, beatingand the previous record set in 2015, despite a 7% decrease in revenue associated with challenging economic conditions. Adjusted diluted EPS is defined and reconciled in Non-GAAP Measures and discussed further in Resultsother 50% vested upon CP achieving an annual operating income of Operations of this Item 7. Management’s Discussion and Analysis of Financial Condition and Results of Operations.
Free cash – In 2016, CP generated Free cash of $1.0 billion, a decrease of 27% over the prior year.$2,618 million. The decreaseoptions became exercisable on June 1, 2018.Mr. Creel was primarily driven by lower cash from operations and proceeds from the sale of D&H South in 2015, partially offset by lower capital expenditures. Free cash is defined and reconciled in Non-GAAP Measures and discussed further in Liquidity and Capital Resources of this Item 7. Management’s Discussion and Analysis of Financial Condition and Results of Operations.
Operatingalso awarded performance – CP’s continued focus stock options on asset utilization and productivity gains resulted in significant improvements to CP’s key operating metrics. In 2016, CP’s network train speed increased by 10% to 23.5 miles per hour, terminal dwell improved by 7% to 6.7 hours, and fuel efficiency improved by 2% to 0.980 U.S. gallons of locomotive fuel consumed per 1,000 gross ton-miles ("GTMs").February 1, 2017. These options will vest on February 1, 2022 provided certain performance metrics are discussed further in Performance Indicatorsachieved. The amount reflects the market value of this Item 7. Management's Discussionperformance stock options that have not vested based on US$177.62, our closing share price on the NYSE on December 31, 2018 and Analysisconverted into Canadian dollars using ayear-end exchange rate of Financial Condition$1.3642.For Mr. Velani, the value of unvested PSUs and ResultsDSUs is based on $242.24, our closing share price on the TSX on December 31, 2018.
Mr. Creel, Mr. Johnson, Mr. Brooks and Mr. Pitz: the value of Operations.PSUs or DSUs is based on US$177.62, our closing share price on the NYSE on December 31, 2018, converted into Canadian dollars using ayear-end
Safety – The Company does not compromise safety exchange rate of $1.3642.PSUs assume a payout at target (100%) for the sake2017 and 2018 grants. The 2016 PSU value reflects a payout at 177% on the award which includes dividends earned up to the payment date.
Vested and unvested DSU awards are deferred and cannot be redeemed until the executive leaves the company.
44
Incentive plan awards – value vested or earned during the year
The table below shows the amount of productivity gains. This relentless commitmentincentive compensation that vested or was paid in 2018.
| | | | | | | | | | | | |
Name | | Option-based awards -
value vested during the year ($) | | | Share-based awards -
value vested during the year ($) | | | Non-equity incentive plan compensation -
value earned during the year ($) | |
Keith Creel | | | 3,905,340 | | | | 7,171,365 | | | | 3,148,551 | |
Nadeem Velani | | | 145,738 | | | | 386,050 | | | | 1,032,596 | |
Robert Johnson | | | 386,683 | | | | 1,220,335 | | | | 778,392 | |
John Brooks | | | 141,622 | | | | 563,488 | | | | 602,177 | |
Laird Pitz | | | 239,420 | | | | 1,022,962 | | | | 560,593 | |
Notes:
Share-based awards – value vested during the year
The value includes DSUs that have vested during the year and are valued on the day of vesting, as well as the 2016 PSUs that vested at 177% on December 31, 2018 including dividends earned up to safetythe payment date.
The PSU value realized on vesting is demonstrated by CP’s safety statistics filed with the FRA. For 2016, CP’s FRA personal injuries frequency improved 11% and FRA train accidents per million train-miles frequency improved 27%, a new record for the Company.
2017 Outlook
For the full year 2017, CP expects Adjusted diluted EPS growth to be in the high single-digit percentages from full-year 2016 Adjusted diluted EPS of $10.29, excluding the impacts of any share repurchases or CEO transition cost recoveries in 2017. CP assumes that, in 2017, the Canadian-to-U.S. dollar exchange rate will be in the range of $1.30 to $1.35 and the average price of West Texas Intermediate ("WTI") crude oil will be approximately U.S. $45 to $55 per barrel. The Company expects a normalized income tax rate of approximately 26.50% for 2017. To further enhance safety and fluidity of the network, CP also plans to invest approximately $1.25 billion in capital programs in 2017, an increase of 6% over the $1.18 billion spent in 2016. Capital programs is defined and discussed further in Liquidity and Capital Resources of this Item 7. Management’s Discussion and Analysis of Financial Condition and Results of Operations.
Adjusted diluted EPS is defined and discussed further in Non-GAAP Measures and in Forward-Looking Information of this Item 7. Management’s Discussion and Analysis of Financial Condition and Results of Operations. Although CP has provided a forward-looking non-GAAP measure, it is not practicable to provide a reconciliation to a forward-looking reported diluted EPS, the most comparable GAAP measure, due to unknown variables and uncertainty related to future results. However, any such variability in reported diluted EPS may be excluded when determining Adjusted diluted EPS. Please see Forward-Looking Information of this Item 7. Management’s Discussion and Analysis of Financial Condition and Results of Operations for further discussion.
Performance Indicators
The following table lists the key measures of the Company’s operating performance:
|
| | | | | | | | | | |
| | | | | % Change |
| For the year ended December 31 | 2016 |
| 2015(1) |
| 2014(1) |
| 2016 vs. 2015 | 2015 vs. 2014 |
| Operations Performance | | | | | |
| Gross ton-miles (“GTMs”) (millions) | 242,694 |
| 263,344 |
| 272,862 |
| (8 | ) | (3 | ) |
| Train miles (thousands) | 30,373 |
| 34,064 |
| 36,252 |
| (11 | ) | (6 | ) |
| Average train weight – excluding local traffic (tons) | 8,614 |
| 8,314 |
| 8,076 |
| 4 |
| 3 |
|
| Average train length – excluding local traffic (feet) | 7,217 |
| 6,935 |
| 6,682 |
| 4 |
| 4 |
|
| Average terminal dwell (hours) | 6.7 |
| 7.2 |
| 8.7 |
| (7 | ) | (17 | ) |
| Average train speed (miles per hour, or "mph") | 23.5 |
| 21.4 |
| 18.0 |
| 10 |
| 19 |
|
| Fuel efficiency (U.S. gallons of locomotive fuel consumed /1,000 GTMs) | 0.980 |
| 0.999 |
| 1.035 |
| (2 | ) | (3 | ) |
| Total employees (average) | 12,082 |
| 13,858 |
| 14,604 |
| (13 | ) | (5 | ) |
| Total employees (end of period) | 11,653 |
| 12,817 |
| 14,255 |
| (9 | ) | (10 | ) |
| Workforce (end of period) | 11,698 |
| 12,899 |
| 14,385 |
| (9 | ) | (10 | ) |
| Safety Indicators | | | | | |
| FRA personal injuries per 200,000 employee-hours | 1.64 |
| 1.84 |
| 1.67 |
| (11 | ) | 10 |
|
| FRA train accidents per million train-miles | 0.97 |
| 1.33 |
| 1.26 |
| (27 | ) | 6 |
|
(1) Certain figures have been updated to reflect new information or have been revised to conform with current presentation.
Operations Performance
A GTM is the movement of one ton of train weight over one mile. GTMs are calculated by multiplying total train weightthe number of shares acquired on vesting by $259.49, the average30-day trading price of our shares prior to December 31, 2018 on the TSX for Mr. Velani, and US$194.42 on the NYSE for Mr. Creel, Mr. Johnson, Mr. Brooks and Mr. Pitz converted to Canadian dollars using theyear-end exchange rate of $1.3642 and by multiplying that product by the distanceachieved performance factor.Option exercises and vested stock awards
The table below shows the train moved. Total train weight comprisesoptions exercised and sold by the named executives in 2018.
| | | | | | | | | | | | |
Name | | Number of options exercised and sold | | | Option exercise price ($) | | | Value realized ($) | |
Keith Creel | | | 60,000 | | | | 115.78 | | | | 9,567,201 | |
Nadeem Velani | | | 0 | | | | 0 | | | | 0 | |
Robert Johnson | | | 0 | | | | 0 | | | | 0 | |
John Brooks | | | 0 | | | | 0 | | | | 0 | |
Laird Pitz | | | 3,150 | | | | 187.00 | | | | 260,295 | |
Value realizedis calculated using the actual market price of the weightshares acquired upon exercise of the freight cars, their contents, and any inactive locomotives. An increaserespective options less the exercise price for those options. The values are in GTMs indicates additional workload. GTMsCanadian dollars.
Equity compensation plan information
The table below shows the securities authorized for 2016 were 242,694 million, an 8% decrease compared with 263,344 million in 2015. This decrease was primarily driven by a drop in volume in the Crude, Potash, and Canadian Grain lines of business.
GTMs in 2015 decreased by 3% compared with 272,862 million in 2014. This decline was primarily due to a drop in volumes in the Intermodal, Crude and Metals, minerals and consumer products lines of business.
Train miles are defined as the sum of the distance moved by all trains operated on the network. Train miles for 2016 decreased by 11% compared with 2015 and in 2015 decreased by 6% compared with 2014, reflecting continuous improvements in operating efficiency from longer, heavier trains.
Average train weight is defined as the average gross weight of CP trains, both loaded and empty. This excludes trains in short-haul service, work trains used to move CP’s track equipment and materials, and the haulage of other railways’ trains on CP’s network. Average train weight of 8,614 tons in 2016 increased by 300 tons, or 4%, from 2015.
The average train length is the sum of each car multiplied by the distance travelled, divided by train miles. Local trains are excluded from this measure. Average train length of 7,217 feet in 2016 increased by 282 feet, or 4%, from 2015.
Average train weight increased in 2015 by 238 tons, or 3%, from 2014. Average train length increased in 2015 by 253 feet, or 4%, from 2014.
Both average train weight and length in 2016 and 2015 benefited from improvements in operating plan efficiency and increased bulk traffic being conveyed in longer, heavier trains.
The average terminal dwell is defined as the average time a freight car resides within terminal boundaries expressed in hours. The timing starts with a train arriving in the terminal, a customer releasing the car to the Company, or a car arriving at interchange from another railway. The timing ends when the train leaves, a customer receives the car from CP, or the freight car is transferred to another railway. Freight cars are excluded if they are being stored at the terminal or used in track repairs. Average terminal dwell decreased by 7% in 2016 from 7.2 hours in 2015 to 6.7 hours in 2016. Average terminal dwell also decreased by 17% in 2015 to 7.2 hours from 8.7 hours in 2014. These favourable decreases were primarily due to continued improvements in yard operating performance.
The average train speed is defined as a measure of the line-haul movement from origin to destination including terminal dwell hours. It is calculated by dividing the total train miles travelled by the total train hours operated. This calculation excludes delay time related to customer or foreign railways, and also excludes the time and distance travelled by: i) trains used in or around CP’s yards; ii) passenger trains; and iii) trains used for repairing track. Average train speed was 23.5 mph in 2016, an increase of 10%, from 21.4 mph in 2015. Average train speed in 2015 increased by 19%, from 18.0 mph in 2014. These favourable increases were primarily due to improved train design and operating plan execution.
Fuel efficiency improved by 2% in 2016 compared to 2015 and by 3% in 2015 compared to 2014. Improvements in fuel efficiency were a result of increased locomotive productivity, operational fluidity, and execution of the Company's fuel conservation strategies.
Total Employees and Workforce
An employee is defined by the Company as an individual currently engaged in full-time, part-time or seasonal employment with CP. The average number of total employees for 2016 decreased by 1,776, or 13%, compared with 2015. The total number of employees asissuance under equity compensation plans at December 31, 2016 was 11,653, a decrease of 1,164, or 9%, compared with 12,817 in 2015.2018. These decreases were primarily due to strong operational performance, natural attrition and efficient resource management planning.
The average number of total employees for 2015 decreased by 746, or 5%, compared with 2014. The total number of employees as at December 31, 2015 was 12,817, a decrease of 1,438, or 10%, compared with 14,255 in 2014. These improvements were primarily due to job reductions as a result of continuing strong operational performance and natural attrition.
The workforce is defined as total employees plus contractors and consultants. The workforce as at December 31, 2016 decreased by 1,201, or 9%, compared with December 31, 2015. The workforce as at December 31, 2015 also decreased by 1,486, or 10%, compared with December 31, 2014. These improvements were primarily due to strong operational performance, natural attrition and efficient resource management planning.
Safety Indicators
Safety is a key priority and core strategy for CP’s management, employees and Board of Directors. The Company’s two main safety indicators – personal injuries and train accidents – follow strict U.S. FRA reporting guidelines.
The FRA personal injuries per 200,000 employee-hours frequency is the number of personal injuries, multiplied by 200,000 and divided by total employee hours. Personal injuries are defined as injuries that require employees to lose time away from work, modify their normal duties or obtain medical treatment beyond minor first aid. FRA employee-hours are the total hours worked, excluding vacation and sick time, by all employees, excluding contractors. The FRA personal injuries per 200,000 employee-hours frequency for CP was 1.64 in 2016, 1.84 in 2015 and 1.67 in 2014.
The FRA train accidents per million train-miles frequency is the number of train accidents, multiplied by 1,000,000 and divided by total train miles. Train accidents included in this metric meet or exceed the FRA reporting threshold of U.S. $10,500 in damage. The FRA train accidents per million train-miles for CP in 2016 was 0.97, compared with 1.33 in 2015 and 1.26 in 2014.
Results of Operations
Income
Operating income was $2,578 million in 2016, a decrease of $110 million, or 4%, from $2,688 million in 2015. This decrease was primarily due to:
lower traffic volumes;
the unfavourable impacts of fluctuations in fuel price;
a $68 million gain on sale of D&H South in 2015;
higher depreciation and amortization; and
higher wage and benefit inflation.
This decrease was partially offset by:
efficiencies generated from improved operating performance and asset utilization;
a change of $122 million in defined benefit pension plan from an expense of $32 million in 2015 to $90 million in income in 2016;
the favourable impact of the change in foreign exchange (“FX”) of $69 million; and
higher land sales.
Operating income was $2,688 million in 2015, an increase of $349 million, or 15%, from $2,339 million in 2014. This increase was primarily due to:
the favourable impact of the change in FX of $247 million;
efficiencies generated from improved operating performance and asset utilization;
the gain on sale of D&H South of $68 million;
lower share-based compensation primarily driven by the change in share price and lower incentive-based compensation;
lower fuel price; and
higher land sales.
This increase was partially offset by:
lower traffic volume;
a change of $84 million in defined benefit pension plan from $52 million in income in 2014 to an expense of $32 million in 2015;
higher wage and benefit inflation; and
higher casualty expenses as a result of more costly incidents.
Adjusted operating income, defined and reconciled in Non-GAAP Measures of this Item 7. Management’s Discussion and Analysis of Financial Condition and Results of Operations, was $2,578 million in 2016, a decrease of $42 million, or 2%, from $2,620 million in 2015. This decrease was primarily due to the same factors discussed above for the decrease in Operating income, except that Adjusted operating income excluded the gain on sale of D&H South in 2015.
Adjusted operating income was $2,620 million in 2015, an increase of $285 million, or 12%, from $2,335 million in 2014. This increase was due to the same factors discussed above for the increase in Operating income except that Adjusted operating income excludes the gain on sale of D&H South in 2015.
Net income was $1,599 million in 2016, an increase of $247 million, or 18%, from $1,352 million in 2015. This increase was primarily due to the favourable impact of FX translation on U.S. dollar-denominated debt and a decrease in income tax expense due to the lower effective tax rate compared to 2015. This increase was partially offset by lower operating income and higher interest expense on new debt issued in 2015.
Net income was $1,352 million in 2015, a decrease of $124 million, or 8%, from $1,476 million in 2014. This decrease was primarily due to the unfavourable impact of FX translation on U.S. dollar-denominated debt and higher interest expense on new debt issued in 2015, partially offset by higher operating income.
Adjusted income, defined and reconciled in Non-GAAP Measures of this Item 7. Management’s Discussion and Analysis of Financial Condition and Results of Operations, was $1,549 million in 2016, a decrease of $76 million, or 5%, from $1,625 million in 2015. This decrease was primarily due to a decrease in Adjusted operating income and higher interest expense on new debt issued in 2015, partially offset by a decrease in income tax expense due to the lower effective tax rate excluding significant items compared to 2015.
Adjusted income was $1,625 million in 2015, an increase of $143 million, or 10%, from $1,482 million in 2014. This increase was primarily due to an increase in Adjusted operating income, partially offset by higher interest expense on new debt issued in 2015 and increased income tax expense.
Diluted Earnings per Share
Diluted EPS was $10.63 in 2016, an increase of $2.23, or 27%, from $8.40 in 2015. This increase was primarily due to higher Net income and the lower average number of outstanding shares due to the Company's share repurchase program.
Diluted EPS was $8.40 in 2015, a decrease of $0.06, or 1%, from $8.46 in 2014. This decrease was primarily due to lower Net income, partially offset by the lower average number of outstanding shares due to the Company's share repurchase program.
Adjusted diluted EPS, defined and reconciled in Non-GAAP Measures of this Item 7. Management’s Discussion and Analysis of Financial Condition and Results of Operations, was $10.29 in 2016, an increase of $0.19, or 2%, from $10.10 in 2015. This increase was primarily due to the lower average number of outstanding shares due to the Company’s share repurchase program, partially offset by lower Adjusted income.
Adjusted diluted EPS was $10.10 in 2015, an increase of $1.60, or 19%, from $8.50 in 2014. This increase was primarily due to higher Adjusted income and the lower average number of outstanding shares due to the Company’s share repurchase program.
Operating Ratio
The Operating ratio provides the percentage of revenues used to operate the railway. A lower percentage normally indicates higher efficiency in the operation of the railway. The Company’s Operating ratio was 58.6% in 2016, a 140 basis point improvement from 60.0% in 2015. This improvement was primarily due to:
efficiencies generated from improved operating performance and asset utilization;
a change of $122 million in defined benefit pension plan from an expense of $32 million in 2015 to $90 million in income in 2016;
higher land sales of $32 million; and
the favourable impact of the change in FX of $69 million.
This improvement was partially offset by:
lower traffic volumes;
a $68 million gain on disposition of D&H South in 2015;
higher depreciation and amortization; and
higher wage and benefit inflation.
The Company’s Operating ratio was 60.0% in 2015, a 470 basis point improvement from 64.7% in 2014. This improvement was primarily due to:
the favourable impact of the change in FX of $247 million;
efficiencies generated from improved operating performance and asset utilization;
the gain on sale of D&H South;
lower share-based compensation primarily driven by the change in share price and lower incentive-based compensation;
lower fuel price; and
higher land sales.
This improvement was partially offset by:
lower traffic volume;
a change of $84 million in defined benefit pension plan from $52 million in income in 2014 to an expense of $32 million in 2015;
higher wage and benefit inflation; and
higher casualty expenses as a result of more costly incidents.
Adjusted operating ratio, defined and reconciled in Non-GAAP Measures of this Item 7. Management’s Discussion and Analysis of Financial Condition and Results of Operations, was 58.6% in 2016, a 240 basis point improvement from 61.0% in 2015. The improvement in Adjusted operating ratio reflects the same factors discussed above for the improvement in Operating ratio except that Adjusted operating ratio excludes the gain on sale of D&H South in 2015.
Adjusted operating ratio was 61.0% in 2015, a 370 basis point improvement from 64.7% in 2014. This improvement in Adjusted operating ratio reflects the same factors discussed above except that Adjusted operating ratio excludes the gain on sale of D&H South in 2015.
Return on Invested Capital
ROIC is a measure of how productively the Company uses its long-term capital investments, representing critical indicators of good operating and investment decisions made by management, and is an important performance criteria in determining certain elements of the Company's long-term incentive plan. ROIC was 14.4% in 2016, a 150 basis point increase compared to 12.9% in 2015 due to higher income and the reduction in total Shareholders’ equity, primarily due to the Company's share repurchase program, partially offset byinclude the issuance of long-term debt in 2015. ROIC was 12.9% in 2015, a 150 basis point decrease compared to 14.4% in 2014 due tosecurities upon exercise of options outstanding under the issuance of long-term debt in 2015, partially offset by the reduction in total Shareholders’ equity, primarily due to the Company's share repurchase program.
Adjusted ROIC was 14.0% at December 31, 2016, a 120 basis point decrease compared to 15.2% in 2015 due to lower Adjusted incomemanagement stock option incentive plan and the
director stock option plan.The table also shows the remaining number of shares available for issuance and includes 340,000 shares under the director stock option plan. On July 21, 2003, the Board suspended any additional grants of long-term debt in 2015, partially offset byoptions under the reductions in total Shareholders’ equity as discussed above. Adjusted ROIC was 15.2% in 2015, a 70 basis point increase compareddirector stock option plan and there are no outstanding options under that plan.
| | | | | | | | | | | | |
Plan Category | | Number of securities to be issued upon exercise of outstanding options, warrants and rights | | | Weighted-average exercise price of outstanding options, warrants and rights ($) | | | Number of securities remaining available for future issuance under equity compensation plans (excluding securities reflected in the first column) | |
Equity compensation plans approved by security holders | | | 1,533,598 | | | | 176.02 | | | | 1,641,047 | |
Equity compensation plans not approved by security holders | | | - | | | | - | | | | - | |
Total | | | 1,533,598 | | | | 176.02 | | | | 1,641,047 | |
45
The number of securities to 14.5% in 2014 due to higher Adjusted incomebe issued upon exercise of outstanding options, warrants and the reductions in total Shareholders’ equity as discussed above, partially offset by the issuance of long-term debt in 2015. ROIC and Adjusted ROIC are defined and reconciled in Non-GAAP Measures of this Item 7. Management’s Discussion and Analysis of Financial Condition and Results of Operations.
Impact of Foreign Exchange on Earnings
Fluctuations in FX affect the Company’s results because U.S. dollar-denominated revenues and expenses are translated into Canadian dollars. U.S. dollar-denominated revenues and expenses increase (decrease) when the Canadian dollar weakens
(strengthens) in relation to the U.S. dollar. In 2016, the impact of a stronger U.S. dollar resulted in an increase in total revenues of $146 million, an increase in total operating expenses of $77 million and an increase in interest expense of $10 million.
|
| | | | | | | | | |
| Average exchange rates (Canadian to U.S. dollar) | 2016 |
| 2015 |
| 2014 |
|
| For the year ended – December 31 | $ | 1.33 |
| $ | 1.28 |
| $ | 1.10 |
|
| For the three months ended – December 31 | $ | 1.33 |
| $ | 1.34 |
| $ | 1.13 |
|
|
| | | | | | | | | |
| Exchange rates (Canadian to U.S. dollar) | 2016 |
| 2015 |
| 2014 |
|
| Beginning of year – January 1 | $ | 1.38 |
| $ | 1.16 |
| $ | 1.06 |
|
| Beginning of quarter – April 1 | $ | 1.30 |
| $ | 1.27 |
| $ | 1.11 |
|
| Beginning of quarter – July 1 | $ | 1.29 |
| $ | 1.25 |
| $ | 1.07 |
|
| Beginning of quarter – October 1 | $ | 1.31 |
| $ | 1.33 |
| $ | 1.12 |
|
| End of quarter – December 31 | $ | 1.34 |
| $ | 1.38 |
| $ | 1.16 |
|
In 2017, CP expects that for every $0.01 the U.S. dollar appreciates (depreciates) relative to the Canadian dollar, it will increase (decrease) revenues by $25 million, operating expenses by $13 million and interest expense by $3 million on an annualized basis.
Impact of Fuel Price on Earnings
Fluctuations in fuel prices affect the Company’s results because fuel expense constitutes a significant portion of CP's operating costs. As fuel prices fluctuate, there will be a timing impact on earnings, as discussed further in Item 1. Business, Operations, Fuel Cost Adjustment Program and Item 1A. Risk Factors, Fuel Cost Volatility. In 2016, the impact of lower fuel prices resulted in a decrease in total revenues of $178 million and a decrease in total operating expenses of $100 million. The wildfires in northern Alberta negatively impacted fuel input costs by an estimated $9 million without triggering a commensurate offsetting impact on benchmark fuel recovery prices during the second quarter of 2016.
|
| | | | | | | | | |
| Average Fuel Price (U.S. dollars per U.S. gallon) | 2016 |
| 2015 |
| 2014 |
|
| For the year ended – December 31 | $ | 1.80 |
| $ | 2.13 |
| $ | 3.41 |
|
| For the three months ended – December 31 | $ | 2.01 |
| $ | 1.91 |
| $ | 3.11 |
|
Impact of Share Price on Earnings
Fluctuationsrights in the Common Share price affectprevious table includes 59,325 unexercised options granted as a stand-alone award to Mr. Creel in 2013. See page 22 to read more about the Company's operating expenses because share-based liabilities are measured at fair value. The following tables indicatemanagement stock option incentive plan. You can also read about the opening and closing CP Common Share Price on the TSX and the NYSEtwo equity compensation plans in our audited consolidated financial statements for the year ended December 31, 2016, 20152018, available on our website (investor.cpr.ca/financials), and 2014.
|
| | | | | | | | | |
| Toronto Stock Exchange (in Canadian dollars) | 2016 |
| 2015 |
| 2014 |
|
| Opening Common Share price, as at January 1 | $ | 176.73 |
| $ | 223.75 |
| $ | 160.65 |
|
| Ending Common Share price, as at March 31 | $ | 172.55 |
| $ | 231.90 |
| $ | 165.65 |
|
| Ending Common Share price, as at June 30 | $ | 166.33 |
| $ | 200.02 |
| $ | 193.31 |
|
| Ending Common Share price, as at September 30 | $ | 200.19 |
| $ | 191.54 |
| $ | 232.43 |
|
| Ending Common Share price, as at December 31 | $ | 191.56 |
| $ | 176.73 |
| $ | 223.75 |
|
| Change in Common Share price for the year ended December 31 | $ | 14.83 |
| $ | (47.02 | ) | $ | 63.10 |
|
|
| | | | | | | | | |
| New York Stock Exchange (in U.S. dollars) | 2016 |
| 2015 |
| 2014 |
|
| Opening Common Share price, as at January 1 | $ | 127.60 |
| $ | 192.69 |
| $ | 151.32 |
|
| Ending Common Share price, as at March 31 | $ | 132.69 |
| $ | 182.70 |
| $ | 150.43 |
|
| Ending Common Share price, as at June 30 | $ | 128.79 |
| $ | 160.23 |
| $ | 181.14 |
|
| Ending Common Share price, as at September 30 | $ | 152.70 |
| $ | 143.57 |
| $ | 207.47 |
|
| Ending Common Share price, as at December 31 | $ | 142.77 |
| $ | 127.60 |
| $ | 192.69 |
|
| Change in Common Share price for the year ended December 31 | $ | 15.17 |
| $ | (65.09 | ) | $ | 41.37 |
|
In 2016,on SEDAR (www.sedar.com) and EDGAR (www.sec.gov).Employee Share Purchase Program
CP’s ESPP is available to all employees and provides the impactopportunity to purchase voting shares on the open market through payroll deductions which aligns employees’ interests with those of shareholders. Employees may contribute between 1% and 10% of their base salary to the ESPP every pay period. CP provides a 33% match on the first 6% ofnon-unionized and specified unionized employees’ contributions which vest at the end of the changefour consecutive quarters. Employees must remain participants of the ESPP at the time of vesting in Common Share price resultedorder to receive the CP match.
As of December 31, 2018, approximately 41% of employees participated in an increaseESPP.
46
Retirement plans
Canadian pension plans
Mr. Creel and Mr. Velani participated in stock-based compensation expenseour defined contribution plan (DC plan) in 2018.
Participants contribute between 4% and 6% of $9 million comparedtheir earnings depending on their age and years of service, and the company contributes between 4% and 8% of earnings. Total contributions are limited to the maximum allowed under theIncome Tax Act(Canada) ($26,500 for 2018).
Defined contribution plan table
| | | | | | | | | | | | |
| | | Accumulated value at start of year ($) | | | Compensatory ($) | | | Accumulated value at year end ($) | |
Keith Creel | | | 842,518 | | | | 430,053 | | | | 1,262,991 | |
Nadeem Velani | | | 315,592 | | | | 138,925 | | | | 455,364 | |
Mr. Creel and Mr. Velani also participate in a decreasedefined contribution supplemental plan (DC SERP), anon-registered plan that provides benefits in excess of $36 million in 2015,theIncome Tax Act(Canada) limits for the DC plan. Specifically, the DC SERP provides a company contribution equal to 6% of a participant’s base salary and an increase of $46 million in 2014.
The impact of share price on stock-based compensation is discussed further in Item 7A. Quantitativeannual bonus. Company contributions vest after two years and Qualitative Disclosures About Market Risk, Share Price Impact on Stock-Based Compensation.
Operating Revenues
|
| | | | | | | | | | | | | | | | | | | | | | | |
|
|
|
| 2016 vs. 2015 | 2015 vs. 2014 |
| For the year ended December 31 | 2016 | 2015 | 2014 | Total Change | % Change | FX Adjusted
% Change(2) | Total Change | % Change | FX Adjusted
% Change(2) |
Freight revenues (in millions)(1) | $ | 6,060 |
| $ | 6,552 |
| $ | 6,464 |
| $ | (492 | ) | (8 | ) | (10 | ) | $ | 88 |
| 1 |
| (7 | ) |
| Non-freight revenues (in millions) | 172 |
| 160 |
| 156 |
| 12 |
| 8 |
| 7 |
| 4 |
| 3 |
| — |
|
| Total revenues (in millions) | $ | 6,232 |
| $ | 6,712 |
| $ | 6,620 |
| $ | (480 | ) | (7 | ) | (9 | ) | $ | 92 |
| 1 |
| (6 | ) |
| Carloads (in thousands) | 2,525 |
| 2,628 |
| 2,684 |
| (103 | ) | (4 | ) | N/A |
| (56 | ) | (2 | ) | N/A |
|
| Revenue ton-miles (in millions) | 135,952 |
| 145,257 |
| 149,849 |
| (9,305 | ) | (6 | ) | N/A |
| (4,592 | ) | (3 | ) | N/A |
|
| Freight revenue per carload (dollars) | $ | 2,400 |
| $ | 2,493 |
| $ | 2,408 |
| $ | (93 | ) | (4 | ) | N/A |
| $ | 85 |
| 4 |
| N/A |
|
| Freight revenue per revenue ton-miles (cents) | 4.46 |
| 4.51 |
| 4.31 |
| (0.05 | ) | (1 | ) | N/A |
| 0.20 |
| 5 |
| N/A |
|
(1) Freight revenues include fuel surcharge revenues of $117 million in 2016, $293 million in 2015 and $637 million in 2014.
(2) FX Adjusted % Change doesemployees do not have any standardized meaning prescribed by GAAP and, therefore is unlikely to be comparable to similar measures presented by other companies. FX adjusted variance is defined and reconciled in Non-GAAP Measures of this Item 7. Management's Discussion and Analysis of Financial Condition and Results of Operations.
The Company’s revenues are primarily derived from transporting freight. Changes in freight volumes generally contribute to
corresponding changes in freight revenues and certain variable expenses, such as fuel, equipment rents and crew costs. Non-freight revenue is generated from leasing of certain assets, switching fees, contractsthe plan.U.S. retirement plans
Our U.S. retirement program has five elements:
| • | | a qualified defined benefit pension plan which provides automatic employer contributions(closed plan) |
| • | | anon-qualified defined benefit pension plan(closed plan)for certain employees whose compensation exceeds theU.S. Internal Revenue Code(the “Code”) limits (US$220,000 for 2018) |
a voluntary qualified 401(k) plan with passenger service operators, and logistical management services.employer match
Freight Revenues
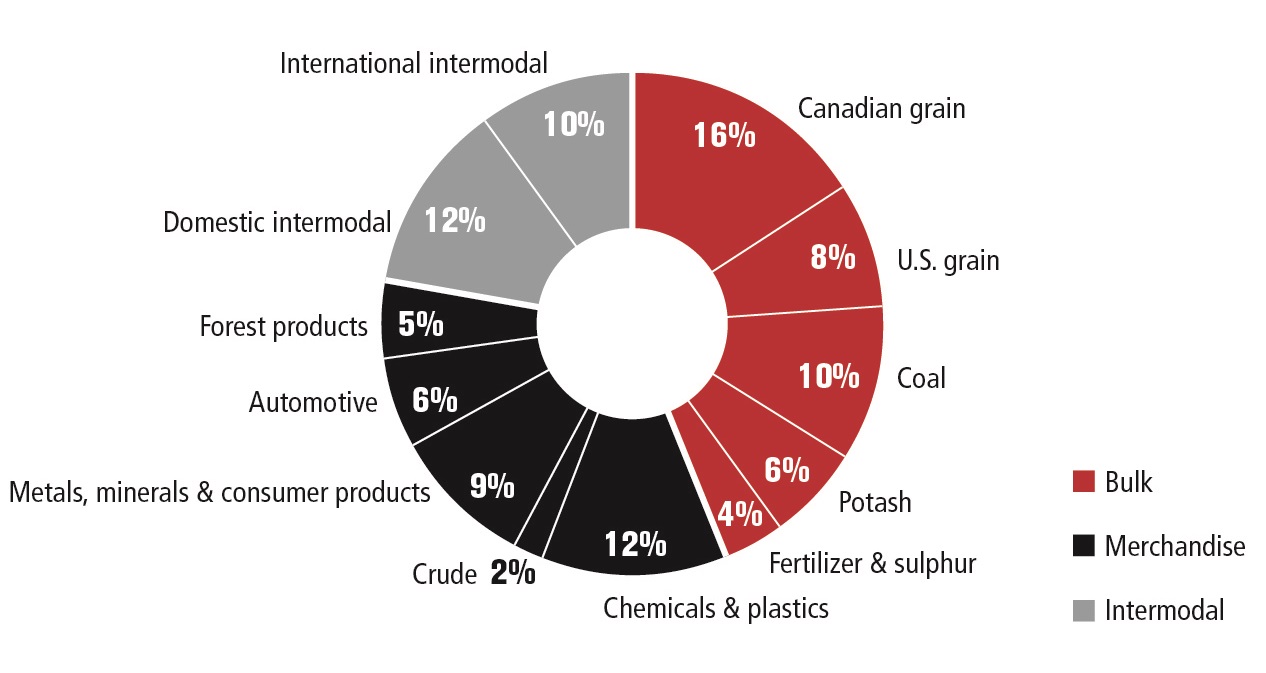
Freight revenues were $6,060 million in 2016, a decrease of $492 million, or 8%, from $6,552 million in 2015. This decrease was primarily due to lower volumes, as measured by RTMs, in Crude, Canadian grain, Potash, and Metals, minerals, and consumer products and the impact of lower fuel prices on fuel surcharge revenue.
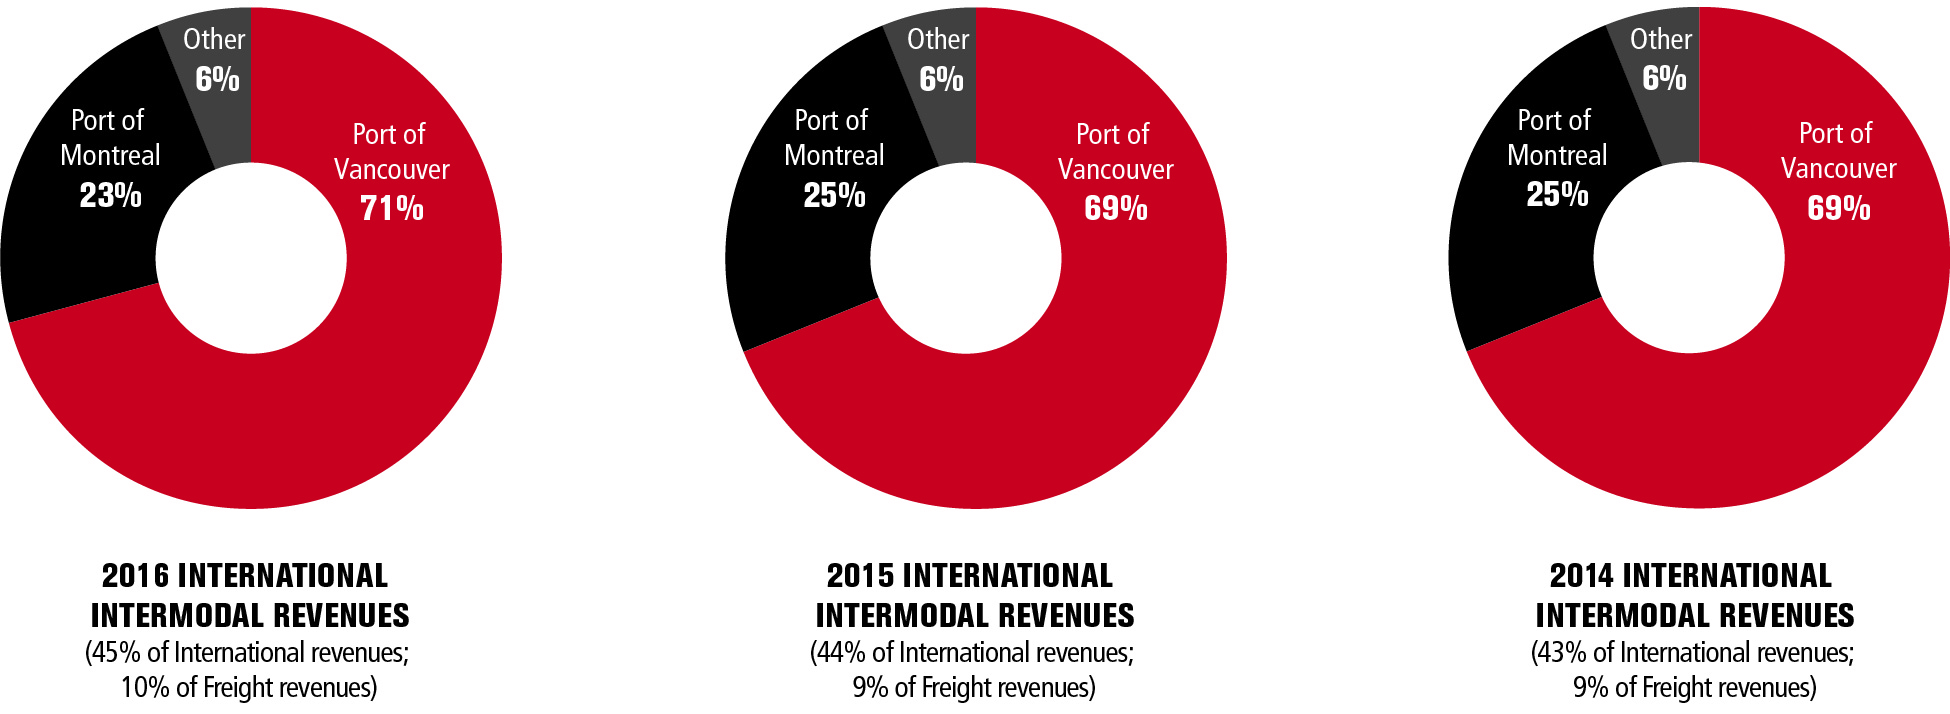
This decrease was partially offset by higher volumes in International intermodal, Chemicals and plastics, and Forest products and the favourable impact of the change in FX of $146 million.
Freight revenues were $6,552 million in 2015, an increase of $88 million, or 1%, from $6,464 million in 2014. This increase was primarily due to the favourable impact of the change in FX of $549 million and an increase in Canadian grain revenue due to increased exports. This increase was partially offset by the impact of lower fuel prices on fuel surcharge revenue of $334 million, and lower volumes of Metals, mineral and consumer products and Crude.
RTMs
RTMs arequalified defined as the movement of one revenue-producing ton of freight overcontribution plan which provides automatic employer contributions
| • | | anon-qualified defined contribution plan for certain employees whose compensation exceeds theCodelimits (US$275,000 for 2018) |
CP Pension Plan for U.S. Management Employees (closed plan)
CP sponsors a distance of one mile. RTMs measure the relative weight and distance of rail freight moved by the Company. RTMs for 2016 were 135,952 million, a decrease of 9,305 million, or 6%, compared with 145,257 million in 2015. This decrease was mainly attributable to decreased shipments of Crude, Canadian grain, Potash, and Metals, minerals and consumer products. This decrease was partially offset by increased shipments of International intermodal, Chemicals and Plastics, Forest products and U.S. grain.
RTMs for 2015 were 145,257 million, a decrease of 3% compared with 149,849 million in 2014. This decrease was primarily due to lower volumes of Crude, Metals, minerals and consumer products, and U.S. Grain. This decrease was partially offset by increased shipments of Potash, Canadian Grain, and Forest products.
Non-freight Revenues
Non-freight revenues were $172 million in 2016, an increase of $12 million, or 8%, from $160 million in 2015. This increase was primarily due to higher transload, leasing, and logistics services revenues.
Non-freight revenues were $160 million in 2015, an increase of $4 million, or 3%, from $156 million in 2014. This increase was primarily due to the favourable impact of the change in FX.
Lines of Business
Canadian Grain
|
| | | | | | | | | | | | | | | | | | | | | | |
| | | | | 2016 vs. 2015 | 2015 vs. 2014 |
| For the year ended December 31 | 2016 | 2015 | 2014 | Total Change | % Change | FX Adjusted
% Change | Total Change | % Change | FX Adjusted
% Change |
| Freight revenues (in millions) | $ | 962 |
| $ | 1,068 |
| $ | 988 |
| $ | (106 | ) | (10 | ) | (11 | ) | $ | 80 |
| 8 |
| 4 |
| Carloads (in thousands) | 270 |
| 285 |
| 291 |
| (15 | ) | (5 | ) | N/A |
| (6 | ) | (2 | ) | N/A |
| Revenue ton-miles (in millions) | 25,994 |
| 27,442 |
| 26,691 |
| (1,448 | ) | (5 | ) | N/A |
| 751 |
| 3 |
| N/A |
| Freight revenue per carload (dollars) | $ | 3,559 |
| $ | 3,750 |
| $ | 3,391 |
| $ | (191 | ) | (5 | ) | N/A |
| $ | 359 |
| 11 |
| N/A |
| Freight revenue per revenue ton-mile (cents) | 3.70 |
| 3.89 |
| 3.70 |
| (0.19 | ) | (5 | ) | N/A |
| 0.19 |
| 5 |
| N/A |
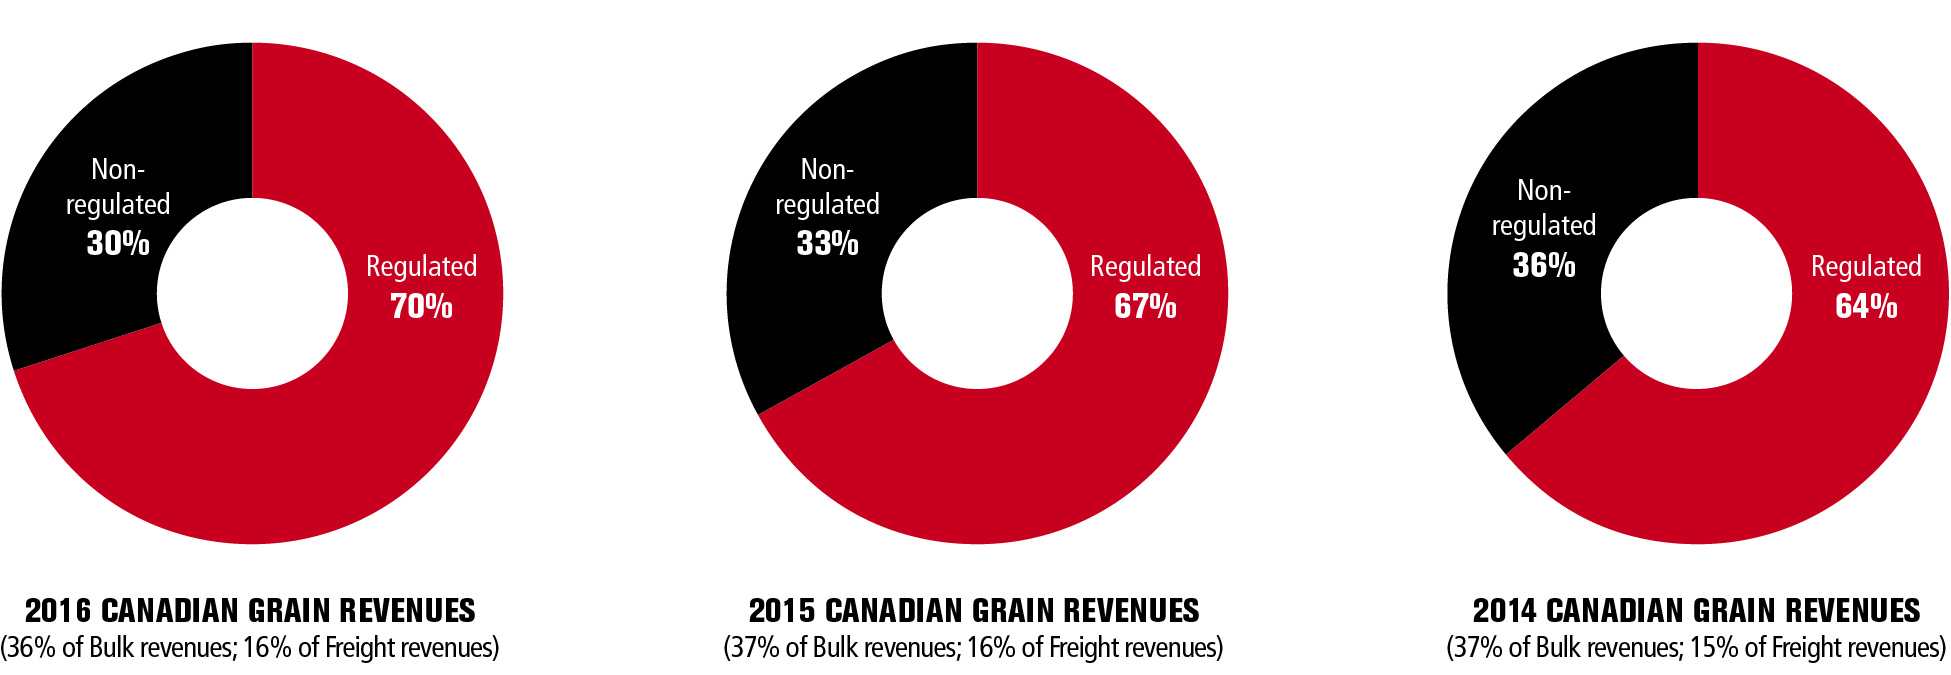
Canadian grain revenue was $962 million in 2016, a decrease of $106 million, or 10%, from $1,068 million in 2015. This decrease was primarily due to a decline in volumes due to lower carryover from prior year and a weather delayed fall harvest, and lower freight rates that reflect the change in the MRE for Canadian regulated grain in the crop year 2015/2016. This decrease was partially offset by the favourable impact of the change in FX, and an increase in volumes due to a larger 2016/2017 crop.
Canadian grain revenue was $1,068 million in 2015, an increase of $80 million, or 8%, from $988 million in 2014. This increase was primarily due to higher freight rates, the favourable impact of the change in FX, and strong export volumes through the Port of Vancouver, partially offset by lower fuel surcharge revenue.
U.S. Grain
|
| | | | | | | | | | | | | | | | | | | | | | | |
| | | | | 2016 vs. 2015 | 2015 vs. 2014 |
| For the year ended December 31 | 2016 | 2015 | 2014 | Total Change | % Change | FX Adjusted
% Change | Total Change | % Change | FX Adjusted
% Change |
| Freight revenues (in millions) | $ | 518 |
| $ | 522 |
| $ | 503 |
| $ | (4 | ) | (1 | ) | (5 | ) | $ | 19 |
| 4 |
| (12 | ) |
| Carloads (in thousands) | 162 |
| 157 |
| 173 |
| 5 |
| 3 |
| N/A |
| (16 | ) | (9 | ) | N/A |
|
| Revenue ton-miles (in millions) | 10,898 |
| 10,625 |
| 11,724 |
| 273 |
| 3 |
| N/A |
| (1,099 | ) | (9 | ) | N/A |
|
| Freight revenue per carload (dollars) | $ | 3,202 |
| $ | 3,326 |
| $ | 2,909 |
| $ | (124 | ) | (4 | ) | N/A |
| $ | 417 |
| 14 |
| N/A |
|
| Freight revenue per revenue ton-mile (cents) | 4.75 |
| 4.91 |
| 4.29 |
| (0.16 | ) | (3 | ) | N/A |
| 0.62 |
| 14 |
| N/A |
|
U.S. grain revenue was $518 million in 2016, a decrease of $4 million, or 1%, from $522 million in 2015. The decrease was primarily due to the decrease in average freight revenue per revenue ton-mile, and lower fuel surcharge revenue as a result of lower fuel prices. The decrease was partially offset by the favourable impact of the change in FX, and increased volumes. The decrease in average freight revenue per revenue ton-mile was primarily due to a change in the mix of commodities being shipped.
U.S. grain revenue was $522 million in 2015, an increase of $19 million, or 4%, from $503 million in 2014. The increase was primarily due to the favourable impact of the change in FX, partially offset by a decrease in volumes of 9% primarily due to the reduction in export volumes, and lower fuel surcharge revenue.
Coal
|
| | | | | | | | | | | | | | | | | | | | | | |
| | | | 2016 vs. 2015 | 2015 vs. 2014 |
| For the year ended December 31 | 2016 | 2015 | 2014 | Total Change | % Change | FX Adjusted
% Change | Total Change | % Change | FX Adjusted
% Change |
| Freight revenues (in millions) | $ | 606 |
| $ | 639 |
| $ | 621 |
| $ | (33 | ) | (5 | ) | (6 | ) | $ | 18 |
| 3 |
| 1 |
| Carloads (in thousands) | 305 |
| 323 |
| 313 |
| (18 | ) | (6 | ) | N/A |
| 10 |
| 3 |
| N/A |
| Revenue ton-miles (in millions) | 22,171 |
| 22,164 |
| 22,443 |
| 7 |
| — |
| N/A |
| (279 | ) | (1 | ) | N/A |
| Freight revenue per carload (dollars) | $ | 1,984 |
| $ | 1,978 |
| $ | 1,985 |
| $ | 6 |
| — |
| N/A |
| $ | (7 | ) | — |
| N/A |
| Freight revenue per revenue ton-mile (cents) | 2.73 |
| 2.88 |
| 2.77 |
| (0.15 | ) | (5 | ) | N/A |
| 0.11 |
| 4 |
| N/A |
Coal revenue was $606 million in 2016, a decrease of $33 million, or 5%, from $639 million in 2015. This decrease was primarily due to the decline in U.S. thermal coal shipments, and lower fuel surcharge revenue as a result of lower fuel prices, partially offset by increased shipments of metallurgical coal, and the favourable impact of the change in FX. The decrease in freight revenue per revenue ton-mile is primarily due to the decrease in U.S. thermal coal, which has a shorter length of haul versus export metallurgical coal.
Coal revenue was $639 million in 2015, an increase of $18 million, or 3%, from $621 million in 2014. This increase was primarily due to the favourable impact of the change in FX and higher freight rates and volumes of U.S. originated thermal coal, partially offset by lower fuel surcharge revenue and a decline in volume in Canadian coal business.
Potash
|
| | | | | | | | | | | | | | | | | | | | | | | |
| | | | | 2016 vs. 2015 | 2015 vs. 2014 |
| For the year ended December 31 | 2016 | 2015 | 2014 | Total Change | % Change | FX Adjusted
% Change | Total Change | % Change | FX Adjusted
% Change |
| Freight revenues (in millions) | $ | 338 |
| $ | 359 |
| $ | 347 |
| $ | (21 | ) | (6 | ) | (8 | ) | $ | 12 |
| 3 |
| (4 | ) |
| Carloads (in thousands) | 116 |
| 124 |
| 118 |
| (8 | ) | (6 | ) | N/A |
| 6 |
| 5 |
| N/A |
|
| Revenue ton-miles (in millions) | 14,175 |
| 15,117 |
| 14,099 |
| (942 | ) | (6 | ) | N/A |
| 1,018 |
| 7 |
| N/A |
|
| Freight revenue per carload (dollars) | $ | 2,904 |
| $ | 2,887 |
| $ | 2,941 |
| $ | 17 |
| 1 |
| N/A |
| $ | (54 | ) | (2 | ) | N/A |
|
| Freight revenue per revenue ton-mile (cents) | 2.38 |
| 2.37 |
| 2.46 |
| 0.01 |
| — |
| N/A |
| (0.09 | ) | (4 | ) | N/A |
|
Potash revenue was $338 million in 2016, a decrease of $21 million, or 6%, from $359 million in 2015. This decrease was primarily due to a decline in export potash volumes, and lower fuel surcharge revenue as a result of lower fuel prices. Favourable impact of the change in FX, and an adjustment to freight rates for one customer for prior periods partially offset this decrease. The freight revenue per revenue ton-mile is essentially flat due to the adjustment to freight rates for one customer for prior periods, offset by decreases in export traffic revenue ton-miles.
Potash revenue was $359 million in 2015, an increase of $12 million, or 3%, from $347 million in 2014. This increase was primarily due to the favourable impact of the change in FX and an increase in volumes where growth in export Potash, which has a lower freight revenue per revenue ton-mile, outpaced domestic Potash growth.
Fertilizers and Sulphur
|
| | | | | | | | | | | | | | | | | | | | | |
| | | | | 2016 vs. 2015 | 2015 vs. 2014 |
| For the year ended December 31 | 2016 | 2015 | 2014 | Total Change | % Change | FX Adjusted
% Change | Total Change | % Change | FX Adjusted
% Change |
| Freight revenues (in millions) | $ | 284 |
| $ | 272 |
| $ | 234 |
| $ | 12 |
| 4 |
| 2 | $ | 38 |
| 16 |
| 6 |
| Carloads (in thousands) | 60 |
| 62 |
| 61 |
| (2 | ) | (3 | ) | N/A | 1 |
| 2 |
| N/A |
| Revenue ton-miles (in millions) | 4,140 |
| 4,044 |
| 4,180 |
| 96 |
| 2 |
| N/A | (136 | ) | (3 | ) | N/A |
| Freight revenue per carload (dollars) | $ | 4,769 |
| $ | 4,410 |
| $ | 3,801 |
| $ | 359 |
| 8 |
| N/A | $ | 609 |
| 16 |
| N/A |
| Freight revenue per revenue ton-mile (cents) | 6.87 |
| 6.71 |
| 5.59 |
| 0.16 |
| 2 |
| N/A | 1.12 |
| 20 |
| N/A |
Fertilizers and sulphur revenue was $284 million in 2016, an increase of $12 million, or 4%, from $272 million in 2015. This increase was primarily due to increased freight revenue per carload and the favourable impact of the change in FX, partially offset by lower fuel surcharge revenue as a result of lower fuel prices, and lower carloads. The increase in freight revenue per carload is primarily due to the increase in average length of haul for fertilizers.
Fertilizers and sulphur revenue was $272 million in 2015, an increase of $38 million, or 16%, from $234 million in 2014. This increase was primarily due to the favourable impact of the change in FX, higher freight rates and a shift in mix of traffic to fertilizers, which generally has higher freight rates than sulphur.
Forest Products
|
| | | | | | | | | | | | | | | | | | | | |
| | | | | 2016 vs. 2015 | 2015 vs. 2014 |
| For the year ended December 31 | 2016 | 2015 | 2014 | Total Change | % Change | FX Adjusted
% Change | Total Change | % Change | FX Adjusted
% Change |
| Freight revenues (in millions) | $ | 275 |
| $ | 249 |
| $ | 206 |
| $ | 26 |
| 10 |
| 7 | $ | 43 |
| 21 | 8 |
| Carloads (in thousands) | 66 |
| 62 |
| 59 |
| 4 |
| 6 |
| N/A | 3 |
| 5 | N/A |
| Revenue ton-miles (in millions) | 4,691 |
| 4,201 |
| 3,956 |
| 490 |
| 12 |
| N/A | 245 |
| 6 | N/A |
| Freight revenue per carload (dollars) | $ | 4,157 |
| $ | 4,026 |
| $ | 3,493 |
| $ | 131 |
| 3 |
| N/A | $ | 533 |
| 15 | N/A |
| Freight revenue per revenue ton-mile (cents) | 5.86 |
| 5.92 |
| 5.20 |
| (0.06 | ) | (1 | ) | N/A | 0.72 |
| 14 | N/A |
Forest products revenue was $275 million in 2016, an increase of $26 million, or 10%, from $249 million in 2015. This increase was primarily due to higher volumes, particularly of lumber and panel products, which have a longer length of haul than other forest products, and the favourable impact of the change in FX. Lower fuel surcharge revenue as a result of lower fuel prices partially offset this increase.
Forest products revenue was $249 million in 2015, an increase of $43 million, or 21%, from $206 million in 2014. This increase was primarily due to the favourable impact of the change in FX, improved pricing and a change in traffic mix to lumber and panel products, which generally have higher freight rates than pulp and paper.
Chemicals and Plastics
|
| | | | | | | | | | | | | | | | | | | | | | | |
| | | | | 2016 vs. 2015 | 2015 vs. 2014 |
| For the year ended December 31 | 2016 | 2015 | 2014 | Total Change | % Change | FX Adjusted
% Change | Total Change | % Change | FX Adjusted
% Change |
| Freight revenues (in millions) | $ | 714 |
| $ | 709 |
| $ | 637 |
| $ | 5 |
| 1 |
| (3 | ) | $ | 72 |
| 11 |
| (2 | ) |
| Carloads (in thousands) | 212 |
| 203 |
| 198 |
| 9 |
| 4 |
| N/A |
| 5 |
| 3 |
| N/A |
|
| Revenue ton-miles (in millions) | 14,294 |
| 13,611 |
| 13,635 |
| 683 |
| 5 |
| N/A |
| (24 | ) | — |
| N/A |
|
| Freight revenue per carload (dollars) | $ | 3,368 |
| $ | 3,483 |
| $ | 3,214 |
| $ | (115 | ) | (3 | ) | N/A |
| $ | 269 |
| 8 |
| N/A |
|
| Freight revenue per revenue ton-mile (cents) | 4.99 |
| 5.21 |
| 4.67 |
| (0.22 | ) | (4 | ) | N/A |
| 0.54 |
| 12 |
| N/A |
|
Chemicals and plastics revenue was $714 million in 2016, an increase of $5 million, or 1%, from $709 million in 2015. This increase was primarily due to an increase in volumes, and the favourable impact of the change in FX. Lower fuel surcharge revenue as a result of lower fuel prices, and lower average freight revenue per revenue ton-mile due to fewer liquefied petroleum gas product shipments, partially offset this increase.
Chemicals and plastics revenue was $709 million in 2015, an increase of $72 million, or 11%, from $637 million in 2014. This increase was primarily due to the favourable impact of the change in FX, partially offset by lower fuel surcharge revenue.
Crude
|
| | | | | | | | | | | | | | | | | | | | | | | |
| | | | | 2016 vs. 2015 | 2015 vs. 2014 |
| For the year ended December 31 | 2016 | 2015 | 2014 | Total Change | % Change | FX Adjusted
% Change | Total Change | % Change | FX Adjusted
% Change |
| Freight revenues (in millions) | $ | 138 |
| $ | 393 |
| $ | 484 |
| $ | (255 | ) | (65 | ) | (66 | ) | $ | (91 | ) | (19 | ) | (29 | ) |
| Carloads (in thousands) | 38 |
| 91 |
| 110 |
| (53 | ) | (58 | ) | N/A |
| (19 | ) | (17 | ) | N/A |
|
| Revenue ton-miles (in millions) | 4,727 |
| 13,280 |
| 16,312 |
| (8,553 | ) | (64 | ) | N/A |
| (3,032 | ) | (19 | ) | N/A |
|
| Freight revenue per carload (dollars) | $ | 3,646 |
| $ | 4,309 |
| $ | 4,419 |
| $ | (663 | ) | (15 | ) | N/A |
| $ | (110 | ) | (2 | ) | N/A |
|
| Freight revenue per revenue ton-mile (cents) | 2.93 |
| 2.96 |
| 2.97 |
| (0.03 | ) | (1 | ) | N/A |
| (0.01 | ) | — |
| N/A |
|
Crude revenue was $138 million in 2016, a decrease of $255 million, or 65%, from $393 million in 2015. This decrease was primarily due to a decline in volumes as a result of the fall in crude oil prices and an increase in available pipeline capacity, as well as lower fuel surcharge revenue as a result of lower fuel prices. The favourable impact of the change in FX partially offset this decrease.
Crude revenue was $393 million in 2015, a decrease of $91 million, or 19%, from $484 million in 2014. This decrease was primarily due to a decline in volume as a result of the fall in crude oil prices and lower fuel surcharge revenue, partially offset by the favourable impact of the change in FX.
Metals, Minerals and Consumer Products
|
| | | | | | | | | | | | | | | | | | | | | | | |
| | | | | 2016 vs. 2015 | 2015 vs. 2014 |
| For the year ended December 31 | 2016 | 2015 | 2014 | Total Change | % Change | FX Adjusted
% Change | Total Change | % Change | FX Adjusted
% Change |
| Freight revenues (in millions) | $ | 564 |
| $ | 643 |
| $ | 712 |
| $ | (79 | ) | (12 | ) | (15 | ) | $ | (69 | ) | (10 | ) | (20 | ) |
| Carloads (in thousands) | 196 |
| 217 |
| 253 |
| (21 | ) | (10 | ) | N/A |
| (36 | ) | (14 | ) | N/A |
|
| Revenue ton-miles (in millions) | 8,338 |
| 9,020 |
| 11,266 |
| (682 | ) | (8 | ) | N/A |
| (2,246 | ) | (20 | ) | N/A |
|
| Freight revenue per carload (dollars) | $ | 2,888 |
| $ | 2,963 |
| $ | 2,814 |
| $ | (75 | ) | (3 | ) | N/A |
| $ | 149 |
| 5 |
| N/A |
|
| Freight revenue per revenue ton-mile (cents) | 6.77 |
| 7.13 |
| 6.32 |
| (0.36 | ) | (5 | ) | N/A |
| 0.81 |
| 13 |
| N/A |
|
Metals, minerals and consumer products revenue was $564 million in 2016, a decrease of $79 million, or 12%, from $643 million in 2015. This decrease was primarily due to declines in the volume of aggregate products, steel, and waste products, and lower fuel surcharge revenue as a result of lower fuel prices, partially offset by the favourable impact of the change in FX. The decrease in average freight revenue per revenue ton-mile is primarily due to a change in mix of commodities.
Metals, minerals and consumer products revenue was $643 million in 2015, a decrease of $69 million, or 10%, from $712 million in 2014. This decrease was primarily due to declines in the volume of frac sand, steel and other aggregates traffic, partially offset by the favourable impact of the change in FX.
Automotive
|
| | | | | | | | | | | | | | | | | | | | | | | |
| | | | | 2016 vs. 2015 | 2015 vs. 2014 |
| For the year ended December 31 | 2016 | 2015 | 2014 | Total Change | % Change | FX Adjusted
% Change | Total Change | % Change | FX Adjusted
% Change |
| Freight revenues (in millions) | $ | 350 |
| $ | 349 |
| $ | 357 |
| $ | 1 |
| — |
| (3 | ) | $ | (8 | ) | (2 | ) | (11 | ) |
| Carloads (in thousands) | 124 |
| 131 |
| 134 |
| (7 | ) | (5 | ) | N/A |
| (3 | ) | (2 | ) | N/A |
|
| Revenue ton-miles (in millions) | 1,667 |
| 1,750 |
| 1,953 |
| (83 | ) | (5 | ) | N/A |
| (203 | ) | (10 | ) | N/A |
|
| Freight revenue per carload (dollars) | $ | 2,825 |
| $ | 2,659 |
| $ | 2,670 |
| $ | 166 |
| 6 |
| N/A |
| $ | (11 | ) | — |
| N/A |
|
| Freight revenue per revenue ton-mile (cents) | 21.02 |
| 19.97 |
| 18.26 |
| 1.05 |
| 5 |
| N/A |
| 1.71 |
| 9 |
| N/A |
|
Automotive revenue was $350 million in 2016, a slight increase of $1 million from $349 million in 2015. The increase in average freight rates and the favourable impact of the change in FX were offset by declines in volume, and lower fuel surcharge revenue as a result of lower fuel prices.
Automotive revenue was $349 million in 2015, a decrease of $8 million, or 2%, from $357 million in 2014. This decrease was primarily due to lower fuel surcharge revenue and lower volumes driven by weaker traffic to Western Canada, partially offset by the favourable impact of the change in FX.
Domestic Intermodal
|
| | | | | | | | | | | | | | | | | | | | | | | |
| | | | | 2016 vs. 2015 | 2015 vs. 2014 |
| For the year ended December 31 | 2016 | 2015 | 2014 | Total Change | % Change | FX Adjusted
% Change | Total Change | % Change | FX Adjusted
% Change |
| Freight revenues (in millions) | $ | 721 |
| $ | 757 |
| $ | 787 |
| $ | (36 | ) | (5 | ) | (5 | ) | $ | (30 | ) | (4 | ) | (6 | ) |
| Carloads (in thousands) | 427 |
| 414 |
| 428 |
| 13 |
| 3 |
| N/A |
| (14 | ) | (3 | ) | N/A |
|
| Revenue ton-miles (in millions) | 11,992 |
| 12,072 |
| 11,867 |
| (80 | ) | (1 | ) | N/A |
| 205 |
| 2 |
| N/A |
|
| Freight revenue per carload (dollars) | $ | 1,688 |
| $ | 1,831 |
| $ | 1,837 |
| $ | (143 | ) | (8 | ) | N/A |
| $ | (6 | ) | — |
| N/A |
|
| Freight revenue per revenue ton-mile (cents) | 6.01 |
| 6.27 |
| 6.63 |
| (0.26 | ) | (4 | ) | N/A |
| (0.36 | ) | (5 | ) | N/A |
|
Domestic intermodal revenue was $721 million in 2016, a decrease of $36 million, or 5%, from $757 million in 2015. This decrease was primarily due to lower fuel surcharge revenue as a result of lower fuel prices, and lower average freight revenue per revenue ton-mile as a result of fewer shipments using temperature controlled equipment. The favourable impact of the change in FX partially offset this decrease.
Domestic intermodal revenue was $757 million in 2015, a decrease of $30 million, or 4%, from $787 million in 2014. This decrease was primarily due to lower fuel surcharge revenue, partially offset by the favourable impact of the change in FX, and increased transcontinental traffic.
International Intermodal
|
| | | | | | | | | | | | | | | | | | | | | | | |
| | | | | 2016 vs. 2015 | 2015 vs. 2014 |
| For the year ended December 31 | 2016 | 2015 | 2014 | Total Change | % Change | FX Adjusted
% Change | Total Change | % Change | FX Adjusted
% Change |
| Freight revenues (in millions) | $ | 590 |
| $ | 592 |
| $ | 588 |
| $ | (2 | ) | — |
| (2 | ) | $ | 4 |
| 1 |
| (5 | ) |
| Carloads (in thousands) | 549 |
| 559 |
| 546 |
| (10 | ) | (2 | ) | N/A |
| 13 |
| 2 |
| N/A |
|
| Revenue ton-miles (in millions) | 12,865 |
| 11,931 |
| 11,723 |
| 934 |
| 8 |
| N/A |
| 208 |
| 2 |
| N/A |
|
| Freight revenue per carload (dollars) | $ | 1,074 |
| $ | 1,061 |
| $ | 1,077 |
| $ | 13 |
| 1 |
| N/A |
| $ | (16 | ) | (1 | ) | N/A |
|
| Freight revenue per revenue ton-mile (cents) | 4.59 |
| 4.96 |
| 5.02 |
| (0.37 | ) | (7 | ) | N/A |
| (0.06 | ) | (1 | ) | N/A |
|
International intermodal revenue was $590 million in 2016, a slight decrease of $2 million from $592 million in 2015. The decrease was primarily due to a decrease in freight revenue per revenue ton-mile due to fewer revenue generating moves of empty customer containers, and lower fuel surcharge revenue as a result of lower fuel prices. This decrease was offset by an increase in revenue ton-miles, as a result of longer haul shipments through the Port of Vancouver, and the favourable impact of the change in FX.
International intermodal revenue was $592 million in 2015, an increase of $4 million, or 1%, from $588 million in 2014. This increase was primarily due to the favourable impact of the change in FX, partially offset by lower fuel surcharge revenue.
Operating Expenses
(1) Purchased services and other includes a $68 million gain on sale of D&H South in 2015.
|
| | | | | | | | | | | | | | | | | | | | | | | |
| | | | 2016 vs. 2015 | 2015 vs. 2014 |
| For the year ended December 31 (in millions) | 2016 |
| 2015 |
| 2014 |
| Total Change | % Change | FX Adjusted % Change(1) | Total Change | % Change | FX Adjusted % Change(1) |
| Compensation and benefits | $ | 1,189 |
| $ | 1,371 |
| $ | 1,348 |
| $ | (182 | ) | (13 | ) | (14 | ) | $ | 23 |
| 2 |
| (3 | ) |
| Fuel | 567 |
| 708 |
| 1,048 |
| (141 | ) | (20 | ) | (23 | ) | (340 | ) | (32 | ) | (41 | ) |
| Materials | 180 |
| 184 |
| 193 |
| (4 | ) | (2 | ) | (3 | ) | (9 | ) | (5 | ) | (7 | ) |
| Equipment rents | 173 |
| 174 |
| 155 |
| (1 | ) | (1 | ) | (3 | ) | 19 |
| 12 |
| 1 |
|
| Depreciation and amortization | 640 |
| 595 |
| 552 |
| 45 |
| 8 |
| 7 |
| 43 |
| 8 |
| 4 |
|
| Purchased services and other | 905 |
| 1,060 |
| 985 |
| (155 | ) | (15 | ) | (16 | ) | 75 |
| 8 |
| 1 |
|
| Gain on sale of D&H South | — |
| (68 | ) | — |
| 68 |
| (100 | ) | (100 | ) | (68 | ) | 100 |
| 100 |
|
| Total operating expenses | $ | 3,654 |
| $ | 4,024 |
| $ | 4,281 |
| $ | (370 | ) | (9 | ) | (11 | ) | $ | (257 | ) | (6 | ) | (12 | ) |
(1) FX Adjusted % Change does not have any standardized meaning prescribed by GAAP and, therefore is unlikely to be comparable to similar measures presented by other companies. FX adjusted variance is defined and reconciled in Non-GAAP Measures of this Item 7. Management's Discussion and Analysis of Financial Condition and Results of Operations.
Operating expenses were $3,654 million in 2016, a decrease of $370 million, or 9%, from $4,024 million in 2015. This decrease was primarily due to:
efficiencies generated from improved operating performance and asset utilization;
lower volume variable expenses;
change of $122 million in defined benefit pension plan from an expensecomprised of $32 milliona Basic Defined Benefit Pension Plan (Basic DB Plan) and a Supplemental Pension (Supplemental Pension Plan) for earnings in 2015 to $90 million in income in 2016;
the favourable impact of $100 million from lower fuel prices; and
a $32 million increase in land sales.
This decrease was partially offset by:
the unfavourable impactexcess of the changeIRS compensation limits in FXthe Basic DB Plan, which provides retirement benefits in excess of $77 million;
the
gainbenefits payable from the Basic DB Plan. The benefit is based on
saleage, service and a percentage of
D&H Southfinal average compensation.The pension formula uses the final average monthly earnings and calculates a benefit of $68 million0.5% up to the Tier 1 Railroad Retirement Board limit and 1.25% in 2015;
higher depreciationexcess of that limit, and amortization duemultiplies that by the years of service to a higher asset base; and
maximum of 30 years. An unreduced pension is available for all employees under this plan as early as age 62 with 30 years of service with the impact of wage andnormal retirement benefit inflation of approximately 3%.
Operating expenses were $4,024 millionpayable at age 65.Mr. Brooks participated in 2015, a decrease of $257 million, or 6%, from $4,281 millionthe Basic DB Plan in 2014. This decrease was primarily due to:
2018. | | | | | | | | | | | | | | | | | | | | | | | | | | | | | | | | |
| | | Years of credited service | | | Annual benefits payable | | | Opening present
value of defined
benefit obligation
($) | | | Compensatory
change
($) | | | Non-Compensatory
change
($) | | | Closing present
value of defined
benefit
obligation
($) | |
| Name | | At December 31, 2018 | | | At age 65 | | | At year end
($) | | | At age 65
($) | |
John Brooks | | | 10.17 | | | | 27.25 | | | | 81,285 | | | | 217,800 | | | | 477,084 | | | | 166,898 | | | | (72,711 | ) | | | 571,271 | |
401(k) plan
Individuals can makepre-tax contributions to the favourable impact of $403 million from lower fuel prices;
efficiencies generated from improved operating performance and asset utilization;
the favourable impact of $87 million from lower stock-based compensation primarily driven401(k) plan subject to limitations imposed by the
changeU.S. Internal Revenue Service. The company provides a matching contribution of 50% on the first 6% of eligible earnings. All contributions vest immediately.47
U.S. Salaried Retirement Income Plan
The U.S. Salaried Retirement Income Plan is employer-funded with an annual contribution amount equal to 3.5% of eligible earnings, which include base salary and annual bonus. These earnings are subject to compensation limitations imposed by the IRS in stock pricethe U.S. These amounts are included in the summary compensation table underAll other compensation.
Supplemental defined contribution plan (U.S. DC SERP)
The U.S. DC SERP is an unfunded,non-qualified defined contribution plan that provides an additional company contribution equal to 6% of eligible earnings without regard to the limitations imposed by the IRS in the U.S. Eligible earnings include base salary and lower incentive-based compensation;
the $68 million favourable gain on sale of D&H South;
lower volume variable expenses; and
a $42 million increaseannual bonus. In addition, for earnings in land sales.
This decrease was partially offset by:
the unfavourable impactexcess of the change in FX of $306 million;
a change of $84 million in defined benefit pension plan from $52 million in income in 2014 to an expense of $32 million in 2015;
the impact of wage and benefit inflation of approximately 3%; and
higher casualty expenses as a result of more costly incidents of $37 million.
Compensation and Benefits
Compensation and benefits expense includes employee wages, salaries, fringe benefits and stock-based compensation. Compensation and benefits expense was $1,189 million in 2016, a decrease of $182 million, or 13%, from $1,371 million in 2015. This decrease was primarily due to:
change of $122 million in defined benefit pension plan from an expense of $32 million in 2015 to $90 million in income in 2016;
lower costs achieved through job reductions;
lower volume variable expenses as a result of a decrease in workload as measured by GTMs;
road and yard efficiencies as a result of continuing strong operational performance; and
the favourable impact of $20 million from lower stock-based compensation and incentive-based compensation.
This decrease was partially offsetlimitations imposed by the impact of wage and benefit inflation of approximately 3% and the unfavourable impact of the change in FX of $18 million.
Compensation and benefits expense was $1,371 million in 2015,U.S. Internal Revenue Code, an increase of $23 million, or 2%, from $1,348 million in 2014. This increase was primarily due to:
a change of $84 million in defined benefit pension plan from $52 million in income in 2014 to an expense of $32 million in 2015;
the unfavourable impact of the change in FX of $62 million; and
the impact of wage and benefit inflation of approximately 3%.
This increase was partially offset by:
the favourable impact of $87 million from lower stock-based compensation primarily driven by the change in stock price and lower incentive-based compensation;
lower costs achieved through job reductions;
road and yard efficiencies as a result of continuing strong operational performance; and
lower volume variable expenses as a result of a decrease in workload as measured by GTMs.
Fuel
Fuel expense consists mainly of fuel used by locomotives and includes provincial, state and federal fuel taxes. Fuel expense was $567 million in 2016, a decrease of $141 million, or 20%, from $708 million in 2015. This decrease was primarily due to:
lower fuel prices with a favourable impact of $100 million;
a reduction in workload, as measured by GTMs; and
improvements in fuel efficiency of approximately 2% as a result of increased locomotive productivity, operational fluidity and the advancement of the Company’s fuel conservation strategies.
This decrease was partially offset by the unfavourable impact of the change in FX of $25 million.
Fuel expense was $708 million in 2015, a decrease of $340 million, or 32%, from $1,048 million in 2014. This decrease was primarily due to:
lower fuel prices with a favourable impact of $403 million;
a reduction in workload, as measured by GTMs; and
improvements in fuel efficiency of approximately 3% as a result of increased locomotive productivity, operational fluidity and the advancement of the Company’s fuel conservation strategies.
This decrease was partially offset by the unfavourable impact of the change in FX of $143 million.
Materials
Materials expense includes the cost of material used for track, locomotive, freight car, building maintenance and software sustainment. Materials expense was $180 million in 2016, a decrease of $4 million, or 2%, from $184 million in 2015. This decrease was primarily due to lower car repair and locomotive maintenance costs.
Materials expense was $184 million in 2015, a decrease of $9 million, or 5%, from $193 million in 2014. This decrease was primarily due to lower locomotive units maintained.
Equipment Rents
Equipment rents expense includes the cost associated with using other companies’ freight cars, intermodal equipment, and locomotives, net of rental income received from other railways for the use of CP’s equipment. Equipment rents expense was $173 million in 2016, a decrease of $1 million, or 1%, from $174 million in 2015. This decrease was primarily due to the purchase or return of leased freight cars reducing rental expenses by $12 million. This decrease was partially offset by the return of subleased locomotives and freight cars reducing rental income by $6 million and the unfavourable impact of the change in FX of $5 million.
Equipment rents expense was $174 million in 2015, an increase of $19 million, or 12%, from $155 million in 2014. This increase was primarily due to the unfavourable impact of the change in FX of $18 million, a return of subleased locomotives reducing rental income by $15 million, and a decrease in car hire expense resulting from the lower use of CP's equipment by other railroads. This increase was largely offset by the purchase of previously leased freight cars reducing rental expenses by $21 million and lower use of foreign equipment.
Depreciation and Amortization
Depreciation and amortization expense represents the charge associated with the use of track and roadway, buildings, rolling stock, information systems and other depreciable assets. Depreciation and amortization expense was $640 million for 2016, an increase of $45 million, or 8%, from $595 million in 2015. This increase was primarily due to a higher depreciable asset base and the unfavourable impact of the change in FX of $5 million.
Depreciation and amortization expense was $595 million for 2015, an increase of $43 million, or 8%, from $552 million in 2014. This increase was primarily due to a higher depreciable asset base and the unfavourable impact of the change in FX of $18 million.
Purchased Services and Other
|
| | | | | | | | | | | | | | | | | | |
| | | | 2016 vs. 2015 | 2015 vs. 2014 |
| For the year ended December 31 (in millions) | 2016(1) |
| 2015 |
| 2014 |
| % Change | Total Change | % Change | Total Change |
| Support and facilities | $ | 271 |
| $ | 298 |
| $ | 297 |
| (9 | ) | $ | (27 | ) | — | $ | 1 |
|
| Track and operations | 238 |
| 266 |
| 243 |
| (11 | ) | (28 | ) | 9 | 23 |
|
| Intermodal | 180 |
| 184 |
| 176 |
| (2 | ) | (4 | ) | 5 | 8 |
|
| Equipment | 165 |
| 196 |
| 166 |
| (16 | ) | (31 | ) | 18 | 30 |
|
| Casualty | 68 |
| 74 |
| 35 |
| (8 | ) | (6 | ) | 111 | 39 |
|
| Property taxes | 116 |
| 103 |
| 94 |
| 13 |
| 13 |
| 10 | 9 |
|
| Other | (27 | ) | 13 |
| 6 |
| (308 | ) | (40 | ) | 117 | 7 |
|
| Land sales | (106 | ) | (74 | ) | (32 | ) | 43 |
| (32 | ) | 131 | (42 | ) |
| Total Purchased services and other | $ | 905 |
| $ | 1,060 |
| $ | 985 |
| (15 | ) | $ | (155 | ) | 8 | $ | 75 |
|
(1) Certain prior quarters' figures have been revised to conform with current presentation.
Purchased services and other expense encompasses a wide range of third-party costs, including contractor and consulting fees, locomotive and freight car repairs performed by third parties, property and other taxes, intermodal pickup and delivery services, casualty expense, expenses for joint facilities, and gains on land sales. Purchased services and other expense was $905 million in 2016, a decrease of $155 million, or 15%, from $1,060 million in 2015. This decrease was primarily due to:
lower third party service costs, reported in Track and operations and Support and facilities;
a $17 million gain on sale of surplus freight cars, and a reduction in accrued discontinuance costs for certain branch lines, reported in Other;
higher land sales of $32 million resulting from optimization of the Company's assets, as discussed further below;
lower crew travel and accommodations costs, reported in Track and operations;
lower third-party freight car and locomotive maintenance costs, reported in Equipment; and
lower casualty expenses of $8 million (excluding FX) as a result of lower third party claims and incident related environmental costs due to effective incident response and case management. Thisadditional 3.5% contribution is partially offset by higher personal injury costs.
This decrease was partially offset by the unfavourable impact of the change in FX of $21 million and higher property taxes of $12 million (excluding FX).
Purchased services and other expense was $1,060 million in 2015, an increase of $75 million, or 8%, from $985 million in 2014. This increase was primarily due to:
the unfavourable impact of the change in FX of $60 million;
higher casualty expenses as a result of more costly incidents, reported in Casualty;
higher intermodal expenses related to pickup and delivery service, reported in Intermodal;
increased locomotive overhauls, reported in Equipment; and
higher legal fees and support costs, reported in Support and facilities.
This increase was partially offset by higher land sales of $42 million and efficiencies generated from the insourcing of certain IT activities, included in Support and facilities.
As part of optimizing its assets, themade. Company may identify and dispose of property used or formerly used in operating activities. The Company includes as part of operating expenses the gains and losses that arise on disposal of such long-lived assets. The following disposals have impacted Purchased services and other during the current and comparative periods:
in the fourth quarter of 2016, the Company completed the sale of CP's Obico rail yard for gross proceeds of $38 million and a gain on sale of $37 million;
in the second quarter of 2016, the Company disposed of 1,000 surplus freight cars that had reached or were nearingcontributions cliff vest at the end of
their useful life, in a non-monetary exchange for new freight cars. The Company recognized a gain on sale of $17 million from the transactionthree years.Mr. Creel, Mr. Johnson and the sale did not impact cash from investing activities;
Mr. Pitz participate in the
first quarterU.S. DC SERP in 2018.The table below shows the U.S. Salaried Retirement Income Plan and U.S. DC SERP account information in 2018.
| | | | | | | | | | | | |
| | | Accumulated value at start of year ($) | | | Compensatory ($) | | | Accumulated value at year end ($) | |
Keith Creel | | | 844,355 | | | | 22,156 | | | | 821,911 | |
Robert Johnson | | | 298,426 | | | | 105,825 | | | | 391,619 | |
Laird Pitz | | | 187,392 | | | | 87,126 | | | | 261,149 | |
The values in the table have been converted to Canadian dollars using the 2018 average exchange rate of 2016,$1.2957.
About deferred compensation
Executive officers and members of senior management who have not met their share ownership requirement can choose to defer all or part of their short-term incentive by receiving it as deferred share units. They cannot defer more than the Company completedamount needed to meet the salerequirement, which includes our 25% match of CP’s Arbutus Corridorthe amount deferred in the year the bonus is actually paid. The matching units vest after three years.
Elections must be made before the beginning of the new fiscal year. The amount is converted to DSUs using the Cityaverage market price of Vancouvera CP common share for gross proceedsthe 10 trading days immediately before December 31 of $55 millionthe performance year.
The table below shows the number of DSUs outstanding and a gaintheir value based on sale of $50 million. The agreement allowsour closing share price on December 31, 2018.
| | | | | | | | | | | | | | | | |
| | | Unvested DSUs (#) | | | Vested DSUs (#) | | | Total units ($) | | | Value as at December 31, 2018 ($) | |
Keith Creel | | | - | | | | 31,530 | | | | 31,530 | | | | 7,640,009 | |
Nadeem Velani | | | 123 | | | | 1,499 | | | | 1,622 | | | | 392,913 | |
Robert Johnson | | | 160 | | | | 6,258 | | | | 6,418 | | | | 1,555,140 | |
John Brooks | | | - | | | | 999 | | | | 999 | | | | 242,067 | |
Laird Pitz | | | 524 | | | | 3,866 | | | | 4,390 | | | | 1,063,737 | |
We valued the Company tooutstanding DSUs using $242.24, our closing share in future proceedsprice on the eventual development and/TSX on December 31, 2018 for Mr. Velani, and US$177.62, our closing share price on the NYSE and converted to Canadian dollars using ayear-end exchange rate of $1.3642 for Mr. Creel, Mr. Johnson, Mr. Brooks and Mr. Pitz.
DSUs are redeemed for cash six months after the executive retires or sale of certain parcelsleaves the company, or up until the end of the Arbutus Corridor; and
following calendar year for Canadian executives. U.S. executives who participate in the first quarter of 2015,DSU plan must redeem their DSUs after the Company recorded gains on land sales totalling $60 million, including a gain of $31 million following the sale of a building after resolution of legal proceedings, and various sections of land in eastern Canada for transit purposes.
Gain on Sale of D&H South
On November 17, 2014, the Company announced a proposed agreement with NS for the sale of approximately 283 miles of the Delaware and Hudson Railway Company, Inc.’s line between Sunbury, Pennsylvania, and Schenectady, New York, ("D&H South").
During the first quarter of 2015, the Company finalized the sales agreement with NS for D&H South. The sale, which received approval by the STB on May 15, 2015, was completed on September 18, 2015 for proceeds of $281 million (U.S. $214 million). The Company recorded a gain on sale of $68 million ($42 million after tax) from the transaction during the third quarter of 2015.
Other Income Statement Items
Other Income and Charges
Other income and charges consists of gains and losses from the change in FX on long-term debt, working capital, various costs relatedsix-month waiting period to financing, shareholder costs, equity income and other non-operating expenditures. Other income and charges was a gain of $45 million in 2016, compared to an expense of $335 million in 2015, a change of $380 million, or 113%. This was primarily due to the favourable impact of FX translation of $79 million on U.S. dollar-denominated debt in 2016 compared to the unfavourable impact of FX translation of $297 million on U.S. dollar-denominated debt in 2015 and a $47 million premium charged upon early redemption of notes in the third quarter of 2015. This was partially offset by a legal settlement charge of $25 million in the third quarter of 2016. This is discussed further in Non-GAAP Measures of this Item 7. Management’s Discussion and Analysis of Financial Condition and Results of Operations.
Other income and charges was an expense of $335 million in 2015, compared with an expense of $19 million in 2014, a change of $316 million, or 1,663%. This increase was primarily due to the unfavourable impact of FX translation of $297 million on U.S. dollar-denominated debt and the loss of $47 million on early redemption of notes. The increase was partially offset by $24 million of other FX gains and losses.
Net Interest Expense
Net interest expense includes interest on long-term debt and capital leases. Net interest expense was $471 million in 2016, an increase of $77 million, or 20%, from $394 million in 2015. This increase was primarily due to interest on new debt issued during the third quarter in 2015 and the unfavourable impact of the change in FX of $11 million, partially offset by higher capitalized interest.
Net interest expense was $394 million in 2015, an increase of $112 million, or 40%, from $282 million in 2014. This increase was primarily due to the unfavourable impact of the change in FX of $37 million and interest on new debt issued during the third quarter in 2015.
Income Tax Expense
Income tax expense was $553 million in 2016. This represents a decrease of $54 million, or 9%, from $607 million in 2015. The decrease is due primarily to a lower effective income tax rate in 2016, partially offset by higher taxable earnings in 2016.
Income tax expense was $607 million in 2015. This represents an increase of $45 million, or 8%, from $562 million in 2014. The increase was due to a higher effective income tax rate, partially offset by lower taxable earnings in 2015.
The effective income tax rate for 2016 was 25.68% on reported income and 26.15% on Adjusted income. Adjusted income is a Non-GAAP measure, which is discussed further in Non-GAAP Measures of this Item 7. Management’s Discussion and Analysis of Financial Condition and Results of Operations.
The effective income tax rate for 2015 was 30.95% on reported income and 27.25% on Adjusted income, compared with 27.59% on reported income and 27.58% on Adjusted income for 2014.
The Company expects a normalized 2017 income tax rate of approximately 26.50%. The Company’s 2017 outlook for its normalized income tax rate is based on certain assumptions about events and developments that may or may not materialize, or that may be offset entirely or partially by new events and developments. This is discussed further in Item 1A. Risk Factors.
Liquidity and Capital Resources
The Company believes adequate amounts of Cash and cash equivalents are available in the normal course of business to provide for ongoing operations, including the obligations identified in the tables in Contractual Commitments of this Item 7. Management’s Discussion and Analysis of Financial Condition and Results of Operations. The Company is not aware of any trends or expected fluctuations in the Company's liquidity that would create any deficiencies. The Company's primary sources of liquidity include its Cash and cash equivalents, its bilateral letter of credit facilities, and its revolving credit facility.
As at December 31, 2016, the Company had $164 million of Cash and cash equivalents, U.S. $2.0 billion available under its revolving credit facilities and up to $280 million available under its letters of credit (December 31, 2015 – $650 million of Cash and cash equivalents, U.S. $2.0 billion available under revolving credit facilities and up to $225 million available under its letters of credit).
As at December 31, 2016, the Company's U.S. $2.0 billion revolving credit facility, which includes a U.S. $1.0 billion five-year portion and U.S. $1.0 billion one-year plus one-year term-out portion, was undrawn (December 31, 2015 – undrawn). On June 28, 2016, the maturity date on the U.S. $1.0 billion one-year plus one-year term-out portion was extended to June 28, 2018, and the maturity date on the U.S. $1.0 billion five year portion was extended to June 28, 2021. The Company did not draw significant amounts from its revolving credit facility during the year ended December 31, 2016 (December 31, 2015 – $nil). The revolving credit facility agreement requires the Company not to exceed a maximum debt to earnings before interest, tax, depreciation, and amortization ratio. As at December 31, 2016, the Company was in compliance with U.S. tax regulations. We use the threshold stipulatedaverage market price of a CP common share for the 10 trading days immediately before the payment date to calculate the amount, which the participant receives in this financial covenant.
The Company has a
commercial paper program that enables itlump sum.48
Termination and change in control
Termination of employment
We have policies to issue commercial paper up to a maximum aggregate principal amountcover different kinds of U.S. $1.0 billion in the formtermination of unsecured promissory notes. The commercial paperemployment.
Mr. Creel is backed by the U.S. $1.0 billion one-year plus one-year term-out portion of the revolving credit facility. During the year ended December 31, 2016, the maximum amount borrowedcovered under the commercial paper program was $308 million. These borrowings were issued on a short-term basis to finance the Company's share repurchase program. The Company used cash from operations to repay the amounts borrowed during the year, suchterms of his employment agreement effective January 31, 2017, as amended December 18, 2018 with terms effective as of January 1, 2019, that there were no commercial paper borrowings outstanding as at December 31, 2016 (December 31, 2015 – $nil).
As at December 31, 2016, under its bilateral letter of credit facilities, the Company had letters of credit drawn of $320 million from a total available amount of $600 million. This compares to letters of credit drawn of $375 million from a total available amount of $600 million as at December 31, 2015. Under the bilateral letter of credit facilities, the Company has the option to post collateral in the form of Cash or cash equivalents, equal at leastincludesnon-competition,non-solicitation and confidentiality restrictions. Mr. Velani, Mr. Johnson, Mr. Brooks and Mr. Pitz are subject to the face value of the letters of credit issued. Collateral provided may include
highly liquid investments purchased three months or less from maturitysame terms as all other employees for voluntary termination, retirement, termination for cause and is stated at cost, which approximates market value. As at December 31, 2016, the Company had posted $nil in collateral on the bilateral letter of credit facilities (December 31, 2015 – $nil).
The following discussion of operating, investing and financing activities describes the Company’s indicators of liquidity and capital resources.
Operating Activities
Cash provided by operating activities was $2,089 million in 2016 compared to $2,459 million in 2015, a decrease of $370 million. The decrease in cash provided by operating activities is primarily due to lower cash generating income and an unfavourable change in working capital primarily ascontrol, however, Mr. Velani, Mr. Brooks and Mr. Pitz signed a result of higher income taxes paidnon-competition,non-solicitation agreement in 2016 and an increase in interest payments resulting from debt issued in the third quarter of 2015.
Cash provided by operating activities was $2,459 million in 2015, an increase of $336 million from $2,123 million in 2014. This increase was primarily due to higher cash generating earnings, and improvements in working capital as a result of a decrease in Accounts receivable attributable to higher collection rates and lower income taxes paid, partially offset by an increase in interest payments resulting from debt issued in the third quarter of 2015.
Investing Activities
Cash used in investing activities was $1,069 million in 2016, a decrease of $54 million from $1,123 million in 2015. This decrease was largely due to lower additions to properties ("capital programs") during 2016 partially offset by the proceeds from the sale of D&H South2018 that occurred in 2015.
Cash used in investing activities was $1,123 million in 2015, a decrease of $38 million from $1,161 million in 2014. This decrease was primarily due to higher proceeds from line sales, including $281 million for D&H South in 2015 compared to $236 million for DM&E West in 2014, and the sale of other assets for higher proceeds of $114 million in 2015 compared to $52 million in 2014. This increase was partially offset by higher additions to properties in 2015.
Additions to properties were $1,182 million in 2016, a decrease of $340 million from $1,522 million in 2015. The decrease, primarily in track and roadway investments, is reflective of the track upgrade programs completed in 2015.
Additions to properties were $1,522 million in 2015, an increase of $73 million from $1,449 million in 2014. The increase, primarily in track and roadway investments, reflects CP’s strategy of reinvesting in the plant, enhancing throughput and capacity, and optimizing existing assets.
Capital Programs
|
| | | | | | | | | |
For the year ended December 31 (in millions, except for track miles and crossties) | 2016 |
| 2015 |
| 2014 |
|
| Additions to capital | | | |
| Track and roadway | $ | 904 |
| $ | 1,119 |
| $ | 1,011 |
|
| Rolling stock | 105 |
| 158 |
| 219 |
|
Information systems(1) | 88 |
| 79 |
| 96 |
|
| Buildings and other | 108 |
| 180 |
| 150 |
|
| Total – accrued additions to capital | 1,205 |
| 1,536 |
| 1,476 |
|
| Less: | | | |
| Non-cash transactions | 23 |
| 14 |
| 27 |
|
| Cash invested in additions to properties (per Consolidated Statements of Cash Flows) | $ | 1,182 |
| $ | 1,522 |
| $ | 1,449 |
|
| Track installation capital programs | | | |
| Track miles of rail laid (miles) | 252 |
| 468 |
| 492 |
|
| Track miles of rail capacity expansion (miles) | 2 |
| 22 |
| 21 |
|
| Crossties installed (thousands) | 1,008 |
| 1,009 |
| 1,040 |
|
(1) Information systems include hardware and software.
Track and roadway expenditures include the replacement and enhancement of the Company’s track infrastructure. Of the $904 million additions in 2016, approximately $721 million was invested in the renewal of depleted assets, namely rail, ties, ballast, signals, and bridges. Approximately $33 million was spent on PTC compliance requirements and $150 million was invested in network improvements, which increased productivity and capacity.
Rolling stock investments encompass locomotives and freight cars. In 2016, expenditures on locomotives were approximately $51 million and were focused on the remanufacture of older six-axle units. Freight car investments of approximately $54 million were largely focused on the acquisition of existing units previously held under operating leases.
In 2016, CP invested approximately $88 million in information systems primarily focused on rationalizing and enhancing business systems, providing real-time data, and modernizing core hardware and applications. Investments in buildings and other items were $108 million, and include items such as facility upgrades and renovations, vehicles, containers, and shop equipment.
For 2017, CP expects to invest approximately $1.25 billion in its capital programs, which will be financed with cash generated from operations and leverages the considerable network upgrade and improvement investments that have been made over the last several years. Approximately 70% of planned capital programs are for track and roadway, including approximately $48 million for PTC. Approximately 10% to 15% is expected to be allocated to rolling stock assets, including locomotive improvements and the continued acquisition of freight cars previously held under operating leases. Between 5% and 10% is expected to be allocated to information services, and 10% is expected to be allocated to buildings and other.
Financing Activities
Cash used in financing activities was $1,493 million in 2016, an increase of $536 million from $957 million in 2015. This increase in cash used in financing activities was primarily due to issuance of long-term debt in 2015. This increase was partially offset by higher payments to buy back shares under the Company's share repurchase program and the net repayment of commercial paper and long-term debt in 2015.
Cash used in financing activities was $957 million in 2015, as compared to $1,630 million in 2014. This decrease was largely due to the issuance of long-term debt in 2015 and was partially offset by higher payments to buy back shares under the Company's share repurchase program and the net repayment of commercial paper compared to net issuances in 2014, and the early redemption of notes.
Interest Coverage Ratio
At December 31, 2016, the Company’s interest coverage ratio was 5.6, compared with 6.0 at December 31, 2015. This decrease was primarily due to an increase in Net interest expense of $77 million compared to the prior year, partially offset by a year over year improvement in Earnings before interest and taxes ("EBIT"). In 2016, EBIT was negatively impacted by a legal settlement charge and positively impacted by FX translation on U.S. dollar-denominated debt, while in 2015 EBIT was negatively impacted by FX translation on U.S. dollar-denominated debt and the early redemption premium on notes, and positively impacted by the gain on sale of D&H South.
Excluding these significant items from EBIT, Adjusted interest coverage ratio was 5.5 at December 31, 2016, compared with 6.7 at December 31, 2015. This decrease was primarily due to an increase in Net interest expense, as well as a year over year decrease in Adjusted EBIT. Interest coverage ratio, Adjusted interest coverage ratio, EBIT, Adjusted EBIT, and significant items are defined and reconciled in Non-GAAP Measures of this Item 7. Management’s Discussion and Analysis of Financial Condition and Results of Operations.
Credit Measures
Credit ratings provide information relating to the Company’s financing costs, liquidity and operations and affect the Company’s ability to obtain short-term and long-term financing and/or the cost of such financing.
A mid-investment grade credit rating is an important measure in assessing the Company’s ability to maintain access to public financing and to minimize the cost of capital. It also affects the ability of the Company to engage in certain collateralized business activities on a cost-effective basis.
Credit ratings and outlooks are based on the rating agencies’ methodologies and can change from time to time to reflect their views of CP. Their views are affected by numerous factors including, but not limited to, the Company’s financial position and liquidity along with external factors beyond the Company’s control.
As at December 31, 2016, CP's credit rating from Standard & Poor's Rating Services ("Standard & Poor's") and Moody's Investor Service ("Moody's") remains unchanged from December 31, 2015. During the second quarter of 2016, Moody's changed the outlook on CP's Senior unsecured debt to negative from stable, and Dominion Bond Rating Service Limited ("DBRS") changed the outlook on CP's Unsecured debentures and Medium-term notes from BBB (high) stable outlook to BBB (high) negative outlook. Subsequently, on August 2, 2016, DBRS downgraded the Company's credit rating from BBB (high) negative outlook to BBB with a stable outlook for unsecured debentures and medium-term notes and from R-2 (high) to R-2 (middle) for the $1 billion Commercial paper program. Standard & Poor's affirmed a stable rating on CP's Long-term corporate credit, Senior secured debt and Senior unsecured debt.
Credit ratings as at December 31, 2016(1)
had confidentiality restrictions. |
| | | | | | | | | |
Long-term debt |
| OutlookResignation | | Retirement | | Termination with cause | | Termination without cause | | Change in control |
Standard & Poor'sSeverance |
|
None | | None | | None | | Mr. Creel: 24 months of base salary Other named executives: per legislative requirements | | None |
Short-term incentive | Long-term corporate credit | BBB+Forfeited | stable | Award for current year ispro-rated to retirement date | | Forfeited | | Equal to the target award for severance period for Mr. Creel Other named executives: award for current year ispro-rated to termination date as per plan | | None |
DSUs | Senior secured debt | AUnvested DSUs are forfeited | stable | Unvested DSUs are forfeited | | Unvested DSUs are forfeited | | Unvested DSUs are forfeited | | Unvested units vest early if the holder is terminated following change in control |
Performance share units | Senior unsecured debt | BBB+Forfeited | stable | Award continues to vest based on performance factors and executive is entitled to receive the full value as long as they have worked for six months of the performance period, otherwise the award is forfeited | | Forfeited | | Pro-rated based on active service within the performance period | | Only vest if the executive is terminated following a change in control PSUs vest at target,pro-rated based on active service within the performance period |
Moody'sStock options |
|
Vested options are exercisable for 30 days or until the expiry date, whichever comes first Unvested options are forfeited Performance stock options are forfeited | | Options continue to vest Award expires five years after the retirement date or the normal expiry date, whichever is earlier Performance stock options are forfeited | | Forfeited | | Vested options are exercisable for six months following termination as well as any options that vest during thesix-month period Performance stock options are forfeited | | Options only vest early if the option holder is terminated following the change in control Performance stock options are forfeited |
Pension | Senior unsecured debt | Baa1No additional value | negative | No additional value | | No additional value | | No additional value | | No additional value |
DBRSESPP shares |
|
Unvested shares are forfeited | | Unvested shares vest | | Unvested shares are forfeited | | Unvested shares vest | | Unvested shares vest |
Benefits | Unsecured debentures | BBBEnd on resignation | stable | Post-retirement life insurance of $50,000 and a health spending account based on years of service (same for all employees) | | End on resignation | | None | | None |
Perquisites | Medium-term notes | BBBAny unused flex perquisite dollars are forfeited | stable |
|
Any unused flex perquisite dollars are forfeited |
|
|
$1 billion Commercial paper programAny unused flex perquisite dollars are forfeited |
|
|
Standard & Poor'sAny unused flex perquisite dollars are forfeited | A-2 | N/A |
Moody's |
| P-2 | N/A |
DBRS |
| R-2 (middle) | N/AAny unused flex perquisite dollars are forfeited |
49
(1) Credit ratings are not recommendationsThe next table shows the estimated incremental amounts that would be paid to purchase, hold or sell securities and do not address the market price or suitability of a specific security for a particular investor. Credit ratings are basedMr. Creel if his employment had been terminated without cause on the rating agencies' methodologies and may be subject to revision or withdrawal at any time by the rating agencies.
The Adjusted net debt to Adjusted earnings before interest, tax, depreciation and amortization (“EBITDA”) ratio for the years ended December 31, 2016, 2015, and 2014 was 2.9, 2.8 and 2.2, respectively. The increase between 2016 and 2015 was primarily due to a lower ending cash balance as at December 31, 2016 compared to December 31, 2015, as well as a decrease in Adjusted EBITDA for 2016. The increase between 2015 and 2014 was due to additional debt issued during the 2015 fiscal year, partially offset by the improved Adjusted income for the year ended December 31, 2015. Adjusted net debt to Adjusted EBITDA ratio and the Adjusted income are defined and reconciled in Non-GAAP Measures of this Item 7. Management’s Discussion and Analysis of Financial Condition and Results of Operations.
Free Cash
CP generated positive Free cash of $1,007 million in 2016, a decrease of $374 million from $1,381 million in 2015. The decrease was primarily due to lower cash provided by operating activities and proceeds from the sale of D&H South in the third quarter of 2015, partially offset by lower additions to properties in 2016. Free cash2018. There is affected by seasonal fluctuations and by other factors including the size of the Company's capital programs. The 2016 capital programs are discussed further above in Investing Activities. Free cash is defined and reconciled in the Non-GAAP Measures of this Item 7. Management’s Discussion and Analysis of Financial Condition and Results of Operations.
At February 14, 2017, the latest practicable date, there were 146,366,093 Common Shares and no preferred shares issued and outstanding, which consists of 14,931 holders of record of the Company's Common Shares. In addition, CP has a Management Stock Option Incentive Plan (“MSOIP”), under which key officers and employees are granted options to purchase CP Common Shares. Each option granted can be exercised for one Common Share. At February 14, 2017, 2.0 million options were outstanding under the Company’s MSOIP and stand-alone option agreements entered into with Mr. Keith Creel and former CEO, Mr. E. Hunter Harrison. There are 1.5 million options available to be issued by the Company’s MSOIP in the future.excise taxgross-up
CP has a Director's Stock Option Plan (“DSOP”), under which directors are granted options to purchase CP Common Shares. There are no outstanding options under the DSOP, which has 0.3 million options available to be issued in the future.
Non-GAAP Measures
The Company presents non-GAAP measures and cash flow information to provide a basis for evaluating underlying earnings and liquidity trends in the Company’s business that can be compared with the results of operations in prior periods. In addition, these non-GAAP measures facilitate a multi-period assessment of long-term profitability, allowing management and other external users of the Company’s consolidated financial information to compare profitability on a long-term basis, including assessing future profitability, with that of the Company’s peers.
These non-GAAP measures have no standardized meaning and are not defined by GAAP and, therefore may not be comparable to similar measures presented by other companies. The presentation of these non-GAAP measures is not intended to be considered in isolation from, as a substitute for, or as superior to the financial information presented in accordance with GAAP.
Adjusted Performance Measures
The Company uses Adjusted income, Adjusted diluted earnings per share, Adjusted operating income, and Adjusted operating ratio to evaluate the Company’s operating performance and for planning and forecasting future business operations and future profitability. These non-GAAP measures are presented in Item 6. Selected Financial Data and discussed further in other sections of this Item 7. Management’s Discussion and Analysis of Financial Condition and Results of Operations. These non-GAAP measures provide meaningful supplemental information regarding operating results because they exclude certain significant items that are not considered indicative of future financial trends either by nature or amount. As a result, these items are excluded for management assessment of operational performance, allocation of resources and preparation of annual budgets. These significant items may include, but are not limited to, restructuring and asset impairment charges, individually significant gains and losses from sales of assets, and certain items outside the control of management. These items may not be non-recurring. However, excluding these significant items from GAAP results allows for a consistent understanding of the Company's consolidated financial performance when performing a multi-period assessment including assessing the likelihood of future results. Accordingly, these non-GAAP financial measures may provide insight to investors and other external users of the Company's consolidated financial information.
In 2016, there were two significant items included in Net income as follows:
in the third quarter, a $25 million expense ($18 million after current tax) related to a legal settlement that unfavourably impacted Diluted EPS by 12 cents; and
during the course of the year, a net non-cash gain of $79 million ($68 million after deferred tax) due to FX translation of the Company’s U.S. dollar-denominated debt as follows:
in the fourth quarter, a $74 million loss ($64 million after deferred tax) that unfavourably impacted Diluted EPS by 43 cents;
in the third quarter, a $46 million loss ($40 million after deferred tax) that unfavourably impacted Diluted EPS by 27 cents;
in the second quarter, a $18 million gain ($16 million after deferred tax) that favourably impacted Diluted EPS by 10 cents; and
in the first quarter, a $181 million gain ($156 million after deferred tax) that favourably impacted Diluted EPS by $1.01.
In 2015, there were four significant items included in Net income as follows:
in the third quarter, a $68 million gain ($42 million after current tax) related to the sale of D&H South that favourably impacted Diluted EPS by 26 cents;
in the third quarter, a $47 million charge ($35 million after deferred tax) related to the early redemption premium on notes that unfavourably impacted Diluted EPS by 22 cents;
in the second quarter, a deferred income tax expense of $23 million as a result of the change in the Alberta provincial corporate income tax rate that unfavourably impacted Diluted EPS by 14 cents; and
during the course of the year, a net non-cash loss of $297 million ($257 million after deferred tax) due to FX translation of the Company’s U.S. dollar-denominated debt as follows:
in the fourth quarter, a $115 million loss ($100 million after deferred tax) that unfavourably impacted Diluted EPS by 64 cents;
in the third quarter, a $128 million loss ($111 million after deferred tax) that unfavourably impacted Diluted EPS by 69 cents;
in the second quarter, a $10 million gain ($9 million after deferred tax) that favourably impacted Diluted EPS by 5 cents; and
in the first quarter, a $64 million loss ($55 million after deferred tax) that unfavourably impacted Diluted EPS by 34 cents.
In 2014, there were two significant items included in Net income as follows:
in the fourth quarter, a net non-cash loss of $12 million ($9 million after deferred tax) due to FX translation on the Company’s U.S. dollar-denominated debt that unfavourably impacted Diluted EPS by 5 cents; and
in the first quarter, a recovery of $4 million ($3 million after current tax) was recorded for the Company's 2012 labour restructuring initiative due to favourable experience gains, recorded in Compensation and benefits that favourably impacted Diluted EPS by 1 cent.
In 2013, there were five significant items included in Net income as follows:
in the fourth quarter, an asset impairment charge and accruals for future costs totalling $435 million ($257 million after deferred tax) relating to the sale of DM&E West, which closed in the second quarter of 2014 and unfavourably impacted Diluted EPS by $1.46;
in the fourth quarter, management transition costs related to the retirement of the Company’s CFO and the appointment of the new CFO of $5 million ($4 million after current tax) that unfavourably impacted Diluted EPS by 2 cents;
in the fourth quarter, a recovery of $7 million ($5 million after current tax) of the Company’s 2012 labour restructuring initiative due to favourable experience gains that favourably impacted Diluted EPS by 3 cents;
in the third quarter, a deferred income tax expense of $7 million as a result of the change in the province of British Columbia’s corporate income tax rate that unfavourably impacted Diluted EPS by 4 cents; and
in the first quarter, a recovery of U.S. $9 million (U.S. $6 million after current tax) related to settlement of certain management transition amounts, which had been subject to legal proceedings, that favourably impacted Diluted EPS by 3 cents.
In 2012, there were six significant items included in Net income as follows:
in the fourth quarter, an asset impairment charge of $185 million ($111 million after deferred tax) with respect to the option to build into the Powder River Basin and another investment that unfavourably impacted Diluted EPS by 64 cents;
in the fourth quarter, an asset impairment charge of $80 million ($59 million after deferred tax) related to a certain series of locomotives that unfavourably impacted Diluted EPS by 34 cents;
in the fourth quarter, a labour restructuring charge of $53 million ($39 million after current tax) as part of a restructuring initiative that unfavourably impacted Diluted EPS by 22 cents;
in the second quarter, a charge of $42 million ($29 million after current tax) with respect to compensation and other management transition costs that unfavourably impacted Diluted EPS by 17 cents;
in the first and second quarters, advisory fees of $27 million ($20 million after current tax) related to shareholder matters that unfavourably impacted Diluted EPS by 12 cents; and
in the second quarter, a deferred income tax expense of $11 million as a result of the change in the province of Ontario's corporate income tax rate that unfavourably impacted Diluted EPS by 6 cents.
Reconciliation of Non-GAAP Performance Measures to GAAP Performance Measures
The following tables reconcile non-GAAP measures presented in Item 6. Selected Financial Data and discussed further in other sections of this Item 7. Management’s Discussion and Analysis of Financial Condition and Results of Operations to the most directly comparable measures presented in accordance with GAAP for the years ended December 31, 2016, 2015, 2014, 2013 and 2012:
Adjusted income is calculated as Net income reported on a GAAP basis less significant items.
|
| | | | | | | | | | | | | | | |
Net income | For the year ended
December 31 |
| (in millions) | 2016 | 2015 | 2014 | 2013 | 2012 |
| Adjusted income | $ | 1,549 |
| $ | 1,625 |
| $ | 1,482 |
| $ | 1,132 |
| $ | 753 |
|
| Add significant items (pretax): |
|
|
|
|
|
| Legal settlement charge | (25 | ) | — |
| — |
| — |
| — |
|
| Gain on sale of D&H South | — |
| 68 |
| — |
| — |
| — |
|
| Labour restructuring | — |
| — |
| 4 |
| 7 |
| (53 | ) |
| Asset impairments | — |
| — |
| — |
| (435 | ) | (265 | ) |
| Management transition costs | — |
| — |
| — |
| 4 |
| (42 | ) |
| Advisory fees related to shareholder matters | — |
| — |
| — |
| — |
| (27 | ) |
| Impact of FX translation on U.S. dollar-denominated debt | 79 |
| (297 | ) | (12 | ) | — |
| — |
|
| Early redemption premium on notes | — |
| (47 | ) | — |
| — |
| — |
|
| Income tax rate change | — |
| (23 | ) | — |
| (7 | ) | (11 | ) |
Tax effect of adjustments(1) | (4 | ) | 26 |
| 2 |
| 174 |
| 129 |
|
| Net income as reported | $ | 1,599 |
| $ | 1,352 |
| $ | 1,476 |
| $ | 875 |
| $ | 484 |
|
(1) Tax effect of adjustments was calculated as the pretax effect of the adjustments multiplied by the effective tax rate for each of the above items for the periods presented.
Adjusted diluted earnings per share is calculated using Adjusted income, as defined above, divided by the weighted-average diluted shares outstanding during the period as determined in accordance with GAAP.
|
| | | | | | | | | | | | | | | |
| Diluted earnings per share | For the year ended
December 31 |
| 2016 | 2015 | 2014 | 2013 | 2012 |
Adjusted diluted earnings per share
| $ | 10.29 |
| $ | 10.10 |
| $ | 8.50 |
| $ | 6.42 |
| $ | 4.34 |
|
| Add significant items (pretax): |
|
|
|
|
|
| Legal settlement charge | (0.17 | ) | — |
| — |
| — |
| — |
|
| Gain on sale of D&H South | — |
| 0.42 |
| — |
| — |
| — |
|
| Labour restructuring | — |
| — |
| 0.02 |
| 0.04 |
| (0.31 | ) |
| Asset impairments | — |
| — |
| — |
| (2.47 | ) | (1.53 | ) |
| Management transition costs | — |
| — |
| — |
| 0.02 |
| (0.24 | ) |
| Advisory fees related to shareholder matters | — |
| — |
| — |
| — |
| (0.16 | ) |
| Impact of FX translation on U.S. dollar-denominated debt | 0.53 |
| (1.84 | ) | (0.07 | ) | — |
| — |
|
| Early redemption premium on notes | — |
| (0.30 | ) | — |
| — |
| — |
|
| Income tax rate change | — |
| (0.14 | ) | — |
| (0.04 | ) | (0.06 | ) |
Tax effect of adjustments(1) | (0.02 | ) | 0.16 |
| 0.01 |
| 0.99 |
| 0.75 |
|
| Diluted earnings per share as reported | $ | 10.63 |
| $ | 8.40 |
| $ | 8.46 |
| $ | 4.96 |
| $ | 2.79 |
|
(1) Tax effect of adjustments was calculated as the pretax effect of the adjustments multiplied by the effective tax rate for each of the above items for the periods presented.
Adjusted operating income is calculated as Operating income reported on a GAAP basis less significant items.
|
| | | | | | | | | | | | | | | |
Operating income | For the year ended
December 31 |
| (in millions) | 2016 | 2015 | 2014 | 2013 | 2012 |
| Adjusted Operating income | $ | 2,578 |
| $ | 2,620 |
| $ | 2,335 |
| $ | 1,844 |
| $ | 1,309 |
|
| Add significant items: |
|
|
|
|
|
| Gain on sale of D&H South | — |
| 68 |
| — |
| — |
| — |
|
| Labour restructuring | — |
| — |
| 4 |
| 7 |
| (53 | ) |
| Asset impairments | — |
| — |
| — |
| (435 | ) | (265 | ) |
| Management transition costs | — |
| — |
| — |
| 4 |
| (42 | ) |
| Operating income as reported | $ | 2,578 |
| $ | 2,688 |
| $ | 2,339 |
| $ | 1,420 |
| $ | 949 |
|
Adjusted operating ratio excludes those significant items that are reported within Operating income.
|
| | | | | | | | | | |
| Operating ratio | For the year ended
December 31 |
| 2016 | 2015 | 2014 | 2013 | 2012 |
| Adjusted operating ratio | 58.6 | % | 61.0 | % | 64.7 | % | 69.9 | % | 77.0 | % |
| Add significant items: |
|
|
|
|
|
|
|
| Gain on sale of D&H South | — | % | (1.0 | )% | — | % | — | % | — | % |
| Labour restructuring | — | % | — | % | — | % | (0.1 | )% | 0.9 | % |
| Asset impairments | — | % | — | % | — | % | 7.1 | % | 4.7 | % |
| Management transition costs | — | % | — | % | — | % | (0.1 | )% | 0.7 | % |
| Operating ratio as reported | 58.6 | % | 60.0 | % | 64.7 | % | 76.8 | % | 83.3 | % |
ROIC and Adjusted ROIC
ROIC is calculated as Operating income less Other income and charges, tax effected at the Company's annualized effective tax rate, on a rolling twelve-month basis, divided by the sum of Total shareholders' equity, Long-term debt, Long-term debt maturing within one year and Short-term borrowing, as presented in the Company's Consolidated Financial Statements, averaged between the beginning and ending balance over a rolling twelve-month period. Adjusted ROIC excludes significant items reported in Operating income and Other income and charges in the Company's Consolidated Financial Statements, as these significant items are not considered indicative of future financial trends either by nature or amount. ROIC and Adjusted ROIC are all-encompassing performance measures that measure how productively the Company uses its long-term capital investments, representing critical indicators of good operating and investment decisions made by management and are important performance criteria in determining certain elements of the Company's long-term incentive plan. ROIC and Adjusted ROIC are presented in Item 6. Selected Financial
Data and discussed further in Results of Operations of this Item 7. Management’s Discussion and Analysis of Financial Condition and Results of Operations.
Calculation of ROIC and Adjusted ROIC
|
| | | | | | | | | | | | | | | |
| (in millions, except for percentages) | 2016 | 2015 | 2014 | 2013 | 2012 |
| Operating income for the year ended December 31 | $ | 2,578 |
| $ | 2,688 |
| $ | 2,339 |
| $ | 1,420 |
| $ | 949 |
|
| Less: |
|
|
|
|
|
|
|
|
|
|
| Other income and charges | (45 | ) | 335 |
| 19 |
| 17 |
| 37 |
|
Tax(1) | 675 |
| 728 |
| 640 |
| 312 |
| 218 |
|
| $ | 1,948 |
| $ | 1,625 |
| $ | 1,680 |
| $ | 1,091 |
| $ | 694 |
|
| Average for the twelve months of total shareholders' equity, long-term debt, long-term debt maturing within one year and short-term borrowing | $ | 13,532 |
| $ | 12,561 |
| $ | 11,653 |
| $ | 10,842 |
| $ | 9,564 |
|
| ROIC | 14.4 | % | 12.9 | % | 14.4 | % | 10.1 | % | 7.3 | % |
(1) Tax was calculated at the annualized effective tax rate of 25.72%, 30.95%, 27.59%, 22.21%, 23.95% for each of the above items for the years presented, respectively.
|
| | | | | | | | | | | | | | | |
| (in millions, except for percentages) | 2016 | 2015 | 2014 | 2013 | 2012 |
| Adjusted operating income for the year ended December 31 | 2,578 |
| 2,620 |
| 2,335 |
| 1,844 |
| 1,309 |
|
| Less: |
|
|
|
|
|
|
|
|
|
|
| Other income and charges | (45 | ) | 335 |
| 19 |
| 17 |
| 37 |
|
| Add significant items (pretax): |
|
|
|
|
|
|
|
|
|
|
| Legal settlement charge | 25 |
| — |
| — |
| — |
| — |
|
| Advisory fees related to shareholder matters | — |
| — |
| — |
| — |
| 27 |
|
| Impact of FX translation on U.S. dollar-denominated debt | (79 | ) | 297 |
| 12 |
| — |
| — |
|
| Early redemption premium on notes | — |
| 47 |
| — |
| — |
| — |
|
Less: tax(1) | 673 |
| 716 |
| 642 |
| 491 |
| 344 |
|
| $ | 1,896 |
| $ | 1,913 |
| $ | 1,686 |
| $ | 1,336 |
| $ | 955 |
|
| Average for the twelve months of total shareholders' equity, long-term debt, long-term debt maturing within one year and short-term borrowing | $ | 13,532 |
| $ | 12,561 |
| $ | 11,653 |
| $ | 10,842 |
| $ | 9,564 |
|
| Adjusted ROIC | 14.0 | % | 15.2 | % | 14.5 | % | 12.3 | % | 10.0 | % |
(1) Tax was calculated at the adjusted annualized effective tax rate of 26.20%, 27.25%, 27.58%, 26.88%, 26.49% for each of the above items for the years presented, respectively.
Free Cash
Free cash is calculated as Cash provided by operating activities, less Cash used in investing activities, adjusted for changes in cash and cash equivalents balances resulting from FX fluctuations. Free cash is a measure that management considers to be an indicator of liquidity. Free cash is useful to investors and other external users of the consolidated financial statements as it assists with the evaluation of the Company's ability to generate cash from its operations without incurring additional external financing. Positive Free cash indicates the amount of cash available for reinvestment in the business, or cash that can be returned to investors through dividends, stock repurchase programs, debt retirements or a combination of these. Conversely, negative Free cash indicates the amount of cash that must be raised from investors through new debt or equity issues, reduction in available cash balances or a combination of these. Free cash should be considered in addition to, rather than as a substitute for, Cash provided by operating activities. Free cash is presented in Item 6. Selected Financial Data and discussed further in Liquidity and Capital Resources of this Item 7. Management’s Discussion and Analysis of Financial Condition and Results of Operations.
Reconciliation of Cash Provided by Operating Activities to Free Cash
|
| | | | | | | | | | | | | | | |
| | For the year ended
December 31 |
| (in millions) | 2016 | 2015 | 2014 | 2013 | 2012 |
| Cash provided by operating activities | $ | 2,089 |
| $ | 2,459 |
| $ | 2,123 |
| $ | 1,950 |
| $ | 1,328 |
|
Cash used in investing activities(1) | (1,069 | ) | (1,123 | ) | (1,161 | ) | (1,186 | ) | (1,011 | ) |
| Effect of foreign currency fluctuations on U.S. dollar-denominated cash and cash equivalents | (13 | ) | 45 |
| 7 |
| 10 |
| (1 | ) |
Free cash(2) | $ | 1,007 |
| $ | 1,381 |
| $ | 969 |
| $ | 774 |
| $ | 316 |
|
(1) 2013 and 2014 comparative figures have been restated by $411 million and ($411) million, respectively, due to the early adoption of Accounting Standards Update ("ASU") 2016-18. See further discussion in Item 8. Financial Statements and Supplemental Data, Note 2 Accounting changes. As a result of the change, the offsetting adjustments for changes in restricted cash were also removed from this calculation in both years, resulting in no net change to Free cash.
(2) The definition of Free cash has been revised to exclude the deduction of dividends paid. As a result of this change, Free cash was increased by $226 million in 2015, $244 million in 2014, $244 million in 2013, and $223 million in 2012.
Foreign Exchange Adjusted Variance
FX adjusted variance allows certain financial results to be viewed without the impact of fluctuations in foreign currency exchange rates, thereby facilitating period-to-period comparisons in the analysis of trends in business performance. Financial result variances at constant currency are obtained by translating the comparable period of the prior year results denominated in U.S. dollars at the foreign exchange rates of the current period. FX adjusted variances are discussed in Operating Revenues and Operating Expenses of this Item 7. Management’s Discussion and Analysis of Financial Condition and Results of Operations.
|
| | | | | | | | | | | | | | | | | | | | | | | | | |
| |
|
|
| 2016 vs. 2015 | 2015 vs. 2014 |
| (in millions) | Reported 2016 | Reported 2015 | Reported 2014 | Variance
due to FX | FX Adjusted 2015 | FX Adj. % | Variance
due to FX | FX Adjusted 2014 | FX Adj. % |
| Freight revenues | $ | 6,060 |
| $ | 6,552 |
| $ | 6,464 |
| $ | 145 |
| $ | 6,697 |
| (10 | ) | $ | 549 |
| $ | 7,013 |
| (7 | ) |
| Non-freight revenues | 172 |
| 160 |
| 156 |
| 1 |
| 161 |
| 7 |
| 4 |
| 160 |
| — |
|
| Total revenues | 6,232 |
| 6,712 |
| 6,620 |
| 146 |
| 6,858 |
| (9 | ) | 553 |
| 7,173 |
| (6 | ) |
| Compensation and benefits | 1,189 |
| 1,371 |
| 1,348 |
| 18 |
| 1,389 |
| (14 | ) | 62 |
| 1,410 |
| (3 | ) |
| Fuel | 567 |
| 708 |
| 1,048 |
| 25 |
| 733 |
| (23 | ) | 143 |
| 1,191 |
| (41 | ) |
| Materials | 180 |
| 184 |
| 193 |
| 2 |
| 186 |
| (3 | ) | 5 |
| 198 |
| (7 | ) |
| Equipment rents | 173 |
| 174 |
| 155 |
| 5 |
| 179 |
| (3 | ) | 18 |
| 173 |
| 1 |
|
| Depreciation and amortization | 640 |
| 595 |
| 552 |
| 5 |
| 600 |
| 7 |
| 18 |
| 570 |
| 4 |
|
| Purchased services and other | 905 |
| 1,060 |
| 985 |
| 21 |
| 1,081 |
| (16 | ) | 60 |
| 1,045 |
| 1 |
|
| Gain on sale of D&H South | — |
| (68 | ) | — |
| 1 |
| (67 | ) | (100 | ) | — |
| — |
| 100 |
|
| Total operating expenses | 3,654 |
| 4,024 |
| 4,281 |
| 77 |
| 4,101 |
| (11 | ) | 306 |
| 4,587 |
| (12 | ) |
| Operating income | $ | 2,578 |
| $ | 2,688 |
| $ | 2,339 |
| $ | 69 |
| $ | 2,757 |
| (6 | ) | $ | 247 |
| $ | 2,586 |
| 4 |
|
Interest Coverage Ratio
Interest coverage ratio is measured, on a rolling twelve-month basis, as EBIT divided by Net interest expense. This ratio provides investors, analysts, and lenders with useful information on how the Company's debt servicing capabilities have changed, period over period and in comparison to the Company’s peers. Interest coverage ratio is discussed further in Liquidity and Capital Resources of this Item 7. Management’s Discussion and Analysis of Financial Condition and Results of Operations.
Adjusted interest coverage ratio is calculated as Adjusted EBIT divided by Net interest expense. By excluding significant items which affect EBIT, Adjusted interest coverage ratio assists management in comparing the Company's performance over various reporting periods on a consistent basis. Adjusted interest coverage ratio is discussed further in Liquidity and Capital Resources of this Item 7. Management’s Discussion and Analysis of Financial Condition and Results of Operations.
Calculation of Interest Coverage Ratio and Adjusted Interest Coverage Ratio
|
| | | | | | | | | |
| (in millions, except for ratios) | 2016 | 2015 | 2014 |
| EBIT | $ | 2,623 |
| $ | 2,353 |
| $ | 2,320 |
|
| Adjusted EBIT | 2,569 |
| 2,629 |
| 2,328 |
|
| Net interest expense | 471 |
| 394 |
| 282 |
|
| Interest coverage ratio | 5.6 |
| 6.0 |
| 8.2 |
|
| Adjusted interest coverage ratio | 5.5 |
| 6.7 |
| 8.3 |
|
Reconciliation of Adjusted earnings before interest, tax, depreciation and amortization and Earnings before interest and tax
Adjusted EBITDA is calculated as Adjusted EBIT plus Depreciation and amortization, net periodic pension and other benefit cost other than current service costs, and operating lease expense. EBIT is calculated as Operating income, less Other income and charges. Adjusted EBIT excludes significant items reported in Operating income and Other income and charges.
|
| | | | | | | | | | | | | | | |
| | For the year ended
December 31 |
| (in millions) | 2016 | 2015 | 2014 | 2013 | 2012 |
| Adjusted EBITDA | $ | 3,153 |
| $ | 3,281 |
| $ | 2,864 |
| $ | 2,464 |
| $ | 1,957 |
|
| Add: |
|
|
|
|
|
|
|
|
|
|
| Net periodic pension and other benefit cost other than current service costs | 167 |
| 70 |
| 137 |
| 82 |
| 63 |
|
| Operating lease expense | (111 | ) | (127 | ) | (121 | ) | (154 | ) | (182 | ) |
| Depreciation and amortization | (640 | ) | (595 | ) | (552 | ) | (565 | ) | (539 | ) |
| Adjusted EBIT | 2,569 |
| 2,629 |
| 2,328 |
| 1,827 |
| 1,299 |
|
| Add Significant items (pretax): |
|
|
|
|
|
| Legal settlement charge | (25 | ) | — |
| — |
| — |
| — |
|
| Gain on sale of D&H South | — |
| 68 |
| — |
| — |
| — |
|
| Labour restructuring | — |
| — |
| 4 |
| 7 |
| (53 | ) |
| Asset impairments | — |
| — |
| — |
| (435 | ) | (265 | ) |
| Management transition | — |
| — |
| — |
| 4 |
| (42 | ) |
| Advisory costs related to shareholder matters | — |
| — |
| — |
| — |
| (27 | ) |
| Impact of FX translation on U.S. dollar-denominated debt | 79 |
| (297 | ) | (12 | ) | — |
| — |
|
| Early redemption premium on notes | — |
| (47 | ) | — |
| — |
| — |
|
| EBIT | 2,623 |
| 2,353 |
| 2,320 |
| 1,403 |
| 912 |
|
| Less: |
|
|
|
|
|
|
|
|
|
|
| Net interest expense | 471 |
| 394 |
| 282 |
| 278 |
| 276 |
|
| Income tax expense | 553 |
| 607 |
| 562 |
| 250 |
| 152 |
|
| Net income as reported | $ | 1,599 |
| $ | 1,352 |
| $ | 1,476 |
| $ | 875 |
| $ | 484 |
|
Adjusted Net Debt to Adjusted EBITDA Ratio
Adjusted net debt is defined as Long-term debt, Long-term debt maturing within one year and Short-term borrowing as reported on the Company’s Consolidated Balance Sheets adjusted for pension plans deficit, the net present value of operating leases, which is discounted by the Company’s effective interest rate for each of the years presented, and Cash and cash equivalents. Adjusted net debt to adjusted EBITDA ratio is calculated as Adjusted net debt divided by Adjusted EBITDA.
The Adjusted net debt to adjusted EBITDA ratio is one of the key metrics used by credit rating agencies in assessing the Company's financial capacities and constraints and determining the credit rating of the Company. By excluding the impact of certain items that are not considered by management in developing a minimum threshold, Adjusted net debt to Adjusted EBITDA ratio provides a metric that management uses to evaluate the Company's financial discipline with respect to capital markets credit sensitivities from management's perspective and communicates it publicly with investors, analysts and credit rating agencies. Adjusted net debt to Adjusted EBITDA ratio is discussed further in Liquidity and Capital Resources of this Item 7. Management’s Discussion and Analysis of Financial Condition and Results of Operations.
Calculation of Adjusted Net Debt to Adjusted EBITDA Ratio
|
| | | | | | | | | |
| (in millions, except for ratios) | 2016 | 2015 | 2014 |
| Adjusted net debt as at December 31 | $ | 9,154 |
| $ | 9,041 |
| $ | 6,268 |
|
| Adjusted EBITDA for the year ended December 31 | 3,153 |
| 3,281 |
| 2,864 |
|
| Adjusted net debt to Adjusted EBITDA ratio | 2.9 |
| 2.8 |
| 2.2 |
|
Reconciliation of Adjusted Net Debt to Long-term Debt
|
| | | | | | | | | |
| (in millions) | 2016 | 2015 | 2014 |
| Adjusted net debt as at December 31 | $ | 9,154 |
| $ | 9,041 |
| $ | 6,268 |
|
| Add: |
|
|
|
| Pension plans deficit | (273 | ) | (295 | ) | (288 | ) |
Net present value of operating leases(1) | (361 | ) | (439 | ) | (447 | ) |
| Cash and cash equivalents | 164 |
| 650 |
| 226 |
|
| Long-term debt including long-term debt maturing within one year as at December 31 | $ | 8,684 |
| $ | 8,957 |
| $ | 5,759 |
|
(1) Operating leases were discounted at the Company’s effective interest rate for each of the years presented.
Off-Balance Sheet Arrangements
Guarantees
At December 31, 2016, the Company had residual value guarantees on operating lease commitments of $19 million, compared to $28 million at December 31, 2015. The maximum amount that could be payable under these and all of the Company’s other guarantees cannot be reasonably estimated due to the nature of certain guarantees. All or a portion of amounts paid under certain guarantees could be recoverable from other parties or through insurance. As at December 31, 2016, the fair value of these guarantees recognized as a liability was $5 million, compared to $4 million at December 31, 2015.
Contractual Commitments
The accompanying table indicates the Company’s obligations and commitments to make future payments for contracts, such as debt, capital lease and commercial arrangements as at December 31, 2016
|
| | | | | | | | | | | | | | | |
| Payments due by period (in millions) | Total |
| 2017 |
| 2018 & 2019 |
| 2020 & 2021 |
| 2022 & beyond |
|
| Contractual commitments |
|
|
|
|
|
|
|
|
|
|
| Interest on long-term debt and capital lease | $ | 12,526 |
| $ | 491 |
| $ | 889 |
| $ | 803 |
| $ | 10,343 |
|
| Long-term debt | 8,614 |
| 20 |
| 1,259 |
| 443 |
| 6,892 |
|
| Capital leases | 166 |
| 4 |
| 10 |
| 11 |
| 141 |
|
Operating lease(1) | 450 |
| 97 |
| 118 |
| 84 |
| 151 |
|
| Supplier purchase | 2,476 |
| 609 |
| 1,083 |
| 177 |
| 607 |
|
Other long-term liabilities(2) | 519 |
| 72 |
| 108 |
| 103 |
| 236 |
|
| Total contractual commitments | $ | 24,751 |
| $ | 1,293 |
| $ | 3,467 |
| $ | 1,621 |
| $ | 18,370 |
|
(1) Residual value guarantees on certain leased equipment with a maximum exposure of $19 million are not included in the minimum payments shown above, as management believes that CP will not be required to make payments under these residual guarantees.
(2) Includes expected cash payments for restructuring, environmental remediation, asset retirement obligations, post-retirement benefits, workers’ compensation benefits, long-term disability benefits, pension benefit payments for the Company’s non-registered supplemental pension plan and certain other long-term liabilities. Projected payments for post-retirement benefits, workers’ compensation benefits and long-term disability benefits include the anticipated payments for years 2017 to 2026. Pension contributions for the Company’s registered pension plans are not included due to the volatility in calculating them. Pension payments are discussed further in Critical Accounting Estimates of this Item 7. Management’s Discussion and Analysis of Financial Condition and Results of Operations.
Certain Other Financial Commitments
In addition to the financial commitments mentioned previously in Off-Balance Sheet Arrangements and Contractual Commitments of this Item 7. Management’s Discussion and Analysis of Financial Condition and Results of Operations, the Company is party to certain other financial commitments discussed below.
Letters of Credit
Letters of credit are obtained mainly to provide security to third parties under the terms of various agreements, including the supplemental pension plan. CP is liable for these contractual amounts in the case of non-performance under these agreements. Letters of credit are accommodated through a revolving credit facility and the Company’s bilateral letter of credit facilities.
Capital Commitments
The Company remains committed to maintaining the current high level of plant quality and renewing the franchise. As part of this commitment, CP has entered into contracts with suppliers to make various capital purchases related to track programs. Payments for these commitments are due in 2017 through 2020. These expenditures are expected to be financed by cash generated from operations or by issuing new debt.
The accompanying table indicates the Company’s commitments to make future payments for letters of credit and capital expenditures as at December 31, 2016
|
| | | | | | | | | | | | | | | |
| Payments due by period (in millions) | Total |
| 2017 |
| 2018 & 2019 |
| 2020 & 2021 |
| 2022 & beyond |
|
| Certain other financial commitments | | | | | |
| Letters of credit | $ | 320 |
| $ | 320 |
| $ | — |
| $ | — |
| $ | — |
|
| Capital commitments | 186 |
| 129 |
| 53 |
| 4 |
| — |
|
| Total certain other financial commitments | $ | 506 |
| $ | 449 |
| $ | 53 |
| $ | 4 |
| $ | — |
|
Critical Accounting Estimates
To prepare consolidated financial statements that conform with GAAP, the Company is required to make estimates and assumptions that affect the reported amounts of assets and liabilities, the disclosure of contingent assets and liabilities at the date of the consolidated financial statements and the reported amounts of revenues and expenses during the reported periods. Using the most current information available, the Company reviews estimates on an ongoing basis, including those related to environmental liabilities, pensions and other benefits, property, plant and equipment, deferred income taxes, and legal and personal injury liabilities.
The development, selection and disclosure of these estimates, and this MD&A, have been reviewed by the Board of Directors’ Audit Committee, which is composed entirely of independent directors.
Environmental Liabilities
CP estimates the probable cost to be incurred in the remediation of property contaminated by past railway use. The Company screens and classifies sites according to typical activities and scale of operations conducted, and develops remediation strategies for each property based on the nature and extent of the contamination, as well as the location of the property and surrounding areas that may be adversely affected by the presence of contaminants. CP also considers available technologies, treatment and disposal facilities and the acceptability of site-specific plans based on the local regulatory environment. Site-specific plans range from containment and risk management of the contaminants through to the removal and treatment of the contaminants and affected soils and groundwater. The details of the estimates reflect the environmental liability at each property. The Company is committed to fully meeting regulatory and legal obligations with respect to environmental matters.
Liabilities for environmental remediation may change from time to time as new information about previously untested sites becomes known. The net liability may also vary as the courts decide legal proceedings against outside parties responsible for contamination. These potential charges, which cannot be quantified at this time, are not expected to be material to the Company’s financial position, but may materially affect income in the period in which a charge is recognized. Material increases to costs would be reflected as increases to "Other long-term liabilities" and "Accounts payable and accrued liabilities" on the Company’s Consolidated Balance Sheets and to "Purchased services and other" within Operating expenses on the Company's Consolidated Statements of Income.
At December 31, 2016 and 2015, the accrual for environmental remediation on the Company’s Consolidated Balance Sheets amounted to $85 million and $93 million respectively, of which the long-term portion amounting to $76 million in 2016 and $80 million in 2015 was included in "Other long-term liabilities" and the short-term portion amounting to $9 million in 2016 and $13 million in 2015 was included in "Accounts payable and accrued liabilities". Cash payments related to the Company’s environmental remediation program totalled $12 million in 2016, compared with $18 million in 2015. The U.S. dollar-denominated portion of the liability was affected by the change in FX, resulting in a decrease in environmental liabilities of $2 million in 2016 and an increase $12 million in 2015.
Cash payments for environmental initiatives are estimated to be approximately $9 million in 2017, $10 million in 2018, $11 million in 2019 and a total of approximately $55 million over the remaining years through 2026, which will be paid in decreasing amounts. All payments will be funded from general operations.
CP continues to be responsible for remediation work on portions of a property in the state of Minnesota and continues to retain liability accruals for remaining future expected costs. The costs are expected to be incurred over approximately 10 years. The state regulators will oversee the work to ensure it is completed in accordance with applicable standards.
Pensions and Other Benefits
CP has defined benefit and defined contribution pension plans. Other benefits include post-retirement medical and life insurance for pensioners, and some post-employment workers’ compensation and long-term disability benefits in Canada. Workers’ compensation and long-term disability benefits are discussed in the Legal and Personal Injury Liabilities section below. Pension and post-retirement benefits liabilities are subject to various external influences and uncertainties.
Information concerning the measurement of costs for pensions and other benefits is discussed in Item 8. Financial Statements and Supplementary Data, Note 1 Summary of significant accounting policies.
Pension Liabilities and Pension Assets
As at December 31, 2016, the Company included on its Consolidated Balance Sheet:
pension benefit liabilities of $263 million ($285 million in 2015) in "Pension and other benefit liabilities" and $10 million ($10 million in 2015) in "Accounts payable and accrued liabilities";
post-retirement benefits liabilities of $383 million ($387 million in 2015) in "Pension and other benefit liabilities" and $21 million ($21 million in 2015) in "Accounts payable and accrued liabilities";
accruals for self-insured workers' compensation and long-term disability benefit plans, including $88 million ($86 million in 2015) in "Pension and other benefit liabilities", which are discussed in the Legal and Personal Injury Liabilities section below; and
pension benefit assets of $1,070 million ($1,401 million in 2015) in "Pension assets".
Net Periodic Benefit Costs
Net periodic benefit costs for pensions and post-retirement benefits were included in "Compensation and benefits" on the Company's Consolidated Statements of Income. Combined net periodic benefit credits for pensions and post-retirement benefits (excluding self-insured workers' compensation and long-term disability benefits) were $55 million in 2016, compared with net periodic benefit costs of $66 million in 2015.
Net periodic benefit credits for pensions were $81 million in 2016, compared with net periodic benefit costs of $41 million in 2015. The benefit credit portion related to defined benefit pensions was $90 million in 2016, compared with the benefit cost portion of $32 million in 2015. The benefit cost portion related to defined contribution pensions (equal to contributions) was $9 million in 2016, compared with $9 million for 2015. Net periodic benefit costs for post-retirement benefits were $26 million in 2016, compared with $25 million in 2015.
CP estimates net periodic benefit credits for defined benefit pensions to be approximately $190 million in 2017, and net periodic benefit costs for defined contribution pensions to be approximately $8 million in 2017. Net periodic benefit costs for post-retirement benefits in 2017 are not expected to differ materially from the 2016 costs.
Pension Plan Contributions
The Company made contributions of $48 million to the defined benefit pension plans in 2016, compared with $81 million in 2015. The Company’s main Canadian defined benefit pension plan accounts for 96% of CP’s pension obligation and can produce significant volatility in pension funding requirements, given the pension fund’s size, the many factors that drive the pension plan’s funded status, and Canadian statutory pension funding requirements. The Company made voluntary prepayments of $600 million in 2011, $650 million in 2010 and $500 million in 2009 to the Company’s main Canadian defined benefit pension plan. CP has applied $1,281 million of these voluntary prepayments to reduce its pension funding requirements in 2012–2016, leaving $469 million of the voluntary prepayments still available at December 31, 2016 to reduce CP’s pension funding requirements in 2017 and future years. CP continues to have significant flexibility with respect to the rate at which the remaining voluntary prepayments are applied to reduce future years’ pension contribution requirements, which allows CP to manage the volatility of future pension funding requirements. At this time, CP estimates it will apply $50 million of the remaining voluntary prepayments against its 2017 pension funding requirements.
CP estimates its aggregate pension contributions, including its defined benefit and defined contribution plans, to be in the range of $50 million to $60 million in 2017, and in the range of $50 million to $100 million per year from 2018 to 2020. These estimates reflect the Company’s current intentions with respect to the rate at which CP will apply the remaining voluntary prepayments against contribution requirements in the next few years.
Future pension contributions will be highly dependent on the Company’s actual experience with such variables as investment returns, interest rate fluctuations and demographic changes, on the rate at which previous years’ voluntary prepayments are applied against
pension contribution requirements, and on any changes in the regulatory environment. CP will continue to make contributions to the pension plans that, at a minimum, meet pension legislative requirements.
Pension Plan Risks
Fluctuations in the liability and net periodic benefit costs for pensions result from favourable or unfavourable investment returns and changes in long-term interest rates. The impact of favourable or unfavourable investment returns is moderated by the use of a market-related asset value for the main Canadian defined benefit pension plan’s public equity securities and absolute return strategies. The impact of changes in long-term rates on pension obligations is partially offset by their impact on the pension funds’ investments in fixed income assets.
The plans’ investment policy provides a target allocation of approximately 46% of the plans’ assets to be invested in public equity securities. As a result, stock market performance is a key driver in determining the pension funds’ asset performance. If the rate of investment return on the plans’ public equity securities in 2016 had been 10 percentage points higher (or lower) than the actual 2016 rate of investment return on such securities, 2017 net periodic benefit costs for pensions would be lower (or higher) by approximately $25 million.
Changes in bond yields can result in changes to discount rates and to changes in the value of fixed income assets. If the discount rate as at December 31, 2016 had been higher (or lower) by 0.1% with no related changes in the value of the pension funds’ investment in fixed income assets, 2017 net periodic benefit costs for pensions would be lower (or higher) by approximately $13 million. However, a change in bond yields would also lead to a change in the value of the pension funds’ investment in fixed income assets, and this change would partially offset the impact on net periodic benefit costs noted above.
The Company estimates that an increase in the discount rate of 0.1% would decrease the defined benefit pension plans’ projected benefit obligations by approximately $155 million, and estimates that a decrease in the discount rate of 0.1% would increase the defined benefit pension plans’ projected benefit obligations by approximately $157 million. Similarly, for every 0.1% the actual return on assets varies above (or below) the estimated return for the year, the value of the defined benefit pension plans’ assets would increase (or decrease) by approximately $12 million.
Adverse experience with respect to these factors could eventually increase funding and pension expense significantly, while favourable experience with respect to these factors could eventually decrease funding and pension expense significantly.
Fluctuations in the post-retirement benefit obligation also can result from changes in the discount rate used. A 0.1% increase (decrease) in the discount rate would decrease (increase) the obligation by approximately $5 million.
CP reviews its pensioner mortality experience to ensure that the mortality assumption continues to be appropriate, or to determine what changes to the assumption is needed.
Property, Plant and Equipment
The Company follows the group depreciation method under which a single depreciation rate is applied to the total cost in a particular class of property, despite differences in the service life or salvage value of individual properties within the same class. CP performs depreciation studies of each property group approximately every three years to update depreciation rates. The depreciation studies are based on statistical analysis of historical retirements of properties in the group and incorporate engineering estimates of changes in current operations and of technological advances. CP depreciates the cost of properties, net of salvage, on a straight-line basis over the estimated useful life of the property group. The estimates of economic lives are uncertain and can vary due to technological changes or in the rate of wear. Additionally, the depreciation rates are updated to reflect the change in residual values of the assets in the class. Under the group depreciation method, retirements or disposals of properties in the normal course of business are accounted for by charging the cost of the property less any net salvage to accumulated depreciation. For the sale or retirement of larger groups of depreciable assets that are unusual that were not predicted in the Company’s depreciation studies, CP records a gain or loss for the difference between net proceeds and net book value of the assets sold or retired.
Due to the capital intensive nature of the railway industry, depreciation represents a significant part of operating expenses. The estimated useful lives of properties have a direct impact on the amount of depreciation recorded as a component of Properties on the Company’s Consolidated Balance Sheets. At December 31, 2016 and 2015, accumulated depreciation was $7,125 million and $6,952 million, respectively.
Revisions to the estimated useful lives and net salvage projections for properties constitute a change in accounting estimate and are addressed prospectively by amending depreciation rates. It is anticipated that there will be changes in the estimates of weighted average useful lives and net salvage for each property group as assets are acquired, used and retired. Substantial changes in either the useful lives of properties or the salvage assumptions could result in significant changes to depreciation expense. For example, if the estimated average life of road locomotives, the largest asset group, increased (or decreased) by 5%, annual depreciation expense would decrease (or increase) by approximately $3 million.
The Company reviews the carrying amounts of properties when circumstances indicate that such carrying amounts may not be recoverable based on future undiscounted cash flows. When such properties are determined to be impaired, recorded asset values are revised to their fair values and an impairment loss is recognized.
Deferred Income Taxes
CP accounts for deferred income taxes based on the liability method. This method focuses on the Company’s balance sheet and the temporary differences otherwise calculated from the comparison of book versus tax values. It is assumed that such temporary differences will be settled in the deferred income tax assets and liabilities at the balance sheet date.
In determining deferred income taxes, the Company makes estimates and assumptions regarding deferred tax matters, including estimating the timing of the realization and settlement of deferred income tax assets (including the benefit of tax losses) and liabilities. Deferred income taxes are calculated using enacted federal, provincial, and state future income tax rates, which may differ in future periods.
A deferred income tax expense of $320 million was included in "Income tax expense" for 2016 and $234 million in 2015 on the Company's Consolidated Statements of Income. The increase in deferred income tax expense in 2016 was primarily due to the 2015 reclassification of deferred tax expense to current tax expense related to the D&H South sale. In addition, the Company recorded deferred income tax expense related to FX translation on U.S. dollar-denominated debt, whereas this was a recovery in 2015. At December 31, 2016 and 2015, deferred income tax liabilities of $3,571 million and $3,391 million, respectively, were recorded as a long-term liability and are composed largely of temporary differences related to accounting for properties.
Legal and Personal Injury Liabilities
The Company is involved in litigation related to CP’s business in Canada and the U.S. Management is required to establish estimates of the potential liability arising from incidents, claims and pending litigation, including personal injury claims by employees and third parties, and certain occupation-related claims and property damage claims.
Accruals for incidents, claims and litigation, including workers' compensation benefit accruals, totalled $130 million, net of insurance recoveries, at December 31, 2016 and $133 million at December 31, 2015. At December 31, 2016 and 2015 respectively, the total accrual included $88 million and $86 million in "Pension and other benefit liabilities", $18 million and $18 million in "Other long-term liabilities" and $26 million and $30 million in "Accounts payable and accrued liabilities", partially offset by $2 million and $1 million in "Other assets" on the Company's Consolidated Balance Sheets. An expense totalling $67 million in 2016 and $62 million in 2015 was included in "Purchased services and other" on the Company's Consolidated Statements of Income.
These estimates are determined on a case-by-case basis with input from defense counsel and are based on an assessment of the actual damages incurred and current legal advice with respect to settlements in other similar cases. CP employs experienced claims adjusters and experts who investigate and assess the validity of individual claims made against CP and estimate the damages incurred.
A provision for lawsuits or other claims will be accrued according to applicable accounting standards, reflecting the assessment of the actual damages incurred based upon the facts and circumstances known at the time. CP accrues for likely claims when the facts of an incident become known and investigation results provide a reasonable basis for estimating the liability. The lower end of the range is accrued if the facts and circumstances permit only a range of reasonable estimates and no single amount in that range is a better estimate than any other. Additionally, for administrative expediency, a general provision for lesser value injury cases is kept. Facts and circumstances related to asserted claims can change, and a process is in place to monitor accruals for changes in accounting estimates.
In the Canadian provinces of Quebec, Ontario, Manitoba and B.C., occupational-injury claims are administered through the Workers' Compensation Board ("WCB") and are actuarially determined. In the provinces of Saskatchewan and Alberta, the Company is assessed an annual WCB contribution on a premium basis and this amount is not subject to estimation by management.
U.S. railway employees are covered by federal law under the FELA rather than workers compensation programs. Accruals are set for individual cases based on facts, legal opinion and statistical analysis. U.S. accruals are also set and include alleged occupational exposure or injury.
Forward-Looking Information
This MD&A and Annual Report on Form 10-K contains certain forward-looking statements within the meaning of the United States Private Securities Litigation Reform Act of 1995 and other relevant securities legislation. These forward-looking statements include, but are not limited to, statements concerning the Company’s defined benefit pension expectations for 2017 and through 2020, our expectations for 2017 which includes: adjusted diluted EPS growth to be in the high single-digit percentages from full-year 2016 Adjusted diluted EPS of $10.29, capital expenditures of $1.25 billion, an increase of 6% over the $1.18 billion spent in 2016, assumptions regarding the Canadian-to-U.S. dollar exchange rate being in the range of $1.30 to $1.35, the average price of WTI being approximately U.S. $45 to $55 per barrel, as well as statements concerning the Company’s operations, anticipated financial
performance, business prospects and strategies, including statements concerning the anticipation that cash flow from operations and various sources of financing will be sufficient to meet debt repayments and obligations in the foreseeable future and concerning anticipated capital programs, statements regarding future payments including income taxes and pension contributions, and capital expenditures. Forward-looking information typically contains statements with words such as “financial expectations”, “key assumptions”, “anticipate”, “believe”, “expect”, “plan”, “will”, “outlook”, “should” or similar words suggesting future outcomes. To the extent that CP has provided guidance using non-GAAP financial measures, the Company may not be able to provide a reconciliation to a GAAP measure, due to unknown variables and uncertainty related to future results.
Readers are cautioned not to place undue reliance on forward-looking information because it is possible that CP will not achieve predictions, forecasts, projections and other forms of forward-looking information. Current economic conditions render assumptions, although reasonable when made, subject to greater uncertainty. In addition, except as required by law, CP undertakes no obligation to update publicly or otherwise revise any forward-looking information, whether as a result of new information, future events or otherwise.
By its nature, forward-looking information involves numerous assumptions, inherent risks and uncertainties, including but not limited to the following factors: changes in business strategies; general North American and global economic, credit and business conditions; risks in agricultural production such as weather conditions and insect populations; the availability and price of energy commodities; the effects of competition and pricing pressures; industry capacity; shifts in market demand; inflation; changes in laws and regulations, including regulation of rates; changes in taxes and tax rates; potential increases in maintenance and operating costs; uncertainties of investigations, proceedings or other types of claims and litigation; labour disputes; risks and liabilities arising from derailments; transportation of dangerous goods; timing of completion of capital and maintenance projects; currency and interest rate fluctuations; effects of changes in market conditions on the financial position of pension plans and investments; and various events that could disrupt operations, including severe weather, droughts, floods, avalanches and earthquakes as well as security threats and the governmental response to them, and technological changes.
There are more specific factors that could cause actual results to differ materially from those described in the forward-looking statements contained in this MD&A. These more specific factors are identified and discussed in Item 1A. Risk Factors. Other risks are detailed from time to time in reports filed by CP with securities regulators in Canada and the United States.
ITEM 7A. QUANTITATIVE AND QUALITATIVE DISCLOSURES ABOUT MARKET RISK
Foreign Exchange Risk
Although CP conducts business primarily in Canada, a significant portion of its revenues, expenses, assets and liabilities including debt are denominated in U.S. dollars. The value of the Canadian dollar is affected by a number of domestic and international factors, including, without limitation, economic performance, and Canadian, U.S. and international monetary policies. Consequently, the Company’s results are affected by fluctuations in the exchange rate between these currencies. On an annualized basis, a $0.01 weakening (or strengthening) of the Canadian dollar positively (or negatively) impacts freight revenues by approximately $25 million and negatively (or positively) impacts operating expenses by approximately $13 million.
CP uses U.S. denominated debt to hedge its net investment in U.S. operations. As at December 31, 2016, the net investment in U.S. operations is less than the total U.S. denominated debt. Consequently, FX translation on the Company’s undesignated U.S. dollar-denominated long-term debt causes additional impacts on earnings in Other income and charges.
To manage this exposure to fluctuations in exchange rates between Canadian and U.S. dollars, CP may sell or purchase U.S. dollar forwards at fixed rates in future periods. In addition, changes in the exchange rate between the Canadian dollar and other currencies (including the U.S. dollar) make the goods transported by the Company more or less competitive in the world marketplace and may in turn positively or negatively affect revenues.
Share Price Impact on Stock-Based Compensation
Based on information available at December 31, 2016 and expectations for 2017 grants, for every $1.00 change in share price, stock-based compensation expense has a corresponding change of approximately $0.4 million to $0.6 million. This excludes the impact of changes in share price relative to the S&P/TSX 60 index and relative to Class I railways, which may trigger different performance share unit payouts. Share based compensation may also be impacted by non-market performance conditions.
Additional information concerning stock based compensation is included in Item 8. Financial Statements and Supplementary Data, Note 21 Stock-based compensation.
Interest Rate Risk
In order to meet the Company’s capital structure requirements, CP may enter into long-term debt agreements. These debt agreements expose CP to increased interest costs on future fixed debt instruments and existing variable rate debt instruments, should market rates increase. In addition, the present value of the Company’s assets and liabilities will also vary with interest rate changes. To manage interest rate exposure, CP may enter into forward rate agreements such as treasury rate locks or bond forwards that lock in rates for a future date, thereby protecting against interest rate increases. CP may also enter into swap agreements whereby one party agrees to pay a fixed rate of interest while the other party pays a floating rate. Contingent on the direction of interest rates, the Company may incur higher costs depending on the contracted rate.
As at December 31, 2016 and 2015, the Company had forward starting floating-to-fixed interest rate swap agreements totalling a notional U.S. $700 million to fix the benchmark rate on cash flows associated with highly probable forecasted issuances of long-term notes.
Information concerning market risks is supplemented in Item 8. Financial Statements and Supplementary Data, Note 17 Financial Instruments.
ITEM 8. FINANCIAL STATEMENTS AND SUPPLEMENTARY DATA
INDEX TO CONSOLIDATED FINANCIAL STATEMENTS
termination benefit. | | | | | | | | | | | | | | | | | | | | | | | | | | | | |
| | | | | | Severance payment | | | | | | | | | | | | | |
Name | | Severance period
(# of months) | | | Base pay
($) | | | Short-term
incentive
($) | | | Additional
retirement
benefits
($) | | | Other
benefits
($) | | | Value of vesting
of options and
equity-based
awards
($) | | | Payable on
termination
without
cause
($) | |
Keith Creel | | | 24 | | | | 3,069,450 | | | | 3,683,340 | | | | - | | | | 32,251 | | | | 6,797,388 | | | | 13,582,429 | |
Notes:
| • |
| |
| | PageOther benefitsinclude the value of accelerated vesting of shares purchased under the Employee Share Purchase Plan |
| • | | |
ReportValue of Independent Registered Public Accounting Firm | |
| |
Consolidated Statementsvesting of Income | |
Foroptions and equity-based awardsis the Year Endedvalue of options vesting within six months following termination in accordance with our stock option plan, and the prorated value as of the termination date of PSU awards. It is based on $242.24, our closing share price on the TSX on December 31, 2016, 2015,2018 and 2014 | |
| |
Consolidated StatementsUS$177.62, the closing price of Comprehensive Income | |
Forour shares on the Year Ended December 31, 2016, 2015, and 2014 | |
| |
Consolidated Balance Sheets | |
At December 31, 2016 and 2015 | |
| |
Consolidated StatementsNYSE, converted into Canadian dollars using ayear-end exchange rate of Cash Flows | |
For the Year Ended December 31, 2016, 2015, and 2014 | |
| |
Consolidated Statements of Changes in Shareholders' Equity | |
For the Year Ended December 31, 2016, 2015, and 2014 | |
| |
Notes to Consolidated Financial Statements | 1.3642 |
50
REPORT OF INDEPENDENT REGISTERED PUBLIC ACCOUNTING FIRM
To the Board of Directors and the Shareholders of Canadian Pacific Railway Limited:
We have audited the accompanying consolidated balance sheets of Canadian Pacific Railway Limited and subsidiaries (the "Company") as of December 31, 2016 and 2015 and the related consolidated statements of income, comprehensive income, cash flows and changes in shareholders' equity for each of the three years in the period ended December 31, 2016. Our audits also included the financial statement schedule listed in the index at Item 15. These financial statements and financial statement schedule are the responsibility of the Company's management. Our responsibility is to express an opinion on the financial statements and financial statement schedule based on our audits.
We conducted our audits in accordance with the standards of the Public Company Accounting Oversight Board (United States). Those standards require that we plan and perform the audit to obtain reasonable assurance about whether the consolidated financial statements are free of material misstatement. An audit includes examining, on a test basis, evidence supporting the amounts and disclosures in the financial statements. An audit also includes assessing the accounting principles used and significant estimates made by management, as well as evaluating the overall financial statement presentation. We believe that our audits provide a reasonable basis for our opinion.
In our opinion, such consolidated financial statements present fairly, in all material respects, the financial position of Canadian Pacific Railway Limited and subsidiaries as of December 31, 2016 and 2015, and the results of their operations and their cash flows for each of the three years in the period ended December 31, 2016, in conformity with accounting principles generally accepted in the United States of America. Also, in our opinion, such financial statement schedule, when considered in relation to the basic consolidated financial statements taken as a whole, present fairly, in all material respects, the information set forth therein.
We have also audited, in accordance with the standards of the Public Company Accounting Oversight Board (United States), the Company's internal control over financial reporting as of December 31, 2016, based on the criteria established in Director compensationInternal Control-Integrated Framework (2013) issued by the Committee of Sponsoring Organizations of the Treadway Commission and our report dated February 16, 2017 expressed an unqualified opinion on the Company’s internal control over financial reporting.
/s/ Deloitte LLP
Chartered Professional Accountants
February 16, 2017
Calgary, Canada
CONSOLIDATED STATEMENTS OF INCOME
|
| | | | | | | | | |
| Year ended December 31 (in millions of Canadian dollars, except per share data) | 2016 |
| 2015 |
| 2014 |
|
| Revenues | | | |
| Freight | $ | 6,060 |
| $ | 6,552 |
| $ | 6,464 |
|
| Non-freight | 172 |
| 160 |
| 156 |
|
| Total revenues | 6,232 |
| 6,712 |
| 6,620 |
|
| Operating expenses | | | |
| Compensation and benefits | 1,189 |
| 1,371 |
| 1,348 |
|
| Fuel | 567 |
| 708 |
| 1,048 |
|
| Materials | 180 |
| 184 |
| 193 |
|
| Equipment rents | 173 |
| 174 |
| 155 |
|
| Depreciation and amortization | 640 |
| 595 |
| 552 |
|
| Purchased services and other (Note 10) | 905 |
| 1,060 |
| 985 |
|
| Gain on sale of Delaware & Hudson South (Note 10) | — |
| (68 | ) | — |
|
| Total operating expenses | 3,654 |
| 4,024 |
| 4,281 |
|
| Operating income | 2,578 |
| 2,688 |
| 2,339 |
|
| Less: | | | |
| Other income and charges (Note 3) | (45 | ) | 335 |
| 19 |
|
| Net interest expense (Note 4) | 471 |
| 394 |
| 282 |
|
| Income before income tax expense | 2,152 |
| 1,959 |
| 2,038 |
|
| Income tax expense (Note 5) | 553 |
| 607 |
| 562 |
|
| Net income | $ | 1,599 |
| $ | 1,352 |
| $ | 1,476 |
|
| Earnings per share (Note 6) | | | |
| Basic earnings per share | $ | 10.69 |
| $ | 8.47 |
| $ | 8.54 |
|
| Diluted earnings per share | $ | 10.63 |
| $ | 8.40 |
| $ | 8.46 |
|
| Weighted-average number of shares (millions) (Note 6) | | | |
| Basic | 149.6 |
| 159.7 |
| 172.8 |
|
| Diluted | 150.5 |
| 161.0 |
| 174.4 |
|
See Notes to Consolidated Financial Statements.
CONSOLIDATED STATEMENTS OF COMPREHENSIVE INCOME
|
| | | | | | | | | |
| Year ended December 31 (in millions of Canadian dollars) | 2016 |
| 2015 |
| 2014 |
|
| Net income | $ | 1,599 |
| $ | 1,352 |
| $ | 1,476 |
|
Net gain (loss) in foreign currency translation adjustments, net of
hedging activities | 18 |
| (86 | ) | (32 | ) |
| Change in derivatives designated as cash flow hedges | (2 | ) | (69 | ) | (49 | ) |
| Change in pension and post-retirement defined benefit plans | (434 | ) | 1,059 |
| (941 | ) |
| Other comprehensive (loss) income before income taxes (Note 7) | (418 | ) | 904 |
| (1,022 | ) |
| Income tax recovery (expense) on above items (Note 7) | 96 |
| (162 | ) | 306 |
|
| Other comprehensive (loss) income (Note 7) | (322 | ) | 742 |
| (716 | ) |
| Comprehensive income | $ | 1,277 |
| $ | 2,094 |
| $ | 760 |
|
See Notes to Consolidated Financial Statements.
CONSOLIDATED BALANCE SHEETS
|
| | | | | | |
| As at December 31 (in millions of Canadian dollars, except Common Shares) | 2016 |
| 2015 |
|
| Assets | | |
| Current assets | | |
| Cash and cash equivalents | $ | 164 |
| $ | 650 |
|
| Accounts receivable, net (Note 9) | 591 |
| 645 |
|
| Materials and supplies | 184 |
| 188 |
|
| Other current assets | 70 |
| 54 |
|
| 1,009 |
| 1,537 |
|
| Investments (Note 11) | 194 |
| 152 |
|
| Properties (Note 12) | 16,689 |
| 16,273 |
|
| Goodwill and intangible assets (Note 13) | 202 |
| 211 |
|
| Pension asset (Note 20) | 1,070 |
| 1,401 |
|
| Other assets (Note 14) | 57 |
| 63 |
|
| Total assets | $ | 19,221 |
| $ | 19,637 |
|
| Liabilities and shareholders’ equity | | |
| Current liabilities | | |
| Accounts payable and accrued liabilities (Note 15) | $ | 1,322 |
| $ | 1,417 |
|
| Long-term debt maturing within one year (Note 16) | 25 |
| 30 |
|
| 1,347 |
| 1,447 |
|
| Pension and other benefit liabilities (Note 20) | 734 |
| 758 |
|
| Other long-term liabilities (Note 18) | 284 |
| 318 |
|
| Long-term debt (Note 16) | 8,659 |
| 8,927 |
|
| Deferred income taxes (Note 5) | 3,571 |
| 3,391 |
|
| Total liabilities | 14,595 |
| 14,841 |
|
| Shareholders’ equity | | |
Share capital (Note 19)
Authorized unlimited Common Shares without par value. Issued and outstanding are 146.3 million and 153.0 million at December 31, 2016 and 2015, respectively.
| 2,002 |
| 2,058 |
|
| Authorized unlimited number of first and second preferred shares; none outstanding. | | |
| Additional paid-in capital | 52 |
| 43 |
|
| Accumulated other comprehensive loss (Note 7) | (1,799 | ) | (1,477 | ) |
| Retained earnings | 4,371 |
| 4,172 |
|
| 4,626 |
| 4,796 |
|
| Total liabilities and shareholders’ equity | $ | 19,221 |
| $ | 19,637 |
|
Commitments and contingencies (Note 23).
Subsequent event (Note 27).
See Notes to Consolidated Financial Statements.
|
| | | | | | | | |
ApprovedOur director compensation program shares the same objective as our executive compensation program: to attract and retain qualified directors and to align the interests of directors and shareholders. Flat fee retainer We pay directors a flat fee, which reflects the director’s ongoing oversight and responsibilities throughout the year and attendance at Board and committee meetings. | | | | | | Aligning director and shareholder interests Directors receive their annual retainer in deferred share units so they have an ongoing stake in our future success, aligning their interests with those of our shareholders. About DDSUs DDSUs are granted to directors under the director deferred share unit plan. Onlynon-employee directors participate in the plan. A DDSU is a bookkeeping entry that has the same value as one CP common share. DDSUs earn additional units as dividend equivalents at the same rate as dividends paid on our shares. Directors receive a cash amount for their DDSUs, one year after they leave the Board, based on the market value of our shares at the time of redemption, less any withholding taxes. |
Directors receive 100% of their annual retainer in Director Deferred Share Units (DDSUs) until they have met their share ownership requirements. After that they must receive at least 50% of their retainer in DDSUs, and can receive the balance in cash. Directors must make their election before the beginning of each calendar year. Directors must meet their share ownership requirements within five years of joining the Board, and must hold their DDSUs for one year after they retire from the Board. The table below shows the flat fee retainers for 2018. In 2018, Canadian directors’ fees were converted to Canadian dollars and the number of DDSUs received was based on the trading price of our shares on the TSX. U.S. directors were paid in U.S. dollars and the number of DDSUs they received was based on the trading price of our shares on the NYSE. | | | | |
| | Annual Retainer | | | |
Board Chair retainer | | US$395,000 | | | | |
Director retainer | | US$200,000 | | | | |
Committee chair retainer | | US$ 30,000 | | | | |
| | | | |
We reimburse directors for travel andout-of-pocket expenses related to attending their Board and committee meetings and other business on behalf of CP.
Mr. Creel does not receive any director compensation because he is compensated in his role as President and CEO.
Benchmarking
Similar to executive compensation, we benchmark director compensation so we can attract the right director talent and be competitive with the market. We amended our peer group to consist of twelve capital-intensive Canadian companies as follows:
| | |
Cenovus Energy Inc. Enbridge Inc. Imperial Oil Limited BCE Inc. GoldCorp Inc. Fortis Inc. | | TransCanada Corporation Telus Corporation Rogers Communications Inc. Barrick Gold Corporation Kinross Gold Corporation Suncor Energy Inc. |
We also look at the director compensation of the Class 1 railroads as a secondary reference.
Independent advice
The Governance Committee may engage an independent consultant with respect to director compensation. The Governance Committee makes its own decisions, which may reflect factors and considerations other than the information and recommendations provided by its external consultant. The Governance Committee did not engage an external compensation consultant in 2018.
2018 director compensation
We paid directors a total of approximately $2,524,539 in 2018 as detailed in the table below. Directors receive a flat fee retainer to cover their ongoing oversight and responsibilities throughout the year and their attendance at Board and committee meetings.
Directors receive 100% of their annual retainer in director deferred share units (DDSUs) until they have met their share ownership requirements. After that, directors are required to receive at least 50% of their compensation in DDSUs. The total represents the approximate dollar value of DDSUs credited to each director’s DDSU account in 2018, based on the closing fair market value of our common shares on the grant date plus the cash portion paid where a director elected to receive a portion of compensation in cash.
Mr. Creel does not receive director compensation because he is compensated in his role as President and CEO (see pages 26 to 30 for details).
| | | | | | | | | | | | | | | | | | | | | | | | | | | | |
| Name | | Fees
earned ($) | | | Share-based
awards(2)(4) ($) | | | Option-based
awards ($) | | | Non-equity incentive
plan compensation ($) | | | Pension
value ($) | | | All other
compensation(3) ($) | | | Total ($) | |
John Baird | | | - | | | | 262,849 | | | | - | | | | - | | | | - | | | | 1,000 | | | | 263,849 | |
Isabelle Courville(1) | | | 151,366 | | | | 151,138 | | | | - | | | | - | | | | - | | | | 1,000 | | | | 303,504 | |
Jill Denham | | | - | | | | 262,849 | | | | - | | | | - | | | | - | | | | 1,000 | | | | 263,849 | |
Rebecca MacDonald | | | - | | | | 302,276 | | | | - | | | | - | | | | - | | | | 1,000 | | | | 303,276 | |
Edward Monser(5) | | | - | | | | 10,611 | | | | - | | | | - | | | | - | | | | 1,000 | | | | 11,611 | |
Matthew Paull | | | - | | | | 298,909 | | | | - | | | | - | | | | - | | | | 1,000 | | | | 299,909 | |
Jane Peverett | | | - | | | | 302,276 | | | | - | | | | - | | | | - | | | | 1,000 | | | | 303,276 | |
Andrew Reardon | | | - | | | | 513,344 | | | | - | | | | - | | | | - | | | | 1,000 | | | | 514,344 | |
Gordon Trafton | | | - | | | | 259,921 | | | | - | | | | - | | | | - | | | | 1,000 | | | | 260,921 | |
| (1) | Until the end of 2018, Ms. Courville elected to receive 50% of her annual director compensation in DDSUs with the remaining 50% paid in cash. |
| (2) | The value of the Board:share-based awards has been calculated in accordance with Financial Accounting Standards Board Accounting Standards Codification Topic 718 (FASB ASC 718) using the grant date fair value, which is prescribed by the DDSU plan. |
| (3) | Each director was provided with a $1,000 donation to the charity of their choice in December 2018 in gratitude for their year of service. This amount appears underAll other compensation. |
| (4) | All directors were paid in U.S. dollars and the value of their share-based awards, and cash payments, as applicable, have been converted to Canadian dollars using the 2018 average exchange rate of $1.2957. |
| (5) | Mr. Monser joined the Board in December, 2018. His 2018 compensation waspro-rated accordingly. |
The Governance Committee reviews director compensation every two to three years based on the directors’ responsibilities and time commitment and the compensation provided by comparable companies. Each director is paid an annual retainer of US$200,000. Committee chairs receive an additional US$30,000 per year and the Board Chair receives an annual retainer of US$395,000. No changes were made to the director compensation program in 2018.
51
Incentive plan awards
Outstanding share-based awards and option-based awards
The table below shows all vested and unvested equity incentive awards that are outstanding as of December 31, 2018.
| | | | | | | | | | | | | | | | | | | | | | | | | | | | | | |
| | Option-based awards | | | | | Share-based awards | |
| Name | | Number of
securities
underlying
unexercised
options (#) | | | |
| | /s/ Andrew F. ReardonOption
exercise
price ($) | | | /s/ Matthew H. Paull |
| | Andrew F. Reardon, Director,Option expiration
date | | | Matthew H. Paull, Director, |
| | ChairValue of the Board
unexercised
in-the-money
options ($) | | | ChairGrant
type | | Number of
shares or units
of shares that
have not
vested (#) | | | Market or
payout value of
share-based
awards that
have not vested ($) | | | Market or payout
value of vested
share-based
awards not paid
out or distributed ($)(1) | |
John Baird | | | - | | | | - | | | | - | | | | - | | | - | | | - | | | | - | | | | 1,059,316 | |
Isabelle Courville | | | - | | | | - | | | | - | | | | - | | | - | | | - | | | | - | | | | 1,704,158 | |
Jill Denham | | | - | | | | - | | | | - | | | | - | | | - | | | - | | | | - | | | | 631,520 | |
Rebecca MacDonald | | | - | | | | - | | | | - | | | | - | | | - | | | - | | | | - | | | | 2,568,228 | |
Edward Monser | | | - | | | | - | | | | - | | | | - | | | - | | | - | | | | - | | | | 11,146 | |
Matthew Paull | | | - | | | | - | | | | - | | | | - | | | - | | | - | | | | - | | | | 1,126,253 | |
Jane Peverett | | | - | | | | - | | | | - | | | | - | | | - | | | - | | | | - | | | | 612,625 | |
Andrew Reardon | | | - | | | | - | | | | - | | | | - | | | - | | | - | | | | - | | | | 3,098,650 | |
Gordon Trafton | | | - | | | | - | | | | - | | | | - | | | - | | | - | | | | - | | | | 617,646 | |
| (1) | Calculated based on the closing price of our shares on December 31, 2018 on the TSX ($242.24), in the case of directors resident in Canada, and on the NYSE (US$177.62) which was converted to Canadian dollars using theyear-end exchange rate of $1.3642, in the case of the Audit Committeedirectors resident in the U.S. |
52
CONSOLIDATED STATEMENTS OF CASH FLOWS
|
| | | | | | | | | |
| Year ended December 31 (in millions of Canadian dollars) | 2016 |
| 2015 |
| 2014 |
|
| Operating activities | | | |
| Net income | $ | 1,599 |
| $ | 1,352 |
| $ | 1,476 |
|
| Reconciliation of net income to cash provided by operating activities: | | | |
| Depreciation and amortization | 640 |
| 595 |
| 552 |
|
| Deferred income taxes (Note 5) | 320 |
| 234 |
| 354 |
|
| Pension funding in excess of expense (Note 20) | (138 | ) | (49 | ) | (132 | ) |
| Foreign exchange (gain) loss on long-term debt (Note 3) | (79 | ) | 297 |
| 11 |
|
| Other operating activities, net | (198 | ) | (245 | ) | (14 | ) |
| Change in non-cash working capital balances related to operations (Note 8) | (55 | ) | 275 |
| (124 | ) |
| Cash provided by operating activities | 2,089 |
| 2,459 |
| 2,123 |
|
| Investing activities | | | |
| Additions to properties | (1,182 | ) | (1,522 | ) | (1,449 | ) |
| Proceeds from the sale of west end of Dakota, Minnesota and Eastern Railroad (Note 10) | — |
| — |
| 236 |
|
| Proceeds from the sale of Delaware & Hudson South (Note 10) | — |
| 281 |
| — |
|
| Proceeds from sale of properties and other assets (Note 10) | 116 |
| 114 |
| 52 |
|
| Other | (3 | ) | 4 |
| — |
|
Cash used in investing activities(1) | (1,069 | ) | (1,123 | ) | (1,161 | ) |
| Financing activities | | | |
| Dividends paid | (255 | ) | (226 | ) | (244 | ) |
| Issuance of CP Common Shares (Note 19) | 21 |
| 43 |
| 62 |
|
| Purchase of CP Common shares (Note 19) | (1,210 | ) | (2,787 | ) | (2,050 | ) |
| Issuance of long-term debt, excluding commercial paper (Note 16) | — |
| 3,411 |
| — |
|
| Repayment of long-term debt, excluding commercial paper (Note 16) | (38 | ) | (505 | ) | (183 | ) |
| Net (repayment) issuance of commercial paper (Note 16) | (8 | ) | (893 | ) | 771 |
|
| Settlement of foreign exchange forward on long-term debt | — |
| — |
| 17 |
|
| Other | (3 | ) | — |
| (3 | ) |
| Cash used in financing activities | (1,493 | ) | (957 | ) | (1,630 | ) |
| Effect of foreign currency fluctuations on U.S. dollar-denominated cash and cash equivalents | (13 | ) | 45 |
| 7 |
|
| Cash position | | | |
(Decrease) increase in cash, cash equivalents, and restricted cash(1) | (486 | ) | 424 |
| (661 | ) |
Cash, cash equivalents, and restricted cash at beginning of year(1) | 650 |
| 226 |
| 887 |
|
Cash, cash equivalents, and restricted cash at end of year(1) | $ | 164 |
| $ | 650 |
| $ | 226 |
|
Supplemental disclosures of cash flow information: | | | |
| Income taxes paid | $ | 322 |
| $ | 176 |
| $ | 226 |
|
| Interest paid | $ | 488 |
| $ | 336 |
| $ | 309 |
|
(1)Certain figures have been reclassified due to a retrospective change in accounting policy (Note 2).
| ITEM 12. | SECURITY OWNERSHIP OF CERTAIN BENEFICIAL OWNERS AND MANAGEMENT AND RELATED STOCKHOLDER MATTERS |
Equity Compensation Plan Information
See Notes to Consolidated Financial Statements.
CONSOLIDATED STATEMENTS OF CHANGES IN SHAREHOLDERS’ EQUITY
|
| | | | | | | | | | | | | | | |
| (in millions of Canadian dollars except per share data) | Share
capital |
| Additional
paid-in
capital |
| Accumulated
other
comprehensive
loss |
| Retained
earnings |
| Total
shareholders’
equity |
|
| Balance at December 31, 2013 | $ | 2,240 |
| $ | 34 |
| $ | (1,503 | ) | $ | 6,326 |
| $ | 7,097 |
|
| Net income | — |
| — |
| — |
| 1,476 |
| 1,476 |
|
| Other comprehensive loss (Note 7) | — |
| — |
| (716 | ) | — |
| (716 | ) |
| Dividends declared ($1.4000 per share) | — |
| — |
| — |
| (241 | ) | (241 | ) |
| Effect of stock-based compensation expense | — |
| 19 |
| — |
| — |
| 19 |
|
| CP Common Shares repurchased (Note 19) | (136 | ) | — |
| — |
| (1,953 | ) | (2,089 | ) |
| Shares issued under stock option plan (Note 19) | 81 |
| (17 | ) | — |
| — |
| 64 |
|
| Balance at December 31, 2014 | 2,185 |
| 36 |
| (2,219 | ) | 5,608 |
| 5,610 |
|
| Net income | — |
| — |
| — |
| 1,352 |
| 1,352 |
|
| Other comprehensive income (Note 7) | — |
| — |
| 742 |
| — |
| 742 |
|
| Dividends declared ($1.4000 per share) | — |
| — |
| — |
| (221 | ) | (221 | ) |
| Effect of stock-based compensation expense | — |
| 17 |
| — |
| — |
| 17 |
|
| CP Common Shares repurchased (Note 19) | (181 | ) | — |
| — |
| (2,567 | ) | (2,748 | ) |
| Shares issued under stock option plan (Note 19) | 54 |
| (10 | ) | — |
| — |
| 44 |
|
| Balance at December 31, 2015 | 2,058 |
| 43 |
| (1,477 | ) | 4,172 |
| 4,796 |
|
| Net income | — |
| — |
| — |
| 1,599 |
| 1,599 |
|
| Other comprehensive loss (Note 7) | — |
| — |
| (322 | ) | — |
| (322 | ) |
| Dividends declared ($1.8500 per share) | — |
| — |
| — |
| (274 | ) | (274 | ) |
| Effect of stock-based compensation expense | — |
| 14 |
| — |
| — |
| 14 |
|
| CP Common Shares repurchased (Note 19) | (84 | ) | — |
| — |
| (1,126 | ) | (1,210 | ) |
| Shares issued under stock option plan (Note 19) | 28 |
| (5 | ) | — |
| — |
| 23 |
|
| Balance at December 31, 2016 | $ | 2,002 |
| $ | 52 |
| $ | (1,799 | ) | $ | 4,371 |
| $ | 4,626 |
|
See Notes to Consolidated Financial Statements.
CANADIAN PACIFIC RAILWAY LIMITED
Notes to Consolidated Financial Statements
December 31, 2016
Item 11 – “Executive Compensation—Equity Compensation Plan Information” for information regarding our equity compensation plans on page 6.Beneficial Ownership Table
The table below sets forth the number and percentage of outstanding shares of our common stock beneficially owned by each person, or group of persons, known by Canadian Pacific Railway Limited (“CPRL”), through its subsidiaries (collectively referredbased on publicly available information as of April 17, 2019, to as “CP” or “the Company”), operates a transcontinental railway in Canada and the United States. CP provides rail and intermodal transportation services over a networkown beneficially more than five percent of approximately 12,400 miles, serving the principal business centresour common stock, each of Canada from Montreal, Quebec, to Vancouver, British Columbia, and the U.S. Northeast and Midwest regions. CP’s railway network feeds directly into the U.S. heartland from the East and West coasts. Agreements with other carriers extend the Company’s market reach eastour directors, each of Montreal in Canada, throughout the U.S. and into Mexico. CP transports bulk commodities, merchandise freight and intermodal traffic. Bulk commodities include grain, coal, fertilizers and sulphur. Merchandise freight consists of finished vehicles and automotive parts, as well as forest, industrial and consumer products. Intermodal traffic consists largely of retail goods in overseas containers that can be transported by train, ship and truck, and in domestic containers and trailers that can be moved by train and truck.
1 Summary of significant accounting policies
Accounting principles generally accepted in the United States of America (“GAAP”)
These consolidated financial statements are expressed in Canadian dollars and have been prepared in accordance with GAAP.
Principles of consolidation
These consolidated financial statements include the accounts of CPour NEOs and all its subsidiaries. The Company’s investments in which it has significant influence are accounted for using the equity method. All intercompany accountsdirectors and transactions have been eliminated.
Use of estimates
The preparation of these consolidated financial statements in conformity with GAAP requires management to make estimates and assumptions that affect the reported amounts of revenues and expenses during the year, the reported amounts of assets and liabilities, and the disclosure of contingent assets and liabilities at the date of the financial statements. Management regularly reviews its estimates, including those related to environmental liabilities, pensions and other benefits, depreciable lives of properties, deferred income tax assets and liabilities,executive officers as
well as legal and personal injury liabilities based upon currently available information. Actual results could differ from these estimates.a group. | | | | | | | | | | | | |
Name of beneficial owner | | Shares of
common stock
beneficially
owned | | | Percent of
common stock
outstanding | | | Additional
underlying
shares(d) | |
John Baird(a) | | | – | | | | – | | | | – | |
Isabelle Courville(a) | | | 900 | | | | * | | | | – | |
Jill Denham(a) | | | – | | | | – | | | | – | |
Rebecca MacDonald(a) | | | – | | | | – | | | | – | |
Edward Monser(a) | | | – | | | | – | | | | – | |
Matthew Paull(a) | | | 3,000 | | | | * | | | | – | |
Jane Peverett(a) | | | – | | | | – | | | | – | |
Andrew Reardon(a) | | | 453 | | | | * | | | | – | |
Gordon T. Trafton(a) | | | – | | | | – | | | | – | |
Keith Creel(b) | | | 3,118 | | | | * | | | | 312,974 | |
John Brooks(b) | | | 1,904 | | | | * | | | | 20,751 | |
Robert Johnson(b) | | | 590 | | | | * | | | | 29,071 | |
Laird Pitz(b) | | | 67 | | | | * | | | | 11,676 | |
Nadeem Velani(b) | | | 1,090 | | | | * | | | | 13,502 | |
TCI Fund Management Limited(c) | | | 7,835,316 | | | | 5.58 | % | | | – | |
All current executive officers and directors as a group | | | 402,806 | | | | * | | | | N/A | |
| * | Represents less than one percent of the outstanding common stock. |
| (a) | See Directors’ Profiles in “Item 10. Directors, Executive Officers and Corporate Governance” above for disclosure with respect to DDSUs. The address of each director is c/o Canadian Pacific, 7550 Ogden Dale Road S.E., Calgary, Alberta, T2C 4X9. |
| (b) | See “Compensation Details – Deferred Compensation Plans” in Item 11. Executive Compensation, for disclosure with respect to NEO DSUs. The address of each executive officer is c/o Canadian Pacific, 7550 Ogden Dale Road S.E., Calgary, Alberta, T2C 4X9. |
| (c) | Based upon statements in the Schedule 13G filed by TCI Fund Management Limited (“TCI Fund”) and Christopher Hohn on February 14, 2019, TCI Fund and Mr. Hohn have (i) shared voting power over 7,835,316 shares of CP’s common stock; and (ii) shared dispositive power of 7,835,316 shares of CP’s common stock. The Children’s Investment Master Fund (“TCIF”) is the investment manager of TCI Fund and Talos Capital DAC (“Talos”). Mr. Hohn, as managing director of TCIF, may be deemed to beneficially own the shares held by the TCI Fund and Talos. The address of each of TCI Fund and Mr. Hohn is 7 Clifford Street, London W1S 2FT, United Kingdom. |
| (d) | Represents stock options held that were exercisable as of April 17, 2019 or within 60 days thereafter. |
53
Principal subsidiaries
The following list sets out CPRL’s principal railway operating subsidiaries, including the jurisdiction of incorporation. All of these subsidiaries are wholly owned, directly or indirectly, by CPRL as at December 31, 2016.
|
| ITEM 13. | |
Principal subsidiary | Incorporated under
the laws of
|
Canadian Pacific Railway Company | Canada |
Soo Line Railroad Company (“Soo Line”) | Minnesota |
Delaware and Hudson Railway Company, Inc. (“D&H”) | Delaware |
Dakota, Minnesota & Eastern Railroad Corporation (“DM&E”) | Delaware |
Mount Stephen Properties Inc. (“MSP”) | CanadaCERTAIN RELATIONSHIPS AND RELATED TRANSACTIONS, AND DIRECTOR INDEPENDENCE |
Revenue recognition
Railway freight revenues are recognized based on the percentage of completed service method. The allocation of revenue between reporting periods is based on the relative transit time in each reporting period with expenses recognized as incurred. Volume rebates to customers are accrued as a reduction of freight revenues based on estimated volumeRelated party transactions
Directors, officers and contract terms as freight service is provided. Other revenues, including passenger revenue, revenue from leasing certain assets, switching fees, and revenue from logistics services, are recognized as service is performed or contractual obligations are met. Revenues are presented net of taxes collected from customers and remitted to government authorities.
Cash and cash equivalents
Cash and cash equivalents include highly liquid short-term investments that are readily convertible to cash with original maturities of three months or less, but exclude cash and cash equivalents subject to restrictions.
Restricted cash and cash equivalents
Cash and cash equivalents that are restricted as to withdrawal or usage, in accordance with specific agreements, are presented as restricted cash and cash equivalents on the balance sheets when applicable.
Foreign currency translation
Assets and liabilities denominated in foreign currencies, other than those held through foreign subsidiaries, are translated into Canadian dollars at the year-end exchange rate for monetary items and at the historical exchange rates for non-monetary items. Foreign currency revenues and expenses are translated at the exchange rates in effect on the dates of the related transactions. Foreign exchange ("FX") gains and losses, other than those arising from the translation of the Company’s net investment in foreign subsidiaries, are included in income.
The accounts of the Company’s foreign subsidiaries are translated into Canadian dollars using the year-end exchange rate for assets and liabilities and the average exchange rates during the year for revenues, expenses, gains and losses. FX gains and losses arising from the translation of the foreign subsidiaries’ assets and liabilities are included in “Other comprehensive income (loss)”. A portion of U.S. dollar-denominated long-term debt has been designated as a hedge of the net investment in foreign subsidiaries. As a result, unrealized FX gains and losses on U.S. dollar-denominated long-term debt, designated as a hedge, are offset against FX gains and losses arising from the translation of foreign subsidiaries’ accounts in “Other comprehensive income (loss)”.
Pensions and other benefits
Pension costs are actuarially determined using the projected-benefit method pro-rated over the credited service periods of employees. This method incorporates management’s best estimates of expected plan investment performance, salary escalation and retirement ages of employees. The expected return on fund assets is calculated using market-related asset values developed from a five-year average of market values for the fund’s public equity securities and absolute return strategies (with each prior year’s market value adjusted to the current date for assumed investment income during the intervening period) plus the market value of the fund’s fixed income, real estate and infrastructure securities, subject to the market-related asset value not being greater than 120% of the market value nor being less than 80% of the market value. The discount rate used to determine the projected-benefit obligation is based on blended market interest rates on high-quality corporate debt instruments with matching cash flows. Unrecognized actuarial gains and losses in excess of 10% of the greater of the benefit obligation and the market-related value of plan assets are amortized over the expected average remaining service period of active employees expected to receive benefits under the plan (approximately 11 years). Prior service costs arising from collectively bargained amendments to pension plan benefit provisions are amortized over the term of the applicable union agreement. Prior service costs arising from all other sources are amortized over the expected average remaining service period of active employees who are expected to receive benefits under the plan at the date of amendment.
Costs for post-retirement and post-employment benefits other than pensions, including post-retirement health care and life insurance and some workers’ compensation and long-term disability benefits in Canada, are actuarially determined on a basis similar to pension costs.
The over or under funded status of defined benefit pension and other post-retirement benefit plans are measured as the difference between the fair value of the plan assets and the benefit obligation, and are recognized on the balance sheets. In addition, any unrecognized actuarial gains and losses and prior service costs and credits that arise during the period are recognized as a component of “Other comprehensive income (loss)”, net of tax.
Gains and losses on post-employment benefits that do not vest or accumulate, including some workers’ compensation and long-term disability benefits in Canada, are included immediately in income as “Compensation and benefits”.
Materials and supplies
Materials and supplies are carried at the lower of average cost or market value and consist primarily of fuel and parts used in the repair and maintenance of track structures, equipment, locomotives and freight cars.
Properties
Fixed asset additions and major renewals are recorded at cost, including direct costs, attributable indirect costs and carrying costs, less accumulated depreciation and any impairment. When there is a legal obligation associated with the retirement of property, a liability is initially recognized at its fair value and a corresponding asset retirement cost is added to the gross book value of the related asset and amortized to expense over the estimated term to retirement. The Company reviews the carrying amounts of its properties whenever changes in circumstances indicate that such carrying amounts may not be recoverable based on future undiscounted cash flows. When such properties are determined to be impaired, recorded asset values are revised to their fair value.
The Company recognizes expenditures as additions to properties or operating expenses based on whether the expenditures increase the output or service capacity, lower the associated operating costs or extend the useful life of the properties and whether the expenditures exceed minimum physical and financial thresholds.
Much of the additions to properties, both new and replacement properties, are self-constructed. These are initially recorded at cost, including direct costs and attributable indirect costs, overheads and carrying costs. Direct costs include, among other things, labour costs, purchased services, equipment costs and material costs. Attributable indirect costs and overheads include incremental long-term variable costs resulting from the execution of capital projects. Indirect costs mainly include work trains, material distribution, highway vehicles and work equipment. Overheads primarily include a portion of the engineering department’s costs, which plans, designs and administers these capital projects. These costs are allocated to projects by applying a measure consistent with the nature of the cost, based on cost studies. For replacement properties, the project costs are allocated to dismantling and installation based on cost studies. Dismantling work is performed concurrently with the installation.
Ballast programs including undercutting, shoulder ballasting and renewal programs that form part of the annual track program are capitalized as this work, and the related added ballast material, significantly improves drainage, which in turn extends the life of ties and other track materials. These costs are tracked separately from the underlying assets and depreciated over the period to the next estimated similar ballast program. Spot replacement of ballast is considered a repair which is expensed as incurred.
The costs of large refurbishments are capitalized and locomotive overhauls are expensed as incurred, except where overhauls represent a betterment of the locomotive in which case costs are capitalized.
The Company capitalizes development costs for major new computer systems.
The Company follows group depreciation which groups assets which are similar in nature and have similar economic lives. The property groups are depreciated on a straight-line basis reflecting their expected economic lives determined by studies of historical retirements of properties in the group and engineering estimates of changes in current operations and of technological advances. Actual use and retirement of assets may vary from current estimates, which would impact the amount of depreciation expense recognized in future periods. Rail and other track material in the U.S. are depreciated based directly on usage.
When depreciable property is retired or otherwise disposed of in the normal course of business, the book value, less net salvage proceeds, is charged to accumulated depreciation and if different than the assumptions under the depreciation study could potentially result in adjusted depreciation expense over a period of years. However, when removal costs exceed the salvage value on assets and the Company has no legal obligation to remove the assets, the removal costs incurred are charged to income in the period in which the assets are removed and are not charged to accumulated depreciation.
For the sale or retirement of larger groups of depreciable assets that are unusual and were not considered in depreciation studies, CP records a gain or loss for the difference between net proceeds and net book value of the assets sold or retired.
Equipment under capital lease is included in Properties and depreciated over the period of expected use.
Assets held for sale
Assets to be disposed that meet the held for sale criteria are reported at the lower of their carrying amount and fair value, less costs to sell, and are no longer depreciated.
Goodwill and intangible assets
Goodwill represents the excess of the purchase price over the fair value of identifiable net assets upon acquisition of a business. Goodwill is assigned to the reporting units that are expected to benefit from the business acquisition which, after integration of operations with the railway network, may be different than the acquired business.
The carrying value of goodwill, which is not amortized, is assessed for impairment annually in the fourth quarter of each year as at October 1st, or more frequently as economic events dictate. The Company has the option of performing an assessment of certain qualitative factors (“Step 0”) to determine if it is more likely than not that the fair value of a reporting unit is less than its carrying value or proceeding directly to a quantitative impairment test (“Step 1”). Qualitative factors include but are not limited to, economic, market and industry conditions, cost factors and overall financial performance of the reporting unit. If Step 0 indicates that the carrying value is less than the fair value, then performing the two-step impairment test is unnecessary. Under Step 1, the fair value of the reporting unit is compared to its carrying value, including goodwill. If the fair value of the reporting unit is less than its carrying value, goodwill is potentially impaired. The impairment charge that would be recognized is the excess of the carrying value of the goodwill over the fair value of the goodwill, determined in the same manner as in a business combination.
Intangible assets with finite lives are amortized on a straight-line basis over the estimated useful lives of the respective assets. Favourable leases, customer relationships and interline contracts have amortization periods ranging from 15 to 20 years. When there is a change in the estimated useful life of an intangible asset with a finite life, amortization is adjusted prospectively.
Financial instruments
Financial instruments are contracts that give rise to a financial asset of one party and a financial liability or equity instrument of another party.
Financial instruments are recognized initially at fair value, which is the amount of consideration that would be agreed upon in an arm’s-length transaction between willing parties.
Subsequent measurement depends on how the financial instruments have been classified. Accounts receivable and investments, classified as loans and receivables, are measured at amortized cost, using the effective interest method. Cash and cash equivalents and derivatives are classified as held for trading and are measured at fair value. Accounts payable, accrued liabilities, short-term borrowings, dividends payable, other long-term liabilities and long-term debt, classified as other liabilities, are also measured at amortized cost.
Derivative financial instruments
Derivative financial and commodity instruments may be used from time to time by the Company to manage its exposure to risks relating to foreign currency exchange rates, stock-based compensation, interest rates and fuel prices. When CP utilizes derivative instruments in hedging relationships, CP identifies, designates and documents those hedging transactions and regularly tests the transactions to demonstrate effectiveness in order to continue hedge accounting.
All derivative instruments are classified as held for trading and recorded at fair value. Any change in the fair value of derivatives not designated as hedges is recognized in the period in which the change occurs in the Consolidated Statements of Income in the line item to which the derivative instrument is related. On the Consolidated Balance Sheets they are classified in “Other assets”, “Other long-term liabilities”, “Other current assets” or “Accounts payable and accrued liabilities” as applicable. Gains and losses arising from derivative instruments may affect the following lines on the Consolidated Statements of Income: “Revenues”, “Compensation and benefits”, “Fuel”, “Other income and charges”, and “Net interest expense”.
For fair value hedges, the periodic changes in values are recognized in income, on the same line as the changes in values of the hedged items are also recorded. For a cash flow hedge, the change in value of the effective portion is recognized in “Other comprehensive income (loss)”. Any ineffectiveness within an effective cash flow hedge is recognized in income as it arises in the same income account as the hedged item. Should a cash flow hedging relationship become ineffective, previously unrealized gains and losses remain within “Accumulated other comprehensive loss” until the hedged item is settled and, prospectively, future changes in value of the derivative are recognized in income. The change in value of the effective portion of a cash flow hedge remains in “Accumulated other comprehensive loss” until the related hedged item settles, at which time amounts recognized in “Accumulated other comprehensive loss” are reclassified to the same income or balance sheet account that records the hedged item.
In the Consolidated Statements of Cash Flows, cash flows relating to derivative instruments designated as hedges are included in the same line as the related hedged items.
Environmental remediation
Environmental remediation accruals, recorded on an undiscounted basis unless a reliably determinable estimate as to amount and timing of costs can be established, cover site-specific remediation programs. The accruals are recorded when the costs to remediate are probable and reasonably estimable. Certain future costs to monitor sites are discounted at an adjusted risk free rate. Provisions for environmental remediation costs are recorded in “Other long-term liabilities”, except for the current portion, which is recorded in “Accounts payable and accrued liabilities”.
Income taxes
The Company follows the liability method of accounting for income taxes. Deferred income tax assets and liabilities are determined based on differences between the financial reporting and tax bases of assets and liabilities using enacted tax rates and laws that will be in effect when the differences are expected to reverse.
The effect of a change in income tax rates on deferred income tax assets and liabilities is recognized in income in the period during which the change occurs.
When appropriate, the Company records a valuation allowance against deferred tax assets to reflect that these tax assets may not be realized. In determining whether a valuation allowance is appropriate, CP considers whether it is more likely than not that all or some portion of CP’s deferred tax assets will not be realized, based on management’s judgment using available evidence about future events.
At times, tax benefit claims may be challenged by a tax authority. Tax benefits are recognized only for tax positions that are more likely than not sustainable upon examination by tax authorities. The amount recognized is measured as the largest amount of benefit
that is greater than 50% likely to be realized upon settlement. A liability for “unrecognized tax benefits” is recorded for any tax benefits claimed in CP’s tax returns that do not meet these recognition and measurement standards.
Investment and other similar tax credits are deferred on the Consolidated Balance Sheets and amortized to “Income tax expense” as the related asset is recognized in income.
Earnings per share
Basic earnings per share are calculated using the weighted average number of common shares outstanding during the year. Diluted earnings per share are calculated using the treasury stock method for determining the dilutive effect of options.
Stock-based compensation
CP follows the fair value based approach to account for stock options. Compensation expense and an increase in “Additional paid-in capital” are recognized for stock options over their vesting period, or over the period from the grant date to the date employees become eligible to retire when this is shorter than the vesting period, based on their estimated fair values on the grant date, as determined using the Black-Scholes option-pricing model.
Any consideration paid by employees on exercise of stock options is credited to “Share capital” when the option is exercised and the recorded fair value of the option is removed from “Additional paid-in capital“ and credited to “Share capital”.
Compensation expense is also recognized for deferred share units (“DSUs”), performance share units (“PSUs”) and restricted share units (“RSUs”) using the fair value method. Compensation expense is recognized over the vesting period, or for PSUs and DSUs only, over the period from the grant date to the date employees become eligible to retire when this is shorter than the vesting period. Forfeitures of DSUs, PSUs and RSUs are estimated at issuance and subsequently at the balance sheet date.
The employee share purchase plan (“ESPP”) gives rise to compensation expense that is recognized using the issue price by amortizing the cost over the vesting period or over the period from the grant date to the date employees become eligible to retire when this is shorter than the vesting period.
2 Accounting changes
Implemented in 2016
Early Adoption of Restricted Cash
In November 2016, the Financial Accounting Standards Board ("FASB") issued Accounting Standards Update (“ASU”) 2016-18, Restricted Cash a consensus of the FASB Emerging Issues Task Force under FASB Accounting Standards Codification ("ASC")Topic 230 Statement of Cash Flows. The amendments required the statement of cash flows explain the change during the period in the total of cash, cash equivalents, and amounts generally described as restricted cash and restricted cash equivalents. Restricted cash will therefore be included in beginning-of-period and end-of-period total amounts shown on the statement of cash flows. The updated standard does not provide a definition of restricted cash and restricted cash equivalents. This ASU is effective retrospectively for public entities for fiscal years and interim periods within those years, beginning on or after December 15, 2017. Early adoption of this ASU is permitted. The Company adopted the provisions of this ASU during the fourth quarter of 2016. As a result of the adoption of ASU 2016-18, the 2014 comparative Statement of Cash Flows has been restated to reflect $411 million in restricted cash and cash equivalents used to collateralize letters of credit in the beginning-of-period total cash and cash equivalents, with the corresponding change in restricted cash and cash equivalents of the year removed from investing activities. There was no restricted cash balance remaining at the end of both comparative periods.
Amendments to the Consolidation Analysis
In February 2015, the FASB issued ASU 2015-02, Amendments to the Consolidation Analysis under FASB ASC Topic 810 Consolidation. The amendments required reporting entities to evaluate whether they should consolidate certain legal entities under the revised consolidation model. Specifically, the amendments modify the evaluation of whether limited partnerships and similar legal entities are variable interest entities (“VIEs”) or voting interest entities, eliminated the presumption that a general partner should consolidate a limited partnership and affected the consolidation analysis of reporting entities involved with VIEs, particularly those that have fee arrangements and related party relationships. This ASU was effective for public entities for fiscal years, and interim periods within those years, beginning on or after December 15, 2015. Entities had the option of using either a full retrospective or a modified retrospective approach to adopt this ASU. The Company evaluated all existing VIEs and all arrangements that might give rise to a VIE; no changes to consolidation, disclosure or financial statement presentation were required as a result of this evaluation.
Future changes
Simplifying the Subsequent Measurement of Inventory
In July 2015, the FASB issued ASU 2015-11, Simplifying the Measurement of Inventory under FASB ASC Topic 330 Inventory. The amendments require reporting entities to measure inventory at the lower of cost and net realizable value. Net realizable value is the estimated selling prices in the ordinary course of business, less reasonably predictable costs of completion, disposal, and transportation. The amendments apply to inventory that is measured using the first-in, first-out or average cost basis. This ASU will be effective for public entities for fiscal years, and interim periods within those years, beginning after December 15, 2016, and will be applied prospectively. The Company does not anticipate that the adoption of this ASU will have an impact on the consolidated financial statements.
Leases
In February 2016, the FASB issued ASU 2016-02, Leases. The new FASB ASC Topic 842 Leases supersedes the lease recognition and measurement requirements in Topic 840 Leases. This new standard requires recognition of right-of-use assets and lease liabilities by lessees for those leases classified as finance and operating leases with a maximum term exceeding 12 months. This ASU will be effective for public entities for fiscal years, and interim periods within those years, beginning on or after December 15, 2018. Entities are required to
usereport any related party transactions to comply with our code of business ethics.In 2018, there were no transactions between CP and a modified retrospective approach to adopt this ASU. The Company is assessing contractual arrangements throughrelated person as described in Item 404 of RegulationS-K, which defines a cross functional team and assessing potential system changes required to deliver required accounting changes. There will berelated person as:
a director, nominated director or executive officer of CP,
an immediate family member of a director, nominated director or executive officer, or
someone who beneficially owns more than 5% of our shares or a member of their immediate family.
Any director who has a material increaseinterest in a transaction or agreement involving CP must disclose the interest to right of use assets and lease liabilities on the Consolidated balance sheet, but the Company does not anticipate a material impact on the Consolidated statement of income.
Revenue from Contracts with Customers
In March 2016, the FASB issued ASU 2016-08, Revenue from Contracts with Customers: Principal versus Agent Considerations under FASB ASC Topic 606. The amendments clarify the principal versus agent guidance in determining whether to recognize revenue on a gross or net basis. The amendments are effective for public entities for annual reporting periods beginning on or after December 15, 2017, including interim periods within that reporting period. Entities have the option of using either a full retrospective or a modified retrospective approach to adopt this ASU. CP is currently assessing the transition methods for adoption in the first quarter of 2018. CP expects to continue to recognize freight revenue, which represents greater than 95% of CP's annual revenues, over time and is currently reviewing agreements to determine the impact of the new standard on non-freight revenue.
Compensation – Stock Compensation
In March 2016, the FASB issued ASU 2016-09, Compensation – Stock Compensation, under ASC Topic 718. The amendments clarify the guidance relating to treatment of excess tax benefits and deficiencies, acceptable forfeiture rate policies, and treatment of cash paid by an employer when directly withholding shares for tax-withholding purposesCEO and the requirement to treat such cash flows as a financing activity. This ASU will be effective for public entities for fiscal years, and interim periods within those years, beginning on or after December 15, 2016. Early adoption is permitted. The Company does not anticipate the adoption of this ASU will have an impact on the consolidated financial statements.
3 Other income and charges
|
| | | | | | | | | |
| (in millions of Canadian dollars) | 2016 |
| 2015 |
| 2014 |
|
| Foreign exchange (gain) loss on long-term debt | $ | (79 | ) | $ | 297 |
| $ | 11 |
|
| Other foreign exchange gains | (5 | ) | (24 | ) | — |
|
| Early redemption premium on notes (Note 16) | — |
| 47 |
| — |
|
| Legal settlement | 25 |
| — |
| — |
|
| Other | 14 |
| 15 |
| 8 |
|
| Total other income and charges | $ | (45 | ) | $ | 335 |
| $ | 19 |
|
4 Net interest expense
|
| | | | | | | | | |
| (in millions of Canadian dollars) | 2016 |
| 2015 |
| 2014 |
|
| Interest cost | $ | 497 |
| $ | 409 |
| $ | 301 |
|
| Interest capitalized to Properties | (25 | ) | (14 | ) | (15 | ) |
| Interest expense | 472 |
| 395 |
| 286 |
|
| Interest income | (1 | ) | (1 | ) | (4 | ) |
| Net interest expense | $ | 471 |
| $ | 394 |
| $ | 282 |
|
Interest expense includes interest on capital leases of $11 million for the year ended December 31, 2016 (2015 – $11 million; 2014 – $12 million).
5 Income taxes
The following is a summary of the major components of the Company’s income tax expense:
|
| | | | | | | | | |
| (in millions of Canadian dollars) | 2016 |
| 2015 |
| 2014 |
|
| Current income tax expense | $ | 233 |
| $ | 373 |
| $ | 208 |
|
| Deferred income tax expense |
|
|
|
| Origination and reversal of temporary differences | 336 |
| 105 |
| 317 |
|
| Effect of tax rate increases | — |
| 23 |
| — |
|
| Effect of hedge of net investment in foreign subsidiaries | (20 | ) | 100 |
| 42 |
|
| Other | 4 |
| 6 |
| (5 | ) |
| Total deferred income tax expense | 320 |
| 234 |
| 354 |
|
| Total income taxes | $ | 553 |
| $ | 607 |
| $ | 562 |
|
| Income before income tax expense |
|
|
|
| Canada | $ | 1,513 |
| $ | 1,099 |
| $ | 1,269 |
|
| Foreign | 639 |
| 860 |
| 769 |
|
| Total income before income tax expense | $ | 2,152 |
| $ | 1,959 |
| $ | 2,038 |
|
| Income tax expense |
|
|
|
| Current |
|
|
|
| Canada | $ | 165 |
| $ | 173 |
| $ | 50 |
|
| Foreign | 68 |
| 200 |
| 158 |
|
| Total current income tax expense | 233 |
| 373 |
| 208 |
|
| Deferred |
|
|
|
| Canada | 207 |
| 163 |
| 292 |
|
| Foreign | 113 |
| 71 |
| 62 |
|
| Total deferred income tax expense | 320 |
| 234 |
| 354 |
|
| Total income taxes | $ | 553 |
| $ | 607 |
| $ | 562 |
|
The provision for deferred income taxes arises from temporary differences in the carrying values of assets and liabilities for financial statement and income tax purposes and the effect of loss carry forwards. The items comprising the deferred income tax assets and liabilities are as follows:
|
| | | | | | |
| (in millions of Canadian dollars) | 2016 |
| 2015 |
|
| Deferred income tax assets | | |
| Amount related to tax losses carried forward | $ | 18 |
| $ | 16 |
|
| Liabilities carrying value in excess of tax basis | 149 |
| 89 |
|
| Future environmental remediation costs | 30 |
| 33 |
|
| Tax credits carried forward including minimum tax | — |
| — |
|
| Other | 58 |
| 72 |
|
| Total deferred income tax assets | 255 |
| 210 |
|
| Deferred income tax liabilities |
|
|
| Properties carrying value in excess of tax basis | 3,796 |
| 3,553 |
|
| Other | 30 |
| 48 |
|
| Total deferred income tax liabilities | 3,826 |
| 3,601 |
|
| Total net deferred income tax liabilities | $ | 3,571 |
| $ | 3,391 |
|
The Company’s consolidated effective income tax rate differs from the expected Canadian statutory tax rates. Expected income tax expense at statutory rates is reconciled to income tax expense as follows:
|
| | | | | | | | | |
| (in millions of Canadian dollars, except percentage) | 2016 |
| 2015 |
| 2014 |
|
| Statutory federal and provincial income tax rate (Canada) | 26.65 | % | 26.47 | % | 26.31 | % |
| Expected income tax expense at Canadian enacted statutory tax rates | $ | 573 |
| $ | 519 |
| $ | 536 |
|
| Increase (decrease) in taxes resulting from: |
|
|
|
| (Gains) losses not subject to tax | (23 | ) | 28 |
| (5 | ) |
| Canadian tax rate differentials | — |
| 1 |
| (1 | ) |
| Foreign tax rate differentials | — |
| 39 |
| 36 |
|
| Effect of tax rate increases | — |
| 23 |
| — |
|
| Other | 3 |
| (3 | ) | (4 | ) |
| Income tax expense | $ | 553 |
| $ | 607 |
| $ | 562 |
|
The Company has no unrecognized tax benefits from capital losses at December 31, 2016 and 2015.
The Company has not provided a deferred liability for the income taxes, if any, which might become payable on any temporary difference associated with its foreign investments because the Company intends to indefinitely reinvest in its foreign investments and has no intention to realize this difference by a sale of its interest in foreign investments. It is not practical to calculate the amount of the deferred tax liability.
During the second quarter of 2015, legislation was enacted to increase the province of Alberta's corporate income tax rate. As a result, the Company recalculated its deferred income taxes as at January 1, 2015 based on this change and recorded an income tax expense of $23 million in the second quarter of 2015.
At December 31, 2016, the Company had income tax operating losses carried forward of $48 million, which have been recognized as a deferred tax asset. Certain of these losses carried forward will begin to expire in 2027, with the majority expiring between 2029 and 2035. The Company also has minimum tax credits of approximately $1 million that are carried forward indefinitely without expiration. The Company did not have any investment tax credits carried forward.
It is more likely than not that the Company will realize the majority of its deferred income tax assets from the generation of future taxable income, as the payments for provisions, reserves and accruals are made and losses and tax credits carried forward are utilized.
The following table provides a reconciliation of uncertain tax positions in relation to unrecognized tax benefits for Canada and the United States for the year ended December 31, 2016:
|
| | | | | | | | | |
| (in millions of Canadian dollars) | 2016 |
| 2015 |
| 2014 |
|
| Unrecognized tax benefits at January 1 | $ | 15 |
| $ | 17 |
| $ | 16 |
|
| Increase in unrecognized: |
|
|
|
| Tax benefits related to the current year | — |
| 4 |
| 2 |
|
| Dispositions: |
|
|
|
| Gross uncertain tax benefits related to prior years | (2 | ) | (6 | ) | (1 | ) |
| Unrecognized tax benefits at December 31 | $ | 13 |
| $ | 15 |
| $ | 17 |
|
If these uncertain tax positions were recognized, all of the amount of unrecognized tax positions as at December 31, 2016 would impact the Company’s effective tax rate.
The Company recognizes accrued interest and penalties related to unrecognized tax benefits as a component of income tax expense in the Company’s Consolidated Statements of Income. The total amount of accrued interest and penalties in 2016 was $1 million (2015 – $4 million; 2014 – $1 million). The total amount of accrued interest and penalties associated with the unrecognized tax benefit at December 31, 2016 was $10 million (2015 – $9 million; 2014 – $5 million).
The Company and its subsidiaries are subject to either Canadian federal and provincial income tax, U.S. federal, state and local income tax, or the relevant income tax in other international jurisdictions. The Company has substantially concluded all Canadian federal and provincial income tax matters for the years through 2012. The federal and provincial income tax returns filed for 2013 and subsequent years remain subject to examination by the Canadian taxation authorities. The Internal Revenue Service ("IRS") of the United States has completed their examinations and issued notices of deficiency for the tax years 2012 and 2013. The Company disagrees with many of their proposed adjustments, and is at the IRS Appeals for those years. The income tax returns for 2014 and subsequent years continue to remain subject to examination by the IRS. Additionally, various U.S. state tax authorities are examining the Company's state income tax returns for the years 2011 through 2015. The Company believes that it has recorded sufficient income tax reserves at December 31, 2016 with respect to these income tax examinations.
The Company does not anticipate any material changes to the unrecognized tax benefits previously disclosed within the next twelve months as at December 31, 2016.
6 Earnings per share
Basic earnings per share have been calculated using net income for the year divided by the weighted average number of shares outstanding during the year.
Diluted earnings per share have been calculated using the treasury stock method which assumes that any proceeds received from the exercise of in-the-money options would be used to purchase CP Common Shares at the average market price for the period. For purposes of this calculation, at December 31, 2016, there were 2.2 million dilutive options outstanding (2015 – 2.5 million; 2014 – 3.1 million).
The number of shares used and the earnings per share calculations are reconciled as follows:
|
| | | | | | | | | |
| (in millions of Canadian dollars, except per share data) | 2016 |
| 2015 |
| 2014 |
|
| Net income | $ | 1,599 |
| $ | 1,352 |
| $ | 1,476 |
|
| Weighted average basic shares outstanding (millions) | 149.6 |
| 159.7 |
| 172.8 |
|
| Dilutive effect of weighted average number of stock options (millions) | 0.9 |
| 1.3 |
| 1.6 |
|
| Weighted average diluted shares outstanding (millions) | 150.5 |
| 161.0 |
| 174.4 |
|
| Earnings per share – basic | $ | 10.69 |
| $ | 8.47 |
| $ | 8.54 |
|
| Earnings per share – diluted | $ | 10.63 |
| $ | 8.40 |
| $ | 8.46 |
|
In 2016, the number of options excluded from the computation of diluted earnings per share because their effect was not dilutive was 0.4 million (2015 – 0.2 million; 2014 – 0.1 million).
7 Other comprehensive income (loss) and accumulated other comprehensive loss
The components of “Accumulated other comprehensive loss”, net of tax, are as follows:
|
| | | | | | |
| (in millions of Canadian dollars) | 2016 |
| 2015 |
|
| Unrealized foreign exchange gain on translation of the net investment in U.S. subsidiaries | $ | 738 |
| $ | 870 |
|
| Unrealized foreign exchange loss on translation of the U.S. dollar-denominated long-term debt designated as a hedge of the net investment in U.S. subsidiaries | (611 | ) | (741 | ) |
| Deferred losses on settled hedge instruments | (3 | ) | (11 | ) |
| Unrealized effective losses on cash flow hedges | (99 | ) | (89 | ) |
| Amounts for defined benefit pension and other post-retirement plans not recognized in income (Note 20) | (1,822 | ) | (1,504 | ) |
| Equity accounted investments | (2 | ) | (2 | ) |
| Accumulated other comprehensive loss | $ | (1,799 | ) | $ | (1,477 | ) |
The components of Other comprehensive (loss) income and the related tax effects are as follows:
|
| | | | | | | | | |
| (in millions of Canadian dollars) | Before
tax amount |
| Income tax
recovery
(expense) |
| Net of tax
amount |
|
| For the year ended December 31, 2016 |
|
|
|
| Unrealized foreign exchange gain (loss) on: |
|
|
|
| Translation of the net investment in U.S. subsidiaries | $ | (132 | ) | $ | — |
| $ | (132 | ) |
| Translation of the U.S. dollar-denominated long-term debt designated as a hedge of the net investment in U.S. subsidiaries (Note 17) | 150 |
| (20 | ) | 130 |
|
| Change in derivatives designated as cash flow hedges: |
|
|
|
| Realized loss on cash flow hedges recognized in income | 10 |
| (2 | ) | 8 |
|
| Unrealized loss on cash flow hedges | (12 | ) | 2 |
| (10 | ) |
| Change in pension and other benefits actuarial gains and losses | (422 | ) | 113 |
| (309 | ) |
| Change in prior service pension and other benefit costs | (12 | ) | 3 |
| (9 | ) |
| Other comprehensive loss | $ | (418 | ) | $ | 96 |
| $ | (322 | ) |
| For the year ended December 31, 2015 |
|
|
|
| Unrealized foreign exchange gain (loss) on: |
|
|
|
| Translation of the net investment in U.S. subsidiaries | $ | 671 |
| $ | — |
| $ | 671 |
|
| Translation of the U.S. dollar-denominated long-term debt designated as a hedge of the net investment in U.S. subsidiaries (Note 17) | (757 | ) | 100 |
| (657 | ) |
| Change in derivatives designated as cash flow hedges: |
|
|
|
| Realized loss on cash flow hedges recognized in income | 7 |
| (2 | ) | 5 |
|
| Unrealized loss on cash flow hedges | (76 | ) | 21 |
| (55 | ) |
| Change in pension and other benefits actuarial gains and losses | 1,058 |
| (281 | ) | 777 |
|
| Change in prior service pension and other benefit costs | 1 |
| — |
| 1 |
|
| Other comprehensive income | $ | 904 |
| $ | (162 | ) | $ | 742 |
|
| For the year ended December 31, 2014 | | | |
| Unrealized foreign exchange gain (loss) on: | | | |
| Translation of the net investment in U.S. subsidiaries | $ | 287 |
| $ | — |
| $ | 287 |
|
| Translation of the U.S. dollar-denominated long-term debt designated as a hedge of the net investment in U.S. subsidiaries (Note 17) | (319 | ) | 42 |
| (277 | ) |
| Change in derivatives designated as cash flow hedges: | | | |
| Realized gain on cash flow hedges recognized in income | (3 | ) | — |
| (3 | ) |
| Unrealized loss on cash flow hedges | (46 | ) | 12 |
| (34 | ) |
| Change in pension and other benefits actuarial gains and losses | (873 | ) | 234 |
| (639 | ) |
| Change in prior service pension and other benefit costs | (68 | ) | 18 |
| (50 | ) |
| Other comprehensive loss | $ | (1,022 | ) | $ | 306 |
| $ | (716 | ) |
Changes in accumulated other comprehensive loss by component:
|
| | | | | | | | | | | | |
| (in millions of Canadian dollars) | Foreign currency
net of hedging
activities(1) | Derivatives and
other(1) |
| Pension and post-
retirement defined
benefit plans(1) |
| Total(1) |
|
| Opening balance, 2016 | $ | 129 |
| $ | (102 | ) | $ | (1,504 | ) | $ | (1,477 | ) |
| Other comprehensive (loss) income before reclassifications | (2 | ) | (10 | ) | (456 | ) | (468 | ) |
| Amounts reclassified from accumulated other comprehensive loss | — |
| 8 |
| 138 |
| 146 |
|
| Net current-period other comprehensive income (loss) | (2 | ) | (2 | ) | (318 | ) | (322 | ) |
| Closing balance, 2016 | $ | 127 |
| $ | (104 | ) | $ | (1,822 | ) | $ | (1,799 | ) |
| Opening balance, 2015 | $ | 115 |
| $ | (52 | ) | $ | (2,282 | ) | $ | (2,219 | ) |
| Other comprehensive income (loss) before reclassifications | 14 |
| (55 | ) | 585 |
| 544 |
|
| Amounts reclassified from accumulated other comprehensive loss | — |
| 5 |
| 193 |
| 198 |
|
| Net current-period other comprehensive income (loss) | 14 |
| (50 | ) | 778 |
| 742 |
|
| Closing balance, 2015 | $ | 129 |
| $ | (102 | ) | $ | (1,504 | ) | $ | (1,477 | ) |
(1) Amounts are presented net of tax.Amounts in Pension and post-retirement defined benefit plans reclassified from Accumulated other comprehensive loss
|
| | | | | | |
| 2016 |
| 2015 |
|
Amortization of prior service costs(1) | $ | (6 | ) | $ | (5 | ) |
Recognition of net actuarial loss(1) | 194 |
| 269 |
|
| Total before income tax | $ | 188 |
| $ | 264 |
|
| Income tax recovery | (50 | ) | (71 | ) |
| Net of income tax | $ | 138 |
| $ | 193 |
|
(1) Impacts Compensation and benefits on the Consolidated Statements of Income.8 Change in non-cash working capital balances related to operations
|
| | | | | | | | | |
| (in millions of Canadian dollars) | 2016 |
| 2015 |
| 2014 |
|
| Source (use) of cash: |
|
|
|
| Accounts receivable, net | $ | 44 |
| $ | 80 |
| $ | (112 | ) |
| Materials and supplies | 14 |
| 15 |
| 7 |
|
| Other current assets | (18 | ) | 55 |
| (75 | ) |
| Accounts payable and accrued liabilities | (95 | ) | 125 |
| 56 |
|
| Change in non-cash working capital | $ | (55 | ) | $ | 275 |
| $ | (124 | ) |
9 Accounts receivable, net
|
| | | | | | |
| (in millions of Canadian dollars) | 2016 |
| 2015 |
|
| Freight | $ | 461 |
| $ | 491 |
|
| Non-freight | 162 |
| 185 |
|
| 623 |
| 676 |
|
| Allowance for doubtful accounts | (32 | ) | (31 | ) |
| Total accounts receivable, net | $ | 591 |
| $ | 645 |
|
The Company maintains an allowance for doubtful accounts based on expected collectability of accounts receivable. Credit losses are based on specific identification of uncollectable accounts, the application of historical percentages by aging category and an assessment of the current economic environment. At December 31, 2016, allowances of $32 million (2015 – $31 million) were recorded in “Accounts receivable, net”. During 2016, provisions of $7 million of accounts receivable (2015 – $7 million; 2014 – $2 million) were recorded within “Purchased services and other”.
10 Dispositions of properties
Gain on sale of Obico
During the fourth quarter of 2016, the Company completed the sale of its Obico rail yard, for gross proceeds of $38 million. The Company recorded a gain on sale of $37 million ($33 million after tax) within "Purchased services and other" from the transaction.
Gain on sale of Arbutus Corridor
In March 2016, the Company completed the sale of CP’s Arbutus Corridor (the “Arbutus Corridor”) to the City of Vancouver for gross proceeds of $55 million. The agreement allows the Company to share in future proceeds on the eventual development and/or sale of certain parcels of the Arbutus Corridor. The Company recorded a gain on sale of $50 million ($43 million after tax) within "Purchased services and other" from the transaction during the first quarter of 2016.
Gain on sale of Delaware & Hudson South
During the first quarter of 2015, the Company finalized a sales agreement with Norfolk Southern Corporation ("NS") for approximately 283 miles of the Delaware and Hudson Railway Company, Inc.'s line between Sunbury, Pennsylvania, and Schenectady, New York ("D&H South"). The sale, which received approval by the U.S. Surface Transportation Board (“STB”) on May 15, 2015, was completed on September 18, 2015 for proceeds of $281 million (U.S. $214 million). The Company recorded a gain on sale of $68 million ($42 million after tax) from the transaction during the third quarter of 2015.
Gain on settlement of legal proceedings related to the purchase and sale of a building
In 2013, CP provided an interest free loan pursuant to a court order to a corporation owned by a court appointed trustee (“the judicial trustee”) to facilitate the acquisition of a building. The building was held in trust during the legal proceedings with regard to CP’s entitlement to an exercised purchase option of the building (“purchase option”). As at December 31, 2014, the loan of $20 million and the purchase option with a carrying value of $8 million, were recorded as “Other assets” in the Company’s Consolidated Balance Sheets.
In the first quarter of 2015, CP reached a settlement with a third party that, following the sale of the building to an arm’s-length third party, resulted in resolution of legal proceedings. CP received $59 million for the sale of the building which included repayment of the aforementioned loan to the judicial trustee. A gain of $31 million ($27 million after tax) was recorded as a credit within “Purchased services and other”.
Dakota, Minnesota & Eastern Railroad – West
On January 2, 2014, the Company executed an agreement with Genesee & Wyoming Inc. (“G&W”) for the sale of a portion of CP’s DM&E line between Tracy, Minnesota; Rapid City, South Dakota; Colony, Wyoming; and Crawford, Nebraska to connecting branch lines (“DM&E West”). The sale was subject to regulatory approval by the STB.
On May 30, 2014, the Company completed the sale of DM&E West to G&W for net proceeds of $236 million (U.S. $218 million). As the assets of DM&E West had previously been written down to the estimated transaction amount in 2013, the transaction did not give rise to a significant earnings impact in 2014.
11 Investments
|
| | | | | | |
| (in millions of Canadian dollars) | 2016 |
| 2015 |
|
| Rail investments accounted for on an equity basis | $ | 136 |
| $ | 115 |
|
| Other investments | 58 |
| 37 |
|
| Total investments | $ | 194 |
| $ | 152 |
|
12 Properties
|
| | | | | | | | | | | | | | | | | | | | | | | | | | | |
| (in millions of Canadian dollars except percentages) | | 2016 |
| 2016 |
| 2015 |
| | | Average
annual depreciation rate |
|
| Cost |
|
| Accumulated
depreciation |
|
| Net book
value |
|
| Cost |
|
| Accumulated
depreciation |
|
| Net book
value |
|
| Track and roadway |
| 2.8 | % |
| $ | 16,817 |
|
| $ | 4,573 |
|
| $ | 12,244 |
|
| $ | 16,303 |
|
| $ | 4,427 |
|
| $ | 11,876 |
|
| Buildings |
| 3.0 | % |
| 662 |
|
| 178 |
|
| 484 |
|
| 642 |
|
| 165 |
|
| 477 |
|
| Rolling stock |
| 2.8 | % |
| 4,060 |
|
| 1,524 |
|
| 2,536 |
|
| 4,041 |
|
| 1,524 |
|
| 2,517 |
|
Information systems(1) |
| 11.7 | % |
| 584 |
|
| 299 |
|
| 285 |
|
| 599 |
|
| 291 |
|
| 308 |
|
| Other |
| 5.3 | % |
| 1,691 |
|
| 551 |
|
| 1,140 |
|
| 1,640 |
|
| 545 |
|
| 1,095 |
|
| Total |
| $ | 23,814 |
|
| $ | 7,125 |
|
| $ | 16,689 |
|
| $ | 23,225 |
|
| $ | 6,952 |
|
| $ | 16,273 |
|
(1) During 2016, CP capitalized costs attributable to the design and development of internal-use software in the amount of $46 million (2015 – $42 million; 2014 – $69 million). Current year depreciation expense related to internal use software was $63 million (2015 – $69 million; 2014 – $70 million).
Capital leases included in properties
|
| | | | | | | | | | | | | | | | | | |
| (in millions of Canadian dollars) | 2016 | 2015 |
| | Cost |
| Accumulated
depreciation |
| Net book
value |
| Cost |
| Accumulated
depreciation |
| Net book
value |
|
| Buildings | $ | 1 |
| $ | 1 |
| $ | — |
| $ | 1 |
| $ | 1 |
| $ | — |
|
| Rolling stock | 311 |
| 105 |
| 206 |
| 311 |
| 96 |
| 215 |
|
| Total assets held under capital lease | $ | 312 |
| $ | 106 |
| $ | 206 |
| $ | 312 |
| $ | 97 |
| $ | 215 |
|
13 Goodwill and intangible assets
|
| | | | | | | | | | | | | | | |
| | | Intangible assets | |
| (in millions of Canadian dollars) | Goodwill |
| Cost |
| Accumulated
amortization |
| Net
carrying
amount |
| Total goodwill and intangible assets |
|
| Balance at December 31, 2014 | $ | 164 |
| $ | 22 |
| $ | (10 | ) | $ | 12 |
| $ | 176 |
|
| Amortization | — |
| — |
| (1 | ) | (1 | ) | (1 | ) |
| Foreign exchange impact | 31 |
| — |
| 2 |
| 2 |
| 33 |
|
| Additions | 3 |
| — |
| — |
| — |
| 3 |
|
| Balance at December 31, 2015 | $ | 198 |
| $ | 22 |
| $ | (9 | ) | $ | 13 |
| $ | 211 |
|
| Amortization | — |
| — |
| (1 | ) | (1 | ) | (1 | ) |
| Foreign exchange impact | (7 | ) | — |
| (1 | ) | (1 | ) | (8 | ) |
| Balance at December 31, 2016 | $ | 191 |
| $ | 22 |
| $ | (11 | ) | $ | 11 |
| $ | 202 |
|
14 Other assets
|
| | | | | | |
| (in millions of Canadian dollars) | 2016 |
| 2015 |
|
| Long-term materials | $ | 22 |
| $ | 20 |
|
| Prepaid leases | 6 |
| 9 |
|
| Unamortized fees on credit facility | 7 |
| 6 |
|
| Contracted customer incentives | 2 |
| 5 |
|
| Long-term receivables | 2 |
| 2 |
|
| Other | 18 |
| 21 |
|
| Total other assets | $ | 57 |
| $ | 63 |
|
Fees on credit facility and contracted customer incentives are amortized to income over the term of the related facility and over the term of the related revenue contract, respectively.
15 Accounts payable and accrued liabilities
|
| | | | | | |
| (in millions of Canadian dollars) | 2016 |
| 2015 |
|
| Trade payables | $ | 352 |
| $ | 339 |
|
| Accrued charges | 282 |
| 293 |
|
| Income and other taxes payable | 146 |
| 218 |
|
| Accrued interest | 137 |
| 147 |
|
| Financial derivative liability (Note 17) | 69 |
| 60 |
|
| Payroll-related accruals | 73 |
| 88 |
|
| Accrued vacation | 65 |
| 69 |
|
| Dividends payable | 73 |
| 53 |
|
| Personal injury and other claims provision | 26 |
| 30 |
|
| Provision for environmental remediation (Note 18) | 9 |
| 13 |
|
| Stock-based compensation liabilities | 40 |
| 48 |
|
| Other | 50 |
| 59 |
|
| Total accounts payable and accrued liabilities | $ | 1,322 |
| $ | 1,417 |
|
16 Debt
|
| | | | | | | | | | |
| (in millions of Canadian dollars) | Maturity | Currency
in which
payable | 2016 |
| 2015 |
|
| 6.500% |
| 10-year Notes (A) | 2018-05 | U.S.$ | $ | 369 |
| $ | 380 |
|
| 6.250% |
| 10-year Medium Term Notes (A) | 2018-06 | CDN$ | 375 |
| 374 |
|
| 7.250% |
| 10-year Notes (A) | 2019-05 | U.S.$ | 469 |
| 484 |
|
| 9.450% |
| 30-year Debentures (A) | 2021-08 | U.S.$ | 336 |
| 346 |
|
| 5.100% |
| 10-year Medium Term Notes (A) | 2022-01 | CDN$ | 125 |
| 125 |
|
| 4.500% |
| 10-year Notes (A) | 2022-01 | U.S.$ | 333 |
| 343 |
|
| 4.450% |
| 12.5-year Notes (A) | 2023-03 | U.S.$ | 469 |
| 483 |
|
| 7.125% |
| 30-year Debentures (A) | 2031-10 | U.S.$ | 470 |
| 484 |
|
| 5.750% |
| 30-year Debentures (A) | 2033-03 | U.S.$ | 328 |
| 339 |
|
| 5.950% |
| 30-year Notes (A) | 2037-05 | U.S.$ | 597 |
| 615 |
|
| 6.450% |
| 30-year Notes (A) | 2039-11 | CDN$ | 400 |
| 400 |
|
| 5.750% |
| 30-year Notes (A) | 2042-01 | U.S.$ | 330 |
| 340 |
|
| 2.900% |
| 10-year Notes (A) | 2025-02 | U.S.$ | 940 |
| 968 |
|
| 3.700% |
| 10.5-year Notes (A) | 2026-02 | U.S.$ | 335 |
| 345 |
|
| 4.800% |
| 30-year Notes (A) | 2045-08 | U.S.$ | 736 |
| 759 |
|
| 4.800% |
| 20-year Notes (A) | 2035-09 | U.S.$ | 401 |
| 413 |
|
| 6.125% |
| 100-year Notes (A) | 2115-09 | U.S.$ | 1,208 |
| 1,246 |
|
| 5.41% |
| Senior Secured Notes (B) | 2024-03 | U.S.$ | 126 |
| 138 |
|
| 6.91% |
| Secured Equipment Notes (C) | 2024-10 | CDN$ | 133 |
| 145 |
|
| 7.49% |
| Equipment Trust Certificates (D) | 2021-01 | U.S.$ | 56 |
| 64 |
|
| Other long-term loans (nil% – 5.50%) | 2016 – 2025 | U.S.$/CDN$ | — |
| 10 |
|
| Obligations under capital leases |
|
|
|
|
|
| (6.313% – 6.99%) (E) | 2022 – 2026 | U.S.$ | 163 |
| 172 |
|
|
| (12.77%) (E) | 2031-01 | CDN$ | 3 |
| 3 |
|
|
|
| 8,702 |
| 8,976 |
|
| Perpetual 4% Consolidated Debenture Stock (F) |
| U.S.$ | 41 |
| 42 |
|
| Perpetual 4% Consolidated Debenture Stock (F) |
| G.B.£ | 6 |
| 7 |
|
|
|
| 8,749 |
| 9,025 |
|
| Less: Unamortized fees on long-term debt |
|
| 65 |
| 68 |
|
|
|
| 8,684 |
| 8,957 |
|
| Less: Long-term debt maturing within one year |
|
| 25 |
| 30 |
|
| |
| | | | $ | 8,659 |
| $ | 8,927 |
|
At December 31, 2016, the gross amount of long-term debt denominated in U.S. dollars was U.S. $5,763 million (2015 – U.S. $5,788 million).
Annual maturities and principal repayment requirements, excluding those pertaining to capital leases, for each of the five years following 2016 are (in millions): 2017 – $21; 2018 – $766; 2019 – $493; 2020 – $66; 2021 – $377.
Fees on long-term debt are amortized to income over the term of the related debt.
During the year ended December 31, 2015, the Company repaid Senior Secured Notes in advance of their maturities for a total of U.S. $285 million ($379 million). The repayments were inclusive of the remaining principal of the notes, totalling U.S. $247 million ($329 million), early redemption premiums of U.S. $34 million ($45 million), and accrued interest of U.S. $4 million ($5 million). The early redemption premiums and accrued interest are included in “Other income and charges” and “Net interest expense” on the Company's Consolidated Statements of Income, respectively. The Company also expensed the unamortized financing fees of $2 million to “Other income and charges” upon payments of the notes.
A. These debentures and notes pay interest semi-annually and are unsecured, but carry a negative pledge.
During the first quarter of 2015, the Company issued U.S. $700 million 2.900% 10-year Notes due February 1, 2025 for net proceeds of U.S. $694 million ($873 million). In addition, the Company settled a notional U.S. $700 million of forward starting floating-to-fixed interest rate swap agreements (“forward starting swaps”) for a payment of U.S. $50 million ($63 million) cash (see Note 17). This payment was included in the same line item as the related hedged item on the Company's Consolidated Statements of Cash Flows. Inclusive of the settlement of the forward starting swap, the annualized effective yield at issuance was 3.61%.
During the third quarter of 2015, the Company issued U.S. $550 million 4.800% 30-year Notes due August 1, 2045 and U.S. $250 million 3.700% 10.5-year notes due February 1, 2026 for a total of U.S. $800 million with net proceeds of U.S. $789 million ($1,032 million).
During the third quarter of 2015, the Company also issued U.S. $900 million 6.125% 100-year Notes due September 15, 2115 and U.S. $300 million 4.800% 20-year Notes due September 15, 2035 for a total of U.S. $1,200 million with net proceeds of U.S. $1,186 million ($1,569 million). At the time of the debt issuance the Company de-designated the hedging relationship for U.S. $700 million of the existing forward starting swaps. The Company did not cash settle these swaps and therefore recorded a non-cash loss of U.S. $36 million ($47 million) in “Accumulated other comprehensive loss” (see Note 17). Subsequently, the Company re-designated U.S. $700 million forward starting swaps as a hedging relationship to fix the benchmark rate on cash flows associated with a highly probable forecasted issuance of long-term notes.
B. The 5.41% Senior Secured Notes are collateralized by specific locomotive units with a carrying value of $124 million at December 31, 2016. The Company pays equal blended semi-annual payments of principal and interest. Final repayment of the remaining principal of U.S. $44 million is due in March 2024.
C. The 6.91% Secured Equipment Notes are full recourse obligations of the Company collateralized by a first charge on specific locomotive units with a carrying value of $115 million at December 31, 2016. The Company pays equal blended semi-annual payments of principal and interest. Final repayment of the remaining principal of $11 million is due in October 2024.
D. The 7.49% Equipment Trust Certificates are secured by specific locomotive units with a carrying value of $117 million at December 31, 2016. The Company makes semi-annual payments that vary in amount and are interest-only payments or blended principal and interest payments. Final repayment of the remaining principal of U.S. $11 million is due in January 2021.
E. At December 31, 2016, capital lease obligations included in long-term debt were as follows:
|
| | | | |
| (in millions of Canadian dollars) | Year | Capital leases |
|
| Minimum lease payments in: | |
|
| 2017 | $ | 16 |
|
| 2018 | 16 |
|
| 2019 | 16 |
|
| 2020 | 16 |
|
| 2021 | 16 |
|
| Thereafter | 152 |
|
| Total minimum lease payments | | 232 |
|
| Less: Imputed interest | | (66 | ) |
| Present value of minimum lease payments | | 166 |
|
| Less: Current portion | | (4 | ) |
| Long-term portion of capital lease obligations | | $ | 162 |
|
During 2016, the Company had no additions to property, plant and equipment under capital lease obligations (2015 – $nil; 2014 – $nil).
The carrying value of the assets collateralizing the capital lease obligations was $206 million at December 31, 2016.
F. The Consolidated Debenture Stock, authorized by an Act of Parliament of 1889, constitutes a first charge upon and over the whole of the undertaking, railways, works, rolling stock, plant, property and effects of the Company, with certain exceptions.
Credit facility
CP has a revolving credit facility (the “facility”) agreement with 15 highly rated financial institutions for a commitment amount of U.S. $2 billion. The facility includes a U.S. $1 billion one-year plus one-year term-out portion and a U.S. $1 billion five-year portion. The facility can accommodate draws of cash and/or letters of credit at market competitive pricing. The agreement requires the Company not to exceed a maximum debt to earnings before interest, tax, depreciation, and amortization ratio.
Effective June 28, 2016, the Company extended the maturity date by one year on its credit facility. The maturity date on the first U.S. $1 billion tranche was extended to June 28, 2018; the maturity date on the second U.S. $1 billion tranche was extended to June 28, 2021. As at December 31, 2016 and 2015, the Company was in compliance with all terms and conditions of the credit facility arrangements and satisfied the threshold stipulated in the amended financial covenant. As at December 31, 2016 and 2015, the facility was undrawn.
The amount available under the terms of the credit facility was U.S. $2 billion at December 31, 2016 (December 31, 2015 – U.S. $2 billion).
The Company has also established a commercial paper program which enables it to issue commercial paper up to a maximum aggregate principal amount of U.S. $1 billion in the form of unsecured promissory notes. The commercial paper program is backed by the U.S. $1 billion committed, revolving credit facility tranche which matures on June 28, 2018. The Company had no commercial paper borrowings as at December 31, 2016 (December 31, 2015 – $nil).
CP has bilateral letter of credit facilities with 6 highly rated financial institutions to support its requirement to post letters of credit in the ordinary course of business. Under these agreements, the Company has the option to post collateral in the form of cash or cash equivalents, equal at least to the face value of the letter of credit issued. These agreements permit CP to withdraw amounts posted as collateral at any time; therefore, the amounts posted as collateral are presented as “Cash and cash equivalents” on the Company’s Consolidated Balance Sheets.
At December 31, 2016, under its bilateral facilities the Company had letters of credit drawn of $320 million (December 31, 2015 – $375 million) from a total available amount of $600 million (December 31, 2015 – $600 million). At December 31, 2016, under the terms of the bilateral letter of credit facilities, no cash and cash equivalents was recorded as “Restricted cash and cash equivalents” (December 31, 2015 – $nil).
17 Financial instruments
A. Fair values of financial instruments
The Company categorizes its financial assets and liabilities measured at fair value into a three-level hierarchy established by GAAP that prioritizes those inputs to valuation techniques used to measure fair value based on the degree to which they are observable. The three levels of the fair value hierarchy are as follows: Level 1 inputs are quoted prices in active markets for identical assets and liabilities; Level 2 inputs, other than quoted prices included within Level 1, are observable for the asset or liability either directly or indirectly; and Level 3 inputs are not observable in the market.
When possible, the estimated fair value is based on quoted market prices and, if not available, estimates from third-party brokers. For non-exchange traded derivatives classified in Level 2, the Company uses standard valuation techniques to calculate fair value. Primary inputs to these techniques include observable market prices (interest, FX and commodity) and volatility, depending on the type of derivative and nature of the underlying risk. The Company uses inputs and data used by willing market participants when valuing derivatives and considers its own credit default swap spread as well as those of its counterparties in its determination of fair value.
The carrying values of financial instruments equal or approximate their fair values with the exception of long-term debt which has a fair value of approximately $9,981 million at December 31, 2016 (December 31, 2015 – $9,750 million) and a carrying value of $8,684 million (December 31, 2015 – $8,957 million). The estimated fair value of current and long-term borrowings has been determined based on market information where available, or by discounting future payments of interest and principal at estimated interest rates expected to be available to the Company at period end. All derivatives and long-term debt are classified as Level 2.
As at December 31, 2016 and 2015, the Company did not have any deposits in the form of short-term investments with financial institutions.
B. Financial risk management
Derivative financial instruments
Derivative financial instruments may be used to selectively reduce volatility associated with fluctuations in interest rates, FX rates, the price of fuel and stock-based compensation expense. Where derivatives are designated as hedging instruments, the relationship between the hedging instruments and their associated hedged items is documented, as well as the risk management objective and strategy for the use of the hedging instruments. This documentation includes linking the derivatives that are designated as fair value or cash flow hedges to specific assets or liabilities on the Consolidated Balance Sheets, commitments or forecasted transactions. At the time a derivative contract is entered into and at least quarterly thereafter, an assessment is made as to whether the derivative item is effective in offsetting the changes in fair value or cash flows of the hedged items. The derivative qualifies for hedge accounting treatment if it is effective in substantially mitigating the risk it was designed to address.
It is not the Company’s intent to use financial derivatives or commodity instruments for trading or speculative purposes.
Credit risk management
Credit risk refers to the possibility that a customer or counterparty will fail to fulfill its obligations under a contract and as a result create a financial loss for the Company.
The railway industry predominantly serves financially established customers and the Company has experienced limited financial losses with respect to credit risk. The credit worthiness of customers is assessed using credit scores supplied by a third party, and through direct monitoring of their financial well-being on a continual basis. The Company establishes guidelines for customer credit limits and should thresholds in these areas be reached, appropriate precautions are taken to improve collectability.
Counterparties to financial instruments expose the Company to credit losses in the event of non-performance. Counterparties for derivative and cash transactions are limited to high credit quality financial institutions, which are monitored on an ongoing basis. Counterparty credit assessments are based on the financial health of the institutions and their credit ratings from external agencies. The Company does not anticipate non-performance that would materially impact the Company’s financial statements. In addition, the Company believes there are no significant concentrations of credit risk.
FX management
The Company conducts business transactions and owns assets in both Canada and the United States. As a result, the Company is exposed to fluctuations in value of financial commitments, assets, liabilities, income or cash flows due to changes in FX rates. The Company may enter into FX risk management transactions primarily to manage fluctuations in the exchange rate between Canadian and U.S. currencies. FX exposure is primarily mitigated through natural offsets created by revenues, expenditures and balance sheet positions incurred in the same currency. Where appropriate, the Company may negotiate with customers and suppliers to reduce the net exposure.
Occasionally the Company will enter into short-term FX forward contracts as part of its cash management strategy.
Net investment hedge
The FX gains and losses on long-term debt are mainly unrealized and can only be realized when U.S. dollar-denominated long-term debt matures or is settled. The Company also has long-term FX exposure on its investment in U.S. affiliates. The majority of the Company’s U.S. dollar-denominated long-term debt has been designated as a hedge of the net investment in foreign subsidiaries. This designation has the effect of mitigating volatility on net income by offsetting long-term FX gains and losses on U.S. dollar-denominated long-term debt and gains and losses on its net investment. The effective portion recognized in “Other comprehensive income” in 2016 was an FX gain of $150 million, the majority of which was unrealized (2015 – loss of $757 million, the majority of which was unrealized; 2014 – unrealized loss of $319 million) (see Note 7). There was no ineffectiveness during 2016 (2015 – $nil; 2014 – $nil).
FX forward contracts
The Company may enter into FX forward contracts to lock-in the amount of Canadian dollars it has to pay on U.S. dollar-denominated debt maturities.
At December 31, 2016, the Company had net unamortized gains related to FX forward contracts to fix the exchange rate on U.S. dollar-denominated debt maturities settled in previous years totalling $1 million (December 31, 2015 – $2 million). During 2016, $1 million of pretax gain related to these previously settled derivatives has been amortized from "Accumulated other comprehensive loss" to “Other income and charges” (December 31, 2015 – $1 million). At December 31, 2016, the Company expected that, during the next 12 months, a $1 million pretax gain will be reclassified to “Other income and charges”.
At December 31, 2016 and 2015, the Company had no remaining FX forward contracts to fix the exchange rate on U.S. dollar-denominated debt maturities.
Interest rate management
The Company is exposed to interest rate risk, which is the risk that the fair value or future cash flows of a financial instrument will vary as a result of changes in market interest rates. In order to manage funding needs or capital structure goals, the Company enters into debt or capital lease agreements that are subject to either fixed market interest rates set at the time of issue or floating rates determined by ongoing market conditions. Debt subject to variable interest rates exposes the Company to variability in interest expense, while debt subject to fixed interest rates exposes the Company to variability in the fair value of debt.
To manage interest rate exposure, the Company accesses diverse sources of financing and manages borrowings in line with a targeted range of capital structure, debt ratings, liquidity needs, maturity schedule, and currency and interest rate profiles. In anticipation of future debt issuances, the Company may enter into forward rate agreements, that are designated as cash flow hedges, to substantially lock in all or a portion of the effective future interest expense. The Company may also enter into swap agreements, designated as fair value hedges, to manage the mix of fixed and floating rate debt.
Forward starting swaps
As at December 31, 2016 and 2015, the Company had forward starting floating-to-fixed interest rate swap agreements (“forward starting swaps”) totalling a notional U.S. $700 million to fix the benchmark rate on cash flows associated with highly probable forecasted issuances of long-term notes. The effective portion of changes in fair value on the forward starting swaps is recorded in “Accumulated other comprehensive loss”, net of tax, as cash flow hedges until the highly probable forecasted notes are issued. Subsequent to the notes issuance, amounts in “Accumulated other comprehensive loss” are reclassified to “Net interest expense”.
During the first quarter of 2015, the Company settled a notional U.S. $700 million of forward starting swaps related to the U.S. $700 million 2.900% 10-year notes issued in the same period.
During the third quarter of 2015, the Company de-designated the hedging relationship for U.S. $700 million of forward starting swaps related to a portion of the U.S. $900 million 6.125% 100-year notes issued. The Company did not cash settle these swaps and concurrently re-designated the forward starting swaps totalling U.S. $700 million to fix the benchmark rate on cash flows associated with a highly probable forecasted issuance of long-term notes.
During the second quarter of 2016, the Company rolled the notional U.S. $700 million forward starting swaps. The Company de-designated the hedging relationship for U.S. $700 million of forward starting swaps. The Company did not cash settle these swaps. There was no ineffectiveness to record upon de-designation.
Concurrently the Company re-designated the forward starting swaps totalling U.S. $700 million to fix the benchmark rate on cash flows associated with a highly probable forecasted debt issuance of long-term notes.
As at December 31, 2016, the total fair value loss of $69 million (December 31, 2015 – fair value loss of $60 million) derived from the forward starting swaps was included in “Accounts payable and accrued liabilities”. Changes in fair value from the forward starting swaps for the year ended December 31, 2016 was a loss of $9 million (2015 – a loss of $77 million). The effective portion for the year ended December 31, 2016 was a loss of $12 million (2015 – loss of $75 million) and was recorded in “Other comprehensive income”. For the year ended December 31, 2016, the ineffective portion was a $3 million gain (2015 – $2 million loss) and is recorded to “Net interest expense” on the Consolidated Statements of Income.
For the year ended December 31, 2016, a loss of $11 million related to previous forward starting swap hedges has been amortized to “Net interest expense” (2015 – a loss of $6 million). The Company expects that during the next 12 months $11 million of losses will be amortized to “Net interest expense”.
Treasury rate locks
At December 31, 2016, the Company had net unamortized losses related to interest rate locks, which are accounted for as cash flow hedges, settled in previous years totalling $21 million (December 31, 2015 – $21 million). This amount is composed of various unamortized gains and losses related to specific debts which are reflected in “Accumulated other comprehensive loss” and are amortized to “Net interest expense” in the period that interest on the related debt is charged. The amortization of these gains and losses resulted in a negligible increase to “Net interest expense” and “Other comprehensive income” in 2016 (2015 – negligible; 2014 – negligible). At December 31, 2016, the Company expected that, during the next 12 months, a negligible amount of loss related to these previously settled derivatives would be reclassified to “Net interest expense”.
Fuel price management
The Company is exposed to commodity risk related to purchases of diesel fuel and the potential reduction in net income due to increases in the price of diesel. Fuel expense constitutes a large portion of the Company’s operating costs and volatility in diesel fuel prices can have a significant impact on the Company’s income. Items affecting volatility in diesel prices include, but are not limited to, fluctuations in world markets for crude oil and distillate fuels, which can be affected by supply disruptions and geopolitical events.
The impact of variable fuel expense is mitigated substantially through fuel cost adjustment programs, which apportion incremental changes in fuel prices to shippers through price indices, tariffs, and by contract, within agreed-upon guidelines. While these programs provide effective and meaningful coverage, residual exposure remains as the fuel expense risk may not be completely recovered from shippers due to timing and volatility in the market.
18 Other long-term liabilities
|
| | | | | | |
| (in millions of Canadian dollars) | 2016 |
| 2015 |
|
Provision for environmental remediation, net of current portion(1) | $ | 76 |
| $ | 80 |
|
| Stock-based compensation liabilities, net of current portion | 72 |
| 73 |
|
| Deferred revenue on rights-of-way licence agreements, net of current portion | 29 |
| 33 |
|
| Deferred retirement compensation | 29 |
| 28 |
|
| Deferred gains on sale leaseback transactions | 19 |
| 22 |
|
| Other, net of current portion | 59 |
| 82 |
|
| Total other long-term liabilities | $ | 284 |
| $ | 318 |
|
(1) As at December 31, 2016, the aggregate provision for environmental remediation, including the current portion was $85 million (2015 – $93 million).
The deferred revenue on rights-of-way licence agreements, and deferred gains on sale leaseback transactions are being amortized to income on a straight-line basis over the related lease terms.
Environmental remediation accruals
Environmental remediation accruals cover site-specific remediation programs. The estimate of the probable costs to be incurred in the remediation of properties contaminated by past railway use reflects the nature of contamination at individual sites according to typical activities and scale of operations conducted. CP has developed remediation strategies for each property based on the nature and extent of the contamination, as well as the location of the property and surrounding areas that may be adversely affected by the presence of contaminants, considering available technologies, treatment and disposal facilities and the acceptability of site-specific plans based on the local regulatory environment. Site-specific plans range from containment and risk management of the contaminants through to the removal and treatment of the contaminants and affected soils and groundwater. The details of the estimates reflect the environmental liability at each property. Provisions for environmental remediation costs are recorded in “Other long-term liabilities”, except for the current portion which is recorded in “Accounts payable and accrued liabilities” (see Note 15). Payments are expected to be made over 10 years to 2026.
The accruals for environmental remediation represent CP’s best estimate of its probable future obligation and include both asserted and unasserted claims, without reduction for anticipated recoveries from third parties. Although the recorded accruals include CP’s best estimate of all probable costs, CP’s total environmental remediation costs cannot be predicted with certainty. Accruals for environmental remediation may change from time to time as new information about previously untested sites becomes known, environmental laws and regulations evolve and advances are made in environmental remediation technology. The accruals may also vary as the courts decide legal proceedings against outside parties responsible for contamination. These potential charges, which cannot be quantified at this time, may materially affect income in the particular period in which a charge is recognized. Costs related to existing, but as yet unknown, or future contamination will be accrued in the period in which they become probable and reasonably estimable. Changes to costs are reflected as changes to “Other long-term liabilities” or “Accounts payable and accrued liabilities” on the Company's Consolidated Balance Sheets and to “Purchased services and other” within operating expenses on the Company's Consolidated Statements of Income. The amount charged to income in 2016 was $6 million (2015 – $7 million; 2014 – $4 million).
19 Shareholders’ equity
Authorized and issued share capital
The Company is authorized to issue an unlimited number of Common Shares, an unlimited number of First Preferred Shares and unlimited number of Second Preferred Shares. At December 31, 2016, no First or Second Preferred Shares had been issued.
An analysis of Common Share balances is as follows:
|
| | | | | | |
| (number of shares in millions) | 2016 |
| 2015 |
| 2014 |
|
| Share capital, January 1 | 153.0 |
| 166.1 |
| 175.4 |
|
| CP Common Shares repurchased | (6.9 | ) | (13.7 | ) | (10.3 | ) |
| Shares issued under stock option plan | 0.2 |
| 0.6 |
| 1.0 |
|
| Share capital, December 31 | 146.3 |
| 153.0 |
| 166.1 |
|
The change in the “Share capital” balances includes $1 million (2015 – $2 million; 2014 – $3 million) related to the cancellation of the tandem share appreciation rights liability on exercise of tandem stock options, and $5 million (2015 – $10 million; 2014 – $17 million) of stock-based compensation transferred from “Additional paid-in capital”.
Share repurchase
On March 11, 2014, the Company announced a new share repurchase program to implement a normal course issuer bid (“NCIB”) to purchase, for cancellation, up to 5.3 million Common Shares before March 16, 2015. On September 29, 2014, the Company announced the amendment of the bid to increase the maximum number of its Common Shares that may be purchased from 5.3 million to 12.7 million of its outstanding Common Shares. The Company completed the purchase of 10.5 million Common Shares in 2014. An additional 2.2 million Common Shares were purchased for $490 million in the first quarter of 2015 prior to the March 16, 2015 expiry date of the program.
On March 16, 2015, the Company announced the renewal of its NCIB, commencing March 18, 2015, to purchase up to 9.1 million of its outstanding Common Shares for cancellation before March 17, 2016. On August 31, 2015, the Company amended the NCIB to increase the maximum number of its Common Shares that may be purchased from 9.1 million to 11.9 million of its outstanding Common Shares. As at December 31, 2015, the Company had purchased 11.3 million Common Shares for $2,258 million under this NCIB program.
On April 20, 2016, the Company announced a new NCIB, commencing May 2, 2016 to May 1, 2017, to purchase up to 6.9 million of its outstanding Common Shares for cancellation. The Company completed this NCIB on September 28, 2016.
All purchases are made in accordance with the respective NCIB at prevalent market prices plus brokerage fees, or such other prices that may be permitted by the Toronto Stock Exchange, with consideration allocated to share capital up to the average carrying amount of the shares, and any excess allocated to "Retained earnings". The following table provides the activities under the share repurchase programs:
|
| | | | | | | | | |
| | 2016 |
| 2015 |
| 2014 |
|
Number of Common Shares repurchased(1) | 6,910,000 |
| 13,549,977 |
| 10,476,074 |
|
Weighted-average price per share(2) | $ | 175.08 |
| $ | 202.79 |
| $ | 199.42 |
|
Amount of repurchase (in millions)(2) | $ | 1,210 |
| $ | 2,748 |
| $ | 2,089 |
|
(1) Excludes shares repurchased and not yet cancelled in the prior year.
(2) Includes brokerage fees.
20 Pensions and other benefits
The Company has both defined benefit (“DB”) and defined contribution (“DC”) pension plans. At December 31, 2016, the Canadian pension plans represent approximately 99% of total combined pension plan assets and approximately 98% of total combined pension plan obligations.
The DB plans provide for pensions based principally on years of service and compensation rates near retirement. Pensions for Canadian pensioners are partially indexed to inflation. Annual employer contributions to the DB plans, which are actuarially determined, are made on the basis of being not less than the minimum amounts required by federal pension supervisory authorities.
The Company has other benefit plans including post-retirement health and life insurance for pensioners, and post-employment long-term disability and workers’ compensation benefits, which are based on Company-specific claims. At December 31, 2016, the Canadian other benefits plans represent approximately 96% of total combined other plan obligations.
The Finance CommitteeChair of the Board of Directors has approved an investment policy that establishes long-term asset mix targets which take into account the Company’s expected risk tolerances. Pension plan assets are managed by a suite of independent investment managers, with the allocation by manager reflecting these asset mix targets. Most of the assets are actively managed with the objective of outperforming applicable benchmarks. In accordance with the investment policy, derivative instruments may be used to hedge or adjust existing or anticipated exposures.
To develop the expected long-term rate of return assumption used in the calculation of net periodic benefit cost applicable to the market-related value of assets, the Company considers the expected composition of the plans’ assets, past experience and future estimates of long-term investment returns. Future estimates of investment returns reflect the expected annual yield on applicable fixed income capital market indices, and the long-term return expectation for public equity, real estate, infrastructure and absolute return investments and the expected added value (relative to applicable benchmark indices) from active management of pension fund assets.
The Company has elected to use a market-related value of assets for the purpose of calculating net periodic benefit cost, developed from a five-year average of market values for the plans’ public equity and absolute return investments (with each prior year’s market value adjusted to the current date for assumed investment income during the intervening period) plus the market value of the plans’ fixed income, real estate and infrastructure securities.
The benefit obligation is discounted using a discount rate that is a blended yield to maturity for a hypothetical portfolio of high-quality corporate debt instruments with cash flows matching project benefit payments. The discount rate is determined by management.
Net periodic benefit cost
The elements of net periodic benefit cost for DB pension plans and other benefits recognized in the year include the following components:
|
| | | | | | | | | | | | | | | | | | | | | | | |
| | Pensions |
| Other benefits |
| (in millions of Canadian dollars) | 2016 |
|
| 2015 |
|
| 2014 |
|
| 2016 |
|
| 2015 |
|
| 2014 |
|
| Current service cost (benefits earned by employees in the year) | $ | 106 |
|
| $ | 126 |
|
| $ | 106 |
|
| $ | 11 |
|
| $ | 12 |
|
| $ | 14 |
|
| Interest cost on benefit obligation | 467 |
|
| 463 |
|
| 477 |
|
| 21 |
|
| 21 |
|
| 23 |
|
| Expected return on fund assets | (846 | ) |
| (816 | ) |
| (757 | ) |
| — |
|
| — |
|
| — |
|
| Recognized net actuarial loss (gain) | 190 |
|
| 265 |
|
| 190 |
|
| 7 |
|
| 2 |
|
| (2 | ) |
| Amortization of prior service costs | (7 | ) |
| (6 | ) |
| (68 | ) |
| 1 |
|
| 1 |
|
| — |
|
| Net periodic benefit (recovery) cost | $ | (90 | ) |
| $ | 32 |
|
| $ | (52 | ) |
| $ | 40 |
|
| $ | 36 |
|
| $ | 35 |
|
Projected benefit obligation, fund assets, and funded status
Information about the Company’s DB pension plans and other benefits, in aggregate, is as follows:
|
| | | | | | | | | | | | | |
| | Pensions |
| Other benefits |
| (in millions of Canadian dollars) | 2016 |
| 2015 |
|
| 2016 |
| 2015 |
|
| Change in projected benefit obligation: | | | | | |
| Benefit obligation at January 1 | $ | 11,194 |
| $ | 11,360 |
|
| $ | 513 |
| $ | 517 |
|
| Current service cost | 106 |
| 126 |
|
| 11 |
| 12 |
|
| Interest cost | 467 |
| 463 |
|
| 21 |
| 21 |
|
| Employee contributions | 40 |
| 43 |
|
| 1 |
| 1 |
|
| Benefits paid | (645 | ) | (608 | ) |
| (31 | ) | (34 | ) |
| Foreign currency changes | (7 | ) | 42 |
|
| — |
| 4 |
|
| Plan amendments and other | 6 |
| (6 | ) |
| — |
| — |
|
| Actuarial loss (gain) | 238 |
| (226 | ) |
| (5 | ) | (8 | ) |
| Projected benefit obligation at December 31 | $ | 11,399 |
| $ | 11,194 |
|
| $ | 510 |
| $ | 513 |
|
|
| | | | | | | | | | | | | |
| | Pensions |
| Other benefits |
| (in millions of Canadian dollars) | 2016 |
| 2015 |
|
| 2016 |
| 2015 |
|
| Change in fund assets: | | | | | |
| Fair value of fund assets at January 1 | $ | 12,300 |
| $ | 11,376 |
|
| $ | 6 |
| $ | 7 |
|
| Actual return on fund assets | 461 |
| 1,374 |
|
| (1 | ) | (1 | ) |
| Employer contributions | 48 |
| 81 |
|
| 30 |
| 33 |
|
| Employee contributions | 40 |
| 43 |
|
| 1 |
| 1 |
|
| Benefits paid | (645 | ) | (608 | ) |
| (31 | ) | (34 | ) |
| Foreign currency changes | (8 | ) | 34 |
|
| — |
| — |
|
| Fair value of fund assets at December 31 | $ | 12,196 |
| $ | 12,300 |
|
| $ | 5 |
| $ | 6 |
|
| Funded status – plan surplus (deficit) | $ | 797 |
| $ | 1,106 |
|
| $ | (505 | ) | $ | (507 | ) |
|
| | | | | | | | | | | | | |
| | 2016 |
| 2015 |
| (in millions of Canadian dollars) | Pension
plans in
surplus |
| Pension
plans in
deficit |
|
| Pension
plans in
surplus |
| Pension
plans in
deficit |
|
| Projected benefit obligation at December 31 | $ | (10,902 | ) | $ | (497 | ) |
| $ | (10,681 | ) | $ | (513 | ) |
| Fair value of fund assets at December 31 | 11,972 |
| 224 |
|
| 12,082 |
| 218 |
|
| Funded Status | $ | 1,070 |
| $ | (273 | ) |
| $ | 1,401 |
| $ | (295 | ) |
All Other benefits plans were in a deficit position at December 31, 2016 and 2015.
Pension asset and liabilities in the Company’s Consolidated Balance Sheets
Amounts recognized in the Company’s Consolidated Balance Sheets are as follows:
|
| | | | | | | | | | | | | |
| | Pensions |
| Other benefits |
| (in millions of Canadian dollars) | 2016 |
| 2015 |
|
| 2016 |
| 2015 |
|
| Pension asset | $ | 1,070 |
| $ | 1,401 |
|
| $ | — |
| $ | — |
|
| Accounts payable and accrued liabilities | (10 | ) | (10 | ) |
| (34 | ) | (34 | ) |
| Pension and other benefit liabilities | (263 | ) | (285 | ) |
| (471 | ) | (473 | ) |
| Total amount recognized | $ | 797 |
| $ | 1,106 |
|
| $ | (505 | ) | $ | (507 | ) |
The defined benefit pension plans’ accumulated benefit obligation as at December 31, 2016 was $11,143 million (2015 – $10,893 million). The accumulated benefit obligation is calculated on a basis similar to the projected benefit obligation, except no future salary increases are assumed in the projection of future benefits.
The measurement date used to determine the plan assets and the accrued benefit obligation is December 31. The most recent actuarial valuation for pension funding purposes for the Company’s main Canadian pension plan was performed as at January 1, 2016. During 2017, the Company expects to file a new valuation with the pension regulator.
Accumulated other comprehensive losses
Amounts recognized in accumulated other comprehensive losses are as follows:
|
| | | | | | | | | | | | | |
| | Pensions |
| Other benefits |
| (in millions of Canadian dollars) | 2016 |
| 2015 |
|
| 2016 |
| 2015 |
|
| Net actuarial loss: | | | | | |
| Other than deferred investment gains | $ | 2,842 |
| $ | 3,144 |
|
| $ | 66 |
| $ | 77 |
|
| Deferred investment gains | (366 | ) | (1,101 | ) |
| — |
| — |
|
| Prior service cost | (7 | ) | (20 | ) |
| 3 |
| 4 |
|
| Deferred income tax | (699 | ) | (580 | ) |
| (17 | ) | (20 | ) |
| Total (Note 7) | $ | 1,770 |
| $ | 1,443 |
|
| $ | 52 |
| $ | 61 |
|
The unamortized actuarial loss and the unamortized prior service cost included in “Accumulated other comprehensive loss” that are expected to be recognized in net periodic benefit cost during 2017 are $153 million and a recovery of $5 million, respectively, for pensions and $2 million and $1 million, respectively, for other post-retirement benefits.
Actuarial assumptions
Weighted-average actuarial assumptions used were approximately:
|
| | | | | | |
| (percentages) | 2016 |
| 2015 |
| 2014 |
|
| Benefit obligation at December 31: |
|
|
|
|
|
|
| Discount rate | 4.02 |
| 4.22 |
| 4.09 |
|
| Projected future salary increases | 2.75 |
| 3.00 |
| 3.00 |
|
| Health care cost trend rate | 7.00 | (1) | 7.00 | (2) | 7.00 | (2) |
| Benefit cost for year ended December 31: |
|
|
|
|
|
|
| Discount rate | 4.22 |
| 4.09 |
| 4.90 |
|
| Expected rate of return on fund assets | 7.75 |
| 7.75 |
| 7.75 |
|
| Projected future salary increases | 3.00 |
| 3.00 |
| 3.00 |
|
| Health care cost trend rate | 7.00 | (2) | 7.00 | (2) | 7.50 | (3) |
(1) The health care cost trend rate is assumed to be 7.00% in 2017 and 2018, and then decreasing by 0.50% per year to an ultimate rate of 5.00% per year in 2022 and thereafter.
(2) The health care cost trend rate was previously assumed to be 6.50% in 2017 (7.00% in 2016 and 2015), and then decreasing by 0.50% per year to an ultimate rate of 5.00% per year in 2020 and thereafter.
(3) For the 2014 benefit cost, the health care cost trend rate was assumed to be 6.00% in 2017 (6.50% in 2016, 7.00% in 2015, 7.50% in 2014), and then decreasing by 0.50% per year to an ultimate rate of 5.00% per year in 2019 and thereafter.
Assumed health care cost trend rates affect the amounts reported for the health care plans. A one-percentage-point increase in the assumed health care cost trend rate would increase the post-retirement benefit obligation by $6 million, and a one-percentage-
point decrease in the assumed health care cost trend rate would decrease the post-retirement benefit obligation by $5 million. A one-percentage-point increase or decrease in the assumed health care cost trend rate would have no material effect on the total of service and interest costs.
In 2014, the Canadian Institute of Actuaries and the Society of Actuaries each published updated mortality tables based on broad pension plan experience in Canada and the U.S., respectively. At December 31, 2014, the Company changed the basis for its obligations for defined benefit pension and post-retirement benefit plans to these new mortality tables, with adjustments to reflect actual plan mortality experience to the extent that credible experience data were available. The changes to the new mortality tables increased the obligations for pensions and post-retirement benefits at that date by approximately $225 million. The Company's obligations for defined benefit pension and post-retirement benefit plans continue to be based on the new mortality tables at December 31, 2016.
Plan assets
Plan assets are recorded at fair value. The major asset categories are public equity securities, fixed income securities, real estate, infrastructure and absolute return investments. The fair values of the public equity and fixed income securities are primarily based on quoted market prices. Real estate values are based on annual valuations performed by external parties, taking into account current market conditions and recent sales transactions where practical and appropriate. Infrastructure values are based on the fair value of each fund’s assets as calculated by the fund manager, generally using a discounted cash flow analysis that takes into account current market conditions and recent sales transactions where practical and appropriate. Absolute return investments are a portfolio of units of externally managed hedge funds and are valued by the fund administrators.
The Company’s pension plan asset allocation, the current weighted average asset allocation targets and the current weighted average policy range for each major asset class, were as follows:
|
| | | | |
| | Current
asset
allocation
target | Current
policy
range | Percentage of plan assets
at December 31 |
| Asset allocation (percentage) | 2016 | 2015 |
| Cash and cash equivalents | 0.5 | 0 – 5 | 1.1 | 1.1 |
| Fixed income | 29.5 | 20 – 40 | 21.4 | 21.0 |
| Public equity | 46.0 | 35 – 55 | 53.8 | 54.5 |
| Real estate and infrastructure | 12.0 | 4 – 20 | 7.5 | 5.8 |
| Absolute return | 12.0 | 0 – 18 | 16.2 | 17.6 |
| Total | 100.0 |
| 100.0 | 100.0 |
Summary of the assets of the Company’s DB pension plans at fair values
The following is a summary of the assets of the Company’s DB pension plans at fair values at December 31, 2016 and 2015: |
| | | | | | | | | | | | | | | |
| (in millions of Canadian dollars) | Quoted prices in
active markets
for identical assets (Level 1) |
| Significant other
observable inputs
(Level 2) |
| Significant
unobservable inputs
(Level 3) |
| Investments measured at NAV(1) |
| Total |
|
| December 31, 2016 | | | | | |
| Cash and cash equivalents | $ | 121 |
| $ | 11 |
| $ | — |
| $ | — |
| $ | 132 |
|
| Fixed income | | | | | |
• Government bonds(2) | — |
| 1,357 |
| — |
| — |
| 1,357 |
|
• Corporate bonds(2) | — |
| 1,186 |
| — |
| — |
| 1,186 |
|
• Mortgages(3) | — |
| 71 |
| — |
| — |
| 71 |
|
| Public equities | | | | |
|
| • Canada | 1,480 |
| 57 |
| — |
| — |
| 1,537 |
|
| • U.S. and international | 4,985 |
| 36 |
| — |
| — |
| 5,021 |
|
Real estate(4) | — |
| — |
| 437 |
| 188 |
| 625 |
|
Derivative assets(5) | — |
| 7 |
| — |
| — |
| 7 |
|
Absolute return(6) | | | | |
|
| • Funds of hedge funds | — |
| — |
| — |
| 668 |
| 668 |
|
| • Multi-strategy funds | — |
| — |
| — |
| 502 |
| 502 |
|
| • Credit funds | — |
| — |
| — |
| 505 |
| 505 |
|
| • Equity funds | — |
| — |
| — |
| 300 |
| 300 |
|
Infrastructure(7) | — |
| — |
| — |
| 285 |
| 285 |
|
| | $ | 6,586 |
| $ | 2,725 |
| $ | 437 |
| $ | 2,448 |
| $ | 12,196 |
|
| December 31, 2015 | | | | | |
| Cash and cash equivalents | $ | 129 |
| $ | 11 |
| $ | — |
| $ | — |
| $ | 140 |
|
| Fixed income | | | | | |
• Government bonds(2) | — |
| 1,276 |
| — |
| — |
| 1,276 |
|
• Corporate bonds(2) | — |
| 1,228 |
| — |
| — |
| 1,228 |
|
• Mortgages(3) | — |
| 81 |
| — |
| — |
| 81 |
|
| Public equities | | | | |
|
| • Canada | 1,449 |
| 46 |
| — |
| — |
| 1,495 |
|
| • U.S. and international | 5,169 |
| 34 |
| — |
| — |
| 5,203 |
|
Real estate(4) | — |
| — |
| 451 |
| — |
| 451 |
|
Derivative assets(5) | — |
| — |
| — |
| — |
| — |
|
Absolute return(6) | | | | | |
| • Funds of hedge funds | — |
| — |
| — |
| 781 |
| 781 |
|
| • Multi-strategy funds | — |
| — |
| — |
| 517 |
| 517 |
|
| • Credit funds | — |
| — |
| — |
| 555 |
| 555 |
|
| • Equity funds | — |
| — |
| — |
| 311 |
| 311 |
|
Infrastructure(7) | — |
| — |
| — |
| 262 |
| 262 |
|
| | $ | 6,747 |
| $ | 2,676 |
| $ | 451 |
| $ | 2,426 |
| $ | 12,300 |
|
(1) Investments measured at net asset value ("NAV"):
Amounts are comprised of certain investments measured at fair value using NAV (or its equivalent) as a practical expedient. These investments have not been classified in the fair value hierarchy.
(2) Government & Corporate Bonds:
Fair values for bonds are based on market prices supplied by independent sources as of the last trading day.
(3) Mortgages:
The fair value of mortgages of $71 million (2015 – $81 million) is based on current market yields of financial instruments of similar maturity, coupon and risk factors.
(4) Real estate:
The fair value of real estate investments of $437 million (2015 – $451 million) is based on property appraisals which use a number of approaches that typically include a discounted cash flow analysis, a direct capitalization income method and/or a direct comparison approach. Appraisals of real estate investments are generally performed semi-annually by qualified external accredited appraisers. There are $81 million of unfunded commitments for real estate investments as at December 31, 2016 (2015 – $278 million).
(5) Derivatives:
The Company’s pension funds may utilize the following derivative instruments: equity futures to replicate equity index returns (Level 2); currency forwards to partially hedge foreign currency exposures (Level 2); bond forwards to reduce asset/liability interest rate risk exposures (Level 2); interest rate swaps to manage duration and interest rate risk (Level 2); credit default swaps to manage credit risk (Level 2); and options to manage interest rate risk and volatility (Level 2). There are currency forwards with a notional value of $937 million and a fair value of $7 million as at December 31, 2016 with maturities varying from three to fifteen months. These currency forwards reduce the funds' exposure to the U.S. dollar.
(6) Absolute return:
The fair value of absolute return fund investments of $1,975 million (2015 – $2,164 million) is based on the NAV reported by the fund administrators. The funds have different redemption policies and periods. There are no unfunded commitments for absolute return investments as at December 31, 2016 (2015 – $nil).
|
| |
- | Funds of hedge funds invest in a portfolio of hedge funds that allocate capital across a broad array of funds and/or investment managers, with monthly redemptions upon 95 days' notice. |
- | Multi-strategy funds include funds that invest in broadly diversified portfolios of equity, fixed income and derivative instruments with quarterly redemptions upon 60 days' notice. |
- | Credit funds invest in an array of fixed income securities with quarterly redemptions upon 60 days' notice. |
- | Equity funds invest primarily in U.S. and global equity securities. Redemptions range from quarterly upon 60 days' notice to triennially upon 45 days' notice. |
(7) Infrastructure:
Infrastructure fund values of $285 million (2015 – $262 million) are based on the NAV of the funds that invest directly in infrastructure investments. The fair values of the investments have been estimated using the capital accounts representing the plans ownership interest in the funds. The investment in each fund is not subject to redemption and is normally returned through distributions as a result of the liquidation of the underlying infrastructure investments. It was estimated that the investments in these funds will be liquidated over the weighted-average period of approximately two years. As at December 31, 2016, unfunded commitments for infrastructure investments were $nil (2015 - $nil).
Portion of the assets of the Company’s DB pension plans measured at fair value using unobservable inputs (Level 3)
During 2015 and 2016 the portion of the assets of the Company’s DB pension plans measured at fair value using unobservable inputs (Level 3) changed as follows:
|
| | | |
| (in millions of Canadian dollars) | Real Estate |
|
| As at January 1, 2015 | $ | 654 |
|
| Disbursements | (223 | ) |
| Net realized gains | 64 |
|
| Decrease in net unrealized gains | (44 | ) |
| As at December 31, 2015 | $ | 451 |
|
| Disbursements | (36 | ) |
| Net realized gains | 24 |
|
| Decrease in net unrealized gains | (2 | ) |
| As at December 31, 2016 | $ | 437 |
|
Additional plan assets information
The Company’s expected long-term target return is 7.75%, net of all fees and expenses. In identifying the asset allocation ranges, consideration was given to the long-term nature of the underlying plan liabilities, the solvency and going-concern financial position of the plan, long-term return expectations and the risks associated with key asset classes as well as the relationships of returns on key asset classes with each other, inflation and interest rates. When advantageous and with due consideration, derivative instruments may be utilized, provided the total value of the underlying assets represented by financial derivatives, excluding currency forwards, is limited to 30% of the market value of the fund.
When investing in foreign securities, the plans are exposed to foreign currency risk; the effect of which is included in the valuation of the foreign securities. CP has entered into currency forward contracts to partially offset pension plan exposure to the U.S. dollar. At December 31, 2016 the plans were 34% exposed to the U.S. dollar net of the currency forwards (42% excluding the currency forwards), 14% exposed to European currencies, and 5% exposed to various other currencies.
At December 31, 2016, fund assets consisted primarily of listed stocks and bonds, including 109,630 of the Company’s Common Shares (2015 –188,276) at a market value of $21 million (2015 – $33 million) andUnsecured Notes issued by the Company at a par value of $3 million (2015 – $3 million) and a market value of $3 million (2015 – $3 million).
Cash flows
In 2016, the Company contributed $57 million to its pension plans (2015 – $90 million; 2014 – $88 million), including $9 million to the DC plans (2015 – $9 million; 2014 – $8 million), $36 million to the Canadian registered and U.S. qualified DB pension plans (2015 – $69 million; 2014 – $67 million), and $12 million to the Canadian non-registered supplemental pension plan (2015 – $12 million; 2014 – $13 million). In addition, the Company made payments directly to employees, their beneficiaries or estates or to third-party benefit administrators of $30 million in 2016 (2015 – $33 million; 2014 – $26 million) with respect to other benefits.
Estimated future benefit payments
The estimated future defined benefit pension and other benefit payments to be paid by the plans for each of the next five years and the subsequent five-year period are as follows:
|
| | | | | | |
| (in millions of Canadian dollars) | Pensions |
| Other benefits |
|
| 2017 | $ | 616 |
| $ | 33 |
|
| 2018 | 626 |
| 32 |
|
| 2019 | 634 |
| 32 |
|
| 2020 | 641 |
| 31 |
|
| 2021 | 649 |
| 31 |
|
| 2022 – 2026 | 3,315 |
| 147 |
|
The benefit payments from the Canadian registered and U.S. qualified DB pension plans are payable from their respective pension funds. Benefit payments from the supplemental pension plan and from the other benefits plans are payable directly from the Company.
Defined contribution plan
Canadian non-unionized employees hired prior to July 1, 2010 had the option to participate in the Canadian DC plan. All Canadian non-unionized employees hired after such date must participate in this plan. Employee contributions are based on a percentage of salary. The Company matches employee contributions to a maximum percentage each year.
Effective July 1, 2010, a new U.S. DC plan was established. All U.S. non-unionized employees hired after such date must participate in this plan. Employees do not contribute to the plan. The Company annually contributes a percentage of salary.
The DC plans provide a pension based on total employee and employer contributions plus investment income earned on those contributions.
In 2016, the net cost of the DC plans, which generally equals the employer’s required contribution, was $9 million (2015 – $9 million; 2014 – $8 million).
Contributions to multi-employer plans
Some of the Company’s unionized employees in the U.S. are members of a U.S. national multi-employer benefit plan. Contributions made by the Company to this plan in 2016 in respect of post-retirement medical benefits were $4 million (2015 – $4 million; 2014 – $4 million).
21 Stock-based compensation
At December 31, 2016, the Company had several stock-based compensation plans, including a stock option plan, various cash settled liability plans and an employee stock savings plan. These plans resulted in an expense in 2016 of $51 million (2015 – $66 million; 2014 – $110 million). The information in this note excludes the effects of the subsequent event described in Note 27.
A. Stock Option Plan
Summary of stock options
The following table summarizes the Company’s stock option plan as at December 31, 2016:
|
| | | | | | | | | | | |
| | Options outstanding |
| Nonvested options |
| Number of
options |
| Weighted
average
exercise price |
|
| Number of
options |
| Weighted
average
grant date
fair value |
|
| Outstanding, January 1, 2016 | 2,407,973 |
| $ | 113.01 |
|
| 984,979 |
| $ | 41.88 |
|
| New options granted | 403,740 |
| 161.06 |
|
| 403,740 |
| 39.01 |
|
| Exercised | (269,491 | ) | 74.99 |
|
| — |
| — |
|
| Vested | — |
| — |
|
| (449,712 | ) | 33.70 |
|
| Forfeited | (90,340 | ) | 186.95 |
|
| (88,840 | ) | 42.42 |
|
| Expired | (1,800 | ) | 60.84 |
|
| — |
| — |
|
| Outstanding, December 31, 2016 | 2,450,082 |
| $ | 121.95 |
|
| 850,167 |
| $ | 44.49 |
|
Vested or expected to vest at
December 31, 2016(1) | 2,437,475 |
| $ | 121.62 |
|
| N/A |
| N/A |
|
| Exercisable, December 31, 2016 | 1,599,915 |
| $ | 93.79 |
|
| N/A |
| N/A |
|
(1) As at December 31, 2016, the weighted average remaining term of vested or expected to vest options was 6.9 years with an aggregate intrinsic value of $181 million.
The following table provides the number of stock options outstanding and exercisable as at December 31, 2016 by range of exercise price and their related intrinsic aggregate value, and for options outstanding, the weighted-average years to expiration. The table also provides the aggregate intrinsic value for in-the-money stock options, which represents the amount that would have been received by option holders had they exercised their options on December 31, 2016 at the Company’s closing stock price of $191.56.
|
| | | | | | | | | | | | | | | | | | |
| | Options outstanding |
| Options exercisable |
| Range of exercise prices | Number of
options |
| Weighted
average
years to
expiration | Weighted
average
exercise
price |
| Aggregate
intrinsic
value
(millions) |
|
| Number of
options |
| Weighted
average
exercise
price |
| Aggregate
intrinsic
value
(millions) |
|
| $36.29 – $72.54 | 304,025 |
| 2.3 | $ | 60.59 |
| $ | 40 |
|
| 304,025 |
| $ | 60.59 |
| $ | 40 |
|
| $72.55 – $86.71 | 747,445 |
| 5.4 | 73.69 |
| 88 |
|
| 747,445 |
| 73.69 |
| 88 |
|
| $86.72 – $161.38 | 678,416 |
| 7.0 | 127.62 |
| 44 |
|
| 347,061 |
| 111.34 |
| 28 |
|
| $161.39 – $236.50 | 720,196 |
| 8.5 | 192.56 |
| (1 | ) |
| 201,384 |
| 188.23 |
| — |
|
Total(1) | 2,450,082 |
| 6.2 | $ | 121.94 |
| $ | 171 |
|
| 1,599,915 |
| $ | 93.79 |
| $ | 156 |
|
(1) As at December 31, 2016, the total number of in-the-money stock options outstanding was 2,140,692 with a weighted-average exercise price of $107.27. The weighted-average years to expiration of exercisable stock options is 5.1 years.
Pursuant to the employee plan, options may be exercised upon vesting, which is between 12 months and 48 months after the grant date, and will expire after 10 years. Under the fair value method, the fair value of options at the grant date was approximately $16 million for options issued in 2016 (2015 – $18 million; 2014 – $21 million). The weighted average fair value assumptions were approximately:
|
| | | | | | | | | |
| | 2016 |
| 2015 |
| 2014 |
|
Expected option life (years)(1) | 5.25 |
| 5.25 |
| 5.98 |
|
Risk-free interest rate(2) | 1.21 | % | 1.10 | % | 1.66 | % |
Expected stock price volatility(3) | 27 | % | 26 | % | 29 | % |
Expected annual dividends per share(4) | $ | 1.40 |
| $ | 1.40 |
| $ | 1.40 |
|
Estimated forfeiture rate(5) | 2.0 | % | 1.2 | % | 1.2 | % |
Weighted average grant date fair value
of options granted during the year | $ | 39.01 |
| $ | 55.28 |
| $ | 48.88 |
|
(1) Represents the period of time that awards are expected to be outstanding. Historical data on exercise behaviour or, when available, specific expectations regarding future exercise behaviour were used to estimate the expected life of the option.
(2) Based on the implied yield available on zero-coupon government issues with an equivalent remaining term at the time of the grant.
(3) Based on the historical stock price volatility of the Company’s stock over a period commensurate with the expected term of the option.
(4) Determined by the current annual dividend at the time of grant. The Company does not employ different dividend yields throughout the contractual term of the option. On April 20, 2016, the Company announced an increase in its quarterly dividend to $0.50 per share, representing $2.00 on an annual basis.
(5) The Company estimated forfeitures based on past experience. The rate is monitored on a periodic basis.
In 2016, the expense for stock options (regular and performance) was $14 million (2015 – $15 million; 2014 – $18 million). At December 31, 2016, there was $8 million of total unrecognized compensation related to stock options which is expected to be recognized over a weighted-average period of approximately 1.1 years.
The total fair value of shares vested for the stock option plan during 2016 was $15 million (2015 – $17 million; 2014 – $15 million).
The following table provides information related to all options exercised in the stock option plan during the years ended December 31:
|
| | | | | | | | | |
| (in millions of Canadian dollars) | 2016 |
| 2015 |
| 2014 |
|
| Total intrinsic value | $ | 30 |
| $ | 72 |
| $ | 115 |
|
| Cash received by the Company upon exercise of options | 21 |
| 43 |
| 62 |
|
B. Other Share-based Plans
Performance share units plan
During 2016, the Company issued 147,157 PSUs with a grant date fair value of $25 million. These units attract dividend equivalents in the form of additional units based on the dividends paid on the Company’s Common Shares. PSUs vest and are settled in cash or in CP Common Shares, approximately three years after the grant date, contingent upon CP’s performance (performance factor). Grant recipients who are eligible to retire and have provided six months of service during the performance period are entitled to the full award. The fair value of PSUs is measured periodically until settlement, using a latticed-based valuation model.
The performance period of the PSUs issued in 2016 is January 1, 2016 to December 31, 2018, and the performance period for the PSUs issued in 2015 is January 1, 2015 to December 31, 2017. The performance factors for these PSUs are Operating Ratio, Return on Invested Capital, Total Shareholder Return ("TSR") compared to the S&P/TSX60 index, and TSR compared to Class 1 railways.
The performance period for the PSUs issued in 2014 was January 1, 2014 to December 31, 2016. The performance factors for these PSUs were Operating Ratio, Free cash flow, TSR compared to the S&P/TSX60 index, and TSR compared to Class I railways. The resulting estimated payout was 118% on 134,063 total outstanding awards at December 31, 2016 resulting in a liability of $31 million at December 31, 2016 and was calculated using the Company's average share price using the last 30 trading days preceding December 31, 2016.
The performance period for the PSUs issued in the fourth quarter of 2012 and in 2013 was January 1, 2013 to December 31, 2014. The performance factors for these PSUs were Operating Ratio, Free cash flow, TSR compared to the S&P/TSX60 index, and TSR compared to Class I railways. All performance factors met the 200% payout thresholds, in effect resulting in a target payout of 200% on 300,095 total outstanding awards as at December 31, 2015. A payout of $79 million on 217,179 outstanding awards, occurred on December 31, 2015 and was calculated using the Company's average share price using the last 30 trading days preceding December 31, 2015. In the first quarter of 2016, final payouts occurred on the total outstanding awards, including dividends reinvested, totalling $31 million on 83,466 outstanding awards
The following table summarizes information related to the Company’s PSUs as at December 31:
|
| | | | |
| | 2016 |
| 2015 |
|
| Outstanding, January 1 | 348,276 |
| 460,783 |
|
| Granted | 147,157 |
| 137,958 |
|
| Units, in lieu of dividends | 4,010 |
| 3,570 |
|
| Settled | (83,466 | ) | (217,179 | ) |
| Forfeited | (42,384 | ) | (36,856 | ) |
| Outstanding, December 31 | 373,593 |
| 348,276 |
|
In 2016, the expense for PSUs was $29 million (2015 – $55 million; 2014 – $50 million). At December 31, 2016, there was $15 million of total unrecognized compensation related to PSUs which is expected to be recognized over a weighted-average period of approximately 1.4 years.
Deferred share units plan
The Company established the DSU plan as a means to compensate and assist in attaining share ownership targets set for certain key employees and Directors. A DSU entitles the holder to receive, upon redemption, a cash payment equivalent to the Company's average share price using the 10 trading days prior to redemption. DSUs vest over various periods of up to 48 months and are only redeemable for a specified period after employment is terminated.
Senior managers may elect to receive DSUs in lieu of annual bonus cash payments in the bonus deferral program. In addition, senior managers will be granted a 25% company match of DSUs when deferring cash to DSUs to meet ownership targets. The election to receive eligible payments in DSUs is no longer available to a participant when the value of the participant’s DSUs is sufficient to meet the Company’s stock ownership guidelines. Senior managers have five years to meet their ownership targets.
An expense for DSUs is recognized over the vesting period for both the initial subscription price and the change in value between reporting periods.
The following table summarizes information related to the DSUs as at December 31:
|
| | | | |
| | 2016 |
| 2015 |
|
| Outstanding, January 1 | 318,176 |
| 308,447 |
|
| Granted | 31,069 |
| 21,690 |
|
| Units, in lieu of dividends | 2,798 |
| 2,015 |
|
| Settled | (87,996 | ) | (11,784 | ) |
| Forfeited | (30,011 | ) | (2,192 | ) |
| Outstanding, December 31 | 234,036 |
| 318,176 |
|
During 2016, the Company granted 31,069 DSUs with a grant date fair value of $5 million. In 2016, the expense was $2 million (2015 – $10 million recovery; 2014 – $28 million expense). At December 31, 2016, there was $1 million of total unrecognized compensation related to DSUs which is expected to be recognized over a weighted-average period of approximately 1.2 years.
Summary of share based liabilities paid
The following table summarizes the total share based liabilities paid for each of the years ended December 31:
|
| | | | | | | | | |
| (in millions of Canadian dollars) | 2016 |
| 2015 |
| 2014 |
|
| Plan | | | |
| DSUs | $ | 17 |
| $ | 3 |
| $ | 17 |
|
| PSUs | 31 |
| 79 |
| — |
|
| Other | — |
| 8 |
| 12 |
|
| Total | $ | 48 |
| $ | 90 |
| $ | 29 |
|
C. Employee share purchase plan
The Company has an employee share purchase plan whereby both employee and the Company contributions are used to purchase shares on the open market for employees. The Company’s contributions are expensed over the one year vesting period. Under the plan, the Company matches $1 for every $3 contributed by employees up to a maximum employee contribution of 6% of annual salary.
The total number of shares purchased in 2016 on behalf of participants, including the Company's contributions, was 140,560 (2015 – 131,703; 2014 – 176,906). In 2016, the Company’s contributions totalled $5 million (2015 – $5 million; 2014 – $5 million) and the related expense was $5 million (2015 – $4 million; 2014 – $5 million).
22 Variable interest entities
The Company leases equipment from certain trusts, which have been determined to be variable interest entities financed by a combination of debt and equity provided by unrelated third parties. The lease agreements, which are classified as operating leases, have a fixed price purchase option which create the Company’s variable interest and result in the trusts being considered variable interest entities.
Maintaining and operating the leased assets according to specific contractual obligations outlined in the terms of the lease agreements and industry standards is the Company’s responsibility. The rigor of the contractual terms of the lease agreements and industry
standards are such that the Company has limited discretion over the maintenance activities associated with these assets. As such, the Company concluded these terms do not provide the Company with the power to direct the activities of the variable interest entities in a way that has a significant impact on the entities’ economic performance.
The financial exposure to the Company as a result of its involvement with the variable interest entities is equal to the fixed lease payments due to the trusts. In 2016, lease payments after tax were $12 million. Future minimum lease payments, before tax, of $207 million will be payable over the next 14 years (see Note 23).
The Company does not guarantee the residual value of the assets to the lessor; however, it must deliver to the lessor the assets in good operating condition, subject to normal wear and tear, at the end of the lease term.
As the Company’s actions and decisions do not significantly affect the variable interest entities’ performance, and the Company’s fixed price purchase option is not considered to be potentially significant to the variable interest entities, the Company is not considered to be the primary beneficiary,immediately, and does not consolidate these variable interest entities.
23 Commitments and contingencies
In the normal course of its operations, the Company becomes involvedparticipate in various legal actions, including claims relating to injuries and damage to property. The Company maintains provisions it considers to be adequate for such actions. While the final outcome with respect to actions outstandingany discussions or pending at December 31, 2016, cannot be predicted with certainty, it is the opinion of management that their resolution will not have a material adverse effectvotes on the Company’s financial position or results of operations.
Commitments
At December 31, 2016, the Company had committed to total future capital expenditures amounting to $186 million and operating expenditures relating to supplier purchase obligations, such as locomotive maintenance and overhaul agreements, as well as agreements to purchase other goods and services amounting to approximately $2.5 billion for the years 2017–2032, of which CP estimates approximately $1.9 billion will be incurred in the next five years.
As at December 31, 2016, the Company’s commitments under operating leases were estimated at $450 million in aggregate, with minimum annual payments in each of the next five years and thereafter as follows:
|
| | | |
| (in millions of Canadian dollars) | Operating
leases |
|
| 2017 | $ | 97 |
|
| 2018 | 66 |
|
| 2019 | 52 |
|
| 2020 | 44 |
|
| 2021 | 40 |
|
| Thereafter | 151 |
|
| Total minimum lease payments | $ | 450 |
|
Expenses for operating leases for the year ended December 31, 2016, were $111 million (2015 – $127 million; 2014 – $121 million).
Legal proceedingsmatter.The Board reviews related to Lac-Mégantic rail accident
On July 6, 2013, a train carrying crude oil operated by Montreal Maine and Atlantic Railway (“MMA”) or a subsidiary, Montreal Maine & Atlantic Canada Co. (“MMAC” and collectively the “MMA Group”) derailed and exploded in Lac-Mégantic, Québec. The accident occurred on a section of railway owned and operated by the MMA Group. The previous day CP had interchanged the train to the MMA Group, and after the interchange, the MMA Group exclusively controlled the train.
Following this incident, Québec's Minister of Sustainable Development, Environment, Wildlife and Parks (the "Minister") ordered the named parties to recover the contaminants and to clean up the derailment site. On August 14, 2013, the Minister added CP as a party (the “Amended Cleanup Order”). CP appealed the Amended Cleanup Order to the Administrative Tribunal of Québec. On July 5, 2016, the Minister served a Notice of Claim for nearly $95 million of compensation spent on cleanup, alleging that CP refused or neglected to undertake the work. On September 6, 2016, CP filed a contestation of the Notice of Claim with the Administrative Tribunal of Québec. In October 2016, CP and the Minister agreed to stay the tribunal proceedings pending the outcome of the Province of Québec's action, set out below. The Court's decision to stay the tribunal proceedings is pending, but de facto, the file has been suspended. Directly related to that matter, on July 6, 2015, the Province of Québec sued CP in Québec Superior Court claiming $409 million in derailment damages, including cleanup costs. The Province alleges that CP exercised custody or control over the crude oil lading and that CP was otherwise negligent. Therefore, CP is said to be solidarily (joint and severally) liable with
third parties responsible for the accident. The Province filed a motion for leave to amend its complaint in September 2016, but no date has been fixed for the hearing of this motion, as most of the Attorney General of Québec's lawyers have been on strike since October 2016 and current reports are that there is no imminent end in sight. As at the end of 2016, no timetable governing the conduct of this lawsuit has been ordered by the Québec Superior Court. This proceeding appears to be duplicative of the administrative proceedings.
A class action lawsuit has also been filed in the Québec Superior Court on behalf of persons and entities residing in, owning or leasing property in, operating a business in or physically present in Lac-Mégantic at the time of the derailment (the “Class Action”). That lawsuit seeks derailment damages, including for wrongful death, personal injury, and property harm. On August 16, 2013, CP was added as a defendant. On May 8, 2015, the Québec Superior Court authorized (certified) the Class Action against CP, the shipper – Western Petroleum, and the shipper’s parent – World Fuel Services (collectively, the “World Fuel Entities”). The World Fuel Entities have since settled. The plaintiffs filed a motion for leave to amend their complaint, but subsequently withdrew it.
On October 24, 2016, the Québec Superior Court authorized class action proceedings against two additional defendants in the same matter discussed above, i.e., against MMAC and Mr. Thomas Harding. On December 9, 2016, the Superior Court granted CP's motion asking the latter to confirm the validity of the opt-outs from this class action by most of the estates of the deceased parties following the train derailment who had opted out to allow them to sue in the United States instead (i.e., the wrongful death cases, filed in the United States, which are further discussed hereinafter). As at the end of 2016, no timetable governing the conduct of this lawsuit has been ordered by the Québec Superior Court.
On July 4, 2016, eight subrogated insurers served CP with claims of approximately $16 million. On July 11, 2016, two additional subrogated insurers served CP with claims of approximately $3 million. The lawsuits do not identify the parties to which the insurers are subrogated, and therefore the extent of claim overlap and the extent that claims will be satisfied after proof of claim review and distribution from the Plans, referred to below, is difficult to determine. These lawsuits have been stayed until June 2, 2017.
In the wake of the derailment and ensuing litigation, MMAC filed for bankruptcy in Canada (the “Canadian Proceeding”) and MMA filed for bankruptcy in the United States (the “U.S. Proceeding”). Plans of arrangement have been approved in both the Canadian Proceeding and the U.S. Proceeding (the “Plans”). These Plans provide for the distribution of a fund of approximately $440 million amongst those claiming derailment damages. The Plans also provide settling parties broadly worded third-party releases and injunctions preventing lawsuits against settlement contributors. CP has not settled and therefore will not benefit from those provisions. Both Plans do, however, contain judgment reduction provisions, affording CP a credit for the greater of (i) the settlement monies received by the plaintiff(s), or (ii) the amount, in contribution or indemnity, that CP would have been entitled to charge against third parties other than MMA and MMAC, but for the Plans' releases and injunctions. CP may also have judgment reduction rights, as part of the contribution/indemnification credit, for the fault of the MMA Group. Finally, the Plans provide for a potential re-allocation of the MMA Group’s liability among plaintiffs and CP, the only non-settling party.
An Adversary Proceeding filed by the MMA U.S. bankruptcy trustee (now, estate representative) against CP, Irving Oil, and the World Fuel Entities accuses CP of failing to ensure that World Fuel Entities or Irving Oil properly classified the oil lading and of not refusing to ship the misclassified oil as packaged. By that action the estate representative seeks to recover MMA's going concern value supposedly destroyed by the derailment. The estate representative has since settled with the World Fuel Entities and Irving Oil and now bases CP misfeasance on the railroad’s failure to abide in North Dakota by a Canadian regulation. That regulation supposedly would have caused the railroads to not move the crude oil train because an inaccurate classification was supposedly suspected. In a recently amended complaint, the estate representative named a CP affiliate, Soo Line Railroad Company ("Soo Line"), and asserts that CP and Soo Line breached terms or warranties allegedly contained in the bill of lading. CP's motion to dismiss this amended complaint was heard on December 20, 2016 and a decision is pending.
In response to one of CP’s motions to withdraw the Adversary Proceedings bankruptcy reference, the estate representative maintained that Canadian law rather than U.S. law controlled. The Article III court that heard the motion found that if U.S. federal regulations governed, the case was not complex enough to warrant withdrawal. Before the bankruptcy court, CP moved to dismiss for want of personal jurisdiction, but the court denied the motion because CP had participated in the bankruptcy proceedings.
Lac-Mégantic residents and wrongful death representatives commenced a class action and a mass action in Texas and wrongful death and personal injury actions in Illinois and Maine. CP removed all of these lawsuits to federal court, and a federal court thereafter consolidated those cases in Maine. These actions generally charge CP with misclassification and mis-packaging (that is, using inappropriate DOT-111 tank cars) negligence. On CP's motion, the Maine court dismissed all wrongful death and personal injury actions on several grounds on September 28, 2016. The plaintiffs’ subsequent motion for reconsideration was denied on January 9, 2017. The plaintiffs filed a notice of appeal on January 19, 2017. CP will file a motion to dismiss the appeal. If the ruling is upheld on appeal these cases will be litigated, if anywhere, in Canada. As previously mentioned, many of these plaintiffs had previously opted-out of the Québec Class Action in order to bring their claims in the United States. CP brought a motion on December 1, 2016 to seek a declaration from the Québec Superior Court that the plaintiffs who had opted were precluded from opting back into the Québec Class Action. CP’s motion was successful. Accordingly, if these plaintiffs seek to sue CP, they would have to do so in Québec in individual actions (they could also join their individual claims in the same individual action).
CP has received two damage to cargo notices of claims from the shipper of the oil, Western Petroleum. Western Petroleum submitted U.S. and Canadian notices of claims for the same damages and under the Carmack Amendment (49 U.S.C. Section 11706) Western
Petroleum seeks to recover for all injuries associated with, and indemnification for, the derailment. Both jurisdictions permit a shipper to recover the value of damaged lading against any carrier in the delivery chain, subject to limitations in the carrier’s tariffs. CP’s tariffs significantly restrict shipper damage claim rights. Western Petroleum is part of the World Fuel Services Entities, and those companies settled with the trustee. In settlements with the estate representative the World Fuel Services Entities and the consignee (Irving Oil) assigned all claims against CP, if any, including Carmack Amendment claims. The estate representative has since designated a trust formed for the benefit of the wrongful death plaintiff to pursue those claims.
On April 12, 2016, the Trustee (the “WD Trustee”) for a wrongful death trust (the “WD Trust”), as defined and established under the confirmed Plans, sued CP in North Dakota federal court, asserting Carmack Amendment claims. The WD Trustee maintains that the estate representative assigned Carmack Amendment claims to the WD Trustee. The Plan supposedly gave the estate representative Carmack Amendment assignment rights. The WD Trustee seeks to recover amounts for damaged railcars (approximately $6 million), and the settlement amounts the consignor (i.e., the shipper, the World Fuel Entities) and the consignee (Irving Oil) paid to the bankruptcy estates, alleged to be $110 million and $60 million, respectively. The WD Trustee maintains that Carmack Amendment liability extends beyond lading losses to cover all derailment related damages suffered by the World Fuel Entities or Irving Oil. CP disputes this interpretation of Carmack Amendment exposure and maintains that CP’s tariffs preclude anything except a minimal recovery. Canadian Pacific Railway Limited and Soo Line Corporation, both non-carriers, have moved to dismiss the Carmack Amendment claims, which only apply to common carriers. CP has brought threshold motions to dismiss the Carmack Amendment claims. The determination of these motions is pending.
At this early stage of the proceedings, any potential responsibility and the quantum of potential losses cannot be determined. Nevertheless, CP denies liability and intends to vigorously defend against all derailment-related proceedings.
24 Guarantees
In the normal course of operating the railway, the Company enters into contractual arrangements that involve providing certain guarantees, which extend over the term of the contracts. These guarantees include, but are not limited to:
residual value guarantees on operating lease commitments of $19 million at December 31, 2016;
guarantees to pay other parties in the event of the occurrence of specified events, including damage to equipment, in relation to assets used in the operation of the railway through operating leases, rental agreements, easements, trackage, and interline agreements; and
indemnifications of certain tax-related payments incurred by lessors and lenders.
The maximum amount that could be payable under these guarantees, excluding residual value guarantees, cannot be reasonably estimated due to the nature of certain of these guarantees. All or a portion of amounts paid under guarantees to other parties in the event of the occurrence of specified events could be recoverable from other parties or through insurance. The Company has accrued for all guarantees that it expects to pay. At December 31, 2016, these accruals amounted to $5 million (2015 – $4 million), recorded in “Accounts payable and accrued liabilities”.
Indemnifications
Pursuant to a trust and custodial services agreement with the trustee of the Canadian Pacific Railway Company Pension Plan, the Company has undertaken to indemnify and save harmless the trustee, to the extent not paid by the fund, from any and all taxes, claims, liabilities, damages, costs, and expenses arising out of the performance of the trustee’s obligations under the agreement, except as a result of misconduct by the trustee. The indemnity includes liabilities, costs, or expenses relating to any legal reporting or notification obligations of the trustee with respect to the defined contribution option of the pension plans or otherwise with respect to the assets of the pension plans that are not part of the fund. The indemnity survives the termination or expiry of the agreement with respect to claims and liabilities arising prior to the termination or expiry. At December 31, 2016, the Company had not recorded a liability associated with this indemnification, astransactions when it does not expect to makeits annual review of director independence. Our accounting and legal departments review any payments pertaining to it.
25 Segmentedrelated party transactions reported by officers and geographic information
Operating segment
employees.Independence
The Company operates in only one operating segment: rail transportation. Operating results by geographic areas, railway corridors or other lower level components or units of operation are not reviewed by the Company’s chief operating decision-maker to make decisions about the allocation of resources to, or the assessment of performance of, such geographic areas, corridors, components or units of operation.
In the years ended December 31, 2016, 2015, and 2014, no one customer comprised more than 10% of total revenues and accounts receivable.
Geographic information
|
| | | | | | | | | |
| (in millions of Canadian dollars) | Canada |
| United States |
| Total |
|
| 2016 |
|
|
|
| Revenues | $ | 4,473 |
| $ | 1,759 |
| $ | 6,232 |
|
| Long-term assets excluding financial instruments, mortgages receivable and deferred tax assets | $ | 11,000 |
| $ | 6,121 |
| $ | 17,121 |
|
| 2015 |
|
|
|
| Revenues | $ | 4,662 |
| $ | 2,050 |
| $ | 6,712 |
|
| Long-term assets excluding financial instruments, mortgages receivable and deferred tax assets | $ | 10,630 |
| $ | 6,068 |
| $ | 16,698 |
|
| 2014 |
|
|
|
| Revenues | $ | 4,655 |
| $ | 1,965 |
| $ | 6,620 |
|
| Long-term assets excluding financial instruments, mortgages receivable and deferred tax assets | $ | 10,114 |
| $ | 4,733 |
| $ | 14,847 |
|
26 Selected quarterly data (unaudited)
|
| | | | | | | | | | | | | | | | | | | | | | | | | |
| For the quarter ended | 2016 |
| 2015 |
| (in millions of Canadian dollars, except per share data) | Dec. 31 |
| Sep. 30 |
| Jun. 30 |
| Mar. 31 |
|
| Dec. 31 |
| Sep. 30 |
| Jun. 30 |
| Mar. 31 |
|
| Total revenues | $ | 1,637 |
| $ | 1,554 |
| $ | 1,450 |
| $ | 1,591 |
|
| $ | 1,687 |
| $ | 1,709 |
| $ | 1,651 |
| $ | 1,665 |
|
| Operating income | 717 |
| 657 |
| 551 |
| 653 |
|
| 677 |
| 753 |
| 646 |
| 612 |
|
| Net income | 384 |
| 347 |
| 328 |
| 540 |
|
| 319 |
| 323 |
| 390 |
| 320 |
|
Basic earnings per share(1) | $ | 2.63 |
| $ | 2.35 |
| $ | 2.16 |
| $ | 3.53 |
|
| $ | 2.09 |
| $ | 2.05 |
| $ | 2.38 |
| $ | 1.94 |
|
Diluted earnings per share(1) | 2.61 |
| 2.34 |
| 2.15 |
| 3.51 |
|
| 2.08 |
| 2.04 |
| 2.36 |
| 1.92 |
|
(1) Per share net incomeBoard has adopted standards for the four quarters combined may not equal the per share net income for the year due to rounding.
On January 18, 2017, the Company announced the resignation of Mr. E. Hunter Harrison from all positions held by him at the Company, including as the Company’s Chief Executive Officer and a member of the Board of Directors of the Company, effective January 31, 2017. In connection with Mr. Harrison’s resignation, the Company entered into a separation agreement with Mr. Harrison. Under the terms of the separation agreement, the Company has agreed to a limited waiver of Mr. Harrison’s non-competition and non-solicitation obligations.
Effective January 31, 2017, pursuant to the separation agreement, Mr. Harrison forfeited certain pension and post-retirement benefits and agreed to the surrender for cancellation of 22,514 PSUs, 68,612 DSUs, and 752,145 Stock options.
As a result of this agreement, the Company has recognized a recovery of $51 million in "Compensation and benefits" in the first quarter of 2017.
28 Condensed consolidating financial information
Canadian Pacific Railway Company, a 100%-owned subsidiary of Canadian Pacific Railway Limited (“CPRL”), is the issuer of certain debt securities, which are fully and unconditionally guaranteed by CPRL. The following tables present condensed consolidating financial information (“CCFI”) in accordance with Rule 3-10(c) of Regulation S-X.
Investments in subsidiaries are accounted for under the equity method when presenting the CCFI.
The tables include all adjustments necessary to reconcile the CCFI on a consolidated basis to CPRL’s consolidated financial statements for the periods presented.
CONDENSED CONSOLIDATING STATEMENTS OF INCOME
YEAR ENDED DECEMBER 31, 2016
|
| | | | | | | | | | | | | | | |
| (in millions of Canadian dollars) | CPRL (Parent Guarantor) |
| CPRC (Subsidiary Issuer) |
| Non-Guarantor Subsidiaries |
| Consolidating Adjustments and Eliminations |
| CPRL Consolidated |
|
| Revenues | | | | | |
| Freight | $ | — |
| $ | 4,332 |
| $ | 1,728 |
| $ | — |
| $ | 6,060 |
|
| Non-freight | — |
| 134 |
| 386 |
| (348 | ) | 172 |
|
| Total revenues | — |
| 4,466 |
| 2,114 |
| (348 | ) | 6,232 |
|
| Operating expenses |
|
|
|
|
|
|
|
|
|
|
| Compensation and benefits | — |
| 749 |
| 434 |
| 6 |
| 1,189 |
|
| Fuel | — |
| 458 |
| 109 |
| — |
| 567 |
|
| Materials | — |
| 130 |
| 32 |
| 18 |
| 180 |
|
| Equipment rents | — |
| 204 |
| (31 | ) | — |
| 173 |
|
| Depreciation and amortization | — |
| 422 |
| 218 |
| — |
| 640 |
|
| Purchased services and other | — |
| 673 |
| 604 |
| (372 | ) | 905 |
|
| Total operating expenses | — |
| 2,636 |
| 1,366 |
| (348 | ) | 3,654 |
|
| Operating income | — |
| 1,830 |
| 748 |
| — |
| 2,578 |
|
| Less: |
|
|
|
|
|
|
|
|
|
|
| Other income and charges | (40 | ) | (34 | ) | 29 |
| — |
| (45 | ) |
| Net interest expense (income) | 1 |
| 493 |
| (23 | ) | — |
| 471 |
|
| Income before income tax expense and equity in net earnings of subsidiaries | 39 |
| 1,371 |
| 742 |
| — |
| 2,152 |
|
| Less: Income tax expense | 6 |
| 337 |
| 210 |
| — |
| 553 |
|
| Add: Equity in net earnings of subsidiaries | 1,566 |
| 532 |
| — |
| (2,098 | ) | — |
|
| Net income | $ | 1,599 |
| $ | 1,566 |
| $ | 532 |
| $ | (2,098 | ) | $ | 1,599 |
|
CONDENSED CONSOLIDATING STATEMENTS OF INCOME
YEAR ENDED DECEMBER 31, 2015
|
| | | | | | | | | | | | | | | |
| (in millions of Canadian dollars) | CPRL (Parent Guarantor) |
| CPRC (Subsidiary Issuer) |
| Non-Guarantor Subsidiaries |
| Consolidating Adjustments and Eliminations |
| CPRL Consolidated |
|
| Revenues | | | | | |
| Freight | $ | — |
| $ | 4,532 |
| $ | 2,020 |
| $ | — |
| $ | 6,552 |
|
| Non-freight | — |
| 128 |
| 363 |
| (331 | ) | 160 |
|
| Total revenues | — |
| 4,660 |
| 2,383 |
| (331 | ) | 6,712 |
|
| Operating expenses |
|
|
|
|
|
|
|
|
|
|
| Compensation and benefits | — |
| 943 |
| 428 |
| — |
| 1,371 |
|
| Fuel | — |
| 549 |
| 159 |
| — |
| 708 |
|
| Materials | — |
| 148 |
| 36 |
| — |
| 184 |
|
| Equipment rents | — |
| 181 |
| (7 | ) | — |
| 174 |
|
| Depreciation and amortization | — |
| 411 |
| 184 |
| — |
| 595 |
|
| Purchased services and other | — |
| 711 |
| 680 |
| (331 | ) | 1,060 |
|
| Gain on sale of Delaware & Hudson South | — |
| — |
| (68 | ) | — |
| (68 | ) |
| Total operating expenses | — |
| 2,943 |
| 1,412 |
| (331 | ) | 4,024 |
|
| Operating income | — |
| 1,717 |
| 971 |
| — |
| 2,688 |
|
| Less: |
|
|
|
|
|
|
|
|
|
|
| Other income and charges | 84 |
| 322 |
| (71 | ) | — |
| 335 |
|
| Net interest (income) expense | (5 | ) | 447 |
| (48 | ) | — |
| 394 |
|
| (Loss) income before income tax expense and equity in net earnings of subsidiaries | (79 | ) | 948 |
| 1,090 |
| — |
| 1,959 |
|
Less: Income tax (recovery) expense
| (21 | ) | 303 |
| 325 |
| — |
| 607 |
|
| Add: Equity in net earnings of subsidiaries | 1,410 |
| 765 |
| — |
| (2,175 | ) | — |
|
| Net income | $ | 1,352 |
| $ | 1,410 |
| $ | 765 |
| $ | (2,175 | ) | $ | 1,352 |
|
CONDENSED CONSOLIDATING STATEMENTS OF INCOME
YEAR ENDED DECEMBER 31, 2014
|
| | | | | | | | | | | | | | | |
| (in millions of Canadian dollars) | CPRL (Parent Guarantor) |
| CPRC (Subsidiary Issuer) |
| Non-Guarantor Subsidiaries |
| Consolidating Adjustments and Eliminations |
| CPRL Consolidated |
|
| Revenues | | | | | |
| Freight | $ | — |
| $ | 4,524 |
| $ | 1,940 |
| $ | — |
| $ | 6,464 |
|
| Non-freight | — |
| 130 |
| 357 |
| (331 | ) | 156 |
|
| Total revenues | — |
| 4,654 |
| 2,297 |
| (331 | ) | 6,620 |
|
| Operating expenses |
|
|
|
|
|
|
|
|
|
|
| Compensation and benefits | — |
| 945 |
| 403 |
| — |
| 1,348 |
|
| Fuel | — |
| 779 |
| 269 |
| — |
| 1,048 |
|
| Materials | — |
| 156 |
| 37 |
| — |
| 193 |
|
| Equipment rents | — |
| 137 |
| 18 |
| — |
| 155 |
|
| Depreciation and amortization | — |
| 396 |
| 156 |
| — |
| 552 |
|
| Purchased services and other | — |
| 706 |
| 610 |
| (331 | ) | 985 |
|
| Total operating expenses | — |
| 3,119 |
| 1,493 |
| (331 | ) | 4,281 |
|
| Operating income | — |
| 1,535 |
| 804 |
| — |
| 2,339 |
|
| Less: |
|
|
|
|
|
|
|
|
|
|
| Other income and charges | 3 |
| 46 |
| (30 | ) | — |
| 19 |
|
| Net interest expense | — |
| 250 |
| 32 |
| — |
| 282 |
|
| (Loss) income before income tax expense and equity in net earnings of subsidiaries | (3 | ) | 1,239 |
| 802 |
| — |
| 2,038 |
|
Less: Income tax (recovery) expense
| (1 | ) | 320 |
| 243 |
| — |
| 562 |
|
| Add: Equity in net earnings of subsidiaries | $ | 1,478 |
| $ | 559 |
| $ | — |
| $ | (2,037 | ) | $ | — |
|
| Net income | $ | 1,476 |
| $ | 1,478 |
| $ | 559 |
| $ | (2,037 | ) | $ | 1,476 |
|
CONDENSED CONSOLIDATING STATEMENTS OF COMPREHENSIVE INCOME
YEAR ENDED DECEMBER 31, 2016
|
| | | | | | | | | | | | | | | |
| (in millions of Canadian dollars) | CPRL (Parent Guarantor) |
| CPRC (Subsidiary Issuer) |
| Non-Guarantor Subsidiaries |
| Consolidating Adjustments and Eliminations |
| CPRL Consolidated |
|
| Net income | $ | 1,599 |
| $ | 1,566 |
| $ | 532 |
| $ | (2,098 | ) | $ | 1,599 |
|
Net gain (loss) in foreign currency translation
adjustments, net of hedging activities | — |
| 149 |
| (131 | ) | — |
| 18 |
|
Change in derivatives designated as cash flow
hedges | — |
| (2 | ) | — |
| — |
| (2 | ) |
Change in pension and post-retirement defined
benefit plans | — |
| (443 | ) | 9 |
| — |
| (434 | ) |
Other comprehensive loss before
income taxes | — |
| (296 | ) | (122 | ) | — |
| (418 | ) |
Income tax recovery (expense) on above items
| — |
| 99 |
| (3 | ) | — |
| 96 |
|
Equity accounted investments
| (322 | ) | (125 | ) | — |
| 447 |
| — |
|
Other comprehensive loss
| (322 | ) | (322 | ) | (125 | ) | 447 |
| (322 | ) |
Comprehensive income
| $ | 1,277 |
| $ | 1,244 |
| $ | 407 |
| $ | (1,651 | ) | $ | 1,277 |
|
CONDENSED CONSOLIDATING STATEMENTS OF COMPREHENSIVE INCOME
YEAR ENDED DECEMBER 31, 2015
|
| | | | | | | | | | | | | | | |
| (in millions of Canadian dollars) | CPRL (Parent Guarantor) |
| CPRC (Subsidiary Issuer) |
| Non-Guarantor Subsidiaries |
| Consolidating Adjustments and Eliminations |
| CPRL Consolidated |
|
| Net income | $ | 1,352 |
| $ | 1,410 |
| $ | 765 |
| $ | (2,175 | ) | $ | 1,352 |
|
Net (loss) gain in foreign currency translation
adjustments, net of hedging activities | — |
| (757 | ) | 671 |
| — |
| (86 | ) |
Change in derivatives designated as cash flow
hedges | — |
| (69 | ) | — |
| — |
| (69 | ) |
Change in pension and post-retirement defined
benefit plans | — |
| 1,061 |
| (2 | ) | — |
| 1,059 |
|
Other comprehensive income before
income taxes | — |
| 235 |
| 669 |
| — |
| 904 |
|
Income tax (expense) recovery on above items
| — |
| (163 | ) | 1 |
| — |
| (162 | ) |
Equity accounted investments
| 742 |
| 670 |
| — |
| (1,412 | ) | — |
|
| Other comprehensive income | 742 |
| 742 |
| 670 |
| (1,412 | ) | 742 |
|
Comprehensive income
| $ | 2,094 |
| $ | 2,152 |
| $ | 1,435 |
| $ | (3,587 | ) | $ | 2,094 |
|
CONDENSED CONSOLIDATING STATEMENTS OF COMPREHENSIVE INCOME
YEAR ENDED DECEMBER 31, 2014
|
| | | | | | | | | | | | | | | |
| (in millions of Canadian dollars) | CPRL (Parent Guarantor) |
| CPRC (Subsidiary Issuer) |
| Non-Guarantor Subsidiaries |
| Consolidating Adjustments and Eliminations |
| CPRL Consolidated |
|
| Net income | $ | 1,476 |
| $ | 1,478 |
| $ | 559 |
| $ | (2,037 | ) | $ | 1,476 |
|
Net (loss) gain in foreign currency translation
adjustments, net of hedging activities | — |
| (316 | ) | 284 |
| — |
| (32 | ) |
Change in derivatives designated as cash flow
hedges | — |
| (49 | ) | — |
| — |
| (49 | ) |
Change in pension and post-retirement defined
benefit plans | — |
| (908 | ) | (33 | ) | — |
| (941 | ) |
Other comprehensive (loss) income before
income taxes | — |
| (1,273 | ) | 251 |
| — |
| (1,022 | ) |
Income tax recovery on above items
| — |
| 293 |
| 13 |
| — |
| 306 |
|
Equity accounted investments
| (716 | ) | 264 |
| — |
| 452 |
| — |
|
Other comprehensive (loss) income
| (716 | ) | (716 | ) | 264 |
| 452 |
| (716 | ) |
Comprehensive income
| $ | 760 |
| $ | 762 |
| $ | 823 |
| $ | (1,585 | ) | $ | 760 |
|
CONDENSED CONSOLIDATING BALANCE SHEETS
AS AT DECEMBER 31, 2016
|
| | | | | | | | | | | | | | | |
| (in millions of Canadian dollars) | CPRL (Parent Guarantor) |
| CPRC (Subsidiary Issuer) |
| Non-Guarantor Subsidiaries |
| Consolidating Adjustments and Eliminations |
| CPRL Consolidated |
|
| Assets | | | | | |
| Current assets | | | | | |
| Cash and cash equivalents | $ | — |
| $ | 100 |
| $ | 64 |
| $ | — |
| $ | 164 |
|
| Accounts receivable, net | — |
| 435 |
| 156 |
| — |
| 591 |
|
| Accounts receivable, intercompany | 90 |
| 113 |
| 206 |
| (409 | ) | — |
|
| Short-term advances to affiliates | 500 |
| 692 |
| 4,035 |
| (5,227 | ) | — |
|
| Materials and supplies | — |
| 150 |
| 34 |
| — |
| 184 |
|
| Other current assets | — |
| 38 |
| 32 |
| — |
| 70 |
|
| | 590 |
| 1,528 |
| 4,527 |
| (5,636 | ) | 1,009 |
|
| Long-term advances to affiliates | 1 |
| — |
| 91 |
| (92 | ) | — |
|
| Investments | — |
| 47 |
| 147 |
| — |
| 194 |
|
| Investments in subsidiaries | 8,513 |
| 10,249 |
| — |
| (18,762 | ) | — |
|
| Properties | — |
| 8,756 |
| 7,933 |
| — |
| 16,689 |
|
| Goodwill and intangible assets | — |
| — |
| 202 |
| — |
| 202 |
|
| Pension asset | — |
| 1,070 |
| — |
| — |
| 1,070 |
|
| Other assets | 1 |
| 48 |
| 8 |
| — |
| 57 |
|
| Deferred income taxes | 11 |
| — |
| — |
| (11 | ) | — |
|
| Total assets | $ | 9,116 |
| $ | 21,698 |
| $ | 12,908 |
| $ | (24,501 | ) | $ | 19,221 |
|
| Liabilities and shareholders’ equity |
|
|
|
|
|
|
|
|
|
|
| Current liabilities |
|
|
|
|
|
|
|
|
|
|
| Accounts payable and accrued liabilities | $ | 73 |
| $ | 945 |
| $ | 304 |
| $ | — |
| $ | 1,322 |
|
| Accounts payable, intercompany | 14 |
| 292 |
| 103 |
| (409 | ) | — |
|
| Short-term advances from affiliates | 4,403 |
| 816 |
| 8 |
| (5,227 | ) | — |
|
| Long-term debt maturing within one year | — |
| 25 |
| — |
| — |
| 25 |
|
| | 4,490 |
| 2,078 |
| 415 |
| (5,636 | ) | 1,347 |
|
| Pension and other benefit liabilities | — |
| 658 |
| 76 |
| — |
| 734 |
|
| Long-term advances from affiliates | — |
| 92 |
| — |
| (92 | ) | — |
|
| Other long-term liabilities | — |
| 152 |
| 132 |
| — |
| 284 |
|
| Long-term debt | — |
| 8,605 |
| 54 |
| — |
| 8,659 |
|
| Deferred income taxes | — |
| 1,600 |
| 1,982 |
| (11 | ) | 3,571 |
|
| Total liabilities | 4,490 |
| 13,185 |
| 2,659 |
| (5,739 | ) | 14,595 |
|
| Shareholders’ equity |
|
|
|
|
|
|
|
|
|
|
| Share capital | 2,002 |
| 1,037 |
| 5,823 |
| (6,860 | ) | 2,002 |
|
| Additional paid-in capital | 52 |
| 1,638 |
| 298 |
| (1,936 | ) | 52 |
|
| Accumulated other comprehensive (loss) income | (1,799 | ) | (1,799 | ) | 712 |
| 1,087 |
| (1,799 | ) |
| Retained earnings | 4,371 |
| 7,637 |
| 3,416 |
| (11,053 | ) | 4,371 |
|
| | 4,626 |
| 8,513 |
| 10,249 |
| (18,762 | ) | 4,626 |
|
| Total liabilities and shareholders’ equity | $ | 9,116 |
| $ | 21,698 |
| $ | 12,908 |
| $ | (24,501 | ) | $ | 19,221 |
|
CONDENSED CONSOLIDATING BALANCE SHEETS
AS AT DECEMBER 31, 2015
|
| | | | | | | | | | | | | | | |
| (in millions of Canadian dollars) | CPRL (Parent Guarantor) |
| CPRC (Subsidiary Issuer) |
| Non-Guarantor Subsidiaries |
| Consolidating Adjustments and Eliminations |
| CPRL Consolidated |
|
| Assets | | | | | |
| Current assets | | | | | |
| Cash and cash equivalents | $ | — |
| $ | 502 |
| $ | 148 |
| $ | — |
| $ | 650 |
|
| Accounts receivable, net | — |
| 452 |
| 193 |
| — |
| 645 |
|
| Accounts receivable, intercompany | 59 |
| 105 |
| 265 |
| (429 | ) | — |
|
Short-term advances to affiliates
| — |
| 75 |
| 3,483 |
| (3,558 | ) | — |
|
| Materials and supplies | — |
| 154 |
| 34 |
| — |
| 188 |
|
| Other current assets | — |
| 37 |
| 17 |
| — |
| 54 |
|
| 59 |
| 1,325 |
| 4,140 |
| (3,987 | ) | 1,537 |
|
| Long-term advances to affiliates | 501 |
| 207 |
| 376 |
| (1,084 | ) | — |
|
| Investments | — |
| 22 |
| 130 |
| — |
| 152 |
|
| Investments in subsidiaries | 7,518 |
| 9,832 |
| — |
| (17,350 | ) | — |
|
| Properties | — |
| 8,481 |
| 7,792 |
| — |
| 16,273 |
|
| Goodwill and intangible assets | — |
| 3 |
| 208 |
| — |
| 211 |
|
| Pension asset | — |
| 1,401 |
| — |
| — |
| 1,401 |
|
| Other assets | — |
| 55 |
| 8 |
| — |
| 63 |
|
| Deferred income taxes | 25 |
| — |
| — |
| (25 | ) | — |
|
| Total assets | $ | 8,103 |
| $ | 21,326 |
| $ | 12,654 |
| $ | (22,446 | ) | $ | 19,637 |
|
| Liabilities and shareholders’ equity |
|
|
|
|
|
|
|
|
|
|
| Current liabilities |
|
|
|
|
|
|
|
|
|
|
| Accounts payable and accrued liabilities | $ | 54 |
| $ | 1,122 |
| $ | 241 |
| $ | — |
| $ | 1,417 |
|
| Accounts payable, intercompany | — |
| 325 |
| 104 |
| (429 | ) | — |
|
| Short-term advances from affiliates | 3,253 |
| 230 |
| 75 |
| (3,558 | ) | — |
|
| Long-term debt maturing within one year | — |
| 24 |
| 6 |
| — |
| 30 |
|
| 3,307 |
| 1,701 |
| 426 |
| (3,987 | ) | 1,447 |
|
| Pension and other benefit liabilities | — |
| 676 |
| 82 |
| — |
| 758 |
|
| Long-term advances from affiliates | — |
| 877 |
| 207 |
| (1,084 | ) | — |
|
| Other long-term liabilities | — |
| 186 |
| 132 |
| — |
| 318 |
|
| Long-term debt | — |
| 8,863 |
| 64 |
| — |
| 8,927 |
|
| Deferred income taxes | — |
| 1,505 |
| 1,911 |
| (25 | ) | 3,391 |
|
| Total liabilities | 3,307 |
| 13,808 |
| 2,822 |
| (5,096 | ) | 14,841 |
|
| Shareholders’ equity |
|
|
|
|
|
|
|
|
|
|
| Share capital | 2,058 |
| 1,037 |
| 5,465 |
| (6,502 | ) | 2,058 |
|
| Additional paid-in capital | 43 |
| 1,568 |
| 613 |
| (2,181 | ) | 43 |
|
| Accumulated other comprehensive (loss) income | (1,477 | ) | (1,477 | ) | 840 |
| 637 |
| (1,477 | ) |
| Retained earnings | 4,172 |
| 6,390 |
| 2,914 |
| (9,304 | ) | 4,172 |
|
| 4,796 |
| 7,518 |
| 9,832 |
| (17,350 | ) | 4,796 |
|
| Total liabilities and shareholders’ equity | $ | 8,103 |
| $ | 21,326 |
| $ | 12,654 |
| $ | (22,446 | ) | $ | 19,637 |
|
CONDENSED CONSOLIDATING STATEMENTS OF CASH FLOWS
YEAR ENDED DECEMBER 31, 2016
|
| | | | | | | | | | | | | | | |
| (in millions of Canadian dollars) | CPRL (Parent Guarantor) |
| CPRC (Subsidiary Issuer) |
| Non-Guarantor Subsidiaries |
| Consolidating Adjustments and Eliminations |
| CPRL Consolidated |
|
Cash provided by operating activities
| $ | 255 |
| $ | 1,424 |
| $ | 879 |
| $ | (469 | ) | $ | 2,089 |
|
| Investing activities |
|
|
|
|
|
|
|
|
|
|
| Additions to properties | — |
| (728 | ) | (454 | ) | — |
| (1,182 | ) |
| Proceeds from sale of properties and other assets | — |
| 102 |
| 14 |
| — |
| 116 |
|
| Advances to affiliates | — |
| (664 | ) | (539 | ) | 1,203 |
| — |
|
| Repayment of advances to affiliates | — |
| 222 |
| — |
| (222 | ) | — |
|
| Capital contributions to affiliates | — |
| (472 | ) | — |
| 472 |
| — |
|
| Repurchase of share capital from affiliates | — |
| 8 |
| — |
| (8 | ) | — |
|
| Other | — |
| — |
| (3 | ) | — |
| (3 | ) |
| Cash used in investing activities | — |
| (1,532 | ) | (982 | ) | 1,445 |
| (1,069 | ) |
| Financing activities |
|
|
|
|
|
|
|
|
|
|
| Dividends paid | (255 | ) | (255 | ) | (214 | ) | 469 |
| (255 | ) |
| Issuance of share capital | — |
| — |
| 472 |
| (472 | ) | — |
|
| Return of share capital to affiliates | — |
| — |
| (8 | ) | 8 |
| — |
|
| Issuance of CP Common Shares | 21 |
| — |
| — |
| — |
| 21 |
|
| Purchase of CP Common Shares | (1,210 | ) | — |
| — |
| — |
| (1,210 | ) |
| Repayment of long-term debt, excluding commercial paper | — |
| (24 | ) | (14 | ) | — |
| (38 | ) |
| Net repayment of commercial paper | — |
| (8 | ) | — |
| — |
| (8 | ) |
| Advances from affiliates | 1,189 |
| — |
| 14 |
| (1,203 | ) | — |
|
| Repayment of advances from affiliates | — |
| — |
| (222 | ) | 222 |
| — |
|
| Other | — |
| (3 | ) | — |
| — |
| (3 | ) |
| Cash (used in) provided by financing activities | (255 | ) | (290 | ) | 28 |
| (976 | ) | (1,493 | ) |
| Effect of foreign currency fluctuations on U.S. dollar-denominated cash and cash equivalents | — |
| (4 | ) | (9 | ) | — |
| (13 | ) |
| Cash position |
|
|
|
|
|
|
|
|
|
|
| Decrease in cash and cash equivalents | — |
| (402 | ) | (84 | ) | — |
| (486 | ) |
| Cash and cash equivalents at beginning of year | — |
| 502 |
| 148 |
| — |
| 650 |
|
| Cash and cash equivalents at end of year | $ | — |
| $ | 100 |
| $ | 64 |
| $ | — |
| $ | 164 |
|
CONDENSED CONSOLIDATING STATEMENTS OF CASH FLOWS
YEAR ENDED DECEMBER 31, 2015
|
| | | | | | | | | | | | | | | |
| (in millions of Canadian dollars) | CPRL (Parent Guarantor) |
| CPRC (Subsidiary Issuer) |
| Non-Guarantor Subsidiaries |
| Consolidating Adjustments and Eliminations |
| CPRL Consolidated |
|
Cash provided by operating activities
| $ | 2,283 |
| $ | 1,650 |
| $ | 1,074 |
| $ | (2,548 | ) | $ | 2,459 |
|
| Investing activities |
|
|
|
|
|
|
|
|
|
|
| Additions to properties | — |
| (766 | ) | (756 | ) | — |
| (1,522 | ) |
| Proceeds from the sale of Delaware & Hudson South | — |
| — |
| 281 |
| — |
| 281 |
|
| Proceeds from sale of properties and other assets | — |
| 103 |
| 11 |
| — |
| 114 |
|
| Advances to affiliates | (1,133 | ) | (311 | ) | (1,820 | ) | 3,264 |
| — |
|
| Repayment of advances to affiliates | — |
| 804 |
| 1,000 |
| (1,804 | ) | — |
|
| Capital contributions to affiliates | — |
| (1,655 | ) | — |
| 1,655 |
| — |
|
| Repurchase of share capital from affiliates | — |
| 1,210 |
| — |
| (1,210 | ) | — |
|
| Other | — |
| 6 |
| (2 | ) | — |
| 4 |
|
| Cash used in investing activities | (1,133 | ) | (609 | ) | (1,286 | ) | 1,905 |
| (1,123 | ) |
| Financing activities |
|
|
|
|
|
|
|
|
|
|
| Dividends paid | (226 | ) | (2,272 | ) | (276 | ) | 2,548 |
| (226 | ) |
| Issuance of share capital | — |
| — |
| 1,655 |
| (1,655 | ) | — |
|
| Return of share capital to affiliates | — |
| — |
| (1,210 | ) | 1,210 |
| — |
|
| Issuance of CP Common Shares | 43 |
| — |
| — |
| — |
| 43 |
|
| Purchase of CP Common Shares | (2,787 | ) | — |
| — |
| — |
| (2,787 | ) |
| Issuance of long-term debt, excluding commercial paper | — |
| 3,411 |
| — |
| — |
| 3,411 |
|
| Repayment of long-term debt, excluding commercial paper | — |
| (461 | ) | (44 | ) | — |
| (505 | ) |
| Net repayment of commercial paper | — |
| (893 | ) | — |
| — |
| (893 | ) |
| Advances from affiliates | 1,820 |
| 500 |
| 944 |
| (3,264 | ) | — |
|
| Repayment of advances from affiliates | — |
| (1,000 | ) | (804 | ) | 1,804 |
| — |
|
| Cash (used in) provided by financing activities | (1,150 | ) | (715 | ) | 265 |
| 643 |
| (957 | ) |
| Effect of foreign currency fluctuations on U.S. dollar-denominated cash and cash equivalents | — |
| 24 |
| 21 |
| — |
| 45 |
|
| Cash position |
|
|
|
|
|
|
|
|
|
|
| Increase in cash and cash equivalents | — |
| 350 |
| 74 |
| — |
| 424 |
|
| Cash and cash equivalents at beginning of year | — |
| 152 |
| 74 |
| — |
| 226 |
|
| Cash and cash equivalents at end of year | $ | — |
| $ | 502 |
| $ | 148 |
| $ | — |
| $ | 650 |
|
CONDENSED CONSOLIDATING STATEMENTS OF CASH FLOWS
YEAR ENDED DECEMBER 31, 2014
|
| | | | | | | | | | | | | | | |
| (in millions of Canadian dollars) | CPRL (Parent Guarantor) |
| CPRC (Subsidiary Issuer) |
| Non-Guarantor Subsidiaries |
| Consolidating Adjustments and Eliminations |
| CPRL Consolidated |
|
Cash provided by operating activities
| $ | 183 |
| $ | 1,684 |
| $ | 604 |
| $ | (348 | ) | $ | 2,123 |
|
| Investing activities |
|
|
|
|
|
|
|
|
|
|
| Additions to properties | — |
| (816 | ) | (702 | ) | 69 |
| (1,449 | ) |
| Proceeds from the sale of west end of Dakota, Minnesota and Eastern Railroad | — |
| — |
| 236 |
| — |
| 236 |
|
| Proceeds from sale of properties and other assets | — |
| 116 |
| 5 |
| (69 | ) | 52 |
|
| Advances to affiliates | — |
| (611 | ) | (2,636 | ) | 3,247 |
| — |
|
| Repayment of advances to affiliates | — |
| 2,167 |
| 1,592 |
| (3,759 | ) | — |
|
| Capital contributions to affiliates | — |
| (2,927 | ) | — |
| 2,927 |
| — |
|
| Other | — |
| 2 |
| (2 | ) | — |
| — |
|
Cash used in investing activities(1) | — |
| (2,069 | ) | (1,507 | ) | 2,415 |
| (1,161 | ) |
| Financing activities |
|
|
|
|
|
|
|
|
|
|
| Dividends paid | (244 | ) | (182 | ) | (166 | ) | 348 |
| (244 | ) |
| Issuance of share capital | — |
| — |
| 2,927 |
| (2,927 | ) | — |
|
| Issuance of CP Common Shares | 62 |
| — |
| — |
| — |
| 62 |
|
| Purchase of CP Common Shares | (2,050 | ) | — |
| — |
| — |
| (2,050 | ) |
| Repayment of long-term debt, excluding commercial paper | — |
| (174 | ) | (9 | ) | — |
| (183 | ) |
| Net issuance of commercial paper | — |
| 771 |
| — |
| — |
| 771 |
|
| Settlement of foreign exchange forward on long-term debt | — |
| 17 |
| — |
| — |
| 17 |
|
| Advances from affiliates | 2,049 |
| 1,198 |
| — |
| (3,247 | ) | — |
|
| Repayment of advances from affiliates | — |
| (1,592 | ) | (2,167 | ) | 3,759 |
| — |
|
| Other | — |
| — |
| (3 | ) | — |
| (3 | ) |
| Cash (used in) provided by financing activities | (183 | ) | 38 |
| 582 |
| (2,067 | ) | (1,630 | ) |
| Effect of foreign currency fluctuations on U.S. dollar-denominated cash and cash equivalents | — |
| (3 | ) | 10 |
| — |
| 7 |
|
| Cash position |
|
|
|
|
|
|
|
|
|
|
Decrease in cash, cash equivalents, and restricted cash(1) | — |
| (350 | ) | (311 | ) | — |
| (661 | ) |
Cash, cash equivalents, and restricted cash at beginning of year(1) | — |
| 502 |
| 385 |
| — |
| 887 |
|
Cash, cash equivalents, and restricted cash at end of year(1) | $ | — |
| $ | 152 |
| $ | 74 |
| $ | — |
| $ | 226 |
|
(1)Certain figures have been reclassified due to a retrospective change in accounting policy (Note 2).
ITEM 9. CHANGES IN AND DISAGREEMENTS WITH ACCOUNTANTS ON ACCOUNTING AND FINANCIAL DISCLOSURE
None.
ITEM 9A. CONTROLS AND PROCEDURES
Evaluation of Disclosure Controls and Procedures
As of December 31, 2016, an evaluation was carried out under the supervision of and with the participation of CP's management, including CEO and CFO, of the effectiveness of the design and operation of the Company's disclosure controls and procedures as defined in Rules 13a-15(e) and 15d-15(e) of the Exchange Act. Based on that evaluation, the CEO and CFO concluded that these disclosure controls and procedures were effective as of December 31, 2016, to ensure that information required to be disclosed by the Company in reports that they file or submit under the Exchange Act is (i) recorded, processed, summarized and reported within the time periods specified by the SEC rules and forms and (ii) accumulated and communicated to the Company’s management, including the CEO and CFO, as appropriate, to allow timely decisions regarding required disclosure.
Management's Report on Internal Control over Financial Reporting
Management is responsible for the financial statements and for establishing and maintaining adequate internal control over financial reporting for the Company as defined in Rules 13a-15(f) and 15d-15(f) of the Exchange Act. The Corporation’s internal control system was designed to provide reasonable assurance to the Corporation’s management and Board of Directors regarding the preparation and fair presentation of published financial statements.Due to its inherent limitations, internal control over financial reporting may not prevent or detect misstatements. Also, projections of any evaluation of effectiveness to future periods are subject to the risk that controls may become inadequate because of changes in conditions, or that the degree of compliance with the policies or procedures may deteriorate.
Management has assessed the effectiveness of the Company’s internal control over financial reporting in accordance with the criteria set forth by the Committee of Sponsoring Organizations of the Treadway Commission in “Internal Control – Integrated Framework (2013)”. Based on this assessment, management concluded that the Company maintained effective internal control over financial reporting as of December 31, 2016. All internal control systems, no matter how well designed, have inherent limitations. Therefore, even those systems determined to be effective can provide only reasonable assurance with respect to the reliability of financial reporting and preparation of financial statements in accordance with generally accepted accounting principles.
The effectiveness of the Company's internal control over financial reporting as of December 31, 2016 has been audited by Deloitte LLP, the Company's independent registered public accounting firm, as stated in their report, which is included herein.
Changes in Internal Control over Financial Reporting
During the three months ended December 31, 2016, the Company has not identified any changes in internal control over financial reporting that have materially affected, or are reasonably likely to materially affect, our internal control over financial reporting.
Report of Independent Registered Public Accounting Firm
To the Board of Directors and the Shareholders of Canadian Pacific Railway Limited:
We have audited the internal control over financial reporting of Canadian Pacific Railway Limited and subsidiaries (the "Company") as of December 31, 2016,director independence based on the criteria established in Internal Control-Integrated Framework (2013) issued by the Committee of Sponsoring Organizations of the Treadway Commission. The Company's management is responsible for maintaining effective internal control over financial reportingNYSE, SEC and for itsCSA.It reviews director independence continually and annually using director questionnaires as well as by reviewing updated biographical information, meeting with directors individually, and conducting a comprehensive assessment of all business and other relationships and interests of each director with respect to CP and our subsidiaries. In 2018, the effectiveness of internal control over financial reporting, included in the accompanying Management’s Report on Internal Control over Financial Reporting. Our responsibilityBoard determined that each director, except for Mr. Creel, is to express an opinion on the Company's internal control over financial reporting based on our audit.
We conducted our auditindependent in accordance with the standards
for independence established by the NYSE and NI58-101 Disclosure of Corporate Governance Practices. Mr. Creel is not independent because of his position as President and Chief Executive Officer of CP.The Board has also determined that each member of the Public Company Accounting Oversight Board (United States). ThoseAudit Committee meets the additional independence standards require that we planfor audit committee members under Section 10A(m)(3) and perform the audit to obtain reasonable assurance about whether effective internal control over financial reporting was maintained in all material respects. Our audit included obtaining an understanding of internal control over financial reporting, assessing the risk that a material weakness exists, testing and evaluating the design and operating effectiveness of internal control based on the assessed risk, and performing such other procedures as we considered necessary in the circumstances. We believe that our audit provides a reasonable basis for our opinion.
A company's internal control over financial reporting is a process designed by, or under the supervisionRule10A-3(b)(1) of the
company's principal executiveExchange Act, and
principal financial officers, or persons performing similar functions,Section 1.5 of NI52-110 Audit Committees.| ITEM 14. | PRINCIPAL ACCOUNTING FEES AND SERVICES |
The table below shows the fees we paid to Deloitte in 2018 and effected2017 for audit andnon-audit services.
| | | | | | | | |
For the year ended December 31 | | 2018 | | | 2017 | |
Audit fees for audit of our annual financial statements, reviews of quarterly reports and services relating to statutory and regulatory filings or engagements (including attestation services and audit or interim review of financial statements of certain subsidiaries and certain pension and benefits plans, and advice on accounting and/or disclosure matters) | | $ | 3,800,200 | | | $ | 3,834,100 | |
| | | | | | | | |
| | |
Audit-related fees for assurance and services related to the audit but not included in the audit fees above, including securities filings | | $ | 138,800 | | | $ | 21,000 | (1) |
| | | | | | | | |
| | |
Tax fees for services relating to tax compliance, tax planning and tax advice and access fees for taxation database resources | | $ | 121,000 | | | $ | 153,100 | |
| | | | | | | | |
| | |
All other fees for services provided relating to CP’s corporate sustainability report and accounting training | | $ | 54,000 | (1) | | $ | 34,600 | |
| | | | | | | | |
Total | | $ | 4,114,100 | | | $ | 4,021,800 | |
| | | | | | | | |
NOTE:
| (1) | In 2017, accounting training was presented under the heading, Audit-related fees. In 2018, accounting training is presented under the heading, All other fees. |
54
Pre-approval of audit services and fees
The Audit Committee has a written policy forpre-approving audit andnon-audit services by the company's board of directors, management,independent auditor and other personnel to provide reasonable assurance regarding the reliability of financial reporting and the preparation of financial statements for external purposes in accordance with generally accepted accounting principles. A company's internal control over financial reporting includes those policies and procedures that (1) pertain to the maintenance of records that, in reasonable detail, accurately and fairly reflect the transactions and dispositions of the assets of the company; (2) provide reasonable assurance that transactions are recorded as necessary to permit preparation of financial statements in accordance with generally accepted accounting principles, and that receipts and expenditures of the company are being made only in accordance with authorizations of management and directors of the company; and (3) provide reasonable assurance regarding prevention or timely detection of unauthorized acquisition, use, or disposition of the company's assets that could have a material effect on the financial statements.
Because of the inherent limitations of internal control over financial reporting, including the possibility of collusion or improper management override of controls, material misstatements due to error or fraud may not be prevented or detected on a timely basis. Also, projections of any evaluation of the effectiveness of the internal control over financial reporting to future periods are subject to the risk that the controls may become inadequate because of changes in conditions, or that the degree of compliance with the policies or procedures may deteriorate.
In our opinion, the Company maintained, in all material respects, effective internal control over financial reporting as of December 31, 2016, based on the criteria established in Internal Control - Integrated Framework (2013) issued by the Committee of Sponsoring Organizations of the Treadway Commission.
We have also audited,their fees, in accordance with the
standardslaws and requirements of stock exchanges and securities regulatory authorities.The policy sets out the following governance procedures:
the Audit Committeepre-approves the terms of the Public Company Accounting Oversightannual engagement of the external auditor
the Board (United States),pre-approves the consolidated financial statements and financial statement schedule as of andfees for the year ended December 31, 2016 ofannual engagement and budgeted amounts for the Companyaudit and our report dated February 16, 2017 expressed an unqualified opinion on those financial statementsthe Audit Committeepre-approves the fees fornon-audit services at least annually
the Vice-President, Financial Planning and financial statement schedule.
/s/ Deloitte LLP
Chartered Professional Accountants
February 16, 2017
Calgary, Canada
ITEM 9B. OTHER INFORMATION
None.
PART III
ITEM 10. DIRECTORS, EXECUTIVE OFFICERS AND CORPORATE GOVERNANCE
In accordance with Instruction G(3) of Form 10-K, the information required by this item is incorporated herein by referenceAccounting submits reports at least quarterly to the Company's definitive Proxy Statement which willAudit Committee listing the services that were performed or planned to be filed withperformed by the SECexternal auditor
any additionalnon-audit services to be provided by the external auditor that were not later than April 30, 2017 (the “Proxy Statement”).
Directors of Registrant
The information regarding directors is included in the Nominees for Election tolist ofpre-approved services or exceed the Board section of the Proxy Statement and is incorporated hereinbudgeted amount by reference.
more than 10% must each beThe information regardingpre-approved by the Audit Committee is included inor the Statement of Corporate Governance sectioncommittee chair. The committee chair must report any additionalpre-approvals at the next committee meeting
the Audit Committee reviews the policy as necessary to make sure it continues to reflect our needs
our chief internal auditor monitors compliance with the policy.
The Audit Committee or committee chair must be satisfied that any services itpre-approves will not compromise the independence of the Proxy Statement and is incorporated hereinexternal auditor. The committeepre-approved all services performed by reference.
Executive Officers of Registrant
The information regarding executive officers is includedthe external auditor in
2018, in accordance with the policy.55
PART IV
| ITEM 15. | EXHIBITS, FINANCIAL STATEMENT SCHEDULE |
Part I of this report under Executive OfficersIV (Item 15) of the Registrant,2018 Form10-K is hereby amended solely to add the following Item 4. Mine Safety Disclosures.
Complianceexhibits required to be filed in connection with Section 16(a) of the Exchange Act
The information regarding the compliance with Section 16(a) of the Securities Exchange Act of 1934 is included in Section 16(a) Beneficial Ownership Reporting Compliance section of the Proxy Statement and is incorporated herein by reference.
Code of Ethics for Chief Executive Officer and Senior Financial Officers
The Board of Directors of CP has adopted the Code of Ethics for the Chief Executive Officer and Senior Financial Officers, which is accessible through CP's website at http://www.cpr.ca/en/about-cp/corporate-governance. All amendments to the code, and all waivers of the code with respect to any of the officers covered by it, will be posted on CP’s website and provided in print to any person who requests them.
ITEM 11. EXECUTIVE COMPENSATION
In accordance with Instruction G(3) of Form 10-K, the information required by this item regarding executive compensation is included in the Statement of Executive Compensation section of the Proxy Statement and is incorporated herein by reference (see Item 10 above).
The information regarding the Compensation Committee is included in the Report of the Management Resources and Compensation Committee section of the Proxy Statement and is incorporated herein by reference (see Item 10 above).
ITEM 12. SECURITY OWNERSHIP OF CERTAIN BENEFICIAL OWNERS AND MANAGEMENT AND RELATED STOCKHOLDER MATTERS
In accordance with Instruction G(3) of Form 10-K, the information required by this item is included in the Management Stock Option Incentive Plan section and the Security Ownership of Certain Beneficial Owners and Management section of the Proxy Statement and is incorporated herein by reference (see Item 10 above).
ITEM 13. CERTAIN RELATIONSHIPS AND RELATED TRANSACTIONS, AND DIRECTOR INDEPENDENCE
In accordance with Instruction G(3) of Form 10-K, the information required by this item regarding director independence and transactions with related persons is included in the Statement of Corporate Governance section and the Nominees for Election to the Board section of the Proxy Statement, which is incorporated herein by reference (see Item 10 above).
ITEM 14. PRINCIPAL ACCOUNTING FEES AND SERVICES
In accordance with Instruction G(3) of Form 10-K, the information required by this item regarding the fees billed by the independent registered public accounting firm and the nature of services comprising the fees is included in the Statement of Corporate Governance section of the Proxy Statement (see Item 10 above).
PART IV
ITEM 15. EXHIBITS, FINANCIAL STATEMENT SCHEDULE
The following documents are filed as part of this report:
Amendment No. 1.
The financial statements filed as part of this filing are listed on the Index to Consolidated Financial Statements in Item 8. Financial Statements and Supplementary Data.
| |
| (b) | Financial Statement ScheduleExhibits |
Schedule II – Valuation and Qualifying Accounts
|
| | | | | | | | | | | | | | | |
| (in millions of Canadian dollars) | Beginning balance at January 1 |
| Additions charged to expenses |
| Payments and other reductions |
| Impact of FX |
| Ending
balance at December 31 |
|
Accruals for legal, personal injury and casualty-related claims(1) |
| 2014 | $ | 153 |
| $ | 32 |
| $ | (38 | ) | $ | 3 |
| $ | 150 |
|
| 2015 | $ | 150 |
| $ | 79 |
| $ | (102 | ) | $ | 6 |
| $ | 133 |
|
| 2016 | $ | 133 |
| $ | 67 |
| $ | (71 | ) | $ | 1 |
| $ | 130 |
|
| Environmental liabilities |
| 2014 | $ | 90 |
| $ | 4 |
| $ | (9 | ) | $ | 6 |
| $ | 91 |
|
| 2015 | $ | 91 |
| $ | 7 |
| $ | (17 | ) | $ | 12 |
| $ | 93 |
|
| 2016 | $ | 93 |
| $ | 6 |
| $ | (12 | ) | $ | (2 | ) | $ | 85 |
|
(1) Includes WCB, FELA, occupational, foreign car damage and property & lading damage claims.
Exhibits are listed in the exhibit index below. The exhibits include management contracts, compensatory plans and arrangements required to be filed as exhibits to the Form 10-K by Item 601 (10) (iii) of Regulation S-K.
| | |
Exhibit | | Description |
| |
Exhibit31.1* | Description |
3 | Articles of incorporation and Bylaws: |
3.1 | Restated Certificate and Articles of Incorporation of Canadian Pacific Railway Limited (incorporated by referenceCEO Rule13a-14(a) Certifications relating to Exhibit 99.2 to Canadian Pacific Railway Limited’s Form 6-K filed with the Securities and Exchange Commission on October 22, 2015, File No. 001-01342). |
3.2 | By-lawthis Amendment No. 1 as amended, of Canadian Pacific Railway Limited (incorporated by reference to Exhibit 1 to Canadian Pacific Railway Limited’son Form 6-K filed with the Securities and Exchange Commission on May 22, 2009, File No. 001-01342). |
3.3 | By-law No. 2 of Canadian Pacific Railway Limited (incorporated by reference to Exhibit 99.1 to Canadian Pacific Railway Limited’s Form 6-K filed with the Securities and Exchange Commission on March 13, 2015, File No. 001-01342). |
3.4 | General By-law, as amended, of Canadian Pacific Railway Company, a wholly owned subsidiary of Canadian Pacific Railway Limited (incorporated by reference to Exhibit 2 to Canadian Pacific Railway Limited’s Form 6-K filed with the Securities and Exchange Commission on May 22, 2009, File No. 001-01342). |
4 | Instruments Defining the Rights of Security Holders, Including Indentures: |
4.1 | Indenture dated as of May 8, 2007 between Canadian Pacific Railway Company and The Bank of New York Mellon (incorporated by reference to Exhibit 4.1 to Canadian Pacific Railway Limited’s Form 10-K filed with the Securities and Exchange Commission on February 29, 2016, File No. 001-01342). |
4.2 | First Supplemental Indenture dated as of May 8, 2007 between Canadian Pacific Railway Company and The Bank of New York Mellon (incorporated by reference to Exhibit 4.2 to Canadian Pacific Railway Limited’s Form 10-K filed with the Securities and Exchange Commission on February 29, 2016, File No. 001-01342). |
4.3 | Second Supplemental Indenture dated as of May 20, 2008 between Canadian Pacific Railway Company and The Bank of New York Mellon (incorporated by reference to Exhibit 4.3 to Canadian Pacific Railway Limited’s Form 10-K filed with the Securities and Exchange Commission on February 29, 2016, File No. 001-01342). |
| 10-K/A |
| |
4.431.2* | Third Supplemental Indenture dated as of May 15, 2009 between Canadian Pacific Railway Company and The Bank of New York Mellon (incorporated by reference | CFO Rule13a-14(a) Certifications relating to Exhibit 4.4 to Canadian Pacific Railway Limited’s Form 10-K filed with the Securities and Exchange Commission on February 29, 2016, Filethis Amendment No. 001-01342). |
4.5 | Fourth Supplemental Indenture dated as of September 23, 2010 between Canadian Pacific Railway Company and The Bank of New York Mellon (incorporated by reference to Exhibit 4.5 to Canadian Pacific Railway Limited’s Form 10-K filed with the Securities and Exchange Commission on February 29, 2016, File No. 001-01342). |
4.6 | Fifth Supplemental Indenture dated as of December 1 2011 between Canadian Pacific Railway Company and The Bank of New York Mellon (incorporated by reference to Exhibit 4.6 to Canadian Pacific Railway Limited’s Form 10-K filed with the Securities and Exchange Commission on February 29, 2016, File No. 001-01342). |
4.7 | Sixth Supplemental Indenture dated as of February 2, 2015 between Canadian Pacific Railway Company and The Bank of New York Mellon (incorporated by reference to Exhibit 4.7 to Canadian Pacific Railway Limited’s Form 10-K filed with the Securities and Exchange Commission on February 29, 2016, File No. 001-01342). |
4.8 | Seventh Supplemental Indenture dated as of August 3, 2015 between Canadian Pacific Railway Company and The Bank of New York Mellon (incorporated by reference to Exhibit 4.8 to Canadian Pacific Railway Limited’s Form 10-K filed with the Securities and Exchange Commission on February 29, 2016, File No. 001-01342). |
4.9 | Eighth Supplemental Indenture dated as of November 24, 2015 among Canadian Pacific Railway Limited, Canadian Pacific Railway Company and The Bank of New York Mellon (incorporated by reference to Exhibit 4.9 to Canadian Pacific Railway Limited’s Form 10-K filed with the Securities and Exchange Commission on February 29, 2016, File No. 001-01342). |
4.10 | Indenture dated as of October 30, 2001 between Canadian Pacific Railway Company and The Bank of New York Mellon (incorporated by reference to Exhibit 4.10 to Canadian Pacific Railway Limited’s Form 10-K filed with the Securities and Exchange Commission on February 29, 2016, File No. 001-01342). |
4.11 | First Supplemental Indenture dated as of April 23, 2004 between Canadian Pacific Railway Company and The Bank of New York Mellon (incorporated by reference to Exhibit 4.11 to Canadian Pacific Railway Limited’s Form 10-K filed with the Securities and Exchange Commission on February 29, 2016, File No. 001-01342). |
4.12 | Second Supplemental Indenture dated as of October 12, 2011 between Canadian Pacific Railway Limited and The Bank of New York Mellon (incorporated by reference to Exhibit 4.12 to Canadian Pacific Railway Limited’s Form 10-K filed with the Securities and Exchange Commission on February 29, 2016, File No. 001-01342). |
4.13 | Third Supplemental Indenture dated as of October 13, 2011 between Canadian Pacific Railway Company and The Bank of New York Mellon (incorporated by reference to Exhibit 4.13 to Canadian Pacific Railway Limited’s Form 10-K filed with the Securities and Exchange Commission on February 29, 2016, File No. 001-01342). |
4.14 | Fourth Supplemental Indenture dated as of November 24, 2015 among Canadian Pacific Railway Limited, Canadian Pacific Railway Company and The Bank of New York Mellon (incorporated by reference to Exhibit 4.14 to Canadian Pacific Railway Limited’s Form 10-K filed with the Securities and Exchange Commission on February 29, 2016, File No. 001-01342). |
4.15 | Indenture dated as of July 15, 1991 between Canadian Pacific Railway Company and Harris Trust and Savings Bank (incorporated by reference to Exhibit 4.15 to Canadian Pacific Railway Limited’s Form 10-K filed with the Securities and Exchange Commission on February 29, 2016, File No. 001-01342). |
4.16 | First Supplemental Indenture dated as of July 1, 1996 between Canadian Pacific Railway Company and Harris Trust and Savings Bank (incorporated by reference to Exhibit 4.16 to Canadian Pacific Railway Limited’s Form 10-K filed with the Securities and Exchange Commission on February 29, 2016, File No. 001-01342). |
4.17 | Second Supplemental Indenture dated as of November 24, 2015 among Canadian Pacific Railway Limited, Canadian Pacific Railway Company and The Bank of New York Mellon (as successor in interest to Harris Trust and Savings Bank) (incorporated by reference to Exhibit 4.17 to Canadian Pacific Railway Limited’s Form 10-K filed with the Securities and Exchange Commission on February 29, 2016, File No. 001-01342). |
4.18 | Indenture dated as of May 23, 2008 between Canadian Pacific Railway Company and Computershare Trust Company of Canada (incorporated by reference to Exhibit 4.18 to Canadian Pacific Railway Limited’s Form 10-K filed with the Securities and Exchange Commission on February 29, 2016, File No. 001-01342). |
4.19 | First Supplemental Indenture dated as of November 24, 2015 among Canadian Pacific Railway Limited, Canadian Pacific Railway Company and Computershare Trust Company of Canada (incorporated by reference to Exhibit 4.19 to Canadian Pacific Railway Limited’s Form 10-K filed with the Securities and Exchange Commission on February 29, 2016, File No. 001-01342). |
4.20 | Indenture dated as of September 11, 2015, from Canadian Pacific Railway Company to Wells Fargo Bank, National Association, as Trustee (incorporated by reference to Exhibit 99.1 to Canadian Pacific Railway Limited’s Registration Statement on Form 6-K filed10-K/A |
| * | Filed with the Securities and Exchange Commissionthis Amendment No. 1 on September 14, 2015, File No. 001-01342).Form10-K/A |
|
| ITEM 16. | |
4.21 | First Supplemental Indenture dated as of September 11, 2015 between Canadian Pacific Railway Company and The Bank of New York Mellon (incorporated by reference to Exhibit 4.21 to Canadian Pacific Railway Limited’s Form FORM10-K filed with the Securities and Exchange Commission on February 29, 2016, File No. 001-01342). |
4.22 | Second Supplemental Indenture dated as of November 24, 2015 among Canadian Pacific Railway Limited, Canadian Pacific Railway Company and The Bank of New York Mellon (incorporated by reference to Exhibit 4.22 to Canadian Pacific Railway Limited’s Form 10-K filed with the Securities and Exchange Commission on February 29, 2016, File No. 001-01342). |
4.23 | Guarantee of Canadian Pacific Railway Company’s Perpetual 4% Consolidated Debenture Stock dated as of December 18, 2015, between Canadian Pacific Railway Limited and Canadian Pacific Railway Company (incorporated by reference to Exhibit 4.23 to Canadian Pacific Railway Limited’s Form 10-K filed with the Securities and Exchange Commission on February 29, 2016, File No. 001-01342). |
10 | Material Contracts: |
10.1*,**
| Amendment dated as of January 31, 2017 to the Executive Employment Agreement dated July 23, 2016 and effective as of July 1, 2017 between Keith Creel and Canadian Pacific Railway Company. |
10.2*,**
| Offer of Employment Letter to Robert Johnson dated April 19, 2016. |
10.3* | Separation Agreement between Canadian Pacific Railway and E. Hunter Harrison dated January 18, 2017 (incorporated by reference to Exhibit 10.1 Canadian Pacific Railway Limited’s Registration Statement on Form 8-K filed with the Securities and Exchange Commission on January 23, 2017, File No. 001-01342).
|
10.4* | Offer of Employment Letter to Nadeem Velani dated October 18, 2016 (incorporated by reference to Exhibit 10.3 Canadian Pacific Railway Limited’s Registration Statement on Form 8-K filed with the Securities and Exchange Commission on October 24, 2016, File No. 001-01342).
|
10.5* | Post-Retirement Consulting Agreement between the Canadian Pacific Railway Limited
and E. Hunter Harrison dated July 25, 2016 (incorporated by reference to Exhibit 10.1 to Canadian Pacific Railway Limited’s Registration Statement on Form 8-K filed with the Securities and Exchange Commission on July 26, 2016, File No. 001-01342).
|
10.6* | Employment Agreement, between the Canadian Pacific Railway Limited and Keith Creel effective July 1, 2017 (incorporated by reference to Exhibit 10.2 to Canadian Pacific Railway Limited’s Registration Statement on Form 8-K filed with the Securities and Exchange Commission on July 26, 2016, File No. 001-01342).
|
10.7 | Third Amending Agreement, dated as of June 28, 2016, amending the Credit Agreement, dated September 26, 2014, between Canadian Pacific Railway Company, as Borrower, Canadian Pacific Railway Limited, as Covenantor, Royal Bank of Canada, as Administrative Agent, and the various Lenders party thereto (incorporated by reference to Exhibit 10.1 to Canadian Pacific Railway Limited’s Registration Statement on Form 8-K filed with the Securities and Exchange Commission on June 29, 2016, File No. 001-01342). |
10.8* | CP 401(k) Savings Plan, as amended and restated effective October 27, 2014 (incorporated by reference to Exhibit 4.5 to Canadian Pacific Railway Limited's Registration Statement on Form S-8 filed with the Securities and Exchange Commission on December 21, 2015, File No. 333-208647). |
10.9* | Stand-Alone Option Agreement dated February 4, 2013 between the Registrant and Keith Creel (incorporated by reference to Exhibit 4.2 to Canadian Pacific Railway Limited’s Registration Statement on Form S-8 filed with the Securities and Exchange Commission on May 24, 2013, File No. 333-188827). |
10.10* | Performance Share Unit Plan for Eligible Employees of Canadian Pacific Railway Limited, adopted with effect from February 17, 2009, as amended February 22, 2013, April 30, 2014 and February 18, 2015 (incorporated by reference to Exhibit 10.3 to Canadian Pacific Railway Limited’s Form 10-K filed with the Securities and Exchange Commission on February 29, 2016, File No. 001-01342). |
10.11* | Canadian Pacific Railway Limited Amended and Restated Management Stock Option Incentive Plan, as amended and restated effective November 19, 2015 (incorporated by reference to Exhibit 10.4 to Canadian Pacific Railway Limited’s Form 10-K filed with the Securities and Exchange Commission on February 29, 2016, File No. 001-01342). |
10.12* | Canadian Pacific Railway Limited Employee Share Purchase Plan (U.S.) dated July 1, 2006 ("ESPP (U.S.)"), and Amendment to the ESPP (U.S.) effective January 1, 2015, and Amendment to the ESPP (U.S.) January 1, 2016 (incorporated by reference to Exhibit 10.5 to Canadian Pacific Railway Limited’s Form 10-K filed with the Securities and Exchange Commission on February 29, 2016, File No. 001-01342). |
10.13* | Stand-Alone Option Agreement dated June 26, 2012 between the Registrant and E. Hunter Harrison (incorporated by reference to Exhibit 4.2 to Canadian Pacific Railway Limited’s Registration Statement on Form S-8 filed with the Securities and Exchange Commission on September 14, 2012, File No. 333-183891). |
10.14* | Directors' Stock Option Plan, effective October 1, 2001 (incorporated by reference to Exhibit 10.7 to Canadian Pacific Railway Limited’s Form 10-K filed with the Securities and Exchange Commission on February 29, 2016, File No. 001-01342). |
10.15* | Directors' Deferred Share Unit Plan, as amended effective July 1, 2013 (incorporated by reference to Exhibit 10.8 to Canadian Pacific Railway Limited’s Form 10-K filed with the Securities and Exchange Commission on February 29, 2016, File No. 001-01342). SUMMARY |
Not applicable.
56
|
| |
10.16* | Senior Executives' Deferred Share Unit Plan, effective as of January 1, 2001, as amended September 6, 2012 (incorporated by reference to Exhibit 10.9 to Canadian Pacific Railway Limited’s Form 10-K filed with the Securities and Exchange Commission on February 29, 2016, File No. 001-01342). |
10.17* | Canadian Pacific Railway Limited Employee Share Purchase Plan (Canada) dated July 1, 2006 ("ESPP (Canada)"), and Amendment to the ESPP (Canada) effective January 1, 2013, and Amendment to the ESPP (Canada) effective November 5, 2013, and Amendment to the ESPP (Canada) effective July 17, 2014 (incorporated by reference to Exhibit 10.10 to Canadian Pacific Railway Limited’s Form 10-K filed with the Securities and Exchange Commission on February 29, 2016, File No. 001-01342). |
10.18* | Canadian Pacific U.S. Salaried Retirement Income Plan, as restated effective January 1, 2015 (incorporated by reference to Exhibit 10.11 to Canadian Pacific Railway Limited’s Form 10-K filed with the Securities and Exchange Commission on February 29, 2016, File No. 001-01342). |
10.19* | Canadian Pacific U.S. Supplemental Executive Retirement Plan, effective January 1, 2013 ("CPUSERP"), and First Amendment to the CPUSERP effective November 14, 2013, and Second Amendment to the CPUSERP effective January 1, 2014 (incorporated by reference to Exhibit 10.12 to Canadian Pacific Railway Limited’s Form 10-K filed with the Securities and Exchange Commission on February 29, 2016, File No. 001-01342). |
10.20* | Restricted Share Unit Plan for Eligible Employees of Canadian Pacific Railway Limited, effective August 2, 2011, as amended February 21, 2013 (incorporated by reference to Exhibit 10.13 to Canadian Pacific Railway Limited’s Form 10-K filed with the Securities and Exchange Commission on February 29, 2016, File No. 001-01342). |
10.21* | Short Term Incentive Plan for Non-Unionized Employees (Canada) and US Salaried Employees, effective January 1, 2014 (incorporated by reference to Exhibit 10.14 to Canadian Pacific Railway Limited’s Form 10-K filed with the Securities and Exchange Commission on February 29, 2016, File No. 001-01342). |
10.22* | Canadian Pacific Railway Company Pension Plan (Pension Plan Rules), consolidated as at January 1, 2009 (incorporated by reference to Exhibit 10.15 to Canadian Pacific Railway Limited’s Form 10-K filed with the Securities and Exchange Commission on February 29, 2016, File No. 001-01342). |
10.23* | Amendment Number 1, effective July 1, 2010, to the Defined Contribution Provisions (Appendix B) of the Canadian Pacific Railway Company Pension Plan (Pension Plan Rules), consolidated as at January 1, 2009 (incorporated by reference to Exhibit 10.16 to Canadian Pacific Railway Limited’s Form 10-K filed with the Securities and Exchange Commission on February 29, 2016, File No. 001-01342). |
10.24* | Amendment Number 2, effective April 1, 2011, to the Defined Contribution Provisions (Appendix B) of the Canadian Pacific Railway Company Pension Plan (Pension Plan Rules), consolidated as at January 1, 2009 (incorporated by reference to Exhibit 10.17 to Canadian Pacific Railway Limited’s Form 10-K filed with the Securities and Exchange Commission on February 29, 2016, File No. 001-01342). |
10.25* | Amendment Number 3, effective January 1, 2013, to the Defined Contribution Provisions (Appendix B) of the Canadian Pacific Railway Company Pension Plan (Pension Plan Rules), consolidated as at January 1, 2009 (incorporated by reference to Exhibit 10.18 to Canadian Pacific Railway Limited’s Form 10-K filed with the Securities and Exchange Commission on February 29, 2016, File No. 001-01342). |
10.26* | Amendment Number 1 to the Canadian Pacific Railway Company Pension Plan (Pension Plan Rules), consolidated as at January 1, 2009, approved by the Board of Directors on December 16, 2009 (incorporated by reference to Exhibit 10.19 to Canadian Pacific Railway Limited’s Form 10-K filed with the Securities and Exchange Commission on February 29, 2016, File No. 001-01342). |
10.27* | Amendment Number 2, effective January 1, 2010, to the Canadian Pacific Railway Company Pension Plan (Pension Plan Rules), consolidated as at January 1, 2009 (incorporated by reference to Exhibit 10.20 to Canadian Pacific Railway Limited’s Form 10-K filed with the Securities and Exchange Commission on February 29, 2016, File No. 001-01342). |
10.28* | Amendment Number 3, effective January 1, 2010, to the Canadian Pacific Railway Company Pension Plan (Pension Plan Rules), consolidated as at January 1, 2009 (incorporated by reference to Exhibit 10.21 to Canadian Pacific Railway Limited’s Form 10-K filed with the Securities and Exchange Commission on February 29, 2016, File No. 001-01342). |
10.29* | Amendment Number 4, effective January 1, 2011, to the Canadian Pacific Railway Company Pension Plan (Pension Plan Rules), consolidated as at January 1, 2009 (incorporated by reference to Exhibit 10.22 to Canadian Pacific Railway Limited’s Form 10-K filed with the Securities and Exchange Commission on February 29, 2016, File No. 001-01342). |
10.30* | Amendment Number 5, effective January 1, 2011, to the Canadian Pacific Railway Company Pension Plan (Pension Plan Rules), consolidated as at January 1, 2009 (incorporated by reference to Exhibit 10.23 to Canadian Pacific Railway Limited’s Form 10-K filed with the Securities and Exchange Commission on February 29, 2016, File No. 001-01342). |
10.31* | Amendment Number 6, effective October 1, 2012, to the Canadian Pacific Railway Company Pension Plan (Pension Plan Rules), consolidated as at January 1, 2009 (incorporated by reference to Exhibit 10.24 to Canadian Pacific Railway Limited’s Form 10-K filed with the Securities and Exchange Commission on February 29, 2016, File No. 001-01342). |
10.32* | Amendment Number 7, effective January 1, 2013, to the Canadian Pacific Railway Company Pension Plan (Pension Plan Rules), consolidated as at January 1, 2009 (incorporated by reference to Exhibit 10.25 to Canadian Pacific Railway Limited’s Form 10-K filed with the Securities and Exchange Commission on February 29, 2016, File No. 001-01342). |
|
| |
10.33* | Amendment Number 8, effective January 1, 2013, to the Canadian Pacific Railway Company Pension Plan (Pension Plan Rules), consolidated as at January 1, 2009 (incorporated by reference to Exhibit 10.26 to Canadian Pacific Railway Limited’s Form 10-K filed with the Securities and Exchange Commission on February 29, 2016, File No. 001-01342). |
10.34* | Amendment Number 9, effective January 1, 2013, to the Canadian Pacific Railway Company Pension Plan (Pension Plan Rules), consolidated as at January 1, 2009 (incorporated by reference to Exhibit 10.27 to Canadian Pacific Railway Limited’s Form 10-K filed with the Securities and Exchange Commission on February 29, 2016, File No. 001-01342). |
10.35* | Amendment Number 10, effective January 1, 2013, to the Canadian Pacific Railway Company Pension Plan (Pension Plan Rules), consolidated as at January 1, 2009 (incorporated by reference to Exhibit 10.28 to Canadian Pacific Railway Limited’s Form 10-K filed with the Securities and Exchange Commission on February 29, 2016, File No. 001-01342). |
10.36* | Amendment Number 11, effective January 1, 2013, to the Canadian Pacific Railway Company Pension Plan (Pension Plan Rules), consolidated as at January 1, 2009 (incorporated by reference to Exhibit 10.29 to Canadian Pacific Railway Limited’s Form 10-K filed with the Securities and Exchange Commission on February 29, 2016, File No. 001-01342). |
10.37* | Amendment Number 12, effective January 1, 2015, to the Canadian Pacific Railway Company Pension Plan (Pension Plan Rules), consolidated as at January 1, 2009 (incorporated by reference to Exhibit 10.30 to Canadian Pacific Railway Limited’s Form 10-K filed with the Securities and Exchange Commission on February 29, 2016, File No. 001-01342). |
10.38* | Amendment Number 13, effective January 1, 2015, to the Canadian Pacific Railway Company Pension Plan (Pension Plan Rules), consolidated as at January 1, 2009 (incorporated by reference to Exhibit 10.31 to Canadian Pacific Railway Limited’s Form 10-K filed with the Securities and Exchange Commission on February 29, 2016, File No. 001-01342). |
10.39* | Canadian Pacific Railway Company Secondary Pension Plan (Pension Plan Rules), effective June 1, 2013 (incorporated by reference to Exhibit 10.32 to Canadian Pacific Railway Limited’s Form 10-K filed with the Securities and Exchange Commission on February 29, 2016, File No. 001-01342). |
10.40* | Amendment Number 1, effective June 1, 2013, to the Canadian Pacific Railway Company Secondary Pension Plan (Pension Plan Rules), effective June 1, 2013 (incorporated by reference to Exhibit 10.33 to Canadian Pacific Railway Limited’s Form 10-K filed with the Securities and Exchange Commission on February 29, 2016, File No. 001-01342). |
10.41* | Amendment Number 2, effective January 1, 2015, to the Canadian Pacific Railway Company Secondary Pension Plan (Pension Plan Rules) effective January 1, 2015 (incorporated by reference to Exhibit 10.34 to Canadian Pacific Railway Limited’s Form 10-K filed with the Securities and Exchange Commission on February 29, 2016, File No. 001-01342). |
10.42* | Canadian Pacific Supplemental Executive Retirement Plan, effective January 1, 2011 (incorporated by reference to Exhibit 10.35 to Canadian Pacific Railway Limited’s Form 10-K filed with the Securities and Exchange Commission on February 29, 2016, File No. 001-01342). |
10.43* | Executive Employment Agreement between Canadian Pacific Railway Company and Hunter Harrison, effective as of June 28, 2012 (incorporated by reference to Exhibit 10.36 to Canadian Pacific Railway Limited’s Form 10-K filed with the Securities and Exchange Commission on February 29, 2016, File No. 001-01342). |
10.44* | Amendment dated as of May 5, 2014, to the Executive Employment Agreement between Canadian Pacific Railway Company and Hunter Harrison, effective as of June 28, 2012 (incorporated by reference to Exhibit 10.37 to Canadian Pacific Railway Limited’s Form 10-K filed with the Securities and Exchange Commission on February 29, 2016, File No. 001-01342). |
10.45* | Executive Employment Agreement between Canadian Pacific Railway Company, Soo Line Railroad Company and Keith Creel, effective as of February 5, 2013 (incorporated by reference to Exhibit 10.38 to Canadian Pacific Railway Limited’s Form 10-K filed with the Securities and Exchange Commission on February 29, 2016, File No. 001-01342). |
10.46* | Amendment dated August 10, 2015, to the Executive Employment Agreement between Canadian Pacific Railway Company, Soo Line Railroad Company and Keith Creel, effective as of February 5, 2013 (incorporated by reference to Exhibit 10.39 to Canadian Pacific Railway Limited’s Form 10-K filed with the Securities and Exchange Commission on February 29, 2016, File No. 001-01342). |
10.47* | Offer of Employment Letter to Mark Erceg dated April 30, 2015 (incorporated by reference to Exhibit 10.40 to Canadian Pacific Railway Limited’s Form 10-K filed with the Securities and Exchange Commission on February 29, 2016, File No. 001-01342). |
10.48* | Change in Control Agreement between Canadian Pacific Railway Company and Mark Erceg made as of May 18, 2015 (incorporated by reference to Exhibit 10.41 to Canadian Pacific Railway Limited’s Form 10-K filed with the Securities and Exchange Commission on February 29, 2016, File No. 001-01342). |
10.49* | Offer of Employment Letter to Mark Wallace dated July 16, 2012 (incorporated by reference to Exhibit 10.42 to Canadian Pacific Railway Limited’s Form 10-K filed with the Securities and Exchange Commission on February 29, 2016, File No. 001-01342). |
10.50* | Change in Control Agreement between Canadian Pacific Railway Company and Mark Wallace made as of May 1, 2014 (incorporated by reference to Exhibit 10.43 to Canadian Pacific Railway Limited’s Form 10-K filed with the Securities and Exchange Commission on February 29, 2016, File No. 001-01342). |
|
| |
10.51* | Offer of Employment Letter to Laird Pitz dated March 7, 2014 (incorporated by reference to Exhibit 10.44 to Canadian Pacific Railway Limited’s Form 10-K filed with the Securities and Exchange Commission on February 29, 2016, File No. 001-01342). |
10.52 | Credit Agreement dated as of September 26, 2014 among Canadian Pacific Railway Company and CPR Securities Limited, as borrowers, Canadian Pacific Railway Limited, as covenantor, the Financial Institutions that are signatories to the Credit Agreement, as Lenders, the Royal Bank of Canada, as Administrative Agent, RBC Capital Markets, J.P. Morgan Securities LLC, TD Securities, Morgan Stanley MUFG Loan Partners, LLC and Citibank, N.A., Canadian Branch, as Co-Lead Arrangers, RBC Capital Markets and J.P. Morgan Securities LLC, as Joint Bookrunners, J.P. Morgan Chase Bank, N.A., as Syndication Agent, The Toronto-Dominion Bank, Morgan Stanley MUFG Loan Partners, LLC and Citibank, N.A., Canadian Branch, as Co-Documentation Agents (incorporated by reference to Exhibit 10.45 to Canadian Pacific Railway Limited’s Form 10-K filed with the Securities and Exchange Commission on February 29, 2016, File No. 001-01342). |
10.53 | First Amending Agreement dated as of June 15, 2015, to the Credit Agreement dated September 26, 2014, among Canadian Pacific Railway Company and CPR Securities Limited, as borrowers, Canadian Pacific Railway Limited, as covenantor, the signatories to this First Amending Agreement to the Credit Agreement, as Lenders, the Royal Bank of Canada, as Administrative Agent (incorporated by reference to Exhibit 10.46 to Canadian Pacific Railway Limited’s Form 10-K filed with the Securities and Exchange Commission on February 29, 2016, File No. 001-01342). |
10.54 | Second Amending Agreement dated as of September 17, 2015, to the Credit Agreement dated September 26, 2014, among Canadian Pacific Railway Company and CPR Securities Limited, as borrowers, Canadian Pacific Railway Limited, as covenantor, the signatories to the Second Amending Agreement to this Credit Agreement, as Lenders, the Royal Bank of Canada, as Administrative Agent (incorporated by reference to Exhibit 10.47 to Canadian Pacific Railway Limited’s Form 10-K filed with the Securities and Exchange Commission on February 29, 2016, File No. 001-01342). |
12.1** | Ratio of earnings to fixed charges |
21.1** | Subsidiaries of the registrant |
23.1** | Consent of Independent Registered Public Accounting Firm |
24.1** | Power of attorney (included on the signature pages of this Form 10-K) |
31.1** | CEO Rule 13a-14(a) Certifications |
31.2** | CFO Rule 13a-14(a) Certifications |
32.1** | CEO Section 1350 Certifications |
32.2** | CFO Section 1350 Certifications |
99.1** | Annual CEO Certification pursuant to NYSE Rule 303A.12(a) |
101.INS** | XBRL Instance Document |
101.SCH** | XBRL Taxonomy Extension Schema Document |
101.CAL** | XBRL Taxonomy Extension Calculation Linkbase Document |
101.LAB** | XBRL Taxonomy Extension Label Linkbase Document |
101.DEF** | XBRL Taxonomy Extension Definition Linkbase Document |
101.PRE** | XBRL Taxonomy Extension Presentation Linkbase Document |
| The following financial information from Canadian Pacific Railway Limited’s Annual Report on Form 10-K for the year ended December 31, 2016, formatted in Extensible Business Reporting Language (XBRL) includes: (i) the Consolidated Statements of Income of each of the years ended December 31, 2016, 2015, and 2014; (ii) the Consolidated Statements of Comprehensive Income for each of the years ended December 31, 2016, 2015, and 2014; (iii) the Consolidated Balance Sheets at December 31, 2016 and 2015; (iv) the Consolidated Statements of Cash Flows for the years ended December 31, 2016, 2015, and 2014; (v) the Consolidated Statements of Changes in Shareholders’ Equity for each of the three years ended December 31, 2016, 2015, and 2014; and (vi) the Notes to Consolidated Financial Statements. |
* Management contract or compensatory arrangement
**Filed with this Statement
SIGNATURES
Pursuant to the requirements of Section 13 or 15(d) of the Securities Exchange Act of 1934, the Company has duly caused this report to be signed on its behalf by the undersigned, thereunto duly authorized.
| | |
| CANADIAN PACIFIC RAILWAY LIMITED |
| (Registrant) |
| |
CANADIAN PACIFIC RAILWAY LIMITEDBy: |
(Registrant) |
By: | /s/ KEITH CREEL |
| | Keith Creel |
| | President and Chief Executive Officer |
Dated: February 16, 2017April 23, 2019
57
POWER OF ATTORNEY
Each of the undersigned do hereby appoint each of Nadeem Velani and Jeffrey J. Ellis, his or her true and lawful attorney-in-fact and agent, to sign on his or her behalf the Company’s Annual Report on Form 10-K, for the year ended December 31, 2016, and any and all amendments thereto, and to file the same, with all exhibits thereto, with the Securities and Exchange Commission.
Pursuant to the requirements of the Securities Exchange Act of 1934, this report has been signed below by the following persons on behalf of the Company and in the capacities indicated on February 16, 2017.
April 23, 2019. | | | | |
Signature | | Title | | |
| |
Signature | Title |
/s/ KEITH CREEL* Keith Creel | | President, Chief Executive Officer and Director |
Keith Creel | (Principal Executive Officer) | | |
| | |
/s/ NADEEM VELANI Nadeem Velani | | Executive Vice-President and Chief Financial Officer |
Nadeem Velani | (Principal Financial and Accounting Officer) | | |
| | |
/s/ ANDREW* Andrew F. REARDONReardon | | Chairman of the Board of Directors |
Andrew F. Reardon | |
| | |
/s/ JOHN R. BAIRD | Director |
* John R. Baird | |
| Director | | |
/s/ ISABELLE COURVILLE | | |
* Isabelle Courville | | Director |
Isabelle Courville | |
| | |
/s/ GILLIAN H. DENHAM | Director |
* Gillian H. Denham | |
| Director | | |
/s/ WILLIAM R. FATT | | |
* Rebecca MacDonald | | Director | | |
William R. Fatt | | |
* Edward Monser | |
| Director | | |
/s/ REBECCA MACDONALD | Director | |
Rebecca MacDonald | |
| |
/s/ MATTHEW H. PAULL | Director |
* Matthew H. Paull | |
| Director | | |
/s/ JANE L. PEVERETT | Director | |
* Jane L. Peverett | |
| Director | | |
/s/ GORDON T. TRAFTON II | Director | |
* Gordon T. Trafton II | | Director | | |
| | |
| *By: | | /s/ NADEEM VELANI | | |
| | Nadeem Velani | | |
| | Attorney-in-Fact | | |
58