| | 2019 individual performance factor | | | | | | | | The individual performance factor
for the CEO has a cap, so his
individual performance factor
cannot exceed the corporate
performance factor. This ensures the payout factor for
the CEO aligns with the CEO’s
overall responsibility for CP’s
performance. | | | | 155 | % | | | | | | | | | | | | 175 | % | | | | | | | | | | | | 175 | % | | | | | | | | | | | | 150 | % | | | | | | | | | | | | 150 | % | | | | | | | | | | | | 150 | % | | | | | | | | | | | | | | | | | | | | | | The Compensation Committee sets the individual performance factor for the CEO. The CEO reviews the performance of his direct reports against their objectives, and recommends their individual performance factors to the Compensation Committee. | | | | | | | | Total |
| | First main track | 12,683 |
| Second and other main track | 1,088 |
| Passing sidings and yard track | 4,353 |
| Industrial and way track | 779 |
| Total track miles | 18,903 |
|
Rail Facilities
CP operates numerous facilities including: terminals for intermodal, transload, automotive and other freight; classification rail yards for train-building and switching, storage-in-transit and other activities; offices to administer and manage operations; dispatch centres to direct traffic on the rail network; crew quarters to house train crews along the rail line; shops and other facilities for fuelling; maintenance and repairs of locomotives; and facilities for maintenance of freight cars and other equipment. The Company continues to invest in terminal upgrades and new facilities to accommodate incremental growth in volumes, such as creating additional capacity with the redesign of the classification yard at Alyth in Calgary. The Company’s average terminal dwell is an indicator of efficient utilization of yard capacity, discussed in Item 7. Management’s Discussion and Analysis of Financial Condition and Results of Operations, Performance Indicators. Typically in all of our major yards, CP Police Services has offices to ensure the safety and security of the yards and operations.
CP 2019 ANNUAL REPORT/ 24
The following table includes the major yards, terminals and transload facilities on CP's network:
| | | | Major Classification Yards | Major Intermodal Terminals | Transload Facilities | |
See the profiles beginning on page 28 to read about each executive’s individual performance in 2019. Compensation Committee Discretion The Compensation Committee has developed principles for the use of discretion. Adjustments should not relieve management from the consequences of their decision making. Adjustments should also neither reward nor penalize management for decisions on discretionary transactions, events outside their control (such as foreign exchange rates and fuel prices that are beyond the assumptions used in the planning process) or transactions outside normal corporate planning and budgeting. As a result, the Compensation Committee can reduce the corporate performance factor for any executive officer as it deems appropriate, as long as it follows the principles. The Board can also use its discretion to adjust the targets and payouts up or down, following the principles set out by the Compensation Committee. The Compensation Committee did not exercise any such discretion in 2019. Long-term incentive awards focus executives on medium and longer-term performance to create sustainable shareholder value. Target awards are set based on the competitive positioning of each executive’s compensation and the practices of companies in our peer group in order to attract and retain experienced railroad executives with highly specialized skills. Vancouver, British Columbia | Vancouver, British Columbia | Vancouver, British Columbia | Calgary, Alberta | Calgary, Alberta | Toronto, Ontario | Edmonton, Alberta | Edmonton, Alberta | Hamilton, Ontario | Moose Jaw, Saskatchewan | Regina, Saskatchewan | Lachine, Québec | Winnipeg, Manitoba | Winnipeg, Manitoba | | Toronto, Ontario | Vaughan, Ontario | Performance share units (60%) | | Stock options (40%) | | What they are | | • notional share units that vest at the end of three years based on absolute and relative performance and the price of our shares | | • right to buy CP shares at a specified price in the future | | Payout | | • cliff vest at the end of three years based on performance against threepre-defined financial and market metrics • no guarantee of a minimum payout | | • vest 25% every year beginning on the anniversary of the grant date • expire at the end of seven years • only have value if our share price increases above the exercise price |
| | | | | Montréal, Québec | Montréal, Québec | Performance share units (60%) | | Stock options (40%) | | Dividend equivalents | | • earned quarterly and compound over the three-year period | | • do not earn dividend equivalents | | Restrictions | | • must meet minimum level of performance • performance multiplier is capped for exceptional performance | | • cannot be exercised during a blackout period | | If the executive retires | | • must give three months’ notice • award continues to vest and executive is entitled to receive the full value as long as they have worked for six months of the performance period, otherwise the award is forfeited | | • must give three months’ notice • options continue to vest, but expire five years after the retirement date or on the normal expiry date, whichever is earlier |
Stock options are usually granted in January immediately after the fourth quarter financial statement blackout period ends, while performance share units (PSUs) are awarded in February after the Compensation Committee has reviewed theyear-end financial results in detail. Grants are also made for special situations like retention or new hires. Special grants can include PSUs, RSUs, DSUs or stock options. These grants are made on the first Tuesday of the month following approval. If we are in a blackout period, the grant is made after the blackout has been lifted. | | | Chicago, IllinoisNon-Compete andNon-Solicitation | Chicago, Illinois | | CP is mindful that the demand for experienced and talented railroaders is high, particularly those with backgrounds in precision scheduled railroading. To manage near-term retention risk, the company’s long-term incentive award agreements containnon-compete, non-solicitation and other restrictive clauses, includingnon-disclosure restrictions. Non-compete andnon-solicitation provisions will apply if a recipient fails to comply with certain commitments for atwo-year period following the end of employment. | | |
2019 long-term incentive awards To determine the appropriate value of long-term incentive grants provided to the NEOs, the Compensation Committee considers the practices of our comparator group and external market data, as well as internal factors including executive retention, dilutive impact and long-term value creation. The table below shows the 2019 long-term incentives awarded to the NEOs. | | | | | St. Paul, Minnesota | Minneapolis, Minnesota | Target as a % of base salary | | | | | 500% | | | | | 275% | | | | | 225% | | | | | 200% | | | | | 225% | | | | | 225% | |
Effective January 1, 2019, Mr. Creel’s long-term incentive target was increased to 600% of his base salary; however, consistent with Mr. Creel’s 2016 employment agreement, his 600% LTI target has been reduced by 100% until the end of 2021 to fund an upfront performance grant that he received in 2017. Therefore, his target was 500% of his base salary in 2019.
Equipment| | | | | | | | | | | | | | | | | | | | | | | | | | | | | | | | | | | | | | | | | | | | | | | | | | | | | | | | incentive | | | | | | | | | | | award | | | | | | | | | | | | | | | | | (grant value) ($) | | | | | | | | | | | | | | | | | | | | | | | | | | | | | | | | | | | | | | | | | | | | | | | | | | | | 9,512,269 | | | | | | | | 5,870,208 | | | | 21,901 | | | | | | | | 3,642,061 | | | | 54,202 | | | | | 2,531,053 | | | | | | | | 1,552,110 | | | | 5,788 | | | | | | | | 978,943 | | | | 16,313 | | | | | 1,893,801 | | | | | | | | 1,196,771 | | | | 4,465 | | | | | | | | 697,030 | | | | 10,453 | | | | | 1,313,416 | | | | | | | | 810,534 | | | | 3,024 | | | | | | | | 502,882 | | | | 7,484 | | | | | 959,877 | | | | | | | | 604,824 | | | | 2,167 | | | | | | | | 355,053 | | | | 5,293 | | | | | 1,643,916 | | | | | | | | 1,014,508 | | | | 3,785 | | | | | | | | 629,408 | | | | 9,367 | |
CP's equipment includes: owned
See the summary compensation table on page 43 for details about how we calculated the grant date fair values of the PSUs and leased locomotivesstock options. Both were calculated in accordance with FASB ASC Topic 718. The grant value of the awards based on the NYSE trading price has been converted to Canadian dollars using a 2019 average exchange rate of $1.3269. On February 14, 2019, additional stock options were granted to Mr. Brooks as a result of his promotion to Executive Vice-President. On September 3, 2019, additional PSUs and railcars; heavy maintenance equipmentstock options were granted to Mr. Redd as a result of his promotion to Executive Vice-President. PSU awards focus executives on achieving medium-term goals within a three-year performance period. The Board sets performance measures, thresholds and machinery; other equipmenttargets at the beginning of the performance period. The number of units that vest is based on our performance over the three-year period. We must achieve threshold performance on a measure, otherwise the payout factor for that measure is zero and tools ina portion of the award is forfeited. If performance is exceptional on a measure, the Board may approve a payout of up to 200%. PSUs earn additional units as dividend equivalents at the same rate as dividends paid on our shops, offices and facilities; and vehicles for maintenance, transportation of crews, and other activities. In this section, owned equipment includes units acquired by CP, equipment leased to third parties, and units held under finance leases, and leased equipment includes units under a short-term or long-term operating lease.shares.
The Company’s locomotive fleetaward is composedpaid out in cash based on the number of largely high-adhesion alternating current locomotivesunits that are more fuel efficientearned and reliable and have superior hauling capacity as compared with standard direct current locomotives. The Company is continuing a modernization program on severalthe average closing share price for the 30 trading days prior to the end of the oldest locomotivesperformance period on the TSX or NYSE, as applicable. The award may be paid out in shares purchased on the open market, on the CEO’s recommendation, using theafter-tax value.The performance period for the 2019 PSU awards is January 1, 2019 to December 31, 2021. In 2019, CP returned to measuring total shareholder return (TSR) performance based on the Class 1 Railways and the S&P TSX 60 Index from the S&P Road and Rail Index and the S&P TSX Capped Industrial Index. The Class 1 Railways align us more closely to our industry peers. Additionally, the S&P TSX 60 Index is a more common benchmark for the broader investment community and a more widely recognized index than the S&P TSX Capped Industrial Index. Performance will be assessed against the measures in the fleet in ordertable below. Awards will be prorated if results fall between threshold and exceptional. | | | | | | | | | | | | | | | | | | | | 2019 PSU performance measures | | Why the measure is important | | | | | | | | | | | | | PSU three-year average return on invested capital (ROIC) Net operating profit after tax divided by average invested capital | | Focuses executives on the effective use of capital as we grow Ensures shareholders’ capital is employed in a value-accretive manner | | | 15.3% | | | | 16% | | | | 16.4% | | | | 70% | | Measured over three years. The percentile ranking of CP’s TSX Compound Annual Growth Rate (CAGR) relative to the companies that make up the S&P/TSX 60 | | Compares our TSR on the TSX to the broader S&P/TSX60 to reflect our progress relative to the Canadian market Aligns long-term incentive compensation with long-term shareholder interests | | | 25th
percentile |
| | | 50th
percentile |
| | | 75th
percentile |
| | | 15% | | Measured over three years. The ordinal ranking of CP’s NYSE CAGR relative to the Class 1 Railroads | | Compares our TSR on the NYSE to the publicly traded Class 1 Railroads to ensure we are competitive against our primary competitors. Aligns long-term incentive compensation with long-term shareholder interests | | | 4th | | | | 3rd | | | | 1st | | | | 15% | |
At the end of the three-year performance period, the starting point for determining relative TSR will be the10-day average closing share price of our shares on the appropriate index prior to improve reliabilityJanuary 1, 2019 and availability,the closing point will be the10-day average closing share price of our shares on the appropriate index prior to January 1, 2022. TSR is adjusted over the period to reflect dividends paid. The payout multiplier is interpolated if our performance falls between 50% and 200%. If results are below the threshold level for any of the performance measures, units for that specific measure will be forfeited. The table below shows the details of the 2019 annual PSU award grant. | | | | | | | | | | | | | | | | | | | | | | | | | | | | 5,870,208 | | | | 21,901 | | | | US$202.00 (NYSE) | | | | | 1,552,110 | | | | 5,788 | | | | $268.16 (TSX) | | | | | 1,196,771 | | | | 4,465 | | | | US$202.00 (NYSE) | | | | | 810,534 | | | | 3,024 | | | | US$202.00 (NYSE) | | | | | 432,874 | | | | 1,615 | | | | US$202.00 (NYSE)
US$234.76 (NYSE) |
| | | | 1,014,508 | | | | 3,785 | | | | US$202.00 (NYSE) | |
On September 3, 2019, additional PSUs were granted to Mr. Redd as well asa result of his promotion to introduce new technologyExecutive Vice-President. The grant value of the PSU awards based on the NYSE trading price have been converted to Canadian dollars using a 2019 average exchange rate of $1.3269. We calculated the number of PSUs to be granted to each executive by dividing the grant value by the theoretical value of a PSU (using the Willis Towers Watson binomial lattice model methodology), applied to our30-day average closing share price on the TSX or the NYSE prior to the fleet. CP’s locomotive productivity,day of the grant. Stock options focus executives on longer term performance. Options have a seven-year term and vest 25% each year beginning on the anniversary date of the grant. The grant price is the last closing price of our common shares on the TSX or the NYSE on the applicable the grant date. Options only have value for the holder if our current share price increases above the grant price. The table below shows the details of the 2019 annual stock option award grant. | | | | | | | | | | | | | | | | | | | | | | | | | | | | 3,642,061 | | | | 54,202 | | | | US$205.31 (NYSE) | | | | | 978,943 | | | | 16,313 | | | | $271.50 (TSX) | | | | | 502,881 | | | | 7,484 | | | | US$205.31 (NYSE) | | | | | 502,882 | | | | 7,484 | | | | US$205.31 (NYSE) | | | | | 268,508 | | | | 3,996 | | | | US$205.31 (NYSE) | | | | | 629,408 | | | | 9,367 | | | | US$205.31 (NYSE) | |
On February 14, 2019, additional stock options were granted to Mr. Brooks as a result of his promotion to Executive Vice-President. On September 3, 2019, additional options were granted to Mr. Redd as a result of his promotion to Executive Vice-President. The grant value of the stock option awards based on the NYSE trading price have been converted to Canadian dollars using a 2019 average exchange rate of $1.3269. We calculated the number of options to be granted to each executive by dividing the grant value by the theoretical value of an option (using the Willis Towers Watson binomial option pricing methodology), applied to our30-day average closing share price on the TSX or the NYSE prior to the day of the grant.
About the stock option plan The management stock option incentive plan (the stock option plan) was introduced in October 2001. Stock options awarded on or after January 1, 2017 have a seven-year term. If the expiry date falls within a blackout period, the expiry date will be extended to 10 business days after the end of the blackout period date. If a further blackout period is imposed before the end of the extension, the term will be extended another 10 days after the end of the additional blackout period. Regular stock options granted before 2017 expire 10 years from the date of grant and generally vest 25% each year over four years, beginning on the anniversary of the grant date. The table below sets out the limits for issuing options under the plan: | | | | | As a % of the number of shares outstanding | Maximum number of shares that may be reserved for issuance to insiders as options | | | Maximum number of options that may be granted to insiders in aone-year period | | | Maximum number of options that may be granted to any insider in aone-year period | | | | | As a % of the number of shares outstanding at the time the shares were reserved | Maximum number of options that may be granted to any person | | |
We measuredilution by determining the number of options available for issuance and the number of options outstanding as a percentage of outstanding shares. Our potential dilution at the end of 2019 was 1.8%. Notwithstanding the limits noted above, the dilution level, measured by the number of options available for issuance as a percentage of outstanding shares continues to be capped, at the discretion of the Board, at 7%. The option grant price is the last closing market price of shares on the grant date on the TSX or the NYSE (for grants after December 15, 2014 depending on the currency of the grant). The table below shows theburn rate for the last three fiscal years, calculated by dividing the number of stock options granted in the fiscal year by the weighted average number of outstanding shares for the year. | | | | | | | | | | | | | | | | | | | | | | | | Number of options granted | | | 369,980 | | | | 282,125 | | | | 224,730 | | Weighted number of shares outstanding | | | 145,863,318 | | | | 142,885,817 | | | | 138,771,939 | | | | | 0.25% | | | | 0.20% | | | | 0.16% | |
The table below shows the options outstanding and available for grant from the Stock Option Plan as at December 31, 2019. | | | | | | | | | | | | | | | | Percentage of outstanding shares | | Options outstanding (as at December 31, 2019) | | | 1,416,346 | | | | 1.03 | % | Options available to grant (as at December 31, 2019) | | | 1,098,707 | | | | 0.80 | % | Shares issued on exercise of options in 2019 | | | 260,267 | | | | 0.19 | % | | | | 224,730 | | | | 0.16 | % |
Since the launch of the stock option plan in October 2001, a total of 18,078,642 shares have been available for issuance under the plan and 15,563,589 shares have been issued through the exercise of options. We do not provide financial assistance to option holders to facilitate the purchase of shares under the stock option plan. There is a double trigger on options so that if there is a change of control and only if an option holder is terminated without cause, all of his or her stock options will vest immediately according to the change in control provisions in the stock option plan.
If an employee retires, the options continue to vest and expire on the original expiry date or five years from retirement, whichever is earlier. If an employee is terminated without cause, the employee has six months to exercise any vested options. If the employee resigns, the employee has 30 days to exercise any vested options. If an employee is terminated with cause, all options are cancelled. Options will continue to vest and expire on the scheduled expiry date if the holder’s employment ends due to permanent disability. If an option holder dies, the options will expire 12 months following his or her death and may be exercised by the holder’s estate. Options can only be assigned to the holder’s family trust, holding corporation or retirement trust, or a legal representative of an option holder’s estate or a person who acquires the option holder’s rights by bequest or inheritance. The CEO, the Chair of the Board and the Compensation Committee chair have authority to grant options to certain employees based on defined parameters, such as the daily average gross ton-miles (“GTMs”) dividedposition of the employee and the expected value of the option award. In 2019, the Compensation Committee authorized a pool of 50,000 options for allocation by daily average operating horsepower,the CEO, who granted 19,456 options to 13 employees to recognize performance and for retention. Making changes to the years ended December 31, 2019, 2018,stock option plan The Board can make the following changes to the stock option plan without shareholder approval: changes to clarify information or to correct an error or omission changes of an administrative or a housekeeping nature changes to eligibility to participate in the stock option plan terms, conditions and mechanics of granting stock option awards changes to vesting, exercise, early expiry or cancellation amendments that are designed to comply with the law or regulatory requirements The Board must receive shareholder approval to make other changes, including the following, among other things: an increase to the maximum number of shares that may be issued under the plan a decrease in the exercise price a grant of options in exchange for, or related to, options being cancelled or surrendered The Board has made two amendments to the stock option plan since it was introduced in 2001: on February 28, 2012, the stock option plan was amended so that a change of control would not trigger accelerated vesting of options held by a participant, unless the person is terminated without cause or constructively dismissed; and on November 19, 2015, the stock option plan was amended to providenet stock settlement as a method of exercise, which allows an option holder to exercise options without the need for us to sell the securities on the open market, resulting in less dilution.
Payout of 2017 was 202, 198, and 201 GTMs per Operating horsepower, respectively. Operating horsepower excludes units offline, tied up or in storage, or in use on other railways, and includes foreign units online. As ofPSU award On December 31, 2019, the Company had 314 locomotives in storage. As a result, the Company does not foresee the need to acquire new locomotives2017 PSU grant for the next several years. Asperiod of January 1, 2017 to December 31, 2019 CP owned or leasedvested and was paid out on February 7, 2020. The NEOs received a payout of 193% on the following locomotive units: award, which includes dividends earned up to the payment date. The table below shows the difference between the actual payout value and the grant value for each NEO. | | | | | | | | | | | Locomotives | Owned |
| Leased |
| Total |
| Average Age (in years) |
| | Line haul | 731 |
| 88 |
| 819 |
| 13 |
| | Road switcher | 560 |
| — |
| 560 |
| 28 |
| | Total locomotives | 1,291 |
| 88 |
| 1,379 |
| 19 |
|

CP’s2017 grant value(2017 PSU award+Dividend equivalents)x2017 PSU performance factorxMarket share price=PSU value($)(# of units)(# of units)(0-200%)($)Keith Creel4,407,78822,294680193%US$245.0114,138,889Nadeem Velani782,3953,903119193%$323.562,517,052John Brooks428,4422,16766193%US$245.011,374,360Laird Pitz394,2371,99461193%US$245.011,264,578Mark Redd367,3491,85857193%US$245.011,178,305Robert Johnson958,7054,849148193%US$245.013,075,226 Closing market share price is calculated on days when both the TSX and NYSE markets are open. For Mr. Velani, the market share price was calculated using $323.56, the average in-service utilization percentage for freight cars, for the years ended30-day closing price of our shares prior to December 31, 2019 2018,on the TSX. For Mr. Creel, Mr. Brooks, Mr. Pitz, Mr. Redd and 2017,Mr. Johnson, the market share price was 81%, 84%, and 84%, respectively. Average in-service utilization is defined asUS$245.01, the average active fleet for the year divided by total cars, excluding company service cars and tank cars as these are utilized only as required for non-revenue movements. As30-day closing price of our shares prior to December 31, 2019 CP ownedon the NYSE, and leased the following unitsvalue of freight cars:these shares were converted to Canadian dollars using theyear-end exchange rate of $1.2988. For comparability, for Mr. Creel, Mr. Brooks, Mr. Pitz, Mr. Redd and Mr. Johnson, the 2017 grant value was converted using an exchange rate of $1.2986. How we calculated the 2017 PSU performance factor | | | | | | | | | Freight cars | Owned | Leased |
| Total | Average Age (in years) |
| | Box car | 2,594 | 250 |
| 2,844 | 30 |
| | Covered hopper | 7,607 | 9,699 |
| 17,306 | 24 |
| | Flat car | 1,461 | 770 |
| 2,231 | 26 |
| | Gondola | 3,648 | 1,440 |
| 5,088 | 21 |
| | Intermodal | 1,319 | 150 |
| 1,469 | 15 |
| | Multi-level autorack | 2,894 | 719 |
| 3,613 | 26 |
| | Company service car | 2,396 | 174 |
| 2,570 | 45 |
| | Open top hopper | 105 | — |
| 105 | 32 |
| | Tank car | 33 | 9 |
| 42 | 12 |
| | Total freight cars | 22,057 | 13,211 |
| 35,268 | 25 |
|
As ofThe PSU performance factor for the three-year period from January 1, 2017 to December 31, 2019 CP owned and leased the following units of intermodal equipment:
| | | | | | | | Intermodal equipment | Owned | Leased |
| Total | Average Age (in years) | | Containers | 8,804 | — |
| 8,804 | 7 | | Chassis | 6,290 | 601 |
| 6,891 | 11 | | Total intermodal equipment | 15,094 | 601 |
| 15,695 | 9 |
Headquarters Office Building
CP owns and operates a multi-building campus in Calgary encompassing the head office building, a data centre, training facility and other office and operational buildings.
The Company's main dispatch centre is located in Calgary, and is the primary dispatching facility in Canada. Rail traffic controllers coordinate and dispatch crews, and manage the day-to-day locomotive management along the network, 24 hours a day, and seven days a week. The operations centre has a complete backup system193%, as shown in the event of any power disruption.
In addition to fully operational redundant systems, CPtable below. The payout value has a fully integrated Business Continuity Centre, should CP's operations centre be affected by any natural disaster, fire, cyber-attack or hostile threat.
CP also maintains a secondary dispatch centre locatedbeen calculated in Minneapolis, where a facility similar toaccordance with the one in Calgary exists. It services the dispatching needs of locomotives and train crews working in the U.S.
Capital Expenditures
The Company incurs expenditures to expand and enhance its rail network, rolling stock and other infrastructure. These expenditures are aimed at improving efficiency and safety of our operations. Such investments are also an integral partterms of the Company's multi-year capital programPSU plan and support growth initiatives. For further details, refer to Item 7. Management’s Discussion and Analysis of Financial Condition and Results of Operations, Liquidity and Capital Resources.the 2017 award agreement.
| | | | | | | | | | | | | | | | | | | | | | | | | | | | | | | | | | | | | | | | | | | | | 3 Year Average Adjusted Return on Invested Capital (1) | | | 14.5% | | | | 15% | | | | 15.5% | | | | | | | | 60% | | | | 200% | | TSR to S&P/TSX Capped Industrial Index | | | 25th
percentile |
| | | 50th
percentile |
| | | 75th
percentile |
| | | 80th
percentile |
| | | 20% | | | | 200% | | TSR to S&P 1500 Road and Rail Index | | | 25th
percentile |
| | | 50th
percentile |
| | | 75th
percentile |
| | | 66.7th
percentile |
| | | 20% | | | | 167% | | | | | | | | | | | | | | | | | | | | | | | | | 193% | |
Encumbrances
Refer to Item 8. Financial Statements and Supplementary Data, Note 18 Debt, for information on the Company's finance lease obligations and assets held as collateral under these agreements.
| (1) | Adjusted Return on Invested Capital is a non-GAAP measure. Non-GAAP measures are defined and reconciled on pages 54-62 of CP’s Annual Report on Form 10-K for the year ended December 31, 2019. |
ITEM 3. LEGAL PROCEEDINGSFor further details, refer to Item 8. Financial Statements and Supplementary Data, Note 26 Commitments and contingencies.
ITEM 4. MINE SAFETY DISCLOSURES
Not applicable.
KEITH E. CREEL PRESIDENT AND CHIEF EXECUTIVE OFFICERCP 2019 ANNUAL REPORT/ 26
INFORMATION ABOUT OUR EXECUTIVE OFFICERS
Our executive officers are appointed by the Board of Directors and they hold office until their successors are appointed, subject to resignation, retirement or removal by the Board of Directors. There are no family relationships among our officers, nor any arrangement or understanding between any officer and any other person pursuant to which the officer was selected. As of the date of this filing, the executive officers’ names, ages and business experience are:
| | |  | | Name, Age and Position | Business Experience | KeithMr. Creel 51 was appointed as President and Chief Executive Officer | Mr. Creel became President and CEO of CP (CEO) on January 31, 2017. Previously,2017, a planned transition that had been in place since he was recruited to CP in February 2013 as President and Chief Operating Officer ("COO") from February 5, 2013, to January 30, 2017.
(COO). Prior to joining CP, Mr. Creel was Executive Vice-Presidenthad a very successful operating career that began in 1992 at Burlington Northern as a management trainee in operations and eventually led to his becoming the EVP and COO at CN in 2010. Mr. Creel obtained a Bachelor of Science in marketing from January 2010Jacksonville State University and has completed the Advanced Management Program at the Harvard Business School. He served as a commissioned officer in the U.S. Army during which time he served in the Persian Gulf War. The end of 2019 marked Mr. Creel’s third year as our President and CEO. This past year, Mr. Creel was focused on developing people, driving safety improvements and pursuing continued sustainable, profitable growth. Mr. Creel was recognized byInstitutional Investor as a member of the 2020All-Canada Executive Team and was ranked as the top CEO in the Capital Goods/Industrials sector. |
2019 individual performance CP’s purpose is to deliver transportation solutions that connect North America and the world. By doing this safely and efficiently, we create long-term, sustainable value for our shareholders and the broader economy. We remain grounded in the foundations of precision scheduled railroading. We operate safely, optimize assets, control costs, provide service and develop people. From our multi-year strategic and business plans to our daily operations and sales and marketing playbooks, everything we do is driven by, and tested against, our purpose, our values and the foundations of precision scheduled railroading. In 2019, Mr. Creel focused on the following key areas: In 2019, Mr. Creel championed the roll out of CP’s three core values of accountability, diversity and pride and appointed a Chief Culture Officer to help sustain and improve its industry-best culture. He also spent considerable time across the CP network engagingwith CP employees, including joining his senior operating team for three CEO town halls. This past year, he led the development and launch of an employee perspective survey to gather actionable data regarding management employee satisfaction and engagement and oversaw the seamless transition of CP’s operating team due to the retirements of Robert Johnson (Executive Vice-President Operations) and Tony Marquis (Senior Vice-President Operations East). Developing leaders internally is essential to CP’s continued success. That commitment is evidenced by Mr. Creel’s continued leadership on CP’s Coaching Capability Program, designed for high-potential managers to expand their leadership skills and create a deep bench of talent at CP. The company also continued its executive coaching program for existing and future leaders to receivecoaching and a customized development program from a certified executive coach. Mr. Creel also led CP’s first executive leadership forum. The forum focused on furthering the development of thought leadership and employee performance potential. Under Mr. Creel’s leadership, 2019 also saw CP release its first ever diversity and inclusion report, numerous panel discussions involving senior leadership focused on the advancement of women at CP, and CP being named the fourth overall Military Friendly® employer in the United States. Driving safety improvements For the 14th year in a row, CP had the lowestFRA-reportable train accident frequency of any North American Class 1 railway. That said, safety is not about a destination, but a constant journey. Mr. Creel led the initiative to increase the weighting on CP’s safety measure within our STIP, reinforcing CP’s commitment to safety. Under his leadership, CP continues to highlight the Home Safe program, which empowers all employees to begin a safety conversation, regardless of seniority or position, in the workplace and at home. This program, along with a personal commitment from each of CP’s employees, has led to a 20% reduction in personal injury rate since its inception. This past year, CP also hosted its first Safety Awards for Excellence gala, celebrating outstanding employee safety leadership.
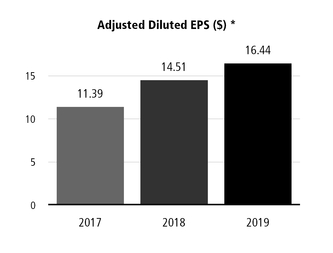
Driving sustainable, profitable growth Under Mr. Creel’s leadership, CP was able to achieve its highest-ever revenues and lowest-ever yearly operating ratio in 2019. This is a result of the company’s disciplined approach to sustainable, profitable growth - a plan rooted in the foundations of precision scheduled railroading. Despite challenging macroeconomic conditions, revenues increased 7 percent to a record $7.79 billion. Diluted earnings per share (EPS) increased 30 percent to a record $17.69 from $13.61 and adjusted diluted EPS(1) rose 13 percent to a record $16.44 from $14.51. As a result of Mr. Creel’s efforts and leadership, CP led the industry in volume growth and revenue growth for a second consecutive year. In 2019, CP realized gains in intermodal, automotive, forest products, and energy, chemicals and plastics. Across all lines of business, there were key contract wins throughout the year that set CP up well for 2020 and beyond. Mr. Creel spearheaded CP’s efforts to extend its reach through various initiatives in 2019 including the acquisition of the Central Maine & Quebec Railway and the opening of new compounds and transload terminals across the CP network. Additionally, this past year Mr. Creel held several meetings with a broad range of external stakeholders, including investors, Indigenous Peoples, industry associations, government, regulators, customers and policy makers. He also met regularly with current and prospective shareholders at industry conferences, at CP’s headquarters, and at shareholder offices across Canada, the United States and Europe. With Mr. Creel at the helm, the company remains focused on safely harnessing our network capacity to provide unique solutions that leverage our network strengths and superior service. The assessment was reviewed by the Compensation Committee and reviewed and approved by the Board. The table below shows the compensation awarded to Mr. Creel for 2019. | | | | | | | | | Compensation (in CAD $‘000) | | | | | | | | | | | | | | 1,538 | | | | | | | | | | | | 2,979 | | | | | | | | | | | | 5,870 | | | | | | 3,642 | | | Total direct compensation | | | 14,029 | | | Total target direct compensation | | | 11,147 | | | | Salary is the actual amount received in the year. Payments made in U.S. dollars have been converted to February 2013. During his timeCanadian dollars using an average exchange rate for the year of $1.3269. | | | | |
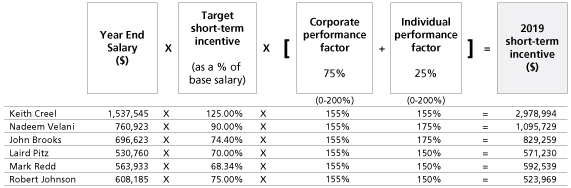
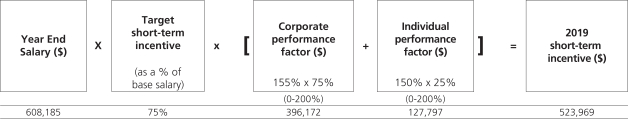
Mr. Creel’s salary was increased to US$1,158,750 in 2019.
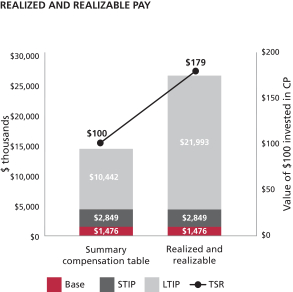
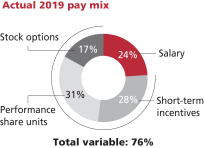
2019 Short-term incentive Based on our 2019 corporate performance and the board’s assessment of his individual performance, Mr. Creel received a cash bonus of $2,978,994 for 2019, calculated as follows: Year EndSalary ($)XTargetshort-termincentiveX[Corporateperformancefactor ($)+Individualperformancefactor ($)]=2019short-termincentive ($)(as a % ofbase salary)155%x 75%155%x 25%(0-200%)(0-200%)1,537,545125%2,234,245744,7492,978,994 Hisyear-end salary and the 2019 STIP award were paid in U.S. dollars and have been converted to Canadian dollars using an average exchange rate of $1.3269 for 2019. Mr. Creel received annual 2019 long-term incentive awards with a total grant value of $9,512,269, 100% of his target award. The grant was allocated as 60% PSUs and 40% stock options. Realized and realizable pay The value of Mr. Creel’s incentive compensation is based on our performance over the period and, for the long-term incentive, our share price when the awards vest. The graph below shows the three-year average of Mr. Creel’s granted and realized and realizable pay from 2017 to 2019. Summary compensation table: average of salary earned, actual cash bonus received, and long-term incentives granted (using the grant date fair value from 2017 to 2019 as disclosed in the summary compensation table on page 43). The compensation figures have been converted to Canadian dollars using the following average exchange rates: $1.3269 for 2019, $1.2957 for 2018 and $1.2986 for 2017.Realized and realizable pay: average of salary earned, actual cash bonus received, the value of long-term incentive awards that have vested or been exercised, and the estimated current value of unvested long-term incentive awards granted from 2017 to 2019.the value of vested 2017 PSUs paid in February 2020 was calculated using the30-day average trading price of our shares prior to December 31, 2019 of US$245.01 on the NYSE with a performance multiplier of 1.93 and includes dividends earned up to the payment date.
the value of unvested 2018 and 2019 PSUs are based on the closing price of our shares on December 31, 2019 of US$254.95 on the NYSE with a performance multiplier of 1.0. PSUs include reinvestment of additional units received as dividend equivalents the value of unvested/unexercised stock options is based on the closing price of our shares on December 31, 2019 of US$254.95 on the NYSE the compensation figures for salary earned and actual bonus received have been converted to Canadian dollars using the following average exchange rates: $1.3269 for 2019, $1.2957 for 2018 and $1.2986 for 2017. the value of any realized and realizable PSUs and Stock Options have been converted into Canadian dollars using the 2019year-end exchange rate of $1.2988 Theup-front performance stock options grant received in 2017 is included in realizable pay We also compare the realized and realizable value of $100 awarded in total direct compensation to Mr. Creel in each year to the value of $100 invested in our shares on the first trading day of the period, assuming reinvestment of dividends to show a meaningful comparison of shareholder value. Pay linked to shareholder value The table below shows Mr. Creel’s total direct compensation in Canadian dollars in each of the last three years, compared to its realized and realizable value as at December 31, 2019. We also compare the realized and realizable value of $100 awarded in total direct compensation to Mr. Creel in each year to the value of $100 invested in CP shares on the first trading day of the period, assuming reinvestment of dividends, to show a meaningful comparison of shareholder value. | | | | | | | | | | | | | | | | | | | | | | | (in CAD $‘000) | | | | | | | | | | | Value of $100 | | | | | | | | Realized and realizable value of compensation as at
December 31, 2019 | | | | | | | | | | | | | | 18,780,304 | | | | 48,994,522 | | | | Jan 1, 2017 to Dec 31, 2019 | | | | 260.88 | | | | 178.55 | | | | | 11,491,066 | | | | 14,640,604 | | | | Jan 1, 2018 to Dec 31, 2019 | | | | 127.41 | | | | 147.41 | | | | | 14,029,129 | | | | 15,318,711 | | | | Jan 1, 2019 to Dec 31, 2019 | | | | 109.19 | | | | 138.38 | |
Mr. Creel’s compensation awarded is as disclosed in the summary compensation table. Mr. Creel’s realized and realizable value for salary earned and actual bonus received have been converted to Canadian dollars using the following average exchange rates: $1.2986 for 2017, $1.2957 for 2018 and for $1.3269 for 2019. The value of any realized and realizable long-term incentive is converted into Canadian dollars using the 2019year-end exchange rate of $1.2988. Equity ownership (at February 28, 2020)| | | | | | | | | | | | | | | | (as a multiple of salary) | | Minimum
ownership value ($) | | | Shares ($) | | Deferred share
units ($) | | Total ownership
value ($) | | Total ownership
(as a multiple of salary) | | | | | 9,616,608 | | | 1,166,073 | | 10,666,164 | | 11,832,237 | | | 7.38x | |
Mr. Creel has met his share ownership requirements. Values are based on US$248.77, the closing price of our shares on the NYSE on February 28, 2020 and have been converted using an exchange rate of $1.3429. The Compensation Committee, in collaboration with Kingsdale, reviewed Mr. Creel’s compensation relative to our Class 1 Railroad peers. Through this benchmarking, it was determined that Mr. Creel’s long-term incentive target was considerably below the median. Effective January 1, 2020, Mr. Creel received a 3% increase in base salary, and his long-term incentive target became 660% of his base salary. Consistent with Mr. Creel’s 2016 employment agreement, his 660% long-term incentive target has been reduced by 100% (to a total of 560% each year) until the end of 2021 to fund an upfront performance grant that he received in 2017. | (1) | Adjusted diluted EPS is anon-GAAP measure.Non-GAAP measures are defined and reconciled on pages 54-62 of CP’s Annual Report on Form10-K for the year ended December 31, 2019. |
NADEEM S. VELANI EXECUTIVE VICE-PRESIDENT AND CHIEF FINANCIAL OFFICER | | |  | | Mr. Velani was appointed Vice-President and Chief Financial Officer (CFO) on October 18, 2016 and was appointed Executive Vice-President and Chief Financial Officer on October 17, 2017. Mr. Velani is a key member of the senior management team responsible for the long-term strategic direction of the Company. Other responsibilities include financial planning, reporting and accounting systems, as well as pension, treasury, investor relations and tax functions. Mr. Velani joined CP in March 2013 and most recently served as Vice-President Investor Relations. Prior to CP, Mr. Velani spent approximately 15 years at CN where he worked in a variety of positions in financial planning, sales and marketing, investor relations and the Office of the President and CEO. |
2019 individual performance The CEO assessed Mr. Velani’s performance against his individual performance objectives. In 2019, Mr. Velani: executed the company’s strategic multi-year plan to drive sustainable profitable growth; championed company-wide leadership development including as Chair of CP’s Leadership Development Steering Committee; improved the forecasting and budgeting process to help align resources in a volatile macro-economic environment, and continued to implement CP’s pension asset management strategy. Mr. Velani also delivered on CP’s financial principles, including a capital allocation strategy to support robust, long-term shareholder returns. Mr. Velani was recognized byInstitutional Investor as a member of the inaugural 2020All-Canada Executive Team. He was ranked as the top CFO in the Capital Goods/Industrials sector as voted on bybuy-side analysts, money managers and sell-side researchers. Mr. Velani was assessed as exceeding his individual performance objectives for the year. The assessment was reviewed by the Compensation Committee and reviewed and approved by the Board. The table below is a summary of the compensation awarded to Mr. Velani for 2019. | | | | | | | | | Compensation (in CAD $‘000) | | | | | | | | | | | | | | 751 | | | | | | | | | | | | 1,096 | | | | | | | | | | | | 1,552 | | | | | | 979 | | | Total direct compensation | | | 4,378 | | | Total target direct compensation | | | 3,538 | |
Mr. Velani’s salary was increased to US $566,500 in 2019. His salary was paid in Canadian dollars based on a foreign exchange rate of $1.3432. 2019 short-term incentive Based on our 2019 corporate performance and the CEO’s assessment of his individual performance, Mr. Velani received a cash bonus of $1,095,729 for 2019, calculated as follows: Year EndSalary ($)XTargetshort-termincentiveX[Corporateperformancefactor ($)+Individualperformancefactor ($)]=2019short-termincentive ($)(as a % ofbase salary)155%x 75%175%x 25%(0-200%)(0-200%)760,92390%796,116299,6131,095,729
Mr. Velani received annual 2019 long-term incentive awards with a total grant value of $2,531,053, 100% of his target award. The grant was allocated as 60% PSUs and 40% stock options. Equity ownership (at February 28, 2020)| | | | | | | | | | | | | | | | | | | | | | (as a multiple of salary) | | Minimum
ownership value ($) | | | Shares ($) | | | Deferred share
units ($) | | | Total ownership
value ($) | | | Total ownership
(as a multiple of salary) | | | | | 2,363,511 | | | | 204,541 | | | | 2,373,218 | | | | 2,577,759 | | | | 3.27x | |
Mr. Velani has met his share ownership requirements. Values are based on $332.67, the closing price of our common shares on the TSX on February 28, 2020. A comprehensive market review was conducted to assess Mr. Velani’s compensation relative to our peer group median. It was determined that Mr. Velani’s total direct compensation was below the market median. Therefore, effective January 1, 2020, his long-term incentive target was increased to 300% of base salary from 275%. He also received a 6% increase in base salary effective February 1, 2020.
JOHN K. BROOKS EXECUTIVE VICE-PRESIDENT AND CHIEF MARKETING OFFICER | | |  | | Mr. CreelBrooks was appointed Executive Vice-President and Chief Marketing Officer (CMO) on February 14, 2019. During the financial year ended December 31, 2018, Mr. Brooks was CP’s Senior Vice-President and Chief Marketing Officer. During Mr. Brooks’ sales and marketing career he has held various positionssenior responsibilities in all lines of business, including coal, chemicals, merchandise products, grain and intermodal. He began his railroading career with Union Pacific and later helped start I&M Rail Link, LLC, which was purchased by the Dakota, Minnesota and Eastern Railroad (DM&E) in 2002. Mr Brooks was Vice-President of Marketing at the DM&E prior to it being acquired by CP in 2007. In the role of CMO, Mr. Brooks is responsible for CP’s business units and leading a group of highly capable sales and marketing professionals across North America. In addition, Mr. Brooks is responsible for strengthening partnerships with existing customers, generating new opportunities for growth, enhancing the value of the company’s service offerings and developing strategies to optimize CP’s book of business. |
2019 individual performance The CEO assessed Mr. Brooks’ performance in 2019 against his individual performance objectives, which included the ongoing development and organization of the sales and marketing team, revenue growth, improving the quality of revenue, customer relationships and network development by expanding our reach through new market offerings, transloads and short lines and enhancing our product offering. Throughout 2019, Mr. Brooks was also focused on proactive customer engagement which included: measuring customer experience, hosting a customer advisory council, hosting meetings of short line railroads and transload operators, recognizing customers through initiatives such as our safe shipper awards and the new grain elevator of the year award. In addition, Mr. Brooks leads his team in the development, measurement and presentation of CP’s annual and multi-year business plan. Mr. Brooks was assessed as having exceeded his overall individual performance objectives. The assessment was reviewed by the Compensation Committee and reviewed and approved by the Board. The table below is summary of the compensation awarded to Mr. Brooks for 2019. | | | | | | | | | Compensation (in CAD $‘000) | | | | | | | | | | | | | | 670 | | | | | | | | | | | | 829 | | | | | | | | | | | | 1,197 | | | | | | 697 | | | Total direct compensation | | | 3,393 | | | Total target direct compensation | | | 2,782 | | | Salary is the actual amount received that year. Payments made in U.S. dollars have been converted to Canadian dollars using an average exchange rate for the year of $1.3269. | |
Effective February 14, 2019, Mr. Brooks was promoted to Executive Vice-President and Chief Marketing Officer. His salary was increased to US$525,000.
2019 short-term incentive Mr. Brooks’ annual bonus target was prorated to 74.4% of his base salary in 2019 to reflect his time at the new target associated with his promotion. Based on our 2019 corporate performance and the CEO’s assessment of his individual performance, Mr. Brooks received a cash bonus of $829,259 for 2019, calculated as follows: Year EndSalary ($)XTargetshort-termincentiveX[Corporateperformancefactor ($)+Individualperformancefactor ($)]=2019short-termincentive ($)(as a % ofbase salary)155%x 75%175%x 25%(0-200%)(0-200%)696,62374.40%602,509226,750829,259 Hisyear-end salary and the 2019 STIP award were paid in U.S. dollars and have been converted to Canadian dollars using an average exchange rate of $1.3269 for 2019. Mr. Brooks’ long-term incentive target was increased to 225% of his annual salary. He received 2019 long-term incentive awards with a total grant value of $1,893,801 which included a top up stock option grant received in February 2019 with a grant value of $194,149 to bring him to the Executive Vice-President level. The grants were allocated as 60% PSUs and 40% stock options. Equity ownership (at February 28, 2020)| | | | | | | | | | | | | | | | | | | | | | (as a multiple of salary) | | Minimum
ownership value ($) | | | Shares ($) | | | Deferred share
units ($) | | | Total ownership
value ($) | | | Total ownership
(as a multiple of salary) | | | | | 2,220,821 | | | | 692,832 | | | | 615,076 | | | | 1,307,908 | | | | 1.77x | |
Mr. Brooks is on track to meet his share ownership requirements by February 2024. Values are based on US$248.77, the closing price of our shares on the NYSE on February 28, 2020 and have been converted using an exchange rate of $1.3429. Mr. Brooks was promoted to Executive Vice-President and Chief Marketing Officer on February 14, 2019. Commensurate with his promotion and supplemented by a competitive market review, effective January 1, 2020, his short-term incentive target was increased to 90% of his base salary from 75% and his long-term incentive target was increased to 275% of base salary from 225%. He also received a 5% increase in base salary effective February 1, 2020.
LAIRD J. PITZ SENIOR VICE-PRESIDENT AND CHIEF RISK OFFICER | | |  | | Mr. Pitz was promoted to Senior Vice-President and Chief Risk Officer in October of 2017. This was part of the overall realignment of the risk and insurance functions for succession purposes, and to retain Mr. Pitz for the necessary development of the succession candidates. He is responsible for all aspects of risk-management in Canada and the U.S., including police services, casualty and general claims, environmental risk, field safety and systems, operational regulatory affairs and training, disability management and forensic audit investigations. Mr. Pitz joined CP on April 2, 2014, as Vice-President of Security and Risk Management. Mr. Pitz, a Vietnam War veteran and former FBI special agent, is a40-year career professional who has directed strategic and operational risk-mitigation, security and crisis-management functions for companies operating in a wide range of fields including defense, logistics and transportation. |
2019 individual performance The CEO assessed Mr. Pitz’s performance in 2019 against his individual performance objectives, which focused on the development of succession candidates in risk mitigation and safety and sustainability; and managing risk and reducing liability in several key areas: safety, environmental, insurance, police, security, casualty management, damage prevention, regulatory, operating practices, forensic and disability management. Under Mr. Pitz’s leadership, CP has made significant progress in mitigating its overall risk and liability, while supporting sustainable growth including the following results in 2019: $88 million cost control of monetary exposure; evaluating our most significant environmental, social and governance topics impacting the company; securing an independent insurance portfolio to protect the company against uncertain insurable losses; executing a resilient emergency response and crisis preparedness practice; and improving CP’s safety culture through Home Safe initiatives and technical training programs resulting in a 4% reduction in FRA Personal Injury frequency to 1.42 (lowest in CP’s history) and industry leading FRA Train Accident frequency of 1.06. Mr. Pitz was assessed as having exceeded his overall individual performance objectives. The assessment was reviewed by the Compensation Committee and reviewed and approved by the Board. The table below is a summary of the compensation awarded to Mr. Pitz for 2019. | | | | | | | | | Compensation (in CAD $‘000) | | | | | | | | | | | | | | 529 | | | | | | | | | | | | 571 | | | | | | | | | | | | 811 | | | | | | 503 | | | Total direct compensation | | | 2,414 | | | Total target direct compensation | | | 1,964 | | | Salary is the actual amount received that year. Payments made in U.S. dollars have been converted to Canadian dollars using an average exchange rate for the year of $1.3269. | |
Mr. Pitz’s salary was increased to US$400,000 in 2019.
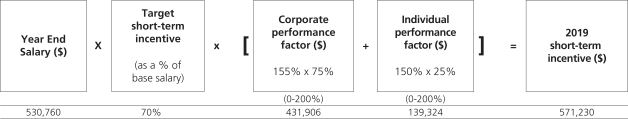
2019 short-term incentive Based on our 2019 corporate performance and the CEO’s assessment of his individual performance, Mr. Pitz received a cash bonus of $571,230 for 2019, calculated as follows: Year EndSalary ($)XTargetshort-termincentiveX[Corporateperformancefactor ($)+Individualperformancefactor ($)]=2019short-termincentive ($)(as a % ofbase salary)155%x 75%150%x 25%(0-200%)(0-200%)530,76070%431,906139,324571,230 Hisyear-end salary and 2019 STIP award were made in U.S. dollars and have been converted to Canadian dollars using an average exchange rate of $1.3269 for 2019. Mr. Pitz also received 2019 annual long-term incentive awards with a total grant value of $1,313,416, 100% of his target award. The grant was allocated 60% PSUs and 40% stock options. Equity ownership (at February 28, 2020)| | | | | | | | | | | | | | | | | | | | | | (as a multiple of salary) | | Minimum
ownership value ($) | | | Shares ($) | | | Deferred share
units ($) | | | Total ownership
value ($) | | | Total ownership
(as a multiple of salary) | | | | | 1,106,550 | | | | 25,724 | | | | 1,485,075 | | | | 1,510,799 | | | | 2.73x | |
Mr. Pitz has met his share ownership requirements. Values are based on US$248.77, the closing price of our shares on the NYSE on February 28, 2020 and have been converted using an exchange rate of $1.3429.
MARK A. REDD EXECUTIVE VICE-PRESIDENT OPERATIONS | | |  | | Mr. Redd was appointed Executive Vice-President Operations Senioreffective September 1, 2019. Mr. Redd oversees the 24/7 operations of CP’s network including those teams responsible for network transportation, operations, mechanical, engineering, procurement and labour relations. Mr. Redd brings to his role considerable leadership experience in rail operations and safety excellence. Mr. Redd joined CP in October 2013. In April 2016, he was appointed Vice-President Eastern Region, Senior Vice-PresidentOperations Western Region, and Vice-President of the Prairie Division. Mr. Creel began his railroad career at Burlington Northern Railway in 1992 as an intermodal ramp manager in Birmingham, Alabama. He also spent part of his career at Grand Trunk Western Railroad as a superintendent and general manager, and at Illinois Central Railroad as a trainmaster and director of corridor operations, priorwas promoted to its merger with CN in 1999.
| Mark Redd, 49
Executive Vice-President, Operations
| Mr. Redd has been Executive Vice-President Operations since September 1, 2019. Before this appointment, he was Senior Vice-President Operations Western Region fromin February 2, 2017 to August 31, 2019 and Vice-President Operations Western Region from April 20, 2016 to February 1, 2017.
Previous Prior to these roles, he was General Manager Operations U.S. West and General Manager Operations Central Division. He was named CP'sCP’s 2016 Railroader of the Year. Prior to joining CP in October 2013,
Mr. Redd worked forbegan his railroading career at Midsouth Rail in Jackson, Mississippi, as a brakeman and conductor, before moving to Kansas City Southern (KCS) as an engineer. Throughout his over 20 years at Kansas City Southern Railway where heKCS, Mr. Redd held a variety of leadership positions in network and field operations. Mr. Redd holds bachelor and Master of Business Administration ("MBA") degrees from the University of Missouri – Kansas City. | Nadeem Velani, 47
Executiveoperations, including Vice-President and Chief Financial Officer
| Mr. Velani has been Executive Vice-President and CFO of CP since October 17, 2017. Previous to this appointment, he was the Vice-President and CFO of CP from October 19, 2016 to October 16, 2017, Vice-President, Investor Relations from October 28, 2015 and Assistant Vice-President, Investor Relations from March 11, 2013.
Prior to joining CP, Mr. Velani spent 15 years at CNTransportation where he workedoversaw key operating functions in a variety of positions in Strategicthe U.S. and Financial Planning, Investor Relations, Sales and Marketing, andMexico. During this time, he also served as the OfficeChairman of the President and CEO.
Mr. Velani holds a Bachelor of Economics degree from Western University and an MBAoperating board for the Port Terminal Railroad Association in Finance/International Business from McGill University.Houston, Texas.
| John Brooks, 49
Executive Vice-President and Chief Marketing Officer
| Mr. Brooks has been Executive Vice-President and Chief Marketing Officer ("CMO") of CP since February 14, 2019. Previous to this appointment, he was the Senior Vice-President and CMO of CP from February 14, 2017 to February 13, 2019. He has worked in senior marketing roles at CP since he joined the Company in 2007, most recently as Vice-President, Marketing – Bulk and Intermodal.
Mr. Brooks began his railroading career with UP and later helped start I&M Rail Link, LLC, which was purchased by DM&E in 2002. Mr. Brooks was Vice-President, Marketing at DM&E prior to it being acquired by CP in 2007.
With more than 20 years in the railroading business, Mr. Brooks brings a breadth of experience to the CMO role that is pivotal to CP's continued and future success.
| James Clements, 50
Senior Vice-President, Strategic Planning and Technology Transformation
| Mr. Clements has been Senior Vice-President, Strategic Planning and Technology Transformation since September 1, 2019. Before this appointment, he was the Vice-President, Strategic Planning and Transportation Services of CP since 2014. Mr. Clements has responsibilities that include strategic network issues, Network Service Centre operations and Information Services. In addition, he has responsibility for all of CP’s facilities and real estate across North America.
Mr. Clements has been at CP for 25 years and his previous experience covers a wide range of areas of CP’s business, including car management, finance, joint facilities agreements, logistics, grain marketing and sales in both Canada and the U.S., as well as marketing and sales responsibility for various other lines of business at CP.
He has an MBA in Finance/International Business from McGill University and a Bachelor of Science in Computer Science and Mathematics from McMaster University.
|
27 /SERVICE EXCELLENCE
2019 individual performance
| | | Jeffrey Ellis, 52
Chief Legal Officer and Corporate Secretary
| Mr. Ellis has been Chief Legal Officer and Corporate Secretary of CP since November 23, 2015. Mr. Ellis is accountable for the overall strategic leadership, oversight andThe CEO assessed Mr. Redd’s performance of the legal, corporate secretarial, government relations and public affairs functions of CP in Canada and the U.S.
Prior to joining CP in 2015, Mr. Ellis was the U.S. General Counsel at BMO Financial Group. Before joining BMO in 2006, Mr. Ellis was with the law firm of Borden Ladner Gervais LLP in Toronto, Ontario.
Mr. Ellis has Bachelor of Arts and Master of Arts degrees from the University of Toronto, Juris Doctor and Master of Laws degrees from Osgoode Hall Law School, and an MBA from the Richard Ivey School of Business, Western University. Mr. Ellis is a member of the bars of New York, Illinois, Ontario and Alberta.
| Mike Foran, 46
Vice-President, Market Strategy and
Asset Management
| Mr. Foran has been Vice-President, Market Strategy and Asset Management of CP since February 14, 2017. His prior roles with CP include Vice-President Network Transportation from 2014 to 2017, Assistant Vice-President Network Transportation from 2013 to 2014, and General Manager – Asset Management from 2012 to 2013. In over 20 years at CP, Mr. Foran has worked in operations, business development, marketing and general management.
Mr. Foran holds an Executive MBA from the Ivey School of Business at Western University and a Bachelor of Commerce from the University of Calgary.
| Michael Redeker, 59
Vice-President and Chief Information Officer
| Mr. Redeker has been Vice-President and Chief Information Officer ("CIO") of CP since October 15, 2012.
Prior to joining CP, Mr. Redeker was Vice-President and CIO of Alberta Treasury Branch from May 2007 to September 2012. He also spent 11 years at IBM Canada, where he focused on delivering quality information technology services within the financial services industry.
| Laird Pitz, 75
Senior Vice-President and Chief Risk Officer
| Mr. Pitz has been Senior Vice-President and Chief Risk Officer ("CRO") of CP since October 17, 2017. Previously, he was the Vice-President and CRO of CP from October 29, 2014 to October 16, 2017 and the Vice-President, Security and Risk Management of CP from April 2014 to October 2014.
Prior to joining CP, Mr. Pitz was retired from March 2012 to April 2014, and Vice-President, Risk Mitigation of CN from September 2003 to March 2012.
Mr. Pitz, a Vietnam War veteran and former Federal Bureau of Investigation special agent, is a 40-year career professional who has directed strategic and operational risk mitigation, security and crisis management functions for companies operating in a wide range of fields, including defence, logistics and transportation.
| Chad Rolstad, 43
Vice-President, Human Resources and Chief Culture Officer
| Mr. Rolstad has been Vice-President, Human Resources since February 14, 2019 and the Chief Culture Officer since September 1, 2019. Previous to this appointment, he was Assistant Vice-President, Human Resources of CP from August 1, 2018 to February 13, 2019 and Assistant Vice-President, Strategic Procurement of CP from April 10, 2017 to July 31, 2018.
Prior to joining CP, Mr. Rolstad held various leadership positions at BNSF Railway in marketing and operations.
Mr. Rolstad has a Bachelor of Science from the Colorado School of Mines and an MBA from Duke University.
|
CP 2019 ANNUAL REPORT/ 28
PART II
ITEM 5. MARKET FOR REGISTRANT'S COMMON EQUITY, RELATED SHAREHOLDER MATTERS AND ISSUER PURCHASES OF EQUITY SECURITIES
Share Information
The Common Shares are listedagainst his individual performance objectives. Mr. Redd focused on the TSXtransitioning his leadership team which included delivering world class service to our customers by executing CP’s precision scheduled railroading model, leading CP’s safety efforts, and on the NYSE under the symbol "CP".
Share Capital
At February 18, 2020, the latest practicable date priorcontinuing to the date of this Annual Report on Form 10-K, there were 136,748,767 Common Shares and no preferred shares issued and outstanding, which consists of 13,928 holders of record of the Common Shares. In addition, CP has a Management Stock Option Incentive Plan (“MSOIP”), under which key officers and employees are granted options to purchase the Common Shares. Each option granted can be exercised for one Common Share. At February 18, 2020, 1,569,063 options were outstanding under the MSOIP and stand-alone option agreements entered into with Mr. Keith Creel. There are 895,948 options available to be issued by the Company’s MSOIPdevelop his team in the future. CParea of technical and leadership skills at all levels. Aligning his team through collaboration while maintaining healthy constructive tension within the teams has a Director's Stock Option Plan (“DSOP”), underallowed the operations department to excel in supporting CP’s five foundations. Mr. Redd promoted and advanced CP’s Home Safe efforts which directors are granted options to purchase Common Shares. There are no outstanding options under the DSOP, which has 340,000 options available to be issuedresulted in the future.
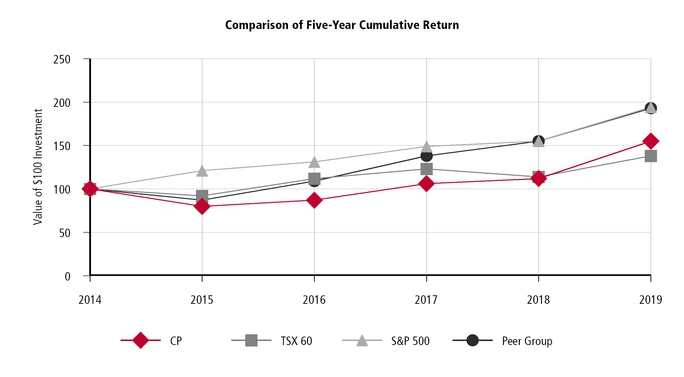
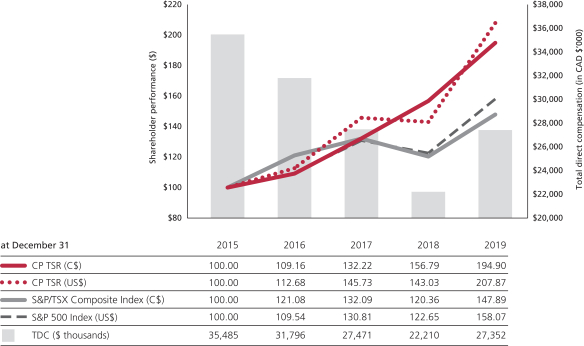
Stock Performance Graph
The following graph provides an indicator of cumulative total shareholder return on the Common Shares, of an assumed investment of $100, as compared to the TSX 60 Index (“TSX 60”), the Standard & Poor's 500 Stock Index (“S&P 500”),lowest personal injury rates and the peer group index (comprising CN, KCS, UP, NS and CSX) on December 31 for each of the years indicated. The values for the assumed investments depicted on the graph andfrequency in the table have been calculated assuming that any dividends are reinvested.
CP 2019 ANNUAL REPORT/ 30
Issuer Purchasehistory of Equity Securities
CPCP. Decreased cycle times for bulk trains yielded record results in several commodity groups for carload and tonnage moved. Mr. Redd’s persistent focus on precision scheduled railroading has established a share repurchase program which is further describedimproved operating efficiencies, proven by CP’s industry-leading third quarter results and positioning the company well in Item 8. Financial Statements and Supplementary Data, Note 22 Shareholders' equity. During 2019, CP repurchased 3.8 million Common Shares for $1,141 million at a weighted average price of $300.65. The following table presents the number of Common Shares repurchased during each month for the fourth quarter of 2019 and the average price paid by CP for the repurchase of such Common Shares.into 2020. Mr. Redd was assessed as having exceeded his overall individual performance objectives.
The assessment was reviewed by the Compensation Committee and reviewed and approved by the Board. | | | | | | | | | | | | 2019 | Total number of shares purchased(1) |
| Average price paid per share(2) |
| Total number of shares purchased as part of publicly announced plans or programs |
| Maximum number of shares (or units) that may yet be purchased under the plans or programs |
| | October 1 to October 31 | 312,279 |
| $ | 284.65 |
| 312,279 |
| — |
| | November 1 to November 30 | — |
| — |
| — |
| — |
| | December 1 to December 31 | 298,409 |
| 333.96 |
| 298,409 |
| 4,502,453 |
| | Ending Balance | 610,688 |
| $ | 308.74 |
| 610,688 |
| N/A |
|
2019 compensation (1) Includes shares repurchased but not yet cancelled at quarter end.
(2) Includes brokerage fees.
31 /SERVICE EXCELLENCE
ITEM 6. SELECTED FINANCIAL DATA
The following table presents as of, and for the years ended, December 31, selected financial data related to the Company’s financial results for the last five fiscal years. The selected financial data should be read in conjunction with Item 7. Management’s Discussion and Analysis of Financial Condition and Results of Operations and Item 8. Financial Statements and Supplementary Data.
For information regarding historical exchange rates, please see Impact of Foreign Exchange on Earnings in Item 7. Management’s Discussion and Analysis of Financial Condition and Results of Operations.
| | | | | | | | | | | | | | | | | | (in millions, except per share data, percentage and ratios) | 2019 |
| 2018 |
| 2017 |
| 2016 |
| 2015 |
| | Financial Performance and Liquidity | | | | | | | Total revenues | $ | 7,792 |
| $ | 7,316 |
| $ | 6,554 |
| $ | 6,232 |
| $ | 6,712 |
| | Operating income | 3,124 |
| 2,831 |
| 2,519 |
| 2,411 |
| 2,618 |
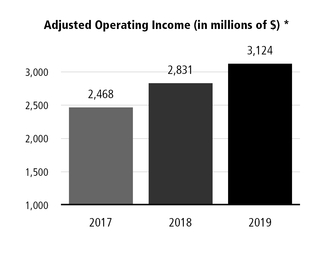
| Adjusted operating income(1) | 3,124 |
| 2,831 |
| 2,468 |
| 2,411 |
| 2,550 |
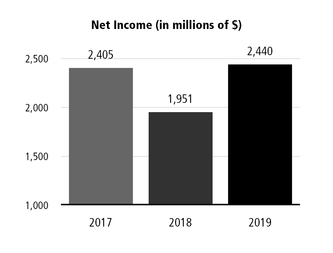
| | Net income | 2,440 |
| 1,951 |
| 2,405 |
| 1,599 |
| 1,352 |
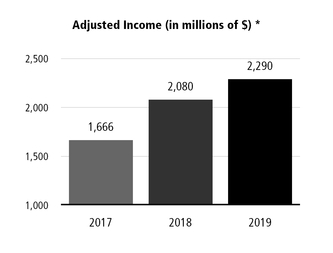
| Adjusted income(1) | 2,290 |
| 2,080 |
| 1,666 |
| 1,549 |
| 1,625 |
| | Basic earnings per share ("EPS") | 17.58 |
| 13.65 |
| 16.49 |
| 10.69 |
| 8.47 |
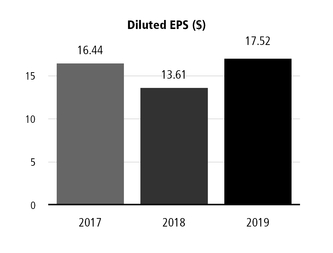
| | Diluted EPS | 17.52 |
| 13.61 |
| 16.44 |
| 10.63 |
| 8.40 |
| Adjusted diluted EPS(1) | 16.44 |
| 14.51 |
| 11.39 |
| 10.29 |
| 10.10 |
| | Dividends declared per share | 3.1400 |
| 2.5125 |
| 2.1875 |
| 1.8500 |
| 1.4000 |
| | Cash provided by operating activities | 2,990 |
| 2,712 |
| 2,182 |
| 2,089 |
| 2,459 |
| | Cash used in investing activities | (1,803 | ) | (1,458 | ) | (1,295 | ) | (1,069 | ) | (1,123 | ) | | Cash used in financing activities | (1,111 | ) | (1,542 | ) | (700 | ) | (1,493 | ) | (957 | ) | Free cash(1) | 1,357 |
| 1,289 |
| 874 |
| 1,007 |
| 1,381 |
| | Financial Position | | | | | | Total assets(2) | $ | 22,367 |
| $ | 21,254 |
| $ | 20,135 |
| $ | 19,221 |
| $ | 19,637 |
| | Total long-term debt, including current portion | 8,757 |
| 8,696 |
| 8,159 |
| 8,684 |
| 8,957 |
| | Total shareholders' equity | 7,069 |
| 6,636 |
| 6,437 |
| 4,626 |
| 4,796 |
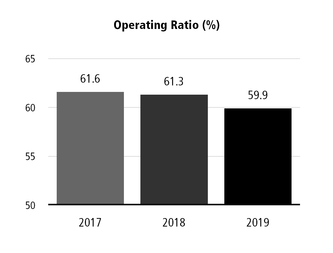
| | Financial Ratios | | | | | | Operating ratio(3) | 59.9 | % | 61.3 | % | 61.6 | % | 61.3 | % | 61.0 | % | Adjusted operating ratio(1) | 59.9 | % | 61.3 | % | 62.4 | % | 61.3 | % | 62.0 | % | Return on invested capital ("ROIC")(1) | 17.9 | % | 15.3 | % | 20.5 | % | 14.4 | % | 12.9 | % | Adjusted ROIC(1) | 16.9 | % | 16.2 | % | 14.7 | % | 14.0 | % | 15.2 | % | Dividend payout ratio(4) | 17.9 | % | 18.5 | % | 13.3 | % | 17.4 | % | 16.7 | % | Adjusted dividend payout ratio(1) | 19.1 | % | 17.3 | % | 19.2 | % | 18.0 | % | 13.9 | % | Long-term debt to Net income ratio(5) | 3.6 |
| 4.5 |
| 3.4 |
| 5.4 |
| 6.6 |
| Adjusted net debt to adjusted EBITDA ratio(1) | 2.4 |
| 2.6 |
| 2.6 |
| 2.9 |
| 2.8 |
|
| | | | | | | | These measures have no standardized meanings prescribed by accounting principles generally accepted in the United States of America ("GAAP") and, therefore, may not be comparable to similar measures presented by other companies. These measures are defined and reconciled in Non-GAAP Measures in Item 7. Management’s Discussion and Analysis of Financial Condition and Results of Operations. |
| | (2)Compensation (in CAD $‘000) | Current period amount is as reported in compliance with GAAP following the adoption of Accounting Standards Update ("ASU") 2016-02 under the cumulative effect adjustment transition approach, discussed further in Item 8. Financial Statements and Supplementary Data, Note 2 Accounting changes. The comparative periods' amounts have not been restated and continue to be reported under the accounting standards in effect for those periods. |
| | | Operating ratio is defined as operating expenses divided by revenues. |
| | (4)
| Dividend payout ratio is defined as dividends declared per share divided by Diluted EPS. |
| | (5)
| Long-term debt to Net income ratio is defined as long-term debt, including long-term debt maturing within one year, divided by Net income. |
CP 2019 ANNUAL REPORT/ 32
ITEM 7. MANAGEMENT'S DISCUSSION AND ANALYSIS OF FINANCIAL CONDITION AND RESULTS OF OPERATIONS
INDEX TO MANAGEMENT'S DISCUSSION AND ANALYSIS
| | | | | Page | Executive Summary | | 2020 Outlook | | Performance Indicators | | Results of Operations | | Impact of Foreign Exchange on Earnings | | Impact of Fuel Price on Earnings | | Impact of Share Price on Earnings | | Operating Revenues | | Operating Expenses | | Other Income Statement Items | | Liquidity and Capital Resources | | Non-GAAP Measures | | Off-Balance Sheet Arrangements | | Critical Accounting Estimates | | Forward-Looking Statements | |
The following discussion and analysis should be read in conjunction with the Company’s Consolidated Financial Statements and the related notes in Item 8. Financial Statements and Supplementary Data, and other information in this annual report. Except where otherwise indicated, all financial information reflected herein is expressed in Canadian dollars.
Executive Summary
2019 Results
| | • | Financial performance– In 2019, CP reported Diluted earnings per share ("EPS") of $17.52, a 29%increase from $13.61 in 2018. Adjusted diluted EPS increased to $16.44, a 13% improvement compared to $14.51 in 2018. CP’s commitment to service and operational efficiency produced an Operating ratio of 59.9%. Adjusted diluted EPS is defined and reconciled in Non-GAAP Measures and discussed further in Results of Operations of this Item 7. Management’s Discussion and Analysis of Financial Condition and Results of Operations.
|
| | • | Total revenues– CP’s Total revenues increased by 7% to $7,792 million in 2019 from $7,316 million in 2018, driven primarily by higher freight rates.
|
| | • | Operating performance – CP's average train speed increased by 3% to 22.2 miles per hour and average dwell time decreased by 6% to 6.4 hours in 2019 primarily due to the completion of network infrastructure projects which improved network fluidity. Average train weight remained relatively unchanged at 9,129 tons and average train length increased by 1% to 7,388 feet due to improvements in operating plan efficiency, in each case compared to 2018. These metrics are discussed further in Performance Indicators of this Item 7. Management's Discussion and Analysis of Financial Condition and Results of Operations.
|
The following table compares 2019 outlook to actual results:
| | | | | | | RTM growth | Adjusted diluted EPS(1)Base earnings | Capital expenditures | | 491 | | Outlook |
Revised at the end of the third quarter to low-single digits
| Double-digit Adjusted diluted EPS growth from full-year 2018 Adjusted diluted EPS of $14.51 | Approximately $1.60 billion | Actual outcomes | Revenue ton-miles ("RTMs") increased by 171 million, or 0.1% | Adjusted diluted EPS growth of 13% to $16.44 | $1.65 billion |
(1) Adjusted diluted EPS is defined and reconciled in Non-GAAP Measures of this Item 7. Management's Discussion and Analysis of Financial Condition and Results of Operations. As described in the 2020 Outlook section below, CP had not calculated an outlook for Diluted EPS in 2019.
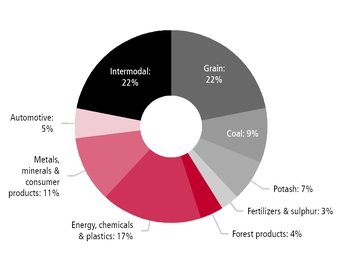
The update in RTM volume expectations was due to delays in the Canadian grain harvest and export potash volumes, as well as general macroeconomic softness. During the fourth quarter of 2019, CP's volumes were lower primarily due to decreased shipments of export potash, Coal and Metals, minerals and consumer products. This decrease was partially offset by increased volumes of crude, and Intermodal.
2020 Outlook
With a 2020 plan that encompasses profitable sustainable growth, CP expects RTM growth to be in the mid-single digit and Adjusted diluted EPS growth to be in the high single-digit to low double-digits. CP’s expectations for Adjusted diluted EPS growth in 2020 are based on Adjusted diluted EPS of $16.44 in 2019. For the purposes of this outlook, CP assumes an effective tax rate of 25 percent. CP estimates other components of net periodic benefit recovery to decrease by approximately $40 million versus 2019. As CP continues to invest in service, productivity and safety, the Company plans to invest approximately $1.6 billion in capital programs in 2020. Capital programs are defined and discussed further in Liquidity and Capital Resources of this Item 7. Management’s Discussion and Analysis of Financial Condition and Results of Operations.
Adjusted diluted EPS is defined and discussed further in Non-GAAP Measures and in Forward-Looking Statements of this Item 7. Management’s Discussion and Analysis of Financial Condition and Results of Operations. Although CP has provided a forward-looking Non-GAAP measure (Adjusted diluted EPS), management is unable to reconcile, without unreasonable efforts, the forward-looking Adjusted diluted EPS to the most comparable GAAP measure, due to unknown variables and uncertainty related to future results. These unknown variables may include unpredictable transactions of significant value. In past years, CP has recognized significant asset impairment charges, management transition costs related to senior executives and discrete tax items. These or other similar, large unforeseen transactions affect diluted EPS but may be excluded from CP’s Adjusted diluted EPS. Additionally, the U.S.-to-Canadian dollar exchange rate is unpredictable and can have a significant impact on CP’s reported results but may be excluded from CP’s Adjusted diluted EPS. In particular, CP excludes the foreign exchange ("FX") impact of translating the Company’s debt and lease liabilities, the impact from changes in income tax rates and a provision for uncertain tax item from Adjusted diluted EPS. Please see Forward-Looking Statements of this Item 7. Management’s Discussion and Analysis of Financial Condition and Results of Operations for further discussion.
CP 2019 ANNUAL REPORT/ 34
Performance Indicators
The following table lists the key measures of the Company’s operating performance:
| | | | | | | | | | | | | | | | | % Change | | For the year ended December 31 | 2019 |
| 2018(1) |
| 2017(1) |
| 2019 vs. 2018 | 2018 vs. 2017 | | Operations Performance | | | | | | | Gross ton-miles (“GTMs”) (millions) | 280,724 |
| 275,362 |
| 252,195 |
| 2 |
| 9 |
| | Train miles (thousands) | 32,924 |
| 32,312 |
| 30,632 |
| 2 |
| 5 |
| | Average train weight – excluding local traffic (tons) | 9,129 |
| 9,100 |
| 8,806 |
| — |
| 3 |
| | Average train length – excluding local traffic (feet) | 7,388 |
| 7,313 |
| 7,214 |
| 1 |
| 1 |
| | Average terminal dwell (hours) | 6.4 |
| 6.8 |
| 6.6 |
| (6 | ) | 3 |
| | Average train speed (miles per hour, or "mph") | 22.2 |
| 21.5 |
| 22.6 |
| 3 |
| (5 | ) | | Fuel efficiency (U.S. gallons of locomotive fuel consumed /1,000 GTMs) | 0.955 |
| 0.953 |
| 0.980 |
| — |
| (3 | ) | | Total employees (average) | 13,103 |
| 12,756 |
| 12,083 |
| 3 |
| 6 |
| | Total employees (end of period) | 12,694 |
| 12,840 |
| 12,215 |
| (1 | ) | 5 |
| | Workforce (end of period) | 12,732 |
| 12,866 |
| 12,294 |
| (1 | ) | 5 |
| | Safety Indicators | | | | | | | FRA personal injuries per 200,000 employee-hours | 1.42 |
| 1.48 |
| 1.65 |
| (4 | ) | (10 | ) | | FRA train accidents per million train-miles | 1.06 |
| 1.10 |
| 0.99 |
| (4 | ) | 11 |
|
(1) Certain figures have been updated to reflect new information or have been revised to conform with current presentation.
Operations Performance
These key measures of operating performance reflect how effective CP's management is at controlling costs and executing the Company's operating plan and strategy. CP continues to drive further productivity improvements in its operations, allowing the Company to deliver superior service and grow its business at low incremental cost.
A GTM is defined as the movement of one ton of train weight over one mile. GTMs are calculated by multiplying total train weight by the distance the train moved. Total train weight comprises the weight of the freight cars, their contents, and any inactive locomotives. An increase in GTMs indicates additional workload. GTMs for 2019 were 280,724 million, a 2% increase compared with 275,362 million in 2018. This increase was primarily driven by increased volumes of Energy, chemicals and plastics and Intermodal. This increase was partially offset by decreased volumes of Potash, frac sand and Coal.
GTMs in 2018 were 275,362 million, a 9% increase compared with 252,195 million in 2017. This increase was primarily driven by increased volumes of Energy, chemicals and plastics, Potash, and Intermodal, partially offset by decreased shipments of U.S. grain.
Train miles are defined as the sum of the distance moved by all trains operated on the network. Train miles for 2019 were 32,924 thousands, an increase of 2% compared with 32,312 thousands in 2018. This reflects the impact of higher GTMs in 2019.
Train miles in 2018 were 32,312, an increase of 5% compared with 30,632 thousands in 2017. This reflects the impact of higher volumes partially offset by continuous improvements in train weights as evident in the relative comparison to GTMs, which grew by 9% in 2018.
Average train weight is defined as the average gross weight of CP trains, both loaded and empty. This excludes trains in short-haul service, work trains used to move CP’s track equipment and materials, and the haulage of other railways’ trains on CP’s network. Average train weight of 9,129 tons in 2019 increased by 29 tons compared with 9,100 tons in 2018. This slight increase was a result of improvements in operating plan efficiency. This increase was partially offset by the implementation of CP's winter contingency plan in the first quarter of 2019 resulting in shorter and lighter trains within the operating plan.
Average train weight of 9,100 tons in 2018 increased by 294 tons, or 3%, from 8,806 tons in 2017. This increase was due to continuous improvements in operating plan efficiency, as well as higher volumes of heavier commodities, such as crude and Potash, compared to the same period in 2017.
Average train length is defined as the average total length of CP trains, both loaded and empty. This includes all cars and locomotives on the train and is calculated as the sum of each car or locomotive's length multiplied by the distance travelled, divided by train miles. Local trains are excluded from this measure.
Average train length of 7,388 feet in 2019 increased by 75 feet, or 1%, compared with 7,313 feet in 2018. This was a result of improvements in operating plan efficiency and increased Intermodal volumes which move on longer trains. This increase was partially offset by the implementation of CP's winter contingency plan in the first quarter of 2019 resulting in shorter and lighter trains within the operating plan.
Average train length of 7,313 feet in 2018 increased by 99 feet, or 1%, from 7,214 feet in 2017. This was a result of improvements in operating plan efficiency and increased Intermodal and Potash volumes, which move in longer trains.
Average terminal dwell is defined as the average time a freight car resides within terminal boundaries expressed in hours. The timing starts with a train arriving at the terminal, a customer releasing the car to the Company, or a car arriving at interchange from another railway. The timing ends when the train leaves, a customer receives the car from CP, or the freight car is transferred to another railway. Freight cars are excluded if they are being stored at the terminal or used in track repairs. Average terminal dwell of 6.4 hours in 2019 decreased by 6% from 6.8 hours in 2018. This favourable decrease was due to improved network fluidity.
Average terminal dwell of 6.8 hours in 2018 increased by 3% from 6.6 hours in 2017. This unfavourable increase was primarily due to:
network disruptions from labour negotiations in the second quarter of 2018;
harsher weather conditions and increased network disruptions in the first quarter of 2018; and
higher volumes in the second half of the year and increased delays from accelerated track and roadway capital programs in the third quarter of 2018.
Average train speed is defined as a measure of the line-haul movement from origin to destination including terminal dwell hours. It is calculated by dividing the total train miles travelled by the total train hours operated. This calculation does not include delay time related to customers or foreign railways and excludes the time and distance travelled by: i) trains used in or around CP’s yards; ii) passenger trains; and iii) trains used for repairing track. Average train speed was 22.2 mph in 2019, an increase of 3%, from 21.5 mph in 2018. This increase in speed was due to the completion of network infrastructure projects, partially offset by the impact of harsh winter operating conditions and network disruptions in the first quarter of 2019.
Average train speed in 2018 was 21.5 mph, a decrease of 5%, from 22.6 mph in 2017. This decrease was primarily due to:
network disruptions from labour negotiations in the second quarter of 2018;
harsher weather conditions and increased network disruptions in the first quarter of 2018; and
higher volumes and increased delays from accelerated track and roadway capital programs in the third quarter of 2018.
This decrease was partially offset by the completion of roadway capital programs, resulting in improved network fluidity in the fourth quarter of 2018.
Fuel efficiencyis defined as U.S. gallons of locomotive fuel consumed per 1,000 GTMs.Fuel consumed includes gallons used in freight, yard and commuter service but excludes fuel used in capital projects and other non-freight activities. Fuel efficiency for 2019 of 0.955 U.S. gallons/1,000 GTMs was flat compared to 2018, and improved by 3% in 2018 compared to 2017. The improvement in fuel efficiency in 2018 compared to 2017 was primarily due to improved productivity from running longer trains.
Total Employees and Workforce
Anemployeeis defined by the Company as an individual currently engaged in full-time, part-time or seasonal employment with CP. The average number of total employees for 2019 increased by 347 compared with 2018. This increase was primarily due to growth in workload as measured in GTMs. The total number of employees as at December 31, 2019 was 12,694, a decrease of 146, or 1%, compared to 12,840 as at December 31, 2018, due to more efficient resource planning and reduced workload in the fourth quarter, partially offset by the addition of CMQ Canada employees.
The average number of total employees for 2018 increased by 673, compared to 2017. This increase was primarily due to growth in volumes. The total number of employees as at December 31, 2018 was 12,840, an increase of 625, or 5%, compared to 12,215 as at December 31, 2017, which was in line with volume growth and volume growth expectations.
Workforceis defined as total employees plus contractors and consultants. The total workforce as at December 31, 2019 was 12,732, a decrease of 134, or 1%, compared to 12,866 as at December 31, 2018, due to more efficient resource planning.
The workforce as at December 31, 2018 was 12,866, an increase of 572, or 5%, compared to 12,294 as at December 31, 2017, which was in line with volume growth and volume growth expectations.
Safety Indicators
Safety is a key priority and core strategy for CP’s management, employees and Board of Directors. The Company’s two main safety indicators – personal injuries and train accidents – follow strict U.S. Federal Railroad Administration ("FRA") reporting guidelines.
The FRA personal injuries per 200,000 employee-hours frequency is the number of personal injuries, multiplied by 200,000 and divided by total employee hours. Personal injuries are defined as injuries that require employees to lose time away from work, modify their normal duties or obtain medical treatment
CP 2019 ANNUAL REPORT/ 36
beyond minor first aid. FRA employee-hours are the total hours worked, excluding vacation and sick time, by all employees, excluding contractors. The FRA personal injuries per 200,000 employee-hours frequency for CP was 1.42 in 2019, compared with 1.48 in 2018 and 1.65 in 2017.
TheFRA train accidents per million train-miles frequency is the number of train accidents, multiplied by 1,000,000 and divided by total train miles. Train accidents included in this metric meet or exceed the FRA reporting threshold of U.S. $10,700 in damage. The FRA train accidents per million train-miles frequency for CP was 1.06 in 2019 , compared with 1.10 in 2018 and 0.99 in 2017.
Results of Operations
Income
* Adjusted operating income is defined and reconciled in Non-GAAP Measures of this Item 7. Management’s Discussion and Analysis of Financial Condition and Results of Operations
Operating income was $3,124 million in 2019, an increase of $293 million, or 10%, from $2,831 million in 2018. This increase was primarily due to:
higher freight rates;
the efficiencies generated from improved operating performance and asset utilization;
| | • | the favourable impact of change in FX of $39 million; and
|
| | • | the favourable impact from changes in fuel prices of $38 million.
|
This increase was partially offset by:
| | • | increased operating expense associated with higher casualty costs in 2019 of $76 million (excluding FX);
|
| | • | higher stock-based compensation of $58 million;
|
cost inflation; and
increased weather related costs as a result of harsh winter operating conditions in the first quarter of 2019.
There were no adjustments to operating income in 2019 and 2018.
Operating income was $2,831 million in 2018, an increase of $312 million, or 12%, from $2,519 million in 2017. This increase was primarily due to higher volumes and the efficiencies generated from improved operating performance and asset utilization.
This increase was partially offset by:
cost inflation;
| | • | management transition recoveries of $51 million associated with Mr. E. Hunter Harrison's retirement as CEO of CP in 2017; and
|
higher depreciation and amortization driven primarily from a higher asset base as a result of capital program spending in 2018.
Adjusted operating income, defined and reconciled in Non-GAAP Measures of this Item 7. Management’s Discussion and Analysis of Financial Condition and Results of Operations, was $2,831 million in 2018, an increase of $363 million, or 15%, from $2,468 million in 2017. This increase was primarily due to the same factors discussed above for the increase in Operating income, except that Adjusted operating income in 2017 excludes the management transition recovery of $51 million.
*Adjusted income is defined and reconciled in Non-GAAP Measures of this Item 7. Management’s Discussion and Analysis of Financial Condition and Results of Operations.
Net income was $2,440 million in 2019, an increase of $489 million, or 25%, from $1,951 million in 2018. This increase was primarily due to:
higher Operating income;
FX translation gains on debt and lease liabilities in 2019 compared to FX translation losses on debt in 2018; and
a higher income tax recovery associated with changes in tax rates.
This increase was partially offset by higher income taxes due to higher taxable income and a provision for an uncertain tax item of a prior period.
Net income was $1,951 million in 2018, a decrease of $454 million, or 19%, from $2,405 million in 2017. This decrease was primarily due to a lower income tax recovery associated with changes in tax rates and FX translation losses on debt in 2018 compared to gains in 2017. This decrease was partially offset by higher Operating income and higher Other components of net periodic benefit recovery.
Adjusted income, defined and reconciled in Non-GAAP Measures of this Item 7. Management’s Discussion and Analysis of Financial Condition and Results of Operations, was $2,290 million in 2019, an increase of $210 million, or 10%, from $2,080 million in 2018. This increase was due to the same factors discussed above for the increase in Net income, except that Adjusted income excludes FX translation gains and losses on debt and lease liabilities, income tax recoveries associated with changes in tax rates, and a provision for an uncertain tax item of a prior period.
Adjusted income was $2,080 million in 2018, an increase of $414 million, or 25%, from $1,666 million in 2017. This increase was primarily due to higher Adjusted operating income and higher Other components of net periodic benefit recovery. This increase was partially offset by higher income taxes due to higher taxable income.
CP 2019 ANNUAL REPORT/ 38
Diluted Earnings per Share
*Adjusted diluted EPS is defined and reconciled in Non-GAAP Measures of this Item 7. Management’s Discussion and Analysis of Financial Condition and Results of Operations.
Diluted EPS was $17.52 in 2019, an increase of $3.91, or 29%, from $13.61 in 2018. This increase was due to higher Net income and lower average number of outstanding Common Shares due to the Company's share repurchase program.
Diluted EPS was $13.61 in 2018, a decrease of $2.83, or 17%, from $16.44 in 2017. This decrease was due to lower Net income, partially offset by lower average number of outstanding Common Shares due to the Company's share repurchase program.
Adjusted diluted EPS, defined and reconciled in Non-GAAP Measures of this Item 7. Management’s Discussion and Analysis of Financial Condition and Results of Operations, was $16.44 in 2019, an increase of $1.93, or 13%, from $14.51 in 2018. Adjusted diluted EPS was $14.51 in 2018, an increase of $3.12, or 27%, from $11.39 in 2017. These increases were due to higher Adjusted income and lower average number of outstanding Common Shares due to the Company's share repurchase program.
Operating Ratio
* Adjusted operating ratio is defined and reconciled in Non-GAAP Measures of this Item 7. Management’s Discussion and Analysis of Financial Condition and Results of Operations.
The Operating ratio provides the percentage of revenues used to operate the railway. A lower percentage normally indicates higher efficiency in the operation of the railway. The Company’s Operating ratio was 59.9% in 2019, a 140 basis point improvement from 61.3% in 2018. This improvement was primarily due to:
higher freight rates;
the favourable impact of changes in fuel prices; and
the efficiencies generated from improved operating performance and asset utilization.
This improvement was partially offset by:
increased operating expense associated with higher casualty costs in 2019;
higher stock-based compensation; and
cost inflation.
There were no adjustments to the operating ratio in 2019 and 2018.
The Company’s Operating ratio was 61.3% in 2018, a 30 basis point improvement from 61.6% in 2017. This improvement was primarily due to higher volumes and the efficiencies generated from improved operating performance and asset utilization.
This improvement was partially offset by:
the unfavourable impact of changes in fuel prices;
cost inflation; and
| | • | management transition recoveries of $51 million associated with Mr. E. Hunter Harrison's retirement as CEO of CP in 2017.
|
Adjusted operating ratio was 61.3% in 2018, a 110 basis point improvement from 62.4% in 2017. This improvement reflects the same factors discussed above for the improvement in Operating ratio, except that Adjusted operating ratio in 2017 excludes the $51 million management transition recovery.
Return on Invested Capital
Return on invested capital ("ROIC") is a measure of how productively the Company uses its long-term capital investments, representing critical indicators of good operating and investment decisions made by management, and is an important performance criteria in determining certain elements of the Company's long-term incentive plan.
ROIC was 17.9% in 2019, a 260 basis point increase compared to 15.3% in 2018, primarily due to higher Operating income and FX translation gains on debt and lease liabilities in 2019 compared to FX translation losses on debt in 2018.
This increase was partially offset by a higher average invested capital base due to higher Retained earnings from Net income, partially offset by lower Common Shares due to the Company's share repurchase program.
ROIC was 15.3% in 2018, a 520 basis point decrease compared to 20.5% in 2017 primarily due to:
a higher average invested capital base due to higher Retained earnings from Net income;
higher Income tax expense due to a lower income tax recovery associated with changes in tax rates; and
the unfavourable impact of FX translation losses on debt in 2018 compared to FX translation gains in 2017.
This decrease was partially offset by higher Operating income and higher Other components of net periodic benefit recoveries.
Adjusted ROIC was 16.9% in 2019, a 70 basis point increase compared to 16.2% in 2018, primarily due to higher Operating income. This increase was partially offset by the increase in adjusted average invested capital primarily due to higher Adjusted income, partially offset by by lower Common Shares due to the Company's share repurchase program.
Adjusted ROIC was 16.2% in 2018, a 150 basis point increase compared to 14.7% in 2017 due to higher Adjusted operating income and higher Other components of net periodic benefit recoveries. This increase was partially offset by the increase in adjusted average invested capital primarily due to higher Adjusted income, partially offset by by lower Common Shares due to the Company's share repurchase program.
ROIC and Adjusted ROIC are defined and reconciled in Non-GAAP Measures of this Item 7. Management’s Discussion and Analysis of Financial Condition and Results of Operations.
Impact of Foreign Exchange on Earnings
Fluctuations in FX affect the Company’s results because U.S. dollar-denominated revenues and expenses are translated into Canadian dollars. U.S. dollar-denominated revenues and expenses increase (decrease) when the Canadian dollar weakens (strengthens) in relation to the U.S. dollar. In 2019, the impact of a stronger U.S. dollar resulted in an increase in total revenues of $87 million, an increase in total operating expenses of $48 million and an increase in interest
CP 2019 ANNUAL REPORT/ 40
expense of $10 million. In 2018, the impact of a weaker U.S. dollar resulted in a decrease in total revenues of $8 million, a decrease in total operating expenses of $4 million and no change to interest expense.
On February 14, 2020, noon buying rate certified for customs purposes by the U.S. Federal Reserve Bank of New York was U.S. $1.00 = $1.33 Canadian dollars.
The following tables set forth, for the periods indicated, the average exchange rate between the Canadian dollar and the U.S. dollar expressed in the Canadian dollar equivalent of one U.S. dollar, the high and low exchange rates and period end exchange rates for the periods indicated. Averages for year-end periods are calculated by using the exchange rates on the last day of each full month during the relevant period. These rates are based on the noon buying rate certified for customs purposes by the U.S. Federal Reserve Bank of New York set forth in the H.10 statistical release of the Federal Reserve Board.
| | | | | | | | | | | | | | | | | | Average exchange rates (Canadian/U.S. dollar) | 2019 |
| 2018 |
| 2017 |
| 2016 |
| 2015 |
| | For the year ended – December 31 | $ | 1.33 |
| $ | 1.30 |
| $ | 1.30 |
| $ | 1.33 |
| $ | 1.28 |
| | For the three months ended – December 31 | $ | 1.32 |
| $ | 1.32 |
| $ | 1.27 |
| $ | 1.33 |
| $ | 1.34 |
|
| | | | | | | | | | | | | | | | | | Exchange rates (Canadian/U.S. dollar) | 2019 |
| 2018 |
| 2017 |
| 2016 |
| 2015 |
| | Beginning of year – January 1 | $ | 1.36 |
| $ | 1.25 |
| $ | 1.34 |
| $ | 1.38 |
| $ | 1.16 |
| | Beginning of quarter – April 1 | $ | 1.33 |
| $ | 1.29 |
| $ | 1.33 |
| $ | 1.30 |
| $ | 1.27 |
| | Beginning of quarter – July 1 | $ | 1.31 |
| $ | 1.32 |
| $ | 1.30 |
| $ | 1.29 |
| $ | 1.25 |
| | Beginning of quarter – October 1 | $ | 1.32 |
| $ | 1.29 |
| $ | 1.25 |
| $ | 1.31 |
| $ | 1.33 |
| | End of year – December 31 | $ | 1.30 |
| $ | 1.36 |
| $ | 1.25 |
| $ | 1.34 |
| $ | 1.38 |
|
| | | | | | | | | | | | | | | | | | High/Low exchange rates (Canadian/U.S. dollar) | 2019 |
| 2018 |
| 2017 |
| 2016 |
| 2015 |
| | High | $ | 1.36 |
| $ | 1.37 |
| $ | 1.37 |
| $ | 1.46 |
| $ | 1.40 |
| | Low | $ | 1.30 |
| $ | 1.23 |
| $ | 1.21 |
| $ | 1.25 |
| $ | 1.17 |
|
In 2020, CP expects that for every $0.01 the U.S. dollar appreciates (depreciates) relative to the Canadian dollar, it will increase (decrease) revenues by $30 million, operating expenses by $15 million and net interest expense by $3 million on an annualized basis.
Impact of Fuel Price on Earnings
Fluctuations in fuel prices affect the Company’s results because fuel expense constitutes a significant portion of CP's operating costs. As fuel prices fluctuate, there will be a timing impact on earnings, as discussed further in Item 1. Business, Operations, Fuel Cost Adjustment Program and Item 1A. Risk Factors, Fuel Cost Volatility.
| | | | | | | | | | | | Average Fuel Price (U.S. dollars per U.S. gallon) | 2019 |
| 2018 |
| 2017(1) |
| | For the year ended – December 31 | $ | 2.49 |
| $ | 2.72 |
| $ | 2.16 |
| | For the three months ended – December 31 | $ | 2.53 |
| $ | 2.71 |
| $ | 2.43 |
|
(1) Average fuel prices for 2017 exclude the effects of an $8 million fuel tax recovery related to prior periods.
The impact of fuel price on earnings includes the impacts of provincial and federal carbon taxes and levies recovered and paid, on revenues and expenses, respectively.
In 2019, the favourable impact of fuel prices on Operating income was $38 million. Lower fuel prices resulted in a decrease in total operating expenses of $77 million. Lower fuel prices, partially offset by the timing of recoveries from CP's fuel cost adjustment program and increased carbon tax recoveries, resulted in a decrease in total revenues of $39 million from 2018. In 2018, the impact of higher fuel prices resulted in an increase in total revenues of $212 million and an increase in total operating expenses of $197 million.
Impact of Share Price on Earnings
Fluctuations in the Common Share price affect the Company's operating expenses because share-based liabilities are measured at fair value. The following tables indicate the opening and closing Common Share price on the TSX and the NYSE for each quarter and the change in the price of the Common Shares on the TSX and the NYSE for the years ended December 31, 2019, 2018 and 2017:
| | | | | | | | | | | | Toronto Stock Exchange (in Canadian dollars) | 2019 |
| 2018 |
| 2017 |
| | Opening Common Share price, as at January 1 | $ | 242.24 |
| $ | 229.66 |
| $ | 191.56 |
| | Ending Common Share price, as at March 31 | $ | 275.34 |
| $ | 227.20 |
| $ | 195.35 |
| | Ending Common Share price, as at June 30 | $ | 308.43 |
| $ | 240.92 |
| $ | 208.65 |
| | Ending Common Share price, as at September 30 | $ | 294.42 |
| $ | 273.23 |
| $ | 209.58 |
| | Ending Common Share price, as at December 31 | $ | 331.03 |
| $ | 242.24 |
| $ | 229.66 |
| | Change in Common Share price for the year ended December 31 | $ | 88.79 |
| $ | 12.58 |
| $ | 38.10 |
|
| | | | | | | | | | | | New York Stock Exchange (in U.S. dollars) | 2019 |
| 2018 |
| 2017 |
| | Opening Common Share price, as at January 1 | $ | 177.62 |
| $ | 182.76 |
| $ | 142.77 |
| | Ending Common Share price, as at March 31 | $ | 206.03 |
| $ | 176.50 |
| $ | 146.92 |
| | Ending Common Share price, as at June 30 | $ | 235.24 |
| $ | 183.02 |
| $ | 160.81 |
| | Ending Common Share price, as at September 30 | $ | 222.46 |
| $ | 211.94 |
| $ | 168.03 |
| | Ending Common Share price, as at December 31 | $ | 254.95 |
| $ | 177.62 |
| $ | 182.76 |
| | Change in Common Share price for the year ended December 31 | $ | 77.33 |
| $ | (5.14 | ) | $ | 39.99 |
|
In 2019, the impact of the change in Common Share prices resulted in an increase in stock-based compensation expense of $42 million compared to $2 million in 2018, and $18 million in 2017.
The impact of share price on stock-based compensation is discussed further in Item 7A. Quantitative and Qualitative Disclosures About Market Risk, Share Price Impact on Stock-Based Compensation.
Operating Revenues
| | | | | | | | | | | | | | | | | | | | | | | | | | | | 2019 vs. 2018 | 2018 vs. 2017 | | For the year ended December 31 | 2019 | 2018 | 2017 | Total Change | % Change | FX Adjusted % Change(2) | Total Change | % Change | FX Adjusted % Change(2) | Freight revenues (in millions)(1) | $ | 7,613 |
| $ | 7,152 |
| $ | 6,375 |
| $ | 461 |
| 6 | 5 | $ | 777 |
| 12 |
| 12 |
| | Non-freight revenues (in millions) | 179 |
| 164 |
| 179 |
| 15 |
| 9 | 8 | (15 | ) | (8 | ) | (8 | ) | | Total revenues (in millions) | $ | 7,792 |
| $ | 7,316 |
| $ | 6,554 |
| $ | 476 |
| 7 | 5 | $ | 762 |
| 12 |
| 12 |
| | Carloads (in thousands) | 2,766.4 |
| 2,739.8 |
| 2,634.2 |
| 26.6 |
| 1 | N/A | 105.6 |
| 4 |
| N/A |
| | Revenue ton-miles (in millions) | 154,378 |
| 154,207 |
| 142,540 |
| 171 |
| — | N/A | 11,667 |
| 8 |
| N/A |
| | Freight revenue per carload (in dollars) | $ | 2,752 |
| $ | 2,611 |
| $ | 2,420 |
| $ | 141 |
| 5 | 4 | $ | 191 |
| 8 |
| 8 |
| | Freight revenue per revenue ton-mile (in cents) | 4.93 |
| 4.64 |
| 4.47 |
| 0.29 |
| 6 | 5 | 0.17 |
| 4 |
| 4 |
|
(1) Freight revenues include fuel surcharge revenues of $464 million in 2019, $492 million in 2018 and $242 million in 2017. Fuel surcharge revenues include recoveries of carbon taxes, levies, and obligations under cap-and-trade programs.
(2) FX adjusted % change does not have any standardized meaning prescribed by GAAP and, therefore, is unlikely to be comparable to similar measures presented by other companies. FX adjusted % change is defined and reconciled in Non-GAAP Measures of this Item 7. Management's Discussion and Analysis of Financial Condition and Results of Operations.
The Company’s revenues are primarily derived from transporting freight. Changes in freight volumes generally contribute to corresponding changes in freight revenues and certain variable expenses, such as fuel, crew costs, and equipment rents. Non-freight revenue is generated from leasing of certain assets; other arrangements, including logistical services and contracts with passenger service operators; and switching fees.
CP 2019 ANNUAL REPORT/ 42
Freight Revenues
Freight revenues were $7,613 million in 2019, an increase of $461 million, or 6%, from $7,152 million in 2018. This increase was primarily due to higher freight revenue per revenue ton-mile and the favourable impact of the change in FX of $86 million. This increase was partially offset by the unfavourable impact of lower fuel surcharge revenue, as a result of lower fuel prices of $39 million.
Freight revenues were $7,152 million in 2018, an increase of $777 million, or 12%, from $6,375 million in 2017. This increase was primarily due to higher volumes, as measured by RTMs, and the favourable impact of higher fuel surcharge revenue, as a result of higher fuel prices of $212 million. This increase was partially offset by lower volumes of U.S. grain, and the unfavourable impact of the change in FX of $8 million.
RTMs
RTMs are defined as the movement of one revenue-producing ton of freight over a distance of one mile. RTMs measure the relative weight and distance of rail freight moved by the Company. RTMs for 2019 were 154,378 million, an increase of 171 million, compared with 154,207 million in 2018. This increase was mainly attributable to increased shipments of Energy, chemicals and plastics and Intermodal, partially offset by decreased shipments of Potash, frac sand and Coal.
RTMs for 2018 were 154,207 million, an increase of 8% compared with 142,540 million in 2017. This increase was mainly attributable to increased shipments of Energy, chemicals and plastics, Potash, and Intermodal, partially offset by decreased shipments of U.S. grain.
Non-freight Revenues
Non-freight revenues were $179 million in 2019, an increase of $15 million, or 9%, from $164 million in 2018. This increase was primarily due to higher switching fees and logistical services revenue.
Non-freight revenues were $164 million in 2018, a decrease of $15 million, or 8%, from $179 million in 2017. This decrease was primarily due to the recovery of prior costs following the expiration of a passenger service contract in 2017 and lower passenger revenues in 2018.
Lines of Business
Grain
| | | | | | | | | | | | | | | | | | | | | | | | | | | 2019 vs. 2018 | 2018 vs. 2017 | | For the year ended December 31 | 2019 | 2018 | 2017 | Total Change | % Change | FX Adjusted % Change(1) | Total Change | % Change | FX Adjusted % Change(1) | | Freight revenues (in millions) | $ | 1,684 |
| $ | 1,566 |
| $ | 1,532 |
| $ | 118 |
| 8 | 6 | $ | 34 |
| 2 |
| 2 | | Carloads (in thousands) | 431.4 |
| 429.4 |
| 440.7 |
| 2.0 |
| — | N/A | (11.3 | ) | (3 | ) | N/A | | Revenue ton-miles (in millions) | 36,941 |
| 36,856 |
| 37,377 |
| 85 |
| — | N/A | (521 | ) | (1 | ) | N/A | | Freight revenue per carload (in dollars) | $ | 3,904 |
| $ | 3,645 |
| $ | 3,477 |
| $ | 259 |
| 7 | 6 | $ | 168 |
| 5 |
| 5 | | Freight revenue per revenue ton-mile (in cents) | 4.56 |
| 4.25 |
| 4.10 |
| 0.31 |
| 7 | 6 | 0.15 |
| 4 |
| 4 |
(1) FX adjusted % change does not have any standardized meaning prescribed by GAAP and, therefore, is unlikely to be comparable to similar measures presented by other companies. FX adjusted % change is defined and reconciled in Non-GAAP Measures of this Item 7. Management's Discussion and Analysis of Financial Condition and Results of Operations.
Grain revenue was $1,684 million in 2019, an increase of $118 million, or 8%, from $1,566 million in 2018. This increase was primarily due to increased freight revenue per revenue ton-mile, higher volumes of regulated Canadian grain, and the favourable impact of the change in FX. This increase was partially offset by lower volumes of U.S. grain, primarily corn, to the U.S. Pacific Northwest. Freight revenue per revenue ton-mile increased due to higher freight rates, primarily for regulated Canadian grain.
Grain revenue was $1,566 million in 2018, an increase of $34 million, or 2%, from $1,532 million in 2017. This increase was primarily due to higher freight revenue per revenue ton-mile, higher fuel surcharge as a result of higher fuel prices, and higher volumes of Canadian grain. This increase was partially offset by decreased volumes of U.S. grain, primarily wheat, and soybeans to the Pacific Northwest, and the unfavourable impact of the change in FX. Freight revenue per revenue ton-mile increased due to higher freight rates, primarily for regulated Canadian grain. RTMs decreased less than carloads due to moving proportionately more Canadian grain, which has a longer length of haul compared to U.S. grain.
| | | | | | | | | | | | | | | | | | | | | | | | | | | | 2019 vs. 2018 | 2018 vs. 2017 | | For the year ended December 31 | 2019 | 2018 | 2017 | Total Change | % Change | FX Adjusted % Change(1) | Total Change | % Change | FX Adjusted % Change(1) | | Freight revenues (in millions) | $ | 682 |
| $ | 673 |
| $ | 631 |
| $ | 9 |
| 1 |
| 1 | $ | 42 |
| 7 |
| 7 | | Carloads (in thousands) | 304.3 |
| 304.3 |
| 306.0 |
| — |
| — |
| N/A | (1.7 | ) | (1 | ) | N/A | | Revenue ton-miles (in millions) | 21,820 |
| 22,443 |
| 22,660 |
| (623 | ) | (3 | ) | N/A | (217 | ) | (1 | ) | N/A | | Freight revenue per carload (in dollars) | $ | 2,241 |
| $ | 2,211 |
| $ | 2,061 |
| $ | 30 |
| 1 |
| 1 | $ | 150 |
| 7 |
| 7 | | Freight revenue per revenue ton-mile (in cents) | 3.13 |
| 3.00 |
| 2.78 |
| 0.13 |
| 4 |
| 4 | 0.22 |
| 8 |
| 8 |
(1) FX adjusted % change does not have any standardized meaning prescribed by GAAP and, therefore, is unlikely to be comparable to similar measures presented by other companies. FX adjusted % change is defined and reconciled in Non-GAAP Measures of this Item 7. Management's Discussion and Analysis of Financial Condition and Results of Operations.
Coal revenue was $682 million in 2019, an increase of $9 million, or 1%, from $673 million in 2018. This increase was primarily due to higher freight revenue per revenue ton-mile. This increase was partially offset by lower volumes of Canadian coal, driven by supply chain challenges at both the mines and the ports. Freight revenue per revenue ton-mile increased due to higher freight rates. RTMs decreased while carloads remained flat due to moving proportionately higher volumes of short haul U.S. coal.
Coal revenue was $673 million in 2018, an increase of $42 million, or 7%, from $631 million in 2017. This increase was primarily due to higher fuel surcharge revenue as a result of higher fuel prices, and higher freight revenue per revenue ton-mile, partially offset by lower volumes of Canadian coal, and the unfavourable impact of the change in FX. Freight revenue per revenue ton-mile increased due to higher freight rates.
Potash
| | | | | | | | | | | | | | | | | | | | | | | | | | | | 2019 vs. 2018 | 2018 vs. 2017 | | For the year ended December 31 | 2019 | 2018 | 2017 | Total Change | % Change | FX Adjusted % Change(1) | Total Change | % Change | FX Adjusted % Change(1) | | Freight revenues (in millions) | $ | 462 |
| $ | 486 |
| $ | 411 |
| $ | (24 | ) | (5 | ) | (6 | ) | $ | 75 |
| 18 | 19 | | Carloads (in thousands) | 149.3 |
| 158.4 |
| 137.4 |
| (9.1 | ) | (6 | ) | N/A |
| 21.0 |
| 15 | N/A | | Revenue ton-miles (in millions) | 17,297 |
| 18,371 |
| 15,751 |
| (1,074 | ) | (6 | ) | N/A |
| 2,620 |
| 17 | N/A | | Freight revenue per carload (in dollars) | $ | 3,094 |
| $ | 3,071 |
| $ | 2,988 |
| $ | 23 |
| 1 |
| — |
| $ | 83 |
| 3 | 3 | | Freight revenue per revenue ton-mile (in cents) | 2.67 |
| 2.65 |
| 2.61 |
| 0.02 |
| 1 |
| — |
| 0.04 |
| 2 | 2 |
(1) FX adjusted % change does not have any standardized meaning prescribed by GAAP and, therefore, is unlikely to be comparable to similar measures presented by other companies. FX adjusted % change is defined and reconciled in Non-GAAP Measures of this Item 7. Management's Discussion and Analysis of Financial Condition and Results of Operations.
Potash revenue was $462 million in 2019, a decrease of $24 million, or 5%, from $486 million in 2018. This decrease was primarily due to lower volumes of domestic potash driven by poor weather affecting the application seasons, and lower volumes of export potash driven by unresolved international contract negotiations. This decrease was partially offset by the favourable impact of the change in FX.
Potash revenue was $486 million in 2018, an increase of $75 million, or 18%, from $411 million in 2017. This increase was primarily due to higher volumes of export potash, as well as higher fuel surcharge revenue as a result of higher fuel prices, partially offset by the unfavourable impact of the change in FX. RTMs increased more than carloads due to moving proportionately more export potash to Vancouver, which has a longer length of haul.
CP 2019 ANNUAL REPORT/ 44
Fertilizers and Sulphur
| | | | | | | | | | | | | | | | | | | | | | | | | | | | | 2019 vs. 2018 | 2018 vs. 2017 | | For the year ended December 31 | 2019 | 2018 | 2017 | Total Change | % Change | FX Adjusted % Change(1) | Total Change | % Change | FX Adjusted % Change(1) | | Freight revenues (in millions) | $ | 250 |
| $ | 243 |
| $ | 241 |
| $ | 7 |
| 3 |
| 1 | $ | 2 |
| 1 |
| 1 |
| | Carloads (in thousands) | 57.0 |
| 58.1 |
| 57.7 |
| (1.1 | ) | (2 | ) | N/A | 0.4 |
| 1 |
| N/A |
| | Revenue ton-miles (in millions) | 3,846 |
| 4,051 |
| 3,849 |
| (205 | ) | (5 | ) | N/A | 202 |
| 5 |
| N/A |
| | Freight revenue per carload (in dollars) | $ | 4,386 |
| $ | 4,186 |
| $ | 4,178 |
| $ | 200 |
| 5 |
| 3 | $ | 8 |
| — |
| 1 |
| | Freight revenue per revenue ton-mile (in cents) | 6.50 |
| 6.00 |
| 6.27 |
| 0.50 |
| 8 |
| 7 | (0.27 | ) | (4 | ) | (4 | ) |
(1) FX adjusted % change does not have any standardized meaning prescribed by GAAP and, therefore, is unlikely to be comparable to similar measures presented by other companies. FX adjusted % change is defined and reconciled in Non-GAAP Measures of this Item 7. Management's Discussion and Analysis of Financial Condition and Results of Operations.
Fertilizers and sulphur revenue was $250 million in 2019, an increase of $7 million, or 3%, from $243 million in 2018. This increase was primarily due to higher freight revenue per revenue ton-mile, the favourable impact of the change in FX, and higher volumes of wet fertilizer. This increase was partially offset by lower volumes of sulphur and dry fertilizer. Freight revenue per revenue ton-mile increased due to higher freight rates. RTMs decreased more than carloads due to moving proportionately less wet fertilizer to the U.S. Midwest, which has a longer length of haul.
Fertilizers and sulphur revenue was $243 million in 2018, an increase of $2 million, or 1%, from $241 million in 2017. This increase was primarily due to increased volumes of dry fertilizer and sulphur, and higher fuel surcharge revenue as a result of higher fuel prices, partially offset by lower freight revenue per revenue ton-mile, and the unfavourable impact of the change in FX. Freight revenue per revenue ton-mile decreased due to moving proportionately less wet fertilizer, which has higher freight rates, and increased volumes of longer haul sulphur from Canada to the U.S.
Forest Products
| | | | | | | | | | | | | | | | | | | | | | | | | | 2019 vs. 2018 | 2018 vs. 2017 | | For the year ended December 31 | 2019 | 2018 | 2017 | Total Change | % Change | FX Adjusted % Change(1) | Total Change | % Change | FX Adjusted % Change(1) | | Freight revenues (in millions) | $ | 304 |
| $ | 284 |
| $ | 265 |
| $ | 20 |
| 7 | 5 | $ | 19 |
| 7 | 8 | | Carloads (in thousands) | 71.5 |
| 68.6 |
| 65.8 |
| 2.9 |
| 4 | N/A | 2.8 |
| 4 | N/A | | Revenue ton-miles (in millions) | 4,974 |
| 4,763 |
| 4,484 |
| 211 |
| 4 | N/A | 279 |
| 6 | N/A | | Freight revenue per carload (in dollars) | $ | 4,252 |
| $ | 4,139 |
| $ | 4,036 |
| $ | 113 |
| 3 | 1 | $ | 103 |
| 3 | 3 | | Freight revenue per revenue ton-mile (in cents) | 6.11 |
| 5.96 |
| 5.92 |
| 0.15 |
| 3 | 1 | 0.04 |
| 1 | 1 |
(1) FX adjusted % change does not have any standardized meaning prescribed by GAAP and, therefore, is unlikely to be comparable to similar measures presented by other companies. FX adjusted % change is defined and reconciled in Non-GAAP Measures of this Item 7. Management's Discussion and Analysis of Financial Condition and Results of Operations.
Forest products revenue was $304 million in 2019, an increase of $20 million, or 7%, from $284 million in 2018. This increase was primarily due to higher volumes of wood pulp, newsprint, and lumber, increased freight revenue per revenue ton-mile, and the favourable impact of the change in FX. Freight revenue per revenue ton-mile increased due to higher freight rates.
Forest products revenue was $284 million in 2018, an increase of $19 million, or 7%, from $265 million in 2017. This increase was primarily due to increased volumes of wood pulp and paper products, and higher fuel surcharge revenue as a result of higher fuel prices, partially offset by the unfavourable impact of the change in FX. RTMs increased more than carloads due to increased volumes of longer haul wood pulp from eastern Canada to the U.S.
Energy, Chemicals and Plastics
| | | | | | | | | | | | | | | | | | | | | | | | | | 2019 vs. 2018 | 2018 vs. 2017 | | For the year ended December 31 | 2019 | 2018 | 2017 | Total Change | % Change | FX Adjusted % Change(1) | Total Change | % Change | FX Adjusted % Change(1) | | Freight revenues (in millions) | $ | 1,534 |
| $ | 1,243 |
| $ | 898 |
| $ | 291 |
| 23 | 22 | $ | 345 |
| 38 | 39 | | Carloads (in thousands) | 358.1 |
| 334.6 |
| 269.5 |
| 23.5 |
| 7 | N/A | 65.1 |
| 24 | N/A | | Revenue ton-miles (in millions) | 29,356 |
| 27,830 |
| 21,327 |
| 1,526 |
| 5 | N/A | 6,503 |
| 30 | N/A | | Freight revenue per carload (in dollars) | $ | 4,284 |
| $ | 3,715 |
| $ | 3,333 |
| $ | 569 |
| 15 | 14 | $ | 382 |
| 11 | 12 | | Freight revenue per revenue ton-mile (in cents) | 5.23 |
| 4.47 |
| 4.21 |
| 0.76 |
| 17 | 15 | 0.26 |
| 6 | 6 |
(1) FX adjusted % change does not have any standardized meaning prescribed by GAAP and, therefore, is unlikely to be comparable to similar measures presented by other companies. FX adjusted % change is defined and reconciled in Non-GAAP Measures of this Item 7. Management's Discussion and Analysis of Financial Condition and Results of Operations.
Energy, chemicals and plastics revenue was $1,534 million in 2019, an increase of $291 million, or 23%, from $1,243 million in 2018. This increase was primarily due to increased freight revenue per revenue ton-mile, higher volumes of crude, liquefied petroleum gas ("LPG"), fuel oil, and other refined products, and the favourable impact of the change in FX. Freight revenue per revenue ton-mile increased primarily due to liquidated damages, including customer volume commitments, and higher freight rates. Carloads increased more than RTMs due to moving proportionately less long haul crude to Kansas City, Missouri, and proportionately more short haul crude to Chicago, Illinois and Noyes, Minnesota.
Energy, chemicals and plastics revenue was $1,243 million in 2018, an increase of $345 million, or 38%, from $898 million in 2017. This increase was primarily due to increased volumes of crude and LPG, and higher fuel surcharge revenue as a result of higher fuel prices, partially offset by the unfavourable impact of the change in FX. RTMs increased more than carloads due to moving proportionately more crude, which has a longer length of haul.
Metals, Minerals and Consumer Products
| | | | | | | | | | | | | | | | | | | | | | | | | | | | | 2019 vs. 2018 | 2018 vs. 2017 | | For the year ended December 31 | 2019 | 2018 | 2017 | Total Change | % Change | FX Adjusted % Change(1) | Total Change | % Change | FX Adjusted % Change(1) | | Freight revenues (in millions) | $ | 752 |
| $ | 797 |
| $ | 739 |
| $ | (45 | ) | (6 | ) | (8 | ) | $ | 58 |
| 8 |
| 8 | | Carloads (in thousands) | 234.3 |
| 252.2 |
| 255.3 |
| (17.9 | ) | (7 | ) | N/A |
| (3.1 | ) | (1 | ) | N/A | | Revenue ton-miles (in millions) | 10,684 |
| 11,858 |
| 11,468 |
| (1,174 | ) | (10 | ) | N/A |
| 390 |
| 3 |
| N/A | | Freight revenue per carload (in dollars) | $ | 3,210 |
| $ | 3,161 |
| $ | 2,894 |
| $ | 49 |
| 2 |
| — |
| $ | 267 |
| 9 |
| 9 | | Freight revenue per revenue ton-mile (in cents) | 7.04 |
| 6.72 |
| 6.44 |
| 0.32 |
| 5 |
| 3 |
| 0.28 |
| 4 |
| 4 |
(1) FX adjusted % change does not have any standardized meaning prescribed by GAAP and, therefore, is unlikely to be comparable to similar measures presented by other companies. FX adjusted % change is defined and reconciled in Non-GAAP Measures of this Item 7. Management's Discussion and Analysis of Financial Condition and Results of Operations.
Metals, minerals and consumer products revenue was $752 million in 2019, a decrease of $45 million, or 6%, from $797 million in 2018. This decrease was primarily due to lower volumes of frac sand and steel. This decrease was partially offset by increased freight revenue per revenue ton-mile, and the favourable impact of the change in FX. Freight revenue per revenue ton-mile increased due to higher freight rates. Carloads decreased less than RTMs due to increased volumes of short haul metallic ore.
Metals, minerals and consumer products revenue was $797 million in 2018, an increase of $58 million, or 8%, from $739 million in 2017. This increase was primarily due to higher freight revenue per revenue ton-mile, higher fuel surcharge revenue as a result of higher fuel prices, and increased volumes of steel and aggregate products. The increase was partially offset by the unfavourable impact of the change in FX. RTMs increased while carloads decreased due to a decrease in volumes of short haul metallic ore traffic. Freight revenue per revenue ton-mile increased due to higher freight rates.
CP 2019 ANNUAL REPORT/ 46
Automotive
| | | | | | | | | | | | | | | | | | | | | | | | | | 2019 vs. 2018 | 2018 vs. 2017 | | For the year ended December 31 | 2019 | 2018 | 2017 | Total Change | % Change | FX Adjusted % Change(1) | Total Change | % Change | FX Adjusted % Change(1) | | Freight revenues (in millions) | $ | 352 |
| $ | 322 |
| $ | 293 |
| $ | 30 |
| 9 | 7 | $ | 29 |
| 10 | 11 | | Carloads (in thousands) | 114.4 |
| 108.3 |
| 105.1 |
| 6.1 |
| 6 | N/A | 3.2 |
| 3 | N/A | | Revenue ton-miles (in millions) | 1,427 |
| 1,347 |
| 1,321 |
| 80 |
| 6 | N/A | 26 |
| 2 | N/A | | Freight revenue per carload (in dollars) | $ | 3,077 |
| $ | 2,975 |
| $ | 2,785 |
| $ | 102 |
| 3 | 1 | $ | 190 |
| 7 | 7 | | Freight revenue per revenue ton-mile (in cents) | 24.67 |
| 23.92 |
| 22.15 |
| 0.75 |
| 3 | 1 | 1.77 |
| 8 | 8 |
(1) FX adjusted % change does not have any standardized meaning prescribed by GAAP and, therefore, is unlikely to be comparable to similar measures presented by other companies. FX adjusted % change is defined and reconciled in Non-GAAP Measures of this Item 7. Management's Discussion and Analysis of Financial Condition and Results of Operations.
Automotive revenue was $352 million in 2019, an increase of $30 million, or 9%, from $322 million in 2018. This increase was primarily due to higher volumes from Vancouver to eastern Canada, higher volumes from the U.S. to CP's new Vancouver Automotive Compound, increased freight revenue per revenue ton-mile, and the favourable impact of the change in FX. Freight revenue per revenue ton-mile increased due to higher freight rates.
Automotive revenue was $322 million in 2018, an increase of $29 million, or 10% from $293 million in 2017. This increase was primarily due to higher freight revenue per revenue ton-mile, higher fuel surcharge revenue as a result of higher fuel prices, and higher volumes of machinery. This increase was partially offset by the unfavourable change in FX. Freight revenue per revenue ton-mile increased due to higher freight rates.
Intermodal
| | | | | | | | | | | | | | | | | | | | | | | | | | | | 2019 vs. 2018 | 2018 vs. 2017 | | For the year ended December 31 | 2019 | 2018 | 2017 | Total Change | % Change | FX Adjusted % Change(1) | Total Change | % Change | FX Adjusted % Change(1) | | Freight revenues (in millions) | $ | 1,593 |
| $ | 1,538 |
| $ | 1,365 |
| $ | 55 |
| 4 |
| 3 |
| $ | 173 |
| 13 | 13 | | Carloads (in thousands) | 1,046.1 |
| 1,025.9 |
| 996.7 |
| 20.2 |
| 2 |
| N/A |
| 29.2 |
| 3 | N/A | | Revenue ton-miles (in millions) | 28,033 |
| 26,688 |
| 24,303 |
| 1,345 |
| 5 |
| N/A |
| 2,385 |
| 10 | N/A | | Freight revenue per carload (in dollars) | $ | 1,523 |
| $ | 1,499 |
| $ | 1,370 |
| $ | 24 |
| 2 |
| 1 |
| $ | 129 |
| 9 | 9 | | Freight revenue per revenue ton-mile (in cents) | 5.68 |
| 5.76 |
| 5.62 |
| (0.08 | ) | (1 | ) | (2 | ) | 0.14 |
| 2 | 2 |
(1) FX adjusted % change does not have any standardized meaning prescribed by GAAP and, therefore, is unlikely to be comparable to similar measures presented by other companies. FX adjusted % change is defined and reconciled in Non-GAAP Measures of this Item 7. Management's Discussion and Analysis of Financial Condition and Results of Operations.
Intermodal revenue was $1,593 million in 2019, an increase of $55 million, or 4%, from $1,538 million in 2018. This increase was primarily due to higher international volumes through the Port of Vancouver, the onboarding of a new domestic retail customer, and the favourable impact of the change in FX. This increase was partially offset by a decrease in freight revenue per revenue ton-mile. RTMs increased more than carloads due to discontinuing expressway service in the second quarter of 2018, which had a shorter length of haul. Freight revenue per revenue ton-mile decreased due to lower fuel surcharge revenue as a result of lower fuel prices.
Intermodal revenue was $1,538 million in 2018, an increase of $173 million, or 13%, from $1,365 million in 2017. This increase was primarily due to higher international volumes through the Port of Vancouver, higher domestic wholesale volumes, as well as higher fuel surcharge revenue as a result of higher fuel prices. This was partially offset by the unfavourable impact of the change in FX. RTMs increased more than carloads due to discontinuing expressway service, and an increased length of haul for international intermodal volume moving through the Port of Vancouver.
Operating Expenses
| | | | 2019 Operating Expenses | 2018 Operating Expenses | 2017 Operating Expenses |
| | | | | | | | | | | | | | | | | | | | | | | | | | | | | | 2019 vs. 2018 | 2018 vs. 2017 | | For the year ended December 31 (in millions) | 2019 |
| 2018 |
| 2017 |
| Total Change | % Change | FX Adjusted % Change(1) | Total Change | % Change | FX Adjusted % Change(1) | | Compensation and benefits | $ | 1,540 |
| $ | 1,468 |
| $ | 1,309 |
| $ | 72 |
| 5 |
| 4 |
| $ | 159 |
| 12 |
| 12 |
| | Fuel | 882 |
| 918 |
| 677 |
| (36 | ) | (4 | ) | (6 | ) | 241 |
| 36 |
| 36 |
| | Materials | 210 |
| 201 |
| 190 |
| 9 |
| 4 |
| 4 |
| 11 |
| 6 |
| 6 |
| | Equipment rents | 137 |
| 130 |
| 142 |
| 7 |
| 5 |
| 3 |
| (12 | ) | (8 | ) | (8 | ) | | Depreciation and amortization | 706 |
| 696 |
| 661 |
| 10 |
| 1 |
| 1 |
| 35 |
| 5 |
| 5 |
| | Purchased services and other | 1,193 |
| 1,072 |
| 1,056 |
| 121 |
| 11 |
| 10 |
| 16 |
| 2 |
| 2 |
| | Total operating expenses | $ | 4,668 |
| $ | 4,485 |
| $ | 4,035 |
| $ | 183 |
| 4 |
| 3 |
| $ | 450 |
| 11 |
| 11 |
|
(1) FX adjusted % change does not have any standardized meaning prescribed by GAAP and, therefore, is unlikely to be comparable to similar measures presented by other companies. FX adjusted % change is defined and reconciled in Non-GAAP Measures of this Item 7. Management's Discussion and Analysis of Financial Condition and Results of Operations.
Operating expenses were $4,668 million in 2019, an increase of $183 million, or 4%, from $4,485 million in 2018. This increase was primarily due to:
| | • | increased operating expense associated with higher casualty costs incurred in 2019 of $76 million (excluding FX);
|
| | • | higher stock-based compensation primarily driven by an increase in stock price of $58 million;
|
cost inflation;
| | • | the unfavourable impact of the change in FX of $48 million;
|
increased weather related costs as a result of harsh winter operating conditions in the first quarter of 2019; and
higher volume variable expenses.
This increase was partially offset by the favourable impact from changes in fuel prices of $77 million and the efficiencies generated from improved operating performance and asset utilization.
Operating expenses were $4,485 million in 2018, an increase of $450 million, or 11%, from $4,035 million in 2017. This increase was primarily due to:
| | • | the unfavourable impact from changes in fuel prices of $197 million;
|
higher volume variable expenses;
cost inflation;
| | • | management transition recoveries of $51 million associated with Mr. E. Hunter Harrison's retirement as CEO of CP in 2017;
|
higher depreciation and amortization due to a higher asset base as a result of the capital program spending in 2018;
| | • | a charge associated with a loss contingency of $20 million;
|
increased weather related costs as a result of harsh winter operating conditions in the first quarter of 2018;
higher stock-based compensation of primarily driven by stronger performance against targets, partially offset by the changes in share price; and
higher incentive compensation.
CP 2019 ANNUAL REPORT/ 48
This increase was partially offset by the efficiencies generated from improved operating performance and asset utilization and higher gains on land sales of $26 million mainly from the sale of Bass Lake railway line in the fourth quarter of 2018.
Compensation and Benefits
Compensation and benefits expense includes employee wages, salaries, fringe benefits and stock-based compensation. Compensation and benefits expense was $1,540 million in 2019, an increase of $72 million, or 5%, from $1,468 million in 2018. This increase was primarily due to:
| | • | higher stock-based compensation primarily driven by an increase in stock price of $58 million;
|
the impact of wage and benefit inflation;
the impact of harsher winter operating conditions driven by operational inefficiencies and increased track labour and overtime;
| | • | the unfavourable impact of the change in FX of $11 million; and
|
higher volume variable expenses as a result of an increase in workload as measured by GTMs.
This increase was partially offset by:
lower incentive compensation;
| | • | lower pension current service cost of $14 million; and
|
labour efficiencies.
Compensation and benefits expense was $1,468 million in 2018, an increase of $159 million, or 12% from $1,309 million in 2017. This increase was primarily due to:
higher volume variable expenses as a result of an increase in workload as measured by GTMs;
| | • | management transition recoveries of $51 million associated with Mr. E. Hunter Harrison's retirement as CEO of CP;
|
the impact of wage and benefit inflation;
higher stock-based compensation of primarily driven by stronger performance against targets, partially offset by the changes in share price;
higher incentive compensation;
an increase in training programs; and
harsher winter operating conditions.
This increase was partially offset by lower labour expenses due to operational efficiencies.
Fuel
Fuel expense consists mainly of fuel used by locomotives and includes provincial, state and federal fuel taxes. Fuel expense was $882 million in 2019, a decrease of $36 million, or 4%, from $918 million in 2018. This decrease was primarily due to the favourable impact of lower fuel prices of $77 million.
This decrease was partially offset by an increase in workload, as measured by GTMs, and the unfavourable impact of the change in FX of $18 million.
Fuel expense was $918 million in 2018, an increase of $241 million, or 36%, from $677 million in 2017. This increase was primarily due to:
| | • | the unfavourable impact from higher fuel prices of $197 million;
|
an increase in workload, as measured by GTMs; and
| | • | a fuel tax recovery received in 2017 that related to prior periods of $8 million.
|
This increase was partially offset by improvements in fuel efficiency of approximately 3%.
Materials
Materials expense includes the cost of material used for maintenance of track, locomotives, freight cars and buildings as well as software sustainment. Materials expense was $210 million in 2019, an increase of $9 million, or 4%, from $201 million in 2018. This increase was primarily due to:
higher spending on locomotive maintenance and overhauls;
weather related materials;
cost inflation; and
| | • | the unfavourable impact of the change in FX of $1 million.
|
This increase was partially offset by higher recoveries from foreign freight car maintenance.
Materials expense was $201 million in 2018, an increase of $11 million, or 6%, from $190 million in 2017. This increase was primarily due to higher locomotive maintenance and higher non-locomotive fuel costs.
Equipment Rents
Equipment rents expense includes the cost associated with using other companies’ freight cars, intermodal equipment and locomotives, net of rental income received from other railways for the use of CP’s equipment. Equipment rents expense was $137 million in 2019, an increase of $7 million, or 5%, from $130 million in 2018. This increase was primarily due to greater usage of pooled freight cars and the unfavourable impact of the change in FX of $3 million.
Equipment rents expense was $130 million in 2018, a decrease of $12 million, or 8%, from $142 million in 2017. This decrease was primarily due to the purchase or return of leased freight cars and lower usage of pooled intermodal containers reducing rental expenses by $7 million, and a $4 million increase in receipts from other railways' use of CP equipment.
Depreciation and Amortization
Depreciation and amortization expense represents the charge associated with the use of track and roadway, buildings, rolling stock, information systems and other depreciable assets. Depreciation and amortization expense was $706 million for 2019, an increase of $10 million, or 1%, from $696 million in 2018. This increase was primarily due to a higher asset base, as a result of the capital program spending in 2019, and the unfavourable impact of the change in FX of $4 million, partially offset by the impact of depreciation studies and other adjustments.
Depreciation and amortization expense was $696 million for 2018, an increase of $35 million, or 5%, from $661 million in 2017. This increase was primarily due to higher asset base as a result of higher capital program spending in 2018.
Purchased Services and Other | | | | | | | | | | | | | | | | | | | | | | | | | | 2019 vs. 2018 | 2018 vs. 2017 | | For the year ended December 31 (in millions) | 2019 |
| 2018 |
| 2017 |
| Total Change | % Change | Total Change | % Change | | Support and facilities | $ | 278 |
| $ | 264 |
| $ | 266 |
| $ | 14 |
| 5 |
| $ | (2 | ) | (1 | ) | | Track and operations | 278 |
| 268 |
| 251 |
| 10 |
| 4 |
| 17 |
| 7 |
| | Intermodal | 222 |
| 221 |
| 197 |
| 1 |
| — |
| 24 |
| 12 |
| | Equipment | 125 |
| 143 |
| 157 |
| (18 | ) | (13 | ) | (14 | ) | (9 | ) | | Casualty | 149 |
| 73 |
| 72 |
| 76 |
| 104 |
| 1 |
| 1 |
| | Property taxes | 133 |
| 124 |
| 121 |
| 9 |
| 7 |
| 3 |
| 2 |
| | Other | 29 |
| 20 |
| 7 |
| 9 |
| 45 |
| 13 |
| 186 |
| | Land sales | (21 | ) | (41 | ) | (15 | ) | 20 |
| (49 | ) | (26 | ) | 173 |
| | Total Purchased services and other | $ | 1,193 |
| $ | 1,072 |
| $ | 1,056 |
| $ | 121 |
| 11 |
| $ | 16 |
| 2 |
|
Purchased services and other expense encompasses a wide range of third-party costs, including contractor and consulting fees, locomotive and freight car repairs performed by third parties, property and other taxes, intermodal pickup and delivery services, casualty expense, expenses for joint facilities and gains on land sales. Purchased services and other expense was $1,193 million in 2019, an increase of $121 million, or 11%, from $1,072 million in 2018. This increase was primarily due to:
| | • | an increase in number and severity of casualty incidents of $73 million (excluding FX), which were the result of difficult operating conditions due to weather in the first half of 2019, reported in Casualty;
|
| | • | lower gains on land sales of $20 million mainly as a result of the sale of the Bass Lake railway line in 2018;
|
| | • | the unfavourable impact of the change in FX of $11 million;
|
an increase in legal fees, reported in Support and facilities;
higher snow removal and other weather related costs; and
higher property taxes due to higher tax rates.
This increase was partially offset by:
| | • | a decrease in charges associated with contingencies of $10 million, reported in Other;
|
a decrease in costs for locomotive warranty service agreements due to the insourcing of maintenance of certain locomotives in the company's fleet, reported in Equipment; and
costs related to labour disruptions in the second quarter of 2018, reported in Track and operations.
Purchased services and other expense was $1,072 million in 2018, an increase of $16 million, or 2%, from $1,056 million in 2017. This increase was primarily due to:
| | • | a charge associated with a loss contingency of $20 million, reported in Other;
|
higher intermodal expenses related to pickup and delivery, reported in Intermodal; and
higher costs due to winter weather related impacts and costs related to labour disruptions, reported primarily in Track and operations.
CP 2019 ANNUAL REPORT/ 50
This increase was partially offset by higher gains on land sales of $26 million mainly from the sale of Bass Lake railway line, in the fourth quarter of 2018, and lower locomotive engine overhaul expenses as a greater proportion of this work was capital in nature in 2018, reported in Equipment.
Other Income Statement Items
Other (Income) Expense
Other (income) expense consists of gains and losses from the change in FX on long-term debt and lease liabilities, working capital, costs related to financing, shareholder costs, equity income, and other non-operating expenditures. Other income was $89 million in 2019, a change of $263 million, or 151%, compared to an expense of $174 million in 2018. This change was primarily due to an FX translation gain on U.S. dollar-denominated debt and lease liabilities of $94 million, compared to an FX translation loss on U.S. dollar-denominated debt of $168 million in 2018.
Other expense was $174 million in 2018, a change of $352 million, or 198%, compared to an income of $178 million in 2017. This change was primarily due to an FX translation loss on U.S. dollar-denominated debt of $168 million, compared to a gain of $186 million, and a $10 million insurance recovery of legal costs in 2017. These unfavourable changes were partially offset by a $13 million charge on the settlement and roll of forward starting swaps in 2017 and higher equity income in 2018.
FX translation gains and losses on debt and lease liabilities are discussed further in Non-GAAP Measures of this Item 7. Management's Discussion and Analysis of Financial Condition and Results of Operations.
Other Components of Net Periodic Benefit Recovery
Other components of net periodic benefit recovery were $381 million in 2019, a decrease of $3 million, or 1%, from $384 million in 2018. This decrease was primarily due to higher interest cost on the benefit obligation. Other components of net periodic benefit recovery were $384 million in 2018, an increase of $110 million or 40%, from $274 million in 2017. This increase was primarily due to the 7.75% expected rate of return in each of 2017 and 2018 being applied to a greater asset value, and a decrease in the recognized net actuarial loss.
Net Interest Expense
Net interest expense includes interest on long-term debt and finance leases. Net interest expense was $448 million in 2019, a decrease of $5 million, or 1%, from $453 million in 2018. This was primarily due to a net reduction in interest charges of $21 million as a result of a lower effective interest rate following the Company's refinancing of debt in 2018 and 2019, partially offset by the unfavourable impact from the change in FX of $10 million and an increase in commercial paper interest of $6 million.
Net interest expense was $453 million in 2018, a decrease of $20 million, or 4%, from $473 million in 2017. This decrease was primarily due to a favourable impact of $15 million as a result of a lower effective interest rate and lower debt levels following the Company's refinancing of debt in 2018, as well as higher capitalized interest.
Income Tax Expense
Income tax expense was $706 million in 2019, an increase of $69 million, or 11%, from $637 million in 2018. The increase was due to:
higher taxable earnings;
| | • | an increase in unrecognized tax benefits of $24 million; and
|
| | • | net income tax recoveries in 2018 of $21 million as a result of the Iowa and Missouri corporate tax rate decreases.
|
This increase was partially offset by net income tax recoveries in 2019 of $88 million as a result of an Alberta corporate tax rate decrease.
Income tax expense was $637 million in 2018, an increase of $544 million, or 585%, from $93 million in 2017. The increase is due to net income tax recoveries in 2017 of $541 million, primarily as a result of U.S. tax reform, and higher 2018 taxable earnings, partially offset by other tax rate changes discussed above in 2018.
The effective income tax rate for 2019 was 22.43% on reported income and 24.96% on Adjusted income. The effective income tax rate for 2018 was 24.64% on reported income and 24.55% on Adjusted income. Adjusted income is a Non-GAAP measure, which is discussed further in Non-GAAP Measures of this Item 7. Management’s Discussion and Analysis of Financial Condition and Results of Operations.
The Company expects a 2020 effective tax rate of 25.00% . The Company’s 2020 outlook for its effective tax rate is based on certain assumptions about events and developments that may or may not materialize, or that may be offset entirely or partially by new events and developments. These assumptions are discussed further in Item 1A. Risk Factors.
Liquidity and Capital Resources
The Company believes adequate amounts of Cash and cash equivalents are available in the normal course of business to provide for ongoing operations, including the obligations identified in the tables in Contractual Commitments of this Item 7. Management’s Discussion and Analysis of Financial Condition and Results of Operations. The Company is not aware of any trends or expected fluctuations in the Company's liquidity that would create any deficiencies. The Company's primary sources of liquidity include its Cash and cash equivalents, its commercial paper program, its bilateral letter of credit facilities, and its revolving credit facility.
As at December 31, 2019, the Company had $133 million of Cash and cash equivalents, U.S. $1.3 billion available under its revolving credit facility, and up to $220 million available under its letter of credit facilities. As at December 31, 2018, the Company had $61 million of Cash and cash equivalents, U.S. $1.0 billion available under its revolving credit facility, and up to $540 million available under its letter of credit facilities.
Effective September 27, 2019, the Company amended and restated its revolving credit facility agreement in order to extend the maturity date of the five year facility from June 28, 2023 to September 27, 2024, and to establish a new U.S. $300 million facility maturing September 27, 2021, increasing the total amount available to U.S. $1.3 billion (2018 – U.S. $1.0 billion). As at December 31, 2019, the Company's revolving credit facility was undrawn (December 31, 2018 – undrawn) and the Company did not draw from its revolving credit facility during the year ended December 31, 2019. The agreement requires the Company to maintain a financial covenant in conjunction with the facility. As at December 31, 2019, the Company was in compliance with all terms and conditions of the credit facility arrangements and satisfied the financial covenant.
The Company has a commercial paper program that enables it to issue commercial paper up to a maximum aggregate principal amount of U.S. $1.0 billion in the form of unsecured promissory notes. This commercial paper program is backed by the revolving credit facility. As at December 31, 2019, total commercial paper borrowings were U.S. $397 million (December 31, 2018 – $nil).
Effective September 27, 2019, the Company also reduced its bilateral letter of credit facilities to $300 million. As at December 31, 2019, under its bilateral letter of credit facilities, the Company had letters of credit drawn of $80 million. This compares to letters of credit drawn of $60 million from a total available amount of $600 million as at December 31, 2018. Under the bilateral letter of credit facilities, the Company has the option to post collateral in the form of Cash or cash equivalents, equal at least to the face value of the letter of credit issued. As at December 31, 2019, the Company did not have any collateral posted on its bilateral letter of credit facilities (December 31, 2018 – $nil).
The following discussion of operating, investing, and financing activities describes the Company’s indicators of liquidity and capital resources.
Operating Activities
Cash provided by operating activities was $2,990 million in 2019, an increase of $278 million compared to $2,712 million in 2018. This increase was primarily due to advance receipts of consideration for service under freight contracts as well as higher cash generating income, compared to 2018.
Cash provided by operating activities was $2,712 million in 2018, an increase of $530 million compared to $2,182 million in 2017. This increase was primarily due to higher cash generating income and a favourable change in working capital mainly due to decreased income taxes payable in 2017.
Investing Activities
Cash used in investing activities was $1,803 million in 2019, an increase of $345 million from $1,458 million in 2018. This increase was primarily due to the acquisition of Central Maine & Québec Railway (“CMQ”), higher additions to properties as discussed further below in Capital Programs, and lower proceeds from the sale of properties and other assets during 2019.
Cash used in investing activities was $1,458 million in 2018, an increase of $163 million from $1,295 million in 2017. This increase was primarily due to higher additions to properties during 2018.
CP 2019 ANNUAL REPORT/ 52
Capital Programs
| | | | | | | | | | | For the year ended December 31 (in millions, except for track miles and crossties) | 2019 |
| 2018 |
| 2017 |
| | Additions to capital | | | | | Track and roadway | $ | 1,004 |
| $ | 965 |
| $ | 958 |
| | Rolling stock and containers | 426 |
| 401 |
| 198 |
| Information systems(1) | 70 |
| 86 |
| 78 |
| | Buildings and other | 164 |
| 122 |
| 132 |
| | Total – accrued additions to capital | 1,664 |
| 1,574 |
| 1,366 |
| | Less: |
|
|
| | Non-cash transactions | 17 |
| 23 |
| 26 |
| | Cash invested in additions to properties (per Consolidated Statements of Cash Flows) | $ | 1,647 |
| $ | 1,551 |
| $ | 1,340 |
| | Track installation capital programs |
|
|
| | Track miles of rail laid (miles) | 246 |
| 281 |
| 313 |
| | Track miles of rail capacity expansion (miles) | 11 |
| 4 |
| 4 |
| | Crossties installed (thousands) | 1,122 |
| 1,015 |
| 1,138 |
|
(1) Information systems include hardware and software.
Track and roadway expenditures include the replacement and enhancement of the Company’s track infrastructure. Of the $1,004 million additions in 2019 (2018 – $965 million), approximately $918 million (2018 – $847 million) was invested in the renewal of depleted assets, namely rail, ties, ballast, signals and bridges. Approximately $27 million (2018 – $47 million) was spent on PTC compliance requirements and $59 million (2018 – $71 million) was invested in network improvements and growth initiatives.
Rolling stock investments encompass locomotives, railcars and containers. In 2019, expenditures on locomotives were approximately $174 million (2018 – $218 million) and were focused on the continued re-investment in CP's existing locomotive fleet. Railcar and container investments of approximately $252 million (2018 – $183 million) were largely focused on renewal of depleted assets, including the acquisition of covered hoppers for grain transportation, and the acquisition of existing units previously held under operating leases.
In 2019, CP invested approximately $70 million (2018 – $86 million) in information systems primarily focused on rationalizing and enhancing business systems, providing real-time data, and modernizing core hardware and applications. Investments in buildings and other items were $164 million (2018 – $122 million), and included items such as facility upgrades and renovations, vehicles and shop equipment.
For 2020, CP expects to invest approximately $1.6 billion in its capital program, which will be financed with cash generated from operations. Approximately 60% to 70% of the planned capital program is for track and roadway, including PTC. Approximately 15% to 20% is expected to be allocated to rolling stock, including railcars and locomotive improvements. Approximately 5% is expected to be allocated to information services, and 10% to 15% is expected to be allocated to buildings and other.
Free Cash
CP generated positive Free cash of $1,357 million in 2019, an increase of $68 million from $1,289 million in 2018. This increase was primarily due to an increase in cash provided by operating activities, partially offset by higher additions to properties and lower proceeds from the sale of properties and other assets during 2019.
CP generated positive Free cash of $1,289 million in 2018, an increase of $415 million from $874 million in 2017. This increase was primarily due to an increase in cash provided by operating activities, partially offset by higher additions to properties during 2018.
Free cash is affected by seasonal fluctuations and by other factors including the size of the Company's capital programs. The 2019 capital programs are discussed above. Free cash is defined and reconciled in Non-GAAP Measures of this Item 7. Management’s Discussion and Analysis of Financial Condition and Results of Operations.
Financing Activities
Cash used in financing activities was $1,111 million in 2019, a decrease of $431 million from $1,542 million in 2018. This decrease was primarily due to the net issuance of commercial paper in 2019 and a lower principal repayment of U.S. $350 million of the Company's 7.250% notes maturing May 2019, compared
to the principal repayments in 2018 of U.S. $275 million of the Company's 6.500% notes maturing May 2018 and $375 million of the Company's 6.250% medium term notes maturing June 2018. This was partially offset by the issuance of $400 million 3.150% notes due March 13, 2029 in 2019 compared to the issuance of U.S. $500 million 4.000% notes due June 1, 2028 in 2018, and higher dividends paid during 2019.
Cash used in financing activities was $1,542 million in 2018, an increase of $842 million from $700 million in 2017. This increase was primarily due to the principal repayments of U.S. $275 million of the Company's 6.500% notes maturing May 2018 and $375 million of the Company's 6.250% medium term notes maturing June 2018, and an increase in payments to buy back shares under the Company's share repurchase program, partially offset by the issuance of U.S. $500 million 4.000% notes due June 1, 2028 in 2018.
Credit Measures
Credit ratings provide information relating to the Company’s operations and liquidity, and affect the Company’s ability to obtain short-term and long-term financing and/or the cost of such financing.
A mid-investment grade credit rating is an important measure in assessing the Company’s ability to maintain access to public financing and to minimize the cost of capital. It also affects the ability of the Company to engage in certain collateralized business activities on a cost-effective basis.
Credit ratings and outlooks are based on the rating agencies’ methodologies and can change from time to time to reflect their views of CP. Their views are affected by numerous factors including, but not limited to, the Company’s financial position and liquidity along with external factors beyond the Company’s control.
As at December 31, 2019, CP's credit ratings from Standard & Poor's Rating Services ("Standard & Poor's") and Moody's Investor Service ("Moody's") remain unchanged from December 31, 2018.
Credit ratings as at December 31, 2019(1)
| | | | | Long-term debt |
| Outlook | | 593 | | Standard & Poor's |
|
| | | |
| Long-term corporate credit | BBB+ | stable | 605 | |
| Senior secured debt | A | stable | 355 | |
| Senior unsecured debtTotal direct compensation | BBB+ | stable | 2,044 | | Moody's |
Total target direct compensation |
| | 2,218 | |
| Senior unsecured debtSalary is the actual amount received that year. Payments made in U.S. dollars have been converted to Canadian dollars using an average exchange rate for the year of $1.3269. | Baa1 | stable |
|
|
|
| Commercial paper program |
|
| Standard & Poor's | A-2 | N/A | Moody's |
| P-2 | N/A |
(1) Credit ratings are not recommendations
Effective September 1, 2019, Mr. Redd was promoted to purchase, hold, or sell securitiesExecutive Vice-President Operations. His salary was increased to US$425,000 effective the same date.
2019 short-term incentive Mr. Redd’s annual bonus target was prorated to 68.34% of his base salary in 2019 to reflect his time at the new target associated with his promotion. Based on our 2019 corporate performance and do not address the market price or suitabilityCEO’s assessment of his individual performance, Mr. Redd received a specific securitycash bonus of $592,539 for 2019, calculated as follows: Year EndSalary ($)XTargetshort-termincentiveX[Corporateperformancefactor ($)+Individualperformancefactor ($)]=2019short-termincentive ($)(as a particular investor. Credit ratings% ofbase salary)155%x 75%150%x 25%(0-200%)(0-200%)563,93368.34%448,018144,521592,539 Hisyear-end salary and 2019 STIP award were made in U.S. dollars and have been converted to Canadian dollars using an average exchange rate of $1.3269 for 2019. Mr. Redd’s long-term incentive target was increased to 225% of his annual salary. He received 2019 annual long-term incentive awards with a total grant value of $959,877. This included a top up PSU and stock option grants received in September 2019 with a grant value of $258,495 to bring him to the Executive Vice-President level. The grant was allocated as 60% PSUs and 40% stock options. Equity ownership (at February 28, 2020)| | | | | | | | | | | | | | | | | | | | | | (as a multiple of salary) | | Minimum
ownership value ($) | | | Shares ($) | | | Deferred
share units ($) | | | Total ownership
value ($) | | | Total ownership
(as a multiple of salary) | | | | | 1,797,807 | | | | 291,791 | | | | 721,813 | | | | 1,013,604 | | | | 1.69x | |
Mr. Redd is on track to meet his share ownership requirements by September 2024. Values are based on US$248.77, the rating agencies' methodologiesclosing price of our shares on the NYSE on February 28, 2020 and mayhave been converted using an exchange rate of $1.3429. Mr. Redd was promoted to Executive Vice-President Operations on September 1, 2019. In continuing his progression towards the market median, effective January 1, 2020, his short-term incentive target will be subjectincreased to revision or withdrawal at any time80% of his base salary from 75% and his long-term incentive target will be increased to 250% of base salary from 225%. He also received a 5% increase in base salary effective February 1, 2020.
ROBERT A. JOHNSON RETIRED EXECUTIVE VICE-PRESIDENT OPERATIONS | | |  | | On September 30, 2019, Mr. Johnson retired from CP after an impressive railroading career that spanned more than three decades. Mr. Johnson was appointed as Executive Vice-President Operations in April 2016. In this role, Mr. Johnson had overall operational responsibility for CP’s rail network, including aspects of operational safety, service, engineering and mechanical services in both Canada and the U.S. with a focus on train performance and overall fluidity of the network. Prior to this appointment, Robert was CP’s Senior Vice-President Operations, Southern Region. Mr. Johnson’s railroad career spans over 37 years. He spent 32 of those years with BNSF where he held successively more responsible roles in operations, transportation, engineering and service excellence. His most recent position at BNSF was General Manager, Northwest Division, overseeingoperations for that region. |
2019 individual performance The CEO assessed Mr. Johnson’s performance for the first nine months of 2019 against his individual performance objectives in the areas of people development, safety and operational efficiency. During 2019, Mr. Johnson focused on people development and succession planning which included the development of a deep operating bench as well as identifying and advancing his own successor. He led double digit improvements in retention of train & engine management staff and conductors. Throughout 2019, Mr. Johnson continued to promote and advance CP’s Home Safe efforts which resulted in a two percent improvement in personal injury rates in the first nine months of the year. In addition, Mr. Johnson drove improvements in asset utilization across the network. His persistent focus on CP’s trip plan compliance resulted in record third quarter Trip Plan compliance. Mr. Johnson was assessed as having exceeded his overall individual performance objective. The assessment was reviewed by the rating agencies.Compensation Committee and reviewed and approved by the Board. The Long-term debttable below is summary of the compensation awarded to Net income ratioMr. Johnson for 2019. | | | | | | | | | Compensation (in CAD $‘000) | | | | | | | | | | | | | | 478 | | | | | | | | | | | | 524 | | | | | | | | | | | | 1,015 | | | | | | 629 | | | Total direct compensation | | | 2,646 | | | Total target direct compensation | | | 2,433 | | | | Salary is the actual amount received that year. Payments made in U.S. dollars have been converted to Canadian dollars using an average exchange rate for the year of $1.3269. | |
Mr. Johnson’s salary was 3.6increased to US$458,350 in 2019. His salary was prorated for the portion of the year in which he was employed.
2019 short-term incentive Mr. Johnson retired as Executive Vice-President Operations effective September 30, 2019. His 2019 cash bonus is reflective of the portion of the year which he was employed. Based on our 2019 corporate performance and the CEO’s assessment of his individual performance, Mr. Johnson received a cash bonus of $523,969 for 2019, calculated as follows: Year EndSalary ($)XTargetshort-termincentiveX[Corporateperformancefactor ($)+Individualperformancefactor ($)]=2019short-termincentive ($)(as a % ofbase salary)155%x 75%150%x 25%(0-200%)(0-200%)608,18575%396,172127,797523,969 Hisyear-end salary and the 2019 STIP award were made in U.S. dollars and have been converted to Canadian dollars using an average exchange rate of $1.3269 for 2019. Mr. Johnson received 2019 long-term incentive awards with a total grant value of $1,643,916, 100% of his target award. The grant was allocated as 60% PSUs and 40% stock options. At the time of his retirement, Mr. Johnson had met his share ownership requirements.
Share performance and cost of management The graph below shows the total shareholder return of $100 invested in CP shares compared to the two major market indices over the last five years ending December 31, 2019 assuming reinvestment of dividends. CP shares have outperformed the S&P/TSX Composite Index and the S&P 500 index over the last five years. The graph shows that significant shareholder value continues to be generated as the total direct compensation paid to our NEOs has declined and stabilized with 4.5our new team. Our share price on the TSX was $176.73 at the beginning of the performance period (US$127.60 on the NYSE) compared to $331.03 at the end of 2019 (US$254.95 on the NYSE), a growth in share appreciation of 87.3%. Our total shareholder return over the same five-year period was 94.9%, assuming reinvestment of dividends. The total compensation value for NEOs as disclosed in the summary compensation table is 0.4% of our total revenues of $7.79 billion for 2019. at December 3120152016201720182019CP TSR (C$)100.00109.16132.22156.79194.90CP TSR (US$)100.00112.68145.73143.03207.87S&P/TSX Composite Index (C$)100.00121.08132.09120.36147.89S&P 500 Index (US$)100.00109.54130.81122.65158.07TDC ($ thousands)35,48531,79627,47122,21027,352 Total direct compensation is the total compensation awarded to the NEOs, as reported in the summary compensation table in prior years.In years where there weremore than five NEOs, we used the following to calculate total direct compensation in the table above: 2019: Keith Creel, Nadeem Velani, John Brooks, Laird Pitz and Mark Redd 2018: Keith Creel, Nadeem Velani, Robert Johnson, Laird Pitz and John Brooks 2017: Keith Creel, Nadeem Velani, Robert Johnson, Laird Pitz and Jeffrey Ellis 2016: Hunter Harrison, Nadeem Velani, Keith Creel, Robert Johnson and Laird Pitz 2015: Hunter Harrison, Mark Erceg, Keith Creel, Laird Pitz and Mark Wallace Mr. Harrison, Mr. Creel, Mr. Brooks, Mr. Pitz, Mr. Redd and Mr. Johnson, were paid in U.S. dollars and their amounts have been converted using the following average exchange rates: $1.3269 for 2019, $1.2957 for 2018, $1.2986 for 2017, $1.3248 for 2016 and $1.2787 for 2015
EXECUTIVE COMPENSATION DETAILS Summary compensation table The table below shows compensation for our six NEOs for the three fiscal years ended December 31, 2019. Mark Redd succeeded Robert Johnson as Executive Vice-President Operations effective September 1, 2019. All of the NEOs except Mr. Velani were paid in U.S. dollars. Their compensation has been converted to Canadian dollars using the average exchange rates for the year: $1.3269 for 2019, $1.2957 for 2018 and 3.4$1.2986 for 2017. | | | | | | | | | | | | | | | | | | | | | | | | | | | | | | | | | | | | | | | | | | | | | | | | | | | | | Non-equity Incentive plan compensation
($) | | | | | | | | | | | Name and principal position | | | | | | | | | | | | | | | | | | | | | | | | | | | | | | | 2019 | | | | 1,537,866 | | | | 5,870,208 | | | | 3,642,061 | | | | 2,978,994 | | | | - | | | | 566,343 | | | | 554,930 | | | | 15,150,402 | | | | | 2018 | | | | 1,453,595 | | | | 4,369,757 | | | | 2,519,163 | | | | 3,148,551 | | | | - | | | | 452,209 | | | | 543,332 | | | | 12,486,607 | | | | | 2017 | | | | 1,436,594 | | | | 4,407,788 | | | | 10,516,630 | | | | 2,419,292 | | | | - | | | | 398,894 | | | | 926,402 | | | | 20,105,600 | | | | | 2019 | | | | 751,099 | | | | 1,623,980 | | | | 978,943 | | | | 1,095,729 | | | | - | | | | 214,043 | | | | 59,250 | | | | 4,723,044 | | | | | 2018 | | | | 666,946 | | | | 1,199,385 | | | | 688,327 | | | | 1,032,596 | | | | - | | | | 138,925 | | | | 57,680 | | | | 3,783,859 | | and Chief Financial Officer | | | 2017 | | | | 451,355 | | | | 806,073 | | | | 202,650 | | | | 490,763 | | | | - | | | | 101,027 | | | | 49,523 | | | | 2,101,391 | | | | | 2019 | | | | 670,235 | | | | 1,240,804 | | | | 697,030 | | | | 829,259 | | | | - | | | | 254,186 | | | | 66,651 | | | | 3,758,165 | | | | | 2018 | | | | 499,384 | | | | 424,798 | | | | 244,922 | | | | 602,177 | | | | - | | | | 166,898 | | | | 61,456 | | | | 1,999,635 | | and Chief Marketing Officer | | | 2017 | | | | 436,359 | | | | 428,442 | | | | 125,582 | | | | 420,251 | | | | - | | | | 144,378 | | | | 59,567 | | | | 1,614,579 | | | | | 2019 | | | | 529,378 | | | | 810,534 | | | | 502,882 | | | | 571,230 | | | | - | | | | 104,830 | | | | 45,606 | | | | 2,564,460 | | | | | 2018 | | | | 482,486 | | | | 444,139 | | | | 256,132 | | | | 560,593 | | | | - | | | | 87,126 | | | | 42,346 | | | | 1,872,822 | | | | | 2017 | | | | 457,901 | | | | 394,237 | | | | 228,694 | | | | 435,601 | | | | - | | | | 82,361 | | | | 41,137 | | | | 1,639,931 | | | | | 2019 | | | | 491,307 | | | | 642,177 | | | | 355,053 | | | | 592,539 | | | | - | | | | 96,231 | | | | 214,626 | | | | 2,391,933 | | | | | 2018 | | | | 440,209 | | | | 832,824 | | | | 562,059 | | | | 510,812 | | | | - | | | | 78,942 | | | | 283,124 | | | | 2,707,970 | | | | | 2017 | | | | 415,321 | | | | 367,349 | | | | 179,664 | | | | 391,637 | | | | - | | | | 69,989 | | | | 66,582 | | | | 1,490,542 | | | | | 2019 | | | | 478,386 | | | | 1,014,508 | | | | 629,408 | | | | 523,969 | | | | - | | | | 121,175 | | | | 79,573 | | | | 2,847,019 | | | | | 2018 | | | | 572,808 | | | | 950,363 | | | | 547,936 | | | | 778,392 | | | | - | | | | 105,825 | | | | 63,858 | | | | 3,019,182 | | | | | 2017 | | | | 564,891 | | | | 958,705 | | | | 556,073 | | | | 597,372 | | | | - | | | | 114,037 | | | | 54,819 | | | | 2,845,897 | |
Represents salary earned during the year. Salary differs from annualized salary because annual increases generally go into effect on April 1 and both Mr. Brooks and Mr. Redd received a promotion in 2017.2019. Mr. Velani’s salary is set in U.S. dollars and was paid in Canadian dollars based on a foreign exchange rate of $1.3432. PSUs were granted on February 14, 2019. The decreaseFebruary 14, 2019 grant date accounting fair value of the awards shown in the ratio from 2018Summary Compensation table is $268.16 per share, granted with reference to the TSX or US$202.00 per share granted with reference to the NYSE. On September 3, 2019, was primarily dueadditional PSUs and options were granted to higher Net income, partially offset by higher debt. The increase in the ratio from 2017 to 2018 was due to lower Net income and higher debt.
The Adjusted net debt to Adjusted earnings before interest, tax, depreciation, and amortization ("EBITDA") ratio was 2.4 in 2019, compared with 2.6 in 2018 and 2.6 in 2017. The decrease in ratio from 2018 to 2019 was primarily due to an increase in Adjusted EBITDA. The ratio remained unchanged between 2017and2018 as higher Adjusted EBITDA was offset by a higher debt balanceMr. Redd as a result of his promotion to Executive Vice-President. The grant date accounting fair value of this PSU award for Mr. Redd was $234.76 on the weakeningNYSE. The grant date accounting fair value of the Canadian dollar. Adjusted net debt to Adjusted EBITDA ratio is defined and reconciled in Non-GAAP Measures of this Item 7. Management’s Discussion and Analysis of Financial Condition and Results of Operations. Over the long term, CP targets an Adjusted net debt to Adjusted EBITDA ratio of 2.0 to 2.5.
Although CP has provided a target Non-GAAP measure (Adjusted net debt to Adjusted EBITDA ratio), management is unable to reconcile, without unreasonable efforts, the target Adjusted net debt to Adjusted EBITDA ratio to the most comparable GAAP measure (Long-term debt to Net income ratio), due to unknown variables and uncertainty related to future results. These unknown variables may include unpredictable transactions of significant value. In past years, CP has recognized significant asset impairment charges, management transition costs related to senior executives and discrete tax items. These or other similar, large unforeseen transactions affect Net income but may be excluded from CP’s Adjusted EBITDA. Additionally, the U.S.-to-Canada dollar exchange rate is unpredictable
CP 2019 ANNUAL REPORT/ 54
and can have a significant impact on CP’s reported results but may be excluded from CP’s Adjusted EBITDA. In particular, CP excludes the FX impact of translating the Company’s debt and lease liabilities, interest and taxes from Adjusted EBITDA. Please see Forward-Looking Statements in this Item 7. Management’s Discussion and Analysis of Financial Condition and Results of Operations for further discussion.
Dividend Payout Ratio
The dividend payout ratio was 17.9% in 2019, compared with 18.5% in 2018 and 13.3% in 2017. The decrease in the ratio from 2018 to 2019 was due to higher diluted EPS, partially offset by higher dividends declared per share. The increase in the ratio from 2017 to 2018 was primarily due to lower diluted EPS.
The Adjusted dividend payout ratio was 19.1% in 2019, compared with 17.3% in 2018 and 19.2% in 2017. The increase in the ratio from 2018 to 2019 was due to higher dividends declared per share, partially offset by higher Adjusted diluted EPS. The decrease in the ratio from 2017 to 2018 was primarily due to higher Adjusted diluted EPS. Adjusted dividend payout ratio is defined and reconciled in Non-GAAP Measures of this Item 7. Management’s Discussion and Analysis of Financial Condition and Results of Operations. Over the long term, CP targets an Adjusted dividend payout ratio of 25.0% to 30.0%.
Although CP has provided a target Non-GAAP measure (Adjusted dividend payout ratio), management is unable to reconcile, without unreasonable efforts, the target Adjusted dividend payout ratio to the most comparable GAAP measure (Dividend payout ratio), due to unknown variables and uncertainty related to future results. These unknown variables may include unpredictable transactions of significant value. In past years, CP has recognized significant asset impairment charges, management transition costs related to senior executives and discrete tax items. These or other similar, large unforeseen transactions affect Diluted EPS but may be excluded from CP’s Adjusted diluted EPS. Additionally, the U.S.-to-Canada dollar exchange rate is unpredictable and can have a significant impact on CP’s reported results but may be excluded from CP’s Adjusted diluted EPS. In particular, CP excludes the FX impact of translating the Company’s debt and lease liabilities, the impact from changes in income tax rates and a provision for uncertain tax item from Adjusted diluted EPS. Please see Forward-Looking Statements in this Item 7. Management’s Discussion and Analysis of Financial Condition and Results of Operations for further discussion.
Share Capital
At February 18, 2020, the latest practicable date prior to the date of this Annual Report on Form 10-K, there were 136,748,767 Common Shares and no preferred shares issued and outstanding, which consists of 13,928 holders of record of the Common Shares. In addition, CP has a Management Stock Option Incentive Plan (“MSOIP”), under which key officers and employeesawards are granted options to purchase the Common Shares. Each option granted can be exercised for one Common Share. At February 18, 2020, 1,569,063 options were outstanding under the MSOIP and stand-alone option agreements entered into with Mr. Keith Creel. There are 895,948 options available to be issued by the Company’s MSOIP in the future. CP has a Director's Stock Option Plan (“DSOP”), under which directors are granted options to purchase Common Shares. There are no outstanding options under the DSOP, which has 340,000 options available to be issued in the future.
Non-GAAP Measures
The Company presents Non-GAAP measures to provide a basis for evaluating underlying earnings and liquidity trends in the Company’s business that can be compared with the results of operations in prior periods. In addition, these Non-GAAP measures facilitate a multi-period assessment of long-term profitability, allowing management and other external users of the Company’s consolidated financial information to compare profitability on a long-term basis, including assessing future profitability, with that of the Company’s peers.
These Non-GAAP measures have no standardized meaning and are not defined by GAAP and, therefore, may not be comparable to similar measures presented by other companies. The presentation of these Non-GAAP measures is not intended to be considered in isolation from, as a substitute for, or as superior to the financial information presented in accordance with GAAP.
Non-GAAP Performance Measures
The Company uses Adjusted income, Adjusted diluted earnings per share, Adjusted operating income and Adjusted operating ratio to evaluate the Company’s operating performance and for planning and forecasting future business operations and future profitability. These Non-GAAP measures are presented inFASB ASC Topic 718: Compensation – Stock Compensation. See Item 6. Selected Financial Data and discussed further in other sections of this Item 7. Management’s Discussion and Analysis of Financial Condition and Results of Operations. These Non-GAAP measures provide meaningful supplemental information regarding operating results because they exclude certain significant items that are not considered indicative of future financial trends either by nature or amount. As a result, these items are excluded for management assessment of operational performance, allocation of resources and preparation of annual budgets. These significant items may include, but are not limited to, restructuring and asset impairment charges, individually significant gains and losses from sales of assets, the FX impact of translating the Company's debt and lease liabilities, discrete tax items, and certain items outside the control of management. These items may not be non-recurring. However, excluding these significant items from GAAP results allows for a consistent understanding of the Company's consolidated financial performance when performing a multi-period assessment including assessing the likelihood of future results. Accordingly, these Non-GAAP financial measures may provide insight to investors and other external users of the Company's consolidated financial information.
In 2019, there were three significant items included in Net income as follows:
| | • | in the fourth quarter, a deferred tax expense of $24 million as a result of a provision for an uncertain tax item of a prior period that unfavourably impacted Diluted EPS by 17 cents;
|
| | • | in the second quarter, a deferred tax recovery of $88 million due to the change in the Alberta provincial corporate income tax rate that favourably impacted Diluted EPS by 63 cents; and
|
| | • | during the course of the year, a net non-cash gain of $94 million ($86 million after deferred tax) due to FX translation of debt and lease liabilities as follows:
|
| | – | in the fourth quarter, a $37 million gain ($32 million after deferred tax) that favourably impacted Diluted EPS by 22 cents;
|
| | – | in the third quarter, a $25 million loss ($22 million after deferred tax) that unfavourably impacted Diluted EPS by 15 cents; |
| | – | in the second quarter, a $37 million gain ($34 million after deferred tax) that favourably impacted Diluted EPS by 24 cents; and |
| | – | in the first quarter, a $45 million gain ($42 million after deferred tax) that favourably impacted Diluted EPS by 30 cents. |
In 2018, there were two significant items included in Net income as follows:
| | • | in the second quarter, a deferred tax recovery of $21 million due to reductions in the Missouri and Iowa state tax rates that favourably impacted Diluted EPS by 15 cents; and
|
| | • | during the course of the year, a net non-cash loss of $168 million ($150 million after deferred tax) due to FX translation of debt as follows:
|
| | – | in the fourth quarter, a $113 million loss ($103 million after deferred tax) that unfavourably impacted Diluted EPS by 72 cents;
|
| | – | in the third quarter, a $38 million gain ($33 million after deferred tax) that favourably impacted Diluted EPS by 23 cents;
|
| | – | in the second quarter, a $44 million loss ($38 million after deferred tax) that unfavourably impacted Diluted EPS by 27 cents; and
|
| | – | in the first quarter, a $49 million loss ($42 million after deferred tax) that unfavourably impacted Diluted EPS by 29 cents.
|
In 2017, there were five significant items included in Net income as follows:
| | • | in the second quarter, a charge on hedge roll and de-designation of $13 million ($10 million after deferred tax) that unfavourably impacted Diluted EPS by 7 cents;
|
| | • | in the second quarter, an insurance recovery of a legal settlement of $10 million ($7 million after current tax) that favourably impacted Diluted EPS by 5 cents;
|
| | • | in the first quarter, a management transition recovery of $51 million related to the retirement of Mr. E. Hunter Harrison as CEO of CP ($39 million after deferred tax) that favourably impacted Diluted EPS by 27 cents;
|
| | • | during the course of the year, a net deferred tax recovery of $541 million as a result of changes in income tax rates as follows:
|
| | – | in the fourth quarter, a deferred tax recovery of $527 million, primarily due to the U.S. tax reform, that favourably impacted Diluted EPS by $3.63;
|
| | – | in the third quarter, a deferred tax expense of $3 million as a result of the change in the Illinois state corporate income tax rate change that unfavourably impacted Diluted EPS by 2 cents;
|
| | – | in the second quarter, a deferred tax recovery of $17 million as a result of the change in the Saskatchewan provincial corporate income tax rate that favourably impacted Diluted EPS by 12 cents; and
|
| | • | during the course of the year, a net non-cash gain of $186 million ($162 million after deferred tax) due to FX translation of debt as follows:
|
| | – | in the fourth quarter, a $14 million loss ($12 million after deferred tax) that unfavourably impacted Diluted EPS by 8, cents;
|
| | – | in the third quarter, a $105 million gain ($91 million after deferred tax) that favourably impacted Diluted EPS by 62 cents;
|
| | – | in the second quarter, a $67 million gain ($59 million after deferred tax) that favourably impacted Diluted EPS by 40 cents; and
|
| | – | in the first quarter, a $28 million gain ($24 million after deferred tax) that favourably impacted Diluted EPS by 16 cents.
|
In 2016, there were two significant items included in Net income as follows:
| | • | in the third quarter, a $25 million expense ($18 million after current tax) related to a legal settlement that unfavourably impacted Diluted EPS by 12 cents; and
|
| | • | during the course of the year, a net non-cash gain of $79 million ($68 million after deferred tax) due to FX translation of debt as follows:
|
| | – | in the fourth quarter, a $74 million loss ($64 million after deferred tax) that unfavourably impacted Diluted EPS by 43 cents;
|
| | – | in the third quarter, a $46 million loss ($40 million after deferred tax) that unfavourably impacted Diluted EPS by 27 cents;
|
| | – | in the second quarter, an $18 million gain ($16 million after deferred tax) that favourably impacted Diluted EPS by 10 cents; and
|
| | – | in the first quarter, a $181 million gain ($156 million after deferred tax) that favourably impacted Diluted EPS by $1.01.
|
In 2015, there were four significant items included in Net income as follows:
| | • | in the third quarter, a $68 million gain ($42 million after current tax) related to the sale of Delaware & Hudson Railway Company, Inc. ("D&H") South that favourably impacted Diluted EPS by 26 cents;
|
| | • | in the third quarter, a $47 million charge ($35 million after deferred tax) related to the early redemption premium on notes that unfavourably impacted Diluted EPS by 22 cents;
|
| | • | in the second quarter, a deferred income tax expense of $23 million as a result of the change in the Alberta provincial corporate income tax rate that unfavourably impacted Diluted EPS by 14 cents; and
|
| | • | during the course of the year, a net non-cash loss of $297 million ($257 million after deferred tax) due to FX translation of debt as follows:
|
| | – | in the fourth quarter, a $115 million loss ($100 million after deferred tax) that unfavourably impacted Diluted EPS by 64 cents;
|
| | – | in the third quarter, a $128 million loss ($111 million after deferred tax) that unfavourably impacted Diluted EPS by 69 cents;
|
| | – | in the second quarter, a $10 million gain ($9 million after deferred tax) that favourably impacted Diluted EPS by 5 cents; and
|
| | – | in the first quarter, a $64 million loss ($55 million after deferred tax) that unfavourably impacted Diluted EPS by 34 cents.
|
CP 2019 ANNUAL REPORT/ 56
Reconciliation of GAAP Performance Measures to Non-GAAP Performance Measures
The following tables reconcile the most directly comparable measures presented in accordance with GAAP to the Non-GAAP measures presented in Item 6. Selected Financial Data and discussed further in other sections of this Item 7. Management’s Discussion and Analysis of Financial Condition and Results of Operations:
Adjusted income is calculated as Net income reported on a GAAP basis adjusted for significant items.
| | | | | | | | | | | | | | | | | | | For the year ended December 31 | | (in millions) | 2019 |
| 2018 |
| 2017 |
| 2016 |
| 2015 |
| | Net income as reported | $ | 2,440 |
| $ | 1,951 |
| $ | 2,405 |
| $ | 1,599 |
| $ | 1,352 |
| | Less significant items (pre-tax): | | | | | | | Legal settlement charge | — |
| — |
| — |
| (25 | ) | — |
| | Insurance recovery of legal settlement | — |
| — |
| 10 |
| — |
| — |
| | Charge on hedge roll and de-designation | — |
| — |
| (13 | ) | — |
| — |
| | Gain on sale of D&H South | — |
| — |
| — |
| — |
| 68 |
| | Management transition recovery | — |
| — |
| 51 |
| — |
| — |
| | Impact of FX translation gain (loss) on debt and lease liabilities | 94 |
| (168 | ) | 186 |
| 79 |
| (297 | ) | | Early redemption premium on notes | — |
| — |
| — |
| — |
| (47 | ) | | Add: | | | | | | Tax effect of adjustments(1) | 8 |
| (18 | ) | 36 |
| 4 |
| (26 | ) | | Income tax rate changes | (88 | ) | (21 | ) | (541 | ) | — |
| 23 |
| | Provision for uncertain tax item | 24 |
| — |
| — |
| — |
| — |
| | Adjusted income | $ | 2,290 |
| $ | 2,080 |
| $ | 1,666 |
| $ | 1,549 |
| $ | 1,625 |
|
(1) The tax effect of adjustments was calculated as the pre-tax effect of the adjustments multiplied by the applicable tax rate for the above items of 8.55%, 10.64%, 15.27%, 7.17% and 9.29% for the years presented, respectively. The applicable tax rates reflect the taxable jurisdictions and nature, being on account of capital or income, of the significant items.
Adjusted diluted earnings per share is calculated using Adjusted income, as defined above, divided by the weighted-average diluted number of Common Shares outstanding during the period as determined in accordance with GAAP.
| | | | | | | | | | | | | | | | | | | For the year ended December 31 | | | 2019 |
| 2018 |
| 2017 |
| 2016 |
| 2015 |
| | Diluted earnings per share as reported | $ | 17.52 |
| $ | 13.61 |
| $ | 16.44 |
| $ | 10.63 |
| $ | 8.40 |
| | Less significant items (pre-tax): | | | | | | | Legal settlement charge | — |
| — |
| — |
| (0.17 | ) | — |
| | Insurance recovery of legal settlement | — |
| — |
| 0.07 |
| — |
| — |
| | Charge on hedge roll and de-designation | — |
| — |
| (0.09 | ) | — |
| — |
| | Gain on sale of D&H South | — |
| — |
| — |
| — |
| 0.42 |
| | Management transition recovery | — |
| — |
| 0.35 |
| — |
| — |
| | Impact of FX translation gain (loss) on debt and lease liabilities | 0.67 |
| (1.17 | ) | 1.27 |
| 0.53 |
| (1.84 | ) | | Early redemption premium on notes | — |
| — |
| — |
| — |
| (0.30 | ) | | Add: | | | | | | Tax effect of adjustments(1) | 0.05 |
| (0.12 | ) | 0.25 |
| 0.02 |
| (0.16 | ) | | Income tax rate changes | (0.63 | ) | (0.15 | ) | (3.70 | ) | — |
| 0.14 |
| | Provision for uncertain tax item | 0.17 |
| — |
| — |
| — |
| — |
| | Adjusted diluted earnings per share | $ | 16.44 |
| $ | 14.51 |
| $ | 11.39 |
| $ | 10.29 |
| $ | 10.10 |
|
(1) The tax effect of adjustments was calculated as the pre-tax effect of the adjustments multiplied by the applicable tax rate for the above items of 8.55%, 10.64%, 15.27%, 7.17% and 9.29% for the years presented, respectively. The applicable tax rates reflect the taxable jurisdictions and nature, being on account of capital or income, of the significant items.
Adjusted operating income is calculated as Operating income reported on a GAAP basis less significant items.
| | | | | | | | | | | | | | | | | | | For the year ended December 31 | | (in millions) | 2019 |
| 2018 |
| 2017 |
| 2016 |
| 2015 |
| | Operating income as reported | $ | 3,124 |
| $ | 2,831 |
| $ | 2,519 |
| $ | 2,411 |
| $ | 2,618 |
| | Less significant items: | | | | | | | Gain on sale of D&H South | — |
| — |
| — |
| — |
| 68 |
| | Management transition recovery | — |
| — |
| 51 |
| — |
| — |
| | Adjusted operating income | $ | 3,124 |
| $ | 2,831 |
| $ | 2,468 |
| $ | 2,411 |
| $ | 2,550 |
|
Adjusted operating ratio excludes those significant items that are reported within Operating income.
| | | | | | | | | | | | | | For the year ended December 31 | | | 2019 |
| 2018 |
| 2017 |
| 2016 |
| 2015 |
| | Operating ratio as reported | 59.9 | % | 61.3 | % | 61.6 | % | 61.3 | % | 61.0 | % | | Less significant items: | | | | | | | Gain on sale of D&H South | — |
| — |
| — |
| — |
| (1.0 | ) | | Management transition recovery | — |
| — |
| (0.8 | ) | — |
| — |
| | Adjusted operating ratio | 59.9 | % | 61.3 | % | 62.4 | % | 61.3 | % | 62.0 | % |
ROIC and Adjusted ROIC
ROIC is calculated as Operating income less Other (income) expense and Other components of net periodic benefit recovery, tax effected at the Company's annualized effective tax rate, divided by Average invested capital. Average invested capital is defined as the sum of total Shareholders' equity, Long-term debt, Long-term debt maturing within one year and Short-term borrowing, as presented in the Company's Consolidated Financial Statements, averaged between the beginning and ending balance over a rolling 12-month period. Adjusted ROIC excludes significant items reported in Operating income, Other (income) expense, and Other components of net periodic benefit recovery in the Company's Consolidated Financial Statements, as these significant items are not considered indicative of future financial trends either by nature or amount. Adjusted average invested capital is similarly adjusted for the impact of these significant items, net of tax, on closing balances as part of this average. ROIC and Adjusted ROIC are performance measures that measure how productively the Company uses its long-term capital investments, representing critical indicators of good operating and investment decisions made by management and are important performance criteria in determining certain elements of the Company's long-term incentive plan. ROIC and Adjusted ROIC are presented in Item 6. Selected Financial Data and discussed further in Results of Operations of this Item 7. Management’s Discussion and Analysis of Financial Condition and Results of Operations.
Calculation of ROIC
| | | | | | | | | | | | | | | | | | | For the year ended December 31 | | (in millions, except for percentages) | 2019 |
| 2018 |
| 2017 |
| 2016 |
| 2015 |
| | Operating income | $ | 3,124 |
| $ | 2,831 |
| $ | 2,519 |
| $ | 2,411 |
| $ | 2,618 |
| | Less: | | | | | | | Other (income) expense | (89 | ) | 174 |
| (178 | ) | (45 | ) | 335 |
| | Other components of net periodic benefit recovery | (381 | ) | (384 | ) | (274 | ) | (167 | ) | (70 | ) | Tax(1) | 806 |
| 749 |
| 111 |
| 675 |
| 728 |
| | | $ | 2,788 |
| $ | 2,292 |
| $ | 2,860 |
| $ | 1,948 |
| $ | 1,625 |
| | Average invested capital | $ | 15,579 |
| $ | 14,964 |
| $ | 13,961 |
| $ | 13,532 |
| $ | 12,561 |
| | ROIC | 17.9 | % | 15.3 | % | 20.5 | % | 14.4 | % | 12.9 | % |
(1) Tax was calculated at the annualized effective tax rate of 22.43%, 24.64%, 3.74%, 25.72%, and 30.95% for each of the above items for the years presented, respectively.
CP 2019 ANNUAL REPORT/ 58
Calculation of Adjusted ROIC
| | | | | | | | | | | | | | | | | | | For the year ended December 31 | | (in millions, except for percentages) | 2019 |
| 2018 |
| 2017 |
| 2016 |
| 2015 |
| | Adjusted operating income | $ | 3,124 |
| $ | 2,831 |
| $ | 2,468 |
| $ | 2,411 |
| $ | 2,550 |
| | Less: | | | | | | | Other (income) expense | (89 | ) | 174 |
| (178 | ) | (45 | ) | 335 |
| | Other components of net periodic benefit recovery | (381 | ) | (384 | ) | (274 | ) | (167 | ) | (70 | ) | | Significant items (pre-tax): | | | | | | | Legal settlement charge | — |
| — |
| — |
| (25 | ) | — |
| | Insurance recovery of legal settlement | — |
| — |
| 10 |
| — |
| — |
| | Charge on hedge roll and de-designation | — |
| — |
| (13 | ) | — |
| — |
| | Impact of FX translation gain (loss) on debt and lease liabilities | 94 |
| (168 | ) | 186 |
| 79 |
| (297 | ) | | Early redemption premium on notes | — |
| — |
| — |
| — |
| (47 | ) | Tax(1) | 874 |
| 788 |
| 724 |
| 673 |
| 716 |
| | | $ | 2,626 |
| $ | 2,421 |
| $ | 2,013 |
| $ | 1,896 |
| $ | 1,913 |
| | Average invested capital | $ | 15,579 |
| $ | 14,964 |
| $ | 13,961 |
| $ | 13,532 |
| $ | 12,561 |
| | Less impact of periodic significant items net of tax on the above average: | | | | | | | Income tax recovery from income tax rate changes | 44 |
| 11 |
| 270 |
| — |
| (11 | ) | | Provision for uncertain tax item | (12 | ) | — |
| — |
| — |
| — |
| | Legal settlement charge | — |
| — |
| — |
| (9 | ) | — |
| | Insurance recovery of legal settlement | — |
| — |
| 4 |
| — |
| — |
| | Charge on hedge roll and de-designation | — |
| — |
| (5 | ) | — |
| — |
| | Gain on sale of D&H South | — |
| — |
| — |
| — |
| 21 |
| | Early redemption premium on notes | — |
| — |
| — |
| — |
| (18 | ) | | Management transition recovery | — |
| — |
| 20 |
| — |
| — |
| | Adjusted average for the 12 months of total shareholders' equity, long-term debt, long-term debt maturing within one year and short-term borrowing | $ | 15,547 |
| $ | 14,953 |
| $ | 13,672 |
| $ | 13,541 |
| $ | 12,569 |
| | Adjusted ROIC | 16.9 | % | 16.2 | % | 14.7 | % | 14.0 | % | 15.2 | % |
(1) Tax was calculated at the adjusted annualized effective tax rate of 24.96%, 24.55% 26.42% 26.20% and 27.25% for each of the above items for the years presented, respectively.
Free Cash
Free cash is calculated as Cash provided by operating activities, less Cash used in investing activities, adjusted for changes in cash and cash equivalents balances resulting from FX fluctuations, the cash settlement of hedges settled upon issuance of debt, and the acquisition of CMQ. Free cash is a measure that management considers to be an indicator of liquidity. Free cash is useful to investors and other external users of the Company's Consolidated Financial Statements as it assists with the evaluation of the Company's ability to generate cash from its operations without incurring additional external financing. The cash settlement of forward starting swaps that occurred in the second quarter of 2018 in conjunction with the issuance of long-term debt is not an indicator of CP's ongoing cash generating ability and therefore has been excluded from Free cash. Similarly, the acquisition of CMQ that occurred in the fourth quarter of 2019 is not indicative of investment trends and has also been excluded from Free cash. Positive Free cash indicates the amount of cash available for reinvestment in the business, or cash that can be returned to investors through dividends, stock repurchase programs, debt retirements or a combination of these. Conversely, negative Free cash indicates the amount of cash that must be raised from investors through new debt or equity issues, reduction in available cash balances or a combination of these. Free cash should be considered in addition to, rather than as a substitute for, Cash provided by operating activities. Free cash is presented in Item 6. Selected Financial Data and discussed further in Liquidity and Capital Resources of this Item 7. Management’s Discussion and Analysis of Financial Condition and Results of Operations.
Reconciliation of Cash Provided by Operating Activities to Free Cash
| | | | | | | | | | | | | | | | | | | For the year ended December 31 | | (in millions) | 2019 |
| 2018 |
| 2017 |
| 2016 |
| 2015 |
| | Cash provided by operating activities | $ | 2,990 |
| $ | 2,712 |
| $ | 2,182 |
| $ | 2,089 |
| $ | 2,459 |
| | Cash used in investing activities | (1,803 | ) | (1,458 | ) | (1,295 | ) | (1,069 | ) | (1,123 | ) | | Effect of foreign currency fluctuations on U.S. dollar-denominated cash and cash equivalents | (4 | ) | 11 |
| (13 | ) | (13 | ) | 45 |
| | Less: | | | | | | | Settlement of forward starting swaps on debt issuance | — |
| (24 | ) | — |
| — |
| — |
| | Investment in Central Maine & Québec Railway | (174 | ) | — |
| — |
| — |
| — |
| | Free cash | $ | 1,357 |
| $ | 1,289 |
| $ | 874 |
| $ | 1,007 |
| $ | 1,381 |
|
Foreign Exchange Adjusted % Change
FX adjusted % change allows certain financial results to be viewed without the impact of fluctuations in foreign currency exchange rates, thereby facilitating period-to-period comparisons in the analysis of trends in business performance. Financial result variances at constant currency are obtained by translating the comparable period of the prior year results denominated in U.S. dollars at the foreign exchange rates of the current period.
FX adjusted % changes in revenues are further used in calculating FX adjusted % change in freight revenue per carload and RTM. These items are presented in Operating Revenues of this Item 7. Management’s Discussion and Analysis of Financial Condition and Results of Operations.
| | | | | | | | | | | | | | | | | | | | | | | | | | | | | | | | | 2019 vs. 2018 | | 2018 vs. 2017 | | (in millions) | Reported 2019 |
| Reported 2018 |
| Reported 2017 |
| Variance
due to
FX | FX Adjusted 2018 | FX Adj. % Change | | Variance
due to
FX | FX Adjusted 2017 | FX Adj. % Change | | Freight revenues by line of business | | | | | | | | | | | | Grain | $ | 1,684 |
| $ | 1,566 |
| $ | 1,532 |
| $ | 19 |
| $ | 1,585 |
| 6 |
| | $ | — |
| $ | 1,532 |
| 2 |
| | Coal | 682 |
| 673 |
| 631 |
| 2 |
| 675 |
| 1 |
| | — |
| 631 |
| 7 |
| | Potash | 462 |
| 486 |
| 411 |
| 6 |
| 492 |
| (6 | ) | | (1 | ) | 410 |
| 19 |
| | Fertilizers and sulphur | 250 |
| 243 |
| 241 |
| 4 |
| 247 |
| 1 |
| | (1 | ) | 240 |
| 1 |
| | Forest products | 304 |
| 284 |
| 265 |
| 5 |
| 289 |
| 5 |
| | (1 | ) | 264 |
| 8 |
| | Energy, chemicals and plastics | 1,534 |
| 1,243 |
| 898 |
| 17 |
| 1,260 |
| 22 |
| | (1 | ) | 897 |
| 39 |
| | Metals, minerals, and consumer products | 752 |
| 797 |
| 739 |
| 16 |
| 813 |
| (8 | ) | | (1 | ) | 738 |
| 8 |
| | Automotive | 352 |
| 322 |
| 293 |
| 7 |
| 329 |
| 7 |
| | (2 | ) | 291 |
| 11 |
| | Intermodal | 1,593 |
| 1,538 |
| 1,365 |
| 10 |
| 1,548 |
| 3 |
| | (1 | ) | 1,364 |
| 13 |
| | Freight revenues | 7,613 |
| 7,152 |
| 6,375 |
| 86 |
| 7,238 |
| 5 |
| | (8 | ) | 6,367 |
| 12 |
| | Non-freight revenues | 179 |
| 164 |
| 179 |
| 1 |
| 165 |
| 8 |
| | — |
| 179 |
| (8 | ) | | Total revenues | $ | 7,792 |
| $ | 7,316 |
| $ | 6,554 |
| $ | 87 |
| $ | 7,403 |
| 5 |
|
| $ | (8 | ) | $ | 6,546 |
| 12 |
|
CP 2019 ANNUAL REPORT/ 60
FX adjusted % changes in operating expenses are discussed in Operating Expenses of this Item 7. Management’s Discussion and Analysis of Financial Condition and Results of Operations.
| | | | | | | | | | | | | | | | | | | | | | | | | | | | | | | | | 2019 vs. 2018 | | 2018 vs. 2017 | | (in millions) | Reported 2019 |
| Reported 2018 |
| Reported 2017 |
| Variance
due to
FX | FX Adjusted 2018 | FX Adj. % Change | | Variance
due to
FX | FX Adjusted 2017 | FX Adj. % Change | | Compensation and benefits | $ | 1,540 |
| $ | 1,468 |
| $ | 1,309 |
| $ | 11 |
| $ | 1,479 |
| 4 |
| | $ | (1 | ) | $ | 1,308 |
| 12 |
| | Fuel | 882 |
| 918 |
| 677 |
| 18 |
| 936 |
| (6 | ) | | — |
| 677 |
| 36 |
| | Materials | 210 |
| 201 |
| 190 |
| 1 |
| 202 |
| 4 |
| | — |
| 190 |
| 6 |
| | Equipment rents | 137 |
| 130 |
| 142 |
| 3 |
| 133 |
| 3 |
| | — |
| 142 |
| (8 | ) | | Depreciation and amortization | 706 |
| 696 |
| 661 |
| 4 |
| 700 |
| 1 |
| | — |
| 661 |
| 5 |
| | Purchased services and other | 1,193 |
| 1,072 |
| 1,056 |
| 11 |
| 1,083 |
| 10 |
| | (3 | ) | 1,053 |
| 2 |
| | Total operating expenses | $ | 4,668 |
| $ | 4,485 |
| $ | 4,035 |
| $ | 48 |
| $ | 4,533 |
| 3 |
|
| $ | (4 | ) | $ | 4,031 |
| 11 |
|
Dividend Payout Ratio and Adjusted Dividend Payout Ratio
Dividend payout ratio is calculated as dividends declared per share divided by Diluted EPS. Adjusted dividend payout ratio is calculated as dividends declared per share divided by Adjusted diluted EPS, as defined above. These ratios are measures of shareholder return and provide information on the Company's ability to declare dividends on an ongoing basis. Dividend payout ratio and Adjusted dividend payout ratio are presented in Item 6. Selected Financial Data and discussed further in Liquidity and Capital Resources of this Item 7. Management’s Discussion and Analysis of Financial Condition and Results of Operations.
Calculation of Dividend Payout Ratio
| | | | | | | | | | | | | | | | | | | For the year ended December 31 | | (in dollars, except for percentages) | 2019 |
| 2018 |
| 2017 |
| 2016 |
| 2015 |
| | Dividends declared per share | $ | 3.1400 |
| $ | 2.5125 |
| $ | 2.1875 |
| $ | 1.8500 |
| $ | 1.4000 |
| | Diluted EPS | 17.52 |
| 13.61 |
| 16.44 |
| 10.63 |
| 8.40 |
| | Dividend payout ratio | 17.9 | % | 18.5 | % | 13.3 | % | 17.4 | % | 16.7 | % |
Calculation of Adjusted Dividend Payout Ratio
| | | | | | | | | | | | | | | | | | | For the year ended December 31 | | (in dollars, except for percentages) | 2019 |
| 2018 |
| 2017 |
| 2016 |
| 2015 |
| | Dividends declared per share | $ | 3.1400 |
| $ | 2.5125 |
| $ | 2.1875 |
| $ | 1.8500 |
| $ | 1.4000 |
| | Adjusted diluted EPS | 16.44 |
| 14.51 |
| 11.39 |
| 10.29 |
| 10.10 |
| | Adjusted dividend payout ratio | 19.1 | % | 17.3 | % | 19.2 | % | 18.0 | % | 13.9 | % |
Long-term Debt to Net Income and Adjusted Net Debt to Adjusted EBITDA Ratios
Long-term debt to Net income ratio is defined as Long-term debt, including Long-term debt maturing within one year, divided by Net income. Adjusted net debt to Adjusted EBITDA ratio is calculated as Adjusted net debt divided by Adjusted EBITDA. The Adjusted net debt to Adjusted EBITDA ratio is a key credit measure used to assess the Company’s financial capacity. The ratio provides information on the Company’s ability to service its debt and other long-term obligations. Long-term debt to Net income and Adjusted net debt to Adjusted EBITDA ratio are presented in Item 6. Selected Financial Data and discussed further in Liquidity and Capital Resources of this Item 7. Management’s Discussion and Analysis of Financial Condition and Results of Operations.
Calculation of Long-term Debt to Net Income Ratio
| | | | | | | | | | | | | | | | | | (in millions, except for ratios) | 2019 |
| 2018 |
| 2017 |
| 2016 |
| 2015 |
| | Long-term debt including long-term debt maturing within one year as at December 31 | $ | 8,757 |
| $ | 8,696 |
| $ | 8,159 |
| $ | 8,684 |
| $ | 8,957 |
| | Net income for the year ended December 31 | 2,440 |
| 1,951 |
| 2,405 |
| 1,599 |
| 1,352 |
| | Long-term debt to Net income ratio | 3.6 |
| 4.5 |
| 3.4 |
| 5.4 |
| 6.6 |
|
Reconciliation of Long-term Debt to Adjusted Net Debt
Adjusted net debt is defined as Long-term debt, Long-term debt maturing within one year and Short-term borrowing as reported on the Company’s Consolidated Balance Sheets adjusted for pension plans deficit, operating lease liabilities recognized on the Company's Consolidated Balance Sheets, and Cash and cash equivalents.
| | | | | | | | | | | | | | | | | | (in millions) | 2019 |
| 2018 |
| 2017 |
| 2016 |
| 2015 |
| | Long-term debt including long-term debt maturing within one year as at December 31 | $ | 8,757 |
| $ | 8,696 |
| $ | 8,159 |
| $ | 8,684 |
| $ | 8,957 |
| | Add: | | | | | | Pension plans deficit(1) | 294 |
| 266 |
| 278 |
| 273 |
| 295 |
| Operating lease liabilities(2) | 354 |
| 387 |
| 281 |
| 361 |
| 439 |
| | Less: | | | | | | | Cash and cash equivalents | 133 |
| 61 |
| 338 |
| 164 |
| 650 |
| | Adjusted net debt as at December 31 | $ | 9,272 |
| $ | 9,288 |
| $ | 8,380 |
| $ | 9,154 |
| $ | 9,041 |
|
(1) Pension plans deficit is the total funded status of the Pension plans in deficit only.
(2) Current period amount is as reported in compliance with GAAP following the adoption of Accounting Standards Update ("ASU") 2016-02 under the cumulative-effect adjustment transition approach, discussed further in Item 8. Financial Statements and Supplementary Data, Note 2 Accounting changes.24: Stock-based compensation in our Annual Report on Form10-K filed with the SEC and securities regulatory authorities in Canada on February 20, 2020 for more details.We value our PSUs using the Willis Towers Watson binomial lattice model methodology. Using this methodology, the grant date expected fair value on February 14, 2019 was $217.21 on the TSX and US$163.62 on the NYSE, and, on September 3,
2019, the grant date expected fair value was US$190.16 on the NYSE. The comparative periods'Willis Towers Watson expected life binomial methodology for the PSUs are calculated based on the following assumptions: | | | | | Willis Towers Watson expected life binomial valuation | | | | | | | | | | | | | | | | | |
Mr. Velani’s, Mr. Brooks’ and Mr. Redd’s amounts have not been restated and were calculated asinclude the net present value of operating leases discounted bymatching DSUs granted in 2019. Stock options were granted on January 25, 2019. The grant date fair value of stock option awards granted to each NEO has been calculated in accordance with FASB ASC Topic 718: Compensation—Stock Compensation. We used the Company's effective interest rateBlack-Scholes option-pricing model (with reference to the shares underlying the options). The grant date accounting fair value of the awards shown in the Summary Compensation table shown respectively with reference to the TSX and NYSE are $60.01 or US$50.64 for the period presented.
CPJanuary 25, 2019 ANNUAL REPORT/ 62
Reconciliation of Net Incomegrant. Additional options were granted to EBIT, Adjusted EBITMr. Brooks on February 14, 2019 and Adjusted EBITDA
Earnings before interestMr. Redd on September 3, 2019 to bring them to the Executive Vice-President level. The grant date accounting fair value on the NYSE is US$49.28 for the February 14, 2019 grant and tax ("EBIT") is calculated as Net income before Net interest expense and Income tax expense. Adjusted EBIT excludes significant items reportedUS$50.29 for the September 3, 2019 grant, both were in both Operating income and Other (income) expense. Adjusted EBITDA is calculated as Adjusted EBIT plus operating lease expense and Depreciation and amortization, less Other components of net periodic benefit recovery.
| | | | | | | | | | | | | | | | | | | For the year ended December 31 | | (in millions) | 2019 |
| 2018 |
| 2017 |
| 2016 |
| 2015 |
| | Net income as reported | $ | 2,440 |
| $ | 1,951 |
| $ | 2,405 |
| $ | 1,599 |
| $ | 1,352 |
| | Add: | | | | | | | Net interest expense | 448 |
| 453 |
| 473 |
| 471 |
| 394 |
| | Income tax expense | 706 |
| 637 |
| 93 |
| 553 |
| 607 |
| | EBIT | 3,594 |
| 3,041 |
| 2,971 |
| 2,623 |
| 2,353 |
| | Less significant items (pre-tax): | | | | | | | Legal settlement charge | — |
| — |
| — |
| (25 | ) | — |
| | Insurance recovery of legal settlement | — |
| — |
| 10 |
| — |
| — |
| | Charge on hedge roll and de-designation | — |
| — |
| (13 | ) | — |
| — |
| | Gain on sale of D&H South | — |
| — |
| — |
| — |
| 68 |
| | Management transition recovery | — |
| — |
| 51 |
| — |
| — |
| | Impact of FX translation gain (loss) on debt and lease liabilities | 94 |
| (168 | ) | 186 |
| 79 |
| (297 | ) | | Early redemption premium on notes | — |
| — |
| — |
| — |
| (47 | ) | | Adjusted EBIT | 3,500 |
| 3,209 |
| 2,737 |
| 2,569 |
| 2,629 |
| | Add: | | | | | | | Operating lease expense | 83 |
| 97 |
| 104 |
| 111 |
| 127 |
| | Depreciation and amortization | 706 |
| 696 |
| 661 |
| 640 |
| 595 |
| | Less: | | | | | | | Other components of net periodic benefit recovery | 381 |
| 384 |
| 274 |
| 167 |
| 70 |
| | Adjusted EBITDA | $ | 3,908 |
| $ | 3,618 |
| $ | 3,228 |
| $ | 3,153 |
| $ | 3,281 |
|
Calculation of Adjusted Net Debtreference to Adjusted EBITDA Ratiothe NYSE.See Incentive plan awards | | | | | | | | | | | | | | | | | | (in millions, except for ratios) | 2019 |
| 2018 |
| 2017 |
| 2016 |
| 2015 |
| | Adjusted net debt as at December 31 | $ | 9,272 |
| $ | 9,288 |
| $ | 8,380 |
| $ | 9,154 |
| $ | 9,041 |
| | Adjusted EBITDA for the year ended December 31 | 3,908 |
| 3,618 |
| 3,228 |
| 3,153 |
| 3,281 |
| | Adjusted net debt to Adjusted EBITDA ratio | 2.4 |
| 2.6 |
| 2.6 |
| 2.9 |
| 2.8 |
|
Off-Balance Sheet Arrangements
Guarantees
Refer toon page 47 for details about the 2019 awards. See Item 8.8, Financial Statements and Supplementary Data, Note 27 Guarantees24: Stock-based compensation in our Annual Report on Form10-K filed with the SEC and securities regulatory authorities in Canada on February 20, 2020 for more details.
To calculate the number of options that an executive receives, we use Willis Towers Watson’s expected life binomial methodology which is fundamentally similar to the methodology used to determine the accounting fair value; however, some of the underlying assumptions are different. For example, the binomial methodology assumes a slightly lower historical volatility, a higher risk-free rate and includes a discount to account for vesting restrictions.
The grant price on January 25, 2019 was $271.50 on the TSX with an underlying value of $54.30 and was US$205.31 on the NYSE with an underlying value of US$47.22. The grant price on February 14, 2019 was US$202.00 on the NYSE with an underlying value of US$46.46. The grant price on September 9, 2019 was US$234.76 on the NYSE with an underlying value of US$53.99. The Willis Towers Watson expected life binomial methodology for the stock options are calculated based on the following assumptions: | | | | | | | | | | | | | Assumptions | | Willis Towers Watson expected life binomial valuation | | | | | | | NYSE | | | TSX | | | | | | | 7 years | | | | 7 years | | | | | | | | | | | | | | | | | | 4.75 years | | | | 4.75 years | | | | | | | 1.00% | | | | 0.99% | | | | | | | 24.0% | | | | 21.7% | | | | | | | 2.5 - 3.1% | | | | 2.0 - 2.5% | | | | | | | 5% | | | | 5% | | | | | | | 23% | | | | 20% | | | |
Non-equity incentive plan compensationCash bonus earned under our short-term incentive plan for 2019 and paid in February 2020. In respect of their short-term incentive compensation, Mr. Velani, Mr. Brooks and Mr. Redd each elected to receive part of their 2019 bonus in DSUs. Mr. Creel and Mr. Velani participate in the Canadian defined contribution plan (DC plan) and in the defined contribution supplemental plan (DC SERP).
63 /SERVICE EXCELLENCEMr. Creel, Mr. Pitz, Mr. Redd and Mr. Johnson participate in the U.S. defined contribution plan and the U.S. supplemental executive retirement plan. Mr. Brooks participates in the CP Pension Plan for U.S. Management Employees. SeeRetirement plans on page 51 for more details. The NEOs also receive certain benefits and perquisites which are competitive with our comparator group. The table below shows the breakdown of all other compensation for 2019. The values in the table have been converted to Canadian dollars using the 2019 average exchange rate of $1.3269. | | | | | | | | | | | | | | | | | | | | | | | | | | | | | | | | | | | | | | | | | | | | | Perquisites | | | Other
compensation | | | | | | Name | | Personal
use of
company
aircraft
($) | | | Auto
benefits
($) | | | Housing
allowance
($) | | | Financial
and tax
planning
($) | | | Additional
medical
($) | | | Club
benefits
($) | | | 401K
match
($) | | | Employer
share
purchase
plan
match ($) | | | Tax
Assistance
($) | | | Total
($) | | | | | 413,422 | | | | 28,704 | | | | 17,056 | | | | 33,173 | | | | 1,353 | | | | 23,647 | | | | 7,165 | | | | 30,410 | | | | - | | | | 554,930 | | | | | - | | | | 33,177 | | | | - | | | | - | | | | - | | | | 11,200 | | | | - | | | | 14,872 | | | | - | | | | 59,249 | | | | | - | | | | 26,251 | | | | - | | | | - | | | | 2,610 | | | | 14,861 | | | | 9,658 | | | | 13,271 | | | | - | | | | 66,651 | | | | | - | | | | 22,543 | | | | - | | | | - | | | | - | | | | 14,861 | | | | 8,203 | | | | - | | | | - | | | | 45,607 | | | | | - | | | | 36,594 | | | | - | | | | - | | | | 2,510 | | | | 14,861 | | | | 7,626 | | | | 9,728 | | | | 143,305 | | | | 214,624 | | | | | - | | | | 53,148 | | | | - | | | | - | | | | - | | | | 14,861 | | | | 9,616 | | | | 1,949 | | | | - | | | | 79,574 | |
| | | | Use of company aircraft | | The value is calculated by multiplying the variable cost per air hour by the number of hours used for travel and includes costs for fuel, maintenance, landing fees and other miscellaneous costs. As an executive of a Calgary-based company, enabling the CEO to visit his family in the United States is an important retention tool.Non-corporate use of the corporate jet has been limited to family visits and limited to the CEO only. | | Auto benefits | | Includes a company-leased vehicle and reimbursement of related operating costs as well as taxable reimbursement of auto benefits for eligible vehicles. Upon retirement on September 30, 2019, Mr. Johnson received his vehicle as a gift from CP. His auto benefits include the value of the vehicle and the lease payments for the time he was employed in 2019. | | | The incremental cost to provide reasonable accommodation for Mr. Creel in Calgary. | Financial and tax planning | | For Mr. Creel, financial and tax planning services according to his current employment contract. | | | CP encourages executives to participate in the executive medical program. Under the U.S. medical benefits plan, available to all U.S. employees, the majority of the cost of a medical examination is covered by the plan. Only additional services for the executive medical are paid for by CP. In Canada, executive medicals are not covered under any general benefit plan. | | | Included in the perquisites program available to all senior executives. | | 401K plan | | Mr. Creel, Mr. Brooks, Mr. Pitz, Mr. Redd and Mr. Johnson also receive matching contributions to the 401k plan. | | ESPP match | | Includes company contributions to the employee share purchase plan (ESPP). The NEOs participate in the ESPP on the same terms and using the same formulas as other participants. See page 50 to read more about the ESPP. | | Tax assistance | | As a U.S. employee relocating to CP’s head office in Canada, Mr. Redd was provided with tax assistance to minimize the tax implications of his cross-border employment on his base salary and any STIP payment up to target. All other income was taxed at full Canadian tax rates. Mr. Redd’s tax assistance is an estimate for 2019. Effective with his promotion to Executive Vice President, Mr. Redd is no longer eligible for tax assistance. |
Except for Mr. Creel, employment agreements for executive officers are set out in a standard offer letter template. The letters contain the standard terms as described in the compensation discussion and analysis and include an annual salary, participation in the short and long-term incentive plans as approved annually by the Compensation Committee, participation in the benefit plans or programs generally available to management employees and modest perquisites. As of the date of this proxy circular, all of our NEOs have atwo-year non-compete, non-solicitation agreement tied to their CP employment. Mr. Creel’s employment agreement includes: reasonable living accommodation in Calgary
use of the corporate jet for business commuting and family visits within North America
Contractual Commitments
non-disclosure, non-solicitation covenantsseverance provisions as described on page 54 reimbursement for club memberships of up to US$25,000 annually reimbursement for financial services of up to US$25,000 annually
Outstanding share-based awards and option-based awards The table below shows all vested and unvested equity incentive awards that were outstanding as of December 31, 2019. SeeLong-term incentive plan beginning on page 21 for more information about our stock option and share-based awards. | | | | | | | | | | | | | | | | | | | | | | | | | | | | | | | | | | | | | | | | | | Option-based awards | | | | | Share-based awards | | | Name | | Grant date | | | Number of
securities
underlying
unexercised
options | | | Option
exercise
price
($) | | | | | | Value of unexercised options | | | Grant
type | | Number of
shares or units
of shares that
have not
vested | | | Market or
payout value of
share-based
awards that
have not vested
($) | | | Market or payout
value of vested
share-based
awards not paid
out or distributed
($) | | | | | | | | | 39,900 | | | | 168.84 | | | | | | | | 6,471,381 | | | | | | | | | | | | | | | | | | | | | | | 47,940 | | | | 210.32 | | | | | | | | 5,786,837 | | | | | | | | | | | | | | | | | | | | | | | 33,910 | | | | 175.92 | | | | | | | | 3,480,664 | | | | | | | | | | | | | | | | | | | | | | | 55,250 | | | | 116.80 | | | | | | | | 9,913,464 | | | | | | | | | | | | | | | | | | | | | | | 33,884 | | | | 150.99 | | | | | | | | 4,575,128 | | | | | | | | | | | | | | | | | | | | | | | 18,762 | | | | 151.14 | | | | | | | | 2,529,651 | | | | | | | | | | | | | | | | | | | | | | | 177,225 | | | | 151.14 | | | | | | | | 23,894,968 | | | | | | | | | | | | | | | | | | | | | | | 43,148 | | | | 185.85 | | | | | | | | 3,872,407 | | | | | | | | | | | | | | | | | | | | | | | 54,202 | | | | 205.31 | | | | | | | | 3,494,535 | | | | | | | | | | | | | | | | | | | | | | | | | | | | | | | | | | | | | | DSU | | | | | | | | | | | 10,546,127 | | | | | | | | | | | | | | | | | | | | | | | | PSU | | | | | | | | | | | 14,138,889 | | | | | | | | | | | | | | | | | | | | | | | | PSU | | | 18,621 | | | | 6,166,051 | | | | | | | | | | | | | | | | | | | | | | | | | | | | PSU | | | 22,068 | | | | 7,307,316 | | | | | | | | | | | | | 504,221 | | | | | | | | | | | | 64,019,035 | | | | | | 40,689 | | | | 13,473,367 | | | | 24,685,016 | | | | | | | | | 2,310 | | | | 126.34 | | | | | | | | 472,834 | | | | | | | | | | | | | | | | | | | | | | | 1,820 | | | | 168.84 | | | | | | | | 295,186 | | | | | | | | | | | | | | | | | | | | | | | 1,539 | | | | 218.78 | | | | | | | | 172,753 | | | | | | | | | | | | | | | | | | | | | | | 2,927 | | | | 165.74 | | | | | | | | 483,804 | | | | | | | | | | | | | | | | | | | | | | | 4,644 | | | | 201.49 | | | | | | | | 601,584 | | | | | | | | | | | | | | | | | | | | | | | 13,260 | | | | 231.66 | | | | | | | | 1,317,646 | | | | | | | | | | | | | | | | | | | | | | | 16,313 | | | | 271.50 | | | | | | | | 971,113 | | | | | | | | | | | | | | | | | | | | | | | | | | | | | | | | | | | | | | DSU | | | | | | | | | | | 223,781 | | | | | | | | | | | | | | | | | | | | | | | | DSU | | | | | | | | | | | 113,220 | | | | | | | | | | | | | | | | | | | | | | | | DSU | | | 124 | | | | 41,083 | | | | 164,332 | | | | | | | | | | | | | | | | | | | | | | | | DSU | | | 270 | | | | 89,402 | | | | 357,609 | | | | | | | | | | | | | | | | | | | | | | | | PSU | | | | | | | | | | | 2,517,052 | | | | | | | | | | | | | | | | | | | | | | | | PSU | | | 5,304 | | | | 1,755,752 | | | | | | | | | | | | | | | | | | | | | | | | | | | | PSU | | | 5,832 | | | | 1,930,622 | | | | | | | | | | | | | 42,813 | | | | | | | | | | | | 4,314,920 | | | | | | 11,530 | | | | 3,816,859 | | | | 3,375,994 | | | | | | | | | 2,850 | | | | 75.71 | | | | | | | | 727,662 | | | | | | | | | | | | | | | | | | | | | | | 2,345 | | | | 97.70 | | | | | | | | 547,159 | | | | | | | | | | | | | | | | | | | | | | | 1,900 | | | | 119.18 | | | | | | | | 402,515 | | | | | | | | | | | | | | | | | | | | | | | 1,440 | | | | 168.84 | | | | | | | | 233,554 | | | | | | | | | | | | | | | | | | | | | | | 2,506 | | | | 175.92 | | | | | | | | 257,226 | | | | | | | | | | | | | | | | | | | | | | | 4,340 | | | | 116.80 | | | | | | | | 778,723 | | | | | | | | | | | | | | | | | | | | | | | 2,610 | | | | 150.99 | | | | | | | | 352,411 | | | | | | | | | | | | | | | | | | | | | | | 4,195 | | | | 185.85 | | | | | | | | 376,489 | | | | | | | | | | | | | | | | | | | | | | | 7,484 | | | | 205.31 | | | | | | | | 482,512 | | | | | | | | | | | | | | | | | | | | | | | 2,969 | | | | 202.00 | | | | | | | | 204,182 | | | | | | | | | | | | | | | | | | | | | | | | | | | | | | | | | | | | | | DSU | | | | | | | | | | | 334,073 | | | | | | | | | | | | | | | | | | | | | | | | DSU | | | 166 | | | | 54,816 | | | | 219,265 | | | | | | | | | | | | | | | | | | | | | | | | PSU | | | | | | | | | | | 1,374,360 | | | | | | | | | | | | | | | | | | | | | | | | PSU | | | 1,810 | | | | 599,421 | | | | | | | | | | | | | | | | | | | | | | | | | | | | PSU | | | 4,499 | | | | 1,489,757 | | | | | | | | | | | | | 32,639 | | | | | | | | | | | | 4,362,433 | | | | | | 6,475 | | | | 2,143,994 | | | | 1,927,698 | | | | | | | | | 1,808 | | | | 116.80 | | | | | | | | 324,408 | | | | | | | | | | | | | | | | | | | | | | | 2,376 | | | | 150.99 | | | | | | | | 320,815 | | | | | | | | | | | | | | | | | | | | | | | 3,290 | | | | 185.85 | | | | | | | | 295,268 | | | | | | | | | | | | | | | | | | | | | | | 7,484 | | | | 205.31 | | | | | | | | 482,512 | | | | | | | | | | | | | | | | | | | | | | | | | | | | | | | | | | | | | | DSU | | | | | | | | | | | 592,133 | | | | | | | | | | | | | | | | | | | | | | | | DSU | | | | | | | | | | | 876,230 | | | | | | | | | | | | | | | | | | | | | | | | PSU | | | | | | | | | | | 1,264,578 | | | | | | | | | | | | | | | | | | | | | | | | PSU | | | 1,893 | | | | 626,713 | | | | | | | | | | | | | | | | | | | | | | | | | | | | PSU | | | 3,047 | | | | 1,008,964 | | | | | | | | | | | | | 14,958 | | | | | | | | | | | | 1,423,003 | | | | | | 4,940 | | | | 1,635,677 | | | | 2,732,941 | |
| | | | | | | | | | | | | | | | | | | | | | | | | | | | | | | | | | | | | | | | | | Option-based awards | | | | | Share-based awards | | | Name | | Grant date | | | Number of
securities
underlying
unexercised
options | | | Option
exercise
price
($) | | | | | | Value of unexercised options | | | Grant
type | | Number of
shares or units
of shares that
have not
vested | | | Market or
payout value of
share-based
awards that
have not vested
($) | | | Market or payout
value of vested
share-based
awards not paid
out or distributed
($) | | | | | | | | | 1,380 | | | | 166.16 | | | | | | | | 227,521 | | | | | | | | | | | | | | | | | | | | | | | 1,256 | | | | 175.92 | | | | | | | | 128,921 | | | | | | | | | | | | | | | | | | | | | | | 2,042 | | | | 116.80 | | | | | | | | 366,394 | | | | | | | | | | | | | | | | | | | | | | | 3,734 | | | | 150.99 | | | | | | | | 504,177 | | | | | | | | | | | | | | | | | | | | | | | 4,015 | | | | 185.85 | | | | | | | | 360,335 | | | | | | | | | | | | | | | | | | | | | | | 5,280 | | | | 194.97 | | | | | | | | 411,323 | | | | | | | | | | | | | | | | | | | | | | | 3,996 | | | | 205.31 | | | | | | | | 257,632 | | | | | | | | | | | | | | | | | | | | | | | 1,297 | | | | 234.76 | | | | | | | | 34,011 | | | | | | | | | | | | | | | | | | | | | | | | | | | | | | | | | | | | | | DSU | | | | | | | | | | | 144,884 | | | | | | | | | | | | | | | | | | | | | | | | DSU | | | 140 | | | | 46,499 | | | | 185,998 | | | | | | | | | | | | | | | | | | | | | | | | PSU | | | | | | | | | | | 1,178,305 | | | | | | | | | | | | | | | | | | | | | | | | PSU | | | 1,733 | | | | 573,813 | | | | | | | | | | | | | | | | | | | | | | | | | | | | PSU | | | 1,708 | | | | 565,642 | | | | | | | | | | | | | | | | | | | | | | | | | | | | PSU | | | 1,627 | | | | 538,848 | | | | | | | | | | | | | | | | | | | | | | | | | | | | PSU | | | 554 | | | | 183,289 | | | | | | | | | | | | | 23,000 | | | | | | | | | | | | 2,290,314 | | | | | | 5,762 | | | | 1,908,091 | | | | 1,509,187 | | | | | | | | | 2,061 | | | | 116.80 | | | | | | | | 369,804 | | | | | | | | | | | | | | | | | | | | | | | 5,778 | | | | 150.99 | | | | | | | | 780,164 | | | | | | | | | | | | | | | | | | | | | | | 7,038 | | | | 185.85 | | | | | | | | 631,640 | | | | | | | | | | | | | | | | | | | | | | | 9,367 | | | | 205.31 | | | | | | | | 603,913 | | | | | | | | | | | | | | | | | | | | | | | | | | | | | | | | | | | | | | DSU | | | | | | | | | | | 1,879,575 | | | | | | | | | | | | | | | | | | | | | | | | DSU | | | | | | | | | | | 213,756 | | | | | | | | | | | | | | | | | | | | | | | | PSU | | | | | | | | | | | 3,075,226 | | | | | | | | | | | | | | | | | | | | | | | | PSU | | | 4,050 | | | | 1,341,032 | | | | | | | | | | | | | | | | | | | | | | | | | | | | PSU | | | 3,814 | | | | 1,262,873 | | | | | | | | | | | | | 24,244 | | | | | | | | | | | | 2,385,521 | | | | | | 7,864 | | | | 2,603,905 | | | | 5,168,557 | |
In general, regular options granted before 2017 vest 25% each year for four years beginning on the anniversary of the grant date and expire 10 years from the grant date. Grants made in 2017 and onwards expire 7 years from the grant date. Mr. Redd received a performance option grant on July 20, 2018 for retention purposes. His 2018 performance option grant will become exercisable on July 20, 2021 upon the achievement of thepre-determined performance criteria at the end of the fiscal year ending December 31, 2020 and will expire 7 years from the grant date. All exercise prices for grants received prior to 2015 are shown in Canadian dollars. With respect to Mr. Creel, Mr. Brooks, Mr. Pitz, Mr. Redd and Mr. Johnson, exercise prices for option awards that were granted in 2015 or later are shown in U.S. dollars. All of Mr. Velani’s exercise prices are shown in Canadian dollars. Value of unexercisedoptions at 2019year-end Based on $331.03, our closing share price on the TSX on December 31, 2019. For all the NEOs, except Mr. Velani, option awards made in 2015 or later have been valued based on US$254.95, our closing share price on the NYSE on December 31, 2019 and converted into Canadian dollars using ayear-end exchange rate of $1.2988. Mr. Creel was awarded 177,225 performance stock options on February 1, 2017. These options will vest on February 1, 2022 provided certain performance metrics are achieved. The amount reflects the market value of these performance stock options based on US$254.95, our closing share price on the NYSE on December 31, 2019 and converted into Canadian dollars using ayear-end exchange rate of $1.2988. For Mr. Velani, the value of unvested PSUs and DSUs is based on $331.03, our closing share price on the TSX on December 31, 2019. For Mr. Creel, Mr. Brooks, Mr. Pitz, Mr. Redd and Mr. Johnson: the value of PSUs or DSUs is based on US$254.95, our closing share price on the NYSE on December 31, 2019, converted into Canadian dollars using ayear-end exchange rate of $1.2988.
PSUs assume a payout at target (100%) for the 2018 and 2019 grants. The 2017 PSU value reflects a payout at 193% on the award which includes dividends earned up to the payment date. Vested and unvested DSU awards are deferred and cannot be redeemed until the executive leaves the company. Incentive plan awards – value vested or earned during the year The table below shows the amount of incentive compensation that vested or was earned in 2019. | | | | | | | | | | | | | | | | Option-based awards -
value vested during the year ($) | | | Share-based awards -
value vested during the year ($) | | | Non-equity incentive plan compensation - value earned during the year ($) | | | | | 2,679,271 | | | | 14,138,889 | | | | 2,978,994 | | | | | 256,072 | | | | 2,778,742 | | | | 1,095,729 | | | | | 185,799 | | | | 1,529,295 | | | | 829,259 | | | | | 309,653 | | | | 1,353,851 | | | | 571,230 | | | | | 133,500 | | | | 1,309,733 | | | | 592,539 | | | | | 462,290 | | | | 3,075,226 | | | | 523,969 | |
Option-based awards – value vested during the year Option-based awards include the aggregate dollar value that would have been realized if the options were exercised on the date of vest. It is calculated as the difference between the closing price (on each of the stock option vest dates in 2019) and the exercise price, converted to Canadian dollars where applicable using the exchange rate on the vest date. Share-based awards – value vested during the year The value includes DSUs that have vested during the year and are valued as of the vest date and converted to Canadian dollars where applicable, as well as the 2017 PSU value which vested at 193% on December 31, 2019. The accompanying2017 PSU value realized on vesting is calculated by multiplying the number of shares acquired on vesting by $323.56, the average30-day trading price of our shares prior to December 31, 2019 on the TSX for Mr. Velani, and US$245.01 on the NYSE for Mr. Creel, Mr. Brooks, Mr. Pitz, Mr. Redd and Mr. Johnson, converted to Canadian dollars using theyear-end exchange rate of $1.2988 and by multiplying that product by the achieved performance factor.Option exercises and vested stock awards The table indicatesbelow shows the Company’s obligationsoptions exercised and commitmentssold by the NEOs in 2019. | | | | | | | | | | | | | | | | Number of options exercised and sold | | | Option exercise price ($) | | | | | | | | 59,325 | | | | 115.78 | | | | 12,770,437 | | | | | | 53,350 | | | | 119.18 | | | | 11,301,402 | | | | | 900 | | | | 51.17 | | | | 234,697 | | | | | | 3,200 | | | | 65.06 | | | | 787,706 | | | | | 4,584 | | | | 175.92 | | | | 393,199 | | | | | 3,618 | | | | 116.80 | | | | 585,031 | | | | | 2,377 | | | | 150.99 | | | | 276,409 | | | | | | 1,097 | | | | 185.85 | | | | 77,370 | | | | | 1,410 | | | | 168.84 | | | | 205,910 | | | | | 3,640 | | | | 129.54 | | | | 669,053 | | | | | 5,870 | | | | 168.84 | | | | 845,179 | | | | | 5,198 | | | | 175.92 | | | | 397,230 | | | | | 6,183 | | | | 116.80 | | | | 953,444 | | | | | 5,779 | | | | 150.99 | | | | 630,239 | | | | | | 2,347 | | | | 185.85 | | | | 147,957 | |
| (1) | Mr. Creel exercised his 2013 options that would be expiring in the next three years. |
| (2) | Mr. Brooks exercised his 2010 and 2011 options that would be expiring in 2020 and 2021 respectively. |
| (3) | Robert Johnson retired September 30, 2019 and exercised all of his vested options upon retirement. |
Value realized is calculated using the actual market price of the shares acquired upon exercise of the respective options less the exercise price for those options. All values are displayed in Canadian dollars. The value for exercised options which were granted on the NYSE have been converted to make future paymentsCanadian dollars using the exchange rate applicable on the date of exercise.Equity compensation plan information The table below shows the securities authorized for contracts, such as debt, leases, and commercial arrangements asissuance under equity compensation plans at December 31, 2019. These include the issuance of securities upon exercise of options outstanding under the stock option plan and the director stock option plan. The table also shows the remaining number of shares available for issuance and includes 340,000 shares under the director stock option plan. On July 21, 2003, the Board suspended any additional grants of options under the director stock option plan and there are no outstanding options under that plan. | | | | | | | | | | | | | | | | | | Payments due by period (in millions) | Total |
| 2020 |
| 2021 & 2022 |
| 2023 & 2024 |
| Thereafter |
| | Contractual commitments |
|
|
|
|
|
|
|
|
|
| | Interest on long-term debt and finance leases | $ | 11,117 |
| $ | 431 |
| $ | 804 |
| $ | 690 |
| $ | 9,192 |
| | Long-term debt | 8,692 |
| 592 |
| 842 |
| 568 |
| 6,690 |
| | Finance leases | 151 |
| 7 |
| 113 |
| 13 |
| 18 |
| Operating leases(1) | 395 |
| 80 |
| 106 |
| 79 |
| 130 |
| | Supplier purchase | 3,090 |
| 699 |
| 1,295 |
| 727 |
| 369 |
| Other long-term liabilities(2) | 495 |
| 53 |
| 102 |
| 99 |
| 241 |
| | Total contractual commitments | $ | 23,940 |
| $ | 1,862 |
| $ | 3,262 |
| $ | 2,176 |
| $ | 16,640 |
|
| | | | | | | | | | | | | | | | Number of securities to
be issued upon exercise
of outstanding options,
warrants and rights | | | Weighted-average
exercise price of
outstanding options,
warrants and rights ($) | | | Number of securities remaining
available for future issuance under equity
compensation plans (excluding securities
reflected in the first column) | | Equity compensation plans approved by security holders | | | 1,416,346 | | | | 199.12 | | | | 1,438,707 | | Equity compensation plans not approved by security holders | | | - | | | | - | | | | - | | | | | 1,416,346 | | | | 199.12 | | | | 1,438,707 | |
(1) Residual value guarantees
See page 24 to read more about the stock option plan. You can also read about the two equity compensation plans in our audited consolidated financial statements for the year ended December 31, 2019, available on certain leased equipmentour website (investor.cpr.ca/financials), and on SEDAR (www.sedar.com) and EDGAR (www.sec.gov). Employee Share Purchase Program (ESPP) CP’s ESPP is available to all employees and provides the opportunity to purchase voting shares on the open market through payroll deductions which aligns employees’ interests with those of shareholders. Employees may contribute between 1% and 10% of their base salary to the ESPP every pay period. CP provides a maximum exposure33% match on the first 6% of $2 million are not includednon-unionized and specified unionized employees’ contributions, which vest at the end of the four consecutive quarters. Employees must remain participants of the ESPP at the time of vesting in order to receive the CP match. As of December 31, 2019, approximately 45% of employees participated in the minimum payments shown above, as management believesESPP.
Mr. Creel and Mr. Velani participated in our DC plan in 2019. Participants contribute between 4% and 6% of their earnings depending on their age and years of service, and the company contributes between 4% and 8% of earnings. Total contributions are limited to the maximum allowed under theIncome Tax Act (Canada) ($27,230 for 2019). Defined contribution plan | | | | | | | | | | | | | | | | | Accumulated value at start of year ($) | | | | | | Accumulated value at year end ($) | | | | | 1,262,991 | | | | 543,653 | | | | 2,041,957 | | | | | 455,364 | | | | 214,043 | | | | 774,411 | |
Mr. Creel and Mr. Velani also participate in the DC SERP, anon-registered plan that CP will not be required to make payments under these residual guarantees. (2) Includes expected cash payments for environmental remediation, post-retirementprovides benefits workers’ compensation benefits, long-term disability benefits, pension benefit paymentsin excess of theIncome Tax Act (Canada) limits for the Company’s non-registered supplemental pension plan,DC Plan. Specifically, the DC SERP provides a company contribution equal to 6% of a participant’s base salary and certain other long-term liabilities. Projected payments for post-retirement benefits, workers’ compensation benefits,annual bonus. Company contributions vest after two years and long-term disability benefits include the anticipated payments for years 2020 to 2029. Pension contributions for the Company’s registered pension plans areemployees do not included duecontribute to the volatility in calculating them. Pension payments are discussed further in Critical Accounting Estimates of this Item 7. Management’s Discussion and Analysis of Financial Condition and Results of Operations.
Certain Other Financial Commitments
In addition to the financial commitments mentioned above, the Company is party to certain other financial commitments discussed below.
Letters of Credit
Letters of credit are obtained mainly to provide security to third parties under the terms of various agreements, including the supplemental pension plan. CP is liable for these contractual amounts in the case of non-performance under these agreements. Letters of credit are accommodated through a revolving credit facility and the Company’s bilateral letter of credit facilities.
Capital Commitments
The Company remains committed to maintaining the current high level of quality of our capital assets in pursuing sustainable growth. As part of this commitment, CP has entered into contracts with suppliers to make various capital purchases related to track and rolling stock programs. Payments for these commitments are due in 2020 through 2032. These expenditures are expected to be financed by cash generated from operations or by issuing new debt.
The accompanying table indicates the Company’s commitments to make future payments for letters of credit and capital expenditures as at December 31, 2019.DC SERP.
| | | | | | | | | | | | | | | | | | Payments due by period (in millions) | Total |
| 2020 |
| 2021 & 2022 |
| 2023 & 2024 |
| Thereafter |
| | Certain other financial commitments | | | | | | | Letters of credit | $ | 80 |
| $ | 80 |
| $ | — |
| $ | — |
| $ | — |
| | Capital commitments | 664 |
| 332 |
| 200 |
| 61 |
| 71 |
| | Total certain other financial commitments | $ | 744 |
| $ | 412 |
| $ | 200 |
| $ | 61 |
| $ | 71 |
|
Critical Accounting Estimates
To prepare the Consolidated Financial Statements that conform with GAAP, the Company is required to make estimates and assumptions that affect the reported amounts of assets and liabilities, the disclosure of contingent assets and liabilities at the date of the Consolidated Financial Statements and the reported amounts of revenues and expenses during the reported periods. Using the most current information available, the Company reviews estimates on an ongoing basis, including those related to environmental liabilities, pensions and other benefits, property, plant and equipment, deferred income taxes, and personal injury and other claims liabilities.
The development, selection and disclosure of these estimates, and this Management's Discussion and Analysis of Financial Condition and Results of Operations, have been reviewed by the Board of Directors’ Audit and Finance Committee, which is composed entirely of independent directors.
CP 2019 ANNUAL REPORT/ 64Our U.S. retirement program has five elements:
Environmental Liabilities
Environmental remediation accruals cover site-specific remediation programs. CP estimates of the probable costs to be incurred in the remediation of properties contaminated by past railway use reflect the nature of contamination at individual sites according to typical activities and scale of operations conducted. The Company screens and classifies sites according to typical activities and scale of operations conducted. CP has developed remediation strategies for each property based on the nature and extent of the contamination, as well as the location of the property and surrounding areas that may be adversely affected by the presence of contaminants. CP also considers available technologies, treatment and disposal facilities and the acceptability of site-specific plans based on the local regulatory environment. Site-specific plans range from containment and risk management of the contaminants through to the removal and treatment of the contaminants and affected soils and groundwater. The details of the estimates reflect the environmental liability at each property. The Company is committed to fully meeting regulatory and legal obligations with respect to environmental matters.
Some sites include remediation activities that are projected beyond the 10-year period, which CP is unable to reasonably estimate and determine. Therefore, CP's accruals of the environmental liabilities is based on an estimate of costs for a rolling 10-year period covered by the environmental program. Payments are expected to be made over 10 years to 2029. A limited portion of the environmental accruals, the stable Perpetual Care for the environmental program, are fixed and reliably determined. This portion of the environmental liabilities is discounted using a risk-free rate, adjusted by inflation and productivity improvements.
Provisions for environmental remediation costs are recorded in “Other long-term liabilities” (refer to Item 8. Financial Statements and Supplementary Data, Note 20 Other long-term liabilities), except for the current portion which is recorded in “Accounts payable and accrued liabilities” (refer to Item 8. Financial Statements and Supplementary Data, Note 17 Accounts payable and accrued liabilities). The accruals for environmental remediation represent CP’s best estimate of its probable future obligations and include both asserted and unasserted claims, without reduction for anticipated recoveries from third parties. Although the recorded accruals include CP’s best estimate of all probable costs, CP’s total environmental remediation costs cannot be predicted with certainty. Accruals for environmental remediation may change from time to time as new information about previously untested sites becomes known, environmental laws and regulations evolve and advances are made in environmental remediation technology. The accruals may also vary as the courts decide legal proceedings against outside parties responsible for contamination. These potential charges, which cannot be quantified at this time, are not expected to be material to the Company’s financial position, but may materially affect income in the period in which a charge is recognized.
The environmental liabilities are also sensitive to the increase in cost of materials which would be reflected as increases to "Other long-term liabilities" and "Accounts payable and accrued liabilities" on the Company’s Consolidated Balance Sheets and to "Purchased services and other" within Operating expenses on the Company's Consolidated Statements of Income. CP's cash payments for environmental initiatives are estimated to be approximately $7 million in 2020, $8 million in 2021, $9 million in 2022 and a total of approximately $55 million over the remaining years through 2029. All payments will be funded from general operations.
Pensions and Other Benefits
CP has defined benefit and defined contribution pension plans. Other benefits include post-retirement medical and life insurance for pensioners, and some post-employment workers’ compensation and long-term disability benefits in Canada. Workers’ compensation and long-term disability benefits are discussed in the Personal Injury and Other Claims Liabilities section below. Pension and post-retirement benefits liabilities are subject to various external influences and uncertainties.
Information concerning the measurement of costs for pensions and other benefits is discussed in Item 8. Financial Statements and Supplementary Data, Note 1 Summary of significant accounting policies.
Net Periodic Benefit Costs
The Company reports the current service cost component of net periodic benefit cost in "Compensation and benefits" for pensions and post-retirement benefits and in "Purchased services and other" for self-insured workers' compensation and long-term disability benefits on the Company's Consolidated Statements of Income. The Other components of net periodic benefit recovery are reported as a separate line item outside of Operating income on the Company's Consolidated Statements of Income. Components of the net periodic benefit costs (credits) are as follows:
| | | | | | | | | | | | | | | | | | | | | | 2019 | 2018 | | (in millions of Canadian dollars) | Current service cost |
| Other components |
| Total |
| Current service cost |
| Other components |
| Total |
| | Defined benefit pensions | $ | 107 |
| $ | (414 | ) | $ | (307 | ) | $ | 120 |
| $ | (405 | ) | $ | (285 | ) | | Defined contribution pensions | 11 |
| — |
| 11 |
| 10 |
| — |
| 10 |
| | Post-retirement benefits | 4 |
| 16 |
| 20 |
| 5 |
| 18 |
| 23 |
| | Self-insured workers' compensation and long-term disability benefits | 7 |
| 17 |
| 24 |
| 7 |
| 3 |
| 10 |
| | All plans | $ | 129 |
| $ | (381 | ) | $ | (252 | ) | $ | 142 |
| $ | (384 | ) | $ | (242 | ) |
CP estimates net periodic benefit credits for defined benefit pensions to be approximately $224 million in 2020 ($140 million in current service cost and $364 million in other components of net periodic recovery), and net periodic benefit costs for defined contribution pensions to be approximately $12 million in 2020. Net periodic benefit costs for post-retirement benefits in 2020 are not expected to differ materially from the 2019 costs. Total net periodic benefit credits for all plans are estimated to be approximately $178 million in 2020 (2019 – $252 million), comprising $165 million (2019 – $129 million) in current service cost and $343 million (2019 – $381 million) in other components of net periodic recovery. The expected rate of return on the market-related asset value used to compute the net periodic benefit credit was 7.75% in 2018 and 7.50% in 2019. For computing the net periodic benefit credit in 2020, the Company is reducing this rate to 7.25% to reflect CP's current view of future long-term investment returns. Net periodic benefit costs and credits are discussed further in Item 8. Financial Statements and Supplementary Data, Note 23 Pensions and other benefits.
Pension Plan Contributions
The Company made contributions of $53 million to the defined benefit pension plans in 2019, compared with $36 million, which is net of a $10 million refund of plan surplus in 2018. The Company’s main Canadianqualified defined benefit pension plan accounts for nearly all of CP’s pension obligation and can produce significant volatility in pension funding requirements, given the pension fund’s size, the many factors that drive the pension plan’s funded status and Canadian statutory pension funding requirements. The Company made voluntary prepayments of $600 million in 2011, $650 million in 2010 and $500 million in 2009 to the Company’s main Canadian which provides automatic employer contributions (closed plan);
anon-qualified defined benefit pension plan. CP has applied $1,324 million of theseplan (closed plan) for certain employees whose compensation exceeds theU.S. Internal Revenue Code limits (US$225,000 for 2019); a voluntary prepayments to reduce its pension funding requirements in 2012–2019, leaving $426 million of the voluntary prepayments still available at December 31, 2019 to reduce CP’s pension funding requirements in 2020 and future years. CP continues to have significant flexibilityqualified 401(k) plan with respect to the rate at which the remaining voluntary prepayments are applied to reduce future years’ pension contribution requirements, which allows CP to manage the volatility of future pension funding requirements. At this time, CP estimates it will not apply any of the remaining voluntary prepayments against its 2020 pension funding requirements.employer match;
CP estimates its aggregate pension contributions, including its defined benefit and
a qualified defined contribution plans, to be inplan which provides automatic employer contributions; and anon-qualified defined contribution plan for certain employees whose compensation exceeds the range of $65 million to $75 million in 2020, and in the range of $50 million to $100 million per year from 2021 to 2023. These estimates reflect the Company’s current intentions with respect to the rate at which U.S. Internal Revenue Code limit (US$280,000 for 2019). CP will apply the remaining voluntary prepayments against contribution requirements in the next few years.
Future pension contributions will be highly dependent on the Company’s actual experience with such variables as investment returns, interest rate fluctuations and demographic changes, on the rate at which previous years’ voluntary prepayments are applied against pension contribution requirements, and on any changes in the regulatory environment. CP will continue to make contributions to the pension plans that, at a minimum, meet pension legislative requirements.
Pension Plan Risksfor U.S. Management Employees (closed plan) Fluctuations in the liability and net periodic benefit costs for pensions result from favourable or unfavourable investment returns and changes in long-term interest rates. The impact of favourable or unfavourable investment returns is moderated by the use ofCP sponsors a market-related asset value for the main Canadian defined benefit pension plan’s public equity securitiesplan comprised of a Basic Defined Benefit Pension Plan (Basic DB Plan) and absolute return strategies. The impact of changesa Supplemental Pension (Supplemental Pension Plan) for earnings in long-term interest rates on pension obligations is partially offset by their impact on the pension funds’ investments in fixed income assets.
The plans’ investment policy provides a target allocation of approximately 45%excess of the plans’ assetsInternal Revenue Service (IRS) compensation limits in the Basic DB Plan, which provides retirement benefits in excess of the benefits payable from the Basic DB Plan. The benefit is based on age, service and a percentage of final average compensation.
The pension formula uses the final average monthly earnings and calculates a benefit of 0.5% up to be investedthe Tier 1 Railroad Retirement Board limit and 1.25% in public equity securities. Asexcess of that limit, and multiplies that by the years of service to a result, stock market performancemaximum of 30 years. An unreduced pension is a key driveravailable for all employees under the Basic DB Plan and the Supplemental Pension Plan as early as age 62 with 30 years of service with the normal retirement benefit payable at age 65. Mr. Brooks participated in determining the pension funds’ asset performance. IfBasic DB Plan and Supplemental Pension Plan in 2019. | | | | | | | | | | | | | | | | | | | | | | | | | | | | | | | | | | | | | Years of credited service | | | Annual benefits payable | | | Opening present
value of defined
benefit obligation | | | Compensatory
change
($) | | | Non-compensatory change ($) | | | Closing present
value of defined
benefit
obligation
($) | | | Name | | At
December 31, 2019 | | | At age 65 | | | At year end
($) | | | At age 65
($) | | | | | 11.17 | | | | 27.25 | | | | 109,679 | | | | 267,571 | | | | 571,271 | | | | 254,186 | | | | 258,866 | | | | 1,084,323 | |
The values in the table have been converted to Canadian dollars using the 2019 average exchange rate of investment return on the plans’ public equity securities in 2019 had been 10% higher (or lower) than the actual 2019 rate of investment return on such securities, 2020 net periodic benefit costs for pensions would be lower (or higher) by approximately $25 million.$1.3269.
Changes in bond yields can result in changes to discount rates and to changes in the value of fixed income assets. If the discount rate as at December 31, 2019 had been higher (or lower) by 0.1% with no related changes in the value of the pension funds’ investment in fixed income assets, 2020 net periodic benefit costs for pensions would be lower (or higher) by approximately $13 million and 2020 current service costs for pensions would be lower (or higher) by approximately $5 million. However, a change in bond yields would also lead to a change in the value of the pension funds’ investment in fixed income assets, and this change would partially offset the impact on net periodic benefit costs noted above.
The Company estimates that an increase in the discount rate of 0.1% would decrease the defined benefit pension plans’ projected benefit obligations by approximately $176 million, and that a decrease in the discount rate of 0.1% would increase the defined benefit pension plans’ projected benefit obligations by approximately $178 million. Similarly, for every 0.1% the actual return on assets varies above (or below) the estimated return for the year, theclosing present value of the defined benefit pension plans’ assets would increase (or decrease)obligation is based on Mr. Brooks’ $109,679 accrued benefit assumed to be paid at age 65. The present value was determined using a discount rate of 3.15% and mortality adjusted actuarial assumptions.
Individuals can makepre-tax orpost-tax (Roth) contributions to the 401(k) plan subject to limitations imposed by approximately $13 million.
Adverse experience with respect to these factors could eventually increase funding and pension expense significantly, while favourable experience with respect to these factors could eventually decrease funding and pension expense significantly.
Fluctuationsthe IRS in the post-retirement benefit obligation also can result from changes inU.S. The company provides a matching contribution of 50% on the discount rate used. A 0.1% increase (decrease) in the discount rate would decrease (increase) the obligation by approximately $6 million.first 6% of eligible earnings. All contributions vest immediately.
CP reviews its pensioner mortality experience to ensure that the mortality assumption continues to be appropriate, or to determine what changes to the assumption are needed.
CP 2019 ANNUAL REPORT/ 66
Property, PlantThe U.S. Salaried Retirement Income Plan is employer-funded with an annual contribution amount equal to 3.5% of eligible earnings, which include base salary and Equipment
The Company follows the group depreciation method under which a single depreciation rate is applied to the total cost in a particular class of property, despite differences in the service life or salvage value of individual properties within the same class. CP performs depreciation studies of each property asset class approximately every three years to update depreciation rates. The studies are conducted with assistance from third-party specialists and analyzed and reviewed by the Company's management. Depreciation studies for U.S. assets are reviewed and approved by the Surface Transportation Board ("STB"). Depreciation studies for Canadian assets are provided to the Canadian Transportation Agency (the "Agency"), but the Agency does not approve depreciation rates. In determining appropriate depreciation rates, management is required to make judgments and assumptions about a variety of key factors thatannual bonus. These earnings are subject to future variability duecompensation limitations imposed by the IRS in the U.S. These amounts are included in the summary compensation table underAll other compensation .Supplemental defined contribution plan (U.S. DC SERP) The U.S. DC SERP is an unfunded,non-qualified defined contribution plan that provides an additional company contribution equal to inherent uncertainties. These6% of eligible earnings without regard to the limitations imposed by the IRS. In the U.S., eligible earnings include the following: | | | Key Assumptions | Assessments | •
Whole and remaining asset lives
| •
Statistical analysis of historical retirement patterns;•
Evaluation of management strategy and its impact on operations and the future use of specific property assets;•
Assessment of technological advances;•
Engineering estimates of changes in current operations and analysis of historic, current and projected future usage;•
Additional factors considered for track assets: density of traffic and whether rail is new or has been re-laid in a subsequent position;•
Assessment of policies and practices for the management of assets including maintenance; and•
Comparison with industry data. | | •
Analysis of historical, current and estimated future salvage values. |
CP depreciates the cost of properties, net of salvage, on a straight-line basis over the estimated useful lifebase salary and annual bonus. In addition, for earnings in excess of the classlimitations imposed by the U.S. Internal Revenue Code, an additional 3.5% contribution is made. Company contributions cliff vest at the end of property. three years.
Mr. Creel, Mr. Pitz, Mr. Redd and Mr. Johnson participated in the U.S. DC SERP in 2019. The estimates of economic lives are uncertaintable below shows the U.S. Salaried Retirement Income Plan and can vary due to changesU.S. DC SERP account information in any of the assessed factors noted2019. | | | | | | | | | | | | | | | | | Accumulated value at start of year ($) | | | | | | Accumulated value at year end ($) | | | | | 841,702 | | | | 22,690 | | | | 1,045,509 | | | | | 267,437 | | | | 104,830 | | | | 406,946 | | | | | 126,699 | | | | 96,231 | | | | 246,286 | | | | | 401,049 | | | | 121,175 | | | | 518,583 | |
The values in the table abovehave been converted to Canadian dollars using the 2019 average exchange rate of $1.3269. About deferred compensation Executive officers and members of senior management who have not met their share ownership requirement can choose to defer all or a portion of their short-term incentive by receiving it as DSUs in the year the bonus is actually paid, which they could receive a 25% match on. The deferred amount, including the match, cannot exceed the amount needed to meet the requirement. The amount is converted to bonus DSUs using the average market price of a CP common share for whole and remaining asset lives. Additionally, the depreciation rates are updated to reflect the change in residual values10 trading days immediately before December 31 of the assetsapplicable performance year. The matching units vest after three years. The Board approved amendments of the Senior Executives Deferred Share Unit Plan (DSU Plan) in the class.
It is anticipated that there willMay 2019 to further assist senior executives in meeting their ownership requirements by allowing future PSUs to be changes in the estimates of weighted-average useful lives and net salvage for each property asset class as assetsconverted into DSUs, which are acquired, used and retired. Substantial changes in either the useful lives of properties or the salvage assumptions could result in significant changes to depreciation expense. For example, if the estimated average life of track assets, including rail, ties, ballast and other track material, increased (or decreased) by one year, annual depreciation expense would decrease (or increase) by approximately $17 million.
Duesubject to the capital intensive naturesame performance conditions as the corresponding PSU grant. The Performance Share Unit Plan (PSU Plan) was also amended similarly. The PSU Plan permits the eligible executives to elect in respect of their future conditional rights to PSUs prior to the start of the railway industry, depreciation represents a significant partperformance period in order to maximize their opportunity to reach ownership levels.
To defer any compensation, elections must be made by June 30th of operating expenses. the calendar year prior to the new fiscal year. The estimated useful livestable below shows the number of properties have a direct impactDSUs outstanding and their value based on our closing share price on December 31, 2019. | | | | | | | | | | | | | | | | | | | | | | | | | | | | | | | | | | | 0 | | | | 31,849 | | | | 31,849 | | | | 10,546,129 | | | | | 394 | | | | 2,595 | | | | 2,989 | | | | 989,449 | | | | | 166 | | | | 1,671 | | | | 1,837 | | | | 608,284 | | | | | 0 | | | | 4,434 | | | | 4,434 | | | | 1,468,226 | | | | | 140 | | | | 999 | | | | 1,139 | | | | 377,156 | | | | | 0 | | | | 6,322 | | | | 6,322 | | | | 2,093,398 | |
We valued the outstanding DSUs using $331.03, our closing share price on the amount of depreciation recorded as a component of "Properties"TSX on the Company’s Consolidated Balance Sheets. At December 31, 2019 for Mr. Velani, and 2018, accumulated depreciation was $8,099 million and $7,964 million, respectively.
Deferred Income Taxes
CP accounts for deferred income taxes basedUS$254.95, our closing share price on the liability method. This method focuses onNYSE and converted to Canadian dollars using ayear-end exchange rate of $1.2988 for Mr. Creel, Mr. Brooks, Mr. Pitz, Mr. Redd and Mr. Johnson.DSUs are redeemed for cash six months after the Company’s balance sheet andexecutive retires or leaves the temporary differences otherwise calculated fromcompany, or up until the comparison of book versus tax values. The provision for deferred income taxes arises from temporary differences in the carrying values of assets and liabilities for financial statement and income tax purposes and the effect of loss carry forwards. It is assumed that such temporary differences will be settled in the deferred income tax assets and liabilities at the balance sheet date.
In determining deferred income taxes, the Company makes estimates and assumptions regarding deferred tax matters, including estimating the timing of the realization and settlement of deferred income tax assets (including the benefit of tax losses) and liabilities, and estimating unrecognized tax benefits for uncertain tax positions. Deferred income taxes are calculated using enacted federal, provincial, and state future income tax rates, which may differ in future periods.
Deferred income tax expense is included in "Income tax expense" on the Company's Consolidated Statements of Income. Additional disclosures are provided in Item 8. Financial Statements and Supplementary Data, Note 6 Income taxes.
Personal Injury and Other Claims Liabilities
CP estimates the potential liability arising from incidents, claims and pending litigations relating to personal injury claims by employees, third-party claims, certain occupation-related claims and property damage claims.
Personal Injury
In Canada, employee occupational injuries are governed by provincial workers' compensation legislation. Occupational injury claims in the provinces of Québec, Ontario, Manitoba and B.C. are self-insured and administered through each Worker's Compensation Board ("WCB"). The future costs related to occupation-related injuries are actuarially determined based on past experience and assumptions associated with the injury, compensation, income replacement, health care and administrative costs. In the four provinces where the Company is self-insured, a discount rate is applied to the future estimated costs based on market
rates for investment grade corporate bonds to determine the liability. An actuarial study is performed on an annual basis. In the provinces of Saskatchewan and Alberta, the Company is assessed an annual WCB contribution on a premium basis and this amount is not subject to estimation by management. At December 31, 2019 and 2018, respectively, the WCB liability was $85 million and $81 million in "Pension and other benefit liabilities"; $11 million and $12 million in "Accounts payable and accrued liabilities", offset by deposits paid to WCB of $1 million and $1 million in "Other assets" on the Company's Consolidated Balance Sheets.
U.S. railway employees are covered by federal law under the Federal Employers' Liability Act ("FELA") rather than workers' compensation programs. Accruals are set for individual cases based on facts, legal opinion and statistical analysis. U.S. accruals are also set and include alleged occupational exposure or injury.
Other Claims
A provision for litigation matters, equipment damages or other claims will be accrued according to applicable accounting standards and any such accrual will be based on an ongoing assessment of the strengths and weaknesses of the litigation or claim and its likelihood of success, together with an evaluation of the damages or other monetary relief sought. CP accrues for probable claims when the facts of an incident become known and investigation results provide a reasonable basis for estimating the liability. The lower end of the range is accrued iffollowing calendar year for Canadian-resident executives. U.S.-resident executives who participate in the facts and circumstances permit only a range of reasonable estimates and no single amount in that range is a better estimate than any other. Facts and circumstances related to asserted claims can change, and a process is in place to monitor accruals for changes in accounting estimates.DSU Plan must redeem their DSUs after thesix-month
Forward-Looking Statements
This Management's Discussion and Analysis of Financial Condition and Results of Operations and Annual Report on Form 10-K contains certain forward-looking statements within the meaning of the United States Private Securities Litigation Reform Act of 1995 and other relevant securities legislation, including applicable securities laws in Canada. Forward-looking statements typically include words such as “financial expectations”, “key assumptions”, “anticipate”, “believe”, “expect”, “plan”, “will”, “outlook”, “should” or similar words suggesting future outcomes. To the extent that CP has provided guidance using Non-GAAP financial measures, the Company may not be able to provide a reconciliation to a GAAP measure without unreasonable efforts, due to unknown variables and uncertainty related to future results.
This Management's Discussion and Analysis of Financial Condition and Results of Operations and Annual Report on Form 10-K includes forward-looking statements relating, but not limited to statements concerning the Company’s defined benefit pension expectations for 2020 and through 2023, our expectations for 2020 financial and operational performance, including our full-year guidance for expected RTM and adjusted diluted EPS growth, planned capital expenditures (including how such capital expenditures are expectedwaiting period to be financed), expected impacts resulting from changes in compliance with U.S. tax regulations. We use the U.S.-to-Canadian dollar exchange rate,average market price of a share for the 10 trading days immediately before the payment date to calculate the amount, which the participant receives in a lump sum.
Termination and change in control Termination of employment We have policies to cover different kinds of termination of employment. Mr. Creel is covered under the terms of his employment agreement effective tax rate,January 31, 2017, as well as statements concerning the Company’s operations, anticipated financial performance, business prospects amended December 18, 2018, that includenon-competition, non-solicitation and strategies, including statements concerning the anticipation that cash flow from operationsconfidentiality restrictions. Mr. Velani, Mr. Brooks, Mr. Pitz and various sources of financing will be sufficient to meet debt repayments and obligations in the foreseeable future and concerning anticipated capital programs, and statements regarding future payments including income taxes and pension contributions. The purpose of the 2020 Adjusted diluted EPS growth projection is to assist readers in understanding our expected and targeted financial results, and this information may not be appropriate for other purposes.
The forward-looking statements contained in this Management’s Discussion and Analysis of Financial Condition and Results of Operations and Annual Report on Form 10-KMr. Redd are based on current expectations, estimates, projections and assumptions, having regardingsubject to the Company's experiencesame terms as all other employees for voluntary termination, retirement, termination for cause and its perception of historical trends, and includes, but is not limited to, expectations, estimates, projections and assumptions relating to: North American and global economic growth; commodity demand growth; sustainable industrial and agricultural production; commodity prices and interest rates; foreign exchange rates (as specified herein); effective tax rates (as specified herein); performance of our assets and equipment; sufficiency of our budgeted capital expenditures in carrying out our business plan; applicable laws, regulations and government policies; the availability and cost of labour, services and infrastructure; and the satisfaction by third parties of their obligations to the Company. Although the Company believes the expectations, estimates, projections and assumptions reflected in the forward-looking statements presented herein are reasonable as of the date hereof, there can be no assurance that they will prove to be correct. Current economic conditions render assumptions, although reasonable when made, subject to greater uncertainty.
Undue reliance should not be placed on forward-looking statements as actual results may differ materially from those expressed or implied by forward-looking statements. By their nature, forward-looking statements involve numerous inherent risks and uncertainties that could cause actual results to differ materially from the forward-looking statements, including but not limited to the following factors: changes in business strategies; general North American and global economic, credit and business conditions; risks associated with agricultural production such as weather conditions and insect populations; the availability and price of energy commodities; the effects of competition and pricing pressures; industry capacity; shifts in market demand; changes in commodity prices; uncertainty surrounding timing and volumes of commodities being shipped via CP; inflation; changes in laws, regulations and government policies, including regulation of rates; changes in taxes and tax rates; potential increases in maintenance and operating costs; changes in fuel prices; uncertainties of investigations, proceedings or other types of claims and litigation; labour disputes; risks and liabilities arising from derailments; transportation of dangerous goods; timing of completion of capital and maintenance projects; currency and interest rate fluctuations; effects of changes in market conditions and discount rates on the financial position of pension plans and investments; trade restrictions or other changes to international trade arrangements; climate change; and various events that could disrupt operations, including severe weather, such as droughts, floods, avalanches and earthquakes, and cybersecurity attacks, as well as security threats and governmental response to them, and technological changes. The foregoing list of factors is not exhaustive.
CP 2019 ANNUAL REPORT/ 68
There are more specific factors that could cause actual results to differ materially from those described in the forward-looking statements contained in this Management's Discussion and Analysis of Financial Condition and Results of Operations and Annual Report on Form 10-K. These more specific factors are identified and discussed in Item 1A. Risk Factors. Other risks are detailed from time to time in reports filed by CP with securities regulators in Canada and the United States.
The forward-looking statements contained in this Management’s Discussion and Analysis of Financial Condition and Results of Operations and Annual Report on Form 10-K are made as of the date hereof. Except as required by applicable law, CP undertakes no obligation to update publicly or otherwise revise any forward-looking statements, or the foregoing assumptions and risks affecting such forward-looking information, whether as a result of new information, future events or otherwise.
ITEM 7A. QUANTITATIVE AND QUALITATIVE DISCLOSURES ABOUT MARKET RISK
Foreign Exchange Risk
Although CP conducts business primarily in Canada, a significant portion of its revenues, expenses, assets and liabilities including debt are denominated in U.S. dollars. The value of the Canadian dollar is affected by a number of domestic and international factors, including, without limitation, economic performance, and Canadian, U.S. and international monetary policies. Consequently, the Company’s results are affected by fluctuations in the exchange rate between these currencies. On an annualized basis, a $0.01 weakening (or strengthening) of the Canadian dollar relative to the U.S. dollar positively (or negatively) impacts Total revenues by approximately $30 million (2018 – approximately $28 million), negatively (or positively) impacts Operating expenses by approximately $15 million (2018 – approximately $15 million), and negatively (or positively) impacts Net interest expense by approximately $3 million (2018 – approximately $3 million).
CP uses U.S. dollar-denominated debt to hedge its net investment in U.S. operations. As at December 31, 2019, the net investment in U.S. operations is less than the total U.S. dollar-denominated debt. Consequently, FX translation on the Company’s undesignated debt and lease liabilities causes additional impacts on earnings in Other (income) expense.
To manage its exposure to fluctuations in exchange rates between Canadian and U.S. dollars, CP may sell or purchase U.S. dollar forwards at fixed rates in future periods. In addition, changes in the exchange rate between the Canadian dollar and other currencies (including the U.S. dollar) make the goods transported by the Company more or less competitive in the world marketplace and may in turn positively or negatively affect revenues.
Share Price Impact on Stock-Based Compensation
Based on information available at December 31, 2019, and expectations for 2020 grants, for every $1.00 change in share price, stock-based compensation expense has a corresponding change of approximately $0.4 million to $0.6 million (2018 – approximately $0.4 million to $0.6 million). This excludes the impact of changescontrol. However, Mr. Velani, Mr. Brooks, Mr. Pitz and Mr. Redd signednon-competition, non-solicitation agreements in share price relative to the S&P/TSX 60 Index, Class I railways, S&P/TSX Capped Industrial Index,2018 and S&P 1500 Road and Rail index, which may trigger different performance share unit payouts. Stock-based compensation may2019 that also be impacted by non-market performance conditions.
Additional information concerning stock-based compensation is included in Item 8. Financial Statements and Supplementary Data, Note 24 Stock-based compensation.
Interest Rate Risk
Debt financing forms part of the Company's capital structure. The debt agreements entered into expose CP to increased interest costs on future fixed debt instruments and existing variable rate debt instruments, should market rates increase. In addition, the present value of the Company’s assets and liabilities will also vary with interest rate changes. To manage interest rate exposure, CP may enter into forward rate agreements such as treasury rate locks or bond forwards that lock in rates for a future date, thereby protecting against interest rate increases. CP may also enter into swap agreements whereby one party agrees to pay a fixed rate of interest while the other party pays a floating rate. Contingent on the direction of interest rates, the Company may incur higher costs depending on the contracted rate.
Information concerning market risks is supplemented in Item 8. Financial Statements and Supplementary Data, Note 19 Financial instruments.
had confidentiality restrictions.
CP 2019 ANNUAL REPORT/ 70
ITEM 8. FINANCIAL STATEMENTS AND SUPPLEMENTARY DATA
INDEX TO CONSOLIDATED FINANCIAL STATEMENTS
| | | | Page | | | | Report of Independent Registered Public Accounting Firm | | | | | Consolidated Statements of Income | | For the Year Ended December 31, 2019, 2018, and 2017 | | | | Consolidated Statements of Comprehensive Income | | For the Year Ended December 31, 2019, 2018, and 2017 | | | | Consolidated Balance Sheets | | As at December 31, 2019 and 2018 | | | | Consolidated Statements of Cash Flows | | For the Year Ended December 31, 2019, 2018, and 2017 | | | | Consolidated Statements of Changes in Shareholders' Equity | | For the Year Ended December 31, 2019, 2018, and 2017 | | | | Notes to Consolidated Financial Statements | |
Report of Independent Registered Public Accounting Firm
To the Shareholders and the Board of Directors of Canadian Pacific Railway Limited
Opinion on the Financial Statements
We have audited the accompanying consolidated balance sheets of Canadian Pacific Railway Limited and subsidiaries (the "Company") as of December 31, 2019 and 2018, the related consolidated statements of income, comprehensive income, cash flows, and changes in shareholders’ equity, for each of the three years in the period ended December 31, 2019, and the related notes and the financial statement schedule listed in the Index at Item 15 (collectively referred to as the "financial statements"). In our opinion, the financial statements present fairly, in all material respects, the financial position of the Company as of December 31, 2019 and 2018, and the results of its operations and its cash flows for each of the three years in the period ended December 31, 2019, in conformity with accounting principles generally accepted in the United States of America ("US GAAP").
We have also audited, in accordance with the standards of the Public Company Accounting Oversight Board (United States) (PCAOB), the Company's internal control over financial reporting as of December 31, 2019, based on criteria established in Internal Control – Integrated Framework (2013) issued by the Committee of Sponsoring Organizations of the Treadway Commission and our report dated February 20, 2020, expressed an unqualified opinion on the Company's internal control over financial reporting.
Change in Accounting Principle
As discussed in Note 2 to the consolidated financial statements, the Company has changed its method of accounting for leases as of January 1, 2019, due to the adoption of Accounting Standards Update 2016-02, Leases (Topic 842) and related amendments.
Basis for Opinion
These financial statements are the responsibility of the Company's management. Our responsibility is to express an opinion on the Company's financial statements based on our audits. We are a public accounting firm registered with the PCAOB and are required to be independent with respect to the Company in accordance with the U.S. federal securities laws and the applicable rules and regulations of the Securities and Exchange Commission and the PCAOB.
We conducted our audits in accordance with the standards of the PCAOB. Those standards require that we plan and perform the audit to obtain reasonable assurance about whether the financial statements are free of material misstatement, whether due to error or fraud. Our audits included performing procedures to assess the risks of material misstatement of the financial statements, whether due to error or fraud, and performing procedures that respond to those risks. Such procedures included examining, on a test basis, evidence regarding the amounts and disclosures in the financial statements. Our audits also included evaluating the accounting principles used and significant estimates made by management, as well as evaluating the overall presentation of the financial statements. We believe that our audits provide a reasonable basis for our opinion.
Critical Audit Matters
The critical audit matters communicated below are matters arising from the current period audit of the financial statements that were communicated or required to be communicated to the audit committee and that: (1) relate to accounts or disclosures that are material to the financial statements and (2) involved our especially challenging, subjective, or complex judgments. The communication of critical audit matters does not alter in any way our opinion on the financial statements, taken as a whole, and we are not, by communicating the critical audit matters below, providing separate opinions on the critical audit matters or on the accounts or disclosures to which they relate.
Properties – Direct Costs that are Capitalized to Self-constructed Assets – Refer to Notes 1 and 14 to the Financial Statements
Critical Audit Matter Description
The Company recognizes direct costs as capitalized additions to self-constructed assets, within properties, based on expenditures necessary to make an asset ready for its intended use. The capitalization of self-constructed assets requires management to make significant estimates and assumptions related to the capitalization of direct cost additions to self-constructed assets based on whether the expenditures meet capitalization criteria under US GAAP.
We identified the capitalization of direct cost additions to self-constructed assets as a critical audit matter because the judgments and assumptions management makes could have a significant impact on the capitalization of direct cost additions. As such auditing the capitalization of direct cost additions involves a high degree of auditor judgment.
How the Critical Audit Matter was Addressed in the Audit
Our audit procedures related to the capitalization of direct cost additions to self-constructed assets included the following, among others:
Evaluated the effectiveness of controls over self-constructed assets, including those over the capitalization of direct cost additions to self-constructed assets.
CP 2019 ANNUAL REPORT/ 72
Selected a sample of direct costs, and obtained evidence to support the capitalized additions to self-constructed assets and assessed whether these expenditures met the capitalization criteria under US GAAP.
Defined Benefit Pension – Refer to Notes 1 and 23 to the Financial Statements
Critical Audit Matter Description
The Company’s accounting of its defined benefit pension plans involves the measurement of the projected benefit obligation and fair value of fund assets. The measurement of the projected-benefit obligation requires management to make significant estimates and assumptions in the determination of the discount rate, which is based on blended market interest rates of high-quality corporate debt instruments with matching cash flows. The measurement of the fair value of fund assets requires management to make significant estimates and assumptions in the determination of the expected return on fund assets, which is calculated using the market-related value of assets.
We identified the determination of the discount rate (for the projected benefit obligation), and the determination of the expected return on fund assets (for the determination of the net period benefit cost) as the critical audit matters because of the significant estimates and assumptions management makes could have a significant impact on the projected benefit obligation and the fair value of fund assets. As such auditing the determination of the discount rate and the expected return on fund assets involves a high degree of auditor judgment as the estimates and assumptions made by management contains significant measurement uncertainty and resulted in an increased extent of effort, which included the need to involve an actuarial specialist.
How the Critical Audit Matter was Addressed in the Audit
Our audit procedures related to the determination of the discount rate (for the projected benefit obligation), and the expected return on fund assets (for the determination of the fair value of fund assets) included the following, among others:
Evaluated the effectiveness of controls over defined benefit pension plans, including those over the determination of the discount rate and the expected return on fund assets.
With the assistance of an actuarial specialist, we evaluated the reasonableness of the discount rate by:
| | – | Assessing the methodology used in management’s determination of the discount rate, |
| | – | Testing the underlying source information, and |
| | – | Developing a range of independent estimates and comparing those to the discount rate selected by management. |
With the assistance of an actuarial specialist, we evaluated the reasonableness of the expected return on fund assets by:
| | – | Assessing the methodology used in management’s determination of the expected return on fund assets, |
| | – | Testing the underlying source information, and |
| | – | Comparing management’s assumptions to historical data and available market trends. |
Evaluated management’s ability to accurately forecast the discount rate and expected return on fund assets by comparing actual results to management’s historical forecasts.
/s/ Deloitte LLP
Chartered Professional Accountants
Calgary, Canada
February 20, 2020
We have served as the Company's auditor since 2011.
CONSOLIDATED STATEMENTS OF INCOME
| | | | | | | | | | | | Year ended December 31 (in millions of Canadian dollars, except per share data) | 2019 |
| 2018 |
| 2017 |
| | Revenues (Note 3) | | | | | Freight | $ | 7,613 |
| $ | 7,152 |
| $ | 6,375 |
| | Non-freight | 179 |
| 164 |
| 179 |
| | Total revenues | 7,792 |
| 7,316 |
| 6,554 |
| | Operating expenses | | | | | Compensation and benefits (Note 23, 24) | 1,540 |
| 1,468 |
| 1,309 |
| | Fuel | 882 |
| 918 |
| 677 |
| | Materials | 210 |
| 201 |
| 190 |
| | Equipment rents | 137 |
| 130 |
| 142 |
| | Depreciation and amortization | 706 |
| 696 |
| 661 |
| | Purchased services and other (Note 12) | 1,193 |
| 1,072 |
| 1,056 |
| | Total operating expenses | 4,668 |
| 4,485 |
| 4,035 |
| | Operating income | 3,124 |
| 2,831 |
| 2,519 |
| | Less: | | | | | Other (income) expense (Note 4) | (89 | ) | 174 |
| (178 | ) | | Other components of net periodic benefit recovery (Note 23) | (381 | ) | (384 | ) | (274 | ) | | Net interest expense (Note 5) | 448 |
| 453 |
| 473 |
| | Income before income tax expense | 3,146 |
| 2,588 |
| 2,498 |
| | Income tax expense (Note 6) | 706 |
| 637 |
| 93 |
| | Net income | $ | 2,440 |
| $ | 1,951 |
| $ | 2,405 |
| | Earnings per share (Note 7) | | |
| | Basic earnings per share | $ | 17.58 |
| $ | 13.65 |
| $ | 16.49 |
| | Diluted earnings per share | $ | 17.52 |
| $ | 13.61 |
| $ | 16.44 |
| | Weighted-average number of shares (millions) (Note 7) | | |
| | Basic | 138.8 |
| 142.9 |
| 145.9 |
| | Diluted | 139.3 |
| 143.3 |
| 146.3 |
|
See Notes to Consolidated Financial Statements.
CP 2019 ANNUAL REPORT/ 74
CONSOLIDATED STATEMENTS OF COMPREHENSIVE INCOME
| | | | | | | | | | | | Year ended December 31 (in millions of Canadian dollars) | 2019 |
| 2018 |
| 2017 |
| | Net income | $ | 2,440 |
| $ | 1,951 |
| $ | 2,405 |
| | Net gain (loss) in foreign currency translation adjustments, net of hedging activities | 37 |
| (60 | ) | 24 |
| | Change in derivatives designated as cash flow hedges | 10 |
| 38 |
| 19 |
| | Change in pension and post-retirement defined benefit plans | (661 | ) | (449 | ) | 80 |
| | Other comprehensive (loss) income before income taxes | (614 | ) | (471 | ) | 123 |
| | Income tax recovery (expense) on above items | 135 |
| 169 |
| (65 | ) | | Other comprehensive (loss) income (Note 8) | (479 | ) | (302 | ) | 58 |
| | Comprehensive income | $ | 1,961 |
| $ | 1,649 |
| $ | 2,463 |
|
See Notes to Consolidated Financial Statements.
CONSOLIDATED BALANCE SHEETS
| | | | | | | | | As at December 31 (in millions of Canadian dollars, except Common Shares) | 2019 |
| 2018 |
| | Assets | | | | Current assets | | | | Cash and cash equivalents | $ | 133 |
| $ | 61 |
| | Accounts receivable, net (Note 10) | 805 |
| 815 |
| | Materials and supplies | 182 |
| 173 |
| | Other current assets | 90 |
| 68 |
| | | 1,210 |
| 1,117 |
| | Investments (Note 13) | 341 |
| 203 |
| | Properties (Note 14, 21) | 19,156 |
| 18,418 |
| | Goodwill and intangible assets (Note 11, 15) | 206 |
| 202 |
| | Pension asset (Note 23) | 1,003 |
| 1,243 |
| | Other assets (Note 16, 21) | 451 |
| 71 |
| | Total assets | $ | 22,367 |
| $ | 21,254 |
| | Liabilities and shareholders’ equity | | | | Current liabilities | | | | Accounts payable and accrued liabilities (Note 17, 21) | $ | 1,693 |
| $ | 1,449 |
| | Long-term debt maturing within one year (Note 18, 19, 21) | 599 |
| 506 |
| | | 2,292 |
| 1,955 |
| | Pension and other benefit liabilities (Note 23) | 785 |
| 718 |
| | Other long-term liabilities (Note 20, 21) | 562 |
| 237 |
| | Long-term debt (Note 18, 19, 21) | 8,158 |
| 8,190 |
| | Deferred income taxes (Note 6) | 3,501 |
| 3,518 |
| | Total liabilities | 15,298 |
| 14,618 |
| | Shareholders’ equity | | | Share capital (Note 22)
Authorized unlimited Common Shares without par value. Issued and outstanding are 137.0 million and 140.5 million as at December 31, 2019 and 2018, respectively. | 1,993 |
| 2,002 |
| | Authorized unlimited number of first and second preferred shares; none outstanding. | | | | Additional paid-in capital | 48 |
| 42 |
| | Accumulated other comprehensive loss (Note 8) | (2,522 | ) | (2,043 | ) | | Retained earnings | 7,550 |
| 6,635 |
| | | 7,069 |
| 6,636 |
| | Total liabilities and shareholders’ equity | $ | 22,367 |
| $ | 21,254 |
|
Commitments and contingencies (Note 26).
See Notes to Consolidated Financial Statements.
| | | | | | | | | | Approved on behalf of the Board: | | | | | | | | | | | | /s/ ISABELLE COURVILLE | | | | | | Termination without cause | | | | Severance | | None | | None | | None | | Mr. Creel: 24 months of base salary Other NEOs: per legislative requirements | | None | | Short-term incentive | | Forfeited | | Award for current year is pro-rated to retirement date | | Forfeited | | Equal to the target award for severance period for Mr. Creel Other NEOs: award for current year ispro-rated to termination date as per plan | | None | | DSUs | | Unvested DSUs are forfeited | | Unvested DSUs are forfeited | | Unvested DSUs are forfeited | | Unvested DSUs are forfeited | | Unvested units vest early if the holder is terminated following change in control | | Performance share units | | Forfeited | | Award continues to vest based on performance factors and executive is entitled to receive the full value as long as they have worked for six months of the performance period, otherwise the award is forfeited | | Forfeited | | Pro-rated based on active service within the performance period | | Only vest if the executive is terminated following a change in control PSUs vest at target,pro-rated based on active service within the performance period | | Stock options | | Vested options are exercisable for 30 days or until the expiry date, whichever comes first Unvested options are forfeited Performance stock options are forfeited | | Award expires five years after the retirement date or the normal expiry date, whichever is earlier Performance stock options are forfeited | | Forfeited | | Vested options are exercisable for six months following termination as well as any options that vest during thesix-month period Performance stock options are forfeited | | Options only vest early if the option holder is terminated following the change in control Performance stock options are forfeited | | | | | | | | | | | | | ESPP shares | | Unvested shares are forfeited | | Unvested shares vest | | Unvested shares are forfeited | | Unvested shares vest | | Unvested shares vest | | Benefits | | End on resignation | | Post-retirement life insurance of $50,000 and a health spending account based on years of service (same for all employees) | | End on resignation | | None | | None | | Perquisites | | Any unused flex perquisite dollars are forfeited | | Any unused flex perquisite dollars are forfeited | | Any unused flex perquisite dollars are forfeited | | Any unused flex perquisite dollars are forfeited | | Any unused flex perquisite dollars are forfeited |
The next table shows the estimated incremental amounts that would be paid to Mr. Creel if his employment had been terminated without cause on December 31, 2019. There is no extra taxgross-up provision for any termination benefit. | | | | | | | | | | | | | | | | | | | | | | | | | | | | | | | | | | | | Severance payment | | | | | | | | | | | | | | | | Severance period
(# of months) | | | | | | | | | Additional
retirement
benefits
($) | | | | | | Value of vesting
of options and
equity-based
awards
($) | | | Payable on
termination
without
cause
($) | | | | | 24 | | | | 3,009,969 | | | | 3,762,461 | | | | - | | | | 41,912 | | | | 12,642,454 | | | | 19,456,796 | |
Other benefits include the value of accelerated vesting of shares purchased under the ESPPValue of vesting of options and equity-based awards is the value of stock options vesting within six months following termination in accordance with our stock option plan, and the prorated value as of the termination date of PSU awards. It is based on $331.03, our closing share price on the TSX on December 31, 2019 and US$254.95, the closing price of our shares on the NYSE, converted into Canadian dollars using ayear-end exchange rate of $1.2988.
| | | /s/ JANE L. PEVERETT | | | Isabelle Courville, Director, | | | Jane L. Peverett, Director, | | | Chair of the Board | | | ChairOur director compensation program shares the same objective as our executive compensation program: to attract and retain qualified directors and to align the interests of the Auditdirectors and Finance Committee |
shareholders.
CP 2019 ANNUAL REPORT/ 76
CONSOLIDATED STATEMENTS OF CASH FLOWS
| | | | | | | | | | | | Year ended December 31 (in millions of Canadian dollars) | 2019 |
| 2018 |
| 2017 |
| | Operating activities | | | | | Net income | $ | 2,440 |
| $ | 1,951 |
| $ | 2,405 |
| | Reconciliation of net income to cash provided by operating activities: | | | | | Depreciation and amortization | 706 |
| 696 |
| 661 |
| | Deferred income taxes (Note 6) | 181 |
| 256 |
| (210 | ) | | Pension recovery and funding (Note 23) | (360 | ) | (321 | ) | (237 | ) | | Foreign exchange (gain) loss on debt and lease liabilities (Note 4) | (94 | ) | 168 |
| (186 | ) | | Settlement of forward starting swaps on debt issuance (Note 18, 19) | — |
| (24 | ) | — |
| | Other operating activities, net | 143 |
| (79 | ) | (113 | ) | | Change in non-cash working capital balances related to operations (Note 9) | (26 | ) | 65 |
| (138 | ) | | Cash provided by operating activities | 2,990 |
| 2,712 |
| 2,182 |
| | Investing activities | | | | | Additions to properties | (1,647 | ) | (1,551 | ) | (1,340 | ) | | Investment in Central Maine & Québec Railway (Note 11) | (174 | ) | — |
| — |
| | Proceeds from sale of properties and other assets (Note 12) | 26 |
| 78 |
| 42 |
| | Other | (8 | ) | 15 |
| 3 |
| | Cash used in investing activities | (1,803 | ) | (1,458 | ) | (1,295 | ) | | Financing activities | | | | | Dividends paid | (412 | ) | (348 | ) | (310 | ) | | Issuance of CP Common Shares (Note 22) | 26 |
| 24 |
| 45 |
| | Purchase of CP Common shares (Note 22) | (1,134 | ) | (1,103 | ) | (381 | ) | | Issuance of long-term debt, excluding commercial paper (Note 18) | 397 |
| 638 |
| — |
| | Repayment of long-term debt, excluding commercial paper (Note 18) | (500 | ) | (753 | ) | (32 | ) | | Net issuance of commercial paper (Note 18) | 524 |
| — |
| — |
| | Settlement of forward starting swaps on de-designation (Note 19) | — |
| — |
| (22 | ) | | Other | (12 | ) | — |
| — |
| | Cash used in financing activities | (1,111 | ) | (1,542 | ) | (700 | ) | | Effect of foreign currency fluctuations on U.S. dollar-denominated cash and cash equivalents | (4 | ) | 11 |
| (13 | ) | | Cash position | | | | | Increase (decrease) in cash and cash equivalents | 72 |
| (277 | ) | 174 |
| | Cash and cash equivalents at beginning of year | 61 |
| 338 |
| 164 |
| | Cash and cash equivalents at end of year | $ | 133 |
| $ | 61 |
| $ | 338 |
| | | | | | | Supplemental disclosures of cash flow information: | | | | | Income taxes paid | $ | 506 |
| $ | 318 |
| $ | 425 |
| | Interest paid | $ | 444 |
| $ | 463 |
| $ | 475 |
|
See Notes to Consolidated Financial Statements.
CONSOLIDATED STATEMENTS OF CHANGES IN SHAREHOLDERS’ EQUITY
| | | | | | | | | | | | | | | | | | (in millions of Canadian dollars, except per share data) | Share
capital |
| Additional
paid-in
capital |
| Accumulated
other
comprehensive
loss |
| Retained
earnings |
| Total
shareholders’
equity |
| | Balance at December 31, 2016 | $ | 2,002 |
| $ | 52 |
| $ | (1,799 | ) | $ | 4,371 |
| $ | 4,626 |
| | Net income | — |
| — |
| — |
| 2,405 |
| 2,405 |
| | Other comprehensive income (Note 8) | — |
| — |
| 58 |
| — |
| 58 |
| | Dividends declared ($2.1875 per share) | — |
| — |
| — |
| (319 | ) | (319 | ) | | Effect of stock-based compensation expense | — |
| 3 |
| — |
| — |
| 3 |
| | CP Common Shares repurchased (Note 22) | (27 | ) | — |
| — |
| (354 | ) | (381 | ) | | Shares issued under stock option plan (Note 22) | 57 |
| (12 | ) | — |
| — |
| 45 |
| | Balance at December 31, 2017 | 2,032 |
| 43 |
| (1,741 | ) | 6,103 |
| 6,437 |
| | Net income | — |
| — |
| — |
| 1,951 |
| 1,951 |
| | Other comprehensive loss (Note 8) | — |
| — |
| (302 | ) | — |
| (302 | ) | | Dividends declared ($2.5125 per share) | — |
| — |
| — |
| (358 | ) | (358 | ) | | Effect of stock-based compensation expense | — |
| 11 |
| — |
| — |
| 11 |
| | CP Common Shares repurchased (Note 22) | (66 | ) | — |
| — |
| (1,061 | ) | (1,127 | ) | | Shares issued under stock option plan (Note 22) | 36 |
| (12 | ) | — |
| — |
| 24 |
| | Balance at December 31, 2018 | 2,002 |
| 42 |
| (2,043 | ) | 6,635 |
| 6,636 |
| | Impact of accounting change (Note 2) | — |
| — |
| — |
| (5 | ) | (5 | ) | | Balance at January 1, 2019, as restated | 2,002 |
| 42 |
| (2,043 | ) | 6,630 |
| 6,631 |
| | Net income | — |
| — |
| — |
| 2,440 |
| 2,440 |
| | Other comprehensive loss (Note 8) | — |
| — |
| (479 | ) | — |
| (479 | ) | | Dividends declared ($3.1400 per share) | — |
| — |
| — |
| (434 | ) | (434 | ) | | Effect of stock-based compensation expense | — |
| 15 |
| — |
| — |
| 15 |
| | CP Common Shares repurchased (Note 22) | (54 | ) | — |
| — |
| (1,086 | ) | (1,140 | ) | | Shares issued under stock option plan (Note 22) | 45 |
| (9 | ) | — |
| — |
| 36 |
| | Balance at December 31, 2019 | $ | 1,993 |
| $ | 48 |
| $ | (2,522 | ) | $ | 7,550 |
| $ | 7,069 |
|
See Notes to Consolidated Financial Statements.
CP 2019 ANNUAL REPORT/ 78
CANADIAN PACIFIC RAILWAY LIMITED
Notes to Consolidated Financial Statements
December 31, 2019
Canadian Pacific Railway Limited (“CPRL”), through its subsidiaries (collectively referred to as “CP” or “the Company”), operates a transcontinental railway in Canada and the United States ("U.S."). CP provides rail and intermodal transportation services over a network of approximately 12,700 miles, serving the principal business centres of Canada from Montréal, Québec, to Vancouver, British Columbia, and the U.S. Northeast and Midwest regions. CP’s railway network feeds directly into the U.S. heartland from the East and West coasts. Agreements with other carriers extend the Company’s market reach in Canada, throughout the U.S. and into Mexico. CP transports bulk commodities, merchandise freight and intermodal traffic. Bulk commodities include grain, coal, fertilizers and sulphur. Merchandise freight consists of finished vehicles and automotive parts, as well as forest, industrial and consumer products. Intermodal traffic consists largely of retail goods in overseas containers that can be transported by train, ship and truck, and in domestic containers and trailers that can be moved by train and truck.
1. Summary of significant accounting policies
Accounting principles generally accepted in the United States of America (“GAAP”)
These Consolidated Financial Statements are expressed in Canadian dollars and have been prepared in accordance with GAAP.
Principles of consolidation
These Consolidated Financial Statements include the accounts of CP and all its subsidiaries. The Company’s investments in which it has significant influence are accounted for using the equity method. Distributions received from equity method investees are classified using the nature of the distribution approach for cash flow presentation purposes, whereby distributions received are classified based on the nature of the activity or activities of the investee that generated the distribution as either a return on investment (classified as a cash inflow from operating activities) or a return of investment (classified as a cash inflow from investing activities). All intercompany accounts and transactions have been eliminated.
Use of estimates
The preparation of these Consolidated Financial Statements in conformity with GAAP requires management to make estimates and assumptions that affect the reported amounts of revenues and expenses during the year, the reported amounts of assets and liabilities, and the disclosure of contingent assets and liabilities at the date of the financial statements. Management regularly reviews its estimates, including those related to environmental liabilities, pensions and other benefits, depreciable lives of properties, deferred income tax assets and liabilities, as well as legal and personal injury liabilities based upon currently available information. Actual results could differ from these estimates.
Principal subsidiaries
The following list sets out CPRL’s principal railway operating subsidiaries, including the jurisdiction of incorporation. All of these subsidiaries are wholly owned, directly or indirectly, by CPRL as at December 31, 2019.
We pay directors a flat fee, which reflects the director’s ongoing oversight and responsibilities throughout the year and attendance at Board and committee meetings. | | | | | Aligning director and shareholder interests Directors receive their annual retainer in deferred share units so they have an ongoing stake in our future success, aligning their interests with those of our shareholders. DDSUs are granted to directors under the director deferred share unit plan. Onlynon-employee directors participate in the plan. A DDSU is a bookkeeping entry that has the same value as one CP common share. DDSUs earn additional units as dividend equivalents at the same rate as dividends paid on our shares. DDSUs vest immediately, and directors receive a cash amount for their DDSUs, one year after they leave the Board, based on the market value of our shares at the time of redemption, less any withholding taxes. | | | Principal subsidiary | Incorporated underDirectors receive 100% of their annual retainer in DDSUs until they have met their share ownership requirements. After that they must receive at least 50% of their retainer in DDSUs, and can receive the lawsbalance in cash. Directors must make their election before the beginning of | Canadian Pacific Railway Company | Canada | Soo Line Railroad Company (“Soo Line”) | Minnesota | Delaware and Hudson Railway Company, Inc. (“D&H”) | Delaware | Dakota, Minnesota & Eastern Railroad Corporation (“DM&E”) | Delaware | Mount Stephen Properties Inc. (“MSP”) | Canada |
Revenue recognition
Revenue is recognized when obligations under the terms of a contract with a customer are satisfied. Revenue is measured as the amount of consideration the Company expects to receive in exchange for providing services. Government imposed taxes that the Company collects concurrent with revenue generating activities are excluded from revenue. In the normal course of business, the Company does not generate any material revenue through acting as an agent for other entities.
The Company provides rail freight transportation services to a wide variety of customers and transports bulk commodities, merchandise freight and intermodal traffic. The Company signs master service agreements with customers that dictate future services the Company is to perform for a customer at the time a bill of lading or service request is received. Each bill of lading or service request represents a separate distinct performance obligation that the Company is obligated to satisfy. The transaction price is generally in the form of a fixed fee determined at the inception of the bill of lading or service request. The Company allocates the transaction price to each distinct performance obligation based on the estimated standalone selling price for each performance obligation. As each bill of lading or service request represents a separate distinct performance obligation, the estimated standalone selling price is assessed at an observable price which
is fair market value. Certain customer agreements include variable consideration in the form of rebates, discounts, or incentives. The expected value method is used to estimate variable consideration and is allocated to the applicable performance obligation and is recognized when the related performance obligation is satisfied. Additionally, the Company offers published rates for services through public tariff agreements in which a customer can request service, triggering a performance obligation the Company must satisfy. Railway freight revenues are recognized over time as services are provided based on the percentage of completed service method. Volume rebates to customers are accrued as a reduction of freight revenues based on estimated volumes and contract terms as freight service is provided. Freight revenues also include certain ancillary and other services provided in association with the performance of rail freight movements. Revenues from these activities are not material and therefore have been aggregated with the freight revenues from customer contracts with which they are associated.
Non-freight revenues, including passenger revenues, switching fees, and revenues from logistics services, are recognized at the point in time the services are provided or when the performance obligations are satisfied. Non-freight revenues also include leasing revenues.
Payment by customers is due upon satisfaction of performance obligations. Payment terms are such that amounts outstanding at the period end are expected to be collected within one reporting period. The Company invoices customers at the time the bill of lading or service request is processed and therefore the Company has no material unbilled receivables and no contract assets. All performance obligations not fully satisfied at period end are expected to be satisfied within the reporting period immediately following. Contracted customer incentives are amortized to income over the term of the related revenue contract.
Cash and cash equivalents
Cash and cash equivalents include highly liquid short-term investments that are readily convertible to cash with original maturities of three months or less, but exclude cash and cash equivalents subject to restrictions.
Restricted cash and cash equivalents
Cash and cash equivalents that are restricted as to withdrawal or usage, in accordance with specific agreements, are presented as restricted cash and cash equivalents on the balance sheets when applicable. In the Company's Consolidated Statements of Cash Flows, these balances, if any, are included with cash and cash equivalents.
Foreign currency translation
Assets and liabilities denominated in foreign currencies, other than those held through foreign subsidiaries, are translated into Canadian dollars at the year-end exchange rate for monetary items and at the historical exchange rates for non-monetary items. Foreign currency revenues and expenses are translated at the exchange rates in effect on the dates of the related transactions. Foreign exchange ("FX") gains and losses, other than those arising from the translation of the Company’s net investment in foreign subsidiaries, are included in income.
The accounts of the Company’s foreign subsidiaries are translated into Canadian dollars using the year-end exchange rate for assets and liabilities and the average exchange rates during the year for revenues, expenses, gains and losses. FX gains and losses arising from the translation of the foreign subsidiaries’ assets and liabilities are included in “Other comprehensive (loss) income”. A portion of U.S. dollar-denominated long-term debt has been designated as a hedge of the net investment in foreign subsidiaries. As a result, unrealized FX gains and losses on U.S. dollar-denominated long-term debt, designated as a hedge, are offset against FX gains and losses arising from the translation of foreign subsidiaries’ accounts in “Other comprehensive (loss) income”.
Pensions and other benefits
Pension costs are actuarially determined using the projected-benefit method pro-rated over the credited service periods of employees. This method incorporates management’s best estimates of expected plan investment performance, salary escalation and retirement ages of employees. The expected return on fund assets is calculated using market-related asset values developed from a five-year average of market values for the fund’s public equity securities and absolute return strategies (with each prior year’s market value adjusted to the current date for assumed investment income during the intervening period) plus the market value of the fund’s fixed income, real estate, infrastructure and private debt securities, subject to the market-related asset value not being greater than 120% of the market value nor being less than 80% of the market value. The discount rate used to determine the projected-benefit obligation is based on blended market interest rates on high-quality corporate debt instruments with matching cash flows. Unrecognized actuarial gains and losses in excess of 10% of the greater of the benefit obligation and the market-related value of plan assets are amortized over the expected average remaining service period of active employees expected to receive benefits under the plan (approximately 12 years). Prior service costs arising from collectively bargained amendments to pension plan benefit provisions are amortized over the term of the applicable union agreement. Prior service costs arising from all other sources are amortized over the expected average remaining service period of active employees who are expected to receive benefits under the plan at the date of amendment.
Costs for post-retirement and post-employment benefits other than pensions, including post-retirement health care and life insurance and some workers’ compensation and long-term disability benefits in Canada, are actuarially determined on a basis similar to pension costs.
The over or under funded status of defined benefit pension and other post-retirement benefit plans are measured as the difference between the fair value of the plan assets and the benefit obligation, and are recognized on the balance sheets. In addition, any unrecognized actuarial gains and losses and prior service costs and credits that arise during the period are recognized as a component of “Other comprehensive (loss) income”, net of tax.
CP 2019 ANNUAL REPORT/ 80
Gains and losses on post-employment benefits that do not vest or accumulate, including some workers’ compensation and long-term disability benefits in Canada, are included immediately on the Company's Consolidated Statements of Income as "Other components of net periodic benefit cost or recovery".
The current service cost component of net periodic benefit cost is reported in "Compensation and benefits" for pensions and post-retirement benefits, and in "Purchased services and other" for self-insured workers' compensation and long-term disability benefits on the Company's Consolidated Statements of Income. Other components of net periodic benefit cost or recovery are reported in "Other components of net periodic benefit cost or recovery" outside of Operating income on the Company's Consolidated Statements of Income.
Capitalization of pension costs, when applicable, is restricted to the current service cost component of net periodic benefit cost.
Materials and supplies
Materials and supplies are carried at the lower of average cost or market value and consist primarily of fuel and parts used in the repair and maintenance of track structures, equipment, locomotives and freight cars.
Properties
Fixed asset additions and major renewals are recorded at cost, including direct costs, attributable indirect costs and carrying costs, less accumulated depreciation and any impairment. When there is a legal obligation associated with the retirement of property, a liability is initially recognized at its fair value and a corresponding asset retirement cost is added to the gross book value of the related asset and amortized to expense over the estimated term to retirement. The Company reviews the carrying amounts of its properties whenever changes in circumstances indicate that such carrying amounts may not be recoverable based on future undiscounted cash flows. When such properties are determined to be impaired, recorded asset values are revised to their fair value and an impairment loss is recognized.
The Company recognizes expenditures as additions to properties or operating expenses based on whether the expenditures increase the output or service capacity, lower the associated operating costs or extend the useful life of the properties and whether the expenditures exceed minimum physical and financial thresholds.
Much of the additions to properties, both new and replacement properties, are self-constructed. These are initially recorded at cost, including direct costs and attributable indirect costs, overheads and carrying costs. Direct costs include, among other things, labour costs, purchased services, equipment costs and material costs. Attributable indirect costs and overheads include incremental long-term variable costs resulting from the execution of capital projects. Indirect costs mainly include work trains, material distribution, highway vehicles and work equipment. Overheads primarily include a portion of the engineering department’s costs, which plans, designs and administers these capital projects. These costs are allocated to projects by applying a measure consistent with the nature of the cost, based on cost studies. For replacement properties, the project costs are allocated to dismantling and installation based on cost studies. Dismantling work, which is expensed, is performed concurrently with the installation.
Ballast programs including undercutting, shoulder ballasting and renewal programs that form part of the annual track program are capitalized as this work, and the related added ballast material, significantly improves drainage, which in turn extends the life of ties and other track materials. These costs are tracked separately from the underlying assets and depreciated over the period to the next estimated similar ballast program. Spot replacement of ballast is considered a repair which is expensed as incurred.
The costs of large refurbishments are capitalized and locomotive overhauls are expensed as incurred, except where overhauls represent a betterment of the locomotive in which case costs are capitalized.
The Company capitalizes development costs for major new computer systems.
The Company follows group depreciation, which groups assets which are similar in nature and have similar economic lives. The property groups are depreciated on a straight-line basis reflecting their expected economic lives determined by depreciation studies. Depreciation studies are regular reviews of asset service lives, salvage values, accumulated depreciation and other related factors. Depreciation rates are established through these studies. Actual use and retirement of assets may vary from current estimates, and would be identified in the next study. These changes in expected economic lives would impact the amount of depreciation expense recognized in future periods. All track assets are depreciated using a straight-line method which recognizes the value of the asset consumed as a percentage of the whole life of the asset.
When depreciable property is retired or otherwise disposed of in the normal course of business, the book value, less net salvage proceeds, is charged to accumulated depreciation and if different than the assumptions under the depreciation study could potentially result in adjusted depreciation expense over a period of years. However, when removal costs exceed the salvage value on assets and the Company has no legal obligation to remove the assets, the removal costs incurred are charged to income in the period in which the assets are removed and are not charged to accumulated depreciation.
For certain asset classes, the historical cost of the asset is separately recorded in the Company’s property records. This amount is retired from the property records upon retirement of the asset. For assets for which the historical cost cannot be separately identified the amount of the gross book value to be retired is estimated
using either an indexation methodology, whereby the current replacement cost of the asset is indexed to the estimated year of installation for the asset, or a first-in, first-out approach, or statistical analysis is used to determine the age of the retired asset. CP uses indices that closely correlate to the principal costs of the assets.
There are a number of estimates inherent in the depreciation and retirement processes and as it is not possible to precisely estimate each of these variables until a group of property is completely retired, CP regularly monitors the estimated service lives of assets and the associated accumulated depreciation for each asset class to ensure depreciation rates are appropriate. If the recorded amounts of accumulated depreciation are greater or less than the amounts indicated by the depreciation studies, then the excess or deficit is amortized as a component of depreciation expense over the remaining service lives of the applicable asset classes.
For the sale or retirement of larger groups of depreciable assets that are unusual and were not considered in the Company’s depreciation studies, CP records a gain or loss for the difference between net proceeds and net book value of the assets sold or retired. The accumulated depreciation to be retired includes asset-specific accumulated depreciation, when known, and an appropriate portion of the accumulated depreciation recorded for the relevant asset class as a whole, calculated using a cost-based allocation.
Revisions to the estimated useful lives and net salvage projections constitute a change in accounting estimate and are addressed prospectively by amending depreciation rates.
Equipment under finance lease is included in Properties and depreciated over the period of expected use.
Leases
The Company has leases for rolling stock, buildings, vehicles, railway equipment, and roadway machines. CP has entered into rolling stock leases that are fully variable or contain both fixed and variable components. Variable components are dependent on the hours and miles that the underlying equipment has been used. Fixed term, short-term, and variable operating lease costs are recorded in "Equipment rents" and "Purchased services and other" on the Company's Consolidated Statements of Income. Components of finance lease costs are recorded in "Depreciation and amortization" and "Net interest expense" on the Company's Consolidated Statements of Income.
The Company determines lease existence and classification at the lease inception date. Leases are identified when an agreement conveys the right to control identified property for a period of time in exchange for consideration. The Company recognizes both an operating lease liability and right-of-use (“ROU”) asset for operating leases with fixed terms and in-substance fixed terms. ROU assets represent our right to use an underlying asset for the lease term and lease liabilities represent our obligation to make lease payments arising from the lease. Operating and finance lease ROU assets and liabilities are recognized at the lease commencement date based on the present value of lease payments over the lease term. Lease payments include fixed and variable payments that are based on an index or a rate. If the Company's leases do not provide a readily determinable implicit interest rate, the Company uses internal incremental secured borrowing rates for comparable tenor in the same currency at the commencement date in determining the present value of lease payments. Operating and finance lease ROU assets also include lease prepayments and initial direct costs, but are reduced by lease incentives. The lease term may include periods associated with options to extend or exclude periods associated with options to terminate the lease when it is reasonably certain that the Company will exercise these options.
The Company has short-term operating leases with terms of 12 months or less, some of which include options to purchase that the Company is not reasonably certain to exercise. The Company has elected to apply the recognition exemption and, as such, accounts for leases with a term of 12 months or less off-balance sheet. Therefore, lease payments on these short-term operating leases are not included in operating lease ROU assets and liabilities, but are recognized as an expense in the Company's Consolidated Statements of Income on a straight-line basis over the term of the lease. Further, the Company has elected to combine lease and non-lease components for all leases, except for leases of roadway machines and information systems hardware.
Assets held for sale
Assets to be disposed that meet the held for sale criteria are reported at the lower of their carrying amount and fair value, less costs to sell, and are no longer depreciated.
Goodwill and intangible assets
Goodwill represents the excess of the purchase price over the fair value of identifiable net assets upon acquisition of a business. Goodwill is assigned to the reporting units that are expected to benefit from the business acquisition which, after integration of operations with the railway network, may be different than the acquired business.
The carrying value of goodwill, which is not amortized, is assessed for impairment annually in the fourth quarter of each year as at October 1st, or more frequently as economic events dictate. The Company has the option of performing an assessment of certain qualitative factors (“Step 0”) to determine if it is more likely than not that the fair value of a reporting unit is less than its carrying value or proceeding directly to a quantitative impairment test (“Step 1”). Qualitative factors include but are not limited to, economic, market and industry conditions, cost factors and overall financial performance of the reporting unit. If Step 0 indicates that the carrying value is less than the fair value, then performing the two-step impairment test is unnecessary. Under Step 1, the fair value of the
CP 2019 ANNUAL REPORT/ 82
reporting unit is compared to its carrying value, including goodwill. If the fair value of the reporting unit is less than its carrying value, goodwill is potentially impaired. The impairment charge that would be recognized is the excess of the carrying value of the goodwill over the fair value of the goodwill, determined in the same manner as in a business combination.
Intangible assets with finite lives are amortized on a straight-line basis over the estimated useful lives of the respective assets. Favourable leases, customer relationships and interline contracts have amortization periods ranging from 15 to 20 years. When there is a change in the estimated useful life of an intangible asset with a finite life, amortization is adjusted prospectively.
Financial instruments
Financial instruments are contracts that give rise to a financial asset of one party and a financial liability or equity instrument of another party.
Financial instruments are recognized initially at fair value, which is the amount of consideration that would be agreed upon in an arm’s-length transaction between willing parties.
Subsequent measurement depends on how the financial instruments have been classified. Accounts receivable and other investments, classified as loans and receivables, are measured at amortized cost, using the effective interest method. Cash and cash equivalents and derivatives are classified as held for trading and are measured at fair value. Accounts payable, accrued liabilities, short-term borrowings, other long-term liabilities and long-term debt are also measured at amortized cost.
Derivative financial instruments
Derivative financial and commodity instruments may be used from time to time by the Company to manage its exposure to risks relating to foreign currency exchange rates, stock-based compensation, interest rates and fuel prices. When CP utilizes derivative instruments in hedging relationships, CP identifies, designates and documents those hedging transactions and regularly tests the transactions to demonstrate effectiveness in order to continue hedge accounting.
All derivative instruments are classified as held for trading and recorded at fair value. Any change in the fair value of derivatives not designated as hedges is recognized in the period in which the change occurs in the Company's Consolidated Statements of Income in the line item to which the derivative instrument is related.
For fair value hedges, the periodic changes in values are recognized in income, on the same line as the changes in values of the hedged items are also recorded. For an effective cash flow hedge, the entire change in value of the hedging instrument is recognized in “Other comprehensive (loss) income”. The change in value of the effective cash flow hedge remains in “Accumulated other comprehensive loss” until the related hedged item settles, at which time amounts recognized in “Accumulated other comprehensive loss” are reclassified to the same income or balance sheet account that records the hedged item.
Cash flows relating to derivative instruments designated as hedges are included in the same line as the related hedged items on the Company's Consolidated Statements of Cash Flows.
Environmental remediation
Environmental remediation accruals, recorded on an undiscounted basis unless a reliably determinable estimate as to amount and timing of costs can be established, cover site-specific remediation programs. The accruals are recorded when the costs to remediate are probable and reasonably estimable. Certain future costs to monitor sites are discounted at an adjusted risk-free rate. Provisions for environmental remediation costs are recorded in “Other long-term liabilities”, except for the current portion, which is recorded in “Accounts payable and accrued liabilities”.
Income taxes
The Company follows the liability method of accounting for income taxes. Deferred income tax assets and liabilities are determined based on differences between the financial reporting and tax bases of assets and liabilities using enacted tax rates and laws that will be in effect when the differences are expected to reverse.
The effect of a change in income tax rates on deferred income tax assets and liabilities is recognized in income in the period during which the change occurs.
When appropriate, the Company records a valuation allowance against deferred tax assets to reflect that these tax assets may not be realized. In determining whether a valuation allowance is appropriate, CP considers whether it is more likely than not that all or some portion of CP’s deferred tax assets will not be realized, based on management’s judgment using available evidence about future events.
At times, tax benefit claims may be challenged by a tax authority. Tax benefits are recognized only for tax positions that are more likely than not sustainable upon examination by tax authorities. The amount recognized is measured as the largest amount of benefit that is greater than 50% likely to be realized upon settlement. A liability for “unrecognized tax benefits” is recorded for any tax benefits claimed in CP’s tax returns that do not meet these recognition and measurement standards.
Investment and other similar tax credits are deferred on the Company's Consolidated Balance Sheets and amortized to “Income tax expense” as the related asset is recognized in income. Income tax recovery or expense on items in "Accumulated other comprehensive loss" are recognized in "Income tax expense" as the related item is recognized in income.
Earnings per share
Basic earnings per share are calculated using the weighted-average number of the Company's Common Shares (the "Common Shares') outstanding during the year. Diluted earnings per share are calculated using the treasury stock method for determining the dilutive effect of options.
Stock-based compensation
CP follows the fair value based approach to account for stock options. Compensation expense and an increase in “Additional paid-in capital” are recognized for stock options over their vesting period, or over the period from the grant date to the date employees become eligible to retire when this is shorter than the vesting period, based on their estimated fair values on the grant date, as determined using the Black-Scholes option-pricing model.
Any consideration paid by employees on exercise of stock options is credited to “Share capital” when the option is exercised and the recorded fair value of the option is removed from “Additional paid-in capital" and credited to “Share capital”.
Compensation expense is also recognized for deferred share units (“DSUs”), performance share units (“PSUs”) and restricted share units (“RSUs”) that settle in cash using the fair value method. Compensation expense is recognized over the vesting period, or for PSUs and DSUs only, over the period from the grant date to the date employees become eligible to retire when this is shorter than the vesting period. Forfeitures of DSUs, PSUs, and RSUs are estimated at issuance and subsequently at the balance sheet date.
The employee share purchase plan gives rise to compensation expense that is recognized using the issue price by amortizing the cost over the vesting period or over the period from the grant date to the date employees become eligible to retire when this is shorter than the vesting period.
2. Accounting changes
Implemented in 2019
Leases
On January 1, 2019, the Company adopted the new Accounting Standards Update ("ASU") 2016-02, issued by the Financial Accounting Standards Board ("FASB"), and all related amendments under FASB Accounting Standards Codification ("ASC") Topic 842, Leases. Using the cumulative-effect adjustment transition approach, the Company recognized a cumulative-effect adjustment to the opening balance of retained earnings in the period of adoption. Accordingly, comparative financial information has not been restated and continues to be reported under the accounting standards in effect for those periods.
In January 2019, the Company implemented a lease management system to assist in delivering the required accounting changes. To facilitate the transition, the Company made policy choices to utilize available practical expedients provided by the new standard, including the:
Acceptance of the package of practical expedients, permitting the Company not to reassess lease existence, classification, and capitalization of initial direct costs previously determined for all leases under Topic 840, Leases;
Acceptance of the previous accounting treatment for land easements where Topic 840 was not applied; and
Use of hindsight at transition to determine lease term length.
Operating leases with fixed terms and in-substance fixed terms were transitioned by recognizing both an operating lease liability and ROU asset. Operating lease liabilities and ROU assets were calculated at the present value of remaining lease payments using the Company’s incremental borrowing interest rate as at January 1, 2019. ROU assets were further modified to include previously accrued balances for prepayments and initial direct costs, but reduced for accrued lease incentives. The Company did not recognize operating lease liabilities or ROU assets for leases requiring variable payment not dependent on an index or rate, or short term leases with a term of 12 months or less.
On adoption, the standard had a material impact on the Company's consolidated balance sheet, but did not have a significant impact on its consolidated statement of income. The most significant impact was the recognition of operating lease ROU assets and operating lease liabilities, while the Company's accounting for finance leases remained substantially unchanged.
CP 2019 ANNUAL REPORT/ 84
The impact of the adoption of ASC 842 as at January 1, 2019 was as follows:
| | | | | | | | | | | | (in millions of Canadian dollars) | As reported
December 31, 2018 |
| New lease standard
cumulative-effect |
| As restated
January 1, 2019 |
| | Assets | | | | | Properties | $ | 18,418 |
| $ | (12 | ) | $ | 18,406 |
| | Other assets | 71 |
| 399 |
| 470 |
| | Liabilities | | | | | Accounts payable and accrued liabilities | 1,449 |
| 58 |
| 1,507 |
| | Other long-term liabilities | 237 |
| 337 |
| 574 |
| | Deferred income taxes | 3,518 |
| (3 | ) | 3,515 |
| | Shareholders' equity | | | | | Retained earnings | $ | 6,635 |
| $ | (5 | ) | $ | 6,630 |
|
There was no significant impact to lessor accounting upon the adoption of ASC 842.
Future Changes
Financial Instruments – Credit Losses
In June 2016, the FASB issued ASU 2016-13, Measurement of Credit Losses on Financial Instruments under FASB ASC Topic 326. This will replace the current incurred loss methodology used for establishing a provision against financial assets, including accounts receivable, with a forward-looking expected loss methodology for accounts receivable, loans and other financial instruments. The standard is effective as of January 1, 2020. Entities are required to apply the amendments in this update using a modified retrospective approach, through a cumulative-effect adjustment to retained earnings as of the effective date. The Company expects that the adoption of this new accounting standard will not result in any material change to accounts receivable or retained earnings. The Company will estimate its expected credit loss by applying an appropriate expected loss methodology to individual portfolios of the Company’s financial assets with portfolios representing assets with similar risk characteristics.
3. Revenues
The following table disaggregates the Company’s revenues from contracts with customers by major source:
| | | | | | | | | | | | (in millions of Canadian dollars) | 2019 |
| 2018 |
| 2017 |
| | Freight | | | | | Grain | $ | 1,684 |
| $ | 1,566 |
| $ | 1,532 |
| | Coal | 682 |
| 673 |
| 631 |
| | Potash | 462 |
| 486 |
| 411 |
| | Fertilizers and sulphur | 250 |
| 243 |
| 241 |
| | Forest products | 304 |
| 284 |
| 265 |
| | Energy, chemicals and plastics | 1,534 |
| 1,243 |
| 898 |
| | Metals, minerals and consumer products | 752 |
| 797 |
| 739 |
| | Automotive | 352 |
| 322 |
| 293 |
| | Intermodal | 1,593 |
| 1,538 |
| 1,365 |
| | Total freight revenues | 7,613 |
| 7,152 |
| 6,375 |
| | Non-freight excluding leasing revenues | 116 |
| 102 |
| 117 |
| | Revenues from contracts with customers | 7,729 |
| 7,254 |
| 6,492 |
| | Leasing revenues | 63 |
| 62 |
| 62 |
| | Total revenues | $ | 7,792 |
| $ | 7,316 |
| $ | 6,554 |
|
Contract liabilities
Contract liabilities represent payments received for performance obligations not yet satisfied and relate to deferred revenue and are presented as components of "Accounts payable and accrued liabilities" and "Other long-term liabilities" on the Company's Consolidated Balance Sheets.
The following table summarizes the changes in contract liabilities for the years ended December 31, 2019 and 2018:
| | | | | | | | | (in millions of Canadian dollars) | 2019 |
| 2018 |
| | Opening balance | $ | 2 |
| $ | 2 |
| | Revenue recognized that was included in the contract liability balance at the beginning of the period | (2 | ) | (2 | ) | | Increases due to consideration received, net of revenue recognized during the period | 146 |
| 2 |
| | Closing balance | $ | 146 |
| $ | 2 |
|
4. Other (income) expense
| | | | | | | | | | | | (in millions of Canadian dollars) | 2019 |
| 2018 |
| 2017 |
| | Foreign exchange (gain) loss on debt and lease liabilities | $ | (94 | ) | $ | 168 |
| $ | (186 | ) | | Other foreign exchange (gains) losses | (4 | ) | 3 |
| (7 | ) | | Insurance recovery of legal settlement | — |
| — |
| (10 | ) | | Charge on hedge roll and de-designation | — |
| — |
| 13 |
| | Other | 9 |
| 3 |
| 12 |
| | Other (income) expense | $ | (89 | ) | $ | 174 |
| $ | (178 | ) |
5. Net interest expense
| | | | | | | | | | | | (in millions of Canadian dollars) | 2019 |
| 2018 |
| 2017 |
| | Interest cost | $ | 471 |
| $ | 475 |
| $ | 491 |
| | Interest capitalized to Properties | (17 | ) | (20 | ) | (16 | ) | | Interest expense | 454 |
| 455 |
| 475 |
| | Interest income | (6 | ) | (2 | ) | (2 | ) | | Net interest expense | $ | 448 |
| $ | 453 |
| $ | 473 |
|
Interest expense includes interest on finance leases of $11 million for the year ended December 31, 2019 (2018 – $11 million; 2017 – $11 million).
CP 2019 ANNUAL REPORT/ 86
6. Income taxes
The following is a summary of the major components of the Company’s income tax expense:
| | | | | | | | | | | | (in millions of Canadian dollars) | 2019 |
| 2018 |
| 2017 |
| | Current income tax expense | $ | 525 |
| $ | 381 |
| $ | 303 |
| | Deferred income tax expense | | | | | Origination and reversal of temporary differences | 316 |
| 214 |
| 371 |
| | Effect of tax rate decrease | (95 | ) | (21 | ) | (541 | ) | | Effect of hedge of net investment in foreign subsidiaries | (38 | ) | 64 |
| (42 | ) | | Other | (2 | ) | (1 | ) | 2 |
| | Total deferred income tax expense (recovery) | 181 |
| 256 |
| (210 | ) | | Total income taxes | $ | 706 |
| $ | 637 |
| $ | 93 |
| | Income before income tax expense | | | | | Canada | $ | 2,392 |
| $ | 1,788 |
| $ | 1,829 |
| | Foreign | 754 |
| 800 |
| 669 |
| | Total income before income tax expense | $ | 3,146 |
| $ | 2,588 |
| $ | 2,498 |
| | Income tax expense | | | | | Current | | | | | Canada | $ | 410 |
| $ | 336 |
| $ | 257 |
| | Foreign | 115 |
| 45 |
| 46 |
| | Total current income tax expense | 525 |
| 381 |
| 303 |
| | Deferred | | | | | Canada | 141 |
| 174 |
| 256 |
| | Foreign | 40 |
| 82 |
| (466 | ) | | Total deferred income tax expense (recovery) | 181 |
| 256 |
| (210 | ) | | Total income taxes | $ | 706 |
| $ | 637 |
| $ | 93 |
|
The provision for deferred income taxes arises from temporary differences in the carrying values of assets and liabilities for financial statement and income tax purposes and the effect of loss carry forwards. The items comprising the deferred income tax assets and liabilities are as follows:
| | | | | | | | | (in millions of Canadian dollars) | 2019 |
| 2018 |
| | Deferred income tax assets | | | | Amount related to tax losses carried forward | $ | 6 |
| $ | 11 |
| | Liabilities carrying value in excess of tax basis | 139 |
| 97 |
| | Unrealized foreign exchange losses | 26 |
| 85 |
| | Environmental remediation costs | 22 |
| 23 |
| | Other | 4 |
| 2 |
| | Total deferred income tax assets | 197 |
| 218 |
| | Valuation allowance | — |
| (5 | ) | | Total net deferred income tax assets | 197 |
| 213 |
| | Deferred income tax liabilities | | | | Properties carrying value in excess of tax basis | 3,524 |
| 3,496 |
| | Pensions carrying value in excess of tax basis | 83 |
| 164 |
| | Other | 91 |
| 71 |
| | Total deferred income tax liabilities | 3,698 |
| 3,731 |
| | Total net deferred income tax liabilities | $ | 3,501 |
| $ | 3,518 |
|
The Company’s consolidated effective income tax rate differs from the expected Canadian statutory tax rates. Expected income tax expense at statutory rates is reconciled to income tax expense as follows:
| | | | | | | | | | | | (in millions of Canadian dollars, except percentage) | 2019 |
| 2018 |
| 2017 |
| | Statutory federal and provincial income tax rate (Canada) | 26.77 | % | 26.86 | % | 26.56 | % | | Expected income tax expense at Canadian enacted statutory tax rates | $ | 842 |
| $ | 695 |
| $ | 663 |
| | (Decrease) increase in taxes resulting from: | | | | | (Gains) losses not subject to tax | (19 | ) | 8 |
| (27 | ) | | Canadian tax rate differentials | — |
| — |
| 1 |
| | Foreign tax rate differentials | (33 | ) | (55 | ) | (9 | ) | | Effect of tax rate decrease | (95 | ) | (21 | ) | (541 | ) | | Valuation allowance | (5 | ) | 5 |
| — |
| Unrecognized tax benefits(1) | 33 |
| — |
| 1 |
| Other(1) | (17 | ) | 5 |
| 5 |
| | Income tax expense | $ | 706 |
| $ | 637 |
| $ | 93 |
|
(1) 2017 comparative period figures have been reclassified to conform with current presentation.
In 2019, the Company revalued its deferred income tax balances as a result of a corporate income tax rate decrease in the province of Alberta, resulting in a net recovery of $88 million.
In 2018, the Company revalued its deferred income tax balances as a result of corporate income tax rate decreases in the states of Iowa and Missouri, resulting in a net recovery of $21 million.
On December 22, 2017, the U.S. enacted the “Tax Cuts and Jobs Act” which has been commonly referred to as U.S. tax reform. A significant change under this reform was the reduction of the U.S. federal statutory corporate income tax rate from 35% to 21% beginning in 2018. As a result of this and other tax rate increases in the province of British Columbia and the state of Illinois, the Company revalued its deferred income tax balances accordingly. For the full year 2017, revaluations of deferred tax balances associated with changes in tax rates totaled a net recovery of $541 million.
The Company has not provided a deferred liability for the income taxes, if any, which might become payable on any temporary difference associated with its foreign investments because the Company intends to indefinitely reinvest in its foreign investments and has no intention to realize this difference by a sale of its interest in foreign investments. It is not practical to calculate the amount of the deferred tax liability.
It is more likely than not that the Company will realize the majority of its deferred income tax assets from the generation of future taxable income, as the payments for provisions, reserves and accruals are made and losses and tax credits carried forward are utilized.
At December 31, 2019, the Company had tax effected operating losses carried forward of $4 million (2018 – $8 million), which have been recognized as a deferred tax asset. The majority of these losses carried forward will begin to expire in 2031, with the remaining expiring between 2034 and 2036. The Company expects to fully utilize these tax effected operating losses before their expiry. The Company did 0t have any minimum tax credits or investment tax credits carried forward.
At December 31, 2019, the Company had $2 million (2018 – $3 million) in tax effected capital losses carried forward recognized as a deferred tax asset. The Company has no unrecognized tax benefits from capital losses at December 31, 2019 and 2018.
CP 2019 ANNUAL REPORT/ 88
The following table provides a reconciliation of uncertain tax positions in relation to unrecognized tax benefits for Canada and the U.S. for the year ended December 31:
| | | | | | | | | | | | (in millions of Canadian dollars) | 2019 |
| 2018 |
| 2017 |
| | Unrecognized tax benefits at January 1 | $ | 13 |
| $ | 13 |
| $ | 13 |
| | Increase in unrecognized: | | | | | Tax benefits related to the current year | 9 |
| 1 |
| — |
| | Tax benefits related to prior years | 34 |
| — |
| — |
| | Dispositions: | | | | | Gross uncertain tax benefits related to prior years | — |
| (1 | ) | — |
| | Settlements with taxing authorities | (4 | ) | — |
| — |
| | Unrecognized tax benefits at December 31 | $ | 52 |
| $ | 13 |
| $ | 13 |
|
If these uncertain tax positions were recognized, all of the amount of unrecognized tax positions as at December 31, 2019 would impact the Company’s effective tax rate.
During the fourth quarter of 2019, a tax authority proposed an adjustment for a prior tax year without assessing taxes. Although the Company has commenced action to have the proposal removed, an increase in uncertain tax position has been recorded on deferred income tax liability and expense in the amount of $24 million. The ultimate resolution of this matter may give rise to further favourable or unfavourable adjustments to deferred tax, the timing and amount of which are not determinable at this time.
The Company recognizes accrued interest and penalties related to unrecognized tax benefits as a component of "Income tax expense" in the Company’s Consolidated Statements of Income. The net amount of accrued interest and penalties in 2019 was a $1 million recovery (2018 – $nil; 2017 – $1 million expense). The total amount of accrued interest and penalties associated with the unrecognized tax benefit at December 31, 2019 was $10 million (2018 – $11 million; 2017 – $11 million).
The Company and its subsidiaries are subject to either Canadian federal and provincial income tax, U.S. federal, state and local income tax, or the relevant income tax in other international jurisdictions. The Company has substantially concluded all Canadian federal and provincial income tax matters for the years through 2013. The federal and provincial income tax returns filed for 2014 and subsequent years remain subject to examination by the Canadian taxation authorities. The Internal Revenue Service ("IRS") audit for 2012 and 2013 has been settled. The income tax returns for 2016 and subsequent years continue to remain subject to examination by the IRS and U.S. state tax jurisdictions. The Company believes that it has recorded sufficient income tax reserves at December 31, 2019 with respect to these income tax examinations.
7. Earnings per share
Basic earnings per share has been calculated using Net income for the year divided by the weighted-average number of shares outstanding during the each calendar year.
Diluted earnings per share has been calculated using the treasury stock method which assumes that any proceeds received from the exercise of in-the-money options would be used to purchase CP Common Shares at the average market price for the period. For purposes of this calculation, at December 31, 2019, there were 1.6 million dilutive options outstanding (2018 – 1.3 million; 2017 – 1.4 million).
The number of shares used and the earnings per share calculations are reconciled as follows:
| | | | | | | | | | | | (in millions of Canadian dollars, except per share data) | 2019 |
| 2018 |
| 2017 |
| | Net income | $ | 2,440 |
| $ | 1,951 |
| $ | 2,405 |
| | Weighted-average basic shares outstanding (millions) | 138.8 |
| 142.9 |
| 145.9 |
| | Dilutive effect of stock options (millions) | 0.5 |
| 0.4 |
| 0.4 |
| | Weighted-average diluted shares outstanding (millions) | 139.3 |
| 143.3 |
| 146.3 |
| | Earnings per share – basic | $ | 17.58 |
| $ | 13.65 |
| $ | 16.49 |
| | Earnings per share – diluted | $ | 17.52 |
| $ | 13.61 |
| $ | 16.44 |
|
In 2019, there were 0 options excluded from the computation of diluted earnings per share (2018 – 0.2 million; 2017 – 0.3 million).
8. Other comprehensive (loss) income and accumulated other comprehensive loss
The components of Other comprehensive (loss) income and the related tax effects are as follows:
| | | | | | | | | | | | (in millions of Canadian dollars) | Before
tax amount |
| Income tax (expense) recovery |
| Net of tax
amount |
| | For the year ended December 31, 2019 | | | | | Unrealized foreign exchange (loss) gain on: | | | | | Translation of the net investment in U.S. subsidiaries | $ | (251 | ) | $ | — |
| $ | (251 | ) | | Translation of the U.S. dollar-denominated long-term debt designated as a hedge of the net investment in U.S. subsidiaries (Note 19) | 288 |
| (38 | ) | 250 |
| | Realized loss on derivatives designated as cash flow hedges recognized in income | 10 |
| (2 | ) | 8 |
| | Change in pension and other benefits actuarial gains and losses | (661 | ) | 175 |
| (486 | ) | | Other comprehensive loss | $ | (614 | ) | $ | 135 |
| $ | (479 | ) | | For the year ended December 31, 2018 | | | | | Unrealized foreign exchange gain (loss) on: | | | | | Translation of the net investment in U.S. subsidiaries | $ | 419 |
| $ | — |
| $ | 419 |
| | Translation of the U.S. dollar-denominated long-term debt designated as a hedge of the net investment in U.S. subsidiaries (Note 19) | (479 | ) | 64 |
| (415 | ) | | Change in derivatives designated as cash flow hedges: | | | | | Realized loss on cash flow hedges recognized in income | 10 |
| (3 | ) | 7 |
| | Unrealized gain on cash flow hedges and other | 28 |
| (8 | ) | 20 |
| | Change in pension and other benefits actuarial gains and losses | (447 | ) | 115 |
| (332 | ) | | Change in prior service pension and other benefit costs | (2 | ) | 1 |
| (1 | ) | | Other comprehensive loss | $ | (471 | ) | $ | 169 |
| $ | (302 | ) | | For the year ended December 31, 2017 | | | | | Unrealized foreign exchange (loss) gain on: | | | | | Translation of the net investment in U.S. subsidiaries | $ | (295 | ) | $ | — |
| $ | (295 | ) | | Translation of the U.S. dollar-denominated long-term debt designated as a hedge of the net investment in U.S. subsidiaries (Note 19) | 319 |
| (42 | ) | 277 |
| | Change in derivatives designated as cash flow hedges: | | | | | Realized loss on cash flow hedges recognized in income | 25 |
| (6 | ) | 19 |
| | Unrealized loss on cash flow hedges and other | (6 | ) | 2 |
| (4 | ) | | Change in pension and other benefits actuarial gains and losses | 84 |
| (20 | ) | 64 |
| | Change in prior service pension and other benefit costs | (4 | ) | 1 |
| (3 | ) | | Other comprehensive income | $ | 123 |
| $ | (65 | ) | $ | 58 |
|
The components of Accumulated other comprehensive loss, net of tax, are as follows:
| | | | | | | | | (in millions of Canadian dollars) | 2019 |
| 2018 |
| | Unrealized foreign exchange gain on translation of the net investment in U.S. subsidiaries | $ | 611 |
| $ | 862 |
| | Unrealized foreign exchange loss on translation of the U.S. dollar-denominated long-term debt designated as a hedge of the net investment in U.S. subsidiaries | (499 | ) | (749 | ) | | Net deferred losses on derivatives and other | (54 | ) | (62 | ) | | Amounts for defined benefit pension and other post-retirement plans not recognized in income (Note 23) | (2,580 | ) | (2,094 | ) | | Accumulated other comprehensive loss | $ | (2,522 | ) | $ | (2,043 | ) |
CP 2019 ANNUAL REPORT/ 90
Changes in Accumulated other comprehensive loss by component are as follows:
| | | | | | | | | | | | | | | (in millions of Canadian dollars) | Foreign currency
net of hedging
activities(1) |
| Derivatives and
other(1) |
| Pension and post-
retirement defined
benefit plans(1) |
| Total(1) |
| | Opening balance, January 1, 2019 | $ | 113 |
| $ | (62 | ) | $ | (2,094 | ) | $ | (2,043 | ) | | Other comprehensive loss before reclassifications | (1 | ) | — |
| (550 | ) | (551 | ) | | Amounts reclassified from accumulated other comprehensive loss | — |
| 8 |
| 64 |
| 72 |
| | Net current-period other comprehensive (loss) income | (1 | ) | 8 |
| (486 | ) | (479 | ) | | Closing balance, December 31, 2019 | $ | 112 |
| $ | (54 | ) | $ | (2,580 | ) | $ | (2,522 | ) | | Opening balance, January 1, 2018 | $ | 109 |
| $ | (89 | ) | $ | (1,761 | ) | $ | (1,741 | ) | | Other comprehensive income (loss) before reclassifications | 4 |
| 19 |
| (417 | ) | (394 | ) | | Amounts reclassified from accumulated other comprehensive loss | — |
| 8 |
| 84 |
| 92 |
| | Net current-period other comprehensive income (loss) | 4 |
| 27 |
| (333 | ) | (302 | ) | | Closing balance, December 31, 2018 | $ | 113 |
| $ | (62 | ) | $ | (2,094 | ) | $ | (2,043 | ) |
(1) Amounts are presented net of tax.
Amounts in Pension and post-retirement defined benefit plans reclassified from Accumulated other comprehensive loss are as follows:
| | | | | | | | | (in millions of Canadian dollars) | 2019 |
| 2018 |
| Amortization of prior service costs(1) | $ | — |
| $ | (2 | ) | Recognition of net actuarial loss(1) | 84 |
| 117 |
| | Total before income tax | 84 |
| 115 |
| | Income tax recovery | (20 | ) | (31 | ) | | Total net of income tax | $ | 64 |
| $ | 84 |
|
(1) Impacts "Other components of net periodic benefit recovery" on the Consolidated Statements of Income.
9. Change in non-cash working capital balances related to operations
| | | | | | | | | | | | (in millions of Canadian dollars) | 2019 |
| 2018 |
| 2017 |
| | Source (use) of cash: | | | | | Accounts receivable, net | $ | 27 |
| $ | (107 | ) | $ | (91 | ) | | Materials and supplies | (8 | ) | (11 | ) | 9 |
| | Other current assets | (24 | ) | 30 |
| (26 | ) | | Accounts payable and accrued liabilities | (21 | ) | 153 |
| (30 | ) | | Change in non-cash working capital | $ | (26 | ) | $ | 65 |
| $ | (138 | ) |
10. Accounts receivable, net
| | | | | | | | | (in millions of Canadian dollars) | 2019 |
| 2018 |
| | Freight | $ | 637 |
| $ | 677 |
| | Non-freight | 210 |
| 168 |
| | | 847 |
| 845 |
| | Allowance for doubtful accounts | (42 | ) | (30 | ) | | Total accounts receivable, net | $ | 805 |
| $ | 815 |
|
The Company maintains an allowance for doubtful accounts based on expected collectability of accounts receivable. The Allowance for doubtful accounts is based on specific identification of uncollectable accounts, the application of historical percentages by aging category, and an assessment of the current economic environment.
11. Business combination
On December 30, 2019, CP acquired 100% of Central Maine & Québec Railway Canada Inc. (“CMQ Canada”) and Central Maine & Québec Railway U.S. Inc. (“CMQ U.S.”) (together “CMQ”) for cash consideration of $174 million. CMQ owns 237 miles of rail lines in Québec and 244 miles of rail lines in Maine and Vermont.
CMQ Canada
The acquisition of CMQ Canada has been accounted for as a business combination under the acquisition method of accounting. The acquired tangible and intangible assets and assumed liabilities are recorded at their estimated fair values at the date of acquisition.
The purchase price allocation was prepared on a preliminary basis and is subject to change as additional information becomes available concerning the fair value and tax bases of the net assets acquired. Any adjustments to the purchase price allocation will be made as soon as practicable but no later than one year from the date of acquisition.
The following summarizes the estimated fair values of the acquired assets and liabilities of CMQ Canada:
| | | | | | (in millions of Canadian dollars) | 2019 |
| | Fair value of net assets acquired: | | | Accounts receivable, net | $ | 7 |
| | Properties | 42 |
| | Intangible assets (Note 15) | 5 |
| | Accounts payable and accrued liabilities | (2 | ) | | Long-term debt maturing within one year (Note 18) | (11 | ) | | Other long-term liabilities | (4 | ) | | Total identifiable assets and liabilities | $ | 37 |
| | Goodwill (Note 15) | 10 |
| | | $ | 47 |
| | Consideration: | | | Cash, net of cash acquired | $ | 47 |
|
The goodwill of $10 million relates primarily to expected operating business synergies. The factors that contribute to the goodwill are revenue growth from customers which are currently not served by CP, access to new routes and an assembled workforce. The goodwill recognized is not deductible for tax purposes.
CP has not provided pro forma information relating to the pre-acquisition period as it is not material.
CMQ U.S.
CP currently accounts for its $127 million cost of acquisition of CMQ U.S. using the equity method of accounting as the shares of CMQ U.S. are held in an independent voting trust while the United States Surface Transportation Board (“STB”) considers the Company's control application (see Note 13). Subject to final approval of the transaction by the STB, the acquisition of CMQ U.S. will be accounted for as a business combination using the acquisition method of accounting.
12. Dispositions of properties
During the fourth quarter of 2018, the Company completed the sale of the Bass Lake railway line for gross proceeds of $37 million (U.S. $27 million). The company recorded a gain on sale of $35 million ($26 million after tax) within "Purchased services and other" from the transaction.
CP 2019 ANNUAL REPORT/ 92
13. Investments
| | | | | | | | | (in millions of Canadian dollars) | 2019 |
| 2018 |
| | Investment in CMQ U.S. accounted for on an equity basis (Note 11) | $ | 127 |
| $ | — |
| | Other rail investments accounted for on an equity basis | 166 |
| 160 |
| | Other investments | 48 |
| 43 |
| | Total investments | $ | 341 |
| $ | 203 |
|
14. Properties
| | | | | | | | | | | | | | | | | | | | | | | | | | | | (in millions of Canadian dollars except percentages) | 2019 | 2019 | | 2018 | | | Weighted-average annual depreciation rate |
| Cost |
| | Accumulated
depreciation |
| | Net book
value |
| | Cost |
| | Accumulated
depreciation |
| | Net book
value |
| | Track and roadway | 2.8 | % | $ | 19,299 |
| | $ | 5,522 |
| | $ | 13,777 |
| | $ | 18,599 |
| | $ | 5,236 |
| | $ | 13,363 |
| | Buildings | 2.9 | % | 833 |
| | 237 |
| | 596 |
| | 781 |
| | 218 |
| | 563 |
| | Rolling stock | 2.8 | % | 4,529 |
| | 1,445 |
| | 3,084 |
| | 4,467 |
| | 1,613 |
| | 2,854 |
| Information systems software(1) | 10.0 | % | 527 |
| | 215 |
| | 312 |
| | 551 |
| | 252 |
| | 299 |
| | Other | 5.2 | % | 2,067 |
| | 680 |
| | 1,387 |
| | 1,984 |
| | 645 |
| | 1,339 |
| | Total | $ | 27,255 |
| | $ | 8,099 |
| | $ | 19,156 |
| | $ | 26,382 |
| | $ | 7,964 |
| | $ | 18,418 |
|
(1) During 2019, CP capitalized costs attributable to the design and development of internal-use software in the amount of $55 million (2018 – $53 million; 2017 – $49 million). Current year depreciation expense related to internal use software was $44 million (2018 – $49 million; 2017 – $55 million).
Finance leases included in properties
| | | | | | | | | | | | | | | | | | | | | (in millions of Canadian dollars) | 2019 | 2018 | | | Cost |
| Accumulated
depreciation |
| Net book
value |
| Cost |
| Accumulated
depreciation |
| Net book
value |
| | Buildings | $ | — |
| $ | — |
| $ | — |
| $ | 1 |
| $ | 1 |
| $ | — |
| | Rolling stock | 303 |
| 130 |
| 173 |
| 311 |
| 124 |
| 187 |
| | Other | 4 |
| — |
| 4 |
| — |
| — |
| — |
| | Total assets held under finance lease | $ | 307 |
| $ | 130 |
| $ | 177 |
| $ | 312 |
| $ | 125 |
| $ | 187 |
|
15. Goodwill and intangible assets
| | | | | | | | | | | | | | | | | | | | Goodwill |
| | Intangible assets | | | (in millions of Canadian dollars) | Net
carrying
amount |
| | Cost |
| Accumulated
amortization |
| Net
carrying
amount |
| Total goodwill and intangible assets |
| | Balance at December 31, 2017 | $ | 178 |
| | $ | 22 |
| $ | (13 | ) | $ | 9 |
| $ | 187 |
| | Amortization | — |
| | — |
| (1 | ) | (1 | ) | (1 | ) | | Foreign exchange impact | 16 |
| | — |
| — |
| — |
| 16 |
| | Balance at December 31, 2018 | 194 |
| | 22 |
| (14 | ) | 8 |
| 202 |
| | Additions (Note 11) | 10 |
| | 5 |
| — |
| 5 |
| 15 |
| | Amortization | — |
| | — |
| (1 | ) | (1 | ) | (1 | ) | | Foreign exchange impact | (10 | ) | | — |
| — |
| — |
| (10 | ) | | Balance at December 31, 2019 | $ | 194 |
| | $ | 27 |
| $ | (15 | ) | $ | 12 |
| $ | 206 |
|
16. Other assets
| | | | | | | | | (in millions of Canadian dollars) | 2019 |
| 2018 |
| | Operating lease ROU assets (Note 2, 21) | $ | 358 |
| $ | — |
| | Long-term materials | 41 |
| 26 |
| | Contracted customer incentives | 32 |
| 11 |
| | Prepaid leases | — |
| 10 |
| | Other | 20 |
| 24 |
| | Total other assets | $ | 451 |
| $ | 71 |
|
17. Accounts payable and accrued liabilities
| | | | | | | | | (in millions of Canadian dollars) | 2019 |
| 2018 |
| | Trade payables | $ | 453 |
| $ | 474 |
| | Accrued charges | 348 |
| 360 |
| Contract liabilities(1) (Note 3) | 142 |
| 2 |
| | Income and other taxes payable | 139 |
| 104 |
| | Accrued interest | 131 |
| 135 |
| | Dividends payable | 114 |
| 91 |
| | Stock-based compensation liabilities | 85 |
| 53 |
| | Payroll-related accruals | 78 |
| 78 |
| | Operating lease liabilities (Note 2, 21) | 69 |
| — |
| | Accrued vacation | 60 |
| 61 |
| | Personal injury and other claims provision | 55 |
| 68 |
| | Provision for environmental remediation (Note 20) | 7 |
| 8 |
| Other(1) | 12 |
| 15 |
| | Total accounts payable and accrued liabilities | $ | 1,693 |
| $ | 1,449 |
|
(1) 2018 comparative period figures have been reclassified to conform with current presentation.
CP 2019 ANNUAL REPORT/ 94
18. Debt
The following table outlines the Company's outstanding debt instruments and finance lease obligations as at December 31, 2019:
| | | | | | | | | | | | | (in millions of Canadian dollars except percentages) | | Maturity | Currency
in which
payable | 2019 |
| 2018 |
| | 7.250% | 10-year Notes | (A) | May 2019 | U.S.$ | $ | — |
| $ | 477 |
| | 9.450% | 30-year Debentures | (A) | Aug 2021 | U.S.$ | 325 |
| 341 |
| | 5.100% | 10-year Medium Term Notes | (A) | Jan 2022 | CDN$ | 125 |
| 125 |
| | 4.500% | 10-year Notes | (A) | Jan 2022 | U.S.$ | 324 |
| 339 |
| | 4.450% | 12.5-year Notes | (A) | Mar 2023 | U.S.$ | 454 |
| 477 |
| | 2.900% | 10-year Notes | (A) | Feb 2025 | U.S.$ | 909 |
| 955 |
| | 3.700% | 10.5-year Notes | (A) | Feb 2026 | U.S.$ | 324 |
| 340 |
| | 4.000% | 10-year Notes | (A) | Jun 2028 | U.S.$ | 649 |
| 682 |
| | 3.150% | 10-year Notes | (A) | Mar 2029 | CDN$ | 399 |
| — |
| | 7.125% | 30-year Debentures | (A) | Oct 2031 | U.S.$ | 454 |
| 477 |
| | 5.750% | 30-year Debentures | (A) | Mar 2033 | U.S.$ | 318 |
| 334 |
| | 4.800% | 20-year Notes | (A) | Sep 2035 | U.S.$ | 388 |
| 408 |
| | 5.950% | 30-year Notes | (A) | May 2037 | U.S.$ | 578 |
| 607 |
| | 6.450% | 30-year Notes | (A) | Nov 2039 | CDN$ | 400 |
| 400 |
| | 5.750% | 30-year Notes | (A) | Jan 2042 | U.S.$ | 319 |
| 336 |
| | 4.800% | 30-year Notes | (A) | Aug 2045 | U.S.$ | 712 |
| 748 |
| | 6.125% | 100-year Notes | (A) | Sep 2115 | U.S.$ | 1,169 |
| 1,228 |
| | 8.000% | 5-year Promissory Notes | (B) | up to Jun 2020 | U.S.$ | 11 |
| — |
| | 5.41% | Senior Secured Notes | (C) | Mar 2024 | U.S.$ | 100 |
| 113 |
| | 6.91% | Secured Equipment Notes | (D) | Oct 2024 | CDN$ | 91 |
| 106 |
| | 7.49% | Equipment Trust Certificates | (E) | Jan 2021 | U.S.$ | 55 |
| 57 |
| | Obligations under finance leases | | | | | | 2.97% | | (F) | Jun 2020 | CDN$ | 3 |
| — |
| | 6.99% | | (F) | Mar 2022 | U.S.$ | 99 |
| 104 |
| | 6.57% | | (F) | Dec 2026 | U.S.$ | 45 |
| 52 |
| | 12.77% | | (F) | Jan 2031 | CDN$ | 4 |
| 4 |
| | Commercial Paper | |
| | U.S.$ | 516 |
| — |
| | | | | 8,771 |
| 8,710 |
| | Perpetual 4% Consolidated Debenture Stock | (G) | | U.S.$ | 39 |
| 41 |
| | Perpetual 4% Consolidated Debenture Stock | (G) | | G.B.£ | 6 |
| 6 |
| | | | | 8,816 |
| 8,757 |
| | Unamortized fees on long-term debt | | | (59 | ) | (61 | ) | | | | | 8,757 |
| 8,696 |
| | Less: Long-term debt maturing within one year | | | 599 |
| 506 |
| | | | | $ | 8,158 |
| $ | 8,190 |
|
At December 31, 2019, the gross amount of long-term debt denominated in U.S. dollars was U.S. $6,016 million (2018 – U.S. $5,970 million).
Annual maturities and principal repayment requirements, excluding those pertaining to finance leases, for each of the five years following 2019 are (in millions): 2020 – $592; 2021 – $365; 2022 – $477; 2023 – $484; 2024 – $84.
Fees on long-term debt are amortized to income over the term of the related debt.
A. These debentures and notes are presented net of unamortized discounts, pay interest semi-annually, and are unsecured but carry a negative pledge.
In 2019, the Company repaid U.S. $350 million 7.250% 10-year Notes at maturity for a total of U.S. $350 million ($471 million). The Company also issued $400 million 3.150% 10-year Notes due March 13, 2029 for net proceeds of $397 million.
In 2018, the Company repaid U.S. $275 million 6.500% 10-year Notes at maturity for a total of U.S. $275 million ($352 million) and $375 million 6.250% 10-year Medium Term Notes at maturity for a total of $375 million. The Company also issued U.S. $500 million 4.000% 10-year Notes due June 1, 2028 for net proceeds of U.S. $495 million ($638 million). In conjunction with the issuance, the Company settled a notional U.S. $500 million of forward starting floating-to-fixed interest rate swap agreements ("forward starting swaps") for a payment of U.S. $19 million ($24 million) (see Note 19). This payment was included in cash provided by operating activities consistent with the location of the related hedged item on the Company's Consolidated Statements of Cash Flows.
B. On December 30, 2019, through its business combination with CMQ Canada, the Company assumed CMQ Canada's obligations under the 8.00% 5-year Promissory Notes totalling U.S. $8 million ($11 million) owing to CMQ U.S. (see Note 11).
C. The 5.41% Senior Secured Notes are collateralized by specific locomotive units with a carrying value of $102 million at December 31, 2019. The Company pays equal blended semi-annual payments of principal and interest. Final repayment of the remaining principal of U.S. $44 million is due in March 2024.
D. The 6.91% Secured Equipment Notes are full recourse obligations of the Company collateralized by a first charge on specific locomotive units with a carrying value of $59 million at December 31, 2019. The Company pays equal blended semi-annual payments of principal and interest. Final repayment of the remaining principal of $11 million is due in October 2024.
E. The 7.49% Equipment Trust Certificates are secured by specific locomotive units with a carrying value of $97 million at December 31, 2019. The Company makes semi-annual payments that vary in amount and are interest-only payments or blended principal and interest payments. Final repayment of the remaining principal of U.S. $11 million is due in January 2021.
F. The carrying value of the assets collateralizing finance lease obligations was $177 million at December 31, 2019.
G. The Consolidated Debenture Stock, authorized by an Act of Parliament of 1889, constitutes a first charge upon and over the whole of the undertaking, railways, works, rolling stock, plant, property and effects of the Company, with certain exceptions.
Credit facility
CP has a revolving credit facility (the “facility”) agreement with 14 highly rated financial institutions for a commitment amount of U.S. $1.3 billion. The facility can accommodate draws of cash and/or letters of credit at market competitive pricing. The agreement requires the Company to maintain a financial covenant in conjunction with the facility. As at December 31, 2019 and 2018, the Company was in compliance with all terms and conditions of the credit facility arrangements and satisfied the financial covenant.
Effective September 27, 2019, the Company amended and restated its revolving credit facility agreement to, among other things, increase the total amount available to U.S. $1.3 billion (December 31, 2018 – U.S. $1.0 billion). The amended and restated revolving credit facility consists of a U.S. $1.0 billion tranche maturing September 27, 2024 (extended from June 28, 2023, previously) and a U.S. $300 million tranche maturing September 27, 2021.
As at December 31, 2019 and 2018, the facility was undrawn. The amount available under the terms of the credit facility was U.S. $1.3 billion at December 31, 2019 (December 31, 2018 – U.S. $1.0 billion).
The Company also has a commercial paper program which enables it to issue commercial paper up to a maximum aggregate principal amount of U.S. $1.0 billion in the form of unsecured promissory notes. This commercial paper program is backed by the revolving credit facility. As at December 31, 2019, theCompany had total commercial paper borrowings of U.S. $397 million ($516 million), included in "Long-term debt maturing within one year" on the Company's Consolidated Balance Sheets (December 31, 2018 – $nil). The weighted-average interest rate on these borrowings was 2.03%. The Company presents issuances and repayments of commercial paper, all of which have a maturity of less than 90 days, in the Company's Consolidated Statements of Cash Flows on a net basis.
CP has bilateral letter of credit facilities with six highly rated financial institutions to support its requirement to post letters of credit in the ordinary course of business. Effective September 27, 2019, the Company reduced its bilateral letter of credit facilities to $300 million (December 31, 2018 – $600 million). Under these agreements, the Company has the option to post collateral in the form of cash or cash equivalents, equal at least to the face value of the letter of credit issued. These agreements permit CP to withdraw amounts posted as collateral at any time; therefore, the amounts posted as collateral are presented as “Cash and cash equivalents” on the Company’s Consolidated Balance Sheets. As at December 31, 2019, under its bilateral letter of credit facilities, the Company had no collateral posted (December 31, 2018 – $nil) and letters of credit drawn of $80 million (December 31, 2018 – $60 million) from a total available amount of $300 million (December 31, 2018 – $600 million).
CP 2019 ANNUAL REPORT/ 96
19. Financial instruments
A. Fair values of financial instruments
The Company categorizes its financial assets and liabilities measured at fair value into a three-level hierarchy established by GAAP that prioritizes those inputs to valuation techniques used to measure fair value based on the degree to which they are observable. The three levels of the fair value hierarchy are as follows: Level 1 inputs are quoted prices in active markets for identical assets and liabilities; Level 2 inputs, other than quoted prices included within Level 1, are observable for the asset or liability either directly or indirectly; and Level 3 inputs are not observable in the market.
The carrying values of financial instruments equal or approximate their fair values with the exception of long-term debt: | | | | | | | | | (in millions of Canadian dollars) | December 31, 2019 |
| December 31, 2018 |
| | Long-term debt (including current maturities): | | | | Fair value | $ | 10,149 |
| $ | 9,639 |
| | Carrying value | 8,757 |
| 8,696 |
|
All long-term debt is classified as Level 2. The estimated fair value of current and long-term borrowings has been determined based on market information where available, or by discounting future payments of principal and interest at estimated interest rates expected to be available to the Company at period end.
B. Financial risk management
Derivative financial instruments
Derivative financial instruments may be used to selectively reduce volatility associated with fluctuations in interest rates, FX rates, the price of fuel, and stock-based compensation expense. Where derivatives are designated as hedging instruments, the relationship between the hedging instruments and their associated hedged items is documented, as well as the risk management objective and strategy for the use of the hedging instruments. This documentation includes linking the derivatives that are designated as fair value or cash flow hedges to specific assets or liabilities on the Company's Consolidated Balance Sheets, commitments, or forecasted transactions. At the time a derivative contract is entered into and at least quarterly thereafter, an assessment is made as to whether the derivative item is effective in offsetting the changes in fair value or cash flows of the hedged items. The derivative qualifies for hedge accounting treatment if it is effective in substantially mitigating the risk it was designed to address.
It is not the Company’s intent to use financial derivatives or commodity instruments for trading or speculative purposes.
Credit risk management
Credit risk refers to the possibility that a customer or counterparty will fail to fulfill its obligations under a contract and as a result create a financial loss for the Company.
The railway industry predominantly serves financially established customers, and the Company has experienced limited financial losses with respect to credit risk. The credit worthiness of customers is assessed using credit scores supplied by a third party and through direct monitoring of their financial well-being on a continual basis. The Company establishes guidelines for customer credit limits and should thresholds in these areas be reached, appropriate precautions are taken to improve collectability.
Counterparties to financial instruments expose the Company to credit losses in the event of non-performance. Counterparties for derivative and cash transactions are limited to high credit quality financial institutions, which are monitored on an ongoing basis. Counterparty credit assessments are based on the financial health of the institutions and their credit ratings from external agencies. The Company does not anticipate non-performance that would materially impact the Company’s financial statements. In addition, the Company believes there are no significant concentrations of credit risk.
FX management
The Company conducts business transactions and owns assets in both Canada and the United States. As a result, the Company is exposed to fluctuations in the value of financial commitments, assets, liabilities, income, or cash flows due to changes in FX rates. The Company may enter into FX risk management transactions primarily to manage fluctuations in the exchange rate between Canadian and U.S. currencies. FX exposure is primarily mitigated through natural offsets created by revenues, expenditures, and balance sheet positions incurred in the same currency. Where appropriate, the Company may negotiate with customers and suppliers to reduce the net exposure.
Net investment hedge
The FX gains and losses on long-term debt are mainly unrealized and can only be realized when U.S. dollar-denominated long-term debt matures or is settled. The Company also has long-term FX exposure on its investment in foreign subsidiaries with a U.S. dollar functional currency. The majority of the Company’s U.S. dollar-denominated long-term debt has been designated as a hedge of the net investment in these foreign subsidiaries. This designation has the effect of mitigating volatility on Net income by offsetting long-term FX gains and losses on U.S. dollar-denominated long-term debt and gains and losses on its net investment. The effect of the net investment hedge recognized in “Other comprehensive (loss) income” in 2019 was an FX gain of $288 million, the majority of which was unrealized (2018 – unrealized loss of $479 million; 2017 – unrealized gain of $319 million) (see Note 8).
Interest rate management
The Company is exposed to interest rate risk, which is the risk that the fair value or future cash flows of a financial instrument will vary as a result of changes in market interest rates. In order to manage funding needs or capital structure goals, the Company enters into debt or finance lease agreements that are subject to either fixed market interest rates set at the time of issue or floating rates determined by ongoing market conditions. Debt subject to variable interest rates exposes the Company to variability in interest expense, while debt subject to fixed interest rates exposes the Company to variability in the fair value of debt.
To manage interest rate exposure, the Company accesses diverse sources of financing and manages borrowings in line with a targeted range of capital structure, debt ratings, liquidity needs, maturity schedule, and currency and interest rate profiles. In anticipation of future debt issuances, the Company may enter into forward rate agreements, that are designated as cash flow hedges, to substantially lock in all or a portion of the effective future interest expense. The Company may also enter into swap agreements, designated as fair value hedges, to manage the mix of fixed and floating rate debt.
Forward starting swaps
During the second quarter of 2018, the Company settled a notional amount of U.S. $500 million of forward starting swaps related to the U.S. $500 million 4.000% 10-year Notes issued in the same period. The fair value of these derivative instruments at the time of settlement was a loss of U.S. $19 million ($24 million). The Company no longer has any active forward starting swaps.
During the second quarter of 2017, the Company de-designated the hedging relationship for U.S. $700 million of forward starting swaps. The Company settled a notional amount of U.S. $200 million of forward starting swaps for a cash payment of U.S. $16 million ($22 million). The Company rolled the remaining notional amount of U.S. $500 million of forward starting swaps and did not cash settle these swaps. The impact of the U.S. $200 million settlement and U.S. $500 million roll of the forward starting swaps was a charge of $13 million to "Other (income) expense" on the Company's Consolidated Statements of Income. Concurrently, the Company re-designated the forward starting swaps totalling U.S. $500 million to fix the benchmark rate on cash flows associated with highly probable forecasted issuances of long-term notes.
The changes in fair value of the forward starting swaps for the year ended December 31, 2019 was $nil (2018 – gain of $31 million). This was recorded in "Accumulated other comprehensive loss”, net of tax, and is being reclassified to "Net interest expense" on the Company's Consolidated Statements of Income until the underlying hedged notes are repaid.
For the year ended December 31, 2019, a net loss of $9 million related to previous forward starting swap hedges has been amortized to “Net interest expense” (2018 – loss of $10 million; 2017 – loss of $11 million). The Company expects that during the next 12 months, $9 million of net losses will be amortized to “Net interest expense”.
Treasury rate locks
At December 31, 2019, the Company had net unamortized losses related to interest rate locks, which are accounted for as cash flow hedges, settled in previous years totalling $18 million (December 31, 2018 – $19 million). This amount is composed of various unamortized gains and losses related to specific debts which are reflected in “Accumulated other comprehensive loss” and are amortized to “Net interest expense” in the period that interest on the related debt is charged. The amortization of these gains and losses resulted in a $1 million increase to “Net interest expense” and “Other comprehensive (loss) income” in 2019 (2018 – $1 million; 2017 – $1 million). The Company expects that during the next 12 months, a net loss of $1 million related to these previously settled derivatives will be reclassified to “Net interest expense”.
CP 2019 ANNUAL REPORT/ 98
20. Other long-term liabilities
| | | | | | | | | (in millions of Canadian dollars) | 2019 |
| 2018 |
| | Operating lease liabilities, net of current portion (Note 2, 21) | $ | 285 |
| $ | — |
| | Stock-based compensation liabilities, net of current portion | 111 |
| 81 |
| Provision for environmental remediation, net of current portion(1) | 70 |
| 74 |
| Deferred revenue on rights-of-way license agreements, net of current portion(2) | 20 |
| 24 |
| Deferred gains on sale leaseback transactions(2) | 6 |
| 13 |
| | Other, net of current portion | 70 |
| 45 |
| | Total other long-term liabilities | $ | 562 |
| $ | 237 |
|
(1) As at December 31, 2019, the aggregate provision for environmental remediation, including the current portion was $77 million (2018 – $82 million).
(2) The deferred revenue on rights-of-way license agreements and deferred gains on sale leaseback transactions are being amortized to income on a straight-line basis over the related lease terms.
Environmental remediation accruals
Environmental remediation accruals cover site-specific remediation programs. The estimate of the probable costs to be incurred in the remediation of properties contaminated by past railway use reflects the nature of contamination at individual sites according to typical activities and scale of operations conducted. CP has developed remediation strategies for each property based on the nature and extent of the contamination, as well as the location of the property and surrounding areas that may be adversely affected by the presence of contaminants, considering available technologies, treatment and disposal facilities and the acceptability of site-specific plans based on the local regulatory environment. Site-specific plans range from containment and risk management of the contaminants through to the removal and treatment of the contaminants and affected soils and groundwater. The details of the estimates reflect the environmental liability at each property. Provisions for environmental remediation costs are recorded in “Other long-term liabilities”, except for the current portion which is recorded in “Accounts payable and accrued liabilities” (see Note 17). Payments are expected to be made over 10 years to 2029.
The accruals for environmental remediation represent CP’s best estimate of its probable future obligation and include both asserted and unasserted claims, without reduction for anticipated recoveries from third parties. Although the recorded accruals include CP’s best estimate of all probable costs, CP’s total environmental remediation costs cannot be predicted with certainty. Accruals for environmental remediation may change from time to time as new information about previously untested sites becomes known, environmental laws and regulations evolve and advances are made in environmental remediation technology. The accruals may also vary as the courts decide legal proceedings against outside parties responsible for contamination. These potential charges, which cannot be quantified at this time, may materially affect income in the particular period in which a charge is recognized. Costs related to existing, but as yet unknown, or future contamination will be accrued in the period in which they become probable and reasonably estimable. Changes to costs are reflected as changes to “Other long-term liabilities” or “Accounts payable and accrued liabilities” on the Company's Consolidated Balance Sheets and to “Purchased services and other” within operating expenses on the Company's Consolidated Statements of Income. The amount charged to income in 2019 was $6 million (2018 – $6 million; 2017 – $5 million).
21. Leases
The Company’s leases have remaining terms of less than one year to 15 years, some include options to extend up to an additional 10 years, and some include options to terminate within one year.
Residual value guarantees are provided on certain rolling stock and vehicle operating leases. Cumulatively, these guarantees are limited to $2 million and are not included in lease liabilities as it is not currently probable that any amounts will be owed under these residual value guarantees.
The components of lease expense for the year ended December 31 are as follows:
| | | | | | (in millions of Canadian dollars) | 2019 |
| | Operating lease cost | $ | 89 |
| | Short-term lease cost | 10 |
| | Variable lease cost | 13 |
| | Sublease income | (3 | ) | | |
| | Finance Lease Cost |
| | Amortization of right-of use-assets | 9 |
| | Interest on lease liabilities | 11 |
| | Total lease costs | $ | 129 |
|
Supplemental balance sheet information related to leases is as follows:
| | | | | | | (in millions of Canadian dollars) | Classification | 2019 |
| | Assets | | | | Operating | Other assets | $ | 358 |
| | Finance | Properties, net book value | 177 |
| | | | | | Liabilities | | | | Current | | | | Operating | Accounts payable and accrued liabilities | 69 |
| | Finance | Long-term debt maturing within one year | 7 |
| | Long-term | | | | Operating | Other long-term liabilities | 285 |
| | Finance | Long-term debt | 144 |
|
The following table provides the Company's weighted-average remaining lease terms and discount rates:
Directors must meet their share ownership requirements within five years of joining the Board, and must hold their DDSUs for one year after they retire from the Board. The table below shows the flat fee retainers for 2019. In 2019, Canadian directors’ fees were converted to Canadian dollars and the number of DDSUs received was based on the trading price of our shares on the TSX. U.S. directors were paid in U.S. dollars and the number of DDSUs they received was based on the trading price of our shares on the NYSE. | | | | | | 2019 |
| Weighted-Average Remaining Lease Term | | | Operating leases | 7 years |
| | | | | Finance leases | 4 years |
| | | | | | | | | | | | | | | | |
We reimburse directors for travel andexpenses related to attending their Board and committee meetings and other business on behalf of CP. Mr. Creel does not receive any director compensation because he is compensated in his role as President and CEO. With input from our compensation advisors, we reviewed and updated our compensation comparator group in 2018. Other than the removal of Goldcorp Inc., which was acquired by Newmont Mining Inc., from the comparator group, we did not make any further changes to our comparator group in 2019. Our comparator group consists of six Class 1 Railroad peers as well as 11 capital-intensive Canadian companies. | | | | BNSF Railway Company | | BCE Inc. | | Canadian National Railway Company | | Fortis Inc. | | CSX Corporation | | TC Energy Corporation | | Kansas City Southern | | TELUS Corporation | | Norfolk Southern Corporation | | Rogers Communications Inc. | | Union Pacific Corporation | | Barrick Gold Corporation | | Cenovus Energy Inc. | | Kinross Gold Corporation | | Enbridge Inc. | | Suncor Energy Inc. | | Imperial Oil Limited | | |
The Governance Committee may engage an independent consultant with respect to director compensation. The Governance Committee makes its own decisions, which may reflect factors and considerations other than the information and recommendations provided by its external consultant. The Governance Committee did not retain a compensation consultant in 2019 with respect to director compensation.
2019 director compensation The Governance Committee reviews director compensation every two to three years based on the directors’ responsibilities and time commitment and the compensation provided by comparable companies. Each director is paid an annual retainer of US$200,000. Committee chairs receive an additional US$30,000 per year and the Board Chair receives an annual retainer of US$395,000. No changes were made to the director compensation program in 2019. We paid directors a total of approximately $2,854,492 in 2019 as detailed in the table below. Directors receive a flat fee retainer to cover their ongoing oversight and responsibilities throughout the year and their attendance at Board and committee meetings. Directors receive 100% of their annual retainer in director deferred share units (DDSUs) until they have met their share ownership requirements. After that, directors are required to receive at least 50% of their compensation in DDSUs. The total represents the approximate dollar value of DDSUs credited to each director’s DDSU account in 2019, based on the closing fair market value of our shares on the grant date plus the cash portion paid where a director elected to receive a portion of compensation in cash. Mr. Creel does not receive director compensation because he is compensated in his role as President and CEO (see pages 28 and 31 for details). | | | | | | | | | | | | | | | | | | | | | | | | | | | | | | | Name | | | | | | | | | | | Non-equity incentive plan compensation | | | | | | All other compensation (2)(3) | | | | | | | | | | | | | | | | | | | | | | | | | | | | | | | | | | | | | | | | | | | | | | | | | | | | | | | | | | | | | | | | | | | | | | | | | | | | | | | | | | | | | | | | | | | | | | | | | | | | | | | | | | | | | | | | | | | | | | | | | | | | | | | | | | | | | | | | | | | | | | | | | | | | | | | | | | | | | | | | | | | | | | | | | | | | | | | | | | | | | | | | | | | | | | | | | | | | | | | | | | | | | | | | | | | | | | | | | | | | | | | | | | | | | | | | | | | | | | | | | | | | | | | | | | | | | | | | | | | | | | | | | | | | | | | | | | | | | | | | | | | | | | | | | | | | | | | | | | | | | | | | | | | | | | | | | | | | | | | | | | | |
| (1) | The value of the share-based awards has been calculated in accordance with Financial Accounting Standards Board Accounting Standards Codification Topic 718 (FASB ASC 718) using the grant date fair value, which is prescribed by the DDSU Plan. |
| (2) | Each director was provided with a $1,000 donation, in local currency, to the charity of their choice in December 2019 in gratitude for their year of service. This amount appears underAll other compensation . |
| (3) | All directors were paid in U.S. dollars and the value of their share-based awards, and cash and other payments, as applicable, have been converted to Canadian dollars using the 2019 average exchange rate of $1.3269. |
| (4) | Mr. Hamberger and Ms. Robertson joined the Board in July 2019. Their 2019 compensation waspro-rated accordingly. |
| (5) | Mr. Reardon retired from the Board and did not stand forre-election at our annual meeting held May 7, 2019. In 2019, Mr. Reardon elected to receive 50% of his director compensation in DDSUs with the remaining 50% paid in cash. His 2019 compensation waspro-rated accordingly. |
Outstanding share-based awards and option-based awards The table below shows all vested and unvested equity incentive awards that are outstanding as of December 31, 2019. | | | | | | | | | | | | | | | | | | | | | | | | | | | | | | | | | | | | Weighted-Average Discount Rate | | | | | | Share-based awards | | Operating leases Name | 3.45 | %Number of
securities
underlying
unexercised
options | | | | | | | | | Value of
unexercised
options | | | Grant
type | | | Number of
shares or units
of shares that
have not
vested | | | Market or
payout value of
share-based
awards that
have not vested | | | Market or payout
value of vested
share-based
awards not paid
out or distributed | | Finance leases | 7.07 | % | | | | | | | | | | | | | | | | | | | | | | | | | | | | | | | | | | | | | | | | | | | | | | | | | | | | | | | | | | | | | | | | | | | | | | | | | | | | | | | | | | | | | | | | | | | | | | | | | | | | | | | | | | | | | | | | | | | | | | | | | | | | | | | | | | | | | | | | | | | | | | | | | | | | | | | | | | | | | | | | | | | | | | | | | | | | | | | | | | | | | | | | | | | | | | | | | | | | | | | | | | | | | | | | | | | | | | | | | | | | | | | | | | | | | | | | | | | | | | | | | | | | | | | | | | | | | | | | | | | | | | | | | | | | | | | | | | | | | | | | | | | | | | | | | | | | | | | | | | | | | | | | | | | | | | | | | | | | | | | | | | | | | | | | | | | | | | | | | | | | | | | | | | | | | | | | | | | | | | | | |
CP 2019 ANNUAL REPORT/ 100
Supplemental information related to leases is as follows:
| | | | | | (in millions of Canadian dollars) | 2019 |
| | Cash paid for amounts included in measurement of lease liabilities | | | Operating cash outflows from operating leases | $ | 82 |
| | Operating cash outflows from finance leases | 10 |
| | Financing cash outflows from finance leases | 6 |
| | | | | Right-of-use assets obtained in exchange for lease liabilities | | | Operating leases | 38 |
| | Finance leases | 4 |
|
The following table provides the maturities of lease liabilities for the next five years and thereafter as at December 31, 2019:
| | | | | | | | | (in millions of Canadian dollars) | Finance Leases |
| Operating Leases |
| | 2020 | $ | 11 |
| $ | 80 |
| | 2021 | 10 |
| 55 |
| | 2022 | 108 |
| 51 |
| | 2023 | 8 |
| 39 |
| | 2024 | 9 |
| 40 |
| | Thereafter | 21 |
| 130 |
| | Total lease payments | 167 |
| 395 |
| | Imputed interest | (16 | ) | (41 | ) | | Present value of lease payments | $ | 151 |
| $ | 354 |
|
22. Shareholders’ equity
Authorized and issued share capital
The Company is authorized to issue an unlimited number of Common Shares, an unlimited number of First Preferred Shares, and an unlimited number of Second Preferred Shares. At December 31, 2019, 0 First or Second Preferred Shares had been issued.
The following table summarizes information related to Common Share balances as at December 31:
| | | | | | | | | (number of shares in millions) | 2019 |
| 2018 |
| 2017 |
| | Share capital, January 1 | 140.5 |
| 144.9 |
| 146.3 |
| | CP Common Shares repurchased | (3.8 | ) | (4.6 | ) | (1.9 | ) | | Shares issued under stock option plan | 0.3 |
| 0.2 |
| 0.5 |
| | Share capital, December 31 | 137.0 |
| 140.5 |
| 144.9 |
|
The change in the “Share capital” balance includes $7 million of stock-based compensation transferred from “Additional paid-in capital” (2018 – $12 million; 2017 – $12 million).
Share repurchases
On May 10, 2017, the Company announced a normal course issuer bid ("NCIB"), commencing May 15, 2017, to purchase up to 4.38 million Common Shares in the open market for cancellation on or before May 14, 2018. The Company completed this NCIB on May 10, 2018.
On October 19, 2018, the Company announced a NCIB, commencing October 24, 2018, to purchase up to 5.68 million Common Shares for cancellation on or before October 23, 2019. The Company completed this NCIB on October 23, 2019.
On December 17, 2019, the Company announced a new NCIB, commencing December 20, 2019, to purchase up to 4.80 million Common Shares for cancellation on or before December 19, 2020. As at December 31, 2019, the Company had purchased 0.30 million Common Shares for $100 million under this NCIB program.
All purchases were made in accordance with the respective NCIB at prevalent market prices plus brokerage fees, or such other prices that were permitted by the Toronto Stock Exchange, with consideration allocated to share capital up to the average carrying amount of the shares and any excess allocated to "Retained earnings".
The following table provides the activities under the share repurchase programs for each of the years ended December 31:
| | | | | | | | | | | | | 2019 |
| 2018 |
| 2017 |
| Number of Common Shares repurchased(1) | 3,794,149 |
| 4,683,162 |
| 1,888,100 |
| Weighted-average price per share(2) | $ | 300.65 |
| $ | 240.68 |
| $ | 201.53 |
| Amount of repurchase (in millions)(2) | $ | 1,141 |
| $ | 1,127 |
| $ | 381 |
|
(1) Includes shares repurchased but not yet cancelled at year end.
(2) Includes brokerage fees.
23. Pensions and other benefits
The Company has both defined benefit (“DB”) and defined contribution (“DC”) pension plans. At December 31, 2019, the Canadian pension plans represent nearly all of total combined pension plan assets and nearly all of total combined pension plan obligations.
The DB plans provide for pensions based principally on years of service and compensation rates near retirement. Pensions for Canadian pensioners are partially indexed to inflation. Annual employer contributions to the DB plans, which are actuarially determined, are made on the basis of being not less than the minimum amounts required by federal pension supervisory authorities.
The Company has other benefit plans including post-retirement health and life insurance for pensioners, and post-employment long-term disability and workers’ compensation benefits, which are based on Company-specific claims. At December 31, 2019, the Canadian other benefits plans represent nearly all of total combined other plan obligations.
The Audit and Finance Committee of the Board of Directors has approved an investment policy that establishes long-term asset mix targets which take into account the Company’s expected risk tolerances. Pension plan assets are managed by a suite of independent investment managers, with the allocation by manager reflecting these asset mix targets. Most of the assets are actively managed with the objective of outperforming applicable benchmarks. In accordance with the investment policy, derivative instruments may be used by investment managers to hedge or adjust existing or anticipated exposures.
To develop the expected long-term rate of return assumption used in the calculation of net periodic benefit cost applicable to the market-related value of plan assets, the Company considers the expected composition of the plans’ assets, past experience and future estimates of long-term investment returns. Future estimates of investment returns reflect the long-term return expectation for fixed income, public equity, real estate, infrastructure, private debt and absolute return investments and the expected added value (relative to applicable benchmark indices) from active management of pension fund assets.
The Company has elected to use a market-related value of assets for the purpose of calculating net periodic benefit cost, developed from a five years average of market values for the plans’ public equity and absolute return investments (with each prior year’s market value adjusted to the current date for assumed investment income during the intervening period) plus the market value of the plans’ fixed income, real estate, infrastructure and private debt securities.
The benefit obligation is discounted using a discount rate that is a blended yield to maturity for a hypothetical portfolio of high-quality corporate debt instruments with cash flows matching projected benefit payments. The discount rate is determined by management.
CP 2019 ANNUAL REPORT/ 102
Net periodic benefit cost
The elements of net periodic benefit cost for DB pension plans and other benefits recognized in the year include the following components:
| | | | | | | | | | | | | | | | | | | | | | | Pensions | | Other benefits | | (in millions of Canadian dollars) | 2019 |
| 2018 |
| 2017 |
| | 2019 |
| 2018 |
| 2017 |
| | Current service cost (benefits earned by employees) | $ | 107 |
| $ | 120 |
| $ | 103 |
| | $ | 11 |
| $ | 12 |
| $ | 12 |
| | Other components of net periodic benefit cost (recovery): | | | | | | | | | Interest cost on benefit obligation | 450 |
| 438 |
| 451 |
| | 20 |
| 19 |
| 20 |
| | Expected return on fund assets | (947 | ) | (955 | ) | (893 | ) | | — |
| — |
| — |
| | Recognized net actuarial loss | 84 |
| 114 |
| 153 |
| | 12 |
| 2 |
| (1 | ) | | Amortization of prior service costs | (1 | ) | (2 | ) | (5 | ) | | 1 |
| — |
| 1 |
| | Total other components of net periodic benefit (recovery) cost | (414 | ) | (405 | ) | (294 | ) | | 33 |
| 21 |
| 20 |
| | Net periodic benefit (recovery) cost | $ | (307 | ) | $ | (285 | ) | $ | (191 | ) | | $ | 44 |
| $ | 33 |
| $ | 32 |
|
Projected benefit obligation, fund assets, and funded status
Information about the Company’s DB pension plans and other benefits, in aggregate, is as follows:
| | | | | | | | | | | | | | | | | Pensions | | Other benefits | | (in millions of Canadian dollars) | 2019 |
| 2018 |
| | 2019 |
| 2018 |
| | Change in projected benefit obligation: | | | | | | | Benefit obligation at January 1 | $ | 11,372 |
| $ | 11,679 |
| | $ | 501 |
| $ | 518 |
| | Current service cost | 107 |
| 120 |
| | 11 |
| 12 |
| | Interest cost | 450 |
| 438 |
| | 20 |
| 19 |
| | Employee contributions | 41 |
| 47 |
| | — |
| 1 |
| | Benefits paid | (646 | ) | (640 | ) | | (34 | ) | (33 | ) | | Foreign currency changes | (10 | ) | 20 |
| | — |
| 2 |
| | Actuarial loss (gain) | 1,296 |
| (292 | ) | | 43 |
| (18 | ) | | Projected benefit obligation at December 31 | $ | 12,610 |
| $ | 11,372 |
| | $ | 541 |
| $ | 501 |
|
| | | | | | | | | | | | | | | | | Pensions | | Other benefits | | (in millions of Canadian dollars) | 2019 |
| 2018 |
| | 2019 |
| 2018 |
| | Change in fund assets: | | | | | | | Fair value of fund assets at January 1 | $ | 12,349 |
| $ | 12,808 |
| | $ | 4 |
| $ | 4 |
| | Actual return on fund assets | 1,528 |
| 82 |
| | 1 |
| — |
| | Employer contributions | 53 |
| 36 |
| | 34 |
| 32 |
| | Employee contributions | 41 |
| 47 |
| | — |
| 1 |
| | Benefits paid | (646 | ) | (640 | ) | | (34 | ) | (33 | ) | | Foreign currency changes | (6 | ) | 16 |
| | — |
| — |
| | Fair value of fund assets at December 31 | $ | 13,319 |
| $ | 12,349 |
| | $ | 5 |
| $ | 4 |
| | Funded status – plan surplus (deficit) | $ | 709 |
| $ | 977 |
| | $ | (536 | ) | $ | (497 | ) |
103 /SERVICE EXCELLENCE| (1) | On July 21, 2003, the Board suspended any additional grants of options under the director stock option plan, and there are no outstanding options under that plan. |
The table below shows the aggregate pension projected benefit obligation and aggregate fair value of plan assets for pension plans with fair value of plan assets in excess of projected benefit obligations (i.e. surplus), and for pension plans with projected benefit obligations in excess of fair value of plan assets (i.e. deficit):
| | | | | | | | | | | | | | | | | 2019 | | 2018 | | (in millions of Canadian dollars) | Pension
plans in
surplus |
| Pension
plans in
deficit |
| | Pension
plans in
surplus |
| Pension
plans in
deficit |
| | Projected benefit obligation at December 31 | $ | (12,076 | ) | $ | (534 | ) | | $ | (10,884 | ) | $ | (488 | ) | | Fair value of fund assets at December 31 | 13,079 |
| 240 |
| | 12,127 |
| 222 |
| | Funded Status | $ | 1,003 |
| $ | (294 | ) | | $ | 1,243 |
| $ | (266 | ) |
The DB pension plans’ accumulated benefit obligation as at December 31, 2019 was $12,201 million (2018 – $10,981 million). The accumulated benefit obligation is calculated on a basis similar to the projected benefit obligation, except no future salary increases are assumed in the projection of future benefits. For pension plans with accumulated benefit obligations in excess of fair value of plan assets (i.e. deficit), the aggregate pension accumulated benefit obligation as at December 31, 2019 was $419 million (2018 – $395 million) and the aggregate fair value of plan assets as at December 31, 2019 was $186 million (2018 – $180 million).
All Other benefits plans were in a deficit position at December 31, 2019 and 2018.
Pension asset and liabilities in the Company’s Consolidated Balance Sheets
Amounts recognized in the Company’s Consolidated Balance Sheets are as follows:
| | | | | | | | | | | | | | | | | Pensions | | Other benefits | | (in millions of Canadian dollars) | 2019 |
| 2018 |
| | 2019 |
| 2018 |
| | Pension asset | $ | 1,003 |
| $ | 1,243 |
| | $ | — |
| $ | — |
| | Accounts payable and accrued liabilities | (11 | ) | (11 | ) | | (34 | ) | (34 | ) | | Pension and other benefit liabilities | (283 | ) | (255 | ) | | (502 | ) | (463 | ) | | Total amount recognized | $ | 709 |
| $ | 977 |
| | $ | (536 | ) | $ | (497 | ) |
The measurement date used to determine the plan assets and the accrued benefit obligation is December 31. The most recent actuarial valuation for pension funding purposes for the Company’s main Canadian pension plan was performed as at January 1, 2019. During 2020, the Company expects to file with the pension regulator a new valuation performed as at January 1, 2020.
Accumulated other comprehensive loss
Amounts recognized in accumulated other comprehensive loss are as follows:
| | | | | | | | | | | | | | | | | Pensions | | Other benefits | | (in millions of Canadian dollars) | 2019 |
| 2018 |
| | 2019 |
| 2018 |
| | Net actuarial loss: | | | | | | | Other than deferred investment gains | $ | 3,434 |
| $ | 2,233 |
| | $ | 91 |
| $ | 61 |
| | Deferred investment gains | 41 |
| 611 |
| | — |
| — |
| | Prior service cost | 1 |
| — |
| | 1 |
| 2 |
| | Deferred income tax | (964 | ) | (797 | ) | | (24 | ) | (16 | ) | | Total (Note 8) | $ | 2,512 |
| $ | 2,047 |
| | $ | 68 |
| $ | 47 |
|
| (2) | Calculated based on the closing price of our shares on December 31, 2019 on the TSX ($331.03), in the case of directors resident in Canada, and on the NYSE (US$254.95) which was converted to Canadian dollars using theyear-end exchange rate of $1.2988, in the case of the directors resident in the U.S. |
The unamortized actuarial loss and the unamortized prior service cost included in “Accumulated other comprehensive loss” that are expected to be recognized in net periodic benefit cost during 2020 are a cost of $176 million and a recovery of $1 million, respectively, for pensions and costs of $3 million and $nil, respectively, for other post-retirement benefits.
CP 2019 ANNUAL REPORT/ 104
Actuarial assumptions
Weighted-average actuarial assumptions used were approximately:
| | | | | | | | | (percentages) | 2019 | | 2018 | | 2017 | | | Benefit obligation at December 31: | | | | | | | | Discount rate | 3.25 | | 4.01 | | 3.80 | | | Projected future salary increases | 2.75 | | 2.75 | | 2.75 | | | Health care cost trend rate | 5.50 | (1) | 6.00 | (1) | 7.00 | (2) | | Benefit cost for year ended December 31: | | | | | | | | Discount rate | 4.01 | | 3.80 | | 4.02 | | Expected rate of return on fund assets (3) | 7.50 | | 7.75 | | 7.75 | | | Projected future salary increases | 2.75 | | 2.75 | | 2.75 | | | Health care cost trend rate | 6.00 | (1) | 7.00 | (2) | 7.00 | (2) |
(1) The health care cost trend rate was assumed to be 6.00% in 2019, is assumed to be 5.50% in 2020 and 5.00% per year in 2021 and thereafter.
(2) The health care cost trend rate was previously assumed to be 7.00% in 2017 and 2018, and then decreasing by 0.50% per year to an ultimate rate of 5.00% per year in 2022 and thereafter.
(3) The expected rate of return on fund assets that will be used to compute the 2020 net periodic benefit credit is 7.25%.
Assumed health care cost trend rates affect the amounts reported for the health care plans. A one-percentage-point increase in the assumed health care cost trend rate would increase the post-retirement benefit obligation by $5 million, and a one-percentage-point decrease in the assumed health care cost trend rate would decrease the post-retirement benefit obligation by $5 million. A one-percentage-point increase or decrease in the assumed health care cost trend rate would have no material effect on the total of service and interest costs.
Plan assets
Plan assets are recorded at fair value. The major asset categories are public equity securities, fixed income securities, real estate, infrastructure, absolute return investments and private debt. The fair values of the public equity and fixed income securities are primarily based on quoted market prices. Real estate and infrastructure values are based on the value of each fund’s assets as calculated by the fund manager, generally using third party appraisals or discounted cash flow analysis and taking into account current market conditions and recent sales transactions where practical and appropriate. Private debt values are based on the value of each fund’s assets as calculated by the fund manager taking into account current market conditions and reviewed annually by external parties. Absolute return investments are a portfolio of units of externally managed hedge funds and are valued by the fund administrators.
The Company’s pension plan asset allocation, the weighted average asset allocation targets and the weighted average policy range for each major asset class at year end, were as follows:
| | | | | | | | | | Percentage of plan assets
at December 31 | | Asset allocation (percentage) | Asset allocation target | Policy range | 2019 | 2018 | | Cash and cash equivalents | 1.2 | 0 – 10 | 0.9 | 1.1 | | Fixed income | 24.1 | 20 – 40 | 24.6 | 25.6 | | Public equity | 45.1 | 35 – 55 | 54.5 | 50.2 | | Real estate and infrastructure | 9.8 | 4 – 13 | 6.8 | 7.7 | | Private debt | 9.8 | 4 – 13 | 2.4 | 1.3 | | Absolute return | 10.0 | 4 – 13 | 10.8 | 14.1 | | Total | 100.0 | | 100.0 | 100.0 |
105 /SERVICE EXCELLENCE| (3) | Mr. Reardon retired from the Board and did not stand for re-election at our annual meeting held May 7, 2019. |
Summary of the assets of the Company’s DB pension plans
The following is a summary of the assets of the Company’s DB pension plans at December 31, 2019 and 2018. As of December 31, 2019 and 2018, there were no plan assets classified as Level 3 valued investments.
| | | | | | | | | | | | | | | | Assets Measured at Fair Value | Investments measured at NAV(1) |
| Total Plan Assets |
| | (in millions of Canadian dollars) | Quoted prices in
active markets
for identical assets (Level 1) |
| Significant other
observable inputs (Level 2) |
| | December 31, 2019 | | | | | | Cash and cash equivalents | $ | 112 |
| $ | — |
| $ | — |
| $ | 112 |
| | Fixed income | | | | | Government bonds(2) | 233 |
| 1,857 |
| — |
| 2,090 |
| Corporate bonds(2) | 273 |
| 819 |
| — |
| 1,092 |
| Mortgages(3) | 159 |
| 5 |
| — |
| 164 |
| | Public equities | | | | | | Canada | 1,351 |
| — |
| — |
| 1,351 |
| | U.S. and international | 5,883 |
| 22 |
| — |
| 5,905 |
| Real estate(4) | — |
| — |
| 724 |
| 724 |
| Infrastructure(5) | — |
| — |
| 187 |
| 187 |
| Private debt(6) | — |
| — |
| 313 |
| 313 |
| Derivative instruments(7) | — |
| (59 | ) | — |
| (59 | ) | Absolute return(8) | | | | | | Funds of hedge funds | — |
| — |
| 1,418 |
| 1,418 |
| | Multi-strategy funds | — |
| — |
| 22 |
| 22 |
| | | $ | 8,011 |
| $ | 2,644 |
| $ | 2,664 |
| $ | 13,319 |
| | December 31, 2018 | | | | | | Cash and cash equivalents | $ | 127 |
| $ | 12 |
| $ | — |
| $ | 139 |
| | Fixed income | | | | | Government bonds(2) | 101 |
| 1,281 |
| — |
| 1,382 |
| Corporate bonds(2) | 128 |
| 1,606 |
| — |
| 1,734 |
| Mortgages(3) | 41 |
| — |
| — |
| 41 |
| | Public equities | | | | | | Canada | 1,287 |
| — |
| — |
| 1,287 |
| | U.S. and international | 4,892 |
| 24 |
| — |
| 4,916 |
| Real estate(4) | — |
| — |
| 697 |
| 697 |
| Infrastructure(5) | — |
| — |
| 259 |
| 259 |
| Private debt(6) | — |
| — |
| 162 |
| 162 |
| Derivative instruments(7) | — |
| (7 | ) | — |
| (7 | ) | Absolute return(8) | | | | | | Funds of hedge funds | — |
| — |
| 1,189 |
| 1,189 |
| | Multi-strategy funds | — |
| — |
| 286 |
| 286 |
| | Credit funds | — |
| — |
| 32 |
| 32 |
| | Equity funds | — |
| — |
| 232 |
| 232 |
| | | $ | 6,576 |
| $ | 2,916 |
| $ | 2,857 |
| $ | 12,349 |
|
CP 2019 ANNUAL REPORT/ 106
(1) Investments measured at net asset value ("NAV"):
Amountsdirectors are comprised of certain investments measured using NAV (or its equivalent) as a practical expedient. These investments have not been classified in the fair value hierarchy.
(2) Government & Corporate Bonds:
Fair values for bonds are based on market prices supplied by independent sources as of the last trading day.
(3) Mortgages:
The fair values of mortgages are based on current market yields of financial instruments of similar maturity, coupon and risk factors.
(4) Real estate:
Real estate fund values are based on the NAV of the funds that invest directly in real estate investments. The values of the investments have been estimated using the capital accounts representing the plan’s ownership interest in the funds. Of the total, $606 million is subject to redemption frequencies ranging from monthly to annually and a redemption notice period of 90 days (2018 – $583 million). The remaining $118 million is not subject to redemption and is normally returned through distributions as a result of the liquidation of the underlying real estate investments (2018 – $114 million). As at December 31, 2019, there are $35 million of unfunded commitments for real estate investments (December 31, 2018 – $38 million).
(5) Infrastructure:
Infrastructure fund values are based on the NAV of the funds that invest directly in infrastructure investments. The values of the investments have been estimated using the capital accounts representing the plans' ownership interest in the funds. Of the total, $119 million is subject to redemption frequencies ranging from monthly to annually and a redemption notice period of 90 days (2018 – $130 million). The remaining $68 million is not subject to redemption and is normally returned through distributions as a result of the liquidation of the underlying infrastructure investments (2018 – $129 million).
(6) Private debt:
Private debt fund values are based on the NAV of the funds that invest directly in private debt investments. The values of the investments have been estimated using the capital accounts representing the plans' ownership interest in the funds. Of the total, $154 million is subject to redemption frequencies ranging from monthly to annually and a redemption notice period of 90 days (2018 – $162 million). The remaining $159 million is not subject to redemption and is normally returned through distributions as a result of the repayment of the underlying loans (2018 – $nil). As at December 31, 2019, there are $392 million of unfunded commitments for private debt investments (December 31, 2018 – $608 million).
(7) Derivatives:
The investment managers may utilize the following derivative instruments: equity futures to replicate equity index returns (Level 2); currency forwards to partially hedge foreign currency exposures (Level 2); bond forwards to reduce asset/liability interest rate risk exposures (Level 2); interest rate swaps to manage duration and interest rate risk (Level 2); credit default swaps to manage credit risk (Level 2); and options to manage interest rate risk and volatility (Level 2). The Company may utilize derivatives directly, but only for the purpose of hedging foreign currency exposures. As at December 31, 2019, there are currency forwards with a notional value of $334 million (December 31, 2018 – $1,226 million) and a fair value of $13 million (December 31, 2018 – $(7) million). The fixed income investment manager utilizes a portfolio of bond forwards for the purpose of reducing asset/liability interest rate exposure. As at December 31, 2019, there are bond forwards with a notional value of $3,269 million and a negative fair value of $72 million (December 31, 2018 – $nil).
(8) Absolute return:
The value of absolute return fund investments is based on the NAV reported by the fund administrators. The funds have different redemption policies with redemption notice periods varying from 60 to 95 days and frequencies ranging from monthly to triennially.
Additional plan assets information
The Company's primary investment objective for pension plan assets is to achieve a long–term return, net of all fees and expenses, that is sufficient for the plan's assets to satisfy the current and future obligations to plan beneficiaries, while minimizing the financial impact on the Company. In identifying the asset allocation ranges, consideration was given to the long-term nature of the underlying plan liabilities, the solvency and going-concern financial position of the plan, long-term return expectations and the risks associated with key asset classes as well as the relationships of returns on key asset classes with each other, inflation and interest rates. When advantageous and with due consideration, derivative instruments may be utilized by investment managers, provided the total value of the underlying assets represented by financial derivatives (excluding currency forwards, liability hedging derivatives in fixed income portfolios and derivatives held by absolute return funds) is limited to 30% of the market value of the fund.
The funded status of the plans is exposed to fluctuations in interest rates, which affects the relative values of the plans' liabilities and assets. In order to mitigate interest rate risk, the Company's main Canadian defined benefit pension plan utilizes a liability driven investment strategy in its fixed income portfolio, which uses a combination of long duration bonds and derivatives to hedge interest rate risk, managed by the investment manager. At December 31, 2019, the plan's solvency funded position was 45% hedged against interest rate risk (2018 – 11%).
When investing in foreign securities, the plans are exposed to foreign currency risk; the effect of which is included in the valuation of the foreign securities. At December 31, 2019, the plans were 39% exposed to the U.S. dollar net of currency forwards (41% excluding the currency forwards), 6% exposed to the Euro, and 14% exposed to various other currencies. At December 31, 2018, the plans were 33% exposed to the U.S. dollar net of currency forwards (43% excluding the currency forwards), 4% exposed to the Euro, and 13% exposed to various other currencies.
At December 31, 2019, fund assets consisted primarily of listed stocks and bonds, including 119,758 of the Common Shares (2018 – 86,084) at a market value of $40 million (2018 – $21 million) and Unsecured Notes issued by the Company at a par value of $nil (2018 – $1 million) and a market value of $nil (2018 – $1 million).
Estimated future benefit payments
The estimated future DB pension and other benefit payments to be paid by the plans for each of the next five years and the subsequent five-year period are as follows:
| | | | | | | | | (in millions of Canadian dollars) | Pensions |
| Other benefits |
| | 2020 | $ | 620 |
| $ | 34 |
| | 2021 | 623 |
| 32 |
| | 2022 | 627 |
| 31 |
| | 2023 | 630 |
| 30 |
| | 2024 | 633 |
| 30 |
| | 2025 – 2029 | 3,203 |
| 144 |
|
The benefit payments from the Canadian registered and U.S. qualified DB pension plans are payable from their respective pension funds. Benefit payments from the supplemental pension plan and from the other benefits plans are payable directly from the Company.
Defined contribution plan
Canadian non-unionized employees hired prior to July 1, 2010 had the option to participate in the Canadian DC plan. All Canadian non-unionized employees hired after such date must participate in this plan. Employee contributions are based on a percentage of salary. The Company matches employee contributions to a maximum percentage each year.
Effective July 1, 2010, a new U.S. DC plan was established. All U.S. non-unionized employees hired after such date must participate in this plan. Employees do not contribute to the plan. The Company annually contributes a percentage of salary.
The DC plans provide a pension based on total employee, where appropriate, and employer contributions plus investment income earned on those contributions.
In 2019, the net cost of the DC plans, which generally equals the employer’s required contribution, was $11 million (2018 – $10 million; 2017 – $9 million).
Contributions to multi-employer plans
Some of the Company’s unionized employees in the U.S. are members of a U.S. national multi-employer benefit plan. Contributions made by the Company to this plan in 2019 in respect of post-retirement medical benefits were $3 million (2018 – $3 million; 2017 – $5 million).
24. Stock-based compensation
At December 31, 2019, the Company had several stock-based compensation plans including stock option plans, various cash-settled liability plans, and an employee share purchase plan. These plans resulted in an expense of $133 million in 2019 (2018 – $75 million; 2017 – $35 million).
Effective January 31, 2017, Mr. E. Hunter Harrison resigned from all positions held by him at the Company, including as the Company’s Chief Executive Officer and as a member of the Board of Directors of the Company. In connection with Mr. Harrison’s resignation, the Company entered into a separation agreement with Mr. Harrison. Under the terms of the separation agreement, the Company agreed to a limited waiver of Mr. Harrison’s non-competition and non-solicitation obligations.
Effective January 31, 2017, pursuant to the separation agreement, Mr. Harrison forfeited certain pension and post-retirement benefits and agreed to the surrender for cancellation of 22,514 PSUs, 68,612 DSUs, and 752,145 stock options. As a result of this agreement, the Company recognized a recovery of $51 million in "Compensation and benefits" in the first quarter of 2017. Of this amount, $27 million related to a recovery from cancellation of certain pension benefits.
CP 2019 ANNUAL REPORT/ 108
A. Stock option plan
The following table summarizes the Company’s stock option plan as at December 31, 2019:
| | | | | | | | | | | | | | Options outstanding | Non-vested options | | | Number of
options |
| Weighted-average
exercise price |
| Number of
options |
| Weighted-average
grant date
fair value |
| | Outstanding, January 1, 2019 | 1,533,598 |
| $ | 176.02 |
| 714,102 |
| $ | 48.94 |
| | Granted | 224,730 |
| $ | 269.99 |
| 224,730 |
| $ | 63.69 |
| | Exercised | (334,127 | ) | $ | 125.12 |
| N/A |
| N/A |
| | Vested | N/A |
| N/A |
| (169,193 | ) | $ | 47.59 |
| | Forfeited | (7,855 | ) | $ | 234.59 |
| (7,855 | ) | $ | 54.75 |
| | Outstanding, December 31, 2019 | 1,416,346 |
| $ | 199.12 |
| 761,784 |
| $ | 53.54 |
| Vested or expected to vest at December 31, 2019(1) | 1,385,626 |
| $ | 197.89 |
| N/A |
| N/A |
| | Exercisable, December 31, 2019 | 654,562 |
| $ | 162.59 |
| N/A |
| N/A |
|
(1) As at December 31, 2019, the weighted-average remaining term of vested or expected to vest options was 4.9 years with an aggregate intrinsic value of $184 million.
The following table provides the number ofgranted stock options outstanding and exercisable as at December 31, 2019 by range of exercise price and their related intrinsic aggregate value, and for options outstanding, the weighted-average years to expiration. The table also provides the aggregate intrinsic value for in-the-money stock options, which represents the amount that would have been received by option holders had they exercised their options on December 31, 2019 at the Company’s closing stock price of $331.03.
| | | | | | | | | | | | | | | | | | | | | Options outstanding | Options exercisable | | Range of exercise prices | Number of
options |
| Weighted-average
years to
expiration | Weighted-average
exercise
price |
| Aggregate
intrinsic
value
(millions) |
| Number of
options |
| Weighted-average
exercise
price |
| Aggregate
intrinsic
value
(millions) |
| | $51.17 – $167.50 | 354,357 |
| 4.1 | $ | 123.00 |
| $ | 74 |
| 303,455 |
| $ | 116.84 |
| $ | 65 |
| | $167.51 – $197.05 | 355,040 |
| 4.1 | $ | 188.53 |
| $ | 51 |
| 135,532 |
| $ | 175.30 |
| $ | 21 |
| | $197.06– $247.87 | 376,654 |
| 4.8 | $ | 222.75 |
| $ | 41 |
| 215,465 |
| $ | 218.98 |
| $ | 24 |
| | $247.88 – $313.16 | 330,295 |
| 5.9 | $ | 265.23 |
| $ | 22 |
| 110 |
| $ | 260.52 |
| $ | — |
| Total(1) | 1,416,346 |
| 4.7 | $ | 199.12 |
| $ | 187 |
| 654,562 |
| $ | 162.59 |
| $ | 110 |
|
(1) As at December 31, 2019, the total number of in-the-money stock options outstanding was 1,416,346 with a weighted-average exercise price of $199.12. The weighted-average years to expiration of exercisable stock options is 4.2 years.
Pursuant to the employee plan, options may be exercised upon vesting, which is between 12 months and 48 months after the grant date, and will expire after seven years. Certain stock options granted in 2019 and 2018 vest upon the achievement of specific performance criteria. Under the fair value method, the fair value of the stock options at grant date was approximately $14 million for options issued in 2019 (2018 – $16 million; 2017 – $17 million). The weighted-average fair value assumptions were approximately:
| | | | | | | | | | | | | 2019 |
| 2018 |
| 2017 |
| Expected option life (years)(1) | 5.00 |
| 5.00 |
| 5.48 |
| Risk-free interest rate(2) | 2.22 | % | 2.22 | % | 1.85 | % | Expected stock price volatility(3) | 25.04 | % | 24.81 | % | 26.94 | % | Expected annual dividends per share(4) | $ | 2.6191 |
| $ | 2.3854 |
| $ | 2.0010 |
| Expected forfeiture rate(5) | 6.05 | % | 4.70 | % | 2.80 | % | | Weighted-average grant date fair value of options granted during the year | $ | 63.69 |
| $ | 55.63 |
| $ | 45.78 |
|
(1) Represents the period of time that awards are expected to be outstanding. Historical data on exercise behaviour or, when available, specific expectations regarding future exercise behaviour were used to estimate the expected life of the option.
(2) Based on the implied yield available on zero-coupon government issues with an equivalent term commensurate with the expected term of the option.
(3) Based on the historical volatility of the Company’s stock price over a period commensurate with the expected term of the option.
(4) Determined by the current annual dividend at the time of grant. The Company does not employ different dividend yields throughout the contractual term of the option. On May 6, 2019, the Company announced an increase in its quarterly dividend to $0.8300 per share, representing $3.3200 on an annual basis.
(5) The Company estimates forfeitures based on past experience. The rate is monitored on a periodic basis.
In 2019, the expense for stock options (regular and performance) was $14 million (2018 – $10 million; 2017 – $3 million). At December 31, 2019, there was $14 million of total unrecognized compensation related to stock options which is expected to be recognized over a weighted-average period of approximately 1.3 years.
The total fair value of shares vested forunder the stock option plan during 2019 was $8 million (2018 – $11 million; 2017 – $14 million).
The following table provides information related to all options exercised in the stock option plan during the years ended December 31:plan.
| | | | | | | | | | | | (in millions of Canadian dollars) | 2019 |
| 2018 |
| 2017 |
| | Total intrinsic value | $ | 63 |
| $ | 17 |
| $ | 36 |
| | Cash received by the Company upon exercise of options | 26 |
| 24 |
| 45 |
|
B. Other share-based plans
Performance share unit plan
During 2019, the Company issued 134,260 PSUs with a grant date fair value of approximately $36 million. These units attract dividend equivalents in the form of additional units based on the dividends paid on the Company's Common Shares. PSUs vest and are settled in cash or in CP Common Shares, approximately three years after the grant date, contingent upon CP’s performance ("performance factor"). The fair value of these PSUs is measured periodically until settlement, using either a lattice-based valuation model or a Monte Carlo simulation model.
The performance period for 133,681 PSUs issued in 2019 is January 1, 2019 to December 31, 2021, and the performance factors for these PSUs are Return on Invested Capital ("ROIC"), Total Shareholder Return ("TSR") compared to the S&P/TSX 60 Index, and TSR compared to Class I railways. The performance factors for the remaining 579 PSUs are annual revenue for the fiscal year 2020, diluted earnings per share for the fiscal year 2020, and share price appreciation.
The performance period for 125,280 PSUs issued in 2018 is January 1, 2018 to December 31, 2020, and the performance factors for these PSUs are ROIC, TSR compared to the S&P/TSX Capped Industrial Index, and TSR compared to S&P 1500 Road and Rail Index. The performance factors for the remaining 36,975 PSUs are annual revenue for the fiscal year 2020, diluted earnings per share for the fiscal year 2020, and share price appreciation.
The performance period for PSUs issued in 2017 was January 1, 2017 to December 31, 2019, and the performance factors for these PSUs were ROIC, TSR compared to the S&P/TSX Capped Industrial Index, and TSR compared to S&P 1500 Road and Rail Index. The resulting estimated payout was 193% on 121,098 total outstanding awards representing a total fair value of $75 million at December 31, 2019, calculated using the Company's average share price using the last 30 trading days preceding December 31, 2019.
The performance period for PSUs issued in 2016 was January 1, 2016 to December 31, 2018, and the performance factors for these PSUs were Operating ratio, ROIC, TSR compared to the S&P/TSX 60 Index, and TSR compared to Class I railways. The resulting payout was 177% of the outstanding units multiplied by the Company's average share price that was calculated using the last 30 trading days preceding December 31, 2018. In the first quarter of 2019, payouts occurred on the total outstanding awards, including dividends reinvested, totalling $54 million on 117,228 outstanding awards.
The following table summarizes information related to the Company’s PSUs as at December 31:
| | | | | | | | 2019 |
| 2018 |
| | Outstanding, January 1 | 395,048 |
| 334,028 |
| | Granted | 134,260 |
| 162,255 |
| | Units, in lieu of dividends | 4,032 |
| 3,643 |
| | Settled | (117,228 | ) | (66,243 | ) | | Forfeited | (12,976 | ) | (38,635 | ) | | Outstanding, December 31 | 403,136 |
| 395,048 |
|
57
In 2019, the expense for PSUs was $89 million (2018 – $54 million; 2017 – $30 million). At December 31, 2019, there was $42 million of total unrecognized compensation related to PSUs which is expected to be recognized over a weighted-average period of approximately 1.5 years.
CP 2019 ANNUAL REPORT/ 110
Deferred share unit plan
The Company established the DSU plan as a means to compensate and assist in attaining share ownership targets set for certain key employees and Directors. A DSU entitles the holder to receive, upon redemption, a cash payment equivalent to the Company's average share price using the 10 trading days prior to redemption. DSUs vest over various periods of up to 48 months and are only redeemable for a specified period after employment is terminated.
Senior managers may elect to receive DSUs in lieu of annual bonus cash payments in the bonus deferral program. In addition, senior managers will be granted a 25% company match of DSUs when deferring cash to DSUs to meet ownership targets. The election to receive eligible payments in DSUs is no longer available to a participant when the value of the participant’s DSUs is sufficient to meet the Company’s stock ownership guidelines. Senior managers have five years to meet their ownership targets.
The expense for DSUs is recognized over the vesting period for both the initial subscription price and the change in value between reporting periods.
The following table summarizes information related to the DSUs as at December 31:
| | | | | | | | 2019 |
| 2018 |
| | Outstanding, January 1 | 152,760 |
| 156,547 |
| | Granted | 19,912 |
| 16,481 |
| | Units, in lieu of dividends | 1,608 |
| 1,551 |
| | Settled | (12,110 | ) | (20,072 | ) | | Forfeited | (951 | ) | (1,747 | ) | | Outstanding, December 31 | 161,219 |
| 152,760 |
|
During 2019, the Company granted 19,912 DSUs with a grant date fair value of approximately $5 million. In 2019, the expense for DSUs was $20 million (2018 – $4 million expense; 2017 – $3 million recovery). At December 31, 2019, there was $0.7 million of total unrecognized compensation related to DSUs which is expected to be recognized over a weighted-average period of approximately 1.2 years.
Summary of share-based liabilities paid
The following table summarizes the total share-based liabilities paid for each of the years ended December 31:
| | | | | | | | | | | | (in millions of Canadian dollars) | 2019 |
| 2018 |
| 2017 |
| | Plan | | | | | PSUs | $ | 54 |
| $ | 30 |
| $ | 31 |
| | DSUs | 4 |
| 6 |
| 6 |
| | Other | — |
| 1 |
| 2 |
| | Total | $ | 58 |
| $ | 37 |
| $ | 39 |
|
C. Employee share purchase plan
The Company has an employee share purchase plan whereby both employee and the Company contributions are used to purchase shares on the open market for employees. The Company’s contributions are expensed over the one year vesting period. Under the plan, the Company matches $1 for every $3 contributed by employees up to a maximum employee contribution of 6% of annual salary.
The total number of shares purchased in 2019 on behalf of participants, including the Company's contributions, was 137,942 (2018 – 118,865; 2017 – 130,041). In 2019, the Company’s contributions totalled $8 million (2018 – $6 million; 2017 – $5 million) and the related expense was $6 million (2018 – $5 million; 2017 – $4 million).
25. Variable interest entities
The Company leases equipment from certain trusts, which have been determined to be variable interest entities financed by a combination of debt and equity provided by unrelated third parties. The lease agreements, which are classified as operating leases, have fixed price purchase options which create the Company’s variable interests and result in the trusts being considered variable interest entities.
Maintaining and operating the leased assets according to specific contractual obligations outlined in the terms of the lease agreements and industry standards is the Company’s responsibility. The rigour of the contractual terms of the lease agreements and industry standards are such that the Company has limited discretion over the maintenance activities associated with these assets. As such, the Company concluded these terms do not provide the Company with the power to direct the activities of the variable interest entities in a way that has a significant impact on the entities’ economic performance.
The financial exposure to the Company as a result of its involvement with the variable interest entities is equal to the fixed lease payments due to the trusts. In 2019, lease payments after tax were $15 million. Future minimum lease payments, before tax, of $138 million will be payable over the next 11 years.
The Company does not guarantee the residual value of the assets to the lessor; however, it must deliver to the lessor the assets in good operating condition, subject to normal wear and tear, at the end of the lease term.
As the Company’s actions and decisions do not significantly affect the variable interest entities’ performance, and the Company’s fixed price purchase option is not considered to be potentially significant to the variable interest entities, the Company is not considered to be the primary beneficiary, and does not consolidate these variable interest entities.
Additionally, the Company is the sole beneficiary of an independent voting trust that holds 100% of the equity interest in CMQ U.S. The trust is governed by a single trustee who is responsible for all day-to-day decisions of CMQ U.S. The Company has no substantive participating or kick-out rights and therefore lacks the power to direct the activities of CMQ U.S. As a result, CMQ U.S. is considered to be a variable interest entity, however, the Company is not considered to be the primary beneficiary and, therefore, does not consolidate this variable interest entity.
26. Commitments and contingencies
In the normal course of its operations, the Company becomes involved in various legal actions, including claims relating to injuries and damage to property. The Company maintains provisions it considers to be adequate for such actions. While the final outcome with respect to actions outstanding or pending at December 31, 2019 cannot be predicted with certainty, it is the opinion of management that their resolution will not have a material adverse effect on the Company’s business, financial position or results of operations. However, an unexpected adverse resolution of one or more of these legal actions could have a material adverse effect on the Company's business, financial position, results of operations or liquidity in a particular quarter or fiscal year.
Commitments
At December 31, 2019, the Company had committed to total future capital expenditures amounting to $664 million and operating expenditures relating to supplier purchase obligations, such as locomotive maintenance and overhaul agreements, as well as agreements to purchase other goods and services amounting to approximately $3.1 billion for the years 2020–2032, of which CP estimates approximately $2.7 billion will be incurred in the next five years.
Commitments related to leases, including minimum annual payments for the next five years and thereafter, are included in Note 21.
Legal proceedings related to Lac-Mégantic rail accident
On July 6, 2013, a train carrying petroleum crude oil operated by Montréal Maine and Atlantic Railway (“MMAR”) or a subsidiary, Montréal Maine & Atlantic Canada Co. (“MMAC” and collectively the “MMA Group”), derailed in Lac-Mégantic, Québec. The derailment occurred on a section of railway owned and operated by the MMA Group and while the MMA Group had custody and control of the train.
Following the derailment, MMAC sought court protection in Canada under the Companies’ Creditors Arrangement Act and MMAR filed for bankruptcy in the U.S. Plans of arrangement were approved in both Canada and the U.S. (the “Plans”), providing for the distribution of approximately $440 million amongst those claiming derailment damages.
A number of legal proceedings, set out below, were commenced in Canada and the U.S. against CP and others:
| | (1) | Québec's Minister of Sustainable Development, Environment, Wildlife and Parks ordered various parties, including CP, to clean up the derailment site and served CP with a Notice of Claim for $95 million for those cleanup costs. CP appealed the cleanup order and contested the Notice of Claim with the Administrative Tribunal of Québec. These proceedings are stayed pending determination of the Attorney General of Québec (“AGQ”) action (paragraph 2 below).
|
| | (2) | The AGQ sued CP in the Québec Superior Court claiming $409 million in damages, which was amended and reduced to $315 million (the “AGQ Action”). The AGQ Action alleges that: (i) CP exercised custody or control over the petroleum crude oil until its delivery to Irving Oil and was negligent in that custody and control; and (ii) CP is vicariously liable for the acts and omissions of the MMA Group.
|
| | (3) | A class action in the Québec Superior Court on behalf of persons and entities residing in, owning or leasing property in, operating a business in, or physically present in Lac-Mégantic at the time of the derailment was certified against CP on May 8, 2015 (the "Class Action"). Other defendants including MMAC and, Mr. Thomas Harding ("Harding") were added to the Class Action on January 25, 2017. The Class Action seeks unquantified damages, including for wrongful death, personal injury, and property damage. |
| | (4) | NaN subrogated insurers sued CP in the Québec Superior Court claiming approximately $16 million in damages, which was amended and reduced to $14 million (the “Promutuel Action”), and 2 additional subrogated insurers sued CP claiming approximately $3 million in damages (the “Royal Action”). Both actions contain similar allegations as the AGQ Action. The actions do not identify the subrogated parties, and therefore overlap with the claims process under the Plans is unclear. The Royal Action is stayed pending determination of the consolidated proceedings described below.
|
On December 11, 2017, the AGQ Action, the Class Action and the Promutuel Action were consolidated. These consolidated claims are currently scheduled for a joint liability trial commencing September 28, 2020, followed by a damages trial, if necessary.
| | (5) | NaN plaintiffs (all individual claims joined in one action) sued CP, MMAC and Harding in the Québec Superior Court claiming approximately U.S. $5 million in damages for economic loss and pain and suffering, and asserting similar allegations as in the Class Action and the AGQ Action. The plaintiffs opted-out of the Class Action and all but two are also plaintiffs in litigation against CP, described in paragraph 7 below. This action is stayed pending determination of the consolidated claims described above.
|
| | (6) | The MMAR U.S. estate representative commenced an action against CP in November 2014 in the Maine Bankruptcy Court claiming that CP failed to abide by certain regulations and seeking damages for MMAR’s loss in business value (as yet unquantified). This action asserts that CP knew or ought to have known that the shipper misclassified the petroleum crude oil and therefore should have refused to transport it. |
| | (7) | The class and mass tort action commenced against CP in June 2015 in Texas (on behalf of Lac-Mégantic residents and wrongful death representatives) and the wrongful death and personal injury actions commenced against CP in June 2015 in Illinois and Maine, were all transferred and consolidated in |
CP 2019 ANNUAL REPORT/ 112
Federal District Court in Maine (the “Maine Actions”). The Maine Actions allege that CP negligently misclassified and improperly packaged the petroleum crude oil. On CP’s motion, the Maine Actions were dismissed. The plaintiffs are appealing the dismissal decision, which may be heard in April 2020.
| | (8) | The trustee for the wrongful death trust commenced Carmack Amendment claims against CP in North Dakota Federal Court, seeking to recover approximately U.S. $6 million for damaged rail cars and lost crude and reimbursement for the settlement paid by the consignor and the consignee under the Plans (alleged to be U.S. $110 million and U.S. $60 million, respectively). This action is scheduled for trial in August 2020.
|
At this stage of the proceedings, any potential responsibility and the quantum of potential losses cannot be determined. Nevertheless, CP denies liability and is vigorously defending these proceedings.
27. Guarantees
In the normal course of operating the railway, the Company enters into contractual arrangements that involve providing certain guarantees, which extend over the term of the contracts. These guarantees include, but are not limited to:
| | • | a guarantee to uphold an equity investee's credit facility of $19 million at December 31, 2019;
|
guarantees to pay other parties in the event of the occurrence of specified events, including damage to equipment, in relation to assets used in the operation of the railway through operating leases, rental agreements, easements, trackage, and interline agreements; and
indemnifications of certain tax-related payments incurred by lessors and lenders.
The maximum amount that could be payable under these guarantees, excluding residual value guarantees, cannot be reasonably estimated due to the nature of certain of these guarantees. All or a portion of amounts paid under guarantees to other parties in the event of the occurrence of specified events could be recoverable from other parties or through insurance. The Company has accrued for all guarantees that it expects to pay. At December 31, 2019, these accruals amounted to $10 million (2018 – $10 million), and are recorded in “Accounts payable and accrued liabilities".
Indemnifications
Pursuant to a trust and custodial services agreement with the trustee of the Canadian Pacific Railway Company Pension Plan, the Company has undertaken to indemnify and save harmless the trustee, to the extent not paid by the fund, from any and all taxes, claims, liabilities, damages, costs, and expenses arising out of the performance of the trustee’s obligations under the agreement, except as a result of misconduct by the trustee. The indemnity includes liabilities, costs, or expenses relating to any legal reporting or notification obligations of the trustee with respect to the defined benefit and defined contribution options of the pension plans, or otherwise with respect to the assets of the pension plans that are not part of the fund. The indemnity survives the termination or expiry of the agreement with respect to claims and liabilities arising prior to the termination or expiry.
Pursuant to the voting trust agreement executed as part of the CMQ U.S. acquisition, the Company has undertaken to indemnify and save harmless the trustee from any loss, cost, or expense in connection with the independent voting trust and any suit or litigation, except as a result of willful misconduct or gross negligence by the trustee.
At December 31, 2019, the Company had not recorded any liabilities associated with the above indemnifications, as it does not expect to make any payments pertaining to them.
28. Segmented and geographic information
Operating segment
The Company operates in only 1 operating segment: rail transportation. Operating results by geographic areas, railway corridors, or other lower-level components or units of operation are not reviewed by the Company’s chief operating decision-maker to make decisions about the allocation of resources to, or the assessment of performance of, such geographic areas, corridors, components, or units of operation.
In the years ended December 31, 2019, 2018, and 2017, no one customer comprised more than 10% of total revenues and accounts receivable.
Geographic information
| | | | | | | | | | | | (in millions of Canadian dollars) | Canada |
| United States |
| Total |
| | 2019 | | | | | Revenues | $ | 5,675 |
| $ | 2,117 |
| $ | 7,792 |
| | Long-term assets excluding financial instruments and pension assets | 13,131 |
| 7,020 |
| 20,151 |
| | 2018 | | | | | Revenues | 5,232 |
| 2,084 |
| 7,316 |
| | Long-term assets excluding financial instruments and pension assets | 12,133 |
| 6,759 |
| 18,892 |
| | 2017 | | | | | Revenues | 4,667 |
| 1,887 |
| 6,554 |
| | Long-term assets excluding financial instruments and pension assets | 11,505 |
| 5,947 |
| 17,452 |
|
29. Selected quarterly data (unaudited)
| | | | | | | | | | | | | | | | | | | | | | | | | | | For the quarter ended | 2019 | 2018 | | (in millions of Canadian dollars, except per share data) | Dec. 31 |
| Sep. 30 |
| Jun. 30 |
| Mar. 31 |
| Dec. 31 |
| Sep. 30 |
| Jun. 30 |
| Mar. 31 |
| | Total revenues | $ | 2,069 |
| $ | 1,979 |
| $ | 1,977 |
| $ | 1,767 |
| $ | 2,006 |
| $ | 1,898 |
| $ | 1,750 |
| $ | 1,662 |
| | Operating income | 890 |
| 869 |
| 822 |
| 543 |
| 874 |
| 790 |
| 627 |
| 540 |
| | Net income | 664 |
| 618 |
| 724 |
| 434 |
| 545 |
| 622 |
| 436 |
| 348 |
| Basic earnings per share(1) | $ | 4.84 |
| $ | 4.47 |
| $ | 5.19 |
| $ | 3.10 |
| $ | 3.84 |
| $ | 4.36 |
| $ | 3.05 |
| $ | 2.41 |
| Diluted earnings per share(1) | 4.82 |
| 4.46 |
| 5.17 |
| 3.09 |
| 3.83 |
| 4.35 |
| 3.04 |
| 2.41 |
|
(1) Earnings per share for the four quarters combined may not equal earnings per share for the year due to rounding.
30. Condensed consolidating financial information
Canadian Pacific Railway Company, a 100%-owned subsidiary of CPRL, is the issuer of certain debt securities, which are fully and unconditionally guaranteed by CPRL. The following tables present condensed consolidating financial information (“CCFI”) in accordance with Rule 3-10(c) of Regulation S-X.
Investments in subsidiaries are accounted for under the equity method when presenting the CCFI.
The tables include all adjustments necessary to reconcile the CCFI on a consolidated basis to CPRL’s Consolidated Financial Statements for the years presented.
CP 2019 ANNUAL REPORT/ 114
CONDENSED CONSOLIDATING STATEMENTS OF INCOME
YEAR ENDED DECEMBER 31, 2019
| | | | | | | | | | | | | | | | | | (in millions of Canadian dollars) | CPRL (Parent Guarantor) |
| CPRC (Subsidiary Issuer) |
| Non-Guarantor Subsidiaries |
| Consolidating Adjustments and Eliminations |
| CPRL Consolidated |
| | Revenues | | | | | | | Freight | $ | — |
| $ | 5,527 |
| $ | 2,084 |
| $ | 2 |
| $ | 7,613 |
| | Non-freight | — |
| 135 |
| 570 |
| (526 | ) | 179 |
| | Total revenues | — |
| 5,662 |
| 2,654 |
| (524 | ) | 7,792 |
| | Operating expenses | | | | | | | Compensation and benefits | — |
| 1,042 |
| 490 |
| 8 |
| 1,540 |
| | Fuel | — |
| 695 |
| 187 |
| — |
| 882 |
| | Materials | — |
| 142 |
| 53 |
| 15 |
| 210 |
| | Equipment rents | — |
| 177 |
| (9 | ) | (31 | ) | 137 |
| | Depreciation and amortization | — |
| 423 |
| 283 |
| — |
| 706 |
| | Purchased services and other | — |
| 967 |
| 742 |
| (516 | ) | 1,193 |
| | Total operating expenses | — |
| 3,446 |
| 1,746 |
| (524 | ) | 4,668 |
| | Operating income | — |
| 2,216 |
| 908 |
| — |
| 3,124 |
| | Less: | | | | | | | Other (income) expense | (12 | ) | (86 | ) | 9 |
| — |
| (89 | ) | | Other components of net periodic benefit (recovery) cost | — |
| (388 | ) | 7 |
| — |
| (381 | ) | | Net interest (income) expense | (1 | ) | 474 |
| (25 | ) | — |
| 448 |
| | Income before income tax expense and equity in net earnings of subsidiaries | 13 |
| 2,216 |
| 917 |
| — |
| 3,146 |
| | Less: Income tax expense | 3 |
| 522 |
| 181 |
| — |
| 706 |
| | Add: Equity in net earnings of subsidiaries | 2,430 |
| 736 |
| — |
| (3,166 | ) | — |
| | Net income | $ | 2,440 |
| $ | 2,430 |
| $ | 736 |
| $ | (3,166 | ) | $ | 2,440 |
|
CONDENSED CONSOLIDATING STATEMENTS OF INCOME
YEAR ENDED DECEMBER 31, 2018
| | | | | | | | | | | | | | | | | | (in millions of Canadian dollars) | CPRL (Parent Guarantor) |
| CPRC (Subsidiary Issuer) |
| Non-Guarantor Subsidiaries |
| Consolidating Adjustments and Eliminations |
| CPRL Consolidated |
| | Revenues | | | | | | | Freight | $ | — |
| $ | 5,098 |
| $ | 2,054 |
| $ | — |
| $ | 7,152 |
| | Non-freight | — |
| 120 |
| 361 |
| (317 | ) | 164 |
| | Total revenues | — |
| 5,218 |
| 2,415 |
| (317 | ) | 7,316 |
| | Operating expenses | | | | | | | Compensation and benefits | — |
| 996 |
| 466 |
| 6 |
| 1,468 |
| | Fuel | — |
| 716 |
| 202 |
| — |
| 918 |
| | Materials | — |
| 139 |
| 49 |
| 13 |
| 201 |
| | Equipment rents | — |
| 137 |
| (7 | ) | — |
| 130 |
| | Depreciation and amortization | — |
| 424 |
| 272 |
| — |
| 696 |
| | Purchased services and other | — |
| 886 |
| 522 |
| (336 | ) | 1,072 |
| | Total operating expenses | — |
| 3,298 |
| 1,504 |
| (317 | ) | 4,485 |
| | Operating income | — |
| 1,920 |
| 911 |
| — |
| 2,831 |
| | Less: | | | | | | | Other expense (income) | 19 |
| 193 |
| (38 | ) | — |
| 174 |
| | Other components of net periodic benefit (recovery) cost | — |
| (386 | ) | 2 |
| — |
| (384 | ) | | Net interest expense (income) | 3 |
| 478 |
| (28 | ) | — |
| 453 |
| | (Loss) income before income tax (recovery) expense and equity in net earnings of subsidiaries | (22 | ) | 1,635 |
| 975 |
| — |
| 2,588 |
| | Less: Income tax (recovery) expense | (4 | ) | 469 |
| 172 |
| — |
| 637 |
| | Add: Equity in net earnings of subsidiaries | 1,969 |
| 803 |
| — |
| (2,772 | ) | — |
| | Net income | $ | 1,951 |
| $ | 1,969 |
| $ | 803 |
| $ | (2,772 | ) | $ | 1,951 |
|
CP 2019 ANNUAL REPORT/ 116
CONDENSED CONSOLIDATING STATEMENTS OF INCOME
YEAR ENDED DECEMBER 31, 2017
| | | | | | | | | | | | | | | | | | (in millions of Canadian dollars) | CPRL (Parent Guarantor) |
| CPRC (Subsidiary Issuer) |
| Non-Guarantor Subsidiaries |
| Consolidating Adjustments and Eliminations |
| CPRL Consolidated |
| | Revenues | | | | | | | Freight | $ | — |
| $ | 4,516 |
| $ | 1,859 |
| $ | — |
| $ | 6,375 |
| | Non-freight | — |
| 140 |
| 372 |
| (333 | ) | 179 |
| | Total revenues | — |
| 4,656 |
| 2,231 |
| (333 | ) | 6,554 |
| | Operating expenses | | | | | | | Compensation and benefits | — |
| 879 |
| 423 |
| 7 |
| 1,309 |
| | Fuel | — |
| 522 |
| 155 |
| — |
| 677 |
| | Materials | — |
| 134 |
| 41 |
| 15 |
| 190 |
| | Equipment rents | — |
| 143 |
| (1 | ) | — |
| 142 |
| | Depreciation and amortization | — |
| 400 |
| 261 |
| — |
| 661 |
| | Purchased services and other | — |
| 826 |
| 585 |
| (355 | ) | 1,056 |
| | Total operating expenses | — |
| 2,904 |
| 1,464 |
| (333 | ) | 4,035 |
| | Operating income | — |
| 1,752 |
| 767 |
| — |
| 2,519 |
| | Less: | | | | | | | Other (income) expense | (33 | ) | (149 | ) | 4 |
| — |
| (178 | ) | | Other components of net periodic benefit (recovery) cost | — |
| (278 | ) | 4 |
| — |
| (274 | ) | | Net interest (income) expense | (12 | ) | 517 |
| (32 | ) | — |
| 473 |
| | Income before income tax expense (recovery) and equity in net earnings of subsidiaries | 45 |
| 1,662 |
| 791 |
| — |
| 2,498 |
| | Less: Income tax expense (recovery) | 7 |
| 475 |
| (389 | ) | — |
| 93 |
| | Add: Equity in net earnings of subsidiaries | 2,367 |
| 1,180 |
| — |
| (3,547 | ) | — |
| | Net income | $ | 2,405 |
| $ | 2,367 |
| $ | 1,180 |
| $ | (3,547 | ) | $ | 2,405 |
|
CONDENSED CONSOLIDATING STATEMENTS OF COMPREHENSIVE INCOME
YEAR ENDED DECEMBER 31, 2019
| | | | | | | | | | | | | | | | | | (in millions of Canadian dollars) | CPRL (Parent Guarantor) |
| CPRC (Subsidiary Issuer) |
| Non-Guarantor Subsidiaries |
| Consolidating Adjustments and Eliminations |
| CPRL Consolidated |
| | Net income | $ | 2,440 |
| $ | 2,430 |
| $ | 736 |
| $ | (3,166 | ) | $ | 2,440 |
| | Net gain (loss) in foreign currency translation adjustments, net of hedging activities | — |
| 288 |
| (251 | ) | — |
| 37 |
| | Change in derivatives designated as cash flow hedges | — |
| 10 |
| — |
| — |
| 10 |
| Change in pension and post-retirement defined
benefit plans | — |
| (651 | ) | (10 | ) | — |
| (661 | ) | | Other comprehensive loss before income taxes | — |
| (353 | ) | (261 | ) | — |
| (614 | ) | | Income tax recovery on above items | — |
| 132 |
| 3 |
| — |
| 135 |
| | Equity accounted investments | (479 | ) | (258 | ) | — |
| 737 |
| — |
| | Other comprehensive loss | (479 | ) | (479 | ) | (258 | ) | 737 |
| (479 | ) | | Comprehensive income | $ | 1,961 |
| $ | 1,951 |
| $ | 478 |
| $ | (2,429 | ) | $ | 1,961 |
|
CONDENSED CONSOLIDATING STATEMENTS OF COMPREHENSIVE INCOME
YEAR ENDED DECEMBER 31, 2018
| | | | | | | | | | | | | | | | | | (in millions of Canadian dollars) | CPRL (Parent Guarantor) |
| CPRC (Subsidiary Issuer) |
| Non-Guarantor Subsidiaries |
| Consolidating Adjustments and Eliminations |
| CPRL Consolidated |
| | Net income | $ | 1,951 |
| $ | 1,969 |
| $ | 803 |
| $ | (2,772 | ) | $ | 1,951 |
| | Net (loss) gain in foreign currency translation adjustments, net of hedging activities | — |
| (479 | ) | 419 |
| — |
| (60 | ) | | Change in derivatives designated as cash flow hedges | — |
| 38 |
| — |
| — |
| 38 |
| Change in pension and post-retirement defined
benefit plans | — |
| (455 | ) | 6 |
| — |
| (449 | ) | | Other comprehensive (loss) income before income taxes | — |
| (896 | ) | 425 |
| — |
| (471 | ) | | Income tax recovery (expense) on above items | — |
| 171 |
| (2 | ) | — |
| 169 |
| | Equity accounted investments | (302 | ) | 423 |
| — |
| (121 | ) | — |
| | Other comprehensive (loss) income | (302 | ) | (302 | ) | 423 |
| (121 | ) | (302 | ) | | Comprehensive income | $ | 1,649 |
| $ | 1,667 |
| $ | 1,226 |
| $ | (2,893 | ) | $ | 1,649 |
|
CP 2019 ANNUAL REPORT/ 118
CONDENSED CONSOLIDATING STATEMENTS OF COMPREHENSIVE INCOME
YEAR ENDED DECEMBER 31, 2017
| | | | | | | | | | | | | | | | | | (in millions of Canadian dollars) | CPRL (Parent Guarantor) |
| CPRC (Subsidiary Issuer) |
| Non-Guarantor Subsidiaries |
| Consolidating Adjustments and Eliminations |
| CPRL Consolidated |
| | Net income | $ | 2,405 |
| $ | 2,367 |
| $ | 1,180 |
| $ | (3,547 | ) | $ | 2,405 |
| | Net gain (loss) in foreign currency translation adjustments, net of hedging activities | — |
| 318 |
| (294 | ) | — |
| 24 |
| | Change in derivatives designated as cash flow hedges | — |
| 19 |
| — |
| — |
| 19 |
| Change in pension and post-retirement defined
benefit plans | — |
| 82 |
| (2 | ) | — |
| 80 |
| | Other comprehensive income (loss) before income taxes | — |
| 419 |
| (296 | ) | — |
| 123 |
| | Income tax (expense) recovery on above items | — |
| (66 | ) | 1 |
| — |
| (65 | ) | | Equity accounted investments | 58 |
| (295 | ) | — |
| 237 |
| — |
| | Other comprehensive income (loss) | 58 |
| 58 |
| (295 | ) | 237 |
| 58 |
| | Comprehensive income | $ | 2,463 |
| $ | 2,425 |
| $ | 885 |
| $ | (3,310 | ) | $ | 2,463 |
|
CONDENSED CONSOLIDATING BALANCE SHEETS
AS AT DECEMBER 31, 2019
| | | | | | | | | | | | | | | | | | (in millions of Canadian dollars) | CPRL (Parent Guarantor) |
| CPRC (Subsidiary Issuer) |
| Non-Guarantor Subsidiaries |
| Consolidating Adjustments and Eliminations |
| CPRL Consolidated |
| | Assets | | | | | | | Current assets | | | | | | | Cash and cash equivalents | $ | — |
| $ | 37 |
| $ | 96 |
| $ | — |
| $ | 133 |
| | Accounts receivable, net | 24 |
| 597 |
| 184 |
| — |
| 805 |
| | Accounts receivable, intercompany | 164 |
| 313 |
| 249 |
| (726 | ) | — |
| | Short-term advances to affiliates | — |
| 1,387 |
| 3,700 |
| (5,087 | ) | — |
| | Materials and supplies | — |
| 144 |
| 38 |
| — |
| 182 |
| | Other current assets | — |
| 41 |
| 49 |
| — |
| 90 |
| | | 188 |
| 2,519 |
| 4,316 |
| (5,813 | ) | 1,210 |
| | Long-term advances to affiliates | 1,090 |
| 7 |
| 84 |
| (1,181 | ) | — |
| | Investments | — |
| 32 |
| 309 |
| — |
| 341 |
| | Investments in subsidiaries | 10,522 |
| 11,165 |
| — |
| (21,687 | ) | — |
| | Properties | — |
| 10,287 |
| 8,869 |
| — |
| 19,156 |
| | Goodwill and intangible assets | — |
| — |
| 206 |
| — |
| 206 |
| | Pension asset | — |
| 1,003 |
| — |
| — |
| 1,003 |
| | Other assets | — |
| 173 |
| 278 |
| — |
| 451 |
| | Deferred income taxes | 4 |
| — |
| — |
| (4 | ) | — |
| | Total assets | $ | 11,804 |
| $ | 25,186 |
| $ | 14,062 |
| $ | (28,685 | ) | $ | 22,367 |
| | Liabilities and shareholders’ equity | | | | | | | Current liabilities | | | | | | | Accounts payable and accrued liabilities | $ | 146 |
| $ | 1,189 |
| $ | 358 |
| $ | — |
| $ | 1,693 |
| | Accounts payable, intercompany | 6 |
| 402 |
| 318 |
| (726 | ) | — |
| | Short-term advances from affiliates | 4,583 |
| 490 |
| 14 |
| (5,087 | ) | — |
| | Long-term debt maturing within one year | — |
| 548 |
| 51 |
| — |
| 599 |
| | | 4,735 |
| 2,629 |
| 741 |
| (5,813 | ) | 2,292 |
| | Pension and other benefit liabilities | — |
| 698 |
| 87 |
| — |
| 785 |
| | Long-term advances from affiliates | — |
| 1,174 |
| 7 |
| (1,181 | ) | — |
| | Other long-term liabilities | — |
| 206 |
| 356 |
| — |
| 562 |
| | Long-term debt | — |
| 8,145 |
| 13 |
| — |
| 8,158 |
| | Deferred income taxes | — |
| 1,812 |
| 1,693 |
| (4 | ) | 3,501 |
| | Total liabilities | 4,735 |
| 14,664 |
| 2,897 |
| (6,998 | ) | 15,298 |
| | Shareholders’ equity | | | | | | | Share capital | 1,993 |
| 538 |
| 4,610 |
| (5,148 | ) | 1,993 |
| | Additional paid-in capital | 48 |
| 406 |
| 265 |
| (671 | ) | 48 |
| | Accumulated other comprehensive (loss) income | (2,522 | ) | (2,522 | ) | 581 |
| 1,941 |
| (2,522 | ) | | Retained earnings | 7,550 |
| 12,100 |
| 5,709 |
| (17,809 | ) | 7,550 |
| | | 7,069 |
| 10,522 |
| 11,165 |
| (21,687 | ) | 7,069 |
| | Total liabilities and shareholders’ equity | $ | 11,804 |
| $ | 25,186 |
| $ | 14,062 |
| $ | (28,685 | ) | $ | 22,367 |
|
CP 2019 ANNUAL REPORT/ 120
CONDENSED CONSOLIDATING BALANCE SHEETS
AS AT DECEMBER 31, 2018
| | | | | | | | | | | | | | | | | | (in millions of Canadian dollars) | CPRL (Parent Guarantor) |
| CPRC (Subsidiary Issuer) |
| Non-Guarantor Subsidiaries |
| Consolidating Adjustments and Eliminations |
| CPRL Consolidated |
| | Assets | | | | | | | Current assets | | | | | | | Cash and cash equivalents | $ | — |
| $ | 42 |
| $ | 19 |
| $ | — |
| $ | 61 |
| | Accounts receivable, net | — |
| 629 |
| 186 |
| — |
| 815 |
| | Accounts receivable, intercompany | 125 |
| 167 |
| 224 |
| (516 | ) | — |
| | Short-term advances to affiliates | — |
| 1,602 |
| 4,651 |
| (6,253 | ) | — |
| | Materials and supplies | — |
| 136 |
| 37 |
| — |
| 173 |
| | Other current assets | — |
| 39 |
| 29 |
| — |
| 68 |
| | | 125 |
| 2,615 |
| 5,146 |
| (6,769 | ) | 1,117 |
| | Long-term advances to affiliates | 1,090 |
| 5 |
| 93 |
| (1,188 | ) | — |
| | Investments | — |
| 24 |
| 179 |
| — |
| 203 |
| | Investments in subsidiaries | 11,443 |
| 12,003 |
| — |
| (23,446 | ) | — |
| | Properties | — |
| 9,579 |
| 8,839 |
| — |
| 18,418 |
| | Goodwill and intangible assets | — |
| — |
| 202 |
| — |
| 202 |
| | Pension asset | — |
| 1,243 |
| — |
| — |
| 1,243 |
| | Other assets | — |
| 57 |
| 14 |
| — |
| 71 |
| | Deferred income taxes | 6 |
| — |
| — |
| (6 | ) | — |
| | Total assets | $ | 12,664 |
| $ | 25,526 |
| $ | 14,473 |
| $ | (31,409 | ) | $ | 21,254 |
| | Liabilities and shareholders’ equity | | | | | | | Current liabilities | | | | | | | Accounts payable and accrued liabilities | $ | 115 |
| $ | 1,017 |
| $ | 317 |
| $ | — |
| $ | 1,449 |
| | Accounts payable, intercompany | 4 |
| 344 |
| 168 |
| (516 | ) | — |
| | Short-term advances from affiliates | 5,909 |
| 341 |
| 3 |
| (6,253 | ) | — |
| | Long-term debt maturing within one year | — |
| 506 |
| — |
| — |
| 506 |
| | | 6,028 |
| 2,208 |
| 488 |
| (6,769 | ) | 1,955 |
| | Pension and other benefit liabilities | — |
| 639 |
| 79 |
| — |
| 718 |
| | Long-term advances from affiliates | — |
| 1,182 |
| 6 |
| (1,188 | ) | — |
| | Other long-term liabilities | — |
| 120 |
| 117 |
| — |
| 237 |
| | Long-term debt | — |
| 8,135 |
| 55 |
| — |
| 8,190 |
| | Deferred income taxes | — |
| 1,799 |
| 1,725 |
| (6 | ) | 3,518 |
| | Total liabilities | 6,028 |
| 14,083 |
| 2,470 |
| (7,963 | ) | 14,618 |
| | Shareholders’ equity | | | | | | | Share capital | 2,002 |
| 538 |
| 5,946 |
| (6,484 | ) | 2,002 |
| | Additional paid-in capital | 42 |
| 1,656 |
| 92 |
| (1,748 | ) | 42 |
| | Accumulated other comprehensive (loss) income | (2,043 | ) | (2,043 | ) | 839 |
| 1,204 |
| (2,043 | ) | | Retained earnings | 6,635 |
| 11,292 |
| 5,126 |
| (16,418 | ) | 6,635 |
| | | 6,636 |
| 11,443 |
| 12,003 |
| (23,446 | ) | 6,636 |
| | Total liabilities and shareholders’ equity | $ | 12,664 |
| $ | 25,526 |
| $ | 14,473 |
| $ | (31,409 | ) | $ | 21,254 |
|
CONDENSED CONSOLIDATING STATEMENTS OF CASH FLOWS
YEAR ENDED DECEMBER 31, 2019
| | | | | | | | | | | | | | | | | | (in millions of Canadian dollars) | CPRL (Parent Guarantor) |
| CPRC (Subsidiary Issuer) |
| Non-Guarantor Subsidiaries |
| Consolidating Adjustments and Eliminations |
| CPRL Consolidated |
| | Cash provided by operating activities | $ | 1,601 |
| $ | 2,133 |
| $ | 1,026 |
| $ | (1,770 | ) | $ | 2,990 |
| | Investing activities | | | | | | | Additions to properties | — |
| (1,243 | ) | (404 | ) | — |
| (1,647 | ) | | Investment in Central Maine & Québec Railway | — |
| (47 | ) | (127 | ) | — |
| (174 | ) | | Proceeds from sale of properties and other assets | — |
| 21 |
| 5 |
| — |
| 26 |
| | Advances to affiliates | — |
| (263 | ) | (396 | ) | 659 |
| — |
| | Repayment of advances to affiliates | — |
| 468 |
| 1,350 |
| (1,818 | ) | — |
| | Capital contributions to affiliates | — |
| (125 | ) | — |
| 125 |
| — |
| | Repurchase of share capital from affiliates | 1,246 |
| 1,345 |
| — |
| (2,591 | ) | — |
| | Other | — |
| 1 |
| (9 | ) | — |
| (8 | ) | | Cash provided by (used in) investing activities | 1,246 |
| 157 |
| 419 |
| (3,625 | ) | (1,803 | ) | | Financing activities | | | | | | | Dividends paid | (412 | ) | (1,612 | ) | (158 | ) | 1,770 |
| (412 | ) | | Issuance of share capital | — |
| — |
| 125 |
| (125 | ) | — |
| | Return of share capital to affiliates | — |
| (1,246 | ) | (1,345 | ) | 2,591 |
| — |
| | Issuance of CP Common Shares | 26 |
| — |
| — |
| — |
| 26 |
| | Purchase of CP Common Shares | (1,132 | ) | (2 | ) | — |
| — |
| (1,134 | ) | | Issuance of long-term debt, excluding commercial paper | — |
| 397 |
| — |
| — |
| 397 |
| | Repayment of long-term debt, excluding commercial paper | — |
| (500 | ) | — |
| — |
| (500 | ) | | Net issuance of commercial paper | — |
| 524 |
| — |
| — |
| 524 |
| | Advances from affiliates | 495 |
| 151 |
| 13 |
| (659 | ) | — |
| | Repayment of advances from affiliates | (1,813 | ) | (5 | ) | — |
| 1,818 |
| — |
| | Other | (11 | ) | (1 | ) | — |
| — |
| (12 | ) | | Cash used in financing activities | (2,847 | ) | (2,294 | ) | (1,365 | ) | 5,395 |
| (1,111 | ) | | Effect of foreign currency fluctuations on U.S. dollar-denominated cash and cash equivalents | — |
| (1 | ) | (3 | ) | — |
| (4 | ) | | Cash position | | | | | | | (Decrease) increase in cash and cash equivalents | — |
| (5 | ) | 77 |
| — |
| 72 |
| | Cash and cash equivalents at beginning of year | — |
| 42 |
| 19 |
| — |
| 61 |
| | Cash and cash equivalents at end of year | $ | — |
| $ | 37 |
| $ | 96 |
| $ | — |
| $ | 133 |
|
CP 2019 ANNUAL REPORT/ 122
CONDENSED CONSOLIDATING STATEMENTS OF CASH FLOWS
YEAR ENDED DECEMBER 31, 2018
| | | | | | | | | | | | | | | | | | (in millions of Canadian dollars) | CPRL (Parent Guarantor) |
| CPRC (Subsidiary Issuer) |
| Non-Guarantor Subsidiaries |
| Consolidating Adjustments and Eliminations |
| CPRL Consolidated |
| | Cash provided by operating activities | $ | 316 |
| $ | 1,968 |
| $ | 1,128 |
| $ | (700 | ) | $ | 2,712 |
| | Investing activities | | | | | | | Additions to properties | — |
| (971 | ) | (580 | ) | — |
| (1,551 | ) | | Proceeds from sale of properties and other assets | — |
| 35 |
| 43 |
| — |
| 78 |
| | Advances to affiliates | — |
| (611 | ) | (209 | ) | 820 |
| — |
| | Repayment of advances to affiliates | — |
| — |
| 866 |
| (866 | ) | — |
| | Repurchase of share capital from affiliates | 500 |
| 964 |
| — |
| (1,464 | ) | — |
| | Other | — |
| 18 |
| (3 | ) | — |
| 15 |
| | Cash provided by (used in) investing activities | 500 |
| (565 | ) | 117 |
| (1,510 | ) | (1,458 | ) | | Financing activities | | | | | | | Dividends paid | (348 | ) | (348 | ) | (352 | ) | 700 |
| (348 | ) | | Return of share capital to affiliates | — |
| (500 | ) | (964 | ) | 1,464 |
| — |
| | Issuance of CP Common Shares | 24 |
| — |
| — |
| — |
| 24 |
| | Purchase of CP Common Shares | (1,103 | ) | — |
| — |
| — |
| (1,103 | ) | | Issuance of long-term debt, excluding commercial paper | — |
| 638 |
| — |
| — |
| 638 |
| | Repayment of long-term debt, excluding commercial paper | — |
| (753 | ) | — |
| — |
| (753 | ) | | Advances from affiliates | 820 |
| — |
| — |
| (820 | ) | — |
| | Repayment of advances from affiliates | (209 | ) | (657 | ) | — |
| 866 |
| — |
| | Cash used in financing activities | (816 | ) | (1,620 | ) | (1,316 | ) | 2,210 |
| (1,542 | ) | | Effect of foreign currency fluctuations on U.S. dollar-denominated cash and cash equivalents | — |
| 18 |
| (7 | ) | — |
| 11 |
| | Cash position | | | | | | | Decrease in cash and cash equivalents | — |
| (199 | ) | (78 | ) | — |
| (277 | ) | | Cash and cash equivalents at beginning of year | — |
| 241 |
| 97 |
| — |
| 338 |
| | Cash and cash equivalents at end of year | $ | — |
| $ | 42 |
| $ | 19 |
| $ | — |
| $ | 61 |
|
CONDENSED CONSOLIDATING STATEMENTS OF CASH FLOWS
YEAR ENDED DECEMBER 31, 2017
| | | | | | | | | | | | | | | | | | (in millions of Canadian dollars) | CPRL (Parent Guarantor) |
| CPRC (Subsidiary Issuer) |
| Non-Guarantor Subsidiaries |
| Consolidating Adjustments and Eliminations |
| CPRL Consolidated |
| | Cash provided by operating activities | $ | 338 |
| $ | 1,334 |
| $ | 989 |
| $ | (479 | ) | $ | 2,182 |
| | Investing activities | | | | | | | Additions to properties | — |
| (950 | ) | (390 | ) | — |
| (1,340 | ) | | Proceeds from sale of properties and other assets | — |
| 29 |
| 13 |
| — |
| 42 |
| | Advances to affiliates | (590 | ) | (550 | ) | (1,528 | ) | 2,668 |
| — |
| | Repayment of advances to affiliates | — |
| 242 |
| 243 |
| (485 | ) | — |
| | Capital contributions to affiliates | — |
| (1,039 | ) | — |
| 1,039 |
| — |
| | Repurchase of share capital from affiliates | — |
| 156 |
| — |
| (156 | ) | — |
| | Other | — |
| 5 |
| (2 | ) | — |
| 3 |
| | Cash used in investing activities | (590 | ) | (2,107 | ) | (1,664 | ) | 3,066 |
| (1,295 | ) | | Financing activities | | | | | | | Dividends paid | (310 | ) | (310 | ) | (169 | ) | 479 |
| (310 | ) | | Issuance of share capital | — |
| — |
| 1,039 |
| (1,039 | ) | — |
| | Return of share capital to affiliates | — |
| — |
| (156 | ) | 156 |
| — |
| | Issuance of CP Common Shares | 45 |
| — |
| — |
| — |
| 45 |
| | Purchase of CP Common Shares | (381 | ) | — |
| — |
| — |
| (381 | ) | | Repayment of long-term debt, excluding commercial paper | — |
| (32 | ) | — |
| — |
| (32 | ) | | Advances from affiliates | 1,383 |
| 1,285 |
| — |
| (2,668 | ) | — |
| | Repayment of advances from affiliates | (485 | ) | — |
| — |
| 485 |
| — |
| | Settlement of forward starting swaps | — |
| (22 | ) | — |
| — |
| (22 | ) | | Cash provided by (used in) financing activities | 252 |
| 921 |
| 714 |
| (2,587 | ) | (700 | ) | | Effect of foreign currency fluctuations on U.S. dollar-denominated cash and cash equivalents | — |
| (7 | ) | (6 | ) | — |
| (13 | ) | | Cash position | | | | | | | Increase in cash and cash equivalents | — |
| 141 |
| 33 |
| — |
| 174 |
| | Cash and cash equivalents at beginning of year | — |
| 100 |
| 64 |
| — |
| 164 |
| | Cash and cash equivalents at end of year | $ | — |
| $ | 241 |
| $ | 97 |
| $ | — |
| $ | 338 |
|
CP 2019 ANNUAL REPORT/ 124
ITEM 9. CHANGES IN AND DISAGREEMENTS WITH ACCOUNTANTS ON ACCOUNTING AND FINANCIAL DISCLOSURE
None.
ITEM 9A. CONTROLS AND PROCEDURES
Evaluation of Disclosure Controls and Procedures
As of December 31, 2019, an evaluation was carried out under the supervision of and with the participation of CP's management, including CEO and CFO, of the effectiveness of the design and operation of the Company's disclosure controls and procedures as defined in Rules 13a-15(e) and 15d-15(e) of the Exchange Act. Based on that evaluation, the CEO and CFO concluded that these disclosure controls and procedures were effective as of December 31, 2019, to ensure that information required to be disclosed by the Company in reports that they file or submit under the Exchange Act is (i) recorded, processed, summarized and reported within the time periods specified by the SEC rules and forms and (ii) accumulated and communicated to the Company’s management, including the CEO and CFO, as appropriate, to allow timely decisions regarding required disclosure.
Management's Report on Internal Control over Financial Reporting
Management is responsible for the financial statements and for establishing and maintaining adequate internal control over financial reporting for the Company as defined in Rules 13a-15(f) and 15d-15(f) of the Exchange Act. The Corporation’s internal control system was designed to provide reasonable assurance to the Corporation’s management and Board of Directors regarding the preparation and fair presentation of published financial statements. Due to its inherent limitations, internal control over financial reporting may not prevent or detect misstatements. Also, projections of any evaluation of effectiveness to future periods are subject to the risk that controls may become inadequate because of changes in conditions, or that the degree of compliance with the policies or procedures may deteriorate.
Management has assessed the effectiveness of the Company’s internal control over financial reporting in accordance with the criteria set forth by the Committee of Sponsoring Organizations of the Treadway Commission in Internal Control – Integrated Framework (2013). Based on this assessment, management concluded that the Company maintained effective internal control over financial reporting as of December 31, 2019. All internal control systems, no matter how well designed, have inherent limitations. Therefore, even those systems determined to be effective can provide only reasonable assurance with respect to the reliability of financial reporting and preparation of financial statements in accordance with generally accepted accounting principles.
The effectiveness of the Company's internal control over financial reporting as of December 31, 2019 has been audited by Deloitte LLP, the Company's independent registered public accounting firm who audited the Company's Consolidated Financial Statements included in this Form 10-K, as stated in their report, which is included herein.
Changes in Internal Control over Financial Reporting
During the three months ended December 31, 2019, the Company has not identified any changes in internal control over financial reporting that have materially affected, or are reasonably likely to materially affect, our internal control over financial reporting.
Report of Independent Registered Public Accounting Firm
To the Shareholders and the Board of Directors of Canadian Pacific Railway Limited
Opinion on Internal Control over Financial Reporting
We have audited the internal control over financial reporting of Canadian Pacific Railway Limited and subsidiaries (the “Company”) as of December 31, 2019, based on criteria established in Internal Control – Integrated Framework (2013) issued by the Committee of Sponsoring Organizations of the Treadway Commission (COSO). In our opinion, the Company maintained, in all material respects, effective internal control over financial reporting as of December 31, 2019, based on criteria established in Internal Control – Integrated Framework (2013) issued by COSO.
We have also audited, in accordance with the standards of the Public Company Accounting Oversight Board (United States) (PCAOB), the consolidated financial statements as of and for the year ended December 31, 2019, of the Company and our report dated February 20, 2020, expressed an unqualified opinion on those financial statements and included an explanatory paragraph regarding the Company’s adoption of Accounting Standards Update 2016-02, Leases (Topic 842) and related amendments.
Basis for Opinion
The Company’s management is responsible for maintaining effective internal control over financial reporting and for its assessment of the effectiveness of internal control over financial reporting, included in the accompanying Management’s Report on Internal Control over Financial Reporting. Our responsibility is to express an opinion on the Company’s internal control over financial reporting based on our audit. We are a public accounting firm registered with the PCAOB and are required to be independent with respect to the Company in accordance with the U.S. federal securities laws and the applicable rules and regulations of the Securities and Exchange Commission and the PCAOB.
We conducted our audit in accordance with the standards of the PCAOB. Those standards require that we plan and perform the audit to obtain reasonable assurance about whether effective internal control over financial reporting was maintained in all material respects. Our audit included obtaining an understanding of internal control over financial reporting, assessing the risk that a material weakness exists, testing and evaluating the design and operating effectiveness of internal control based on the assessed risk, and performing such other procedures as we considered necessary in the circumstances. We believe that our audit provides a reasonable basis for our opinion.
Definition and Limitations of Internal Control over Financial Reporting
A company’s internal control over financial reporting is a process designed to provide reasonable assurance regarding the reliability of financial reporting and the preparation of financial statements for external purposes in accordance with generally accepted accounting principles. A company’s internal control over financial reporting includes those policies and procedures that (1) pertain to the maintenance of records that, in reasonable detail, accurately and fairly reflect the transactions and dispositions of the assets of the company; (2) provide reasonable assurance that transactions are recorded as necessary to permit preparation of financial statements in accordance with generally accepted accounting principles, and that receipts and expenditures of the company are being made only in accordance with authorizations of management and directors of the company; and (3) provide reasonable assurance regarding prevention or timely detection of unauthorized acquisition, use, or disposition of the company’s assets that could have a material effect on the financial statements.
Because of its inherent limitations, internal control over financial reporting may not prevent or detect misstatements. Also, projections of any evaluation of effectiveness to future periods are subject to the risk that controls may become inadequate because of changes in conditions, or that the degree of compliance with the policies or procedures may deteriorate.
/s/ Deloitte LLP
Chartered Professional Accountants
Calgary, Canada
February 20, 2020
CP 2019 ANNUAL REPORT/ 126
ITEM 9B. OTHER INFORMATION
None.
PART III
CP 2019 ANNUAL REPORT/ 128
ITEM 10. DIRECTORS, EXECUTIVE OFFICERS AND CORPORATE GOVERNANCE
Directors of Registrant
The information required by this Item will be contained in the Company’s Form 10-K/A, which will be filed no later than 120 days after December 31, 2019. This information will also be contained in the management proxy circular that we prepare in accordance with applicable Canadian corporate and securities law requirements.
Executive Officers of Registrant
The information regarding executive officers is included in Part I of this annual report under Information about our Executive Officers, following Item 4. Mine Safety Disclosures.
Compliance with Section 16(a) of the Exchange Act
The information required by this Item will be contained in the Company’s Form 10-K/A, which will be filed no later than 120 days after December 31, 2019.
Code of Ethics for Chief Executive Officer and Senior Financial Officers
The information required by this Item will be contained in the Company’s Form 10-K/A, which will be filed no later than 120 days after December 31, 2019.
ITEM 11. EXECUTIVE COMPENSATION
The information required by this Item will be contained in the Company’s Form 10-K/A, which will be filed no later than 120 days after December 31, 2019. This information will also be contained in the management proxy circular that we prepare in accordance with applicable Canadian corporate and securities law requirements.
ITEM 12. SECURITY OWNERSHIP OF CERTAIN BENEFICIAL OWNERS AND MANAGEMENT AND RELATED STOCKHOLDER MATTERS
Equity Compensation Plan Information See Item 11 – “Executive Compensation—Equity Compensation Plan Information” for information regarding our equity compensation plans on page 50. Beneficial Ownership Table The table below sets forth the number and percentage of outstanding shares of our common stock beneficially owned by each person, or group of persons, known by Canadian Pacific based on publicly available information required by this Item will be contained in the Company’s Form 10-K/A, which will be filed no lateras of April 20, 2020, to own beneficially more than 120 days after December 31, 2019.five percent of our common stock, each of our directors, each of our NEOs and all directors and executive officers as a group. | | | | | | | | | | Name of beneficial owner 1 | | Shares of common stock
beneficially owned | | | Percent of common stock
outstanding | | | | | — | | | | — | | | | | 900 | | | | * | | | | | 0 | | | | — | | | | | 0 | | | | — | | | | | 0 | | | | — | | | | | 0 | | | | — | | | | | 3,000 | | | | * | | | | | 0 | | | | — | | | | | 0 | | | | — | | | | | 0 | | | | — | | | | | 269,726 | | | | * | | | | | 24,142 | | | | * | | | | | 9,638 | | | | * | | | | | 6,041 | | | | * | | | | | 6,534 | | | | * | | | | | 23,419 | | | | * | | TCI Fund Management Limited (i) | | | 10,978,084 | | | | 8.09 | % | All current executive officers and directors as a group | | | 420,737 | | | | * | |
| * | Represents less than one percent of the outstanding common stock. |
| (a) | See Directors’ Profiles in “Item 10. Directors, Executive Officers and Corporate Governance” above for disclosure with respect to DDSUs. The address of each director is c/o Canadian Pacific, 7550 Ogden Dale Road S.E., Calgary, Alberta, T2C 4X9. |
| (b) | See “Compensation Details – Deferred Compensation Plans” in Item 11. Executive Compensation, for disclosure with respect to NEO DSUs. The address of each executive officer is c/o Canadian Pacific, 7550 Ogden Dale Road S.E., Calgary, Alberta, T2C 4X9. |
| (c) | The shares of common stock owned by Mr. Creel are comprised of (i) 251,610 shares issuable upon the exercise of stock options that have vested or will vest within the next 60 days, and (ii) 18,116 shares held by Mr. Creel directly. |
| (d) | The shares of common stock owned by Mr. Brooks are comprised of (i) 22,051 shares issuable upon the exercise of stock options that have vested or will vest within the next 60 days, and (ii) 2,091 shares held by Mr. Brooks directly. |
| (e) | The shares of common stock owned by Mr. Johnson are comprised of 9,638 shares issuable upon the exercise of stock options that have vested or will vest within the next 60 days. |
| (f) | The shares of common stock owned by Mr. Pitz are comprised of (i) 5,964 shares issuable upon the exercise of stock options that have vested or will vest within the next 60 days, and (ii) 77 shares held by Mr. Pitz directly. |
| (g) | The shares of common stock owned by Mr. Redd are comprised of (i) 5,643 shares issuable upon the exercise of stock options that have vested or will vest within the next 60 days, and (ii) 891 shares held by Mr. Redd directly. |
| (h) | The shares of common stock owned by Mr. Velani are comprised of (i) 22,788 shares issuable upon the exercise of stock options that have vested or will vest within the next 60 days, and (ii) 631 shares held by Mr. Velani directly. |
| (i) | Based upon statements in the Schedule 13G/A filed by TCI Fund Management Limited (“TCI Fund”) and Christopher Hohn on February 14, 2020, TCI Fund and Mr. Hohn have (i) shared voting power over 10,978,084 shares of CP’s common stock; and (ii) shared dispositive power of 10,978,084 shares of CP’s common stock. The Children’s Investment Master Fund (“TCIF”) is the investment manager of TCI Fund and Talos Capital DAC (“Talos”). Mr. Hohn, as managing director of TCIF, may be deemed to beneficially own the shares held by the TCI Fund and Talos. The address of each of TCI Fund and Mr. Hohn is 7 Clifford Street, London W1S 2FT, United Kingdom. |
ITEM 13. CERTAIN RELATIONSHIPS AND RELATED TRANSACTIONS, AND DIRECTOR INDEPENDENCE
Related party transactions Directors, officers and employees are required to report any related party transactions to comply with our code of business ethics. In 2019, there were no transactions between CP and a related person as described in Item 404 of RegulationS-K, which defines arelated person as: a director, nominated director or executive officer of CP, an immediate family member of a director, nominated director or executive officer, or someone who beneficially owns more than 5% of our shares or a member of their immediate family. Any director who has a material interest in a transaction or agreement involving CP must disclose the interest to the CEO and the Chair of the Board immediately, and does not participate in any discussions or votes on the matter. The Board reviews related party transactions when it does its annual review of director independence. Our accounting and legal departments review any related party transactions reported by officers and employees. The Board has adopted standards for director independence based on the criteria of the NYSE, SEC and CSA. It reviews director independence continually and annually using director questionnaires as well as by reviewing updated biographical information, required by this Item will be contained inmeeting with directors individually, and conducting a comprehensive assessment of all business and other relationships and interests of each director with respect to CP and our subsidiaries. In 2019 and 2020, the Company’s Form 10-K/A, which will be filed no later than 120 days after December 31, 2019. This information will also be contained in the management proxy circularBoard determined that we prepareeach director, except for Mr. Creel, is independent in accordance with applicable Canadian corporatethe standards for independence established by the NYSE and securities law requirements.CSA. Mr. Creel is not independent because of his position as President and CEO.
10A-3(b)(1) of the Exchange Act, and Section 1.5 of NI
audit committees.ITEM 14. PRINCIPAL ACCOUNTING FEES AND SERVICES
The information requiredtable below shows the fees we paid to Deloitte in 2019 and 2018 for audit andnon-audit services.| | | | | | | | | | | For the year ended December 31 | | 2019 | | | 2018 | | for audit of our annual financial statements, reviews of quarterly reports and services relating to statutory and regulatory filings or engagements (including attestation services and audit or interim review of financial statements of certain subsidiaries and certain pension and benefits plans, and advice on accounting and/or disclosure matters) | | $ | 3,576,300 | | | $ | 3,800,200 | | for assurance and services related to the audit but not included in the audit fees above, including securities filings | | $ | 169,700 | | | $ | 138,800 | | for services relating to tax compliance, tax planning and tax advice | | $ | 35,500 | | | $ | 121,000 | | for services provided relating to CP’s corporate sustainability report and training programs | | $ | 90,500 | | | $ | 54,000 | | | | $ | 3,872,000 | | | $ | 4,114,000 | |
Pre-approval of audit services and feesThe Audit Committee has a written policy forpre-approving audit andnon-audit services by this Item will be contained in the Company’s Form 10-K/A, which will be filed no later than 120 days after December 31, 2019. This information will also be contained in the management proxy circular that we prepareindependent auditor and their fees, in accordance with applicable Canadian corporatethe laws and requirements of stock exchanges and securities law requirements.regulatory authorities.
The policy sets out the following governance procedures: 129 /SERVICE EXCELLENCEthe Audit and Finance Committeepre-approves the terms of the annual engagement of the external auditor the Boardpre-approves the fees for the annual engagement and budgeted amounts for the audit and the Audit and Finance Committeepre-approves the fees fornon-audit services at least annually the Vice-President, Financial Planning and Accounting submits reports at least quarterly to the Audit and Finance Committee listing the services that were performed or planned to be performed by the external auditor any additionalnon-audit services to be provided by the external auditor that were not included in the list ofpre-approved services or exceed the budgeted amount by more than 10% must each bepre-approved by the Audit and Finance Committee or the committee chair. The committee chair must report any additionalpre-approvals at the next committee meeting the Audit and Finance Committee reviews the policy as necessary to make sure it continues to reflect our needs our chief internal auditor monitors compliance with the policy. The Audit Committee or committee chair must be satisfied that any services itpre-approves will not compromise the independence of the external auditor. The committeepre-approved all services performed by the external auditor in 2019, in accordance with the policy.
| ITEM 15. | EXHIBITS, FINANCIAL STATEMENT SCHEDULE |
Part IV (Item 15) of the 2019 Form10-K is hereby amended solely to add the following exhibits required to be filed in connection with this Amendment No. 1.
PART IV
CP 2019 ANNUAL REPORT/ 130
ITEM 15. EXHIBITS, FINANCIAL STATEMENT SCHEDULE
The following documents are filed as part of this annual report:
The financial statements filed as part of this filing are listed on the Index to Consolidated Financial Statements in Item 8. Financial Statements and Supplementary Data.
| | (b) | Financial Statement Schedule
|
Schedule II – Valuation and Qualifying Accounts
| | | | | | | | | | | | | | | | | | (in millions of Canadian dollars) | Beginning balance at January 1 |
| Additions charged to expenses |
| Payments and other reductions |
| Impact of FX |
| Ending
balance at December 31 |
| Accruals for personal injury and other claims provision(1) | | 2017 | $ | 130 |
| $ | 66 |
| $ | (77 | ) | $ | (1 | ) | $ | 118 |
| | 2018 | $ | 118 |
| $ | 93 |
| $ | (60 | ) | $ | 1 |
| $ | 152 |
| | 2019 | $ | 152 |
| $ | 142 |
| $ | (152 | ) | $ | (1 | ) | $ | 141 |
| | Environmental liabilities | | 2017 | $ | 85 |
| $ | 5 |
| $ | (8 | ) | $ | (4 | ) | $ | 78 |
| | 2018 | $ | 78 |
| $ | 6 |
| $ | (7 | ) | $ | 5 |
| $ | 82 |
| | 2019 | $ | 82 |
| $ | 6 |
| $ | (8 | ) | $ | (3 | ) | $ | 77 |
|
(1) Includes WCB, FELA, occupational, damage and other claims.
Exhibits are listed in the exhibit index below. The exhibits include management contracts, compensatory plans and arrangements required to be filed as exhibits to the Form 10-K by Item 601 (10) (iii) of Regulation S-K. | | | | | | | | Exhibit31.1* | Description | 3 | Articles of Incorporation and Bylaws: | | | | | | | | | 4 | Instruments Defining the Rights of Security Holders, Including Indentures: | | | | | | |
CP 2019 ANNUAL REPORT/ 132
| | | | 104* | |
| | | | | | 10 | Material Contracts: | | | | Fourth Amending Agreement, dated as of June 23, 2017, amending the Credit Agreement, dated September 26, 2014, between Canadian Pacific Railway Company, as Borrower, Canadian Pacific Railway Limited, as Covenantor, Royal Bank of Canada, as Administrative Agent, and the various Lenders party thereto (incorporated by reference to Exhibit 10.1 Canadian Pacific Railway Limited's Current Report on Form 8-K filed with the Securities and Exchange Commission on June 27, 2017, File No. 001-01342). | | |
| | | | | | | Third Amending Agreement, dated as of June 28, 2016, amending the Credit Agreement, dated September 26, 2014, between Canadian Pacific Railway Company, as Borrower, Canadian Pacific Railway Limited, as Covenantor, Royal Bank of Canada, as Administrative Agent, and the various Lenders party thereto (incorporated by reference to Exhibit 10.1 to Canadian Pacific Railway Limited’s Registration Statement on Form 8-K filed with the Securities and Exchange Commission on June 29, 2016, File No. 001-01342). | | | | | | | | | | | | | | | | |
CP 2019 ANNUAL REPORT/ 134
| | | | | | | | | | | | | | | | | | | | | | | | | | Credit Agreement dated as of September 26, 2014 among Canadian Pacific Railway Company and CPR Securities Limited, as borrowers, Canadian Pacific Railway Limited, as covenantor, the Financial Institutions that are signatories to the Credit Agreement, as Lenders, the Royal Bank of Canada, as Administrative Agent, RBC Capital Markets, J.P. Morgan Securities LLC, TD Securities, Morgan Stanley MUFG Loan Partners, LLC and Citibank, N.A., Canadian Branch, as Co-Lead Arrangers, RBC Capital Markets and J.P. Morgan Securities LLC, as Joint Bookrunners, J.P. Morgan Chase Bank, N.A., as Syndication Agent, The Toronto-Dominion Bank, Morgan Stanley MUFG Loan Partners, LLC and Citibank, N.A., Canadian Branch, as Co-Documentation Agents (incorporated by reference to Exhibit 10.45 to Canadian Pacific Railway Limited’s Form 10-K filed with the Securities and Exchange Commission on February 29, 2016, File No. 001-01342). | | First Amending Agreement dated as of June 15, 2015, to the Credit Agreement dated September 26, 2014, among Canadian Pacific Railway Company and CPR Securities Limited, as borrowers, Canadian Pacific Railway Limited, as covenantor, the signatories to this First Amending Agreement to the Credit Agreement, as Lenders, the Royal Bank of Canada, as Administrative Agent (incorporated by reference to Exhibit 10.46 to Canadian Pacific Railway Limited’s Form 10-K filed with the Securities and Exchange Commission on February 29, 2016, File No. 001-01342). | | Second Amending Agreement dated as of September 17, 2015, to the Credit Agreement dated September 26, 2014, among Canadian Pacific Railway Company and CPR Securities Limited, as borrowers, Canadian Pacific Railway Limited, as covenantor, the signatories to the Second Amending Agreement to this Credit Agreement, as Lenders, the Royal Bank of Canada, as Administrative Agent (incorporated by reference to Exhibit 10.47 to Canadian Pacific Railway Limited’s Form 10-K filed with the Securities and Exchange Commission on February 29, 2016, File No. 001-01342). |
| Fifth Amending Agreement, dated as of June 8, 2018, amending the Credit Agreement, dated September 26, 2014, between Canadian Pacific Railway Company, as Borrower, Canadian Pacific Railway Limited, as Covenantor, Royal Bank of Canada, as Administrative Agent, and the various Lenders party thereto (incorporated by reference to Exhibit 10.1 Canadian Pacific Railway Limited's Current Report on Form 8-K filed with the Securities and Exchange Commission on June 11, 2018, File No. 001-01342). | | | | Amended and Restated Credit Agreement, dated as of September 27, 2019, between Canadian Pacific Railway Company, as Borrower, Canadian Pacific Railway Limited, as Covenantor, Royal Bank of Canada, as Administrative Agent, and the various Lenders party thereto (incorporated by reference to Exhibit 10.1 to Canadian Pacific Railway Limited's Current Report on Form 8-K filed with the Securities and Exchange Commission on October 1, 2019, File No. 001-01342) |
| | | | | | | | | | | | | | | | | 101.INS** | Inline XBRL Instance Document | 101.SCH** | Inline XBRL Taxonomy Extension Schema Document | 101.CAL** | Inline XBRL Taxonomy Extension Calculation Linkbase Document | 101.LAB** | Inline XBRL Taxonomy Extension Label Linkbase Document | 101.DEF** | Inline XBRL Taxonomy Extension Definition Linkbase Document | 101.PRE** | Inline XBRL Taxonomy Extension Presentation Linkbase Document | 104 ** | Cover Page Interactive Data File (formatted as Inline XBRL and contained in Exhibit 101) |
| The following financial information from Canadian Pacific Railway Limited’s Annual ReportFiled with this Amendment No. 1 on Form 10-K for the year ended December 31, 2019, formatted in Extensible Business Reporting Language (XBRL) includes: (i) the Consolidated Statements of Income of each of the three years ended December 31, 2019, 2018, and 2017; (ii) the Consolidated Statements of Comprehensive Income for each of the three years ended December 31, 2019, 2018, and 2017; (iii) the Consolidated Balance Sheets at December 31, 2019 and 2018; (iv) the Consolidated Statements of Cash Flows for each of the three years ended December 31, 2019, 2018, and 2017; (v) the Consolidated Statements of Changes in Shareholders’ Equity for each of the three years ended December 31, 2019, 2018, and 2017; and (vi) the Notes to Consolidated Financial Statements.10-K/A |
* Management contract or compensatory arrangement
** Filed with this Annual Report on Form 10-K
CP 2019 ANNUAL REPORT/ 136
ITEM 16. FORM 10-K SUMMARY
137 /SERVICE EXCELLENCE
SIGNATURES
Pursuant to the requirements of Section 13 or 15(d) of the Securities Exchange Act of 1934,, the Company has duly caused this report to be signed on its behalf by the undersigned, thereunto duly authorized. | | | | | CANADIAN PACIFIC RAILWAY LIMITED | | | By: | | | | | Keith Creel | | | President and Chief Executive Officer |
Dated: February 20,April 29, 2020
POWER OF ATTORNEY
Each of the undersigned do hereby appoint each of Nadeem Velani and Jeffrey J. Ellis, his or her true and lawful attorney-in-fact and agent, to sign on his or her behalf the Company’s Annual Report on Form 10-K, for the year ended December 31, 2019, and any and all amendments thereto, and to file the same, with all exhibits thereto, with the Securities and Exchange Commission.
Pursuant to the requirements of the Securities Exchange Act of 1934,, this report has been signed below by the following persons on behalf of the Company and in the capacities indicated on February 20,April 29, 2020. | | | | Signature | | Title | | | Signature | Title | /s/ KEITH CREEL | President, Chief Executive Officer and Director | Keith Creel | (Principal (Principal Executive Officer) | | | | | Executive Vice-President and Chief Financial Officer | Nadeem Velani | (Principal (Principal Financial and Accounting Officer) | | | /s/ ISABELLE COURVILLE | | Chair of the Board of Directors | Isabelle Courville | | | | /s/ JOHN R. BAIRD | Director | John R. Baird | | | | /s/ GILLIAN H. DENHAM | Director | Gillian H. Denham | | | | /s/ EDWARD R. HAMBERGER | Director | Edward R. Hamberger | | | | /s/ REBECCA MACDONALD | Director | | Rebecca MacDonald | | | | | /s/ EDWARD L. MONSER | Director | Edward L. Monser | | | | /s/ MATTHEW H. PAULL | Director | Matthew H. Paull | | | | /s/ JANE L. PEVERETT | Director | Jane L. Peverett | | | | /s/ ANDREA ROBERTSON | Director | Andrea Robertson | | | | /s/ GORDON T. TRAFTON | Director | Gordon T. Trafton | | | *By: | | | | | Nadeem Velani | | | |
|