UNITED STATES
SECURITIES AND EXCHANGE COMMISSION
Washington, D.C. 20549
FORM 10-K
(Mark one)
| | | | | |
| ☒ | ANNUAL REPORT PURSUANT TO SECTION 13 OR 15(d) OF THE SECURITIES AND EXCHANGE ACT OF 1934 |
For fiscal year ended December 31, 20222023
OR
| | | | | |
| ☐ | TRANSITION REPORT PURSUANT TO SECTION 13 OR 15(d) OF THE SECURITIES EXCHANGE ACT OF 1934 |
For the transition period from to
Commission File Number 001-01342
Canadian Pacific RailwayKansas City Limited
(Exact name of registrant as specified in its charter)
| | | | | | | | | | | |
| Canada | | 98-0355078 |
(State or Other Jurisdiction
of Incorporation or Organization) | | (IRS Employer
Identification No.) |
| | | |
| 7550 Ogden Dale Road S.E., Calgary, Alberta, | | |
CalgaryCanada | | AB | T2C 4X9 |
(Address of Principal Executive Offices)principal executive offices) | | (Zip Code) |
Registrant's
(403) 319-7000
Registrant’s Telephone Number, Including Area Code: (403) 319-7000
Securities registered pursuant to Section 12(b) of the Act:
| | | | | | | | | | | | | | | | | | | | | | | | | | |
| | Title of Each Classeach class | | | Trading Symbol(s) | | | Name of Each Exchangeeach exchange on which Registered | |
Common Shares, without par value, of
Canadian Pacific RailwayKansas City Limited | | CP | | New York Stock Exchange |
| | |
Common Shares, without par value, of
Canadian Pacific Kansas City Limited | | CP | | Toronto Stock Exchange |
| | |
| Perpetual 4% Consolidated Debenture Stock of Canadian Pacific Railway Company | | CP/40 | | New York Stock Exchange |
| | | |
| Perpetual 4% Consolidated Debenture Stock of Canadian Pacific Railway Company | | BC87 | | London Stock Exchange |
| | | |
Securities registered pursuant to Section 12(g) of the Act: None
Indicate by check mark if the registrant is a well-known seasoned issuer, as defined in Rule 405 of the Securities Act.
Yes þ No o
Indicate by check mark if the registrant is not required to file reports pursuant to Section 13 or Section 15(d) of the Exchange Act.
Yes o No þ
Indicate by check mark whether the registrant (1) has filed all reports required to be filed by Section 13 or 15(d) of the Securities Exchange Act of 1934 during the preceding 12 months (or for such shorter period that the registrant was required to file such reports), and (2) has been subject to such filing requirements for the past 90 days. Yes þ No o
Indicate by check mark whether the registrant has submitted electronically every Interactive Data File required to be submitted pursuant to Rule 405 of Regulation S-T (§232.405 of this chapter) during the preceding 12 months (or for such shorter period that the registrant was required to submit such files). Yes þ No o
Indicate by check mark whether the registrant is a large accelerated filer, an accelerated filer, a non-accelerated filer, a smaller reporting company or an emerging growth company. See the definitions of "large accelerated filer," "accelerated filer," "smaller reporting company," and "emerging growth company" in Rule 12b-2 of the Exchange Act.
| | | | | | | | | | | | | | | | | | | | | | | | | | | | | |
| Large accelerated filer | þ | Accelerated filer | ☐ | Non-accelerated filer | ☐ | Smaller reporting
company | ☐ | Emerging growth company | ☐ |
If an emerging growth company, indicate by check mark if the registrant has elected not to use the extended transition period for complying with any new or revised financial accounting standards provided pursuant to Section 13(a) of the Exchange Act. o
Indicate by check mark whether the registrant has filed a report on and attestation to its management’s assessment of the effectiveness of its internal control over financial reporting under Section 404(b) of the Sarbanes-Oxley Act (15 U.S.C. 7262(b)) by the registered public accounting firm that prepared or issued its audit report. ☑
If securities are registered pursuant to Section 12(b) of the Act, indicate by check mark whether the financial statements of the registrant included in the filing reflect the correction of an error to previously issued financial statements. ☐
Indicate by check mark whether any of those error corrections are restatements that required a recovery analysis of incentive-based compensation received by any of the registrant’s executive officers during the relevant recovery period pursuant to § 240.10D-1(b). ☐
Indicate by check mark whether the registrant is a shell company (as defined in Rule 12b-2 of the Exchange Act). Yes ☐ No þ
As of June 30, 2022,2023, the last business day of the registrant's most recently completed second fiscal quarter, the aggregate market value of the voting stock held by non-affiliates of the registrant, in U.S. dollars, was $64,936,373,457,$75,204,483,138, based on the closing sales price per share as reported by the New York Stock Exchange on such date.
As of the close of business on February 23, 2023,26, 2024, there were 930,767,959932,428,454 shares of the registrant's common shares outstanding.
DOCUMENTS INCORPORATED BY REFERENCE
Not applicable.
EXPLANATORY NOTE
Canadian Pacific RailwayKansas City Limited ("CPRL"CPKC"), a corporation incorporated under the Canada Business Corporations Act, qualifies as a foreign private issuer in the U.S. for purposes of the Securities Exchange Act of 1934, as amended (the “Exchange Act”). Although as a foreign private issuer CPRLCPKC is no longer required to do so, CPRLCPKC currently continues to file annual reports on Form 10-K, quarterly reports on Form 10-Q, and current reports on Form 8-K with the Securities and Exchange Commission ("SEC") instead of filing reports on forms available to foreign private issuers.
CPRLCPKC prepares and files a management information circular and related material under Canadian requirements. As CPRL'sCPKC's management information circular is not filed pursuant to Regulation 14A, CPRLCPKC may not incorporate by reference information required by Part III of this Form 10-K from its management information circular. Accordingly, in reliance upon and as permitted
by Instruction G(3) to Form 10-K, CPRLCPKC will be filing an amendment to this Form 10-K containing the Part III information no later than 120 days after the end of the fiscal year covered by this Form 10-K. All references to websites (including our websiteswebsite) contained herein do not constitute incorporation by reference of information contained on such websites and such information should not be considered part of this document.
CP 2022CPKC 2023 ANNUAL REPORT / 1
CANADIAN PACIFIC RAILWAYKANSAS CITY LIMITED
FORM 10-K TABLE OF CONTENTS
| | | | | | | | |
| PART I | | Page |
| Item 1. | Business | |
| Item 1A. | Risk Factors | |
| Item 1B. | Unresolved Staff Comments | |
| Item 1C. | Cybersecurity | |
| Item 2. | Properties | |
| Item 3. | Legal Proceedings | |
| Item 4. | Mine Safety Disclosures | |
| Information about our Executive Officers | |
| | |
| PART II | | |
| Item 5. | Market for Registrant's Common Equity, Related Shareholder Matters and Issuer Purchases of Equity Securities | |
| Item 6. | [Reserved] | |
| Item 7. | Management's Discussion and Analysis of Financial Condition and Results of Operations | |
| Item 7A. | Quantitative and Qualitative Disclosures About Market Risk | |
| Item 8. | Financial Statements and Supplementary Data | |
| Item 9. | Changes in and Disagreements With Accountants on Accounting and Financial Disclosure | |
| Item 9A. | Controls and Procedures | |
| Item 9B. | Other Information | |
Item 9C. | Disclosure Regarding Foreign Jurisdictions that Prevent Inspections | |
| | |
| PART III | | |
| Item 10. | Directors, Executive Officers and Corporate Governance | |
| Item 11. | Executive Compensation | |
| Item 12. | Security Ownership of Certain Beneficial Owners and Management and Related Stockholder Matters | |
| Item 13. | Certain Relationships and Related Transactions, and Director Independence | |
| Item 14. | Principal Accounting Fees and Services | |
| | |
| PART IV | | |
| Item 15. | Exhibits, Financial Statement Schedule | |
| Item 16. | Form 10-K Summary | |
| Signatures | |
2 / CP 2022CPKC 2023 ANNUAL REPORT
PART I
CP 2022CPKC 2023 ANNUAL REPORT / 3
ITEM 1. BUSINESS
Company Overview
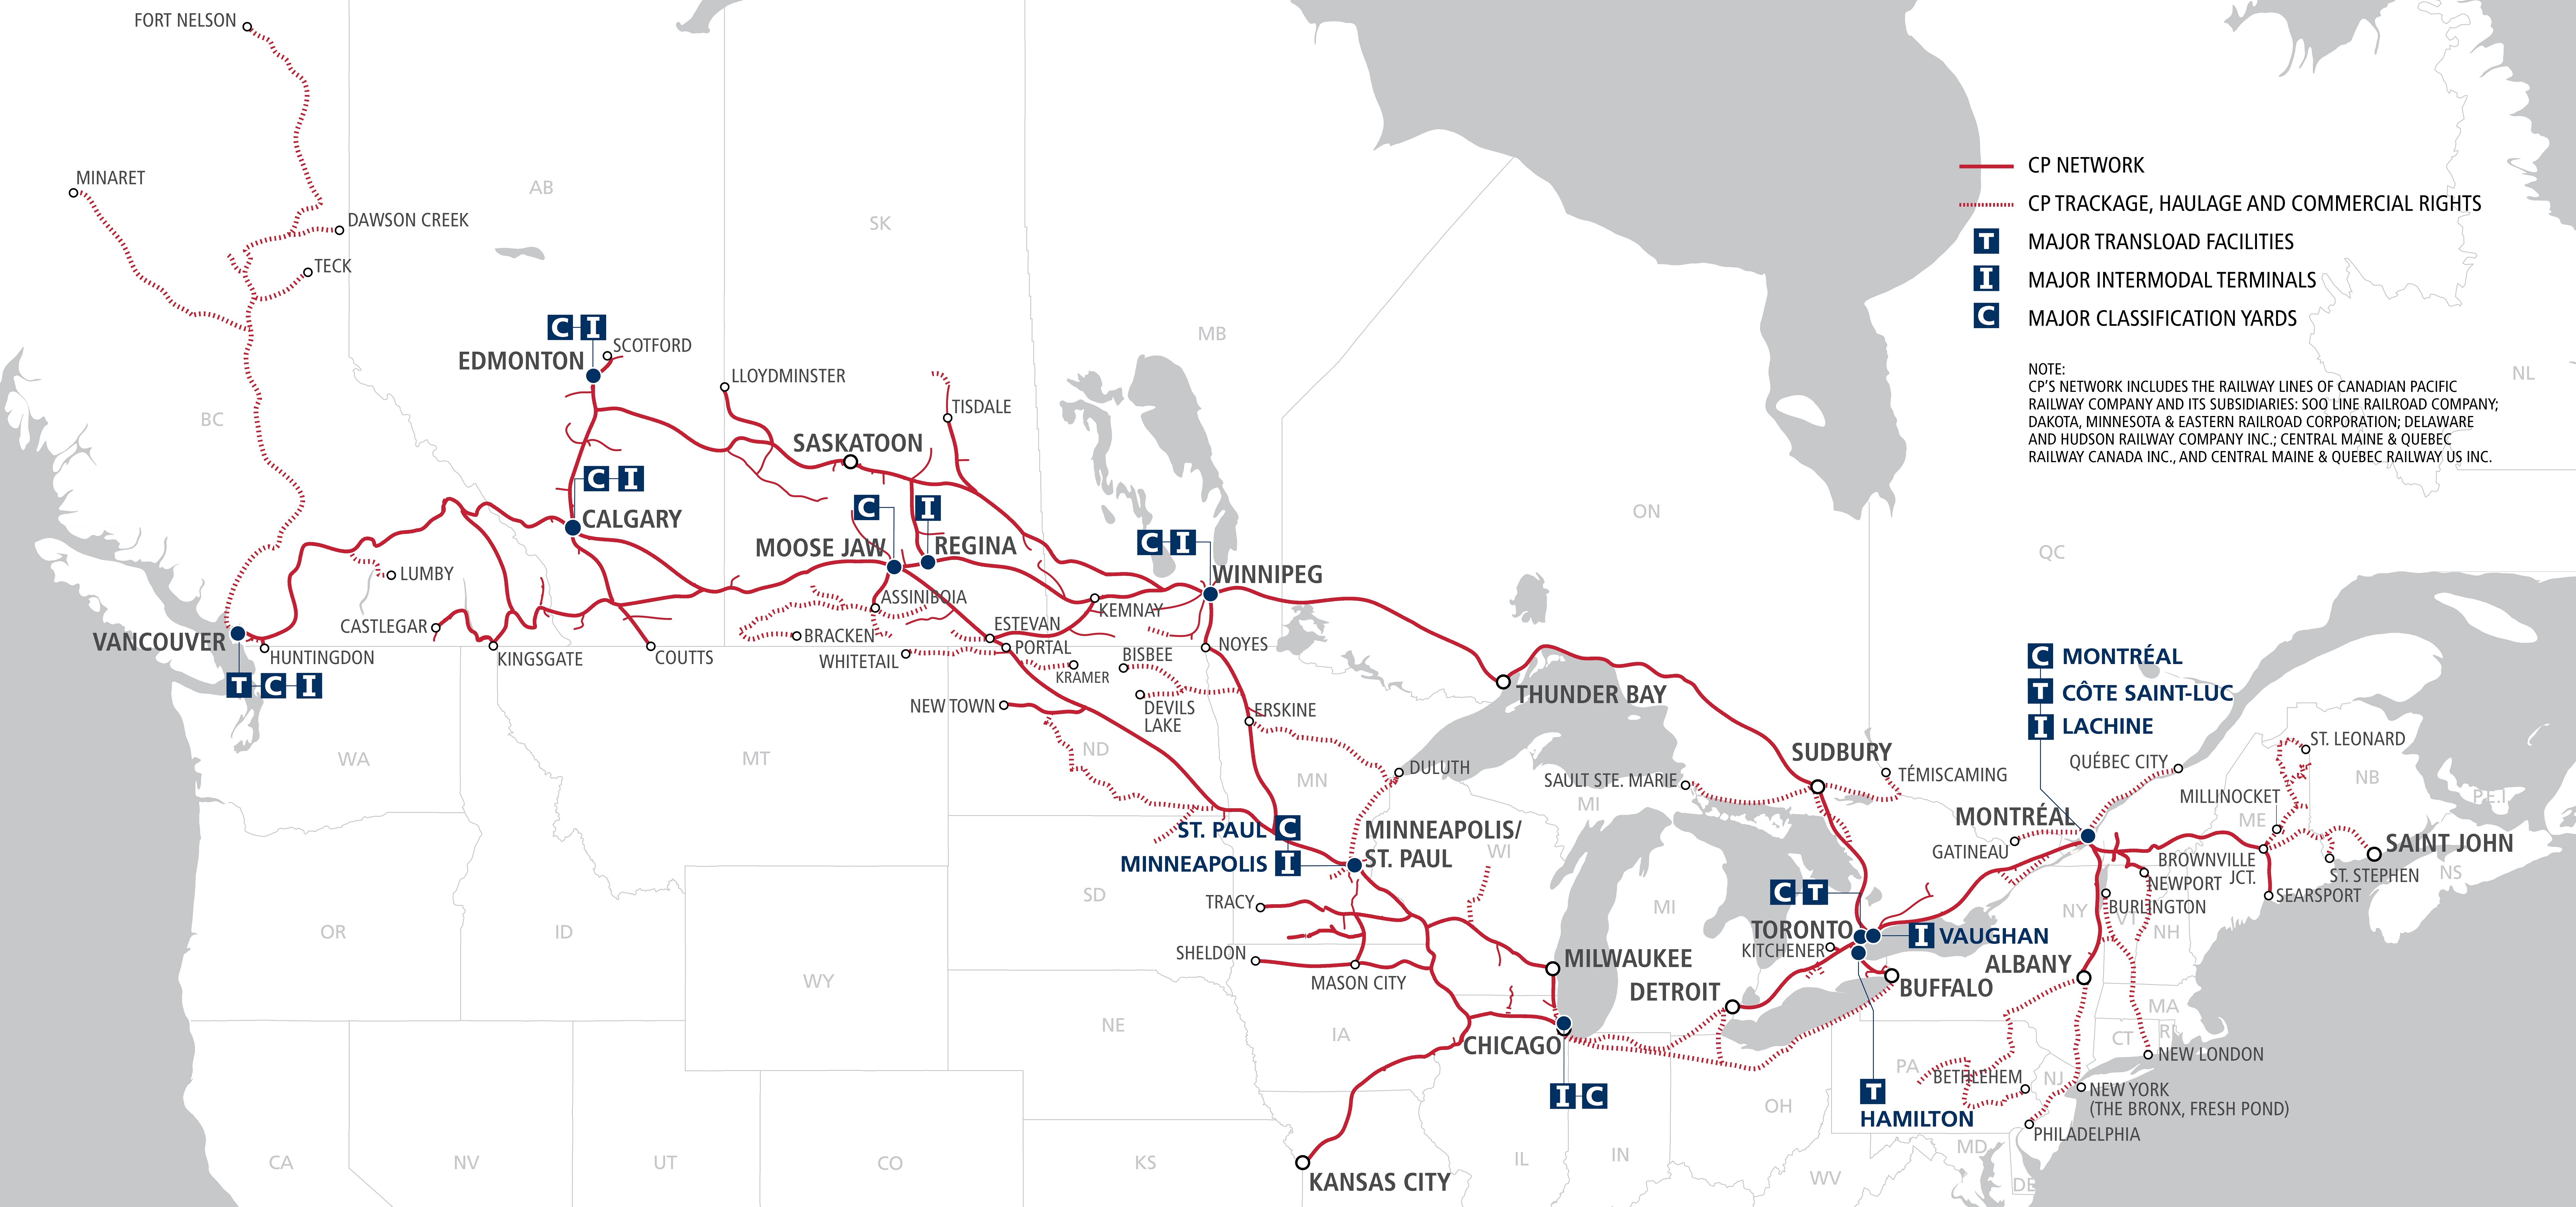
On April 14, 2023, Canadian Pacific Railway Limited (“CPRL”CPRL" or "CP") assumed control of Kansas City Southern ("KCS") (through an indirect wholly-owned subsidiary), together with its subsidiaries (“CP”and filed articles of amendment to change CPRL's name to Canadian Pacific Kansas City Limited ("CPKC"),. CPKC owns and operates a transcontinentalthe only freight railway inspanning Canada, and the United States (“("U.S.”"). CP, and Mexico. CPKC provides rail and intermodal transportation services over a network of approximately 13,000 miles, directly 20,000 miles, serving the principal business centres ofacross Canada, from Montréal, Québec, to Vancouver, British Columbia ("B.C.")the U.S., and the U.S. Northeast and Midwest regions. CP’s railway network feeds directly into the U.S. Midwest from the East and West coasts. Agreements with other carriers extend CP's market reach in Canada, through the U.S. and into Mexico. CPCPKC transports bulk commodities, merchandise freight, and intermodal traffic. For additional information regarding CP'sCPKC's network and geographical locations, refer to Item 2. Properties.
CPRLThe Company was originally incorporated on June 22, 2001, under the Canada Business Corporations Act and controls and owns all of the Common Shares of Canadian Pacific Railway Company (“CPRC”), which was incorporated in 1881 by Letters Patent pursuant to an Act of the Parliament of Canada. CPRL'sCPKC's registered, executive and corporate head office is located at 7550 Ogden Dale Road S.E., Calgary, Alberta, T2C 4X9, Canada. CPRL'sCPKC's U.S. head office is located at 427 West 12 Street, Kansas City, Missouri, 64105. CPKC's Common Shares (the "Common Shares") are listed on the Toronto Stock Exchange (“TSX”) and the New York Stock Exchange (“NYSE”) under the symbol “CP”.
For purposes of this annual report, unless the context indicates otherwise, all references herein to “CP”“CPKC”, “the Company”, “we”, “our” and “us” refer to CPRL,Canadian Pacific Kansas City Limited and its subsidiaries, which includes KCS as a consolidated subsidiary on and from April 14, 2023. Prior to April 14, 2023, KCS was held as an equity investment accounted for by the equity method of accounting. For purposes of this annual report, unless the context indicates otherwise, all references herein to “legacy CP” refer to CPRL and its subsidiaries CPRLprior to April 14, 2023. For purposes of this annual report, unless the context indicates otherwise, all references herein to“legacy KCS” refer to KCS and one or more of its subsidiaries or one or more of CPRL's subsidiaries, as the context may require.prior to April 14, 2023. All references to currency amounts included in this annual report, including the Consolidated Financial Statements, are in Canadian dollars unless specifically noted otherwise.
Strategy
The Company’s strategy remains focused on precision scheduled railroading as embedded within our five foundations:
•Provide Service: Providing efficient and consistent transportation solutions for the Company’s customers. “Doing what we say we are going to do” is what drives the Company in providing a reliable product with a lower cost operating model. Centralized planning aligned with local execution is bringing the Company closer to the customer and accelerating decision-making.
•Control Costs: Controlling and removing unnecessary costs from the organization, eliminating bureaucracy, and continuing to identify productivity enhancements are the keys to success.
•Optimize Assets: Through longer and heavier trains, and improved asset utilization, the Company is moving increased volumes with fewer locomotives and cars while unlocking capacity for future growth potential.
•Operate Safely: Each year, the Company safely moves millions of carloads of freight across North America while ensuring the safety of our people and the communities through which we operate. Safety is never to be compromised. The Company strives for continuous implementation of state-of-the-art safety technology, safety management systems, and safety culture with our employees to ensure safe, efficient operations across our network.
•Develop People: The Company recognizes that none of the other foundations can be achieved without its people. Every employee is a railroader and the Company has established a culture focused on our values of accountability, diversity and pride, in everything we do. Coaching and mentoring all employees into becoming leaders will continue to drive the Company forward.
Today, we continue to apply our long-term strategy: leverage our lower cost base, network strengths, and improve service to drive sustainable, profitable growth. While the accomplishments during the operational turnaround were tremendous, the Company's journey to become North America's best-performing rail carrier is far from over. As a Company, we remain focused on our next level of service, productivity, and innovation to continue to generate sustainable value for our customers, employees, and shareholders.
Business Developments
Kansas City Southern ("KCS")KCS transaction
The U.S.On March 15, 2023, the United States Surface Transportation Board'sBoard ("STB") reviewissued a final decision approving CPRL and KCS's joint merger application, subject to certain conditions. On March 17, 2023, the CPRL announced its acceptance of CP's proposedthe STB's final decision and its intent to assume control of KCS while KCS is inon April 14, 2023 (the "Control Date"). On the Control Date, the voting trust is expectedwas terminated and the CPRL assumed control of KCS (through an indirect wholly-owned subsidiary), and changed CPRL's name to be completed in the first quarter of 2023. Upon obtaining control approval from the STB, provided it is granted, the two companies will be combined. Mr. Creel will serve as the Chief Executive Officer of the combined company. The combined business will be named Canadian Pacific Kansas City Limited ("CPKC"). Calgary, Alberta will be the global headquarters of CPKC, and Kansas City, Missouri will be designated as the U.S. headquarters. The Mexico headquarters will remain in Mexico City and Monterrey. CP's current U.S. headquarters in Minneapolis-St. Paul, Minnesota will remain an important base of operations. Four KCS Directors are expected to join CP's expanded Board at the appropriate time, bringing their experience and expertise in overseeing KCS's multinational operations.Limited.
4 / CP 2022CPKC 2023 ANNUAL REPORT
The transaction will combine the two railroads to create the first rail network connecting the U.S., Mexico, and Canada and will deliver dramatically expanded market reach for customers served by CP and KCS, provide new competitive transportation service options, and support North American economic growth.
Specific risk factors related to the KCS transaction are included in Part I, Item 1A. Risk Factors.
Other current business developments
In the fourth quarter of 2022,2023, the Company was named to the S&P Global Dow Jones Sustainability World Index ("(“DJSI World"World”) for the first time and to the North American Index ("(“DJSI North America"America”) for the third consecutive year.. According to S&P Global, the DJSI North America comprisestracks the performance of North American sustainability leaders as identified through the Corporate Sustainability Assessment. The index represents the top 20% of the largest 600 North AmericanCanadian and United States companies in the S&P Global Broad Market Index and measures corporate sustainability leaders' performance based on long-term economic, environmental, and social criteria.that lead the field in terms of sustainability. The DJSI World Index comprises global sustainability leaders as identified by S&P Global throughtracks the Corporate Sustainability Assessment. It representsperformance of the top 10% of the largest 2,500 companies in the S&P Global BMI based on long-term economic, environmental and social criteria.
Additionally,that lead the Company was named to CDP Worldwide ("CDP")’s A List for the second consecutive year. CDP is an international nonprofit organization that annually assesses organizations on environmental performance and transparency. According to CDP, nearly 20,000 organizations disclosed climate-related and environmental metrics and information through the organizationfield in 2022.terms of sustainability.
On July 20, 2022, KCSJune 28, 2023, CPKC, CSX Corporation ("CSX"), and its affiliate Kansas City Southern de México, S.A. de C.V.Genesee & Wyoming Inc. ("KCSM"G&W") announced an agreement, effective July 14, 2022, extendingthat they have reached agreements which, when completed, will create a new direct CPKC-CSX interchange connection in Alabama. As part of the concession exclusivity rights grantedseries of proposed transactions, CPKC and CSX will each acquire or operate portions of Meridian & Bigbee Railroad, L.L.C., a G&W-owned railway in Mississippi and Alabama, to KCSMestablish a new freight corridor for an additional 10 years to now expire in 2037. Additionally, KCSM reached an agreementshippers that connects Mexico and Texas with the Mexican Ministry of Infrastructure, Communications and Transportation to fund a new investment in the Celaya-NBA Line Railway Bypass and other infrastructure.
On May 3, 2022, the Company became the first freight rail company in North America to participate in the United Nations ("UN") Global Compact, a voluntary leadership platform for the development, implementation and disclosure of socially responsible business practices. Launched in 2000, the UN Global Compact is the largest corporate sustainability initiative in the world, with more than 15,000 participating companies in over 160 countries.
On April 27, 2022, at the Company's Annual and Special Meeting of Shareholders, all nine director nominees were elected to the Board of DirectorsU.S. Southeast. Certain portions of the Company.
On March 16, 2022, the Company issued a 72-hour noticetransactions are subject to the Teamsters Canada Rail Conference ("TCRC") - Train & Engine, of its plan to lock-out employees at 00:01 Eastern Time on March 20, 2022 if the TCRC leadershipregulatory review and the Company were unable to come to a negotiated settlementapproval from, or agree to binding arbitration. The TCRC represents approximately 3,000 locomotive engineers, conductors, and train and yard workers across Canada. On March 19, 2022, while the Company was still engaged in ongoing negotiations facilitated by federal mediators, the TCRC withdrew its services in the final hours before the deadline for a legal strike or lockout to potentially occur. On March 22, 2022, the Company reached an agreement with the TCRC Negotiating Committee to enter into binding arbitration. This agreement enabled the Company's employees to return to work effective at noon on March 22, 2022 local time to resume our essential services for our customers and the North American supply chain. On August 15, 2022, the Company entered into a new two-year collective agreement with the TCRC following binding arbitration. The new agreement includes a 3.5 percent wage increase in 2022 and 2023 as well as increased benefits. Under the arbitration decision, the TCRC has joined a pension improvement account. The new collective agreement is effective from January 1, 2022 to December 31, 2023.
Prior Developments
On December 14, 2021, following approval of the transactionexemption by, the shareholders of both the Company and KCS, receipt of Mexican regulatory approvals, and satisfaction or waiver of customary closing conditions and pursuant to the terms set forth in the Agreement and Plan of Merger (the "Merger Agreement") with KCS dated September 15, 2021, the acquisition of KCS was consummated and all outstanding stock of KCS was deposited into a voting trust and held by a single trustee as trust stock. Under the terms of the Merger Agreement, the Company issued 262.6 million Common Shares to existing KCS common stockholders at the exchange ratio of 2.884 Common Shares per share of KCS common stock and paid cash consideration to existing KCS stockholders of U.S. $90 per share of KCS common stock held and U.S. $37.50 per share of KCS preferred stock held for a total of approximately $10.5 billion (U.S. $8.2 billion). Share consideration, cash consideration, and the above described payments to KCS totaled approximately $36 billion (U.S. $28 billion). For additional information regarding this acquisition, refer to Item 8. Financial Statements and Supplementary Data, Note 10 Business acquisitions.
On September 15, 2021, upon KCS's termination of the Agreement and Plan of Merger with Canadian National Railway Company ("CN") (the "CN Merger Agreement"), the Company entered into the Merger Agreement with KCS. Pursuant to the terms of the CN Merger Agreement, KCS paid a merger termination fee of U.S. $700 million and refunded the CP merger termination fee of U.S. $700 million to CN (together, the "CN merger termination
fees"). In connection with the Merger Agreement, the Company remitted $1,773 million (U.S. $1,400 million) to KCS on September 15, 2021 in connection with KCS's payment of the CN merger termination fees.
On April 21, 2021, the five-for-one Share Split of the issued and outstanding Common Shares was approved at the Annual and Special Meeting of Shareholders. On May 13, 2021, the Company’s shareholders of record as of May 5, 2021 received four additional Common Shares for every Common Share held. Ex-distribution trading in the Company’s Common Shares on a split-adjusted basis commenced on May 14, 2021. Proportional adjustments were also made to outstanding awards under the Company's stock-based compensation plans in order to reflect the share split. All outstanding Common Shares, stock-based compensation awards, and per share amounts herein have been retrospectively adjusted to reflect the share split.STB.
Operations
The Company operates in only one operating segment: rail transportation. Although the Company provides a breakdown of revenue by business line, the overall financial and operational performance of the Company is analyzed as one segment due to the integrated nature of the rail network. Additional information regarding the Company's business and operations, including revenue and financial information, and information by geographic location is presented in Item 7. Management’s Discussion and Analysis of Financial Condition and Results of Operations, and Item 8. Financial Statements and Supplementary Data, Note 2628 Segmented and geographic information.
Lines of Business
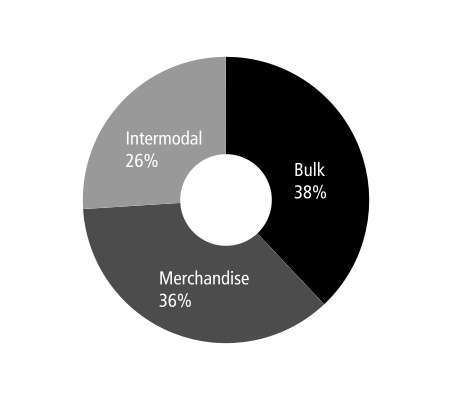
The Company transports freight consisting of bulk commodities, merchandise, and intermodal traffic. Bulk commodities, which typically move in large volumes across long distances, include Grain, Coal, Potash, and Fertilizers and sulphur. Merchandise freight consists of industrial and consumer products, such as Forest products, Energy, chemicals and plastics, Metals, minerals and consumer products, and Automotive. Intermodal traffic consists largely of retail goods in overseas containers that can be transported by train, ship and truck, and in domestic containers that can be moved by train and truck.
In 2022,2023, the Company generated Freight revenues totalling $8,627$12,281 million ($7,8168,627 million in 2021)2022). For purposes of this annual report, the following charts are presented as CPKC, which includes KCS as a consolidated subsidiary comprising a component of total freight revenues on and from April 14, 2023. Prior to April 14, 2023, the Company's 100% interest in KCS was reported as an equity-method investment.
The following chart shows the percentage of the Company’s total Freight revenues derived from each of the three major business lines in 2022:2023:
| | | | |
20222023 Freight Revenues | | |
6 CP 2022CPKC 2023 ANNUAL REPORT/ 5
BULK
The Company's Bulk business represented approximately 38%35% of total Freight revenues in 2022.2023.
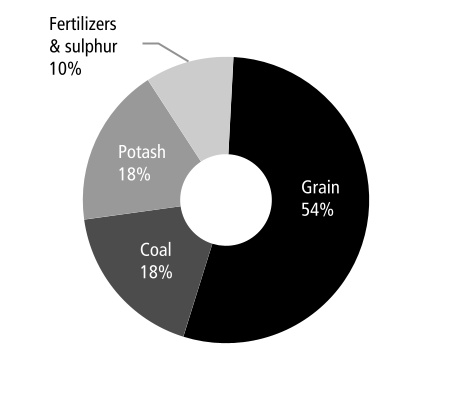
Bulk includes the Grain, Coal, Potash, and Fertilizer and sulphur lines of business. Bulk traffic predominantly moves in unit train service moving from one origin to one destination onby a single train without reclassification. The following chart shows the percentage of the Company's Bulk freight revenues by Lineline of business in 2022:2023:
| | | | |
20222023 Bulk Revenues | | |
(38%35% of Freight Revenues) | | |
Grain
The Company’s Grain business represented approximately 54%58% of Bulk revenues and was 20% of total Freight revenues in 2022.2023.
The Company's Grain network is unique among railways in North America as it is strategically positioned in the heart of grain-producing regions of western Canada and the Northern Plains of the U.S. The Company provides a service advantage to its customers through grain transportation in 8,500-foot High Efficiency Product ("HEP") trainsTrainsTM including high-capacity hopper cars, which enables the Company to efficiently serve farmers, shippers, and the entire grain supply chain. The 8,500-foot HEP trainTrainsTM can move approximately 40 percent more grain than the prior generation of grain train.
The following chart shows the percentage of the Company's Grain freight revenues generated from Canadian and U.S. shipments in 2023:
Canadian grain transported by the Company consists of both whole grains, such as wheat, durum, canola, and pulses, and soybeans, andas well as processed products such as meals, oils and malt.meals. This business is centred in the Canadian Prairies (Saskatchewan, Manitoba, and Alberta), with grain shipped primarily west to the Port of Vancouver, British Columbia and east to the Port of Thunder Bay, Ontario for export. Grain is also shipped to the U.S., and eastern Canada and Mexico for domestic consumption.
Canadian grain includes a division of business that is regulated by the Canadian government through the Canada Transportation Act (the “CTA”). This regulated business is subject to a maximum revenue entitlement (“MRE”). Under the CTA, railways can set their own rates for individual movements. However, the MRE governs aggregate revenue earned by the railway based on a formula that factors in the total volumes, length of haul, average revenue per ton, and inflationary adjustments. The regulation applies to western Canadian export grain shipments to the ports of Vancouver and Thunder Bay.
6 / CPKC 2023 ANNUAL REPORT
U.S. grain transported by the Company consists of both whole grains, such as corn, wheat, and soybeans, and durum, andas well as processed products such as meals, feed, meals, oils, and flour.oils. This business is centred in the states of Minnesota, North Dakota, and Iowa. Grain destined for domestic consumption is interchanged with other carriers to the U.S. Midwest, the U.S Northeast via Chicago, Illinois,Northern Plains and the U.S. Pacific Northwest.Midwest. The Company also delivers direct shipments of U.S. grain to western Canada primarily for animal feed. In partnership with other railways, the Company moves U.S. grain to facilities in Mexico, export terminals in the U.S. Pacific Northwest, and to various other destinations across the Gulf of Mexico. Export U.S. grain traffic is also shipped to the Port of Vancouver and the ports at Superior, Wisconsin and Duluth, Minnesota.Canada for domestic consumption.
Coal
The Company’s Coal business represented approximately 18%20% of Bulk revenues and was 7% of total Freight revenues in 2022.2023.
The following chart shows the percentage of the Company's Coal freight revenues generated from metallurgical and thermal coal in 2023:
In Canada, the Company handles mostly metallurgical coal destined for export for use in the steelmaking process. The Company’s Canadian coal traffic originates mainly from Teck Resources Limited’s mines in southeastern B.C. The Company primarily moves coal west from the mines to port terminals for export to world markets (Pacific Rim, Europe, and South America), and east for the U.S. Midwest markets..
In the U.S., the Company moves primarily thermal coal from connecting railways, serving the thermal coal fields in the Powder River Basin in Montana and Wyoming, which is delivered to power-generating facilities in the U.S. Gulf Coast and the U.S. Midwest.
Potash
The Company's Potash business represented approximately 18%13% of Bulk revenues and was 7%5% of total Freight revenues in 2022.2023.
The Company’s Potash traffic moves mainly from Saskatchewan to offshore markets through the portsPort of Vancouver, the Port of Portland, Oregon, and Thunder Bay, andthe U.S. Gulf Coast, as well as to domestic markets in the U.S.U.S Midwest. All potash shipments for export beyond Canada and the U.S. are marketed by Canpotex Limited or K+S Potash Canada. Canpotex is an export company owned in equal sharesequally by Nutrien Ltd. and The Mosaic Company. Independently, The Mosaic Company, Nutrien Ltd., and K+S Potash Canada move domestic potash with the Company primarily to the U.S. Midwest and eastern Canada for local application.
Fertilizers and Sulphur
The Company's Fertilizers and sulphur business represented approximately 10%9% of Bulk revenues and was 4%3% of total Freight revenues in 2022.2023.
The Company’s fertilizer traffic includes dry fertilizers, which are phosphate, urea, nitrate, and ammonium sulphate, and wet fertilizers, which are primarily anhydrous ammonia. Approximately half of the Company's fertilizer shipments originate from production facilities in Alberta, where abundant sources of natural gas and other chemicals provide feedstock for fertilizer production.
Most sulphur is produced in Alberta as a byproduct of oil and gas activity. Sulphur is a raw material used primarily in the manufacturing of sulphuric acid, which is used most extensively in the production of phosphate fertilizers.
CPKC 2023 ANNUAL REPORT / 7
MERCHANDISE
The Company’s Merchandise business represented approximately 36%45% of total Freight revenues in 2022.2023.
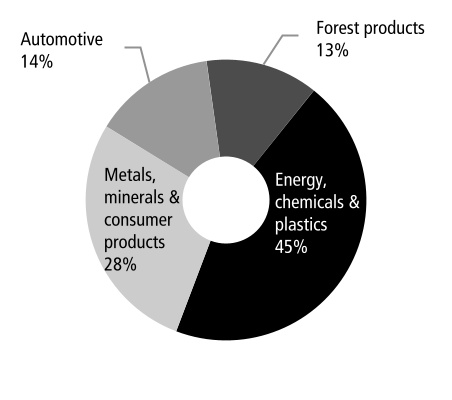
Merchandise products move in both mixed freight and unit trains in a variety of car types. Service involves delivering products to many different customers and destinations. In addition to traditional rail service, the Company moves merchandise traffic through a network of truck-rail transload facilities, expanding the reach of the Company's network to non-rail served facilities. The following chart shows the percentage of the Company's Merchandise freight revenue by Lineline of Businessbusiness in 2022:2023:
| | | | |
20222023 Merchandise Revenues | | |
(36%45% of Freight Revenues) | | |
Forest Products
The Company’s Forest products business represented approximately 13%12% of Merchandise revenues and was 5% of total Freight revenues in 2022.2023.
Forest products traffic primarily includes pulp and paper andas well as lumber and panel products shipped from key producing areas in the U.S. Gulf Coast, B.C., Ontario, Alberta, Québec, the U.S. Southeast, New Brunswick,Ontario, and the U.S. Northeast,Alberta to destinations throughout North America including the U.S. Midwest, the U.S. Northeast,Mexico, the U.S. Southeast, the U.S. Gulf Coast, and to export markets via Vancouver.the U.S. Northeast.
Energy, Chemicals and Plastics
The Company’s Energy, chemicals and plastics business represented approximately 45%42% of Merchandise revenues and was 16%19% of total Freight revenues in 2022.2023.
The Company moves energy products consisting of commodities such as fuel oil, liquefied petroleum gas ("LPG"L.P.G."), fuel oil, asphalt, gasoline, and other energy products. The majority of the Company’s western Canadian energy traffic originates in the Alberta Industrial Heartland Canada's(Canada's largest hydrocarbon processing region,region), the U.S. Gulf Coast, Saskatchewan, and Saskatchewan.Mexico. The Company accesses key destinations and export markets in Mexico, the U.S. Midwest, western Canada, the U.S. West Coast, and the U.S. Gulf Coast. The Company is a main transportation provider of refined fuels from the U.S. Gulf Coast into Mexico.
The Company’s chemical traffic includes products such as ethylene glycol, caustic soda, sulphuric acid, soda ash, and other chemical products. These shipments mainly originate from the U.S. Northeast,Gulf Coast, western Canada, and the U.S. Midwest and Mexico.move to end markets in the U.S., Mexico, Canada, and overseas.
The most commonly shipped plastics products are polyethylene and polypropylene. The majority of the Company’s plastics traffic originates from the U.S. Gulf Coast and Alberta and moves to various North American destinations.
The Company's biofuels traffic originates mainly from facilities in the U.S. Midwest, shipping primarily to destinations in the U.S. Northeast, the U.S. Gulf Coast,Southeast, and Alberta.
The Company moves crude primarily from production facilities throughout Alberta and Saskatchewan to refining markets primarily in the U.S. Gulf Coast. The majority of the Company’s crude is now moving as DRUbitTM, a sustainable heavy crude oil specifically designed for rail transportation and produced using an innovative facility known as a Diluent Recovery Unit, ("DRU"), which enables the removal of diluent at origin. This technology enables the safe and economical transportation of crude oil and is cost competitive with pipeline transportation. The Company transports DRUbitTM on a single line haul from the Hardisty Rail Terminal in Alberta to Port Neches, Texas, via interchange in Kansas City.Arthur, Texas.
The Company’s chemical traffic includes products such as ethylene glycol, caustic soda, sulphuric acid, methanol, and other chemical products. These shipments originate from western Canada, the Gulf Coast, eastern Canada, and the U.S. Midwest, and move to end markets in the U.S., Canada, and overseas.
The most commonly shipped plastics products are polyethylene and polypropylene. Approximately half of the Company’s plastics traffic originates in central and northern Alberta and moves to various North American destinations.
Metals, Minerals and Consumer Products
The Company’s Metals, minerals and consumer products business represented approximately 28%29% of Merchandise revenues and was 10%13% of total Freight revenues in 2022.2023.
The Company's Metals, minerals and consumer products freight revenues are generated from steel, aggregates, (including frac sand), steel, food and consumer products, and non-ferrous metals. Aggregate products include coarse particulate and composite materials such as frac sand, cement, limestone, gypsum,sand and other aggregate products.
The majority of frac sand originates at mines located along the Company's network in Wisconsinstone, clay bentonite, and moves to the Bakken and Marcellus shale formations, Permian shale basin, and other shale formations across North America.
Cement is shipped directly from production facilities in Alberta, the U.S. Midwest, Ontario, and Québec to energy and construction projects in the U.S. Midwest, western Canada, and the U.S. Pacific Northwest.gypsum.
The Company transports steel in various forms from mills in Mexico, the U.S. Midwest, the Canadian Prairies,U.S. Southeast, and Ontariowestern Canada to a variety of industrial users. The Company carries base metals such as aluminum, zinc, and lead. The Company also moves ores from mines to smelters and refineries for processing, and theas well as processed metalmetals to automobile and consumer productsproduct manufacturers.
The majority of frac sand originates at mines located along the Company's network in Wisconsin and Iowa and moves to the Bakken and Marcellus shale formations as well as other shale formations across North America.
Cement is shipped directly from production facilities in the U.S. Midwest, Alberta, Ontario, and Mexico to energy and construction projects in the U.S. Midwest, western Canada, Mexico, and western U.S.
Food, consumer, and other products traffic consists of a diverse mix of goods, including railway equipment, food products, railway equipment, building materials, and waste products.large domestic use appliances.
Automotive
The Company’s Automotive business represented approximately 14%17% of Merchandise revenues and was 5%8% of total Freight revenues in 2022.2023.
The Company’s Automotive portfolio consists of four finished vehicle traffic components: Canadian-produced vehicles that ship tooriginating from Canadian production facilities in Ontario, the U.S. from Ontario production facilities; vehicles, Mexico, and from overseas that moveare imported through the Port of VancouverVancouver. Finished vehicles are primarily to eastern Canadian markets as well as western Canadian markets; U.S.-produced vehicles that ship cross-border to Canadian markets as well as within the U.S.; and Mexican-produced vehicles that shipshipped to Canada, and the U.S., and Mexico. In addition to finished vehicles, the Company also ships pre-owned vehicles,automotive parts, machinery, and automotive parts.pre-owned vehicles. A comprehensive network of automotive compounds is utilized to facilitate final delivery of vehicles to dealers throughout Canada, the U.S, and inMexico. The Company services the U.S.majority of automotive plants within Mexico.
INTERMODAL
The Company’s Intermodal business represented approximately 26%20% of total Freight revenues in 2022.2023.
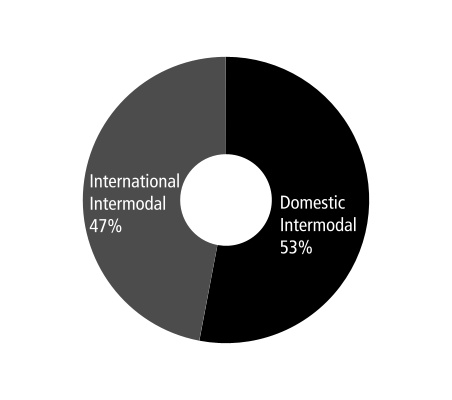
The Company's Intermodal freight revenues are generated from domestic and international movements. Domestic intermodal freight consists primarily of manufactured consumer products that are predominantly moved in 53-foot containers within North America. International intermodal freight moves in marine containers to and from ports and North American inland markets. The following chart shows the percentage of the Company's Intermodal freight revenues generated from domestic intermodal and international intermodal in 2022:2023:
| | | | |
20222023 Intermodal Revenues | | |
(26%20% of Freight Revenues) | | |
CPKC 2023 ANNUAL REPORT / 9
Domestic Intermodal
The Company's domestic business represented approximately 53%56% of Intermodal revenues and was 14%11% of total freight revenues in 2022.2023.
The Company’s domestic intermodal business moves goods from a broad spectrum of industries including wholesale, retail, food, and various other commodities. Key service factors in domestic intermodal include consistent on-time delivery and the ability to provide door-to-door service. The majority of the Company’s domestic intermodal business originates in Canada, where the Company markets its services directly to retailers and manufacturers and maintains direct relationships with its customers. In the U.S., and Mexico, the Company’s service is delivered mainly through intermodal marketing companies. In 2023, the Company launched the Mexico Midwest Express ("MMX") Series premium intermodal service to provide the first truck-competitive, single-line rail service option between the U.S. Midwest and Mexico.
International Intermodal
The Company's international business represented approximately 47%44% of Intermodal revenues and was 12%9% of total freight revenues in 2022.2023.
The Company’s international intermodal business consists primarily of containerized traffic moving between the portsPort of Vancouver,Vancouver; the Port of Montréal, Québec; the Port of Lázaro Cárdenas, Michoacán; the Port of Saint John, New Brunswick; and inland points across Canada and the U.S.North America. Import traffic from the Port of Vancouver is mainly long-haul business destined for eastern Canada and the U.S. Midwest. The Company works closely with the Port of Montréal, a major year-round East Coast gateway to Europe, to serve markets primarily in Canada and the U.S. Midwest. Import traffic from the Port of Lázaro Cárdenas is primarily destined for Mexico. The Company's access to the Port of Saint John provides the fastest rail service from the east coastEast Coast to thewestern Canadian and U.S. Midwest markets for import from and export cargo fromto Europe, South America, and Asia.
Fuel Cost Adjustment Program
The short-term volatility in fuel prices may adversely or positively impact revenues. The Company employs a fuel cost adjustment program designed to respond to fluctuations in fuel prices and help reduce volatility to changing fuel prices. Fuel surcharge revenues are earned on individual shipments and are based primarily on the price of On-Highway Diesel.Diesel in Canada and the U.S. and the public fuel price for Petróleos Mexicanos ("PEMEX") TAR Irapuato in Mexico. As such, fuel surcharge revenues are a function of freight volumes and fuel prices. Fuel surcharge
revenues accounted for approximately 15%13% of the Company's Freight revenues in 2022.2023. The Company is also subject to carbon taxation systems and levies in some jurisdictions in which it operates, the costs of which are passed on to the shipper. As such, fuel surcharge revenue includes carbon taxes and levy recoveries.
Freight revenues included fuel surcharge revenues of $1,303$1,623 million in 2022,2023, an increase of $768$320 million, or 144%25%, from $535$1,303 million in the same period of 2021.2022. This increase was primarily due to the impact of the KCS acquisition, the favourable impact from the timing of recoveries under the Company's fuel cost adjustment program, the favourable impact of the change in foreign exchange ("FX"), and higher volumes, partially offset by lower fuel prices and increased carbon tax recoveries.prices.
Significant Customers
For each of the years ended December 31, 20222023 and 2021,2022, the Company's revenues and operations were not dependent on any major customers.
Competition
The Company is in the ground transportation and logistics business. The Company sees competition in this segment from other railways, motor carriers, ship and barge operators, and pipelines. Depending on the specific market, competing railways, motor carriers, and other competitors may exert pressure on price and service levels. The Company continually evaluates the market needs and the competition. The Company responds as it deems appropriate to provide competitive services to the market. This includes developing new offerings such as transload facilities, new train services, and other logistics services.
Seasonality
Volumes and revenues from certain goods are stronger during different periods of the year. First-quarter revenues are typically lower mainly due to winter weather conditions, which results in reduced capacity under the winter operating plan with train length restrictions, the closure of the Port of Thunder Bay, and reduced transportation of retail goods. Second and third quarter revenues generally improve compared to the first quarter, as fertilizer volumes are typically highest during the second quarter and demand for construction-related goods is generally highest in the third quarter. Revenues are typically strongest in the fourth quarter, primarily as a result of the transportation of grain after the harvest, fall fertilizer programs, and increased demand for retail goods moved by rail. Operating income is also affected by seasonal fluctuations. Operating income is typically lowest in the first quarter due to lower freight revenue and higher operating costs associated with winter conditions.
Government Regulation
The Company’s railway operations are subject to extensive federal laws, regulations, and rules in the countries in which it operates, which directly affect how operations and business activities are managed.
10 / CPKC 2023 ANNUAL REPORT
Canada
The Company’s rail operations in Canada are subject to economic regulation by the Canadian Transportation Agency (the "Agency”) pursuant to authorities under the CTA. The CTA establishes a common carrier obligation and it indirectly regulates rates by providing shippers access to regulatory mechanisms for challenging freight rates, including ancillary charges, and access to regulated interswitching rates and long-haul interswitching rates; and regulatory mechanisms to challenge level of service. The CTA also establishes an MRE for the transportation of Canadian export grain and other agriculture products, which is administered by the Agency. Finally, the Agency makes regulatory determinations regarding the construction and abandonment of railway lines, commuter and passenger access, and noise and vibration-related disputes.
The Company’s rail operations in Canada are subject to safety and security regulatory requirements enforced by Transport Canada ("TC") pursuant to the Railway Safety Act ("RSA") and the Transportation of Dangerous Goods Act (the "TDGA"). The RSA regulates safety-related aspects of railway operations in Canada, including the delegation of inspection, investigation, and enforcement powers to TC. TC is also responsible for overseeing the safe and secure transportation of dangerous goods.
Various other regulators directly and indirectly affect the Company’s operations in areas such as health, safety, environment, climate, sustainability and other matters.
U.S.
The Company’s U.S. rail operations are subject to economic regulation by the STB. The STB provides economic regulatory oversight and administers Title 49 of the United States Code and related Code of Federal Regulations. The STB has jurisdiction over railroad rate and service issues, proposed railroad mergers, and other transactions.
The Company’s U.S. operations are subject to safety regulations enforced by the Federal Railroad Administration (the “FRA”), and the Pipeline and Hazardous Materials Safety Administration (“PHMSA”). The FRA regulates safety-related aspects of the Company’s railway operations in the U.S. under the Federal Railroad Safety Act, as well as rail portions of other safety statutes. The PHMSA regulates the safe transportation of hazardous materials by
rail. The Company’s U.S. rail operations are also subject to security regulations and directives by the Transportation Security Administration ("TSA"), a component of the U.S. Department of Homeland Security.
Various other regulators directly and indirectly affect the Company’s operations in areas such as health, safety, security, environmental, climate, sustainability and other matters.
Mexico
Primary regulatory oversight of the Company’s Mexican operations is provided by the Mexican Agencia Reguladora del Transporte Ferroviario (also known as Mexico's Railway Transport Regulatory Agency) (the "ARTF"). The ARTF establishes regulations concerning railway safety and operations, and is responsible for resolving disputes between railways and customers. Kansas City Southern de México, S.A. de C.V. (also known as Canadian Pacific Kansas City Mexico) ("CPKCM") must register its maximum rates with the ARTF and make regular reports to the ARTF and the Secretaría de Infraestructura, Comunicaciones y Transportes (also known as Secretariat of Infrastructure, Communications and Transportation) (the "SICT").
CPKCM must provide reports on investments, traffic volumes, theft and vandalism on the general right of way, customer complaints, fuel consumption, number of locomotives, railcars and employees, and activities around maintenance of way, sidings and spurs, among other financial information and reports. The Company may freely set rates on a non-discriminatory basis up to the maximum rates registered with the ARTF. At any time, the ARTF may request additional information regarding the determination of maximum rates and may issue recommendations with respect to proposed rate increases. If the ARTF or another party considers there to be no effective competition, they may request an opinion from the Comisión Federal de Competencia Económica (also known as Mexican Antitrust Commission) (the “COFECE”) regarding market conditions. If the COFECE determines that there is no effective competition for particular movements, the ARTF could set rates for those movements or grant limited trackage rights to another railroad while the condition of no effective competition remains.
CPKCM holds a concession from the Mexican government until June 2047, which is renewable under certain conditions for additional periods of up to 50 years (the "Concession"). CPKCM has the exclusive right to provide the freight rail service through 2037, subject to certain trackage and haulage rights granted to other freight rail concessionaires, and subject to trackage and haulage rights afforded to concessionaires of concessions that may be granted by the SICT to provide passenger rail service in the future. The Concession authorizes CPKCM to provide freight transportation services over north-east rail lines, which are a primary commercial corridor of the Mexican railroad system. CPKCM is required to provide freight railroad services to all users on a fair and non-discriminatory basis and in accordance with efficiency and safety standards approved periodically by the Mexican government. CPKCM has the right to use, but does not own, all track and buildings that are necessary for the rail lines’ operation. CPKCM is obligated to maintain the right of way, track structure, buildings and related maintenance facilities to the operational standards specified in the Concession agreement and to return the assets in that condition at the end of the Concession period. During the remainder of the Concession period, CPKCM is required to pay the Mexican government an
CPKC 2023 ANNUAL REPORT / 11
annual concession duty equal to 1.25% of gross revenues. The ARTF may request information to verify CPKCM´s compliance with the Concession and any applicable regulatory framework.
Environmental Laws, Regulations and RegulationsStrategies
The Company’s operations and real estate assets are subject to extensive federal, provincial, state, and local environmental laws and regulations, including those governing air pollutants, greenhouse gas ("GHG") emissions, (please see “Sustainability-Related Laws, Regulations and Strategies” for further discussion), management and remediation of historical contaminant sites, discharges to waters and the handling, storage, transportation, and disposal of waste and other materials. If the Company is found to have violated such laws or regulations, itor to have acted in a manner that is inconsistent with regulatory expectations, such a finding could have a material adverse effect on the Company’s business, financial condition, or operating results. In addition, in operating a railway, it is possible that releases of hazardous materials during derailments or other accidents have, or may occur, that could cause harm to human health or to the environment. Costs of remediation, damages and changes in regulations could materially affect the Company’s operating results, financial condition, and reputation. Please see “Legal and Regulatory Risks” in Item 1A. Risk Factors for further discussion.
The Company has implemented an Environmental Management System to facilitate the reduction of environmental risk. Specific environmental programs are in place and designed to address areas such as locomotive air emissions, GHG reporting, management of vegetation, wastewater, chemicals and waste, storage tanks, and fueling facilities. The Company has also undertaken environmental impact assessments and risk assessments designed to identify, prevent, and mitigate environmental risks. There is continued focus on preventing spills and other incidents that have a negative impact on the environment. There is an established strategic emergency response contractor network, and spill equipment kits are located across its network to ensuresupport a rapid and efficient response in the event of an environmental incident. In addition, emergency preparedness and response plans are regularly updated and tested.
The Company has developedestablished an environmental audit program that comprehensively, systematically,aimed at conducting thorough, systematic, and regularly assesses the Company’sroutine assessments of its facilities forto ensure compliance with legal requirements and the Company’s policies for conformanceadherence to accepted industry standards. Included in this isstandards, accompanied by a corrective action follow-up process and review by senior management.management review.
The Company focuses on key strategies, identifying tactics and actions to support and operationalize our environmental commitments. The Company’s environmental strategies include:
•Implementing measures to minimize or prevent environmental impacts from our operations and facilities, and to ensure compliance with applicable environmental laws and regulations;
•Maintaining an Environmental Management System to provide consistent, effective guidance and resources to the Company's employees in regard to the management of air emissions, dangerous goods and waste materials, emergency preparedness and response, petroleum products management, and water and wastewater systems;
•Reducing environmental and safety risk through business processes to identify and mitigate potential environmental impacts related to all the Company's operations and activities;
•Ensuring that new or altered operations and other business activities are evaluated, planned, permitted in accordance with applicable regulations, and executed to mitigate environmental risk;
•Engaging with relevant stakeholders to consider and discuss the Company’s environmental management practices and environmental issues and concerns associated with our operations;
•Employing best practices, proven technologies, and safe operating standards for activities involving elevated environmental risk; and
•Planning and preparing for emergency responses to ensure all appropriate steps are taken in the event of a derailment, spill, or other incident involving a release to the environment.
Security
The Company is subject to statutory and regulatory requirements across its network that address security concerns. The Company plays a critical role in the North American transportation system. Rail lines, facilities and equipment, including railcars carrying hazardous materials, could be direct targets or indirect casualties of terrorist attacks, actions by criminal and non-criminal organizations, and activities by individuals. Regulations by the U.S. Department of Transportation and the U.S. Department of Homeland Security include speed restrictions, chain of custody, and security measures, which can impact service and increase costs for the transportation of hazardous materials, especially materials that are toxic inhalation hazards ("TIH") materials.. Regulations issued by TC under the TDGA have added requirements for railway companies to take actions to mitigate security risks of transporting dangerous goods by rail.
The Company takes the following security measures:
•The Company employs its own police service that works closely with communities and other law enforcement and government agencies to promote railway safety and infrastructure security. As a railway law enforcement agency, the Company's Police Services hashave a central headquarterheadquarters that oversees police officers assigned to field offices responsible for railway police operations across its network. The Company's Police Services operate on the Company's rail network as well as in areas where the Company has non-railway operations;
12 / CPKC 2023 ANNUAL REPORT
•The Company's Corporate Security department is committed to providing a safe and secure work environment for the Company’s employees, contractors, visitors, and other authorized persons on the Company's property, and to protecting the Company’s assets, operations, information, the
public and the environment from damage, interference, and undue liability. As part of this commitment, Corporate Security is responsible for ensuring:overseeing: the security of the International Supply Chaininternational supply chain and its requisite programs; providing training and awareness to employees and contractors; assessing the risk and vulnerability of the Company’s properties; establishing appropriate countermeasurecountermeasures to secure and protect the Company’s properties and assets; and engage with customers and the public. Specifically, the Company employs the following to support these initiatives:
◦The Company’s Security Management Plan is a comprehensive, risk-based plan modelled on and developed in conjunction with the security plan prepared by the Association of American Railroads post-September 11, 2001. Under this plan, the Company routinely examines and prioritizes railway assets, physical and cyber vulnerabilities, and threats, as well as tests and revises measures to provide essential railway security;
◦The Company’s Public Safety Communication Centre ("PSCC") operates 24 hours a day. PSCC receives reports of emergencies, dangerous or potentially dangerous conditions, and other safety and security issues from our employees, the public, and law enforcement and other government officials. PSCC ensures that proper emergency responders and governing bodies are notified; and
•To address cyber security risks, the Company’s Enterprise Security Department implements mitigation programs that evolve with the changing technology threat environment. The Company has also worked diligently to establish backup sites to ensure a seamless transition in the event that the Company's operating systems are the target of a cyber-attack. By doing so, the Company is ableexpects to maintain network fluidity. Please see Item 1C. Cybersecurity for further discussion.
While the risk of theft and vandalism is comparatively higher in Mexico, we believe CPKCM remains among the safest and most secure methods of transportation for freight shipments in Mexico. CPKCM’s sector leading security record is due in large part to the implementation of a secure corridor: integrating a multi-layered safety and security process throughout the CPKCM network. In addition to having its own internal system, the process is connected to, and supported by, federal, state and local law enforcement. A primary focus of this effort involves maintaining diligence, intelligence and counterintelligence operations, technology-reporting applications and active vigilance while enhancing overall system velocity, which reduces the residual risk for incidents to occur.
Focus on Sustainability - Related Laws, Regulations and Strategies
Sustainability at the Company is rooted in a long-standing legacy of building for the future. We recognize that integrating sustainability into our business processes is imperative to future growth and long-term success as an organization. As one of North America’s top-performing railways, we seek to continue to innovate and to advance practices to create value for the Company’s stakeholders, including employees, customers, shareholders, suppliers, and local and Indigenous communities. We are proud to be recognized as a corporate sustainability leader in our industry.
To ensure thatThrough ongoing engagement and collaboration across and beyond our organization, the Company manages thecontinually refines our sustainability topics most significantapproach, including as part of our integration of KCS. Please see “Climate-Related Risks—Transition Risks" in Item 1A. Risk Factors for further discussion. We value feedback from our stakeholders, strive to learn from our businessperformance and stakeholders, we have structuredconstantly challenge ourselves to improve our management approach across three strategic areas. Ourpractices, including our sustainability practice is grounded in our commitment to safety, operational excellence, and social impact, and is designed to inspire action across our business.
In recent years, federal, state and international lawmakers and regulators have increased their focus on companies’ risk oversight, disclosures and practices in connection with climate change and other ESG matters. Recent legal developments with respect to climate- and other ESG-related matters include the rulemaking activities of securities regulatory authorities in Canada and the United States. In addition, recently enacted or proposed ESG-related statutes or regulations in certain U.S. states may impact the operations, preferences, activities and financial conditions of the Company and its customers and other stakeholders. We are monitoring these legal developments, as well as trends in climate and other ESG-related litigation and regulatory investigations, as well as their potential impact on the Company’s climate and other ESG-related activities (including its strategies, disclosure and risk management practices). Please see “Legal and Regulatory Risks” in Item 1A. Risk Factors for further discussion.
Sustainability Governance
Recognizing the importance of sustainability to our business and to our internal and external stakeholders, theThe Company has established a clear governance structure to effectively communicate and respond to environmental, social and governance ("ESG")relevant ESG topics, while proactivelystriving to be proactive in implementing ourits sustainability commitments and practices. The Board of Directors, through its committees, is responsible for the monitoring measurement and oversight of the Company's key risks and strategies andon sustainability topics. The Risk and Sustainability Committee of the Board reviewsis responsible for reviewing ESG performance against short- and long-term sustainability objectives, as well as strategic plans and evaluates results of stakeholder engagementopportunities to ensure alignmentalign sustainability objectives with the Company’s strategic planning.long-term climate strategy.
With oversight from the President and CEOChief Executive Officer of the Company, decisions on day-to-day implementation of the Company’s sustainability priorities areobjectives is guided by a cross-functional executive Sustainability Steering Committee. The Sustainability Steering Committee regularlyUpdates and progress reports progress and advances recommendations on the Company’sCompany's sustainability objectives policies, and management approach to sustainability topics are regularly provided to the Risk and Sustainability Committee of the Board.
Through ongoing engagement and collaboration across and beyond our organization, the Company continually refines its sustainability approach, which is driven by our values and based on a shared sense of purpose, community, and vision for the future. We value feedback from our stakeholders, strive to learn from our performance and constantly challenge ourselves to improve our practices. As we continue to embed sustainability practices in our business, we are committed to improving our ESG disclosures to align with best practices and recognized sustainability disclosure standards.
CPKC 2023 ANNUAL REPORT / 13
Climate Change
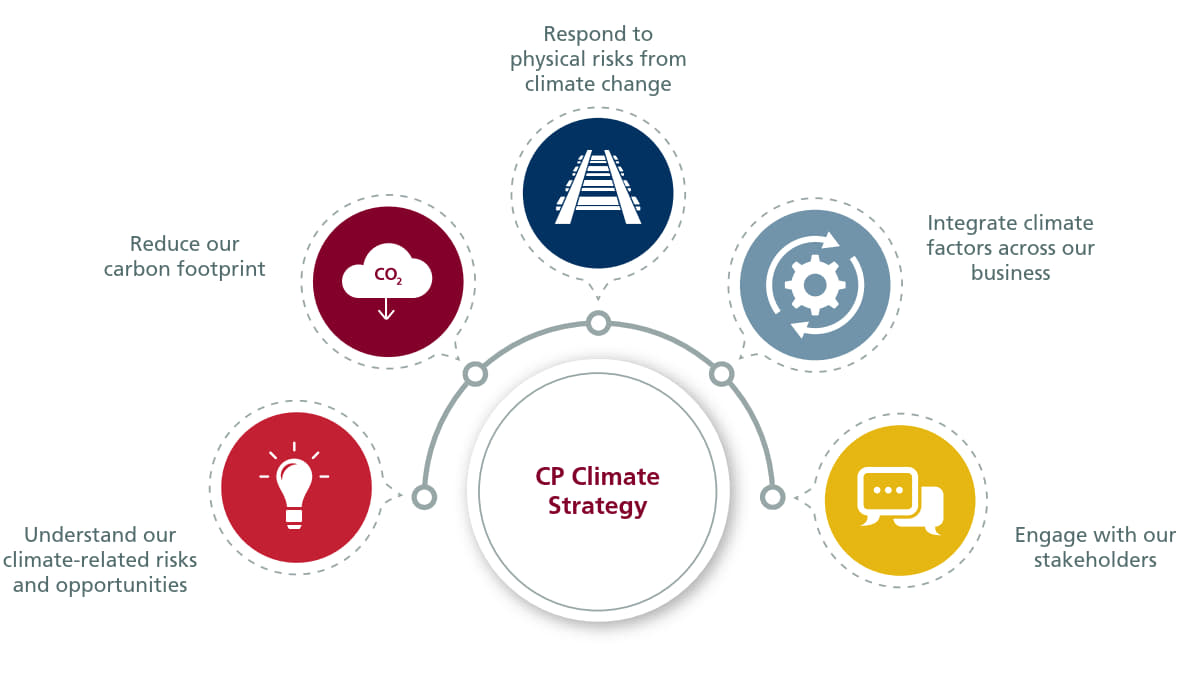
ClimateThe Company recognizes that climate change represents a significant global challengepresents both risks and the Company is committedopportunities to adapting our business and operations.business. The Company published its first Climate Strategy in 2021, outlining our approach to managing potential climate-related impacts reducing our carbon footprint, and seeking to positionacross the Company as an industry leader in the transition to a low-carbon future. As part of the Climate Strategy, the Company established science-based GHG emissions reduction targets covering 100% of Scope 1 and 2 emissions and more than half of our Scope 3 emissions.business.
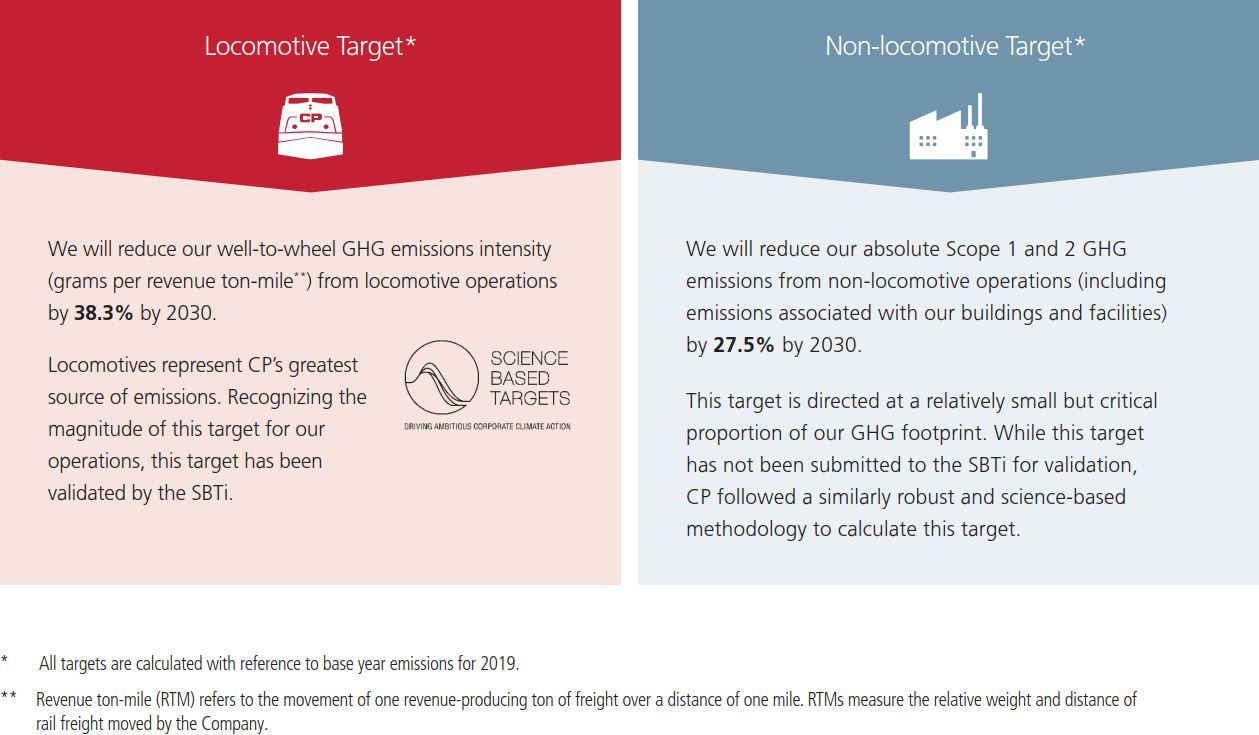
Science-based targets are used by many companies to establish a pathway for GHG emissions reduction across their organizations. Emissions reduction targets are considered science-based if they align with both current climate science and the objectives of the Paris Agreement. Over the past year, the Company has taken action to support the execution of our Climate Strategy. The Science Based Targets initiative (SBTi) workscarbon reduction efforts, including in connection with our integration of KCS. In June 2023, the private sector to set and validate science-based emissions targets, and align corporate ambitions with global goals and investor expectations for business resilience inCompany announced a net-zero economy. The SBTi has developed standardized tools, resources, and sector-specific methodologies to support company-specificconsolidated 2030 locomotive GHG emissions reduction targets.target using the SBTi’s sectoral-based approach for freight railroads and a well-below 2⁰C global warming scenario. The SBTi is a partnership ofconsolidated 2030 target for the World Resources Institute, CDP, United Nations Global Compact, andCompany's combined locomotive operations was validated by the World Wildlife Fund for Nature.
14 CP 2022 ANNUAL REPORT
SBTi.
To respond to the risks and opportunities posed by climate change and meet our decarbonization commitments, our Climate Strategy includes actions across five strategic pillars. We are strengthening roles and responsibilities for climate governance. The Company's President and CEO's oversight of the Sustainability Steering Committee includes performance related to climate change, while the Risk and Sustainability Committee of the Board provides oversight and reviews climate-related risks and opportunities. To lead our focus on decarbonization, in 2022 we have established a Carbon Reduction Task Force, composed of the Company’s industry-leading engineers and operations experts. Reporting to the Sustainability Steering Committee, the Carbon Reduction Task Force evaluates, recommends, and implements climate action measures to reduce GHG emissions and drive performance in the direction of our science-based targets.
CPThe Company also strives to advance implementation of our climate strategy by exploring carbon reduction opportunities that are aligned to the demands of our business. For example, the Company is building North America’s first line-haul hydrogen-powered locomotive using fuel cells and batteries to power the locomotive’s electric traction motors. In 2022,2023, the Company advancedcontinued to advance our hydrogen locomotive program, placing two converted hydrogen locomotive into service and advancing production on three hydrogen locomotive conversions and installinga third, as well the installation of hydrogen production and fueling facilities. This industry-leading project is demonstrating the technical performance in real-world operations and generating critical industry knowledge and experience that is informing future commercialization and development activities. CP's Hydrogen Locomotive program passed a significant milestone in 2022 by completing the first successful movement and freight service testing on the initial hydrogen locomotive.
CP aligns our reporting by including the recommendations from the Task Force on Climate-related Financial Disclosure ("TCFD") and has issued a TCFD aligned Index to demonstrate CP's full alignment to the recommendations. In addition, we regularly report on climate-related efforts through CDP and supplemental sustainability disclosures.
Human Capital Management
The Company is focused on attracting, developing, and retaining a resilient, high-performing workforce that delivers on providing service for our customers. The Company's culture is guided by three core values:the values of Accountability, Diversity, and Pride. TheseBuilt on a bedrock of respect, these values drive our actions. Everything we do is grounded in precision scheduled railroading and our five foundations of Provide Service, Control Costs, Optimize Assets, Operate Safely, and Develop People.
A team of approximately 13,00020,000 railroaders across North America underpins the Company’s success and brings value to our customers and shareholders. Accordingly, Develop People is one of the foundations of how we do business, illustrating our focus and energy towards empowering our people, providing an engaging culture, and cultivating an industry leading team.
Total Employees and Workforce
An employee is defined by the Company as an individual currently engaged in full-time, part-time, or seasonal employment with CP.the Company. The total number of employees as of December 31, 20222023, was 12,754,19,927 for CPKC, an increase of 9207,173 compared to 11,83412,754 for legacy CP only as at December 31, 2021.2022.
Workforce is defined as total employees plus contractors and consultants. The total workforce as at December 31, 20222023 was 12,824,20,038 for CPKC, an increase of 9527,214 compared to 11,87212,824 for legacy CP only as at December 31, 2021.2022.
Unionized Workforce
Class I railways are party to collective bargaining agreements with various labour unions. The majority of the Company's employees belong to labour unions and are subject to these agreements. The Company manages collaborative relationships with union members in both Canada, and the U.S. and Mexico.
Unionized employees represent nearly 74% of our workforce and are represented by 3775 active bargaining units.
Canada
Within Canada there are nine bargaining units representing approximately 7,200 Canadian unionized active employees. From time to time, we negotiate to renew collective agreements with various unionized groups of employees. In such cases, the collective agreements remain in effect until the bargaining process has been exhausted (pursuant to the Canada Labour Code). FourThree agreements are open for renewal of which one has been tentatively agreedreferred to binding Mediation/Arbitration and incollective bargaining has commenced with the ratification stage.Teamsters Canada Rail Conference for the other two. Agreements are in place with the other fivesix bargaining units in Canada, of which two collective agreements are effective until December 31, 2023, one is effective until December 31, 2024, one istwo are effective until December 31, 2025 and the last onetwo are effective until December 31, 2026.
U.S.
In the U.S., there are currently 2865 active bargaining units on fournine subsidiary railroads representing approximately 2,3004,400 unionized active employees. Agreements are in place with respect to 1762 bargaining units which will expire in or beyond 2023.2024. Negotiations have concluded on 2 agreements that are pending ratification, and negotiations are ongoing with the remaining 9three agreements.
14 / CPKC 2023 ANNUAL REPORT
Mexico
In Mexico, approximately 3,200 of CPKCM employees are covered by a single labour agreement. The compensation terms under this labour agreement are subject to renegotiation on an annual basis and all other benefits are subject to negotiation every two years. The current agreement terms will remain in effect until new terms have been negotiated in 2024.
Health and Safety
The Company is an industry leader in rail safety and we are committed to protecting our employees, our communities, our environment, and our customers’ goods. The Company remained an industry leader in train accident statistics for the 17th consecutive year and achievedfinished 2023 with the lowest everFRA train accident frequency recorded by aamong Class I railway. FRA personal injury frequency for 2022 was alsorailways: building on the second lowest ever recorded byCP's 17 consecutive years leading the Company.industry. The Company's leadership approach has been the most impactful driver of the strong safety performance metrics and we are committed to continually improving on them. Aside from running trains, many of our employees work in yards, terminals, and shops across our network with machinery and heavy equipment, orand often in extreme weather conditions. Their safety is of utmost importance to the Company and through 20222023 we have continued to look at ways to improve safety in these areas of the operation. Operate Safely is one of our five foundations of successful railroading and it starts with knowing and following the rules. The FRA reportable train accident and personal injury frequency rates are key metrics as part of the Company's annual incentive plan.
The ongoing reinforcement ofDuring 2023, we rolled out our HomeSafe initiative continues to drive improvement byKCS and CPKCM tapping into the human side of safety and promotingwhat it means to promote both safety engagement and feedback. HomeSafe defines the commitment and actions needed to ensure everyone goes home safely each day. HomeSafe puts everyone on the same level and empowers all employees to begin a safety conversation, no matter their role or position. We intend to continue strengthening our strongExpanding HomeSafe, culture in 2023 through active peer engagement, safetySafety walkabouts and awareness initiatives.other safety initiatives to the KCS and CPKCM has been instrumental in maintaining a strong safety performance in 2023.
Our reportable personal injury incidents rate per 200,000 employee-hours increased 10%15% to 1.01 (20211.16 (2022 - 0.92)1.01) and our reportable train accident rate per million train-miles decreased 15%increased 14% to 0.93 (20211.06 (2022 - 1.10)0.93). The 2022 numbers reflect legacy CP on a standalone basis. The Company’s safety performance is disclosed publicly on a quarterly basis using standardized metrics set out by the FRA.
Talent Management
The Company’s approach for talent management begins with our Human Resources department, which oversees recruitment, development, engagement, and retention with the current and future workforce and leadership of the Company.
The Management Resources and Compensation Committee of the Board of Directors reviews and informs the Company’s compensation plan and programming, and makes recommendations to the Board on succession planning for senior management and processes to identify, develop, and retain executive talent. Additionally, as part of the Company’s succession planning program, senior leaders are actively engaged in building the pool of future leaders and present their development plans to the Board.
The Company maintains a number of internal policies and processes related to recruitment, relocation, compensation, employment equity, and diversity and inclusion. The effective implementation of these policies alongside our ongoing workforce initiatives ensures the Company’s attraction and
recruitment, employee development, succession, engagement, and diversity and inclusion practices are consistent and aligned with the Company’s commitments, foundations, and values.
Attraction and Recruitment
We employ a number of recruitment strategies and retention tactics to attract and retain talent across North America. The Company offers many rewarding career opportunities in a variety of roles within the organization in both operating and support functions. We base our recruitment strategy on workforce planning needs, and our focusgoal is on ensuring that weto have a diverse candidate pool to fill our open positions.
The Company recognizes the valuable skills and experience that veterans have gained from serving their country. Our veteran program was recognized as part of Canada's Best Diversity Employers® of 2021 and weWe were named part of the top 10 Military Friendly® Employers in the U.S. for 2023.2024. The Company was also named Canada's Top 100 Employers for 20232024 as well as Alberta's Top 7580 Employers for 2023.2024.
The Company tracks recruitment performance and success rates to better understand which tactics, benefits, and strategic partnerships are most successful in bringing in and retaining new talent.
TalentTraining and Leadership Development & Succession
As partOne of our core foundation and commitmentthe Company’s five foundations is to Develop People, we encouragePeople. CPKC achieves this by providing its diverse workforce with an array of training and development opportunities.
CPKC 2023 ANNUAL REPORT / 15
Our strategy involves delivering specialized training, best practices, and skill-broadening opportunities to all employees. The Company offers a variety of training opportunities, including, but not limited to, technical/on-the-job training, role-specific offerings as well as optional courses. Training includes instructor-led in-person and virtual classes, blended, e-learning and self-directed online learning.
Non-union employees also complete annual performance reviews with development action plans with their leaders to set individual goals tied to the Company's five foundations and track progress against Company expectations as well as career development goals. Additionally, the Company offers a robust set of leadership development programs to support employees career growth.
The Company encourages all employees to take an active role in their career planning and development. We believe that investing in our employees leads to improved workplace morale and fosters a supportive working environment.
Training and Development
One of the Company’s five foundations is to Develop People, which is integral to the way we do business at the railway. Our strategy involves delivering specialized training, best practices, and skill-broadening opportunities to all employees.
The Company offers a variety of training opportunities, providing both technical/on-the-job training, role-specific offerings as well as optional courses. Training includes instructor-led classes and online on-demand, self-directed online learning.
Non-union employees also complete annual performance management and development action plans with their leaders to set individual goals tied to the Company's five key foundations and track progress against Company expectations as well as career development goals.
Diversity and Inclusion
Diversity is one of our core values. We believe that different backgrounds, experiences, and perspectives enhance creativity and innovation and encourage diversity of thought in the workplace. Fostering an inclusive environment where all employees feel empowered to strive for and achieve success supports our high-performance culture and is integral to our growth and success as an organization. Our Diversity and Inclusion team with support from senior leadership is responsible for developing programs and initiatives to achieve our diversity commitments. We are continually working on programs and opportunities to ensure we are attracting,attract, retaining, and developingdevelop the best people and skill sets for the Company. The Company is committed to increasing diversity throughout all levels of the organization.
The Company recognizes the importance of Board member diversity as a critical component of objective oversight and continuous improvement. As of December 31, 2022, four2023, five of the nine13 directors (44%(38.5%) are women. Additionally, onethree of our male directors identifiesidentify as a minority, which makes the majority of the Board of Directors (56%(61.5%) members of "designated groups" as defined in the Employment Equity Act of Canada.
The Company has regulatory requirements to report on workforce diversity representation in Canada (Employment Equity Act) and the U.S. (Equal Employment Opportunity Commission). The Company currently collects diversity data on the following categories: women, persons with disabilities, minorities, (visible minorities), and Indigenous peoples (Canada) from employees, as shown in the table below, through voluntary self-disclosure. The Company continues to focus our efforts on attracting, recruiting, and developing a diverse workforce. This data is shared in various disclosures and government reporting, internally with employees and leaders, as well as our Board of Directors.
Year over Year Diversity Representation
| | | | | | | | | |
Canada and U.S. Diversity Percentages(1) | 2022 | 2021 | |
| Women | 9 | % | 10 | % | |
| Persons with disabilities | 3 | % | 3 | % | |
Minorities (visible minorities)(2) | 16 | % | 14 | % | |
| Indigenous peoples (Canada only) | 4 | % | 3 | % | |
| | | | | | | | | |
Diversity Percentages(1) | 2023 | 2022 | |
| Women (U.S., Canada & Mexico) | 8 | % | 9 | % | |
| Minorities (U.S. & Canada) | 20 | % | 16 | % | |
| Indigenous peoples (Canada only) | 4 | % | 4 | % | |
(1) Percentages are based on total active employees at year-end.
(2) The Minority is a term used in2022 numbers reflect legacy CP employees only and the U.S., Visible Minority is a term used in Canada.
The Company continues to work collaboratively with our employees, communities, and partner organizations along our network to progress and support the Company’s commitment toward a more representative and inclusive workplace. Some of our initiatives include:
•Establishing three diversity councils (Indigenous, Gender, and Racial). Each council is chaired by an executive and represents a diverse group of2023 numbers reflect CPKC employees. The councils work to ensure we consider diversity and inclusion when we make decisions, provide feedback on corporate directions and promote initiatives that relate to each council’s area of focus;
•Providing a company wide diversity and inclusion anonymous survey, the results of which aid in putting in place initiatives and educational opportunities;
•Continuing our existing partnerships with associations and organizations that attract, recruit, and support skilled immigrants, transitioning veterans, persons with disabilities, and women;
•Working with Indigenous groups to develop relationships that are more meaningful, create targeted outreach programs and employment opportunities, and better understand Indigenous history, culture, and opportunities for collaboration;
•Supporting the development and advancement of women at the Company; and
•Increasing employee awareness regarding the Company’s workplace diversity and inclusion practices through communications, education, and training.
We pride ourselves on offering a diverse workplace with a variety of careers in both our corporate and field locations. We recruit and hire talent based on relevant skills and experience, and seek to attract the highest quality candidates regardless of gender, age, cultural heritage, or ethnic origin. One of our primary objectives is attracting, recruiting, retaining, and developing a workforce representative of the communities in which we operate.
Available Information
The Company makes available on or through its website www.cpr.cawww.cpkcr.com free of charge, its annual reports on Form 10-K, quarterly reports on Form 10-Q, current reports on Form 8-K and all amendments to those reports filed or furnished pursuant to Section 13(a) or 15(d) of the Exchange Act as soon as reasonably practicable after such reports are filed with or furnished to the SEC. Our website also contains charters for each of the committees of our Board of Directors, our corporate governance guidelines and our Code of Business Ethics. This Form 10-K and other SEC filings made by the Company are also accessible through the SEC’s website at www.sec.gov.
All references to websites (including our websiteswebsite) contained herein do not constitute incorporation by reference of information contained on such websites and such information should not be considered part of this document.
1816 / CP 2022CPKC 2023 ANNUAL REPORT
ITEM 1A. RISK FACTORS
The risks set forth in the following risk factors could have a materially adverse effect on the Company's business, financial condition, results of operations, and liquidity, and could cause those results to differ materially from those expressed or implied in the Company's forward-looking statements and forward-looking information (collectively, "forward-looking statements").
The information set forth in this Item 1A. Risk Factors should be read in conjunction with the rest of the information included in this annual report, including Item 7. Management’s Discussion and Analysis of Financial Condition and Results of Operations and Item 8. Financial Statements and Supplementary Data.
Business and Operational Risks
As a common carrier, the Company is required by law to transport dangerous goods and hazardous materials, which could expose the Company to significant costs and claims. Railways, including the Company, are legally required to transport dangerous goods and hazardous materials as part of their common carrier obligations regardless of risk or potential exposure to loss. The Company transports dangerous goods and hazardous materials, including but not limited to crude oil, ethanol, and TIH materials such as chlorine gas and anhydrous ammonia. A train accident involving hazardous materials could result in significant claims against the Company arising from personal injury, property or natural resource damage, environmental penalties, and remediation obligations. Such claims, if insured, could exceed the existing insurance coverage commercially available to the Company, which could have a material adverse effect on the Company’s financial condition, operating results, and liquidity. The Company is also required to comply with rules and regulations regarding the handling of dangerous goods and hazardous materials across its network. Noncompliance with these rules and regulations can subject the Company to significant penalties and could factor in litigation arising out of a train accident. Changes to these rules and regulations could also increase operating costs, reduce operating efficiencies and impact service delivery.
The Company faces competition from other transportation providers and failure to compete effectively could adversely affect financial results. The Company faces significant competition for freight transportation across its network, including competition from other railways, motor carriers, ship and barge operators, and pipelines. Competition is based mainly on quality of service, freight rates, and access to markets. Other transportation modes generally use public rights-of-way that are built and maintained by government entities, while the Company and other railways must use internal resources to build and maintain their rail networks. Competition with the trucking industry is generally based on freight rates, flexibility of service, and transit time performance. Any future improvements or expenditures materially increasing the quality or reducing the cost of alternative modes of transportation, or legislation that eliminates or significantly reduces the burden of the size or weight limitations currently applicable to trucking carriers, could have a material adverse effect on the Company's financial results.
The operations of carriers with which the Company interchanges may adversely affect operations. The Company's ability to provide rail services to customers across its network also depends upon its ability to maintain cooperative relationships with connecting carriers with respect to, among other matters, revenue division, car supply and locomotive availability, data exchange and communications, reciprocal switching, interchange, and trackage rights. Deterioration in the operations or services provided by connecting carriers, or in the Company's relationship with those connecting carriers, could result in the Company's inability to meet customers' demands or require the Company to use alternate train routes, which could result in significant additional costs and network inefficiencies and adversely affect our business, operating results, and financial condition.
The Company may be affected by acts of terrorism, war, or risk of war. The Company plays a critical role in the North American transportation system and therefore could become the target for acts of terrorism or war. The Company is also involved in the transportation of hazardous materials, which could result in the Company's equipment or infrastructure being direct targets or indirect casualties of terrorist attacks. Acts of terrorism, or other similar events, any government response thereto, and war or risk of war could cause significant business interruption to the Company and may adversely affect the Company’s results of operations, financial condition and liquidity.
The Company may beis affected by fluctuating fuel prices. Fuel expense constitutes a significant portion of the Company’s operating costs. Fuel prices can be subject to dramatic fluctuations, and significant price increases could have a material adverse effect on the Company's results of operations. The Company currently employs a fuel cost adjustment program to help reduce volatility in changing fuel prices, but the Company cannot be certain that it will always be able to fully mitigate rising or elevated fuel costsprices through this program. Factors affecting fuel prices include worldwide oil demand, international politics,geopolitics, weather, refinery capacity, supplier and upstream outages, unplanned infrastructure failures, environmental and sustainability policies, and labour and political instability.
The Company relies on technology and technological improvements to operate its business and we are subject to cybersecurity risks.business. Information technology is critical to all aspects of the Company’s business, and the Company relies on technology systems operated by us or under control of third parties. Although the Company devotes significant resources to protect its technology systems and proprietary data, there can be no assurance that the systems we have designed to prevent or limit the effects of cyber incidents or attacks will be sufficient to prevent or detectin averting such incidents or attacks, or to avoid a material adverse impact on our systems after such incidents or attacks do occur. attacks. (Please see “Item 1C. Cybersecurity” for further discussion). The Company is continually evaluatingevaluates attackers’ techniques, and tactics and the Company ismotives, and strives to be diligent in its monitoring, training, planning, and prevention. However, due to the increasing sophistication of
cyber-attacks and greater complexity inwithin our IT supply chain, the Company may be unable to anticipate or implement appropriate preventive measures to detect and respond to a security breach.
CPKC 2023 ANNUAL REPORT / 17
This includes the raisingrising rates of reported ransomware events, increased human error, or other cyber-attack methods disrupting the Company’sthe Company’s systems or the systems of third parties. If the Company or third parties whose technology systems we rely on were to experience a significant disruption or failure of one or more of their information technology or communications systems (either as a result of an intentional cyber or malicious act, or an unintentional error), it could result in significant service interruptions, or othersafety failures safety failures,or other operational difficulties such as: unauthorized access to the loss of access to or misappropriation of competitively sensitive, confidential or other critical information or systems, loss of customers, financial losses, regulatory fines, and misuse or corruption of critical data and proprietary information, which could have a material adverse effect on the Company's results of operations, financial condition, and liquidity. The Company also may experience security breaches that could remain undetected for an extended period and, therefore, have a greater impact on the services we offer. In addition, if thethe Company is unable to acquire or implement new technology in general, the Company may suffer a competitive disadvantage, which could also have an adverse effect on its results of operations, financial condition, and liquidity.
Human Capital Risks
The availability of qualified personnel could adversely affect the Company's operations. Changes in employee demographics, training requirements and the availability of qualified personnel, particularly locomotive engineers and trainpersons, could negatively impact the Company’s ability to meet demand for rail services. Unpredictable increases in the demand for rail services may increase the risk of having insufficient numbers of trained personnel, which could have a material adverse effect on the Company’s results of operations, financial condition and liquidity. In addition, changes in operations and other technology improvements may significantly impact the number of employees required to meet the demand for rail services.
Strikes or work stoppages could adversely affect the Company's operations. Class I railways are party to collective bargaining agreements with various labour unions. The majority of the Company's employees belong to labour unions and are subject to these agreements. Disputes with regard to the terms of these agreements or the Company's potential inability to negotiate mutually acceptable contracts with these unions, have resulted in, and could in the future result in, among other things, strikes, work stoppages, slowdowns, or lockouts, which could cause a significant disruption of the Company's operations and have a material adverse effect on the Company's results of operations, financial condition, and liquidity. Additionally, future national labour agreements, or provisions of labour agreements related to health care, could significantly increase the Company's costs for health and welfare benefits, which could have a material adverse impact on its financial condition and liquidity.
Legal and Regulatory Risks
The Company is subject to significant governmental legislation and regulation over commercial, operating and environmental, climate, sustainability and other matters. The Company’s railway operations are subject to extensive federal laws, regulations and rules in the countries it operates. Operations are subject to economic and safety regulations in Canada primarily by the Agency and TC. The Company’s U.S. operations are subject to economic and safety regulation by the STB and the FRA. The Company’s Mexican operations are subject to economic and safety regulations by the SICT and ARTF. Any new rules from our regulators could have a material adverse effect on the Company's financial condition, results of operations and liquidity as well as its ability to invest in enhancing and maintaining vital infrastructure. Various other regulators, including the FRA, and its sister agency within the U.S. Department of Transportation, the PHMSA, directly and indirectly affect the Company’s operations in areas such as health, safety, security, environmental and other matters. Together, the FRA and the PHMSA have broad jurisdiction over railroad operating standards and practices, including track, freight cars, locomotives, and hazardous materials requirements. In addition, the U.S. Environmental Protection Agency (“EPA”) has regulatory authority with respect to matters that impact the Company's properties and operations. Additional regulation of the rail industry by these regulators or federal and state or provincial legislative bodies, whether under new or existing laws, may result in increased capital expenditures and operating costs and could have a significant negative impact on the Company’s ability to determine prices for rail services and result in a material adverse effect in the future on the Company’s business, financial position, results of operations, and liquidity in a particular year or quarter. This potential material adverse effect could also result in reduced capital spending on the Company’s rail network or in abandonment of lines.
The Company is subject to environmental laws and regulations that may result in significant costs. The Company’s operations are subject to extensive federal, state, provincial (Canada) and local environmental laws concerning, among other matters,and regulations, including those governing air pollutants, GHG emissions, management and remediation of historical contaminant sites, discharges to the air, land, and water,waters and the handling, storage, transportation, and disposal of hazardous materialswaste and wastes.other materials. (Please see “Environmental Laws, Regulations and Strategies” and “Sustainability-Related Laws, Regulations and Strategies” in Item 1. Business for further discussion). Violation of these laws and regulations can result in significant fines and penalties, as well as other potential impacts on the Company’s operations. These laws can impose strict, and in some circumstances, joint and several liability on both current and former owners, and on operators of facilities. If the Company is found to have violated such laws or regulations or to have acted in a manner that is inconsistent with regulatory expectations, such a finding could have a material adverse effect on the Company’s business, financial condition, or operating results.
Such environmental liabilities may also be raised by adjacent landowners or third parties. In addition, in operating a railway, it is possible that releases of hazardous materials during derailments or other accidents may occur that could cause harm to human health or to the environment. Costs of remediation, damages and changes in regulations could materially affect the Company’s operating results and reputation. The Company has been, and may in the future be, subject to allegations or findings to the effect that it has violated, or is strictly liable under, environmental laws or regulations. The Company currently has obligations at existing sites for investigation, remediation and monitoring, and will likely have obligations at other sites in the future. The actual costs associated with both current and long-term liabilities may vary from the Company’s estimates due to a number of factors including, but not limited to changes in: the content or interpretation of environmental laws and regulations; required remedial actions; technology associated with site
18 / CPKC 2023 ANNUAL REPORT
investigation or remediation; and the involvement and financial viability of other parties that may be responsible for portions of those liabilities. The Company’s Mexican operations are subject to Mexican federal and state laws and regulations relating to the protection of the environment concerning, among other matters, emissions to the air, land, and water, and the handling of hazardous materials and wastes, and are also subject to the compliance with standards for water discharge, water supply, emissions, noise pollution, hazardous substances and transportation and handling of hazardous and solid waste. The Mexican government may bring administrative and criminal proceedings, impose economic sanctions against companies that violate environmental laws, and temporarily or even permanently close non-complying facilities.
The Company may beis subject to claims and litigation that could result in significant expenditures. Due to the nature of its operations, the Company is exposed to the potential for claims and litigation arising out of personal injury, property damage or freight damage, employment, labour contract or other commercial disputes, and environmental, climate or sustainability, or other liability. The Company accrues for potential losses in accordance with applicable accounting standards, based on ongoing assessments of the likelihood of an adverse result in a claim or litigation together with the monetary relief or other damages sought or potentially recoverable. Material changes to litigation trends, a significant rail or other incident or series of incidents involving freight damage or loss, property damage, personal injury, or environmental, climate or sustainability, or other liability, and other significant matters could have a material adverse impact to the Company's operations, reputation, financial position or liquidity.
Supply Chain Risks
Disruptions within the supply chain could negatively affect the Company's operational efficiencies and increase costs. The North American transportation system is integrated. The Company’s operations and service may be negatively impacted by service disruptions of other transportation links, such as ports, handling facilities, customer facilities, and other railways. A prolonged service disruption at one of these entities could have a material adverse effect on the Company's results of operations, financial condition, and liquidity.
The Company is dependent on certain key suppliers of core railway equipment and materials that could result in increased price volatility or significant shortages of materials, which could adversely affect results of operations, financial condition, and liquidity. Due to the complexity and specialized nature of core railway equipment and infrastructure (including rolling stock equipment, locomotives, rail and ties), there can beare a limited number of suppliers of rail equipment and materials available. Should these specialized suppliers cease production or experience capacity or supply shortages, this concentration of suppliers could result in the Company experiencing cost increases or difficulty in obtaining rail equipment and materials, which could have a material adverse effect on the Company's results of operations, financial condition, and liquidity. Additionally, the Company’s operations are dependent on the availability of diesel fuel. A significant fuel supply shortage arising from production decreases, increased demand in existing or emerging foreign markets, disruption of oil imports, disruption of domestic refinery production, damage to refinery or pipeline infrastructure, political unrest, war or other factors could have a material adverse effect on the Company's results of operations, financial position, and liquidity in a particular year or quarter.
Risks Related to the Kansas City Southern Transaction
FollowingThe conditions imposed by the closing of the KCS acquisition into a voting trust, although the Company does not control KCS, KCS’s operational and financial performanceSTB’s March 15, 2023 final decision could have an adverse effect on the Company’s businesses, results of operations, financial condition, cash flows or results of operations. On December 14, 2021, the KCS acquisition closed into a voting trust, whereby the Company indirectly acquired a 100% beneficial ownership interest in KCS but does not control KCS. KCS’s voting stock was deposited into a voting trust that insulates KCS from control by the Company. The Company will not control KCS until STB control approval is obtained. Until that time, KCS will be managed by its own executive team overseen by its own Board of Directors and the voting trust.
The voting trust precludes the Company from exercising control over the business strategy or other operational aspects of KCS. The Company’s investment in this unconsolidated entity was considered significant under Rule 3-09 of Regulation S-X for the year ended December 31, 2022. The Company cannot provide assurance that KCS will operate in a manner that will increase themarket value of the Company’s investments,common stock and debt securities, or reduce the anticipated benefits of the combination. In connection with the STB's March 15, 2023 final decision, the STB imposed a number of conditions, including among others (i) commitments by the combined company to keep gateways open on commercially reasonable terms and create no new bottlenecks, (ii) environmental-related conditions, (iii) data reporting and retention requirements, and (iv) a seven-year oversight period for the STB to monitor adherence to these conditions. In addition, the Company inherits conditions previously imposed by the STB on KCS in connection with various prior KCS acquisitions, including in relation to KCS’s commitment to keep the Laredo gateway open on commercially reasonable terms in connection with its prior acquisition of The Texas Mexican Railway. Furthermore, the STB has noted its authority to issue supplemental orders to address issues or concerns that may arise in the future. These conditions could disrupt the Company’s income or losses from KCS will continue atbusinesses, and uncertainty about the current level inoutcome of that review could divert management’s attention and resources, and reduce the anticipated benefits of the combination, and may have an adverse effect on the combined company. Further, the combination may give rise to potential liabilities, including as a result of pending and future or thatshareholder lawsuits and other litigation relating to the combination. In addition, the Company will nothas incurred, and expects to incur losses from KCS. Write-downs toadditional, material non-recurring expenses in connection with the carrying amountcompletion of the combination and integration activities. Any of these matters could adversely affect the businesses of, or harm the results of operations, financial condition or cash flows of the Company and the market value of the Company’s equity interest could adversely impact the Company’s results of operations.common stock and debt securities.
The Company incurred substantial indebtedness in connection with consummation of the acquisition, which may pose risks and/or intensify existing risks.Prior to the KCS acquisition closing into voting trust that occurred on December 14, 2021, the Company incurred additional indebtedness of approximately U.S. $6.7 billion and $2.2 billion notes and a U.S. $500 million term loan to indirectly fund the acquisition.
The foregoing indebtedness, as well as any additional indebtedness we may incur, could have the effect, among other things, of reducing our liquidity and may limit our flexibility in responding to other business opportunities and increasing our vulnerability to adverse economic and industry conditions.
Our ability to make payments of principal and interest on our indebtedness depends upon our future performance, which will be subject to general economic, financial and business conditions, sufficient cash flow from KCS during the period in which it is in the voting trust, the implementation of the integration with KCS (if the STB approves our assuming control of KCS), and other factors affecting our operations, many of which are beyond our control. In addition, we may be
CPKC 2023 ANNUAL REPORT / 19
required to redeem all of the outstanding 2.450% notes due 2031 and 3.000% notes due 2041 pursuant to a special mandatory redemption requirement of those notes, which could have a significant adverse impact on the business and financial condition of the Company. For more information, see "The combination is subject to final approval by the STB, and there can be no assurance as to whether and when it may be approved or if such approval will be granted with conditions acceptable to the parties; accordingly, the combination may be delayed, jeopardized or prevented entirely and the anticipated benefits of the combination could be reduced".
Our increased indebtedness could also reduce funds available for working capital, capital expenditures, acquisitions and other general corporate purposes and may create competitive disadvantages relative to other companies with lower debt levels. If we obtain control of KCS but we do not achieve the
expected benefits and cost savings from the combination, or if the financial performance of the combined company does not meet current expectations, then our ability to service our indebtedness may be adversely impacted.
The agreements that govern the indebtedness that has been incurred in connection with the KCS acquisition contain various affirmative and negative covenants that may, subject to certain customary exceptions, restrict our ability to, among other things, create liens over our property, change our line of business and/or merge or consolidate with any other person or sell or convey certain of our assets to another person. In addition, some of the agreements that govern our debt financings contain a financial covenant that requires us to maintain certain financial ratios. Various risks, uncertainties and events beyond our control could affect our ability to comply with these covenants and failure to comply with them could result in an event of default, which, if not cured or waived, could accelerate our repayment obligations. Under these circumstances, we may not have sufficient funds or other resources to satisfy all of our obligations.
Moreover, we may be required to raise substantial additional financing to fund working capital, capital expenditures, acquisitions or other general corporate requirements. Our ability to arrange additional financing or refinancing will depend on, among other factors, our financial position and performance, as well as prevailing market conditions and other factors beyond our control. There can be no assurance that we will be able to obtain additional financing or refinancing on terms acceptable to us or at all.
The pendency of the STB's regulatory review of the combination could have an adverse effect on the Company’s businesses, results of operations, financial condition, cash flows or the market value of the Company’s common stock and debt securities. The pendency of the regulatory review of the combination could disrupt the Company’s businesses, and uncertainty about the outcome of that review may have an adverse effect on the Company or the combined company. The attention of the Company’s management may be directed towards obtaining final approval from the STB and addressing related requests from the third parties for conditions on STB approval and may be diverted from the day-to-day business operations of the Company. Matters related to the combination may require commitments of time and resources that could otherwise have been devoted to other opportunities that might have been beneficial to the Company. Further, the combination may give rise to potential liabilities, including as a result of pending and future shareholder lawsuits relating to the combination. In addition, the Company has incurred, and expects to incur additional, material non-recurring expenses in connection with the completion of the combination. Any of these matters could adversely affect the businesses of, or harm the results of operations, financial condition or cash flows of the Company, and the market value of the Company’s common stock.
The combination is subject to final approval by the STB, and there can be no assurance as to whether and when it may be approved or if such approval will be granted with conditions acceptable to the parties; accordingly, the combination may be delayed, jeopardized or prevented entirely and the anticipated benefits of the combination could be reduced. The STB has the authority to impose conditions on its approval of a control transaction to alleviate competitive and other public interest harm. If such conditions were imposed, the anticipated benefits of the combination might be reduced. There is no assurance that final approval from the STB will be obtained or obtained on terms acceptable to the Company.
In addition, the STB's review process allows railroad competitors of the Company and KCS and other interested parties to intervene to oppose the STB application or seek conditions in the event approval by the STB is granted, which might delay the approval process or reduce the anticipated benefits of the combination. For example, on February 28, 2022, CN filed a responsive application asking the STB to condition any approval of a CP-KCS combination on the divestiture of KCS lines from Kansas City, Missouri to Springfield and East St. Louis, Illinois to CN, pursuant to the STB’s statutory authority to order “the divestiture of parallel tracks” as a merger condition. Furthermore, if the STB does not provide final approval or imposes conditions on its approval in a final order, and the Company and KCS decide to appeal such final order from the STB, any such appeal might not be resolved for a substantial period of time after the entry of such order by the STB.
If we determine in our reasonable judgment that the STB final approval will not be sought or has not or will not be received prior to March 25, 2023, then we will be required to redeem all of the outstanding 2.450% notes due 2031 and 3.000% notes due 2041 at a special mandatory redemption price equal to 101% of the aggregate principal amount of the applicable notes plus accrued and unpaid interest, if any. The Company may not have sufficient funds or other resources to satisfy such repurchase obligation, which could have a significant adverse impact on the business and financial condition of the Company.
If either (i) final approval from the STB has not been obtained by December 31, 2023 or (ii) the STB has, by a final and non-appealable order, refused to provide final approval (an “STB denial”), the Company would be required to dispose of its investment in KCS. Similarly, if the STB imposes onerous conditions on its final approval, the Company may choose to dispose of its investment in KCS rather than agreeing to the conditions imposed by the STB. In either case, the Company would be obligated under the voting trust agreement to directly or indirectly divest the trust stock in a manner that is acceptable to the STB. In the case of a divestiture, the market and divestiture alternatives for the trust stock might be limited, and such a disposition could cause the Company to incur significant losses and expenses in connection with the transaction, which could have a significant adverse impact on the business and financial condition of the Company.
The Company may be unable to integrate KCS successfully, and the Company may not experience the growth being sought from the combination. The CompanyCPRL and KCS have operated and,independently until the receipt of final approval from the STB, will continue to operate, independently.
Control Date. Integrating KCS with CP following STB approval of CP controlCPKC will involve operational, technological and personnel-related challenges. This process will beis time-consuming and expensive, may disrupt the businesses of either or both of the companies and may reduce the growth opportunities sought from the combination. There can be no guarantee of the successful integration of KCS or that the combined company will realize the anticipated benefits of the business combination, whether financial, strategic or otherwise, and this may be exacerbated by changes to the economic, political and global environment in which the merged company would operate.operates.
Risks related to Operations in Mexico
The Mexican concession of CPKCM is subject to revocation or termination in certain circumstances, which would prevent CPKCM from conducting rail operations under the Concession and would have a material adverse effect on the Company’s consolidated financial statements. CPKCM operates under the Concession granted by the Mexican government for a period of 50 years which is renewable under certain conditions for additional periods, each of up to 50 years. The Concession gives CPKCM exclusive rights to provide freight transportation services over its rail lines through 2037 (the first 40 years of the 50-year Concession), subject to certain trackage and haulage rights granted to other freight rail concessionaires, and subject to trackage and haulage rights afforded to concessionaires of concessions that may be granted by the SICT to provide passenger rail service in the future.
The SICT and ARTF, which are principally responsible for regulating railroad services in Mexico, have broad powers to monitor CPKCM’s compliance with the Concession, and they can require CPKCM to supply them with any technical, administrative and financial information they request. Among other obligations, CPKCM must comply with the investment commitments established in its business plan, which forms an integral part of the Concession, and must update the plan every three years. The SICT treats CPKCM’s business plans confidentially. The SICT and ARTF also monitor CPKCM’s compliance with efficiency and safety standards established in the Concession. The SICT and ARTF review, and may amend, these standards from time to time. COFECE also has the authority to regulate railroad service in Mexico, having powers to monitor compliance with the antitrust laws as well as to investigate and determine remedies for anticompetitive practices.
Under the Concession, CPKCM has the right to operate its rail lines, but it does not own the land, roadway or associated structures. If the Mexican government legally terminates the Concession, it would own, control, and manage such public domain assets used in the operation of CPKCM’s rail lines. All other property not covered by the Concession, including all locomotives and railcars otherwise acquired, would remain CPKCM’s property. In the event of early termination, or total or partial revocation of the Concession, the Mexican government would have the right to cause the Company to lease all service related assets to it for a term of at least one year, automatically renewable for additional one-year terms for up to five years. The amount of rent would be determined by experts appointed by CPKCM and the Mexican government. The Mexican government must exercise this right within four months after early termination or revocation of the Concession.
In addition, the Mexican government would also have a right of first refusal with respect to certain transfers by CPKCM of railroad equipment within 90 days after revocation of the Concession. The Mexican government may also temporarily seize control of CPKCM’s rail lines and its assets in the event of a natural disaster, war, significant public disturbance or imminent danger to the domestic peace or economy. In such a case, the SICT may restrict CPKCM’s ability to operate under the Concession in such manner as the SICT deems necessary under the circumstances, but only for the duration of any of the foregoing events. Mexican law requires that the Mexican government pay compensation if it effects a statutory appropriation for reasons of the public
20 / CPKC 2023 ANNUAL REPORT
interest. With respect to a temporary seizure due to any cause other than international war, the Mexican Regulatory Railroad Service Law and regulations provide that the Mexican government will indemnify an affected concessionaire for an amount equal to damages caused and losses suffered. However, these payments may not be sufficient to compensate CPKCM for its losses and may not be made timely.
The SICT may revoke the Concession if CPKCM is sanctioned for the same cause at least three times within a period of five years for any of the following: unjustly interrupting the operation of its rail lines or rendering its public services for charging rates higher than those it has registered with the ARTF; unlawfully restricting the ability of other Mexican rail operators to use its rail lines; failing to make payments for damages caused during the performance of services; failing to comply with any term or condition of the Mexican Regulatory Railroad Service Law and regulations or the Concession; failing to make the capital investments required under its three-year business plan filed with the SICT; or failing to maintain an obligations compliance bond and insurance coverage as specified in the Mexican Regulatory Railroad Service Law and regulations. In addition, the Concession would terminate automatically if CPKCM changes its nationality or assigns or creates any lien on the Concession, or if there is a change in control of CPKCM without the SICT’s approval.
The SICT may also terminate the Concession as a result of CPKCM’s surrender of its rights under the Concession, or for reasons of public interest or upon CPKCM’s liquidation or bankruptcy. If the Concession is terminated or revoked by the SICT for any reason, CPKCM would receive no compensation and its interest in its rail lines, and all other fixtures covered by the Concession, as well as all improvements made by it, would revert to the Mexican government. Revocation or termination of the Concession could have a material adverse effect on the Company’s consolidated financial statements.
The Company’s ownership of CPKCM and operations in Mexico subject it to Mexican economic and political risks. The Mexican government has exercised, and continues to exercise, significant influence over the Mexican economy. Accordingly, Mexican governmental actions concerning the economy and state-owned enterprises could have a significant impact on Mexican private sector entities in general and on CPKCM’s operations in particular. For example, CPKCM operations could be impacted with the introduction of new legislation or policies to regulate the railway industry, the energy market, or labour and tax conditions. The Company cannot predict the impact that the political landscape, including multiparty rule, social unrest and civil disobedience, will have on the Mexican economy or CPKCM’s operations. For example, from time to time, teachers' protests in Mexico have resulted in service interruptions on CPKCM’s right of ways. The Company’s consolidated financial statements and prospects may be adversely affected by currency fluctuations, inflation, interest rates, regulation, taxation and other political, social and economic developments in or affecting Mexico. For example, the Company has a tax contingency related to an audit assessment, which is currently in litigation, for the CPKCM 2014 Mexico tax return. An adverse resolution of these matters could have a material adverse effect on the Company’s consolidated financial statements in a particular quarter or period. Tax contingencies are further discussed in Notes 6 and 26 of Item 8. Financial Statements and Supplementary Data.
The social and political situation in Mexico could adversely affect the Mexican economy and CPKCM’s operations, and changes in laws, public policies and government programs could be enacted, each of which could also have a material adverse effect on the Company’s consolidated financial statements.
The Mexican economy in the past has suffered balance of payment deficits and shortages in FX reserves. Although Mexico has imposed foreign exchange controls in the past, there are currently no exchange controls in Mexico. Any restrictive exchange control policy could adversely affect the Company’s ability to obtain U.S. dollars or to convert Mexican pesos into dollars for purposes of making payments. This could have a material adverse effect on the Company’s consolidated financial statements.
Downturns in the United States economy or in trade between the United States and Asia or Mexico and fluctuations in the peso-dollar exchange rates could have material adverse effects on the Company’s consolidated financial statements. The level and timing of the Company’s Mexican business activity is heavily dependent upon the level of United States-Mexican trade and the effects of current or future multinational trade agreements on such trade. The Mexican operations depend on the United States and Mexican markets for the products CPKCM transports, the relative position of Mexico and the United States in these markets at any given time, and tariffs or other barriers to trade. Failure to preserve trade provisions conducive to trade, or any other action imposing import duties or border taxes, could negatively impact KCS customers and the volume of rail shipments, and could have a material adverse effect on the Company’s consolidated financial statements.
Downturns in the United States or Mexican economies or in trade between the United States and Mexico could have material adverse effects on the Company’s consolidated financial statements and the Company’s ability to meet debt service obligations. In addition, the Company has invested significant amounts in developing its intermodal operations, including the Port of Lázaro Cárdenas, in part to provide Asian importers with an alternative to the west coast ports of the United States, and the level of intermodal traffic depends, to an extent, on the volume of Asian shipments routed through Lázaro Cárdenas. Reductions in trading volumes, which may be caused by factors beyond the Company’s control, including increased government regulations regarding the safety and quality of Asian-manufactured products, could have a material adverse effect on the Company’s consolidated financial statements.
Additionally, fluctuations in the peso-dollar exchange rates could lead to shifts in the types and volumes of Mexican imports and exports. Although a decrease in the level of exports of some of the commodities that CPKCM transports to the United States may be offset by a subsequent increase in imports of other commodities CPKCM hauls into Mexico and vice versa, any offsetting increase might not occur on a timely basis, if at all. Future developments in
CPKC 2023 ANNUAL REPORT / 21
United States-Mexican trade beyond the Company’s control may result in a reduction of freight volumes or in an unfavourable shift in the mix of products and commodities CPKCM carries.
Extreme volatility in the peso-dollar exchange rate may result in disruption of the international foreign exchange markets and may limit the ability to transfer or convert Mexican pesos into U.S. dollars. Although the Mexican government currently does not restrict, and for many years has not restricted, the right or ability of Mexican or foreign persons or entities to convert pesos into U.S. dollars or to transfer foreign currencies out of Mexico, the Mexican government could, as in the past, institute restrictive exchange rate policies that could limit the ability to transfer or convert pesos into U.S. dollars or other currencies for the purpose of making timely payments and meeting contractual commitments. Fluctuations in the peso-dollar exchange rates also have an effect on the Company’s consolidated financial statements. A weakening of the peso against the U.S. dollar would cause reported peso-denominated revenues and expenses to decrease, and could increase reported foreign exchange loss due to the Company’s net monetary assets that are peso-denominated. Exchange rate variations also affect the calculation of taxes under Mexican income tax law, and a weakening of the peso against the U.S. dollar could cause an increase in the Company’s cash tax obligation and effective income tax rate.
Climate-Related Risks
Climate change presents both physical and transition risks to our business. A summary of climate-related risks that could adversely affect our business, operations and financial results is discussed below.
Physical Risks
Changing climate conditions, severe weather or natural disasters could result in significant business interruptions and costs to the Company. The Company is exposed to severe weather conditions and natural disasters, including earthquakes, volcanism, hurricanes, tropical storms, tornadoes, floods, fires, avalanches, mudslides, extreme temperatures, and significant precipitation that may causehave caused track outages, severe damage to infrastructure, and business interruptions that canhave adversely affectaffected the Company’s entire rail network. These events have resulted and can result in substantial costs to respond during the event and recover following the event. Costs can include modifications to existing infrastructure or implementation of new infrastructure to prevent future impacts to our business.
Impacts from these types of events are highly variable based on the severity and length of the event and scope of network impact. Climate-related changes such as rising mean temperatures and severe weather events can increase physical climate risk potentially compounding impacts to the business and operations. Such events have had and in the future could have a material adverse effect on the Company’s results of operations, financial condition, and liquidity.
Insurance maintained by the Company to protect against loss of business and other related consequences resulting from these natural occurrences is subject to coverage limitations, depending on the nature of the risk insured. This insurance may not be sufficient to cover all of the Company's damages or damages to others, and may not continue to be available at commercially reasonable rates. Even with insurance, if any natural occurrence leads to a catastrophic interruption of services, the Company may not be able to restore services without a significant interruption in operations.
Transition Risks
Reputational Risks
The Company has established a GHG emissionemissions reduction target, and may establish updated or new targets in the future to guide the implementation of the Company's Climate Strategy.carbon reduction efforts. The Company's inability to achieve the current GHG emissions reduction target or any future targets we may establish could negatively impact the Company, including both our reputation and financial results.results. The Company has established twoa science-based GHG emissions reduction target (please see “Sustainability-Related Laws, Regulations and Strategies—Climate Change” in Item 1. Business for further discussion). Our current GHG emissions reduction target and any future GHG emissions reduction targets we may establish are subject to address a substantial portionnumber of the Company's Scope 1, Scope 2risks, assumptions and Scope 3 emissions by 2030. The primary risks associated with achieving these commitmentsuncertainties that include, but are not limited toto: changes in carbon markets; evolving sustainability strategies and scientific, methodological or technological developments, including future investments in and the availability of GHG emissions-reduction tools and technologies, shifts in the science, data, methodology and legal and financial considerations underlying our climate and sustainability-related analysis and strategy, including those developed and used by organizations such as SBTi, the ability of the Company to successfully implement its climate and sustainability-related strategies and initiatives (including actions and plans undertaken by the Company to reduce GHG emissions), significant changes in the Company's GHG emissions profile as a result of changes to its railway asset base, the Company's ability to work with governments and third parties to mitigate the impacts of climate change, domestic and international economic conditions, including exchange rates, the effects of competition and regulation, uncertainties in the financial markets, capital spending, actions of vendors, the willingness of customers to acquire our services, cost of network expansion, maintenance and retrofits, and physical impact of climate change on our business. OurIn addition, the accuracy, consistency and usefulness of climate or sustainability-related data (including data underlying our current or future targets are subject to the successful implementationand their baselines) could be impacted by a number of the actions and plans outlined in the Climate Strategy as well asfactors, including the accuracy of the assumptions in the science-based methodology used to calculate this data, improvement in our data collection and measuring systems, activities such as joint ventures, mergers and acquisitions or divestitures, and industry-driven changes to methodologies. Further, as we continue to integrate KCS, we are conducting additional data-gathering and intend to further assess the climate and sustainability strategies and initiatives for the combined company, and may make changes to our existing strategies and initiatives as a result.
22 / CPKC 2023 ANNUAL REPORT
As a result of these targets.and other factors, we may not achieve our current GHG emissions reduction target or any future GHG emissions reduction targets we may establish. We cannot assure that the Company's current or future plans to reduce GHG emissions will be viable or successful. Inability to meet our current GHG emissions reduction target or any future GHG emissions reduction targets we may establish, including our ability do so in a manner that meets standards and expectations developed by third parties such as SBTi, could have a material adverse effect on the Company's reputation, legal risks, results of operations, orand financial position.
Policy and Regulatory Risks
An escalating price on carbon emissions could materially increase direct costs related to fuel purchases and indirect expenses related to purchased goods, materials, and electricity required to operate our business. As a fuel-intensive operation, the Company is exposed to both emerging and escalating carbon pricing regulations. The Company is regulated under multiple carbon taxation systems and cap and trade market mechanisms in the Canadian provinces in which we operate. Approximately 75% of the Company’sThe Company's Scope 1 and Scope 2 GHG emissions are generated through our operations in Canada and Mexico are impacted by carbon pricing mechanisms.
In most provinces, energy providers and utilities are directly regulated through carbon pricing programs. The Company’s carbon costs are generally assessed by our primary fuel suppliers based on fuel purchase transactions. The amount collected by our suppliers follows current regulatory carbon pricing rates multiplied by the total volume of fuel purchased. The Company’s carbon costs are also paid to a province as part of tax returns in some locations, based on reported locomotive fuel consumption in a specific region. The Company is further exposed to carbon pricing through electricity purchases, where electric utilities pass on carbon costs to customers. Introduction of, or changes to, regulations by government bodies in response to climate change that increase the cost of carbon emissions could result in a significant increase in expenses and could adversely affect our business performance, results of operations, financial position, and liquidity.
Please see “Sustainability-Related Laws, Regulations and Strategies” in Item 1. Business for further discussion of climate- and other sustainability-related laws and regulations (including the rulemaking activities of securities regulatory authorities in Canada and the United States) that could materially affect the Company’s operating results, financial condition, and reputation.CP 2022 ANNUAL REPORT 23
Market Risks
A number of the sectors the Company serves have the potential to be significantly impacted by climate-related transitional risks, including increased regulations, technology changes, and shifts in consumer preferences. The Company’s business is based on transporting a wide variety of commodities from suppliers to the marketplace. The Company regularly transports energy commodities that serve refineries, processing locations, and end-users across North America and global markets. The Company’s business lines include thermal and metallurgical coal, crude oil and petroleum products, including liquefied petroleum gas, fuel oil, asphalt, gasoline, condensate (diluent), and lubricant oils.
Shifting consumer demand to lower-carbon products and increased climate-focused regulations, such as carbon pricing and fuel regulations, may instigate a broad transition in the energy sector. Programs that place a price on carbon emissions or other government restrictions on certain market sectors may further impact current and potential freight rail customers in the energy sector. A comprehensive transition in the energy sector could significantly impact the markets of the Company's energy customers or lead to market differentiation through geographic variation in policies and demand trends. A portion of the Company’s business could be materially affected by potential future changes and instability that may be related to such a transition.
Please see “Sustainability-Related Laws, Regulations and Strategies” in Item 1. Business for further discussion of climate- and other sustainability-related laws, regulations and other legal developments that could materially affect the preferences, activities, and financial conditions of our customers and other stakeholders, as well as the Company’s operating results, financial condition, and reputation.
General Risk Factors
Global Risks
Global economic and public health conditions could negatively affect demand for commodities and other freight transported by the Company. A decline or disruption in domestic, cross border or global economic conditions, including fluctuations in interest rates, that affect the supply or demand for the commodities that the Company transports may decrease the Company’s freight volumes and maywould result in a material adverse effect on the Company’s financial or operating results and liquidity. Economic conditions resulting in bankruptcies of one or more large customers could have a significant impact on the Company's financial position, results of operations, and liquidity in a particular year or quarter. We are also subject to outbreaks of infectious disease, such as risks related to the global COVID-19 pandemic, which had adverse impacts on economic and market conditions and the Company's business. Public health crises, including COVID-19, have created, and in the future may create, significant volatility, uncertainty and economic disruption in the regions in which the Company operates and therefore adversely affect the Company's business.
Our business, financial condition, and results of operations have been adversely affected, and in the future, could be adversely affected by pandemics or other public health crises. The future impacts of COVID-19 on the Company's business or operating and financial results are unpredictable and cannot be identified or assessed with certainty at this time. The COVID-19 pandemic has adversely affected the global economy and resulted in a widespread economic downturn which has adversely impacted and could continue to adversely impact demand for our services and otherwise cause interruptions, including fluctuations to commodity prices, disruptions or restrictions on the ability to transport freight in the ordinary course, temporary closures of facilities and ports, or the facilities and ports of our customers, partners, suppliers or other third-party service providers, and/or changes to export/import restrictions. The pandemic caused by COVID-19 has impacted and may continue to impact the seasonal trends that typically characterize our revenues and operating income. There is no assurance that the pandemic will not continue to have a material and adverse impact on our business or results of operations. Additionally, our operations could be further negatively affected if a significant number of our employees are unable to perform their normal duties, including because of contracting COVID-19 or based on further direction from governments, public health authorities or regulatory agencies. The extent of the impact, if any, will depend on developments, many of which are beyond our control, including actions taken by governments, financial institutions, monetary policy authorities, and public health authorities to contain and respond to public health concerns and general economic conditions as a result of the pandemic. The COVID-19 pandemic may also result in continued substantial market volatility and declines, which could adversely impact future net periodic benefit costs and funding requirements of the Company’s pension plans. Furthermore, certain impacts of the COVID-19 pandemic, including demand for our services and to economic conditions generally, could continue following the pandemic or the expiration or termination of government actions in respect of the pandemic.
We will continue to actively monitor the situation and may take further actions that alter our business operations as may be required or recommended by federal, provincial, state or local authorities, or that we determine are in the best interests of our employees, customers, partners, suppliers, shareholders, and other stakeholders. We cannot be certain of potential effects that any such alterations or modifications may have on our business or operating and financial results in future fiscal periods.
To the extent COVID-19 adversely affects our business or operating and financial results, it may also have the effect of heightening many of the other risks described above and below. In addition, we could be materially and adversely affected by other public health crises, including another widespread epidemic or pandemic.
Liquidity Risks
The state of capital markets could adversely affect the Company's liquidity. Weakness in the capital and credit markets could negatively impact the Company’s access to capital. From time to time, the Company relies on the capital markets to provide some of its capital requirements, including the issuance of long-term debt instruments and commercial paper. Significant instability or disruptions of the capital markets and the credit markets, or deterioration of the Company's financial condition due to internal or external factors could restrict or eliminate the Company's access to, and/or significantly increase the cost of, various financing sources, including bank credit facilities and issuance of corporate bonds. Instability or disruptions of the capital markets and deterioration of the Company's financial condition, alone or in combination, could also result in a reduction in the Company's
CPKC 2023 ANNUAL REPORT / 23
credit rating to below investment grade, which could also further prohibit or restrict the Company from accessing external sources of short-term and long-term debt financing, and/or significantly increase the associated costs.
ITEM 1B. UNRESOLVED STAFF COMMENTS
None.
ITEM 1C. CYBERSECURITY
Risk Management
CPKC’s cybersecurity risk management program is an integrated and essential component of the Company’s overall risk management strategy. Through its Security Management Plan, CPKC maintains a comprehensive, risk-based plan that is modelled on and was developed in conjunction with the security plan prepared by the Association of American Railroads post-September 11, 2001. This plan also covers regulatory requirements such as TSA Cyber Security Directives and auditing requirements. Under this plan, the Company routinely examines and prioritizes cyber vulnerabilities and threats while also testing and revising protective measures for its assets and operations, both physical or cyber. Likewise, the Company’s cybersecurity risk management program entails real-time review and monitoring of CPKC’s cyber-risk exposures and implements strategic processes to manage those risks.
The Company's cybersecurity program utilizes the National Institute of Standards and Technology Cybersecurity Framework as its foundation. Accordingly, CPKC’s program includes periodic risk assessments, penetration testing by a third-party, audit participation, employee and contractor training, and the implementation of technologies to assist in mitigating cybersecurity risks and harms. Incident response procedures, including escalation procedures, are designed, implemented, and periodically tested to assist the Company in detecting, responding to, and recovering from a potential cybersecurity incident, and making any timely notification or disclosure that may be required under the circumstances. The Company scopes the third-party penetration tests as real-world attacks against perimeter defenses and internal processes such as social engineering and phishing.
The Company's cybersecurity risk management program also includes ongoing threat research and analysis conducted with the assistance of third parties, including on emerging threat attack vectors, tactics, actors and motivations. The Company also engages in ongoing network monitoring and has implemented a vulnerability management and patching program. Further, CPKC employs structured vetting and ongoing risk management processes to identify and mitigate cyber risks associated with the use of third-party service providers, including specifically in the area of technology.
To date, risks arising from cybersecurity threats have not materially affected the Company, its results of its operations, or its financial condition. However, the Company also recognizes the reality of the ever-evolving cyber risk landscape faced by industries and businesses across the world. Depending on their source and nature, cyber incidents could in the future materially affect CPKC and its operations, and financial condition.
See “Risk Factors” in Part I, Item 1A of this Form 10-K for further information about information and cybersecurity risk.
Governance and Oversight
The Board of Directors oversees the work of all of its committees, including the Risk and Sustainability Committee. The Risk and Sustainability Committee is responsible for overseeing the Company’s strategic and integrated risk practices, including its approach to management and assessment of cybersecurity risks. The Chief Information Officer (CIO) provides annual and periodic updates to the Risk and Sustainability Committee and the Board of Directors on cybersecurity risks and the Company’s implementation of its strategy for mitigating such risks. In addition, the Company’s Chief Information Security Officer (CISO) also briefs the Risk and Sustainability Committee. The Audit and Finance Committee receives updates on information systems and cybersecurity audit and advisory engagements from the Chief Internal Auditor.
The CISO reports directly to the CIO and is responsible for:
•Overseeing and implementing CPKC's cybersecurity strategy;
•Aligning cybersecurity objectives with the overall business objectives;
•Ensuring compliance with regulatory directives related to cybersecurity;
•Promoting a cybersecurity culture through comprehensive awareness and training programs; and
•Managing and coordinating incident response activities.
The Company's cybersecurity risk management program is supervised by the Managing Director of Enterprise Security who reports directly to the CISO. The Chief Information Officer and CISO regularly update senior leadership and the executive committee on cybersecurity risks.
The CISO, CIO, and certain members of their management team who are involved in implementing the Company's cybersecurity program possess expertise in cybersecurity risk management. Our CISO and CIO each have many years of experience in designing and implementing cybersecurity frameworks and working to mitigate cyber threats. Among other qualifications, certain members of the CISO's and CIO's management team also have certifications as a CISSP (Certified Information Systems Security Professional) and CISM (Certified Information Security Manager).
24 / CPKC 2023 ANNUAL REPORT
ITEM 2. PROPERTIES
Network Geography
The Company operates on a network of approximately 13,00020,000 miles of first main track, of which the Company accesses 2,1003,300 miles under trackage rights. The Company's owned track miles include leases with wholly owned subsidiaries where the term of the lease exceeds 99 years. The Company's track miles do not include approximately 7,100 miles of tracks owned and operated by KCS and its subsidiaries. The Company's track network represents the size of the Company's operations that connects markets, customers, and other railways. Of the total mileage operated, approximately 5,200 miles are located in western Canada, 2,500 miles in eastern Canada (including CMQ Canada), 4,500 miles in the U.S. Midwest, and 600 miles in the U.S. Northeast. The Company’s network accesses the U.S. markets directly through four wholly ownedfive wholly-owned subsidiaries: Soo Line Railroad Company (“Soo Line”), a Class I railway operating in the U.S. Midwest; the Dakota, Minnesota & Eastern Railroad ("DM&E"), which operates in the U.S. Midwest; Delaware & Hudson Railway Company, Inc., which operates between eastern Canada and the U.S. Northeast; and the Central Maine & Quebec Railway U.S. Inc., which operates in the U.S. Northeast.Northeast, and the Kansas City Southern Railway Company, which operates in the central and south-central U.S. KCS indirectly owns CPKCM which operates in northeastern and central Mexico and the port cities of Lázaro Cárdenas, Tampico and Veracruz.
The Company’s network in Canada covers approximately 8,400 miles and extends from the Port of Vancouver, B.C. on Canada’s Pacific Coast to the Port of Montréal, Québec, and eastern Québec and to the Port of Saint John, New Brunswick via a haulage agreement,agreement. The U.S. network covers approximately 8,800 miles and to the U.S.extends through industrial centres of Chicago, Illinois; Detroit, Michigan; Buffalo and Albany, New York; Minneapolis, Minnesota; Kansas City, Missouri; and Minneapolis, Minnesota.to the U.S. Gulf Coast with port access at Port Arthur, Texas, New Orleans, Louisiana, and Mobile, Alabama via agreement. The Company’s network in Mexico extends approximately 3,100 miles from the Laredo, Texas border crossing through Mexico City, Mexico City with port access at Lázaro Cárdenas, Michoacán, Veracruz, Veracruz, and Altamira, Tamaulipas.
CPKC 2023 ANNUAL REPORT / 25
At December 31, 2022,2023, the breakdown of the Company's operated track miles is as follows:
| | | | | |
| Total |
| First main track | 12,82219,178 | |
| Second and other main track | 1,0411,159 | |
| Passing sidings and yard track | 4,2565,815 | |
| Industrial and way track | 8661,894 | |
| Total track miles | 18,98528,046 | |
Rail Facilities
The Company operates numerous facilities including: terminals for intermodal, transload, automotive and other freight; classification rail yards for train-building and switching, storage-in-transit and other activities; offices to administer and manage operations; dispatch centres to direct traffic on the rail network; crew quarters to house train crews along the rail line; shops and other facilities for fuelling;fuelling, maintenance and repairs of locomotives; and facilities for maintenance of freight cars and other equipment. The Company continues to invest in terminal upgrades and new facilities to accommodate incremental growth in volumes. Typically in all of our major yards, the Company's Police Services has offices to ensure the safety and security of the yards and operations.
Equipment
The Company's equipment includes: owned and leased locomotives and railcars; heavy maintenance equipment and machinery; other equipment and tools in our shops, offices and facilities; and vehicles for maintenance, transportation of crews, and other activities. In this section, owned equipment includes units acquired by the Company, equipment leased to third parties, units held under finance leases, and equipment leased to the Company under short-term or long-term operating leases.
The Company’s locomotive fleet is composedcomprised of largely high-adhesion alternating current line haul locomotives that are more fuel efficient and reliable and have superior hauling capacity as compared with standard direct current locomotives. The Company has entered into locomotive leases in the past to ensure there is appropriate capacity to meet market demand. The Company’s locomotive productivity, defined as the daily average GTMs divided by daily average operating horsepower, for the years ended December 31, 2023 and 2022, was 171 and 2021, was 196 and 201 GTMs per Operating horsepower, respectively. Operating horsepower excludes units offline, tied up or in storage, or in use on other railways, and includes foreign units online. 2022 GTMs reflect legacy CP on a standalone basis. As of December 31, 2022,2023, the Company had 262357 locomotives in storage. As of December 31, 2022,2023, the Company owned or leased the following locomotive units:
| | Locomotives | Locomotives | Owned | Leased | Total | Average Age
(in years) | Locomotives | Owned | Leased | Total | Average Age
(in years) |
| Line haul | Line haul | 767 | | 56 | | 823 | | 14 | |
| Road switcher | 536 | | 7 | | 543 | | 30 | |
| Road Switcher | |
| Yard Switcher | | Yard Switcher | 49 | — | | 49 | 50 |
| Total locomotives | Total locomotives | 1,303 | 63 | 1,366 | 21 | |
26 / CPKC 2023 ANNUAL REPORT
The Company’s average in-service utilization percentage for freight cars, for the years ended December 31, 2023 and 2022, was 81% and 2021, was 79% and 83%85%, respectively. Average in-service utilization is defined as average active fleet for the year divided by total cars, excluding company service cars and tank cars as these are utilized only as required for non-revenue movements.respectively(1). 2022 reflects legacy CP on a standalone basis. As of December 31, 2022,2023, the Company owned and leased the following freight cars:
| | Freight cars | Freight cars | Owned | Leased | Total | Average Age
(in years) | Freight cars | Owned | Leased | Total | Average Age
(in years) |
| Box car | Box car | 2,336 | 421 | | 2,757 | 31 | |
| Covered hopper | Covered hopper | 11,038 | 5,592 | 16,630 | 15 | |
| Flat car | Flat car | 1,405 | 1,110 | 2,515 | 27 | |
| Gondola | Gondola | 3,579 | 1,721 | 5,300 | 21 | |
| Intermodal | Intermodal | 1,264 | 149 | 1,413 | 17 | |
| Multi-level autorack | Multi-level autorack | 2,654 | 1,103 | 3,757 | 26 | |
| Company service car | Company service car | 2,374 | 176 | 2,550 | 46 | |
| Open top hopper | Open top hopper | 11 | — | | 11 | 33 | |
| Tank car | Tank car | 30 | 10 | 40 | 16 | |
| Total freight cars | Total freight cars | 24,691 | 10,282 | 34,973 | 21 | |
(1) Average in-service utilization percentage for 2022 previously reported as 79%, has been restated to 85% in this annual report. The restatement reflects new methodology adopted by the Company in 2023 to harmonize utilization data across the combined network.
As of December 31, 2022,2023, the Company owned and leased the following units of intermodal equipment:
| | Intermodal equipment | Intermodal equipment | Owned | Leased | Total | Average Age
(in years) | Intermodal equipment | Owned | Leased | Total | Average age
(in years) |
| Containers | Containers | 7,548 | — | | 7,548 | 6 | Containers | 10,728 | — | | 10,728 | 10,728 | 6 |
| Chassis | Chassis | 7,075 | 99 | 7,174 | 12 | Chassis | 7,640 | 2,017 | 9,657 | 12 |
| Total intermodal equipment | Total intermodal equipment | 14,623 | 99 | 14,722 | 9 | Total intermodal equipment | 18,368 | 2,017 | 20,385 | 9 |
Headquarters Office Building
The Company owns and operatesCompany's global headquarters in Calgary, Alberta is a multi-building campus in Calgary encompassing the head office building, a data centre, training facility, and other office and operational buildings. The Company’s U.S. headquarters is located in Kansas City, Missouri while Mexican headquarters are located in Monterrey, Nuevo Leon and Mexico City.
The Company's main dispatch centre is located in Calgary, and is the primary dispatching facility in Canada. Rail traffic controllers coordinate and dispatch crews, and manage the day-to-day locomotive management across the network, 24 hours a day, and seven days a week. The operations centre has a complete backup system in the event of any power disruption.
In addition to fully operational redundant systems, the Company has a fully integrated Business Continuity Centre, should the Company's operations centre be affected by any natural disaster, fire, cyber-attack, or hostile threat.
The Company also maintains a secondary dispatch centrecentres in the U.S., located in Kansas City and Minneapolis, where a facility similarMinnesota, and Mexico, located in Monterrey to the one in Calgary exists. It servicesservice the dispatching needs of locomotiveslocomotive and train crews working in the U.S. and Mexico, respectively.
Capital Expenditures
The Company incurs expenditures to expand and enhance its rail network, rolling stock, and other infrastructure. These expenditures are aimed at improving efficiency and safety of our operations. Such investments are also an integral part of the Company's multi-year capital program and support growth initiatives.
In 2023, the Company invested in capital expenditures of $2,468 million (2022 - $1,557 million), up 59% from the prior year mainly as a result of the KCS acquisition. For further details, refer to Item 7. Management’sManagement's Discussion and Analysis of Financial Condition and Results of Operations, Liquidity and Capital Resources.
CPKC 2023 ANNUAL REPORT / 27
Encumbrances
Refer to Item 8. Financial Statements and Supplementary Data, Note 1517 Debt, for information on the Company's finance lease obligations and assets held as collateral under these agreements.
ITEM 3. LEGAL PROCEEDINGS
For further details, refer to Item 8. Financial Statements and Supplementary Data, Note 2426 Commitments and contingencies.
SEC regulations require the disclosure of any proceeding under environmental laws to which a government authority is a party unless the registrant reasonably believes it will not result in sanctions over a certain threshold. The Company uses a threshold of U.S. $1 million for the purposes of determining proceedings requiring disclosure.
From time to time, the Company or its subsidiaries may be subject to information requests from U.S. State or Federal environmental regulatory authorities inquiring as to the Company’s compliance or remediation practices in the U.S. In September 2020, the Company received an initial request for information from the EPA inquiring into the Company’s compliance with the mobile source provisions of the Clean Air Act (“CAA”). The Company has been providing information in response to the EPA’s initial and follow-up requests, and the EPA has issued Notices of Violations, which preliminarily identify certain categories of alleged non-compliance with civil provisions of the CAA pertaining to locomotives and locomotive engines. In December 2022, the U.S. Department of Justice (“DOJ”) sent a communication requesting a meeting with the Company to discuss potentially resolving any alleged noncompliance which included an initial draft consent decree from the DOJ. That initial meeting occurred in January 2023 and communications are ongoing. Neither the EPA nor the DOJ has issued a final compendium of alleged violations, demand for corrective or mitigating actions, or articulated a preliminary civil penalty assessment, and it remains too early to provide a fulsome evaluation of the likely outcome with respect to either the nature of any alleged violations or the amount of any potential civil penalty. The Company will continue to fully cooperate and engage in discussions to resolve the matter.
ITEM 4. MINE SAFETY DISCLOSURES
Not applicable.
28 / CP 2022CPKC 2023 ANNUAL REPORT
INFORMATION ABOUT OUR EXECUTIVE OFFICERS
Our executive officers are appointed by the Board of Directors and they hold office until their successors are appointed, subject to resignation, retirement or removal by the Board of Directors. There are no family relationships among our officers, nor any arrangement or understanding between any officer and any other person pursuant to which the officer was selected. As of the date of this filing, the executive officers’ names, ages, and business experience are:
| | | | | |
| Name, Age and Position | Business Experience |
Keith Creel, 5455
President and Chief Executive Officer | Mr. Creel became the first President and Chief Executive Officer ("CEO") of CPKC on April 14, 2023. Mr. Creel previously served as President and CEO of the Company onCP from January 31, 2017. Previously, he2017 to April 13, 2023. He was appointed CP President and Chief Operating Officer ("COO") fromin February 5, 2013 and joined the CP Board of Directors in May of 2015. Under Mr. Creel's leadership, CP achieved industry-leading safety performance and delivered more efficient ways to January 30, 2017.connect customers to domestic and global markets, playing a prominent role in connecting communities across North America.
Prior to joining the Company, Mr. Creel was Executive Vice-President and COO at CNCanadian National Railway Limited ("CN") from January 2010 to February 2013. During his time at CN, Mr. Creel held various positions including Executive Vice-President, Operations, Senior Vice-President Eastern Region, Senior Vice-President Western Region, and Vice-President of the Prairie Division.
Mr. Creel began his railroad career at Burlington Northern Railway in 1992 as an intermodal ramp manager in Birmingham, Alabama. He also spent part of his career at Grand Trunk Western Railroad as a superintendent and general manager, and at Illinois Central Railroad as a trainmaster and director of corridor operations, prior to its merger with CN in 1999.
Mr. Creel holds a Bachelor of Science in marketing from Jacksonville State University and completed the Advanced Management Program at Harvard Business School. |
Nadeem Velani, 5051
Executive Vice-President and Chief Financial Officer | Mr. Velani has beenis Executive Vice-President and Chief Financial Officer ("CFO")of CPKC. In his role, Mr. Velani serves as a key member of the Company since October 17, 2017. Previous to this appointment, he wasCPKC executive leadership team responsible for helping plan the Vice-President and CFOlong-term strategic direction of the Company from October 19, 2016, to October 16, 2017, Vice-President, Investor Relations from October 28, 2015,company with duties including financial planning, investor relations, reporting and Assistant Vice-President, Investor Relations from March 11, 2013.accounting systems, as well as procurement, treasury and tax.
Previously, Mr. Velani served as Executive Vice-President and Chief Financial Officer at CP having earlier served as Vice-President Investor Relations. Prior to joining the Company,CP, Mr. Velani spent 15 years at CN where he worked in a variety of positions in Strategic and Financial Planning, Investor Relations, Sales and Marketing and the Office of the President and CEO.
Mr. Velani holds a Bachelor of Economics degree from Western University and an MBA in Finance/International Businessfinance/international business from McGill University. He alsoIn 2022, Mr. Velani completed the Advanced Management Program at Harvard Business School. |
John Brooks, 5253
Executive Vice-President and Chief Marketing Officer | Mr. Brooks has beenis Executive Vice-President and Chief Marketing Officer ("CMO") of CPKC. Mr. Brooks is responsible for CPKC's business units and leads a group of highly capable sales and marketing professionals across North America. Mr. Brooks is also responsible for strengthening partnerships with existing customers, generating new opportunities for growth, enhancing the Company since February 14, 2019. Previousvalue of the company's service offerings and developing strategies to this appointment, he was the Senioroptimize CPKC's book of business.
Previously, Mr. Brooks served as Executive Vice-President and CMO of the Company fromCP since February 14, 2017, to February 13, 2019. He has worked in senior marketing roles at the CompanyCP since he joined the Companyjoining in 2007, including past experience as Senior Vice-President and CMO and Vice-President, Marketing – Bulk and Intermodal.
the CompanyCP in 2007.
With more than 2425 years in the railroading business, Mr. Brooks brings a breadth of experience to the CMO role that is pivotal to the Company's continued and future success.
Mr. Brooks holds a Bachelor of Arts in finance from the University of Northern Iowa and a minor in real estate finance. |
CPKC 2023 ANNUAL REPORT / 29
| | | | | |
Mark Redd, 5253
Executive Vice-President Operationsand Chief Operating Officer | Mr. Redd has beenis Executive Vice-President and COO of CPKC, bringing considerable leadership experience in rail operations and safety excellence to the role. Mr. Redd oversees the 24/7 operations of CPKC's North American network, north of Beaumont, Texas, including teams responsible for network transportation, operations, mechanical, engineering, training and safety.
Previously, Mr. Redd served as Executive Vice-President Operations of CP since September 1, 2019. Before this appointment, he was Senior Vice-President Operations Western Region from February 2, 2017, to August 31, 2019, and Vice-President Operations Western Region from April 20, 2016, to February 1, 2017.
Previous to these roles, he wasHe joined CP in October 2013 as General Manager Operations U.S. West and General Managerhas held various leadership positions. In April 2016, he became Vice-President Operations Central Division. He was named the Company's 2016 Railroader of the Year. PriorWestern Region and in February 2017, he became Senior Vice-President Operations Western Region. Previous to joining the Company in October 2013,these roles, Mr. Redd worked for over 20 years at Kansas City Southern Railway Company where he held a variety of leadership positions in network and field operations. operations, including Vice-President Transportation where he oversaw key operating functions in the U.S. and Mexico.
Mr. Redd holds a BachelorBachelor's and MasterMaster's degrees of Sciencescience in Managementmanagement from the University of Phoenix and an Executive MBA from the University of Missouri – Kansas City. |
John Orr, 60
Executive Vice-President and Chief Transformation Officer | Mr. Orr is Executive Vice-President and Chief Transformation Officer of CPKC. In this new strategic position, Mr. Orr's responsibilities include Mexico operations, network operations planning and design, labor relations and regulatory affairs.
Previously, Mr. Orr served as Executive Vice-President Operations for Kansas City Southern, overseeing the transportation, engineering, mechanical, network operations, health-safety-environmental and labor relations teams from 2021-2023. A fourth-generation railroader, Mr. Orr began his railroad career at CN in 1985, gaining critical experience and ultimately holding various leadership positions including Senior Vice-President and Chief Transportation Officer.
Mr. Orr holds a Bachelor of Arts in environmental studies from the University of Waterloo and has most recently completed the Advanced Management Program at Harvard University. He has also completed additional business coursework and professional development in leadership from University of Waterloo, University of Guelph, University of Western Ontario and Niagara Leadership Institute. |
James Clements, 54
Executive Vice-President, Strategic Planning and Technology | | | | Mr. Clements is Executive Vice-President, Strategic Planning and Technology at CPKC. Mr. Clements has responsibilities that include strategic network issues, Network Service Centre operations, and Information Services.
Previously, Mr. Clements served as Senior Vice-President, Strategic Planning and Technology Transformation at CP since September 2019. Before this appointment, he was the Vice-President, Strategic Planning and Transportation Services of the Company from 2014. Mr. Clements has more than 20 years' experience at the Company, enabling an extensive understanding of the Company's customers, processes, systems, and leadership of CP-KCS integration planning. His previous experience and leadership roles cover a wide range of areas of the Company’s business, including car management, finance, logistics, grain marketing and sales in both Canada and the U.S., as well as marketing and sales responsibilities for various other lines of business.
Mr. Clements holds an MBA in international business and finance from McGill University and a Bachelor of Science in computer science and mathematics from McMaster University. |
Jeffrey Ellis, 5556
Executive Vice-President, Chief Legal Officer and Corporate Secretary | Mr. Ellis has beenis Executive Vice-President, Chief Legal Officer and Corporate Secretary of the Company since November 23, 2015.CPKC. Mr. Ellis is accountablehas accountability for the overall strategic leadership, oversight and performance of the legal, corporate secretarial, government relations, and public affairscommunications functions of the Company in CanadaCompany. Mr. Ellis' responsibilities include litigation management, regulatory, contracts, commercial matters, advising on risk management as well as providing strategic support to senior management and the U.S.Board of Directors.
Previously, Mr. Ellis served as Chief Legal Officer and Corporate Secretary at CP, a role he had served in since 2015. Prior to joining the Company in 2015,CP, Mr. Ellis was the U.S. General Counsel at BMO Financial Group ("BMO").Group. Before joining BMO in 2006, Mr. Ellis was with the law firm of Borden Ladner Gervais LLP in Toronto, Ontario.
Mr. Ellis holds a Bachelor of Arts and a Master's of Arts degree from the University of Toronto, Juris Doctor and Master of Laws degrees from Osgoode Hall Law School, and an MBA from the Richard Ivey School of Business, Western University. Mr. Ellis is a member of the bars of New York, Illinois, Ontario and Alberta. |
30 / CPKC 2023 ANNUAL REPORT
| | | | | |
Laird Pitz, 7879
Senior Vice-President and Chief Risk Officer | Mr. Pitz has beenis Senior Vice-President and Chief Risk Officer ("CRO") at CPKC. In his role, Mr. Pitz is responsible for risk management, police services, U.S. and Canadian casualty and general claims, environmental risk and forensic audit investigations.
Previously, Mr. Pitz served as Senior Vice-President and CRO of the CompanyCP since October 17, 2017. Previously, he wasHe also served as the Vice-President and CRO of the Company from October 29, 2014 to October 16, 2017, and the Vice-President, Security and Risk Management of the Company from April 2014 to October 2014.
Mr. Pitz, a Vietnam War veteran and former Federal Bureau of Investigation special agent, is a 40-year career professional who has directed strategic and operational risk mitigation, security and crisis management functions for companies operating in a wide range of fields, including defence, logistics and transportation. |
James Clements, 53
Senior Vice-President, Strategic Planning and Technology Transformation | Mr. Clements has been Senior Vice-President, Strategic Planning and Technology Transformation since September 1, 2019. Before this appointment, he was the Vice-President, Strategic Planning and Transportation Services of the Company from 2014. Mr. Clements has responsibilities that include strategic network issues, Network Service Centre operations, and Information Services.
Mr. Clements has more than 20 years' experience at the Company, including an extensive understanding of the Company's customers, processes, and systems. His previous experience and leadership roles cover a wide range of areas of the Company’s business, including car management, finance, logistics, grain marketing and sales in both Canada and the U.S., as well as marketing and sales responsibilities for various other lines of business.
Mr. Clements holds an MBA in International Business and Finance from McGill University and a Bachelor of Science in Computer Science and Mathematics from McMaster University. |
Mike Foran, 4950 Senior Vice-President, Market StrategyNetwork and Capacity Management Asset Management
| Mr. Foran has beenis Senior Vice-President, Network and Capacity Management at CPKC. In this role, Mr. Foran is responsible for guiding the use of company assets to align with corporate objectives to drive strategic, sustainable growth.
Previously, Mr. Foran served as Vice-President, Market Strategy and Asset Management of the Companyat CP since February 14,May 2017. His prior roles with the Company include Vice-President Network Transportation from 2014 to 2017, Assistant Vice-President Network Transportation from 2013 to 2014, and General Manager – Asset Management from 2012 to 2013. In over 20During his more than 21 years at the Company,CP, Mr. Foran has worked in operations, business development, marketing and general management.
Mr. Foran holds an Executive MBA from the Ivey School of Business at Western University and a Bachelor of Commerce from the University of Calgary. |
Maeghan Albiston, 42
Vice-President and Chief Human Resources Officer | Ms. Albiston is Vice-President and Chief Human Resources Officer at CPKC. Ms. Albiston is responsible for leading the Company's Human Resources function across North America, including in the areas of talent management, recruitment, total rewards, occupational health and leadership development. Ms. Albiston also oversees the management of the Company's pension plans, which include CP's defined benefit pension plan, one of the oldest and largest corporate pension plans in Canada.
During her nearly 20 year career at CP, Ms. Albiston has held a number of leadership roles, most recently as Vice-President Capital Markets where she acted as the primary point of contact for the financial community with oversight for the investor relations, treasury and pension functions.
Ms. Albiston holds a Bachelor of Commerce from the University of Alberta. |
Oscar Augusto Del Cueto Cuevas, 57
CPKCM President, General Manager and Executive Representative | Mr. Del Cueto is the President and the Executive Representative of CPKCM. Mr. Del Cueto has more than 30 years of experience in the railway industry. Mr. Del Cuteo joined KCS de Mexico in 2006 where he served in numerous roles including Director of Mechanical, Director of Transportation, General Superintendent of Transportation and Vice President and General Director.
In August 2020, Mr. Del Cueto was also appointed as President of the Mexican Association of Railways after serving as Chairman of the Operations and Security Committee for five years. He is on the Board of Directors of the Railway and Terminal del Valle de México, ("Ferrovalle") and a full member of the Steering Committee of the Ferrovalle railway terminal. He is also a member of the Mexican Council of Foreign Trade of the Northeast and in January 2021, he was appointed to the Board of the American Chamber of Commerce of Mexico.
Mr. Del Cueto holds a Bachelor’s degree in communications and an MBA in business administration from the University of Monterrey. Additionally, he received a Certificate in the Management Rail Program from the University of Michigan. He is fluent in Spanish and English. |
30 CP 2022CPKC 2023 ANNUAL REPORT/ 31
| | | | | |
| Chad Rolstad, 46
Vice-President, Human Resources and Chief Culture Officer | Mr. Rolstad has been Vice-President, Human Resources since February 14, 2019, and the Chief Culture Officer since September 1, 2019. Previous to this appointment, he was Assistant Vice-President, Human Resources of the Company from August 1, 2018, to February 13, 2019, and Assistant Vice-President, Strategic Procurement of the Company from April 10, 2017, to July 31, 2018.
Prior to joining the Company, Mr. Rolstad held various leadership positions at BNSF Railway in marketing and operations.
Mr. Rolstad has a Bachelor of Science from the Colorado School of Mines and an MBA from Duke University.
Pam Arpin, 4749
Vice-President and Chief Information Officer | Ms. Arpin has beenis Vice-President and Chief Information Officer since July 19, 2021.at CPKC. Previous to this appointment, she was the Company'sCP's first Vice-President Innovation & Business Transformation, a portfolio she retains in her current role, including oversight of the Company's Network Service Centre.
Ms. Arpin has navigated an extensive and varied career at the Company, and has 20-plus years of experience covering a wide range of areas including commercial, operations, finance, and customer service roles. She was named the 2019 Railway Woman of the Year by the League of Railway Women and was named one of Canada's Most Powerful Women: Top 100 by the Women's Executive Network that same year.
Ms. Arpin holds a Bachelor of Commerce from the University of Saskatchewan. |
32 / CP 2022CPKC 2023 ANNUAL REPORT 31
PART II
32 CP 2022CPKC 2023 ANNUAL REPORT/ 33
ITEM 5. MARKET FOR REGISTRANT'S COMMON EQUITY, RELATED SHAREHOLDER MATTERS AND ISSUER PURCHASES OF EQUITY SECURITIES
Share Information
The Common Shares are listed on the TSX and on the NYSE under the symbol "CP".
Share Capital
At February 23, 2023,26, 2024, the latest practicable date prior to the date of this Annual Report on Form 10-K, there were 930,767,959932,428,454 Common Shares and no preferred shares issued and outstanding, which consisted of 14,83715,190 holders of record of the Common Shares. In addition, the Company has a Management Stock Option Incentive Plan (“MSOIP”), under which key officers and employees are granted options to purchase the Common Shares. Options issued prior to the share split further described in Item 1. Business, Business Developments now each provide rights over five shares. For consistency, allAll number of options presented herein are shown on the basis of the number of shares subject to the options.On April 27, 2022, at the Annual and Special Meeting, the Company's shareholders approved an amendment to the MSOIP to increase the maximum number of shares available for issuance under the MSOIP, effective at and after April 27, 2022, by 20,000,000 Common Shares. At February 23, 2023, 7,708,86626, 2024, 6,992,378 options were outstanding under the MSOIP and stand-alone option agreements entered into with Mr. Keith Creel. There are 21,883,56120,940,714 options available to be issued by the Company’s MSOIP in the future. The Company also has a Director's Stock Option Plan (“DSOP”), under which directors are granted options to purchase Common Shares. There are no outstanding options under the DSOP, which has 1,700,000 options available to be issued in the future.
Stock Performance Graph
The following graph provides an indicator of cumulative total shareholder return on the Common Shares, of an assumed investment of $100, as compared to the TSX 60 Index (“TSX 60”), the Standard & Poor's 500 Stock Index (“S&P 500”), and the peer group index (comprising Canadian National Railway Company, Union Pacific Corporation, Norfolk Southern Corporation and CSX Corporation) on December 31 for each of the years indicated. The values for the assumed investments depicted on the graph and in the table have been calculated assuming that any dividends are reinvested.
(1) KCS was excluded from the peer group index in 2021 as shares were no longer publicly listed effective December 14, 2021. Comparative periods were restated to conform with the current year presentation.
Issuer Purchase of Equity Securities
In connection with the KCS transaction, the Company suspended share repurchases and did not have an active program as at December 31, 2022. Purchases2023. Active programs and purchases made in prior years are further described in Item 8. Financial Statements and Supplementary Data, Note 1921 Shareholders' equity.Equity.
34 / CPKC 2023 ANNUAL REPORT
ITEM 6. [RESERVED]
34 CP 2022CPKC 2023 ANNUAL REPORT/ 35
ITEM 7. MANAGEMENT'S DISCUSSION AND ANALYSIS OF FINANCIAL CONDITION AND RESULTS OF OPERATIONS
INDEX TO MANAGEMENT'S DISCUSSION AND ANALYSIS
| | | | | |
| Page |
| Executive Summary | |
| |
| Performance Indicators | |
| Results of Operations | |
| Operating Revenues | |
| Operating Expenses | |
| Other Income Statement Items | |
| Impact of Foreign Exchange on Earnings and Foreign Exchange Risk | |
| Impact of Fuel Price on Earnings | |
| Impact of Share Price on Earnings and Stock-based Compensation | |
| Liquidity and Capital Resources | |
| Share Capital | |
| Non-GAAP Measures | |
| Critical Accounting Estimates | |
| Forward-Looking Statements | |
36 / CP 2022CPKC 2023 ANNUAL REPORT 35
The following Management’s Discussion and Analysis of Financial Condition and Results of Operations (“MD&A”) is intended to enhance a reader’s understanding of the Company’s results of operations and financial condition. The MD&A is provided as a supplement to and should be read in conjunction with the Company’s Consolidated Financial Statements and the related notes in Item 8. Financial Statements and Supplementary Data, and other information in this annual report. Except where otherwise indicated, all financial information reflected herein is expressed in Canadian dollars. The following section generally discusses 2023 and 2022 items and comparisons between 2023 and 2022. Discussions of 2021 items and year-to-year comparisons between 2022 and 2021. Discussions of 2020 items and year-to-year comparisons between 2021 and 2020 that are not included in this Form 10-K can be found in "Management's Discussion and Analysis of Financial Condition and Results of Operations" in Part II, Item 7, of the Company's Annual Report on Form 10-K for the fiscal year ended December 31, 2021.2022.
For purposes of this report, unless the context indicates otherwise, all references herein to “CP”“CPKC”, “the Company”, “we”, “our” and “us” refer to Canadian Pacific RailwayKansas City Limited ("CPRL"CPKC"), CPRL and its subsidiaries, CPRLwhich includes Kansas City Southern ("KCS") as a consolidated subsidiary on and one or more of its subsidiaries, or one or more of CPRL's subsidiaries,from April 14, 2023 (the "Control Date"). Prior to April 14, 2023, the Company's 100% interest in KCS was reported as the context may require.an equity-method investment.
Executive Summary
20222023 Results
•Financial performance – In 2022,2023, the Company reported Diluted earnings per share ("EPS") of $4.21, a 12% increase from $3.77 a 10% decrease from $4.18 in 2021.2022, and Core adjusted combined diluted EPS has remained unchanged at $3.77.of $3.84, a 2% increase from $3.77 in 2022. The Company’s commitment to service and operational efficiency produced anCompany reported Operating ratio of 65.0%, a 280 basis point increase from 62.2% in 2022, and an AdjustedCore adjusted combined operating ratio of 61.4%.62.0%, a 30 basis point increase from 61.7% in 2022. Core adjusted combined diluted EPS and AdjustedCore adjusted combined operating ratio are defined and reconciled in the Non-GAAP Measures section.
In 2023, equity earnings of KCS prior to the Control Date was $230 million and net income from KCS from the Control Date to December 31, 2023 was $682 million compared to equity earnings of KCS of $1,074 million in 2022. The lower overall contribution from KCS was primarily due to the gain on unwinding of interest rate hedges in 2022 that did not occur in 2023, partially offset by a decrease in net interest expense as a result of the completion of the debt exchange, which is further discussed further in Results of Operations of this Item 7. Management’s Discussionthe Liquidity and Analysis of Financial Condition and Results of Operations.Capital Resources section. In 2023, KCS contributed $963 million to CPKC's Operating income, which increased CPKC's operating ratio by 2.7%.
•Total revenues – The Company’s Totaltotal revenues increased by 10%42% to$12,555 million in 2023 from $8,814 million in 2022, from $7,995 million in 2021, driven primarily by higher fuel surchargedue to the impact of the KCS acquisition, increased freight revenues per revenue as a result of higher fuel priceston-mile ("RTM'), and higher freight rates.volumes as measured by RTMs.
Performance Indicators
The following table lists the key measures of the Company’s operating performance:
| | For the year ended December 31 | For the year ended December 31 | 2022 | 2021 | % Change | For the year ended December 31 | 2023 | 2022 | % Change |
| | Gross ton-miles (“GTMs”) (millions) | |
| Gross ton-miles (“GTMs”) (millions) | |
| Gross ton-miles (“GTMs”) (millions) | Gross ton-miles (“GTMs”) (millions) | 269,134 | | 271,921 | | (1) | |
| Train miles (thousands) | Train miles (thousands) | 28,899 | | 29,397 | | (2) | |
| | Fuel efficiency (U.S. gallons of locomotive fuel consumed /1,000 GTMs) | Fuel efficiency (U.S. gallons of locomotive fuel consumed /1,000 GTMs) | 0.955 | | 0.931 | | 3 | |
| | | Fuel efficiency (U.S. gallons of locomotive fuel consumed /1,000 GTMs) | |
| | Fuel efficiency (U.S. gallons of locomotive fuel consumed /1,000 GTMs) | |
| | Total employees (average) | Total employees (average) | 12,570 | 12,337 | 2 | |
| | Total employees (average) | |
| | Total employees (average) | |
|
These key measures are used by management as comparisons to historical operating results and in the planning process to facilitate decisions that continue to drive further productivity improvements in the Company's operations. Results of theseThese key measures reflect how effective the Company’s management is at controlling costs and executing the Company’s operating plan and strategy. Continued monitoring of these key measures ensures thatenables the Company canto take appropriate actions to ensure the delivery ofdeliver superior service and be able to grow its business at low incremental cost.
A GTM is defined as the movement of one ton of train weight over one mile. GTMs are calculated by multiplying total train weight by the distance the train moved. Total train weight comprises the weight of the freight cars, their contents, and any inactive locomotives. An increase in GTMs indicates additional workload. GTMs for 2022 were 269,134 million, a slight decrease compared with 271,921 million in 2021. The decreaseincrease in GTMs was mainly attributableprimarily due to lowerthe impact of the KCS acquisition and higher volumes of Canadian grain, Coal and Energy, chemicals and plastics.Automotive. This decreaseincrease was partially offset by higherlower volumes of Intermodal, U.S.U.S grain, Potash, and frac sand.crude.
Train miles are defined as the sum of the distance moved by all trains operated on the network. Train miles provide a measure of the productive utilization of our network. A smaller increase in train miles relative to increases in volumes, as measured by RTMs, and/or workload, as measured by GTMs, indicates improved train productivity. TrainThe increase in train miles for 2022 were 28,899 thousands, a decrease of 2% compared with 29,397 thousands in 2021. This decrease reflects the impact of a slight decrease29% increase in workload (GTMs), as well asand an 8% decrease in average train weights, which was primarily due to the impact of a 1% increase in average train weights.the KCS acquisition.
Fuel efficiency is defined as U.S. gallons of locomotive fuel consumed per 1,000 GTMs.Fuel consumed includes gallons from freight, yard and commuter service but excludes fuel used in capital projects and other non-freight activities. An improvement in fuel efficiency indicates operational cost savings and the Company's commitment to corporate sustainability through a reduction of greenhouse gas emissions intensity. Fuel efficiency for 2022 was 0.955 U.S. gallons/1,000 GTMs, a decrease of 3% compared to 0.931 U.S. gallons/1,000 GTMs in 2021. This decrease was due to harsher winter
36 CP 2022CPKC 2023 ANNUAL REPORT/ 37
operating conditionssavings. The decrease in 2022, higher volumesfuel efficiency was mainly driven by a decrease in average train weights of Intermodal, which has lower horsepower utilization, and lower locomotive productivity defined8% primarily due to the impact of the KCS acquisition as a result of the daily average GTMs divided by daily average operating horsepower.KCS network running lighter trains.
An employee is defined as an individual currently engaged in full-time, part-time, or seasonal employment with the Company. The Company monitors employment and workforce levels in order to efficiently meet service and strategic requirements. The number of employees is a key driver to total compensation and benefits costs.
The increase in the average number of total employees for 2022 was 12,570, an increasewas due to the acquisition of 233, or 2%, compared to 12,337 in 2021KCS and to support anticipated future volume growth.
Results of Operations
Operating Revenues
| | | | | | | | | | | | | | | | | | | | |
| | | | | | |
| For the year ended December 31 | 2022 | 2021 | | Total Change | % Change | | | | | |
| | | | | | | | | | |
Freight revenues (in millions)(1) | $ | 8,627 | | $ | 7,816 | | | $ | 811 | | 10 | | | | | | |
| Non-freight revenues (in millions) | 187 | | 179 | | | 8 | | 4 | | | | | | |
| Total revenues (in millions) | $ | 8,814 | | $ | 7,995 | | | $ | 819 | | 10 | | | | | | |
| Carloads (in thousands) | 2,782.1 | | 2,735.5 | | | 46.6 | | 2 | | | | | | |
| Revenue ton-miles (in millions) | 148,228 | | 149,686 | | | (1,458) | | (1) | | | | | | |
| Freight revenue per carload (in dollars) | $ | 3,101 | | $ | 2,857 | | | $ | 244 | | 9 | | | | | | |
| Freight revenue per revenue ton-mile (in cents) | 5.82 | | 5.22 | | | 0.60 | | 11 | | | | | | |
(1) Freight revenues include fuel surcharge revenues of $1,303 million in 2022 and $535 million in 2021. Fuel surcharge revenues include recoveries of carbon taxes, levies, and obligations under cap-and-trade program | | | | | | | | | | | | | | | | | | | | |
| | | | | | |
| For the year ended December 31 | 2023 | 2022 | | Total Change | % Change | | | | | |
| | | | | | | | | | |
| Freight revenues (in millions) | $ | 12,281 | | $ | 8,627 | | | $ | 3,654 | | 42 | | | | | | |
| Non-freight revenues (in millions) | 274 | | 187 | | | 87 | | 47 | | | | | | |
| Total revenues (in millions) | $ | 12,555 | | $ | 8,814 | | | $ | 3,741 | | 42 | | | | | | |
| Carloads (in thousands) | 4,045.6 | | 2,782.1 | | | 1,263.5 | | 45 | | | | | | |
| Revenue ton-miles (in millions) | 188,960 | | 148,228 | | | 40,732 | | 27 | | | | | | |
| Freight revenue per carload (in dollars) | $ | 3,036 | | $ | 3,101 | | | $ | (65) | | (2) | | | | | | |
| Freight revenue per revenue ton-mile (in cents) | 6.50 | | 5.82 | | | 0.68 | | 12 | | | | | | |
The Company’s revenues are primarily derived from transporting freight. Changes in freight volumes as measured by RTMs generally contribute to corresponding changes in freightFreight revenues and certain variable expenses such as fuel, equipment rents, and crew costs, and equipment rents.costs. Non-freight revenue isrevenues are generated from leasing of certain assets;assets, interline switching, and other arrangements, including contracts with passenger service operators, fibre optic agreements, and logistical services; switching fees; and other arrangements.services.
Total Revenues
The increase in Freight revenues wasprimarily due to the impact of the KCS acquisition of $3,405 million, increased freight revenue per RTM, partially offset by lowerand higher volumes as measured by RTMs.The increase in Non-freight revenues was primarily due to higher leasing revenue, higher passenger revenue from passenger service operators, andthe impact of the KCS acquisition of $62 million, higher interline switching fees, partially offset by lowerrevenue, higher revenue from logistical services.a fibre optic agreement, and higher leasing revenue.
RTMs
RTMs are defined as the movement of one revenue-producing ton of freight over a distance of one mile. RTMs measure the relative weight and distance of rail freight moved by the Company. The decreaseincrease in RTMs was mainly attributableprimarily due to lowerthe impact of the KCS acquisition and higher volumes of Canadian grain, Coal, and Energy, chemicals and plastics. This decrease wasAutomotive, partially offset by higherlower volumes of Intermodal, U.S. grain, Potash, and frac sand.crude. Carloads have increased more than RTMs due to the impact of the KCS acquisition as KCS has a shorter average length of haul.
Freight revenueRevenue per RTM
Freight revenue per RTM is defined as freight revenue per revenue-producing ton of freight over a distance of one mile. This is an indicator of yield. The increase in Freightfreight revenue per RTM was primarily due to higher fuel surcharge revenue as a result of higher fuel prices of $709 million, higher freight rates and the favourable impact of the change in foreign exchange ("FX") of $142 million. This increase was$165 million, partially offset by the unfavourable impact to fuel surcharge revenue as a result of lower crude liquidated damages, including customer volume commitments, due to completionfuel prices of customer contracts.$200 million.
38 / CPKC 2023 ANNUAL REPORT
Lines of Business
Grain
| | | For the year ended December 31 | For the year ended December 31 | 2022 | 2021 | Total Change | % Change | |
| | For the year ended December 31 | |
| | For the year ended December 31 | |
| | Freight revenues (in millions) | |
| | Freight revenues (in millions) | |
| | Freight revenues (in millions) | Freight revenues (in millions) | $ | 1,776 | | $ | 1,684 | | $ | 92 | | 5 | | |
| Carloads (in thousands) | Carloads (in thousands) | 382.1 | | 426.2 | | (44.1) | | (10) | | |
| Carloads (in thousands) | |
| Carloads (in thousands) | |
| Revenue ton-miles (in millions) | |
| Revenue ton-miles (in millions) | |
| Revenue ton-miles (in millions) | Revenue ton-miles (in millions) | 35,325 | | 37,999 | | (2,674) | | (7) | | |
| Freight revenue per carload (in dollars) | Freight revenue per carload (in dollars) | $ | 4,648 | | $ | 3,951 | | $ | 697 | | 18 | | |
| Freight revenue per carload (in dollars) | |
| Freight revenue per carload (in dollars) | |
| Freight revenue per revenue ton-mile (in cents) | Freight revenue per revenue ton-mile (in cents) | 5.03 | | 4.43 | | 0.60 | | 14 | | |
| Freight revenue per revenue ton-mile (in cents) | |
| Freight revenue per revenue ton-mile (in cents) | |
The increase in Grain revenue was primarily due to the impact of the KCS acquisition, higher volumes of Canadian grain to Vancouver, British Columbia ("B.C.") and Thunder Bay, Ontario due to prior year drought conditions that impacted the 2021-2022 crop size, and increased freight revenue per RTM and higherRTM. This increase was partially offset by lower volumes of U.S. corn from the U.S. Midwest to western Canada partially offset byprimarily due to an improved Canadian harvest for the 2022-2023 crop year, lower volumes of Canadian grainU.S. soybeans to Vancouver, B.C.the U.S. Pacific Northwest driven by a strong South American crop, and eastern Canada due to drought conditions that impacted the 2021-2022 Canadian crop size.unfavourable impact of fuel surcharge revenue as a result of lower fuel prices. Freight revenue per RTM increased due to higher freight rates and the favourable impact of the change in FX. RTMs increased more than carloads due to moving higher volumes of Canadian grain to Vancouver, which has a longer length of haul.
Coal
| | | | | | | | | | | | | | | | | | | |
| | | | | |
| For the year ended December 31 | 2023 | 2022 | Total Change | % Change | | | | | |
| | | | | | | | | |
| Freight revenues (in millions) | $ | 859 | | $ | 577 | | $ | 282 | | 49 | | | | | | |
| Carloads (in thousands) | 449.6 | | 269.8 | | 179.8 | | 67 | | | | | | |
| Revenue ton-miles (in millions) | 22,095 | | 14,970 | | 7,125 | | 48 | | | | | | |
| Freight revenue per carload (in dollars) | $ | 1,911 | | $ | 2,139 | | $ | (228) | | (11) | | | | | | |
| Freight revenue per revenue ton-mile (in cents) | 3.89 | | 3.85 | | 0.04 | | 1 | | | | | | |
The increase in Coal revenue was primarily due to the impact of the KCS acquisition, higher volumes of Canadian coal to Vancouver and Thunder Bay as a result of prior year production challenges at the mines, higher volumes of U.S. coal, and increased freight revenue per RTM. This increase was partially offset by the unfavourable impact to fuel surcharge revenue as a result of higherlower fuel prices and lower volumes of Canadian coal to Kamloops, B.C. Freight revenue per RTM increased due to higher freight rates and the favourable impact of the change in FX.
Potash
| | | | | | | | | | | | | | | | | | | |
| | | | | |
| For the year ended December 31 | 2023 | 2022 | Total Change | % Change | | | | | |
| | | | | | | | | |
| Freight revenues (in millions) | $ | 566 | | $ | 581 | | $ | (15) | | (3) | | | | | | |
| Carloads (in thousands) | 153.5 | | 160.0 | | (6.5) | | (4) | | | | | | |
| Revenue ton-miles (in millions) | 16,904 | | 18,176 | | (1,272) | | (7) | | | | | | |
| Freight revenue per carload (in dollars) | $ | 3,687 | | $ | 3,631 | | $ | 56 | | 2 | | | | | | |
| Freight revenue per revenue ton-mile (in cents) | 3.35 | | 3.20 | | 0.15 | | 5 | | | | | | |
The decrease in Potash revenue was primarily due to lower volumes of export potash to Vancouver as a result of the International Longshore and Warehouse Union's strike in July, lower volumes of export potash to the U.S. Pacific Northwest as a result of an equipment failure at the Port of Portland, Oregon, and the unfavourable impact to fuel surcharge revenue as a result of lower fuel prices. This decrease was partially offset by increased freight revenue per RTM and higher volumes of domestic potash. Freight revenue per RTM increased due to higher freight rates and the favourable impact of the change in FX. RTMs decreased less than carloads due to moving higher volumes of U.S. corn from the U.S. Midwest to western Canada, which has a longer length of haul.
Coal
| | | | | | | | | | | | | | | | | | | |
| | | | | |
| For the year ended December 31 | 2022 | 2021 | Total Change | % Change | | | | | |
| | | | | | | | | |
| Freight revenues (in millions) | $ | 577 | | $ | 625 | | $ | (48) | | (8) | | | | | | |
| Carloads (in thousands) | 269.8 | | 291.5 | | (21.7) | | (7) | | | | | | |
| Revenue ton-miles (in millions) | 14,970 | | 18,345 | | (3,375) | | (18) | | | | | | |
| Freight revenue per carload (in dollars) | $ | 2,139 | | $ | 2,144 | | $ | (5) | | — | | | | | | |
| Freight revenue per revenue ton-mile (in cents) | 3.85 | | 3.41 | | 0.44 | | 13 | | | | | | |
The decrease in Coal revenue was primarily due to lower volumes of Canadian coal to Vancouver as a result of production challenges at the mines, partially offset by higher volumes of Canadian coal to Kamloops, B.C. and increased freight revenue per RTM. Freight revenue per RTM increased due to higher fuel surcharge revenue as a result of higher fuel prices and higher freight rates. RTMs decreased more than carloads due to moving lower volumes of Canadian coalexport potash to Vancouver, which has a longer length of haul, and moving higher volumes of Canadian coal to Kamloops, which has a shorter length of haul.
CPKC 2023 ANNUAL REPORT / 39
Potash
| | | | | | | | | | | | | | | | | | | |
| | | | | |
| For the year ended December 31 | 2022 | 2021 | Total Change | % Change | | | | | |
| | | | | | | | | |
| Freight revenues (in millions) | $ | 581 | | $ | 463 | | $ | 118 | | 25 | | | | | | |
| Carloads (in thousands) | 160.0 | | 150.9 | | 9.1 | | 6 | | | | | | |
| Revenue ton-miles (in millions) | 18,176 | | 16,671 | | 1,505 | | 9 | | | | | | |
| Freight revenue per carload (in dollars) | $ | 3,631 | | $ | 3,068 | | $ | 563 | | 18 | | | | | | |
| Freight revenue per revenue ton-mile (in cents) | 3.20 | | 2.78 | | 0.42 | | 15 | | | | | | |
The increase in Potash revenue was primarily due to increased freight revenue per RTM and higher volumes of export potash to Vancouver and Thunder Bay, Ontario. Freight revenue per RTM increased due to higher fuel surcharge revenue as a result of higher fuel prices, the favourable impact of the change in FX, and higher freight rates.
Fertilizers and Sulphur
| | | For the year ended December 31 | For the year ended December 31 | 2022 | 2021 | Total Change | % Change | |
| | For the year ended December 31 | |
| | For the year ended December 31 | |
| | Freight revenues (in millions) | |
| | Freight revenues (in millions) | |
| | Freight revenues (in millions) | Freight revenues (in millions) | $ | 332 | | $ | 305 | | $ | 27 | | 9 | | |
| Carloads (in thousands) | Carloads (in thousands) | 61.8 | | 64.4 | | (2.6) | | (4) | | |
| Carloads (in thousands) | |
| Carloads (in thousands) | |
| Revenue ton-miles (in millions) | |
| Revenue ton-miles (in millions) | |
| Revenue ton-miles (in millions) | Revenue ton-miles (in millions) | 4,772 | | 4,845 | | (73) | | (2) | | |
| Freight revenue per carload (in dollars) | Freight revenue per carload (in dollars) | $ | 5,372 | | $ | 4,736 | | $ | 636 | | 13 | | |
| Freight revenue per carload (in dollars) | |
| Freight revenue per carload (in dollars) | |
| Freight revenue per revenue ton-mile (in cents) | Freight revenue per revenue ton-mile (in cents) | 6.96 | | 6.30 | | 0.66 | | 10 | | |
| Freight revenue per revenue ton-mile (in cents) | |
| Freight revenue per revenue ton-mile (in cents) | |
The increase in Fertilizers and sulphur revenue was primarily due to increased freight revenue per RTM, the impact of the KCS acquisition, and higher volumes of dry fertilizers,wet fertilizers. This increase was partially offset by lower volumes of wetdry fertilizers and sulphur. Freight revenue per RTM increased duethe unfavourable impact to higher fuel surcharge revenue as a result of higherlower fuel prices,prices. Freight revenue per RTM increased due to higher freight rates and the favourable impact of the change in FX.
Forest Products
| | | For the year ended December 31 | For the year ended December 31 | 2022 | 2021 | Total Change | % Change | |
| | For the year ended December 31 | |
| | For the year ended December 31 | |
| | Freight revenues (in millions) | |
| | Freight revenues (in millions) | |
| | Freight revenues (in millions) | Freight revenues (in millions) | $ | 403 | | $ | 348 | | $ | 55 | | 16 | | |
| Carloads (in thousands) | Carloads (in thousands) | 73.1 | | 73.6 | | (0.5) | | (1) | | |
| Carloads (in thousands) | |
| Carloads (in thousands) | |
| Revenue ton-miles (in millions) | |
| Revenue ton-miles (in millions) | |
| Revenue ton-miles (in millions) | Revenue ton-miles (in millions) | 5,741 | | 5,718 | | 23 | | — | | |
| Freight revenue per carload (in dollars) | Freight revenue per carload (in dollars) | $ | 5,513 | | $ | 4,728 | | $ | 785 | | 17 | | |
| Freight revenue per carload (in dollars) | |
| Freight revenue per carload (in dollars) | |
| Freight revenue per revenue ton-mile (in cents) | Freight revenue per revenue ton-mile (in cents) | 7.02 | | 6.09 | | 0.93 | | 15 | | |
| Freight revenue per revenue ton-mile (in cents) | |
| Freight revenue per revenue ton-mile (in cents) | |
The increase in Forest products revenue was primarily due to the impact of the KCS acquisition, increased freight revenue per RTM, higher volumes of paperboard from Chicago, Illinois to Alberta, higher volumes of lumber from western Canada to Texas, and higher volumes of wood pulp from Ontario. This increase was partially offset by the unfavourable impact to fuel surcharge revenue as a result of lower fuel prices, lower volumes of panel products from western Canada, and lower volumes of newsprint from Saint John, New Brunswick, partially offset by lower volumes of lumber.Brunswick. Freight revenue per RTM increased due to higher fuel surcharge revenue as a result of higher fuel prices, higher freight rates and the favourable impact of the change in FX.
Energy, Chemicals and Plastics
| | | For the year ended December 31 | For the year ended December 31 | 2022 | 2021 | Total Change | % Change | |
| | For the year ended December 31 | |
| | For the year ended December 31 | |
| | Freight revenues (in millions) | |
| | Freight revenues (in millions) | |
| | Freight revenues (in millions) | Freight revenues (in millions) | $ | 1,394 | | $ | 1,563 | | $ | (169) | | (11) | | |
| Carloads (in thousands) | Carloads (in thousands) | 297.4 | | 320.1 | | (22.7) | | (7) | | |
| Carloads (in thousands) | |
| Carloads (in thousands) | |
| Revenue ton-miles (in millions) | |
| Revenue ton-miles (in millions) | |
| Revenue ton-miles (in millions) | Revenue ton-miles (in millions) | 24,625 | | 25,469 | | (844) | | (3) | | |
| Freight revenue per carload (in dollars) | Freight revenue per carload (in dollars) | $ | 4,687 | | $ | 4,883 | | $ | (196) | | (4) | | |
| Freight revenue per carload (in dollars) | |
| Freight revenue per carload (in dollars) | |
| Freight revenue per revenue ton-mile (in cents) | Freight revenue per revenue ton-mile (in cents) | 5.66 | | 6.14 | | (0.48) | | (8) | | |
| Freight revenue per revenue ton-mile (in cents) | |
| Freight revenue per revenue ton-mile (in cents) | |
The decreaseincrease in Energy, chemicals and plastics revenue was primarily due to decreasedthe impact of the KCS acquisition, higher volumes of petroleum products and plastics, and increased freight revenue per RTM and lower volumes of conventional crude, LPG, and other energy products.RTM. This decreaseincrease was partially offset by higherlower volumes of crude, liquified petroleum gas ("L.P.G."), biofuels, and ethylene glycol, and the unfavourable impact to fuel surcharge revenue as a result of lower fuel prices. Freight revenue per RTM increased due to higher fuel prices, higher volumes of DRUbitTM crude to Kansas City, Missourifreight rates and ethylene glycol to Vancouver, the favourable impact of the change in FX, and higher freight rates. Freight revenue per RTM decreased due to lower crude liquidated damages, including customer volume commitments, as a result of the completion of customer contracts. RTMs decreased less than carloads due to moving higher volumes of DRUbitFX.
TM crude to Kansas City, which has a longer length of haul.
Metals, Minerals and Consumer Products
| | | For the year ended December 31 | For the year ended December 31 | 2022 | 2021 | Total Change | % Change | |
| | For the year ended December 31 | |
| | For the year ended December 31 | |
| | Freight revenues (in millions) | |
| | Freight revenues (in millions) | |
| | Freight revenues (in millions) | Freight revenues (in millions) | $ | 884 | | $ | 728 | | $ | 156 | | 21 | | |
| Carloads (in thousands) | Carloads (in thousands) | 248.3 | | 236.7 | | 11.6 | | 5 | | |
| Carloads (in thousands) | |
| Carloads (in thousands) | |
| Revenue ton-miles (in millions) | |
| Revenue ton-miles (in millions) | |
| Revenue ton-miles (in millions) | Revenue ton-miles (in millions) | 11,710 | | 11,170 | | 540 | | 5 | | |
| Freight revenue per carload (in dollars) | Freight revenue per carload (in dollars) | $ | 3,560 | | $ | 3,076 | | $ | 484 | | 16 | | |
| Freight revenue per carload (in dollars) | |
| Freight revenue per carload (in dollars) | |
| Freight revenue per revenue ton-mile (in cents) | Freight revenue per revenue ton-mile (in cents) | 7.55 | | 6.52 | | 1.03 | | 16 | | |
| Freight revenue per revenue ton-mile (in cents) | |
| Freight revenue per revenue ton-mile (in cents) | |
The increase in Metals, minerals and consumer products revenue was primarily due to the impact of the KCS acquisition, increased freight revenue per RTM, and higher volumes of frac sand to the Marcellusaggregates, minerals and Bakken shale formations,metals, and consumer products. This increase was partially offset by the unfavourable impact to fuel surcharge revenue as a result of lower fuel prices and lower volumes of steel and aggregates.steel. Freight revenue per RTM increased due to higher fuel surcharge revenue as a result of higher fuel prices, higher freight rates and the favourable impact of the change in FX.
Automotive
| | | For the year ended December 31 | For the year ended December 31 | 2022 | 2021 | Total Change | % Change | |
| | For the year ended December 31 | |
| | For the year ended December 31 | |
| | Freight revenues (in millions) | |
| | Freight revenues (in millions) | |
| | Freight revenues (in millions) | Freight revenues (in millions) | $ | 438 | | $ | 376 | | $ | 62 | | 16 | | |
| Carloads (in thousands) | Carloads (in thousands) | 104.4 | | 109.2 | | (4.8) | | (4) | | |
| Carloads (in thousands) | |
| Carloads (in thousands) | |
| Revenue ton-miles (in millions) | |
| Revenue ton-miles (in millions) | |
| Revenue ton-miles (in millions) | Revenue ton-miles (in millions) | 1,736 | | 1,765 | | (29) | | (2) | | |
| Freight revenue per carload (in dollars) | Freight revenue per carload (in dollars) | $ | 4,195 | | $ | 3,443 | | $ | 752 | | 22 | | |
| Freight revenue per carload (in dollars) | |
| Freight revenue per carload (in dollars) | |
| Freight revenue per revenue ton-mile (in cents) | Freight revenue per revenue ton-mile (in cents) | 25.23 | | 21.30 | | 3.93 | | 18 | | |
| Freight revenue per revenue ton-mile (in cents) | |
| Freight revenue per revenue ton-mile (in cents) | |
The increase in Automotive revenue was primarily due to the impact of the KCS acquisition, higher volumes from Chicago, various origins in Ontario, Vancouver, and Kansas City, Missouri to various destinations in Canada, partially due to prior year global supply chain challenges, and increased freight revenue per RTM,RTM. This increase was partially offset by lower volumesthe unfavourable impact to fuel surcharge revenue as a result of global supply chain challenges.lower fuel prices. Freight revenue per RTM increased due to higher fuel surcharge revenue as a result of higher fuel prices,freight rates and the favourable impact of the change in FX,FX. RTMs increased more than carloads due to moving higher volumes from Chicago, Ontario, and Kansas City to western Canada and higher freight rates.volumes from Vancouver to eastern Canada, which have longer lengths of haul.
Intermodal
| | | For the year ended December 31 | For the year ended December 31 | 2022 | 2021 | Total Change | % Change | |
| | For the year ended December 31 | |
| | For the year ended December 31 | |
| | Freight revenues (in millions) | |
| | Freight revenues (in millions) | |
| | Freight revenues (in millions) | Freight revenues (in millions) | $ | 2,242 | | $ | 1,724 | | $ | 518 | | 30 | | |
| Carloads (in thousands) | Carloads (in thousands) | 1,185.2 | | 1,062.9 | | 122.3 | | 12 | | |
| Carloads (in thousands) | |
| Carloads (in thousands) | |
| Revenue ton-miles (in millions) | |
| Revenue ton-miles (in millions) | |
| Revenue ton-miles (in millions) | Revenue ton-miles (in millions) | 31,173 | | 27,704 | | 3,469 | | 13 | | |
| Freight revenue per carload (in dollars) | Freight revenue per carload (in dollars) | $ | 1,892 | | $ | 1,622 | | $ | 270 | | 17 | | |
| Freight revenue per carload (in dollars) | |
| Freight revenue per carload (in dollars) | |
| Freight revenue per revenue ton-mile (in cents) | Freight revenue per revenue ton-mile (in cents) | 7.19 | | 6.22 | | 0.97 | | 16 | | |
| Freight revenue per revenue ton-mile (in cents) | |
| Freight revenue per revenue ton-mile (in cents) | |
The increase in Intermodal revenue was primarily due to increasedthe impact of the KCS acquisition, higher freight revenue per RTM,rates, higher international intermodal volumes due to onboarding a new internationalcustomer and higher volumes imported through the Port of Vancouver, higher domestic wholesale volumes, and the favourable impact of the change in FX. This increase was partially offset by lower intermodal customers, higherancillary revenue, lower domestic intermodal volumes due to lower cross-border volumes between Canada and the U.S. and lower retail volumes, lower international intermodal volumes to and from the Port of Saint John, New Brunswick and to and from the Port of Vancouver,Montréal, Québec, and the Port of Montreal, and higher domestic intermodal retail and wholesale volumes. This increase was partially offset by lower domestic intermodal cross-border volumes. Freight revenue per RTM increased dueunfavourable impact to higher fuel surcharge revenue as a result of higherlower fuel prices, higher intermodal ancillary revenue, higher freight rates, and the favourable impact of the change in FX.
37 CP 2022CPKC 2023 ANNUAL REPORT/ 41
Operating Expenses
| | | | | | | | | | | | | | | | | | | | |
| | | | | | |
For the year ended December 31
(in millions of Canadian dollars) | 2022 | 2021 | | Total Change | % Change | | | | | |
| Compensation and benefits | $ | 1,570 | | $ | 1,570 | | | $ | — | | — | | | | | | |
| Fuel | 1,400 | | 854 | | | 546 | | 64 | | | | | | |
| Materials | 260 | | 215 | | | 45 | | 21 | | | | | | |
| Equipment rents | 140 | | 121 | | | 19 | | 16 | | | | | | |
| Depreciation and amortization | 853 | | 811 | | | 42 | | 5 | | | | | | |
| Purchased services and other | 1,262 | | 1,218 | | | 44 | | 4 | | | | | | |
| Total operating expenses | $ | 5,485 | | $ | 4,789 | | | $ | 696 | | 15 | | | | | | |
Operating expenses were $5,485 million in 2022, an increase of $696 million, or 15%, from $4,789 million in 2021. This increase was primarily due to:
•the unfavourable impact of higher fuel prices of $483 million;
•the impact of cost inflation;
•the unfavourable impact of the change in FX of $71 million;
•a gain on the exchange of property and construction easements in Chicago of $50 million in 2021 and lower gains on land sales of $15 million; and
•a decrease in efficiencies primarily due to harsh winter weather conditions in the first quarter of 2022.
This increase was partially offset by lower acquisition-related costs of $109 million associated with the KCS acquisition recorded in Purchased services and other, and lower incentive and stock-based compensation primarily due to lower payout assumptions. | | | | | | | | | | | | | | | | | | | | |
| | | | | | |
For the year ended December 31
(in millions of Canadian dollars) | 2023 | 2022 | | Total Change | % Change | | | | | |
| Compensation and benefits | $ | 2,332 | | $ | 1,570 | | | $ | 762 | | 49 | | | | | | |
| Fuel | 1,681 | | 1,400 | | | 281 | | 20 | | | | | | |
| Materials | 346 | | 260 | | | 86 | | 33 | | | | | | |
| Equipment rents | 277 | | 140 | | | 137 | | 98 | | | | | | |
| Depreciation and amortization | 1,543 | | 853 | | | 690 | | 81 | | | | | | |
| Purchased services and other | 1,988 | | 1,262 | | | 726 | | 58 | | | | | | |
| Total operating expenses | $ | 8,167 | | $ | 5,485 | | | $ | 2,682 | | 49 | | | | | | |
Compensation and Benefits
Compensation and benefits expense includes employee wages, salaries, fringe benefits, and stock-based compensation. The increase in Compensation and benefits expense was $1,570 million in 2022, unchanged compared to $1,570 million in 2021. This was primarily due to lower incentive and stock-based compensationto:
•the impact of the KCS acquisition of $645 million, including acquisition-related costs incurred by KCS of $55 million, which were primarily due to lower payout assumptions, and lower post-retirement benefits current service costcomprised of $24 million.
These decreases were offset by:
•the impact of wage and benefit inflation;
•higher incentive compensation;
•reduced labour efficiencies, including the impact of reduced train weights;
•the unfavourable impact of the change in FX of $18$16 million;
•higher acquisition-related costs incurred by CPKC, excluding KCS's acquisition-related costs, of $14 million, including stock-based compensation of $10 million; and
•iincreased volume variable expenses as a result of an increase in workload as measured by GTMs.
ncreased new hire training cost.
This increase was partially offset by a reduction of $77 million in defined benefit pension current service costs and the favourable impact of changes in common share price of $12 million on stock-based compensation.
Fuel
Fuel expense consists mainly of fuel used by locomotives and includes provincial, state, and federal fuel taxes. The increase in Fuel expense was $1,400 million in 2022, an increase of $546 million, or 64%, from $854 million in 2021. This increase was primarily due to:
•the unfavourable impact of higher fuel pricesthe KCS acquisition of $483$441 million;
•a decrease in fuel efficiency of 3% due to harsher winter operating conditions in 2022, higher volumes of Intermodal, which has lower horsepower utilization, and lower locomotive productivity defined as the daily average GTMs divided by daily average operating horsepower; and
•the unfavourable impact of the change in FX of $27$42 million; and
•an increase in workload, as measured by GTMs.
This increase was partially offset by a decrease in workload, as measured by GTMs.the favourable impact of lower fuel prices of $221 million.
Materials
Materials expense includes the cost of material used for maintenance of track, locomotives, freight cars, and buildings, as well as software sustainment. The increase in Materials expense was $260 million in 2022, an increase of $45 million, or 21%, from $215 million in 2021. This increase was primarily due to:
•to the impact of costthe KCS acquisition of $89 million and the unfavourable impact of inflation, particularlypartially offset by a decrease in non-locomotive fuel prices;
•higher spending on track and locomotive maintenance and;
•an increase in non-locomotive fuel consumption.maintenance.
Equipment Rents
Equipment rents expense includes the cost associated with using other companies’railways' freight cars, intermodal equipment, and locomotives, net of rental incomerecoveries received from other railways for the use of the Company’s equipment. The increase in Equipment rents expense was $140 million in 2022, an increase of $19 million, or 16%, from $121 million in 2021. This increase was primarily due to:
•lower price incentives received on intermodal cars;
•slower cycle times; andthe impact of the KCS acquisition of $110 million;
•greater usage of pooled freight cars.cars;
•reduced rental income received from other railways; and
•slower cycle times.
This increase was partially offset by higher receipts for CP freight cars used bygreater recoveries from other railways.railway's use of the company's locomotives.
42 / CPKC 2023 ANNUAL REPORT
Depreciation and Amortization
Depreciation and amortization expense representsis the charge associated with the use of track and roadway, buildings, rolling stock, information systems,buildings, and other depreciable assets, including assets related to the Company's concession with the Mexican government, as well as amortization of finite life intangible assets. The increase in Depreciation and amortization expense was $853 million for 2022, an increase of $42 million, or 5%, from $811 million in 2021. This increase was primarily due to:
•the impact of the KCS acquisition of $629 million, including additional depreciation of $175 million and amortization of $59 million attributed to fair value adjustments to properties and intangible assets with finite lives recognized upon the acquisition of KCS;
•a higher depreciable asset base as a result of the capital program spending in 20222023 and recent years as well as years; and
•the unfavourable impact of the change in FX of $8 million.
Purchased Services and Other
| | For the year ended December 31
(in millions of Canadian dollars) | |
For the year ended December 31
(in millions of Canadian dollars) | |
For the year ended December 31
(in millions of Canadian dollars) | For the year ended December 31
(in millions of Canadian dollars) | 2022 | 2021 | Total Change | % Change | 2023 | 2022 | Total Change | % Change |
| Support and facilities | Support and facilities | $ | 334 | | $ | 293 | | $ | 41 | | 14 | |
| Track and operations | Track and operations | 294 | | 260 | | 34 | | 13 | |
| Intermodal | Intermodal | 225 | | 205 | | 20 | | 10 | |
| Equipment | Equipment | 112 | | 105 | | 7 | | 7 | |
| Casualty | Casualty | 103 | | 125 | | (22) | | (18) | |
| Property taxes | Property taxes | 133 | | 128 | | 5 | | 4 | |
| Other | 85 | | 191 | | (106) | | (55) | |
| Land sales | (24) | | (89) | | 65 | | (73) | |
Other (1) | |
| Land sales (gains) losses | |
| Total Purchased services and other | Total Purchased services and other | $ | 1,262 | | $ | 1,218 | | $ | 44 | | 4 | |
(1) 2023 includes KCS results from April 14 to December 31, 2023.
Purchased services and other expense encompasses a wide range of third-party costs, including expenses for joint facilities, personal injury and damage claims, environmental remediation, property taxes, contractor and consulting fees, locomotive and freight car repairs performed by third parties, property and other taxes, intermodal pickup and delivery services, casualty expense, expenses for joint facilities, and gains on land sales.insurance. The increase in Purchased services and other expense was $1,262 million in 2022, an increase of $44 million, or 4%, from $1,218 million in 2021. This increase was primarily due to:
•the impact of cost inflation,the KCS acquisition of $590 million, including higher pickup and delivery, which isacquisition-related costs incurred by KCS of $18 million, reported in Intermodal;Other;
•a gain on the exchangean increased number of propertycasualty incidents and construction easementshigher personal injury costs, reported in Chicago of $50 million in 2021 and Casualty;
•cost inflation;
•lower gains on land sales of $15 million;sales;
•higher expenses primarily dueacquisition-related costs incurred by CPKC, excluding KCS's acquisition-related costs, of $19 million including payments made to higher eventscertain communities across the combined network to address the environmental and sponsorship costs;societal impacts of increased traffic, reported in Other; and
•the unfavourable impact of the change in FX of $13 million;
•increased purchased services due to harsher weather conditions, reported in Track and operations; and
•a $7 million arbitration settlement in 2021, reported in Track and operations.$18 million.
This increase was partially offset by:
•lower acquisition-related costsby a business interruption insurance recovery of $109$51 million, associated with the KCS acquisition, reported in Other;
•lower expenses from lower volumes, reported in Intermodal, and Track and operations; and
•lower expenses primarily due to the reduced severity of casualty incidents.Other.
Other Income Statement Items
Equity Earnings (Loss) of Kansas City Southern
On DecemberApril 14, 2021, following2023, the consummation of the KCS acquisition, the sharesCompany assumed control of KCS were placed into a voting trust while the United States Surface Transportation Board (“STB”) considers the Company's application for controland subsequently ceased recognizing equity earnings of KCS.
In 2022,For the period from January 1 to April 13, 2023, the Company recognized $1,074$230 million (U.S. $820$170 million) of equity earnings of KCS, a decrease of $844 million or 79%, from $1,074 million (U.S. $820 million) in the Company's Consolidated Statements of Income.year ended December 31, 2022. This amount is net of amortization of basis differences of $48 million (U.S. $35 million) associated with KCS purchase accounting, a decrease of $115 million or 71%, from $163 million (U.S. $125 million) associated with KCS purchase accounting,in the year ended December 31, 2022, and includesis net of acquisition-related costs (net of tax) incurred by KCS. These basis differences relate to depreciable property, plant and equipment, intangible assets with definite lives, and long-term debt, and are amortized over the related assets' remaining useful lives, and the remaining terms to maturity of the debt instruments. Equity earnings for 2022 represent a full yearAcquisition-related costs (net of income attributable to CP, whereas the $141 million equity loss recognized in 2021 was limited to the 18 day period from the date of acquisition of KCS closing into the voting trust to December 31, 2021. The equity loss in 2021 was attributable to acquisition-related coststax) incurred by KCS during that period. in the period from January 1 to April 13, 2023 were $11 million (U.S. $8 million), a decrease of $38 million or 78%, from $49 million (U.S. $38 million) in the year ended December 31, 2022. These decreases are attributable to the derecognition of KCS as an equity investment following the acquisition of control by CPKC on April 14, 2023. Equity earnings of KCS recognized in 2022 also included KCS's gain on unwinding of interest rate hedges of $212 million, which is net of CtheP's associated purchase accounting basis difference and tax. KCS's gain on unwinding of interest rate hedges and acquisition-related costs are discussed further and reconciled in Non-GAAP Measures of this Item 7. Management's Discussion and Analysis of Financial Condition and Results of Operations.
On aKCS U.S. dollar historical basis, without any effect of purchase accounting, KCS recorded net income attributable to controlling interests of $1,278 million (U.S. $982 million) in 2022, a favourable change of $620 million (U.S. $457 million), or 94%, from $658 million (U.S. $525 million) net income in 2021. Included within the $1,278 million (U.S $982 million) net income was a $254 million (net of tax) (U.S $195 million) gain from the unwinding of interest rate hedges. The remainder of the change was primarily due to higher revenues of $692 million (U.S. $423 million) and lower acquisition related costs, partially offset by higher fuel cost of $208 million (U.S. $148 million). Acquisition-related costs (net of tax) incurred by KCS in 2022results were $50 million (U.S. $38 million), a decrease of $221 million (U.S. $178 million), or 82%, from $271 million (U.S. $216 million) in the same period of 2021. These values have been translated at the average FX rate for the period from January 1 to April 13, 2023 and the year ended December 31, 2022 of $1.00 USD = $1.35 CAD and $1.00 USD = $1.30 and $1.25 CAD, per USD for 2022 and 2021, respectively.
CPKC 2023 ANNUAL REPORT / 43
Other Expense (Income)
Other expense (income)consists of gains and losses from the change in FX on debt and lease liabilitiescash and working capital, the impact of foreign currency forwards, financing costs, related to financing, shareholder costs, equity income,earnings, and other non-operating expenditures. Other expense was $52 million in 2023, an increase of $35 million, or 206%, from $17 million in 2022, a decrease of $220 million, or 93%, from expense of $237 million in 2021. This decrease2022. The increase was primarily due to the impact of the KCS acquisition, including foreign exchange losses on forward contracts to sell Mexican pesos and buy U.S.dollars, of $27 million, and net acquisition-related costs of $247$6 million in 2021, which included losses on interest rate hedges of $264 million and bridge facility and backstop revolver fees of $52 million, partially offsetdriven by gains on cash held for the KCS acquisition of $56 million, and gains on FX hedges of $13 million. This decrease was partially offset by lower net FX gains on US-denominated cash, working capital, debt and lease liabilities of $11 million in 2022 and higher amortization of fees of $11 million related to debt issued forexchange. Additional information concerning the KCS acquisitiondebt exchange is included in the last quarter of 2021.Item 8. Financial Statements and Supplementary Data, Note 17 Debt.
FX translation gains and losses on debt and lease liabilities and acquisition-related costs are discussed further in Non-GAAP Measures of this Item 7. Management's Discussion and Analysis of Financial Condition and Results of Operations.
Merger Termination Fee
On May 21, 2021, KCS terminated the Agreement and Plan of Merger (the "Original Merger Agreement") with CP to enter into a definitive agreement with CN. At the same time and in accordance with the terms of the Original Merger Agreement, KCS paid CP a termination fee of $845 million (U.S. $700 million). This amount was reported as "Merger termination fee" in the Company's Consolidated Statements of Income in 2021. No similar items were received in 2022. Merger termination fee is discussed further and reconciled in Non-GAAP Measures of this Item 7. Management's Discussion and Analysis of Financial Condition and Results of Operations.
Other Components of Net Periodic Benefit Recovery
Other components of net periodic benefit recovery isare related to the Company's pension and other post-retirement and post-employment benefit plans. It includes interest cost on benefit obligations,obligation, expected return on plan assets, recognized net actuarial losses,loss, and amortization of prior service costs. Other components of net periodic benefit recovery were $327 million in 2023, a decrease of $84 million, or 20%, from $411 million in 2022, an increase of $24 million, or 6%, from $387 million in 2021.2022. This increasedecrease was primarily due to a decrease in recognized net actuarial losses of $57 million, partially offset by an increase in interest cost on the benefit obligation of $32$109 million and a decrease in the expected return on plan assets of $77 million, partially offset by a decrease in recognized net actuarial losses of $103 million.
Net Interest Expense
Net interest expense includes interest on long-term debt and finance leases. Net interest expense was $771 million in 2023, an increase of $119 million, or 18%, from $652 million in 2022, an increase of $212 million, or 48%, from $440 million in 2021.2022. This increase was primarily due to to:
•interest of $234$106 million incurred on long-term debt issuances and term facility related toissued under the KCS acquisition, adebt exchange;
•the unfavourable impact of the change in FX of $15$20 million;
•higher interest on commercial paper of $19 million as a result of higher interest rates and higher commercial paper interestborrowings; and
•the impact of $10the KCS Purchase Accounting of $13 million.
This increase was partially offset by lower interest costs of $19 million following the favourable impactsrepayment of maturing long-term debt repaymentsand higher interest income of $32$12 million.
Remeasurement of Kansas City Southern
On April 14, 2023, the Company assumed control of KCS and accounted for its acquisition as a business combination achieved in stages. The Company's investment in KCS was accounted for using the equity method of accounting prior to assuming control. On control, the carrying value of the previously held equity investment in KCS was remeasured to its fair value and upon derecognition, a loss of $7,175 million and $14 million resulting from lower effective interest rates.was recognized in the Company's Consolidated Statements of Income for the year ended December 31, 2023. This loss was primarily due to the reversal of a value equal to the deferred tax liability on the outside basis difference which was initially recognized with the investment in KCS.
Income Tax (Recovery) Expense
Income tax recovery was $6,976 million in 2023, a change of $7,604 million, or 1,211%, from an income tax expense wasof $628 million in 2022, a decrease of $140 million, or 18%, from $768 million in 2021.2022. This decreasechange was primarily due to:
•lower taxable earnings, mainly due toa deferred tax recovery of $7,832 million on the $845 million (U.S. $700 million) merger termination payment received in 2021 in connection with KCS's terminationderecognition of the Original Merger Agreement, partially offset by lowerdeferred tax liability on the outside basis difference of the investment in KCS upon acquiring control;
•a deferred tax recovery of $58 million on the revaluation of deferred income tax balances on unitary state apportionment changes;
•higher current tax recoveries on acquisition-related costs of $14 million associated with the KCS acquisition;acquisition incurred by legacy CP; and
•lower current tax expense due to lower taxable earnings.
This change was partially offset by the impact of the KCS acquisition of $256 million, including current tax expense related to tax settlements of $16 million with the Servicio de Administración Tributaria ("SAT”) (Mexican tax authority) in relation to taxation years for which audits have closed and the estimated impact of potential future audit settlements, deferred tax recoveries on the amortization relating to purchase accounting fair value adjustments of $67 million, and current tax recoveries on acquisition-related costs of $7 million. In addition to the impact of the KCS acquisition, there was also an increase in income tax expense due to a higher effective tax rate and a reversal of an uncertain tax position in 2022 related to a prior period of $24 million; and
•income tax recoveries of $12 million asmillion. As a result of a decreasethe KCS debt exchange an offsetting current tax expense and deferred tax recovery of $101 million is included in the Iowa state"income tax rate.(recovery) expense".
This decreaseThe effective income tax rate for 2023 was partially offset by lower deferred tax recoveries of $14 million228.50% and 24.01% on changes in the outside basis difference of the equity investment in KCS.
a Core adjusted basis. The effective income tax rate for 2022 was 15.16% and 22.24% on ana Core adjusted basis. The Company's 2024 Core adjusted effective income tax rate for 2021 was 21.23% and 23.85% on an adjusted basis.is expected to be between 25.00% to 25.50%. The Core adjusted effective tax rate is a Non-GAAP measure, calculated as the effective tax rate adjusted for significant items as they are not considered indicative of future financial trends either by nature or amount ornor provide improved comparability to past performance. The Company uses Core adjusted effective tax rate to evaluate CPKC’s operating performance and in 2022, thefor planning and forecasting future profitability. Core adjusted effective tax rate also excludedexcludes equity earnings of KCS.KCS (net of tax) and KCS purchase accounting to provide financial statement users with additional transparency by isolating the impact of KCS purchase accounting. This Non-GAAP measure does not have a standardized meaning and is not defined by GAAP and, therefore, may not be comparable
44 / CPKC 2023 ANNUAL REPORT
to similar measures presented by other companies. Significant items and KCS purchase accounting are discussed further in Non-GAAP Measures of this Item 7. Management’s Discussion and Analysis of Financial Condition and Results of Operations.
The Company's 2023 effective tax rate is expected to be approximately 24%, which excludes discrete tax items, the impact of the change in the equity investment in KCS, and associated deferred tax on the outside basis difference during the year (discussed further in Critical Accounting Estimates of this Item 7. Management's Discussion and Analysis of Financial Condition and Results of Operation). The Company’s 20232024 outlook for its Core adjusted annualized effective income tax rate is based on certain assumptions about events and developments that may or may not materialize, or that may be offset entirely or partially by new events and developments. These assumptions are discussed further in Item 1A. Risk Factors.
Impact of Foreign Exchange on Earnings and Foreign Exchange Risk
Although the Company conducts business primarilyis headquartered in Canada and reports in Canadian dollars, a significant portion of its revenues, expenses, assets and liabilities including debt are denominated in U.S. dollars.dollars and Mexican pesos. In addition, equity earnings or losses of KCS are denominated in U.S. dollars. The value of the Canadian dollar is affected by a number of domestic and international factors, including, without limitation, economic performance, commodity prices, and Canadian, U.S., and international monetary policies. Fluctuations in FX affect the Company'sCompany’s results because U.S. dollar-denominated revenues and expenses denominated in U.S. dollars and Mexican pesos are translated into Canadian dollars. U.S. dollar-denominated revenues and expenses increase (decrease) when the Canadian dollar weakens (strengthens) in relation to the U.S. dollar. Mexican peso-denominated revenues and expenses increase (decrease) when the U.S. dollar weakens (strengthens) in relation to the Mexican peso.
In 2022,2023, the U.S. dollar has strengthened to an average rate of $1.30$1.35 Canadian/U.S. dollar, compared to $1.25$1.30 Canadian/U.S. dollar in 2021. In 2022, the impact of a stronger U.S. dollar resultedresulting in an increase in Total revenues of $143$166 million, an increase in Total operating expenses of $71$90 million, and an increase in Net interest expense of $15$20 million.
In 2023, excluding impacts of KCS,2024, the Company expects that every $0.01 weakening (or strengthening) of the Canadian dollar relative to the U.S. dollar, positively (or negatively) impacts Total revenues by approximately $75 million (2023 – approximately $37 million (2022 – approximately $35 million)excluding the impact of KCS), negatively (or positively) impacts Operating expenses by approximately $46 million (2023 – approximately $18 million (2022 – approximately $19 million)excluding the impact of KCS), and negatively (or positively) impacts Net interest expense by approximately $4$5 million (2022(2023 – approximately $4 million)million excluding the impact of KCS) on an annualized basis.
In 2024, the Company expects that every Ps.0.10 strengthening (or weakening) of the Mexican peso relative to the Canadian dollar, positively (or negatively) impacts Total revenues by approximately $7 million and negatively (or positively) impacts Operating expenses by approximately $7 million on an annualized basis.
The Company uses U.S. dollar-denominated debt and operating lease liabilities to hedge its net investment in U.S. operations. As at December 31, 2022,2023, the net investment in U.S. operations is greater than the total U.S. denominated debt.debt and the operating lease liabilities. Consequently, FX translation on the Company's unhedged net investment in U.S. operations is recognized in Other comprehensive income. There is no additional impact on earnings in Other expense (income) related to the FX translation on the Company’s debt and operating lease liabilities.
To manage its exposure to fluctuations in exchange rates between Canadian anddollars, U.S. dollars, and Mexican pesos, the Company may sell or purchase U.S. dollar or Mexican peso forwards at fixed rates in future periods. In addition, changes in the exchange rate between the Canadian dollar and other currencies (including the U.S. dollar)dollar and Mexican peso) make the goods transported by the Company more or less competitive in the world marketplace and may in turn positively or negatively affect revenues.
Impact of Fuel Price on Earnings
Fluctuations in fuel prices affect the Company’s results because fuel expense constitutes a significant portion of the Company's operating costs. As fuel prices fluctuate, there will be a timing impact on earnings, as discussed further in Item 1. Business, Operations, Fuel Cost Adjustment Program and Item 1A. Risk Factors, Fuel Cost Volatility.“The Company is affected by fluctuating fuel prices”.
The impact of fuel price on earnings includes the impacts of provincial and federal carbon taxes, levies, and leviesobligations under cap-and-trade programs recovered and paid, on revenuesrevenue and expenses, respectively.
In 2022,2023, the favourable impact of fuel prices on Operating income was $226$21 million. Higher fuel prices and increased carbon tax recoveries resulted in an increase in Total revenues of $709 million from 2021. HigherLower fuel prices resulted in an increasea decrease in Total operating expenses of $483 million.$221 million from 2022. Lower fuel prices, partially offset by the favourable impact of timing of recoveries under the Company's fuel cost adjustment program, resulted in a decrease in Total revenues of $200 million from 2022.
Impact of Share Price on Earnings and Stock-Based Compensation
Fluctuations in the Common Share price affect the Company's operating expenses because share-based liabilities are measured at fair value. The Company's Common Shares are listed on the Toronto Stock Exchange ("TSX") and the New York Stock Exchange ("NYSE") with ticker symbol "CP".
In 2022,2023, the impact of the change in Common Share pricesprice resulted in stock-based compensation expense of $4 million, a decrease of $12 million, from $16 million an increase of $5 million, from $11 million in 2021.2022.
CPKC 2023 ANNUAL REPORT / 45
Based on information available at December 31, 20222023 and expectations for 20232024 share-based grants, excluding impacts of KCS, for every $1.00 change in shareCommon Share price, stock-based compensation expense has a corresponding change of approximately $1.6 million to $2.3 million (2022 – approximately $1.2 million to $1.8 million (2021 – approximately $1.5 million to $2.0 million). This excludes the impact of changes in shareCommon Share price relative to the S&P/TSX 60 Index, S&P 500 Industrials Index, and to Class I railways, which may trigger different performance share unit payouts. Stock-based compensation may also be impacted by non-market performance conditions.
Additional information concerning stock-based compensation is included in Item 8. Financial Statements and Supplementary Data, Note 2224 Stock-based compensation.
Liquidity and Capital Resources
The Company's primary sources of liquidity include its Cash and cash equivalents, commercial paper program, bilateral letter of credit facilities, and revolving credit facility. The Company believes that these sources as well as cash flow generated through operations and existing debt capacity are adequate to meet its short-term and long-term cash requirements. The Company is not aware of any material trends, events, or uncertainties that would create any deficiencies in the Company's liquidity.
As at December 31, 2022,2023, the Company had $451$464 million of Cash and cash equivalents compared to $69$451 million at December 31, 2021.2022.
As at December 31, 2022, the Company's revolving credit facility was undrawn, unchanged from December 31, 2021, from a total available amount of U.S. $1.3 billion. Effective April 9, 2021, the Company amended its revolving credit facility to modify certain provisions relating to the calculation of the financial covenant ratio in its revolving credit facility. Effective September 24, 2021, the Company entered into an amendment to extend the two-year tranche and the five-year tranche of its revolving credit facility to September 27,May 11, 2023, and September 27, 2026, respectively. Effective September 29, 2021, the Company entered into a furthersecond amended and restated credit agreement to extend the maturity dates and increase the total amount available under the revolving credit facility. The amendment increased the amount available of the five-year tranche from U.S. $1.0 billion to itsU.S.$1.1 billion and extended the maturity date from September 27, 2026 to May 11, 2028. The amendment also increased the amount available of the two-year tranche from U.S. $300 million to U.S. $1.1 billion and extended the maturity date from September 27, 2023 to May 11, 2025. The Company also terminated the legacy KCS credit facility effective May 11, 2023. As at December 31, 2023 the Company's existing revolving credit facility in order to provide financial covenant flexibility for acquisition financing pertaining to the KCS acquisition, which is in place for a two-year period until December 14, 2023. In 2021,was undrawn. The revolving credit facility agreement requires the Company also entered intoto maintain a U.S. $500 million unsecured non-revolving termfinancial covenant. As at December 31, 2023, the Company was in compliance with all terms and conditions of the credit facility with a maturity date of March 15, 2022. arrangements and satisfied the financial covenant.
Effective March 14, 2022, the Company extended the maturity date of the U.S. $500 million term facility to September 15, 2022. During the year ended December 31, 2022,, the Company repaid in full the outstanding borrowings of $636U.S. $500 million (U.S. $500($636 million) on this unsecured non-revolvingthe term credit facility. The facility was automatically terminated on September 15, 2022 following the final principal repayment.repayment.
The Company has a commercial paper program that enables it to issue commercial paper up to a maximum aggregate principal amount of U.S. $1.0 billion in the form of unsecured promissory notes. ThisOn July 12, 2023, the Company increased the maximum aggregate principal amount of commercial paper available to be issued from U.S. $1.0 billion to U.S $1.5 billion. The Company also terminated the legacy KCS commercial paper program effective May 19, 2023. The Company's existing commercial paper program is backed by the revolving credit facility. As at December 31, 2022,2023, the Company did not have any borrowings on itshad total commercial paper programborrowings outstanding of U.S. $800 million (December 31, 20212022 – U.S. $265 million)$nil).
As at December 31, 2022,2023, under its bilateral letter of credit facilities, the Company had letters of credit drawn of $75$93 million from a total available amount of $300 million (December 31, 20212022 - $58$75 million). Under the bilateral letter of credit facilities, the Company has the option to post collateral in the form of Cash or cash equivalents, equal at least to the face value of the letter of credit issued. These agreements permit the Company to withdraw amounts posted as collateral at any time; therefore, the amounts posted as collateral are presented as "Cash and cash equivalents" on the Company's Consolidated Balance Sheets.As at December 31, 2022,2023, the Company did not have any collateral posted on its bilateral letter of credit facilities (December 31, 20212022 – Nil)$nil).
Contractual Commitments
The Company’s material cash requirements from known contractual obligations and commitments to make future payments primarily consist of long-term debt and related interest, supplier purchases, capital commitments, leases, and other long term liabilities. Outstanding obligations related to debt and leases can be found in Item 8. Financial Statements and Supplementary Data, Note 1517 Debt and Note 1820 Leases. Interest obligations related to debt and finance leases amount to $649$773 million within the next 12 months, with the remaining amount committed thereafter of $13,710$16,513 million.
Supplier purchase agreements and other long-term liabilities amount to $1,036$235 million and $57$71 million within the next 12 months, respectively, with the remaining amount committed thereafter of $364$309 million and $443$618 million, respectively. Other long-term liabilities includesinclude expected cash payments for environmental remediation, post-retirement benefits, worker’s compensation benefits, long-term disability benefits, pension benefit payments for the Company’s non-registered supplemental pension plan, and certain other long-term liabilities. Pension payments are discussed further in Critical Accounting Estimates of this Item 7. Management’s Discussion and Analysis of Financial Condition and Results of Operations. Capital commitments are discussed further in in Item 8. Financial Statements and Supplementary Data, Note 26 Commitments and Contingencies.
46 / CPKC 2023 ANNUAL REPORT
Concession Duty
Under CPKCM's 50-year Concession, which will expire in 2047 unless extended, CPKCM pays annual concession duty expense of 1.25% of its gross revenues. Capital commitments under the CPKCM concession can be found in Item 8. Financial Statements and Supplementary Data, Note 26 Commitments and contingencies.
Guarantees
Refer to Item 8. Financial Statements and Supplementary Data, Note 2527 Guarantees for details.
Operating Activities
Cash provided by operating activities was $4,137 million in 2023, a decrease of $5 million compared to $4,142 million in 2022, an increase of $454 million, or 12%, compared to $3,688 million in 2021. This increase2022. The decrease was primarily due to an unfavourable change in working capital driven by an increase in freight and non-freight accounts receivable along with higher tax installments paid in 2023, and the settlement of Mexican tax audits in the third and fourth quarters of 2023 compared to the same period of 2022.
This decrease was partially offset by higher cash generating income, in 2022 including dividends received from KCSthe impact of $1,157 million, partially offset by the $845 million merger termination fee received in 2021.acquisition of KCS.
Investing Activities
Cash used in investing activities was $2,162 million in 2023, an increase of $666 million, or 45%, from $1,496 million in 2022, a decrease of $12,234 million, or 89%, from $13,730 million in 2021.2022. This decreaseincrease was primarily due to cash payments madehigher additions to KCS and their stockholders forproperties, including the impact of the acquisition of KCS in 2021.KCS. This increase was partially offset by cash acquired on control of KCS.
Capital Programs
| | | | | | | | | |
For the year ended December 31
(in millions of Canadian dollars, except for track miles and crossties) | 2022 | 2021 | |
| Additions to capital | | | |
| Track and roadway | $ | 1,048 | | $ | 970 | | |
| Rolling stock | 243 | | 297 | | |
| Buildings | 75 | | 105 | | |
Other(1) | 199 | | 179 | | |
| Total – accrued additions to capital | 1,565 | | 1,551 | | |
| Less: | | | |
| Non-cash transactions | 8 | | 19 | | |
| Cash invested in additions to properties (per Consolidated Statements of Cash Flows) | $ | 1,557 | | $ | 1,532 | | |
| Track installation capital programs | | | |
| Track miles of rail laid (miles) | 271 | | 284 | | |
| Track miles of rail capacity expansion (miles) | 17 | | 9 | | |
| Crossties installed (thousands) | 1,215 | | 1,222 | | |
(1) Comparative figures have been reclassified to conform with current period presentation. | | | | | | | | | |
For the year ended December 31
(in millions of Canadian dollars, except for track miles and crossties) | 2023 | 2022 | |
| Additions to capital | | | |
| Track and roadway | $ | 1,623 | | $ | 1,048 | | |
| Rolling stock | 273 | | 243 | | |
| Buildings | 112 | | 75 | | |
| Other | 483 | | 199 | | |
| Total – accrued additions to capital | 2,491 | | 1,565 | | |
| Less: | | | |
| Non-cash transactions | 23 | | 8 | | |
| Cash invested in additions to properties (per Consolidated Statements of Cash Flows) | $ | 2,468 | | $ | 1,557 | | |
| Track installation capital programs | | | |
| Track miles of rail laid (miles) | 323 | | 271 | | |
| Track miles of rail capacity expansion (miles) | 24 | | 17 | | |
| Crossties installed (thousands) | 1,617 | | 1,215 | | |
Track and roadway expenditures include the replacement and enhancement of the Company’s track infrastructure. Of the $1,048$1,623 million additions in 2022 (20212023 (2022 – $970$1,048 million), approximately $967$1,373 million (2021(2022 – $917$967 million) was invested in the renewal of depleted assets, namely rail, ties, ballast, signals, and bridges. Approximately $81$250 million (2021(2022 – $53$81 million) was invested in network improvements and growth initiatives.
Rolling stock investments encompass locomotives and railcars. In 2022,2023, expenditures on locomotives were approximately $84$186 million (2021(2022 – $121$84 million) and were focused on the continued re-investment in the Company's existing locomotive fleet. Railcar investment of approximately $87 million (2022 – $159 million (2021 – $176 million) in 2023 was largely focused on the renewal of depleted assets, including the acquisition of covered hoppers for grain transportation.new freight cars.
In 2023, investments in buildings were approximately $112 million (2022 - $75 million) and included the new operations building in Kansas City, facility upgrades, renovations, and shop equipment. Other investments were $483 million (2022 – $199 million) and included investments in intermodal equipment, information systems, work equipment and vehicles.
43 CP 2022CPKC 2023 ANNUAL REPORT/ 47
In 2022, investmentsCash invested in buildings were approximately $75additions to properties by KCS was $221 million (2021 - $105 million)for the period from January 1 to April 13, 2023 (U.S. $164 million at average exchange rate of $1.00 USD = $1.35 CAD). Expenditures mainly relate to renewal and included items such as facility upgrades, renovations,replacement of track infrastructure and shop equipment. Other items were $199 million (2021 – $179 million) and included investmentsre-investment in work equipment, information system software, vehicles, containers, and other growth initiatives.existing locomotive fleet.
For 2023,2024, the Company expects to invest approximately $1.6$2.75 billion in its standalone capital programs, excluding any capital spend that the Company may require following acquisition of control of KCS.programs. Capital programs will be financed with cash generated from operations. Approximately 60% to 70% of the planned capital programs is for track and roadway. Approximately 15%10% to 20%15% is expected to be allocated to rolling stock, including railcars and locomotive improvements. Approximately 5% to 10% is expected to be allocated to information services, and 5% is expected to be allocated to buildings. Other investments isare expected to be 5% toapproximately 10%. Additional discussion of capital commitments can be found in Item 8. Financial Statements and Supplementary Data, Note 2426 Commitments and Contingencies.
Financing Activities
The Company continues to focus on debt repayments in order to return to its long term leverage ratio following the acquisition of KCS. Cash used in financing activities was $1,955 million in 2023, a decrease of $342 million, or 15%, from cash used in financing activities of $2,297 million in 2022, a change of $12,233 million, or 123%, from cash provided by financing activities of $9,936 million in 2021. This change2022. The decrease was primarily due to:
•issuanceto an increase of U.S $6.7 billion$1,095 million in net issuances of commercial paper compared to $415 million of repayments in 2022, and $2.2 billion notes (total proceeds of $10,673 million) along with a U.S. $500 million ($633 million) term loan to fund the cash consideration component of the KCS acquisition in 2021;
•principal repayments of $636 million (U.S. $500 million) on a term loan in 2022;2022.
•This decrease was partially offset primarily by principal repayments of $1,000 million 1.589% 2-year Notes, $479 million (U.S. $350 million) of 4.45% 12.5-year Notes, $272 million (U.S. $199 million) of 3.85% 10-year Senior Notes, and $592 million (U.S. $439 million) of 3.00% 10-year Senior Notes, compared to principal repayments of $125 million of the Company's 5.100%5.10% 10-year Medium Term Notes, $313 million (U.S. $250 million) of the Company's 4.500%4.50% 10-year Notes, at maturity in January 2022, and principal repayment of $97 million (U.S. $76 million) of the Company's 6.99% Finance lease at maturity in March 2022, compared to principal repayment of $312 million (U.S $250 million) of the Company's 9.450% notes in 2021; and
•increased dividend payments of $200 million in 2022 due to a higher number of shares outstanding resulting from shares issued to fund the share consideration component of the KCS acquisition at the end of 2021.2022.
Credit Measures
Credit ratings provide information relating to the Company’s operations and liquidity, and affect the Company’s ability to obtain short-term and long-term financing and/or the cost of such financing. The applicable margin that applies to outstanding loans under the Company’s revolving credit facility is based on the credit rating assigned to CP’sthe Company’s senior unsecured and unsubordinated debt.
If CP’sthe Company’s credit ratings were to decline to below investment-grade levels, the Company could experience a significant increase in its interest cost for new debt along with a negative effect on its ability to readily issue new debt.
Credit ratings and outlooks are based on the rating agencies’ methodologies and can change from time to time to reflect their views of the Company. Their views are affected by numerous factors including, but not limited to, the Company’s financial position and liquidity along with external factors beyond the Company’s control.
As at December 31, 2022,2023, the Company's credit ratings from Standard & Poor's Rating Services ("Standard & Poor's") and Moody's Investor Service ("Moody's") remain unchanged from December 31, 2021.2022. The following table shows the ratings issued for CPthe Company by the rating agencies noted herein as of December 31, 20222023 and is being presented as it relates to the Company’s cost of funds and liquidity.
Credit ratings as at December 31, 20222023(1)
| | | | | | | | | | | |
| Long-term debt | | Outlook |
| Standard & Poor's | BBB+ | stable |
| Moody's | Baa2 | stable |
| | | |
| Commercial paper program | | |
| Standard & Poor's | A-2 | N/A |
| Moody's | | P-2 | N/A |
(1) Credit ratings are not recommendations to purchase, hold, or sell securities and do not address the market price or suitability of a specific security for a particular investor. Credit ratings are based on the rating agencies' methodologies and may be subject to revision or withdrawal at any time by the rating agencies.
Financial Ratios
The Long-term debt to Net income ratio was 5.6 in 2022, compared with 7.1 in 2021. This decrease was due to higher net income for the year ended December 31, 2022 and lower long-term debt.
The Pro-forma Adjusted Net Debt to Pro-forma Adjusted earnings before interest, tax, depreciation, and amortization ("EBITDA") ratio was 3.8 in 2022, compared with 4.0 in 2021. This decrease was primarily due to higher pro-forma adjusted EBITDA for the year ended December 31, 2022. Beginning in the first quarter of 2022, the Company added disclosure of Pro-forma Adjusted Net Debt to Pro-forma Adjusted EBITDA Ratio to better align with the Company’s debt covenant calculation, which takes into account the trailing twelve month adjusted EBITDA of KCS as well as KCS’s outstanding debt. Please see Non-GAAP Measures of this Item 7. Management's Discussion and Analysis of Financial Condition and Results of Operations for further discussion. Over the long term, the Company targets a Pro-forma Adjusted Net debt to Pro-forma Adjusted EBITDA ratio of 2.0 to 2.5.
Although the Company has provided a target Non-GAAP measure (Pro-forma Adjusted Net Debt to Pro-forma Adjusted EBITDA ratio), management is unable to reconcile, without unreasonable efforts, the target Pro-forma Adjusted Net debt to Pro-forma Adjusted EBITDA ratio to the most comparable GAAP measure (Long-term debt to Net income ratio), due to unknown variables and uncertainty related to future results. These unknown variables may include unpredictable transactions of significant value. In recent years, the Company has recognized acquisition-related costs, the merger termination payment received, KCS's gain on unwinding of interest rate hedges (net of CP's associated purchase accounting basis differences and tax), the FX impact of translating the Company’s debt and lease liabilities (including borrowings under the credit facility), discrete tax items, changes in the outside basis tax difference between the carrying amount of the Company's equity investment in KCS and its tax basis of the investment, changes in income tax rates, and changes to an uncertain tax item. Acquisition-related costs include legal, consulting, financing fees, integration planning costs consisting of third-party services and system migration, fair value gain or loss on FX forward contracts and interest rate hedges, FX gain on U.S. dollar-denominated cash on hand from the issuances of long-term debt to fund the KCS acquisition, and transaction and integration costs incurred by KCS which were recognized within Equity earnings of Kansas City Southern in the Company's Consolidated Statements of Income. KCS has also recognized significant transaction costs and FX gains and losses. These or other similar, large unforeseen transactions affect Net income but may be excluded from the Company’s Pro-forma Adjusted EBITDA. Additionally, the U.S.-to-Canada dollar exchange rate is unpredictable and can have a significant impact on the Company’s reported results, but may, along with interest, taxes, and FX impact of translating the Company’s debt and lease liabilities, be excluded from Pro-forma Adjusted EBITDA. Please see Forward-Looking Statements in this Item 7. Management’s Discussion and Analysis of Financial Condition and Results of Operations for further discussion.
Supplemental Guarantor Financial Information
Canadian Pacific Railway Company (“CPRC”), a 100%-owned subsidiary of Canadian Pacific Railway Limited (“CPRL”),CPKC, is the issuer of certain securities, which are fully and unconditionally guaranteed by CPRLCPKC on an unsecured basis. The other subsidiaries of CPRC do not guarantee the securities and are referred to below as the “Non-Guarantor Subsidiaries”. The following is a description of the terms and conditions of the guarantees with respect to securities for which CPRC is the
48 / CPKC 2023 ANNUAL REPORT
issuer and CPRLCPKC provides a full and unconditional guarantee.
As of the date of the filing of the Form 10-K, CPRC had U.S. $12,050$14,714 million principal amount of debt securities outstanding due through 2115 which includes the debt exchanged for KCS debt as described below, and U.S. $30 million and GBP £3 million in perpetual 4% consolidated debenture stock, for all of which CPRLCPKC is the guarantor subject to Section 13(a) or 15(d) of the Securities Exchange Act of 1934 (the "Exchange Act"), as amended. As of the same date, CPRC also had $3,300$2,300 million principal amount of debt securities issued under Canadian Securities Law due through 2050 for which CPRLCPKC is the guarantor and not subject to the Exchange Act.
CPRLCPKC fully and unconditionally guarantees the payment of the principal (and premium, if any) and interest on the debt securities and consolidated debenture stock issued by CPRC, any sinking fund or analogous payments payable with respect to such securities, and any additional amounts payable when they become due, whether at maturity or otherwise. The guarantee is CPRL’sCPKC’s unsubordinated and unsecured obligation and ranks equally with all of CPRL’sCPKC’s other unsecured, unsubordinated obligations.
CPRLCPKC will be released and relieved of its obligations under the guarantees after obligations to the holders are satisfied in accordance with the terms of the respective instruments.
On March 20, 2023, CPKC and CPRC announced offers to exchange any and all validly tendered (and not validly withdrawn) and accepted notes of seven series, previously issued by KCS (the “Old Notes") for notes to be issued by CPRC (the "CPRC Notes"). As of April 19, 2023, U.S. $3,014 million of Old Notes of such seven series were tendered and accepted in exchange for U.S. $3,014 million of CPRC Notes in seven corresponding series.
Each series of CPRC Notes has the same interest rates, interest payment dates, maturity dates, and substantively the same optional redemption provisions as the corresponding series of Old Notes.
In exchange for each U.S. $1,000 principal amount of Old Notes that was validly tendered prior to March 31, 2023 (the "Early Participation Date"), holders of Old Notes received consideration consisting of U.S. $1,000 principal amount of CPRC Notes and a cash amount of U.S. $1.00. The total consideration included an early participation premium, consisting of U.S. $30 principal amount of CPRC Notes per U.S. $1,000 principal amount of Old Notes. In exchange for each U.S. $1,000 principal amount of Old Notes that was validly tendered after the Early Participation Date but prior to the expiration of the exchange offers on April 17, 2023 (the "Expiration Date") and not validly withdrawn, holders of Old Notes received consideration consisting of U.S. $970 principal amount of CPRC Notes and a cash amount of U.S. $1.00.
CPKC has fully and unconditionally guaranteed the payment of the principal (and premium, if any) and interest, on the CPRC Notes, and any additional amounts payable with respect to the CPRC Notes, when they become due and payable, whether at the stated maturity thereof or by declaration of acceleration, call for redemption, or otherwise. The CPRC Notes and the related guarantees are part of CPRC’s and CPKC’s respective unsecured obligations and rank equally with all of CPRC’s and CPKC’s existing and future unsecured and unsubordinated indebtedness.
Additional information is included in Item 8. Financial Statements and Supplementary Data, Note 17 Debt.
Pursuant to Rule 13-01 of the SEC's Regulation S-X, the Company provides summarized financial and non-financial information of CPRC in lieu of providing separate financial statements of CPRC.
More information on the securities under this guarantee structure can be found in Exhibit 22.1 List of Issuers and Guarantor Subsidiaries of this annual report.
Summarized Financial Information
The following tables present summarized financial information for CPRC (Subsidiary Issuer) and CPRL (Parent Guarantor)CPKC (Parent) on a combined basis after elimination of (i) intercompany transactions and balances among CPRC and CPRL;CPKC; (ii) equity in earnings from and investments in the Non-Guarantor Subsidiaries; and (iii) intercompany dividend income.
Statements of Income
| | | | | | | | |
| CPRC (Subsidiary Issuer) and CPRL (Parent Guarantor) |
| (in millions of Canadian dollars) | For the year ended December 31, 2022 | For the year ended December 31, 2021 |
| Total revenues | $ | 6,384 | | $ | 5,924 | |
| Total operating expenses | 4,110 | | 3,712 | |
Operating income (1) | 2,274 | | 2,212 | |
Less: Other (2) | 234 | | (522) | |
| Income before income tax expense | 2,040 | | 2,734 | |
| Net income | $ | 1,533 | | $ | 2,548 | |
(1) Includes net lease costs incurred from non-guarantor subsidiaries for the year ended December 31, 2022, and 2021 of $410 million and $431 million, respectively.
(2) Includes Other expense (income), Merger termination fee, Other components of net periodic benefit recovery, and Net interest expense.
Balance Sheets
| | | | | | | | |
| CPRC (Subsidiary Issuer) and CPRL (Parent Guarantor) |
| (in millions of Canadian dollars) | As at December 31, 2022 | As at December 31, 2021 |
| Assets | | |
| Current assets | $ | 1,395 | | $ | 963 | |
| Properties | 11,791 | | 11,342 | |
| Other non-current assets | 3,337 | | 2,536 | |
| | |
| Liabilities | | |
| Current liabilities | $ | 2,759 | | $ | 2,789 | |
| Long-term debt | 18,137 | | 18,574 | |
| Other non-current liabilities | 3,178 | | 3,008 | |
Excluded from the Income Statements and Balance Sheets above are the following significant intercompany transactions and balances that CPRC and CPRL have with the Non-Guarantor Subsidiaries:
Cash Transactions with Non-Guarantor Subsidiaries
| | | | | | | | |
| CPRC (Subsidiary Issuer) and CPRL (Parent Guarantor) |
| (in millions of Canadian dollars) | For the year ended December 31, 2022 | For the year ended December 31, 2021 |
| Dividend income from non-guarantor subsidiaries | $ | 133 | | $ | 297 | |
| Capital contributions to non-guarantor subsidiaries | — | | (134) | |
| Return of capital from non-guarantor subsidiaries | 115 | | 1,370 | |
CP 2022CPKC 2023 ANNUAL REPORT 46/ 49
Statements of Income
| | | | | | | | |
| CPRC (Subsidiary Issuer) and CPKC (Parent) |
| (in millions of Canadian dollars) | For the year ended December 31, 2023 | For the year ended December 31, 2022 |
| Total revenues | $ | 6,577 | | $ | 6,384 | |
| Total operating expenses | 4,074 | | 4,110 | |
Operating income (1) | 2,503 | | 2,274 | |
Less: Other (2) | 468 | | 234 | |
| Income before income tax expense | 2,035 | | 2,040 | |
| Net income | $ | 1,480 | | $ | 1,533 | |
(1) Includes net lease costs incurred from non-guarantor subsidiaries for the year ended December 31, 2023, and 2022 of $463 million and $410 million, respectively.
(2) Includes Other expense (income), Other components of net periodic benefit recovery, and Net interest expense.
Balance Sheets
| | | | | | | | |
| CPRC (Subsidiary Issuer) and CPKC (Parent) |
| (in millions of Canadian dollars) | As at December 31, 2023 | As at December 31, 2022 |
| Assets | | |
| Current assets | $ | 1,240 | | $ | 1,395 | |
| Properties | 12,327 | | 11,791 | |
| Other non-current assets | 3,562 | | 3,337 | |
| | |
| Liabilities | | |
| Current liabilities | $ | 4,359 | | $ | 2,759 | |
| Long-term debt | 19,169 | | 18,137 | |
| Other non-current liabilities | 3,412 | | 3,178 | |
Excluded from the Income Statements and Balance Sheets above are the following significant intercompany transactions and balances that CPRC and CPKC have with the Non-Guarantor Subsidiaries:
Transactions with Non-Guarantor Subsidiaries
| | | | | | | | |
| CPRC (Subsidiary Issuer) and CPKC (Parent) |
| (in millions of Canadian dollars) | For the year ended December 31, 2023 | For the year ended December 31, 2022 |
| Dividend income from non-guarantor subsidiaries | $ | 309 | | $ | 133 | |
| Capital contributions to non-guarantor subsidiaries | (4,324) | | — | |
| Redemption of capital from non-guarantor subsidiaries | — | | 115 | |
50 / CPKC 2023 ANNUAL REPORT
Balances with Non-Guarantor Subsidiaries
| | CPRC (Subsidiary Issuer) and CPRL (Parent Guarantor) |
| CPRC (Subsidiary Issuer) and CPKC (Parent) | | | CPRC (Subsidiary Issuer) and CPKC (Parent) |
| (in millions of Canadian dollars) | (in millions of Canadian dollars) | As at December 31, 2022 | As at December 31, 2021 | (in millions of Canadian dollars) | As at December 31, 2023 | As at December 31, 2022 |
| Assets | Assets | |
| Accounts Receivable, intercompany | $ | 186 | | $ | 344 | |
| Accounts receivable, intercompany | |
| Accounts receivable, intercompany | |
| Accounts receivable, intercompany | |
| Short-term advances to affiliates | Short-term advances to affiliates | 2,209 | | 2,859 | |
| Long-term advances to affiliates | Long-term advances to affiliates | 7,502 | | 7,616 | |
| | Liabilities | Liabilities | |
| Liabilities | |
| Liabilities | |
| Accounts payable, intercompany | |
| Accounts payable, intercompany | |
| Accounts payable, intercompany | Accounts payable, intercompany | $ | 199 | | $ | 212 | |
| Short-term advances from affiliates | Short-term advances from affiliates | 2,649 | | 2,777 | |
| Long-term advances from affiliates | Long-term advances from affiliates | 88 | | 82 | |
Share Capital
At February 23, 2023,26, 2024, the latest practicable date prior to the date of this Annual Report on Form 10-K, there were 930,767,959932,428,454 Common Shares and no preferred shares issued and outstanding, which consisted of 14,83715,190 holders of record of the Common Shares. In addition, the Company has a Management Stock Option Incentive Plan (“MSOIP”), under which key officers and employees are granted options to purchase the Common Shares. Options issued prior to the share split further described in Item 1. Business, Business Developments now each provide rights over five shares. For consistency, allShares . All number of options presented herein are shown on the basis of the number of shares subject to the options.On April 27, 2022, at the Annual and Special Meeting, the Company's shareholders approved an amendment to the MSOIP to increase the maximum number of shares available for issuance under the MSOIP, effective at and after April 27, 2022, by 20,000,000 Common Shares. At February 23, 2023, 7,708,86626, 2024, 6,992,378 options were outstanding under the MSOIP and stand-alone option agreements entered into with Mr. Keith Creel. There are 21,883,56120,940,714 options available to be issued by the Company’s MSOIP in the future. The Company also has a Director's Stock Option Plan (“DSOP”), under which directors are granted options to purchase Common Shares. There are no outstanding options under the DSOP, which has 1,700,000 options available to be issued in the future.
Non-GAAP Measures
The Company presents Non-GAAP measures, including Core adjusted combined operating ratio and Core adjusted combined diluted earnings per share, to provide aan additional basis for evaluating underlying earnings and liquidity trends in the Company’s businessCompany's current periods' financial results that can be compared with the results of operations in prior periods. In addition,Management believes these Non-GAAP measures facilitate a multi-period assessment of long-term profitability, allowing management and other external users of the Company’s consolidated financial information to compare profitability on a long-term basis, including assessing future profitability, with that of the Company’s peers.profitability.
These Non-GAAP measures have no standardized meaning and are not defined by GAAPaccounting principles generally accepted in the United States of America ("GAAP") and, therefore, may not be comparable to similar measures presented by other companies. The presentation of these Non-GAAP measures is not intended to be considered in isolation from, as a substitute for, or as superior to the financial information presented in accordance with GAAP.
Non-GAAP Performance Measures
The Company usesOn April 14, 2023, CP obtained control of KCS and CPKC began consolidating KCS, which had been accounted for under the equity method of accounting between December 14, 2021 and April 13, 2023. On the Control Date, CPKC’s previously-held interest in KCS was remeasured to its Control Date fair value. CPKC presents Core adjusted earnings results including Adjusted income, Adjustedcombined operating ratio and Core adjusted combined diluted earnings per share Adjusted operating income,to give effect to results after isolating and Adjusted operating ratioremoving the impact of the acquisition of KCS on those results. These measures provide a comparison to prior period financial information, as adjusted to exclude certain significant items, and are used to evaluate the Company’sCPKC’s operating performance and for planning and forecasting future business operations and future profitability. Core adjusted income and Core adjusted diluted earnings per share are presented to provide financial statement users with additional transparency by isolating for
Management believes the impactuse of KCS purchase accounting. KCS purchase accounting represents the amortization of basis differences, being the difference in value between the consideration paid to acquire KCS and the underlying carrying value of the net assets of KCS immediately prior to its acquisition by the Company, net of tax, as recognized within Equity (earnings) loss of Kansas City Southern in the Company's Consolidated Statements of Income. All assets subject to KCS purchase accounting contribute to income generation and will continue to amortize over their estimated useful lives. These Non-GAAP measures are discussed further in other sections of this Item 7. Management’s Discussion and Analysis of Financial Condition and Results of Operations. These Non-GAAP measures provideprovides meaningful supplemental information regardingabout our operating results because they exclude certain significant items that are not considered indicative of future financial trends either by nature or amount or provide improved comparability to past performance. As a result, these items are excluded for management's assessment of operational performance, allocation of resources, and preparation of annual budgets. These significant items may include, but are not limited to, restructuring and asset impairment charges, individually significant gains and losses from sales of assets, acquisition-related costs, the merger termination payment received, KCS's gain on unwinding of interest rate hedges (net of CP'sCPKC's associated purchase accounting basis differences and tax), as recognized within Equity"Equity (earnings) loss of Kansas City SouthernSouthern" in the Company's Consolidated Statements of Income, the FX impactloss on derecognition of translating the Company’s debt and lease liabilities (including borrowings under the credit facility),CPKC’s previously held equity method investment in KCS, discrete tax
items, changes in the outside basis tax difference between the carrying amount of CP'sCPKC's equity investment in KCS and its tax basis of this investment, a deferred tax recovery related to the elimination of the deferred tax liability on the outside basis difference of the investment, settlement of Mexican taxes relating to prior years, changes in income tax rates, changes to an uncertain tax item, and certain items outside the control of management. Acquisition-relatedAcquisition-
CPKC 2023 ANNUAL REPORT / 51
related costs include legal, consulting, financing fees, integration planning costs consisting ofincluding third-party services and system migration, debt exchange transaction costs, community investments, fair value gain or loss on FX forward contracts and interest rate hedges, FX gain on U.S. dollar-denominated cash on hand from the issuances of long-term debt to fund the KCS acquisition, restructuring, employee retention and synergy incentive costs, and transaction and integration costs incurred by KCS, net of tax, which were recognized within Equity (earnings) loss of Kansas City Southern in the Company's Consolidated Statements of Income.KCS. These items may not be non-recurring. However,non-recurring, and may include items that are settled in cash. Specifically, due to the magnitude of the acquisition, its significant impact to the Company’s business and complexity of integrating the acquired business and operations, the Company expects to incur acquisition-related costs beyond the year of acquisition. Management believes excluding these significant items from GAAP results allows forprovides an additional viewpoint which may give users a consistent understanding of the Company's consolidatedCPKC's financial performance when performing a multi-period assessment including assessing the likelihood of future results. Accordingly, these Non-GAAP financial measures may provide additional insight to investors and other external users of CPKC's financial information.
In addition, Core adjusted combined operating ratio and Core adjusted combined diluted earnings per share exclude KCS purchase accounting. KCS purchase accounting represents the amortization of basis differences being the incremental depreciation and amortization in relation to fair value adjustments to properties and intangible assets, incremental amortization in relation to fair value adjustments to KCS’s investments, amortization of the change in fair value of debt of KCS assumed on the Control Date, and depreciation and amortization of fair value adjustments that are attributable to non-controlling interest, as recognized within "Depreciation and amortization", "Other expense", "Net interest expense", and "Net loss attributable to non-controlling interest", respectively, in the Company's Consolidated Statements of Income. During the periods that KCS was equity accounted for, from December 14, 2021 to April 13, 2023, KCS purchase accounting represents the amortization of basis differences, being the difference in value between the consideration paid to acquire KCS and the underlying carrying value of the net assets of KCS immediately prior to its acquisition by the Company, net of tax, as recognized within "Equity (earnings) loss of Kansas City Southern" in the Company's Consolidated Statements of Income. All assets subject to KCS purchase accounting contribute to income generation and will continue to amortize over their estimated useful lives. Excluding KCS purchase accounting from GAAP results provides financial statement users with additional transparency by isolating the impact of KCS purchase accounting.
Reconciliation of GAAP Performance Measures to Non-GAAP Performance Measures
The following tables reconcile the most directly comparable measures presented in accordance with GAAP to the Non-GAAP measures:
Core Adjusted Combined Diluted Earnings per Share
Core adjusted combined diluted earnings per share is calculated using Net income attributable to controlling shareholders reported on a GAAP basis adjusted for significant items less KCS purchase accounting, divided by the weighted-average diluted number of Common Shares outstanding during the period as determined in accordance with GAAP. Between December 14, 2021 and April 13, 2023, KCS was accounted for in CPKC's diluted earnings per share reported on a GAAP basis using the equity method of accounting and on a consolidated financial information.basis beginning April 14, 2023. As the equity method of accounting and consolidation both provide the same diluted earnings per share for CPKC, no adjustment is required to pre-control diluted earnings per share to be comparable on a consolidated basis.
In 2023, there were five significant items included in the Net income attributable to controlling shareholders as reported on a GAAP basis as follows:
•during the course of the year, a total current tax expense of $16 million related to a tax settlement with the SAT of $13 million and a reserve for the estimated impact of potential future audit settlements of $3 million, that unfavourably impacted Diluted EPS by 2 cents as follows:
–in the fourth quarter, a current tax expense of $1 million related to a tax settlement with the SAT that had minimal impact on Diluted EPS; and
–in the third quarter, a total current tax expense of $15 million related to a tax settlement with the SAT of $9 million and reserves for the estimated impact of potential future audit settlements of $6 million of which $3 million was settled in the fourth quarter, that unfavourably impacted Diluted EPS by 2 cents;
•in the second quarter, a remeasurement loss of KCS of $7,175 million recognized in "Remeasurement loss of Kansas City Southern" due to the derecognition of CPKC’s previously held equity method investment in KCS and remeasurement at its Control Date fair value that unfavourably impacted Diluted EPS by $7.68;
•during the course of the year, a deferred tax recovery of $72 million on account of changes in tax rates and apportionment that favourably impacted Diluted EPS by 7 cents as follows:
–in the fourth quarter, a deferred tax recovery of $7 million due to CPKC unitary state apportionment changes that favourably impacted Diluted EPS by 1 cent;
–in the third quarter, a deferred tax recovery of $14 million due to decreases in the Iowa and Arkansas state tax rates that favourably impacted Diluted EPS by 2 cents; and
–in the second quarter, a deferred tax recovery of $51 million due to CPKC unitary state apportionment changes that favourably impacted Diluted EPS by 5 cents;
•during the course of the year, a deferred tax recovery of $7,855 million on changes in the outside basis difference on the equity investment in KCS that favourably impacted Diluted EPS by $8.42 as follows:
–in the second quarter, a deferred tax recovery of $7,832 million related to the elimination of the deferred tax liability on the outside basis difference of the investment in KCS that favourably impacted Diluted EPS by $8.39; and
52 / CPKC 2023 ANNUAL REPORT
–in the first quarter, a deferred tax recovery of $23 million on changes in the outside basis difference of the equity investment in KCS that favourably impacted Diluted EPS by 3 cents; and
•during the course of the year, acquisition-related costs of $201 million in connection with the KCS acquisition ($164 million after current tax recovery of $37 million), including an expense of $71 million recognized in "Compensation and benefits", $2 million recognized in "Materials", $111 million recognized in "Purchased services and other", $6 million recognized in "Other expense", and $11 million recognized in "Equity (earnings) loss of Kansas City Southern", that unfavourably impacted Diluted EPS by 17 cents as follows:
–in the fourth quarter, acquisition-related costs of $32 million ($24 million after current tax recovery of $8 million), including costs of $7 million recognized in "Compensation and benefits", $1 million recognized in "Materials", and $24 million recognized in "Purchased services and other", that unfavourably impacted Diluted EPS by 2 cents;
–in the third quarter, acquisition-related costs of $24 million ($18 million after current tax recovery of $6 million), including costs of $1 million recognized in "Compensation and benefits", $1 million recognized in "Materials", and $22 million recognized in "Purchased services and other", that unfavourably impacted Diluted EPS by 2 cents;
–in the second quarter, acquisition-related costs of $120 million ($101 million after current tax recovery of $19 million), including costs of $63 million recognized in "Compensation and benefits", $53 million recognized in "Purchased services and other", $3 million recognized in "Other expense", and $1 million recognized in "Equity (earnings) loss of Kansas City Southern", that unfavourably impacted Diluted EPS by 11 cents; and
–in the first quarter, acquisition-related costs of $25 million ($21 million after current tax recovery of $4 million), including costs of $12 million recognized in "Purchased services and other", $3 million recognized in "Other expense", and $10 million recognized in "Equity (earnings) loss of Kansas City Southern", that unfavourably impacted Diluted EPS by 2 cents.
In 2022, there were five significant items included in Net income attributable to controlling shareholders as reported on a GAAP basis as follows:
•in the fourth quarter, a gain of $212 million due to KCS's gain on unwinding of interest rate hedges (net of CP'sCPKC's associated purchase accounting basis differences and tax) recognized in Equity earnings"Equity (earnings) loss of KCSKansas City Southern" that favourably impacted Diluted EPS by 23 cents;
•in the fourth quarter, a deferred tax recovery of $24 million as a result of a reversal of an uncertain tax item related to a prior period that favourably impacted Diluted EPS by 3 cents;
•in the third quarter, a deferred tax recovery of $12 million due to a decrease in the Iowa state tax rate that favourably impacted Diluted EPS by 1 cent;
•during the course of the year, a net deferred tax recovery of $19 million on changes in the outside basis difference of the equity investment in KCS that favourably impacted Diluted EPS by 2 cents as follows:
–in the fourth quarter, a deferred tax recovery of $27 million on changes in the outside basis difference of the equity investment in KCSrecovery that favourably impacted Diluted EPS by 3 cents;
–in the third quarter, a deferred tax recovery of $9 million on changes in the outside basis difference of the equity investment in KCSrecovery that favourably impacted Diluted EPS by 1 cent;
–in the second quarter, a deferred tax expense of $49 million on changes in the outside basis difference of the equity investment in KCSexpense that unfavourably impacted Diluted EPS by 5 cents; and
–in the first quarter, a deferred tax recovery of $32 million on changes in the outside basis difference of the equity investment in KCSrecovery that favourably impacted Diluted EPS by 3 cents; and
•during the course of the year, acquisition-related costs of $123 million in connection with the KCS acquisition ($108 million after current tax recovery of $15 million), including costs of $74 million recognized in Purchased"Purchased services and other,other", and $49 million recognized in Equity earnings"Equity (earnings) loss of KCS,Kansas City Southern" that unfavourably impacted Diluted EPS by 12 cents as follows:
–in the fourth quarter, acquisition-related costs of $27 million ($16 million after current tax recovery of $11 million), including costs of $17 million recognized in Purchased"Purchased services and otherother" and $10 million recognized in Equity earnings"Equity (earnings) loss of KCS,Kansas City Southern" that unfavourably impacted Diluted EPS by 3 cents;
–in the third quarter, acquisition-related costs of $30 million ($33 million after current tax expense of $3 million), including costs of $18 million recognized in Purchased"Purchased services and otherother" and $12 million recognized in Equity earnings"Equity (earnings) loss of KCS,Kansas City Southern" that unfavourably impacted Diluted EPS by 3 cents;
–in the second quarter, acquisition-related costs of $33 million ($29 million after current tax recovery of $4 million), including costs of $19 million recognized in Purchased"Purchased services and otherother" and $14 million recognized in Equity earnings"Equity (earnings) loss of KCS,Kansas City Southern" that unfavourably impacted Diluted EPS by 3 cents; and
–in the first quarter, acquisition-related costs of $33 million ($30 million after current tax recovery of $3 million), including costs of $20 million recognized in Purchased"Purchased services and otherother" and $13 million recognized in Equity earnings"Equity (earnings) loss of KCS,Kansas City Southern" that unfavourably impacted Diluted EPS by 3 cents.
In 2021, there were four significant itemsKCS purchase accounting included in Net income attributable to controlling shareholders as reported on a GAAP basis was as follows:
•in the fourth quarter, a deferred tax recovery of $33 million on changes in the outside basis difference of the equity investment in KCS that favourably impacted Diluted EPS by 5 cents;
•in the second quarter, the merger termination payment received of $845 million ($748 million after current taxes) in connection with KCS's termination of the Original Merger Agreement effective May 21, 2021, that favourably impacted Diluted EPS by $1.11;2023:
•during the course of the year, acquisition-related costsKCS purchase accounting of $599$297 million in connection with the KCS acquisition ($500228 million after currentdeferred tax recovery of $107 million net of deferred tax expense of $8$69 million), including costs of $183$234 million recognized in Purchased services"Depreciation and other, $169amortization", $1 million recognized in Equity loss"Purchased services and other" related to the amortization of KCS, and $247equity investments, $17 million recognized in Other expense (income)"Net interest expense", $2 million recognized in "Other expense", $48 million recognized in "Equity (earnings) loss of KCS", and a recovery of $5 million recognized in "Net loss attributable to the non-controlling interest", that unfavourably impacted Diluted EPS by 7525 cents as follows:
–in the fourth quarter, acquisition-related costs of $157 million ($157 million after current tax recovery of $13 million net of deferred tax expense of $13 million), including costs of $36 million recognized in Purchased services and other, $169 million in Equity loss of KCS, and a $48 million recovery recognized in Other (income) expense, that unfavourably impacted Diluted EPS by 22 cents;
–in the third quarter, acquisition-related costs of $98 million ($80 million after current tax recovery of $61 million net of deferred tax expense of $43 million), including costs of $15 million recognized in Purchased services and other and $83 million recognized in Other expense (income), that unfavourably impacted Diluted EPS by 12 cents;
CP 2022CPKC 2023 ANNUAL REPORT 48/ 53
–in the secondfourth quarter, acquisition-related costsKCS purchase accounting of $308$87 million ($23662 million after current taxesdeferred tax recovery of $25 million and deferred taxes of $47 million), including costs of $99$85 million recognized in Purchased services"Depreciation and other and $209amortization", $1 million recognized in Other expense (income)"Purchased services and other" related to the amortization of equity investments, $6 million recognized in "Net interest expense", and a recovery of $5 million recognized in "Net loss attributable to the non-controlling interest", that unfavourably impacted Diluted EPS by 357 cents;
–in the third quarter, KCS purchase accounting of $87 million ($63 million after deferred tax recovery of $24 million), including costs of $81 million recognized in "Depreciation and amortization", $5 million recognized in "Net interest expense", and $1 million in recognized in "Other expense", that unfavourably impacted Diluted EPS by 7 cents;
–in the second quarter, KCS purchase accounting of $81 million ($61 million after deferred tax recovery of $20 million), including costs of $68 million recognized in "Depreciation and amortization", $6 million recognized in "Net interest expense", $1 million recognized in "Other expense", and $6 million recognized in "Equity (earnings) loss of KCS", that unfavourably impacted Diluted EPS by 6 cents; and
–in the first quarter, acquisition-related costsKCS purchase accounting of $36 million ($27 million after current taxes of $8 million and deferred taxes of $1 million), including costs of $33$42 million recognized in Purchased services and other and $3 million recognized in Other expense (income),"Equity (earnings) loss of KCS" that unfavourably impacted Diluted EPS by 4 cents; and5 cents.
2022:
•during the course of the year, a net non-cash gainKCS purchase accounting of $7$163 million ($6 million after deferred tax) due to FX translationexpense recognized in "Equity (earnings) loss of debt and lease liabilitiesKCS" that favourablyunfavourably impacted Diluted EPS by 1 cent17 cents as follows:
–in the fourth quarter, a $32KCS purchase accounting of $42 million loss ($28 million after deferred tax) that unfavourably impacted Diluted EPS by 4 cents;
–in the third quarter, a $46KCS purchase accounting of $42 million loss ($40 million after deferred tax) that unfavourably impacted Diluted EPS by 6 cents;
–in the second quarter, a $52 million gain ($45 million after deferred tax) that favourably impacted Diluted EPS by 7 cents; and
–in the first quarter, a $33 million gain ($29 million after deferred tax) that favourably impacted Diluted EPS by 4 cents.
In 2020, there were two significant items included in Net income as follows:
•in the fourth quarter, a deferred tax recovery of $29 million due to a change relating to a tax return filing election for the state of North Dakota that favourably impacted Diluted EPS by 5 cents; and
•during the course of the year, a net non-cash gain of $14 million ($12 million after deferred tax) due to FX translation of debt and lease liabilities that favourably impacted Diluted EPS by 2 cents as follows:
–in the fourth quarter, a $103 million gain ($90 million after deferred tax) that favourably impacted Diluted EPS by 13 cents;
–in the third quarter, a $40 million gain ($38 million after deferred tax) that favourably impacted Diluted EPS by 6 cents;
–in the second quarter, an $86 million gain ($82 million after deferred tax) that favourably impacted Diluted EPS by 12 cents; and
–in the first quarter, a $215 million loss ($198 million after deferred tax) that unfavourably impacted Diluted EPS by 28 cents.
In 2019, there were three significant items included in Net income as follows:
•in the fourth quarter, a deferred tax expense of $24 million as a result of a provision for an uncertain tax item of a prior period that unfavourably impacted Diluted EPS by 3 cents;
•in the second quarter, a deferred tax recovery of $88 million due to the change in the Alberta provincial corporate income tax rate that favourably impacted Diluted EPS by 13 cents; and
•during the course of the year, a net non-cash gain of $94 million ($86 million after deferred tax) due to FX translation of debt and lease liabilities that favourably impacted Diluted EPS by 12 cents as follows:
–in the fourth quarter, a$37 million gain ($32 million after deferred tax) that favourably impacted Diluted EPS by 4 cents;
–in the third quarter, a $25 million loss ($22 million after deferred tax) that unfavourably impacted Diluted EPS by 3 cents;
–in the second quarter, a $37KCS purchase accounting of $39 million gain ($34 million after deferred tax) that favourably impacted Diluted EPS by 4 cents; and
–in the first quarter, a $45 million gain ($42 million after deferred tax) that favourably impacted Diluted EPS by 6 cents.
In 2018, there were two significant items included in Net income as follows:
•in the second quarter, a deferred tax recovery of $21 million due to reductions in the Missouri and Iowa state tax rates that favourably impacted Diluted EPS by 3 cents; and
•during the course of the year, a net non-cash loss of $168 million ($150 million after deferred tax) due to FX translation of debt that unfavourably impacted Diluted EPS by 21 cents as follows:
–in the fourth quarter, a $113 million loss ($103 million after deferred tax) that unfavourably impacted Diluted EPS by 14 cents;
–in the third quarter, a $38 million gain ($33 million after deferred tax) that favourably impacted Diluted EPS by 5 cents;
–in the second quarter, a $44 million loss ($38 million after deferred tax) that unfavourably impacted Diluted EPS by 5 cents; and
–in the first quarter, a $49KCS purchase accounting of $40 million loss ($42 million after deferred tax) that unfavourably impacted Diluted EPS by 64 cents.
Reconciliation of GAAP Performance Measures to Non-GAAP Performance Measures
The following tables reconcile the most directly comparable measures presented in accordance with GAAP to the Non-GAAP measures as discussed further in other sections of this Item 7. Management’s Discussion and Analysis of Financial Condition and Results of Operations:
Adjusted income is calculated as Net income reported on a GAAP basis adjusted for significant items. Core adjusted income is calculated as Adjusted income less KCS purchase accounting.
| | | | | | | | | | | | | | | | | |
| For the year ended December 31 |
| (in millions of Canadian dollars) | 2022 | 2021 | 2020 | 2019 | 2018 |
| Net income as reported | $ | 3,517 | | $ | 2,852 | | $ | 2,444 | | $ | 2,440 | | $ | 1,951 | |
| Less significant items (pre-tax): | | | | | |
| | | | | |
| | | | | |
| | | | | |
| KCS net gain on unwind of interest rate hedges | 212 | | — | | — | | — | | — | |
| Acquisition-related costs | (123) | | (599) | | — | | — | | — | |
| Merger termination fee | — | | 845 | | — | | — | | — | |
| Impact of FX translation gain (loss) on debt and lease liabilities | — | | 7 | | 14 | | 94 | | (168) | |
| Add: | | | | | |
Tax effect of adjustments(1) | (15) | | (1) | | 2 | | 8 | | (18) | |
| Deferred tax recovery on the outside basis difference of the investment in KCS | (19) | | (33) | | — | | — | | — | |
| Income tax rate changes | (12) | | — | | (29) | | (88) | | (21) | |
| (Reversal of) provision for uncertain tax item | (24) | | — | | — | | 24 | | — | |
| Adjusted income | $ | 3,358 | | $ | 2,565 | | $ | 2,403 | | $ | 2,290 | | $ | 2,080 | |
| Less: KCS purchase accounting | (163) | | (8) | | — | | — | | — | |
| Core adjusted income | $ | 3,521 | | $ | 2,573 | | $ | 2,403 | | $ | 2,290 | | $ | 2,080 | |
| | | | | |
| | | | | | | | |
| For the year ended December 31 |
| 2023 | 2022 |
| CPKC diluted earnings per share as reported | $ | 4.21 | | $ | 3.77 | |
| | |
| | |
| | |
| | |
| | |
| Less: | | |
| Significant items (pre-tax): | | |
| KCS net gain on unwind of interest rate hedges | — | | 0.23 | |
| Remeasurement loss of KCS | (7.68) | | — | |
| Acquisition-related costs | (0.21) | | (0.14) | |
| KCS purchase accounting | (0.32) | | (0.17) | |
| Add: | | |
Tax effect of adjustments(1) | (0.11) | | (0.02) | |
| Settlement of Mexican taxes relating to prior years | 0.02 | | — | |
| Income tax rate changes | (0.07) | | (0.01) | |
| Deferred tax recovery on the outside basis difference of the investment in KCS | (8.42) | | (0.02) | |
| Reversal of provision for uncertain tax item | — | | (0.03) | |
Core adjusted combined diluted earnings per share(2) | $ | 3.84 | | $ | 3.77 | |
(1)The tax effect of adjustments was calculated as the pre-tax effect of the adjustmentssignificant items and KCS purchase accounting listed above multiplied by the applicable tax rate for the above items of 16.97%, 0.51%, 13.58%, 8.55% and 10.64%1.37% for the years presented, respectively.year ended December 31, 2023 and 20.08% for the year ended December 31, 2022. The applicable tax rates reflect the taxable jurisdictions and nature, being on account of capital or income, of the adjustments.
(2) The Company previously used the non-GAAP measure Core adjusted diluted earnings per share, which was calculated as diluted earnings per share adjusted for significant items.items less KCS purchase accounting. Core adjusted diluted earnings per share was $3.77 for the year ended December 31, 2022, which is the same as the revised measure Core adjusted combined diluted earnings per share, as KCS was equity accounted for within CPKC's results.
Core Adjusted Combined Operating Ratio
Core adjusted combined operating ratio is calculated from reported GAAP revenue and operating expenses adjusted for (1) KCS operating income prior to the Control Date and giving effect to transaction accounting adjustments in a consistent manner with Regulation S-X Article 11 ("Article 11"), where applicable, (2) significant items (acquisition-related costs) that are reported within Operating income, and (3) KCS purchase accounting recognized in Depreciation and amortization and Purchased services and other.
This combined measure does not purport to represent what the actual consolidated results of operations would have been had the Company obtained control of KCS and consolidation actually occurred on January 1, 2022, nor is it indicative of future results. This information is based upon assumptions
54 / CPKC 2023 ANNUAL REPORT
that CPKC believes reasonably reflect the impact to CPKC's historical financial information, on a supplemental basis, of obtaining control of KCS had it occurred as of January 1, 2022. This information does not include anticipated costs related to integration activities, cost savings or synergies that may be achieved by the combined company.
In 2023, acquisition-related costs were $197 million in connection with the KCS acquisition including costs of $82 million recognized in "Compensation and benefits", $2 million recognized in"Materials", and $113 million recognized in "Purchased services and other", that unfavourably impacted operating ratio on a combined basis, calculated in a manner consistent with Article 11, by 1.4%:
•in the fourth quarter, acquisition-related costs of $32 million including costs of $7 million recognized in "Compensation and benefits", $1 million recognized in "Materials", and $24 million recognized in "Purchased services and other", that unfavourably impacted operating ratio by 0.8%;
•in the third quarter, acquisition-related costs of $24 million including costs of $1 million recognized in "Compensation and benefits", $1 million recognized in "Materials", and $22 million recognized in "Purchased services and other", that unfavourably impacted operating ratio by 0.8%;
•in the second quarter, acquisition-related costs of $116 million including costs of $63 million recognized in "Compensation and benefits", and $53 million recognized in "Purchased services and other", that unfavourably impacted operating ratio by 3.5%; and
•in the first quarter, acquisition-related costs of $25 million including costs of $11 million recognized in "Compensation and benefits", and $14 million recognized in "Purchased services and other", that unfavourably impacted operating ratio by 0.7%.
In 2022, acquisition-related costs were $168 million in connection with the KCS acquisition including costs of $55 million recognized in "Compensation and benefits" and $113 million recognized in "Purchased services and other", that unfavourably impacted operating ratio on a combined basis, calculated in a manner consistent with Article 11, by 1.3%:
•in the third quarter, acquisition-related costs of $33 million including costs of $14 million recognized in "Compensation and benefits", and $19 million recognized in "Purchased services and other", that unfavourably impacted operating ratio by 0.8%;
•in the second quarter, acquisition-related costs of $35 million including costs of $14 million recognized in "Compensation and benefits", and $21 million recognized in "Purchased services and other", that unfavourably impacted operating ratio by 1.1%; and
•in the first quarter, acquisition-related costs of $69 million including costs of $15 million recognized in "Compensation and benefits", and $54 million recognized in "Purchased services and other", that unfavourably impacted operating ratio by 2.5%.
KCS purchase accounting included in operating ratio on a combined basis calculated in a manner consistent with Article 11 was as follows:
2023
•during the course of the year, KCS purchase accounting of $327 million including $326 million recognized in "Depreciation and amortization" and $1 million recognized in "Purchased services and other" related to the amortization of equity investments, that unfavourably impacted operating ratio by 2.4% as follows:
–in the fourth quarter, KCS purchase accounting of $86 million including $85 million recognized in "Depreciation and amortization" and $1 million recognized in "Purchased services and other" related to the amortization of equity investments, that unfavourably impacted operating ratio by 2.3%;
–in the third quarter, KCS purchase accounting of $81 million recognized in "Depreciation and amortization" that unfavourably impacted operating ratio by 2.4%;
–in the second quarter, KCS purchase accounting of $80 million recognized in "Depreciation and amortization" that unfavourably impacted operating ratio by 2.4%; and
–in the first quarter, KCS purchase accounting of $80 million recognized in "Depreciation and amortization" that unfavourably impacted operating ratio by 2.3%.
2022
CP 2022CPKC 2023 ANNUAL REPORT 50/ 55
Adjusted diluted earnings per share is calculated using Adjusted | | | | | | | | |
| For the year ended December 31 |
| 2023 | 2022(3) |
| CPKC operating ratio as reported | 65.0 | % | 62.2 | % |
| Add: | | |
KCS operating income as reported prior to Control Date(1) | — | % | 0.5 | % |
Pro forma Article 11 transaction accounting adjustments(2) | 0.8 | % | 2.6 | % |
| 65.8 | % | 65.3 | % |
| | |
| Less: | | |
| Acquisition-related costs | 1.4 | % | 1.3 | % |
| KCS purchase accounting in Operating expenses | 2.4 | % | 2.3 | % |
| Core adjusted combined operating ratio | 62.0 | % | 61.7 | % |
(1) KCS results were translated into Canadian dollars at the Bank of Canada monthly average rates of $1.35 and $1.30 for January 1 through April 13, 2023 and the year ended December 31, 2022, respectively.
(2) Pro forma Article 11 transaction accounting adjustments represent adjustments made in a manner consistent with Article 11, these include:
•For January 1 through April 13, 2023, depreciation and amortization of differences between the historic carrying values and the provisional fair values of KCS's tangible and intangible assets and investments prior to the Control Date that unfavourably impacted operating ratio by 0.8% and miscellaneous immaterial amounts that have been reclassified across revenue, operating expenses, and non-operating income as defined above, dividedor expense, consistent with CPKC's financial statement captions; and
•For the year ended December 31, 2022, depreciation and amortization of differences between the historic carrying values and the provisional fair values of KCS's tangible and intangible assets and investments prior to the Control Date that unfavourably impacted operating ratio by 2.3%, the estimated transaction costs expected to be incurred by the weighted-average diluted number of Common Shares outstanding during the period as determined in accordanceCompany that unfavourably impacted operating ratio by 0.3%, and miscellaneous immaterial amounts that have been reclassified across revenue, operating expenses, and non-operating income or expense, consistent with GAAP. Core adjusted diluted earnings per share is calculated as Adjusted diluted earnings per share less KCS purchase accounting.
| | | | | | | | | | | | | | | | | |
| For the year ended December 31 |
| 2022 | 2021 | 2020 | 2019 | 2018 |
| Diluted earnings per share as reported | $ | 3.77 | | $ | 4.18 | | $ | 3.59 | | $ | 3.50 | | $ | 2.72 | |
| Less significant items (pre-tax): | | | | | |
| | | | | |
| | | | | |
| | | | | |
| KCS net gain on unwind of interest rate hedges | 0.23 | | — | | — | | — | | — | |
| Acquisition-related costs | (0.14) | | (0.88) | | — | | — | | — | |
| Merger termination fee | — | | 1.24 | | — | | — | | — | |
| Impact of FX translation gain (loss) on debt and lease liabilities | — | | 0.01 | | 0.02 | | 0.13 | | (0.23) | |
| | | | | |
| Add: | | | | | |
Tax effect of adjustments(1) | (0.02) | | — | | — | | 0.01 | | (0.02) | |
| Deferred tax recovery on the outside basis difference of the investment in KCS | (0.02) | | (0.05) | | — | | — | | — | |
| Income tax rate changes | (0.01) | | — | | (0.04) | | (0.13) | | (0.03) | |
| (Reversal of) provision for uncertain tax item | (0.03) | | — | | — | | 0.04 | | — | |
| Adjusted diluted earnings per share | $ | 3.60 | | $ | 3.76 | | $ | 3.53 | | $ | 3.29 | | $ | 2.90 | |
| Less: KCS purchase accounting | (0.17) | | (0.01) | | — | | — | | — | |
| Core adjusted diluted earnings per share | $ | 3.77 | | $ | 3.77 | | $ | 3.53 | | $ | 3.29 | | $ | 2.90 | |
| | | | | |
(1) The tax effect of adjustments was calculated as the pre-tax effect of the adjustments multiplied by the applicable tax rate for the above items of 16.97%, 0.51%, 13.58%, 8.55% and 10.64% for the years presented, respectively. The applicable tax rates reflect the taxable jurisdictions and nature, being on account of capital or income, of the significant items.CPKC's financial statement captions.
Adjusted operating income is calculated as Operating income reportedFor more information about these pro forma transaction accounting adjustments for the three months ended March 31, 2023 and the year ended December 31, 2022, please see Exhibit 99.1 “Selected Unaudited Combined Summary of Historical Financial Data” of CPKC’s Current Report on a GAAP basis less significant items.Form 8-K furnished with the Securities and Exchange Commission (“SEC”) on May 15, 2023.
| | | | | | | | | | | | | | | | | |
| For the year ended December 31 |
| (in millions of Canadian dollars) | 2022 | 2021 | 2020 | 2019 | 2018 |
| Operating income as reported | $ | 3,329 | | $ | 3,206 | | $ | 3,311 | | $ | 3,124 | | $ | 2,831 | |
| Less significant item: | | | | | |
| | | | | |
| Acquisition-related costs | (74) | | (183) | | — | | — | | — | |
| Adjusted operating income | $ | 3,403 | | $ | 3,389 | | $ | 3,311 | | $ | 3,124 | | $ | 2,831 | |
Operating ratio is calculated as operating expenses divided by revenues. The Company previously used the Non-GAAP measure Adjusted operating ratio, excludeswhich was defined as operating ratio excluding those significant items that are reported within Operating income.
| | | | | | | | | | | | | | | | | |
| For the year ended December 31 |
| 2022 | 2021 | 2020 | 2019 | 2018 |
| Operating ratio as reported | 62.2 | % | 59.9 | % | 57.1 | % | 59.9 | % | 61.3 | % |
| Less significant item: | | | | | |
| | | | | |
| Acquisition-related costs | 0.8 | | 2.3 | | — | | — | | — | |
| Adjusted operating ratio | 61.4 | % | 57.6 | % | 57.1 | % | 59.9 | % | 61.3 | % |
Adjusted Return on Invested Capital ("Adjusted ROIC")
Return on average shareholders' equity is calculated as Net income divided by average shareholders' equity, averaged between the beginning and ending balance over a trailing twelve month period. Adjusted ROIC is calculated as Adjusted return divided by Adjusted average invested capital. Adjusted return is defined as Net income adjusted for interest expense, tax effected at the Company’s adjusted annualized effective tax rate, and significant items in the Company’s Consolidated Financial Statements, tax effected at the applicable tax rate. Adjusted average invested capital is defined as the sum of total
Shareholders' equity, Long-term debt, and Long-term debt maturing within one year, as presented in the Company's Consolidated Financial Statements, each averaged between the beginning and ending balance over a trailing twelve month period, adjusted for the impact of significant items, tax effected at the applicable tax rate, on closing balances as part of this average. Adjusted ROIC excludes significant items reported in the Company's Consolidated Financial Statements, as these significant items are not considered indicative of future financial trends either by nature or amount, and excludes interest expense, net of tax, to incorporate returns on the Company’s overall capitalization. Adjusted ROIC is a performance measure that measures how productively the Company uses its long-term capital investments, representing critical indicators of good operating and investment decisions made by management, and is an important performance criteria in determining certain elements of the Company's long-term incentive plan. Adjusted ROIC is reconciled below from Return on average shareholders' equity, the most comparable measure calculated in accordance with GAAP.
Calculation of Return on average shareholders' equity | | | | | | | | | | | | | | | | | |
| For the year ended December 31 |
| (in millions of Canadian dollars, except for percentages) | 2022 | 2021 | 2020 | 2019 | 2018 |
| Net income as reported | $ | 3,517 | $ | 2,852 | $ | 2,444 | $ | 2,440 | $ | 1,951 |
| Average shareholders' equity | 36,358 | 20,574 | 7,194 | 6,853 | 6,537 |
| Return on average shareholders' equity | 9.7 | % | 13.9 | % | 34.0 | % | 35.6 | % | 29.8 | % |
Reconciliation of Net Income to Adjusted Return
| | | | | | | | | | | | | | | | | |
| For the year ended December 31 |
| (in millions of Canadian dollars) | 2022 | 2021 | 2020 | 2019 | 2018 |
| Net income as reported | $ | 3,517 | | $ | 2,852 | | $ | 2,444 | | $ | 2,440 | | $ | 1,951 | |
| Add: | | | | | |
| Net interest expense | 652 | | 440 | | 458 | | 448 | | 453 | |
Tax on interest(1) | (145) | | (106) | | (113) | | (112) | | (112) | |
| Significant items (pre-tax): | | | | | |
| | | | | |
| | | | | |
| | | | | |
| KCS net gain on unwind of interest rate hedges | (212) | | — | | — | | — | | — | |
| Acquisition-related costs | 123 | | 599 | | — | | — | | — | |
| Merger termination fee | — | | (845) | | — | | — | | — | |
| Impact of FX translation (gain) loss on debt and lease liabilities | — | | (7) | | (14) | | (94) | | 168 | |
Tax on significant items(2) | (15) | | (1) | | 2 | | 8 | | (18) | |
| Deferred tax recovery on the outside basis difference of the investment in KCS | (19) | | (33) | | — | | — | | — | |
| Income tax rate changes | (12) | | — | | (29) | | (88) | | (21) | |
| (Reversal of) provision for uncertain tax item | (24) | | — | | — | | 24 | | — | |
| Adjusted return | $ | 3,865 | | $ | 2,899 | | $ | 2,748 | | $ | 2,626 | | $ | 2,421 | |
(1) Taxratio was calculated at the adjusted annualized effective tax rate of 22.24%, 23.85%, 24.61%, 24.96%, and 24.55% for each of the above items for the years presented, respectively.
(2) Tax was calculated as the pre-tax effect of the adjustments multiplied by the applicable tax rate of 16.97%, 0.51%, 13.58%, 8.55%, and 10.64% for each of the above items for the years presented, respectively. The applicable tax rates reflect the taxable jurisdictions and nature, being on account of capital or income, of the significant items.
Reconciliation of Average shareholders' equity to Adjusted average invested capital
| | | | | | | | | | | | | | | | | |
| For the year ended December 31 |
| (in millions of Canadian dollars) | 2022 | 2021 | 2020 | 2019 | 2018 |
| Average shareholders' equity | $ | 36,358 | | $ | 20,574 | | $ | 7,194 | | $ | 6,853 | | $ | 6,537 | |
| Average long-term debt, including long-term debt maturing within one year | 19,889 | | 14,949 | | 9,264 | | 8,726 | | 8,427 | |
| $ | 56,247 | | $ | 35,523 | | $ | 16,458 | | $ | 15,579 | | $ | 14,964 | |
| Less: | | | | | |
| Significant items (pre-tax): | | | | | |
| | | | | |
| | | | | |
| | | | | |
| KCS net gain on unwind of interest rate hedges | 106 | | — | | — | | — | | — | |
| Acquisition-related costs | (62) | | (300) | | — | | — | | — | |
| Merger termination fee | — | | 423 | | — | | — | | — | |
Tax on significant items(1) | 8 | | 1 | | — | | — | | — | |
| Deferred tax recovery on the outside basis difference of the investment in KCS | 10 | | 16 | | — | | — | | — | |
| Income tax rate changes | 6 | | — | | 15 | | 44 | | 11 | |
| (Reversal of) provision for uncertain tax item | 12 | | — | | — | | (12) | | — | |
| Adjusted average invested capital | $ | 56,167 | | $ | 35,383 | | $ | 16,443 | | $ | 15,547 | | $ | 14,953 | |
(1) Tax was calculated at the pre-tax effect of the adjustments multiplied by the applicable tax rate of 16.97% and 0.90% for 2022 and 2021, respectively. The applicable tax rate reflects the taxable jurisdictions and nature, being on account of capital or income, of the significant items.
Calculation of Adjusted ROIC
| | | | | | | | | | | | | | | | | |
| For the year ended December 31 |
| (in millions of Canadian dollars, except for percentages) | 2022 | 2021 | 2020 | 2019 | 2018 |
| Adjusted return | $ | 3,865 | | $ | 2,899 | | $ | 2,748 | | $ | 2,626 | | $ | 2,421 | |
| Adjusted average invested capital | 56,167 | | 35,383 | | 16,443 | | 15,547 | | 14,953 | |
| Adjusted ROIC | 6.9 | % | 8.2 | % | 16.7 | % | 16.9 | % | 16.2 | % |
Free Cash
Free cash is calculated as Cash provided by operating activities, less Cash used in investing activities, adjusted for changes in Cash and cash equivalents balances resulting from FX fluctuations, cash settlement of hedges settled upon issuance of debt, the operating cash flow impacts of acquisition-related costs associated with the KCS transaction including settlement of cash flow hedges upon debt issuance and FX gain on U.S. dollar-denominated cash held to fund the KCS acquisition, the merger termination payment received related to KCS's termination of the Original Merger Agreement, and the acquisitions of KCS, Central Maine & Québec Railway ("CMQ"), and Detroit River Tunnel Partnership ("DRTP"). Free cash is a measure that management considers to be a valuable indicator of liquidity. Free cash is useful to investors and other external users of the Company's Consolidated Financial Statements as it assists with the evaluation of the Company's ability to generate cash to satisfy debt obligations and discretionary activities such as dividends, share repurchase programs, and other strategic opportunities, and is an important performance criteria in determining certain elements of the Company's long-term incentive plan. The cash settlement of forward starting swaps that occurred in conjunction with the issuance of long-term debt, the acquisition-related costs associated with the KCS acquisition, and the merger termination payment received related to KCS's termination of the Original Merger Agreement are not indicative of operating trends and have been excluded from Free cash. Similarly, the acquisitions of KCS, CMQ, and DRTP are not indicative of investment trends and have also been excluded from Free cash. Free cash should be considered in addition to, rather than as a substitute for, Cash provided by operating activities.
Reconciliation of Cash Provided by Operating Activities to Free Cash
| | | | | | | | | | | | | | | | | |
| For the year ended December 31 |
| (in millions of Canadian dollars) | 2022 | 2021 | 2020 | 2019 | 2018 |
| Cash provided by operating activities | $ | 4,142 | | $ | 3,688 | | $ | 2,802 | | $ | 2,990 | | $ | 2,712 | |
| Cash used in investing activities | (1,496) | | (13,730) | | (2,030) | | (1,803) | | (1,458) | |
| Effect of foreign currency fluctuations on U.S. dollar-denominated cash and cash equivalents | 20 | | 41 | | 6 | | (4) | | 11 | |
| Less: | | | | | |
| Settlement of forward starting swaps on debt issuance | — | | — | | — | | — | | (24) | |
Acquisition-related costs(1) | (67) | | (340) | | — | | — | | — | |
| Merger termination fee | — | | 845 | | — | | — | | — | |
| Investment in Kansas City Southern | — | | (12,299) | | — | | — | | — | |
| Investment in Central Maine & Québec Railway | — | | — | | 19 | | (174) | | — | |
| Investment in Detroit River Tunnel Partnership | — | | — | | (398) | | — | | — | |
| Free cash | $ | 2,733 | | $ | 1,793 | | $ | 1,157 | | $ | 1,357 | | $ | 1,289 | |
(1) Including settlement of cash flow hedges upon debt issuance of $226 million61.4% for the year ended December 31, 2021.
Foreign Exchange Adjusted % Change
FX adjusted % change allows certain financial results2022, which was changed to be viewed without the impact of fluctuations in foreign currency exchange rates, thereby facilitating period-to-period comparisons in the analysis of trends in business performance. Financial result variances at constant currency are obtained by translating the comparable period of the prior year results denominated in U.S. dollars at the foreign exchange rates of the current period.
FX adjusted % changes in revenues are further used in calculating FX adjusted % change in freight revenue per carload and RTM.
| | | | | | | | | | | | | | | | | | | | | | |
| | | | 2022 vs. 2021 | | |
| (in millions of Canadian dollars) | Reported 2022 | Reported 2021 | | Variance
due to FX | FX Adjusted 2021 | FX Adjusted
% Change | | | | |
| Freight revenues by line of business | | | | | | | | | | |
| Grain | $ | 1,776 | | $ | 1,684 | | | $ | 34 | | $ | 1,718 | | 3 | | | | | |
| Coal | 577 | | 625 | | | 3 | | 628 | | (8) | | | | | |
| Potash | 581 | | 463 | | | 9 | | 472 | | 23 | | | | | |
| Fertilizers and sulphur | 332 | | 305 | | | 9 | | 314 | | 6 | | | | | |
| Forest products | 403 | | 348 | | | 12 | | 360 | | 12 | | | | | |
| Energy, chemicals and plastics | 1,394 | | 1,563 | | | 31 | | 1,594 | | (13) | | | | | |
| Metals, minerals, and consumer products | 884 | | 728 | | | 22 | | 750 | | 18 | | | | | |
| Automotive | 438 | | 376 | | | 9 | | 385 | | 14 | | | | | |
| Intermodal | 2,242 | | 1,724 | | | 13 | | 1,737 | | 29 | | | | | |
| Freight revenues | 8,627 | | 7,816 | | | 142 | | 7,958 | | 8 | | | | | |
| Non-freight revenues | 187 | | 179 | | | 1 | | 180 | | 4 | | | | | |
| Total revenues | $ | 8,814 | | $ | 7,995 | | | $ | 143 | | $ | 8,138 | | 8 | | | | | |
FX adjusted % changes in operating expenses are discussed in Operating Expenses of this Item 7. Management’s Discussion and Analysis of Financial Condition and Results of Operations.
| | | | | | | | | | | | | | | | | | | | | | |
| | | | 2022 vs. 2021 | | |
| (in millions of Canadian dollars) | Reported 2022 | Reported 2021 | | Variance
due to FX | FX Adjusted 2021 | FX Adjusted
% Change | | | | |
| Compensation and benefits | $ | 1,570 | | $ | 1,570 | | | $ | 18 | | $ | 1,588 | | (1) | | | | | |
| Fuel | 1,400 | | 854 | | | 27 | | 881 | | 59 | | | | | |
| Materials | 260 | | 215 | | | 2 | | 217 | | 20 | | | | | |
| Equipment rents | 140 | | 121 | | | 3 | | 124 | | 13 | | | | | |
| Depreciation and amortization | 853 | | 811 | | | 8 | | 819 | | 4 | | | | | |
| Purchased services and other | 1,262 | | 1,218 | | | 13 | | 1,231 | | 3 | | | | | |
| Total operating expenses | $ | 5,485 | | $ | 4,789 | | | $ | 71 | | $ | 4,860 | | 13 | | | | | |
Dividend Payout Ratio and Core Adjusted Dividend Payout Ratio
Dividend payout ratio is calculated as dividends declared per share divided by Diluted EPS.revised measure Core adjusted dividend payout ratio is calculated as dividends declared per share divided by Core adjusted diluted EPS, as defined above.combined operating ratio. This ratio is a measure of shareholder return and provides information onchange was due to the Company's ability to declare dividends on an ongoing basis, excluding significant items and the impactaddition of KCS purchase accounting.
Starting in 2022, Core adjusted dividend payout ratio is presented to provide users with additional transparency by isolating for the impact ofhistorical operating income less KCS purchase accounting.
Calculation of Dividend Payout Ratio
| | | | | | | | | | | | | | | | | |
| For the year ended December 31 |
| (in Canadian dollars, except for percentages) | 2022 | 2021 | 2020 | 2019 | 2018 |
| Dividends declared per share | $ | 0.7600 | | $ | 0.7600 | | $ | 0.7120 | | $ | 0.6280 | | $ | 0.5025 | |
| Diluted EPS | 3.77 | | 4.18 | | 3.59 | | 3.50 | | 2.72 | |
| Dividend payout ratio | 20.2 | % | 18.2 | % | 19.8 | % | 17.9 | % | 18.5 | % |
Calculation of Core Adjusted Dividend Payout Ratio
| | | | | | | | | | | | | | | | | |
| For the year ended December 31 |
| (in Canadian dollars, except for percentages) | 2022 | 2021 | 2020 | 2019 | 2018 |
| Dividends declared per share | $ | 0.7600 | | $ | 0.7600 | | $ | 0.7120 | | $ | 0.6280 | | $ | 0.5025 | |
| Core adjusted diluted EPS | 3.77 | | 3.77 | | 3.53 | | 3.29 | | 2.90 | |
| Core adjusted dividend payout ratio | 20.2 | % | 20.2 | % | 20.1 | % | 19.1 | % | 17.3 | % |
Adjusted Net Debt to Adjusted EBITDA Ratio and Pro-forma adjusted Net Debt to Pro-forma adjusted EBITDA Ratio
Adjusted net debt to Adjusted earnings before interest, tax, depreciation and amortization ("EBITDA") ratio is calculated as Adjusted net debt divided by Adjusted EBITDA. The Adjusted net debt to Adjusted EBITDA ratio is a key credit measure used to assess the Company’s financial capacity. The ratio provides information on the Company’s ability to service its debt and other long-term obligations from operations, excluding significant items, and is an important performance criteria in determining certain elements of the Company's long-term incentive plan. The Adjusted net debt to Adjusted EBITDA ratio is reconciled below from the Long-term debt to Net income ratio, the most comparable measure calculated in accordance with GAAP.
Beginning in the first quarter of 2022, CP added disclosure of Pro-forma adjusted net debt to Pro-forma adjusted EBITDA ratio to better align with CP’s debt covenant calculation, which incorporates the trailing twelve month adjusted EBITDA of KCS as well as KCS’s outstanding debt. CP is incorporating the trailing twelve month adjusted EBITDA of KCS on a pro-forma basis, as CP is not entitled to earningsacquisition-related costs (as defined above) prior to the acquisition date of December 14, 2021. CP does not control KCS while it is inControl Date. For the voting trust during review of our merger application by the STB, though CP is the beneficial owner of
KCS’s outstanding shares and receives cash dividends from KCS. The adjustment to include the trailing twelve month EBITDA and KCS’s outstanding debt provides users of the financial statements with better insight into CP’s progress in achieving deleveraging commitments. KCS’s disclosed U.S. dollar financial values for the yearsyear ended December 31, 2022, and December 31, 2021, were2023, CPKC has presented the Non-GAAP measure of Core adjusted combined operating ratio, as defined above, to provide a comparison to prior period combined information calculated in a manner consistent with Article 11 as further adjusted to Canadian dollars reflecting the FX rate for the appropriate period presented, respectively. The Pro-formaconform to CPKC’s core adjusted Net Debt to Pro-forma adjusted EBITDA ratio is discussed further in Liquidity and Capital Resources of this Item 7. Management's Discussion and Analysis of Financial Condition and Results of Operations.
Calculation of Long-term Debt to Net Income Ratio
Long-term debt to Net income ratio is calculated as long-term debt, including long-term debt maturing within one year, divided by Net income.
| | | | | | | | | | | | | | | | | |
| (in millions of Canadian dollars, except for ratios) | 2022 | 2021 | 2020 | 2019 | 2018 |
| Long-term debt including long-term debt maturing within one year as at December 31 | $ | 19,651 | | $ | 20,127 | | $ | 9,771 | | $ | 8,757 | | $ | 8,696 | |
| Net income for the year ended December 31 | 3,517 | | 2,852 | | 2,444 | | 2,440 | | 1,951 | |
| Long-term debt to Net income ratio | 5.6 | | 7.1 | | 4.0 | | 3.6 | | 4.5 | |
Reconciliation of Long-term Debt to Adjusted Net Debt and Pro-forma Adjusted Net Debt
Adjusted net debt is defined as Long-term debt, Long-term debt maturing within one year and Short-term borrowing as reported on the Company’s Consolidated Balance Sheets adjusted for pension plans deficit, operating lease liabilities recognized on the Company's Consolidated Balance Sheets, and Cash and cash equivalents. Adjusted net debt is used as a measure of debt and long-term obligations as part of the calculation of Adjusted Net Debt to Adjusted EBITDA.
| | | | | | | | | | | | | | | | | |
(in millions of Canadian dollars)(1) | 2022 | 2021 | 2020 | 2019 | 2018 |
| CP long-term debt including long-term debt maturing within one year as at December 31 | $ | 19,651 | | $ | 20,127 | | $ | 9,771 | | $ | 8,757 | | $ | 8,696 | |
| Add: | | | | | |
Pension plans deficit(2) | 175 | | 263 | | 328 | | 294 | | 266 | |
| Operating lease liabilities | 270 | | 283 | | 311 | | 354 | | 387 | |
| Less: | | | | | |
| Cash and cash equivalents | 451 | | 69 | | 147 | | 133 | | 61 | |
| CP Adjusted net debt as at December 31 | $ | 19,645 | | $ | 20,604 | | $ | 10,263 | | $ | 9,272 | | $ | 9,288 | |
| KCS's long-term debt including long-term debt maturing within one year as at December 31 | $ | 5,119 | | $ | 4,789 | | N/A | N/A | N/A |
| Add: | | | | | |
| KCS operating lease liabilities | 136 | | 87 | | N/A | N/A | N/A |
| Less: | | | | | |
| KCS cash and cash equivalents | 281 | | 430 | | N/A | N/A | N/A |
| KCS Adjusted net debt as at December 31 | 4,974 | | 4,446 | | N/A | N/A | N/A |
| CP Adjusted net debt as at December 31 | 19,645 | | 20,604 | | N/A | N/A | N/A |
| Pro-forma Adjusted net debt as at December 31 | $ | 24,619 | | $ | 25,050 | | N/A | N/A | N/A |
(1) KCS's amounts were translated at the period end FX rate of $1.35 and $1.27 for the years ended December 31, 2022 and 2021, respectively.
(2) Pension plans deficit is the total funded status of the Pension plans in deficit only.
Reconciliation of Net Income to EBIT, Adjusted EBIT and Adjusted EBITDA and Pro-forma Adjusted EBITDA
Earnings before interest and tax ("EBIT") is calculated as Net income before Net interest expense and Income tax expense. Adjusted EBIT excludes significant items reported in both Operating income and Other expense (income). Adjusted EBITDA is calculated as Adjusted EBIT plus operating lease expense and Depreciation and amortization, less Other components of net periodic benefit recovery. Adjusted EBITDA is used as a measure of liquidity derived from operations, excluding significant items, as part of the calculation of Adjusted Net Debt to Adjusted EBITDA.
| | | | | | | | | | | | | | | | | |
| For the year ended December 31 |
(in millions of Canadian dollars)(1) | 2022 | 2021 | 2020 | 2019 | 2018 |
| CP Net income as reported | $ | 3,517 | | $ | 2,852 | | $ | 2,444 | | $ | 2,440 | | $ | 1,951 | |
| Add: | | | | | |
| Net interest expense | 652 | | 440 | | 458 | | 448 | | 453 | |
| Income tax expense | 628 | | 768 | | 758 | | 706 | | 637 | |
| EBIT | 4,797 | | 4,060 | | 3,660 | | 3,594 | | 3,041 | |
| Less significant items (pre-tax): | | | | | |
| | | | | |
| | | | | |
| | | | | |
| | | | | |
| | | | | |
| KCS net gain on unwind of interest rate hedges | 212 | | — | | — | | — | | — | |
| Acquisition-related costs | (123) | | (599) | | — | | — | | — | |
| Merger termination fee | — | | 845 | | — | | — | | — | |
| Impact of FX translation gain (loss) on debt and lease liabilities | — | | 7 | | 14 | | 94 | | (168) | |
| | | | | |
| Adjusted EBIT | 4,708 | | 3,807 | | 3,646 | | 3,500 | | 3,209 | |
| Add: | | | | | |
| Operating lease expense | 75 | | 72 | | 78 | | 83 | | 97 | |
| Depreciation and amortization | 853 | | 811 | | 779 | | 706 | | 696 | |
| Less: | | | | | |
| Other components of net periodic benefit recovery | 411 | | 387 | | 342 | | 381 | | 384 | |
| CP Adjusted EBITDA | $ | 5,225 | | $ | 4,303 | | $ | 4,161 | | $ | 3,908 | | $ | 3,618 | |
| Net income attributable to KCS and subsidiaries | $ | 1,290 | | $ | 675 | | N/A | N/A | N/A |
| Add: | | | | | |
| KCS interest expense | 204 | | 196 | | N/A | N/A | N/A |
| KCS income tax expense | 426 | | 269 | | N/A | N/A | N/A |
| KCS EBIT | 1,920 | | 1,140 | | N/A | N/A | N/A |
| Less significant items (pre-tax): | | | | | |
| KCS merger costs | (60) | | (310) | | N/A | N/A | N/A |
| KCS gain on settlement of treasury lock agreements | 352 | | — | | N/A | N/A | N/A |
| KCS Adjusted EBIT | 1,628 | | 1,450 | | N/A | N/A | N/A |
| Add: | | | | | |
| KCS total lease cost | 43 | | 40 | | N/A | N/A | N/A |
| KCS depreciation and amortization | 509 | | 459 | | N/A | N/A | N/A |
| KCS Adjusted EBITDA | $ | 2,180 | | $ | 1,949 | | N/A | N/A | N/A |
| CP Adjusted EBITDA | $ | 5,225 | | $ | 4,303 | | N/A | N/A | N/A |
| Less: | | | | | |
Equity earnings (loss) of KCS(2) | 1,074 | | (141) | | N/A | N/A | N/A |
Acquisition-related costs of KCS(3) | 49 | | 169 | | N/A | N/A | N/A |
KCS net gain on unwind of interest rate hedges(4) | (212) | | — | | N/A | N/A | N/A |
| Pro-forma Adjusted EBITDA | $ | 6,494 | | $ | 6,224 | | N/A | N/A | N/A |
(1) KCS's amounts were translated at the quarterly average FX rate of $1.36, $1.30, $1.28, and $1.27 for Q4 2022, Q3 2022, Q2 2022 and Q1 2022 and $1.26, $1.26, $1.23, and $1.27 for Q4 2021, Q3 2021, Q2 2021, and Q1 2021, respectively.
(2) Equity earnings (loss) of KCS were part of CP's reported net income and therefore have been deducted in arriving to the Pro-forma Adjusted EBITDA.
(3) Acquisition-related costs of KCS have been adjusted in CP's Adjusted EBITDA calculation above, therefore have been deducted in arriving to the Pro-forma Adjusted EBITDA.
(4) KCS net gain on unwind of interest rate hedges has been adjusted in CP's Adjusted EBITDA calculation above and therefore has been added back in arriving to the Pro-forma Adjusted EBITDA.
Calculation of Adjusted Net Debt to Adjusted EBITDA Ratio and Pro-forma Adjusted Net Debt to Pro-forma Adjusted
EBITDA Ratio
| | | | | | | | | | | | | | | | | |
| (in millions of Canadian dollars, except for ratios) | 2022 | 2021 | 2020 | 2019 | 2018 |
| Adjusted net debt as at December 31 | $ | 19,645 | | $ | 20,604 | | $ | 10,263 | | $ | 9,272 | | $ | 9,288 | |
| Adjusted EBITDA for the year ended December 31 | 5,225 | | 4,303 | | 4,161 | | 3,908 | | 3,618 | |
| Adjusted net debt to Adjusted EBITDA ratio | 3.8 | | 4.8 | | 2.5 | | 2.4 | | 2.6 | |
| | | | | | | | | | | | | | | | | |
| (in millions of Canadian dollars, except for ratios) | 2022 | 2021 | 2020 | 2019 | 2018 |
| Pro-forma adjusted net debt as at December 31 | $ | 24,619 | | $ | 25,050 | | N/A | N/A | N/A |
| Pro-forma adjusted EBITDA for the year ended December 31 | 6,494 | | 6,224 | | N/A | N/A | N/A |
| Pro-forma adjusted net debt to Pro-forma adjusted EBITDA ratio | 3.8 | | 4.0 | | N/A | N/A | N/A |
Critical Accounting Estimates
To prepare the Consolidated Financial Statements that conform with GAAP, the Company is required to make estimates and assumptions that affect the reported amounts of assets and liabilities, the disclosure of contingent assets and liabilities at the date of the Consolidated Financial Statements and the reported amounts of revenues and expenses during the reported periods. Using the most current information available, the Company reviews estimates on an ongoing basis.
The development, selection and disclosure of these estimates, and this Management's Discussion and Analysis of Financial Condition and Results of Operations, have been reviewed by the Board of Directors’ Audit and Finance Committee, which is composed entirely of independent directors.
Business Acquisition
As described in Item 8. Financial Statements and Supplementary Data, Note 11 Business acquisition and Note 12 Investment in KCS, the Company assumed control of KCS and commenced consolidation of KCS on the Control Date, accounting for the acquisition as a business combination achieved in stages.
In accounting for the business combination, the Company’s previously held interest in KCS was remeasured to its Control Date fair value. The identifiable assets acquired, and liabilities and non-controlling interest assumed are measured at their provisional fair values at the Control Date, with certain exceptions, including income taxes and contract liabilities. The results from operations and cash flows are consolidated in the financial statements.
The disclosure of the business acquisition presented in Item 8. Financial Statements and Supplementary Data, Note 11 Business acquisition is prepared on a provisional basis using the best available information at this time. A provisional purchase price allocation was determined at the Control Date and has been revised at December 31, 2023 for identified measurement period adjustments. This provisional purchase price allocation may be subject to further adjustment during the remainder of the measurement period resulting in additional assets or liabilities being recognized to reflect new information obtained about facts and circumstances that existed as of the Control Date that, if known, would affect the amounts recognized as of that date. The measurement period is not to exceed a year. Changes to the provisional amounts may impact the amount of goodwill recognized. Goodwill is the residual
56 / CPKC 2023 ANNUAL REPORT
value after allocating the fair value of KCS to the assets acquired and liabilities and non-controlling interest assumed, i.e. it represents the excess of the purchase price over the fair value of the identifiable net assets.
Accounting for a business acquisition requires significant judgement to determine the estimated fair value of long-lived assets, intangible assets and assumed liabilities as at the acquisition date. The estimated fair values assigned to tangible and intangible assets acquired and liabilities assumed are based on management's estimates and assumptions, as well as other information compiled by management, including valuations that utilize customary valuation procedures and techniques. Estimates and assumptions include, but are not limited to, the cash flows an asset is expected to generate in the future and the appropriate weighted average cost of capital as at the Control Date, including market data, historical and future cash flow estimates, growth rates and discount rates.
The Company believes the fair value of KCS and the provisional fair values of the assets acquired and the liabilities and non-controlling interest assumed are based on reasonable assumptions and reflect known information and estimates. Measurement uncertainty in these estimates exists due to the characteristics of the assumptions and facts used to generate these estimates. Changes to assumptions and estimates during the measurement period could materially change the fair value estimates of the assets and liabilities included in the provisional purchase price allocation, and could change the recognized amount of goodwill. In addition, alternative estimates or assumptions could have been used in the establishment of the fair value of KCS and the provisional fair values of the assets acquired and liabilities assumed, including goodwill.
The table below outlines the sensitivities of key estimates or changes in those key estimates that management believes could result from new and more precise information relating to facts and conditions as of the Control Date. The table includes estimates of the related impacts to the provisional fair values:
| | | | | | | | | | | | | | | | | |
| (in billions of dollars, except percentages) | Provisional Estimate at Control Date | Sensitivity Range | Value Range |
| Previously held equity investment in KCS | $ | 37.2 | | | | | |
| Revenue growth rate | | -1 | % | 1 | % | $ | 36.2 | | $ | 38.3 | |
| Terminal EBITDA multiple | | -0.5x | 0.5x | $ | 35.6 | | $ | 38.8 | |
| EBITDA margin | | -1 | % | 1 | % | $ | 36.7 | | $ | 37.8 | |
| Discount rate | | -1 | % | 1 | % | $ | 38.9 | | $ | 35.6 | |
| | | | | |
Intangible assets including Mexican concession(1) | $ | 12.2 | | | | | |
| Terminal growth rate | | -0.5 | % | 0.5 | % | $ | 11.4 | | $ | 13.1 | |
| Discount rate | | -1 | % | 1 | % | $ | 14.4 | | $ | 10.6 | |
| | | | | |
Mexican concession(1) | $ | 9.2 | | | | | |
Renewal probability of Mexican concession(1) | | -10 | % | 10 | % | $ | 8.9 | | $ | 9.4 | |
(1)Concession rights and related assets held under the terms of a concession from the Mexican government are presented with acquired Properties.
Goodwill and Intangible Assets
The Company evaluates goodwill and indefinite life intangible assets for impairment at least annually, or sooner if indicators of impairment exist. For intangible assets with finite lives impairment is assessed whenever events or circumstances indicate that their carrying amounts may not be recoverable. In determining if events or circumstances indicate the carrying value of the reporting unit exceeds its fair value, the Company considers relevant events and conditions, including, but not limited to:
•macroeconomic trends;
•industry and market conditions;
•overall financial performance;
•company-specific events; and
•legal and regulatory factors.
When qualitative assessments suggest that the fair value of the Company’s reporting unit is more likely than not to be lower than its carrying amount, the Company performs a quantitative impairment test. Measurement of the fair value of a reporting unit requires the use of estimates and assumptions. The fair value of the Company’s reporting unit is estimated using a combination of:
•discounted cash flows and earnings multiples which represent amounts at which the reporting unit as a whole could be bought or sold in a current transaction between willing parties;
CPKC 2023 ANNUAL REPORT / 57
•present value techniques of estimated future cash flows; and
•valuation techniques based on multiples of earnings or revenue.
Specifically, the determination of fair value using the discounted cash flow technique requires the use of estimates and assumptions and the sensitivities of these estimates and assumptions used in the valuation of KCS are provided in the Business Acquisition section above.
At December 31, 2023, the Company had recorded goodwill of $17,729 million, all of which is allocated to a single reporting unit represented by the Company’s rail transportation operating segment, and intangible assets of $2,974 million. In addition to these amounts, the Concession rights and related assets held under a concession from the Mexican government, which are recognized within Properties, totalled $9,079 million at December 31, 2023.
Environmental Liabilities
Environmental remediation accruals cover site-specific remediation programs. The Company's estimates of the probable costs to be incurred in the remediation of properties contaminated by past activities reflect the nature of contamination at individual sites according to typical activities and scale of operations conducted. The Company screens and classifies sites according to typical activities and scale of operations conducted. The Company has developed remediation strategies for each property based on the nature and extent of the contamination, as well as the location of the property and surrounding areas that may be adversely affected by the presence of contaminants. The Company also considers available technologies, treatment and disposal facilities and the acceptability of site-specific plans based on the local regulatory environment. Site-specific plans range from containment and risk management of the contaminants through to the removal and treatment of the contaminants and affected soils and groundwater. The details of the estimates reflect the environmental liability at each property. The Company is committed to fully meeting regulatory and legal obligations with respect to environmental matters.
Some sites include remediation activities that are projected beyond the 10-year period, which the Company is unable to reasonably estimate and determine. Therefore, the Company's accruals of theprovision for environmental liabilities areremediation is based on an estimate of costs for a rolling 10-year period covered by the environmental program. Payments are expected to be made over 10 years to 2032.2033.
As of December 31, 2022 and 20212023, the Company's provision for remediation at specific environmental sites, including discounting, was $220 million (2022 - $83 millionmillion). In 2023 an additional provision for environmental remediation costs was recognized upon the acquisition of KCS (Item 8. Financial Statements and $79 million respectively.Supplementary Data, Note 11 Business acquisitions). CPKC continues to work with environmental consultants evaluating the estimated environmental liability recorded on acquisition of KCS and is performing further detailed assessments. This additional work may result in new information about the nature or extent of contamination on these sites from historic railway use, or may provide new information about appropriate remediation methodologies. To the extent this new information results in a revised estimate of remediation costs this change to the recorded liability will be accounted for as a measurement period adjustment if estimable during the measurement period, otherwise it will be recorded through expense.
Provisions for environmental remediation costs are recorded in “Other long-term liabilities” (refer to Item 8. Financial Statements and Supplementary Data, Note 1719 Other long-term liabilities), except for the current portion which is recorded in “Accounts payable and accrued liabilities” (refer to Item 8. Financial Statements and Supplementary Data, Note 1416 Accounts payable and accrued liabilities). The accruals for environmental remediation represent the Company’s best estimate of its probable future obligations and include both asserted and unasserted claims, without reduction for anticipated recoveries from third parties. Although the recorded accruals include the Company’s best estimate of all probable costs, the Company’s total environmental remediation costs cannot be predicted with certainty. Accruals for environmental remediation may change from time to time as new information about previously untested sites becomes known, environmental laws and regulations evolve and advances are made in environmental remediation technology. The accruals may also vary as the courts decide legal proceedings against outside parties responsible for contamination. These potential charges, which cannot be quantified at this time, are not expected to be material to the Company’s financial position, but may materially affect income in the period in which a charge is recognized.
The environmental liabilities are also sensitive to the increase in cost of materials which would be reflected as increases to "Other long-term liabilities" and "Accounts payable and accrued liabilities" on the Company’s Consolidated Balance Sheets and to "Purchased services and other" within Operating expenses on the Company's Consolidated Statements of Income. The Company's cash payments for environmental initiatives were $10$15 million in 2021,2023 (2022 - $8 million in 2022million) and are estimated to be approximately $12 million in 2023, $11$20 million in 2024, $10$26 million in 2025, $24 million in 2026 and a total of approximately $53$155 million over the remaining years through 2032.2033. All payments will be funded from general operations.
Pensions and Other Benefits
The Company has defined benefit and defined contribution pension plans. Other benefits include post-retirement medicalhealth benefits and life insurance, for pensioners, and some post-employment workers’ compensation and long-term disability benefits, in Canada.and certain other non-pension post-employment benefits. Workers’ compensation and long-term disability benefits are discussed in the Personal Injury and Other Claims Liabilities section below.
The obligations and costs for pensions and other benefits are based on the discounted present value of future benefits. The underlying benefits are paid over many years and are estimated based on uncertain demographic and economic assumptions. As a result, the obligations and costs themselves involve a significant amount of estimation uncertainty.
58 / CPKC 2023 ANNUAL REPORT
Information concerning the measurement of obligations and costs for pensions and other benefits is discussed in Item 8. Financial Statements and Supplementary Data, Note 12 Summary of significant accounting policies, and Note 2123 Pensions and other benefits.
Net Periodic Benefit Costs
The Company estimates net periodic benefit recoveries for defined benefit pensions to be approximately $293$292 million in 20232024 ($70 million in current service cost and $363376 million in other components of net periodic benefit recovery)recovery, partially offset by $84 million in current service cost), and net periodic benefit costs for defined contribution pensions to be approximately $13$14 million in 2023.2024. Net periodic benefit costs for post-retirement benefits in 20232024 are not expected to differ materially from the 20222023 costs. Total net periodic benefit recoveries for all plans are estimated to be approximately $250$239 million in 2023 (20222024 (2023 – $240$232 million), comprising $92comprised of $350 million (2022(2023 – $171 million) in current service cost and $342 million (2022 – $411$327 million) in other components of net periodic benefit recovery.recovery, partially offset by $111 million (2023 – $95 million) in current service cost.
Pension Plan Contributions
The Company estimates its aggregate pension contributions, including its defined benefit and defined contribution plans, to be in the range of $25 million to $35 million in 2023,2024, and in the range of $25 million to $50 million per year from 20242025 to 2026.2027.
The Company’s main Canadian defined benefit pension plan accounts for nearly all of the Company’s pension obligation and can produce significant volatility in pension funding requirements, given the pension fund’s size, the many factors that drive the pension plan’s funded status, and Canadian statutory pension funding requirements. TheBetween 2009 and 2011, the Company made voluntary prepayments totalingtotalling $1,750 million between 2009 and 2011 to the Company’s main Canadian defined benefit pension plan. The Company has applied $1,324 million of these voluntary prepayments to reduce its pension funding requirements in 2012–2022,2023, leaving $426 million of the voluntary prepayments still available at December 31, 2022,2023 to reduce the Company’s pension funding requirements in 20232024 and future years. The Company continues to have significant flexibility with respect to the rate at which the remaining voluntary prepayments are applied to reduce future years’ pension contribution requirements, which allows the Company to manage the volatility of future pension funding requirements. At this time, the Company estimates it will not apply any of the remaining voluntary prepayments against its 20232024 pension funding requirements.
Future pension contributions will be highly dependent on the Company’s actual experience with respect to variables such as investment returns, interest rate fluctuations, and demographic changes, on the rate at which previous years’ voluntary prepayments are applied against pension contribution requirements, and on any changes in the regulatory environment. The Company will continue to make contributions to theits pension plans that, at a minimum, meet pension legislative requirements.
Pension and Other Benefit Plan Risks
Fluctuations in the obligations and net periodic benefit costs for pensions result from favourable or unfavourable investment returns, changes to the outlook for future investment returns, and changes in long-term interest rates. The impact of favourable or unfavourable investment returns is moderated by the use of a market-related asset value for the main Canadian defined benefit pension plan’s public equity securities and absolute return strategies. The impact of changes in long-term interest rates on pension obligations is partially offset by their impact on the pension plans’ investments in fixed income assets.
The plans’ investment policy provides a target allocation of approximately 45%30% of the plans’ assets to be invested in public equity securities. As a result, stock market performance is a key driver in determining the pension plans’ asset performance. If the rate of investment return on the plans’ public equity securities in 20222023 had been 10% higher (or lower) than the actual 20222023 rate of investment return on such securities, 20232024 net periodic benefit costsrecoveries for pensions would be lowerhigher (or higher)lower) by approximately $21$16 million.
For computing the net periodic benefit recovery in 2023,2024, the Company is continuing to use anreducing the expected rate of return on the market-related asset value offrom 6.90% to 6.70% to reflect the Company's current view of future long-term investment returns. Changes to the outlook for future long-term investment returns can result in changes to the expected rate of return on the market-related asset value. If the expected rate of return as at December 31, 20222023 had been higher (or lower) by 0.1%, 20232024 net periodic benefit recoveries for pensions would be higher (or lower) by approximately $13$14 million.
Changes in bond yields can result in changes to discount rates and to the value of fixed income assets. If the discount rate as at December 31, 20222023 had been higher (or lower) by 0.1% with no related changes in the value of the pension plans’ investments in fixed income assets, 20232024 net periodic benefit recoveries for pensions would be higher (or lower) by approximately $8 million and 20232024 current service costs for pensions would be lower (or higher) by approximately $3 million. However, a change in bond yields would also lead to a change in the value of the pension funds’ investments in fixed income assets, and this change would partially offset the impact on net periodic benefit costs noted above.
The Company estimates that an increase in the discount rate of 0.1% would decrease the defined benefit pension plans’ projected benefit obligations by approximately $112$118 million, and that a decrease in the discount rate of 0.1% would increase the defined benefit pension plans’ projected benefit
CPKC 2023 ANNUAL REPORT / 59
obligations by approximately $115$120 million. Similarly, for every 0.1% that the actual return on assets varies above (or below) the estimated return for the year, the value of the defined benefit pension plans’ assets would increase (or decrease) by approximately $13 million.
Adverse experience with respect to these factors could eventually increase funding and pension expense significantly, while favourable experience with respect to these factors could eventually decrease funding and pension expense significantly.
Fluctuations in the post-retirement benefit obligation also can result from changes in the discount rate used. A 0.1% increase (decrease) in the discount rate would decrease (increase) the obligation by approximately $3$4 million.
The Company reviews its pensioner mortality experience to ensure that the mortality assumption continues to be appropriate, or to determine what changes to the assumption are needed.
Property, Plant and Equipment
The Company follows the group depreciation method under which a single depreciation rate is applied to the total cost in a particular class of property, despite differences in the service life or salvage value of individual properties within the same class. The Company performs depreciation studies of each property asset class approximately every three years to update depreciation rates. The studies are conducted with assistance from third-party specialists and analyzed and reviewed by the Company's management. Depreciation studies for U.S. assets are reviewed and approved by the STB. Depreciation studies for Canadian assets are provided to the Canadian Transportation Agency (the "Agency"), but the Agency does not approve depreciation rates. In determining appropriate depreciation rates, management is required to make judgments and assumptions about a variety of key factors that are subject to future variability due to inherent uncertainties. These include the following:
| | | | | |
| Key Assumptions | Assessments |
•Whole and remaining asset lives
| •Statistical analysis of historical retirement patterns; •Evaluation of management strategy and its impact on operations and the future use of specific property assets; •Assessment of technological advances; •Engineering estimates of changes in current operations and analysis of historic, current, and projected future usage; •Additional factors considered for track assets: density of traffic and whether rail is new or has been re-laid in a subsequent position; •Assessment of policies and practices for the management of assets including maintenance; and •Comparison with industry data. |
•Salvage values | •Analysis of historical, current, and estimated future salvage values. |
The estimates of economic lives are uncertain and can vary due to changes in any of the assessed factors noted in the table above for whole and remaining asset lives. Additionally, the depreciation rates are updated to reflect the change in residual values of the assets in the class.
It is anticipated that there will be changes in the estimates of weighted-average useful lives and net salvage for each property asset class as assets are acquired, used, and retired. Substantial changes in either the useful lives of properties or the salvage assumptions could result in significant changes to depreciation expense. For example, if the estimated average life of track assets, including rail, ties, ballast, and other track material, increased (or decreased) by one year, annual depreciation expense would decrease (or increase) by approximately $19$33 million.
Due to the capital intensive nature of the railway industry, depreciation represents a significant part of operating expenses. The estimated useful lives of properties have a direct impact on the amount of depreciation recorded as a component of "Properties" on the Company’s Consolidated Balance Sheets.
The fair value of the Concession rights and related assets assigned through the Purchase Price Allocation following the acquisition of KCS and as adjusted through the measurement period, are capitalized and depreciated using the group method of depreciation over the lesser of the current expected concession term, including probable renewal of an additional 50-year term, or the estimated useful lives of the assets and rights. At December 31, 2023, the Concession rights and related assets, net of depreciation and amortization, were $9,079 million.
Management has assessed that the renewal of the Concession for an additional 50-year term is probable based on the terms of the Concession agreement, current Mexican laws, the Company’s performance under the Concession agreement, and the Mexican government’s continued provision of rail services through concessions held by private companies. It is not reasonably likely that the probability of renewal will change in the foreseeable future, however, the Business Acquisition section above provides details of the change in the fair value of the Concession at the Control Date based on a 10% change in probability of renewal. In addition, it is also not reasonably likely based on current Mexican laws, that the renewal term would change.
60 / CPKC 2023 ANNUAL REPORT
However, any change in the renewal term could result in a change in the depreciable lives of the assets and future depreciation expense. For example, if the depreciable life of the Concession rights and related assets, excluding track assets, increased (or decreased) by one year, annual depreciation expense would decrease (or increase) by approximately $2 million. The impact of a one year change in depreciable lives of the Concession’s track assets has been included in the sensitivity discussed above for the Company’s total track assets.
Deferred Income Taxes
The Company accounts for deferred income taxes based on the asset and liability method. This method focuses on the Company’s balance sheet and the temporary differences otherwise calculated from the comparison of book versus tax values. The provision for deferred income taxes arises from temporary differences in the carrying values of assets and liabilities for financial statement and income tax purposes and the effect of loss carryforwards. The provision amount is sensitive to any changes in book and tax values of assets and liabilities and changes toin statutory tax rates. For example, a change in temporary differences of $10 million would result in an approximate deferred income tax change of $3 million.It is assumed that such temporary differences will be settled in the future in the deferred income tax assets and liabilities at the balance sheet date.
In determining deferred income taxes, the Company makes estimates and assumptions regarding deferred income tax matters, including estimating the timing of the realization and settlement of deferred income tax assets (including the benefit of tax losses) and liabilities, and estimating unrecognized tax benefits for uncertain tax positions. Deferred income taxes are calculated using enacted federal, provincial, and state future income tax rates, which may differ in future periods. Additionally, the Company estimates whether taxable income in future periods will be sufficient to fully recognize any deferred income tax assets on a more likely than not basis. Valuation allowances are recorded as appropriate to reduce deferred income tax assets to the amount considered more likely than not to be realized.
Deferred income tax expense is includedreported in "Income“Income tax expense"(recovery) expense” on the Company's Consolidated Statements of Income. At December 31, 2022 and 2021, deferred income tax expense was $136 million and $242 million, respectively. Management does anticipate the total net deferred tax liabilities will change significantly within the next 12 months as a result of the pending business combination with KCS, subject to STB approval. A future fair value remeasurement of the carrying value of the Company's investment in KCS would result in a change in the deferred tax liability recognized in the Company’s income statement. Upon the Company obtaining control, the entire deferred tax liability of $7.5 billion at December 31, 2022, reflecting the outside basis of the investment in KCS, would be reversed through deferred tax expense in the Company’s income statement. Under a business combination, the Company would allocate the purchase price to the individual assets and liabilities assumed, and goodwill would be recognized. A deferred tax liability would be recognized on an inside basis based on the liability method described above with a resultant offsetting increase in goodwill. Additional disclosures are provided in Item 8. Financial Statements and Supplementary Data, Note 56 Income taxes.
Personal Injury and Other Claims Liabilities
The Company estimates the potential liability arising from incidents, claims and pending litigations relating to personal injury claims by employees, third-party claims, certain occupation-related claims, and property damage claims.
Personal Injury
In Canada, employee occupational injuries are governed by provincial workers' compensation legislation. Occupational injury claims in the provinces of Québec, Ontario, Manitoba, and B.C. are self-insured and administered through each Worker's Compensation Board ("WCB"). The future costs related to occupation-related injuries are actuarially determined based on past experience and assumptions associated with the injury, compensation, income replacement, health care, and administrative costs. In the four provinces where the Company is self-insured, a discount rate is applied to the future estimated costs based on market rates for investment-grade corporate bonds to determine the liability. An actuarial study is performed on an annual basis. In the provinces of Saskatchewan and Alberta, the Company is assessed an annual WCB contribution on a premium basis and this amount is not subject to estimation by management. Changes to these assumptions could have a material adverse impact to the Company's results of operations, financial position and liquidity. At December 31, 20222023 and 2021,2022, respectively, the WCB liability was $74$81 million and $77$74 million in "Pension and other benefit liabilities"; $11$12 million and $11 million in "Accounts payable and accrued liabilities", offset by deposits paid to WCB of $1 million and $1 million in "Other assets" on the Company's Consolidated Balance Sheets.
Fluctuations in WCB can result from changes in the discount rate used. A 0.1% increase (decrease) in the discount rate would decrease (increase) the obligation by approximately $1 million.
U.S. railway employees are covered by federal law under the Federal Employers' Liability Act ("FELA") rather than workers' compensation programs. Accruals are set for individual cases based on facts, legal opinion and statistical analysis. U.S. accruals are also set and include alleged occupational exposure or injury.
Mexican railway employees are covered by Instituto Mexicano del Seguro Social (Social Security Institute) ("IMSS"). Similar to the workers’ compensation programs in Alberta and Saskatchewan, the Company is assessed an annual contribution to IMSS on a premium basis and this amount is not subject to estimation by management.
Other Claims
A provision for litigation matters, equipment damages or other claims will beis accrued according to applicable accounting standards and any such accrual will beis based on an ongoing assessment of the strengths and weaknesses of the litigation or claim and its likelihood of success, together with an evaluation of the damages or other monetary relief sought. The Company accrues a reserve for claims for which the risk of loss is probable, claims when the facts of an incident become known and investigation results provide a reasonable basis for estimating the liability. The lower end of the range is accrued if the facts and circumstances permit only a range of reasonable estimates and no single amount in that range is a better estimate than any other. Facts and circumstances related to asserted claims can change, and a process is in place to monitor accruals for changes in accounting estimates. The final outcome with respect to actions
outstanding or pending at December 31, 2022,2023, or with respect to future claims cannot be predicted with certainty. Material
CPKC 2023 ANNUAL REPORT / 61
changes to litigation trends, equipment damages, or other claims could have a material adverse impact to the Company's results of operations, financial position, and liquidity.
Forward-Looking Statements
This Management's Discussion and Analysis of Financial Condition and Results of Operations and Annual Report on Form 10-K contains certain forward-looking statements within the meaning of the United States Private Securities Litigation Reform Act of 1995 and forward-looking information within the meaning of other relevant securities legislation, including applicable securities laws in Canada (collectively referred to herein as "forward-looking statements"). Forward-looking statements typically include words such as “financial expectations”, “key assumptions”, “anticipate”, “believe”, “expect”, “project”, “estimate”, “forecast”, “plan”, “intend”, “target”, “will”, “outlook”, "guidance", “should” or similar words suggesting future outcomes. All statements other than statements of historical fact may be forward-looking statements. To the extent that the Company has provided forecasts or targets using Non-GAAP financial measures, the Company may not be able to provide a reconciliation to a GAAP measure without unreasonable efforts, due to unknown variables and uncertainty related to future results.
This Management's Discussion and Analysis of Financial Condition and Results of Operations and Annual Report on Form 10-K includes forward-looking statements relating, but not limited to statements concerning the Company’s defined benefit pension expectations for 20232024 and through 2026,2027, expected impacts resulting from changes in the U.S.-to-CanadianU.S. dollar and Mexican peso exchange rate,rates relative to the Canadian dollar, and the effective tax rate, as well as statements concerning the Company’s operations, anticipated financial performance, business prospects and strategies, including statements concerning the anticipation that cash flow from operations and various sources of financing will be sufficient to meet debt repayments and obligations in the foreseeable future and concerning anticipated capital programs, statements regarding future payments including income taxes, statements regarding the Company's greenhouse gas ("GHG") emissions targets, our environmental, climate- or other sustainability-related strategies and statements concerninginitiatives and other information regarding environmental, climate- or other sustainability-related actions we plan to take in the pending KCS business combination.future.
The forward-looking statements contained in this Management’s Discussion and Analysis of Financial Condition and Results of Operations and Annual Report on Form 10-K are based on current expectations, estimates, projections and assumptions, having regard to the Company's experience and its perception of historical trends, and includes, but is not limited to, expectations, estimates, projections and assumptions relating to: change in business strategies; North American and global economic growth; commodity demand growth; sustainable industrial and agricultural production; commodity prices and interest rates; foreign exchange rates (as specified herein); effective tax rates (as specified herein); performance of our assets and equipment; sufficiency of our budgeted capital expenditures in carrying out our business plan; geopolitical conditions; applicable laws, regulations and government policies; the availability and cost of labour, services and infrastructure; labour disruptions; and the satisfaction by third parties of their obligations to the Company; and the anticipated impacts of the COVID-19 pandemic on the Company's business, operating results, cash flows and/or financial condition.Company. Although the Company believes the expectations, estimates, projections and assumptions reflected in the forward-looking statements presented herein are reasonable as of the date hereof, there can be no assurance that they will prove to be correct. Current conditions, economic and otherwise, render assumptions, although reasonable when made, subject to greater uncertainty.
With respect to the pending KCS business combination, we can provide no assurance when or if the combination will be completed. Completion of the combination is subject to the receipt of final approval from the STB of the CP-KCS control application by December 31, 2023. There can be no assurance of receipt of this final approval by December 31, 2023. Additionally, even if such final approval is received, there can be no guarantee of the satisfaction of the conditions imposed by the STB in its March 15, 2023 final decision, successful integration of KCS or that the combined company will realize the anticipated benefits of the business combination, whether financial, strategic or otherwise, and this may be exacerbated by changes to the economic, political and global environment in which the merged company will operate.
Our GHG emissions targets are subject to a number of inherent risks, assumptions and uncertainties that include, but are not limited to, changes in carbon markets, evolving sustainability strategies and scientific or technological developments. Additionally, although our data underlying GHG emissions estimates have been internally vetted using accepted and relevant scientific and technical methodologies, historical performance data may become outdated due to a variety of factors, including improvement in our data collection and measuring systems, activities such as joint ventures, mergers and acquisitions or divestitures, and industry-driven changes to methodologies. As a result of these and other factors, we may not achieve our stated targets.
Undue reliance should not be placed on forward-looking statements as actual results may differ materially from those expressed or implied by forward-looking statements. By their nature, forward-looking statements involve numerous inherent risks and uncertainties that could cause actual results to differ materially from the forward-looking statements, including but not limited to the following factors: changes in business strategies; general North American and global economic, credit and business conditions; risks associated with agricultural production such as weather conditions and insect populations; the availability and price of energy commodities; the effects of competition and pricing pressures; industry capacity; shifts in market demand; changes in commodity prices; uncertainty surrounding timing and volumes of commodities being shipped via the Company; inflation; geopolitical instability; changes in laws, regulations and government policies, including regulation of rates; changes in taxes and tax rates; potential increases in maintenance and operating costs; changes in fuel prices; uncertainties of investigations, proceedings or other types of claims and litigation; labour disputes; risks and liabilities arising from derailments; transportation of dangerous goods; timing of completion of capital and maintenance projects; currency and interest rate fluctuations; effects of changes in market conditions and discount rates on the financial position of pension plans and investments; trade restrictions or other changes to international trade arrangements; climate change; various events that could disrupt operations, including severe weather, such as droughts, floods, avalanches, volcanism and earthquakes, and cybersecurity attacks, as well as security threats and governmental response to them, and technological changes; and the pandemic created by the outbreak of COVID-19a pandemic or contagious disease and its variants andthe resulting effects on economic conditions, the demand
environment for logistics requirements and energy prices, restrictions imposed by public health authorities or governments, fiscal and monetary policy responses by governments and financial institutions, and disruptions to global supply chains. The foregoing list of factors is not exhaustive.
There are more specific factors that could cause actual results to differ materially from those described in the forward-looking statements contained in this Management's Discussion and Analysis of Financial Condition and Results of Operations and Annual Report on Form 10-K. These more specific factors are
62 / CPKC 2023 ANNUAL REPORT
identified and discussed in Item 1A. Risk Factors. Other risks are detailed from time to time in reports filed by the Company with securities regulators in Canada and the United States.
The forward-looking statements contained in this Management’s Discussion and Analysis of Financial Condition and Results of Operations and Annual Report on Form 10-K are made as of the date hereof. Except as required by law, the Company undertakes no obligation to update publicly or otherwise revise any forward-looking statements, or the foregoing assumptions and risks affecting such forward-looking statements, whether as a result of new information, future events or otherwise.
63 CP 2022CPKC 2023 ANNUAL REPORT/ 63
ITEM 7A. QUANTITATIVE AND QUALITATIVE DISCLOSURES ABOUT MARKET RISK
Information concerning market risk sensitive instruments is set forth under Item 7. Management’s Discussion and Analysis of Financial Condition and Results of Operations – Impact of Foreign Exchange on Earnings and Foreign Exchange Risk and Impact of Changes in Share Price on Earnings and Stock-Based Compensation.
Interest Rate Risk
Debt financing forms part of the Company's capital structure. The debt agreements entered into expose the Company to increased interest costs on future fixed debt instruments and existing variable rate debt instruments, should market rates increase. As at December 31, 2022,2023, a hypothetical one percentage point change in interest rates on the Company's floating rate debt obligations outstanding is not material. In addition, the present value of the Company’s assets and liabilities will also vary with interest rate changes. To manage interest rate exposure, the Company may enter into forward rate agreements such as treasury rate locks or bond forwards that lock in rates for a future date, thereby protecting against interest rate increases. The Company may also enter into swap agreements whereby one party agrees to pay a fixed rate of interest while the other party pays a floating rate. Contingent on the direction of interest rates, the Company may incur higher costs depending on the contracted rate.
The fair value of the Company’s fixed rate debt may fluctuate with changes in market interest rates. A hypothetical one percentage point decrease in interest rates as of December 31, 2022,2023, would result in an increase of approximately $1.5$1.9 billion to the fair value of the Company's debt as at December 31, 20222023 (December 31, 20212022 - approximately $2.3$1.5 billion). Fair values of the Company’s fixed rate debt are estimated by considering the impact of the hypothetical interest rates on quoted market prices and current borrowing rates, but do not consider other factors that could impact actual results.
Information concerning market risks is supplemented in Item 8. Financial Statements and Supplementary Data, Note 1618 Financial instruments.
64 / CP 2022CPKC 2023 ANNUAL REPORT 64
ITEM 8. FINANCIAL STATEMENTS AND SUPPLEMENTARY DATA
INDEX TO CONSOLIDATED FINANCIAL STATEMENTS
| | | | | |
| Page |
| |
| Reports of Independent Registered Public Accounting Firms (Ernst & Young LLP, PCAOB ID: 1263; Deloitte LLP, PCAOB ID: 1208) | |
| |
| Consolidated Statements of Income | |
For the YearYears Ended December 31, 2023, 2022, 2021, and 20202021 | |
| |
| Consolidated Statements of Comprehensive Income | |
For the YearYears Ended December 31, 2023, 2022, 2021, and 20202021 | |
| |
| Consolidated Balance Sheets | |
As at December 31, 20222023 and 20212022 | |
| |
| Consolidated Statements of Cash Flows | |
For the YearYears Ended December 31, 2023, 2022, 2021, and 20202021 | |
| |
Consolidated Statements of Changes in Shareholders' Equity | |
For the YearYears Ended December 31, 2023, 2022, 2021, and 20202021 | |
| |
| Notes to Consolidated Financial Statements | |
65 CP 2022CPKC 2023 ANNUAL REPORT/ 65
Report of Independent Registered Public Accounting Firm
To the Shareholders and the Board of Directors of Canadian Pacific RailwayKansas City Limited
Opinion on the Financial Statements
We have audited the accompanying consolidated balance sheetsheets of Canadian Pacific RailwayKansas City Limited and its subsidiaries (the "Company") as of December 31, 2023 and 2022, the related consolidated statements of income, comprehensive income, changes in shareholders’ equity and cash flows, for each of the yeartwo years in the period ended December 31, 2022,2023, and the related notes and financial statement schedule listed in the Index at Item 15 (collectively referred to as the "financial"consolidated financial statements"). In our opinion, the consolidated financial statements present fairly, in all material respects, the financial position of the Company as at December 31, 2023 and 2022, and the results of its operations and its cash flows for each of the yeartwo years in the period ended December 31, 2022,2023, in conformity with accounting principles generally accepted in the United States of America (“US GAAP”).
We also have audited, in accordance with the standards of the Public Company Accounting Oversight Board (United States) (“PCAOB”), the Company's internal control over financial reporting as of December 31, 2022,2023, based on criteria established in Internal Control-Integrated Framework issued by the Committee of Sponsoring Organizations of the Treadway Commission framework (2013) and our report dated February 24, 202327, 2024 expressed an unqualified opinion thereon.
Basis for Opinion
These financial statements are the responsibility of the Company's management. Our responsibility is to express an opinion on the Company's financial statements based on our audits. We are a public accounting firm registered with the PCAOB and are required to be independent with respect to the Company in accordance with the U.S. federal securities laws and the applicable rules and regulations of the Securities and Exchange Commission and the PCAOB.
We conducted our audits in accordance with the standards of the PCAOB. Those standards require that we plan and perform the audit to obtain reasonable assurance about whether the financial statements are free of material misstatement, whether due to error or fraud. Our audit included performing procedures to assess the risks of material misstatement of the financial statements, whether due to error or fraud, and performing procedures that respond to those risks. Such procedures included examining, on a test basis, evidence regarding the amounts and disclosures in the financial statements. Our audit also included evaluating the accounting principles used and significant estimates made by management, as well as evaluating the overall presentation of the financial statements. We believe that our audit provides a reasonable basis for our opinion.
Critical Audit Matters
The critical audit matters communicated below are matters arising from the current period audit of the financial statements that were communicated or required to be communicated to the Audit and Finance Committee and that: (1) relate to accounts or disclosures that are material to the financial statements and (2) involved our especially challenging, subjective, or complex judgments. The communication of the critical audit matters does not alter in any way our opinion on the consolidated financial statements, taken as a whole, and we are not, by communicating the critical audit matters below, providing a separate opinion on the critical audit matters or on the accounts or disclosures to which they relate.
Defined Benefit Pension
Description of the Matter
At December 31, 2023, the projected benefit obligation of the Company's defined benefit pension plan was $10,306million, of which the Canadian pension plans represent nearly all the combined pension obligations. As explained in Notes 2 and 23 to the consolidated financial statements, the discount rate used to determine the projected benefit obligation is based on blended market interest rates on high-quality debt instruments with matching cash flows.
Auditing the Canadian projected benefit obligation was complex and required the involvement of specialists due to the magnitude of the projected benefit obligation and judgement applied related to the discount rate used in the measurement process.
How We Addressed the Matter in Our Audit
To test the discount rate for the Canadian projected benefit obligation, our audit procedures included, among others, testing the Company’s internal controls over the assumptions and data used in the determination of the discount rate.
We assessed the competence and objectivity of the qualified actuary engaged by the Company to value the Canadian projected benefit obligation under ASC 715 ‘Compensation Retirement Benefits’.
66 / CPKC 2023 ANNUAL REPORT
We involved an actuarial specialist to assist with our procedures. We evaluated management’s methodology and actuarial assumptions with respect to the determination of the discount rate for the Canadian plans in accordance with actuarial principles and practices under Canadian actuarial standards of practice. We developed an independent estimate of the expected duration of the Canadian plans’ projected benefit cash flows and used other common methodologies to determine the discount rate for the Canadian plans, at the current measurement date, that reflects the maturity and duration of the Canadian expected benefit payments and compared those to the discount rate for the Canadian plans selected by management.
Acquisition of Kansas City Southern
Description of the Matter
As discussed in Note 11 to the consolidated financial statements, on April 14, 2023, the Company assumed control of its investment in Kansas City Southern ("KCS"), which was previously accounted for under the equity method. The transaction was accounted for as a business combination achieved in stages. The Company derecognized its previously held equity method investment in KCS of $44,402 million and remeasured the investment at its fair value of $37,227 million, which formed the purchase consideration for the purchase price allocation (“PPA”).
Auditing the Company’s preliminary PPA was complex given the significant estimation uncertainty in determining the fair value of the previously held investment in KCS, as well as the fair value of acquired trackage rights, and concession rights. The significant estimation uncertainty was primarily due to the sensitivity of the respective fair values to the significant underlying assumptions. The significant assumptions used to estimate the fair value of the previously held investment in KCS included the discount rate, revenue growth rates, earnings before interest, tax, depreciation, and amortization (“EBITDA”) margins, and the terminal EBITDA multiple. The significant assumptions used to estimate the fair value of the trackage rights included discount rates, EBITDA margin, and terminal growth rates. The significant assumptions used to estimate the concession rights included the discount rate, revenue growth rate, EBITDA margin, and the renewal probability of the concession rights. These significant assumptions are forward-looking and could be affected by future economic and market conditions.
How We Addressed the Matter in Our Audit
Our procedures included obtaining an understanding, evaluating the design, and testing the effectiveness of controls over the Company’s business combination process, including controls related to establishing the fair value of the previously held investment in KCS, trackage rights and concession rights acquired.
To test the estimated fair value of the previously held investment in KCS, trackage rights, and concession rights acquired, we performed audit procedures that included, among others, involving our valuation specialists to assist in evaluating the appropriateness of the Company’s valuation methodology and significant assumptions used. For example, we compared projections to historical performance and to available external data. We compared the significant assumptions, including the discount rate, to current industry, market and economic trends and to the Company’s forecasts. In addition, we performed sensitivity analyses on significant assumptions to evaluate the changes in fair value that would result from changes in the assumptions. We tested the completeness and accuracy of the underlying data supporting the significant assumptions.
/s/ Ernst & Young LLP
Chartered Professional Accountants
Calgary, Canada
February 27, 2024
We have served as the Company's auditor since 2021.
CPKC 2023 ANNUAL REPORT / 67
Report of Independent Registered Public Accounting Firm
To the Shareholders and the Board of Directors of Canadian Pacific Kansas City Limited
Opinion on the Financial Statements
We have audited the accompanying consolidated statements of income, comprehensive income, cash flows, and changes in shareholders' equity of Canadian Pacific Kansas City Limited (formerly, Canadian Pacific Railway Limited) and subsidiaries (the "Company"), for the year ended December 31, 2021, and the related notes and the schedule listed in the Index at Item 15 (collectively referred to as the "financial statements"). In our opinion, the financial statements present fairly, in all material respects, the results of the Company’s operations and its cash flows for the year ended December 31, 2021, in conformity with accounting principles generally accepted in the United States of America ("US GAAP").
Basis for Opinion
These financial statements are the responsibility of the Company's management. Our responsibility is to express an opinion on the Company's financial statements based on our audit. We are a public accounting firm registered with the PCAOB and are required to be independent with respect to the Company in accordance with the U.S. federal securities laws and the applicable rules and regulations of the Securities and Exchange Commission and the PCAOB.
We conducted our audit in accordance with the standards of the PCAOB. Those standards require that we plan and perform the audit to obtain reasonable assurance about whether the financial statements are free of material misstatement, whether due to error or fraud. Our audit included performing procedures to assess the risks of material misstatement of the financial statements, whether due to error or fraud, and performing procedures that respond to those risks. Such procedures included examining, on a test basis, evidence regarding the amounts and disclosures in the financial statements. Our audit also included evaluating the accounting principles used and significant estimates made by management, as well as evaluating the overall presentation of the financial statements. We believe that our audit provides a reasonable basis for our opinion.
Critical Audit Matters
The critical audit matter communicated below is a matter arising from the current period audit of the financial statements that was communicated or required to be communicated to the Audit and Finance Committee and that: (1) relates to accounts or disclosures that are material to the financial statements and (2) involved especially challenging, subjective, or complex judgments. The communication of the critical audit matter does not alter in any way our opinion on the consolidated financial statements, taken as a whole, and we are not, by communicating the critical audit matter below, providing separate opinions on the critical audit matter or on the accounts or disclosures to which it relates.
Description of the Matter
At December 31, 2022, the projected benefit obligation of the Company's defined benefit pension plans was $9,936 million, of which the Canadian pension plans represent nearly all the combined pension obligations. As explained in Notes 1 and 21 to the consolidated financial statements, the discount rate used to determine the projected benefit obligation is based on blended market interest rates on high-quality debt instruments with matching cash flows.
Auditing the Canadian projected benefit obligation was complex and required the involvement of specialists due to the magnitude of the projected benefit obligation and judgement applied related to the discount rate used in the measurement process.
How We Addressed the Matter in Our Audit
To test the discount rate for the Canadian projected benefit obligation, our audit procedure included, among others, testing the Company’s internal controls over the assumptions and data used in the determination of the discount rate.
We assessed the competence and objectivity of the qualified actuary engaged by the Company to value the Canadian projected benefit obligation under ASC 715 ‘Compensation Retirement Benefits’.
We involved an actuarial specialist to assist with our procedures. We evaluated management’s methodology and actuarial assumptions with respect to the determination of the discount rate for the Canadian plans in accordance with actuarial principles and practices under Canadian actuarial standards of practice. We developed an independent estimate of the expected duration of the Canadian plans’ projected benefit cash flows and used other common
methodologies to determine the discount rate for the Canadian plans, at the current measurement date, that reflects the maturity and duration of the Canadian expected benefit payments and compared those to the discount rate for the Canadian plans selected by management.
/s/ Ernst & Young LLP
Chartered Professional Accountants
Calgary, Canada
February 24, 2023
We have served as the Company's auditor since 2021
Report of Independent Registered Public Accounting Firm
To the Shareholders and the Board of Directors of Canadian Pacific Railway Limited
Opinion on the Financial Statements
We have audited the accompanying consolidated balance sheet of Canadian Pacific Railway Limited and subsidiaries (the "Company") as of December 31, 2021, the related consolidated statements of income, comprehensive income, cash flows, and changes in shareholders' equity, for each of the two years in the period ended December 31, 2021, and the related notes and the schedule listed in the Index at Item 15 (collectively referred to as the "financial statements"). In our opinion, the financial statements present fairly, in all material respects, the financial position of the Company as of December 31, 2021, and the results of its operations and its cash flows for each of the two years in the period ended December 31, 2021, in conformity with accounting principles generally accepted in the United States of America ("US GAAP").
Basis for Opinion
These financial statements are the responsibility of the Company's management. Our responsibility is to express an opinion on the Company's financial statements based on our audits. We are a public accounting firm registered with the PCAOB and are required to be independent with respect to the Company in accordance with the U.S. federal securities laws and the applicable rules and regulations of the Securities and Exchange Commission and the PCAOB.
We conducted our audits in accordance with the standards of the PCAOB. Those standards require that we plan and perform the audit to obtain reasonable assurance about whether the financial statements are free of material misstatement, whether due to error or fraud. Our audits included performing procedures to assess the risks of material misstatement of the financial statements, whether due to error or fraud, and performing procedures that respond to those risks. Such procedures included examining, on a test basis, evidence regarding the amounts and disclosures in the financial statements. Our audits also included evaluating the accounting principles used and significant estimates made by management, as well as evaluating the overall presentation of the financial statements. We believe that our audits provide a reasonable basis for our opinion.
/s/ Deloitte LLP
Chartered Professional Accountants
Calgary, Canada
February 23, 2022
We began serving as the Company's auditor in 2011. In 2022 we became the predecessor auditor.
68 / CP 2022CPKC 2023 ANNUAL REPORT 68
CONSOLIDATED STATEMENTS OF INCOME
| | | | | | | | | | | |
| Year ended December 31 (in millions of Canadian dollars, except share and per share data) | 2022 | 2021 | 2020 |
| Revenues (Note 3) | | | |
| Freight | $ | 8,627 | | $ | 7,816 | | $ | 7,541 | |
| Non-freight | 187 | | 179 | | 169 | |
| Total revenues | 8,814 | | 7,995 | | 7,710 | |
| Operating expenses | | | |
| Compensation and benefits (Note 21, 22) | 1,570 | | 1,570 | | 1,560 | |
| Fuel | 1,400 | | 854 | | 652 | |
| Materials | 260 | | 215 | | 216 | |
| Equipment rents | 140 | | 121 | | 142 | |
| Depreciation and amortization | 853 | | 811 | | 779 | |
| Purchased services and other (Note 9, 10) | 1,262 | | 1,218 | | 1,050 | |
| Total operating expenses | 5,485 | | 4,789 | | 4,399 | |
| Operating income | 3,329 | | 3,206 | | 3,311 | |
| Less: | | | |
| Equity (earnings) loss of Kansas City Southern (Note 10) | (1,074) | | 141 | | — | |
| Other expense (income) (Note 4, 10) | 17 | | 237 | | (7) | |
| Merger termination fee (Note 10) | — | | (845) | | — | |
| Other components of net periodic benefit recovery (Note 21) | (411) | | (387) | | (342) | |
| Net interest expense | 652 | | 440 | | 458 | |
| Income before income tax expense | 4,145 | | 3,620 | | 3,202 | |
| Income tax expense (Note 5) | 628 | | 768 | | 758 | |
| Net income | $ | 3,517 | | $ | 2,852 | | $ | 2,444 | |
| Earnings per share (Note 6) | | | |
| Basic earnings per share | $ | 3.78 | | $ | 4.20 | | $ | 3.61 | |
| Diluted earnings per share | $ | 3.77 | | $ | 4.18 | | $ | 3.59 | |
| Weighted-average number of shares (millions) (Note 6) | | | |
| Basic | 930.0 | | 679.7 | | 677.2 | |
| Diluted | 932.9 | | 682.8 | | 679.9 | |
See Notes to Consolidated Financial Statements.
CONSOLIDATED STATEMENTS OF COMPREHENSIVE INCOME
| | | | | | | | | | | |
| Year ended December 31 (in millions of Canadian dollars) | 2022 | 2021 | 2020 |
| Net income | $ | 3,517 | | $ | 2,852 | | $ | 2,444 | |
| Net gain (loss) in foreign currency translation adjustments, net of hedging activities | 1,628 | | (291) | | 18 | |
| Change in derivatives designated as cash flow hedges | 6 | | 48 | | 10 | |
| Change in pension and post-retirement defined benefit plans | 680 | | 1,286 | | (407) | |
| Equity accounted investments | (5) | | 9 | | (1) | |
| Other comprehensive income (loss) before income taxes | 2,309 | | 1,052 | | (380) | |
| Income tax (expense) recovery on above items | (115) | | (341) | | 88 | |
| Other comprehensive income (loss) (Note 7) | 2,194 | | 711 | | (292) | |
| Comprehensive income | $ | 5,711 | | $ | 3,563 | | $ | 2,152 | |
| | | | | | | | | | | |
| Year ended December 31 (in millions of Canadian dollars, except share and per share data) | 2023 | 2022 | 2021 |
| Revenues (Note 4) | | | |
| Freight | $ | 12,281 | | $ | 8,627 | | $ | 7,816 | |
| Non-freight | 274 | | 187 | | 179 | |
| Total revenues | 12,555 | | 8,814 | | 7,995 | |
| Operating expenses | | | |
| Compensation and benefits (Note 11, 23, 24) | 2,332 | | 1,570 | | 1,570 | |
| Fuel | 1,681 | | 1,400 | | 854 | |
| Materials (Note 11) | 346 | | 260 | | 215 | |
| Equipment rents | 277 | | 140 | | 121 | |
| Depreciation and amortization (Note 11, 13, 15) | 1,543 | | 853 | | 811 | |
| Purchased services and other (Note 10, 11, 26) | 1,988 | | 1,262 | | 1,218 | |
| Total operating expenses | 8,167 | | 5,485 | | 4,789 | |
| Operating income | 4,388 | | 3,329 | | 3,206 | |
| Less: | | | |
| Equity (earnings) loss of Kansas City Southern (Note 11, 12) | (230) | | (1,074) | | 141 | |
| Other expense (Note 5, 11) | 52 | | 17 | | 237 | |
| Merger termination fee (Note 11) | — | | — | | (845) | |
| Other components of net periodic benefit recovery (Note 23) | (327) | | (411) | | (387) | |
| Net interest expense (Note 11) | 771 | | 652 | | 440 | |
| Remeasurement loss of Kansas City Southern (Note 11) | 7,175 | | — | | — | |
| (Loss) income before income tax (recovery) expense | (3,053) | | 4,145 | | 3,620 | |
| Less: | | | |
| Current income tax expense (Note 6) | 909 | | 492 | | 526 | |
| Deferred income tax (recovery) expense (Note 6) | (7,885) | | 136 | | 242 | |
| Income tax (recovery) expense (Note 6) | (6,976) | | 628 | | 768 | |
| Net income | $ | 3,923 | | $ | 3,517 | | $ | 2,852 | |
| Less: Net loss attributable to non-controlling interest (Note 11) | (4) | | — | | — | |
| Net income attributable to controlling shareholders | $ | 3,927 | | $ | 3,517 | | $ | 2,852 | |
| Earnings per share (Note 7) | | | |
| Basic earnings per share | $ | 4.22 | | $ | 3.78 | | $ | 4.20 | |
| Diluted earnings per share | $ | 4.21 | | $ | 3.77 | | $ | 4.18 | |
| Weighted-average number of shares (millions) (Note 7) | | | |
| Basic | 931.3 | | 930.0 | | 679.7 | |
| Diluted | 933.7 | | 932.9 | | 682.8 | |
See Notes to Consolidated Financial Statements.
CP 2022CPKC 2023 ANNUAL REPORT 70/ 69
CONSOLIDATED STATEMENTS OF COMPREHENSIVE INCOME
| | | | | | | | | | | |
| Year ended December 31 (in millions of Canadian dollars) | 2023 | 2022 | 2021 |
| Net income | $ | 3,923 | | $ | 3,517 | | $ | 2,852 | |
| Net (loss) gain in foreign currency translation adjustments, net of hedging activities | (655) | | 1,628 | | (291) | |
| Change in derivatives designated as cash flow hedges | 7 | | 6 | | 48 | |
| Change in pension and post-retirement defined benefit plans | (73) | | 680 | | 1,286 | |
| Other comprehensive income (loss) from equity investees | 7 | | (5) | | 9 | |
| Other comprehensive (loss) income before income taxes | (714) | | 2,309 | | 1,052 | |
| Income tax expense on above items | (4) | | (115) | | (341) | |
| Other comprehensive (loss) income (Note 8) | (718) | | 2,194 | | 711 | |
| Comprehensive income | $ | 3,205 | | $ | 5,711 | | $ | 3,563 | |
| Comprehensive loss attributable to the non-controlling interest | (13) | | — | | — | |
| Comprehensive income attributable to controlling shareholders | $ | 3,218 | | $ | 5,711 | | $ | 3,563 | |
See Notes to Consolidated Financial Statements.
70 / CPKC 2023 ANNUAL REPORT
CONSOLIDATED BALANCE SHEETS
| | | | | | | | |
| As at December 31 (in millions of Canadian dollars, except Common Shares) | 2022 | 2021 |
| Assets | | |
| Current assets | | |
| Cash and cash equivalents | $ | 451 | | $ | 69 | |
| Restricted cash and cash equivalents | — | | 13 | |
| Accounts receivable, net (Note 8) | 1,016 | | 819 | |
| Materials and supplies | 284 | | 235 | |
| Other current assets | 138 | | 216 | |
| 1,889 | | 1,352 | |
| Investment in Kansas City Southern (Note 11) | 45,091 | | 42,309 | |
| Investments | 223 | | 209 | |
| Properties (Note 12, 18) | 22,385 | | 21,200 | |
| Goodwill and intangible assets (Note 10, 13) | 386 | | 371 | |
| Pension asset (Note 21) | 3,101 | | 2,317 | |
| Other assets (Note 18) | 420 | | 419 | |
| Total assets | $ | 73,495 | | $ | 68,177 | |
| Liabilities and shareholders’ equity | | |
| Current liabilities | | |
| Accounts payable and accrued liabilities (Note 14, 18) | $ | 1,703 | | $ | 1,609 | |
| Long-term debt maturing within one year (Note 15, 16, 18) | 1,510 | | 1,550 | |
| 3,213 | | 3,159 | |
| Pension and other benefit liabilities (Note 21) | 538 | | 718 | |
| Other long-term liabilities (Note 17, 18) | 520 | | 542 | |
| Long-term debt (Note 15, 16, 18) | 18,141 | | 18,577 | |
| Deferred income taxes (Note 5) | 12,197 | | 11,352 | |
| Total liabilities | 34,609 | | 34,348 | |
| Shareholders’ equity | | |
Share capital (Note 19) Authorized unlimited Common Shares without par value. Issued and outstanding are 930.5 million and 929.7 million as at December 31, 2022 and 2021, respectively. | 25,516 | | 25,475 | |
| Authorized unlimited number of first and second preferred shares; none outstanding. | | |
| Additional paid-in capital | 78 | | 66 | |
| Accumulated other comprehensive income (loss) (Note 7) | 91 | | (2,103) | |
| Retained earnings | 13,201 | | 10,391 | |
| 38,886 | | 33,829 | |
| Total liabilities and shareholders’ equity | $ | 73,495 | | $ | 68,177 | |
| | | | | | | | |
| As at December 31 (in millions of Canadian dollars, except Common Shares) | 2023 | 2022 |
| Assets | | |
| Current assets | | |
| Cash and cash equivalents | $ | 464 | | $ | 451 | |
| | |
| Accounts receivable, net (Note 9) | 1,887 | | 1,016 | |
| | |
| Materials and supplies | 400 | | 284 | |
| Other current assets | 251 | | 138 | |
| 3,002 | | 1,889 | |
| Investment in Kansas City Southern (Note 12) | — | | 45,091 | |
| Investments | 533 | | 223 | |
| Properties (Note 13, 20) | 51,744 | | 22,385 | |
| Goodwill (Note 11, 14) | 17,729 | | 344 | |
| Intangible assets (Note 11, 15) | 2,974 | | 42 | |
| Pension asset (Note 23) | 3,338 | | 3,101 | |
| Other assets (Note 20) | 582 | | 420 | |
| Total assets | $ | 79,902 | | $ | 73,495 | |
| Liabilities and equity | | |
| Current liabilities | | |
| Accounts payable and accrued liabilities (Note 16, 20) | $ | 2,567 | | $ | 1,703 | |
| Long-term debt maturing within one year (Note 17, 18, 20) | 3,143 | | 1,510 | |
| 5,710 | | 3,213 | |
| Pension and other benefit liabilities (Note 23) | 581 | | 538 | |
| Other long-term liabilities (Note 19, 20) | 797 | | 520 | |
| Long-term debt (Note 17, 18, 20) | 19,351 | | 18,141 | |
| Deferred income taxes (Note 6) | 11,052 | | 12,197 | |
| Total liabilities | 37,491 | | 34,609 | |
| Shareholders’ equity | | |
Share capital (Note 21) Authorized unlimited Common Shares without par value. Issued and outstanding are 932.1 million and 930.5 million as at December 31, 2023 and 2022, respectively. | 25,602 | | 25,516 | |
| Authorized unlimited number of first and second preferred shares; none outstanding. | | |
| Additional paid-in capital | 88 | | 78 | |
| Accumulated other comprehensive (loss) income (Note 8) | (618) | | 91 | |
| Retained earnings | 16,420 | | 13,201 | |
| 41,492 | | 38,886 | |
| Non-controlling interest (Note 11) | 919 | | — | |
| Total equity | 42,411 | | 38,886 | |
| Total liabilities and equity | $ | 79,902 | | $ | 73,495 | |
Certain comparative figures have been reclassified to conform to the current year's presentation (Note 11).
See Commitments and contingencies (Note 24)26).
See Notes to Consolidated Financial Statements.
| | | | | | | | | | | | | | | | | | | | | | | | | | |
| Approved on behalf of the Board: | | | | | | | | |
| | /s/ ISABELLE COURVILLE | | | /s/ JANE L. PEVERETT |
| | Isabelle Courville, Director, | | | Jane L. Peverett, Director, |
| | Chair of the Board | | | Chair of the Audit and Finance Committee |
71 CP 2022CPKC 2023 ANNUAL REPORT/ 71
CONSOLIDATED STATEMENTS OF CASH FLOWS
| | | | | | | | | | | |
| Year ended December 31 (in millions of Canadian dollars) | 2023 | 2022 | 2021 |
| Operating activities | | | |
| Net income | $ | 3,923 | | $ | 3,517 | | $ | 2,852 | |
| Reconciliation of net income to cash provided by operating activities: | | | |
| Depreciation and amortization | 1,543 | | 853 | | 811 | |
| Deferred income tax (recovery) expense (Note 6) | (7,885) | | 136 | | 242 | |
| Pension recovery and funding (Note 23) | (306) | | (288) | | (249) | |
| Equity (earnings) loss of Kansas City Southern (Note 11, 12) | (230) | | (1,074) | | 141 | |
| Foreign exchange gain on debt and lease liabilities (Note 5) | — | | — | | (7) | |
| Remeasurement loss of Kansas City Southern (Note 11) | 7,175 | | — | | — | |
| Dividends from Kansas City Southern (Note 12) | 300 | | 1,157 | | — | |
| Settlement of Mexican tax audits (Note 6) | (135) | | — | | — | |
| Other operating activities, net | 60 | | (67) | | (36) | |
| Change in non-cash working capital balances related to operations (Note 22) | (308) | | (92) | | (66) | |
| Cash provided by operating activities | 4,137 | | 4,142 | | 3,688 | |
| Investing activities | | | |
| Additions to properties | (2,468) | | (1,557) | | (1,532) | |
| Additions to Meridian Speedway properties | (31) | | — | | — | |
| Investment in Kansas City Southern (Note 11) | — | | — | | (12,299) | |
| | | |
| | | |
| Proceeds from sale of properties and other assets | 57 | | 58 | | 96 | |
| Cash acquired on control of Kansas City Southern (Note 11) | 298 | | — | | — | |
| Investment in government securities (Note 17) | (267) | | — | | — | |
| Proceeds from settlement of government securities (Note 17) | 274 | | — | | — | |
| Other | (25) | | 3 | | 5 | |
| Cash used in investing activities | (2,162) | | (1,496) | | (13,730) | |
| Financing activities | | | |
| Dividends paid | (707) | | (707) | | (507) | |
| Issuance of Common Shares (Note 21) | 69 | | 32 | | 25 | |
| | | |
| Issuance of long-term debt, excluding commercial paper (Note 17) | — | | — | | 10,673 | |
| Repayment of long-term debt, excluding commercial paper (Note 17) | (2,395) | | (571) | | (359) | |
| Proceeds from term loan (Note 17) | — | | — | | 633 | |
| Repayment of term loan (Note 17) | — | | (636) | | — | |
| Net issuance (repayment) of commercial paper (Note 17) | 1,095 | | (415) | | (454) | |
| | | |
| Acquisition-related financing fees (Note 11) | (17) | | — | | (51) | |
| Other | — | | — | | (24) | |
| Cash (used in) provided by financing activities | (1,955) | | (2,297) | | 9,936 | |
| Effect of foreign currency fluctuations on foreign-denominated cash and cash equivalents | (7) | | 20 | | 41 | |
| Cash position | | | |
| Increase (decrease) in cash and cash equivalents | 13 | | 369 | | (65) | |
Cash and cash equivalents at beginning of period(1) | 451 | | 82 | | 147 | |
| Cash and cash equivalents at end of year | $ | 464 | | $ | 451 | | $ | 82 | |
| | | |
| Supplemental disclosures of cash flow information: | | | |
| Income taxes paid | $ | 906 | | $ | 408 | | $ | 552 | |
| Interest paid | $ | 825 | | $ | 641 | | $ | 426 | |
(1) As at January 1, 2022, cash and cash equivalents of $82 million includes $13 million of restricted cash.
See Notes to Consolidated Financial Statements.
| | | | | | | | | | | |
| Year ended December 31 (in millions of Canadian dollars) | 2022 | 2021 | 2020 |
| Operating activities | | | |
| Net income | $ | 3,517 | | $ | 2,852 | | $ | 2,444 | |
| Reconciliation of net income to cash provided by operating activities: | | | |
| Depreciation and amortization | 853 | | 811 | | 779 | |
| Deferred income tax expense (Note 5) | 136 | | 242 | | 221 | |
| Pension recovery and funding (Note 21) | (288) | | (249) | | (250) | |
| Equity (earnings) loss of Kansas City Southern (Note 10) | (1,074) | | 141 | | — | |
| Foreign exchange gain on debt and lease liabilities (Note 4) | — | | (7) | | (14) | |
| Dividends from Kansas City Southern (Note 10) | 1,157 | | — | | — | |
| Other operating activities, net | (67) | | (36) | | 11 | |
| Change in non-cash working capital balances related to operations (Note 20) | (92) | | (66) | | (389) | |
| Cash provided by operating activities | 4,142 | | 3,688 | | 2,802 | |
| Investing activities | | | |
| Additions to properties | (1,557) | | (1,532) | | (1,671) | |
| Investment in Kansas City Southern (Note 10) | — | | (12,299) | | — | |
| Investment in Detroit River Tunnel Partnership (Note 10) | — | | — | | (398) | |
| Investment in Central Maine & Québec Railway | — | | — | | 19 | |
| Proceeds from sale of properties and other assets | 58 | | 96 | | 22 | |
| Other | 3 | | 5 | | (2) | |
| Cash used in investing activities | (1,496) | | (13,730) | | (2,030) | |
| Financing activities | | | |
| Dividends paid | (707) | | (507) | | (467) | |
| Issuance of Common Shares (Note 22) | 32 | | 25 | | 52 | |
| Purchase of Common shares (Note 19) | — | | — | | (1,509) | |
| Issuance of long-term debt, excluding commercial paper (Note 15) | — | | 10,673 | | 958 | |
| Repayment of long-term debt, excluding commercial paper (Note 15) | (571) | | (359) | | (84) | |
| Proceeds from term loan (Note 15) | — | | 633 | | — | |
| Repayment of term loan (Note 15) | (636) | | — | | — | |
| Net (repayment) issuance of commercial paper (Note 15) | (415) | | (454) | | 270 | |
| Net increase in short-term borrowings | — | | — | | 5 | |
| Acquisition-related financing fees (Note 10) | — | | (51) | | — | |
| Other | — | | (24) | | 11 | |
| Cash (used in) provided by financing activities | (2,297) | | 9,936 | | (764) | |
| Effect of foreign currency fluctuations on U.S. dollar-denominated cash and cash equivalents | 20 | | 41 | | 6 | |
| Cash position | | | |
| Increase (decrease) in cash, cash equivalents and restricted cash | 369 | | (65) | | 14 | |
| Cash, cash equivalents and restricted cash at beginning of year | 82 | | 147 | | 133 | |
| Cash, cash equivalents and restricted cash at end of year | $ | 451 | | $ | 82 | | $ | 147 | |
| | | |
| Supplemental disclosures of cash flow information: | | | |
| Income taxes paid | $ | 408 | | $ | 552 | | $ | 582 | |
| Interest paid | $ | 641 | | $ | 426 | | $ | 443 | |
CONSOLIDATED STATEMENTS OF CHANGES IN EQUITY
| | | | | | | | | | | | | | | | | | | | | | | |
| (in millions of Canadian dollars, except per share data) | Share
capital | Additional
paid-in
capital | Accumulated
other
comprehensive
(loss) income | Retained
earnings | Total
shareholders’
equity | Non-controlling interest | Total equity |
| Balance as at December 31, 2020 | $ | 1,983 | | $ | 55 | | $ | (2,814) | | $ | 8,095 | | $ | 7,319 | | $ | — | | $ | 7,319 | |
| | | | | | | |
| | | | | | | |
| Net income | — | | — | | — | | 2,852 | | 2,852 | | — | | 2,852 | |
| Other comprehensive income (Note 8) | — | | — | | 711 | | — | | 711 | | — | | 711 | |
| Dividends declared ($0.76 per share) | — | | — | | — | | (556) | | (556) | | — | | (556) | |
| Effect of stock-based compensation expense | — | | 23 | | — | | — | | 23 | | — | | 23 | |
| Shares issued for Kansas City Southern acquisition (Note 21) | 23,461 | | (5) | | — | | — | | 23,456 | | — | | 23,456 | |
| Shares issued under stock option plan (Note 21) | 31 | | (7) | | — | | — | | 24 | | — | | 24 | |
| Balance as at December 31, 2021 | 25,475 | | 66 | | (2,103) | | 10,391 | | 33,829 | | — | | 33,829 | |
| | | | | | | |
| | | | | | | |
| Net income | — | | — | | — | | 3,517 | | 3,517 | | — | | 3,517 | |
| Other comprehensive income (Note 8) | — | | — | | 2,194 | | — | | 2,194 | | — | | 2,194 | |
| Dividends declared ($0.76 per share) | — | | — | | — | | (707) | | (707) | | — | | (707) | |
| Effect of stock-based compensation expense | — | | 23 | | — | | — | | 23 | | — | | 23 | |
| Shares issued for Kansas City Southern acquisition (Note 21) | — | | (2) | | — | | — | | (2) | | — | | (2) | |
| Shares issued under stock option plan (Note 21) | 41 | | (9) | | — | | — | | 32 | | — | | 32 | |
| Balance as at December 31, 2022 | 25,516 | | 78 | | 91 | | 13,201 | | 38,886 | | — | | 38,886 | |
| Net income (loss) | — | | — | | — | | 3,927 | | 3,927 | | (4) | | 3,923 | |
| Other comprehensive loss (Note 8) | — | | — | | (709) | | — | | (709) | | (9) | | (718) | |
| Dividends declared ($0.76 per share) | — | | — | | — | | (708) | | (708) | | — | | (708) | |
| Effect of stock-based compensation expense | — | | 27 | | — | | — | | 27 | | — | | 27 | |
| | | | | | | |
| | | | | | | |
| Shares issued under stock option plan (Note 21) | 86 | | (17) | | — | | — | | 69 | | — | | 69 | |
| Non-controlling interest in connection with business acquisition (Note 11) | — | | — | | — | | — | | — | | 932 | | 932 | |
| Balance as at December 31, 2023 | $ | 25,602 | | $ | 88 | | $ | (618) | | $ | 16,420 | | $ | 41,492 | | $ | 919 | | $ | 42,411 | |
See Notes to Consolidated Financial Statements.
CP 2022CPKC 2023 ANNUAL REPORT 72/ 73
CONSOLIDATED STATEMENTS OF CHANGES IN SHAREHOLDERS’ EQUITY
| | | | | | | | | | | | | | | | | |
| (in millions of Canadian dollars, except per share data) | Share
capital | Additional
paid-in
capital | Accumulated
other
comprehensive
income (loss) | Retained
earnings | Total
shareholders’
equity |
| Balance at December 31, 2019 | $ | 1,993 | | $ | 48 | | $ | (2,522) | | $ | 7,550 | | $ | 7,069 | |
Impact of accounting change(1) | — | | — | | — | | (1) | | (1) | |
| Balance at January 1, 2020, as restated | 1,993 | | 48 | | (2,522) | | 7,549 | | 7,068 | |
| Net income | — | | — | | — | | 2,444 | | 2,444 | |
| Other comprehensive loss (Note 7) | — | | — | | (292) | | — | | (292) | |
| Dividends declared ($0.712 per share) | — | | — | | — | | (479) | | (479) | |
| Effect of stock-based compensation expense | — | | 17 | | — | | — | | 17 | |
| Common Shares repurchased (Note 19) | (58) | | — | | — | | (1,419) | | (1,477) | |
| Shares issued under stock option plan (Note 19) | 48 | | (10) | | — | | — | | 38 | |
| Balance at December 31, 2020 | 1,983 | | 55 | | (2,814) | | 8,095 | | 7,319 | |
| | | | | |
| | | | | |
| Net income | — | | — | | — | | 2,852 | | 2,852 | |
| Other comprehensive income (Note 7) | — | | — | | 711 | | — | | 711 | |
| Dividends declared ($0.760 per share) | — | | — | | — | | (556) | | (556) | |
| Effect of stock-based compensation expense | — | | 23 | | — | | — | | 23 | |
| Shares issued for Kansas City Southern acquisition (Note 10, 19) | 23,461 | | (5) | | — | | — | | 23,456 | |
| Shares issued under stock option plan (Note 19) | 31 | | (7) | | — | | — | | 24 | |
| Balance as at December 31, 2021 | 25,475 | | 66 | | (2,103) | | 10,391 | | 33,829 | |
| Net income | — | | — | | — | | 3,517 | | 3,517 | |
| Other comprehensive income (Note 7) | — | | — | | 2,194 | | — | | 2,194 | |
| Dividends declared ($0.760 per share) | — | | — | | — | | (707) | | (707) | |
| Effect of stock-based compensation expense | — | | 23 | | — | | — | | 23 | |
| | | | | |
| Shares issued for Kansas City Southern acquisition (Note 10, 19) | — | | (2) | | — | | — | | (2) | |
| Shares issued under stock option plan (Note 19) | 41 | | (9) | | — | | — | | 32 | |
| Balance as at December 31, 2022 | $ | 25,516 | | $ | 78 | | $ | 91 | | $ | 13,201 | | $ | 38,886 | |
(1) Impact of the adoption of Accounting Standards Update ("ASU") 2016-13, Financial Instruments - Credit Losses (Topic 326) on January 1, 2020.
See Notes to Consolidated Financial Statements.
CANADIAN PACIFIC RAILWAYKANSAS CITY LIMITED
Notes to Consolidated Financial Statements
December 31, 20222023
1. Description of the business
The terms "CPKC", “the Company”, “our”, or “us” in these Consolidated Financial Statements refer to Canadian Pacific RailwayKansas City Limited (“CPRL”), throughand its subsidiaries (collectively referred to as “CP” or “the Company”),unless the context suggests otherwise.
CPKC owns and operates a transcontinental freight railway inspanning Canada, and the United States ("U.S."). The Company, and Mexico. CPKC provides rail and intermodal transportation services over a network of approximately 13,00020,000 miles, serving the principal business centres ofacross Canada, from Montréal, Québec, to Vancouver, British Columbia, and the U.S. Northeast and Midwest regions. The Company’s railway network feeds directly into the U.S. heartland from the East and West coasts. Agreements with other carriers extend the Company’s market reach in Canada, throughout the U.S. and into Mexico. The Company transports bulk commodities, merchandise freight and intermodal traffic. Bulk commoditiesfreight. CPKC's Common Shares trade on the Toronto Stock Exchange and New York Stock Exchange under the symbol “CP”.
Acquisition of Kansas City Southern
On April 14, 2023, Canadian Pacific Railway Limited (“CPRL") assumed control of Kansas City Southern ("KCS") through an indirect wholly-owned subsidiary, and filed articles of amendment to change CPRL's name to Canadian Pacific Kansas City Limited ("CPKC"). These Consolidated Financial Statements include grain, coal, fertilizersKCS as a consolidated subsidiary from April 14, 2023. For the period beginning on December 14, 2021 and sulphur. Merchandise freight consists of finished vehiclesending on April 13, 2023 the Company's 100% interest in KCS was accounted for and automotive parts,reported as well as forest, industrialan equity-method investment (see Notes 11 and consumer products. Intermodal traffic consists largely of retail goods in overseas containers that can be transported by train, ship and truck, and in domestic containers and trailers that can be moved by train and truck.12).
1.2. Summary of significant accounting policies
Accounting principles generally accepted in the United StatesBasis of America (“GAAP”)presentation
These Consolidated Financial Statements are prepared in accordance with accounting principles generally accepted in the U.S. ("GAAP"). Amounts are expressed in Canadian dollars, and have been preparedunless otherwise noted. Certain comparative figures in accordance with GAAP.
Principles of consolidation
Thesethese Consolidated Financial Statements include the accounts of the Company. The Company’s investments in which it has significant influence are accounted for using the equity method. Distributions received from equity method investees are classified using the nature of the distribution approach for cash flow presentation purposes, whereby distributions received are classified based on the nature of the activity or activities of the investee that generated the distribution as either a return on investment (classified as a cash inflow from operating activities) or a return of investment (classified as a cash inflow from investing activities). All intercompany accounts and transactions have been eliminated.
Common stock split
On April 21, 2021,reclassified to conform to the Company's shareholders approved a five-for-one stock split to shareholders of record as of May 5, 2021. Proportional adjustments were made to all outstanding awards under the Company's stock-based compensation plans in order to reflect the share split. All share and per share amounts have been retroactively adjusted to reflect the impact of the stock split.current year's presentation.
Use of estimates and judgements
The preparation of these Consolidated Financial Statementsfinancial statements in conformity with GAAP requires management to makeexercise its judgement in applying the Company's accounting policies. It also requires the use of accounting estimates and assumptions that affect the reported amounts of revenues and expenses during the year, the reported amounts of assets and liabilities andat the date of the Consolidated Financial Statements, disclosure of contingent assets and liabilities at the date of the consolidated financial statements. Management regularly reviews itsConsolidated Financial Statements, and reported amounts of revenues and expenses during the reporting periods. Although these estimates including those related to environmental liabilities, pensionsare based on management's best knowledge of current events and other benefits, depreciable lives of properties, deferred income tax assets and liabilities, as well as legal and personal injury liabilities based upon currently available information. Actualactions, actual results couldmay ultimately differ from thesethose estimates.
Revenue recognitionCritical estimates and judgements made by management relate to:
•Deferred income taxes (Note 6);
•Business acquisitions (Note 11);
•Properties (Note 13);
•Goodwill (Note 14);
•Intangible assets (Note 15);
•Provision for environmental remediation (Note 19);
•Pension and other benefits (Note 23); and
•Legal claims (Note 26).
Principles of consolidation
The financial statements of subsidiaries are included in these Consolidated Financial Statements from the date control commences until the date control ceases. Intercompany accounts and transactions are eliminated. Third party ownership interests in the Company's subsidiaries are presented in the Consolidated Financial Statements as activities and amounts attributable to non-controlling interests.
Revenues
Revenue is recognized when control of promised services is transferred to the customerare delivered and obligations under the terms of a contract with a customer are satisfied. Revenue is measured as the amount of consideration the Company expects to receive in exchange for providing services. Government imposed taxes that the Company collects concurrent with revenue-generating activities are excluded from revenue. In the normal course of business, the
74 / CPKC 2023 ANNUAL REPORT
Company does not generate any material revenuerevenues through acting as an agent for other entities. Revenues are presented net of taxes collected from customers and remitted to governmental authorities.
The Company invoices customers when a bill of lading or service request is processed. Payment for services are due when performance obligations are satisfied. Amounts outstanding at the end of each reporting period are generally collected in the following reporting period. Performance obligations not fully satisfied at the end of a reporting period are also expected to be satisfied in the following reporting period.
Freight revenues
The Company provides rail freight transportation services to a wide variety of customers, and transportstransporting bulk commodities, merchandise freight and intermodal traffic.
The Company signsenters into master service agreements with customers that dictatewhich establish pricing, terms and conditions for future freight services the Company is to perform for a customer at the time awill provide when service requests or bills of lading are received from those customers. Each bill of lading or service request is received. Eacha distinct performance obligation that the Company must satisfy. The transaction price is generally a fixed fee determined when the bill of lading or service request represents a separate distinct performance obligation that the Company is obligated to satisfy.initiated. The transaction price is generally in the form of a fixed fee determined at the inception of the bill of lading or service request. The Company allocates the transaction priceallocated to each distinct performance obligationobligations based on the estimated standalone selling price for each performance obligation. As eachprices. Since every bill of lading or service request representsis a separate distinct performance obligation, the estimated standalone selling price is assessed at anprices are determined based on observable price which is fair market value. values. The Company also provides services to customers at published rates established in public tariff agreements. In those arrangements a performance obligation is triggered when the customer orders a service that the Company must satisfy.
Railway freight revenue is recognized over time as transportation services are provided and obligations under the terms of a contract with the customer are satisfied. Inputs are used to measure percentage of completion towards satisfaction of performance obligations. Progress is measured based on elapsed freight transit time relative to the total expected freight transit time from origination to destination. The short duration of freight delivery performance obligations results in generally immaterial services in progress at any given period end.
Certain customer agreements include variable consideration in the form of rebates, discounts, or incentives. The expected value method is used to estimate the amount of variable consideration and is allocated to the applicableallocate to performance obligation and is recognized when the related performance obligation isobligations as they are satisfied. Additionally, the Company offers published rates for services through public tariff agreements in which a customer can request service, triggering a performance obligation the Company must satisfy. Railway freight revenues are recognized over time as services are provided based on the percentage of completed service method. Volume rebates to customers are accrued as a
reduction of freight revenues based on estimated volumes and contract terms, and recognized as freight service is provided. Freight revenues also include certain ancillary and other services provided in association with the performancea reduction of rail freight movements. Revenues from these activities are not material and therefore have been aggregated with the freight revenues fromas the related freight services are provided. Contracted customer contracts with which theyincentives are associated.amortized to income over the term of the related service contract.
Non-freight revenues
Non-freight revenues, including revenues earned from passenger service operators, switching fees, and revenues from logistics services, are recognized either at the point in time the services are provided or over time as the customer obtains control when the performance obligations are satisfied. Non-freight revenues also include revenues from leasing revenues.
Payment by customers is due upon satisfaction of performance obligations. Payment terms are such that amounts outstanding at the period end are expected to be collected within one reporting period. The Company invoices customers at the time the bill of lading or service request is processedland and therefore the Company has no material unbilled receivables and no contract assets. All performance obligations not fully satisfied at period end are expected to be satisfied within the reporting period immediately following. Contracted customer incentives are amortized to income over the term of the related revenue contract.other property.
Income taxes
The Company follows the asset and liability method of accounting for income taxes. DeferredUnder this method, a deferred income tax assets and liabilities areasset or liability is determined based on differencesthe difference between the financial reporting and tax basesbasis of assets and liabilitiesthe asset or liability, using enacted tax rates and laws that will be in effect when the differences aredifference is expected to reverse.
The change in the net deferred income tax asset or liability is included in the computation of "Net income" and "Other comprehensive (loss) income". The effect of a change in income tax rates on deferred income tax assets and liabilities is recognized in income in the period during whichthat the change occurs.
When appropriate, theThe Company records a valuation allowance againstto reduce deferred income tax assets to reflectif it is more likely than not, based on available evidence about future events, that thesesome or all of the deferred income tax assets maywill not be realized. In determining whether a valuation allowance is appropriate,
The Company recognizes the Company considers whethertax benefit from an uncertain tax position only if it is more likely than not that all or some portion of the Company’s deferred tax assetsposition will not be realized, based on management’s judgment using available evidence about future events.
At times, tax benefit claims may be challenged by a tax authority. Tax benefits are recognized only for tax positions that are more likely than not sustainablesustained upon examination by taxing authorities based on the technical merits of the position. The tax authorities. The amountbenefit recognized is measured asbased on the largest amount of benefit that ishas a greater than 50% likely to belikelihood of being realized upon ultimate settlement. A liability for “unrecognized tax benefits” is recorded for any tax benefits claimed in the Company’s tax returns that do not meet these recognition and measurement standards.have a greater than 50% likelihood of being realized upon ultimate settlement.
Investment and other similar tax credits are deferredrecorded as "Deferred income taxes" on the Company's Consolidated Balance Sheets and amortized to “Incomerecognized as "Deferred income tax expense”(recovery) expense" in the Consolidated Statements of Income as the related asset is recognized in income. Income tax recovery or expense on items in "Accumulated other comprehensive income (loss)" are recognized in "Income tax expense" as the related item is recognized in income.
Earnings per share
Basic earnings per share areis calculated using the weighted-average number of the Company's Common Shares ("Common Shares") outstanding during the year. Diluted earnings per share areis calculated using the treasury stock method for determining the dilutive effect of Common Shares issuable upon exercise of outstanding stock options.
CPKC 2023 ANNUAL REPORT / 75
Equity method investments
The Company’s investments in entities over which it can exercise significant influence or has joint control are accounted for using the equity method. Equity-method investments are initially recognized at cost. Subsequently, and until the date significant control ceases, its carrying amount is presented in the Consolidated Balance Sheets, with adjustments to reflect:
•the Company's share of income or losses and comprehensive income or losses, based on the Company's share of common stock and in-substance common stock;
•depreciation, amortization or accretion related to any any basis differences that were identified as part of the initial accounting for the investment;
•dividends received;
•other-than-temporary impairments, if any; and
•the effects of any intra-entity profit and losses and capital transactions.
Distributions received from equity-method investments are classified in the Consolidated Statements of Cash Flows according to the nature of the activities generating distributions.
If the Company acquires control of a business that it was previously able to exercise significant influence over, it stops accounting for the investment using the equity method. The investment is remeasured to fair value as of the date control was obtained, with any gain or loss from the remeasurement recognized in the Company's Consolidated Statements of Income. Any amounts in "Accumulated other comprehensive (loss) income" ("AOCI") in the Consolidated Balance Sheets related to the investment are reclassified and included in the calculation of the gain or loss. Any pre-existing relationship between the Company and the investment is settled with a corresponding gain or loss recorded in the Company's Consolidated Statements of Income, separately from the business acquisition.
Business acquisitions
Management makes estimates and assumptions to determine the fair values of assets acquired and liabilities and non-controlling interest assumed in a business combination at the acquisition date. Such estimates and assumptions are inherently uncertain and subject to refinement. During the measurement period the Company may adjust any provisional amounts reported on the acquisition date if additional information is obtained about facts and circumstances that existed as of the acquisition date that, if known, would have affected their measurement on that date. Adjustments to provisional amounts are recognized with corresponding adjustments to goodwill.
If the acquisition-date fair value of an asset or liability arising from pre-acquisition contingencies cannot be determined as of the acquisition date or during the measurement period, the estimated amount of the asset or liability is recognized if it is probable that an asset existed or a liability had been incurred at the acquisition date based on information available prior to the end of the measurement period and the amount of the asset or liability can be reasonably estimated.
The measurement period ends as soon as all necessary information about the facts and circumstances that existed as of the acquisition date for provisional amounts has been obtained, not to exceed one year. Changes that do not qualify as measurement period adjustments or that occur after the measurement period are recognized in the Consolidated Statements of Income.
Foreign currency translation
AssetsForeign currency transactions
Foreign currency transactions are denominated in currencies other than CPKC's functional currency, which is the Canadian dollar. Transactions denominated in foreign currencies are translated to the functional currency using the exchange rate prevailing at the date of the transaction. Monetary assets and liabilities denominated in foreign currencies other than those held through foreign subsidiaries, are translated into Canadian dollarsremeasured to the functional currency using the exchange rate in effect at the year-end exchange rate for monetary items and at the historical exchange rates for non-monetary items. Foreign currency revenues and expenses are translated at the exchange rates in effect on the dates of the related transactions.balance sheet date. Foreign exchange ("FX") gains and losses other than those arisingresulting from the translation of the Company’s net investment in foreign subsidiaries,monetary assets and liabilities are included in income.income in the period they arise.
The accounts of the Company’s foreign subsidiaries and foreign equity method investees are translated into Canadian dollars using the year-endForeign operations
Foreign exchange rate for assets and liabilities and the average exchange rates during the year for revenues, expenses, gains, and losses. FX gains and losses arising from the translation of the Company's foreign subsidiaries’ and foreign equity methodequity-method investees' assets and liabilitiesfunctional currencies to CPKC's Canadian dollar presentation are included in “Other comprehensive (loss) income” and recognized in income (loss)”. Debt instrumentsupon the sale of the foreign operation. Asset and liability accounts are translated at the exchange rates in effect as at the balance sheet date, and revenues and expenses are translated using monthly average exchange rates.
U.S. dollar-denominated debt, finance lease obligations ("long-term debt") and operating lease liabilities denominated in U.S. dollars have beenare designated as a hedgehedges of the Company's net investment in foreign subsidiaries and foreign equity methodequity-method investees. As a result,Accordingly, unrealized FX gains and losses on U.S. dollar-denominated long-term debt and operating lease liabilities, designated as a hedge, are offset against FX gains and losses arising from the translation of the designated U.S. dollar-denominated debt, finance lease obligations and operating lease liabilities are offset against gains and losses arising from the translation of the Company's foreign subsidiaries’ and foreign equity method investees'operations' accounts in “Other comprehensive income (loss)” income”.
76 / CPKC 2023 ANNUAL REPORT
Cash and cash equivalents
Cash and cash equivalents include highly liquid short-term investments that are readily convertible to cash with original maturities of less than three months or less, but excludes cash and cash equivalents subject to restrictions.
Restricted cash and cash equivalents
Cash and cash equivalents that are restricted as to withdrawal or usage, in accordance with specific agreements, are presented as restricted cash and cash equivalents on the Company's Consolidated Balance Sheets when applicable. In the Company's Consolidated Statements of Cash Flows, these balances, if any, are included with cash and cash equivalents.months.
Accounts receivable, net
Accounts receivable from customers are recognized initiallyrecorded at fair value and subsequently measured at amortized cost lessnet of an allowance for expected credit losses. Losses on accounts receivable areThe allowance for expected credit losses is estimated based on relevant information about historical credit loss experience of receivables with similar risk characteristics. Historical loss experience is adjusted to reflect any management expectations thatcharacteristics, current orconditions, and forecasts of future conditions will differ from conditions that existed for the period over which historical information is evaluated.expected to affect collectability.
To determine expected credit losses, receivables are disaggregated by credit characteristics, type of customer service, customer line of business, andAccounts receivable aging. Receivables are considered to be in default and are written off against the allowance for credit losses when it is probable that allthe remaining contractual payments due will not be collected in accordance with the terms of the customer contracts.collected. Subsequent recoveries of amounts previously written off are credited to earningsincome in the period recovered.
Materials and supplies
Materials and supplies, are carried at the lower of average cost or market value and consist primarily ofincluding fuel and parts used in the repair and maintenance of track structures, equipment, locomotives, and freight cars.cars, are measured at the lower of average cost or net realizable value.
Properties
Fixed assetProperties are reported at historical cost, less accumulated depreciation or amortization and any impairment. The Company reviews properties for impairment when changes in circumstances indicate that its carrying amount may not be recoverable. If the estimated future undiscounted cash flows are less than the property's carrying amount, its carrying amount is reduced to the estimated fair value, measured using discounted cash flows, and a corresponding impairment loss is recognized in income.
Additions to properties
For property additions and major renewalsbetterments the Company capitalizes all costs necessary to make the assets ready for their intended use.
A large amount of the Company's capital expenditures are for self-constructed properties, both new and the replacement of existing properties. Self-constructed assets are initially recorded at cost, including direct costs, attributable indirect costs, and carrying costs, less accumulated depreciation and any impairment. When there is a legal obligation associated with the retirement of property, a liability, when reliably estimable, is initially recognized at its fair value and a corresponding asset retirement cost is added to the gross book value of the related asset and amortized to expense over the estimated term to retirement. The Company reviews the carrying amounts of its properties whenever changes in circumstances indicate that such carrying amounts may not be recoverable based on future undiscounted cash flows. When such properties are determined to be impaired, recorded asset values are revised to their fair value and an impairment loss is recognized.
The Company recognizes expenditures as additions to properties or operating expenses based on whether the expenditures increase the output or service capacity, lower the associated operating costs or extend the useful life of the properties and whether the expenditures exceed minimum physical and financial thresholds.
Much of the additions to properties, both new and replacement properties, are self-constructed. These are initially recorded at cost, including direct costs and attributable indirect costs, overheads, and carrying costs. Direct
•direct costs include among other things, labour, costs, purchased services, materials and equipment, costs, material costs, project supervision costs, and fringe benefits. Attributable
•attributable indirect costs and overheads include incremental long-term variable costs resulting from the execution of capital projects. Indirect
•indirect costs mainly include costs associated with work trains, material distribution, highway vehicles, and work equipment. Overheads
•overheads primarily include a portionrelate to engineering department costs of planning, designing, and administering the engineering department’s costs,capital projects, which plans, designs, and administers these capital projects. These costs are allocated to projects by applyingusing a measure consistent with the nature of the cost, based on cost studies. For replacement properties, the project costs are allocated to dismantling and installation based on cost studies. Dismantling work, which is expensed, is performed concurrently with the installation.
BallastThe Company capitalizes costs incurred for replacements or betterments that enhance the service potential or extend the useful life of the properties, when the expenditures exceed minimum physical and financial thresholds. Costs to repair or maintain the service potential of properties are expensed.
•the cost of ballast programs, including undercutting, shoulder ballasting, and renewal programs that form part of the annual track program are capitalized as thisbecause the work and the related added ballast material significantly improves drainage, which in turn extends the life of ties and other track materials. These costsThe cost of ballast programs are tracked separately from the underlying assets and depreciated over the estimated period to the next estimated similar ballast program. Spot replacement of ballast is considered a repair, which is expensed as incurred.
The costs of largesignificant freight car refurbishments, are capitalized and locomotive overhauls and other capital improvements that enhance service potential or extend useful life are expensed as incurred, except where overhauls represent a betterment of the locomotive in which casecapitalized.
•replacement project costs are capitalized.allocated to dismantling, which is expensed, and installation, which is capitalized, based on cost studies.
The Company also capitalizes development costs for major new computer systems.
Asset retirement obligations
When there is a reliably measurable legal obligation associated with the retirement of property, a liability is initially recognized at its fair value and a corresponding asset retirement cost is added to the carrying amount of property and depreciated over the estimated useful life of the property.
Group depreciation
The Company followsprimarily uses the group method of depreciation, in which groups assets thatproperties with similar characteristics, use and expected lives are similar in nature and have similar economic lives. The propertyallocated to asset groups:
•the asset groups are depreciated on a straight-line basis reflecting their expected economic lives, determined byusing composite depreciation studies. Depreciation studies are regular reviews of asset service lives, salvage values, accumulated depreciation, and other related factors. Depreciation rates are established through these studies. Actual use and retirement of assets may vary from current estimates, and would be identified in the next study. These changes in expected economic lives would impact the amount of depreciation expense recognized in future periods.rates. All track assets are depreciated using a straight-line method which recognizes the value of the asset consumed as a percentage of the whole life of the asset.
•the depreciation studies also estimate accumulated depreciation surpluses or deficiencies for each asset group, which are amortized over the remaining life of the respective asset group.
CP 2022CPKC 2023 ANNUAL REPORT 76/ 77
When•when depreciable property is retired or otherwise disposed of in the normal course of business, its life generally approximates its expected useful life as determined in the depreciation studies. For this reason, under group depreciation, a gain or loss on disposal is not recognized. Instead, the asset's net book value, less net salvage proceeds, is charged to accumulated depreciation and if different than the assumptions under the depreciation study could potentially result in adjusted depreciation expense over a period of years. However, when removal costs exceed the salvage value on assets and the Company has no legal obligation to remove the assets, the removal costs incurred are charged to income in the period in which the assets are removed and are not charged to accumulated depreciation.
Forfor certain asset classes,groups, the historical cost of the asset is separately recorded in the Company’sCompany's property records. This amount is retired from the property records upon retirement of the asset. For assets for which the historical cost cannot be separately identified, the amount of theasset's gross book value to be retired is estimated using either an indexation methodology, whereby the retired property's current replacement cost of the asset is indexed to theits estimated year of installation, for the asset, or a first-in, first-out approach, or statistical analysis is used to determine the age of theits retired asset.age. The Company uses indices that closely correlate to the principal costs of the assets.
There are a number of estimates inherent inwhen removal costs exceed the depreciationproperty's salvage value and retirement processes and as itremoval is not possiblea legal obligation, the removal costs are charged to precisely estimate each of these variables until a group ofincome when the property is completely retired, the Company regularly monitors the estimated service lives of assets and the associated accumulated depreciation for each asset class to ensure depreciation rates are appropriate. If the recorded amounts of accumulated depreciation are greater or less than the amounts indicated by the depreciation studies, then the excess or deficit is amortized as a component of depreciation expense over the remaining service lives of the applicable asset classes.removed.
For the sale or retirementfor disposals of larger groups of depreciable assets that are unusual and were not considered infactored into the Company’s depreciation studies, the Company records a gain or loss for the difference between the net proceeds and the net book value of the assets sold or retired. The accumulated depreciation to be retiredthat is derecognized includes asset-specific accumulated depreciation, when known, andor an appropriate portion of the accumulated depreciation recorded for the relevant asset class as a whole, calculated using a cost-based allocation.
RevisionsConcession assets
CPKC holds a concession from the Mexican government which authorizes the Company to provide freight transportation services over certain rail lines, including the use all related track and other assets necessary for the rail lines' operation (the "Concession"). The Concession term ends in June 2047, but is renewable under certain conditions, for additional periods, each up to 50 years.
The underlying tangible assets that the Concession provides the Company with the right to use are capitalized in "Properties", and amortized using the group method. Amortization is recognized over the lesser of the expected concession term, including one renewal period of 50 years, or the estimated useful lives and net salvage projections constitute a change in accounting estimate andlife of the underlying asset groups. The intangible rights granted under the Concession are addressed prospectively by amending depreciation rates.amortized over the expected term of the Concession.
Equipment under financeFinance lease isright-of-use ("ROU") assets
Finance lease ROU assets included in Properties and depreciated over"Properties" are amortized to the periodearlier of expected use.the end of the useful life of the ROU asset or the end of the lease term.
LeasesGovernment assistance
The Company has leasesrecords government assistance from various levels of governments and government agencies when there is reasonable assurance that the assistance will be received.
Government assistance in connection with the acquisition or construction of properties sometimes includes conditions which, if not met within a certain period of time, may require repayment of some or all of the assistance received. It is the Company's intention to comply with all conditions imposed by the terms of government assistance accepted. Government assistance received or receivable related to property is recorded as a reduction of the cost of the property and amortized over the same period as the related assets.
Goodwill
Goodwill represents the excess of the purchase price over the fair value of identifiable net assets upon acquisition of a business. On the acquisition date goodwill is allocated to the reporting unit expected to benefit from the acquisition. The carrying value of goodwill, which is not amortized, is assessed for rolling stock, buildings, vehicles, railway equipment, roadway machines, and information systems hardware.impairment annually, or more frequently if events or changes in circumstances arise that suggest goodwill may be impaired. The Company has entered into rolling stock and roadway machine leases that are fully variable or contain both fixed and variable components. Variable components are dependentCompany's annual review of goodwill is performed in the fourth quarter, on the hours and miles that the underlying equipment has been used. Fixed-term, short-term, and variable operating lease costs are recorded in "Equipment rents" and "Purchased services and other" on the Company's Consolidated Statements of Income. Components of finance lease costs are recorded in "Depreciation and amortization" and "Net interest expense" on the Company's Consolidated Statements of Income.October 1 balance.
The Company determines lease existencefirst assesses qualitative factors, including, but not limited to economic, market, and classificationindustry conditions, the reporting unit's overall financial performance and events such as notable changes in management or customers. If the qualitative assessment indicates that it is more likely than not that the fair value of the reporting unit is less than its carrying value, a quantitative assessment is undertaken. The quantitative assessment is a comparison of the reporting unit's carrying value and fair value. The reporting unit's fair value is defined as the price expected to be received if it was sold in an orderly transaction between market participants. It is determined based on pre-tax discounted cash flows that reflect management's best estimates of the time value of money and risks specific to the reporting unit and its assets. If the carrying value of the reporting unit, including goodwill, exceeds its fair value, an impairment is recognized, measured at the lease inception date. Leases are identified when an agreement conveysamount by which the right to control identified property for a period of time in exchange for consideration. The Company recognizes both an operating lease liability and right-of-use (“ROU”) asset for operating leases with fixed terms and in-substance fixed terms. ROU assets represent our right to use an underlying asset for the lease term and lease liabilities represent our obligation to make lease payments arising from the lease. Operating and finance lease ROU assets and liabilities are recognized at the lease commencement date based on the presentreporting unit's carrying value of lease payments over the lease term. Lease payments include fixed and variable payments that are based on an index or a rate. If the Company's leases do not provide a readily determinable implicit interest rate, the Company uses internal incremental secured borrowing rates for comparable tenor in the same currency at the commencement date in determining the present value of lease payments. Operating and finance lease ROU assets also include lease prepayments and initial direct costs, but are reduced by lease incentives. The lease term may include periods associated with options to extend or exclude periods associated with options to terminate the lease when it is reasonably certain that the Company will exercise these options.exceeds its fair value.
The Company has short-term operating leasesIntangible assets
Intangible assets with termsfinite lives, consisting primarily of 12 months or less, some of which include options to purchase that the Company is not reasonably certain to exercise. The Company has elected to apply the recognition exemptioncustomer contracts, customer relationships and as such, accounts for leases with a term of 12 months or less off-balance sheet. Therefore, lease payments on these short-term operatingfavourable leases are not included in operating lease ROU assets and liabilities, but are recognized as an expense in the Company's Consolidated Statements of Incomeamortized on a straight-line basis over their estimated useful lives of up to 22 years. When there is a change in the termestimated useful life of an intangible asset with a finite life, amortization is adjusted prospectively. An intangible asset with a finite life is assessed for impairment whenever events or circumstances indicate that its carrying amount may not be recoverable.
78 / CPKC 2023 ANNUAL REPORT
Intangible assets with indefinite useful lives are primarily trackage rights that are expected to generate cash flows indefinitely. They are not amortized but are tested for impairment annually, or more frequently if events or changes in circumstances indicate they may be impaired.
When assessing an intangible asset for impairment, if the undiscounted cash flows indicate that its carrying amount may not be recoverable, an impairment loss will be recognized for the amount that its carrying amount exceeds its fair value, determined based on pre-tax discounted cash flows that reflect management's best estimates of the lease. Further,time value of money and risks specific to the Company has elected to combine lease and non-lease components for all leases, except for leases of roadway machines and information systems hardware.asset.
Assets held for sale
Assets to be disposed that meet the held for saleheld-for-sale criteria are reported in "Other assets" at the lower of their carrying amount and fair value, less costs to sell, and are no longernot depreciated. This classification is applied at the date at which applicable criteria for recognition are met.
Government assistance
By analogy to the grant model of accounting within International Accounting Standards ("IAS") 20, Accounting for Government Grants and Disclosure of Government Assistance, the Company records government assistance from various levels of the Canadian and U.S. governments and government agencies when the conditions of their receipt are complied with and there is reasonable assurance that the assistance will be received.
Government assistance related to properties has as a primary condition that the Company should purchase, construct, or otherwise acquire property, plant, and equipment. Under certain government assistance arrangements, there is a secondary condition that requires the Company to repay a portion of the assistance if certain conditions related to the assets are not adhered to during a specified period. In these cases, it is the Company's intention to comply with all conditions imposed by the terms of the government assistance. Government assistance received or receivable related to the Company's property assets is deducted from the cost of the assets in the Consolidated Balance Sheets within "Properties" and amortized over the same period as the related assets in "Depreciation and amortization" in the Consolidated Statements of Income.
Goodwill and intangible assets
Goodwill represents the excess of the purchase price in a business combination over the fair value of identifiable net assets acquired. Goodwill is allocated at the date of the business combination to the reporting unit that is expected to benefit from the business acquisition which, after integration of operations with the railway network, may be different than the acquired business.
The carrying value of goodwill, which is not amortized, is assessed for impairment annually in the fourth quarter of each year as at October 1, or more frequently as economic events dictate. The Company has the option of performing an assessment of certain qualitative factors to determine if it is more likely than not that the fair value of a reporting unit is less than its carrying value or proceeding directly to a quantitative impairment test. Qualitative factors include but are not limited to, economic, market and industry conditions, cost factors, overall financial performance of the reporting unit, and events such as notable changes in management or customers. If the assessment of qualitative factors indicates that the carrying value is less than the fair value, then performing the quantitative goodwill impairment test is unnecessary. The quantitative assessment compares the fair value of the reporting unit to its carrying value, including goodwill. If the fair value of the reporting unit is less than its carrying value, goodwill is impaired. The impairment charge that would be recognized is the excess of the carrying value over the fair value of the reporting unit, limited to the total amount of goodwill allocated to the reporting unit.
The Company defines the fair value of a reporting unit as the price expected to be received to sell the entire reporting unit in an orderly transaction between market participants as of the impairment date. In order to determine the fair value of a reporting unit, the Company uses the discounted cash flow method with a pre-tax discount rate, reflecting current market assessments of the time value of money and the risks specific to the asset(s).
Intangible assets with finite lives are amortized on a straight-line basis over the estimated useful lives of the respective assets. Favourable leases, customer relationships, and interline contracts have amortization periods up to 20 years. When there is a change in the estimated useful life of an intangible asset with a finite life, amortization is adjusted prospectively.
The Company tests the recoverability of its intangible assets whenever future undiscounted cash flows indicate that the carrying amount may not be recoverable. If the carrying amount of an intangible asset exceeds the fair value, an impairment loss will be recognized in the Company's Consolidated Statements of Income for the difference between the carrying amount of the asset and fair value.
Pensions and other benefits
Pension costs are actuarially determined using the projected benefit method pro-rated over the credited service periods of employees. This method incorporates management’s best estimates of expected plan investment performance, salary escalation, and retirement ages of employees. The expected return on plan assets is calculated using market-related asset values developed from a five-year average of market values for the fund’s public equity securities and absolute return strategies (with each prior year’s market value adjusted to the current date for assumed investment income during the intervening period) plus the market value of the fund’s fixed income, real estate, infrastructure, and private debt securities, subject to the market-related asset value not being greater than 120% of the market value nor being less than 80% of the market value. The discount rate used to determine the projected benefit obligation is based on blended market interest rates on high-quality debt instruments with matching cash flows. Unrecognized actuarial gains and losses in excess of 10% of the greater of the projected benefit obligation and the market-related value of plan assets are amortized over the expected average remaining service period of active employees expected to receive benefits under the plan (approximately 13 years). Prior service costs arising from collectively bargained amendments to pension plan benefit provisions are amortized over the term of the applicable union agreement. Prior service costs arising from all other sources are amortized over the expected average remaining service period of active employees who are expected to receive benefits under the plan at the date of amendment.
Costs for post-retirement and post-employment benefits other than pensions, including post-retirement health care and life insurance and some workers’ compensation and long-term disability benefits in Canada, are actuarially determined on a basis similar to pension costs.
The over or under funded status of defined benefit pension and other post-retirement benefit plans are measured as the difference between the fair value of the plan assets and the benefit obligation, and are recognized on the consolidated balance sheets. In addition, any unrecognized actuarial gains and losses and prior service costs that arise during the period are recognized as a component of “Other comprehensive income (loss)”, net of tax.
Gains and losses on post-employment benefits that do not vest or accumulate, including some workers’ compensation and long-term disability benefits in Canada, are included immediately on the Company's Consolidated Statements of Income as "Other components of net periodic benefit recovery".
The current service cost component of net periodic benefit cost is reported in "Compensation and benefits" for pensions and post-retirement benefits, and in "Purchased services and other" for self-insured workers' compensation and long-term disability benefits on the Company's Consolidated Statements of Income. Other components of net periodic benefit cost or recovery are reported in "Other components of net periodic benefit recovery" outside of Operating income on the Company's Consolidated Statements of Income.
Capitalization of pension costs, when applicable, is restricted to the current service cost component of net periodic benefit cost.
Financial instruments
Financial instruments are contracts that give rise to a financial asset of one party and a financial liability or equity instrument of another party. Financial instruments are recognized initially at fair value, which is the amount of consideration that would be agreed upon in an arm’s-length transaction between willing parties.
Subsequent measurement depends on how the financial instruments have been classified.Cash and cash equivalents are classified as amortized cost, which approximates fair value. Accounts receivable and other investments classified asconsisting of loans and receivables are subsequently measured at amortized cost, using the effective interest method. Cash and cash equivalents and derivatives are classified as held for trading and are measured at fair value. Accounts payable and accrued liabilities, short-term borrowings, other long-term liabilities, and long-term debt are also subsequently measured at amortized cost.
Derivative financial instruments
Derivative financial and commodity instruments may beare used from time to time by the Company to manage itsthe Company's exposure to risks relating tochanges in foreign currency exchange rates, stock-based compensation, interest rates, fuel price and fuel prices.certain compensation tied to our common share price. When the Company utilizes derivative instruments are used in hedging relationships, the Company identifies, designates, and documents those hedging transactions and regularly tests the transactions to demonstrate effectiveness in order to continue hedge accounting.
AllThe Company's derivative instruments are classified as held for tradingheld-for-trading and recorded at fair value.value in the Consolidated Balance Sheets as current or non-current assets or liabilities depending on the timing of settlements and the resulting cash flows associated with the instrument. Any changechanges in the fair value of derivatives that are not designated as hedges isare recognized in income in the period in which the change occurs in the Company's Consolidated Statements of Income in the line item to which the derivative instrument is related.occurs.
For fair value hedges, the periodic changes in the fair value of the hedging instrument are recognized in income onalong with changes in the same line as the changes infair value of the hedged items are also recorded. risk of the asset or liability that is designated as part of the hedging relationship.
For designated cash flow hedges, the changes in the fair value of the hedging instrument is recognizedare recorded in “Other comprehensive (loss) income” and reclassified to income (loss)”when the hedged item impacts income. If a derivative instrument designated as a cash flow hedge ceases to be effective or is terminated, hedge accounting is discontinued and remainsthe gain or loss at that date is deferred in “Accumulated other"Other comprehensive (loss) income" and recognized in income (loss)” untilconcurrently with the related transaction. If an anticipated hedged item settles, attransaction is no longer probable, the gain or loss is recognized immediately in income. Subsequent gains and losses from derivative instruments for which time amountshedge accounting has been discontinued are recognized in “Accumulated other comprehensive income (loss)” are reclassified to the same income or balance sheet account that records the hedged item. The changes in value of the hedging instrument is recognized in the Company's Consolidated Statements of Income if derivatives designated as cash flow hedges are subsequently de-designated.period in which they occur.
Cash flows relating to derivative instruments designated as hedges are included in the same category as the related hedged items onin the Company's Consolidated Statements of Cash Flows.
EnvironmentalLeases
The Company leases rolling stock, buildings, vehicles, railway equipment, roadway machines, and information systems hardware. Lease liabilities and ROU assets are recognized in the Consolidated Balance Sheets for finance leases and operating leases with fixed terms and in-substance fixed terms.
•ROU assets and lease liabilities are recognized on the lease commencement date at the present value of the future lease payments over the lease term. Lease payments include fixed and variable payments that are based on an index or a rate. If the rate implicit in the lease is not readily determinable, the Company uses internal incremental secured borrowing rates for a comparable tenor and in the same currency at the lease commencement date to determine the present value of lease payments.
•certain leases of rolling stock and roadway machines are fully variable or contain both fixed and variable components. Variable components are dependent on the hours and miles that the underlying equipment has been used. Fixed-term, short-term and variable operating lease costs are recorded in "Equipment rents" and "Purchased services and other" in the Company's Consolidated Statements of Income.
•components of finance lease costs are recorded in "Depreciation and amortization" and "Net interest expense" in the Company's Consolidated Statements of Income.
•ROU assets are adjusted for lease prepayments, initial direct costs and lease incentives.
CPKC 2023 ANNUAL REPORT / 79
•lease terms include periods associated with options to extend or exclude periods associated with termination options when the Company is reasonably certain of exercising such options.
•non-lease components are accounted for separately from lease components of roadway machine, information systems hardware, and fleet vehicle lease contracts. Otherwise, lease and non-lease components are combined and accounted as a single lease component.
Leases with terms of 12 months or less that do not contain an option to purchase the underlying asset at the end of the lease term that the Company intends to exercise are not recorded on the Consolidated Balance Sheets; lease payments are recognized as expenses in the Consolidated Statements of Income on a straight-line basis over the lease term.
Provision for environmental remediation
Environmental remediation accruals, covering site-specific remediation programs, are recorded on an undiscounted basis unless a reliably determinable estimate as toof the amount and timing of costs can be established, cover site-specific remediation programs.established. The accruals are recorded when the costs to remediate are probable and can be reasonably estimable.estimated. Certain future costs to monitor sites are discounted at an adjusted risk-free rate. Provisions for environmental remediation costs are recorded in “Other long-term liabilities”, except for the current portion, which is recorded in “Accounts payable and accrued liabilities”.
Stock-based compensationPensions and other benefits
Obligations and net periodic benefit costs for the Company's defined benefit pension plans are actuarially determined using the projected benefit method, pro-rated over the credited service periods of employees. This method incorporates management’s best estimates of actuarial assumptions, such as discount rates, salary and other cost escalations, employees' retirement ages and mortality. The discount rates are based on blended market interest rates on high-quality debt instruments with matching cash flows.
Plan assets are measured at fair value. The expected return on plan assets is calculated using market-related asset values, developed from a five-year average of adjusted market values for the fund’s public equity securities and absolute return strategies, plus the market value of the fund’s other asset classes, subject to the market-related asset value not being greater than 120% nor less than 80% of the market value.
Actuarial gains and losses arise from the difference between the actual and expected return on plan assets, and changes in the measurement of the benefit obligation. Periodic net actuarial gains and losses and prior service costs are accumulated and presented as a component of AOCI in the Consolidated Balance Sheets.
Obligations and net periodic benefit costs for the Company's other post-retirement and post-employment benefits are actuarially determined on a similar basis.
The Company followsstatus of over and under funded defined benefit pension and benefit plans, measured as the difference between the fair value based approachof a plan's assets and benefit obligation, are reported in the Company's Consolidated Balance Sheets.
Components of net periodic benefit cost included in Operating income in the Consolidated Statements of Income include:
•current service costs for defined benefit pension and post-retirement benefits, and the Company's contributions to accountdefined contribution pension plans are recorded in"Compensation and benefits"; and
•current service costs for stock options. Compensation expenseself-insured workers' compensation and an increaselong-term disability benefits, which are recorded in"Purchased services and other".
Other components of net periodic benefit cost or recovery, recognized outside of Operating income in “Additional paid-in capital”the Consolidated Statements of Income are:
•interest cost on benefit obligation;
•expected return on plan assets;
•amortization of net actuarial gains and losses in excess of 10% of the greater of the projected benefit obligation and the market-related value of plan assets, over the expected average remaining service period of the plan's active employee group (approximately 13 years);
•amortization of prior service costs arising from collectively bargained amendments to pension plan benefit provisions (over the term of the applicable union agreement) and from all other sources (over the expected average remaining service period of active employees who are recognized forexpected to receive benefits under the plan at the date of the amendment); and
•gains and losses on post-employment benefits that do not vest or accumulate, including some workers’ compensation and long-term disability benefits in Canada.
Stock-based compensation
Stock options
The cost of awards of equity-settled employee stock options is measured based on the options' fair value on their grant date. The cost is recognized as "Compensation and benefits expense", with a corresponding increase to "Additional paid-in capital" ("APIC") in "Shareholders' equity" over theirthe shorter of (i) the vesting periodperiod; or over(ii) the period from the grant date to the date employees becomethe employee becomes eligible to retire, when this is shorter than the vesting period, based on their fair values on theretire. The grant date as determined using the Black-Scholes option-pricing model. Forfeitures are estimated at issuance and monitored on a periodic basis. Any consideration paid by employees on exercise of stock options is credited to “Share capital” when the option is exercised and the recorded fair value of the option is removed from “Additional paid-in capital" and credited to “Share capital”.determined
7980 / CP 2022CPKC 2023 ANNUAL REPORT
using the Black-Scholes option-pricing model. Forfeitures are estimated at the grant date, and changes in the estimate of forfeitures in subsequent periods are recognized as adjustments to"Compensation and benefits expense" in the period that the change in estimate occurs. As stock options are exercised, the related amount accumulated in "APIC" is reclassified to "Share Capital" and the proceeds are recognized in "Share Capital".
Compensation expense isShare units
The Company also recognized forissues cash-settled awards, including deferred share units ("DSUs"), performance share units (“PSUs”), and performance deferred share units ("PDSUs"), deferred share units ("DSUs"),for which a liability is remeasured each financial reporting period until settlement.
"Compensation and restricted share units (“RSUs”) that settle in cashbenefits expense" is recognized, using the fair value method. Compensation expense is recognizedmethod, over the shorter of the vesting periodterm, or over the period from the grant date to the date employees becomethe employee is eligible to retire, when thisbased on the number of units outstanding and the closing price of CPKC's Common Shares on the measurement date. In the case of PSUs and PDSUs, the fair value of units that are probable of vesting, based on forecasted performance factors is shorter than the vesting period where applicable.recognized as "Compensation and benefits expense". Forfeitures of share units are estimated at issuancethe grant date, and monitored on a periodic basis.changes in the estimate of forfeitures in subsequent periods are recognized as adjustments to "Compensation and benefits expense" in the period that the change in estimate occurs.
Share purchase plan
The employee share purchase plan gives rise to compensation expense that is recognized using the issue price by amortizing the cost over the vesting period.
2.3. Accounting changes
Implemented in 2022Adoption of new standards
Government AssistanceAccounting for contract assets and contract liabilities from contracts with customers
OnEffective January 1, 2022,2023, the Company adopted the new ASU 2021-10, issued by the Financial Accounting Standards Board ("FASB"Update (“ASU”) 2021-08, Business Combinations (Topic 805), Accounting for Contract Assets and all related amendments under FASBContract Liabilities from Contracts with Customers on a prospective basis. Under this ASU contract assets and contract liabilities acquired in a business combination are measured in accordance with Accounting Standards Codification ("ASC") Topic 832, Government Assistance.606, Revenue from Contracts with Customers instead of at fair value. The amendment is made to increase transparency by introducing specific disclosure requirements for entities who apply a grant or contribution model by analogy to account for transactions with a government. This update is applied to government assistance transactions within the scopeCompany's application of this amendment that areASU for the measurement of contract assets and contract liabilities acquired in the KCS acquisition (Note 11) did not have a material impact on the Company's financial statements at the dateposition and results of initial application and prospectively to new transactions entered into after initial application. See Note 1 and Note 12 for further discussion on government assistance.operations.
All other accounting pronouncements that became effective during the period covered by the Consolidated Financial Statements did not have a material impact on the Company's Consolidated Financial Statements and related disclosures.
Future ChangesNew pronouncements
Contract Assets and Contract Liabilities Acquired in a Business Combination
In October 2021, the FASB issued ASU 2021-08, Business Combinations (Topic 805), Accounting for Contract Assets and Contract Liabilities from Contracts with Customers. This amendment introduces the requirement for an acquirer to recognize and measure contract assets and contract liabilities acquired in a business combination in accordance with the requirements of FASB ASC Topic 606, Revenue from Contracts with Customers, rather than at fair value. This amendment will be effective prospectively from January 1, 2023, with early adoption permitted. The Company plans to adopt this update from January 1, 2023, with anticipation that upon obtaining effective control of Kansas City Southern ("KCS") following approval by the Surface Transportation Board ("STB"), any contract assets and liabilities of KCS will be recorded in the purchase price allocation in compliance with the update.
All other recentlyRecently issued accounting pronouncements have been assessed and are not expected to have a significantmaterial impact on the Company's consolidated financial statements and related disclosures.position or results of operations.
CP 2022CPKC 2023 ANNUAL REPORT 80/ 81
3.4. Revenues
The following table disaggregatespresents disaggregated information about the Company’s revenues from contracts with customers by major source:
| | (in millions of Canadian dollars) | 2022 | | 2021 | 2020 | |
| Freight | |
| For the year ended December 31 (in millions of Canadian dollars) | |
| Grain | Grain | $ | 1,776 | | $ | 1,684 | | $ | 1,829 | |
| Coal | Coal | 577 | | 625 | | 566 | |
| Potash | Potash | 581 | | 463 | | 493 | |
| Fertilizers and sulphur | Fertilizers and sulphur | 332 | | 305 | | 290 | |
| Forest products | Forest products | 403 | | 348 | | 328 | |
| Energy, chemicals and plastics | Energy, chemicals and plastics | 1,394 | | 1,563 | | 1,519 | |
| Metals, minerals and consumer products | Metals, minerals and consumer products | 884 | | 728 | | 629 | |
| Automotive | Automotive | 438 | | 376 | | 324 | |
| Intermodal | Intermodal | 2,242 | | 1,724 | | 1,563 | |
| Total freight revenues | Total freight revenues | 8,627 | | 7,816 | | 7,541 | |
| Non-freight excluding leasing revenues | Non-freight excluding leasing revenues | 103 | | 100 | | 107 | |
| Revenues from contracts with customers | Revenues from contracts with customers | 8,730 | | 7,916 | | 7,648 | |
| Leasing revenues | Leasing revenues | 84 | | 79 | | 62 | |
| Total revenues | Total revenues | $ | 8,814 | | $ | 7,995 | | $ | 7,710 | |
Contract liabilities
Contract liabilities represent payments received for performance obligations not yet satisfied and relate to deferred revenue andsatisfied. They are presented as components ofwithin "Accounts payable and accrued liabilities" and "Other long-term liabilities" on the Company's Consolidated Balance Sheets.
The following table summarizes the changes in contract liabilities for the years ended December 31, 20222023 and 2021:2022:
| | | | | | | | | |
| (in millions of Canadian dollars) | 2022 | 2021 | |
| Opening balance | $ | 67 | | $ | 61 | | |
| Revenue recognized that was included in the contract liability balance at the beginning of the period | (21) | | (48) | | |
| Increase due to consideration received, net of revenue recognized during the period | 18 | | 54 | | |
| Closing balance | $ | 64 | | $ | 67 | | |
| | | | | | | | | |
| (in millions of Canadian dollars) | 2023 | 2022 | |
| Opening balance, January 1 | $ | 64 | | $ | 67 | | |
| Contract liabilities assumed upon the acquisition of KCS (Note 11) | 7 | | — | | |
| Revenue recognized in the period that was included in the opening balance or liabilities assumed | (36) | | (21) | | |
| Increase due to consideration received, net of revenue recognized in the period | 17 | | 18 | | |
| Closing balance, December 31 | $ | 52 | | $ | 64 | | |
4.5. Other expense (income)
| | (in millions of Canadian dollars) | 2022 | 2021 | 2020 |
| For the year ended December 31 (in millions of Canadian dollars) | | For the year ended December 31 (in millions of Canadian dollars) | 2023 | 2022 | 2021 |
| Foreign exchange gain on debt and lease liabilities | Foreign exchange gain on debt and lease liabilities | $ | — | | $ | (7) | | $ | (14) | |
| Foreign exchange loss on FX forward contracts (Note 18) | |
| Other foreign exchange gains | Other foreign exchange gains | — | | (4) | | (1) | |
| Acquisition-related costs (Note 10) | — | | 247 | | — | |
| Acquisition-related costs (Note 11) | |
| Other | Other | 17 | | 1 | | 8 | |
| Other expense (income) | $ | 17 | | $ | 237 | | $ | (7) | |
| Other expense | |
8182 / CP 2022CPKC 2023 ANNUAL REPORT
5.6. Income taxes
The following is a summary of the major components of the Company’s income tax (recovery) expense:
| | (in millions of Canadian dollars) | 2022 | 2021 | 2020 |
| For the year ended December 31 (in millions of Canadian dollars) | | For the year ended December 31 (in millions of Canadian dollars) | 2023 | 2022 | 2021 |
| Current income tax expense | Current income tax expense | $ | 492 | | $ | 526 | | $ | 537 | |
| Deferred income tax expense | |
| Deferred income tax (recovery) expense | |
| Reversal of outside basis deferred tax (Note 11) | |
| Reversal of outside basis deferred tax (Note 11) | |
| Reversal of outside basis deferred tax (Note 11) | |
| Origination and reversal of temporary differences | Origination and reversal of temporary differences | 101 | | 259 | | 277 | |
| Effect of tax rate decrease | Effect of tax rate decrease | (25) | | (11) | | (32) | |
Effect of hedge of net investment in foreign subsidiaries (Note 7)
| 59 | | (3) | | (18) | |
| Effect of hedge of net investment in foreign subsidiaries and equity-method investees (Note 8) | |
| Other | Other | 1 | | (3) | | (6) | |
| Total deferred income tax expense | 136 | | 242 | | 221 | |
| Total income taxes | $ | 628 | | $ | 768 | | $ | 758 | |
| Income before income tax expense | |
| Total deferred income tax (recovery) expense | |
| Total income tax (recovery) expense | |
| | (Loss) income before income tax (recovery) expense | |
| (Loss) income before income tax (recovery) expense | |
| (Loss) income before income tax (recovery) expense | |
| Canada | |
| Canada | |
| Canada | Canada | $ | 2,236 | | $ | 2,899 | | $ | 2,518 | |
| Foreign | Foreign | 1,909 | | 721 | | 684 | |
| Total income before income tax expense | $ | 4,145 | | $ | 3,620 | | $ | 3,202 | |
| Income tax expense | |
| Total (loss) income before income tax (recovery) expense | |
| Income tax (recovery) expense | |
| Current | Current | |
| Current | |
| Current | |
| Canada | |
| Canada | |
| Canada | Canada | $ | 333 | | $ | 404 | | $ | 412 | |
| Foreign | Foreign | 159 | | 122 | | 125 | |
| Total current income tax expense | Total current income tax expense | 492 | | 526 | | 537 | |
| Deferred | Deferred | |
| Canada | Canada | 177 | | (179) | | 231 | |
| Canada | |
| Canada | |
| Foreign | Foreign | (41) | | 421 | | (10) | |
| Total deferred income tax expense | 136 | | 242 | | 221 | |
| Total income taxes | $ | 628 | | $ | 768 | | $ | 758 | |
| Total deferred income tax (recovery) expense | |
| Total income tax (recovery) expense | |
CP 2022CPKC 2023 ANNUAL REPORT 82/ 83
The provision for deferred income taxes arises from temporary differences in the carrying values of assets and liabilities for financial statement and income tax purposes and the effect of loss carryforwards. The items comprising the deferred income tax assets and liabilities are as follows:
| | (in millions of Canadian dollars) | 2022 | 2021 |
| As at December 31 (in millions of Canadian dollars) | | As at December 31 (in millions of Canadian dollars) | 2023 | 2022 |
| Deferred income tax assets | Deferred income tax assets | |
Tax losses and other attributes carried forward(1) | $ | 70 | | $ | 19 | |
| Tax losses and other attributes carried forward | |
| Tax losses and other attributes carried forward | |
| Tax losses and other attributes carried forward | |
| Liabilities carrying value in excess of tax basis | Liabilities carrying value in excess of tax basis | 108 | | 124 | |
| Unrealized foreign exchange losses | Unrealized foreign exchange losses | 50 | | — | |
| Environmental remediation costs | Environmental remediation costs | 22 | | 22 | |
Other(1) | 5 | | 5 | |
| Other | |
| | | Total deferred income tax assets | |
| | Total deferred income tax assets | |
| | Total deferred income tax assets | Total deferred income tax assets | 255 | | 170 | |
| Valuation allowance | Valuation allowance | (4) | | — | |
| Total net deferred income tax assets | Total net deferred income tax assets | $ | 251 | | $ | 170 | |
| Deferred income tax liabilities | Deferred income tax liabilities | |
| Investment in Kansas City Southern (Note 10) | 7,526 | | 7,079 | |
| Investment in Kansas City Southern (Note 12) | |
| Investment in Kansas City Southern (Note 12) | |
| Investment in Kansas City Southern (Note 12) | |
| Properties carrying value in excess of tax basis | Properties carrying value in excess of tax basis | 4,149 | | 3,887 | |
| Pensions carrying value in excess of tax basis | Pensions carrying value in excess of tax basis | 691 | | 441 | |
| Unrealized foreign exchange gains | — | | 13 | |
| Other | 82 | | 102 | |
| | Intangibles carrying value in excess of tax basis | |
| Intangibles carrying value in excess of tax basis | |
| Intangibles carrying value in excess of tax basis | |
Investments carrying value in excess of tax basis(1) | |
Other(1) | |
| Total deferred income tax liabilities | Total deferred income tax liabilities | 12,448 | | 11,522 | |
| Total net deferred income tax liabilities | Total net deferred income tax liabilities | $ | 12,197 | | $ | 11,352 | |
(1) 20212022 comparative figures have been reclassified to conform withto the current periodyear's presentation.
The Company’s consolidated effective income tax rate differs from the expected Canadian statutory tax rates. Expected income tax (recovery) expense at statutory rates is reconciled to income tax (recovery) expense as follows:
| | (in millions of Canadian dollars, except percentage) | 2022 | 2021 | 2020 |
| For the year ended December 31 (in millions of Canadian dollars, except percentage) | | For the year ended December 31 (in millions of Canadian dollars, except percentage) | 2023 | 2022 | 2021 |
| Statutory federal and provincial income tax rate (Canada) | Statutory federal and provincial income tax rate (Canada) | 26.12 | % | 26.12 | % | 26.31 | % | Statutory federal and provincial income tax rate (Canada) | 26.11 | % | 26.12 | % | 26.12 | % |
| Expected income tax expense at Canadian enacted statutory tax rates | $ | 1,083 | | $ | 946 | | $ | 842 | |
| Expected income tax (recovery) expense at Canadian enacted statutory tax rates | |
| (Decrease) increase in taxes resulting from: | (Decrease) increase in taxes resulting from: | |
| Gains not subject to tax | (9) | | (116) | | (23) | |
| Reversal of outside basis deferred tax (Note 11) | |
| Reversal of outside basis deferred tax (Note 11) | |
| Reversal of outside basis deferred tax (Note 11) | |
| Remeasurement loss of Kansas City Southern | |
| Losses (gains) not subject to tax | |
| Canadian tax rate differentials | Canadian tax rate differentials | (12) | | (22) | | (3) | |
| Foreign tax rate differentials | Foreign tax rate differentials | (94) | | (37) | | (32) | |
| Effect of tax rate decrease | Effect of tax rate decrease | (25) | | (11) | | (32) | |
| Deduction for dividends taxed on outside basis | Deduction for dividends taxed on outside basis | (270) | | — | | — | |
| Unrecognized tax benefits | Unrecognized tax benefits | (24) | | (2) | | (7) | |
| Inflation in Mexico | |
| Valuation allowance | |
| Other | Other | (21) | | 10 | | 13 | |
| Income tax expense | $ | 628 | | $ | 768 | | $ | 758 | |
| Income tax (recovery) expense | |
84 / CPKC 2023 ANNUAL REPORT
In 2022,2023, the Company recorded a deferred tax recovery of $19$23 million (U.S. $15$17 million) on the outside basis difference of the change in the equity investment in KCS from December 31, 2021.for the period January 1, 2023 to April 13, 2023, prior to acquiring control of KCS. In 2022 and 2021, deferred tax recoveries of $19 million (U.S. $15 million) and $33 million (U.S. $26 million), respectively, were recorded on the outside basis difference of the change in the equity investment in KCS. The outside basis difference is the excess of the carrying amount of the Company’s investment in KCS for financial reporting over the tax basis of this investment. Reversal
In 2023, the Company recorded a deferred tax recovery of this$7,832 million on the derecognition of the deferred tax liability is expected to be recognized through income tax expense.on the outside basis difference of the investment in KCS upon acquiring control.
In 2023, the Company revalued its deferred income tax balances as a result of decreases in the corporate income tax rates in the states of Iowa and Arkansas, resulting in a net recovery of $13 million. In 2022, the Company revalued its deferred income tax balances as a result of a corporate income tax rate decrease in the state of Iowa, resulting in a net recovery of $12 million.
In 2021, the Company recorded a deferred tax liability of $7.2 billion$7,178 million (U.S. $5.6 billion)$5,607 million) on the outside basis difference of its investment in KCS. This balance iswas held in a U.S. functional currency entity and subsequently revalued to $7.5 billion$7,526 million at December 31, 2022 ($7.1 billion7,079 million at December 31, 2021) due to changes in FX. In 2023, upon acquisition of control in KCS, the entire outside basis deferred tax liability was reversed through "income tax (recovery) expense" as mentioned above.
In 2021, the Company recorded a deferred tax recovery of $33 million (U.S. $26 million) on the outside basis difference of the change in the equity investment in KCS from initial recognition on December 14, 2021.
In 2020, the Company revalued its deferred income tax balances as a result of a tax filing election for the state of North Dakota resulting in a lower corporate income tax rate and a net recovery of $29 million.
With the exception of the deferred tax liability recorded on the outside basis difference of its investment in KCS, theThe Company has not provided a deferred liability for the income taxes if any, which might become payable on any temporary difference associated with its foreign investments because the Company intends to indefinitely reinvest in its foreign investments and has no intention to realize this difference by a sale of its interest in foreign investments. It is not practical to calculate the amount of the deferred tax liability.
It is more likely than not that the Company will realize the majority of its deferred income tax assets from the generation of future taxable income, as the payments for provisions, reserves, and accruals are made and losses and tax credits carried forward are utilized.
As at December 31, 2022,2023, the Company had tax effected operating losses carried forward of $22$52 million (2021(2022 – $15$22 million), which have been recognized as a deferred tax asset. The losses carried forward will begin to expire in 2034.2026. The Company expects to fully utilize these tax effected operating losses before their expiry. The Company did not have any minimum tax credits or investment tax credits carried forward.
As at December 31, 2022,2023, the Company had $2 million (2021(2022 – $2 million) in tax effected capital losses carried forward recognized as a deferred tax asset. The Company has no unrecognized tax benefits from capital losses as at December 31, 20222023 and 2021.2022.
As at December 31, 2023, the Company had $4 million in tax effected track maintenance credits carried forward recognized as a deferred tax asset, which will begin to expire in 2028. The Company did not have any minimum tax credits or investment tax credits carried forward.
The following table provides a reconciliation of uncertain tax positions in relation to unrecognized tax benefits for Canada, and the U.S., and Mexico for the yearyears ended December 31:
| | (in millions of Canadian dollars) | (in millions of Canadian dollars) | 2022 | 2021 | 2020 | (in millions of Canadian dollars) | 2023 | 2022 | 2021 |
| Unrecognized tax benefits at January 1 | Unrecognized tax benefits at January 1 | $ | 49 | | $ | 55 | | $ | 52 | |
| Increase in unrecognized: | Increase in unrecognized: | |
| Tax benefits related to the current year | Tax benefits related to the current year | 1 | | — | | — | |
| Tax benefits related to the current year | |
| Tax benefits related to the current year | |
| Tax benefits related to prior years | Tax benefits related to prior years | — | | — | | 10 | |
| Tax benefits acquired with KCS | |
| Dispositions: | Dispositions: | |
| Gross uncertain tax benefits related to prior years | |
| Gross uncertain tax benefits related to prior years | |
| Gross uncertain tax benefits related to prior years | Gross uncertain tax benefits related to prior years | (30) | | (6) | | (9) | |
| Settlements with taxing authorities | Settlements with taxing authorities | — | | — | | 2 | |
| Unrecognized tax benefits at December 31 | Unrecognized tax benefits at December 31 | $ | 20 | | $ | 49 | | $ | 55 | |
If these uncertainunrecognized tax positionsbenefits were recognized, all of the amount$17 million of unrecognized tax positionsbenefits as at December 31, 20222023 would impact the Company’s effective tax rate.
During the fourth quarter of 2019, a tax authority proposed an adjustment for a prior tax year without assessing taxes. Although the Company had commenced action to have the proposal removed, an increase in uncertain tax position was recorded onto deferred income tax liability and expense in the amount of $24 million. While the proposed adjustment was withdrawn during 2020, the ultimate resolution of this matter was not previously determinable.determinable until
CPKC 2023 ANNUAL REPORT / 85
2022. During the fourth quarter of 2022, the Company recorded a deferred tax recovery of $24 million to reverse this uncertain tax position as the amount iswas no longer expected to be realized.
The Company recognizes accrued interest, inflation and penalties related to unrecognized tax benefits as a component of "Income tax (recovery) expense" in the Company’s Consolidated Statements of Income. The net amount of accrued interest, inflation and penalties in 20222023 was a $3 million recovery (2022 – $5 million expense (2021expense; 2021 – $4 million expense; 2020 – $1 million recovery)expense). The total amount of accrued interest, inflation and penalties associated with unrecognized tax benefits as at December 31, 20222023 was $15 million (2022 – $18 million (2021million; 2021 – $13 million; 2020 – $9 million).
The Company and its subsidiaries are subject to either Canadian federal and provincial income tax, U.S. federal, state and local income tax, Mexican income tax or the relevant income tax in other international jurisdictions. The Company has substantially concluded all Canadian federal and provincial income tax matters for the
years through 2017.2018. The federal and provincial income tax returns filed for 20182019 and subsequent years remain subject to examination by the Canadian taxation authorities. The Canadian international audit for 20142017 and subsequent years is ongoing. The income tax returns for 20192020 and subsequent years continue to remain subject to examination by the IRS and U.S. state tax jurisdictions. Kansas City Southern de México, S.A. de C.V. (also known as Canadian Pacific Kansas City Mexico) ("CPKCM") has closed audit examinations for Mexican income tax returns for the years through 2020, except for the 2014 year which is currently in litigation (see Note 26). The CPKCM Mexican income tax returns filed for 2021 and subsequent years remain subject to examination by the Servicio de Administración Tributaria ("SAT”) (Mexican tax authority). There are certain Mexican subsidiaries with ongoing audits for the years 2016-2018 and 2021. As at December 31, 2023, the Company believes that it has recorded sufficient income tax reserves as at December 31, 2022, with respect to these income tax examinations.examinations and open tax years.
In December 2021, the Organization for Economic Co-operation and Development ("OECD") published model rules for a new global minimum tax framework ("Pillar Two"), and various governments around the world have issued, or are in the process of issuing, legislation regarding Pillar Two. The Company is in the process of assessing the full impact of this but does not expect it to have a material impact on the Company's future financial results.
Mexican tax audits
CPKCM closed audit examinations with the SAT for the tax years 2016-2020 in September 2023 and the tax years 2009-2010, 2013 and 2015 in November 2023. The audit examinations were for corporate income tax and value added tax (“VAT”). The settlement of these audits resulted in payments of $135 million and a $16 million reduction to the April 14, 2023 refundable VAT balance, which was classified within "Accounts receivable, net". The settlements primarily resulted in an increase of $90 million to "Goodwill" (see Note 11) and a current income tax expense to "Income tax (recovery) expense" of $13 million. In addition, a current income tax expense of $3 million for the year ended December 31, 2023 was recognized to reserve for potential future audit settlements. As a result, as at December 31, 2023, the estimated impact of potential future audit settlements for tax years after 2020 that were substantially reserved included a reduction to the April 14, 2023 refundable VAT balance of $9 million and an income tax reserve of $3 million, which was classified within "Accounts payable and accrued liabilities".
Mexican value added tax
As discussed above in Mexican tax audits, CPKCM closed audit examinations for Mexican VAT returns for the years through 2020, except for the 2014 year which is currently in litigation (see Note 26). The settlement and the estimated impact of potential future audit settlements resulted in an increase of $96 million to "Goodwill" (see Note 11) and a $25 million reduction to the April 14, 2023 refundable VAT balance. As of December 31, 2023 and April 14, 2023, the CPKCM refundable VAT balance was $nil and $55 million, respectively. Except for the 2014 year in litigation, there are no VAT disputes with the SAT as of December 31, 2023.
6.7. Earnings per share
| | (in millions of Canadian dollars, except per share data) | 2022 | 2021 | 2020 |
| Net income | $ | 3,517 | | $ | 2,852 | | $ | 2,444 | |
| For the year ended December 31 (in millions of Canadian dollars, except per share data) | | For the year ended December 31 (in millions of Canadian dollars, except per share data) | 2023 | 2022 | 2021 |
| Net income attributable to controlling shareholders | |
| Weighted-average basic shares outstanding (millions) | Weighted-average basic shares outstanding (millions) | 930.0 | | 679.7 | | 677.2 | |
| Dilutive effect of stock options (millions) | Dilutive effect of stock options (millions) | 2.9 | | 3.1 | | 2.7 | |
| Weighted-average diluted shares outstanding (millions) | Weighted-average diluted shares outstanding (millions) | 932.9 | | 682.8 | | 679.9 | |
| Earnings per share – basic | Earnings per share – basic | $ | 3.78 | | $ | 4.20 | | $ | 3.61 | |
| Earnings per share – diluted | Earnings per share – diluted | $ | 3.77 | | $ | 4.18 | | $ | 3.59 | |
In 2022,2023, there were 0.30.6 million options excluded from the computation of diluted earnings per share because their effects were not dilutive (2021(2022 – 0.3 million; 2021 – 0.1 million; 2020 – nil)million).
8586 / CP 2022CPKC 2023 ANNUAL REPORT
7.8. Other comprehensive (loss) income (loss) and accumulated other comprehensive (loss) income (loss)
The components of Other comprehensive (loss) income (loss) and the related tax effects attributable to controlling shareholders are as follows:
| | | | | | | | | | | |
| (in millions of Canadian dollars) | Before
tax amount | Income tax (expense) recovery | Net of tax
amount |
| For the year ended December 31, 2022 | | | |
| Unrealized foreign exchange gain (loss) on: | | | |
| Translation of the net investment in U.S. subsidiaries and equity method investees | $ | 2,099 | | $ | — | | $ | 2,099 | |
| Translation of the U.S. dollar-denominated long-term debt designated as a hedge of the net investment in U.S. subsidiaries and equity method investees (Note 16) | (471) | | 59 | | (412) | |
| Realized loss on derivatives designated as cash flow hedges recognized in income | 6 | | (2) | | 4 | |
| Change in pension and other benefits actuarial gains and losses | 706 | | (182) | | 524 | |
| Change in prior service pension and other benefit costs | (26) | | 7 | | (19) | |
| Equity accounted investments | (5) | | 3 | | (2) | |
| Other comprehensive income | $ | 2,309 | | $ | (115) | | $ | 2,194 | |
| For the year ended December 31, 2021 | | | |
| Unrealized foreign exchange (loss) gain on: | | | |
| Translation of the net investment in U.S. subsidiaries and equity method investees | $ | (316) | | $ | — | | $ | (316) | |
| Translation of the U.S. dollar-denominated long-term debt designated as a hedge of the net investment in U.S. subsidiaries and equity method investees (Note 16) | 25 | | (3) | | 22 | |
| Change in derivatives designated as cash flow hedges: | | | |
| Realized loss on derivatives designated as cash flow hedges recognized in income | 10 | | (3) | | 7 | |
| Unrealized gain on cash flow hedges | 38 | | (9) | | 29 | |
| Change in pension and other benefits actuarial gains and losses | 1,286 | | (323) | | 963 | |
| Equity accounted investments | 9 | | (3) | | 6 | |
| Other comprehensive income | $ | 1,052 | | $ | (341) | | $ | 711 | |
| For the year ended December 31, 2020 | | | |
| Unrealized foreign exchange (loss) gain on: | | | |
| Translation of the net investment in U.S. subsidiaries | $ | (118) | | $ | — | | $ | (118) | |
| Translation of the U.S. dollar-denominated long-term debt designated as a hedge of the net investment in U.S. subsidiaries (Note 16) | 136 | | (18) | | 118 | |
| Realized loss on derivatives designated as cash flow hedges recognized in income | 10 | | (3) | | 7 | |
| Change in pension and other benefits actuarial gains and losses | (403) | | 108 | | (295) | |
| Change in prior service pension and other benefit costs | (4) | | 1 | | (3) | |
| Equity accounted investments | (1) | | — | | (1) | |
| Other comprehensive loss | $ | (380) | | $ | 88 | | $ | (292) | |
| | | | | | | | | | | |
| (in millions of Canadian dollars) | Before
tax amount | Income tax (expense) recovery | Net of tax
amount |
| For the year ended December 31, 2023 | | | |
| Unrealized foreign exchange (loss) gain on: | | | |
| Translation of the net investment in U.S. subsidiaries and equity method investees | $ | (840) | | $ | — | | $ | (840) | |
| Translation of the U.S. dollar-denominated long-term debt designated as a hedge of the net investment in U.S. subsidiaries and equity method investees (Note 18) | 194 | | (22) | | 172 | |
| Realized loss on derivatives designated as cash flow hedges recognized in income | 7 | | (2) | | 5 | |
| Change in pension and other benefits actuarial gains and losses | (57) | | 16 | | (41) | |
| Change in prior service pension and other benefit costs | (16) | | 4 | | (12) | |
| Equity accounted investments | 7 | | — | | 7 | |
| Other comprehensive loss | $ | (705) | | $ | (4) | | $ | (709) | |
| For the year ended December 31, 2022 | | | |
| Unrealized foreign exchange gain (loss) on: | | | |
| Translation of the net investment in U.S. subsidiaries and equity method investees | $ | 2,099 | | $ | — | | $ | 2,099 | |
| Translation of the U.S. dollar-denominated long-term debt designated as a hedge of the net investment in U.S. subsidiaries and equity method investees (Note 18) | (471) | | 59 | | (412) | |
| Realized loss on derivatives designated as cash flow hedges recognized in income | 6 | | (2) | | 4 | |
| Change in pension and other benefits actuarial gains and losses | 706 | | (182) | | 524 | |
| Change in prior service pension and other benefit costs | (26) | | 7 | | (19) | |
| Equity accounted investments | (5) | | 3 | | (2) | |
| Other comprehensive income | $ | 2,309 | | $ | (115) | | $ | 2,194 | |
| For the year ended December 31, 2021 | | | |
| Unrealized foreign exchange (loss) gain on: | | | |
| Translation of the net investment in U.S. subsidiaries and equity method investees | $ | (316) | | $ | — | | $ | (316) | |
| Translation of the U.S. dollar-denominated long-term debt designated as a hedge of the net investment in U.S. subsidiaries and equity method investees (Note 18) | 25 | | (3) | | 22 | |
| Change in derivatives designated as cash flow hedges: | | | |
| Realized loss on derivatives designated as cash flow hedges recognized in income | 10 | | (3) | | 7 | |
| Unrealized gain on cash flow hedges | 38 | | (9) | | 29 | |
| Change in pension and other benefits actuarial gains and losses | 1,286 | | (323) | | 963 | |
| Equity accounted investments | 9 | | (3) | | 6 | |
| Other comprehensive income | $ | 1,052 | | $ | (341) | | $ | 711 | |
CP 2022CPKC 2023 ANNUAL REPORT 86/ 87
Changes in Accumulated other comprehensive (loss) incomeAOCI attributable to controlling shareholders, net of tax, by component are as follows:
| | | | | | | | | | | | | | | | | |
| (in millions of Canadian dollars) | Foreign currency
net of hedging
activities(1) | Derivatives(1) | Pension and post-
retirement defined
benefit plans(1) | Equity accounted investments(1) | Total(1) |
| Opening balance, January 1, 2022 | $ | (182) | | $ | (4) | | $ | (1,915) | | $ | (2) | | $ | (2,103) | |
| Other comprehensive income before reclassifications | 1,687 | | — | | 387 | | 164 | | 2,238 | |
| Amounts reclassified from accumulated other comprehensive loss | — | | 4 | | 118 | | (166) | | (44) | |
| Net other comprehensive income (loss) | 1,687 | | 4 | | 505 | | (2) | | 2,194 | |
| Closing balance, December 31, 2022 | $ | 1,505 | | $ | — | | $ | (1,410) | | $ | (4) | | $ | 91 | |
| Opening balance, January 1, 2021 | $ | 112 | | $ | (40) | | $ | (2,878) | | $ | (8) | | $ | (2,814) | |
| Other comprehensive (loss) income before reclassifications | (294) | | 28 | | 808 | | 6 | | 548 | |
| Amounts reclassified from accumulated other comprehensive loss | — | | 8 | | 155 | | — | | 163 | |
| Net other comprehensive (loss) income | (294) | | 36 | | 963 | | 6 | | 711 | |
| Closing balance, December 31, 2021 | $ | (182) | | $ | (4) | | $ | (1,915) | | $ | (2) | | $ | (2,103) | |
(1) Amounts are presented net of tax.
8. Accounts receivable, net
| | | | | | | | | | | | | | | | | | | | |
| As at December 31, 2022 | As at December 31, 2021 |
| (in millions of Canadian dollars) | Freight | Non-Freight | Total | Freight | Non-Freight | Total |
| Total accounts receivable | $ | 785 | | $ | 272 | | $ | 1,057 | | $ | 614 | | $ | 239 | | $ | 853 | |
| Allowance for credit losses | (27) | | (14) | | (41) | | (20) | | (14) | | (34) | |
| Total accounts receivable, net | $ | 758 | | $ | 258 | | $ | 1,016 | | $ | 594 | | $ | 225 | | $ | 819 | |
| | | | | | | | | | | | | | | | | |
| (in millions of Canadian dollars) | Foreign currency net of hedging activities | Derivatives | Pension and post- retirement defined benefit plans | Equity accounted investments | Total |
| Opening balance, January 1, 2023 | $ | 1,505 | | $ | — | | $ | (1,410) | | $ | (4) | | $ | 91 | |
| Other comprehensive (loss) income before reclassifications | (668) | | — | | (79) | | 6 | | (741) | |
| Amounts reclassified from AOCI | — | | 5 | | 26 | | 1 | | 32 | |
| Net other comprehensive (loss) income | (668) | | 5 | | (53) | | 7 | | (709) | |
| Closing balance, December 31, 2023 | $ | 837 | | $ | 5 | | $ | (1,463) | | $ | 3 | | $ | (618) | |
| Opening balance, January 1, 2022 | $ | (182) | | $ | (4) | | $ | (1,915) | | $ | (2) | | $ | (2,103) | |
| Other comprehensive income before reclassifications | 1,687 | | — | | 387 | | 164 | | 2,238 | |
| Amounts reclassified from AOCI | — | | 4 | | 118 | | (166) | | (44) | |
| Net other comprehensive income (loss) | 1,687 | | 4 | | 505 | | (2) | | 2,194 | |
| Closing balance, December 31, 2022 | $ | 1,505 | | $ | — | | $ | (1,410) | | $ | (4) | | $ | 91 | |
9. Accounts receivable, net
| | | | | | | | | | | | | | | | | | | | |
| As at December 31, 2023 | As at December 31, 2022 |
| (in millions of Canadian dollars) | Freight | Non-freight | Total | Freight | Non-freight | Total |
| Total accounts receivable | $ | 1,559 | | $ | 417 | | $ | 1,976 | | $ | 785 | | $ | 272 | | $ | 1,057 | |
| Allowance for credit losses | (63) | | (26) | | (89) | | (27) | | (14) | | (41) | |
| Total accounts receivable, net | $ | 1,496 | | $ | 391 | | $ | 1,887 | | $ | 758 | | $ | 258 | | $ | 1,016 | |
10. Property sale
During the first quarter of 2021, the Company exchangedprovided property to a government agency in exchange for property and property easements in Chicago with a government agency for proceeds of $103 million including cash of $61 million and property and permanent easement assets at a fair valuevalues of $33 million and $9 million, respectively.respectively, and cash of $61 million. Fair value wasvalues were determined based on comparable market transactions. The Company recorded a gain withinin "Purchased services and other" of $50 million ($38 million after tax) from the transaction, and a deferred gain of $53 million, which is being recognized in income over the period of use of certain easements. The Company recognized $14 million of the deferred gain into income in 2022 (2021 –2023 (2022 - $14 million; 2021 - $13 million)).
There were no significant property sales transacted in 2023 or 2022.
10.11. Business acquisitionsacquisition
KCS
On March 21,September 15, 2021, the Company entered into an Agreement and Plan of Merger (the "Original Merger"Merger Agreement") with KCS, under which CP agreed to acquire KCS in a stock and cash transaction. KCS is a U.S. Class I railway, with approximately 7,100 route miles extending from the midwest and southeast portionsobjective of creating the United States south intoonly single railroad link the U.S., Mexico and connects with all Class I railways. KCS is connected to the CP network at Kansas City.Canada.
OnPreviously, on March 21, 2021, the Company had entered a merger agreement (the “Original Merger Agreement”) with KCS. However, on May 21, 2021, KCS terminated the Original Merger Agreement with the Company in order to enter into a merger agreement with Canadian National Railway Company ("CN") (the "CN Merger Agreement"). As a result, and underUnder the terms of the Original Merger Agreement, KCS concurrently paid a merger termination fee of $845 million (U.S. $700 million)$700 million) to the Company, recorded as "Merger termination fee" in the Company's 2021 Consolidated Statements of Income.
On August 10, 2021, CP submitted a proposal to acquire KCS in a stock and cash transaction representing an enterprise value of approximately U.S. $31 billion, based on the CP closing price on August 9, 2021, which included the assumption of U.S. $3.8 billion of outstanding KCS debt. The terms of the proposal were very similar in nearly every respect to those in the Original Merger Agreement, except for an increase in the share exchange ratio from 2.445 to 2.884. Following the Surface Transportation Board's ("STB") decision on August 31, 2021 to refuse CN and KCS's joint motion for voting trust approval in respect of the CN Merger Agreement, and after renewed negotiations with CP, KCS's Board of Directors deemed CP's proposal a "Company Superior Proposal", as defined in the CN Merger Agreement, and terminated the CN Merger Agreement.
On September 15, 2021, upon KCS's termination ofKCS terminated the CN Merger Agreement, the Companypaid U.S. $1,400 million in merger termination fees, and entered into an Agreement and Plan of Merger (the "Merger Agreement") with KCS. Pursuant to the terms of the CN Merger Agreement KCS paid a merger termination fee of U.S. $700 million and refundedwith the CP merger termination fee of U.S. $700 million to CN (together, the "CN merger termination fees").Company. In connection with the Merger Agreement the Company remitted $1,773 million (U.S. $1,400 million) to KCS on September 15, 2021 in connection withto compensate KCS for payments it was required to make to CN. This payment to KCS was KCS's payment of the CN merger termination fees, included as part of the cost of the acquisition of KCS within "Investment in Kansas City Southern" in the Company's Consolidated Balance Sheets. This payment isSheets and was included in "Investment in Kansas City Southern" onin the Company's Consolidated Statements of Cash Flows.
88 / CPKC 2023 ANNUAL REPORT
On December 14, 2021, following approvalthe Company purchased 100% of the transaction by the shareholders of both the Companyissued and KCS, receipt of Mexican regulatory approvals, satisfaction or waiver of customary closing conditions and pursuant to the terms set forth in the Merger Agreement, the acquisition of KCS was consummated and all outstanding stock of KCS which was deposited into a voting trust and held by a single trustee as trust stock. KCS's management andwhile the U.S. Surface Transportation Board (the "STB") reviewed the Company's proposed control of Directors will continue to steward KCS while it is in trust, pursuing its independent business plan and growth strategies. Under the terms of the Merger Agreement,KCS. In exchange, the Company issued approximately 262.6 million Common Shares to existing KCS common stockholders at the exchange ratio of 2.884 Common Shares per share of KCS common stock (valued at $23.5 billionor $23,461 million (U.S. $18.3 billion))$18,282 million) and paid cash consideration to existing KCS stockholders of (i) U.S. $90 per share of KCS common stock and (ii) U.S. $37.50 per share of KCS preferred stock, for a total of approximately $10.5 billiontotalling $10,526 million (U.S. $8.2 billion). Share consideration, cash consideration, and the above described payments to KCS totalled approximately $36 billion (U.S. $28 billion)$8,203 million). The cashtotal consideration paid to acquire KCS, including the payment made in connection with the CN merger termination described above was $35,760 million (U.S. $27,885 million). Cash consideration paid in connection with the acquisition was financed by issuances of long-term debt of approximately $2.2 billion and $8.6 billion (U.S. $6.7 billion) on November 24, 2021 and December 2, 2021, respectively (see Note 15)17).
TheOn March 15, 2023, the STB approved the Company accounts forand KCS’s joint merger application, and the Company assumed control of KCS on April 14, 2023 (the "Control Date"). From December 14, 2021 to April 13, 2023 the Company recorded its investment in KCS using the equity method of accounting while(Note 12).
Accordingly, the STB considersCompany commenced consolidation of KCS on the Company's application to control KCS.Control Date, accounting for the acquisition as a business combination achieved in stages. The results from operations and cash flows have been consolidated prospectively from the Control Date. The Company derecognized its previously held equity method investment in KCS of $45,091$44,402 million as of April 13, 2023 and remeasured the investment at its Control Date fair value of $37,227 million, which formed part of the purchase consideration, resulting in a net remeasurement loss of $7,175 million. In addition, a deferred income tax recovery of $7,832 million was recognized upon the derecognition of the deferred tax liability computed on the outside basis that the Company had recognized in relation to its investment in KCS while accounted for using the equity method. The fair value of the previously held equity interest in KCS was determined by a discounted cash flow approach, which incorporated the Company’s best estimates of long-term growth rates, tax rates, discount rates, and terminal multiples.
The identifiable assets acquired, and liabilities and non-controlling interest assumed were measured at their provisional fair values at the Control Date, with certain exceptions, including income taxes, certain contingent liabilities and contract liabilities. The provisional fair values of the tangible assets were determined using valuation techniques including, but not limited to, the market approach and the cost approach. The significant assumptions used to determine the provisional fair value of the tangible assets included, but were not limited to, a selection of comparable assets and an appropriate inflation rate. Presented with the acquired Properties are concession and related assets held under the terms of a concession from the Mexican government. The Concession expires in June 2047 and is renewable under certain conditions for additional periods, each of up to 50 years.
The provisional fair values of the intangible assets were determined using valuation techniques including, but not limited to, the multi-period excess earnings method, the replacement cost method, the relief from royalty method and the income approach. The significant assumptions used to determine the provisional fair values of the intangible assets included, but were not limited to, the renewal probability and term of the Mexican concession extension, discount rates, earnings before interest, tax, depreciation, and amortization ("EBITDA") margins and terminal growth rates.
The fair value of the non-controlling interest was determined using a combination of the income and market approaches to determine the fair value of Meridian Speedway LLC in which Norfolk Southern Corporation ("NSC") owns a non-controlling interest, and this fair value was allocated proportionately between KCS and NSC.
At December 31, 2023, the accounting for the acquisition of KCS remains incomplete as the Company continues to validate the provisional fair values assigned to acquired assets and assumed liabilities. This validation will be completed during the measurement period as additional information is obtained about facts and circumstances as of the Control Date that will assist in the determination of the fair values of these assets and liabilities. Measurement uncertainty exists at December 31, 2022, included $1,074 million2023 with respect to, but not limited to, working capital balances, “Investments”, “Properties”, “Intangible assets”, “Other assets”, “Pensions and other benefit liabilities”, “Other long-term liabilities”, and “Deferred income taxes”.
CPKC 2023 ANNUAL REPORT / 89
The following table summarizes the preliminary purchase price allocation with the amounts recognized in respect of the identifiable assets acquired and liabilities and non-controlling interest assumed on the Control Date, as well as the fair value of the previously held equity earnings ofinterest in KCS and foreign currency translationthe measurement period adjustments recorded during the year:
| | | | | | | | | | | |
| (in millions of Canadian dollars) | Reported at
April 14, 2023 | Measurement period adjustments | Reported at December 31, 2023 |
| Net assets acquired: | | | |
| Cash and cash equivalents | $ | 298 | | $ | — | | $ | 298 | |
| Net working capital | 51 | | (110) | | (59) | |
| Properties | 28,748 | | 1 | | 28,749 | |
| Intangible assets | 3,022 | | — | | 3,022 | |
| Other long-term assets | 496 | | (5) | | 491 | |
| Debt including debt maturing within one year | (4,545) | | — | | (4,545) | |
| Deferred income taxes | (6,984) | | 42 | | (6,942) | |
| Other long-term liabilities | (406) | | (2) | | (408) | |
| Total identifiable net assets | $ | 20,680 | | $ | (74) | | $ | 20,606 | |
| Goodwill | 17,491 | | 74 | | 17,565 | |
| $ | 38,171 | | $ | — | | $ | 38,171 | |
| Consideration: | | | |
| Fair value of previously held equity method investment | $ | 37,227 | | $ | — | | $ | 37,227 | |
| Intercompany payable balance, net acquired | 12 | | — | | 12 | |
| Fair value of non-controlling interest | 932 | | — | | 932 | |
| Total | $ | 38,171 | | $ | — | | $ | 38,171 | |
During the year ended December 31, 2023, measurement period adjustments were recorded as a result of $2,891new information that was obtained about facts and circumstances of certain KCS assets and liabilities at the Control Date. The new information was primarily in relation to CPKCM’s VAT assets and liabilities, as well as income and other tax positions, discussed further in Note 6. Other adjustments recorded in relation to assets and liabilities were not significant in value. These adjustments to the Company's Consolidated Balance Sheet had a negligible impact to the Company's net income in 2023.
Acquired cash and cash equivalents of $298 million offset by dividendsare presented as an investing activity on the Company's Consolidated Statements of $1,157Cash Flows for the year ended December 31, 2023.
The net working capital acquired included trade receivables of $704 million receivedand accounts payable and accrued liabilities of $970 million.
Intangible assets of $3,022 million consist of contracts and customer relationships with amortization periods of nine to 22 years as well as U.S. trackage rights and the KCS brand with indefinite estimated useful lives. Included in the acquired Properties are concession rights and related assets held under the terms of a concession from the Mexican government, which have provisional fair values totalling $9,176 million. The Concession rights and related assets are amortized over the shorter of the underlying asset lives and the estimated concession term, including one renewal period, of 74 years.
Net working capital and Other long-term liabilities included environmental liabilities of $15 million and $132 million, respectively, and legal and personal injury claims of $28 million and $40 million, respectively, which are contingent on the outcome of uncertain future events. The values are measured at estimated cost and evaluated for changes in facts at the end of the reporting period.
The excess of the total consideration, over the amounts allocated to acquired assets and assumed liabilities and the non-controlling interest recognized, has been recognized as goodwill of $17,565 million. Goodwill represents future synergies and an acquired assembled workforce. All of the goodwill has been assigned to the rail transportation operating segment. None of the goodwill is expected to be deductible for income tax purposes.
The Consolidated Statement of Income for the year ended December 31, 2023 included revenue of $3,467 million and net income attributable to controlling shareholders of $682 million from KCS, from the period of April 14, 2023 to December 31, 2023. On a pro forma basis, if the Company had consolidated KCS starting January 1, 2022, the revenue and net income attributable to controlling shareholders of the combined entity would be as follows for the years ended December 31, 2023 and December 31, 2022:
90 / CPKC 2023 ANNUAL REPORT
| | | | | | | | | | | | | | |
| For the year ended December 31, 2023 | For the year ended December 31, 2022 |
| (in millions of Canadian dollars) | KCS Historical(1) | Pro Forma CPKC | KCS Historical(1) | Pro Forma CPKC |
| Revenue | $ | 1,351 | | $ | 13,909 | | $ | 4,390 | | $ | 13,217 | |
| Net income attributable to controlling shareholders | 280 | | 3,174 | | 1,287 | | 4,153 | |
(1) KCS's results were translated into Canadian dollars at the Bank of Canada daily exchange rate for the period from January 1 to April 13, 2023 and year ended December 31, 2022 with effective exchange rates of $1.35 and $1.30, respectively.
For the years ended December 31, 2023 and December 31, 2022, the supplemental pro forma Net income attributable to controlling shareholders for the combined entity were adjusted for:
•the removal of the remeasurement loss of $7,175 million upon the derecognition of CPRL's previously held equity method investment in KCS from the year ended December 31, 2023, which included the reclassification of associated AOCI to retained earnings; and recognition of this remeasurement loss in the year ended December 31, 2022. Included within2022;
•depreciation and amortization of differences between the $1,074 millionhistoric carrying value and the preliminary fair value of tangible and intangible assets and investments prior to the Control Date;
•amortization of differences between the carrying amount and the fair value of debt through net interest expense prior to the Control Date;
•the elimination of intercompany transactions prior to the Control Date between the Company and KCS;
•miscellaneous amounts have been reclassified across revenue, operating expenses, and non-operating income or expense, consistent with CPKC's financial statement captions;
•the removal of equity earnings from KCS, previously held as an equity method investment prior to the Control Date, of KCS recognized$230 million and $1,074 million for the years ended December 31, 2023 and December 31, 2022, respectively;
•transaction costs incurred by the Company; and
•income tax adjustments including:
◦the derecognition of a deferred tax recovery of $7,832 million for the year ended December 31, 2022, was2023 related to the elimination of the deferred income tax liability on the outside basis difference of the investment in KCS; and recognition of this deferred income tax recovery in the year ended December 31, 2022;
◦the derecognition of a deferred tax recovery for the year ended December 31, 2023 on CPKC unitary state apportionment changes; and recognition of these CPKC unitary state apportionment changes in the year ended December 31, 2022;
◦a deferred tax recovery prior to the Control Date on amortization (net of tax) of $163 million of basis differences (see Note 11). These basis differences relatefair value adjustments to depreciable property, plant and equipment,investments, properties, intangible assets and debt; and
◦a current tax recovery on transaction costs expected to be incurred by CPKC.
During the year ended December 31, 2023, the Company incurred $190 million in acquisition-related costs, of which:
•$71 million were recognized in "Compensation and benefits" primarily related to restructuring costs, retention and synergy related incentive compensation costs;
•$2 million were recognized in "Materials";
•$111 million were recognized in "Purchased services and other" including third party purchased services, and payments made to certain communities across the combined network to address the environmental and social impacts of increased traffic as required by voluntary agreements with definite lives,communities and long-term debt,conditions imposed by the STB pursuant to the STB's final decision approving the Company and are amortized over theKCS's joint merger application, including, but not limited to, payments related assets' remaining useful lives,to new crossings, closure of existing crossings and the remaining terms to maturityother infrastructure projects; and
•$6 million were recognized in "Other expense".
KCS incurred acquisition-related costs of the debt instruments.$11 million between January 1, 2023 and April 13, 2023, which were included within "Equity (earnings) loss of Kansas City Southern".
During the year ended December 31, 2022, the Company incurred $74 million in acquisition-related costs recordedrecognized within "Purchased services and other" in the Company's Consolidated Statements of Income.. Acquisition-related costs of $49 million incurred by KCS during the year ended December 31, 2022, arewere included withinin "Equity (earnings) loss of Kansas City Southern" in the Company's Consolidated Statements of Income. Equity earnings of KCS recognized for the year ended December 31, 2022, also included KCS's gain on the unwinding of interest rate hedges of $212 million, which was net of CP's associated purchase accounting basis differences and tax..
During the year ended December 31, 2021, the Company incurred $599 million in acquisition-related costs associated with the KCS acquisition, of which $183 million were recorded withinrecognized in "Purchased services and other"and $247 million were recorded withinrecognized in "Other expense (income)" in the Company's Consolidated Statements of Income.expense". Acquisition-related costs of $169 million, incurred by KCS during the 18 days from the date the acquisition closed into the voting trust, arewere included withinin "Equity (earnings) loss of Kansas City Southern" in the Company's Consolidated Statements of Income.. The acquisition-related costs recorded withinrecognized in "Other expense (income)" includeexpense" included the changes in fair value and realized gain from settlement of the FX forward contracts, changes in fair value and realized loss of the bond locks and forward starting floating-to-fixed interest rate swaps associated with the debt issuances (see Note 15)18), amortization of financing fees associated with the credit facilities, (see Note 15), and FX gains on U.S. dollar-denominated cash on hand from the issuances of long-term debt to fund the KCS acquisition. Total financing fees paid for a bridge facility associated with the KCS acquisition for the year ended December 31, 2021 were $51 million, , presented under "Cash (used in) provided byused in financing activities" in the Company's Consolidated Statements of Cash Flows.
DRTP
On December 22, 2020, CP completed its acquisition of the 83.5% ownership of the Detroit River Tunnel Partnership (“DRTP”) held by OMERS Infrastructure Management Inc. (“OMERS”) for cash, net of cash acquired, of $398 million. The purchase price was subject to customary closing adjustments, including any final adjustment for closing working capital and certain closing costs. With this acquisition CP obtained 100% ownership of DRTP. The acquisition of DRTP will reduce CP’s operating costs related to movements through the tunnel which amounted to approximately $34 million in 2020, and better integrate the eastern part of the network. DRTP owns a 1.6-mile rail tunnel linking Windsor, Ontario, and Detroit, Michigan and additional, separate lands in both cities. The acquisition was funded with cash from operations and CP's commercial paper program.
The acquisition of DRTP was accounted for as a business combination under the acquisition method of accounting. The acquired assets and assumed liabilities were recorded at their estimated fair values at the date of acquisition. The fair values were estimated by applying an income approach using the discounted cash flow method of future cash flows, appraised land values reflecting a corridor enhancement factor where appropriate, and depreciated replacement cost for depreciable assets including the tunnel, track, signaling systems, and other railway related infrastructure assets.
CP 2022CPKC 2023 ANNUAL REPORT 88/ 91
Prior to
During the closeyear ended December 31, 2023, the Company recognized $297 million ($228 million after deferred income tax recovery of the transaction, CP owned a 16.5% interest$69 million) of KCS purchase accounting representing incremental depreciation and amortization in DRTP, which was accounted for as an equity method investment. The previously held equity investment was remeasuredrelation to fair value which was determined fromadjustments to depreciable property, plant and equipment, intangible assets with definite lives, and long-term debt, and amortized over the negotiated purchase price that reflected a market value established in a competitive bid process. As a resultrelated assets' remaining useful lives, and the remaining terms to maturity of the acquisition,debt instruments in 2020,"Net income attributable to controlling shareholders", including costs of:
•$234 million recognized in "Depreciation and amortization";
•$1 million recognized in "Purchased services and others";
•$17 million recognized in "Net interest expense";
•$2 million recognized in "Other expense";
•$48 million recognized in "Equity (earnings) loss of Kansas City Southern"; and
•a recovery of $5 million recognized in "Net loss attributable to non-controlling interest".
During the year ended December 31, 2022, the Company recognized a before-tax gain$163 million KCS purchase accounting in "Equity (earnings) loss of $68 million on the remeasurement to fair value of its equity interest within "Purchased services and other", calculated as the difference between the fair value of CP's 16.5% interest in DRTP of $81 million and the book value of the interest of $13 million. The following summarizes the fair values of the acquired assets and liabilities of DRTP:
| | | | | |
(in millions of Canadian dollars) | December 22, 2020 |
Fair value of net assets acquired: | |
Accounts receivable, net | $ | 5 | |
Properties | 436 | |
Intangible assets (Note 13) | 4 | |
Accounts payable and accrued liabilities | (1) | |
Deferred taxes | (55) | |
Total identifiable assets and liabilities | $ | 389 | |
Goodwill (Note 13) | 90 | |
| $ | 479 | |
Consideration: | |
Cash, net of cash acquired | $ | 398 | |
Fair value of previously held equity method investment | 81 | |
Total consideration | $ | 479 | |
The goodwill of $90 million relates primarily to the contract that DRTP has for CP’s use of the tunnel and deferred taxes recognized as a result of the purchase price allocation. The goodwill recognized is not deductible for tax purposes.
Prior to the acquisition of DRTP, CP had pre-existing agreements to use the tunnel and to operate and manage the tunnel on behalf of DRTP. On acquisition, no gain or loss was recognized in respect of the effective settlement of these pre-existing relationships as they were determined to be at fair market value based on an assessment of current market conditions and market participants.
Acquired cash and cash equivalents of $6 million is presented as a reduction of cash used in investing activities in the Company's 2020 Consolidated Statements of Cash Flows.
CP has not provided pro forma information relating to the pre-acquisition period as it is not material.Kansas City Southern".
11.12. Investment in KCSKansas City Southern
On DecemberApril 14, 2021,2023, the Company acquiredassumed control of KCS and deposited 100%subsequently derecognized its previously held equity method investment in KCS. The carrying amount of the outstanding KCS common stock into a voting trust. The Company recorded itsCompany's equity investment in KCS at its acquisition cost underreported in the equity method of accounting pending approval from the STB of the Company's application for control of KCS.
The investment carrying cost of $45,091 million reported on the Company's Consolidated Balance Sheets as at December 31, 2022 (December 31, 2021 - $42,309 million) reflectsprior to derecognition reflected the total of the consideration paid to acquire KCS (see Note 11), the offsetting asset recorded on recognition of a deferred tax liability computed on an outside basis (see Note 5)6), the subsequent recognition of equity income recorded in Equity"Equity (earnings) loss of KCSKansas City Southern" and Other Comprehensive"Other comprehensive Income of KCS,(loss) from equity investees", the receipt of dividends from KCS, and foreign currency translation based on the year-endperiod-end exchange rate.
The approximate $30Company estimated approximately $30.0 billion difference in valueof basis differences between thethe consideration paid to acquire KCS and the underlying carrying value of the net assets of KCS as at December 14, 2021, immediately prior to the acquisition by2021. While the Company is the basis difference. The Company has estimated the fair value ofaccounted for its investment in KCS and its underlying net assets for the purposes of amortizing the basis difference, as required by using the equity method of accounting. The fair valueaccounting from December 14, 2021 until April 13, 2023, the basis difference was amortized and recorded as a reduction of KCS's underlying net assets, including property, plant and equipment, identifiable intangible assets, and other assets and liabilities, have been estimated on a preliminary basis and may be subject to change as additional information becomes available.the Company's equity earnings of KCS
. The basis differences that relaterelated to depreciable property, plant and equipment, intangible assets with definite lives, and long-term debt arewere amortized over the related assets' remaining useful lives, and the remaining terms to maturity of the debt instruments. The basis difference that related to interest rate
hedges was reversed upon derecognition by KCS. The remainder of the basis difference,differences, relating to non-depreciable property, plant and equipment, intangible assets with indefinite lives, and equity method goodwill, iswere not amortized and is carried at cost subject to an assessment for impairment.
SubjectFor the period from January 1 to final approval by the STB,April 13, 2023, the Company would obtain controlrecognized $230 million of equity earnings of KCS (year ended December 31, 2022 - $1,074 million), and would account for its acquisitionreceived dividends from KCS of KCS as a business combination using the acquisition method of accounting. As a result, the Company would be required to remeasure the carrying value of its equity method investment in KCS to fair value. Any resultant change in the value$300 million (year ended December 31, 2022 - $1,157 million). The foreign currency translation of the investment in KCS would betotalled a FX loss of $578 million (year ended December 31, 2022 - an FX gain of $2,891 million). Included within the equity earnings of KCS recognized as afor the period from January 1 to April 13, 2023 was amortization (net of tax) of basis differences of $48 million (year ended December 31, 2022 - $163 million). Equity earnings of KCS recognized for the year ended December 31, 2022 also included KCS's gain or loss in the Company’s Consolidated Statementson unwinding of Income, including the write-downinterest rate hedges of that portion$212 million, which is net of the carrying value of the investment in KCS recorded as an offsetting asset to the outsideCompany's associated purchase accounting basis deferred tax liability (see Note 5).differences and tax.
The following tables present summarized financial information for KCS, on its historical cost basis:
StatementConsolidated Statements of Income
| (in millions of Canadian dollars)(1) | (in millions of Canadian dollars)(1) | For the year ended December 31, 2022 | For the period December 14 to December 31, 2021 | (in millions of Canadian dollars)(1) | For the period January 1 to April 13, 2023 | For the year ended December 31, 2022(3) | For the period December 14 to December 31, 2021 |
| Total revenues | Total revenues | $ | 4,387 | | $ | 178 | |
| Total operating expenses | Total operating expenses | 2,790 | | 287 | |
| Operating income (loss) | Operating income (loss) | 1,597 | | (109) | |
Less: Other(2) | Less: Other(2) | (108) | | 12 | |
| Income (loss) before income taxes | Income (loss) before income taxes | 1,705 | | (121) | |
| Net income (loss) | Net income (loss) | $ | 1,278 | | $ | (106) | |
(1) Amounts translated at the average FX rate for the period from January 1 to April 13, 2023 of $1.00 USD = $1.35 CAD, for the year ended December 31, 2022 of $1.00 USD = $1.30 CAD, and for the period from December 14 to 31, 2021 of $1.00 USD = $1.28 CAD.
(2) Includes Equity in net earnings of KCS's affiliates, Interest expense, FX loss, Gain on settlement of treasury lock agreements, and Other income, net.
(3) Certain 2022 comparative figures have been revised to conform with current year's presentation regarding translation of KCS's historical results from U.S. dollars to Canadian dollars.
92 / CPKC 2023 ANNUAL REPORT
Consolidated Balance Sheet
| | | | | | | | |
(in millions of Canadian dollars)(1) | As at December 31, 2022 | As at December 31, 2021 |
| Assets | | |
| Current assets | $ | 1,441 | | $ | 1,120 | |
| Properties | 12,680 | | 11,676 | |
| Other non-current assets | 340 | | 425 | |
| | |
| Liabilities | | |
| Current liabilities | $ | 1,748 | | $ | 619 | |
| Long-term debt | 4,232 | | 4,778 | |
| Other non-current liabilities | 1,987 | | 1,823 | |
| Non-controlling interest | 448 | | 416 | |
| | | | | | |
(in millions of Canadian dollars)(1) | As at December 31, 2022 | |
| Assets | | |
| Current assets | $ | 1,441 | | |
| Properties | 12,680 | | |
| Other non-current assets | 340 | | |
| | |
| Liabilities | | |
| Current liabilities | $ | 1,748 | | |
| Long-term debt | 4,232 | | |
| Other non-current liabilities | 1,987 | | |
| Non-controlling interest | 448 | | |
(1) Amounts translated at the December 31, 2022 and 2021 year-end at FX rate of $1.00 USD = $1.35 CAD and $1.27, respectively.$1.35 CAD.
13. Properties
| | | | | | | | | | | | | | | | | | | | | | | | | | | | | | | | | | | | | | |
| 2023 | 2023 | | 2022 |
As at December 31
(in millions of Canadian dollars except percentages) | Weighted-average annual depreciation rate | Cost | | Accumulated
depreciation | | Net book
value | | Cost | | Accumulated
depreciation | | Net book
value |
Track and roadway(1) | 2.8 | % | $ | 42,597 | | | $ | 6,811 | | | $ | 35,786 | | | $ | 21,524 | | | $ | 6,308 | | | $ | 15,216 | |
| Rolling stock | 3.6 | % | 8,125 | | | 1,629 | | | 6,496 | | | 5,085 | | | 1,523 | | | 3,562 | |
Land(1) | N/A | 3,487 | | | — | | | 3,487 | | | 964 | | | — | | | 964 | |
| Concession land rights | 1.4 | % | 1,779 | | | 17 | | | 1,762 | | | — | | | — | | | — | |
| Buildings | 3.0 | % | 1,732 | | | 281 | | | 1,451 | | | 1,069 | | | 254 | | | 815 | |
| Other | 6.7 | % | 4,065 | | | 1,303 | | | 2,762 | | | 3,038 | | | 1,210 | | | 1,828 | |
| Total | $ | 61,785 | | | $ | 10,041 | | | $ | 51,744 | | | $ | 31,680 | | | $ | 9,295 | | | $ | 22,385 | |
(1) 2022 comparative figures have been reclassified to confirm with current year's presentation.
The breakdown of Concession assets included within each asset group of Properties shown above is as follows:
| | | | | | | | | | | |
| As at December 31, 2023 (in millions of Canadian dollars) | Cost | Accumulated
depreciation | Net book
value |
| | | |
| Track and roadway | $ | 7,056 | | $ | 99 | | $ | 6,957 | |
| Concession land rights | 1,779 | | 17 | | 1,762 | |
| Buildings | 230 | | 7 | | 223 | |
| Other | 141 | | 4 | | 137 | |
| Total | $ | 9,206 | | $ | 127 | | $ | 9,079 | |
Finance lease ROU assets
| | | | | | | | | | | | | | | | | | | | |
| 2023 | 2022 |
| As at December 31 (in millions of Canadian dollars) | Cost | Accumulated
depreciation | Net book
value | Cost | Accumulated
depreciation | Net book
value |
| | | | | | |
| Rolling stock | $ | 182 | | $ | 79 | | $ | 103 | | $ | 170 | | $ | 75 | | $ | 95 | |
| Other | 14 | | 6 | | 8 | | 10 | | 3 | | 7 | |
| Total ROU assets held under finance lease | $ | 196 | | $ | 85 | | $ | 111 | | $ | 180 | | $ | 78 | | $ | 102 | |
CP 2022CPKC 2023 ANNUAL REPORT 90/ 93
12. Properties
| | | | | | | | | | | | | | | | | | | | | | | | | | | | | | | | | | | | | | |
| 2022 | 2022 | | 2021 |
| (in millions of Canadian dollars except percentages) | Weighted-average annual depreciation rate | Cost | | Accumulated
depreciation | | Net book
value | | Cost | | Accumulated
depreciation | | Net book
value |
| Track and roadway | 2.8 | % | $ | 22,488 | | | $ | 6,308 | | | $ | 16,180 | | | $ | 21,210 | | | $ | 5,893 | | | $ | 15,317 | |
| Buildings | 2.7 | % | 1,069 | | | 254 | | | 815 | | | 1,022 | | | 266 | | | 756 | |
| Rolling stock | 2.8 | % | 5,085 | | | 1,523 | | | 3,562 | | | 4,793 | | | 1,419 | | | 3,374 | |
| | | | | | | | | | | | |
Other(1) | 5.8 | % | 3,038 | | | 1,210 | | | 1,828 | | | 2,826 | | | 1,073 | | | 1,753 | |
| Total | $ | 31,680 | | | $ | 9,295 | | | $ | 22,385 | | | $ | 29,851 | | | $ | 8,651 | | | $ | 21,200 | |
(1) Comparative figures have been reclassified to conform with current period presentation.
Finance leases included in properties
| | | | | | | | | | | | | | | | | | | | |
| 2022 | 2021 |
| (in millions of Canadian dollars) | Cost | Accumulated
depreciation | Net book
value | Cost | Accumulated
depreciation | Net book
value |
| | | | | | |
| Rolling stock | $ | 170 | | $ | 75 | | $ | 95 | | $ | 291 | | $ | 133 | | $ | 158 | |
| Other | 10 | | 3 | | 7 | | 9 | | 1 | | 8 | |
| Total assets held under finance lease | $ | 180 | | $ | 78 | | $ | 102 | | $ | 300 | | $ | 134 | | $ | 166 | |
Government assistance
During the year ended December 31, 2022,2023, the Company received $25 million (2022 - $32 millionmillion) of government assistance towards the purchase and construction of properties.properties.
As of December 31, 2022,2023, the total Properties balance of $22,385$51,744 million is net ofincludes $272 million (2022 - $285 millionmillion) of unamortized government assistance, primarily related to the enhancement of the Company's track and roadway infrastructure. Amortization expense related to government assistance for the year ended December 31, 2022,2023, was $11 million.million (2022 - $11 million).
13.14. Goodwill and intangible assets
| | | | | | | | | | |
| | | | |
| (in millions of Canadian dollars) | | | | | | |
| Balance as at December 31, 2021 | $ | 328 | | | | | | |
| | | | | | |
| Foreign exchange impact | 16 | | | | | | |
| Balance as at December 31, 2022 | 344 | | | | | | |
| Addition (Note 11) | 17,565 | | | | | | |
| | | | | | |
| Foreign exchange impact | (180) | | | | | | |
| Balance as at December 31, 2023 | $ | 17,729 | | | | | | |
| | | | | | | | | | | | | | | | | | | | |
| Goodwill | | Intangible assets | |
| (in millions of Canadian dollars) | Net
carrying
amount | | Cost | Accumulated
amortization | Net
carrying
amount | Total goodwill and intangible assets |
| Balance as at December 31, 2020 | $ | 329 | | | $ | 55 | | $ | (18) | | $ | 37 | | $ | 366 | |
| Additions (Note 9) | — | | | 9 | | — | | 9 | | 9 | |
| Amortization | — | | | — | | (3) | | (3) | | (3) | |
| Foreign exchange impact | (1) | | | — | | — | | — | | (1) | |
| Balance as at December 31, 2021 | 328 | | | 64 | | (21) | | 43 | | 371 | |
| Amortization | — | | | — | | (3) | | (3) | | (3) | |
| Foreign exchange impact | 16 | | | 2 | | — | | 2 | | 18 | |
| Balance as at December 31, 2022 | $ | 344 | | | $ | 66 | | $ | (24) | | $ | 42 | | $ | 386 | |
15. Intangible assets
| | | | | | | | | | | | | | |
| | | | |
| (in millions of Canadian dollars) | | | Cost(1) | Accumulated
amortization | Net carrying amount | |
| Balance as at December 31, 2021 | | | $ | 64 | | $ | (21) | | $ | 43 | | |
| Amortization | | | — | | (3) | | (3) | | |
| Foreign exchange impact | | | 2 | | — | | 2 | | |
| Balance as at December 31, 2022 | | | 66 | | (24) | | 42 | | |
| Additions (Note 11) | | | 3,022 | | — | | 3,022 | | |
| Amortization | | | — | | (61) | | (61) | | |
| Foreign exchange impact | | | (27) | | (2) | | (29) | | |
| Balance as at December 31, 2023 | | | $ | 3,061 | | $ | (87) | | $ | 2,974 | | |
(1) As at December 31, 2023, the Company held $1,798 million (2022 - $9 million) of Intangible assets not subject to amortization.
Provided below is the estimated aggregate amortization expense for each of the five succeeding fiscal years, and thereafter:
| | | | | |
| (in millions of Canadian dollars) | |
| 2024 | $ | 85 | |
| 2025 | 85 |
| 2026 | 85 |
| 2027 | 85 |
| 2028 | 85 |
| 2029 and thereafter | 751 | |
| Total | $ | 1,176 | |
9194 / CP 2022CPKC 2023 ANNUAL REPORT
14.16. Accounts payable and accrued liabilities
| | | | | | | | |
| (in millions of Canadian dollars) | 2022 | 2021 |
| Trade payables | $ | 503 | | $ | 432 | |
| Accrued charges | 284 | | 286 | |
| Income and other taxes payable | 177 | | 164 | |
| Dividends payable | 177 | | 177 | |
| Accrued interest | 143 | | 141 | |
| Stock-based compensation liabilities | 84 | | 126 | |
| Payroll-related accruals | 79 | | 65 | |
| Operating lease liabilities (Note 18) | 68 | | 59 | |
| Accrued vacation | 62 | | 60 | |
| Personal injury and other claims provision | 53 | | 49 | |
Other(1) | 73 | | 50 | |
| Total accounts payable and accrued liabilities | $ | 1,703 | | $ | 1,609 | |
(1) 2021 comparative figures have been reclassified to conform with current period presentation. | | | | | | | | |
| As at December 31 (in millions of Canadian dollars) | 2023 | 2022 |
| Trade payables | $ | 680 | | $ | 503 | |
| Accrued charges | 667 | | 284 | |
| Income and other taxes payable | 255 | | 177 | |
| Dividends payable | 177 | | 177 | |
| Accrued interest | 162 | | 143 | |
| Payroll-related accruals | 115 | | 79 | |
| Operating lease liabilities (Note 20) | 102 | | 68 | |
| Accrued vacation | 99 | | 62 | |
| Personal injury and other claims provision | 81 | | 53 | |
| Financial derivative liability (Note 18) | 60 | | — | |
| Stock-based compensation liabilities | 50 | | 84 | |
| Other | 119 | | 73 | |
| Total accounts payable and accrued liabilities | $ | 2,567 | | $ | 1,703 | |
15.17. Debt
The following table outlines the Company's outstanding long-term debt as at December 31, 2022:2023:
| | | | | | | | | | | | | | | | | | | | |
| (in millions of Canadian dollars except percentages) | | Maturity | Currency
in which
payable | 2022 | 2021 |
| 5.100% | 10-year Medium Term Notes | (A) | Jan 2022 | CDN$ | — | | 125 | |
| 4.500% | 10-year Notes | (A) | Jan 2022 | U.S.$ | — | | 317 | |
| 4.450% | 12.5-year Notes | (A) | Mar 2023 | U.S.$ | 474 | | 444 | |
| 1.589% | 2-year Notes | (A) | Nov 2023 | CDN$ | 1,000 | | 1,000 | |
| 1.350% | 3-year Notes | (A) | Dec 2024 | U.S.$ | 2,030 | | 1,899 | |
| 2.900% | 10-year Notes | (A) | Feb 2025 | U.S.$ | 948 | | 887 | |
| 3.700% | 10.5-year Notes | (A) | Feb 2026 | U.S.$ | 338 | | 317 | |
| 1.750% | 5-year Notes | (A) | Dec 2026 | U.S.$ | 1,353 | | 1,266 | |
| 2.540% | 6.3-year Notes | (A) | Feb 2028 | CDN$ | 1,200 | | 1,200 | |
| 4.000% | 10-year Notes | (A) | Jun 2028 | U.S.$ | 677 | | 634 | |
| 3.150% | 10-year Notes | (A) | Mar 2029 | CDN$ | 399 | | 399 | |
| 2.050% | 10-year Notes | (A) | Mar 2030 | U.S.$ | 676 | | 633 | |
| 7.125% | 30-year Debentures | (A) | Oct 2031 | U.S.$ | 474 | | 444 | |
| 2.450% | 10-year Notes | (A) | Dec 2031 | U.S.$ | 1,896 | | 1,774 | |
| 5.750% | 30-year Debentures | (A) | Mar 2033 | U.S.$ | 333 | | 311 | |
| 4.800% | 20-year Notes | (A) | Sep 2035 | U.S.$ | 405 | | 379 | |
| 5.950% | 30-year Notes | (A) | May 2037 | U.S.$ | 603 | | 564 | |
| 6.450% | 30-year Notes | (A) | Nov 2039 | CDN$ | 400 | | 400 | |
| 3.000% | 20-year Notes | (A) | Dec 2041 | U.S.$ | 1,348 | | 1,261 | |
| 5.750% | 30-year Notes | (A) | Jan 2042 | U.S.$ | 334 | | 312 | |
| 4.800% | 30-year Notes | (A) | Aug 2045 | U.S.$ | 743 | | 695 | |
| 3.050% | 30-year Notes | (A) | Mar 2050 | CDN$ | 298 | | 298 | |
| | | | | | | | | | | | | | | | | | | | |
| (in millions of Canadian dollars except percentages) | | Maturity | Currency
in which
payable | 2023 | 2022 |
| 4.45% | 12.5-year Notes | (A) | Mar 2023 | U.S.$ | $ | — | | $ | 474 | |
| 1.589% | 2-year Notes (1) | (A) | Nov 2023 | CDN$ | — | | 1,000 | |
| 1.35% | 3-year Notes (1) | (A) | Dec 2024 | U.S.$ | 1,983 | | 2,030 | |
| 2.90% | 10-year Notes | (A) | Feb 2025 | U.S.$ | 926 | | 948 | |
| 3.70% | 10.5-year Notes | (A) | Feb 2026 | U.S.$ | 330 | | 338 | |
| 1.75% | 5-year Notes (1) | (A) | Dec 2026 | U.S.$ | 1,321 | | 1,353 | |
| 2.54% | 6.3-year Notes (1) | (A) | Feb 2028 | CDN$ | 1,200 | | 1,200 | |
| 4.00% | 10-year Notes | (A) | Jun 2028 | U.S.$ | 661 | | 677 | |
| 3.15% | 10-year Notes | (A) | Mar 2029 | CDN$ | 400 | | 399 | |
| 2.05% | 10-year Notes | (A) | Mar 2030 | U.S.$ | 660 | | 676 | |
| 7.125% | 30-year Debentures | (A) | Oct 2031 | U.S.$ | 463 | | 474 | |
| 2.45% | 10-year Notes (1) | (A) | Dec 2031 | U.S.$ | 1,851 | | 1,896 | |
| 5.75% | 30-year Debentures | (A) | Mar 2033 | U.S.$ | 326 | | 333 | |
| 4.80% | 20-year Notes | (A) | Sep 2035 | U.S.$ | 396 | | 405 | |
| 5.95% | 30-year Notes | (A) | May 2037 | U.S.$ | 590 | | 603 | |
| 6.45% | 30-year Notes | (A) | Nov 2039 | CDN$ | 400 | | 400 | |
| 3.00% | 20-year Notes (1) | (A) | Dec 2041 | U.S.$ | 1,317 | | 1,348 | |
| 5.75% | 30-year Notes | (A) | Jan 2042 | U.S.$ | 326 | | 334 | |
| 4.80% | 30-year Notes | (A) | Aug 2045 | U.S.$ | 725 | | 743 | |
| 3.05% | 30-year Notes | (A) | Mar 2050 | CDN$ | 298 | | 298 | |
| 3.10% | 30-year Notes (1) | (A) | Dec 2051 | U.S.$ | 2,365 | | 2,422 | |
| 6.125% | 100-year Notes | (A) | Sep 2115 | U.S.$ | 1,190 | | 1,219 | |
CP 2022CPKC 2023 ANNUAL REPORT 92/ 95
| | 3.100% | 30-year Notes | (A) | Dec 2051 | U.S.$ | 2,422 | | 2,266 | |
| 6.125% | 100-year Notes | (A) | Sep 2115 | U.S.$ | 1,219 | | 1,141 | |
| CPRC Notes issued under Debt Exchange | |
| 3.125% | |
| 3.125% | |
| 3.125% | |
| 2.875% | |
| 4.30% | |
| 4.95% | |
| 4.70% | |
| 3.50% | |
| 4.20% | |
| 2.875% - 7.00% | |
| 5.41% | 5.41% | Senior Secured Notes | (B) | Mar 2024 | U.S.$ | 76 | | 80 | |
| 6.91% | 6.91% | Secured Equipment Notes | (C) | Oct 2024 | CDN$ | 40 | | 58 | |
| 2.96% - 4.29% | |
| Obligations under finance leases | Obligations under finance leases | |
| Various | Various | | (D) | Various | CDN$/U.S.$ | 2 | | 2 | |
| 6.99% | | (D) | Mar 2022 | U.S.$ | — | | 97 | |
| Various | |
| Various | |
| 2.32% | |
| 6.57% | 6.57% | | (D) | Dec 2026 | U.S.$ | 29 | | 33 | |
| 12.77% | 12.77% | | (D) | Jan 2031 | CDN$ | 3 | | 4 | |
| 1.93% | 1.93% | | (D) | Feb 2041 | U.S.$ | 4 | | 4 | |
| | Commercial Paper | Commercial Paper | | Dec 2022 | U.S.$ | — | | 336 | |
| Term Credit Facility | | Sep 2022 | U.S.$ | — | | 634 | |
| Demand Promissory Note | | | CDN$ | — | | 6 | |
| | 19,724 | | 20,220 | |
| Commercial Paper | |
| Commercial Paper | |
| | | | | 22,552 | |
| Perpetual 4% Consolidated Debenture Stock | Perpetual 4% Consolidated Debenture Stock | (E) | | U.S.$ | 41 | | 38 | |
| Perpetual 4% Consolidated Debenture Stock | Perpetual 4% Consolidated Debenture Stock | (E) | | G.B.£ | 6 | | 6 | |
| | 19,771 | | 20,264 | |
| | | 22,598 | |
| Unamortized fees on long-term debt | Unamortized fees on long-term debt | | (120) | | (137) | |
| | 19,651 | | 20,127 | |
| | | 22,494 | |
| Less: Long-term debt maturing within one year | Less: Long-term debt maturing within one year | | 1,510 | | 1,550 | |
| | $ | 18,141 | | $ | 18,577 | |
| Total long-term debt | |
(1) Notes issued to fund the cash consideration component of the KCS acquisition (Note 11).
As at December 31, 2022,2023, the gross amount of long-term debt denominated in U.S. dollars was U.S. $12,161$15,764 million (December 31, 20212022 – U.S. $13,265$12,161 million).
Annual maturities and principal repayment requirements, excluding those pertaining to finance leases, for each of the five years following 20222023 are (in millions): 20232024 – $1,504$3,133; 20242025 – $2,118; 2025 – $948;933; 2026 – $1,693;$1,990; 2027 – $7; 2028 – $nil;1,868; thereafter – $13,520.15,202.
Fees on long-term debt are amortized to income over the term of the related debt.
A. These debentures and notes are presented net of unamortized discounts, payrequire interest payments semi-annually, and are unsecured but carry a negative pledge.
In 2023, the Company repaid $1,000 million 1.589% 2-year Notes, and U.S. $350 million ($479 million) 4.45% 12.5-year Notes. In addition, the Company repaid U.S. $199 million ($272 million) of 3.85% 10-year Senior Notes, and U.S. $439 million ($592 million) of 3.00% 10-year Senior Notes by release of funds from the trustee as discussed below in “Satisfaction and discharge of KCS 2023 Notes”.
In 2022, the Company repaid at maturity $125 million 5.100%5.10% 10-year Medium Term Notes, and U.S. $250 million ($313 million) 4.500%4.50% 10-year Notes, and a U.S. $76 million ($97 million) 6.99% finance lease.Notes.
In 2021,B. On March 20, 2023, the Company announced the commencement of offers to exchange any and all validly tendered (and not validly withdrawn notes) and accepted notes of seven series, each previously issued the following securitiesby KCS (the "Old Notes") for total net proceedsnotes issued by Canadian Pacific Railway Company ("CPRC") (the "CPRC Notes"), a wholly-owned subsidiary of $10.7 billion to fund the cash consideration componentCPKC, and unconditionally guaranteed on an unsecured basis by CPKC. Each series of the KCS acquisition:
| | | | | | | | | | | |
Date Issued | Description of Securities | Maturity | Net Proceeds |
November 24, 2021 | $1.0 billion 1.589% Notes | Nov 2023 | $1.00 billion |
| $1.2 billion 2.540% Notes | Feb 2028 | $1.20 billion |
December 2, 2021 | U.S. $1.5 billion 1.350% Notes | Dec 2024 | $1.91 billion (U.S. $1.49 billion) |
| U.S. $1.0 billion 1.750% Notes | Dec 2026 | $1.27 billion (U.S. $0.99 billion) |
| U.S. $1.4 billion 2.450% Notes | Dec 2031 | $1.78 billion (U.S. $1.39 billion) |
| U.S. $1.0 billion 3.000% Notes | Dec 2041 | $1.26 billion (U.S. $0.99 billion) |
| U.S. $1.8 billion 3.100% Notes | Dec 2051 | $2.26 billion (U.S. $1.77 billion) |
9396 / CP 2022CPKC 2023 ANNUAL REPORT
The U.S. $1.4 billion 2.450% Notesthe same interest rates, interest payment dates, maturity dates, and substantively the U.S. $1.0 billion 3.000% Notes include a special mandatorysame optional redemption provision which provides that if STB final approvalprovisions as the corresponding series of the Company's application to control KCS is not received prior to March 25, 2023 or, if in the Company's judgment, STB final approval will not be sought or received by this date, the Company will be required to redeem all of such outstanding notes at a price equal to 101% of the aggregate principal amount of the applicable notes plus accrued and unpaid interest.Old Notes.
In conjunctionexchange for each U.S. $1,000 principal amount of Old Notes that was validly tendered prior to March 31, 2023 (the "Early Participation Date") and not validly withdrawn, holders of Old Notes received consideration consisting of U.S. $1,000 principal amount of CPRC Notes and a cash amount of U.S. $1.00. This total consideration included an early participation premium, consisting of U.S. $30 principal amount of CPRC Notes per U.S. $1,000 principal amount of Old Notes. In exchange for each U.S. $1,000 principal amount of Old Notes that was validly tendered after the Early Participation Date but prior to the expiration of the exchange offers on April 17, 2023 (the "Expiration Date") and not validly withdrawn, holders of Old Notes received consideration consisting of U.S. $970 principal amount of CPRC Notes and a cash amount of U.S. $1.00. On April 19, 2023, the exchange offerings were settled with the above debt issuances,issuance of $3,014 million of CPRC Notes. The notes which were not exchanged had a carrying value of $104 million at December 31, 2023.
The Debt Exchange was accounted for as a modification of debt. During the year ended December 31, 2023, the Company cash settled a notional $600incurred $12 million of interest rate bond locks and a notional U.S. $2.4 billion of forward starting floating-to-fixed interest rate swap agreements ("forward starting swaps") for a payment of $226 million during 2021. This payment was included in cash provided by operating activities consistentcosts associated with the locationDebt Exchange, recorded in "Other expense"(see Note 5). These charges, and amounts paid to noteholders upon execution of the related hedged item onDebt Exchange, of $17 million, have been classified as "Acquisition-related financing fees" in the Company's Consolidated Statements of Cash Flows.Flows for the year ended December 31, 2023.
In 2021, the Company also repaid U.S. $250 million 9.450% 30-year debentures at maturity for a total of U.S. $250 million ($312 million).
B.C. The 5.41% senior secured notesSenior Secured Notes are collateralized by specific locomotive unitslocomotives with a carrying value of $89$76 million as at December 31, 2022.2023. The Company pays equal blended semi-annual payments of principal and interest. Final repayment of the remaining principal of U.S. $44 million is due in March 2024.
C.D. The 6.91% secured equipment notesSecured Equipment Notes are full recourse obligations of the Company collateralized by a first charge on specific locomotive units with a carrying value of $31$27 million as at December 31, 2022.2023. The Company pays equal blended semi-annual payments of principal and interest. Final repayment
E. The following loans were made under the Railroad Rehabilitation and Improvement Financing (“RRIF”) Program administered by the Federal Railroad Administration:
The Kansas City Southern Railway Company ("KCSR") RRIF Loan Agreement was entered in February 21, 2012 to borrow U.S. $55 million to be used to reimburse KCSR for a portion of the remainingpurchase price of thirty new locomotives (the “Locomotives”) in the fourth quarter of 2011. The loan bears interest at 2.96% annually and the principal balance amortizes quarterly with a final maturity of $11February 24, 2037. This loan is secured by a first priority security interest in the Locomotives with a carrying value of $14 million as at December 31, 2023.
The Texas Mexican Railway Company RRIF Loan Agreement was entered in June 28, 2005 to borrow U.S. $50 million to be used for infrastructure improvements in order to accommodate growing freight rail traffic. The loan bears interest at 4.29% annually and the principal balance amortizes quarterly with a final maturity of July 13, 2030. The loan is dueguaranteed by Mexrail, which has issued a pledge agreement in October 2024.favour of the lender equal to the gross revenues earned by Mexrail on per-car fees on traffic crossing the International Rail Bridge in Laredo, Texas. The Company wholly owns Mexrail which, in turn, wholly owns The Texas Mexican Railway Company.
D.F. In 2022 the Company repaid a U.S. $76 million ($97 million) 6.99% finance lease. The carrying value of the assets collateralizing the Company's finance lease obligations was $102$111 million at December 31, 2022.2023.
E.G. The Consolidated Debenture Stock, authorized by an Act of Parliament of 1889, constitutes a first charge upon and over the whole of the undertaking, railways, works, rolling stock, plant, property and effects of the Company, with certain exceptions.
Credit facilityfacilities
The Company has a revolving credit facility (the “facility”) agreement with 1416 highly rated financial institutions for a commitment amount of U.S. $1.3$2.2 billion.The facility can accommodate draws of cash and/or letters of credit at market competitive pricing. Effective September 24, 2021,May 11, 2023, the Company entered into a second amended and restated credit agreement to extend the maturity dates and increase the total amount available under the facility. The amendment increased the amount available of the five-year tranche from U.S. $1.0 billion to U.S. $1.1 billion and extended the maturity dates of the U.S. $1.0 billion tranche todate from September 27, 2026 andto May 11, 2028. The amendment also increased the amount available of the two-year tranche from U.S. $300 million tranche to U.S. $1.1 billion and extended the maturity date from September 27, 2023. During 2021, the Company amended the financial covenant within the facility agreement2023 to provide flexibility upon closing of the KCS acquisition.May 11, 2025. As at December 31, 20222023 and 2021,2022, the Company was in compliance with all terms and conditions of the credit facility arrangements and satisfied the financial covenant. As at December 31, 20222023 and 2021,2022, the facility was undrawn.
In 2021, the Company entered into a U.S. $500 million unsecured non-revolving term credit facility (the "term facility") with an initial due date of March 15, 2022. Effective March 14, 2022, the Company extended the maturity date of the U.S. $500 million term facility to September 15, 2022. During the year ended December 31, 2022, the Company repaid in full the outstanding borrowings of U.S. $500 million ($636 million) on the term facility. The term facility was automatically terminated on September 15, 2022 following the final principal repayment.
CPKC 2023 ANNUAL REPORT / 97
The Company also has a commercial paper program, which enables it to issue commercial paper up to a maximum aggregate principal amount of U.S. $1.0U.S. $1.5 billion in the form of unsecured promissory notes. On July 12, 2023, the Company increased the maximum aggregate principal amount of commercial paper available to be issued from U.S. $1.0 billion to U.S. $1.5 billion. This commercial paper program is backed by the U.S. $2.2 billion revolving credit facility. As at December 31, 2022,2023, theCompany had nototal commercial paper borrowings outstanding of U.S. $800 million ($1,058 million), included in "Long-term debt maturing within one year" in the Company's Consolidated Balance Sheets (December 31, 20212022 – $336 million)$nil). The weighted-average interest rate on these borrowings as at December 31, 2023 was 5.59%. The Company presents issuances and repayments of commercial paper, all of which have a maturity of less than 90 days, in the Company's Consolidated Statements of Cash Flows on a net basis.
The Company has bilateral letter of credit facilities with six highly rated financial institutions to support its requirement to post letters of credit in the ordinary course of business. Under these agreements, the Company has the option to post collateral in the form of cash or cash equivalents, equal at least to the face value of the letter of credit issued. These agreements permit the Company to withdraw amounts posted as collateral at any time; therefore, the amounts posted as collateral are presented as “Cash and cash equivalents” on the Company’s Consolidated Balance Sheets. As at December 31, 20222023 and 2021,2022, the Company did not have any collateral posted on its bilateral letter of credit facilities but had letters of credit drawn of $7593 million (December 31, 20212022 – $58$75 million) from a total available amount of $300 million.
In May 2023 the Company terminated KCS's credit facility and commercial paper program.
16.
Satisfaction and discharge of KCS 2023 Notes
On April 24, 2023, the Company irrevocably deposited U.S. $647 million of non-callable government securities with the trustee of two series of notes that matured in 2023 and were not included in the Debt Exchange (the "KCS 2023 Notes"), to satisfy and discharge KCS's obligations under the KCS 2023 Notes. As a result of the satisfaction and discharge, the obligations of the Company under the indenture with respect to the KCS 2023 Notes were terminated, except those provisions of the indenture that, by their terms, survive the satisfaction and discharge. The Company utilized existing cash resources and issuances of commercial paper to fund the satisfaction and discharge. On May 15, 2023 and November 15, 2023, the U.S. $439 million 3.00% senior notes and U.S. $199 million 3.85% senior notes, respectively, that comprise the KCS 2023 Notes were repaid by release of funds from the trustee. In the Company's Consolidated Statements of Cash Flows, the government securities purchased towards settlement of the May maturity were treated as a cash equivalent. The purchase of government securities of U.S. $198 million ($267 million) associated with the November maturity, along with the settlement of these government securities for U.S. $200 million ($274 million) were presented within investing activities. This transaction, along with the Debt Exchange mentioned above, relieved KCS from continuous disclosure obligations.
18. Financial instruments
A. Fair values of financial instruments
The Company categorizes its financial assets and liabilities measured at fair value into a three-level hierarchy established by GAAP that prioritizes those inputs to valuation techniques used to measure fair value based on the degree to which they are observable. The three levels of the fair value hierarchy are as follows: Level 1 inputs are quoted prices in active markets for identical assets and liabilities; Level 2 inputs, other than quoted prices included within Level 1, are observable for the asset or liability either directly or indirectly; and Level 3 inputs are not observable in the market.
The Company’s short-term financial instruments include cash and cash equivalents, restricted cash and cash equivalents, accounts receivable, accounts payable and accrued liabilities, and short-term borrowings including commercial paper and term loans. The carrying value of short-term financial instruments approximate their fair values.
The carrying value of the Company’s long-term debt does not approximate its fair value. The estimated fair value has been determined based on market information where available, or by discounting future payments of principal and interest at estimated interest rates expected to be available to the Company at period end. All measurements are classified as Level 2. The Company’s long-term debt, including current maturities, with a carrying value of $19,651$21,437 million as at December 31, 20222023 (December 31, 20212022 - $19,151$19,651 million), had a fair value of $17,720$20,550 million (December 31, 20212022 - $21,265$17,720 million).
B. Financial risk management
Derivative financial instruments
Derivative financial instruments may be used to selectively reduce volatility associated with fluctuations in interest rates, FX rates, the price of fuel, and stock-based compensation expense. Where derivatives are designated as hedging instruments, the relationship between the hedging instruments and their associated hedged items is documented, as well as the risk management objective and strategy for the use of the hedging instruments. This documentation includes linking the derivatives that are designated as fair value or cash flow hedges to specific assets or liabilities on the Company's Consolidated Balance Sheets, commitments, or forecasted transactions. At the time a derivative contract is entered into and at least quarterly thereafter, an assessment is made as to whether the derivative item is effective in offsetting the changes in fair value or cash flows of the hedged items. The derivative qualifies for hedge accounting treatment if it is effective in substantially mitigating the risk it was designed to address.
It is not the Company’s intent to use financial derivatives or commodity instruments for trading or speculative purposes.
98 / CPKC 2023 ANNUAL REPORT
Credit risk management
Credit risk refers to the possibility that a customer or counterparty will fail to fulfil its obligations under a contract and as a result create a financial loss for the Company.
The railway industry predominantly serves financially established customers, and the Company has experienced limited financial losses with respect to credit risk. The credit worthiness of customers is assessed using credit scores supplied by a third party and through direct monitoring of their financial well-being on a continual basis. The Company establishes guidelines for customer credit limits and should thresholds in these areas be reached, appropriate precautions are taken to improve collectability.
Counterparties to financial instruments expose the Company to credit losses in the event of non-performance. Counterparties for derivative and cash transactions are limited to high credit quality financial institutions, which are monitored on an ongoing basis. Counterparty credit assessments are based on the financial health of the institutions and their credit ratings from external agencies. The Company does not anticipate non-performance that would materially impact the Company’s Consolidated financial statements. In addition, the Company believes there are no significant concentrations of credit risk.
FX management
The Company conducts business transactions and owns assets in both Canada, the U.S., and the United States.Mexico. As a result, the Company is exposed to fluctuations in the value of financial commitments, assets, liabilities, income, or cash flows due to changes in FX rates. The Company may enter into FX risk management transactions primarily to manage fluctuations in the exchange rate between Canadian and U.S. currencies.currencies, along with fluctuations in the Mexican peso and U.S dollar as discussed below in "Foreign currency derivative instruments". FX exposure is primarily mitigated through natural offsets created by revenues, expenditures, and balance sheet positions incurred in the same currency. Where appropriate, the Company may negotiate with customers and suppliers to reduce the net exposure.
Net investment hedge
The FX gains and losses on long-term debt are mainly unrealized and can only be realized when U.S. dollar-denominated long-term debt matures or is settled. The Company also has long-term FX exposure on its investment in foreign subsidiaries with a U.S. dollar functional currency. The majority of the Company’s U.S. dollar-denominated long-term debt, hasfinance lease obligations, and operating lease liabilities have been designated as a hedge of the net investment in these foreign subsidiaries. This designation has the effect of mitigating volatility on Net income by offsetting long-term FX gains and losses on U.S. dollar-denominated long-term debt and gains and losses on its net investment. The effect of the net investment hedge recognized in “Other comprehensive income (loss)” income” in 20222023 was an FX lossgain of $471$194 million,, the majority of which was unrealized (2021(2022 – unrealized loss of $471 million; 2021 – unrealized gain of $25 million; 2020 – unrealized gain of $136 million)million) (see Note 7)8).
U.S.dollar- Canadian dollar FX forward contracts
During 2021, the Company entered into various FX forward contracts totalling a notional U.S. $1.0 billion to fix the FX rate and lock-in a portion of the amount of Canadian dollars it could have borrowed to finance the U.S. dollar-denominated cash portion of the total consideration payable pursuant to the Original Merger Agreement with KCS. During the third quarter of 2021, the Company settled the FX forward contracts and did not have any such contracts remaining as at December 31, 2021. The realized gain from settlement of the FX forward contracts was $13 million and was recorded in "Other expense (income)"expense" on the Company's Consolidated Statements of Income (2022for the year ended December 31, 2021 (2023 - $nil; 2022 - $nil).
Mexican Peso- U.S dollar FX Forward contracts
The Company’s Mexican subsidiaries have net U.S. dollar-denominated monetary assets which, for Mexican income tax purposes, are subject to periodic revaluation based on changes in the value of the Mexican peso ("Ps.") against the U.S. dollar. This revaluation creates fluctuations in the Company’s Mexican income tax expense and the amount of income taxes paid in Mexican pesos. The Company also has net monetary assets denominated in Mexican pesos that are subject to periodic re-measurement and settlement that create fluctuations within "Other expense". The Company has hedged its net exposure to Mexican peso/U.S. dollar fluctuations in earnings with foreign currency forward contracts. The foreign currency forward contracts involve the Company’s agreement to buy or sell pesos at an agreed-upon exchange rate on a future date.
As at December 31, 2023, the Company had outstanding foreign currency forward contracts to purchase a notional value of U.S. $215 million. These outstanding contracts are at a weighted-average exchange rate of Ps.20.61 per U.S. $1.00, and have a maturity date of January 12, 2024. The Company has not designated any of the foreign currency derivative contracts as hedging instruments for accounting purposes. The Company measures the foreign currency derivative contracts at fair value each period and recognizes any change in "Other expense". The cash flows associated with these instruments are classified as "Operating activities" within the Consolidated Statements of Cash Flows.
Following the acquisition of control of KCS on April 14, 2023 and through the period ended December 31, 2023, the Company recorded a loss of $39 million related to foreign exchange currency forwards. As at December 31, 2023, the fair value of outstanding foreign exchange contracts included in "Accounts payable and accrued liabilities" was $60 million. On maturity, the Company settled all outstanding foreign currency forward contracts, resulting in a cash payment of $65 million.
CPKC 2023 ANNUAL REPORT / 99
Offsetting
The Company’s foreign currency forward contracts are executed with counterparties in the U.S. and are governed by International Swaps and Derivatives Association agreements that include standard netting arrangements. Asset and liability positions from contracts with the same counterparty are net settled upon maturity/expiration and presented on a net basis in the Company's Consolidated Balance Sheets prior to settlement.
Interest rate management
The Company is exposed to interest rate risk, which is the risk that the fair value or future cash flows of a financial instrument will vary as a result of changes in market interest rates. In order to manage funding needs or capital structure goals, the Company enters into debt or finance lease agreements that are subject to either fixed market interest rates set at the time of issue or floating rates determined by ongoing market conditions. Debt subject to variable interest rates exposes the Company to variability in interest expense, while debt subject to fixed interest rates exposes the Company to variability in the fair value of debt.
To manage interest rate exposure, the Company accesses diverse sources of financing and manages borrowings in line with a targeted range of capital structure, debt ratings, liquidity needs, maturity schedule, and currency and interest rate profiles. In anticipation of future debt issuances, the Company may enter into forward rate agreements that are designated as cash flow hedges, to substantially lock in all or a portion of the effective future interest expense. The Company may also enter into swap and lock agreements, designated as fair value hedges, to manage the mix of fixed and floating rate debt.
Forward starting swaps
In the first half of 2021, the Company entered into forward starting swaps with terms of up to 30 years, totalling a notional U.S. $2.4 billion to fix the benchmark rate on cash flows associated with highly probable forecasted issuances of long-term notes.
On May 21, 2021, the Original Merger Agreement with KCS was terminated which resulted in the Company ceasing hedge accounting for the U.S. $2.4 billion of forward starting swaps. However, as the note issuances were still reasonably possible to occur, fair value losses of $73 million prior to this determination remained in “Accumulated other comprehensive loss”,AOCI, net of tax. Fair value losses of $251 million during the period from May 21, 2021 through to the roll and re-designation described below were recorded within “Other expense (income)"Expense" on the Company’s Consolidated Statements of Income for twelve monthsthe year ended December 31, 2021.
Following CP entering into the Merger Agreement with KCS, the Company rolled the notional U.S. $2.4 billion of forward starting swaps but did not effect a cash settlement. Concurrently, the Company re-designated the forward starting swaps totalling U.S. $2.4 billion to fix the benchmark rate on cash flows associated with highly probable forecasted issuances of long-term notes. The changes in fair value on the forward starting swaps were recorded in “Accumulated other comprehensive loss”, net of tax, as cash flow hedges until the notes were issued. Fair value gains subsequent to re-designation of $94 million were recorded within “Other comprehensive income” on the Company’s Consolidated Statements of Comprehensive Income for the twelve monthsyear ended December 31, 2021.
During the fourth quarter of 2021, the Company cash settled all outstanding forward starting swaps related to debt issuances that occurred in the same period. The fair value of these derivative instruments at the time of settlement was a loss of $230 million. The related $21 million gain within "Accumulated other comprehensive loss" will be reclassified to "Net interest expense" ratably over the duration of the notes' hedged interest payments.
Bond locks
In the first quarter of 2021, the Company entered into seven-yearseven-year interest rate bond locks totalling a notional $600 million to fix the benchmark rate on cash flows associated with a highly probable forecasted issuance of long-term notes.
On May 21, 2021, the Original Merger Agreement with KCS was terminated which resulted in the Company ceasing hedge accounting for the $600 million of bond locks. However, as the note issuances were still reasonably possible to occur, fair value losses of $2 million prior to this determination remained in “Accumulated other comprehensive loss”, net of tax. Fair value losses of $10 million during the period from May 21, 2021 through to the roll and re-designation described below were recorded within “Other expense (income)"expense" on the Company’s Consolidated Statements of Income for the twelve monthsyear ended December 31, 2021.
Following CP entering into the Merger Agreement with KCS, the Company rolled the notional $600 million of bond locks but did not effect a cash settlement. Concurrently, the Company re-designated the bond locks totalling $600 million to fix the benchmark rate on cash flows associated with highly probable forecasted issuances of long-term notes. The changes in fair value on the bond locks are recorded in “Accumulated other comprehensive loss”, net of tax, as cash flow hedges until the notes were issued. Fair value gains subsequent to re-designation of $19 million were recorded within “Other comprehensive income” on the Company’s Consolidated Statements of Comprehensive Income for the twelve monthsyear ended December 31, 2021.
During the fourth quarter of 2021, the Company cash settled all outstanding bond locks related to debt issuances that occurred in the same period. The fair value of these derivative instruments at the time of settlement was a gain of $7 million. The related $17 million gain within "Accumulated other comprehensive loss" will be reclassified to "Net interest expense" ratably over the duration of the notes' hedged interest payments.
100 / CPKC 2023 ANNUAL REPORT
Designated hedges that were previously settled were amortized from “Accumulated other comprehensive income (loss)"AOCI to "Net interest expense" for a total of $6$7 million inin the year ended December 31, 2022 (20212023 (2022 - $10$6 million; 20202021 - $10 million). The Company expects that during the next 12 months, $6 million of net losses will be reclassified to “Net interest expense”.
17.19. Other long-term liabilities
| | (in millions of Canadian dollars) | 2022 | 2021 |
| Operating lease liabilities, net of current portion (Note 18) | $ | 202 | | $ | 224 | |
| As at December 31 (in millions of Canadian dollars) | | As at December 31 (in millions of Canadian dollars) | 2023 | 2022 |
| Operating lease liabilities, net of current portion (Note 20) | |
Provision for environmental remediation, net of current portion(1) | |
| Stock-based compensation liabilities, net of current portion | Stock-based compensation liabilities, net of current portion | 125 | | 125 | |
Provision for environmental remediation, net of current portion(1) | 71 | | 68 | |
| Deferred revenue, net of current portion (Note 3) | 39 | | 47 | |
Deferred lease and license revenue, net of current portion(2) | Deferred lease and license revenue, net of current portion(2) | 15 | | 14 | |
| Deferred revenue, net of current portion (Note 4) | |
| Other, net of current portion | Other, net of current portion | 68 | | 64 | |
| Total other long-term liabilities | Total other long-term liabilities | $ | 520 | | $ | 542 | |
(1) As at December 31, 2022,2023, the aggregate provision for environmental remediation, including the current portion was $83$220 million (2021 (2022 – $79 million)$83 million).
(2) The deferred lease and license revenue is being amortized to income on a straight-line basis over the related lease terms. Comparative figures have been reclassified to conform with current period presentation.
EnvironmentalProvision for environmental remediation accruals
Environmental remediation accruals cover site-specific remediation programs. The estimate of the probable costs to be incurred in the remediation of properties contaminated by past activities reflects the nature of contamination at individual sites according to typical activities and scale of operations conducted. The Company has developed remediation strategies for each property based on the nature and extent of the contamination, as well as the location of the property and surrounding areas that may be adversely affected by the presence of contaminants, considering available technologies, treatment and disposal facilities and the acceptability of site-specific plans based on the local regulatory environment. Site-specific plans range from containment and risk management of the contaminants through to the removal and treatment of the contaminants and affected soils and groundwater. The details of the estimates reflect the environmental liability at each property. Provisions for environmental remediation costs are recorded in “Other long-term liabilities”, except for the current portion which is recorded in “Accounts payable and accrued liabilities” (see Note 14). Payments are expected to be made over 10 years to 2032.2033.
The accruals for environmental remediation represent the Company’s best estimate of its probable future obligation and include both asserted and unasserted claims, without reduction for anticipated recoveries from third parties. Although the recorded accruals include the Company’s best estimate of all probable costs, the Company’s total environmental remediation costs cannot be predicted with certainty. Accruals for environmental remediation may change from time to time as new information about previously untested sites becomes known, environmental laws and regulations evolve and advances are made in environmental remediation technology. The accruals may also vary as the courts decide legal proceedings against outside parties responsible for contamination. These potential charges, which cannot be quantified at this time, may materially affect income in the particular period in which a charge is recognized. Costs related to existing, but as yet unknown, or future contamination will be accrued in the period in which they become probable and reasonably estimable. Changes to costs are reflected as changes to “Other long-term liabilities” or “Accounts payable and accrued liabilities” on the Company's Consolidated Balance Sheets and to “Purchased services and other” within operating expenses on the Company's Consolidated Statements of Income. The amount charged to income in 20222023 was $8 million (2021(2022 – $10$8 million; 20202021 – $10 million).
18.20. Leases
The Company’s leases have remaining terms of less than one year to 18 years, some include options to extend up to an additional 10 years, and some include options to terminate within one year.
17 years. Residual value guarantees are also provided on certain vehicle operating leases. Cumulatively, these guarantees are limited to $1 million and are not included in lease liabilities as it is not currently probable that any amounts will be owed.
97 CP 2022CPKC 2023 ANNUAL REPORT/ 101
Components of lease expense included in the Consolidated Statements of Income for the yearyears ended December 31 are as follows:
| | (in millions of Canadian dollars) | (in millions of Canadian dollars) | 2022 | 2021 | (in millions of Canadian dollars) | 2023 | 2022 | 2021 |
| Operating lease cost | Operating lease cost | $ | 77 | | $ | 74 | |
| Short-term lease cost | Short-term lease cost | 17 | | 16 | |
| Variable lease cost | Variable lease cost | 9 | | 5 | |
| Sublease income | Sublease income | (2) | | (3) | |
| | Finance Lease Cost | |
| Amortization of right-of-use assets | 6 | | 10 | |
| Finance lease cost | |
| Finance lease cost | |
| Finance lease cost | |
| Amortization of ROU assets | |
| Amortization of ROU assets | |
| Amortization of ROU assets | |
| Interest on lease liabilities | Interest on lease liabilities | 4 | | 10 | |
| Total lease costs | Total lease costs | $ | 111 | | $ | 112 | |
Supplemental balance sheet information related to leases isROU Assets and Lease Liabilities included in the Consolidated Balance Sheet are as follows:
| | | | | | | | | | | |
| (in millions of Canadian dollars) | Classification | 2022 | 2021 |
| Assets | | | |
| Operating | Other assets | $ | 267 | | $ | 287 | |
| Finance | Properties, net book value | 102 | | 166 | |
| | | |
| Liabilities | | | |
| Current | | | |
| Operating | Accounts payable and accrued liabilities | 68 | | 59 | |
| Finance | Long-term debt maturing within one year | 8 | | 104 | |
| Long-term | | | |
| Operating | Other long-term liabilities | 202 | | 224 | |
| Finance | Long-term debt | 30 | | 36 | |
| | | | | | | | | | | |
| As at December 31 (in millions of Canadian dollars) | Classification | 2023 | 2022 |
| ROU Assets | | | |
| Operating leases | Other assets (long-term) | $ | 347 | | $ | 267 | |
| Finance leases | Properties | 111 | | 102 | |
| | | |
| Lease Liabilities | | | |
| Current liabilities | | | |
| Operating leases | Accounts payable and accrued liabilities | 102 | | 68 | |
| Finance leases | Long-term debt maturing within one year | 14 | | 8 | |
| Long-term liabilities | | | |
| Operating leases | Other long-term liabilities | 242 | | 202 | |
| Finance leases | Long-term debt | 31 | | 30 | |
The following table provides the Company's weighted-average remaining lease terms and discount rates:
| | 2022 | 2021 |
| 2023 | | | 2023 | 2022 |
| Weighted-Average Remaining Lease Term | Weighted-Average Remaining Lease Term | |
| Operating leases | |
| Operating leases | |
| Operating leases | Operating leases | 5 years | 6 years | 5 years | 5 years |
| Finance leases | Finance leases | 6 years | 2 years | Finance leases | 4 years | 6 years |
| | Weighted-Average Discount Rate | Weighted-Average Discount Rate | |
| Weighted-Average Discount Rate | |
| Weighted-Average Discount Rate | |
| Operating leases | |
| Operating leases | |
| Operating leases | Operating leases | 3.20 | % | 3.18 | % | 3.93 | % | 3.20 | % |
| Finance leases | Finance leases | 6.89 | % | 6.96 | % | Finance leases | 6.18 | % | 6.89 | % |
102 / CP 2022CPKC 2023 ANNUAL REPORT 98
SupplementalCash Flow information related to leases is as follows:
| | (in millions of Canadian dollars) | 2022 | 2021 |
| As at December 31 (in millions of Canadian dollars) | | As at December 31 (in millions of Canadian dollars) | 2023 | 2022 | 2021 |
| Cash paid for amounts included in measurement of lease liabilities | Cash paid for amounts included in measurement of lease liabilities | |
| Operating cash outflows from operating leases | |
| Operating cash outflows from operating leases | |
| Operating cash outflows from operating leases | Operating cash outflows from operating leases | $ | 64 | | $ | 64 | |
| Operating cash outflows from finance leases | Operating cash outflows from finance leases | 6 | | 10 | |
| Financing cash outflows from finance leases | Financing cash outflows from finance leases | 104 | | 8 | |
| | Right-of-use assets obtained in exchange for lease liabilities | |
| ROU assets obtained in exchange for lease liabilities | |
| ROU assets obtained in exchange for lease liabilities | |
| ROU assets obtained in exchange for lease liabilities | |
| Operating leases | |
| Operating leases | |
| Operating leases | Operating leases | 34 | | 36 | |
| Finance leases | Finance leases | — | | 5 | |
The following table provides the maturities of lease liabilities for the next five years and thereafter as at December 31, 2022:2023:
| | (in millions of Canadian dollars) | (in millions of Canadian dollars) | Finance Leases | Operating Leases | (in millions of Canadian dollars) | Finance leases | Operating leases |
| 2023 | $ | 10 | | $ | 75 | |
| 2024 | 2024 | 10 | | 62 | |
| 2025 | 2025 | 9 | | 49 | |
| 2026 | 2026 | 9 | | 42 | |
| 2027 | 2027 | — | | 28 | |
| 2028 | |
| Thereafter | Thereafter | 7 | | 37 | |
| Total lease payments | 45 | | 293 | |
| Total lease future payments | |
| Imputed interest | Imputed interest | (7) | | (23) | |
| Present value of lease payments | $ | 38 | | $ | 270 | |
| Present value of future lease payments | |
19 .21. Shareholders’ equity
Authorized and issued share capital
The Company is authorized to issue an unlimited number of Common Shares, an unlimited number of First Preferred Shares, and an unlimited number of Second Preferred Shares. As at December 31, 2022,2023, no First or Second Preferred Shares had been issued.
The following table summarizes information related to Common Share balances as at December 31:
| | (number of shares in millions) | (number of shares in millions) | 2022 | 2021 | 2020 | (number of shares in millions) | 2023 | 2022 | 2021 |
| Share capital, January 1 | Share capital, January 1 | 929.7 | | 666.3 | | 685.0 | |
| Common Shares repurchased | — | | — | | (20.4) | |
| | Shares issued under stock option plan | Shares issued under stock option plan | 0.8 | | 0.8 | | 1.7 | |
| Shares issued for KCS acquisition (Note 10) | — | | 262.6 | | — | |
| Shares issued under stock option plan | |
| Shares issued under stock option plan | |
| Shares issued for KCS acquisition (Note 11) | |
| Share capital, December 31 | Share capital, December 31 | 930.5 | | 929.7 | | 666.3 | |
The change in the “Share capital” balance includes $9$17 million of stock-based compensation transferred from “Additional paid-in capital” (2021(2022 – $7$9 million; 20202021 – $10$7 million).
Share repurchases
In connection with the KCS transaction, the Company suspended share repurchases and did not have an active program as at December 31, 2023 and December 31, 2022.
CPKC 2023 ANNUAL REPORT / 103
On January 27, 2021, the Company announced a NCIB, commencing January 29, 2021, to purchase up to 16.7 million Common Shares in the open market for cancellation on or before January 28, 2022. The Company did not purchase any Common Shares under this NCIB.
Share split
On December 17, 2019,April 21, 2021, the Company announcedCompany's shareholders approved a NCIB, commencing December 20, 2019,five-for-one share split to purchase upcommon shareholders of record as of May 5, 2021. Proportional adjustments were made to 24.0 million Common Shares in the open market for cancellation on or before December 19, 2020. Upon expiry of this NCIB, the Company had purchased 21.4 million Common Shares for $1,577 million.
The following table provides activitiesall outstanding awards under the Company's stock-based compensation plans in order to reflect the share repurchase programs for eachsplit. All common share and per common share amounts have been retroactively adjusted to reflect the impact of the years ended December 31:
| | | | | | | | | | | |
| | 2022 | 2021 | 2020 |
Number of Common Shares repurchased(1) | — | | — | | 19,865,380 | |
Weighted-average price per share(2) | $ | — | | $ | — | | $ | 74.35 | |
Amount of repurchase (in millions)(2) | $ | — | | $ | — | | $ | 1,477 | |
(1) Includes shares repurchased but not yet cancelled at year end.
(2) Includes brokerage fees.share split.
20.22. Change in non-cash working capital balances related to operations
| | (in millions of Canadian dollars) | 2022 | 2021 | 2020 |
| For the year ended December 31 (in millions of Canadian dollars) | | For the year ended December 31 (in millions of Canadian dollars) | 2023 | 2022 | 2021 |
| (Use) source of cash: | (Use) source of cash: | |
| Accounts receivable, net | |
| Accounts receivable, net | |
| Accounts receivable, net | Accounts receivable, net | $ | (147) | | $ | 32 | | $ | (61) | |
| Materials and supplies | Materials and supplies | (27) | | (14) | | (15) | |
| Other current assets | Other current assets | (13) | | 24 | | (5) | |
| Accounts payable and accrued liabilities | Accounts payable and accrued liabilities | 95 | | (108) | | (308) | |
| Change in non-cash working capital balances related to operations | Change in non-cash working capital balances related to operations | $ | (92) | | $ | (66) | | $ | (389) | |
21.23. Pensions and other benefits
The Company has both defined benefit (“DB”) and defined contribution (“DC”) pension plans. At December 31, 2022,2023, the Canadian pension plans represent nearly all of total combined pension plan assets and nearly all of total combined pension plan obligations.
The DB plans provide for pensions based principally on years of service and compensation rates near retirement. Pensions for Canadian pensioners are partially indexed to inflation. Annual employer contributions to the DB plans, which are actuarially determined, are made on the basis of being not less than the minimum amounts required by federal pension supervisory authorities.
The Company has other benefit plans including post-retirement health benefits and life insurance, for pensioners, and post-employment long-term disability and workers’ compensation benefits which are based on Company-specific claims.claims, and certain other non-pension post-employment benefits. At December 31, 2022,2023, the Canadian other benefits plans represent nearly all of total combined other plan obligations.
The Audit and Finance Committee of the Board of Directors has approved an investment policy that establishes long-term asset mix targets, which take into account the Company’s expected risk tolerances. Pension plan assets are managed by a suite of independent investment managers, with the allocation by manager reflecting these asset mix targets. Most of the assets are actively managed with the objective of outperforming applicable benchmarks. In accordance with the investment policy, derivative instruments may be used by investment managers to hedge or adjust existing or anticipated exposures.
To develop the expected long-term rate of return assumption used in the calculation of net periodic benefit cost applicable to the market-related value of plan assets, the Company considers the expected composition of the plans’ assets, past experience, and future estimates of long-term investment returns. Future estimates of investment returns reflect the long-term return expectation for fixed income, public equity, real estate, infrastructure, private debt, and absolute return investments, and the expected added value (relative to applicable benchmark indices) from active management of pension plan assets.
CP 2022 ANNUAL REPORT 100
The Company has elected to use a market-related value of assets for the purpose of calculating net periodic benefit cost, developed from a five-year average of market values for the plans’ public equity and absolute return investments (with each prior year’s market value adjusted to the current date for assumed investment income during the intervening period) plus the market value of the plans’ fixed income, real estate, infrastructure, and private debt securities.
The benefit obligation is discounted using a discount rate that is a blended yield to maturity for a hypothetical portfolio of high-quality debt instruments with cash flows matching projected benefit payments. The discount rate is determined by management.
104 / CPKC 2023 ANNUAL REPORT
Net periodic benefit (recovery) cost
The elements of net periodic benefit (recovery) cost for DB pension plans and other benefits recognized in the year include the following components:
| | | | Pensions | | Other benefits | | Pensions | | Other benefits | | Total |
| (in millions of Canadian dollars) | 2022 | 2021 | 2020 | | 2022 | 2021 | 2020 |
| Current service cost (benefits earned by employees) | $ | 148 | | $ | 171 | | $ | 140 | | | $ | 11 | | $ | 13 | | $ | 12 | |
| For the year ended December 31 (in millions of Canadian dollars) | | For the year ended December 31 (in millions of Canadian dollars) | 2023 | 2022 | 2021 | | 2023 | 2022 | 2021 | | 2023 | 2022 | 2021 |
| Current service cost | |
| Other components of net periodic benefit (recovery) cost: | Other components of net periodic benefit (recovery) cost: | |
| Interest cost on benefit obligation | |
| Interest cost on benefit obligation | |
| Interest cost on benefit obligation | Interest cost on benefit obligation | 383 | | 351 | | 406 | | | 16 | | 16 | | 17 | |
| Expected return on plan assets | Expected return on plan assets | (959) | | (959) | | (945) | | | — | | — | | — | |
| Recognized net actuarial loss (gain) | Recognized net actuarial loss (gain) | 153 | | 206 | | 177 | | | (5) | | (1) | | 4 | |
| Amortization of prior service costs (recoveries) | 1 | | — | | (1) | | | — | | — | | — | |
| Amortization of prior service costs | |
| Total other components of net periodic benefit (recovery) cost | Total other components of net periodic benefit (recovery) cost | (422) | | (402) | | (363) | | | 11 | | 15 | | 21 | |
| Net periodic benefit (recovery) cost | Net periodic benefit (recovery) cost | $ | (274) | | $ | (231) | | $ | (223) | | | $ | 22 | | $ | 28 | | $ | 33 | |
Projected benefit obligation, plan assets, and funded status
Information about the Company’s DB pension plans and other benefits, in aggregate, is as follows:
| | | | Pensions | | Other benefits | | Pensions | | Other benefits | | Total |
| (in millions of Canadian dollars) | (in millions of Canadian dollars) | 2022 | 2021 | | 2022 | 2021 | (in millions of Canadian dollars) | 2023 | 2022 | | 2023 | 2022 | | 2023 | 2022 |
| Change in projected benefit obligation: | Change in projected benefit obligation: | |
| Projected benefit obligation at January 1 | |
| Projected benefit obligation at January 1 | |
| Projected benefit obligation at January 1 | Projected benefit obligation at January 1 | $ | 12,884 | | $ | 13,799 | | | $ | 503 | | $ | 553 | |
| Current service cost | Current service cost | 148 | | 171 | | | 11 | | 13 | |
| Interest cost | Interest cost | 383 | | 351 | | | 16 | | 16 | |
| Employee contributions | Employee contributions | 42 | | 42 | | | — | | — | |
| Benefits paid | Benefits paid | (680) | | (667) | | | (22) | | (31) | |
| Foreign currency changes | Foreign currency changes | 16 | | — | | | — | | — | |
| Addition of KCS plans | |
| Plan amendments and other | Plan amendments and other | 27 | | — | | | — | | — | |
| Actuarial gain | (2,884) | | (812) | | | (97) | | (48) | |
| Net actuarial loss (gain) | |
| Projected benefit obligation at December 31 | Projected benefit obligation at December 31 | $ | 9,936 | | $ | 12,884 | | | $ | 411 | | $ | 503 | |
The net actuarial losses for Pensions and Other benefits in 2023 were primarily due to the decrease in discount rate from 5.01% to 4.64%. The net actuarial gains for Pensions and Other benefits in 2022 and 2021 were primarily due to the increase in discount rate from 3.01% to 5.01% and from 2.58% to 3.01%, respectively..
101 CP 2022CPKC 2023 ANNUAL REPORT/ 105
| | | | Pensions | | Other benefits | | Pensions | | Other benefits | | Total |
| (in millions of Canadian dollars) | (in millions of Canadian dollars) | 2022 | 2021 | | 2022 | 2021 | (in millions of Canadian dollars) | 2023 | 2022 | | 2023 | 2022 | | 2023 | 2022 |
| Change in plan assets: | Change in plan assets: | |
| Fair value of plan assets at January 1 | |
| Fair value of plan assets at January 1 | |
| Fair value of plan assets at January 1 | Fair value of plan assets at January 1 | $ | 14,938 | | $ | 14,365 | | | $ | 5 | | $ | 5 | |
| Actual return on plan assets | Actual return on plan assets | (1,464) | | 1,180 | | | — | | — | |
| Employer contributions | Employer contributions | 14 | | 18 | | | 22 | | 31 | |
| Employee contributions | Employee contributions | 42 | | 42 | | | — | | — | |
| Benefits paid | Benefits paid | (680) | | (667) | | | (22) | | (31) | |
| Foreign currency changes | Foreign currency changes | 12 | | — | | | — | | — | |
| Fair value of plan assets at December 31 | Fair value of plan assets at December 31 | $ | 12,862 | | $ | 14,938 | | | $ | 5 | | $ | 5 | |
| Funded status – plan surplus (deficit) | Funded status – plan surplus (deficit) | $ | 2,926 | | $ | 2,054 | | | $ | (406) | | $ | (498) | |
The table below shows the aggregate pension projected benefit obligation and aggregate fair value of plan assets for pension plans with fair value of plan assets in excess of projected benefit obligations (i.e. surplus), and for pension plans with projected benefit obligations in excess of fair value of plan assets (i.e. deficit):
| | | | 2022 | | 2021 | | 2023 | | 2022 |
| (in millions of Canadian dollars) | (in millions of Canadian dollars) | Pension
plans in
surplus | Pension
plans in
deficit | | Pension
plans in
surplus | Pension
plans in
deficit | (in millions of Canadian dollars) | Pension
plans in
surplus | Pension
plans in
deficit | | Pension
plans in
surplus | Pension
plans in
deficit |
| Projected benefit obligation at December 31 | Projected benefit obligation at December 31 | $ | (9,512) | | $ | (424) | | | $ | (12,346) | | $ | (538) | |
| Fair value of plan assets at December 31 | Fair value of plan assets at December 31 | 12,613 | | 249 | | | 14,663 | | 275 | |
| Funded status | Funded status | $ | 3,101 | | $ | (175) | | | $ | 2,317 | | $ | (263) | |
The DB pension plans’ accumulated benefit obligation as at December 31, 20222023 was $9,747$10,155 million (2021(2022 – $12,591$9,747 million). The accumulated benefit obligation is calculated on a basis similar to the projected benefit obligation, except no future salary increases are assumed in the projection of future benefits. For pension plans with accumulated benefit obligations in excess of fair value of plan assets (i.e. deficit), the aggregate pension accumulated benefit obligation as at December 31, 20222023 was $332$327 million (2021(2022 – $410$332 million) and the aggregate fair value of plan assets as at December 31, 20222023 was $186$189 million (2021 –$201(2022 – $186 million).
All Other benefits plans were in a deficit position as at December 31, 20222023 and 2021.2022.
Pension asset and liabilities in the Company’s Consolidated Balance Sheets
Amounts recognized in the Company’s Consolidated Balance Sheets are as follows:
| | | | Pensions | | Other benefits | | Pensions | | Other benefits | | Total |
| (in millions of Canadian dollars) | 2022 | 2021 | | 2022 | 2021 |
| As at December 31 (in millions of Canadian dollars) | | As at December 31 (in millions of Canadian dollars) | 2023 | 2022 | | 2023 | 2022 | | 2023 | 2022 |
| Pension asset | Pension asset | $ | 3,101 | | $ | 2,317 | | | $ | — | | $ | — | |
| Accounts payable and accrued liabilities | Accounts payable and accrued liabilities | (10) | | (11) | | | (33) | | (32) | |
| Pension and other benefit liabilities | Pension and other benefit liabilities | (165) | | (252) | | | (373) | | (466) | |
| Total amount recognized | Total amount recognized | $ | 2,926 | | $ | 2,054 | | | $ | (406) | | $ | (498) | |
The measurement date used to determine the plan assets and the benefit obligation is December 31. The most recent actuarial valuation for pension funding purposes for the Company’s main Canadian pension plan was performed as at January 1, 2022.2023. During 2023,2024, the Company expects to file with the pension regulator a new valuation performed as at January 1, 2023.
106 / CP 2022CPKC 2023 ANNUAL REPORT 102
Accumulated other comprehensive (loss) income
Amounts recognized in accumulated other comprehensive (loss) incomeAOCI are as follows:
| | | | Pensions | | Other benefits | | Pensions | | Other benefits | | Total |
| (in millions of Canadian dollars) | 2022 | 2021 | | 2022 | 2021 |
| As at December 31 (in millions of Canadian dollars) | | As at December 31 (in millions of Canadian dollars) | 2023 | 2022 | | 2023 | 2022 | | 2023 | 2022 |
| Net actuarial (loss) gain: | Net actuarial (loss) gain: | |
| Other than deferred investment (losses) gains | |
| Other than deferred investment (losses) gains | |
| Other than deferred investment (losses) gains | Other than deferred investment (losses) gains | $ | (1,711) | | $ | (3,298) | | | $ | 35 | | $ | (57) | |
| Deferred investment (losses) gains | Deferred investment (losses) gains | (301) | | 672 | | | — | | — | |
| Prior service cost | Prior service cost | (31) | | (5) | | | (1) | | (1) | |
| Deferred income tax | Deferred income tax | 608 | | 759 | | | (9) | | 15 | |
| Total (Note 7) | $ | (1,435) | | $ | (1,872) | | | $ | 25 | | $ | (43) | |
| Total (Note 8) | |
Actuarial assumptions
Weighted-average actuarial assumptions used were approximately:
| | (percentages) | (percentages) | 2022 | | 2021 | | 2020 | |
| Benefit obligation at December 31: | Benefit obligation at December 31: | |
| Benefit obligation at December 31: | |
| Benefit obligation at December 31: | |
| Discount rate | |
| Discount rate | |
| Discount rate | Discount rate | 5.01 | | | 3.01 | | | 2.58 | | |
| Projected future salary increases | Projected future salary increases | 2.75 | | | 2.75 | | | 2.75 | | |
Health care cost trend rate (1) | 5.00 | | | 5.00 | | | 5.00 | | |
| Projected future salary increases | |
| Projected future salary increases | |
| Health care cost trend rate | |
| Health care cost trend rate | |
| Health care cost trend rate | |
| Benefit cost for year ended December 31: | |
| Benefit cost for year ended December 31: | |
| Benefit cost for year ended December 31: | Benefit cost for year ended December 31: | |
| Discount rate | Discount rate | 3.01 | | | 2.58 | | | 3.25 | | |
Expected rate of return on plan assets (2) | 6.90 | | | 6.90 | | | 7.25 | | |
| Discount rate | |
| Discount rate | |
Expected rate of return on plan assets (1) | |
Expected rate of return on plan assets (1) | |
Expected rate of return on plan assets (1) | |
| Projected future salary increases | Projected future salary increases | 2.75 | | | 2.75 | | | 2.75 | | |
Health care cost trend rate (1) | 5.00 | | | 5.00 | | | 5.50 | | |
| Projected future salary increases | |
| Projected future salary increases | |
| Health care cost trend rate | |
| Health care cost trend rate | |
| Health care cost trend rate | |
(1)The health care cost trend rate was assumed to be 5.50% in 2020 and 5.00% in 2021 and is assumed to be 5.00% per year in 2022 and thereafter.
(2) The expected rate of return on plan assets that will be used to compute the 20232024 net periodic benefit recovery is 6.90%6.70%.
Plan assets
Plan assets are recorded at fair value. The major asset categories are public equity securities, fixed income securities, real estate, infrastructure, absolute return investments, and private debt. The fair values of the public equity and fixed income securities are primarily based on quoted market prices. Real estate and infrastructure values are based on the value of each fund’s assets as calculated by the fund manager, generally using third party appraisals or discounted cash flow analysis and taking into account current market conditions and recent sales transactions where practical and appropriate. Private debt values are based on the value of each fund’s assets as calculated by the fund manager taking into account current market conditions and reviewed annually by external parties. Absolute return investments are a portfolio of units of externally managed hedge funds and are valued by the fund administrators.
103 CP 2022CPKC 2023 ANNUAL REPORT/ 107
The Company’s pension plan asset allocation, the weighted-average asset allocation targets, and the weighted averageweighted-average policy range for each major asset class at year-end were as follows:
| | | | | Percentage of plan assets
at December 31 | | | | Percentage of plan assets
at December 31 |
| Asset allocation (percentage) | Asset allocation (percentage) | Asset allocation target | Policy range | 2022 | 2021 | Asset allocation (percentage) | Asset allocation target | Policy range | 2023 | 2022 |
| Cash and cash equivalents | Cash and cash equivalents | 1.2 | | 0 – 10 | 1.1 | | 3.1 | |
| Fixed income | Fixed income | 24.4 | | 20 – 40 | 20.5 | | 24.1 | |
| Public equity | Public equity | 45.0 | | 35 – 55 | 46.4 | | 50.5 | |
| Real estate and infrastructure | Real estate and infrastructure | 9.8 | | 4 – 13 | 11.4 | | 6.7 | |
| Private debt | Private debt | 9.8 | | 4 – 13 | 7.7 | | 4.6 | |
| Absolute return | Absolute return | 9.8 | | 4 – 13 | 12.9 | | 11.0 | |
| Total | Total | 100.0 | | | 100.0 | | 100.0 | |
In April 2023, the Audit and Finance Committee approved changes to the asset allocation for the Company's main Canadian DB pension plan. The changes began in 2023 and will continue to be implemented on a measured basis in 2024. All asset allocations are within their policy ranges at December 31, 2023.
108 / CP 2022CPKC 2023 ANNUAL REPORT 104
Summary of the assets of the Company’s DB pension plans
The following is a summary of the assets of the Company’s DB pension plans at December 31, 20222023 and 2021.2022. As at December 31, 20222023 and 2021,2022, there were no plan assets classified as Level 3 valued investments.
| | Assets Measured at Fair Value | |
| Assets Measured at Fair Value | |
| Assets Measured at Fair Value | | | Investments measured at NAV(1) | Total Plan
Assets |
| (in millions of Canadian dollars) | |
| December 31, 2023 | |
| December 31, 2023 | |
| December 31, 2023 | |
| Cash and cash equivalents | |
| Cash and cash equivalents | |
| Cash and cash equivalents | |
| Fixed income | |
Government bonds(2) | |
Government bonds(2) | |
Government bonds(2) | |
Corporate bonds(2) | |
Mortgages(3) | |
Mortgage-backed and asset-backed securities(4) | |
| Public equities | |
| Canada | |
| Canada | |
| Canada | |
| U.S. and international | |
Real estate(5) | |
Infrastructure(6) | |
Private debt(7) | |
Derivative instruments(8) | |
Absolute return(9) | |
| Funds of hedge funds | |
| Funds of hedge funds | |
| Funds of hedge funds | |
| | Assets Measured at Fair Value | | Investments measured at NAV(1) | Total Plan
Assets |
| (in millions of Canadian dollars) | Quoted prices in
active markets
for identical assets (Level 1) | Significant other observable inputs (Level 2) | |
| $ | |
| $ | |
| $ | |
| December 31, 2022 | December 31, 2022 | | | |
| Cash and cash equivalents | Cash and cash equivalents | $ | 218 | | $ | — | | | $ | — | | $ | 218 | |
| Cash and cash equivalents | |
| Cash and cash equivalents | |
| Fixed income | Fixed income | | | |
Government bonds(2) | |
Government bonds(2) | |
Government bonds(2) | Government bonds(2) | 180 | | 1,125 | | | — | | 1,305 | |
Corporate bonds(2) | Corporate bonds(2) | 432 | | 724 | | | — | | 1,156 | |
Mortgages(3) | Mortgages(3) | 182 | | 2 | | | — | | 184 | |
| Public equities | Public equities | | | |
| Canada | Canada | 769 | | — | | | — | | 769 | |
| Canada | |
| Canada | |
| U.S. and international | U.S. and international | 5,195 | | — | | | — | | 5,195 | |
Real estate(4) | — | | — | | | 722 | | 722 | |
Infrastructure(5) | — | | — | | | 744 | | 744 | |
Private debt(6) | — | | — | | | 992 | | 992 | |
Derivative instruments(7) | — | | (81) | | | — | | (81) | |
Absolute return(8) | | | |
Real estate(5) | |
Infrastructure(6) | |
Private debt(7) | |
Derivative instruments(8) | |
Absolute return(9) | |
| Funds of hedge funds | |
| Funds of hedge funds | |
| Funds of hedge funds | Funds of hedge funds | — | | — | | | 1,658 | | 1,658 | |
| | | $ | 6,976 | | $ | 1,770 | | | $ | 4,116 | | $ | 12,862 | |
| December 31, 2021 | | | |
| Cash and cash equivalents | $ | 363 | | $ | — | | | $ | — | | $ | 363 | |
| Fixed income | | | |
Government bonds(2) | 232 | | 1,704 | | | — | | 1,936 | |
Corporate bonds(2) | 569 | | 868 | | | — | | 1,437 | |
Mortgages(3) | 230 | | 4 | | | — | | 234 | |
| Public equities | | | |
| Canada | 1,004 | | — | | | — | | 1,004 | |
| U.S. and international | 6,536 | | — | | | — | | 6,536 | |
Real estate(4) | — | | — | | | 732 | | 732 | |
Infrastructure(5) | — | | — | | | 263 | | 263 | |
Private debt(6) | — | | — | | | 682 | | 682 | |
Derivative instruments(7) | — | | 106 | | | — | | 106 | |
Absolute return(8) | | | |
| Funds of hedge funds | — | | — | | | 1,621 | | 1,621 | |
| Multi-strategy funds | — | | — | | | 24 | | 24 | |
| | $ | |
| | $ | |
| | $ | 8,934 | | $ | 2,682 | | | $ | 3,322 | | $ | 14,938 | |
| | $ | |
(1) Investments measured at net asset value ("NAV"):
Amounts are comprised of certain investments measured using NAV (or its equivalent) as a practical expedient. These investments have not been classified in the fair value hierarchy.
(2) Government & Corporate Bonds:
CPKC 2023 ANNUAL REPORT / 109
Fair values for bonds are based on market prices supplied by independent sources as of the last trading day.
105 CP 2022 ANNUAL REPORT
(3) Mortgages:
The fair values of mortgages are based on current market yields of financial instruments of similar maturity, coupon and risk factors.
(4)Mortgage-backed and asset-backed securities:
The fair values of mortgage-backed and asset-backed securities are determined based on valuations from pricing sources that incorporate broker-dealer quotations, reported trades or valuation estimates from their internal pricing models which consider tranche-level attributes, current market data, estimated cash flows and market-based yield spreads and incorporate deal collateral performance, as available.
(5) Real estate:
Real estate fund values are based on the NAV of the funds that invest directly in real estate investments. The values of the investments have been estimated using the capital accounts representing the plans' ownership interest in the funds. Of the total, $595$480 million is subject to redemption frequencies ranging from monthly to annually and a redemption notice period of 90 days (2021(2022 – $613$595 million). The remaining $127$83 million is not subject to redemption and is normally returned through distributions as a result of the liquidation of the underlying real estate investments (2021(2022 – $119$127 million). As at December 31, 2022,2023, there are $40$166 million of unfunded commitments for real estate investments (December 31, 20212022 – $32$40 million).
(5)(6) Infrastructure:
Infrastructure fund values are based on the NAV of the funds that invest directly in infrastructure investments. The values of the investments have been estimated using the capital accounts representing the plans' ownership interest in the funds. Of the total, $356$493 million is subject to redemption frequencies ranging from monthly to annually and a redemption notice period of 90 days (2021(2022 – $107$356 million). The remaining $388$468 million is not subject to redemption and is normally returned through distributions as a result of the liquidation of the underlying infrastructure investments (2021(2022 – $156$388 million). As at December 31, 2022,2023, there are $356$220 million of unfunded commitments for infrastructure investments (December 31, 20212022 – $814$356 million).
(6)(7) Private debt:
Private debt fund values are based on the NAV of the funds that invest directly in private debt investments. The values of the investments have been estimated using the capital accounts representing the plans' ownership interest in the funds. Of the total, $160$124 million is subject to redemption frequencies ranging from monthly to annually and a redemption notice period of 90 days (2021(2022 – $152$160 million). The remaining $832$1,004 million is not subject to redemption and is normally returned through distributions as a result of the repayment of the underlying loans (2021(2022 - $530$832 million). As at December 31, 2022,2023, there are $747$540 million of unfunded commitments for private debt investments (December 31, 20212022 – $774$747 million).
(7)(8) Derivatives:
The investment managers may utilize the following derivative instruments: equity futures to replicate equity index returns (Level 2); currency forwards to partially hedge foreign currency exposures (Level 2); bond futures and forwards to reduce asset/liabilitymanage duration and interest rate risk exposures (Level 2); interest rate swaps to manage duration and interest rate risk (Level 2); credit default swaps to manage credit risk (Level 2); and options to manage interest rate risk and volatility (Level 2). The Company may utilize derivatives directly, but only for the purpose of hedging foreign currency exposures. As at December 31, 2022, there are currency forwards with a notional valueOne of $nil (December 31, 2021 – $nil) and a fair value of $nil (December 31, 2021 – $6 million). Thethe fixed income investment managermanagers utilizes a portfolio of bond forwards for the purpose of reducing asset/liability interest rate exposure. As at December 31, 2022,2023, there are bond forwards with a notional value of $1,745$1,396 million (December 31, 20212022 – $2,967$1,745 million) and a fair value of $(81)$116 million (December 31, 20212022 – $100$(81) million).
(8)(9) Absolute return:
The value of absolute return fund investments is based on the NAV reported by the fund administrators. The funds have different redemption policies with redemption notice periods varying from 30 to 120 days and frequencies ranging from monthly to triennially.
Additional plan assets information
The Company's primary investment objective for pension plan assets is to achieve a long–termlong-term return, net of all fees and expenses, that is sufficient for the plan's assets to satisfy the current and future obligations to plan beneficiaries, while minimizing the financial impact on the Company. In identifying the asset allocation ranges, consideration was given to the long-term nature of the underlying plan liabilities, the solvency and going-concern financial position of the plan, long-term return expectations, and the risks associated with key asset classes as well as the relationships of returns on key asset classes with each other, inflation, and interest rates. When advantageous and with due consideration, derivative instruments may be utilized by investment managers, provided the total value of the underlying assets represented by financial derivatives (excluding currency forwards, liability hedging derivatives in fixed income portfolios, and derivatives held by absolute return funds) is limited to 30% of the market value of the fund.
The funded status of the plans is exposed to fluctuations in interest rates, which affects the relative values of the plans' liabilities and assets. In order to mitigate interest rate risk, the Company's main Canadian defined benefitDB pension plan utilizes a liability driven investment strategy in its fixed income portfolio, which uses a combination of long duration bonds and derivatives to hedge interest rate risk, managed by the investment manager. As at December 31, 2022,2023, the plan's solvency funded position was 45%50% hedged against interest rate risk (2021(2022 – 47%45%).
When investing in foreign securities, the plans are exposed to foreign currency risk; the effect of which is included in the valuation of the foreign securities. At December 31, 2023, the plans were 41% exposed to the U.S. dollar, 7% exposed to the Euro, and 9% exposed to various other currencies. At December 31, 2022, the plans were 50% exposed to the U.S. dollar, 6% exposed to the Euro, and 10% exposed to various other currencies. At December 31, 2021, the plans were 43% exposed to the U.S. dollar, 5% exposed to the Euro, and 10% exposed to various other currencies.
At December 31, 2022,2023, plan assets included 570,074354,530 of the Common Shares of the Company (2021(2022 – 426,304)570,074) at a market value of $58$37 million (2021(2022 – $39$58 million) and Fixed Income securities of the Company at a market value of $5$2 million (2021(2022 – $5 million).
110 / CP 2022CPKC 2023 ANNUAL REPORT 106
Estimated future benefit payments
The estimated future DB pension and other benefit payments to be paid by the plans for each of the next five years and the subsequent five-year period are as follows:
| | (in millions of Canadian dollars) | (in millions of Canadian dollars) | Pensions | Other benefits | (in millions of Canadian dollars) | Pensions | Other benefits |
| 2023 | $ | 652 | | $ | 33 | |
| 2024 | 2024 | 648 | | 31 | |
| 2025 | 2025 | 649 | | 30 | |
| 2026 | 2026 | 648 | | 29 | |
| 2027 | 2027 | 649 | | 29 | |
| 2028-2032 | 3,234 | | 137 | |
| 2028 | |
| 2029-2033 | |
The benefit payments from the Canadian registered and U.S. qualified DB pension plans are payable from their respective pension funds. Benefit payments from the supplemental pension planplans and from the other benefits plans are payable directly by the Company.
Defined contribution plan
Canadian non-unionized employees hired prior to July 1, 2010 had the option to participate in the Canadian DC plan. All Canadian non-unionized employees hired after such date must participate in this plan. Employee contributions are based on a percentage of salary. The Company matches employee contributions to a maximum percentage each year.
Effective July 1, 2010, a new U.S. DC plan was established. All U.S. non-unionizedNon-unionized employees of Soo Line Railroad Company; Dakota, Minnesota & Eastern Railroad; and Delaware & Hudson Railway Company, Inc. hired after such date must participate in this plan. Employees do not contribute to the plan. The Company annually contributes a percentage of salary.
The DC plans provide a pension based on total employee and employer contributions plus investment income earned on those contributions.
In 2022,2023, the net cost of the DC plans, which generally equals the employer’s required contribution, was $14 million (2022 – $12 million (2021million; 2021 – $13 million; 2020 – $12 million).
Contributions to multi-employer plans
Some of the Company’s unionized employees in the U.S. are members of a U.S. national multi-employer benefit plan. Contributions made by the Company to this plan in 20222023 in respect of post-retirement medical benefits were $4 million (2022 – $2 million (2021 – $3 million; 20202021 – $3 million).
22.24. Stock-based compensation.compensation
At December 31, 2022,2023, the Company had several stock-based compensation plans including a stock option plans,options plan, various cash-settled liability plans, and an employee share purchase plan. These plans resulted in an expense of $113$122 million in 2022 (20212023 (2022 – $131$113 million; 20202021 – $170$131 million) and the total tax benefit related to these plans was $2627 million in 2022 (20212023 (2022 – $26 million; 2021 – $29 million; 2020 – $42 million).
107 CP 2022CPKC 2023 ANNUAL REPORT/ 111
A. Stock optionoptions plan
The following table summarizes informationthe activity related to the stock option plan as at December 31, 2022:options during 2023:
| | Options outstanding | | Non-vested options |
| Number of
options | Weighted-average
exercise price | | Number of
options | Weighted-average
grant date
fair value |
| Outstanding, January 1, 2022 | 7,392,188 | | $ | 53.36 | | | 3,748,983 | | $ | 14.25 | |
| Options outstanding | | | Options outstanding | | Non-vested options |
| Number of
stock options | | | Number of
stock options | Weighted-average
exercise price | | Number of
stock options | Weighted-average
grant date
fair value |
| Outstanding, January 1, 2023 | |
| Granted | Granted | 839,108 | | $ | 94.18 | | | 839,108 | | $ | 21.33 | |
| Exercised | Exercised | (840,795) | | $ | 38.46 | | | N/A | Exercised | (1,634,730) | | $ | 42.13 | | | N/A | | N/A | N/A |
| Vested | Vested | N/A | | (1,953,715) | | $ | 12.10 | |
| Forfeited | Forfeited | (37,368) | | $ | 84.78 | | | (37,368) | | $ | 17.94 | |
| | Outstanding, December 31, 2022 | 7,353,133 | | $ | 61.69 | | | 2,597,008 | | $ | 18.09 | |
Vested or expected to vest at December 31, 2022(1) | 7,304,289 | | $ | 61.51 | | | N/A |
| Exercisable, December 31, 2022 | 4,756,125 | | $ | 49.02 | | | N/A |
| Outstanding, December 31, 2023 | |
| Outstanding, December 31, 2023 | |
| Outstanding, December 31, 2023 | |
Vested or expected to vest at December 31, 2023(1) | | Vested or expected to vest at December 31, 2023(1) | 6,428,547 | | $ | 70.83 | | | N/A | N/A |
| Exercisable, December 31, 2023 | | Exercisable, December 31, 2023 | 4,168,829 | | $ | 58.20 | | | N/A | N/A |
(1) As at December 31, 2022,2023, the weighted-average remaining term of vested or expected to vest options was 3.3 years with an aggregate intrinsic value of $288$219 million.
The following table provides the number of stock options outstanding and exercisable as at December 31, 20222023 by range of exercise price and their related intrinsic aggregate value, and for stock options outstanding, the weighted-average years to expiration. The table also provides the aggregate intrinsic value for in-the-money stock options, which represents the amount that would have been received by option holders had they exercised their options on December 31, 20222023 at the Company’s closing stock price of $100.95.$104.84.
| | | | | | | | | | | | | | | | | | | | | | | | | | |
| Options outstanding | | Options exercisable |
| Range of exercise prices | Number of
options | Weighted-average
years to
expiration | Weighted-average
exercise
price | Aggregate
intrinsic
value
(millions) | | Number of
options | Weighted-average
exercise
price | Aggregate
intrinsic
value
(millions) |
| $23.84 - $41.51 | 2,105,506 | | 1.6 | $ | 36.62 | | $ | 135 | | | 2,105,506 | | $ | 36.62 | | $ | 135 | |
| $41.52 - $55.48 | 1,655,284 | | 2.3 | $ | 49.09 | | $ | 86 | | | 1,526,734 | | $ | 48.64 | | $ | 80 | |
| $55.49 - $90.81 | 1,795,994 | | 4.0 | $ | 70.03 | | $ | 56 | | | 883,395 | | $ | 66.85 | | $ | 30 | |
| $90.82 - $111.52 | 1,796,349 | | 5.6 | $ | 94.35 | | $ | 12 | | | 240,490 | | $ | 94.49 | | $ | 2 | |
Total(1) | 7,353,133 | | 3.3 | $ | 61.69 | | $ | 289 | | | 4,756,125 | | $ | 49.02 | | $ | 247 | |
| | | | | | | | | | | | | | | | | | | | | | | | | | |
| Options outstanding | | Options exercisable |
| Range of exercise prices | Number of
stock options | Weighted-average
years to
expiration | Weighted-average
exercise
price | Aggregate
intrinsic
value
(millions) | | Number of
stock options | Weighted-average
exercise
price | Aggregate
intrinsic
value
(millions) |
| $30.94 - $50.19 | 1,693,436 | | 1.2 | $ | 40.04 | | $ | 110 | | | 1,693,436 | | $ | 40.04 | | $ | 110 | |
| $50.20 - $70.36 | 1,395,999 | | 2.3 | $ | 58.53 | | $ | 65 | | | 1,284,814 | | $ | 57.53 | | $ | 61 | |
| $70.37 - $94.27 | 1,610,826 | | 4.0 | $ | 82.99 | | $ | 35 | | | 822,618 | | $ | 80.20 | | $ | 20 | |
| $94.28 - $109.01 | 1,771,671 | | 5.3 | $ | 99.62 | | $ | 9 | | | 367,961 | | $ | 94.94 | | $ | 4 | |
Total(1) | 6,471,932 | | 3.3 | $ | 71.03 | | $ | 219 | | | 4,168,829 | | $ | 58.20 | | $ | 195 | |
(1) As at December 31, 2022,2023, the total number of in-the-money stock options outstanding was 7,339,3745,787,281 with a weighted-average exercise price of $61.60.$66.96. The weighted-average years to expiration of exercisable stock options is 2.42.3 years.
Pursuant to the employee plan, stock options may be exercised upon vesting, which is between 12 months and 48 months after the grant date, and will expire after seven years. Underyears from the fair value method, thegrant date. The grant date fair value of the stock options atgranted in 2023 was $26 million (2022 – $16 million; 2021 – $26 million). The following table provides assumptions used to determine the fair values of stock option awards, and the weighted-average grant date was approximately $16 millionfair values for options issuedunits granted in 2023, 2022 (2021 – $26 million; 2020 – $15 million). The weighted-average fair value assumptions were approximately:and 2021:
| | 2022 | 2021 | 2020 |
| 2023 | | | 2023 | 2022 | 2021 |
Expected option life (years)(1) | Expected option life (years)(1) | 4.75 | 4.75 | Expected option life (years)(1) | 4.75 | 4.75 |
Risk-free interest rate(2) | Risk-free interest rate(2) | 1.62 | % | 0.53 | % | 1.28 | % | Risk-free interest rate(2) | 3.35 | % | 1.62 | % | 0.53 | % |
Expected stock price volatility(3) | Expected stock price volatility(3) | 26.85 | % | 27.14 | % | 23.14 | % | Expected stock price volatility(3) | 28.44 | % | 26.85 | % | 27.14 | % |
Expected annual dividends per share(4) | Expected annual dividends per share(4) | $ | 0.760 | | $ | 0.760 | | $ | 0.664 | |
Expected forfeiture rate(5) | Expected forfeiture rate(5) | 3.01 | % | 2.62 | % | 4.41 | % | Expected forfeiture rate(5) | 3.18 | % | 3.01 | % | 2.62 | % |
| Weighted-average grant date fair value of options granted during the year | Weighted-average grant date fair value of options granted during the year | $ | 21.33 | | $ | 19.06 | | $ | 13.80 | |
(1) Represents the period of time that awards are expected to be outstanding. Historical data on exercise behaviour or, when available, specific expectations regarding future exercise behaviour were used to estimate the expected life of the option.
(2) Based on the implied yield available on zero-coupon government issues with an equivalent term commensurate with the expected term of the option.
112 / CPKC 2023 ANNUAL REPORT
(3) Based on the historical volatility of the Company’s stock price over a period commensurate with the expected term of the option.
CP 2022 ANNUAL REPORT 108
(4) Determined by the current annual dividend at the time of grant. The Company does not employ different dividend yields throughout the contractual term of the option.
(5) The Company estimates forfeitures based on past experience. The rate is monitored on a periodic basis.
In 2022,2023, the expense for stock options (regular and performance) was $23$25 million (2021(2022 – $23 million; 20202021 – $16$23 million). At December 31, 2022,2023, there was $17$9 million of total unrecognized compensation related to stock options, which is expected to be recognized over a weighted-average period of approximately 0.91.1 years.
The total fair value of shares vested for the stock option plan during 20222023 was $18 million (2022 – $24 million (2021million; 2021 – $18 million; 2020 – $10 million).
The following table provides information related to all stock options exercised in the stock option plan during the years ended December 31:
| | (in millions of Canadian dollars) | (in millions of Canadian dollars) | 2022 | 2021 | 2020 | (in millions of Canadian dollars) | 2023 | 2022 | 2021 |
| Total intrinsic value | Total intrinsic value | $ | 53 | | $ | 43 | | $ | 52 | |
| Cash received by the Company upon exercise of options | Cash received by the Company upon exercise of options | 32 | | 25 | | 52 | |
B. Other share-basedShare unit plans
Performance share unit plansplan
During 2022,2023, the Company issued 415,660891,411 PSUs with a grant date fair value of approximately $38$96 million and 13,50626,333 PDSUs with a grant date fair value, including the fair value of expected future matching units, of approximately $1$3 million. PSUs and PDSUs attract dividend equivalents in the form of additional units based on dividends paid on the Company's Common Shares, and vest approximately three to four years after the grant date, contingent upon CP’son the Company’s performance ("performance factor"). The fair value of these PSUs and PDSUs is measured periodically until settlement using closing share price on the date of measurement. The fair value of units that are probable of vesting based on forecasted performance factors over the three-year performance period is recognized as expense in the Consolidated Statements of Income. Vested PSUs are settled in cash. Vested PDSUs are settled in cashconverted into DSUs pursuant to the DSU plan, and are eligible for a 25% company match if the holderemployee has not exceeded their share ownership requirements, and are paid outsettled in cash only when the holder ceases their employment with CP.the Company.
The performance period for 544,175 PSUs and all PDSUs issuedgranted in 2023 is January 1, 2023 to December 31, 2025, and the performance factors are Free Cash Flow ("FCF"), Total Shareholder Return ("TSR") compared to the S&P/TSX 60 Index, and TSR compared to the S&P 500 Industrials Index. The performance period for the other 347,236 PSUs granted in 2023 is April 28, 2023 to December 1, 2026 and the performance factors are annualized earnings before interest, tax, depreciation, and amortization ("EBITDA"), and TSR compared to Class I railways.
The performance period for all of the 415,660 PSUs and 13,506 PDSUs granted in 2022 is January 1, 2022 to December 31, 2024, and the performance factors are Free Cash Flow ("FCF"),FCF, Adjusted net debt to Adjusted earnings before interest, tax, depreciation, and amortization ("EBITDA")EBITDA Modifier, Total Shareholder Return ("TSR")TSR compared to the S&P/TSX 60 Index, and TSR compared to the S&P 500 Industrials Index.
The performance period for all of the 431,430 PSUs and 12,694 PDSUs issuedgranted in 2021 iswas January 1, 2021 to December 31, 2023, and the performance factors for these PSUs arewere Return on Invested Capital ("ROIC"), TSR compared to the S&P/TSX 60 Index, and TSR compared to Class I railways.
The performance period for 489,990 PSUs and 50,145 PDSUs issued in 2020 was January 1, 2020 to December 31, 2022, and the performance factors for these PSUs were ROIC, TSR compared to the S&P/TSX 60 Index, and TSR compared to Class I Railways. The estimated payout on these awards is 180%135% on 459,358399,372 PSUs and 45,058 PDSUs outstanding (including expected futuredividends reinvested) and 11,372 PDSUs (including expected dividends reinvested and matching units) outstanding, representing fair values of $87$54 million and $11$2 million, respectively, as at December 31, 2022,2023, calculated usingbased on the Company's average common share price of the last 30 trading days preceding December 31, 2022.2023.
The performance period for 668,405all of the 489,990 PSUs issuedand 50,145 PDSUs granted in 20192020 was January 1, 20192020 to December 31, 2021,2022, and the performance factors were ROIC, TSR compared to the S&P/TSX 60 Index, and TSR compared to Class I Railways.railways. The resulting payout was 200%180% of the outstanding units multiplied by the Company's average common share price calculated usingbased on the last 30 trading days preceding December 31, 2021.2022. In the first quarter of 2023, payouts were $87 million on 459,358 PSUs, including dividends reinvested. The 45,058 PDSUs that vested on December 31, 2022, payouts occurred on 631,457 total outstanding awards,with a fair value of $11 million, including dividends reinvested totalling $116 million.and matching units, will be paid out in future reporting periods pursuant to the DSU plan (as described above).
The following table summarizes information related to PSUs and PDSUs as at December 31:
| | | | | | | | |
| 2022 | 2021 |
| Outstanding, January 1 | 1,577,781 | | 1,909,345 | |
| Granted | 429,166 | | 444,124 | |
| Units in lieu of dividends | 11,207 | | 14,668 | |
| Settled | (637,073) | | (743,512) | |
| Forfeited | (44,723) | | (46,844) | |
| Outstanding, December 31 | 1,336,358 | | 1,577,781 | |
109 CP 2022CPKC 2023 ANNUAL REPORT/ 113
The following table summarizes the activity related to PSUs and PDSUs during for each of the years ended December 31:
| | | | | | | | |
| 2023 | 2022 |
| Outstanding, January 1 | 1,336,358 | | 1,577,781 | |
| Granted | 917,744 | | 429,166 | |
| Issued in lieu of dividends | 10,845 | | 11,207 | |
| Settled | (460,667) | | (637,073) | |
| PDSUs converted into DSUs | (45,058) | | — | |
| Forfeited | (80,669) | | (44,723) | |
| Outstanding, December 31 | 1,678,553 | | 1,336,358 | |
In 2022,2023, the expense for PSUs and PDSUs was $78 million (2022 – $69 million (2021million; 2021 – $91 million; 2020 – $121 million). At December 31, 2022,2023, there was $32$67 million of total unrecognized compensation related to these awards, which is expected to be recognized over a weighted-average period of approximately 1.61.9 years.
Deferred share unit plan
The Company established the DSU plan as a means to compensate and assist in attaining share ownership targets set for certain key employees and Directors. A DSU entitles the holder to receive, upon redemption, a cash payment equivalent to the Company's average common share price using the 10 trading days prior to redemption. DSUs vest over various periods of up to 36 months and are only redeemable for a specified period after employment is terminated.
Senior managers may elect to receive DSUs in lieu of annual bonus cash payments in the bonus deferral program. In addition, senior managers will be granted a 25% company match of DSUs when deferring cash to DSUs to meet ownership targets. The election to receive eligible payments in DSUs is no longer available to a participant when the value of the participant’s DSUs is sufficient to meet the Company’s stock ownership guidelines. Senior managers have five years to meet their ownership targets.
The expense for DSUs is recognized over the vesting period for both the initial subscription price and the change in value between reporting periods.
The following table summarizes informationthe activity related to DSUs as atfor each of the years ended December 31:
| | 2022 | 2021 |
| 2023 | | | 2023 | 2022 |
| Outstanding, January 1 | Outstanding, January 1 | 841,333 | | 774,053 | |
| Granted | Granted | 60,262 | | 70,112 | |
| Units in lieu of dividends | 6,510 | | 6,753 | |
| PDSUs converted into DSUs | |
| Issued in lieu of dividends | |
| Settled | Settled | (162,319) | | (6,677) | |
| Forfeited | Forfeited | (1,256) | | (2,908) | |
| Outstanding, December 31 | Outstanding, December 31 | 744,530 | | 841,333 | |
During 2022,2023, the Company granted 60,26281,533 DSUs with a grant date fair value of approximately $6$9 million. In 2022,2023, the expense for DSUs was $10 million (2021(2022 – $6$10 million; 20202021 – $21$6 million). At December 31, 2022,2023, there was $1 million of total unrecognized compensation related to DSUs, which is expected to be recognized over a weighted-average period of approximately 1.71.9 years.
114 / CPKC 2023 ANNUAL REPORT
Summary of share-basedshare unit liabilities paid
The following table summarizes the total share-basedshare unit liabilities paid for each of the years ended December 31:
| | (in millions of Canadian dollars) | (in millions of Canadian dollars) | 2022 | 2021 | 2020 | (in millions of Canadian dollars) | 2023 | 2022 | 2021 |
| Plan | Plan | |
| PSUs | PSUs | $ | 116 | | $ | 119 | | $ | 76 | |
| PSUs | |
| PSUs | |
| DSUs | DSUs | 16 | | 1 | | 9 | |
| Other | Other | 5 | | 6 | | 1 | |
| Total | Total | $ | 137 | | $ | 126 | | $ | 86 | |
C. Employee share purchase plan
The Company has an employee share purchase plan whereby both employee and the Company contributions are used to purchase shares on the open market for employees. The Company’s contributions are expensed over the one year vesting period. Under the plan, the Company matches $1 for every $3 contributed by employees up to a maximum employee contribution of 6% of annual salary.
The total number of shares purchased in 20222023 on behalf of participants, including the Company's contributions, was 566,902 (2021600,730 (2022 – 538,022; 2020566,902; 2021 – 576,720)538,022). In 2022,2023, the Company’s contributions totalled $11$15 million (2021(2022 – $11 million; 20202021 – $9$11 million) and the related expense was $11 million (2022 – $9 million (2021million; 2021 – $8 million; 2020 – $7 million).
CP 2022 ANNUAL REPORT 110
23.25. Variable interest entities
The Company leases equipment from certain trusts, which have been determined to be variable interest entitiesare financed by a combination of debt and equity provided byand are unrelated third parties. The lease agreements, which are classified as operating leases, have fixed price purchase options that create the Company’s variable interests and result in the trusts being considered variable interest entities.entities ("VIE").
Maintaining and operating the leased assets according to specific contractual obligations outlined in the terms of the lease agreements and industry standards is the Company’s responsibility. The rigour of the contractual terms of the lease agreements and industry standards are such that the Company has limited discretion over the maintenance activities associated with these assets. As such,Accordingly, the Company concluded these terms dodoes not provide the Company withhave the power to direct the activities of the variable interestthat most significantly impact these entities in a way that has a significant impact on the entities’ economic performance.
The Company's financial exposure to the Company as a result ofresulting from its involvement with the variable interestthese entities, is equallimited to its fixed lease payments. In 2023, lease payments related to the fixed lease payments due to the trusts. In 2022, lease payments after taxVIE were $15$8 million. FutureTotal future minimum lease payments before tax,to the end of $94 million willthe lease term in 2030 are $84 million. The fixed price purchase options for all leased assets expire in 2026. Although the leased assets must be payable overreturned in good operating condition, subject to normal wear and tear, the next eight years. The Company does not guarantee the residual value of the assets to the lessor; however, it must deliver to the lessor the assets in good operating condition, subject to normal wear and tear, at the end of the lease term.lease.
As the Company’s actions and decisions do not significantly affect the variable interest entities’ performance, and the Company’s fixed price purchase option is not considered to be potentially significant to the variable interest entities,Since the Company is not consideredhas neither the power to bedirect the primary beneficiary, andactivities of the VIE, or the obligation to absorb expected losses or residual returns, it does not consolidate these variable interest entities.
Additionally, as further discussed in Note 10, as at December 31, 2022, an indirect wholly owned subsidiary of the Company is the sole beneficiary of an independent voting trust that holds 100% of the equity interest in KCS. The trust is governed by a single trustee who is responsible to act in the interest of the Company as the beneficial owner of the shares of KCS. As a result of KCS's equity being held in trust, the Company's interest in KCS does not have the attributes of a typical equity holder as the Company has no power to direct KCS’s activities during the trust period and therefore the trust is considered to be a variable interest entity that the Company cannot consolidate.
The risks associated with the Company's investment in KCS include normal corporate and business risks associated with railroad operations. During the trust period, KCS is subject to contractual restrictions related to acquiring assets, entering into material contracts, or making certain additional capital expenditures that could have a negative impact on their operations. The Company's investment in KCS is also subject to the risk that the STB will not approve the Company’s application to control KCS by December 31, 2023, or by a final and non-appealable order, refuse to provide final approval in which cases the Company would be required to dispose of its investment in KCS. Similarly, if the STB imposes onerous conditions on its final approval, the Company may choose to dispose of its initial investment in KCS rather than agreeing to the conditions imposed by the STB. The Company may not be able to sell its investment at a price that recovers its initial investment and may incur a loss up to the full carrying value of its investment in KCS, in addition to incurring significant expenses in connection to such transaction. All of these risks can impact the overall value of the Company’s investment in KCS.VIE.
24.26. Commitments and contingencies
In the normal course of its operations, the Company becomes involved in various legal actions, including claims relating to injuries and damage to property. The Company maintains provisions it considers to be adequate for such actions. While the final outcome with respect to actions outstanding or pending at December 31, 2022,2023, cannot be predicted with certainty, it is the opinion of management that their resolution will not have a material adverse effect on the Company’s business, financial position, or results of operations.operations, or liquidity. However, an unexpected adverse resolution of one or more of these legal actions could have a material adverse effect on the Company's business, financial position, results of operations, or liquidity in a particular quarter or fiscal year.
Commitments
At December 31, 2022,2023, the Company had committed to total future capital expenditures amounting to $389 million$2.3 billion, which includes investments in the Celaya-NBA Line Railway Bypass and other concession capital expenditures. Future operating expenditures relating to supplier purchase obligations, such as bulk fuel purchase agreements, locomotive maintenance and overhaul agreements, as well as agreements to purchase other goods and services amounting to approximately $1.4 billion$544 million for the years 2023–2024–2035.
Annual maturities and principal repayments of debt for the next five years and thereafter are provided in Note 17. Commitments related to leases, including minimum annual payments for the next five years and thereafter, are included in Note 18.20.
CPKC 2023 ANNUAL REPORT / 115
Legal proceedings related to Lac-Mégantic rail accident
On July 6, 2013, a train carrying petroleum crude oil operated by Montréal Maine and Atlantic Railway (“MMAR”) or a subsidiary, Montréal Maine & Atlantic Canada Co. (“MMAC” and collectively the “MMA Group”), derailed in Lac-Mégantic, Québec. The derailment occurred on a section of railway owned and operated by the MMA Group and while the MMA Group exclusively controlled the train.
111 CP 2022 ANNUAL REPORT
Following the derailment, MMAC sought court protection in Canada under the Companies’ Creditors Arrangement Act and MMAR filed for bankruptcy in the U.S. Plans of arrangement were approved in both Canada and the U.S. (the “Plans”), providing for the distribution of approximately $440 million amongst those claiming derailment damages.
A number of legal proceedings, set out below, were commenced in Canada and the U.S. against the Company and others:
(1)Québec's Minister of Sustainable Development, Environment, Wildlife and Parks ordered various parties, including the Company, to remediate the derailment site (the "Cleanup Order") and served the Company with a Notice of Claim for $95 million for those costs. The Company appealed the Cleanup Order and contested the Notice of Claim with the Administrative Tribunal of Québec. These proceedings are stayed pending determination of the Attorney General of Québec (“AGQ”) action (paragraph 2 below).
(2)The AGQ sued the Company in the Québec Superior Court claiming $409 million in damages, which was amended and reduced to $315 million (the “AGQ Action”). The AGQ Action alleges that: (i) the Company was responsible for the petroleum crude oil from its point of origin until its delivery to Irving Oil Ltd.; and (ii) the Company is vicariously liable for the acts and omissions of the MMA Group.
(3)A class action in the Québec Superior Court on behalf of persons and entities residing in, owning or leasing property in, operating a business in, or physically present in Lac-Mégantic at the time of the derailment was certified against the Company on May 8, 2015 (the "Class Action"). Other defendants including MMAC and Mr. Thomas Harding ("Harding") were added to the Class Action on January 25, 2017. On November 28, 2019, the plaintiffs' motion to discontinue their action against Harding was granted. The Class Action seeks unquantified damages, including for wrongful death, personal injury, property damage, and economic loss.
(4)Eight subrogated insurers sued the Company in the Québec Superior Court claiming approximately $16 million in damages, which was amended and reduced to approximately $15 million (the “Promutuel Action”), and two additional subrogated insurers sued the Company claiming approximately $3 million in damages (the “Royal Action”). Both actions contain similar allegations as the AGQ Action. The actions do not identify the subrogated parties. As such, the extent of any overlap between the damages claimed in these actions and under the Plans is unclear. The Royal Action is stayed pending determination of the consolidated proceedings described below.
On December 11, 2017, the AGQ Action, the Class Action and the Promutuel Action were consolidated. The joint liability trial of these consolidated claims commenced on September 21, 2021, with oral arguments ending on June 15, 2022. The Québec Superior Court issued a decision on December 14, 2022 dismissing all claims as against the Company, finding that the Company’s actions were not the direct and immediate cause of the accident and the damages suffered by the plaintiffs. All three plaintiffs filed a declaration of appeal on January 13, 2023. A damages trial will follow after the disposition of all appeals, if necessary.
(5)Forty-eight plaintiffs (all individual claims joined in one action) sued the Company, MMAC, and Harding in the Québec Superior Court claiming approximately $5 million in damages for economic loss and pain and suffering, and asserting similar allegations as in the Class Action and the AGQ Action. The majority of the plaintiffs opted-out of the Class Action and all but two are also plaintiffs in litigation against the Company, described in paragraph 7 below. This action is stayed pending determination of the consolidated claims described above.
(6)The MMAR U.S. bankruptcy estate representative commenced an action against the Company in November 2014 in the Maine Bankruptcy Court claiming that the Company failed to abide by certain regulations and seeking approximately U.S. $30 million in damages for MMAR’s loss in business value according to a recentan expert report filed by the bankruptcy estate. This action asserts that the Company knew or ought to have known that the shipper misclassified the petroleum crude oil and therefore should have refused to transport it. Summary judgment motion was argued and taken under advisement on June 9, 2022, and decision is pending. InOn May 23, 2023, the meantime,case management judge stayed the Company has filed a motion for leave to file additional arguments onproceedings pending the effectoutcome of the decision of the Québec Superior Courtappeal in the Canadian consolidated claims and motion is set to be heard on February 28, 2023.claims.
(7)The class and mass tort action commenced against the Company in June 2015 in Texas (on behalf of Lac-Mégantic residents and wrongful death representatives) and the wrongful death and personal injury actions commenced against the Company in June 2015 in Illinois and Maine, were all transferred and consolidated in Federal District Court in Maine (the “Maine Actions”). The Maine Actions allege that the Company negligently misclassified and improperly packaged the petroleum crude oil. On the Company’s motion, the Maine Actions were dismissed. The plaintiffs appealed the dismissal decision to the United StatesU.S. First Circuit Court of Appeals, which dismissed the plaintiffs' appeal on June 2, 2021. The plaintiffs further petitioned the United StatesU.S. First Circuit Court of Appeals for a rehearing, which was denied on September 8, 2021. On January 24, 2022, the
116 / CPKC 2023 ANNUAL REPORT
plaintiffs further appealed to the U.S. Supreme Court on two bankruptcy procedural grounds. On May 31, 2022, the U.S. Supreme Court denied the petition, thereby rejecting the plaintiffs' appeal.
(8)The trustee for the wrongful death trust commenced Carmack Amendment claims against the Company in North Dakota Federal Court, seeking to recover approximately U.S. $6 million for damaged rail cars and lost crude oil and reimbursement for the settlement paid by the consignor and the consignee under the Plans (alleged to be U.S. $110 million and U.S. $60 million, respectively). The Court issued an Order on August 6, 2020
CP 2022 ANNUAL REPORT 112
granting and denying in parts the parties' summary judgment motions which has been reviewed and confirmed following motions by the parties for clarification and reconsideration. Final briefs of dispositive motions for summary judgment and for reconsideration on tariff applicability were submitted on September 30, 2022. On January 20, 2023, the Court granted in part the Company's summary judgment motion by dismissing all claims for recovery of settlement payments but leaving for trial the determination of the value of the lost crude oil. It also dismissed the Company's motion for reconsideration on tariff applicability. The remaining issueissues of the value of the lost crude oil and applicability of judgment reduction provisions do not require trial, and were fully briefed in 2024. On January 5, 2024, the Court issued its decision finding that the Company is setliable for trial from February 27approximately U.S. $3.9 million plus pre-judgment interest, but declined to March 2, 2023.determine whether judgment reduction provisions were applicable, referring the parties to a court in Maine on that issue. On January 18, 2024, the Company filed a motion for reconsideration for the Court to apply the judgment reduction provisions. On January 19, 2024, the trustee for the wrongful death trust filed a Notice of Appeal for the January 5, 2024 decision, as well as prior decisions.
At this stage of the proceedings, any potential responsibility and the quantum of potential losses cannot be determined. Nevertheless, the Company denies liability and is vigorously defending these proceedings.
Court decision related to Remington Development Corporation legal claim
On October 20, 2022, the Court of King’s Bench of Alberta issued a decision in a claim brought by Remington Development Corporation (“Remington”) against the Company and the Province of Alberta (“Alberta”) with respect to an alleged breach of contract by the Company in relation to the sale of certain properties in Calgary. In its decision, the Court found the Company had breached its contract with Remington and Alberta had induced the contract breach. The Court found the Company and Alberta liable for damages of approximately $164 million plus interest and costs, and subject to an adjustment to the acquisition value of the property. However,In a further decision on August 30, 2023, the Court determined that adjustment and set the total damages at $165 million plus interest and costs. On October 20, 2023, the Court determined the costs payable to Remington, however, the Court has not provided any indication of how the damages, which are currently estimated to total approximately $200$217 million, before Remington’s costs are established, should be apportioned between the Company and Alberta. As a result, at this time, the Company cannot reasonably estimate the amount of damages for which it is liable under the ruling of the Court. The Company has filed an appeal of the Court’s decision.
2014 tax assessment
25.In April 2022, the SAT delivered an audit assessment on CPKCM’s 2014 tax returns (the “2014 Assessment’). As of December 31, 2023, the assessment was Ps.6,068 million ($475 million), which included inflation, interest, and penalties. In July 2022, CPKCM filed an administrative appeal with the SAT to revoke the 2014 Assessment and challenge that the SAT’s delivery of the assessment by electronic tax mailbox was in violation of an enforceable court injunction previously granted to CPKCM. In September 2022, the SAT dismissed CPKC’s administrative appeal on grounds that it was not submitted timely. In November 2022, CPKCM filed a lawsuit in Administrative Court challenging the legality of the SAT's delivery of the assessment by electronic mailbox and also the SAT’s dismissal of CPKCM’s administrative appeal. The Administrative Court is expected to render a decision on the legality of the 2014 Assessment in 2024. CPKCM expects to prevail based on the technical merits of its case.
2023 business interruption insurance settlement
During the third quarter of 2023, the Company realized gain contingencies of $51 million recognized to "Purchased services and other", as a result of settlements reached with insurers for business interruption losses incurred by the Company related to a wildfire and flooding in B.C. in 2021.
27. Guarantees
In the normal course of operating the railway, the Company enters into contractual arrangements that involve providing certain guarantees, which extend over the term of the contracts. These guarantees include, but are not limited to:
•guarantees to pay other parties in the event of the occurrence of specified events, including damage to equipment, in relation to assets used in the operation of the railway through operating leases, rental agreements, easements, trackage, and interline agreements;
•guarantees to pay other parties in the event of a specified change in control of the Company or particular subsidiaries of the Company;
•guarantees to repay amounts outstanding for certain debt obligations;
•a guarantee to repay a portion of amounts outstanding for certain debt obligations held by an equity investee; and
•indemnifications of certain tax-related payments incurred by lessors and lenders.
The maximum amount that could be payable under these guarantees, excluding residual value guarantees, cannot be reasonably estimated due to the nature of certain of these guarantees. All or a portion of amounts paid under guarantees to other parties in the event of the occurrence of specified events could
CPKC 2023 ANNUAL REPORT / 117
be recoverable from other parties or through insurance. The Company has accrued for all guarantees that it expects to pay. As at December 31, 2022, these2023, accruals amounted toof $8 million (2022 – $5 million (2021 – $14 million), and arewere recorded in “Accounts payable and accrued liabilities".
IndemnificationsIndemnification
Pursuant to a trust and custodial services agreement with the trustee of the Canadian Pacific Railway Company Pension Plan, the Company has undertaken to indemnify and save harmless the trustee, to the extent not paid by the fund, from any and all taxes, claims, liabilities, damages, costs, and expenses arising out of the performance of the trustee’s obligations under the agreement, except as a result of misconduct by the trustee. The indemnity includes liabilities, costs, or expenses relating to any legal reporting or notification obligations of the trustee with respect to the defined benefit and defined contribution options of the pension plans, or otherwise with respect to the assets of the pension plans that are not part of the fund. The indemnity survives the termination or expiry of the agreement with respect to claims and liabilities arising prior to the termination or expiry.
Pursuant to the voting trust agreement executed as part of the KCS acquisition, the Company has undertaken to protect, indemnify and save harmless the trustee from any loss, damages, liability, cost or expense in connection with the independent voting trust (except those resulting from the gross negligence or wilful misconduct of the trustee), and any cost or expense of any suit or litigation with respect to the trust stock or the voting trust agreement. The Company has also undertaken to pay all costs, damages and expenses of the trustee, where the trustee is made party to or is the subject of any investigation or proceeding by reason of and with respect to the trust stock or voting trust agreement.
As at December 31, 2022,2023, the Company had not recorded a liability associated with this indemnification as it does not expect to make any payments pertaining to it.
26.28. Segmented and geographic information
Operating segment
The Company operates in only has one operating segment: rail transportation. Operating results by geographic areas, railway corridors, or other lower-level components or units of operation are not reviewed by the Company’s chief operating decision-maker to make decisions about the allocation of resources to, or the assessment of performance of, such geographic areas, corridors, components, or units of operation.
In the years ended December 31, 2023, 2022, 2021, and 2020,2021, no one customer comprised more than 10% of total revenues and accounts receivable.revenues.
113 CP 2022 ANNUAL REPORT
Geographic information
All of the Company's revenues and long-termlong-lived assets disclosed in the table below are held within Canada, the U.S., and the United States.Mexico.
| | (in millions of Canadian dollars) | Canada | United States | Total |
| For the years ended and as at December 31 (in millions of Canadian dollars) | | For the years ended and as at December 31 (in millions of Canadian dollars) | Canada | U.S. | Mexico | Total |
| 2023 | |
| Revenues | |
| Revenues | |
| Revenues | |
| Long-lived assets: Properties and right of use assets | |
| 2022 | 2022 | |
| Revenues | Revenues | $ | 6,423 | | $ | 2,391 | | $ | 8,814 | |
| Long-term assets excluding investment in Kansas City Southern, financial instruments, and pension assets | 15,462 | | 7,942 | | 23,404 | |
| Revenues | |
| Revenues | |
Long-lived assets: Properties and right of use assets(1) | |
| 2021 | 2021 | |
| Revenues | Revenues | 5,992 | | 2,003 | | 7,995 | |
| Long-term assets excluding investment in Kansas City Southern, financial instruments, and pension assets | 14,922 | | 7,274 | | 22,196 | |
| 2020 | |
| Revenues | Revenues | 5,829 | | 1,881 | | 7,710 | |
| Long-term assets excluding financial instruments and pension assets | 14,258 | | 7,165 | | 21,423 | |
| Revenues | |
|
(1) 2022 comparative figure has been revised to conform with current year's presentation.
118 / CP 2022CPKC 2023 ANNUAL REPORT 114
ITEM 9. CHANGES IN AND DISAGREEMENTS WITH ACCOUNTANTS ON ACCOUNTING AND FINANCIAL DISCLOSURE
None.
ITEM 9A. CONTROLS AND PROCEDURES
Evaluation of Disclosure Controls and Procedures
As of December 31, 2022,2023, an evaluation was carried out under the supervision of and with the participation of the Company's management, including CEO and CFO, of the effectiveness of the design and operation of the Company's disclosure controls and procedures as defined in Rules 13a-15(e) and 15d-15(e) of the Exchange Act. Based on that evaluation, the CEO and CFO concluded that these disclosure controls and procedures were effective as of December 31, 2022,2023, to ensure that information required to be disclosed by the Company in reports that they file or submit under the Exchange Act is (i) recorded, processed, summarized and reported within the time periods specified by the SEC rules and forms and (ii) accumulated and communicated to the Company’s management, including the CEO and CFO, as appropriate, to allow timely decisions regarding required disclosure.
Management's Report on Internal Control over Financial Reporting
Management is responsible for the financial statements and for establishing and maintaining adequate internal control over financial reporting for the Company as defined in Rules 13a-15(f) and 15d-15(f) of the Exchange Act. The Corporation’s internal control system was designed to provide reasonable assurance to the Corporation’s management and Board of Directors regarding the preparation and fair presentation of published financial statements. Due to its inherent limitations, internal control over financial reporting may not prevent or detect misstatements. Also, projections of any evaluation of effectiveness to future periods are subject to the risk that controls may become inadequate because of changes in conditions, or that the degree of compliance with the policies or procedures may deteriorate.
Management has assessed the effectiveness of the Company’s internal control over financial reporting in accordance with the criteria set forth by the Committee of Sponsoring Organizations of the Treadway Commission in Internal Control – Integrated Framework (2013). Based on this assessment, management concluded that the Company maintained effective internal control over financial reporting as of December 31, 2022.2023. All internal control systems, no matter how well designed, have inherent limitations. Therefore, even those systems determined to be effective can provide only reasonable assurance with respect to the reliability of financial reporting and preparation of financial statements in accordance with generally accepted accounting principles.
As permitted by SEC guidance, management has excluded its subsidiary, KCS from this evaluation of the system of internal control over financial reporting. The Company assumed control of KCS on April 14, 2023. KCS had assets and revenues representing 41% and 28%, respectively, of the related consolidated financial statement amounts as of and for the year ended December 31, 2023. Additional information regarding this acquisition is included in Item 8. Financial Statements and Supplementary Data, Note 11 Business Acquisition. KCS will be included in management's evaluation of internal control over financial reporting for the fiscal year ended December 31, 2024.
The effectiveness of the Company's internal control over financial reporting as of December 31, 20222023 has been audited by EYErnst & Young LLP, the Company's independent registered public accounting firm who audited the Company's Consolidated Financial Statements included in this Form 10-K, as stated in their report, which is included herein.
Changes in Internal Control over Financial Reporting
During the three months ended December 31, 2022,2023, the Company has not identified any changes in internal control over financial reporting that have materially affected, or are reasonably likely to materially affect, our internal control over financial reporting.
115 CP 2022CPKC 2023 ANNUAL REPORT/ 119
Report of Independent Registered Public Accounting Firm
To the Shareholders and the Board of Directors of Canadian Pacific RailwayKansas City Limited
Opinion on Internal Control overOver Financial Reporting
We have audited Canadian Pacific RailwayKansas City Limited and subsidiaries’ internal control over financial reporting as of December 31, 2022,2023, based on criteria established in Internal Control—Integrated Framework (2013) issued by the Committee of Sponsoring Organizations of the Treadway Commission (the “COSO criteria”). In our opinion, Canadian Pacific RailwayKansas City Limited and subsidiaries (“the Company”) maintained, in all material respects, effective internal control over financial reporting as of December 31, 2022,2023, based on the COSO criteria.
As indicated in the accompanying Management’s Report on Internal Control over Financial Reporting, management’s assessment of and conclusion on the effectiveness of internal controls over financial reporting did not include the internal controls of Kansas City Southern, which is included in the 2023 consolidated financial statements of the Company and constituted 41% of total assets as of December 31, 2023 and 28% of revenues for the year then ended. Our audit of internal control over financial reporting of the Company also did not include an evaluation of the internal control over financial reporting of Kansas City Southern.
We also have audited, in accordance with the standards of the Public Company Accounting Oversight Board (United States) (“PCAOB”), the consolidated balance sheetsheets of the Company as of December 31, 2023 and 2022, the related consolidated statements of income, comprehensive income, shareholders’changes in equity and cash flows for each of the one yeartwo years in the period ended December 31, 2022,2023, and the related notes and our report dated February 24, 202327, 2024 expressed an unqualified opinion thereon.
Basis for Opinion
The Company’s management is responsible for maintaining effective internal control over financial reporting and for its assessment of the effectiveness of internal control over financial reporting included in the accompanying Management's Report on Internal Control over Financial Reporting. Our responsibility is to express an opinion on the Company’s internal control over financial reporting based on our audit. We are a public accounting firm registered with the PCAOB and are required to be independent with respect to the Company in accordance with the U.S. federal securities laws and the applicable rules and regulations of the Securities and Exchange Commission and the PCAOB.
We conducted our audit in accordance with the standards of the PCAOB. Those standards require that we plan and perform the audit to obtain reasonable assurance about whether effective internal control over financial reporting was maintained in all material respects.
Our audit included obtaining an understanding of internal control over financial reporting, assessing the risk that a material weakness exists, testing and evaluating the design and operating effectiveness of internal control based on the assessed risk, and performing such other procedures as we considered necessary in the circumstances. We believe that our audit provides a reasonable basis for our opinion.
Definition and Limitations of Internal Control overOver Financial Reporting
A company’s internal control over financial reporting is a process designed to provide reasonable assurance regarding the reliability of financial reporting and the preparation of financial statements for external purposes in accordance with generally accepted accounting principles. A company’s internal control over financial reporting includes those policies and procedures that (1) pertain to the maintenance of records that, in reasonable detail, accurately and fairly reflect the transactions and dispositions of the assets of the company; (2) provide reasonable assurance that transactions are recorded as necessary to permit preparation of financial statements in accordance with generally accepted accounting principles, and that receipts and expenditures of the company are being made only in accordance with authorizations of management and directors of the company; and (3) provide reasonable assurance regarding prevention or timely detection of unauthorized acquisition, use, or disposition of the company’s assets that could have a material effect on the financial statements.
Because of its inherent limitations, internal control over financial reporting may not prevent or detect misstatements. Also, projections of any evaluation of effectiveness to future periods are subject to the risk that controls may become inadequate because of changes in conditions, or that the degree of compliance with the policies or procedures may deteriorate.
/s/ Ernst & Young LLP
Chartered Professional Accountants
Calgary, Canada
February 24, 2023
120 / CP 2022CPKC 2023 ANNUAL REPORT 116
ITEM 9B. OTHER INFORMATION
None.
ITEM 9C. DISCLOSURE REGARDING FOREIGN JURISDICTIONS THAT PREVENT INSPECTIONS
Not applicable.
117 CP 2022CPKC 2023 ANNUAL REPORT/ 121
PART III
122 / CP 2022CPKC 2023 ANNUAL REPORT 118
ITEM 10. DIRECTORS, EXECUTIVE OFFICERS AND CORPORATE GOVERNANCE
Directors of Registrant
The information required by this Item will be contained in the Company’s Form 10-K/A, which will be filed no later than 120 days after December 31, 2022.2023. This information will also be contained in the management proxy circular that we prepare in accordance with applicable Canadian corporate and securities law requirements.
Executive Officers of Registrant
The information regarding executive officers is included in Part I of this annual report under Information about our Executive Officers, following Item 4. Mine Safety Disclosures.
Compliance with Section 16(a) of the Exchange Act
The information required by this Item will be contained in the Company’s Form 10-K/A, which will be filed no later than 120 days after December 31, 2022.2023.
Code of EthicsSecurities Authorized for Chief Executive OfficerIssuance Under Equity Compensation Plans
The information required by Item 201(d) will be contained in the Company’s Form 10-K/A, which will be filed no later than 120 days after December 31, 2023.
Audit and SeniorFinance Committee Financial OfficersExperts
The information required by this Item will be contained in the Company’s Form 10-K/A, which will be filed no later than 120 days after December 31, 2022.2023, and is incorporated herein by reference. This information will also be contained in the management proxy circular that we prepare in accordance with applicable Canadian corporate and securities law requirements.
Code of Ethics for Chief Executive Officer and Senior Financial Officers
The information required by this Item will be contained in the Company’s Form 10-K/A,which will be filed no later than 120 days after December 31, 2023.
ITEM 11. EXECUTIVE COMPENSATION
The information required by this Item will be contained in the Company’s Form 10-K/A, which will be filed no later than 120 days after December 31, 2022.2023. This information will also be contained in the management proxy circular that we prepare in accordance with applicable Canadian corporate and securities law requirements.
ITEM 12. SECURITY OWNERSHIP OF CERTAIN BENEFICIAL OWNERS AND MANAGEMENT AND RELATED STOCKHOLDER MATTERS
The information required by this Item will be contained in the Company’s Form 10-K/A, which will be filed no later than 120 days after December 31, 2022.
ITEM 13. CERTAIN RELATIONSHIPS AND RELATED TRANSACTIONS, AND DIRECTOR INDEPENDENCE
The information required by this Item will be contained in the Company’s Form 10-K/A, which will be filed no later than 120 days after December 31, 2022.2023. This information will also be contained in the management proxy circular that we prepare in accordance with applicable Canadian corporate and securities law requirements.
ITEM 14. PRINCIPAL ACCOUNTING FEES AND SERVICES
The information required by this Item will be contained in the Company’s Form 10-K/A, which will be filed no later than 120 days after December 31, 2022.2023. This information will also be contained in the management proxy circular that we prepare in accordance with applicable Canadian corporate and securities law requirements.
119 CP 2022CPKC 2023 ANNUAL REPORT/ 123
PART IV
124 / CP 2022CPKC 2023 ANNUAL REPORT 120
ITEM 15. EXHIBITS, FINANCIAL STATEMENT SCHEDULE
The following documents are filed as part of this annual report:
(a)Financial Statements
The financial statements filed as part of this filing are listed on the Index to Consolidated Financial Statements in Item 8. Financial Statements and Supplementary Data.
(b)Financial Statement Schedule
Schedule II – Valuation and Qualifying Accounts
| | (in millions of Canadian dollars) | (in millions of Canadian dollars) | Beginning balance at January 1 | Additions charged to expenses | Payments and other reductions | Impact of FX | Ending
balance at December 31 | (in millions of Canadian dollars) | Beginning balance at January 1 | Impact of KCS Acquisition | Additions charged to expenses | Payments and other reductions | Impact of FX | Ending
balance at December 31 |
Accruals for personal injury and other claims provision(1) | Accruals for personal injury and other claims provision(1) | Accruals for personal injury and other claims provision(1) |
| 2020 | $ | 141 | | $ | 105 | | $ | (119) | | $ | (1) | | $ | 126 | |
| 2021 | 2021 | $ | 126 | | $ | 114 | | $ | (117) | | $ | — | | $ | 123 | |
| 2022 | 2022 | $ | 123 | | $ | 101 | | $ | (94) | | $ | 2 | | $ | 132 | |
Environmental liabilities | | 2020 | $ | 77 | | $ | 10 | | $ | (6) | | $ | (1) | | $ | 80 | |
| 2023 | |
| Provision for environmental remediation | | Provision for environmental remediation |
| 2021 | 2021 | $ | 80 | | $ | 10 | | $ | (10) | | $ | (1) | | $ | 79 | |
| 2022 | 2022 | $ | 79 | | $ | 8 | | $ | (8) | | $ | 4 | | $ | 83 | |
| 2023 | |
(1) Includes WCB, FELA, occupational, damage, and other.
(c)Exhibits
Exhibits are listed in the exhibit index below. The exhibits include management contracts, compensatory plans and arrangements required to be filed as exhibits to the Form 10-K by Item 601(10)(iii) of Regulation S-K.
| | | | | |
| Exhibit | Description |
| 2 | Plan of Acquisition, Reorganization, Arrangement, Liquidation, or Succession: |
| |
| |
| 3 | Articles of Incorporation and Bylaws: |
| |
| |
| |
121 CP 2022CPKC 2023 ANNUAL REPORT/ 125
| | | | | |
| | | | | |
| |
| |
| 4 | Instruments Defining the Rights of Security Holders, Including Indentures: |
| |
| |
| |
| |
| |
| |
| |
| |
| |
| |
| |
| |
| |
| |
126 / CPKC 2023 ANNUAL REPORT
CP 2022 ANNUAL REPORT 122
| | | | | |
| |
| |
| |
| |
| |
| Fourth Supplemental Indenture, dated as of March 5, 2020, by and among Canadian Pacific Railway Company, as issuer, Canadian Pacific Railway Limited, as guarantor, and Wells Fargo Bank, National Association, as trustee (incorporated by reference to Exhibit 4.2 to Canadian Pacific Railway Limited's Current Report on Form 8-K filed with the Securities and Exchange Commission on March 6, 2020, File No. 001-01342). |
| Second Supplemental Indenture, dated as of March 9, 2020, by and among Canadian Pacific Railway Company, as issuer, Canadian Pacific Railway Limited, as guarantor, and Computershare Trust Company of Canada, as trustee (incorporated by reference to Exhibit 4.3 to Canadian Pacific Railway Limited’s Quarterly Report on Form 10-Q filed with the Securities and Exchange Commission on April 21, 2020, File No. 001-01342). |
| Fifth Supplemental Indenture, dated as of December 2, 2021, by and among Canadian Pacific Railway Company, as issuer, Canadian Pacific Railway Limited, as guarantor, and Computershare Trust Company N.A., as successor to Wells Fargo Bank, National Association, as trustee (incorporated by reference to Exhibit 4.1 to Canadian Pacific Railway Limited's Current Report on Form 8-K filed with the Securities and Exchange Commission on December 6, 2021, File No. 001-01342. |
| Sixth Supplemental Indenture, dated as of April 19, 2023, by and among Canadian Pacific Railway Company, Canadian Pacific Kansas City Limited, as guarantor, and Computershare Trust Company, N.A., as successor to Wells Fargo Bank, National Association, as trustee (incorporated by reference to Exhibit 4.1 to Canadian Pacific Kansas City Limited’s Current Report on Form 8-K filed with the Securities and Exchange Commission on April 19, 2023, File No. 001-01342) |
| 9 | Voting Trust Agreement: |
| |
| 10 | Material Contracts: |
| |
| Fourth Amending Agreement, dated as of June 23, 2017, amending the Credit Agreement, dated September 26, 2014, between Canadian Pacific Railway Company, as Borrower, Canadian Pacific Railway Limited, as Covenantor, Royal Bank of Canada, as Administrative Agent, and the various Lenders party thereto (incorporated by reference to Exhibit 10.1 to Canadian Pacific Railway Limited's Current Report on Form 8-K filed with the Securities and Exchange Commission on June 27, 2017, File No. 001-01342). |
| |
| |
| |
| |
CPKC 2023 ANNUAL REPORT / 127
123 CP 2022 ANNUAL REPORT
CP 2022 ANNUAL REPORT 124
| | | | | |
| |
| |
| |
| |
| |
| |
| |
| |
| |
| |
| |
| |
| |
| |
| |
| |
| |
| Credit Agreement dated as of September 26, 2014 among Canadian Pacific Railway Company and CPR Securities Limited, as borrowers, Canadian Pacific Railway Limited, as covenantor, the Financial Institutions that are signatories to the Credit Agreement, as Lenders, the Royal Bank of Canada, as Administrative Agent, RBC Capital Markets, J.P. Morgan Securities LLC, TD Securities, Morgan Stanley MUFG Loan Partners, LLC and Citibank, N.A., Canadian Branch, as Co-Lead Arrangers, RBC Capital Markets and J.P. Morgan Securities LLC, as Joint Bookrunners, J.P. Morgan Chase Bank, N.A., as Syndication Agent, The Toronto-Dominion Bank, Morgan Stanley MUFG Loan Partners, LLC and Citibank, N.A., Canadian Branch, as Co-Documentation Agents (incorporated by reference to Exhibit 10.45 to Canadian Pacific Railway Limited’s Annual Report on Form 10-K filed with the Securities and Exchange Commission on February 29, 2016, File No. 001-01342). |
125 CP 2022 ANNUAL REPORT
| | | | | |
| First Amending Agreement dated as of June 15, 2015, to the Credit Agreement dated September 26, 2014, among Canadian Pacific Railway Company and CPR Securities Limited, as borrowers, Canadian Pacific Railway Limited, as covenantor, the signatories to this First Amending Agreement to the Credit Agreement, as Lenders, the Royal Bank of Canada, as Administrative Agent (incorporated by reference to Exhibit 10.46 to Canadian Pacific Railway Limited’s Annual Report on Form 10-K filed with the Securities and Exchange Commission on February 29, 2016, File No. 001-01342). |
| Second Amending Agreement dated as of September 17, 2015, to the Credit Agreement dated September 26, 2014, among Canadian Pacific Railway Company and CPR Securities Limited, as borrowers, Canadian Pacific Railway Limited, as covenantor, the signatories to the Second Amending Agreement to this Credit Agreement, as Lenders, the Royal Bank of Canada, as Administrative Agent (incorporated by reference to Exhibit 10.47 to Canadian Pacific Railway Limited’s Annual Report on Form 10-K filed with the Securities and Exchange Commission on February 29, 2016, File No. 001-01342). |
| Fifth Amending Agreement, dated as of June 8, 2018, amending the Credit Agreement, dated September 26, 2014, between Canadian Pacific Railway Company, as Borrower, Canadian Pacific Railway Limited, as Covenantor, Royal Bank of Canada, as Administrative Agent, and the various Lenders party thereto (incorporated by reference to Exhibit 10.1 to Canadian Pacific Railway Limited's Current Report on Form 8-K filed with the Securities and Exchange Commission on June 11, 2018, File No. 001-01342). |
| |
| Amended and Restated Credit Agreement, dated as of September 27, 2019, between Canadian Pacific Railway Company, as Borrower, Canadian Pacific Railway Limited, as Covenantor, Royal Bank of Canada, as Administrative Agent, and the various Lenders party thereto (incorporated by reference to Exhibit 10.1 to Canadian Pacific Railway Limited's Current Report on Form 8-K filed with the Securities and Exchange Commission on October 1, 2019, File No. 001-01342). |
| |
| |
| |
| |
| |
128 / CPKC 2023 ANNUAL REPORT
| | | | | |
| |
| |
| |
| First Amending Agreement, dated as of April 9, 2021 among Canadian Pacific Railway Company, as Borrower, Canadian Pacific Railway Limited, as Covenantor, Royal Bank of Canada, a Canadian chartered bank, as administrative agent of the Lenders, and the Consenting Lenders (incorporated by reference to Exhibit 10.2 to Canadian Pacific Railway Limited’s Quarterly Report on Form 10-Q filed with the Securities and Exchange Commission April 21, 2021, File No. 001-01342). |
| Second Amending Agreement dated as of September 24, 2021, amending the Credit Agreement, dated September 27, 2019, among Canadian Pacific Railway Company, as Borrower, Canadian Pacific Railway Limited, as Covenantor, Royal Bank of Canada, as Administrative Agent, and the various Lenders party thereto (incorporated by reference to Exhibit 10.3 to Canadian Pacific Railway Limited's Registration Statement on Form F-4 filed with the Securities and Exchange Commission on October 1, 2021, File No. 333-259991). |
CP 2022 ANNUAL REPORT 126
| | | | | |
| Third Amending Agreement dated as of September 29, 2021, amending the Credit Agreement, dated September 27, 2019, among Canadian Pacific Railway Company, as Borrower, Canadian Pacific Railway Limited, as Covenantor, Royal Bank of Canada, as Administrative Agent, and the various Lenders party thereto (incorporated by reference to Exhibit 10.4 to Canadian Pacific Railway Limited's Registration Statement on Form F-4 filed with the Securities and Exchange Commission on October 1, 2021, File No. 333-259991). |
| Credit Agreement, dated as of September 15, 2021, among Canadian Pacific Railway Company, as Borrower, Canadian Pacific Railway Limited, as Covenantor, Bank of Montreal, as Administrative Agent, and the various Lenders party thereto (incorporated by reference to Exhibit 10.5 to Canadian Pacific Railway Limited's Registration Statement on Form F-4 filed with the Securities and Exchange Commission on October 1, 2021, File No. 333-259991). |
| |
| |
| |
| |
| |
| |
| |
| |
| |
| |
| |
| |
| |
| |
| |
127 CP 2022 ANNUAL REPORT
| | | | | |
| First Amending Agreement, dated as of March 14, 2022, among Canadian Pacific Railway Company, as Borrower, Canadian Pacific Railway Limited, as Covenantor, Bank of Montreal, as Administrative Agent, and the various Lenders party thereto (incorporated by reference to Exhibit 10.7 to Canadian Pacific Railway Limited’s Quarterly Report on Form 10-Q filed with the Securities and Exchange Commission April 28, 2022, File No. 001-01342). |
| |
CPKC 2023 ANNUAL REPORT / 129
| | | | | |
| Amendment Number 18, effective January 1,Second Amended and Restated Credit Agreement, dated as of May 11, 2023, among Canadian Pacific Railway Company, as Borrower, Canadian Pacific Kansas City Limited, as Covenantor, Bank of Montreal, as Administrative Agent, and various Lenders party thereto (incorporated by reference to Exhibit 10.1 to Canadian Pacific Kansas City Limited’s Current Report on Form 8-K filed with the Securities and Exchange Commission on May 17, 2023, File No. 001-01342). |
| |
| |
| |
| |
| |
| |
| |
| |
| |
| |
| |
| |
| |
| |
| |
| |
| |
| |
| |
| |
| |
| 101.INS** | Inline XBRL Instance Document |
| 101.SCH** | Inline XBRL Taxonomy Extension Schema Document |
| 101.CAL** | Inline XBRL Taxonomy Extension Calculation Linkbase Document |
| 101.LAB** | Inline XBRL Taxonomy Extension Label Linkbase Document |
| 101.DEF** | Inline XBRL Taxonomy Extension Definition Linkbase Document |
| 101.PRE** | Inline XBRL Taxonomy Extension Presentation Linkbase Document |
130 / CPKC 2023 ANNUAL REPORT
| | | | | |
| The following financial information from Canadian Pacific RailwayKansas City Limited’sAnnual Report on Form 10-K for the year ended December 31, 2022,2023, formatted in Extensible Business Reporting Language (XBRL) includes: (i) the Consolidated Statements of Income for each of the three years ended December 31, 2023, 2022, 2021, and 2020;2021; (ii) the Consolidated Statements of Comprehensive Income for each of the three years ended December 31, 2023, 2022, 2021, and 2020;2021; (iii) the Consolidated Balance Sheets at December 31, 20222023 and 2021;2022; (iv) the Consolidated Statements of Cash Flows for each of the three years ended December 31, 2023, 2022, 2021, and 2020;2021; (v) the Consolidated Statements of Changes in Shareholders’ Equity for each of the three years ended December 31, 2023, 2022, 2021, and 2020;2021; and (vi) the Notes to Consolidated Financial Statements. |
| 104 ** | Cover Page Interactive Data File (formatted as Inline XBRL and contained in Exhibit 101) |
* Management contract or compensatory arrangement
** Filed with this Annual Report on Form 10-K
*** Certain portions of this exhibit have been redacted pursuant to Item 601(b)(10)(iv) of Regulation S-K. An unredacted copy of this exhibit will be furnished separately to the SEC upon request.
CP 2022CPKC 2023 ANNUAL REPORT 128/ 131
ITEM 16. FORM 10-K SUMMARY
Not applicable.
129132 / CP 2022CPKC 2023 ANNUAL REPORT
SIGNATURES
Pursuant to the requirements of Section 13 or 15(d) of the Securities Exchange Act of 1934, the Company has duly caused this report to be signed on its behalf by the undersigned, thereunto duly authorized.
| | | | | |
CANADIAN PACIFIC RAILWAYKANSAS CITY LIMITED |
| (Registrant) |
| By: | /s/ KEITH CREEL |
| Keith Creel |
| Chief Executive Officer |
Dated: February 24, 202327, 2024
POWER OF ATTORNEY
Each of the undersigned do hereby appoint each of Nadeem Velani and Jeffrey J. Ellis, his or her true and lawful attorney-in-fact and agent, to sign on his or her behalf the Company’s Annual Report on Form 10-K, for the year ended December 31, 2022,2023, and any and all amendments thereto, and to file the same, with all exhibits thereto, with the Securities and Exchange Commission.
Pursuant to the requirements of the Securities Exchange Act of 1934, this report has been signed below by the following persons on behalf of the Company and in the capacities indicated on February 24, 2023.27, 2024.
| | | | | |
| Signature | Title |
| /s/ KEITH CREEL | Chief Executive Officer and Director |
| Keith Creel | (Principal Executive Officer) |
| |
| /s/ NADEEM VELANI | Executive Vice-President and Chief Financial Officer |
| Nadeem Velani | (Principal Financial Officer and Principal Accounting Officer) |
| |
| /s/ ISABELLE COURVILLE | Chair of the Board of Directors |
| Isabelle Courville | |
| |
| /s/ JOHN R. BAIRD | Director |
| John R. Baird | |
| |
| /s/ GILLIAN H. DENHAM | Director |
| Gillian H. Denham | |
| |
| /s/ AMB. ANTONIO GARZA (RET.) | Director |
| Amb. Antonio Garza (Ret.) | |
| |
| /s/ DAVID GARZA-SANTOS | Director |
| David Garza-Santos | |
| |
| /s/ EDWARD R. HAMBERGER | Director |
| Edward R. Hamberger | |
| |
| /s/ JANET H. KENNEDY | Director |
| Janet H. Kennedy | |
| |
| /s/ HENRY MAIER | Director |
| Henry Maier | |
| |
| /s/ MATTHEW H. PAULL | Director |
| Matthew H. Paull | |
| |
| /s/ JANE L. PEVERETT | Director |
| Jane L. Peverett | |
| |
| /s/ ANDREA ROBERTSON | Director |
| Andrea Robertson | |
| |
| /s/ GORDON T. TRAFTON | Director |
| Gordon T. Trafton | |