Washington, D.C. 20549
ANNUAL REPORT PURSUANT TO SECTIONS 13 OR 15(d) OF THE SECURITIES EXCHANGE ACT OF 1934
[ ] TRANSITION REPORT PURSUANT TO SECTION 13 OR 15(d) OF THE SECURITIES EXCHANGE ACT OF 1934
Indicate by check mark if the registrant is a well-known seasoned issuer, as defined in Rule 405 of the Securities Act. YESYes ☐ NONo ☒
Indicate by check mark if the registrant is not required to file reports pursuant to Section 13 or Section 15(d) of the Act. YESYes ☐ NONo ☒
Indicate by check mark whether the registrant (1) has filed all reports required to be filed by Section 13 or 15(d) of the Securities Exchange Act of 1934 during the preceding 12 months (or for such shorter period that the registrant was required to file such reports), and (2) has been subject to such filing requirements for the past 90 days. YESYes ☒ NONo ☐
Indicate by check mark whether the registrant has submitted electronically every Interactive Data File required to be submitted pursuant to Rule 405 of Regulation S-T (§232.405 of this chapter) during the preceding 12 months (or for such shorter period that the registrant was required to submit such files). YES ☐ NOYes ☒ No ☐
Indicate by check mark whether the registrant is a large accelerated filer, an accelerated filer, a non-accelerated filer, smaller reporting company, or an emerging growth company. See the definitions of “large accelerated filer,” “accelerated filer,” “smaller reporting company,” and “emerging growth company” in Rule 12b-2 of the Exchange Act.
If an emerging growth company, indicate by check mark if the registrant has elected not to use the extended transition period for complying with any new or revised financial accounting standards provided pursuant to Section 13(a) of the Exchange Act. ☐
Indicate by check mark whether the registrant is a shell company (as defined in Rule 12b-2 of the Act).
The aggregate market value of the voting stock held by non-affiliates of the registrant as of September 30, 20192022 was $365,217,231$457,460,183 based on the last sale price of such stock as quoted by The Nasdaq Global Select Market on such date.
The number of shares of common stock, $0.25 par value per share, outstanding as of May 29, 202019, 2023 was 17,998,098.36,722,665.
CAUTIONARY STATEMENT CONCERNING FORWARD-LOOKING STATEMENTS
This Annual Report on Form 10-K contains forward-looking statements regarding the plans and objectives of management for future operations.operations and future performance (including the internal rate of return to the Company). Any such forward-looking statements may involve known and unknown risks, uncertainties and other factors which may cause our actual results, performance or achievements to be materially different from future results, performance or achievements expressed or implied by any forward-looking statements. Forward-looking statements, which involve assumptions and describe our future plans, strategies and expectations are generally identifiable by use of the words “may,” “predict,” “will,” “continue,” “likely,” “would,” “could,” “should,” “expect,” “anticipate,” “potential,” “estimate,” “indicate,” “seek,” “believe,” “target,” “intend,” “plan,” or “project” or the negative of these words or other variations on these words or comparable terminology. These forward-looking statements involve risks and uncertainties and are based on assumptions that may be incorrect, and we cannot assure you that the projections included in these forward-looking statements will come to pass. Accordingly, there are or will be important factors that could cause our actual results to differ materially from those expressed or implied by the forward-looking statements. We believe these factors include, but are not limited to, the following:
•our future operating results;
•market conditions and our ability to access debt and equity capital and our ability to manage our capital resources effectively;
•the timing of cash flows, if any, from the operations of our portfolio companies;
•our business prospects and the prospects of our existing and prospective portfolio companies;
•the financial condition and ability of our existing and prospective portfolio companies to achieve their objectives;
•the adequacy of our cash resources and working capital;
•our ability to recover unrealized losses;
•our expected financings and investments;
•our contractual arrangements and other relationships with third parties;
•the impact of fluctuations in interest ratesrate volatility, including the decommissioning of LIBOR, and inflation on our business;business and our portfolio companies;
•the impact of a protracted decline in the liquidity of credit markets on our business;
•our ability to operate as a BDCbusiness development company and to qualify and maintain our qualification as a RIC,regulated investment company, including the impact of changes in laws or regulations, including the tax reform, governing our operations or the operations of our portfolio companies;
•our ability to operate our wholly owned subsidiary, Capital Southwest SBIC I, LP, as a small business investment company;
•the dependence of our future success on the general economy and its impact on the industries in which we invest;
•the impact of supply chain disruptions and labor shortages on our portfolio companies;
•changes in laws and regulations, changes in political, economic or industry conditions, and changes in the interest rate environment or other conditions affecting the financial and capital markets, including changes resulting from or in response to, or potentially even the absence of changes as a result of, the impact of the COVID-19 pandemic;
•our ability to successfully invest any capital raised in an offering;
•the return or impact of current and future investments;
•the performance and the valuation of our investments in portfolio companies, particularly those having no liquid trading market;
•our regulatory structure and tax treatment; and
•the timing, form and amount of any dividend distributions; anddistributions.
•uncertainties associated with the impact from the COVID-19 pandemic, including: its impact on the global and U.S. capital markets and the global and U.S. economy; the length and duration of the COVID-19 outbreak in the United States as well as worldwide and the magnitude of the economic impact of that outbreak; the effect of the COVID-19 pandemic on our business prospects and the operational and financial performance of our portfolio companies, including our and their ability to achieve their respective objectives; and the effect of the disruptions caused by the COVID-19 pandemic on our ability to continue to effectively manage our business.
For a discussion of these and other factors that could cause our actual results to differ materially from forward-looking statements contained in this Annual Report, please see the discussion under “Risk Factors” in Item 1A.
We have based the forward-looking statements included in this Annual Report on Form 10-K on information available to us on the date of this Annual Report on Form 10-K. You should not place undue reliance on these forward-looking statements and you should carefully consider all of the factors identified in this report that could cause actual results to differ. We assume no obligation to update any such forward-looking statements, unless we are required to do so by applicable law.
PART I
Item 1. Business
ORGANIZATION
Capital Southwest Corporation which (“we, refer to as “we,” “our,” “us,” “CSWC,” or the “Company”), a Texas corporation, is an internally managed closed-end, non-diversified investment company that has elected to be regulated as a business development company, or BDC, under the Investment Company Act of 1940, as amended, or the 1940 Act. Because CSWC is internally managed, all of the executive officers and other employees are employed by CSWC. Therefore, CSWC does not pay any external investment advisory fees, but instead directly incurs the operating costs associated with employing investment and portfolio management professionals.
Since September 30, 2015, we have pursued a credit-focused investing strategy. We specialize in providing customized financing to middle market companies in a broad range of industry segments located primarily in the United States. We invest primarily in debt securities, including senior debt and second lien, and also invest in preferred stock and common stock alongside our debt investments or through warrants. Our common stock currently trades on The Nasdaq Global Select Market under the ticker symbol “CSWC.”
We were organized as a Texas corporation on April 19, 1961. Until September 1969, we operated as a small business investment company, or SBIC, licensed under the Small Business Investment Act of 1958. At that time, we transferred to our wholly-owned subsidiary, Capital Southwest Venture Corporation, or CSVC, certain assets including our SBIC license. CSVC was a closed-end, non-diversified investment company registered under the 1940 Act. Effective June 14, 2016, CSVC was dissolved and its SBIC license was surrendered. All assets held in CSVC were transferred to us upon dissolution. Prior to March 30, 1988, we were registered as a closed-end, non-diversified investment company under the 1940 Act. On that date, we elected to be treated as a BDC under the 1940 Act. As a BDC, we are required to comply with certain regulatory requirements. For instance, we generally have to invest at least 70% of our assets in “qualifying assets,” including securities of private or thinly traded public U.S. companies, cash, cash equivalents, U.S. government securities and high quality debt investments that mature in one year or less. In addition, effective April 25, 2019, we are allowed to borrow money such that our asset coverage, as defined in the 1940 Act, equals at least 150% after such borrowing. Additionally, the Board of Directors approved a resolution whichthat limits the Company's issuance of senior securities such that the asset coverage ratio, taking into account any such issuance, would not be less than 166%, at any time after the effective date.
We have elected, and intend to qualify annually, to be treated for U.S. federal income tax purposes as a regulated investment company, or RIC, under Subchapter M of the U.S. Internal Revenue Code of 1986, as amended, or the Code. As such, we generally will not havebe subject to pay corporate-level U.S. federal income tax at corporate rates on any ordinary income or capital gains that we timely distribute to our shareholders as dividends. To continue to maintain our RIC tax treatment, we must meet specified source-of-income and asset diversification requirements and distribute annually at least 90% of our ordinary income and realized net short-term capital gains in excess of realized net long-term capital losses, if any. Depending on the level of taxableWe will be subject to U.S. federal income earned in a tax, year, we may choose to carry forward taxable income in excess of current year distributions into the next year and paypossibly a 4% U.S. federal excise tax, on such income. Any such carryover taxableany income mustthat we do not timely distribute to our shareholders. Our U.S. federal income tax liability may be distributed through a dividend declared prior to filing the final tax return relatedreduced to the extent that we make certain distributions during the following calendar year that generated such taxable income.and satisfy other procedural requirements.
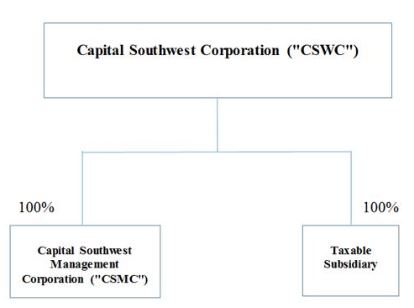
Capital Southwest Management Corporation, or CSMC, our wholly-owned subsidiary, is our management company. CSMC generally incurs all normal operating and administrative expenses, including, but not limited to, salaries and related benefits, rent, equipment and other administrative costs required for day-to-day operations.
We also haveCSWC has a direct wholly-ownedwholly owned subsidiary that has elected to be treated as an association taxable as a taxable entitycorporation for U.S. federal income tax purposes (the “Taxable Subsidiary”). The primary purpose of the Taxable Subsidiary is to permit us to hold certain interests in portfolio companies that are organized as limited liability companies, or LLCs (or other forms of pass-through entities) and still allow us to satisfy the RIC tax requirement that at least 90% of our gross income for U.S. federal income tax purposes must consist of qualifying investment income. The Taxable Subsidiary is taxedsubject to U.S. federal income tax at normal corporate tax rates based on its taxable income.
On September 30, 2015, we completedApril 20, 2021, our wholly owned subsidiary, Capital Southwest SBIC I, LP (“SBIC I”) received a license from the spin-off, which we referU.S. Small Business Administration (the “SBA”) to as the Share Distribution, of CSW Industrials, Inc., or CSWI. CSWI is now an independent publicly traded company. The Share Distribution was effected through a tax-free, pro-rata distribution of 100% of CSWI’s common stock to our shareholders. Each of our shareholders received one share of CSWI common stock for every one share of our common stock on the record date, September 18, 2015. Cash was paid in lieu of any fractional shares of CSWI common stock.
Following the Share Distribution, we have maintained operationsoperate as an internally managed BDCSBIC under Section 301(c) of the Small Business Investment Act of 1958, as amended. SBIC I has an investment strategy substantially similar to ours and pursuedmakes similar types of investments in accordance with SBA regulations. SBIC I and its general partner are consolidated for U.S. GAAP reporting purposes, and the portfolio investments held by it are included in the consolidated financial statements. See “Regulation as a credit-focused investing strategy akinSmall Business Investment Company” below for more information about the regulations applicable to similarly structured organizations. We intend to continue to provide capital to middle-market companies. We invest primarily in debt securities, including senior debt, second lien and subordinated debt, and also invest in preferred stock and common stock alongside our debt investments or through warrants.SBIC I.
The following diagram depicts our organizational structure:
Employees
As of March 31, 2020, we had twenty-two employees, each of whom was employed by our management company, CSMC. These employees include our corporate officers, investment and portfolio management professionals and administrative staff. All of our employees are located in our principal executive offices in Dallas, Texas.
Corporate Information
Our principal executive offices are located at 5400 Lyndon B. Johnson Freeway,8333 Douglas Avenue, Suite 1300,1100, Dallas, Texas 75240.75225. We maintain a website at www.capitalsouthwest.com. You can review the filings we have made with the Securities and Exchange Commission, or the SEC, free of charge on EDGAR, the Electronic Data Gathering, Analysis, and Retrieval System of the SEC, accessible at http://www.sec.gov. We also make available free of charge on our website our Annual Reports on Form 10-K, Quarterly Reports on Form 10-Q, Current Reports on Form 8-K, any amendments to those reports and any other reports filed or furnished pursuant to Section 13(a) or 15(d) of the Securities Exchange Act of 1934, or the Exchange Act, as soon as reasonably practicable after filing these reports with the SEC. Information on our website is not incorporated by reference into
this Annual Report on Form 10-K and you should not consider that information to be part of this Annual Report on Form 10-K. The charters adopted by the committees of our Board of Directors are also available on our website.
OVERVIEW OF OUR BUSINESS
We are an internally managed closed-end, non-diversified investment company that has elected to be regulated as a BDC under the 1940 Act. We specialize in providing customized debt and equity financing to lower middle market, or LMM, companies and debt capital to upper middle market, or UMM, companies in a broad range of investment segments located primarily in the United States. Our investment objective is to produce attractive risk-adjusted returns by generating current income from our debt investments and capital appreciation from our equity and equity related investments. Our investment strategy is to partner with business owners, management teams and financial sponsors to provide flexible financing solutions to fund growth, changes of control, or other corporate events. We invest primarily in senior debt securities, secured by security interests in portfolio company assets. We also invest in equity interests in our portfolio companies alongside our debt securities.
We focus on investing in companies with histories of generating revenues and positive cash flow, established market positions and proven management teams with strong operating discipline. We primarilyOur core business is to target senior debt investments and equity investments in LMM companies, as well ascompanies. We also opportunistically target first and second lien syndicated loans in UMM companies. Our target LMM companies typicallygenerally have annual earnings before interest, taxes, depreciation and amortization, or EBITDA, between $3.0 million and $15.0$20.0 million, and our LMM investments generally range in size from $5.0 million to $25.0$35.0 million. Our UMM investments generally include syndicated first and second lien loans in companies with EBITDA generally greater than $50.0$20.0 million, and our UMM investments typically range in size from $5.0 million to $15.0$20.0 million.
We seek to fill the financing gap for LMM companies, which historically have had more limited access to financing from commercial banks and other traditional sources. The underserved nature of the LMM creates the opportunity for us to meet the financing needs of LMM companies while also negotiating favorable transaction terms and equity participation. Our ability to invest across a LMM company’s capital structure, from secured loans to equity securities, allows us to offer portfolio companies a comprehensive suite of financing options. Providing customized financing solutions is important to LMM companies. We generally seek to partner directly with financial sponsors, entrepreneurs, management teams and business owners in making our investments. Our LMM debt investments typically include senior loans with a first lien on the assets of the portfolio company. Our LMM debt investments typically have a term of between five and seven years from the original investment date. We also often seek to invest in the equity securities of our LMM portfolio companies.
Our investments in UMM companies primarily consist of direct investments in or secondary purchases of interest bearing debt securities in privately held companies that are generally larger in size than the LMM companies included in our portfolio. Our UMM debt investments are generally secured by either a first or second priority lien on the assets of the portfolio company and typically have an expected duration of between three and seven years from the original investment date.
We offer managerial assistance to our portfolio companies and provide them access to our investment experience, direct industry expertise and contacts. Our obligation to offer to make available significant managerial assistance to our portfolio companies is consistent with our belief that providing managerial assistance to a portfolio company is important to its business development activities.
Because we are internally managed, we do not pay any external investment advisory fees, but instead directly incur the operating costs associated with employing investment and portfolio management professionals. We believe that our internally managed structure provides us with a beneficial operating expense structure when compared to other publicly traded and privately held investment firms that are externally managed, and our internally managed structure allows us the opportunity to leverage our non-interest operating expenses as we grow our investment portfolio.
Recent Developments
On March 31, 2023, Moody's Investors Service, Inc. assigned CSWC an investment grade long-term issuer rating of Baa3 with a stable outlook.
On April 22, 2020,26, 2023, the Board of Directors declared a total dividend of $0.51$0.59 per share, comprised of a regular dividend of $0.41$0.54 and a supplemental dividend of $0.10,$0.05, for the quarter ended June 30, 2020.2023. The record date for the dividend is June 15, 2020.2023. The payment date for the dividend is June 30, 2020.2023.
On May 28, 2020,April 26, 2023, pursuant to Rule 2a-5 under the 1940 Act, the Board of Directors declareddesignated a total dividendcommittee of $0.51 per share, comprisedcertain officers of a regular dividendthe Company as the Board's valuation designee (the “Valuation Designee”) to determine the fair value of $0.41 and a supplemental dividendthe
Company's investments that do not have readily available market quotations, subject to the oversight of the Board of Directors, effective beginning as of the fiscal quarter ended Septemberending June 30, 2020. The record date for the dividend is September 15, 2020. The payment date for the dividend is September 30, 2020.2023.
Our BusinessInvestment Strategy
Our business strategy isWe intend to achieve our investment objective of producing attractive risk-adjusted returns by generating current income from our debt investments and realizing capital appreciation from our equity and equity-related investments. We have adopted the following businessinvestment strategies to achieve our investment objective:
•Leveraging the Experience of Our Management Team. Our senior management team has extensive experience investing in and lending to middle market companies across changing market cycles. The members of our management team have diverse investment backgrounds, with prior experience at BDCs in the capacity of senior officers. We believe this extensive experience provides us with an in-depth understanding of the strategic, financial and operational challenges and opportunities of the middle market companies in which we invest. We believe this understanding allows us to select and structure better investments and to efficiently monitor and provide managerial assistance to our portfolio companies.
•Applying Rigorous Underwriting Policies and Active Portfolio Management. Our senior management team has implemented rigorous underwriting policies that are followed in each transaction. These policies include a thorough analysis of each potential portfolio company’s competitive position, financial performance, management team operating discipline, growth potential and industry attractiveness, which we believe allows us to better assess the company’s prospects. After investing in a company, we monitor the investment closely, typically receiving monthly, quarterly and annual financial statements. Senior management, together with the deal team and accounting and finance departments, generally meets at least monthlyquarterly to analyze and discuss in detail the company’s financial performance and industry trends. We believe that our initial and ongoing portfolio review process allows us to effectively monitor effectively the performance and prospects of our portfolio companies.
•Investing Across Multiple Companies, Industries, Regions and End Markets. We seek to maintain a portfolio of investments that is appropriately diverse among various companies, industries, geographic regions and end markets. This portfolio balance is intended to mitigate the potential effects of negative economic events for particular companies, regions, industries and end markets. However, we may from time to time hold securities of an individual portfolio company that comprise more than 5% of our total assets and/or more than 10% of the outstanding voting securities of the portfolio company. For that reason, we are classified as a non-diversified investment company that has elected to be regulated as a BDC under the 1940 Act.
•Utilizing Long-Standing Relationships to Source Deals. Our senior management team and investment professionals maintain extensive relationships with entrepreneurs, financial sponsors, attorneys, accountants, investment bankers, commercial bankers and other non-bank providers of capital who refer prospective portfolio companies to us. These relationships historically have generated significant investment opportunities. We believe that our network of relationships will continue to produce attractive investment opportunities.
•Focusing on Underserved Markets. The middle market has traditionally been underserved. We believe that operating margin and growth pressures, as well as regulatory concerns, have caused many financial institutions to de-emphasize services to middle market companies in favor of larger corporate clients and more liquid capital market transactions. We also invest in securities that would be rated below investment grade if they were rated. We believe these dynamics have resulted in the financing market for middle market companies being underserved, providing us with greater investment opportunities.
•Focus on Established Companies. We generally invest in companies with established market positions, proven management teams with strong operating discipline, histories of generating revenues, and recurring cash flow streams. We believe that those companies generally possess better risk adjusted return profiles than earlier stage companies that are building their management teams and establishing their revenue base. We also believe that established companies in our target size range generally provide opportunities for capital appreciation.
•Capital Structures Appropriate for Potential Industry and Business Volatility. Our investment team spends significant time understanding the performance of both the target portfolio company and its specific industry throughout a full economic cycle. The history of each specific industry and target portfolio company will demonstrate a different level of potential volatility in financial performance. We seek to understand this dynamic thoroughly and invest our
capital at leverage levels in the capital structure that will remain within enterprise value and in securities that will receive interest payments if such downside volatility were to occur.
•Providing Customized Financing Solutions. We offer a variety of financing structures and have the flexibility to structure our investments to meet the needs of our portfolio companies. We primarily invest in senior debt securities coupled with equity interests. We believe our ability to customize financing structures makes us an attractive partner to middle market companies.
INVESTMENT CRITERIA AND OBJECTIVES
Our investment team has identified the following investment criteria that we believe are important in evaluating prospective investment opportunities. However, not all of these criteria have been or will be met in connection with each of our investments:
Companies with •Positive and Sustainable Cash Flow: We generally seek to invest in established companies with sound historical financial performance.
•Excellent Management: Management teams with a proven record of achievement, exceptional ability, unyielding determination and integrity. We believe management teams with these attributes are more likely to manage the companies in a manner that protects and enhances value.
Industry: •Competitive Advantages in Markets: We primarily focus on companies having competitive advantages in their respective markets and/or operating in industries with barriers to entry, which may help protect their market position.
•Strong Private Equity Sponsors: We focus on developing relationships with leading private equity firms in order to partner with these firms and provide them capital to support the acquisition and growth of their portfolio companies.
•Appropriate Risk-Adjusted Returns: We focus on and price opportunities to generate returns that are attractive on a risk-adjusted basis, taking into consideration factors in addition to the ones depicted above, including credit structure, leverage levels and the general volatility and potential volatility of cash flows.
We have an investment committee that is responsible for all aspects of our investment process relating to investments made by us. The current members of the investment committee are Bowen Diehl, Chief Executive Officer,Officer; Michael Sarner, Chief
Financial Officer, Douglas Kelley, Managing Director,Officer; Josh Weinstein, Senior Managing Director,Director; and William Thomas,Ramona Rogers-Windsor, a member of the Board of Directors.Directors and a non-voting, observer of the investment committee.
Investment Process
Our investment strategy involves a team approach, whereby our investment team screens potential transactions before they are presented to the investment committee for approval. Transactions that are either above a certain hold size or outside our general investment policy will also be reviewed and approved by the Board of Directors. Our investment team generally categorizes the investment process into six distinctive stages:
•Deal Generation/Origination: Deal generation and origination is maximized through long-standing and extensive relationships with private equity firms, leveraged loan syndication desks, brokers, commercial and investment bankers, entrepreneurs, service providers such as lawyers and accountants, and current and former portfolio companies and investors.
•Screening: Once it is determined that a potential investment has met our investment criteria, we will screen the investment by performing preliminary due diligence, which could include discussions with the private equity firm, management team, loan syndication desk, etc. Upon successful screening of the proposed investment, the investment team makes a recommendation to move forward and prepares an initial screening memo for our investment committee. We then issue either a non-binding term sheet (in the case of a directly originated transaction), or submit an order to the loan syndication desk (in the case of a large-market syndicated loan transaction).
•Term Sheet: In a directly originated transaction, the non-binding term sheet will typically include the key economic terms of our investment proposal, along with exclusivity, confidentiality, and expense reimbursement provisions, amongas well as other terms relevant to the particular investment. Upon acceptance of the term sheet, we will begin our formal due diligence process. In a syndicated loan transaction, rather than a formal term sheet, we will submit an order for an allocation to the syndicated loan desk.
•Due Diligence: Due diligence is performed under the direction of our senior investment professionals, and involves our entire investment team as well as certain external resources who together perform due diligence to understand the
relationships among the prospective portfolio company’s business plan, operations, financial performance, and legal risks. On our directly originated transactions, our due diligence often will often include (1) conducting site visits with management and key personnel; (2) performing a detailed review of historical and projected financial statements, often with a third-party accounting firm, to evaluate the target company’s normalized cash flow; (3) creating our own detailed modeling projections, including a downside case which attempts to project how the business would perform in a recession based on past operating history of either the company or the industry; (4) interviewing key customers and suppliers; (5) evaluating company management, including a formal background check; (6) reviewing material contracts; (7) conducting an industry, market and strategy analysis; and (8) obtaining a review by legal, environmental or other consultants. In instances where a financial sponsor is investing in the equity in a transaction, we will leverage work done by the financial sponsor for purposes of our due diligence. In syndicated loan transactions, our due diligence may exclude direct customer and supplier interviews, and will consist of a detailed review of reports from the financial sponsor or syndication agent for industry and market analysis and legal and environmental diligence.
•Document and Close: Upon completion of a satisfactory due diligence review, our investment team presents its written findings to the investment committee. For transactions that are either over a certain hold size or outside our general investment policy, the investment team will present the transaction to our Board of Directors for approval. Upon approval forof the investment, we re-confirm our regulatory company compliance, process and finalize all required legal documents and fund the investment.
•Post-Investment: We continuously monitor the status and progress of our portfolio companies, as well as our investment thesis developed at the time of investment. We offer managerial assistance to our portfolio companies and provide them access to our investment experience, direct industry expertise and contacts. The same investment team leader that was involved in the investment process will continue to be involved in the portfolio company post-investment. This approach provides continuity of knowledge and allows the investment team to maintain a strong business relationship with the financial sponsor, business owner and key management of our portfolio companies. As part of the monitoring process, members of our investment team will analyze monthly, quarterly and annual financial statements against previous periods, review financial projections, meet with the financial sponsor and management (when necessary), attend board meetings (when appropriate) and review all compliance certificates and covenants. Our investment team generally meets once each monthquarter with senior management to review the performance of each of our portfolio companies.
We utilize an internally developed investment rating system to rate the performance of and monitor the expected level of returns for each debt investment in our portfolio. The investment rating system takes into account both quantitative and qualitative factors of the portfolio company and the investments held therein, including each investment’s expected level of returns and the collectability of our debt investments, comparisons to competitors and other industry participants and the portfolio company’s future outlook. The ratings are not intended to reflect the performance or expected level of returns of our equity investments.
•Investment Rating 1 represents the least amount of risk in our portfolio. The investment is performing materially above underwriting expectations and the trends and risk factors are generally favorable. The investment generally has a higher probability of being prepaid in part or in full.
•Investment Rating 2 indicates the investment is performing as expected at the time of underwriting and the trends and risk factors are generally favorable to neutral. All new loans are initially rated 2.
•Investment Rating 3 involves an investment performing below underwriting expectations and the trends and risk factors are generally neutral to negative. The portfolio company or investment may be out of compliance with financial covenants and interest payments may be impaired, however principal payments are generally not past due.
•Investment Rating 4 indicates that the investment is performing materially below underwriting expectations, the trends and risk factors are generally negative and the risk of the investment has increased substantially. Interest and principal payments on our investment are likely to be impaired.
Determination of Net Asset Value
Quarterly Determinations
We determine our net asset value, or NAV, per share on a quarterly basis. The NAV per share is equal to our total assets minus liabilities divided by the total number of shares of common stock outstanding.
We determine in good faith the fair value of our portfolio investments pursuant to a valuation policy in accordance with Accounting Standards Codification (“ASC”) Topic 820, Fair Value Measurements and Disclosures (“ASC 820”) and a valuation process approved by our Board of Directors and in accordance with the 1940 Act. Our valuation policy is intended to provide a consistent basis for determining the fair value of the portfolio.
We undertake a multi-step valuation process each quarter in connection with determining the fair value of our investments. The valuation process is led by the finance department in conjunction with the investment teams and senior management. Valuations of each portfolio security are prepared quarterly by the finance department using updated portfolio company financial and operational information. Each investment valuation is also subject to review by the executive officers and investment teams.
In conjunction with the internal valuation process, we have engaged multiple independent consulting firms that specialize in financial due diligence, valuation and business advisory services to provide third-party valuation reviews of the majority of our investments on a quarterly basis. OurAs of March 31, 2023, our Board of Directors is ultimately responsible for overseeing, reviewing and approving, in good faith, our determination of the fair value of each investment in our portfolio. Beginning as of the fiscal quarter ending June 30, 2023, pursuant to Rule 2a-5 under the 1940 Act, the Board of Directors has designated a valuation committee comprised of certain officers of the Company (the "Valuation Committee") as its valuation designee to determine the fair value of the Company's investments that do not have readily available market quotations, subject to the oversight of the Board of Directors.
Determinations in Connection with our Offerings
The 1940 Act prohibits us from selling shares of our common stock at a price below the current NAV per share of such stock, with certain exceptions. One such exception is prior shareholder approval of issuances below current NAV per share, provided that our Board of Directors determines that such sale is in the best interests of the Company and its shareholders. We do not intend to seek shareholder authorization to sell shares of our common stock below the then current NAV per share of our common stock at our 2023 annual meeting of shareholders. However, in the event we change our position, we will seek requisite approval of our shareholders.
In connection with each offering of shares of our common stock, our Board of Directors or an authorized committee thereofValuation Committee is required by the 1940 Act to make the determination of whether we are selling shares of our common stock at a price below our then current NAV at the time at which the sale is made. Ourmade, subject to the oversight of the Board of Directors or an authorized committee thereofDirectors. Our Valuation Committee considers the following factors, among others, in making such determination:
•the NAV of our common stock disclosed in the most recent periodic report we filed with the SEC;
•our management’s assessment of whether any material change in the NAV has occurred (including through the realization of net gains on the sale of our investments) from the period beginning on the date of the most recently disclosed NAV per share of our common stock and ending as of a time within 48 hours (excluding Sundays and holidays) of the sale of our common stock; and
•the magnitude of the difference between (i) a value that our Board of Directors or an authorized committee thereofValuation Committee has determined reflects the current (as of a time within 48 hours, excluding Sundays and holidays) NAV of our common stock, which is based upon the NAV disclosed in the most recent periodic report we filed with the SEC, as adjusted to
reflect our management’s assessment of any material change in the NAV since the date of the most recently disclosed NAV, and (ii) the offering price of the shares of our common stock in the proposed offering.
Moreover, to the extent that there is even a remote possibility that we may (i) issue shares of our common stock at a price below the then current NAV of our common stock at the time at which the sale is made or (ii) trigger the undertaking (which we providedwould provide to the SEC) to suspend the offering of shares of our common stock if the NAV fluctuates by certain amounts in certain circumstances, our Board of Directors or an authorized committee thereofValuation Committee will elect, in the case of clause (i) above, either to postpone the offering until such time that there is no longer the possibility of the occurrence of such event or to undertake to determine NAV within two days prior to any such sale to ensure that such sale will not be below our then current NAV, and, in the case of clause (ii) above, to comply with such undertaking or to undertake to determine NAV to ensure that such undertaking has not been triggered.
These processes and procedures are part of our compliance policies and procedures. Records are made contemporaneously with all determinations described in this section and these records are maintained with other records we are required to maintain under the 1940 Act.
COMPETITION
We compete for attractive investment opportunities with other financial institutions, including BDCs, junior capital lenders, and banks. We believe we are able to be competitive with these entities primarily on the basis of the experience and contacts of our management team and our responsive and efficient investment analysis and decision-making processes. However, many of our competitors are substantially larger and have considerably greater financial, technical and marketing resources than we do. Furthermore, our competitors may have a lower cost of funds and many have access to funding sources that are not available to us. In addition, certain of our competitors may have higher risk tolerances or different risk assessments, which could allow them to consider a wider variety of investments, establish more relationships, and build their market shares. Likewise, many of our competitors are not subject to the regulatory restrictions and valuation requirements that the 1940 Act imposes on us as a BDC. See “Risk Factors—Risks Related to Our Business and Structure—We operate in a highly competitive market for investment opportunities.”
We cannot assure you that the competitive pressures we face will not have a material adverse effect on our business, financial condition and results of operations. In addition, because of this competition, we may be unable to take advantage of attractive investment opportunities and may be unable to identify and make investments that satisfy our investment objectives or meet our investment goals.
HUMAN CAPITAL
Our employees are vital to our success as an internally managed BDC. The long-term success of our business and the success of our investment strategy depends on our people. We strive to attract, develop and retain our employees by offering advancement and promotion opportunities, attractive compensation and benefit packages and a close-knit culture. The departure of our key investment and operations personnel could cause our operating results to suffer.
Our investment strategy depends heavily on the business owners, management teams, and financial sponsors of our portfolio companies and their respective employees, contractors and service providers. In our investment process, the analysis of these individuals is a critical part of our overall investment underwriting process and as a result we carefully review the qualifications and experience of the portfolio company’s business owners and management team and their employment practices. We strive to partner with business owners, management teams, and financial sponsors whose business practices reflect our core values.
We also strive to recruit talented and driven individuals who share our values. Our recruiting efforts utilize strong relationships with a variety of sources from which we recruit. We offer selected students investment analyst internships, which are expected to lead to permanent roles for high performing and high potential interns. Through our internship program, interns who want to become investment analysts have the opportunity to see the full investment process from origination to closing, as well as post-closing portfolio management activities. We routinely promote from within, promoting current employees who have shown the technical ability, attitude, interest and the initiative to take on greater responsibility.
We have designed a compensation structure, including an array of benefit plans and programs, that we believe is attractive to our current and prospective employees. For certain employees, our compensation strategy also includes an equity incentive plan, which we have structured to further align the interests of our employees with our shareholders, and to cultivate a strong sense of ownership and commitment to the Company. Through our performance review processes, our employees are annually evaluated by supervisors and our senior management team to ensure employees continue to develop and advance as expected. We provide a workplace designed to enable our employees to balance work, family and family-related situations including flexible working arrangements. Our employees have access to a parental leave program for birth, adoption placement or foster child placement. We are committed to creating and maintaining an atmosphere where all employees feel welcomed, valued, respected and heard so that they feel motivated and encouraged to contribute fully to their careers, the Company and our communities.
We are committed to fostering a workplace conducive to the open communication of any concerns regarding unethical, fraudulent or illegal activities. We seek to promote a safe environment that is free of harassment or bullying. We do not tolerate discrimination or harassment of any kind, including, but not limited to, sexual, gender identity, race, religion, ethnicity, age, or disability, among others. We seek feedback from employees on matters related to their employment or our operations including its financial statement disclosures, accounting, internal accounting controls or auditing matters. Under our Whistleblower Policy, each employee of the Company has the ability to confidentially report via a dedicated, confidential reporting hotline questionable or improper accounting, internal controls, auditing matters, disclosure, or fraudulent business practices or other illegal or unethical behavior. We seek to protect the confidentiality of those making reports of possible misconduct and our
Whistleblower Policy prohibits retaliation against those who report activities believed in good faith to be a violation of any law, rule, regulation or internal policy. Our Code of Business Conduct establishes applicable policies, guidelines, and procedures that promote ethical practices and conduct by the Company and all its employees, officers, and directors. Our Whistleblower Policy and Code of Business Conduct can be found on our website at www.capitalsouthwest.com/governance.
As of March 31, 2023, we had twenty-six employees. These employees include our corporate officers, investment and portfolio management professionals and administrative staff. All of our employees are located in our principal executive offices in Dallas, Texas.
LEVERAGE
We borrow funds to make investments, a practice known as “leverage,” in an attempt to increase returns to our shareholders. Effective April 25, 2019, we are allowed to borrow amounts such that our asset coverage, as calculated in accordance with the 1940 Act, equals at least 150% after such borrowing. Additionally, the Board of Directors approved a resolution whichthat limits the Company's issuance of senior securities such that the asset coverage ratio, taking into account any such issuance, would not be less than 166%, at any time after the effective date. The amount of leverage that we employ at any particular time will depend on management’s and our Board of Directors’ assessments of portfolio mix, prevailing market advance rates, and other market factors at the time of any proposed borrowing. See “Risk Factors – Risks Related to Our Business and Structure – Because we borrow money to make investments, the potential for gain or loss on amounts invested in us is magnified and may increase the risk of investing in us.” On August 11, 2021, we received an exemptive order from the SEC to permit us to exclude the senior securities issued by SBIC I or any future SBIC subsidiary of the Company from the definition of "senior securities" in the asset coverage requirement applicable to the Company under the 1940 Act.
We intend to continue borrowing under the Credit Facilityour senior secured credit facility (the "Credit Facility") in the future, and we may increase the size of the Credit Facility, add additional credit facilities, or otherwise issue additional debt securities or other evidences of indebtedness in the future, although there can be no assurance that we will be able to do so.
See "Management’s Discussion and Analysis of Financial Condition and Results of Operations—Financial Liquidity and Capital Resources" as well as Note 5 to our consolidated financial statements for the year ended March 31, 20202023 for information regarding the Credit Facility the issuance of the December 2022 Notes and the issuance of the October 2024 Notes.
BROKERAGE ALLOCATION AND OTHER PRACTICES
Since we generally acquire and dispose of our investments in privately negotiated transactions, we infrequently use brokers in the normal course of our business. Our investment team is primarily responsible for the execution of the publicly traded securities portion of our portfolio transactions4.50% Notes due 2026 (the "January 2026 Notes") and the allocation of brokerage commissions. We do not expect to execute transactions3.375% Notes due 2026 (the "October 2026 Notes").
through any particular broker or dealer, but will seek to obtain the best net results for us, taking into account such factors as price (including the applicable brokerage commission or dealer spread), size of order, difficulty of execution, and operational facilities of the firm and the firm’s risk and skill in positioning blocks of securities. While we will generally seek reasonably competitive trade execution costs, we will not necessarily pay the lowest spread or commission available. Subject to applicable legal requirements, we may select a broker based partly upon brokerage or research services provided to us. In return for such services, we may pay a higher commission than other brokers would charge if we determine in good faith that such commission is reasonable in relation to the services provided. We did not pay any brokerage commissions during the three years ended March 31, 2020.
DIVIDEND REINVESTMENT PLAN
We have adopted a dividend reinvestment plan, or DRIP, that provides for the reinvestment of dividends on behalf of our shareholders.shareholders in shares of our common stock. Under the DRIP, if we declare a dividend, registered shareholders who have opted into the DRIP as of the dividend record date will have their dividend automatically reinvested into additional shares of our common stock. The share requirements of the DRIP are satisfied through open market purchases of common stock by the DRIP plan administrator. Shares purchased in the open market to satisfy the DRIP requirements will be valued based upon the average price of the applicable shares purchased by the DRIP plan administrator, before any associated brokerage or other costs.
ELECTION TO BE REGULATED AS A BUSINESS DEVELOPMENT COMPANY
We are a closed-end, non-diversified investment company that has elected to be treatedregulated as a BDC under the 1940 Act. In addition, we have elected, and intend to qualify annually, to be treated as a RIC.RIC for U.S. federal income tax purposes. Our election to be regulated as a BDC and our election to be treated as a RIC for U.S. federal income tax purposes have a significant impact on our operations. Some of the most important effects on our operations of our election to be regulated as a BDC and our election to be treated as a RIC are outlined below.
•We report our investments at market value or fair value with changes in value reported through our Consolidated Statements of Operations.
In accordance with the requirements of the 1940 Act and Article 6 of Regulation S-X, we report all of our investments, including debt investments, at market value or, for investments that do not have a readily available market value, at their “fair value” as determined in good faith by our Board of Directors. Changes in these values are reported through our Consolidated Statements of Operations under the caption of “net change in unrealized appreciation on investments.” See “Determination of Net Asset Value” above.
•We intend to distribute substantially all of our income to our shareholders. We generally will be requiredsubject to payU.S. federal income taxestax only on the portion of our taxable income we do not timely distribute to shareholders (actually or constructively).
As a RIC, so long as we meet certain minimum distribution, source of income, and asset diversification requirements, we generally are requiredsubject to pay U.S. federal income taxestax only, and possibly a 4% U.S. federal excise tax, on the portion of our taxable income and gains that we do not timely distribute (actually or constructively) and certain built-in gains. Depending onOur U.S. federal income tax liability may be reduced to the level of taxable income earned in a tax year,extent that we may choose to carry forward taxable income in excess of current yearmake certain distributions intoduring the nextfollowing calendar year and pay a 4% U.S. federal excise tax on such income. Any such carryover taxable income must be distributed through a dividend declared prior to filing the final tax return related to the year that generated such taxable income.satisfy other procedural requirements. We intend to distribute to our shareholders substantially all of our income. We may, however, make deemed distributions to our shareholders of any retained net long-term capital gains. If this happens, our shareholders will be treated as if they received an actual distribution of the net capital gains and reinvested the net after-tax proceeds in us. Our shareholders also may be eligible to claim a tax credit (or, in certain circumstances, a tax refund) equal to their allocable share of the corporate-level U.S. federal income tax we pay on the deemed distribution. See “Material U.S. Federal Income Tax Considerations.” We met the minimum distribution requirements for tax years 20182021 and 20172020 and intend to meet the minimum distribution requirements for tax year 2019.2022. We continually monitor our distribution requirements with the goal of ensuring compliance with the Code.
In addition, we have a Taxable Subsidiary that holds a portion of one or more of our portfolio investments that are listed on the Consolidated Schedule of Investments. The Taxable Subsidiary is consolidated for financial reporting purposes in accordance with U.S. Generally Accepted Accounting Principles, or GAAP, so that our consolidated financial statements reflect our investments in the portfolio companies owned by the Taxable Subsidiary. The purpose of the Taxable Subsidiary is to permit us to hold certain interests in portfolio companies that are organized as limited liability companies, or LLCs (or other forms of pass-through entities) and still satisfy the RIC tax requirement that at least 90% of our gross income for U.S. federal income tax purposes must consist of qualifying investment income. Absent the Taxable Subsidiary, a proportionate amount of any gross income of a partnership or
LLC (or other pass-through entity) portfolio investment generally would flow through directly to us. To the extent that such income did not consist of investment income, it could jeopardize our ability to qualify as a RIC and therefore cause us to incur significant amounts of corporate-level U.S. federal income taxes. Where interests in LLCs (or other pass-through entities) are owned by the Taxable Subsidiary, the income from those interests is taxed to the Taxable Subsidiary and does not flow through to us, thereby helping us preserve our RIC status and resultant tax advantages. The Taxable Subsidiary is not consolidated for U.S. federal income tax purposes and may generate U.S. federal income tax expense as a result of its ownership of the portfolio companies. This U.S. federal income tax expense, if any, is reflected in our Consolidated Statements of Operations.
•Our ability to use leverage as a means of financing our portfolio of investments is limited.
As a BDC, we are required to meet a coverage ratio of total assets to total senior securities of at least 150%, which became effective April 25, 2019. Additionally, the Board of Directors approved a resolution whichthat limits the Company's issuance of senior securities such that thatour asset coverage ratio, taking into account any such issuance, would not be less than 166%, at any time after the effective date. For this purpose, senior securities include all borrowings and any preferred stock we may issue in the future. Additionally, our ability to utilize leverage as a means of financing our portfolio of investments may be limited by this asset coverage requirement. While the use of leverage may enhance returns if we meet our investment objective, our returns may be reduced or eliminated if our returns on investments are less than the costs of borrowing. On August 11, 2021, we received an exemptive order from the SEC to permit us to exclude the senior securities issued by SBIC I or any future SBIC subsidiary of the Company from the definition of senior securities in the asset coverage requirement applicable to the Company under the 1940 Act.
•We are required to comply with the provisions of the 1940 Act applicable to business development companies.
As a BDC, we are required to have a majority of directors who are not “interested persons” as such term is(as defined in Section 2(a)(19) of the 1940 Act.Act) of the Company. In addition, we are required to comply with other applicable provisions of the 1940 Act, including those requiring the adoption of a code of ethics, maintaining a fidelity bond and placing and maintaining itsour securities and similar investments in custody. See “Regulation as a Business Development Company” below.
Regulation as a Business Development Company
We have elected to be regulated as a BDC under the 1940 Act. The 1940 Act contains prohibitions and restrictions relating to transactions between BDCs and their affiliates and principal underwriters as well as their respective affiliates. The 1940 Act requires that a majority of the members of the board of directors of a BDC be persons other than “interested persons,” as defined in the 1940 Act. In addition, the 1940 Act provides that we may not change the nature of our business so as to cease to be, or to withdraw our election as, a BDC unless approved by holders of a majority of our outstanding voting securities.
The 1940 Act defines “a majority of the outstanding voting securities” as the lesser of (1) 67% or more of the voting securities of holders present or represented by proxy at a meeting if the holders of more than 50% of our outstanding voting securities are present or represented by proxy or (2) more than 50% of our voting securities.
The following is a brief description of the 1940 Act provisions applicable to BDCs, which is qualified in its entirety by reference to the full text of the 1940 Act and rules issued thereunder by the SEC.SEC:
•Generally, BDCs must offer, and must provide upon request, significant managerial assistance available to certaineligible portfolio companies. In general, as a BDC, a company must, among other things: (1) be a domestic company; (2) have registered a class of its securities pursuant to Section 12 of the Exchange Act; (3) operate for the purpose of investing in the securities of certain types of eligible portfolio companies, includingwhich may include early stage or emerging companies and businesses sufferingbankrupt, insolvent or just recovering from financial distressdistressed companies (see following paragraph); (4) offer to make available significant managerial assistance to such eligible portfolio companies; and (5) file a proper notice of election with the SEC.
•An eligible"eligible portfolio companycompany" generally is a domestic company that is not a regulated or private investment company or a financial company (such as brokerage firms, banks, insurance companies and investment banking firms) and that: (1) does not have a class of securities listed on a national securities exchange; (2) has a class of securities listed on a national securities exchange with an equity market capitalization of less than $250 million; or (3) is controlled by the BDC itself or together with others and, as a result of such control, the BDC has an affiliated person on the board of directors of the company. The 1940 Act presumes that a person has “control” of a portfolio company if that person owns at least 25% of its outstanding voting securities.
•As a BDC, we are required to provide and maintain a bond issued by a reputable fidelity insurance company to protect against larceny and embezzlement. Furthermore, as a BDC, we are prohibited from protecting any director or officer against any liability to us or our shareholders arising from any act or omission constituting willful malfeasance, bad faith, gross negligence or reckless disregard of the duties involved in the conduct of that person’s office.
•We are required to adopt and implement written policies and procedures reasonably designed to prevent violation of the federal securities laws, review these policies and procedures annually for their adequacy and the effectiveness of their implementation and designate a chief compliance officer who reports directly to the Board of Directors to be responsible for administering these policies and procedures.
On March 23, 2018, the Small Business Credit Availability Act (the “SBCAA”) was signed into law and, among other things, instructs the SEC to issue rules or amendments to rules allowing BDCs to use the same registration, offering and communication processes that are available to operating companies. The rules and amendments specified by the SBCAA became self-implementing on March 24, 2019. On April 8, 2020, the SEC adopted rules and amendments to implement certain provisions of the SBCAA (the “Final Rules”) that, among other things, modify the registration, offering, and communication processes available to BDCs relating to: (i) the shelf offering process to permit the use of short-form registration statements on Form N-2 and incorporation by reference; (ii) the ability to qualify for Well-Known Seasoned Issuer status; (iii) the immediate or automatic effectiveness of certain filings made in connection with continuous public offerings; and (iv) communication processes and prospectus delivery. In addition, the SEC adopted rules that will require BDCs to comply with certain structured data and inline XBRL requirements. The Final Rules will generally become effective on August 1, 2020, except that a BDC eligible to file short-form registration statements on Form N-2, like the Company, must comply with the Inline XBRL structure data requirements for its financial statements, registration statement cover page, and certain prospectus information by August 1, 2022.
Qualifying Assets
The 1940 Act provides that we may not make an investmentacquire any assets other than "qualifiying assets" specified in non-qualifying assetsthe 1940 Act unless at the time of the investment at least 70% of the value of our total assets (measured as of the date of our most recently filed financial statements) consists of qualifying assets. Qualifying assets include: (1) securities of eligible portfolio companies; (2) securities of certain companies that were eligible portfolio companies at the time we initially acquired their securities and in which we retain a substantial interest; (3) securities of certain controlled companies; (4) securities of certain bankrupt, insolvent or distressed companies; (5) securities received in exchange for or distributed in or with respect to any of the foregoing; and (6) cash items, U.S. government securities and high-quality short-term debt.
Significant Managerial Assistance to Portfolio Companies
In orderBDCs generally must offer, and must provide upon request, significant managerial assistance to countcertain of their portfolio securities as qualifying assets forcompanies, except in circumstances where either (i) the purpose of the qualifying assets requirement, we must either control theBDC controls such issuer of the securities or must offer to make available to(ii) the issuer of the securities significant managerial assistance. However, where we purchaseBDC purchases such securities in conjunction with one or more other persons acting together and one of the other persons in the group may makemakes available such managerial assistance. Making available managerial assistance means, among other things, any arrangement whereby the BDC, through its directors, officers or employees, offers to provide, and, if accepted, provides, significant guidance and counsel concerning the management, operations or business objectives and policies of a portfolio company.
Temporary Investments
Pending investment in other types of “qualifyingqualifying assets,” as described above, our investments may consist of cash, cash equivalents, U.S. government securities, short-term investments in secured debt investments, independently rated debt investments, and diversified bond funds, which we refer to as temporary investments.
Senior Securities
BDCs generally have been permitted by the 1940 Act, under specific conditions, to issue multiple classes of debt and one class of stock senior to its common stock if its asset coverage, as defined by the 1940 Act, is at least 200% immediately after each such issuance. However, recent legislation has modified the 1940 Act by allowingallows a BDC to increase the maximum amount of leverage it may incur by reducing the minimum asset coverage ratio from 200% to 150%, if certain requirements under the 1940 Act are met. On April 25, 2018, the Board of Directors unanimously approved the application of the recently modified asset coverage requirements set forth in Section 61(a)(2) of the 1940 Act. As a result, effective April 25, 2019, the minimum asset coverage ratio applicable to the Company was decreased from 200% to 150%, which became effective April 25, 2019.. Additionally, the Board of Directors also approved a resolution whichthat limits the Company’s issuance of senior securities such that the asset coverage ratio, taking into account any such issuance, would not be less than 166%, at any time after the effective date. We are required to make certain disclosures on our website and in SEC filings regarding, among other things, the receipt of approval to reduce itsour asset coverage requirement to 150%, itsour leverage capacity and usage, and risks related to leverage.
As of March 31, 2020,2023, we had $154.0$235.0 million, $77.1$140.0 million and 75.0$150.0 million in total aggregate principal amount of debt outstanding under our Credit Facility, December 2022the January 2026 Notes and the October 20242026 Notes, respectively. As of March 31, 2020,2023, our asset coverage for borrowed amounts was 189%235%.
In addition, while any preferred stock or publicly traded debt securities are outstanding, we may be prohibited from making distributions to our shareholders or the repurchasing of such securities or shares unless we meet the applicable asset coverage ratios at the time of the distribution or repurchase. We may also borrow amounts up to 5% of the value of our total assets for temporary or emergency purposes without regard to asset coverage. Under specific conditions, we are also permitted by the 1940 Act to issue warrants.
Common Stock
We are not generally able to issue and sell our common stock at a price below NAV per share. We may, however, sell our common stock, warrants, options or rights to acquire our common stock at a price below the then current NAV of theour common stock if our Board of Directors determines that such sale is in our best interests and that of our shareholders, and our shareholders approve such sale. In any such case, the price at which our securities are to be issued and sold may not be less than a price which, in the determination of our Board of Directors, closely approximates the market value of such securities (less any distributing commission or discount). We do not intend to seek shareholder authorization to sell shares of our common stock below the then current NAV per share of our common stock at our 20202023 annual meeting of shareholders. See "Risk Factors - Risks Relating to Our Business and Structure - Regulations governing our operation as a BDC will affect our ability to, and the way in which we, raise additional capital."
Code of Ethics and Code of Conduct
We adopted a code of ethics pursuant to Rule 17j-1 under the 1940 Act that establishes procedures for personal investments and restricts certain personal securities transactions. Personnel subject to the code may invest in securities for their personal investment accounts, including securities that may be purchased or held by us, so long as those investments are made in accordance with the code’s requirements. We have also adopted a code of conduct that applies to our Chief Executive Officer, Chief Financial Officer (or persons performing similar functions), our Board of Directors, and all other employees. This code sets forth policies that these executives and employees must follow when performing their duties. The code of ethics and code of conduct are available on the Company website at www.capitalsouthwest.com/governance.
Proxy Voting Policies and Procedures
We vote proxies relating to our portfolio securities in a manner in which we believe is consistent with the best interest of our shareholders. We review on a case-by-case basis each proposal submitted to a shareholder vote to determine its impact on the portfolio securities held by us. Although we generally vote against proposals that we expect would have a negative impact on our portfolio securities, we may vote for such a proposal if there exists compelling long-term reasons to do so. Our proxy voting decisions are made by the investment team that is responsible for monitoring the investments. To ensure that our vote is not the product of a conflict of interest, we require that anyone involved in the decision-making process discloses to our Chief Compliance Officer any potential conflict of which he or she is aware. Shareholders may obtain information, without charge, regarding how we voted proxies with respect to our portfolio securities by making a written request for proxy voting information to: Chief Financial Officer c/o Capital Southwest Corporation, 5400 Lyndon B. Johnson Freeway,8333 Douglas Avenue, Suite 1300,1100, Dallas, Texas 75240.75225.
Compliance Policies and Procedures
We have adopted and implemented written policies and procedures reasonably designed to prevent violation of the U.S. federal securities laws, and we are required to review these compliance policies and procedures annually for their adequacy and the effectiveness of their implementation, andimplementation. We are further required to designate a Chief Compliance Officer to be responsible for administering these policies and procedures. Michael S. Sarner serves as our Chief Compliance Officer.
Exemptive Relief
On October 26, 2010, we received an exemptive order from the SEC permitting usThe right to issuegrant restricted stock awards under the 2010 Restricted Stock Award Plan (the "2010 Plan") terminated on July 18, 2021, ten years after the date that the 2010 Plan was approved by the Company's shareholders pursuant to our executive officersits terms.
In connection with the termination of the 2010 Plan, the Company’s Board of Directors and certain keyshareholders approved the Capital Southwest Corporation 2021 Employee Restricted Stock Award Plan (the "2021 Employee Plan"), which became effective on July 28, 2021, as part of the compensation package for its employees, or the Original Order.terms of which are, in all material respects, identical to the 2010 Plan. On August 22, 2017,July 19, 2021, we received an exemptive order that supersedes the Original Order, or the Exemptive Order, and in additionprior exemptive order relating to the relief granted under2010 Plan (the “Order”) to permit the Original Order, allows usCompany to (i) issue restricted stock as part of the compensation package for its employees in the 2021 Employee Plan, and (ii) withhold shares of the Company’s common stock or purchase shares of the Company’s common stock from the participants to satisfy tax withholding obligations relatedrelating to the vesting of restricted stock granted pursuant to the 20102021 Employee Plan. In addition, the Company's Board of Directors and shareholders approved the Capital Southwest Corporation 2021 Non-Employee Director Restricted Stock Award Plan or(the "Non-Employee Director Plan"), which became effective on July 27, 2022, as part of the 2010 Plan,compensation package for non-employee directors of the Board of Directors. In connection therewith, on May 16, 2022, we received an exemptive order that supersedes the Order (the "Superseding Order") and to paycovers both employees and non-employee directors of the exercise priceBoard of options to purchase shares of our common stock granted pursuant to the 2009 Stock Incentive Plan, or the 2009 Plan.Directors.
Other
We may also be prohibited under the 1940 Act from knowingly participating in certain transactions with our affiliates without the prior approval of our Board of Directors who are not interested persons and, in some cases, prior approval by the SEC. The prior approval of the SEC is not required, however, where a transaction involves no negotiation of terms other than price.
We expect to periodically be examined by the SEC for compliance with the 1940 Act.
MATERIAL U.S. FEDERAL INCOME TAX CONSIDERATIONS
The following discussion is a general summary of the material U.S. federal income tax considerations applicable to us and to an investment in our shares. This summary does not purport to be a complete description of the income tax considerations applicable to us or to investors in such an investment. For example, we have not described tax consequences that we assume to be generally known by investors or certain considerations that may be relevant to certain types of holders subject to special treatment under U.S. federal income tax laws, including shareholders subject to the alternative minimum tax, tax-exempt organizations, insurance companies, dealers in securities, pension plans and trusts, financial institutions, U.S. shareholders (as defined below) whose functional currency is not the U.S. dollar, persons who mark-to-market our shares and persons who hold our shares as part of a “straddle,” “hedge” or “conversion” transaction. This summary assumes that investors hold shares of our common stock as capital assets (within the meaning of the Code). The discussion is based upon the Code, Treasury regulations, and administrative and judicial interpretations, each as of the date of this Annual Report on Form 10-K and all of which are subject to change, possibly retroactively, which could affect the continuing validity of this discussion. This summary does not discuss any aspects of U.S. estate or gift tax or foreign, state or local tax. It does not discuss the special treatment under U.S. federal income tax laws that could result if we invested in tax-exempt securities or certain other investment assets.
For purposes of our discussion, a “U.S. shareholder” means a beneficial owner of shares of our common stock that is for U.S. federal income tax purposes:
•A citizen or individual resident of the United States;
•A corporation, or other entity treated as a corporation, for U.S. federal income tax purposes, created or organized in or under the laws of the United States or any state thereof ofor the District of Columbia;
•An estate, the income of which is subject to U.S. federal income taxation regardless of its source; or
•A trust if (1) a U.S. court is able to exercise primary supervision over the administration of the trust and one or more U.S. persons have the authority to control all substantial decisions of the trust, or (2) it has a valid election in place to be treated as a U.S. person.
For purposes of our discussion, a “Non-U.S.“non-U.S. shareholder” means a beneficial owner of shares of our common stock that is neither a U.S. shareholder nor a partnership (including an entity treated as a partnership for U.S. federal income tax purposes).
If an entity treated as a partnership for U.S. federal income tax purposes (a “partnership”) holds shares of our common stock, the tax treatment of a partner or member of the partnership will generally depend upon the status of the partner or member and the activities of the partnership. A prospective shareholder that is a partner or member in a partnership holding shares of our common stock should consult his, her or its tax advisors with respect to the purchase, ownership and disposition of shares of our common stock.
Tax matters are very complicated and the tax consequences to an investor of an investment in our shares will depend on the facts of his, her, or its particular situation. We encourage investors to consult their own tax advisors regarding the specific consequences of such an investment, including tax reporting requirements, the applicability of U.S. federal, state, local and foreign tax laws, eligibility for the benefits of any applicable tax treaty and the effect of any possible changes in the tax laws.
Taxation as a Regulated Investment Company
Election to be Taxed as a RIC
We have elected to be treated as a RIC under Subchapter M of the Code. As a RIC, we generally are not subject to corporate-level U.S. federal income taxestax on any income that we timely distribute to our shareholders from our tax earnings and profits. To qualify as a RIC, we must, among other things, meet certain source-of-income and asset diversification requirements (as described below). In addition, in order to obtain RIC tax treatment, we generally must distribute to our shareholders, for each taxable year, at least 90% of our “investment company taxable income,” which is generally our net ordinary income plus the excess, if any, of realized net short-term capital gain over realized net long-term capital loss, or the Annual Distribution Requirement. Depending on the level of taxable income earned in a tax year, we may choose to carry forward taxable income in excess of current year distributions into the next year and pay a 4% U.S. federal excise tax onyear. In such income. Any such carryover taxable income must be
distributed through a dividend declared prior to filing the final tax return related to the year that generated such taxable income. Even if we qualify as a RIC,case, we generally will be subject to corporate-level U.S. federal income tax at corporate rates on our undistributed taxable income and could be subject to U.S. federal excise, state, local and foreign taxes.
Under the Code, we may satisfy certain of our RIC distributions with dividends paid after the end of the current year. In particular, if we pay a distribution in January of the following year that was declared in October, November, or December of the current year and is payable to shareholders of record in the current year, the dividend will be treated for all U.S. federal tax purposes as if it were paid on December 31 of the current year. In addition, under the Code, we may pay dividends, referred to as “spillover dividends,” that are paid during the following taxable year that will allow us to maintain our qualification for taxation as a RIC and eliminate our liability for U.S. federal income tax. Under these spillover dividend procedures, we may defer distribution of income earned during the current year until December of the following year. For example, we may defer distributions of income earned during 2022 until as late as December 31, 2023. If we choose to pay a spillover dividend, we will incur the nondeductible 4% U.S. federal excise tax on some or all of the distribution.
Taxation as a RIC
Provided that we qualify as a RIC, we will not be subject to U.S. federal income tax on the portion of our investment company taxable income and net capital gain (which we define as net long-term capital gain in excess of net short-term capital loss) that we timely distribute to shareholders. We will be subject to U.S. federal income tax at the regular corporate rates on any income or capital gain not distributed (or deemed distributed) to our shareholders.
We will be subject to a 4% nondeductible U.S. federal excise tax on certain undistributed income unless we distribute in a timely manner an amount at least equal to the sum of (1) 98% of our ordinary income for each calendar year, (2) 98.2% of our capital gain net income for the onecalendar year period ended OctoberDecember 31 and (3) any income and gains recognized, but not distributed, in preceding years and on which we paid no U.S. federal income tax.
In order to qualify as a RIC for U.S. federal income tax purposes, we must, among other things:
•Meet the Annual Distribution Requirement;
•Qualify to be treatedregulated as a BDC or be registered as a management investment company under the 1940 Act at all times during each taxable year;
•Derive in each taxable year at least 90% of our gross income from dividends, interest, payments with respect to certain securities loans, gains from the sale or other disposition of stock or other securities or foreign currencies or other income derived with respect to our business of investing in such stock, securities or currencies and net income derived from an interest in a “qualified publicly traded partnership” (as defined in the Code), or the 90% Income Test; and
•Diversify our holdings so that at the end of each quarter of the taxable year:
| |
◦ | at least 50% of the value of our assets consists of cash, cash equivalents, U.S. Government securities, securities of other RICs, and other securities if such other securities of any one issuer do not represent more than 5% of the value of our assets or more than 10% of the outstanding voting securities of the issuer (which for these purposes includes the equity securities of a “qualified publicly traded partnership”); and |
| |
◦ | no more than 25% of the value of our assets is invested in the securities, other than U.S. Government securities or securities of other RICs, (1) of one issuer (2) of two or more issuers that are controlled, as determined under applicable tax rules, by us and that are engaged in the same or similar or related trades or businesses or (3) of one or more “qualified publicly traded partnerships,” or the Diversification Tests. |
◦at least 50% of the value of our assets consists of cash, cash equivalents, U.S. Government securities, securities of other RICs, and other securities, if such other securities of any one issuer do not represent more than 5% of the value of our assets or more than 10% of the outstanding voting securities of the issuer (which for these purposes includes the equity securities of a “qualified publicly traded partnership”); and
◦no more than 25% of the value of our assets is invested in (i) the securities, other than U.S. Government securities or securities of other RICs, of one issuer, (ii) the securities, other than the securities of other RICs, of two or more issuers that are controlled, as determined under applicable tax rules, by us and that are engaged in the same or similar or related trades or businesses, or (iii) the securities of one or more “qualified publicly traded partnerships,” or the Diversification Tests.
To the extent that we invest in entities treated as partnerships for U.S. federal income tax purposes (other than a “qualified publicly traded partnership”), we generally must include the items of gross income derived by the partnerships for purposes of the 90% Income Test, and the income that is derived from a partnership (other than a “qualified publicly traded partnership”) will be treated as qualifying income for purposes of the 90% Income Test only to the extent that such income is attributable to items of income of the partnership which would be qualifying income if realized by us directly. In addition, we generally must take into account our proportionate share of the assets held by partnerships (other than a “qualified publicly traded partnership”) in which we are a partner for purposes of the Diversification Tests.
In order to meet the 90% Income Test, we have established the Taxable Subsidiary to hold assets from which we do not anticipate earning dividend,dividends, interest or other income under the 90% Income Test. We may establish additional subsidiaries for the same purpose in the future. Any investments held through athe Taxable Subsidiary generally are subject to U.S. federal income and other taxes, and therefore we can expect to achieve a reduced after-tax yield on such investments.
We may be required to recognize taxable income in circumstances in which we do not receive a corresponding payment in cash. For example, if we hold debt obligations that are treated under applicable tax rules as having original issue discount (including debt instruments with payment-in-kind interest or, in certain cases, increasing interest rates or issued with warrants), we must include in income each year a portion of the original issue discount or payment-in-kind interest that accrues over the life of the obligation, regardless of whether cash representing such income is received by us in the same taxable year. We anticipate that a portion of our income may constitute original issue discount or other income required to be included in taxable income prior to receipt of cash.
Because any original issue discount or other amounts accrued will be included in our investment company taxable income for the year of the accrual, we may be required to make a distribution to our shareholders in order to satisfy the Annual Distribution Requirement, even though we will not have received any corresponding cash amount. As a result, we may have difficulty meeting
the annual distribution requirement necessary to obtain and maintain RIC tax treatment under the Code. We may have to sell some of our investments at times and/or at prices we would not consider advantageous, raise additional debt or equity capital or forgo new investment opportunities for this purpose. If we are not able to obtain cash from other sources, we may fail to qualify for RIC tax treatment and thus become subject to corporate-level U.S. federal income tax.
Furthermore, a portfolio company in which we invest may face financial difficulty that requires us to work-out, modify or otherwise restructure our investment in the portfolio company. Any such restructuring may result in unusable capital losses and future non-cash income. Any restructuring may also result in our recognition of a substantial amount of non-qualifying income for purposes of the 90% Income Test, such as cancellation of indebtedness income in connection with the work-out of a leveraged investment (which, while not free from doubt, may be treated as non-qualifying income) or the receipt of other non-qualifying income.
Gain or loss realized by us from warrants acquired by us, as well as any loss attributable to the lapse of such warrants, generally will be treated as capital gain or loss. Such gain or loss generally will be long-term or short-term, depending on how long we held a particular warrant.
Investments by us in non-U.S. securities may be subject to non-U.S. income, withholding and other taxes, and therefore, our yield on any such securities may be reduced by such non-U.S. taxes. Shareholders will generally not be entitled to claim a credit or deduction with respect to non-U.S. taxes paid by us.
We are authorized to borrow funds and to sell assets in order to satisfy distribution requirements. Under the 1940 Act, we are not permitted to make distributions to our shareholders while our debt obligations and other senior securities are outstanding unless certain “asset coverage” tests are met. See “Regulation as a Business Development Company” above. Moreover, our ability to dispose of assets to meet our distribution requirements may be limited by (1) the illiquid nature of our portfolio and/or (2) other requirements relating to our status as a RIC, including the Diversification Tests. If we dispose of assets in order to meet the Annual Distribution Requirement or to avoid the excise tax, we may make such dispositions at times that are not advantageous from an investment standpoint, are not advantageous.standpoint.
If we fail to satisfy the Annual Distribution Requirement or otherwise fail to qualify as a RIC in any taxable year, we will be subject to tax in that year on all of our taxable income, regardless of whether we make any distributions to our shareholders. In that case, all of such income will be subject to corporate-level U.S. federal income tax at corporate rates, reducing the amount available to be distributed to our shareholders. See “Failure To Obtain RIC Tax Treatment” below.
As a RIC, we are not allowed to carry forward or carry back a net operating loss for purposes of computing our investment company taxable income in other taxable years. U.S. federal income tax law generally permits a RIC to carry forward (1) the excess of its net short-term capital loss over its net long-term capital gain for a given year as a short-term capital loss arising on the first day of the following year and (2) the excess of its net long-term capital loss over its net short-term capital gain for a given year as a long-term capital loss arising on the first day of the following year. Future transactions we engage in may cause our ability to use any capital loss carryforwards, and unrealized losses once realized, to be limited under Section 382 of the Code. Certain of our investment practices may be subject to special and complex U.S. federal income tax provisions that may, among other things, (1) disallow, suspend, or otherwise limit the allowance of certain losses or deductions, (2) convert lower taxed long-term capital gain and qualified dividend income into higher taxed short-term capital gain or ordinary income, (3) convert an ordinary loss or a deduction into a capital loss (the deductibility of which is more limited), (4) cause us to recognize income or gain without a corresponding receipt of cash, (5) adversely affect the time as to when a purchase or sale of stock or securities is deemed to occur, (6) adversely alter the characterization of certain complex financial transactions and (7) produce income that will not be qualifying income for purposes of the 90% Income Test. We will monitor our transactions and may make certain tax elections in order to mitigate the effect of these provisions.
As described above, to the extent that we invest in equity securities of entities that are treated as partnerships for U.S. federal income tax purposes, the effect of such investments for purposes of the 90% Income Test and the Diversification Tests will depend on whether or not the partnership is a “qualified publicly traded partnership” (as defined in the Code). If the entity is a “qualified publicly traded partnership,” the net income derived from such investments will be qualifying income for purposes of the 90% Income Test and will be “securities” for purposes of the Diversification Tests. If the entity is not treated as a “qualified publicly traded partnership,” however, the consequences of an investment in the partnership will depend upon the amount and type of income and assets of the partnership allocable to us. The income derived from such investments may not be qualifying income for purposes of the 90% Income Test and therefore could adversely affect our qualification as a RIC. We intend to monitor our investments in equity securities of entities that are treated as partnerships for U.S. federal income tax purposes to prevent our disqualification as a RIC.
We may invest in preferred securities or other securities for which the U.S. federal income tax treatment of which may not be clear or may be subject to re-characterization by the Internal Revenue Service, or the IRS. To the extent the tax treatment of such securities or the income from such securities differs from the expected tax treatment, itsuch tax treatment could affect the timing or character of income recognized, requiring us to purchase or sell securities or otherwise change our portfolio in order to comply with the tax rules applicable to RICs under the Code.
We may distribute taxable dividends that are payable in cash or shares of our common stock at the election of each shareholder. Under certain applicable provisions of the Code and the Treasury regulations, distributions payable in cash or in shares of stock at the election of shareholders are treated as taxable dividends. The IRS has issued a revenue procedure indicating that this rule will apply where the total amount of cash to be distributed is not less than 20% of the total distribution (which has been temporarily reduced to 10% for distributions declared on or after April 1, 2020, and on or before December 31, 2020).distribution. Under this revenue procedure, if too many shareholders elect to receive their distributions in cash, each such shareholder would receive a pro rata share of the total cash to be distributed and would receive the remainder of their distribution in shares of stock. If we decide to make any distributions consistent with this revenue procedure that are payable in part in our common stock, taxable shareholders receiving such dividends will be required to include the full amount of the dividend (whether received in cash, our common stock, or a combination thereof) as ordinary income (or as long-term capital gain, to the extent such distribution is properly reported as a capital gain dividend) to the extent of our current and accumulated earnings and
profits for United StatesU.S. federal income tax purposes. As a result, a U.S. shareholder may be required to pay tax with respect to such dividends in excess of any cash received. If a U.S. shareholder sells the stock it receives in order to pay this tax, the sales proceeds may be less than the amount included in income with respect to the dividend, depending on the market price of our common stock at the time of the sale. Furthermore, with respect to non-U.S. shareholders, we may be required to withhold U.S. tax with respect to such dividends, including in respect of all or a portion of such dividend that is payable in stock. If a significant number of our shareholders determine to sell shares of our common stock in order to pay taxes owed on dividends, it may put downward pressure on the trading price of our common stock.
Failure to Obtain RIC Tax Treatment
If we fail to satisfy the 90% Income Test or the Diversification Tests for any taxable year, we may nevertheless continue to qualify as a RIC for that year if certain relief provisions are applicable (which may, among other things, require us to pay certain corporate-level U.S. federal taxestax at corporate rates or to dispose of certain assets).
If we were unable to obtain tax treatment as a RIC, we would be subject to U.S. federal income tax on all of our taxable income at regular corporate rates. We would not be able to deduct distributions to shareholders, nor would they be required to be made. Distributions would generally be taxable to our shareholders as dividend income to the extent of our current and accumulated earnings and profits (in the case of non-corporate U.S. shareholders, generally at a maximum federal income tax rate applicable to qualified dividend income of 20%). Subject to certain holding period and other limitations under the Code, corporate distributees wouldmay be eligible for the dividends-received deduction. Distributions in excess of our current and accumulated earnings and profits would be treated first as a return of capital to the extent of the shareholder’s adjusted tax basis, and any remaining distributions would be treated as a capital gain.
If we fail to meet the RIC requirements for more than two consecutive years and then seek to re-qualify as a RIC, we would be subject to corporate-level U.S. federal income taxationtax at corporate rates on any built-in gain recognized during the succeeding 5-yearfive-year period, unless we made a special election to recognize all that built-in gain upon our re-qualification as a RIC and to pay the corporate-level U.S. federal income tax on thatsuch built-in gain.
Coronavirus Aid, Relief and Economic Security Act
In response to the COVID-19 pandemic, the Coronavirus Aid, Relief and Economic Security Act (CARES Act) was signed into law in March 2020. The CARES Act lifts certain deduction limitations originally imposed by the Tax Cuts and Jobs Act of 2017 (2017 Tax Act). The enactment of the CARES Act did not result in any material adjustments to our income tax provision for the year ended March 31, 2020, or to our net deferred tax assets as of March 31, 2020.
Possible Legislative or Other Actions Affecting Tax Considerations
Prospective investors should recognize that the present U.S. federal income tax treatment of an investment in our common stock may be modified by legislative, judicial or administrative action at any time, and that any such action may affect investments and commitments previously made. The rules dealing withgoverning U.S. federal income taxation are constantly under review by persons involved in the legislative process and by the IRS and the U.S. Treasury Department, resulting in revisions of regulations and revised interpretations of established concepts as well as statutory changes. Revisions in U.S. federal tax laws and interpretations thereof could affect the tax consequences of an investment in our common stock. See "Risk Factors – Legislative or other actions relating to taxes could have a negative effect on us."
REGULATION AS A SMALL BUSINESS INVESTMENT COMPANY
SBIC I’s SBIC license allows it to incur leverage by issuing SBA-guaranteed debentures, subject to the issuance of a leverage commitment by the SBA and other customary procedures. SBA regulations currently permit SBIC I to borrow up to $175 million in SBA-guaranteed debentures with at least $87.5 million in regulatory capital (as defined in the SBA regulations), subject to SBA approval. SBA-guaranteed debentures are non-recourse, interest only debentures, with interest payable semi-annually and have a ten-year maturity. The principal amount of SBA-guaranteed debentures is not required to be paid prior to maturity but may be prepaid at any time without penalty. The interest rate of SBA-guaranteed debentures is fixed at the time of issuance at a market-driven spread over U.S. Treasury Notes with ten-year maturities. Receipt of an SBIC license does not assure that SBIC I will receive SBA-guaranteed debenture funding; rather, such funding is dependent upon SBIC I continuing to be in compliance with SBA regulations and policies. The SBA, as a creditor, will have a superior claim to SBIC I’s assets over our shareholders in the event we liquidate SBIC I or the SBA exercises its remedies under the SBA-guaranteed debentures issued by SBIC I upon an event of default.
On August 11, 2021, we received an exemptive order from the SEC to permit us to exclude the senior securities issued by SBIC I or any future SBIC subsidiary of the Company from the definition of senior securities in the asset coverage requirement applicable to the Company under the 1940 Act.
SBICs are designed to stimulate the flow of private investor capital to eligible “small businesses” as defined by the SBA. Under SBA regulations, SBICs may make loans to eligible small businesses, invest in the equity securities of such businesses, and provide them with consulting and advisory services. Under current SBA regulations, eligible small businesses
generally include businesses that (together with their affiliates) have a tangible net worth not exceeding $24.0 million and has average annual net income after U.S. federal income taxes not exceeding $8.0 million (average net income to be computed without benefit of any carryover loss) for the two most recent fiscal years. In addition, an SBIC must invest 25.0% of its investment capital to “smaller enterprises” as defined by the SBA. The definition of a smaller enterprise generally includes a business that (together with its affiliates) has a tangible net worth not exceeding $6.0 million for the most recent fiscal year and has average net income after U.S. federal income taxes not exceeding $2.0 million (average net income to be computed without benefit of any carryover loss) for the two most recent fiscal years. SBA regulations also provide alternative industry size standard criteria to determine eligibility for designation as an eligible small business or a smaller enterprise, which criteria depends on the primary industry in which the business is engaged and is based on the number of employees or gross revenue of the business and its affiliates. However, once an SBIC has invested in an eligible small business, it may continue to make follow-on investments in the company, regardless of the size of the company at the time of the follow-on investment, up to the time of the company's initial public offering, if any.
The SBA generally prohibits an SBIC from providing financing to small businesses with certain characteristics, such as relending or businesses with the majority of their employees located outside the United States, and business engaged in certain prohibited industries, such as project finance, real estate, farmland, financial intermediaries or “passive” (i.e. non-operating) businesses. Without prior SBA approval, an SBIC may not provide financing or a commitment to a small business in an amount equal to more than approximately 30.0% of the SBIC’s regulatory capital in any one company and its affiliates.
The SBA places certain limitations on the financing terms of investments by SBICs in portfolio companies (such as limiting the permissible interest rate on debt securities held by an SBIC in a portfolio company). An SBIC may exercise control over a small business for a period of up to seven years from the date on which the SBIC initially acquires its control position. This control period may be extended for an additional period of time with the SBA's prior written approval.
The SBA restricts the ability of an SBIC to provide financing to an “associate,” as defined in the SBA regulations, without prior written approval from the SBA. SBA regulations also prohibit, without prior SBA approval, a “change of control” or “change in ownership” of transfer of an SBIC (as such terms are defined in the SBA regulations) and require that SBICs invest idle funds in accordance with SBA regulations. In addition, SBIC I may also be limited in its ability to make distributions to us if it does not have sufficient capital, in accordance with SBA regulations.
SBIC I is subject to regulation and oversight by the SBA, including, among other things, requirements with respect to maintaining certain minimum financial ratios and other covenants, a periodic examination by an SBA examiner, and the performance of a financial audit by an independent auditor.
THE NASDAQ GLOBAL SELECT MARKET CORPORATE GOVERNANCE REGULATIONS
The NASDAQ Global Select Market, or Nasdaq, has adopted corporate governance listing standards with which listed companies must comply in order to remain listed. We believe that we are in compliance with these corporate governance listing standards. We intend to monitor our compliance with future listing standards and to take all necessary actions to ensure that we remain in compliance.
SECURITIES EXCHANGE ACT OF 1934 AND SARBANES-OXLEY ACT COMPLIANCE
We are subject to the reporting and disclosure requirements of the Exchange Act, including the filing of quarterly, annual and current reports, proxy statements and other required items. In addition, we are subject to the Sarbanes-Oxley Act of 2002 (the "Sarbanes-Oxley Act") and regulations promulgated thereunder, which imposes a wide variety of regulatory requirements on publicly-held companies and their insiders. For example:
Pursuant•pursuant to Rule 13a-14 ofunder the Exchange Act, our Chief Executive Officer and Chief Financial Officer are required to certify the accuracy of the financial statements contained in our periodic reports;
Pursuant•pursuant to Item 307 of Regulation S-K, our periodic reports are required to disclose our conclusions about the effectiveness of our disclosure controls and procedures;
Pursuant•pursuant to Rule 13a-15 ofunder the Exchange Act, our management is required to prepare a report on its assessment of our internal control over financial reporting, and we engage an independent registered public accounting firm to separately audit our internal control over financial reporting; and
Pursuant•pursuant to Item 308 of Regulation S-K and Rule 13a-15 ofunder the Exchange Act, our periodic reports must disclose whether there were significant changes in our internal control over financial reporting or in other factors that could significantly affect these controls subsequent to the date of their evaluation, including any corrective actions with regard to significant deficiencies and material weaknesses.
Item 1A. Risk Factors
Investing in our securities involves a number of significant risks. In addition to other information contained in this Annual Report on Form 10-K, investors should consider the following information before making an investment in our securities. The risks and uncertainties described below could materially adversely affect our business, financial conditions and results of operations. RisksThe risks set forth below are not the only risks we face. Additional risks and uncertainties not presently known to us, or not presently deemed material by us, also may also impair our operations and performance. If any of the following risks, or risks not presently known to us, actually occur, the trading price of our securities could decline, and you may lose all or part of your investment.
The following is a summary of the principal risk factors associated with an investment in us. Further details regarding each risk included in the below summary list can be found further below.
•Our financial condition and results of operations will depend on our ability to effectively allocate and manage capital.
•Our business model depends to a significant extent upon strong referral relationships. Our inability to maintain or develop these relationships, as well as the failure of these relationships to generate investment opportunities, could adversely affect our business.
•All of our assets are subject to security interests under our secured Credit Facility and if we default on our obligations under the Credit Facility, we may suffer adverse consequences, including foreclosure on our assets.
•In addition to regulatory limitations on our ability to raise capital, our current debt obligations contain various covenants, that, if not complied with, could accelerate our repayment obligations under the Credit Facility—thereby materially and adversely affecting our liquidity, financial condition, results of operations and ability to pay distributions.
•Because we borrow money to make investments, the potential for gain or loss on amounts invested in us is magnified and may increase the risk of investing in us.
•A failure on our part to maintain our status as a BDC would significantly reduce our operating flexibility.
•We will become subject to U.S. federal income tax at corporate rates if we are unable to maintain our qualification as a regulated investment company under Subchapter M of the Code or satisfy regulated investment company distribution requirements.
•Our portfolio investments generally are not publicly traded. As a result, the fair value of these investments may not be readily determinable and will be recorded at fair value as determined in good faith and under the direction of our Board of Directors. As a result, there may be uncertainty as to the value of our portfolio investments.
•We are currently operating in a period of capital markets disruptions and economic uncertainty. Such market conditions may materially and adversely affect debt and equity capital markets, which may have a negative impact on our business, financial condition and results of operations.
•Inflation may adversely affect the business, results of operations and financial condition of our portfolio companies, which may, in turn, impact the valuation of such portfolio companies.
•We operate in a highly competitive market for investment opportunities.
•Our success depends on attracting and retaining qualified personnel in a competitive environment.
•Our investments in portfolio companies involve a number of significant risks.
•SBIC I has an SBIC license and is subject to SBA regulations, and any failure to comply with SBA regulations could have an adverse effect on our operations.
•Rising credit spreads could affect the value of our investments, and rising interest rates make it more difficult for portfolio companies to make periodic payments on their loans.
•The lack of liquidity in our investments may adversely affect our business.
•Defaults by our portfolio companies could harm our operating results.
•We generally will not control our portfolio companies.
•Investing in shares of our common stock may involve an above average degree of risk.
•Shares of closed-end investment companies, including BDCs, may trade at a discount to their NAV.
•The January 2026 Notes and the October 2026 Notes are unsecured and therefore are effectively subordinated to any existing and future secured indebtedness, including indebtedness under our Credit Facility.
•We may not be able to repurchase the January 2026 Notes and the October 2026 Notes upon a Change of Control Repurchase Event.
•If we default on our obligations to pay our other indebtedness, we may not be able to make payments on the January 2026 Notes and the October 2026 Notes.
RISKS RELATED TO OUR BUSINESS AND STRUCTURE
Our financial condition and results of operations will depend on our ability to effectively allocate and manage capital.
Our ability to achieve our investment objective of maximizing risk-adjusted returns to shareholders depends on our ability to effectively allocate and manage capital. Capital allocation depends in part upon our investment team’s ability to identify, evaluate, invest in and monitor companies that meet our investment criteria.
Accomplishing our investment objectives is largely a function of our investment team’s management of the investment process and our access to investments offering attractive risk adjusted returns. In addition, members of our investment team aremay be called upon, from time to time, to provide managerial assistance to some of our portfolio companies.
The results of our operations depend on many factors, including the availability of opportunities for investment, readily accessible shortshort- and long-term funding alternatives in the financial markets and economic conditions. Our ability to make new investments at attractive relative returns is also a function of our marketing and our management of the investment process, as well as conditions in the private credit markets in which we invest. If we fail to invest our capital effectively, our return on equity may be negatively impacted, which could have a material adverse effect on the price of the shares of our common stock.
Any unrealized losses we experience may be an indication of future realized losses, which could reduce our income available to make distributions.
As a BDC, we are required to carry our investments at market value or, if no market valuequotation is ascertainable,readily available, at the fair value as determined in good faith by our Board of DirectorsValuation Committee pursuant to a valuation methodology approved by our Board of Directors. Decreases in the market values or fair values of our investments will be recorded as unrealized losses. An unrealized loss could be an indication of a portfolio company’s inability to generate cash flow or meet its repayment obligations. This could result in realized losses in the future and ultimately in reductions of our income available to pay dividends or interest and principal on our securities and could have a material adverse effect on your investment.
Our business model depends to a significant extent upon strong referral relationships. Our inability to maintaindevelop or developmaintain these relationships, as well as the potential failure of these relationships to generate investment opportunities, could adversely affect our business.
We expect that members of our management team will maintain their relationships with financial sponsors, intermediaries, financial institutions, investment bankers, commercial bankers, financial advisors, attorneys, accountants, consultants and other individuals within our network, and we will rely to a significant extent upon these relationships to provide us with potential investment opportunities. If our management team fails to maintain its existing relationships or develop new relationships with sources of investment opportunities, we will not be able to effectively invest our capital. Individuals with whom members of our management team have relationships are not obligated to provide us with investment opportunities; therefore, there is no assurance that these relationships will generate investment opportunities for us.
All of our assets are subject to security interests under our secured Credit Facility and if we default on our obligations under the Credit Facility, we may suffer adverse consequences, including foreclosure on our assets.
All of our assets are currently pledged as collateral under our Credit Facility. If we default on our obligations under the Credit Facility, the lenders party thereto may have the right to foreclose upon and sell, or otherwise transfer, the collateral
subject to their security interests. In such event, we may be forced to sell our investments to raise funds to repay our outstanding borrowings in order to avoid foreclosure and these forced sales may be at times and at prices we would not consider advantageous. Moreover, such deleveraging of our companythe Company could significantly impair our ability to effectively operate our business in the manner in which we have historically operated. As a result, we could be forced to curtail or cease new investment activities and lower or eliminate the dividends that we have historically paid to our shareholders. In addition, if the lenders exercise their right to sell the assets
pledged under our Credit Facility, such sales may be completed at distressed sale prices, thereby diminishing or potentially eliminating the amount of cash available to us after repayment of the amounts outstanding under the Credit Facility. These distressed prices could be materially below our most recent valuation of each security, which could have a significantly negative effect on NAV.
In addition to regulatory limitations on our ability to raise capital, our current debt obligations contain various covenants, which,that, if not complied with, could accelerate our repayment obligations under the Credit Facility Facility—thereby materially and adversely affecting our liquidity, financial condition, results of operations and ability to pay distributions.
We will have a continuing need for capital to finance our investments. As of March 31, 2020,2023, the Credit Facility provides us with a revolving credit line of up to $325.0$400.0 million of which $154.0$235.0 million was drawn.
The Credit Facility contains customary terms and conditions, including, without limitation, affirmative and negative covenants such as information reporting requirements, minimum consolidated net worth, minimum consolidated interest coverage ratio, minimum asset coverage, and maintenance of RIC tax treatment and BDC status. The Credit Facility also contains customary events of default with customary cure and notice provisions, including, without limitation, nonpayment, misrepresentation of representations and warranties in a material respect, breach of covenants, bankruptcy, and change of control. The Credit Facility permits us to fund additional loans and investments as long as we are within the conditions set out in the Credit Facility.
Our continued compliance with these covenants depends on many factors, some of which are beyond our control, and there are no assurances that we will continue to comply with these covenants. If we breach a covenant under the terms of the Credit Facility and seek a waiver, we may not be able to obtain a waiver from the required lenders. Our failure to satisfy these covenants could result in foreclosure by our lenders, which would accelerate our repayment obligations under the credit facilityCredit Facility and thereby have a material adverse effect on our business, liquidity, financial condition, results of operations, and ability to pay distributions to our shareholders.
Because we borrow money to make investments, the potential for gain or loss on amounts invested in us is magnified and may increase the risk of investing in us.
Borrowings to fund investments, also known as leverage, magnify the potential for loss on investments in our indebtedness and gain or loss on investments in our equity capital. As we use leverage to partially finance our investments, you will experience increased risks of investing in our securities. We may borrow from banks and other lenders, including under our Credit Facility, and may issue debt securities or enter into other types of borrowing arrangements in the future. If the value of our assets decreases, leveraging would cause NAV to decline more sharply than it otherwise would have had we not leveraged our business. Similarly, any decrease in our income would cause net investment income to decline more sharply than it would have had we not leveraged our business. Such a decline could negatively affect our ability to pay common stock dividends, scheduled debt payments or other payments related to our securities. Use of leverage is generally considered a speculative investment technique.
As of March 31, 2020,2023, we had $154.0$235.0 million debt outstanding out of $325$400 million of total commitments under our Credit Facility. Borrowings under the Credit Facility bear interest, on a per annum basis at a rate equal to the applicable LIBOR rate plus 2.50%.2.15% with no LIBOR floor. We pay unused commitment fees of 0.50% to 1.00% per annum, based on utilization, on the unused lender commitments under the Credit Facility. The Credit Facility is secured by substantially all of our assets. If we are unable to meet theour financial obligations under the Credit Facility, the lenders under the Credit Facility may exercise itstheir remedies under the Credit Facility as the result of a default by us. On April 16, 2018 and May 11, 2018, CSWC entered into Incremental Assumption Agreements, which increased the total commitments under the Credit Facility by $20 million and $10 million, respectively. The increases were executed under the accordion feature of the Credit Facility and increased total commitments from $180 million to $210 million. On December 21, 2018, CSWC entered into the Amended and Restated Senior Secured Revolving Credit Agreement (the "Credit Agreement"), and a related Amended and Restated Guarantee, Pledge and Security Agreement, to amend and restate its Credit Facility. The Credit Agreement (1) increased the total commitments by $60 million from $210 million to an aggregate total of $270 million, provided by a diversified group of nine lenders, (2) increased the Credit Facility's accordion feature to $350 million under the Credit Facility from new and existing lenders on the same terms and conditions as the existing commitments, (3) reduced the interest rate on borrowings from LIBOR plus 3.00% to LIBOR plus 2.50%, subject to certain conditions as outlined in the Credit Agreement, (4) reduced the minimum asset coverage with respect to senior securities representing indebtedness from 200% to 150% after the date on which such minimum asset coverage is permitted to be reduced by the Company under applicable law, subject to certain conditions as outlined in the Credit Agreement, and (5) extended the Credit Facility's revolving period from November 16, 2020 to December 21, 2022 and the final maturity was extended from November 16, 2021 to December 21, 2023. On March 19, 2020, CSWC entered into an Incremental Assumption Agreement, which increased the total commitments under the Credit Facility by $30 million, which increased total commitments from $295 million to $325 million.
As of March 31, 2020,2023, the carrying amount of the December 2022January 2026 Notes was $75.8$139.1 million. The December 2022January 2026 Notes mature on December 15, 2022 and may be redeemed in whole or in part at any time, or from time to time, at our option on or after December 15, 2019. The December 2022 Notes bear interest at a rate of 5.95% per year, payable quarterly on March 15, June 15, September 15 and December 15 of each year. The December 2022 Notes are an unsecured obligation, rank pari passu with our other outstanding and future unsecured unsubordinated indebtedness and are effectively subordinated to all of our existing and future secured indebtedness, including borrowings under our Credit Facility.
As of MarchJanuary 31, 2020, the carrying amount of the October 2024 Notes was $73.5 million. The October 2024 Notes mature on October 1, 20242026 and may be redeemed in whole or in part at any time prior to July 1, 2024,October 31, 2025, at par plus a “make-whole”"make-whole" premium, and thereafter at par. The October 2024January 2026 Notes bear interest at a rate of 5.375%4.50% per year, payable semi-annually on April 1January 31 and October 1July 31 of each year, beginning on April 1, 2020.year. The October 2024January 2026 Notes are the direct unsecured obligations of the Company and rank pari passu with our other outstanding and future unsecured unsubordinated indebtedness and are effectively subordinated to all of our existing and future secured indebtedness, including borrowings under our Credit Facility.
As of March 31, 2023, the carrying amount of the October 2026 Notes was $147.3 million. The October 2026 Notes mature on October 1, 2026 and may be redeemed in whole or in part at any time prior to July 1, 2026, at par plus a "make-whole" premium, and thereafter at par. The October 2026 Notes bear interest at a rate of 3.375% per year, payable semi-annually on April 1 and October 1 of each year. The October 2026 Notes are the direct unsecured obligations of the Company and rank pari passu with our other outstanding and future unsecured unsubordinated indebtedness and are effectively subordinated to all of our existing and future secured indebtedness, including borrowings under our Credit Facility.
Our ability to achieve our investment objective may depend in part on our ability to access additional leverage on favorable terms by borrowing from banks or insurance companies or by issuing debt securities and there can be no assurance that such additional leverage can in fact be achieved.
Illustration. The following table illustrates the effect of leverage on returns from an investment in our common stock assuming various annual returns, net of expenses. The calculations in the table below are hypothetical and actual returns may be higher or lower than those appearing below.
Assumed Return on Our Portfolio(1)
(net of expenses)
|
| | | | | | | | | |
| | (10.0)% | | (5.0)% | | 0.0% | | 5.0% | | 10.0% |
Corresponding net return to common shareholder(2) | (27.23)% | | (16.19)% | | (5.74)% | | 5.00% | | 15.74% |
| | | | | | | | | | | | | | | | | | | | | | | | | | | | | |
| | (10.0)% | | (5.0)% | | 0.0% | | 5.0% | | 10.0% |
Corresponding net return to common shareholder(2) | (27.20)% | | (16.55)% | | (5.90)% | | 4.75% | | 15.40% |
| |
(1) | Assumes $585.0 million in total assets, $306.1 million in debt principal outstanding, $272.2 million in net assets and a weighted-average interest rate of 4.82% on our senior securities based on our financial data available on March 31, 2020. Actual interest payments may be different. |
| |
(2) | In order for us to cover our annual interest payments on indebtedness, we must achieve annual returns on our March 31, 2020 total assets of at least 2.67%. |
(1)Assumes $1,257.7 million in total assets, $645.0 million in debt principal outstanding, $590.4 million in net assets and a weighted-average interest rate of 5.27% on our indebtedness based on our financial data available on March 31, 2023. Actual interest payments may be different.
(2)In order for us to cover our annual interest payments on indebtedness, we must achieve annual returns on our March 31, 2023 total assets of at least 2.77%.
If we do not invest a sufficient portion of our assets in qualifying assets, we could fail to qualify as a BDC or be precluded from investing according to our current business strategy.
As a BDC, we are not permitted to acquire any assets other than “qualifying assets” unless, at the time of and after giving effect to such acquisition, at least 70% of our total assets are qualifying assets.
As of March 31, 2020, 88.1%2023, 86.1% of our total assets consistconsisted of qualifying assets. However, we may be precluded from investing in what we believe are attractive investments if those investments are not qualifying assets for purposes of the 1940 Act. Similarly, these rules could prevent us from making follow-on investments in existing portfolio companies, or we could be required to dispose of investments at inopportune or inappropriate times to comply with the 1940 Act (which could result in the dilution of our position). If we need to dispose of investments quickly, it could be difficult to dispose of such investments on favorable terms. We may not be able to find a buyer for such investments and, even if we do find a buyer, we may have to sell the investments at a substantial loss. Any such outcomes could have a material adverse effect on our business, financial condition, results of operations, and cash flows.
A failure on our part to maintain our status as a BDC would significantly reduce our operating flexibility.
If we fail to maintain our status as a BDC, we might be regulated as a closed-end investment company that is required to register under the 1940 Act, which would subject us to additional regulatory restrictions and significantly decrease our operating flexibility. In addition, any such failure could cause an event of default under our outstanding indebtedness, which could have a material adverse effect on our business, financial condition or results of operations.
We will become subject to corporate-level U.S. federal income tax at corporate rates if we are unable to maintain our qualification as a regulated investment company under Subchapter M of the Code or satisfy regulated investment company distribution requirements.
We have elected, and intend to qualify annually, thereafter, to be treated as a RIC under Subchapter M of the Code. No assurance can be given that we will be able to maintain our qualification as a RIC. To maintain RIC tax treatment under the Code, we must meet the following annual distribution, income source and asset diversification requirements:
•The annual distribution requirement for a RIC is generally satisfied if we timely distribute to our shareholders on an annual basis at least 90% of our net ordinary income and realized short-term capital gains in excess of realized net long-term capital losses. Depending on the level of taxableWe will be subject to U.S. federal income earned in a tax, year, we may choose to carry forward taxable income in excess of current year distributions into the next year and paypossibly a 4% U.S. federal excise tax, on such income. Any such carryover taxableany income mustthat we do not timely distribute to our shareholders. Our U.S. federal income tax liability may be distributed through a dividend declared prior to filing the final tax return relatedreduced to the extent that we make certain distributions during the following calendar year that generated such taxable income.and satisfy other procedural requirements.
•The source of income requirement is satisfied if we obtain at least 90% of our gross income for each taxable year from dividends, interest, payments with respect to certain securities loans, gains from the sale or other disposition of stock or other securities or foreign currencies or other income derived with respect to our business of investing in such stock, securities or currencies and net income derived from an interest in a “qualified publicly traded partnership” (as defined in the Code), or the 90% Income Test.
•The asset diversification requirement is satisfied if we meet certain asset diversification requirements at the end of each quarter of our taxable year. To satisfy this requirement, at least 50% of the value of our assets must consist of cash, cash equivalents, U.SU.S. Government securities, securities of other RICs, and other securities if such other securities of any one issuer do not represent more than 5% of the value of our assets or more than 10% of the outstanding voting securities of the issuer (which for these purposes includes the equity securities of a “qualified publicly traded partnership”). In addition, no more than 25% of the value of our assets can be invested in (i) the securities, other than U.S Government securities or securities of other RICs, (1) of one issuer (2)issuer; (ii) the securities, other than securities of other RICs, of two or more issuers that are controlled, as determined under applicable tax rules, by us and that are engaged in the same or similar or related trades or businessesbusinesses; or (3)(iii) the securities of one or more “qualified publicly traded partnerships,” or the Diversification Tests.
Failure to meet these requirements may result in us having to dispose of certain unqualified investments quickly in order to prevent the loss of RIC tax treatment. If we fail to maintain RIC tax treatment for any reason and are subject to corporate-level U.S. federal income tax, the resulting corporate-level taxes could substantially reduce our net assets, the amount of income available for distribution and the amount of our distributions. In addition, to the extent we hadhave unrealized gains, we would have to establish deferred tax liabilities, for taxes, which would reduce our NAV accordingly. In addition, our shareholders would lose the tax credit realized when we, as a RIC, decide to retain the net realized capital gain and make deemed distributions of net realized capital gains, and pay taxes on behalf of our shareholders at the end of the tax year. The loss of this pass-through tax treatment could have a material adverse effect on the total return of an investment in our common stock.
Even if the Company qualifies as a regulated investment company, it may face tax liabilities that reduce its cash flow.
Even ifIf we qualify for taxation as a RIC under the Code, we maygenerally will not be subject to certain U.S. federal, state and local taxes on our income and assets. In addition, we may hold some of our assets through our Taxable Subsidiary, which is not consolidated for U.S. federal income tax purposes, or any other taxable subsidiaryon income that we may form. Any taxes paid by our subsidiary corporations would decrease the cash available for distributiontimely distribute to our shareholders.shareholders as dividends. Income derived through the Taxable Subsidiary will be subject to U.S. federal income tax at corporate rates without regard to the Annual Distribution Requirement.
A substantial portion of ourOur portfolio investments generally are not publicly traded. As a result, the fair value of these investments may not be readily determinable and will be recorded at fair value as determined in good faith and underby the directionValuation Committee, subject to the oversight of our Board of Directors. As a result, there may be uncertainty as to the value of our portfolio investments.
Under the 1940 Act, we are required to carry our portfolio investments at market value or, if there is no readily available market value,quotation, at fair value as determined in good faith by us, withthe Valuation Committee, subject to the oversight of our Board of Directors having final responsibility for overseeing, reviewing and approving, in good faith, our fair value determination.Directors. Typically, there is not a public market for the securities of the privately held companies in which we have invested and will continue to invest. As a result, we valuethe Valuation Committee values these securities quarterly at fair value based on inputs from management and our investment team along withand our third-party valuation firms, subject to the oversight review and approval of our Board of Directors.
The determination of fair value and, consequently, the amount of unrealized gains and losses in our portfolio are, to a certain degree, subjective and dependent on aour valuation process approved by our Board of Directors.process. Certain factors that may be considered in determining the fair value of our investments include external events, such as private mergers, sales and acquisitions involving comparable companies. Because of the inherent uncertainty of the valuation of portfolio securities that do not have readily ascertainableavailable market values,quotations, our fair value determinations may differ materially from the values a third party would be
willing to pay for our portfolio securities or the values whichthat would be applicable to unrestricted securities having a public market. Due to this uncertainty, our fair value determinations may cause our NAV on a given date to materially understate or overstate the value that we may ultimately realize on one or more of our investments. As a result, investors purchasing our common stock based on an overstated NAV may pay a higher price than the value of our investments might warrant. Conversely, investors selling
shares during a period in which the NAV understates the value of our investments may receive a lower price for their shares than the value of our investments might warrant.
We are currently operating in a period of capital markets disruptions and economic uncertainty. Such market conditions may materially and adversely affect debt and equity capital markets, which may have a negative impact on our business, financial condition and results of operations.
From time to time, capital markets may experience periods of disruption and instability. The U.S. capital markets have experienced extreme volatility and disruption following the global outbreak of coronavirus (“COVID-19”)COVID-19 that began in December 2019. Some economists2019 and major investment banks have expressed concernthe conflict between Russia and Ukraine that began in late February 2022 (see "Terrorist attacks, acts of war or natural disasters may affect any market for our common stock, impact the continued spread of the COVID-19 globally could lead to a world-wide economic downturn.business in which we invest and harm our business, operating results and financial condition" for more information). Even after the COVID-19 pandemic subsides, the U.S. economy, as well as most other major economies, may continue to experience a recession, and we anticipate our businesses would be materially and adversely affected by a prolonged recession in the United States and other major markets. Disruptions in the capital markets have increased the spread between the yields realized on risk-free and higher risk securities, resulting in illiquidity in parts of the capital markets.
The economic conditions caused by the COVID-19 outbreak is having, and any future outbreakspandemic could have, an adverse impact on the ability of lenders to originate loans, the volume and type of loans originated, the ability of borrowers to make payments and the volume and type of amendments and waivers granted to borrowers and remedial actions taken in the event of a borrower default, each of which could negatively impact the amount and quality of loans available for investment by the Company and returns to the Company, among other things. With respect to the U.S. credit markets (in particular for middle-market loans), the COVID-19 outbreak has resulted in, and until fully resolved is likely to continue to result in, the following, among other things: (i) increased draws by borrowers on revolving lines of credit and other financing instruments; (ii) increased requests by borrowers for amendments and waivers of their credit agreements to avoid default, increased defaults by such borrowers and/or increased difficulty in obtaining refinancing at the maturity dates of their loans; and (iii) greater volatility in pricing and spreads and difficulty in valuing loans during periods of increased volatility;volatility and (iv) rapidly evolving proposals and/or actions by state and federal governments to address problems being experienced by the markets and by businesses and the economy in general which will not necessarily adequately address the problems facing the loan market and middle-market businesses.liquidity issues. These and future market disruptions and/or illiquidity could have an adverse effect on our business, financial condition, results of operations and cash flows. Unfavorable economic conditions also could increase our funding costs, limit our access to the capital markets or result in a decision by lenders not to extend credit to us. These events could limit our investment originations limitand our ability to grow and could also have a material negative impact on our operating results and the fair values of our debt and equity investments. We may have to access, if available, alternative markets for debt and equity capital, and a severe disruption in the global financial markets, deterioration in credit and financing conditions or uncertainty regarding U.S. government spending and deficit levels or other global economic conditions could have a material adverse effect on our business, financial condition and results of operations.
Past economic downturns or recessions have had a significant negative impact on the operating performance and fair value of middle market companies. For example, between 2008 and 2009, the U.S. and global capital markets were unstable, as evidenced by periodic disruptions in liquidity in the debt capital markets, significant write-offs in the financial services sector, the re-pricing of credit risk in the broadly syndicated credit market and the failure of major financial institutions. Despite actions of the U.S. federal government and foreign governments, these events contributed to worsening general economic conditions that materially and adversely impacted the broader financial and credit markets and reduced the availability of debt and equity capital for the market as a whole and financial services firms in particular.
Equity capital may be difficult to raise during periods of adverse or volatile market conditions because, subject to some limited exceptions, as a BDC, we are generally not able to issue additional shares of our common stock at a price less than NAV without first obtaining approval for such issuance from our shareholders and our directors who are not "interested persons" (as such term is used under Section 2(a)(19) of the 1940 Act) of the Company, or independent directors. Volatility and dislocation in the capital markets can also create a challenging environment in which to raise or access debt capital. If the current market conditions (which are similar to those experienced from 2008 through 2009,2009) continue for any substantial length of time, it could make it difficult to refinance or extend the maturity of or refinance our existing indebtedness or obtain new indebtedness with similar terms and any failure to do so could have a material adverse effect on our business. The debt capital that will be available to us in the future, if at all, may be at a higher cost and on less favorable terms and conditions than what we currently experience, including being at a higher cost in a rising interest rate environment. If any of these conditions appear, they may have an adverse effect on our business, financial condition, and results of operations. These events could limit our investment originations, limit our ability to increase returns to equity holders through the effective use of leverage, and negatively impact our operating results.
In addition, significant changes or volatility in the capital markets may also have a negative effect on the valuations of our investments. While most of our investments are not publicly traded, applicable accounting standards require us to assume as
part of our valuation process that our investments are sold in a principal market to market participants (even if we plan on holding an investment through its maturity). Significant changes in the capital markets may also affect the pace of our investment activity and the potential for liquidity events involving our investments. Thus, the illiquidity of our investments may make it difficult for us to sell our investments to access capital if required, and as a result, we could realize significantly less than the value at which we have recorded our investments if we were required to sell them for liquidity purposes. An inability to raise or access capital could have a material adverse effect on our business, financial condition or results of operations.
Government authorities worldwide have taken increased measures to stabilize the markets and support economic growth. The success of these measures is unknown and they may not be sufficient to address the market dislocations or avert severe and prolonged reductions in economic activity.
We also facedface an increased risk of investor, creditor or portfolio company disputes, litigation, and governmental and regulatory scrutiny as a result of the effects of COVID-19 on economic and market conditions.
Events outside of our control, including public health crises,such as the COVID-19 pandemic, could negatively affect our portfolio companies and our results of our operations.operations and financial condition.
Periods of market volatility have occurred and could continue to occur in response to pandemics or other events outside of our control. These types of events have adversely affected affected—and could continue to adversely affect affect—operating results for us and for our portfolio companies. The recent outbreakFor example, the COVID-19 pandemic has led to, and for an unknown period of COVID-19time will continue to lead to, disruptions in many countries,local, regional, national and global markets and the economies affected thereby, including the United States, continuesStates. With respect to adversely impactU.S. and global commercial activitycredit markets and has contributedthe economy in general, the COVID-19 pandemic and preventative measures taken to significant volatility in financial markets. COVID-19contain or mitigate its spread quicklyhave caused, and has been identified as a global pandemic by the World Health Organization. In response, governmental authorities have imposedare continuing to cause, business shutdowns, cancellations of events and restrictions on travel, significant reductions in demand for certain goods and the temporary closureservices, reductions in business activity and financial transactions, supply chain disruptions, labor difficulties and shortages, commodity inflation and elements of many corporate offices, retail stores, restaurants, fitness clubseconomic and manufacturing facilities and factories in affected jurisdictions, including, beginning in March 2020,financial market instability in the United States.States and globally. Such effects will likely continue for the duration of the pandemic, for some period thereafter. COVID-19 and the resulting economic dislocations have had adverse consequences for the business operations and financial performance of some of our portfolio companies, which may, in turn, impact the valuation of our investments and have adversely affected, and threaten to continue to adversely affect, our operations. Local, state and federal and numerous non-U.S. governmental authorities have imposed travel restrictions, business closures and other quarantine measures on service providers and other individuals that remain in effect on the date of this Annual Report on Form 10-K. COVID-19 has caused the effective cessation of all business activity deemed non-essential by such governmental authorities. We cannot predict the full impact of COVID-19, including the duration of the closures and restrictions described above. As a result, we are unable to predict the duration of these business and supply-chainsupply chain disruptions, the extent to which the economic conditions caused by COVID-19 will negatively affect our portfolio companies’ operating results or the impact that such disruptions may have on our results of operations and financial condition. With respect to loans to portfolio companies, the Company will be impacted if, among other things, (i) amendments and waivers are granted (or are required to be granted) to borrowers permitting deferral of loan payments or allowing for PIK interest payments, (ii) borrowers default on their loans, are unable to refinance their loans at maturity, or go out of business, or (iii) the value of loans held by the Company decreases as a result of such events and the uncertainty they cause. Portfolio companies may also be more likely to seek to draw on unfunded commitments we have made, and the risk of being unable to fund such commitments is heightened during such periods.
Depending on the duration and extent of the disruption to the business operations of our portfolio companies, we expect some portfolio companies, particularly those in vulnerable industries, to experience financial distress and possibly to default on their financial obligations to us and/or their other capital providers. In addition, if such portfolio companies are subjected to prolonged and severe financial distress, we expect some of them to substantially curtail their operations, defer capital expenditures, and lay off workers. These developments would be likely to permanently impair their businesses and result in a reduction in the value of our investments in them.
Global economic, political, regulatory Any potential impact to our results of operations will depend, to a large extent, on future developments and new information that could emerge regarding the duration and severity of the COVID-19 pandemic and the actions taken by authorities and other entities to contain the spread or treat its impact, all of which are beyond our control. These potential impacts, while uncertain, could adversely affect our and our portfolio companies’ operating results and financial conditions, including uncertainty about the financial stability of the United States,condition.
Inflation may adversely affect ourthe business, results of operations and financial condition of our portfolio companies, which may, in turn, impact the valuation of such portfolio companies.
Certain of our portfolio companies may be impacted by inflation, which may, in turn, impact the valuation of such portfolio companies. If such portfolio companies are unable to pass any increases in their costs along to their customers, it could adversely affect their results and their ability to pay interest and principal on our loans, particularly if interest rates rise in response to inflation. In addition, any projected future decreases in our portfolio companies’ operating results due to inflation could adversely impact the fair value of those investments. Any decreases in the fair value of our investments could result in future unrealized losses and therefore reduce our net assets resulting from operations.
Political, social and economic uncertainty creates and exacerbates risks.
Social, political, economic and other conditions and events (such as natural disasters, epidemics and pandemics, terrorism, conflicts and social unrest) could occur, potentially creating uncertainty and significantly impacting issuers, industries, governments and other systems, including the financial markets, to which companies and their investments are exposed. As global systems, economies and financial markets are increasingly interconnected, events that once had only local impact are now more likely to have regional or even global effects. Events that occur in one country, region or financial market will, more frequently, adversely impact issuers in other countries, regions, or markets, including in established markets, such as the United States. These impacts can be exacerbated by failures of governments and societies to adequately respond to an emerging event or threat.
Uncertainty can result in or coincide with other phenomena, including, among other things: increased volatility in the financial markets for securities, derivatives, loans, credit and currency; a decrease in the reliability of market prices and difficulty in valuing assets (including portfolio company assets); greater fluctuations in spreads on debt investments and currency exchange rates; increased risk of default (by both government and private obligors and issuers); further social, economic, and political instability; nationalization of private enterprise; greater governmental involvement in the economy or in social factors that impact the economy; changes to governmental regulation and supervision of the loan, securities, derivatives and currency markets and market participants and decreased or revised monitoring of such markets by governments or self-regulatory organizations and reduced enforcement of regulations; limitations on the activities of investors in such markets; controls or restrictions on foreign investment, capital controls and limitations on repatriation of invested capital; the significant loss of liquidity and the inability to purchase, sell and otherwise fund investments or settle transactions (including, but not limited to, a market freeze); unavailability of currency hedging techniques; substantial, and in some periods extremely high, rates of inflation, which can last many years and have substantial negative effects on credit and securities markets as well as the economy as a whole; economic recessions or downturns; and difficulties in obtaining and/or enforcing legal judgments.
Following the November 2022 elections in the United States, the Democratic Party controls the Presidency and the Senate, with the Republican Party controlling the House of Representatives. Despite political tensions and uncertainty in a divided legislature, changes in federal policy, including tax policies, and at regulatory agencies may occur over time through policy and personnel changes, which can lead to changes involving the level of oversight and regulation of the financial services industry as well as changes in tax rates. The nature, timing and economic and political effects of potential changes to the current legal and regulatory framework affecting financial institutions remain highly uncertain.
Although it is impossible to predict the precise nature and consequences of these events, or of any political or policy decisions and regulatory changes occasioned by emerging events or uncertainty on applicable laws or regulations that impact us, our revenue growthportfolio companies and our investments, it is clear that these types of events are impacting us and our portfolio companies and will, for at least some time, continue to impact us and our portfolio companies; further, in many instances, the impact will be adverse and profound.
The effect of global climate change may impact the operations and valuation of our portfolio companies.
Climate change creates physical and financial risk and some of our portfolio companies may be adversely affected by climate change. For example, the needs of customers of energy companies vary with weather conditions, primarily temperature and humidity. To the extent weather conditions are affected by climate change, energy use could increase or decrease depending on the duration and magnitude of any changes. Increases in the cost of energy could adversely affect the cost of operations of our portfolio companies if the use of energy products or services is material to their business. A decrease in energy use due to weather changes may affect some of our portfolio companies’ financial condition through, for example, decreased revenues, which may, in turn, impact the valuation of such portfolio companies. Extreme weather conditions in general require more system backup, adding to costs, and can contribute to increased system stresses, including service interruptions.
In December 2015, the United Nations adopted a climate accord (the “Paris Agreement”), which the United States rejoined in 2021, with the long-term goal of limiting global warming and the short-term goal of significantly reducing greenhouse gas emissions. Additionally, the Inflation Reduction Act of 2022 included several measures designed to combat climate change, including restrictions on methane emissions. As a result, some of our portfolio companies may become subject to new or strengthened regulations or legislation, which could increase their operating costs and/or decrease their revenues, which may, in turn, impact their ability to make payments on our investments.
Environmental, social and governance factors may adversely affect our business or cause us to alter our business strategy.
Our business faces increasing public scrutiny related to environmental, social and governance (“ESG”) activities. We risk damage to our brand and reputation if we fail to act responsibly in a number of areas, such as environmental stewardship, corporate governance and transparency. Adverse incidents with respect to ESG activities could impact the value of our brand, the cost of our operations and relationships with investors, all of which could adversely affect our business and results of operations. Additionally, new regulatory initiatives related to ESG could adversely affect our business. For example, the SEC has announced that it may require disclosure of certain ESG-related matters. At this time, there is uncertainty regarding the scope of such proposals or when they would become effective (if at all). Compliance with any new laws or regulations increases our regulatory burden and could make compliance more difficult and expensive, affect the manner in which we or our prospective portfolio companies conduct our businesses and adversely affect our profitability.
Downgrades byof the U.S. credit rating, automatic spending cuts, or another government shutdown could negatively impact our liquidity, financial condition, and results of operations.
U.S. debt ceiling and budget deficit concerns have increased the possibility of credit-rating downgrades, or a recession in the U.S. Although U.S. lawmakers have passed legislation to raise the federal debt ceiling on multiple occasions, including in December 2021, ratings agencies have threatened to lower the long-term sovereign credit rating on the United States. The impact of the increased debt ceiling and/or downgrades to the U.S. government’s sovereign credit rating or concerns about its creditperceived creditworthiness could adversely affect the U.S. and deficit levels in generalglobal financial markets and economic conditions. Absent further quantitative easing by the Federal Reserve, these developments could cause interest rates and borrowing costs to rise, which may negatively impact both the perception of credit risk associated with our debt portfolio and our ability to access the debt markets on favorable terms. In addition, a decreased U.S. government credit rating could create broader financial turmoil and uncertainty, which may weigh heavily on our financial performance and the value of our common stock.
The Chinese capital markets have also experienced periods of instability over the past several years. The current political climate has also intensified concerns about a potential trade war between the U.S. and China in connection with each country’s
recent or proposed tariffs on the other country’s products. These market and economic disruptions and the potential trade war with China have affected, and may in the future affect, the U.S. capital markets, which could adversely affect our business, financial condition or results of operations.
Deterioration in the economic conditions in the Eurozone and globally, including instability in financial markets, may pose a risk to our business. In recent years, financial markets have been affected at times by a number of global macroeconomic and political events, including the following: large sovereign debts and fiscal deficits of several countries in Europe and in emerging markets jurisdictions, levels of non‑performing loans on the balance sheets of European banks, the potential effect of any European country leaving the Eurozone, the potential effect of the United Kingdom leaving the European Union, and market volatility and loss of investor confidence driven by political events. Market and economic disruptions have affected, and may in the future affect, consumer confidence levels and spending, personal bankruptcy rates, levels of incurrence and default on consumer debt and home prices, among other factors. We cannot assure you that market disruptions in Europe, including the increased cost of funding for certain governments and financial institutions, will not impact the global economy, and we cannot assure you that assistance packages will be available, or if available, be sufficient to stabilize countries and markets in Europe or elsewhere affected by a financial crisis. To the extent uncertainty regarding any economic recovery in Europe negatively impacts consumer confidence and consumer credit factors, our business, financial condition and results of operations could be significantly and adversely affected.
The current global financial market situation, as well as various social and political tensions in the United States and around the world (including wars and other forms of conflict, terrorist acts, security operations and catastrophic events such as fires, floods, earthquakes, tornadoes, hurricanes and global health epidemics), may contribute to increased market volatility and economic uncertainties or deterioration in the United States and worldwide. Additionally, the U.S. government's credit and deficit concerns, the European sovereign debt crisis, and the potential trade war with China could cause interest rates to be volatile, which may negatively impact our ability to access the debt markets on favorable terms.
The Republican Party currently controlsIn addition, disagreement over the executive branchfederal budget has caused the U.S. federal government to shut down for periods of time resulting in, among other things, inadequate funding for and/or the shutdown of certain government agencies, including the SEC and the Senate portionSBA, on which the operation of our business may rely. Inadequate funding for and/or the legislative branch of government, which increases the likelihood that legislation may be adopted that could significantly affect the regulation of U.S. financial markets. Areas subject to potential change, amendment or repeal include the Dodd-Frank Wall Street Reform and Consumer Protection Act and the authority of the Federal Reserve and the Financial Stability Oversight Council. For example, in March 2018, the U.S. Senate passed a bill that eased financial regulations and reduced oversight for certain entities. We cannot predict the effectsshutdown of these or similar eventsother government agencies prevents them from performing their normal business functions, which could impact, among other things, (i) our and our portfolio companies’ ability to access the public markets and obtain necessary capital in order to, among other things, properly capitalize, continue or expand operations, or, in the future oncase of portfolio investments held by us, liquidate such investments; (ii) the ability for SBIC I to originate loans; and (iii) the ability of other governmental agencies to timely review and process regulatory submissions of our portfolio companies, as applicable. Continued adverse political and economic conditions, including a prolonged U.S. economy and securities markets or on our investments. We monitor developments and seek to manage our investments in a manner consistent with achieving our investment objective, but there can be no assurance that we will be successful in doing so.
Significant developments stemming from the United Kingdom’s referendum on membership in the European Unionfederal government shutdown, could have a material adverse effect on our business, financial condition and results of operations.
Our business is dependent on bank relationships and recent strain on the banking system may adversely impact us.
In June 2016,The financial markets recently have encountered volatility associated with concerns about the United Kingdom held a referendum inbalance sheets of banks, especially small and regional banks that may have significant losses associated with investments that make it difficult to fund demands to withdraw deposits and other liquidity needs. Although the federal government has announced measures to assist these banks and protect depositors, some banks have already been impacted and others may be materially and adversely impacted. Our business is dependent on bank relationships, including small and regional banks, and we are proactively monitoring the financial health of banks with which a majority of voters voted in favor of Brexit, and, subsequently, on March 29, 2017, the U.K. government began the formal process of leaving the European Union. The United Kingdom formally left the European Union on January 31, 2020 and immediately entered a transition period set to expire on December 31, 2020. Brexit has created political and economic uncertainty, particularly in the United Kingdom and the European Union, and this uncertaintywe (or our portfolio companies) do or may last for years. Events that could occur in the future as a consequencedo business. To the extent that our portfolio companies work with banks that are negatively impacted by the foregoing, such portfolio companies’ ability to access their own cash, cash equivalents and investments may be threatened. In addition, such affected portfolio companies may not be able to enter into new banking arrangements or credit facilities or receive the benefits of the United Kingdom’s withdrawal, including the possible breakup of the United Kingdom, may continue to cause significant volatility in globaltheir existing banking arrangements or credit facilities. Any such developments could harm our business, financial markets, including in global currencycondition, and credit markets. This volatility could cause a slowdown in economic activity in the United Kingdom, Europe or globally, which could adversely affect our operating results, and growth prospects. Any of these effects of Brexit, and others we cannot anticipate, could have unpredictable consequences for credit markets andprevent us from fully implementing our investment plan. Continued strain on the banking system may adversely affectimpact our business, financial condition and results of operations and financial performance.operations.
Changes in the laws or regulations governing our business or the operations of our portfolio companies, changes in the interpretations thereof or of newly enacted laws or regulations, and any failure by us to comply with these laws or regulations could require changes to certain business practices of us or our portfolio companies, negatively affect the profitability of the operations, cash flows or financial condition of us or our portfolio companies, impose additional costs on us or our portfolio companies or otherwise adversely affect our business or the business of our portfolio companies.
We are subject to federal, state and local laws and regulations and are subject to judicial and administrative decisions that affect our operations, including our loan originations, maximum interest rates, fees and other charges, disclosures to portfolio companies, the terms of secured transactions, collection and foreclosure procedures and other trade practices. These laws and regulations, as well as their interpretation, may be changed from time to time, and new laws and regulations may be enacted. Any change in the laws or regulations, the interpretations of thesuch laws and regulations, or newly enacted laws or
regulations could require changes to certain business practices ofused by us or our portfolio companies, negatively impact the operations, cash flows or financial
condition of us or our portfolio companies, impose additional costs on us or our portfolio companies or otherwise adversely affect our business or the business of our portfolio companies. In addition, if we do not comply with applicable laws, regulations and decisions, we may lose licenses needed for the conduct of our business andand/or be subject to civil fines and criminal penalties, any of which could have a material adverse effect upon our business, results of operations or financial condition.
We operate in a highly competitive market for investment opportunities.
We compete for attractive investment opportunities with other financial institutions, including BDCs, junior capital lenders, and banks. Some of these competitors are substantially larger and have greater financial, technical and marketing resources, and some are subject to different, and frequently less stringent, regulations. Our competitors may have a lower cost of funds and may have access to funding sources that are not available to us. Furthermore, many of our competitors are not subject to the regulatory restrictions that the 1940 Act imposes on us as a BDC and the Code imposes on us as a RIC. As a result of this competition, we may not be able to take advantage of attractive investment opportunities from time to time, and there can be no assurance that we will be able to identify and make investments that satisfy our objectives. A significant increase in the number and/or size of our competitors in our target market could force us to accept less attractive investment terms, which may impact our return on these investments. We cannot assure you that the competitive pressures we face will not have a materially adverse effect on our business, financial condition and results of operation.
Adverse market and economic conditions could cause harm to our operating results.
Past economic downturns or recessions have had a significant negative impact on the operating performance and fair value of many middle market companies. Many of our portfolio companies could be adversely impacted again by any future economic downturn or recession and may be unable to be sold at a price that would allow us to recover our investment, or may be unable to operate during a recession. See “The capital markets may experience periods of disruption and instability. Such market conditions may materially and adversely affect debt and equity capital markets, which may have a negative impact on our business, financial condition and operations.” Such portfolio company performance could have a material adverse effect on our business, financial condition and results of operations.
Our success depends on attracting and retaining qualified personnel in a competitive environment.
Sourcing, selecting, structuring and closing our investments depends upon the diligence and skill of our management. Our management’s capabilities may significantly impact our results of operations. Our success requires that we retain investment and operations personnel in a competitive environment. Our ability to attract and retain personnel with the requisite credentials, experience and skills depends on several factors, including, but not limited to, our ability to offer competitive wages, benefits and professional growth opportunities. Many of the entities, including investment funds (such as private equity funds and debt funds) and traditional financial services companies, with which we compete for experienced personnel have greater resources than we have.
The competitive environment for qualified personnel may require us to take certain measures to ensure that we are able to attract and retain experienced personnel. Such measures may include increasing the attractiveness of our overall compensation packages, altering the structure of our compensation packages through the use of additional forms of compensation or other steps. The inability to attract and retain experienced personnel could potentially have an adverse effect on our business.
Effective April 25, 2019, our asset coverage requirement was reduced from 200% to 150%, which could increase the risk of investing in the Company.
The 1940 Act generally prohibits BDCs from incurring indebtedness unless immediately after such borrowing it has an asset coverage for total borrowings of at least 200% (i.e., the amount of debt may not exceed 50% of the value of our total assets). However, on March 23, 2018, the SBCAA was signed into law, which included various changes to regulations under the federal securities laws that impact BDCs. The SBCAA included changes to the 1940 Act to allow BDCs to decrease their asset coverage requirement from 200% to 150%, if certain requirements are met. On April 25, 2018, the Board of Directors, including a “required majority” (as such term is defined in Section 57(o) of the 1940 Act) of the Board of Directors, approved the application of the modified asset coverage requirements set forth in Section 61(a)(2) of the 1940 Act. As a result, the minimum asset coverage ratio applicable to the Company was decreased from 200% to 150%, which became effective April 25, 2019. Additionally, the Board of Directors also approved a resolution whichthat limits the Company’s issuance of senior securities such that the asset coverage ratio, taking into account such issuance, would not be less than 166%, at any time after the effective date. We are required to make certain disclosures on our website and in SEC filings regarding, among other things, the receipt of approval to reduce its asset coverage requirement to 150%, its leverage capacity and usage, and risks related to leverage. In addition, on August 11, 2021, we received an exemptive order from the SEC to permit us to exclude the senior securities issued by SBIC I or any future SBIC subsidiary of the Company from the definition of senior securities in the asset coverage requirement applicable to the Company under the 1940 Act.
Leverage is generally considered a speculative investment technique and increases the risk of investing in our securities. Leverage magnifies the potential for loss on investments in our indebtedness and on invested equity capital. As we use leverage
to partially finance our investments, you will experience increased risks of investing in our securities. If the value of our assets increases, then leveraging would cause the NAV attributable to our common stock to increase more sharply than it
would have had we not leveraged. Conversely, if the value of our assets decreases, leveraging would cause NAV to decline more sharply than it otherwise would have had we not leveraged our business. Similarly, any increase in our income in excess of interest payable on the borrowed funds would cause our net investment income to increase more than it would without the leverage, while any decrease in our income would cause net investment income to decline more sharply than it would have had we not borrowed. Such a decline could negatively affect our ability to pay common stock dividends, scheduled debt payments or other payments related to our securities. If we incur additional leverage, you will experience increased risks of investing in our common stock.
EffortsWe expend significant financial and other resources to comply with the Sarbanes-Oxley Act involve significant expenditures, and non-compliance with the Sarbanes-Oxley Act may adversely affect us.requirements of being a public company.
WeAs a public entity, we are subject to the Sarbanes-Oxleyreporting requirements of the Exchange Act and requirements of 2002, or the Sarbanes-Oxley Act and the related rules and regulations promulgated by the SEC. Among other requirements, under Section 404 of theThe Exchange Act requires that we file annual, quarterly and current reports with respect to our business and financial condition. The Sarbanes-Oxley Act requires that we maintain effective disclosure controls and rulesprocedures and regulations of the SEC thereunder, our management is required to report on our internal controls over financial reporting. We are requiredIn order to review on an annual basismaintain and improve the effectiveness of our disclosure controls and procedures and internal controls, over financial reporting,significant resources and on a quarterly and annual basis to evaluate and disclose significant changes in our internal controls over financial reporting.management oversight are required. We have implemented procedures, processes, policies and expectpractices for the purpose of addressing the standards and requirements applicable to continue to incur significant expenses related to compliance with the Sarbanes-Oxley Act, which will negatively impact our financial performance and our ability to make distributions. In addition, this process results in a diversion ofpublic companies. These activities may divert management’s time and attention. In the event that we are unable to maintain compliance with the Sarbanes-Oxley Actattention from other business concerns, which could have a material adverse effect on our business, financial condition, results of operations and related rules, we may be adversely affected.cash flows.
Our ability to enter into transactions with our affiliates is restricted.
We are prohibited under the 1940 Act from participating in certain transactions with certain of our affiliates without the prior approval of our independent directors and, in some cases, the SEC. Any person that owns, directly or indirectly, 5% or more of our outstanding voting securities is our affiliate for purposes of the 1940 Act, and we generally are prohibited from buying or selling any security from or to an affiliate, absent the prior approval of our independent directors. The 1940 Act also prohibits certain “joint” transactions with certain of our affiliates, which could include investments in the same portfolio company (whether at the same or different times), without prior approval of our independent directors and, in some cases, the SEC. If a person acquires more than 25% of our voting securities, we are prohibited from buying or selling any security from or to that person or certain of that person’s affiliates, or entering into prohibited joint transactions with that person, absent the prior approval of the SEC. Similar restrictions limit our ability to transact business with our officers or directors or their affiliates.
Regulations governing our operation as a BDC will affect our ability to, and the way in which we, raise additional capital.
Our business will requirerequires capital to operate and grow. We may acquire such additional capital from the following sources:
Senior Securities. We may issue debt securities, preferred stock and/or borrow money from banks or other financial institutions, which we refer to collectively as senior securities. As a result of issuing senior securities, we will be exposed to additional risks, including the following:
•Under the provisions of the 1940 Act and effective April 25, 2019, we are permitted, as a BDC, to issue senior securities only in amounts such that our asset coverage, as defined in the 1940 Act, equals at least 150% immediately after each issuance of senior securities. In accordance with the 1940 Act, on April 25, 2018, our Board of Directors, including a “required majority” (as such term is defined in Section 57(o) of the 1940 Act) of our Board of Directors, approved the application of the modified asset coverage requirements set forth in Section 61(a)(2) of the 1940 Act. As a result, the minimum asset coverage ratio applicable to the Company was decreased from 200% to 150%, effective April 25, 2019. The Board also approved a resolution whichthat limits the Company's issuance of senior securities such that the asset coverage ratio, taking into account such issuance, would not be less than 166%, at any time after the effective date. In addition, on August 11, 2021, we received an exemptive order from the SEC to permit us to exclude the senior securities issued by SBIC I or any future SBIC subsidiary of the Company from the definition of senior securities in the asset coverage requirement applicable to the Company under the 1940 Act. If the value of our assets declines, we may be unable to satisfy this requirement. If that happens, we will be prohibited from issuing debt securities and/or borrowing money from banks or other financial institutions and may not be permitted to declare a dividend or make any distribution to shareholders or repurchase shares until such time as we satisfy this test.
•Any amounts that we use to service our debt will not be available for dividends to our common shareholders.
•It is likely that any senior securities or other indebtedness we issue will be governed by an indenture or other instrument containing covenants restricting our operating flexibility. Additionally, some of these securities or other indebtedness may be rated by rating agencies, and in obtaining a rating for such securities and other indebtedness, we may be required to abide by operating and investment guidelines that further restrict operating and financial flexibility.
•We and, indirectly, our shareholders will bear the cost of issuing and servicing such securities and other indebtedness.
•Any unsecured debt issued by us would rank (1) pari passu with our future unsecured indebtedness and effectively subordinated to all of our existing and future secured indebtedness, to the extent of the value of the assets securing such indebtedness, and (2) structurally subordinated to all existing and future indebtedness and other obligations of any of our subsidiaries
•Upon a liquidation of our company,the Company, holders of our debt securities and lenders with respect to other borrowings would receive a distribution of our available assets prior to the holders of our common stock. Future offerings of additional debt securities, which would be senior to our common stock upon liquidation, or equity securities, which could dilute our existing shareholders, may harm the value of our common stock.
Additional Common Stock. The 1940 Act prohibits us from selling shares of our common stock at a price below the current NAV per share of such stock, with certain exceptions. One such exception is prior shareholder approval of issuances below current NAV per share provided that our Board of Directors determines that such sale is in the best interests of the Company and its shareholders. We do not intend to seek shareholder authorization to sell shares of our common stock below the then current NAV per share of our common stock at our 20202023 annual meeting of shareholders. However, in the event we change our position, we will seek requisite approval of our shareholders. See “-Shareholders may incur dilution if we sell shares of our common stock in one or more offerings at prices below the then current NAV per share of our common stock or issue securities that are convertible to subscribe to, convert to or purchase shares of our common stock” for a discussion of the risks related to us issuing shares of our common stock below NAV. If we raise additional funds by issuing more common stock or senior securities convertible into, or exchangeable for, our common stock, the percentage ownership of our shareholders at that time would decrease, and they may experience dilution. Moreover, we can offer no assurance that we will be able to issue and sell additional equity securities in the future, on favorable terms or at all.
SBIC I has an SBIC license and is subject to SBA regulations, and any failure to comply with SBA regulations could have an adverse effect on our operations.
On April 20, 2021, SBIC I received a license from the SBA to operate as an SBIC under Section 301(c) of the Small Business Investment Act of 1958, as amended, and is regulated by the SBA.
The SBA places certain limitations on the financing terms of investments by SBICs in portfolio companies, regulates the types of financing, prohibits investing in small businesses with certain characteristics or in certain industries and requires capitalization thresholds that limit distributions to us. Accordingly, compliance with SBIC requirements may cause SBIC I to forego attractive investment opportunities that are not permitted under SBA regulations and/or to invest at less competitive rates in order to find investments that qualify under the SBA regulations.
Further, SBA regulations require that an SBIC be periodically examined and audited by the SBA to determine its compliance with the relevant SBA regulations. If SBIC I fails to comply with applicable regulations, the SBA could, depending on the severity of the violation, limit or prohibit SBIC I’s use of the debentures, declare outstanding debentures immediately due and payable, and/or limit SBIC I from making new investments. In addition, the SBA could revoke or suspend SBIC I’s license for willful or repeated violation of, or willful or repeated failure to observe, any provision of the Small Business Investment Act of 1958, as amended, or any rule or regulation promulgated thereunder. These actions by the SBA would, in turn, negatively affect our operations because SBIC I is our wholly owned subsidiary. We do not have any prior experience managing an SBIC. Our lack of experience in complying with SBA regulations may hinder our ability to take advantage of SBIC I’s access to SBA-guaranteed debentures.
Shareholders may incur dilution if we sell shares of our common stock in one or more offerings at prices below the then current NAV per share of our common stock or issue securities to convertthat are convertible to shares of our common stock.
The 1940 Act prohibits us from selling shares of our common stock at a price below the current NAV per share of such stock, with certain exceptions. One such exception is prior shareholder approval of issuances below NAV provided that our Board of Directors determines that such sale is in the best interests of the Company and its shareholders. We do not intend to seek shareholder authorization to sell shares of our common stock below the then current NAV per share of our common stock at our 20202023 annual meeting of shareholders. However, in the event we change our position, we will seek the requisite approval of our shareholders.
If we were to sell shares of our common stock below NAV per share, such sales would result in an immediate dilution to the NAV per share. This dilution would occur as a result of the sale of shares at a price below the then current NAV per share of our common stock and a proportionately greater decrease in a shareholder’s interest in our earnings and assets and voting
interest in us than the increase in our assets resulting from such issuance. Because the number of shares of common stock that could be so issued and the timing of any issuance is not currently known, the actual dilutive effect cannot be predicted. Notwithstanding the foregoing, the example below illustrates the effect of dilution to existing shareholders resulting from the sale of common stock at prices below the NAV of such shares.
In addition, if we issue securities to convertthat are convertible to shares of common stock, the exercise or conversion of such securities would increase the number of outstanding shares of our common stock. Any such exercise would be dilutive on the voting power of existing shareholders, and could be dilutive with regard to dividends and our NAV, and other economic aspects of the common stock.
Illustration: Example of Dilutive Effect of the Issuance of Shares Below Net Asset Value.NAV. Assume that Company XYZ has 1,000,000 total shares outstanding, $15,000,000 in total assets and $5,000,000 in total liabilities. The NAV per share of the common stock of Company XYZ is $10.00. The following table illustrates the reduction NAV and the dilution experienced by shareholder A following the sale of 100,000 shares of the common stock of Company XYZ at $9.00 per share, a price below its NAV per share.
| | | | | | | | | | | | | | | | | | | | |
| | Prior to Sale Below NAV | | Following Sale Below NAV | | Percentage Change |
| Reduction to NAV | | | | | | |
| Total Shares Outstanding | | 1,000,000 | | | 1,100,000 | | | 10.00 | % |
| NAV per share | | $ | 10.00 | | | $ | 9.91 | | | (0.91) | % |
| Dilution to Existing Shareholder | | | | | | |
| Shares held by Shareholder A | | 10,000 | | | 10,000 | | (1) | — | % |
| Percentage Held by Shareholder A | | 1.00 | % | | 0.91 | % | | (9.09) | % |
| Total Interest of Shareholder A in NAV | | $ | 100,000 | | | $ | 99,091 | | | (0.91) | % |
(1)Assumes that Shareholder A does not purchase additional shares in the sale of shares below NAV. |
| | | | | | | | | | | |
| | | Prior to Sale Below NAV | | Following Sale Below NAV | | Percentage Change |
| Reduction to NAV | | | | | | |
| Total Shares Outstanding | | 1,000,000 |
| | 1,100,000 |
| | 10.00 | % |
| NAV per share | | $ | 10.00 |
| | $ | 9.91 |
| | (0.91 | )% |
| Dilution to Existing Shareholder | | | | | | |
| Shares held by Shareholder A | | 10,000 |
| | 10,000 |
| 1 | — | % |
| Percentage Held by Shareholder A | | 1.00 | % | | 0.91 | % | | (9.09 | )% |
| Total Interest of Shareholder A in NAV | | $ | 100,000 |
| | $ | 99,091 |
| | (0.91 | )% |
| |
(1)
| Assumes that Shareholder A does not purchase additional shares in the sale of shares below NAV. |
We cannot predict how tax reform legislation will affect us, our investments,Legislative or our shareholders, and any such legislationother actions relating to taxes could adversely affect our business.have a negative effect on us.
Legislative or other actions relating to taxes could have a negative effect on us. The rules dealing withgoverning U.S. federal income taxation are constantly under review by persons involved in the legislative process and by the IRS and the U.S. Department of the Treasury. Congress passed tax reform legislation in December 2017, which the President signed into law. This legislation made many changes to the Code, including significant changes to the taxation of business entities, the deductibility of interest expense, and the tax treatment of capital investment. We cannot predict with certainty how any changes in the tax laws might affect us, our shareholders, or our portfolio investments. New legislation and any U.S. Treasury regulations, administrative interpretations or court decisions interpreting such legislation or regulations could significantly and negatively affect our ability to qualify for tax treatment as a RIC or the U.S. federal income tax consequences to us and our shareholders of such qualification, or could have other adverse consequences. Shareholders are urged to consult with their tax advisor regarding tax legislative, regulatory, or administrative developments and proposals and their potential effect on an investment in our securities.
We are highly dependent on information systems and systems failures could significantly disrupt our business, which may, in turn, have a material adverse effect on our operating results and negatively affect the market price of our common stock and our ability to pay dividends to our shareholders.
Our business is highly dependent on our and third parties’ communications and information systems. Any failure or interruption of those systems, including as a result of the termination of an agreement with any third-party service providers, could cause delays or other problems in our activities. Our financial, accounting, data processing, backup or other operating systems and facilities may fail to operate properly or become disabled or damaged as a result of a number of factors, including events that are wholly or partially beyond our control and adversely affect our business. There could be:
Sudden•sudden electrical or telecommunications outages;
Natural•natural disasters such as earthquakes, tornadoes and hurricanes;
Disease•disease pandemics (including the COVID-19 outbreak)pandemic);
Events•events arising from local or larger scale political or social matters, including terrorist acts; and
Cyber-attacks.•cyber-attacks.
These events, in turn, could have a material adverse effect on our operating results and negatively affect the market price of our common stock and our ability to pay dividends to our shareholders.
A failure of cybersecurity systems, as well as the occurrence of events unanticipated in our disaster recovery systems and management continuity planning could impair our ability to conduct business effectively.
The occurrence of a disaster, such as a cyber-attack against us or against a third-party that has access to our data or networks, a natural catastrophe, an industrial accident, failure ofa terrorist attack or war, events unanticipated in our disaster recovery systems, or consequential employee error could have an adverse effect on our ability to communicate or conduct business, negatively impacting our operations and financial condition. This adverse effect can become particularly acute if those events affect our electronic data processing, transmission, storage, and retrieval systems, or impact the availability, integrity, or confidentiality of our data. If a significant number of our employees were unavailable in the event of a disaster, our ability to effectively conduct our business could be severely compromised.
We, and the third-party service providers with which we do business, depend heavily upon computer systems to perform necessary business functions. Despite our implementation of a variety of security measures, our computer systems, networks, and data, like those of other companies, could be subject to cyber-attacks and unauthorized access, use, alteration, or destruction, such as from physical and electronic break-ins or unauthorized
tampering, tampering. We may experience threats to our data and systems, including malware and computer virus attacks, unauthorized access, or system failures and disruptions. If one or more of these events occurs, it could potentially jeopardize the confidential, proprietary, and other information processed, stored in, and transmitted through our computer systems and networks. Such an attack could cause interruptions or malfunctions in our operations, which could result in financial losses, litigation, regulatory penalties, client dissatisfaction or loss, reputational damage, and increased costs associated with mitigation of damages and remediation.
Third parties with which we do business may also be sources of cybersecurity or other technological risks. We outsource certain functions, and these relationships allow for the storage and processing of our information, as well as customer, counterparty, employee and borrower information. Cybersecurity failures or breaches by service providers (including, but not limited to, accountants, transfer agents, and custodians), and the issuers of securities in which we invest, also have the ability to cause disruptions and impact business operations, potentially resulting in financial losses, interference with our ability to calculate its NAV, impediments to trading, the inability of our stockholders to transact business, violations of applicable privacy and other laws, regulatory fines, penalties, reputation damages, reimbursement of other compensation costs, or additional compliance costs. While we engage in actions to reduce our exposure resulting from outsourcing, ongoing threats may result in unauthorized access, loss, exposure or destruction of data, or other cybersecurity incidents that affect our data, resulting inwith increased costs and other consequences, including those as described above. In addition, substantial costs may be incurred in order to prevent any cyber incidents in the future.
WePrivacy and information security laws and regulation changes, and compliance with those changes, may result in cost increases due to system changes and the development of new administrative processes. In addition, we may be required to expend significant additional resources to modify our protective measures and to investigate and remediate vulnerabilities or other exposures arising from operational and security risks.
Our service providers are currentlymay be impacted by quarantines and similar measures being enacted by governments in response to COVID-19,operating restrictions, which are obstructing the regular functioning of business workforces (includingmay include requiring employees to continue to work from external locationsremote locations. Policies of extended periods of remote working could strain technology resources, introduce operational risks and their homes).otherwise heighten the risks described above. Remote working environments may be less secure and more susceptible to hacking attacks, including phishing and social engineering attempts that seek to exploit weaknesses in a remote work environment. Accordingly, the risks described above are heightened under current conditions.conditions, which may continue for an unknown duration.
Terrorist attacks, acts of war or natural disasters may affect any market for our common stock, impact the businesses in which we invest and harm our business, operating results and financial condition.
Terrorist attacks, acts of war or natural disasters may disrupt our operations, as well as the operations of the businesses in which we invest. These events have created, and continue to create, economic and political uncertainties and have contributed to global economic instability. Future terrorist activities, military or security operations, or natural disasters could further weaken the domestic or global economy. These events could create additional uncertainties, which may negatively impactaffect the businesses in which we invest directly or indirectly and, in turn, could have a material adverse impact on our business, operating results and financial condition. Losses from terrorist attacks and natural disasters are generally uninsurable.
The continued threat of global terrorism and the impact of military and other action will likely continue to cause volatility in the economies of certain countries, contribute to increased market volatility and economic uncertainties or deterioration in the United States and worldwide and various aspects thereof, including in prices of commodities. Our portfolio investments may involve significant strategic assets having a national or regional profile. The nature of these assets could
expose them to a greater risk of being the subject of a terrorist attack than other assets or businesses. In late February 2022, Russia launched a large scale military attack on Ukraine. The invasion significantly amplified already existing geopolitical tensions among Russia, Ukraine, Europe, NATO and the West, including the United States. In response to the ongoing military action by Russia, various countries, including the United States, the United Kingdom, and European Union issued broad-ranging economic sanctions against Russia. Such sanctions included, among other things, a prohibition on doing business with certain Russian companies, large financial institutions, officials and oligarchs; a commitment by certain countries and the European Union to remove selected Russian banks from the Society for Worldwide Interbank Financial Telecommunications (“SWIFT”), the electronic banking network that connects banks globally; and restrictive measures to prevent the Russian Central Bank from undermining the impact of the sanctions. Additional sanctions may be imposed in the future. Such sanctions (and any future sanctions) and other actions against Russia may adversely impact, among other things, the Russian economy and various sectors of the economy, including but not limited to, financials, energy, metals and mining, engineering and defense and defense-related materials sectors; result in a decline in the value and liquidity of Russian securities; result in boycotts, tariffs, and purchasing and financing restrictions on Russia’s government, companies and certain individuals; weaken the value of the ruble; downgrade the country’s credit rating; freeze Russian securities and/or funds invested in prohibited assets and impair the ability to trade in Russian securities and/or other assets; and have other adverse consequences on the Russian government, economy, companies and region.
The ramifications of the hostilities and sanctions, however, may not be limited to Russia and Russian companies but may spill over to and negatively impact other regional and global economic markets (including Europe and the United States), companies in other countries (particularly those that have done business with Russia) and on various sectors, industries and markets for securities and commodities globally, such as oil and natural gas. Accordingly, the actions discussed above and the potential for a wider conflict could increase financial market volatility, cause severe negative effects on regional and global economic markets, industries, and companies and have a negative effect on the Company’s investments and performance, which may, in turn, impact the valuation of such portfolio companies. In addition, Russia may take retaliatory actions and other countermeasures, including cyberattacks and espionage against other countries and companies around the world, which may negatively impact such countries and the companies in which the Company invests. The extent and duration of the military action or future escalation of such hostilities, the extent and impact of existing and future sanctions, market disruptions and volatility, and the result of any diplomatic negotiations cannot be predicted. These and any related events could have a significant impact on the Company’s performance and the value of an investment in the Company.
Our business and operations may be negatively affected if we become subject to securities litigation or shareholder activism, which could cause us to incur significant expense, hinder execution of our investment strategy and impact our stock price.
In the past, following periods of volatility in the market price of a company’s securities, securities class-action litigation has often been brought against that company. Shareholder activism, which could take many forms or arise in a variety of situations, has been increasing in the BDC space recently.space. While we are currently not subject to any securities litigation or shareholder activism, due to the potential volatility of our stock price and for a variety of other reasons, we may in the future become the target of securities litigation or shareholder activism. Securities litigation and shareholder activism, including potential proxy contests, could result in substantial costs and divert management’s and our Board of Directors’ attention and resources from our business. Additionally, such securities litigation and shareholder activism could give rise to perceived uncertainties as to our future, adversely affect our relationships with service providers and make it more difficult to attract and retain qualified personnel. Also, we may be required to incur significant legal fees and other expenses related to any securities litigation and activist shareholder matters. Further, our stock price could be subject to significant fluctuation or otherwise be adversely affected by the events, risks and uncertainties of any securities litigation and shareholder activism.
RISKS RELATED TO OUR INVESTMENTS
Our investments in portfolio companies involve a number of significant risks.
We primarily invest in privately held U.S. middle-marketmiddle market companies. Investments in privately held middle-marketmiddle market companies involve a number of significant risks, including the following:
•These companies are more likely to depend on the management talents and efforts of a small group of key employees. Therefore, the death, disability, resignation, termination, or significant under-performance of one or more of these persons could have a material adverse impact on our portfolio company and, in turn, on us.
•These companies may have unpredictable operating results, could become parties to litigation, may be engaged in rapidly changing businesses with products subject to a substantial risk of obsolescence and may require
substantial additional capital to support their operations, finance expansion or maintain their competitive position.
•Private companies may notgenerally have readilyless publicly available information about their businesses, operations and financial condition. Consequently, we rely on the ability of our management team and investment professionals to obtain adequate information to evaluate the potential returns from making investments in these portfolio companies. If we are unable to uncover all material information about the target portfolio company, we may not make a fully informed investment decision and may lose all or part of our investment.
•These companies may have shorter operating histories, narrower product lines, smaller market shares and/or more significant customer concentration than larger businesses, which tend to render them more vulnerable to competitors’ actions and market conditions, as well as general economic downturns.
•These companies may have limited financial resources and may be unable to meet their obligations under their debt instruments that we hold, which may be accompanied by a deterioration in the value of any collateral and a reduction in the likelihood of us realizing any guarantees from subsidiaries or affiliates of our portfolio companies that we may have obtained in connection with our investment, as well as a corresponding decrease in the value of the equity components of our investments.
In addition, in the course of providing significant managerial assistance to certain of our portfolio companies, certain of our officers and directors may serve as directors on the boards of these companies. To the extent that litigation arises out of our investments in these companies, our officers and directors may be named as defendants in such litigation, which could result in an expenditure of funds for claims in excess of our directors’ and officers’ insurance coverage (through our indemnification of our officers and directors) and the diversion of management’s time and resources.
The lack of liquidity in our investments may adversely affect our business.
We invest, and will continue to invest, in portfolio companies whose securities are not publicly traded. These securities generally are generally subject to legal and other restrictions on resale or will otherwise be less liquid than publicly traded securities. As a result, we do not expect to achieve liquidity in our investments in the near-term. The illiquidity of these investments may make it difficult for us to sell these investments when desired. In addition, if we are required to liquidate all or a portion of our portfolio quickly, we may realize significantly less than the value at which we had previously recorded these investments and, as a result, we may suffer losses.
Defaults by our portfolio companies could harm our operating results.
Portfolio companies may fail to satisfy financial, operating or other covenants imposed by us or other lenders, which could lead to a defaultnon-payment of interest and other defaults and, potentially, acceleration of its loans and foreclosure on its secured assets. These events could trigger cross-defaults under other agreements and jeopardize the portfolio company’s ability to meet its obligations, including under the debt or equity securities we hold. We may also incur expenses to the extent necessary to recover upon a default or to negotiate new terms, which may include the waiver of certain financial covenants, with the defaulting portfolio company.
OurWe may not realize gains from our equity investments in equity securities involve a substantial degree of risk.
We may purchase common stock and other equity securities, including warrants.warrants, alongside our debt investments. Although equity securities have historically generated higher average total returns than fixed-income securities over the long term, equity securities have also experienced significantly more volatility in those returns. The equity securities we acquire may fail to appreciate and may decline in value or become worthless, and our ability to recover our investment depends on our portfolio company’scompany's success. Investments in equity securities involve a number of significant risks, including the risk of further dilution as a result of additional issuances, inability to access additional capital and failure to pay current distributions. Investments in preferred securities involve special risks, such as the risk of deferred distributions, credit risk, illiquidity and limited voting rights.
We may not realize gains from our equity investments.
Certain investments that we have made in the past and may make in the future include warrants or other equity securities. Investments in equity securities involve a number of significant risks, including the risk of further dilution as a result of additional issuances, inability to access additional capital and failure to pay current distributions. Investments in preferred securities involve special risks, such as the risk of deferred distributions, credit risk, illiquidity and limited voting rights. In addition, we may from time to time make non-control, equity investments in portfolio companies. Our goal is ultimately to realize gains upon our disposition of these equity interests. However, the equity interests we receive may not appreciate in value and, in fact, may decline in value. Accordingly, we may not be able to realize gains from our equity interests, and any gains that we do realize on the disposition of any equity interests may not be sufficient to offset any other losses we experience. We also may be unable to realize any value if a portfolio company does not have a liquidity event, such as a sale of the business, recapitalization or public offering, which would allow us to sell the underlying equity interests. We often seek puts or similar rights to give us the right to sell our equity securities back to the portfolio company issuer; however, we may be unable to exercise these put rights for the consideration provided in our investment documents if the issuer is in financial distress.
Prepayments of our debt investments by our portfolio companies could adversely impact our results of operations and reduce our return on equity.
From timeWe are subject to time, certainthe risk that the debt investments we make in our portfolio companies may prepay our debt investments in our portfolio companiesbe prepaid prior to maturity, the specific timing of which we do not control. When this occurs, we will generally reinvest these proceeds in temporary investments, pending their future investment in new portfolio companies. These temporary investments will typically have substantially lower yields than the debt being prepaid and we could experience significant delays in reinvesting these amounts. Any future investment in a new portfolio company may also be at lower yields than the debt that was repaid. As a result, our results of operations could be materially adversely affected if one or more of our portfolio companies elect to prepay amounts owed to us. Additionally, prepayments could negatively impact our return on equity, which could result in a decline in the market price of our securities.
ChangesWe are exposed to risks associated with changes in interest rates may affectrates.
Because we have borrowed and intend to continue to borrow money to make investments, our cost of capital, the value of investments and net investment income.
Some of our debt investments will bear interestincome depends, in part, upon the difference between the rate at variable rateswhich we borrow funds and the interest income from these investments could be negatively affected by decreasesrate at which we invest those funds. As a result, we can offer no assurance that a significant change in market interest rates.rates will not have a material adverse effect on our net investment income. In addition, anresponse to market indicators showing a rise in inflation, since March 2022, the Federal Reserve has been rapidly increasing interest rates and has indicated that it would consider additional rate hikes in response to ongoing inflation concerns. An increase in interest rates would make it more expensive for us to use debt to finance our investments. As a result, a significant increase in marketcould decrease the value of any investments we hold which earn fixed interest rates and also could increase our cost of capital, which would reduceinterest expense, thereby decreasing our net investment income. Also, an increase in interest rates available to investors could make an investment in shares of our securitiescommon stock less attractive than alternative investments, a situationif we are not able to increase our distribution rate, which could reduce the value of our securities. Conversely, a decrease incommon stock. Further, rising interest rates may have an adverse impact oncould also adversely affect our returns by requiring usperformance if such increases cause our borrowing costs to seek lower yields on our debt investments and by increasingrise at a rate in excess of the riskrate that our portfolio companies will prepay our debt investments resultingyield. It is possible that the Federal Reserve's tightening cycle could also result in a recession in the need to redeploy capital at potentially lower rates. A decrease in marketUnited States.
In the current and any future periods of rising interest rates, may also adversely impactto the extent we borrow money subject to a floating interest rate (such as under the Credit Facility), our returns on temporary investments,cost of funds would increase, which wouldcould reduce our net investment income.income if there is not a corresponding increase in interest income generated by our investment portfolio. Further, rising interest rates could also adversely affect our performance if we hold investments with floating interest rates, subject to specified minimum (or “floor”) interest rates, while at the same time engaging in borrowings subject to floating interest rates not subject to such minimums. In addition, certainsuch a scenario, rising interest rates may temporarily increase our interest expense, even though our interest income from investments is not increasing in a corresponding manner if market rates remain lower than the existing floor rate.
If interest rates continue to rise, there is also a risk that portfolio companies in which we hold floating rate loans will be unable to pay escalating interest amounts, which could increase the risk of payment defaults and cause the portfolio companies to defer or cancel needed investment. Any failure of one or more portfolio companies to repay or refinance its debt at or prior to maturity or the inability of one or more portfolio companies to make ongoing payments following an increase in contractual interest rates could have a material adverse effect on our business, financial condition, results of operations and cash flows. The value of our debt investments and debt liabilities may bear interest at fixed rates. To the extent that our fixed rate assets and liabilities are not perfectly hedged, our net investment income may decrease based on changes in market interest rates. Ansecurities could also be reduced from an increase in market interestcredit spreads as rates may also decrease the fair value ofavailable to investors could make an investment in our fixed rate investments, as these may besecurities less attractive securities in a rising rate environment. than alternative investments.
There may be circumstances in which our debt investments could be subordinated to claims of other creditors or we could be subject to lender liability claims.
Even though we may have structured our investments as secured debt, if one of our portfolio companies were to go bankrupt, depending on the facts and circumstances, and based upon principles of equitable subordination, a bankruptcy court could subordinate all or a portion of our claim to that of other creditors and transfer any lien securing our subordinated claim to the bankruptcy estate. The principles of equitable subordination based on case law generally provide that a claim may be subordinated only if its holder is guilty of misconduct or where the secured debt is re-characterized as an equity investment and the senior lender has actually provided significant managerial assistance to the bankrupt debtor. We may also be subject to lender liability claims for actions taken by us with respect to a borrower’s business or instances where we exercise control over the borrower. It is possible that we could become subject to a lender’s liability claim, including as a result of actions taken in rendering significant managerial assistance or actions to compel and collect payments from the borrower outside the ordinary course of business.
As a RIC, we may have certain regulatory restrictions that could preclude us from making additional investments in our portfolio companies.
We may not have the ability to make additional investments in our portfolio companies. After our initial investment in a portfolio company, we may be called upon from time to time to provide additional funds to that company or have the opportunity to increase our investment or make follow-on investments. Any decisions not to make a follow-on investment or any inability on our part to make such an investment may have a negative impact on a portfolio company in need of such an investment, may result in a missed opportunity for us to increase our participation in a successful operation, or may reduce the expected return on the investment.
ChangesThe interest rates of our loans to our portfolio companies, any LIBOR-linked securities, and other financial obligations that extend beyond 2021 might be subject to change based on recent regulatory changes, including the decommissioning of LIBOR.
The London Interbank Offered Rate (“LIBOR”) is an index rate that historically has been widely used in lending transactions and remains a common reference rate for setting the floating interest rate on private loans. LIBOR typically has been the reference rate used in floating-rate loans extended to our portfolio companies and, to some degree, is expected to continue to be used as a reference rate until such time that private markets have fully transitioned to using the Secured Overnight Financing Rate (“SOFR”), or other alternative reference rates recommended by applicable market regulators. Uncertainty relating to the LIBOR calculation process, the valuation of LIBOR alternatives, and other economic consequences from the phasing out of LIBOR may adversely affect the valueour results of the LIBOR-indexed, floating-rate debt securities in our portfolio.operations, financial condition and liquidity.
In the recent past, concerns have been publicized that some of the member banks surveyed by the British Bankers’ Association (‘‘BBA’’) in connection with the calculation of LIBOR across a range of maturities and currencies may have been under-reporting or otherwise manipulating the inter-bank lending rate applicable to them in order to profit on their derivative positions or to avoid an appearance of capital insufficiency or adverse reputational or other consequences that may have resulted from reporting inter-bank lending rates higher than those they actually submitted. A number of BBA member banks entered into settlements with their regulators and law enforcement agencies with respect to alleged manipulation of LIBOR, and investigations by regulators and governmental authorities in various jurisdictions are ongoing.
Actions by the ICE Benchmark Administration, regulators or law enforcement agencies as a result of these or future events, may result in changes to the manner in which LIBOR is determined. Potential changes, or uncertainty related to such potential changes may adversely affect the market for LIBOR-based securities, including our portfolio of LIBOR-indexed, floating-rate debt securities. In addition, any further changes or reforms to the determination or supervision of LIBOR may result in a sudden or prolonged increase or decrease in reported LIBOR, which could have an adverse impact on the market for LIBOR-based securities or the value of our portfolio of LIBOR-indexed, floating-rate debt securities, loans, and other financial obligations or extensions of credit held by or due to us.
On July 27, 2017,March 5, 2021, the U.K.United Kingdom's Financial Conduct Authority (the "FCA"), which regulates LIBOR, announced that it intendsthe ICE Benchmark Administration ("IBA") (the entity regulated by the FCA that is responsible for calculating LIBOR) had notified the FCA of its intent, among other things, to stop persuadingcease providing overnight, 1, 3, 6 and 12 months USD LIBOR tenors after June 30, 2023 and all other tenors after December 31, 2021. On November 16, 2021, the FCA issued a statement confirming that starting January 1, 2022, entities supervised by the FCA will be prohibited from using LIBORs, including USD LIBOR, that will be discontinued as of December 31, 2021 as well as, except in very limited circumstances, those tenors of USD LIBOR that will be discontinued or compellingdeclared non-representative after June 30, 2023. While LIBOR will cease to exist or be declared non-representative, there continues to be uncertainty regarding the nature of potential changes to specific USD LIBOR tenors, the development and acceptance of alternative reference rates and other reforms.
Central banks to submit LIBOR rates after 2021. We have exposure to LIBOR, includingand regulators in financial instruments that mature after 2021. Our exposure arises from the valuea number of our portfolio of LIBOR-indexed, floating-rate debt securities.
In themajor jurisdictions (for example, United States, United Kingdom, European Union, Switzerland and Japan) have convened working groups to find, and implement the transition to, suitable replacements for LIBORs and other interbank offered rates ("IBORs"). To identify a successor rate for USD LIBOR, the Alternative Reference Rates Committee (“ARRC”), U.S.-based group convened by the U.S. Federal Reserve Board and the Federal Reserve Bank of New York, in conjunction withwas formed. The ARRC has identified SOFR as its preferred alternative rate for LIBOR. SOFR is a measure of the Alternative Reference Rates Committee, a steering committee comprisedcost of largeborrowing cash overnight, collateralized by U.S. financial institutions, is considering replacing U.S. dollar LIBOR with a new index calculated by short-term repurchase agreements, backed by Treasury securities, calledand is based on directly observable U.S. Treasury-backed repurchase transactions. On July 29, 2021, the Secured Overnight Financing Rate (“SOFR”). The Federal Reserve Bank of New York began publishingARRC formally recommended SOFR in April 2018. In addition,as its preferred alternative replacement rate for LIBOR. On July 29, 2021, the ARRC also recommended a forward-looking term rate based on March 25, 2020, the U.K. Financial Conduct Authority stated that, although the central assumption that firms cannot rely on LIBOR beingSOFR published after the end of 2021 has not changed, the outbreak of COVID-19 has impacted the timing of many firms’ transition planning, and the U.K. Financial Conduct Authority will continue to assess the impact of the COVID-19 outbreak on transition timelines and update the marketplace as soon as possible.by CME Group. Although SOFR appears to be the preferred replacement rate for U.S. dollar LIBOR, at this time, it is not possible to predict the effect of any such changes, any establishment of alternative reference rates or other reforms to LIBOR that may be enacted in the United States, United Kingdom or elsewhereelsewhere. Alternative reference rates that may replace LIBOR, including SOFR for USD transactions, may not yield the same or whethersimilar economic results as LIBOR over the COVID-19 outbreaklives of such transactions. There can be no guarantee that SOFR will become the dominant alternative to USD LIBOR or that SOFR will be widely used and other alternatives may or may not be developed and adopted with additional consequences.
New York and several other states have further effectpassed laws intended to apply to U.S. dollar LIBOR-based contracts, securities, and instruments governed by those states’ laws. These laws established fallbacks for LIBOR when there is no or insufficient fallback rates in these contracts. The federal Adjustable Interest Rate (LIBOR) Act (the “LIBOR Act”) was signed into law on March 15, 2022. The federal legislation provides a statutory fallback mechanism on a nation-wide basis to replace U.S. dollar LIBOR transition plans. with a benchmark rate, selected by the Federal Reserve Board and based on SOFR, for certain contracts that reference U.S. dollar LIBOR and contain no or insufficient fallback provisions. The New York and other state laws were superseded by the LIBOR Act. On December 16, 2022, the Federal Reserve Board adopted a final rule implementing certain provisions of the LIBOR Act (“Regulation ZZ”). Regulation ZZ specifies that on the LIBOR replacement date, which is the first London banking day after June 30, 2023, the Federal Reserve Board-selected benchmark replacement, based on SOFR and including any tenor spread adjustment as provided by Regulation ZZ, will replace references to overnight, 1, 3, 6, and 12-month LIBOR in certain contracts that do not mature before the LIBOR replacement date and that do not contain adequate fallback language. Regulation ZZ could apply to certain of our investments that reference LIBOR to the extent that they do not have fallback provisions or adequate fallback provisions.
The elimination of LIBOR or any other changes or reforms to the determination or supervision of LIBOR could have an adverse impact on the market for or value of and/or transferability of any LIBOR-indexed, floating-rate debtLIBOR-linked securities, loans, and other financial obligations or extensions of credit held by or due to us, valuation measurements used by us that include LIBOR as an input, our operational processes or on our overall financial condition or results of operations.
The Company intendsFor instance, if the LIBOR reference rate of our LIBOR-linked securities, loans, and other financial obligations is higher than an alternative reference rate, such as SOFR, on our alternative reference rate-linked portfolio investments, the difference between the total interest income earned on interest earning assets and the total interest expense incurred on interest bearing liabilities may be compressed, reducing our net interest income and potentially adversely affecting our operating results.In addition, while the majority of our LIBOR-linked loans contemplate that LIBOR may cease to monitorexist and allow for amendment to a new alternative reference rate without the developments with respect to the scheduled phasing outapproval of LIBOR after 2021 and work with its portfolio companies and lenders to ensure such transition away from LIBOR will have minimal impact on its financial condition, but can provide no assurances regarding the impact100% of the discontinuation of LIBOR.
As of March 31, 2020, approximately 96.8% of our debt investment portfolio (at fair value) bore interest rates indexed upon LIBOR. Additionally, our Credit Facility accrues interest at the applicable LIBOR rate plus 2.50%, subject to certain conditions as outlined in the Credit Agreement. Iflenders, if LIBOR ceases to exist, we may needcould be required, in such situations, to renegotiate thenegotiate modifications to credit agreements extending beyond 2021 with our portfolio companies that utilize LIBOR as a factorgoverning such instruments, in determining the interest rateorder to replace LIBOR with such alternative reference rate and to incorporate any conforming changes to applicable credit spreads or margins. Following the new standard that is established. Any such renegotiatedreplacement of LIBOR, some or all of these credit agreements or methodologymay bear interest at a lower interest rate, which could have an adverse impact on the value and liquidity of the new standard may not beour investment in these portfolio companies and, as favorable to us as the current agreements and LIBOR, which may adversely affecta result, on our results of operations. Such adverse impacts and the uncertainty of the transition could result in disputes and litigation with counterparties and borrowers regarding the implementation of alternative reference rates.
We generally will not control our portfolio companies.
We do not, and do not expect to, control most of our portfolio companies, even though we may have board representation or board observation rights, and our debt agreements may contain certain restrictive covenants. As a result, we are subject to the risk that a portfolio company in which we invest may make business decisions with which we disagree, and the management of such company, as representatives of the holders of their common equity, may take risks or otherwise act in ways that do not serve our interests as debt investors. Due to the lack of liquidity of our investments in private companies, we may not be able to dispose of our interests in our portfolio companies as readily as we would like or at an appropriate valuation. As a result, a portfolio company may make decisions that could decrease the value of our portfolio holdings.
Second priority liens on collateral securing loans that we make to our portfolio companies may be subject to control by senior creditors with first priority liens. Further, in cases where we invest in unsecured subordinated debt, we would not have any lien on the collateral. In each of these cases, if there is a default, the value of the collateral may not be sufficient to repay in full both the first priority creditors and us.
Certain loans that we make are either secured by a second priority security interest in the same collateral pledged by a portfolio company to secure senior debt owed by the portfolio company to commercial banks or other traditional lenders, or in the case of unsecured subordinated debt, we have no lien at all on the assets. Often the senior lender has procured covenants from the portfolio company prohibiting the incurrence of additional secured debt without the senior lender’s consent. Prior to and as a condition of permitting the portfolio company to borrow money from us secured by the same collateral pledged to the senior
lender, or in the case where we invest in unsecured subordinated debt, the senior lender will require assurances that it will control the disposition of any collateral in the event of bankruptcy or other default. In many cases, the senior lender will require us to enter into an “intercreditor agreement” prior to permitting the portfolio company to borrow from us. Typically, the intercreditor agreements we are requested to execute expressly subordinate our debt instruments to those held by the senior lender and further provide that the senior lender shallwill control: (1) the commencement of foreclosure or other proceedings to liquidate and collect on the collateral, subject to a negotiated “standstill period” after which we can initiate; (2) the nature, timing and conduct of foreclosure or other collection proceedings, subject to a negotiated “standstill period” after which we can initiate; (3) the amendment of any collateral document; (4) the release of the security interests in respect of any collateral; and (5) the waiver of defaults under any security agreement. Because of the control we may cede to senior lenders under intercreditor agreements we may enter, we may be unable to realize the proceeds of any collateral securing some of our loans.
Our portfolio companies may incur debt that ranks equally with, or senior to, our investments in those companies.
We invest primarily in the secured term debt of middle market companies and equity issued by middle market companies. Our portfolio companies may have, or may be permitted to incur, other debt that ranks equally with, or senior to, the debt in which we invest. By their terms, these debt instruments may entitle the holders to receive payment of interest or principal on or before the dates on which we are entitled to receive payments with respect to the debt instruments in which we invest. Also, in the event of insolvency, liquidation, dissolution, reorganization or bankruptcy of a portfolio company, holders of debt instruments ranking senior to our investment in that portfolio company would typically be entitled to receive payment in full before we receive any distribution. After repaying its senior creditors, the portfolio company may not have any remaining assets to use for repaying its obligation to us. In the case of debt ranking equally with debt instruments in which we invest, we
would have to share on an equal basis any distributions with other creditors holding such debt in the event of an insolvency, liquidation, dissolution, reorganization or bankruptcy of the relevant portfolio company.
Changes in healthcare laws and other regulations, or the enforcement or interpretation of such laws or regulations, applicable to some of our portfolio companies’ businesses may constrain their ability to offer their products and services.
Our investments in the healthcare sector are subject to substantial risk. Changes in healthcare or other laws and regulations, or the enforcement or interpretation of such laws or regulations, applicable to the businesses of some of our portfolio companies may occur that could increase their compliance and other costs of doing business, require significant systems enhancements, or render their products or services less profitable or obsolete, any of which could have a material adverse effect on their results of operations. Healthcare companies often must obtain and maintain regulatory approvals to market many of their products, change prices for certain regulated products and consummate some of their acquisitions and divestitures. Delays in obtaining or failing to obtain or maintain these approvals could reduce revenue or increase costs. There has also been an increased political and regulatory focus on healthcare laws in recent years, and new legislation could have a material effect on the business and operations of some of our portfolio companies.
Additionally, because of the possibility of additional changes to healthcare laws and regulations under the current U.S. presidential administration, we cannot quantify or predict with any certainty the likely impact on our portfolio companies, our business model, prospects, financial condition or results of operations. We also anticipate that Congress, state legislatures, and third-party payors may continue to review and assess alternative healthcare delivery and payment systems and may in the future propose and adopt legislation or policy changes or implementations effecting additional fundamental changes in the healthcare delivery system. We cannot assure you as to the ultimate content, timing, or effect of changes, nor is it possible at this time to estimate the impact of any such potential legislation on certain of our portfolio companies, our business model, prospects, financial condition or results of operations.
RISKS RELATED TO OUR SECURITIES
The market price of our common stock may fluctuate significantly.
The market price of our common stock will fluctuate with market conditions and other factors. Our common stock is intended for long-term investors and should not be treated as a trading vehicle. The market price and liquidity of the market for shares of our common stock may be significantly affected by numerous factors, some of which are beyond our control and may not be directly related to our operating performance. These factors include:
•significant volatility in the market price and trading volume of securities of BDCs or other companies in our sector, which is not necessarily related to the operating performance of these companies;
•exclusion of our common stock from certain market indices, such as the Russell 2000 Financial Services Index, which could reduce the ability of certain investment funds to own our common stock and put short-term selling pressure on our common stock;
•changes in regulatory policies, accounting pronouncements or tax guidelines, particularly with respect to BDCs or RICs;
| |
�� | failure to qualify for RIC tax treatment; |
•failure to qualify for RIC tax treatment;
•our origination activity, including the pace of, and competition for, new investment opportunities;
•changes or perceived changes in earnings or variations of operating results;
•changes or perceived changes in the value of our portfolio of investments;
•any shortfall in revenueour investment income or net investment income or any increase in losses from levels expected by investors or securities analysts;
potential future sales•proposed, or completed, offerings of common stock or debtour securities, convertible into or exchangeable or exercisable forincluding securities other than our common stock or the conversion of such securities;stock;
•departure of our key personnel;
•operating performance of companies comparable to us;
•credit market changes;
•general economic trends and other external factors, such as the COVID-19 pandemic;factors; and
•loss of a major funding source.
Investing in shares of our common stock may involve an above average degree of risk.
The investments we make in accordance with our investment objectives may result in a higher amount of risk, volatility or loss of principal than alternative investment options. Our investments in portfolio companies may be highly speculative, and therefore, an investment in our common stock may not be suitable for investors with lower risk tolerance.
Shares of closed-end investment companies, including BDCs, may trade at a discount to their net asset value.NAV.
Our common stock is listed on The NASDAQNasdaq Global Select Market. Shareholders desiring liquidity may sell their shares on The NASDAQNasdaq Global Select Market at current market value, which could be below NAV. Shares of closed-end investment companies frequently trade at discounts from NAV, which is a risk separate and distinct from the risk that a fund’s performance will cause its NAV to decrease. We cannot predict whether our common stock will trade at, above or below NAV. In addition, if our common stock trades below our NAV per share, we will generally not be able to issue additional common stock at the market price unless our shareholders approve such a sale and our Board of Directors make certain determinations. See “-Shareholders“Shareholders may incur dilution if we sell shares of our common stock in one or more offerings at prices below the then current NAV per share of our common stock or issue securities that are convertible to subscribe to, convert to or purchase shares of our common stock” for a discussion of the risks related to us issuing shares of our common stock below NAV.
The December 2022January 2026 Notes and the October 20242026 Notes will beare unsecured and therefore will beare effectively subordinated to any existing and future secured indebtedness, including indebtedness under our Credit Facility.
The December 2022Each of the January 2026 Notes and the October 20242026 Notes (collectively, the “Notes”) willare not be secured by any of our assets or any of the assets of any of our subsidiaries. As a result, the Notes will beare effectively subordinated to any existing and future secured indebtedness we or our subsidiaries have outstanding as of the date of this prospectus supplementcurrently incurred (including our Credit Facility) or that we or our subsidiaries may incur in the future (or any indebtedness that is initially unsecured as to which we subsequently grant a security interest) to the extent of the value of the assets securing such indebtedness. In any liquidation, dissolution, bankruptcy or other similar proceeding, the holders of any of our secured indebtedness or secured indebtedness of our subsidiaries may assert rights against the assets pledged to secure that indebtedness in order to receive full payment of their indebtedness before the assets may be used to pay other creditors, including the holders of the Notes. As of March 31, 2020,2023, we had $154.0$235.0 million in outstanding indebtedness under our Credit Facility, which is secured by (1) substantially all of the present and future property and assets of the Company and the guarantors and (2) 100.0% of the equity interests in the Company’s wholly-owned subsidiaries.wholly owned subsidiaries (except for the assets held in SBIC I).
The indenture under which the December 2022January 2026 Notes and the October 20242026 Notes were issued contain limited protection for holders of the December 2022January 2026 Notes and the October 20242026 Notes.
The respective indenture under which the January 2026 Notes and the October 2026 Notes were issued offer limited protection to holders of the January 2026 Notes and the October 2026 Notes. The terms of the respective indenture and the January 2026 Notes and the October 2026 Notes do not restrict our or any of our subsidiaries’ ability to engage in, or otherwise be a party to, a variety of corporate transactions, circumstances or events that could have a material adverse impact on yourthe investment inof the Notes.holders of the January 2026 Notes and the October 2026 Notes, respectively. In particular, the terms of the respective indenture and the January 2026 Notes and the October 2026 Notes will not place any restrictions on our or our subsidiaries’ ability to:
•issue securities or otherwise incur additional indebtedness or other obligations, including (1) any indebtedness or other obligations that would be equal in right of payment to the Notes, (2) any indebtedness or other obligations that would be secured and therefore rank effectively senior in right of payment to the Notes to the extent of the values of the assets securing such debt, (3) indebtedness of ours that is guaranteed by one or more of our subsidiaries and which therefore is structurally senior to the Notes and (4) securities, indebtedness or obligations issued or incurred by our subsidiaries that would be senior to our equity interests in those entities and therefore rank structurally senior to the Notes with respect to the assets of our subsidiaries, in each case other than an incurrence of indebtedness or other obligation that would cause a violation of Section 18(a)(1)(A) as modified by Section 61(a)(2) of the 1940 Act or any successor provisions, whether or not we continue to be subject to such provisions of the 1940 Act, but giving effect, in each case, to any exemptive relief granted to us by the SEC. Currently, these provisions generally prohibit us from incurring additional borrowings, including through the issuance of additional debt securities, unless our asset coverage, as defined in the 1940 Act, equals at least 150% after such borrowings;
•pay dividends on, or purchase or redeem or make any payments in respect of, capital stock or other securities ranking junior in right of payment to the Notes, including subordinated indebtedness, except that we have agreed that, for the period of time during which the Notes are outstanding, we will not violate Section 18(a)(1)(B) as modified by (i) Section 61(a)(2) of the 1940 Act or any successor provisions and after giving effect to any exemptive relief granted to us by the SEC and (ii) the following two exceptions: (A) we will be permitted to declare a cash dividend or distribution notwithstanding the prohibition contained in Section 18(a)(1)(B) as modified by Section 61(a)(2) of the 1940 Act or any successor provisions, but only up to such amount as is necessary for us to maintain our status as a RIC under Subchapter M of the Code; and (B) this restriction will not be triggered unless and until such time as our asset
coverage has not been in compliance with the minimum asset coverage required by Section 18(a)(1)(B) as modified by Section 61(a)(2) of the 1940 Act or any successor provisions (after giving effect to any exemptive relief granted to us by the SEC) for more than six consecutive months. If Section 18(a)(1)(B) as modified by Section 61(a)(2) of the 1940 Act were currently applicable to us in connection with this offering, these provisions would generally prohibit us from declaring any cash dividend or
distribution upon any class of our capital stock, or purchasing any such capital stock if our asset coverage, as defined in the 1940 Act, were below 150% at the time of the declaration of the dividend or distribution or the purchase and after deducting the amount of such dividend, distribution or purchase;
•sell assets (other than certain limited restrictions on our ability to consolidate, merge or sell all or substantially all of our assets);
•enter into transactions with affiliates;
•create liens (including liens on the shares of our subsidiaries) or enter into sale and leaseback transactions;
•make investments; or
•create restrictions on the payment of dividends or other amounts to us from our subsidiaries.
In addition, the respective indenture governing the January 2026 Notes and the October 20242026 Notes will require us to make an offer to purchase the January 2026 Notes and the October 20242026 Notes in connection with a change of control or any other event.event, respectively.
Furthermore, the terms of the respective indenture and the January 2026 Notes and the October 2026 Notes do not protect holders of the January 2026 Notes and the October 2026 Notes, respectively, in the event that we experience changes (including significant adverse changes) in our financial condition, results of operations or credit ratings, if any, as they do not require that we or our subsidiaries adhere to any financial tests or ratios or specified levels of net worth, revenues, income, cash flow, or liquidity.
Our ability to recapitalize, incur additional debt (including additional debt that matures sooner thanprior to the maturity of the January 2026 Notes and the October 2026 Notes), and take a number of other actions that are not limited by the terms of each of the January 2026 Notes and the October 2026 Notes may have important consequences for you as a holder of the January 2026 Notes and the October 2026 Notes, including making it more difficult for us to satisfy our obligations with respect to the December 2022January 2026 Notes and the October 20242026 Notes or negatively affecting the market value of the January 2026 Notes and the October 2026 Notes.
Other debt we issue or incur in the future could contain more protections for its holders than the respective indenture and the January 2026 Notes and the October 2026 Notes, including additional covenants and events of default. The issuance or incurrence of any such debt with incremental protections could affect the market for, trading levels, and prices of the January 2026 Notes and the October 2026 Notes.
We may not be able to repurchase the January 2026 Notes and the October 20242026 Notes upon a Change of Control Repurchase Event.
Upon a Change of Control Repurchase Event (as defined in the relevant indenture), holders of the January 2026 Notes and the October 20242026 Notes may require us to repurchase for cash some or all of the January 2026 Notes and the October 20242026 Notes, respectively, at a repurchase price equal to 100% of the aggregate principal amount of the January 2026 Notes and the October 20242026 Notes, respectively, being repurchased, plus their respective accrued and unpaid interest to, but not including, the repurchase date. We may not be able to repurchase the January 2026 Notes and/or the October 20242026 Notes upon a Change of Control Repurchase Event because we may not have sufficient funds. Before making any such repurchase of the January 2026 Notes or the October 20242026 Notes, we would also have to comply with certain requirements under our Credit Facility, to the extent such requirements remain in effect at such time, or otherwise obtain consent from the lenders under our Credit Facility. The terms of our Credit Facility also provide that certain change of control events will constitute an event of default thereunder entitling the lenders to accelerate any indebtedness outstanding under our Credit Facility at that time and to terminate our Credit Facility. In addition, the occurrence of a Change of Control Repurchase Event enabling the holders of the January 2026 Notes and/or the October 20242026 Notes to require the mandatory purchase of the January 2026 Notes and/or the October 20242026 Notes, respectively, would likely constitute an event of default under our Credit Facility, entitling the lenders to accelerate any indebtedness outstanding under our Credit Facility at that time and to terminate our Credit Facility. Our and our subsidiaries' future financing facilities may contain similar restrictions and provisions. Our failure to purchase such tendered January 2026 Notes or the October 20242026 Notes upon the occurrence of such Change of Control Repurchase Event would cause an event of default under the respective indenture governing the January 2026 Notes or the October 20242026 Notes, respectively, and a cross-default under the agreements governing certain of our other indebtedness, including under the agreements governing our Credit Facility, which may result in the acceleration of such indebtedness requiring us to repay that indebtedness immediately. If the holders of the January 2026 Notes or the October 20242026 Notes exercise their respective right to require us to repurchase the
January 2026 Notes or the October 20242026 Notes, respectively, upon a Change of Control Repurchase Event, the financial effect of thisany such repurchase could cause a default under our current and future debt instruments, even if the Change of Control Repurchase Event itself would not cause a default. If a Change of Control Repurchase Event were to occur, we may not have sufficient funds to repay any such accelerated indebtedness.
TheWhile a trading market or market value of our publicly issued debt securities may be volatile.
Thedeveloped after issuing the January 2026 Notes and the October 2026 Notes, we cannot assure you that an active trading market for the January 2026 Notes and the October 2026 Notes will be maintained.
While a trading market developed after issuing the January 2026 Notes and the October 2026 Notes, we cannot assure you that an active and liquid market for the January 2026 Notes and the October 2026 Notes will be maintained. We do not intend to list the January 2026 Notes or the October 2026 Notes on any securities exchange or for quotation of the January 2026 Notes or the October 2026 Notes on any automated dealer quotation system. If the January 2026 Notes or the October 2026 Notes are traded after their initial issuance, they may trade at a discount to their public offering price depending on prevailing interest rates, the market for similar securities, our credit ratings, our financial condition, performance and prospects, general economic conditions, including the impact of COVID-19, or other relevant factors. The underwriters may discontinue any market-making in the January 2026 Notes or the October 2026 Notes at any time at their sole discretion. In addition, any market-making activity will be subject to limits imposed by law. Accordingly, we cannot assure you that a liquid trading market will be maintained for the January 2026 Notes and the October 2026 Notes, that holders will be able to sell their respective January 2026 Notes or October 2026 Notes at a particular time or that the price the holder receive when he or she sell will be favorable. To the extent an active trading market is not maintained, the liquidity and trading price for the January 2026 Notes and the October 2026 Notes may from time to time be significantly affected by numerous factors, including:adversely affected.
Creditworthiness;
Terms, including, but not limited to, maturity, principal amount, redemption, and repayment of convertible features;
Market and economic conditions; and
Demand for our debt securities.
In addition, credit rating assessments by third parties regarding our ability to pay our obligations will generally affect the market value of our debt securities.
If we default on our obligations to pay our other indebtedness, we may not be able to make payments on the January 2026 Notes and the October 2026 Notes.
Any default under the agreements governing our indebtedness, including a default under our Credit Facility, the respective indenture governing the December 2022January 2026 Notes orand the October 20242026 Notes, or other indebtedness to which we may be a party that is not waived by the required lenders or holders, and the remedies sought by lenders or the holders of such indebtedness could make us unable to pay principal, premium, if any, and interest on the January 2026 Notes and the October 2026 Notes and substantially decrease the market value of the Notes. If we are unable to generate sufficient cash flow and are otherwise unable to obtain funds necessary to meet required payments of principal, premium, if any, and interest on our indebtedness, or if we otherwise fail to comply with the various covenants, including financial and operating covenants, in the instruments governing our indebtedness (including the Credit Facility, the December 2022January 2026 Notes and the October 20242026 Notes), we could be in default under the terms of the agreements governing such indebtedness, including the Notes. In the event of such default, the holders of such indebtedness could elect to declare all the funds borrowed thereunder to be due and payable, together with accrued and unpaid interest, the lenders under the Credit Facility or other debt we may incur in the future could elect to terminate their commitment, cease making further loans and institute foreclosure proceedings against our assets, and we could be forced into bankruptcy or liquidation.
Our ability to generate sufficient cash flow in the future is, to some extent, subject to general economic, financial, competitive, legislative and regulatory factors as well as other factors that are beyond our control. We cannot assure you that our business will generate cash flow from operations, or that future borrowings will be available to us under the Credit Facility or otherwise, in an amount sufficient to enable us to meet our payment obligations under the Notes, our other debt, and to fund other liquidity needs.
If our operating performance declines and we are not able to generate sufficient cash flow to service our debt obligations, we may in the future need to refinance or restructure our debt, including the Notes, sell assets, reduce or delay capital investments, seek to raise additional capital or seek to obtain waivers from the lenders under the Credit Facility, the holders of the Notes, or other debt that we may incur in the future to avoid being in default. If we are unable to implement one or more of these alternatives, we may not be able to meet our payment obligations under the Notes and our other debt. If we breach our covenants under the Credit Facility, the respective indenture governing the January 2026 Notes and the October 2026 Notes, or any of our other debt and seek a waiver, we may not be able to obtain a waiver from the required lenders or holders thereof. If this occurs, we would be in default under the Credit Facility, the Notes, the respective indenture governing the January 2026 Notes and the October 2026 Notes, or other debt, the lenders or holders could exercise rights as described above, and we could be forced into bankruptcy or liquidation. If we are unable to repay debt, lenders having secured obligations could proceed against the collateral securing the debt. Because the Credit Facility has, and any future credit facilities will likely have, customary cross-default provisions, if the indebtedness under the January 2026 Notes and the October 2026 Notes, the Credit Facility or under any future credit facility is accelerated, we may be unable to repay or finance the amounts due.
Terms relating to redemption may materially adversely affect the return on our debt securities.
The January 2026 Notes are redeemable, in whole or in part, at any time at our option prior to October 31, 2025, at par plus a "make-whole" premium, and thereafter at par. The October 2026 Notes are redeemable, in whole or in part, at any time at our option prior to July 1, 2026 at par plus a "make-whole" premium, and thereafter at par. We may choose to redeem the January 2026 Notes or the October 2026 Notes at times when prevailing interest rates are lower than the interest rate paid on the January 2026 Notes or the October 2026 Notes.
We currently intend to pay quarterly dividends. However, in the future we may not pay any dividends depending on a variety of factors.
While we intend to pay dividends to our shareholders out of taxable income available for distribution, there can be no assurance that we will do so. Any dividends that we do pay may be payable in cash, in our common stock, or in stock in any of our holdings or in a combination of all three. All dividends will be paid at the discretion of our Board of Directors and will depend upon our financial condition, maintenance of our RIC tax treatment, and compliance with applicable BDC regulations.
We currently pay dividends in cash. However, in the future we may choose to pay dividends in our own stock, in which case you may be required to pay tax in excess of the cash you receive.
We may distribute taxable dividends that are payable in part in our common stock. Under certain applicable provisions of the Code and the Treasury regulations, distributions payable by us in cash or in shares of stock (at the shareholders election) would satisfy the annual distribution requirement for a RIC. The IRS has issued a revenue procedure providing that a dividend payable in stock or in cash at the election of the shareholders will be treated as a taxable dividend eligible for the dividends paid deduction provided that at least 20% of the total dividend is payable in cash and certain other requirements are satisfied. Taxable shareholders receiving such dividends will be required to include the full amount of the dividend as ordinary income (or as long-term capital gain to the extent such dividend is properly reported as a capital gain dividend) to the extent of our current and accumulated earnings and profits for U.S. federal income tax purposes. As a result, a U.S. shareholder may be required to pay tax with respect
to such dividends in excess of any cash received. If a U.S. shareholder sells the stock it receives as a dividend in order to pay this tax, the sales proceeds may be less than the amount included in income with respect to the dividend, depending on the market price of our common stock at the time of the sale. Furthermore, with respect to non-U.S. shareholders, we may be required to withhold U.S. tax with respect to such dividends, including in respect of all or a portion of such dividends payable in stock. If a significant number of our shareholders determine to sell shares of our common stock in order to pay taxes owed on dividends, it may put downward pressure on the trading price of our common stock.
We may not be able to invest a significant portion of the net proceeds from future capital raises on acceptable terms, which could harm our financial condition and operating results.
Delays in investing the net proceeds raised in an offering may cause our performance to be worse than that of other fully invested BDCs or other lenders or investors pursuing comparable investment strategies. We cannot assure you that we will be able to identify any investments that meet our investment objective or that any investment that we make will produce a positive return. We may be unable to invest the net proceeds of any offering on acceptable terms within the time period that we anticipate or at all, which could harm our financial condition and operating results.
In the event that we cannot invest our net proceeds as desired we will invest the net proceeds from any offering primarily in cash, cash equivalents, U.S. Government securities and other high-quality debt investments that mature in one year or less from the time of investment. These securities may have lower yields than our other investments and accordingly may result in lower distributions, if any, during such period.
Terms relating to redemption may materially adversely affect the return on our debt securities.
The December 2022 Notes are redeemable, in whole or in part, at our option on or after December 15, 2019. The October 2024 Notes are redeemable, in whole or in part, at any time at our option prior to July 1, 2024, at par plus a "make-whole" premium, and thereafter at par. We may choose to redeem the December 2022 Notes or the October 2024 Notes at times when prevailing interest rates are lower than the interest rate paid on the December 2022 Notes or the October 2024 Notes. In addition, if the December 2022 Notes are subject to mandatory redemption, we may be required to redeem the December 2022 Notes at times when prevailing interest rates are lower than the interest rate paid on the December 2022 Notes. In this circumstance, a holder of the December 2022 Notes may not be able to reinvest the redemption proceeds in a comparable security at an effective interest rate as high as the December 2022 Notes being redeemed.
Provisions of the Texas law and our charter could deter takeover attempts and have an adverse impact on the price of our common stock.
Texas law and our charter contain provisions that may have the effect of discouraging, delaying or making difficult a change in control. The existence of these provisions, among others, may have a negative impact on the price of our common stock and may discourage third-party bids for ownership of our company.the Company. These provisions may prevent any premiums being offered to you for our common stock.
Item 1B. Unresolved Staff Comments
None.
Item 2. Properties
We do not own any real estate or other physical properties. We maintain our offices at 5400 Lyndon B. Johnson Freeway,8333 Douglas Avenue, Suite 1300,1100, Dallas, Texas 75240,75225, where we lease approximately 9,26113,000 square feet of office space pursuant to a lease agreement expiring in February 2022.September 2032. We believe that our offices are adequate to meet our current and expected future needs.
Item 3. Legal Proceedings
We and our subsidiaries may, from time to time, be involved in litigation arising out of our operations in the normal course of business or otherwise. Furthermore, third parties may try to seek to impose liability on us in connection with the activities of our portfolio companies. As of the date hereof, we and our subsidiaries are not a party to, and none of our assets are subject to, any material pending legal proceedings and are not aware of any claims that could have a materially adverse effect on our financial position, results of operations or cash flows.
Item 4. Mine Safety Disclosures
Not applicable.
PART II
Item 5. Market for Registrant’s Common Equity, Related Shareholder Matters and Issuer Purchases of Equity Securities
SENIOR SECURITIES
Information about our senior securities is shown in the following table for the years ended March 31, 2023, 2022, 2021 2020, 2019, 2018 and 2017. The Company did not have any senior securities outstanding prior to the year ended March 31, 2017. The report of RSM US LLP, our independent registered public accountants for the fiscal years ended March 31, 2023, 2022, 2021 2020, 2019, and 2018, on the senior securities table as of March 31, 2023, 2022, 2021 2020, 2019, and 2018 is attached as an exhibit to this Annual Report on Form 10-K.
| | | | | | | | | | | | | | | | | | | | | | | | | | |
| Class and Year | | Total Amount Outstanding Exclusive of Treasury Securities (1) | | Asset Coverage per Unit (2) | | Involuntary Liquidating Preference per Unit (3) | | Average Market Value per Unit (4) |
| | (dollars in thousands) | | | | | | |
| Credit Facility | | | | | | | | |
| 2023 | | $ | 235,000 | | | 2.35 | | | — | | | N/A |
| 2022 | | 205,000 | | | 1.93 | | | — | | | N/A |
| 2021 | | 120,000 | | | 1.87 | | | — | | | N/A |
| 2020 | | 154,000 | | | 1.89 | | | — | | | N/A |
| 2019 | | 141,000 | | | 2.49 | | | — | | | N/A |
| 2018 | | 40,000 | | | 4.16 | | | — | | | N/A |
| 2017 | | 25,000 | | | 12.40 | | | — | | | N/A |
| December 2022 Notes | | | | | | | | |
| 2023 | | $ | — | | | — | | | — | | | N/A |
| 2022 | | — | | | — | | | — | | | N/A |
| 2021 | | — | | | — | | | — | | | N/A |
| 2020 | | 77,136 | | | 1.89 | | | — | | | 22.01 | |
| 2019 | | 77,136 | | | 2.49 | | | — | | | 25.50 | |
| 2018 | | 57,500 | | | 4.16 | | | — | | | 25.40 | |
| 2017 | | — | | | — | | | — | | | N/A |
| October 2024 Notes | | | | | | | | |
| 2023 | | $ | — | | | — | | | — | | | N/A |
| 2022 | | — | | | — | | | — | | | N/A |
| 2021 | | 125,000 | | | 1.87 | | | — | | | N/A |
| 2020 | | 75,000 | | | 1.89 | | | — | | | N/A |
| 2019 | | — | | | — | | | — | | | N/A |
| 2018 | | — | | | — | | | — | | | N/A |
| 2017 | | — | | | — | | | — | | | N/A |
| January 2026 Notes | | | | | | | | |
| 2023 | | $ | 140,000 | | | 2.35 | | | — | | | N/A |
| 2022 | | 140,000 | | | 1.93 | | | — | | | N/A |
| 2021 | | 140,000 | | | 1.87 | | | — | | | N/A |
| 2020 | | — | | | — | | | — | | | N/A |
| 2019 | | — | | | — | | | — | | | N/A |
| 2018 | | — | | | — | | | — | | | N/A |
| 2017 | | — | | | — | | | — | | | N/A |
|
| | | | | | | | | | | | | | |
| Class and Year | | Total Amount Outstanding Exclusive of Treasury Securities (1) | | Asset Coverage per Unit (2) | | Involuntary Liquidating Preference per Unit (3) | | Average Market Value per Unit (4) |
| | | (dollars in thousands) | | | | | | |
| Credit Facility | | | | | | | | |
| 2020 | | $ | 154,000 |
| | 1.89 |
| | — |
| | N/A |
|
| 2019 | | 141,000 |
| | 2.49 |
| | — |
| | N/A |
|
| 2018 | | 40,000 |
| | 4.16 |
| | — |
| | N/A |
|
| 2017 | | 25,000 |
| | 12.40 |
| | — |
| | N/A |
|
| December 2022 Notes | | | | | | | | |
| 2020 | | $ | 77,136 |
| | 1.89 |
| | — |
| | $ | 22.01 |
|
| 2019 | | 77,136 |
| | 2.49 |
| | — |
| | 25.50 |
|
| 2018 | | 57,500 |
| | 4.16 |
| | — |
| | 25.40 |
|
| 2017 | | — |
| | — |
| | — |
| | — |
|
| October 2024 Notes | | | | | | | | |
| 2020 | | $ | 75,000 |
| | 1.89 |
| | — |
| | N/A |
|
| 2019 | | — |
| | — |
| | — |
| | N/A |
|
| 2018 | | — |
| | — |
| | — |
| | N/A |
|
| 2017 | | — |
| | — |
| | — |
| | N/A |
|
| | | | | | | | | | | | | | | | | | | | | | | | | | |
| October 2026 Notes | | | | | | | | |
| 2023 | | $ | 150,000 | | | 2.35 | | | — | | | N/A |
| 2022 | | 150,000 | | | 1.93 | | | — | | | N/A |
| |
(1) | Total amount of each class of senior securities outstanding at the end of the period presented. |
| |
(2) | Asset coverage per unit is the ratio of the carrying value of our total consolidated assets, less all liabilities and indebtedness not represented by senior securities, to the aggregate amount of senior securities representing indebtedness. Asset coverage per unit is expressed in terms of dollar amounts per $1,000 of indebtedness. |
| |
(3) | The amount to which such class of senior security would be entitled upon the involuntary liquidation of the issuer in preference to any security junior to it. The “-” indicates information which the SEC expressly does not required to be disclosed for certain types of senior securities. |
| |
(4) | Average market value per unit for our Credit Facility and October 2024 Notes is not applicable because these are not registered for public trading. |
(1)Total amount of each class of senior securities outstanding at the end of the period presented. (2)Asset coverage per unit is the ratio of the carrying value of our total consolidated assets, less all liabilities and indebtedness not represented by senior securities, to the aggregate amount of senior securities representing indebtedness. Asset coverage per unit is expressed in terms of dollar amounts per $1,000 of indebtedness. On August 11, 2021, we received an exemptive order from the SEC to permit us to exclude the senior securities issued by SBIC I or any future SBIC subsidiary of CSWC from the definition of senior securities in the asset coverage requirement applicable to CSWC under the 1940 Act.
(3)The amount to which such class of senior security would be entitled upon the involuntary liquidation of the issuer in preference to any security junior to it. The “-” indicates information which the SEC expressly does not required to be disclosed for certain types of senior securities.
(4)Average market value per unit for our Credit Facility, October 2024 Notes, January 2026 Notes and October 2026 Notes is not applicable because these are not registered for public trading.
PRICE RANGE OF COMMON STOCK AND HOLDERS
Market Information
Our common stock is traded on the Nasdaq Global Select Market under the symbol “CSWC.”
The following table sets forth, for each fiscal quarter within the two most recent fiscal years and the current fiscal year to date, the range of high and low selling prices of our common stock as reported on the Nasdaq Global Select Market, as applicable, and the sales price as a percentage of the NAV per share of our common stock.
| | | | | | | | | | | | | | | | | | | | | | | | | | | | | |
| | | Price Range | | | | |
| NAV (1) | | High | | Low | | Premium (Discount) of High Sales Price to NAV (2) | | Premium (Discount) of Low Sales Price to NAV (2) |
| Year ending March 31, 2024 | | | | | | | | | |
| First Quarter (through May 19, 2023) | * | | $ | 18.67 | | | $ | 17.22 | | | * | | * |
| Year ended March 31, 2023 | | | | | | | | | |
| Fourth Quarter | $ | 16.37 | | | $ | 20.20 | | | $ | 16.34 | | | 23.40 | % | | (0.18) | % |
| Third Quarter | 16.25 | | | 19.72 | | | 16.28 | | | 21.36 | | | 0.18 | |
| Second Quarter | 16.53 | | | 21.23 | | | 16.70 | | | 28.43 | | | 1.03 | |
| First Quarter | 16.54 | | | 24.40 | | | 17.79 | | | 47.52 | | | 7.56 | |
| Year ended March 31, 2022 | | | | | | | | | |
| Fourth Quarter | $ | 16.86 | | | $ | 26.61 | | | $ | 22.78 | | | 57.83 | % | | 35.11 | % |
| Third Quarter | 16.19 | | | 28.41 | | | 23.75 | | | 75.48 | | | 46.70 | |
| Second Quarter | 16.36 | | | 28.33 | | | 23.28 | | | 73.17 | | | 42.30 | |
| First Quarter | 16.58 | | | 28.10 | | | 22.16 | | | 69.48 | | | 33.66 | |
|
| | | | | | | | | | | | | | | | | |
| | | | | Price Range | | | | |
| | | NAV (1) | | High | | Low | | Premium (Discount) of High Sales Price to NAV (2) | | Premium (Discount) of Low Sales Price to NAV (2) |
| Year ending March 31, 2020 | | | | | | | | | | |
| Fourth Quarter | $ | 15.13 |
| | $ | 21.71 |
| | $ | 7.39 |
| | 43.49 | % | | (51.16 | )% |
| Third Quarter | | 16.74 |
| | 22.56 |
| | 20.60 |
| | 34.77 |
| | 23.06 |
|
| Second Quarter | | 18.30 |
| | 22.90 |
| | 20.57 |
| | 25.14 |
| | 12.40 |
|
| First Quarter | | 18.58 |
| | 22.49 |
| | 20.86 |
| | 21.04 |
| | 12.27 |
|
| Year ending March 31, 2019 | | | | | | | | | | |
| Fourth Quarter | $ | 18.62 |
| | $ | 22.60 |
| | $ | 19.06 |
| | 21.37 | % | | 2.36 | % |
| Third Quarter | | 18.43 |
| | 24.18 |
| | 17.22 |
| | 31.20 |
| | (6.57 | ) |
| Second Quarter | | 18.84 |
| | 19.80 |
| | 18.00 |
| | 5.10 |
| | (4.46 | ) |
| First Quarter | | 18.87 |
| | 19.38 |
| | 16.53 |
| | 2.70 |
| | (12.4 | ) |
(2)Calculated as the respective high or low share price divided by NAV and subtracting 1.
| |
(1) | NAV per share, is determined as of the last day in the relevant quarter and therefore may not reflect the NAV per share on the date of the high and low sales prices. The NAVs shown are based on outstanding shares at the end of each period. |
| |
(2) | Calculated as the respective high or low share price divided by NAV and subtracting 1. |
*Not determinable at the time of filing.
Our common stock is traded on The Nasdaq Global Select Market under the symbol “CSWC.” On May 29, 2020,19, 2023, there were approximately 387333 holders of record of our common stock, which did not include shareholders for whom shares are held in "nominee" or "street name."
Shares of BDCs may trade at a market price that is less than the value of the net assets attributable to those shares. The possibility that our shares of common stock will trade at a discount from net asset value per share or at premiums that are unsustainable over the long term are separate and distinct from the risk that our net asset value per share will decrease. It is not possible to predict whether our common stock will trade at, above, or below net asset value per share.
DISTRIBUTIONS
We intend to make distributions on a quarterly basis to our shareholders of substantially all of our taxable income. In lieu of cash, we may make deemed distributions of certain net capital gains to our shareholders.
The payment dates and amounts of cash dividends per share for the past three fiscal years are as follows:
|
| | | |
| Payment Date | Cash Dividend |
| Fiscal Year 2020 | |
June 28, 20191 | $ | 0.49 |
|
September 30, 20191 | 0.50 |
|
December 31, 20192 | 1.25 |
|
March 31, 20201 | 0.51 |
|
| | $ | 2.75 |
|
| | |
| Fiscal Year 2019 | |
July 2, 20183 | $ | 0.89 |
|
September 28, 20181 | 0.44 |
|
December 31, 20181 | 0.46 |
|
March 29, 20191 | 0.48 |
|
| | $ | 2.27 |
|
| | |
| Fiscal Year 2018 | |
| July 3, 2017 | $ | 0.21 |
|
| October 2, 2017 | 0.24 |
|
| January 2, 2018 | 0.26 |
|
| April 2, 2018 | 0.28 |
|
| | $ | 0.99 |
|
| |
| On each of these dates, the cash dividend paid included a supplemental dividend of $0.10 per share. |
| |
2
| On December 31, 2019, CSWC paid a regular dividend of $0.40 per share, a supplemental dividend of $0.10 per share and a special dividend of $0.75 per share. |
| |
3
| On July 2, 2018, CSWC paid a regular dividend of $0.29 per share and a supplemental dividend of $0.60 per share. |
On April 22, 2020, the Company’s Board of Directors declared a total dividend of $0.51 per share, comprised of a regular dividend of $0.41 and a supplemental dividend of $0.10, for the quarter ended June 30, 2020. The record date for the dividend is June 15, 2020. The payment date for the dividend is June 30, 2020.
On May 28, 2020, the Board of Directors declared a total dividend of $0.51 per share, comprised of a regular dividend of $0.41 and a supplemental dividend of $0.10, for the quarter ended September 30, 2020. The record date for the dividend is September 15, 2020. The payment date for the dividend is September 30, 2020.
The amounts and timing of cash dividend payments have generally been dictated by requirements of the Code regarding the distribution of taxable net investment income (ordinary income) of regulated investment companies.
Distribution PolicyDISTRIBUTION POLICY
We generally intend to make distributions on a quarterly basis to our shareholders of substantially all of our taxable income. In order to avoid certain excise taxes imposed on RICs, we must distribute during each calendar year an amount at least equal to the sum of (1) 98% of our ordinary income for the calendar year, (2) 98.2% of our capital gains in excess of capital losses for the onecalendar year period ended each OctoberDecember 31, and (3) any ordinary income and net capital gains for the preceding year that were not distributed during that year. We will not be subject to excise taxes on amounts on which we are required to pay corporate income tax (such as retained net capital gains). In order to obtain the tax benefits applicable to RICs, we will be required to distribute to our shareholders with respect to each taxable year at least 90% of our ordinary income and realized net short-term capital gains in excess of realized net long-term capital losses. Depending on the level of taxableWe may be subject to U.S. federal income earned in a tax year, we may choose to carry forward taxable income in excess of current year distributions into the next year and pay a 4% U.S. federal
excise tax on such income. Any such carryover taxableany income mustthat we do not timely distribute to our shareholders. Our U.S. federal income tax liability may be distributed through a dividend declared prior to filing the final tax return relatedreduced to the extent that we make certain distributions during the following calendar year that generated such taxable income.and satisfy other procedural requirements.
We may retain for investment realized net long-term capital gains in excess of realized net short-term capital losses. We may make deemed distributions to our shareholders of any retained net capital gains. If this happens, our shareholders will be treated as if they received an actual distribution of the capital gains we retain and then reinvested the net after-tax proceeds in our common stock. Our shareholders also may be eligible to claim a tax credit (or, in certain circumstances, a tax refund) equal to their allocable share of the tax we paid on the capital gains deemed distributed to them. Please refer to “Business —Material U.S. Federal Income Tax Considerations” included in Item 1 of Part I of this Annual Report for further information regarding the consequences of our retention of net capital gains. We may, in the future, make actual distributions to our shareholders of some or all realized net long-term capital gains in excess of realized net short-term capital losses. Our ability to make distributions in the future may be limited by our Credit Facility, the indenture and related supplementsindentures governing each of our December 2022January 2026 Notes and our October 20242026 Notes and the 1940 Act. For a more detailed discussion, see “Business — Election to be Regulated as a Business Development Company – Regulation as a Business Development Company,” “Management’s Discussion and Analysis of Financial Condition and Results of Operations,” and “Note 5” to our consolidated financial statements included in this Annual Report on Form 10K.10-K.
We have adopted a DRIP which provides for reinvestment of our distributions on behalf of our common shareholders if opted into by a common shareholder. See “Business — Dividend Reinvestment Plan” included in Item I of Part I of this Annual Report on Form 10-K.
Shareholders who receive dividends in the form of stock generally are subject to the same federal, state and local tax consequences as are shareholders who elect to receive their dividends in cash. A shareholder’s basis for determining gain or loss upon the sale of stock received in a dividend from us will be equal to the total dollar amount of the dividend payable to the shareholder. Any stock received in a dividend will have a holding period for tax purposes commencing on the day following the day on which the shares are credited to the U.S. shareholder’s account.
RECENT SALES OF UNREGISTERED EQUITY SECURITIES
We did not sell any securities during the period covered by this Annual Report that were not registered under the Securities Act of 1933.1933, as amended.
ISSUER PURCHASES OF EQUITY SECURITIES
In January 2016,On July 28, 2021, the Company’s Board of Directors approved a share repurchase program authorizing the Company to repurchase up to $10$20 million of its outstanding shares of common stock in the open market at certain thresholds below its NAV per share, in accordance with guidelines specified in Rules 10b5-1(c)(1)(i)(B) and 10b-18 under the Securities Exchange Act of 1934.Act. On March 1, 2016,August 31, 2021, the Company entered into a share repurchase agreement, which became effective immediately, and shall terminate on the earliest of:Company will cease purchasing its common stock under the share repurchase program upon the earlier of, among other things: (1) the date on which a total of $10the aggregate purchase price for all shares equals $20 million worth of commonincluding, without limitation, all applicable fees, costs and expenses; or (2) upon written notice by the Company to the broker that the share repurchase agreement is terminated. During the year ended March 31, 2023, the Company did not repurchase any shares have been purchased under the plan; (2) the date on which the terms set forth in the purchase instructions have been met; or (3) the date that is one trading day after the date on which insider notifies broker in writing that this agreement shall terminate.share repurchase program.
The following table provides information forregarding purchases of our common stock during the year ended March 31, 2020.2023.
|
| | | | | | | | | | | | | | |
| Period | | Total Number of Shares Purchased | | Average Price Paid Per Share | | Total Number of Shares Purchased as Part of Publicly Announced Plans or Programs | | Approximate Dollar Value of Shares That May Yet Be Purchased Under the Plans or Programs (2) |
| April 1 through April 30, 2019 (1) | | 2,258 |
| | $ | 21.87 |
| | — |
| | $ | — |
|
| May 1 through May 31, 2019 | | — |
| | — |
| | — |
| | — |
|
| June 1 through June 30, 2019 | | — |
| | — |
| | — |
| | — |
|
| July 1 through July 31, 2019 | | — |
| | — |
| | — |
| | — |
|
| August 1 through August 31, 2019 | | — |
| | — |
| | — |
| | — |
|
| September 1 through September 30, 2019 | | — |
| | — |
| | — |
| | — |
|
| October 1 through October 31, 2019 | | — |
| | — |
| | — |
| | — |
|
| November 1 through November 30, 2019 (1) | | 17,570 |
| | 20.93 |
| | — |
| | — |
|
| December 1 through December 31, 2019 | | — |
| | — |
| | — |
| | — |
|
| January 1 through January 31, 2020 (1) | | 37 |
| | 21.19 |
| | — |
| | — |
|
| February 1 through February 29, 2020 | | — |
| | — |
| | — |
| | — |
|
| March 1 through March 31, 2020 | | 794,180 |
| | 11.57 |
| | 794,180 |
| | 42,715 |
|
| Total | | 814,045 |
| | $ | 11.80 |
| | 794,180 |
| | $ | 42,715 |
|
| | | | | | | | | | | | | | | | | | | | | | | | | | |
| Period | | Total Number of Shares Purchased | | Average Price Paid Per Share | | Total Number of Shares Purchased as Part of Publicly Announced Plans or Programs | | Approximate Dollar Value of Shares That May Yet Be Purchased Under the Plans or Programs (2) |
| April 1 through April 30, 2022 | | — | | | $ | — | | | — | | | $ | — | |
| May 1 through May 31, 2022 | | — | | | — | | | — | | | — | |
| June 1 through June 30, 2022 (1) | | 29,673 | | | 21.60 | | | — | | | — | |
| July 1 through July 31, 2022 | | — | | | — | | | — | | | — | |
| August 1 through August 31, 2022 | | — | | | — | | | — | | | — | |
| September 1 through September 30, 2022 | | — | | | — | | | — | | | — | |
| October 1 through October 31, 2022 | | — | | | — | | | — | | | — | |
| November 1 through November 30, 2022 (1) | | 19,917 | | | 19.09 | | | — | | | — | |
| December 1 through December 31, 2022 | | — | | | — | | | — | | | — | |
| January 1 through January 31, 2023 | | — | | | — | | | — | | | — | |
| February 1 through February 28, 2023 | | — | | | — | | | — | | | — | |
| March 1 through March 31, 2023 | | — | | | — | | | — | | | — | |
| Total | | 49,590 | | | $ | 20.59 | | | — | | | $ | — | |
| |
(1) | Represents shares of common stock withheld upon vesting of restricted stock to cover withholding tax obligations. |
| |
(2) | On January 25, 2016, we announced that our Board of Directors authorized us to repurchase an indeterminate number of shares of our common stock at an aggregate market value of up to $10 million. The repurchase program will be in effect until the approved dollar amount has been used to repurchase shares or the Board amends or discontinues the plan at any time. |
(1)Represents shares of common stock withheld upon vesting of restricted stock to cover withholding tax obligations.
(2)On July 28, 2021, the Company’s Board of Directors approved a share repurchase program authorizing the Company to repurchase up to $20 million of its outstanding shares of common stock in the open market at certain thresholds below its NAV per share, in accordance with guidelines specified in Rules 10b5-1(c)(1)(i)(B) and 10b-18 under the Exchange Act. On August 31, 2021 the Company entered into a share repurchase agreement, which became effective immediately, and the Company shall cease purchasing its common stock under the share repurchase program upon the earlier of, among other things: (1) the date on which the aggregate purchase price for all shares equals $20 million including, without limitation, all applicable fees, costs and expenses; or (2) upon written notice by the Company to the broker that the share repurchase agreement is terminated. During the year ended March 31, 2023, the Company did not repurchase any shares under the share repurchase program. As of March 31, 2023, the Company has $20 million available under the share repurchase program.
Performance Graph
The following graph compares our cumulative total shareholder return during the last five years (based on the market price of our common stock and assuming reinvestment of all dividends, prior to any tax effect) with the Nasdaq Composite Total Return Index, the Russell 2000 Total ReturnETF, the S&P BDC Index and the KBWS&P Regional Bank Total Return Index, as we do not believe that there is an appropriate index of companies with an investment strategy similar to our own with which to compare the return on our common stock.Banking ETF. The graph assumes initial investment of $100 on March 31, 20152018 and reinvestment of dividends. The graph measures total shareholder return, which takes into account both changes in stock price and distributions. It assumes that distributions paid are invested in like securities. The value of the CSWI shares distributed in the Share Distribution is reflected in the cumulative total return as a reinvested dividend.
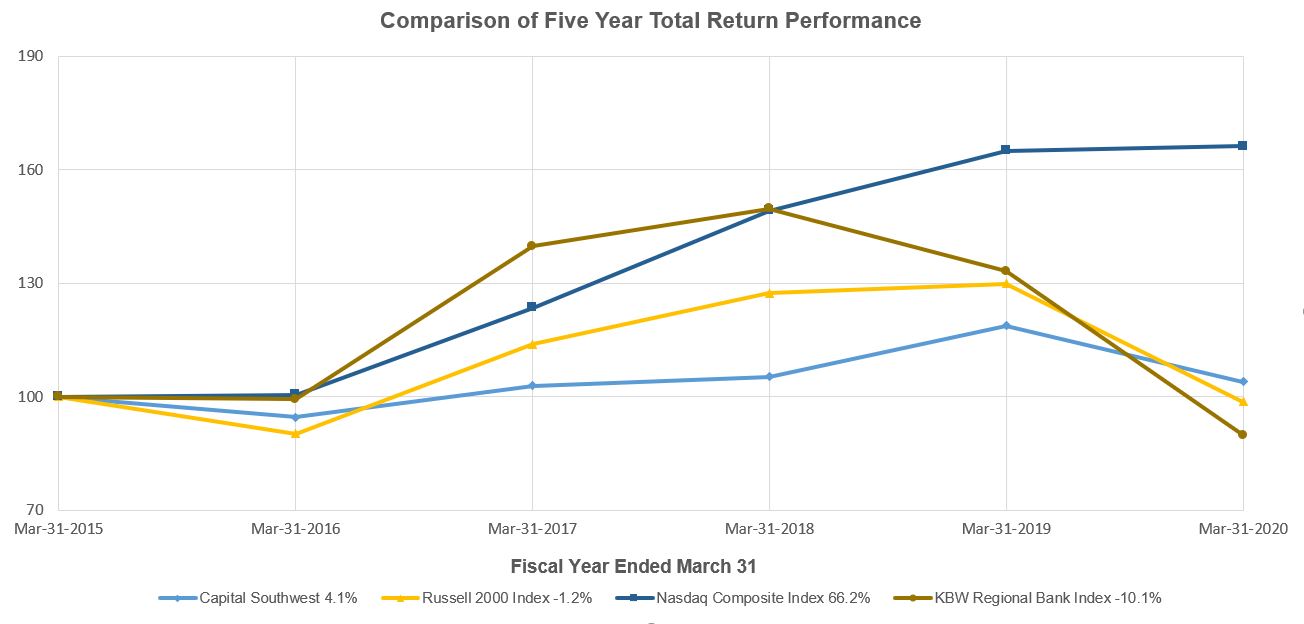
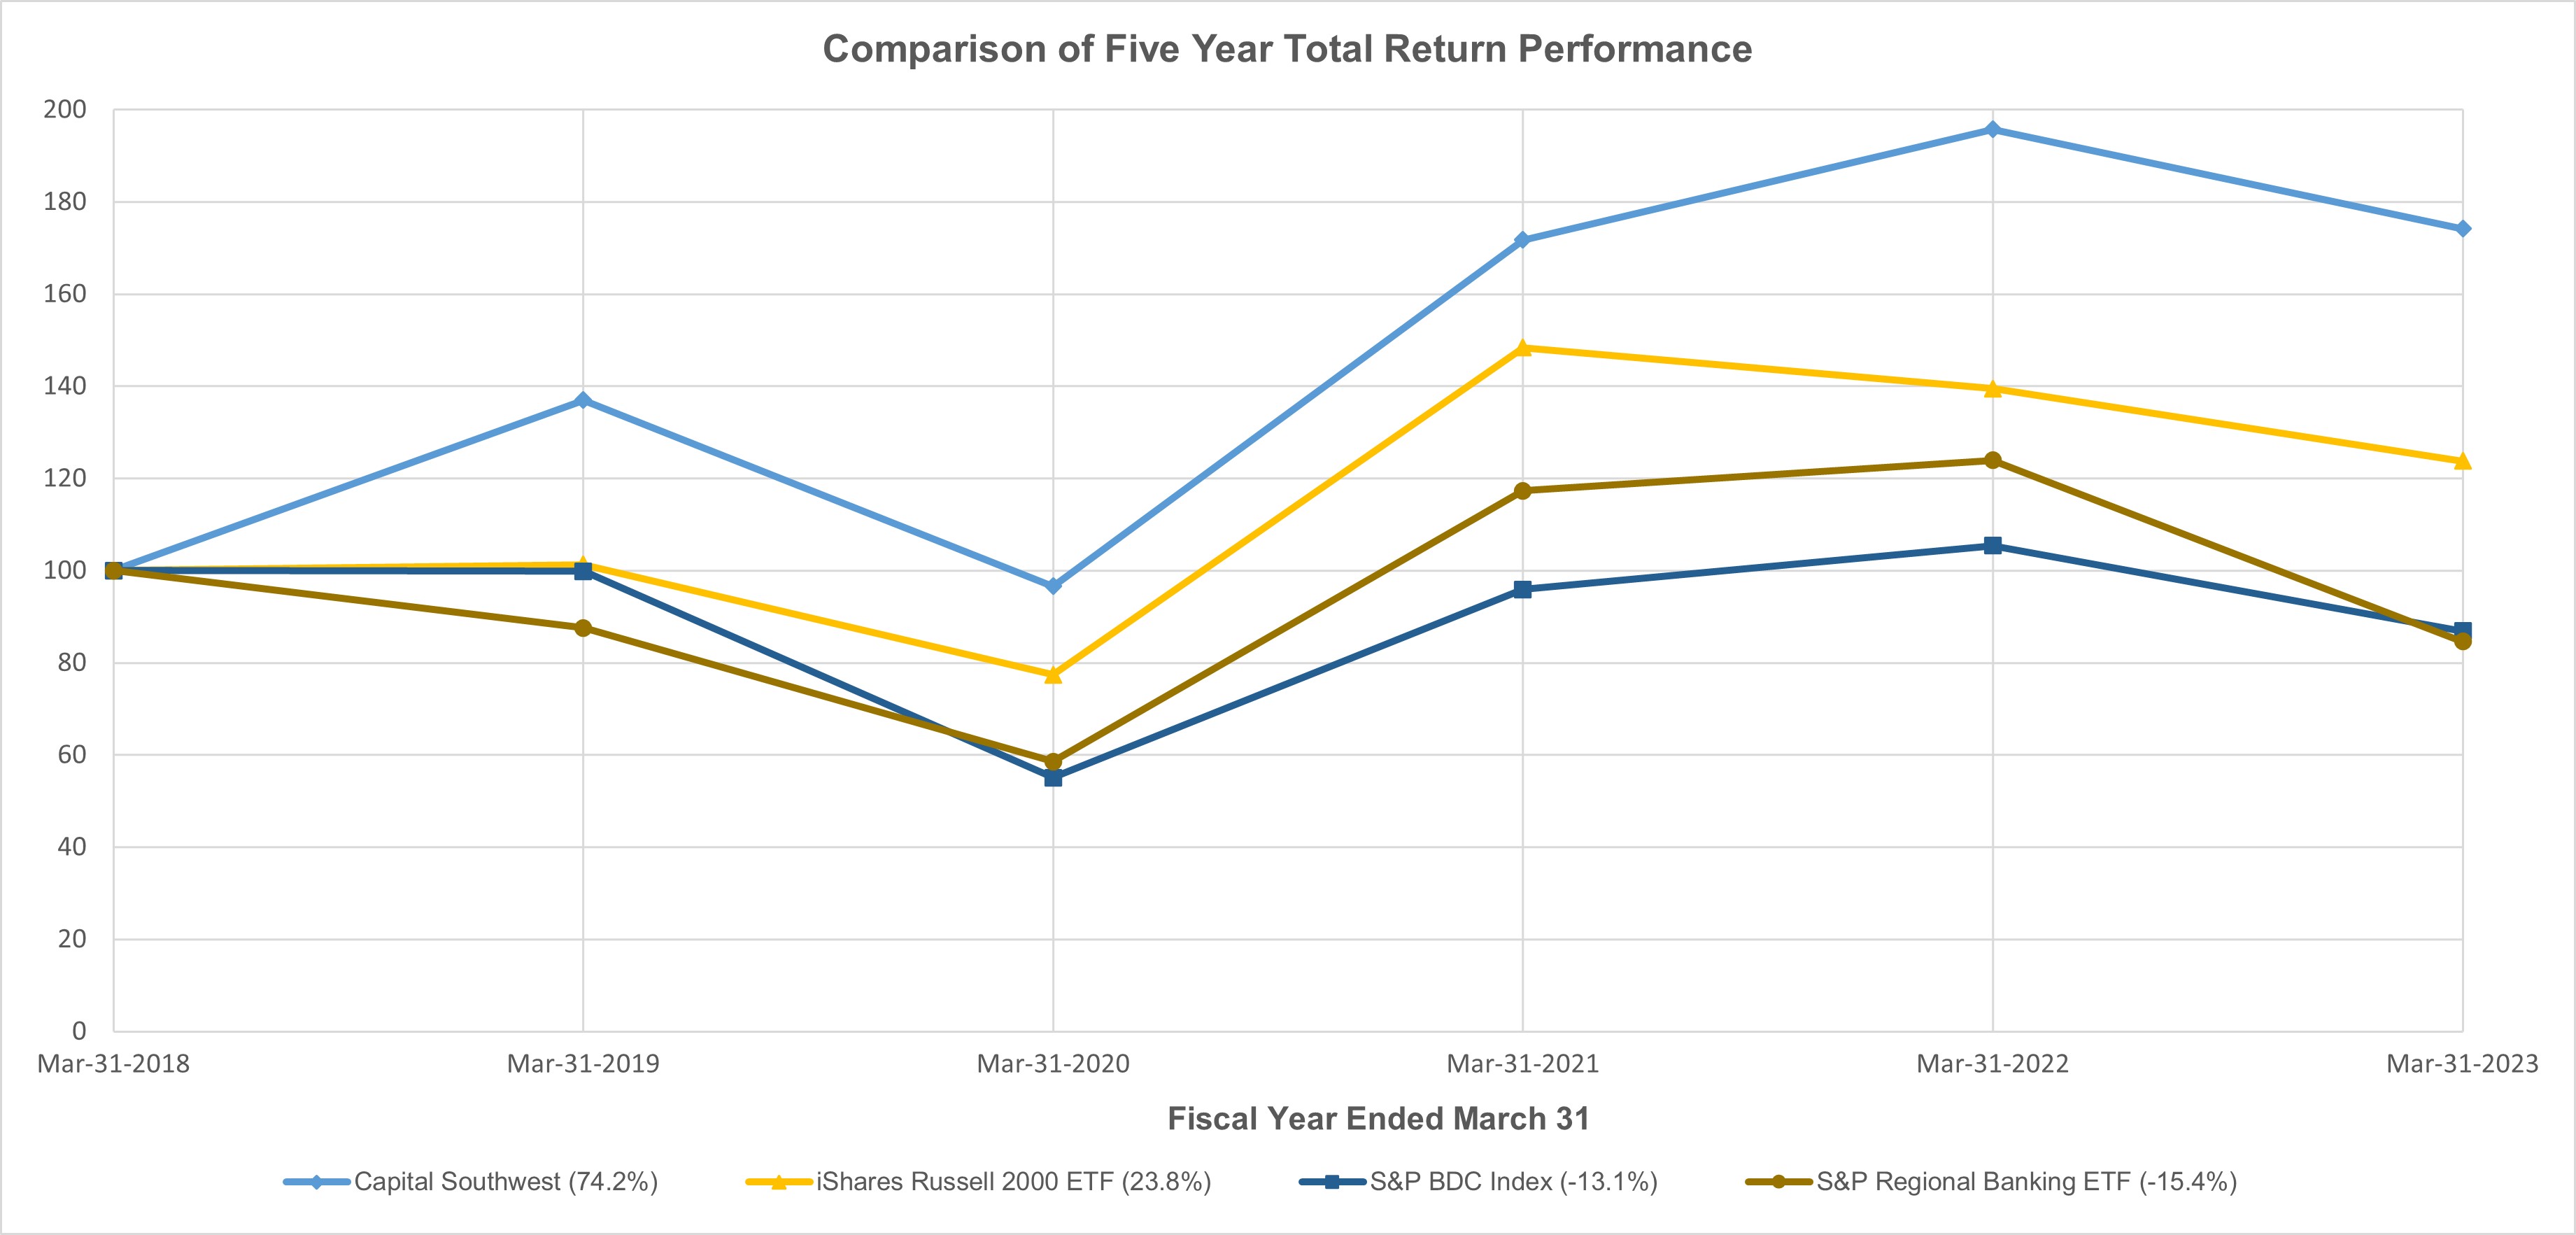
The graph and other information furnished under this Part II Item 5 of this Annual Report on Form 10-K shall not be deemed to be "soliciting material" or to be filed with the SEC or subject to Regulation 14A or 14C, or to the liabilities of Section 18 of the Exchange Act. The stock price performance included in the above graph is not necessarily indicative of future stock performance.
Item 6. Selected Financial Data[Reserved]
The following table provides selected financial data relating to our historical financial condition and results of operations as of and for each of the years ended March 31, 2016 through 2020. This data should be read in conjunction with Item 7, “Management’s Discussion and Analysis of Financial Condition and Results of Operations” and the consolidated financial statements and related notes.
Selected Consolidated Financial Data
(In thousands except per share data)
|
| | | | | | | | | | | | | | | | | | | |
| | Year ended March 31, |
| | 2020 | | 2019 | | 2018 | | 2017 | | 2016 |
| Income statement data: | | | | | | | | | |
| Investment income: | | | | | | | | | |
| Interest and dividends | $ | 59,361 |
| | $ | 50,192 |
| | $ | 34,233 |
| | $ | 22,324 |
| | $ | 8,033 |
|
| Interest income from cash and cash equivalents | 73 |
| | 36 |
| | 21 |
| | 166 |
| | 386 |
|
| Fees and other income | 2,605 |
| | 1,653 |
| | 872 |
| | 984 |
| | 741 |
|
| Total investment income | 62,039 |
| | 51,881 |
| | 35,126 |
| | 23,474 |
| | 9,160 |
|
| Operating expenses: | | | | | | | | | |
| Compensation-related expenses | 10,163 |
| | 9,986 |
| | 9,238 |
| | 8,217 |
| | 9,515 |
|
| Interest expense | 15,836 |
| | 12,178 |
| | 4,875 |
| | 989 |
| | — |
|
| General, administrative and other | 5,746 |
| | 4,959 |
| | 4,585 |
| | 4,601 |
| | 11,610 |
|
| Total operating expenses | 31,745 |
| | 27,123 |
| | 18,698 |
| | 13,807 |
| | 21,125 |
|
| Income (loss) before income taxes | 30,294 |
| | 24,758 |
| | 16,428 |
| | 9,667 |
| | (11,965 | ) |
| Income tax expense (benefit) | 2,062 |
| | 1,048 |
| | 195 |
| | 1,779 |
| | (1,278 | ) |
| Net investment income (loss) | 28,232 |
| | 23,710 |
| | 16,233 |
| | 7,888 |
| | (10,687 | ) |
| Net realized gains (losses): | | | | | | | | | |
| Non-control/Non-affiliate investments | 1,335 |
| | 2,124 |
| | 1,492 |
| | 3,992 |
| | (9,575 | ) |
| Affiliate investments | 57 |
| | 77 |
| | 90 |
| | 3,876 |
| | (1,458 | ) |
| Control investments | 44,300 |
| | 18,653 |
| | — |
| | 28 |
| | 231 |
|
| Taxes on deemed distribution of long-term capital gains | (3,461 | ) | | — |
| | — |
| | — |
| | — |
|
| Net realized gains (losses) on investments | 42,231 |
| | 20,854 |
| | 1,582 |
| | 7,896 |
| | (10,802 | ) |
| Net unrealized appreciation (depreciation) on investments | (92,814 | ) | | (11,506 | ) | | 21,492 |
| | 7,690 |
| | 16,089 |
|
| Net realized and unrealized (losses) gains on investments | (50,583 | ) | | 9,348 |
| | 23,074 |
| | 15,586 |
| | 5,287 |
|
| Net increase (decrease) in net assets resulting from operations | $ | (22,351 | ) | | $ | 33,058 |
| | $ | 39,307 |
| | $ | 23,474 |
| | $ | (5,400 | ) |
| Pre-tax net investment income (loss) per share - basic and diluted | $ | 1.68 |
| | $ | 1.48 |
| | $ | 1.02 |
| | $ | 0.61 |
| | $ | (0.76 | ) |
| Net investment income (loss) per share - basic and diluted | $ | 1.57 |
| | $ | 1.42 |
| | $ | 1.01 |
| | $ | 0.50 |
| | $ | (0.68 | ) |
Net realized earnings per share - basic and diluted1 | $ | 3.91 |
| | $ | 2.66 |
| | $ | 1.11 |
| | $ | 1.00 |
| | $ | (1.37 | ) |
| Net increase (decrease) in net assets from operations - basic and diluted | $ | (1.24 | ) | | $ | 1.98 |
| | $ | 2.45 |
| | $ | 1.48 |
| | $ | (0.35 | ) |
| Net asset value per common share | $ | 15.13 |
| | $ | 18.62 |
| | $ | 19.08 |
| | $ | 17.80 |
| | $ | 17.34 |
|
| Total dividends/distributions declared per common share | $ | 2.75 |
| | $ | 2.27 |
| | $ | 0.99 |
| | $ | 0.79 |
| | $ | 0.14 |
|
| Weighted average number of shares outstanding – basic | 18,000 |
| | 16,727 |
| | 16,074 |
| | 15,825 |
| | 15,636 |
|
| Weighted average number of shares outstanding – diluted | 18,000 |
| | 16,734 |
| | 16,139 |
| | 15,877 |
| | 15,724 |
|
| |
1
| “Net realized earnings per share – basic and diluted” is calculated as the sum of “Net investment income (loss)” and “Net realized gain (loss) on investments” divided by weighted average shares outstanding – basic and diluted. |
|
| | | | | | | | | | | | | | | | | | | |
| | Year ended March 31, |
| | 2020 | | 2019 | | 2018 | | 2017 | | 2016 |
| Balance sheet data: | | | | | | | | | |
| Assets: | | | | | | | | | |
| Investments at fair value | $ | 553,072 |
| | $ | 524,071 |
| | $ | 393,095 |
| | $ | 286,880 |
| | $ | 178,436 |
|
| Cash and cash equivalents | 13,744 |
| | 9,924 |
| | 7,907 |
| | 22,386 |
| | 95,969 |
|
| Interest, escrow and other receivables | 12,230 |
| | 11,049 |
| | 5,894 |
| | 4,308 |
| | 6,405 |
|
| Deferred tax asset | 1,402 |
| | 1,807 |
| | 2,050 |
| | 2,017 |
| | 2,342 |
|
| Other assets | 4,511 |
| | 4,992 |
| | 8,544 |
| | 10,161 |
| | 1,341 |
|
| Total assets | $ | 584,959 |
| | $ | 551,843 |
| | $ | 417,490 |
| | $ | 325,752 |
| | $ | 284,493 |
|
| Liabilities: | | | | | | | | | |
| December 2022 Notes | $ | 75,812 |
| | $ | 75,099 |
| | $ | 55,305 |
| | $ | — |
| | $ | — |
|
| October 2024 Notes | 73,484 |
| | — |
| | — |
| | — |
| | — |
|
| Credit facility | 154,000 |
| | 141,000 |
| | 40,000 |
| | 25,000 |
| | — |
|
| Other liabilities | 4,883 |
| | 6,516 |
| | 6,142 |
| | 5,523 |
| | 9,028 |
|
| Dividends payable | — |
| | — |
| | 4,525 |
| | 7,191 |
| | 625 |
|
| Accrued restoration plan liability | 3,082 |
| | 3,073 |
| | 2,937 |
| | 2,170 |
| | 2,205 |
|
| Income taxes payable | 513 |
| | 192 |
| | 103 |
| | 473 |
| | — |
|
| Deferred income taxes | 963 |
| | — |
| | 190 |
| | 323 |
| | — |
|
| Total liabilities | 312,737 |
| | 225,880 |
| | 109,202 |
| | 40,680 |
| | 11,858 |
|
| Net assets | 272,222 |
| | 325,963 |
| | 308,288 |
| | 285,072 |
| | 272,635 |
|
| Total liabilities and net assets | $ | 584,959 |
| | $ | 551,843 |
| | $ | 417,490 |
| | $ | 325,752 |
| | $ | 284,493 |
|
| Other data: | | | | | | | | | |
| Number of portfolio companies | 46 |
| | 37 |
| | 30 |
| | 28 |
| | 23 |
|
| Weighted average yield on debt investments at end of period | 10.50 | % | | 11.58 | % | | 11.46 | % | | 10.28 | % | | 10.67 | % |
| Weighted average yield on total investments at end of period | 10.63 | % | | 10.96 | % | | 10.48 | % | | 10.49 | % | | 9.46 | % |
| Expense ratios (as percentage of average net assets): | | | | | | | | | |
| Total expenses, excluding interest expense | 4.94 | % | | 4.75 | % | | 4.70 | % | | 4.59 | % | | 4.48 | % |
Item 7. Management’sManagement's Discussion and Analysis of Financial Condition and Results of Operations
The following discussion should be read in conjunction with our consolidated financial statements and the notes thereto included elsewhere in this Annual Report on Form 10-K. Statements we make in the following discussion which express a belief, expectation or intention, as well as those that are not historical fact, are forward-looking statements that are subject to risks, uncertainties and assumptions. Our actual results, performance or achievements, or industry results, could differ materially from those we express in the following discussion as a result of a variety of factors, including the risks and uncertainties we have referred to under the headings “Cautionary Statement Concerning Forward-Looking Statements” and “Risk Factors” in Part I of this report.
OVERVIEW
We are an internally managed closed-end, non-diversified management investment company that has been elected to be regulated as a BDC under the 1940 Act. We specialize in providing customized debt and equity financing to LMM companies and debt capital to UMM companies in a broad range of investment segments located primarily in the United States. Our investment objective is to produce attractive risk-adjusted returns by generating current income from our debt investments and capital appreciation from our equity and equity related investments. Our investment strategy is to partner with business owners, management teams and financial sponsors to provide flexible financing solutions to fund growth, changes of control, or other corporate events. We invest primarily in senior debt securities, secured by security interests in portfolio company assets. We also invest in equity interests in our portfolio companies alongside our debt securities.
We focus on investing in companies with histories of generating revenues and positive cash flow, established market positions and proven management teams with strong operating discipline. We primarily target senior debt and equity investments
in LMM companies, as well asand opportunistically target first and second lien syndicated loans in UMM companies. Our target LMM companies typically have annual earnings before interest, taxes, depreciation and amortization (“EBITDA”)EBITDA between $3.0 million and $15.0$20.0 million, and our LMM investments generally range in size from $5.0 million to $25.0$35.0 million. Our UMM investments generally include syndicated first and second lien loans in companies with EBITDA generally greater than $50.0$20.0 million, and our UMM investments typically range in size from $5.0 million to $15.0$20.0 million.
We seek to fill the financing gap for LMM companies, which, historically, have had more limited access to financing from commercial banks and other traditional sources. The underserved nature of the LMM creates the opportunity for us to meet the financing needs of LMM companies while also negotiating favorable transaction terms and equity participations. Our ability to invest across a LMM company’s capital structure, from secured loans to equity securities, allows us to offer portfolio companies a comprehensive suite of financing options. Providing customized financing solutions is important to LMM companies. We generally seek to partner directly with financial sponsors, entrepreneurs, management teams and business owners in making our investments. Our LMM debt investments typically include senior loans with a first lien on the assets of the portfolio company. Our LMM debt investments typically have a term of between five and seven years from the original investment date. We also often seek to invest in the equity securities of our LMM portfolio companies.
Our investments in UMM companies primarily consist of direct investments in or secondary purchases of interest bearing debt securities in privately held companies that are generally larger in size than the LMM companies included in our portfolio. Our UMM debt investments are generally secured by either a first or second priority lien on the assets of the portfolio company and typically have an expected duration of between three and seven years from the original investment date.
Since the Share Distribution on September 30, 2015 through March 31, 2020, our exited investments resulted in a weighted average internal rate of return to the Company of approximately 16.4% (based on original cash invested of approximately $227.0 million). Internal rate of return is the discount rate that makes the net present value of all cash flows related to a particular investment equal to zero. Internal rate of return is gross of expenses related to investments as these expenses are not allocable to specific investments. Investments are considered to be exited when the original investment objective has been achieved through the receipt of cash and/or non-cash consideration upon the repayment of a debt investment or sale of an investment or through the determination that no further consideration was collectible and, thus, a loss may have been realized. Approximately 87.4% of these exited investments resulted in an aggregate cash flow realized internal rate of return to the Company of 10% or greater.
Because we are internally managed, we do not pay any external investment advisory fees, but instead directly incur the operating costs associated with employing investment and portfolio management professionals. We believe that our internally managed structure provides us with a beneficial operating expense structure when compared to other publicly traded and privately held investment firms whichthat are externally managed, and our internally managed structure allows us the opportunity to leverage our non-interest operating expenses as we grow our investment portfolio. For the years ended March 31, 2020, 20192023, 2022, and 2018,2021 the ratio of our annualized fourth quarterlast twelve months ("LTM") operating expenses, excluding interest expense, as a percentage of our quarterlyLTM average total assets was 2.37%1.91%, 2.81%2.20% and 3.36%2.42%, respectively.
Recent COVID-19 Developments
The outbreak of COVID-19 has severely impacted global economic activity and caused significant volatility and negative pressure in financial markets. The global impact of the outbreak has been rapidly evolving and many countries, including the United States, have reacted by instituting quarantines, imposed restricting travel, and temporarily closing many corporate offices, retail stores, restaurants, fitness clubs and manufacturing facilities and factories in affected jurisdictions. Such actions are creating disruption in global supply chains and adversely impacting a number of industries. The outbreak could have a continued adverse impact on economic and market conditions and trigger a period of global economic slowdown.
We are closely monitoring the impact of the outbreak of COVID-19 on all aspects of our business, including how it will impact our portfolio companies, employees, due diligence and underwriting processes, and financial markets. Given the fluidity of the situation, we cannot estimate the long-term impact of COVID-19 on our business, future results of operations, financial position or cash flows at this time. Further, the operational and financial performance of the portfolio companies in which we make investments may be significantly impacted by COVID-19, which may in turn impact the valuation of our investments. We believe our portfolio companies have taken immediate actions to effectively and efficiently respond to the challenges posed by COVID-19 and related orders imposed by state and local governments, including developing liquidity plans supported by internal cash reserves, shareholder support, and, as appropriate, accessing their ability to participate in the recently enacted government Paycheck Protection Program. The extent to which our operations may be impacted by the COVID-19 pandemic will depend largely on future developments, which are highly uncertain and cannot be accurately predicted, including new information which may emerge concerning the severity of the outbreak and actions by government authorities to contain the outbreak or treat its
impact. Furthermore, the impacts of a potential worsening of global economic conditions and the continued disruptions to and volatility in the financial markets remain unknown.
We have evaluated subsequent events from March 31, 2020 through the filing date of this Annual Report on Form 10-K, June 2, 2020. However, as the discussion in this Item 7. Management’s Discussion and Analysis of Financial Condition and Results of Operations relates to the Company’s financial statements for the fiscal year ended March 31, 2020, the analysis contained herein may not fully account for impacts relating to the COVID-19 pandemic. In that regard, for example, as of March 31, 2020, the Company valued its portfolio investments in conformity with U.S. GAAP based on the facts and circumstances known by the Company at that time, or reasonably expected to be known at that time. Due to the overall volatility that the COVID-19 pandemic has caused during the months that followed our March 31, 2020 valuation, any valuations conducted now or in the future in conformity with U.S. GAAP could result in a lower fair value of our portfolio. The impact to our results going forward may depend to a large extent on future developments and new information that may emerge regarding the duration and severity of COVID-19 and the actions taken by authorities and other entities to contain the COVID-19 or treat its impact, all of which are beyond our control. Accordingly, the Company cannot predict the extent to which its financial condition and results of operations will be affected at this time.
CRITICAL ACCOUNTING POLICIES AND USE OF ESTIMATES
The preparation of our consolidated financial statements in accordance with U.S. GAAP requires management to make certain estimates and assumptions that affect the reported amounts of assets and liabilities at the date of the consolidated financial statements and the reported amounts of revenues and expenses for the periods covered by the consolidated financial statements. We have identified investment valuation and revenue recognition as our most critical accounting estimates. On an
on-going basis, we evaluate our estimates, including those related to the matters below. These estimates are based on the information that is currently available to us and on various other assumptions that we believe to be reasonable under the circumstances. Actual results could differ materially from those estimates under different assumptions or conditions. A discussion of our critical accounting policies follows.
Valuation of Investments
The most significant determination inherent in the preparation of our consolidated financial statements is the valuation of our investment portfolio and the related amounts of unrealized appreciation and depreciation. As of March 31, 20202023 and 2019,March 31, 2022, our investment portfolio at fair value represented approximately 94.5%95.9% and 95.0%96.2% of our total assets, respectively. We are required to report our investments at fair value. We follow the provisions of ASC 820. ASC 820 defines fair value, establishes a framework for measuring fair value, establishes a fair value hierarchy based on the quality of inputs used to measure fair value, and enhances disclosure requirements for fair value measurements. ASC 820 requires us to assume that the portfolio investment is to be sold in the principal market to independent market participants, which may be a hypothetical market. See Note 4 — “FairFair Value Measurements”Measurements in the notes to consolidated financial statements for a detailed discussion of our investment portfolio valuation process and procedures.
Due to the inherent uncertainty in the valuation process, our determination of fair value for our investment portfolio may differ materially from the values that would have been determined had a ready market for the securities actually existed. In addition, changes in the market environment, portfolio company performance, and other events may occur over the lives of the investments that may cause the gains or losses ultimately realized on these investments to be materially different than the valuations currently assigned. We determine the fair value of each individual investment and record changes in fair value as unrealized appreciation or depreciation.
OurAs of March 31, 2023, our Board of Directors iswas responsible for determining, in good faith, the fair value for our investment portfolio and our valuation procedures, consistent with 1940 Act requirements. Our Board of Directors believes that our investment portfolio as of March 31, 20202023 and 2019March 31, 2022 reflects the fair value as of those dates based on the markets in which we operate and other conditions in existence on those reporting dates.
Revenue Recognition
Interest and Dividend Income
Interest and dividend income is recorded on an accrual basis to the extent amounts are expected to be collected. Dividend income is recognized on the date dividends are declared by the portfolio company or at the point an obligation exists for the portfolio company to make a distribution. Discounts/premiums received to par on loans purchased are capitalized and accreted or
amortized into income over the life of the loan.loan using the effective interest method. In accordance with our valuation policy, accrued interest and dividend income is evaluated periodicallyquarterly for collectability. When we do not expect the debtor to be able to service all of its debt or other obligations, we will generally establish a reserve against interest income receivable, thereby placing the loan or debt security on non-accrual status, and cease to recognize interest income on that loan or debt security until the borrower has demonstrated the ability and intent to pay contractual amounts due. If a loan or debt security’s status significantly improves regarding its ability to service debt or other obligations, it will be restored to accrual basis. As of March 31, 2020, we had four2023, investments on non-accrual status which comprised ofrepresented approximately 3.3%0.3% of our total investment portfolio's fair value and approximately 5.8%1.3% of its cost. As of March 31, 2019, we had one investment2022, investments on non-accrual status which represented approximately 1.6%1.5% of our total investment portfolio's fair value and approximately 1.9%2.6% of its cost.
Recently Issued Accounting Standards
In February 2016,March 2020, the FASB issued ASU 2016-02, Leases, which requires lessees2020-04, "Reference rate reform (Topic 848)—Facilitation of the effects of reference rate reform on financial reporting." The amendments in this update provide optional expedients and exceptions for applying U.S. GAAP to recognize on the balance sheet a right-of-use asset, representing its rightcertain contracts and hedging relationships that reference LIBOR or another reference rate expected to use the underlying asset for the lease term,be discontinued due to reference rate reform and a lease liabilitybecame effective upon issuance for all leasesentities. The Company has agreements that have LIBOR as a reference rate with terms greater than 12 months. The guidance also requires qualitativecertain portfolio companies and quantitative disclosures designedcertain lenders. Many of these agreements include an alternative successor rate or language for choosing an alternative successor rate when LIBOR reference is no longer considered to assessbe appropriate. With respect to other agreements, the amount, timing,Company intends to work with its portfolio companies and uncertaintycertain lenders to modify agreements to choose an alternative successor rate. Contract modifications are required to be evaluated in determining whether the modifications result in the establishment of cash flows arising from leases. The standard requiresnew contracts or the usecontinuation of a modified retrospective transition approach, which includes a number of optional practical expedients that entities may elect to apply. In July 2018,existing contracts. On December 21, 2022, the FASB issued ASU 2018-10, Codification Improvements to Topic 842, Leases, which affects narrow aspects2022-06 "Reference rate reform (Topic 848)—Deferral of the guidance issued inSunset Date of Topic
848," which defers the sunset date of ASC 848 until December 31, 2024. ASU 2022-06 became effective upon issuance. The expedients and exceptions provided by the amendments do not apply to contract modifications and hedging relationships entered into or evaluated after December 31, 2024, except for hedging transactions as of December 31, 2024, that an entity has elected certain optional expedients for and that are retained through the end of the hedging relationship. The Company does not believe it will have a material impact on its consolidated financial statements or its disclosure and did not utilize the optional expedients and exceptions provided by ASU 2020-04 during the year ended March 31, 2023.
In June 2022, the FASB issued ASU 2022-03, “Fair Value Measurement (Topic 820) - Fair Value Measurement of Equity Securities Subject to Contractual Sale Restrictions,” which was issued to (1) clarify the guidance in ASU 2016-02.Topic 820, Fair Value Measurement, when measuring the fair value of an equity security subject to contractual restrictions that prohibit the sale of an equity security, (2) amend a related illustrative example, and (3) introduce new disclosure requirements for equity securities subject to contractual sale restrictions that are measured at fair value in accordance with Topic 820. The new guidance is effective for interim and annual periods beginning after December 15, 2018, and interim periods therein. CSWC adopted ASU 2016-02 effective April 1, 2019. Under ASC 842, Leases, ("ASC 842"), CSWC evaluates leases to determine if the leases are considered financing or operating leases.2023. The Company is currently has one operating lease for office space for whichevaluating the Company has recorded a right-of-use asset and lease liability for the operating lease obligation. Non-lease components (maintenance, property tax, insurance and parking) are not included in the lease cost. The lease expense is presented as a single lease cost that is amortized on a straight-line basis over the lifeimpact of the lease.
In August 2018,new standard on the FASB issued ASU 2018-13, Fair Value Measurement (Topic 820): Disclosure Framework - Changes to the Disclosure Requirements for Fair Value Measurement, which changes the fair value measurement disclosure requirements of ASC 820. The key provisions include new, eliminated and modified disclosure requirements. The new guidance is effective for fiscal years beginning after December 15, 2019, including interim periods therein. Early application is permitted. CSWC elected to early adopt ASU 2018-13 effective April 1, 2019. No significant changes to the fair value disclosures were necessary in the notes to theCompany's consolidated financial statements in order to comply with ASU 2018-13.
In March 2019, the SEC issued Final Rule Release No. 33-10618, FAST Act Modernization and Simplification of Regulation S-K, which amends certain SEC disclosure requirements. The amendments are intended to simplify certain disclosure requirements, improve readabilityrelated disclosures and navigability of disclosure documents, and discourage repetition and disclosure of immaterial information. The amendments are effective for all filings submitteddoes not believe it will have a material impact on or after May 2, 2019. The Company adopted the requisite amendments effective May 2, 2019. As it pertains to the Company for this Annual Report on Form 10-K, there were no significant changes to the Company’sits consolidated financial positionstatements or disclosures.its disclosure.
INVESTMENT PORTFOLIO COMPOSITION
Our LMM investments consist primarily of secured debt, equity warrants and direct equity investments in privately held, LMM companies based in the United States. Our LMM portfolio companies generally have annual EBITDA between $3.0 million and $15.0 million, and our LMM investments typically range in size from $5.0 million to $25.0 million. The LMM debt investments are typically secured by either a first or second priority lien on the assets of the portfolio company, generally bear interest at floating rates, and generally have a term of between five and seven years from the original investment date.
Our UMM investments consist of direct investments in or secondary purchases of interest-bearing debt securities in privately held companies based in the United States that are generally larger in size than the LMM companies included in our portfolio with EBITDA generally greater than $50.0 million. Our UMM investments typically range in size from $5.0 million to $15.0 million. Our UMM debt investments are generally secured by ether a first or second priority lien on the assets of the portfolio company and typically have a term of between three and seven years from the original investment date.
The total value of our investment portfolio was $553.1$1,206.4 million as of March 31, 2020,2023, as compared to $524.1$936.6 million as of March 31, 2019.2022. As of March 31, 2020,2023, we had investments in 4686 portfolio companies with an aggregate cost of $599.2$1,220.2 million. As of March 31, 2019,2022, we had investments in 3773 portfolio companies with an aggregate cost of $478.1$938.3 million.
As of March 31, 20202023 and 2019,March 31, 2022, approximately $459.0$1,002.9 million, or 96.8%96.7%, and $348.2$772.7 million, or 94.7%97.3%, respectively, of our debt investment portfolio (at fair value) bore interest at floating rates, of which 97.6% and 87.8%, respectively,100.0% were subject
to contractual minimum interest rates. As of March 31, 20202023 and 2019,March 31, 2022, the weighted average contractual minimum interest rate is 1.38%1.15% and 1.20%1.08%, respectively. As of March 31, 20202023 and 2019,March 31, 2022, approximately $15.3$34.7 million, or 3.2%3.3%, and $19.5$21.1 million, or 5.3%2.7%, respectively, of our debt investment portfolio (at fair value) bore interest at fixed rates.
The following tables provide a summary of our investments in LMM and UMMportfolio companies as of March 31, 20202023 and 2019March 31, 2022 (excluding our investment in I-45 SLF LLC):
| | | | | | | | | | | |
| March 31, 2023 | | March 31, 2022 |
| (dollars in thousands) |
| Number of portfolio companies (a) | 85 | | 72 |
| Fair value | $ | 1,155,132 | | | $ | 879,011 | |
| Cost | $ | 1,139,352 | | | $ | 862,303 | |
| % of portfolio at fair value - debt | 89.8 | % | | 90.3 | % |
| % of portfolio at fair value - equity | 10.2 | % | | 9.7 | % |
| % of investments at fair value secured by first lien | 86.7 | % | | 84.2 | % |
| Weighted average annual effective yield on debt investments (b) | 12.8 | % | | 9.3 | % |
| Weighted average annual effective yield on total investments (c) | 12.1 | % | | 9.0 | % |
| Weighted average EBITDA (d) | $ | 21,049 | | | $ | 20,889 | |
| Weighted average leverage through CSWC security (e) | 4.0x | | 4.0x |
(a)At March 31, 2023 and March 31, 2022, we had equity ownership in approximately 62.4% and 56.9%, respectively, of our investments.
(b)The weighted average annual effective yields were computed using the effective interest rates during the quarter for all debt investments at cost as of March 31, 2023 and March 31, 2022, respectively, including accretion of original issue discount but excluding fees payable upon repayment of the debt instruments. As of March 31, 2023, investments on non-accrual status represented approximately 0.3% of our total investment portfolio's fair value and approximately 1.3% of its cost. As of March 31, 2022, investments on non-accrual status represented approximately 1.5% of our total investment portfolio's fair value and approximately 2.6% of its cost. Weighted average annual effective yield is not a return to shareholders and is higher than what an investor in shares in our common stock will realize on its investment because it does not reflect our expenses or any sales load paid by an investor.
(c)The weighted average annual effective yields on total investments were calculated by dividing total investment income, exclusive of non-recurring fees, by average total investments at fair value.
(d)Includes CSWC debt investments only. Weighted average EBITDA metric is calculated using investment cost basis weighting. For the year ended March 31, 2023, nine portfolio companies are excluded from this calculation due to a reported debt to adjusted EBITDA ratio
|
| | | | | | | |
| | As of March 31, 2020 |
| | LMM (a) | | UMM |
| | (dollars in thousands) |
| Number of portfolio companies | 34 |
| | 11 |
|
| Fair value | $ | 437,142 |
| | $ | 76,170 |
|
| Cost | $ | 435,015 |
| | $ | 96,172 |
|
| % of portfolio at cost - debt | 91.8 | % | | 100.0 | % |
| % of portfolio at cost - equity | 8.2 | % | | — |
|
| % of debt investments at cost secured by first lien | 84.1 | % | | 84.5 | % |
| Weighted average annual effective yield (b)(c) | 11.2 | % | | 6.6 | % |
| Weighted average EBITDA (c) | $ | 8,322 |
| | $ | 74,143 |
|
| Weighted average leverage through CSWC security (c)(d) | 3.7x |
| | 4.2x |
|
(e)Includes CSWC debt investments only. Calculated as the amount of each portfolio company’s debt (including CSWC’s position and debt senior or pari passu to CSWC’s position, but excluding debt subordinated to CSWC’s position) in the capital structure divided by each portfolio company’s adjusted EBITDA. Weighted average leverage is calculated using investment cost basis weighting. Management uses this metric as a guide to evaluate relative risk of its position in each portfolio debt investment. For the year ended March 31, 2023, nine portfolio companies are excluded from this calculation due to a reported debt to adjusted EBITDA ratio that was not meaningful. For the year ended March 31, 2022, three portfolio companies are excluded from this calculation due to a reported debt to adjusted EBITDA ratio that was not meaningful.
| |
(a) | At March 31, 2020, we had equity ownership in approximately 64.7% of our LMM investments. |
| |
(b) | The weighted-average annual effective yields were computed using the effective interest rates for all debt investments at cost as of March 31, 2020, including accretion of original issue discount but excluding fees payable upon repayment of the debt instruments and any debt investments on non-accrual status. As of March 31, 2020, there were four investments on non-accrual status. Weighted-average annual effective yield is not a return to shareholders and is higher than what an investor in shares in our common stock will realize on its investment because it does not reflect our expenses or any sales load paid by an investor. |
| |
(c) | Weighted average EBITDA metric is calculated using investment cost basis weighting. For the year ended March 31, 2020, two UMM portfolio companies are excluded from this calculation due to a reported debt to adjusted EBITDA ratio that was not meaningful. |
| |
(d) | Includes CSWC debt investments only. Calculated as the amount of each portfolio company’s debt (including CSWC’s position and debt senior or pari passu to CSWC’s position, but excluding debt subordinated to CSWC’s position) in the capital structure divided by each portfolio company’s adjusted EBITDA. Weighted average leverage is calculated using investment cost basis weighting. Management uses this metric as a guide to evaluate relative risk of its position in each portfolio debt investment. For the year ended March 31, 2020, two UMM portfolio companies are excluded from this calculation due to a reported debt to adjusted EBITDA ratio that was not meaningful. |
|
| | | | | | | |
| | As of March 31, 2019 |
| | LMM (a) | | UMM |
| | (dollars in thousands) |
| Number of portfolio companies | 26 |
| | 10 |
|
| Fair value | $ | 377,792 |
| | $ | 80,536 |
|
| Cost | $ | 325,343 |
| | $ | 84,712 |
|
| % of portfolio at cost - debt | 87.5 | % | | 100.0 | % |
| % of portfolio at cost - equity | 12.5 | % | | — |
|
| % of debt investments at cost secured by first lien | 76.6 | % | | 82.6 | % |
| Weighted average annual effective yield (b)(c) | 12.2 | % | | 9.7 | % |
| Weighted average EBITDA (c) | $ | 9,200 |
| | $ | 66,531 |
|
| Weighted average leverage through CSWC security (c)(d) | 3.3x |
| | 4.8x |
|
| |
(a) | At March 31, 2019, we had equity ownership in approximately 73.1% of our LMM investments. |
| |
(b) | The weighted-average annual effective yields were computed using the effective interest rates for all debt investments at cost as of March 31, 2019, including accretion of original issue discount but excluding fees payable upon repayment of the debt instruments and any debt investments on non-accrual status. As of March 31, 2019, there was one investment on non-accrual status. Weighted-average annual effective yield is higher than what an investor in shares in our common stock will realize on its investment because it does not reflect our expenses or any sales load paid by an investor. |
| |
(c) | Weighted average EBITDA metric is calculated using investment cost basis weighting. For the quarter ended March 31, 2019, one UMM portfolio company is excluded from this calculation due to a reported debt to adjusted EBITDA ratio that was not meaningful. |
| |
(d) | Includes CSWC debt investments only. Calculated as the amount of each portfolio company’s debt (including CSWC’s position and debt senior or pari passu to CSWC’s position, but excluding debt subordinated to CSWC’s position) in the capital structure divided by each portfolio company’s adjusted EBITDA. Weighted average leverage is calculated using investment cost basis weighting. Management uses this metric as a guide to evaluate relative risk of its position in each portfolio debt investment. For the quarter ended March 31, 2019, one UMM portfolio company is excluded from this calculation due to a reported debt to adjusted EBITDA ratio that was not meaningful. |
Portfolio Asset Quality
We utilize an internally developed investment rating system to rate the performance and monitor the expected level of returns for each debt investment in our portfolio. The investment rating system takes into account both quantitative and qualitative factors of the portfolio company and the investments held therein, including each investment’sinvestment's expected level of returns and the collectability of our debt investments, comparisons to competitors and other industry participants and the portfolio company’scompany's future outlook. The ratings are not intended to reflect the performance or expected level of returns of our equity investments.
•Investment Rating 1 represents the least amount of risk in our portfolio. The investment is performing materially above underwriting expectations and the trends and risk factors are generally favorable. The investment generally has a higher probability of being prepaid in part or in full.
•Investment Rating 2 indicates the investment is performing as expected at the time of underwriting and the trends and risk factors are generally favorable to neutral. All new loans are initially rated 2.
•Investment Rating 3 involves an investment performing below underwriting expectations and the trends and risk factors are generally neutral to negative. The portfolio company or investment may be out of compliance with financial covenants and interest payments may be impaired, however principal payments are generally not past due.
•Investment Rating 4 indicates that the investment is performing materially below underwriting expectations, the trends and risk factors are generally negative and the risk of the investment has increased substantially. Interest and principal payments on our investment are likely to be impaired.
The COVID-19 pandemic has impacted our investment ratings asWe also have observed, and continue to observe, supply chain disruptions, labor and resource shortages, commodity inflation, elements of March 31, 2020, causing downgradesfinancial market instability (including rapidly rising interest rates and volatility in the banking systems, particularly with small and regional banks), an uncertain economic outlook for the United States (which may include a recession), and elements of geopolitical instability (including the ongoing war in Ukraine and U.S. and China relations). In the event that the U.S. economy enters into a protracted recession, it is possible that the results of certain portfolio companies. AsU.S. middle market companies could experience deterioration. We are closely monitoring the COVID-19 situation continues to evolve, we are maintaining close communications witheffect of such market volatility may have on our portfolio companies to proactively assess and manage potential risks across our debt investment portfolio. Weactivities, and we have also increased oversight and analysis of credits in vulnerable industries in an attempt to improvemitigate any decline in loan performance and reduce credit risk.
The following table shows the distribution of our debt portfolio investments on the 1 to 4 investment rating scale at fair value as of March 31, 20202023 and 2019:March 31, 2022:
| | | | | | | | | | | |
| As of March 31, 2023 |
| Investment Rating | Debt Investments at Fair Value | | Percentage of Debt Portfolio |
| (dollars in thousands) |
| 1 | $ | 153,118 | | | 14.8 | % |
| 2 | 839,456 | | | 80.9 | |
| 3 | 44,726 | | | 4.3 | |
| 4 | 295 | | | 0.0 | |
| Total | $ | 1,037,595 | | | 100.0 | % |
| | | | As of March 31, 2020 | |
| | Debt | | | | | | | | | | | | |
| | Investments at | | Percentage of | | As of March 31, 2022 |
| Investment Rating | Fair Value | | Debt Portfolio | Investment Rating | Debt Investments at Fair Value | | Percentage of Debt Portfolio |
| | (dollars in thousands) | | (dollars in thousands) |
| 1 | $ | 53,488 |
| | 11.3 | % | 1 | $ | 124,192 | | | 15.6 | % |
| 2 | 347,056 |
| | 73.2 |
| 2 | 632,675 | | | 79.7 | |
| 3 | 59,266 |
| | 12.5 |
| 3 | 36,648 | | | 4.6 | |
| 4 | 14,523 |
| | 3.0 |
| 4 | 319 | | | 0.1 | |
| Total | $ | 474,333 |
| | 100.0 | % | Total | $ | 793,834 | | | 100.0 | % |
| | | | | |
| | As of March 31, 2019 | |
| | Debt | | | |
| | Investments at | | Percentage of | |
| Investment Rating | Fair Value | | Debt Portfolio | |
| | (dollars in thousands) | |
| 1 | $ | 61,897 |
| | 16.8 | % | |
| 2 | 284,041 |
| | 77.3 |
| |
| 3 | 21,789 |
| | 5.9 |
| |
| 4 | — |
| | — |
| |
| Total | $ | 367,727 |
| | 100.0 | % | |
Interest and dividend income is recorded on an accrual basis to the extent amounts are expected to be collected. When we do not expect the debtor to be able to service all of its debt or other obligations, we will generally establish a reserve against interest income receivable, thereby placing the loan or debt security on non-accrual status, and cease to recognize interest income on that loan or debt security until the borrower has demonstrated the ability and intent to pay contractual amounts due.
The composite measure of our financial performance in the Consolidated Statements of Operations is captioned “Net increase (decrease) in net assets from operations” and consists of threefour elements. The first is “Net investment income, (loss),” which is the difference between income from interest, dividends and fees and our combined operating and interest expenses, net of applicable income taxes. The second element is “Net realized (loss) gain (loss) on investments, before incomenet of tax,” which is the difference between the proceeds received from the disposition of portfolio securities and their stated cost. The third element is the “Net change in unrealized (depreciation) appreciation on investments, net of tax”tax,” which is the net change in the market or fair value of our investment portfolio, compared with stated cost. It should be noted that theThe “Net realized (loss) gain (loss) on investments before income tax” and “Net change in unrealized appreciation (depreciation) on investments, net of tax” are directly related in that when an appreciated portfolio security is sold to realize a gain, a corresponding decrease in net unrealized appreciation occurs by transferring the gain associated with the transaction from being “unrealized” to being “realized.” Conversely, when a loss is realized on a depreciated portfolio security, an increase in net unrealized appreciation occurs. The fourth element is the “Realized loss on extinguishment of debt”, which is the difference between the principal amount due at maturity adjusted for any unamortized debt issuance costs and any "make-whole" premium payable at the time of the debt extinguishment.
Set forth below is a comparison of the results of operations for the years ended March 31, 20202023 and 2019.2022. For the comparison of the results of operations for the years ended March 31, 20192022 and 2018,2021, see the Company's Annual Report on Form 10-K for the year ended March 31, 2019,2022, which was filed with the SEC on June 4, 2019,May 24, 2022, located within Part II, Item 7. Management's Discussion and Analysis of Financial Condition and Results of Operations, which is incorporated by reference herein.
Due to the nature of our business, the majority of our operating expenses are related to interest and fees on our borrowings, employee compensation (including both cash and share-based compensation), and general and administrative expenses.
FINANCIAL LIQUIDITY AND CAPITAL RESOURCES
Our liquidity and capital resources are generated primarily from cash flows from operations, the net proceeds of public offerings of debt and equity securities, and advances from the Credit Facility.Facility and our continued access to the debentures guaranteed by the Small Business Administration (the "SBA Debentures"). Management believes that the Company’s cash and cash equivalents, cash available from investments, and commitments under the Credit Facility are adequate to meet its needs for the next twelve months. We anticipate that we will continue to fund our investment activities through existing cash and cash equivalents, cash flows generated through our ongoing operating activities, utilization of available borrowings under our Credit Facility and future issuances of debt and equity on terms we believe are favorable to the Company and our shareholders.shareholders (including the Equity ATM Program, as described below). Our primary uses of funds will be investments in portfolio companies and operating expenses. Due to the diverse capital sources available to us at this time, we believe we have adequate liquidity to support our near-term capital requirements. As the impactIn light of COVID-19 continues to unfold,current market conditions, we will continually evaluate our overall liquidity position and take proactive steps to maintain that position based on the current circumstances. This "Financial Liquidity and Capital Resources" section should be read in conjunction with the notes of our consolidated financial statements.
Cash Flows
At March 31, 2020, the Company had cash and cash equivalents of approximately $13.7 million. For the year ended March 31, 2020,2023, we experienced a net increase in cash and cash equivalents in the amount of $3.8$10.2 million. During thatthe foregoing period, our operating activities used $47.9$227.1 million in cash, consisting primarily of new portfolio investments of $196.6$433.2 million, partially offset by $67.8$139.1 million offrom sales and repayments received from debt investments in portfolio companies and $56.0$2.7 million of proceeds from sales and return of capital of equity investments.investments in portfolio companies. In addition, our financing activities increasedprovided cash by $51.8of $237.5 million, consisting primarily of net borrowings underproceeds from the Credit FacilityEquity ATM Program of $13.0$158.9 million, net proceeds from an underwritten equity offering of $44.1 million, net proceeds from the issuance of the October 2024 NotesSBA debentures of $73.5$78.1 million and proceeds from the offeringnet borrowings on our Credit Facility of our common stock of $26.1$30.0 million, partially offset by cash dividends paid in the amount of $50.3$71.1 million.
At March 31, 2019,2023, the Company had cash and cash equivalents of approximately $9.9$21.6 million.
For the year ended March 31, 2019,2022, we experienced a net increasedecrease in cash and cash equivalents in the amount of $2.0$20.2 million. During that period, our operating activities used $94.7$182.7 million in cash, consisting primarily of new portfolio investments of $229.6$499.2 million, partially offset by $74.7$259.2 million offrom sales and repayments received from debt investments in portfolio companies and $33.9$11.9 million of proceeds from sales and return of capital of equity investments.investments in portfolio companies. In addition, our financing activities increasedprovided cash by $96.7of $164.5 million, consisting primarily of net borrowings under theon our Credit Facility of $101.0$85.0 million, net proceeds from the Equity ATM Program of $98.1 million, net proceeds from the issuance of the December 2022October 2026 Notes of $19.5$146.4 million and net proceeds from the offeringissuance of our common stockSBA debentures of $18.9$39.0 million, partially offset by the redemption of the October 2024 Notes of $125.0 million and cash dividends paid in the amount of $42.5$58.6 million. At March 31, 2022, the Company had cash and cash equivalents of approximately $11.4 million.
Financing Transactions
In accordance with the 1940 Act, with certain limitations, effective April 25, 2019, the Company is only allowed to borrow amounts such that its asset coverage (i.e., the ratio of assets less liabilities not represented by senior securities to senior securities such as borrowings), calculated pursuant to the 1940 Act, is at least 150% after such borrowing. The Board of Directors also approved a resolution which limits the Company’s issuance of senior securities such that the asset coverage ratio, taking into account any such issuance, would not be less than 166%, which became effective April 25, 2019. On August 11, 2021, we received an exemptive order from SEC to permit us to exclude the senior securities issued by SBIC I or any future SBIC subsidiary of the Company from the definition of senior securities in the asset coverage requirement applicable to the Company under the 1940 Act. As of March 31, 2020,2023, the Company’s asset coverage was 189%235%.
Credit Facility
In August 2016, CSWC entered into a senior secured credit facility (as amended, restated, supplemented or otherwise modified from time to time, the(the “Credit Facility”) to provide additional liquidity to support its investment and operational activities, which included total commitments of $100 million. The Credit Facility contained an accordion feature that allowed CSWC to increase the total commitments under the Credit Facility up to $150 million from new and existing lenders on the same terms and conditions as the existing commitments. In August 2017, we increased our total commitments by $15 million through adding an additional lender using the accordion feature.activities.
On November 16, 2017,August 9, 2021, CSWC entered into Amendment No. 1 (the “Amendment”)the Second Amended and Restated Senior Secured Revolving Credit Agreement (as amended or otherwise modified from time to its Credit Facility.time, the "Credit Agreement"). Prior to the Amendment,Credit Agreement, (1) borrowings under the Credit Facility accrued interest on a per annum basis at a rate equal to the applicable LIBOR rate plus 3.25%2.50% with no LIBOR floor.floor, and (2) the total borrowing capacity was $340 million with commitments from a diversified group of eleven lenders. The Credit Agreement (1) decreased the total borrowing capacity under the Credit Facility to $335 million
with commitments from a diversified group of ten lenders, (2) reduced the interest rate on borrowings to LIBOR plus 2.15% with no LIBOR floor and removed conditions related thereto as previously set forth in the Amended and Restated Senior Secured Revolving Credit Agreement, and (3) extended the end of the Credit Facility's revolver period from December 21, 2022 to August 9, 2025 and extended the final maturity from December 21, 2023 to August 9, 2026. The Credit Agreement also modified certain covenants in the Credit Facility, including, among other things, to increase the minimum obligors’ net worth test from $180 million to $200 million.
The Credit Facility contains an accordion feature that allows CSWC paidto increase the total commitments under the Credit Facility up to $400 million from new and existing lenders on the same terms and conditions as the existing commitments.
On May 11, 2022, CSWC entered into Amendment No. 2 (the "Amendment") to the Credit Agreement. The Amendment changed the benchmark interest rate from LIBOR to Adjusted Term SOFR. In addition, CSWC entered into an Incremental Commitment Agreement, pursuant to which the total commitments under the Credit Agreement increased from $335 million to $380 million.
On November 16, 2022, CSWC entered into an Incremental Assumption Agreement that increased the total commitments under the accordion feature of the Credit Agreement by $20 million, which increased total commitments from $380 million to $400 million. The $20 million increase was provided by one existing lender and one new lender, bringing the total bank syndicate to eleven participants.
CSWC pays unused commitment fees of 0.50% to 1.50%1.00% per annum, based on utilization, on the unused lender commitments under the Credit Facility. The Amendment (1) increased the total borrowing capacity under the Credit Facility to $180 million, with commitments from a diversified group of eight lenders, (2) increased the Credit Facility’s accordion feature that allows for an increase in total commitments of up to $250 million under the Credit Facility from new and existing lenders on the same terms and conditions as the existing commitments, (3) reduced the interest rate on borrowings from LIBOR plus 3.25% down to LIBOR plus 3.00%, with a further step-down to LIBOR plus 2.75% at the time the Company’s net
worth exceeds $325 million, (4) reduced unused commitment fees from a utilization-based grid of 0.50% to 1.5% down to a range of 0.50% to 1.0% per annum, and (5) extended the Credit Facility’s revolving period that ended on August 30, 2019 through November 16, 2020. Additionally, the final maturity of the Credit Facility was extended from August 30, 2020 to November 16, 2021. On April 16, 2018 and May 11, 2018, CSWC entered into Incremental Assumption Agreements, which increased the total commitments under the Credit Facility by $20 million and $10 million, respectively. The increases were executed in accordance with the accordion feature of the Credit Facility, increasing total commitments from $180 million to $210 million.
On December 21, 2018, CSWC entered into the Amended and Restated Senior Secured Revolving Credit Agreement (the "Credit Agreement"), and a related Amended and Restated Guarantee, Pledge and Security Agreement, to amend and restate its Credit Facility. The Credit Agreement (1) increased the total commitments by $60 million from $210 million to an aggregate total of $270 million, provided by a diversified group of nine lenders, (2) increased the Credit Facility's accordion feature to $350 million under the Credit Facility from new and existing lenders on the same terms and conditions as the existing commitments, (3) reduced the interest rate on borrowings from LIBOR plus 3.00% to LIBOR plus 2.50%, subject to certain conditions as outlined in the Credit Agreement, (4) reduced the minimum asset coverage with respect to senior securities representing indebtedness from 200% to 150% after the date on which such minimum asset coverage is permitted to be reduced by the Company under applicable law, and (5) extended the Credit Facility's revolving period from November 16, 2020 to December 21, 2022 and the final maturity was extended from November 16, 2021 to December 21, 2023.
The Credit Agreement modified certain covenants in the Credit Facility, including: (1) to provide for a minimum senior coverage ratio of 2-to-1 (in addition to the asset coverage ratio noted below), (2) to increase the minimum obligors’ net worth test from $160 million to $180 million, (3) to reduce the minimum consolidated interest coverage ratio from 2.50-to-1 to 2.25-to-1 as of the last day of any fiscal quarter, and (4) to provide for the fact that the Company will not declare or pay a dividend or distribution in cash or other property unless immediately prior to and after giving effect thereto the Company's asset coverage ratio exceeds 150% (and certain other conditions are satisfied). The Credit Facility also contains certain affirmative and negative covenants, including but not limited to: (1) certain reporting requirements, (2) maintaining RIC and BDC status, (3) maintaining a minimum senior coverage ratio of 2 to 1, (4) maintaining a minimum shareholders’ equity, (4)(5) maintaining a minimum consolidated net worth, (6) maintaining a regulatory asset coverage of not less than 150%, (7) maintaining an interest coverage ratio of at least 2.25 to 1.0, and (5)(8) at any time the outstanding advances exceed 90% of the borrowing base, maintaining a minimum liquidity of not less than 10% of the covered debt amount.
On May 23, 2019, CSWC entered into an Incremental Assumption Agreement that increased the total commitments under the accordion feature of the Credit Facility by $25 million, which increased total commitments from $270 million to $295 million. On March 19, 2020, CSWC entered into an Incremental Assumption Agreement that increased the total commitments under the accordion feature of the Credit Facility by $30 million, which increased total commitments from $295 million to $325 million.
The Credit FacilityAgreement also contains customary events of default, including, without limitation, nonpayment, misrepresentation of representations and warranties in a material respect, breach of covenant, bankruptcy, and change of control, with customary cure and notice provisions. If the Company defaults on its obligations under the Credit Facility,Agreement, the lenders may have the right to foreclose upon and sell, or otherwise transfer, the collateral subject to their security interests. There are no changes to the covenants or the events of default in the Credit Facility as a result of the Amendment.
The Credit Facility is secured by (1) substantially all of the present and future property and assets of the Company and the guarantors and (2) 100% of the equity interests in the Company’s wholly-owned subsidiaries.subsidiary. As of March 31, 2020,2023, substantially all of the Company’s assets were pledged as collateral for the Credit Facility.Facility, except for assets held in SBIC I.
At March 31, 2020,2023, CSWC had $154.0$235.0 million in borrowings outstanding under the Credit Facility. CSWC recognized interest expense related to the Credit Facility, including unused commitment fees and amortization of deferred loan costs, of $8.3$13.2 million, $6.2 million and $7.3$6.8 million respectively, for the years ended March 31, 20202023, 2022 and 2019.2021, respectively. The weighted average interest rate on the Credit Facility was 4.82%5.22% and 5.41%, respectively,2.50% for the years ended March 31, 20202023 and 2019.2022, respectively. Average borrowings for the years ended March 31, 20202023 and 20192022 were $134.7$213.7 million and $99.8$173.5 million, respectively. As of March 31, 20202023 and 2019,2022, CSWC was in compliance with all financial covenants under the Credit Facility.Agreement.
December 2022 Notes
In December 2017, the Company issued $57.5 million in aggregate principal amount, including the underwriters’ full exercise of their option to purchase additional principal amounts to cover over-allotments, of 5.95% Notes due 2022 (the “December 2022 Notes”). The December 2022 Notes mature on December 15, 2022 and may be redeemed in whole or in part at any time, or from time to time, at the Company’s option on or after December 15, 2019. The December 2022 Notes bear interest at a rate of 5.95% per year, payable quarterly on March 15, June 15, September 15 and December 15 of each year, beginning on March 15, 2018. The December 2022 Notes are an unsecured obligation, rank pari passu with our other outstanding and future unsecured unsubordinated indebtedness and are effectively subordinated to all of our existing and future secured indebtedness, including borrowings under our Credit Facility.
On June 11, 2018, the Company entered into an ATM debt distribution agreement, pursuant to which it may offer for sale, from time to time, up to $50 million in aggregate principal amount of December 2022 Notes through B. Riley FBR, Inc., acting as its sales agent (the “2022 Notes Agent”). Sales of the December 2022 Notes may be made in negotiated transactions or transactions that are deemed to be "at the market offerings" as defined in Rule 415 under the Securities Act of 1933, as amended, including sales made directly on The Nasdaq Global Select Market, or similar securities exchanges or sales made through a market maker other than on an exchange at prices related to prevailing market prices or at negotiated prices.
The 2022 Notes Agent receives a commission from the Company equal to up to 2% of the gross sales of any December 2022 Notes sold through the 2022 Notes Agent under the debt distribution agreement. The 2022 Notes Agent is not required to sell any specific principal amount of December 2022 Notes, but will use its commercially reasonable efforts consistent with its sales and trading practices to sell the December 2022 Notes. The December 2022 Notes trade “flat,” which means that purchasers in the secondary market will not pay, and sellers will not receive, any accrued and unpaid interest on the December 2022 Notes that is not reflected in the trading price.
During the year ended March 31, 2020, the Company did not sell any December 2022 Notes. The Company has no current intention of issuing additional December 2022 Notes under this ATM debt distribution agreement. Accordingly, during the three months ended June 30, 2019, the Company amortized $0.2 million of the remaining debt issuance costs associated with the ATM debt distribution agreement, which is included in interest expense in the Consolidated Statement of Operations for the year ended March 31, 2020.
All issuances of December 2022 Notes rank equally in right of payment and form a single series of notes.
As of March 31, 2020, the carrying amount of the December 2022 Notes was $75.8 million on an aggregate principal amount of $77.1 million at a weighted average effective yield of 5.93%. As of March 31, 2020, the fair value of the December 2022 Notes was $67.9 million. The fair value is based on the closing price of the security of The Nasdaq Global Select Market, which is a Level 1 input under ASC 820. The Company recognized interest expense related to the December 2022 Notes, including amortization of deferred issuance costs, of $5.3 million and $4.8 million for the years ended March 31, 2020 and 2019, respectively. Average borrowings for the years ended March 31, 2020 and 2019 were $77.1 million and $70.1 million, respectively.
The indenture governing the December 2022 Notes contains certain covenants including but not limited to (i) a requirement that the Company comply with the asset coverage requirement of Section 61 of the 1940 Act as modified by Section 61(a) of the 1940 Act or any successor provisions thereto, after giving effect to any exemptive relief granted to the Company by the SEC, (ii) a requirement, subject to a limited exception, that the Company will not declare any cash dividend, or declare any other cash distribution, upon a class of its capital stock, or purchase any such capital stock, unless, in every such case, at the time of the declaration of any such dividend or distribution, or at the time of any such purchase, the Company has the minimum asset coverage required pursuant to Section 61 of the 1940 Act or any successor provision thereto after deducting the amount of such dividend, distribution or purchase price, as the case may be, giving effect to any exemptive relief granted to the Company by the SEC and (iii) a requirement to provide financial information to the holders of the December 2022 Notes and the trustee under the indenture if the Company should no longer be subject to the reporting requirements under the Securities Exchange Act of 1934, as amended, (the "Exchange Act"). The indenture and supplement relating to the December 2022 Notes also provides for customary events of default. As of March 31, 2020, the Company was in compliance with all covenants of the December 2022 Notes.
October 2024 Notes
In September 2019, the Company issued $65.0 million in aggregate principal amount of 5.375% Notes due 2024 (the “Existing October 2024 Notes”). OnIn October 8, 2019, the Company issued an additional $10.0 million in aggregate principal amount of the October 2024 Notes (the "Additional October 2024 Notes"). In August 2020, the Company issued an additional $50.0 million in aggregate principal amount of the October 2024 Notes (the "New Notes" together with the Existing October 2024 Notes and the Additional October 2024 Notes, the "October 2024 Notes"). The Additional October 2024 Notes are beingand the New Notes were treated as a single series with the Existing October 2024
Notes under the indenture and havehad the same terms as the Existing October 2024 Notes. The maturity date of the October 2024 Notes mature onwas October 1, 2024, and may be redeemedthe October 2024 Notes were redeemable in whole or in part at any time prior to July 1, 2024, at par plus a “make-whole” premium, and thereafter at par. The October 2024 Notes bearbore interest at a rate of 5.375% per year.
On September 24, 2021, the Company redeemed $125.0 million in aggregate principal amount of the issued and outstanding October 2024 Notes. The October 2024 Notes were redeemed at 100% of their principal amount, plus (i) the accrued and unpaid interest thereon, through, but excluding the redemption date, and (ii) a "make-whole" premium. Accordingly, the Company recognized a realized loss on extinguishment of debt, equal to the write-off of the related unamortized debt issuance costs of $1.8 million and the "make-whole" premium of $15.2 million during the three months ended September 30, 2021.
The Company did not recognize any interest expense related to the October 2024 Notes for the year ended March 31, 2023. For the years ended March 31, 2022 and 2021, the Company recognized interest expense related to the October 2024 Notes, including amortization of deferred issuance costs, of $3.6 million and $6.3 million, respectively. From April 1, 2021 through September 24, 2021 (the redemption date of the October 2024 Notes), average borrowings were $125.0 million. The October 2024 Notes had a weighted average effective yield of 5.375%.
January 2026 Notes
In December 2020, the Company issued $75.0 million in aggregate principal amount of 4.50% Notes due 2026 (the "Existing January 2026 Notes"). The Existing January 2026 Notes were issued at par. In February 2021, the Company issued an additional $65.0 million in aggregate principal amount of the January 2026 Notes (the "Additional January 2026 Notes" together with the Existing January 2026 Notes, the "January 2026 Notes"). The Additional January 2026 Notes were issued at a price of 102.11% of the aggregate principal amount of the Additional January 2026 Notes, resulting in a yield-to-maturity of approximately 4.0% at issuance. The Additional January 2026 Notes are treated as a single series with the Existing January 2026 Notes under the indenture and have the same terms as the Existing January 2026 Notes. The January 2026 Notes mature on January 31, 2026 and may be redeemed in whole or in part at any time prior to October 31, 2025, at par plus a "make-whole" premium, and thereafter at par. The January 2026 Notes bear interest at a rate of 4.50% per year, payable semi-annually on April 1January 31 and October 1July 31 of each year, beginning on April 1, 2020.year. The October 2024January 2026 Notes are the direct unsecured obligations of the Company and rank pari passu with our other outstanding and future unsecured unsubordinated indebtedness and are effectively or structurally subordinated to all of our existing and future secured indebtedness, including borrowings under our Credit Facility.Facility and the SBA Debentures.
As of March 31, 2020,2023, the carrying amount of the October 2024January 2026 Notes was $73.5$139.1 million on an aggregate principal amount of $75.0$140.0 million at a weighted average effective yield of 5.375%4.46%. As of March 31, 2020,2023, the fair value of the October 2024January 2026 Notes was $65.7$122.8 million. This is a Level 3 fair value measurement under ASC 820 based on a valuation model using a discounted cash flow analysis. The Company recognized interest expense related to the October 2024January 2026 Notes, including amortization of deferred issuance costs, of $2.2$6.6 million, $6.7 million and $1.2 million for the yearyears ended March 31, 2020. Since the issuance2023, 2022 and 2021, respectively. For each of the October 2024 Notes,years ended March 31, 2023 and 2022, average borrowings were $74.4$140.0 million.
The indenture governing the October 2024January 2026 Notes contains certain covenants, including certain covenants requiring the Company to comply with Section 18(a)(1)(A) as modified by Section 61(a)(2) of the 1940 Act, or any successor provisions, whether or not the Company continues to be subject to such provisions of the 1940 Act, but giving effect, in either case, to any exemptive relief granted to the Company by the SEC, to comply with Section 18(a)(1)(B) as modified by Section 61(a)(2) of the 1940 Act, or any successor provisions, after giving effect to any exemptive relief granted to the Company by the SEC and subject to certain other exceptions, and to provide financial information to the holders of the January 2026 Notes and the trustee under the indenture if the Company is no longer subject to the reporting requirements under the Securities Exchange Act of 1934, as amended (the "Exchange Act"). These covenants are subject to important limitations and exceptions that are described in the indenture and the third supplemental indenture relating to the January 2026 Notes.
In addition, holders of the January 2026 Notes can require the Company to repurchase some or all of the January 2026 Notes at a purchase price equal to 100% of their principal amount, plus accrued and unpaid interest to, but not including, the repurchase date upon the occurrence of a “Change of Control Repurchase Event,” as defined in the third supplemental indenture relating to the January 2026 Notes.
October 2026 Notes
In August 2021, the Company issued $100.0 million in aggregate principal amount of 3.375% Notes due 2026 (the "Existing October 2026 Notes"). The Existing October 2026 Notes were issued at a price of 99.418% of the aggregate principal amount of the Existing October 2026 Notes, resulting in a yield-to-maturity of 3.5%. In November 2021, the Company issued an additional $50.0 million in aggregate principal amount of the October 2026 Notes (the "Additional October 2026 Notes" together with the Existing October 2026 Notes, the "October 2026 Notes"). The Additional October 2026 Notes were issued at a
price of 99.993% of the aggregate principal amount, resulting in a yield-to-maturity of approximately 3.375% at issuance. The Additional October 2026 Notes are treated as a single series with the Existing October 2026 Notes under the indenture and have the same terms as the Existing October 2026 Notes. The October 2026 Notes mature on October 1, 2026 and may be redeemed in whole or in part at any time prior to July 1, 2026, at par plus a "make-whole" premium, and thereafter at par. The October 2026 Notes bear interest at a rate of 3.375% per year, payable semi-annually in arrears on April 1 and October 1 of each year. The October 2026 Notes are the direct unsecured obligations of the Company and rank pari passu with our other outstanding and future unsecured unsubordinated indebtedness and are effectively or structurally subordinated to all of our existing and future secured indebtedness, including borrowings under our Credit Facility and the SBA Debentures.
As of March 31, 2023, the carrying amount of the October 2026 Notes was $147.3 million on an aggregate principal amount of $150.0 million at a weighted average effective yield of 3.5%. As of March 31, 2023, the fair value of the October 2026 Notes was $132.2 million. This is a Level 3 fair value measurement under ASC 820 based on a valuation model using a discounted cash flow analysis. The Company recognized interest expense related to the October 2026 Notes, including amortization of deferred issuance costs, of $5.8 million and $3.1 million for the years ended March 31, 2023, respectively. For the year ended March 31, 2023, average borrowings were $150.0 million. Since the issuance of the October 2026 Notes on August 27, 2021 through March 31, 2022, average borrowings were $132.9 million.
The indenture governing the October 2026 Notes contains certain covenants, including certain covenants requiring the Company to comply with Section 18(a)(1)(A) as modified by Section 61(a)(2) of the 1940 Act, or any successor provisions, whether or not the Company continues to be subject to such provisions of the 1940 Act, but giving effect, in either case, to any exemptive relief granted to the Company by the SEC, to comply with Section 18(a)(1)(B) as modified by Section 61(a)(2) of the 1940 Act, or any successor provisions, after giving effect to any exemptive relief granted to the Company by the SEC and subject to certain other exceptions, and to provide financial information to the holders of the October 20242026 Notes and the trustee under the indenture if the Company is no longer subject to the reporting requirements under the Exchange Act. These covenants are subject to important limitations and exceptions that are described in the indenture and the secondfourth supplemental indenture relating to the October 20242026 Notes.
In addition, holders of the October 2026 Notes can require the Company to repurchase some or all of the October 20242026 Notes at a purchase price equal to 100% of their principal amount, plus accrued and unpaid interest to, but not including, the repurchase date upon the occurrence of a “Change of Control Repurchase Event,” as defined in the secondfourth supplemental indenture relating to the October 20242026 Notes.
SBA Debentures
On April 20, 2021, SBIC I received a license from the SBA to operate as an SBIC under Section 301(c) of the Small Business Investment Act of 1958, as amended. The license allows SBIC I to obtain leverage by issuing SBA Debentures, subject to the issuance of a leverage commitment by the SBA. SBA Debentures are loans issued to an SBIC which have interest payable semi-annually and a ten-year maturity. The interest rate is fixed shortly after issuance at a market-driven spread over U.S. Treasury Notes with ten-year maturities. Interest on SBA Debentures is payable semi-annually on March 1 and September 1. Current statutes and regulations permit SBIC I to borrow up to $175 million in SBA Debentures with at least $87.5 million in regulatory capital (as defined in the SBA regulations).
On May 25, 2021, SBIC I received a leverage commitment from the SBA in the amount of $40.0 million to be issued on or prior to September 30, 2025. On January 28, 2022, SBIC I received an additional leverage commitment in the amount of $40.0 million to be issued on or prior to September 30, 2026. On November 22, 2022, SBIC I received an additional leverage commitment in the amount of $50.0 million to be issued on or prior to September 30, 2027. As of March 31, 2023, SBIC I had regulatory capital of $65.0 million and leverageable capital of $65.0 million. As of March 31, 2023, SBIC I had a total leverage commitment from the SBA in the amount of $130.0 million, of which $10.0 million remains unused. The SBA may limit the amount that may be drawn each year under these commitments, and each issuance of leverage is conditioned on the Company’s full compliance, as determined by the SBA, with the terms and conditions set forth in the SBA regulations.
As of March 31, 2023, the carrying amount of SBA Debentures was $116.3 million on an aggregate principal amount of $120.0 million. As of March 31, 2023, the fair value of the SBA Debentures was $115.8 million. The fair value of the SBA Debentures is estimated by discounting the remaining payments using current market rates for similar instruments and considering such factors as the legal maturity date and the ability of market participants to prepay the SBA Debentures, which are Level 3 inputs under ASC 820. The Company recognized interest expense and fees related to SBA Debentures of $3.2 million and $0.3 million for the years ended March 31, 2023 and 2022, respectively. The weighted average interest rate on
the SBA Debentures was 3.38% and 1.30% for the years ended March 31, 2023 and 2022, respectively. For the years ended March 31, 2023 and 2022, average borrowings were $82.6 million and $17.0 million, respectively.
As of March 31, 2023, the Company's issued and outstanding SBA Debentures mature as follows (amounts in thousands):
| | | | | | | | | | | | | | | | | | | | |
| Pooling Date (1) | | Maturity Date | | Fixed Interest Rate | | March 31, 2023 |
| 9/22/2021 | | 9/1/2031 | | 1.575% | | $ | 15,000 | |
| 3/23/2022 | | 3/1/2032 | | 3.209% | | 25,000 | |
| 9/21/2022 | | 9/1/2032 | | 4.435% | | 40,000 | |
| 3/22/2023 | | 3/1/2033 | | 5.215% | | 40,000 | |
| | | | | | $ | 120,000 | |
(1)The SBA has two scheduled pooling dates for SBA Debentures (in March and in September). Certain SBA Debentures funded during the reporting periods may not be pooled until the subsequent pooling date.
Equity Capital Activities
In January 2016, our boardOn November 17, 2022, the Company completed an underwritten public equity offering of directors approved a share repurchase program authorizing us to repurchase up to $10 million in the aggregate2,534,436 shares of our outstanding common stock, inincluding shares issuable pursuant to the open marketunderwriters' option to purchase additional shares, at certain thresholds below our net asset valuea public offering price of $18.15 per share, in accordance with guidelines specified in Rules 10b5-1(c)(1)(i)(B)raising $46.0 million of gross proceeds. Net proceeds were $44.1 million after deducting underwriting discounts and 10b-18 under the Exchange Act. During the year ended March 31, 2020, the Company repurchased a total of 794,180 shares at an average price of $11.57 per share, including commissions paid. As of March 31, 2020, we had repurchased a total of 840,543 shares of our common stock in the open market under the stock repurchase program, at an average price of $11.85, including commissions paid, and, as a result, the Company may repurchase up to an additional $43 thousand of its common stock under the share repurchase program.offering expenses.
On March 4, 2019, the Company established an "at-the-market" offering (the "Equity ATM Program") pursuant to which the Company may offer and sell, from time to time through sales agents, shares of its common stock having an aggregate offering price of up to $50,000,000. On February 4, 2020, the Company (i) increased the maximum amount of shares of its common stock to be sold through the Equity ATM Program to $100,000,000 from $50,000,000 and (ii) added two additional sales agents to the Equity ATM Program. DuringOn May 26, 2021, the year endedCompany (i) increased the maximum amount of shares of its common stock to be sold through the Equity ATM Program to $250,000,000 from $100,000,000 and (ii) reduced the commission paid to the sales agents for the Equity ATM Program to 1.5% from 2.0% of the gross sales price of shares of the Company's common stock sold through the sales agents pursuant to the Equity ATM Program on and after May 26, 2021. On August 2, 2022, the Company increased the maximum amount of shares of its common stock to be sold through the Equity ATM Program to $650,000,000 from $250,000,000.
The following table summarizes certain information relating to shares sold under the Equity ATM Program:
| | | | | | | | | | | |
| |
| | | |
| | | |
| | | |
| | | |
| | | |
| | | |
| Years Ended March 31, |
| 2023 | | 2022 |
| Number of shares sold | 8,435,462 | | | 3,872,031 | |
| Gross proceeds received (in thousands) | $ | 161,216 | | | $ | 99,636 | |
Net proceeds received (in thousands)1 | $ | 158,798 | | | $ | 98,142 | |
| Weighted average price per share | $ | 19.11 | | | $ | 25.73 | |
1Net proceeds reflects proceeds after deducting commissions to the sales agents on shares sold and offering expenses. As of March 31, 2020,2023, no proceeds remained receivable. As of March 31, 2022, $1.7 million in proceeds remained receivable and was included in other receivables in the Consolidated Statement of Assets and Liabilities.
Cumulative to date, the Company has sold 1,231,43216,613,122 shares of its common stock under the Equity ATM Program at a weighted-average price of $21.71 per share,$20.75, raising $26.7$344.7 million of gross proceeds. Net proceeds were $26.2 million, after deducting commissions to the sales agents on shares sold. Cumulative to date, the Company has sold 1,495,088 shares of its common stock under the Equity ATM Program at a weighted-average price of $21.67, raising $32.4 million of gross proceeds. Net proceeds were $31.7$339.1 million after commissions to the sales agents on shares sold. As of March 31, 2023, the Company has $305.3 million available under the Equity ATM Program.
On August 1, 2019, after receivingJuly 28, 2021, the requisite shareholder approval,Company's Board of Directors approved a share repurchase program authorizing the Company filed an amendment to repurchase up to $20 million of its Amended and Restated Articles of Incorporation to increase the amount of authorizedoutstanding shares of common stock from 25,000,000 to 40,000,000.
In order to satisfyin the Code requirements applicable to a RIC, we intend to distribute to our shareholders, after considerationopen market at certain thresholds below its NAV per share, in accordance with guidelines specified in Rules 10b5-1(c)(1)(i)(B) and application of our ability10b-18 under the CodeExchange Act. On August 31, 2021, the Company entered into a share repurchase agreement, which became effective immediately, and the
Company will cease purchasing its common stock under the share repurchase program upon the earlier of, among other things: (1) the date on which the aggregate purchase price for all shares equals $20 million including, without limitation, all applicable fees, costs and expenses; or (2) upon written notice by the Company to carry forward certain excess undistributed taxable income from one tax year into the next tax year, substantially all of our taxable income.broker that the share repurchase agreement is terminated. During the years ended March 31, 2023 and 2022, the Company did not repurchase any shares under the share repurchase program.
OFF-BALANCE SHEET ARRANGEMENTS
We may be a party to financial instruments with off-balance sheet risk in the normal course of business to meet the financial needs of our portfolio companies. These instruments may include commitments to extend credit and fund equity capital and involve, to varying degrees, elements of liquidity and credit risk in excess of the amount recognized in the balance sheet. Because commitments may expire without being drawn upon, the total commitment amount does not necessarily represent future cash requirements. Additionally, our commitment to fund delayed draw term loans generally is triggered upon the satisfaction of certain pre-negotiated terms and conditions, such as meeting certain financial performance hurdles or financial covenants, which may limit a borrower's ability to draw on such delayed draw term loans.
At March 31, 20202023 and 2019,March 31, 2022, we had a total of approximately $15.2$125.2 million and $17.7$134.3 million, respectively, in currently unfunded commitments (as discussed in Note 11 to the Consolidated Financial Statements). As of March 31, 2020,2023, the total unfunded commitments included commitments to issueletters of credit through a financial intermediary on behalf of certain portfolio companies. As of March 31, 2020 and March 31, 2019,2023, we had $3.4$0.9 million in letters of credit issued and outstanding under these commitments on behalf of the portfolio companies. For the letters of credit issued and outstanding, we would be required to make payments to third parties if the portfolio companies were to default on their related payment obligations.Of these letters of credit, $3.4$0.3 million expire in May 2021.August 2023, $0.4 million expire in February 2024 and $0.2 million expire in April 2024. As of March 31, 2020 and March 31, 2019,2023, none of the letters of credit issued and outstanding were recorded as a liability on the Company's balance sheet as such letters of credit are considered in the valuation of the investments in the portfolio company.
The Company believes its assets will provide adequate coverage to satisfy these unfunded commitments. As of March 31, 2020,2023, the Company had cash and cash equivalents of $13.7$21.6 million and $167.6$164.4 million in available borrowings under the Credit Facility.
Contractual Obligations
As shown below, we had the following contractual obligations as of March 31, 2020.2023. For information on our unfunded investment commitments, see Note 11 of the Notes to Consolidated Financial Statements.
| | | | | | | | | | | | | | | | | | | | | | | | | | | | | |
| Payments Due By Period |
| (in thousands) |
| Total | | Less than | | 1-3 Years | | 3-5 Years | | More Than |
| Contractual Obligations | | 1 Year | | | | 5 Years |
| Operating lease obligations | $ | 4,262 | | | $ | 406 | | | $ | 842 | | | $ | 882 | | | $ | 2,132 | |
| Credit Facility (1) | 276,784 | | | 12,474 | | | 24,879 | | | 239,431 | | | — | |
| January 2026 Notes (2) | 158,900 | | | 6,300 | | | 152,600 | | | — | | | — | |
| October 2026 Notes (2) | 170,250 | | | 5,062 | | | 10,125 | | | 155,063 | | | — | |
| $ | 610,196 | | | $ | 24,242 | | | $ | 188,446 | | | $ | 395,376 | | | $ | 2,132 | |
|
| | | | | | | | | | | | | | | | | | | |
| | Payments Due By Period |
| | (In thousands) |
| | | | Less than | | | | | | More Than |
| Contractual Obligations | Total | | 1 Year | | 1-3 Years | | 3-5 Years | | 5 Years |
| Operating lease obligations | $ | 514 |
| | $ | 266 |
| | $ | 248 |
| | $ | — |
| | $ | — |
|
| Credit Facility (1) | 182,021 |
| | 7,526 |
| | 15,052 |
| | 159,443 |
| | — |
|
| December 2022 Notes (2) | 89,477 |
| | 4,598 |
| | 84,879 |
| | — |
| | — |
|
| October 2024 Notes (2) | 95,202 |
| | 4,076 |
| | 8,063 |
| | 83,063 |
| | |
| Total | $ | 367,214 |
| | $ | 16,466 |
| | $ | 108,242 |
| | $ | 242,506 |
| | $ | — |
|
| |
(1) | Amounts include interest payments calculated at an average rate of 4.82% of outstanding Credit Facility borrowings, which were $154.0 million as of March 31, 2020. |
| |
(2) | Includes interest payments. |
(2)Includes interest payments.
RECENT DEVELOPMENTS
On April 22, 2020,26, 2023, the Board of Directors declared a total dividend of $0.51$0.59 per share, comprised of a regular dividend of $0.41$0.54 and a supplemental dividend of $0.10,$0.05, for the quarter endedending June 30, 2020.2023. The record date for the dividend is June 15, 2020.2023. The payment date for the dividend is June 30, 2020.2023.
On May 28, 2020,April 26, 2023, pursuant to Rule 2a-5 under the 1940 Act, the Board of Directors declareddesignated a total dividendcommittee of $0.51 per share, comprisedcertain
officers of a regular dividendthe Company as the Board's valuation designee (the “Valuation Designee”) to determine the fair value of $0.41 and a supplemental dividend of $0.10, for the quarter ended September 30, 2020. The record date for the dividend is September 15, 2020. The payment date for the dividend is September 30, 2020.
COVID-19
The Company has been closely monitoring the COVID-19 pandemic, its broader impact on the global economy and the more recent impacts on the U.S. economy. As of June 2, 2020, there is no indication of a reportable subsequent event impacting the Company’s financial statements for the year ended March 31, 2020. The Company cannot predict the extent to which its financial condition and results of operations will be affected at this time. The potential impact to our results will depend to a large extent on future developments and new informationCompany's investments that may emerge regarding the duration and severity of COVID-19. The Company continues to observe and responddo not have readily available market quotations, subject to the evolving COVID-19 environment and its potential impact on areas across its business.oversight of the Board of Directors, effective beginning as of the fiscal quarter ending June 30, 2023.
Item 7A. Quantitative and Qualitative Disclosures about Market Risk
We are subject to market risk. Market risk includes risk that arise from changes in interest rates, commodity prices, equity prices and other market changes that affect market sensitive instruments. The prices of securities held by us may decline in response to certain events, including those directly involving the companies in which we invest; conditions affecting the general economy, including public health emergencies, such as COVID-19;economy; overall market changes;changes, including an increase in market volatility; interest rate volatility, including the decommissioning of LIBOR and rising interest rates; inflationary pressures; legislative reform; and local, regional, national or global political, social or economic instability; and interest rate fluctuations.instability.
Interest Rate Risk
We are subject to interest rate risk. See “Risk Factors - Risks Related to our Investments - “Changes in interest rates may affect our cost of capital, the value of investments and net investment income.”Interest rate risk is defined as the sensitivity of our current and future earnings to interest rate volatility, variability of spread relationships, the difference in re-pricing internals between our assets and liabilities and the effect that interest rates may have on our cash flows. Changes in the general level of interest rates can affect our net interest income, which is the difference between the interest income earned on interest earning assets and our interest expense incurred in connection with our interest-bearing liabilities. Changes in interest rates can also affect, among other things, our ability to acquire and originate loans and securities and the value of our investment portfolio. Our net investment income is affected by fluctuations in various interest rates, including the decommissioning of LIBOR and changes in alternate rates and prime rates, to the extent our debt investments include floating interest rates. A large portion of our portfolio is comprised of floating rate investments that utilize LIBOR, SOFR or an alternative rate.
Since March 2022, the Federal Reserve has been rapidly raising interest rates and has indicated that it would consider additional rate hikes in response to ongoing inflation concerns. In a rising interest rate environment, our cost of funds would increase, which could reduce our net investment income if there is not a corresponding increase in interest income generated by our investment portfolio. It is possible that the Federal Reserve's tightening cycle could result in a recession in the United States, which would likely lead to a decrease in interest rates. Alternatively, a prolonged reduction in interest rates will reduce our gross investment income and could result in a decrease in our net investment income if such decreases in base rates, such as LIBOR or SOFR, are not offset by a corresponding increase in the spread over such base rate that we earn on any portfolio investments or a decrease in the interest rate of our floating interest rate liabilities tied to such base rate. See “Risk Factors — The interest rates of our loans to our portfolio companies, any LIBOR-linked securities, and other financial obligations that extend beyond 2021 might be subject to change based on recent regulatory changes, including the decommissioning of LIBOR” for more information.
Our interest expenseexpenses also will also be affected by changes in the published LIBORSOFR rate in connection with our Credit Facility. See “Risk Factors - Risks Related to our Investments - Changes relating to the LIBOR calculation process may adversely affect the value of the LIBOR-indexed, floating-rate debt securities in our portfolio.” The interest rates on the December 2022October 2026 Notes, the January 2026 Notes and the October 2024 NotesSBA Debentures are fixed for the life of such debt. Our risk management systems and procedures are designed to identify and analyze our risk, to set appropriate policies and limits and to continually monitor these risks. We regularly measure exposure to interest rate risk and determine whether or not any hedging transactions are necessary to mitigate exposure to changes in interest rates. As of March 31, 2020,2023, we were not a party to any hedging arrangements.
As of March 31, 2020,2023, approximately 96.8%96.7% of our debt investment portfolio (at fair value) bore interest at floating rates, 100.0% of which 97.6% were subject to contractual minimum interest rates. A hypothetical 100 basis point increase in interest rates could increase our net investment income by a maximum of $2.8 million, or $0.15 per share, on an annual basis. A hypothetical 100 basis point decrease in interest rates could increase our net investment income by a maximum of $0.4 million, or $0.02 per share, on an annual basis. Our Credit Facility bears interest on a per annum basis equal to the applicable LIBORAdjusted Term SOFR rate plus 2.50%, subject to certain conditions as outlined in the Credit Agreement.2.15%. We pay unused commitment fees of 0.50% to 1.00% per annum, based on utilization. The following table shows the approximate annualized increase or decrease in net investment income due to hypothetical base rate changes in interest rates, assuming no changes in our investments and borrowings as of March 31, 2023.
| | | | | | | | |
| Basis Point Change | Increase (decrease) in net investment income (in thousands) | Increase (decrease) net investment income per share |
| (200 bps) | $ | (16,942) | | $ | (0.47) | |
| (150 bps) | (12,707) | | (0.35) | |
| (100 bps) | (8,471) | | (0.23) | |
| (50 bps) | (4,236) | | (0.12) | |
| 50 bps | 4,236 | | 0.12 | |
Although we believe that the foregoing analysis is indicative of our sensitivity to interest rate changes, it does not adjust for potential changes in the credit market, credit quality, size and composition of the assets in our portfolio. It also does not adjust for other business developments, including future borrowings that could affect the net increase in net assets resulting from operations, or net income. It also does not assume any repayments from borrowers. Accordingly, no assurances can be given that actual results would not differ materially from the statementtable above.
Because we currently borrow, and plan to borrow in the future, money to make investments, our net investment income is dependent upon the difference between the rate at which we borrow funds and the rate at which we invest the funds borrowed. Accordingly, there can be no assurance that a significant change in interest rates will not have a material adverse effect on our net investment income. In periods of rising interest rates, our cost of funds would increase, which could reduce our net investment income if there is not a corresponding increase in interest income generated by our investment portfolio.
Item 8. Financial Statements and Supplementary Data
Index to Financial Statements
Report of Independent Registered Public Accounting Firm
To the Shareholders and the Board of Directors of Capital Southwest Corporation and Subsidiaries
Opinion on the Financial Statements
We have audited the accompanying consolidated statements of assets and liabilities including the consolidated schedules of investments, of Capital Southwest Corporation and Subsidiaries (the Company), including the consolidated schedules of investments, as of March 31, 20202023 and 2019, and2022, the related consolidated statements of operations, changes in net assets, and cash flows for each of the three years in the period ended March 31, 2020,2023, and the related notes to the consolidated financial statements and the Schedule of Investments in and Advances to Affiliates of the Company listed in Schedule 12-14 for the year ended March 31, 20202023 (collectively, the financial statements). In our opinion, the financial statements present fairly, in all material respects, the financial position of the Company as of March 31, 20202023 and 2019,2022, and the results of its operations, changes in net assets, and its cash flows for each of the three years in the period ended March 31, 2020,2023, in conformity with accounting principles generally accepted in the United States of America, , and in our opinion, the related Schedule of Investments in and Advances to Affiliates, when considered in relation to the basic consolidated financial statements taken as a whole, presentpresents fairly in all material respects the information set forth therein.
We have also audited, in accordance with the standards of the Public Company Accounting Oversight Board (United States) (PCAOB), the Company's internal control over financial reporting as of March 31, 2020, based on criteria established in Internal Control - Integrated Framework issued by the Committee of Sponsoring Organizations of the Treadway Commission in 2013, and our report dated June 2, 2020, expressed an unqualified opinion on the effectiveness of the Company’s internal control over financial reporting.
Basis for Opinion
These financial statements are the responsibility of the Company’s management. Our responsibility is to express an opinion on the Company’s financial statements based on our audits. We are a public accounting firm registered with the PCAOBPublic Company Accounting Oversight Board (United States) (PCAOB) and are required to be independent with respect to the Company in accordance with U.S. federal securities laws and the applicable rules and regulations of the Securities and Exchange Commission and the PCAOB.
We conducted our audits in accordance with the standards of the PCAOB. Those standards require that we plan and perform the auditsaudit to obtain reasonable assurance about whether the financial statements are free of material misstatement, whether due to error or fraud. The Company is not required to have, nor were we engaged to perform, an audit of its internal control over financial reporting. As part of our audits we are required to obtain an understanding of internal control over financial reporting but not for the purpose of expressing an opinion on the effectiveness of the Company’s internal control over financial reporting. Accordingly, we express no such opinion.
Our audits included performing procedures to assess the risks of material misstatement of the financial statements, whether due to error or fraud, and performing procedures that respond to those risks. Such procedures included examining, on a test basis, evidence regarding the amounts and disclosures in the financial statements. Our procedures included confirmation of investments owned as of March 31, 2023 and 2022, by correspondence with the custodians or the portfolio companies and other appropriate procedures where replies were not received. Our audits also included evaluating the accounting principles used and significant estimates made by management, as well as evaluating the overall presentation of the financial statements. Our procedures included confirmation of investments owned as of March 31, 2020 and 2019, by correspondence with the custodians, portfolio companies or agents or by other appropriate procedures where replies from custodians, portfolio companies or agents were not received. We believe that our audits provide a reasonable basis for our opinion.
Critical Audit Matters
The critical audit matter communicated below is a matter arising from the current period audit of the financial statements that was communicated or required to be communicated to the audit committee and that: (1) relates to accounts or disclosures that are material to the financial statements and (2) involved our especially challenging, subjective or complex judgments. The communication of critical audit matters does not alter in any way our opinion on the financial statements, taken as a whole, and we are not, by communicating the critical audit matter below, providing a separate opinion on the critical audit matter or on the accounts or disclosures to which it relates.
Fair value of investments using significant unobservable inputs
As discussed in Note 4, at March 31, 2023, the fair value of the Company’s investments categorized as Level 3 investments within the fair value hierarchy (Level 3 investments) totaled $1,155.132 million. Level 3 investments represent investments whose values are based on unobservable inputs that are significant to the overall fair value measurement. Management estimates, and the Board of Directors approves, the fair value of the Company’s Level 3 investments by applying the methodologies outlined in Notes 2 and 4 to the financial statements.
We identified the fair value of Level 3 investments as a critical audit matter because of the management judgment necessary to select the valuation techniques used to estimate the fair value of the investments and to estimate the significant unobservable
inputs used in those valuation techniques. Auditing the fair value of the Company’s Level 3 investments is complex, as the valuation techniques, unobservable inputs and assumptions used by management are highly judgmental and changes could have a significant effect on the fair value measurements of such investments.
The audit procedures we performed to address this critical audit matter included the following, among others:
•We evaluated the appropriateness of the Company’s valuation techniques used for Level 3 investments by reviewing the reasonableness of significant changes in those valuation techniques from the prior year-end, if applicable, and also comparing to those used by market participants.
•We tested the reasonableness of assumptions used by management to estimate the unobservable inputs, including market yield, financial performance measures, and discounts rates, by comparing these inputs to market information obtained from external sources.
•For a sample of investments, we utilized valuation specialists, with specialized skill and knowledge, to assist with evaluation of the Company’s valuation techniques and testing the reasonableness of the assumptions used by management.
•We evaluated the Company’s historical ability to estimate fair value by comparing the transaction price of available transactions occurring subsequent to the prior period valuation date against the fair value estimate determined by the Company in the prior period.
•We evaluated subsequent events and other available information and considered whether this information corroborated or contradicted the Company’s year-end valuations.
•We tested broker quotes using third-party quotes, if available.
/s/ RSM US LLP
We have served as the Company's auditor since 2017.
Chicago, Illinois
June 2, 2020May 23, 2023
69
Report of Independent Registered Public Accounting Firm
To the Shareholders and the Board of Directors of Capital Southwest Corporation and Subsidiaries
Opinion on the Internal Control Over Financial Reporting
We have audited Capital Southwest Corporation and Subsidiaries' (the Company) internal control over financial reporting as of March 31, 2020, based on criteria established in Internal Control - Integrated Framework issued by the Committee of Sponsoring Organizations of the Treadway Commission in 2013. In our opinion, the Company maintained, in all material respects, effective internal control over financial reporting as of March 31, 2020, based on criteria established in Internal Control - Integrated Framework issued by the Committee of Sponsoring Organizations of the Treadway Commission in 2013.
We have also audited, in accordance with the standards of the Public Company Accounting Oversight Board (United States) (PCAOB), the consolidated statements of assets and liabilities, including the consolidated schedules of investments, of the Company as of March 31, 2020 and 2019, and the related consolidated statements of operations, changes in net assets and cash flows for each of the three years ended March 31, 2020, the related notes to the consolidated financial statements and our report dated June 2, 2020 expressed an unqualified opinion.
Basis for Opinion
The Company’s management is responsible for maintaining effective internal control over financial reporting and for its assessment of the effectiveness of internal control over financial reporting in the accompanying Management’s Report on Internal Control over Financial Reporting. Our responsibility is to express an opinion on the Company’s internal control over financial reporting based on our audit. We are a public accounting firm registered with the PCAOB and are required to be independent with respect to the Company in accordance with U.S. federal securities laws and the applicable rules and regulations of the Securities and Exchange Commission and the PCAOB.
We conducted our audit in accordance with the standards of the PCAOB. Those standards require that we plan and perform the audit to obtain reasonable assurance about whether effective internal control over financial reporting was maintained in all material respects. Our audit included obtaining an understanding of internal control over financial reporting, assessing the risk that a material weakness exists, and testing and evaluating the design and operating effectiveness of internal control based on the assessed risk. Our audit also included performing such other procedures as we considered necessary in the circumstances. We believe that our audit provides a reasonable basis for our opinion.
Definition and Limitations of Internal Control Over Financial Reporting
A company's internal control over financial reporting is a process designed to provide reasonable assurance regarding the reliability of financial reporting and the preparation of financial statements for external purposes in accordance with generally accepted accounting principles. A company's internal control over financial reporting includes those policies and procedures that (1) pertain to the maintenance of records that, in reasonable detail, accurately and fairly reflect the transactions and dispositions of the assets of the company; (2) provide reasonable assurance that transactions are recorded as necessary to permit preparation of financial statements in accordance with generally accepted accounting principles, and that receipts and expenditures of the company are being made only in accordance with authorizations of management and directors of the company; and (3) provide reasonable assurance regarding prevention or timely detection of unauthorized acquisition, use or disposition of the company's assets that could have a material effect on the financial statements.
Because of its inherent limitations, internal control over financial reporting may not prevent or detect misstatements. Also, projections of any evaluation of effectiveness to future periods are subject to the risk that controls may become inadequate because of changes in conditions, or that the degree of compliance with the policies or procedures may deteriorate.
/s/ RSM US LLP
Chicago, Illinois
June 2, 2020
CAPITAL SOUTHWEST CORPORATION AND SUBSIDIARIES
CONSOLIDATED STATEMENTS OF ASSETS AND LIABILITIES
(In thousands except share and per share data)
|
| | | | | | | |
| | March 31, | | March 31, |
| | 2020 | | 2019 |
| Assets | |
| | |
|
| Investments at fair value: | |
| | |
|
| Non-control/Non-affiliate investments (Cost: $436,463 and $305,596, respectively) | $ | 421,280 |
| | $ | 304,663 |
|
| Affiliate investments (Cost: $94,724 and $79,277, respectively) | 92,032 |
| | 80,905 |
|
| Control investments (Cost: $68,000 and $93,182, respectively) | 39,760 |
| | 138,503 |
|
| Total investments (Cost: $599,187 and $478,055, respectively) | 553,072 |
| | 524,071 |
|
| Cash and cash equivalents | 13,744 |
| | 9,924 |
|
| Receivables: | | | |
| Dividends and interest | 10,389 |
| | 9,252 |
|
| Escrow | 1,643 |
| | 370 |
|
| Other | 51 |
| | 1,244 |
|
| Income tax receivable | 147 |
| | 183 |
|
| Deferred tax asset | 1,402 |
| | 1,807 |
|
| Debt issuance costs (net of accumulated amortization of $2,720 and $1,814, respectively) | 2,980 |
| | 3,364 |
|
| Other assets | 1,531 |
| | 1,628 |
|
| Total assets | $ | 584,959 |
| | $ | 551,843 |
|
| | | | |
| Liabilities | | | |
| December 2022 Notes (Par value: $77,136 and $77,136, respectively) | $ | 75,812 |
| | $ | 75,099 |
|
| October 2024 Notes (Par value: $75,000 and $0, respectively) | 73,484 |
| | — |
|
| Credit facility | 154,000 |
| | 141,000 |
|
| Other liabilities | 4,883 |
| | 6,516 |
|
| Accrued restoration plan liability | 3,082 |
| | 3,073 |
|
| Income tax payable | 513 |
| | 192 |
|
| Deferred income taxes | 963 |
| | — |
|
| Total liabilities | $ | 312,737 |
| | $ | 225,880 |
|
| | | | |
| Commitments and contingencies (Note 11) | | | |
| | | | |
| Net Assets | | | |
| Common stock, $0.25 par value: authorized, 40,000,000 shares at March 31, 2020 and 25,000,000 at March 31, 2019; issued, 20,337,610 shares at March 31, 2020 and 19,842,528 shares at March 31, 2019 | $ | 5,085 |
| | $ | 4,961 |
|
| Additional paid-in capital | 310,846 |
| | 281,205 |
|
| Total distributable earnings | (19,772 | ) | | 63,734 |
|
| Treasury stock - at cost, 2,339,512 shares | (23,937 | ) | | (23,937 | ) |
| Total net assets | 272,222 |
| | 325,963 |
|
| Total liabilities and net assets | $ | 584,959 |
| | $ | 551,843 |
|
| Net asset value per share (17,998,098 shares outstanding at March 31, 2020 and 17,503,016 shares outstanding at March 31, 2019) | $ | 15.13 |
| | $ | 18.62 |
|
| | | | | | | | | | | |
| CAPITAL SOUTHWEST CORPORATION AND SUBSIDIARIES |
| CONSOLIDATED STATEMENTS OF ASSETS AND LIABILITIES |
| (In thousands, except shares and per share data) |
| | | |
| March 31, | | March 31, |
| 2023 | | 2022 |
| | | |
| Assets | | | |
| Investments at fair value: | | | |
| Non-control/Non-affiliate investments (Cost: $947,829 and $721,392, respectively) | $ | 966,627 | | | $ | 747,132 | |
| Affiliate investments (Cost: $191,523 and $140,911, respectively) | 188,505 | | | 131,879 | |
| Control investments (Cost: $80,800 and $76,000, respectively) | 51,256 | | | 57,603 | |
| Total investments (Cost: $1,220,152 and $938,303, respectively) | 1,206,388 | | | 936,614 | |
| Cash and cash equivalents | 21,585 | | | 11,431 | |
| Receivables: | | | |
| Dividends and interest | 18,430 | | | 12,106 | |
| Escrow | 363 | | | 1,344 | |
| Other | 647 | | | 2,238 | |
| Income tax receivable | 368 | | | 158 | |
| Debt issuance costs (net of accumulated amortization of $5,642 and $4,573, respectively) | 3,717 | | | 4,038 | |
| Other assets | 6,186 | | | 6,028 | |
| Total assets | $ | 1,257,684 | | | $ | 973,957 | |
| | | |
| Liabilities | | | |
| SBA Debentures (Par value: $120,000 and $40,000, respectively) | $ | 116,330 | | | $ | 38,352 | |
| January 2026 Notes (Par value: $140,000 and $140,000, respectively) | 139,051 | | | 138,714 | |
| October 2026 Notes (Par value: $150,000 and $150,000, respectively) | 147,263 | | | 146,522 | |
| Credit facility | 235,000 | | | 205,000 | |
| Other liabilities | 16,761 | | | 14,808 | |
| Accrued restoration plan liability | 598 | | | 2,707 | |
| Income tax payable | 156 | | | 1,240 | |
| Deferred tax liability | 12,117 | | | 5,747 | |
| Total liabilities | 667,276 | | | 553,090 | |
| | | |
| Commitments and contingencies (Note 11) | | | |
| | | |
| Net Assets | | | |
| Common stock, $0.25 par value: authorized, 40,000,000 shares; issued, 38,415,937 shares at March 31, 2023 and 27,298,032 shares at March 31, 2022 | 9,604 | | | 6,825 | |
| Additional paid-in capital | 646,586 | | | 448,235 | |
| Total distributable (loss) earnings | (41,845) | | | (10,256) | |
| Treasury stock - at cost, 2,339,512 shares | (23,937) | | | (23,937) | |
| Total net assets | 590,408 | | | 420,867 | |
| Total liabilities and net assets | $ | 1,257,684 | | | $ | 973,957 | |
| Net asset value per share (36,076,425 shares outstanding at March 31, 2023 and 24,958,520 shares outstanding at March 31, 2022) | $ | 16.37 | | | $ | 16.86 | |
The accompanying Notes are an integral part of these Consolidated Financial Statements.
CAPITAL SOUTHWEST CORPORATION AND SUBSIDIARIES
CONSOLIDATED STATEMENTS OF OPERATIONS
(In thousands except share and per share data)
|
| | | | | | | | | | | |
| | Years Ended March 31, |
| | 2020 | | 2019 | | 2018 |
| Investment income: | |
| | |
| | |
|
| Interest income: | |
| | |
| | |
|
| Non-control/Non-affiliate investments | $ | 38,094 |
| | $ | 28,716 |
| | $ | 18,257 |
|
| Affiliate investments | 8,559 |
| | 7,143 |
| | 3,513 |
|
| Control investments | 265 |
| | 1,406 |
| | 82 |
|
| Dividend income: | | | | | |
| Non-control/Non-affiliate investments | 166 |
| | 197 |
| | — |
|
| Affiliate investments | 141 |
| | 82 |
| | 127 |
|
| Control investments | 12,136 |
| | 12,648 |
| | 12,254 |
|
| Interest income from cash and cash equivalents | 73 |
| | 36 |
| | 21 |
|
| Fees and other income | 2,605 |
| | 1,653 |
| | 872 |
|
| Total investment income | 62,039 |
| | 51,881 |
| | 35,126 |
|
| Operating expenses: | | | | | |
| Compensation | 7,310 |
| | 7,715 |
| | 7,013 |
|
| Spin-off compensation plan | — |
| | — |
| | 517 |
|
| Share-based compensation | 2,853 |
| | 2,271 |
| | 1,708 |
|
| Interest | 15,836 |
| | 12,178 |
| | 4,875 |
|
| Professional fees | 2,029 |
| | 1,737 |
| | 1,580 |
|
| Net pension expense | 143 |
| | 159 |
| | 164 |
|
| General and administrative | 3,574 |
| | 3,063 |
| | 2,841 |
|
| Total operating expenses | 31,745 |
| | 27,123 |
| | 18,698 |
|
| Income before taxes | 30,294 |
| | 24,758 |
| | 16,428 |
|
| Income tax expense | 2,062 |
| | 1,048 |
| | 195 |
|
| Net investment income | $ | 28,232 |
| | $ | 23,710 |
| | $ | 16,233 |
|
| | | | | | |
| Net realized gain | | | | | |
| Non-control/Non-affiliate investments | 1,335 |
| | 2,124 |
| | 1,492 |
|
| Affiliate investments | 57 |
| | 77 |
| | 90 |
|
| Control investments | 44,300 |
| | 18,653 |
| | — |
|
| Taxes on deemed distribution of long-term capital gains | (3,461 | ) | | — |
| | — |
|
| Total net realized gain on investments, net of tax | 42,231 |
| | 20,854 |
| | 1,582 |
|
| | | | | | |
| Net unrealized (depreciation) appreciation on investments | | | | | |
| Non-control/Non-affiliate investments | (14,250 | ) | | (934 | ) | | (4,325 | ) |
| Affiliate investments | (4,320 | ) | | 1,109 |
| | 337 |
|
| Control investments | (73,561 | ) | | (11,859 | ) | | 25,347 |
|
| Income tax (provision) benefit | (683 | ) | | 178 |
| | 133 |
|
| Total net unrealized (depreciation) appreciation on investments, net of tax | (92,814 | ) | | (11,506 | ) | | 21,492 |
|
| | | | | | |
| Net realized and unrealized (losses) gains on investments | $ | (50,583 | ) | | $ | 9,348 |
| | $ | 23,074 |
|
| | | | | | |
| Net (decrease) increase in net assets from operations | $ | (22,351 | ) | | $ | 33,058 |
| | $ | 39,307 |
|
| | | | | | |
| Pre-tax net investment income per share - basic and diluted | $ | 1.68 |
| | $ | 1.48 |
| | $ | 1.02 |
|
| Net investment income per share - basic and diluted | $ | 1.57 |
| | $ | 1.42 |
| | $ | 1.01 |
|
| Net (decrease) increase in net assets from operations - basic and diluted | $ | (1.24 | ) | | $ | 1.98 |
| | $ | 2.45 |
|
| Weighted average shares outstanding – basic | 17,999,836 |
| | 16,727,254 |
| | 16,073,642 |
|
| Weighted average shares outstanding – diluted | 17,999,836 |
| | 16,734,369 |
| | 16,138,541 |
|
| | | | | | | | | | | | | | | | | | | | | |
| CAPITAL SOUTHWEST CORPORATION AND SUBSIDIARIES |
| CONSOLIDATED STATEMENTS OF OPERATIONS |
| | |
| (In thousands, except shares and per share data) |
| | | | | | | | | |
| | | Years Ended |
| | | March 31, |
| | | | | 2023 | | 2022 | | 2021 |
| Investment income: | | | | | | | | | |
| Interest income: | | | | | | | | | |
| Non-control/Non-affiliate investments | | | | | $ | 87,982 | | | $ | 58,136 | | | $ | 42,880 | |
| Affiliate investments | | | | | 11,658 | | | 7,122 | | | 6,126 | |
| | | | | | | | | |
| Payment-in-kind interest income: | | | | | | | | | |
| Non-control/Non-affiliate investments | | | | | 2,382 | | | 2,051 | | | 4,268 | |
| Affiliate investments | | | | | 3,060 | | | 1,160 | | | 3,018 | |
| | | | | | | | | |
| Dividend income: | | | | | | | | | |
| Non-control/Non-affiliate investments | | | | | 1,824 | | | 1,654 | | | 1,752 | |
| Affiliate investments | | | | | 141 | | | 28 | | | 33 | |
| Control investments | | | | | 7,337 | | | 6,720 | | | 6,609 | |
| Fee income: | | | | | | | | | |
| Non-control/Non-affiliate investments | | | | | 4,057 | | | 4,833 | | | 3,233 | |
| Affiliate investments | | | | | 638 | | | 494 | | | 122 | |
| Control investments | | | | | 100 | | | — | | | — | |
| Other income | | | | | 121 | | | 17 | | | 21 | |
| Total investment income | | | | | 119,300 | | | 82,215 | | | 68,062 | |
| Operating expenses: | | | | | | | | | |
| Compensation | | | | | 9,870 | | | 8,838 | | | 7,756 | |
| Share-based compensation | | | | | 3,705 | | | 3,585 | | | 2,944 | |
| Interest | | | | | 28,873 | | | 19,924 | | | 17,941 | |
| Professional fees | | | | | 3,180 | | | 2,489 | | | 2,193 | |
| General and administrative | | | | | 4,632 | | | 4,077 | | | 3,115 | |
| Total operating expenses | | | | | 50,260 | | | 38,913 | | | 33,949 | |
| Income before taxes | | | | | 69,040 | | | 43,302 | | | 34,113 | |
| Federal income, excise and other taxes | | | | | 630 | | | 181 | | | 637 | |
| Deferred taxes | | | | | (301) | | | 434 | | | 1,805 | |
| Total income tax provision | | | | | 329 | | | 615 | | | 2,442 | |
| Net investment income | | | | | $ | 68,711 | | | $ | 42,687 | | | $ | 31,671 | |
| Realized (loss) gain | | | | | | | | | |
| Non-control/Non-affiliate investments | | | | | $ | (5,872) | | | $ | 7,136 | | | $ | (6,908) | |
| Affiliate investments | | | | | (11,027) | | | 140 | | | (1,628) | |
| | | | | | | | | |
| Income tax provision | | | | | (130) | | | (1,442) | | | — | |
| Total net realized (loss) gain on investments, net of tax | | | | | (17,029) | | | 5,834 | | | (8,536) | |
| Net unrealized (depreciation) appreciation on investments | | | | | | | | | |
| Non-control/Non-affiliate investments | | | | | (6,942) | | | 20,940 | | | 21,218 | |
| Affiliate investments | | | | | 6,014 | | | (4,750) | | | (2,825) | |
| Control investments | | | | | (11,147) | | | (2,755) | | | 12,598 | |
| Income tax provision | | | | | (6,514) | | | (1,968) | | | (2,236) | |
| Total net unrealized (depreciation) appreciation on investments, net of tax | | | | | (18,589) | | | 11,467 | | | 28,755 | |
| Net realized and unrealized (losses) gains on investments | | | | | (35,618) | | | 17,301 | | | 20,219 | |
| Realized loss on extinguishment of debt | | | | | — | | | (17,087) | | | (1,007) | |
| Realized loss on disposal of fixed assets | | | | | — | | | (86) | | | — | |
| Net increase in net assets from operations | | | | | $ | 33,093 | | | $ | 42,815 | | | $ | 50,883 | |
| | | | | | | | | |
| Pre-tax net investment income per share - basic and diluted | | | | | $ | 2.30 | | | $ | 1.90 | | | $ | 1.79 | |
| Net investment income per share – basic and diluted | | | | | $ | 2.29 | | | $ | 1.87 | | | $ | 1.66 | |
| Net increase in net assets from operations – basic and diluted | | | | | $ | 1.10 | | | $ | 1.87 | | | $ | 2.67 | |
| Weighted average shares outstanding – basic and diluted | | | | | 30,015,533 | | | 22,839,835 | | | 19,060,131 | |
The accompanying Notes are an integral part of these Consolidated Financial Statements.
CAPITAL SOUTHWEST CORPORATION AND SUBSIDIARIES
CONSOLIDATED STATEMENTS OF CHANGES IN NET ASSETS
(In thousands)
| | | | | | | | | | | | | | | | | | | | | | | | | | | | | | | | | | | |
| CAPITAL SOUTHWEST CORPORATION AND SUBSIDIARIES |
| CONSOLIDATED STATEMENTS OF CHANGES IN NET ASSETS |
| (In thousands, except shares) |
| Common Stock | | Treasury Stock | | Additional Paid-In Capital | | Total Distributable Earnings (Loss) | | Total Net Asset Value |
| Number of Shares | Par Value | | Number of Shares | Par Value | | | |
| Balances at March 31, 2020 | 17,998,098 | $ | 5,085 | | | 2,339,512 | $ | (23,937) | | | $ | 310,846 | | | $ | (19,772) | | | $ | 272,222 | |
| Issuance of common stock | 2,810,541 | 702 | | — | — | | 49,691 | | — | | 50,393 |
| Share-based compensation | — | — | | — | — | | 2,944 | | — | | 2,944 |
| Issuance of common stock under restricted stock plan, net of forfeitures | 211,994 | 53 | | — | — | | (53) | | — | | — |
| Common stock withheld for payroll taxes upon vesting of restricted stock | (15,309) | (4) | | — | — | | (235) | | — | | (239) |
| Dividends to shareholders | — | — | | — | — | | — | | (39,945) | | (39,945) |
| Change in restoration plan liability | — | — | | — | — | | (7) | | — | | (7) |
| Reclassification for certain permanent book-to-tax differences | — | — | | — | — | | (6,739) | | 6,739 | | — |
| Net increase resulting from operations | — | — | | — | — | | — | | 50,883 | | 50,883 |
| Balances at March 31, 2021 | 21,005,324 | $ | 5,836 | | | 2,339,512 | $ | (23,937) | | | $ | 356,447 | | | $ | (2,095) | | | $ | 336,251 | |
| Issuance of common stock | 3,872,031 | 969 | | — | — | | 97,138 | | — | | 98,107 |
| Share-based compensation | — | — | | — | — | | 3,585 | | — | | 3,585 |
| Issuance of common stock under restricted stock plan, net of forfeitures | 133,289 | 33 | | — | — | | (33) | | — | | — |
| Common stock withheld for payroll taxes upon vesting of restricted stock | (52,124) | (13) | | — | — | | (1,395) | | — | | (1,408) |
| Dividends to shareholders | — | — | | — | — | | — | | (58,624) | | (58,624) |
| Change in restoration plan liability | — | — | | — | — | | 141 | | — | | 141 |
| Reclassification for certain permanent book-to-tax differences | — | — | | — | — | | (7,648) | | 7,648 | | — |
| Net increase resulting from operations | — | — | | — | — | | — | | 42,815 | | 42,815 |
| Balances at March 31, 2022 | 24,958,520 | $ | 6,825 | | | 2,339,512 | $ | (23,937) | | | $ | 448,235 | | | $ | (10,256) | | | $ | 420,867 | |
| Issuance of common stock | 10,969,898 | 2,742 | | — | — | | 200,039 | | — | | 202,781 |
| Share-based compensation | — | — | | — | — | | 3,705 | | — | | 3,705 |
| Issuance of common stock under restricted stock plan, net of forfeitures | 197,597 | 49 | | — | — | | (49) | | — | | — |
| Common stock withheld for payroll taxes upon vesting of restricted stock | (49,590) | (12) | | — | — | | (1,009) | | — | | (1,021) |
| Dividends to shareholders | — | — | | — | — | | — | | (71,102) | | (71,102) |
| Change in restoration plan liability | — | — | | — | — | | 2,085 | | — | | 2,085 |
| Reclassification for certain permanent book-to-tax differences | — | — | | — | — | | (6,420) | | 6,420 | | — |
| Net increase resulting from operations | — | — | | — | — | | — | | 33,093 | | 33,093 |
| Balances at March 31, 2023 | 36,076,425 | $ | 9,604 | | | 2,339,512 | $ | (23,937) | | | $ | 646,586 | | | $ | (41,845) | | | $ | 590,408 | |
|
| | | | | | | | | | | |
| | Years Ended March 31, |
| | 2020 | | 2019 | | 2018 |
| Operations: | | | | | |
| Net investment income | $ | 28,232 |
| | $ | 23,710 |
| | $ | 16,233 |
|
| Net realized gain on investments | 45,692 |
| | 20,854 |
| | 1,582 |
|
| Taxes on deemed distribution of long-term capital gains | (3,461 | ) | | — |
| | — |
|
| Net unrealized (depreciation) appreciation on investments, net of tax | (92,814 | ) | | (11,506 | ) | | 21,492 |
|
| Net (decrease) increase in net assets from operations | (22,351 | ) | | 33,058 |
| | 39,307 |
|
| Dividends to shareholders | (50,343 | ) | | (38,010 | ) | | (15,920 | ) |
| Spin-off compensation plan distribution | — |
| | — |
| | (517 | ) |
| Capital share transactions: | | | | | |
| Change in restoration plan liability | (91 | ) | | (185 | ) | | (813 | ) |
| Issuance of common stock | 25,819 |
| | 18,744 |
| | — |
|
| Exercise of employee stock options | — |
| | 2,169 |
| | 125 |
|
| Share-based compensation expense | 2,853 |
| | 2,271 |
| | 1,708 |
|
| Common stock withheld for payroll taxes upon vesting of restricted stock | (419 | ) | | (187 | ) | | (86 | ) |
| Repurchase of common stock | (9,209 | ) | | (185 | ) | | (588 | ) |
| (Decrease) increase in net assets | (53,741 | ) | | 17,675 |
| | 23,216 |
|
| Net assets, beginning of year | 325,963 |
| | 308,288 |
| | 285,072 |
|
| Net assets, end of year | $ | 272,222 |
| | $ | 325,963 |
| | $ | 308,288 |
|
| | | | | | | | | | | | | | | | | |
| CAPITAL SOUTHWEST CORPORATION AND SUBSIDIARIES |
| CONSOLIDATED STATEMENTS OF CASH FLOWS |
| | |
| (In thousands) |
| Years Ended |
| March 31, |
| 2023 | | 2022 | | 2021 |
| Cash flows from operating activities | | | | | |
| Net increase in net assets from operations | $ | 33,093 | | | $ | 42,815 | | | $ | 50,883 | |
| Adjustments to reconcile net increase in net assets from operations to net cash used in operating activities: | | | | | |
| Purchases and originations of investments | (433,200) | | | (499,218) | | | (219,349) | |
| Proceeds from sales and repayments of debt investments in portfolio companies | 139,051 | | | 259,158 | | | 97,589 | |
| Proceeds from sales and return of capital of equity investments in portfolio companies | 2,664 | | | 11,881 | | | 17,841 | |
| Payment of accreted original issue discounts | 1,570 | | | 3,692 | | | 1,228 | |
| Payment of accrued payment-in-kind interest | 1,313 | | | 3,485 | | | — | |
| Depreciation and amortization | 2,750 | | | 2,230 | | | 1,967 | |
| Net pension benefit | (24) | | | (132) | | | (110) | |
| Realized loss (gain) on investments before income tax | 17,222 | | | (6,617) | | | 8,549 | |
| Realized loss on extinguishment of debt | — | | | 17,103 | | | 1,007 | |
| Realized loss on disposal of fixed assets | — | | | 86 | | | — | |
| Net unrealized depreciation (appreciation) on investments before income tax | 12,075 | | | (13,435) | | | (30,991) | |
| Accretion of discounts on investments | (3,842) | | | (3,005) | | | (2,347) | |
| Payment-in-kind interest | (5,965) | | | (4,190) | | | (7,880) | |
| Share-based compensation expense | 3,705 | | | 3,585 | | | 2,944 | |
| Deferred income taxes | 6,369 | | | 2,402 | | | 3,784 | |
| Changes in other assets and liabilities: | | | | | |
| (Increase) decrease in dividend and interest receivable | (6,803) | | | (1,539) | | | (144) | |
| Decrease (increase) in escrow receivables | 756 | | | (159) | | | 493 | |
| (Increase) decrease in tax receivable | (209) | | | (4) | | | (8) | |
| Decrease (increase) in other receivables | 1,591 | | | (2,067) | | | (119) | |
| (Increase) decrease in other assets | (128) | | | (3,090) | | | 95 | |
| (Decrease) increase in taxes payable | (1,085) | | | 1,191 | | | (463) | |
| Increase in other liabilities | 1,997 | | | 3,153 | | | 6,779 | |
| Net cash used in operating activities | (227,100) | | | (182,675) | | | (68,252) | |
| Cash flows from investing activities | | | | | |
| Acquisition of fixed assets | (281) | | | (1,995) | | | — | |
| Net cash used in investing activities | (281) | | | (1,995) | | | — | |
| Cash flows from financing activities | | | | | |
| Proceeds from common stock offering | 202,956 | | | 98,141 | | | 50,410 | |
| Equity offering costs paid | (102) | | | — | | | — | |
| Borrowings under credit facility | 185,000 | | | 315,000 | | | 182,000 | |
| Repayments of credit facility | (155,000) | | | (230,000) | | | (216,000) | |
| Debt issuance costs paid | (1,248) | | | (3,865) | | | (540) | |
| Proceeds from issuance of SBA Debentures | 78,052 | | | 39,026 | | | — | |
| Proceeds from issuance of October 2024 Notes | — | | | — | | | 49,000 | |
| Proceeds from issuance of January 2026 Notes | — | | | — | | | 138,571 | |
| Proceeds from issuance of October 2026 Notes | — | | | 146,414 | | | — | |
| Redemption of December 2022 Notes | — | | | — | | | (77,136) | |
| Redemption of October 2024 Notes | — | | | (125,000) | | | — | |
| Payment for debt extinguishment costs | — | | | (15,196) | | | — | |
| Dividends to shareholders | (71,102) | | | (58,624) | | | (39,945) | |
| Common stock withheld for payroll taxes upon vesting of restricted stock | (1,021) | | | (1,408) | | | (239) | |
| Net cash provided by financing activities | 237,535 | | | 164,488 | | | 86,121 | |
| Net increase (decrease) in cash and cash equivalents | 10,154 | | | (20,182) | | | 17,869 | |
| Cash and cash equivalents at beginning of period | 11,431 | | | 31,613 | | | 13,744 | |
| Cash and cash equivalents at end of period | $ | 21,585 | | | $ | 11,431 | | | $ | 31,613 | |
| Supplemental cash flow disclosures: | | | | | |
| Cash paid for income taxes | $ | 1,896 | | | $ | 461 | | | $ | 1,464 | |
| Cash paid for interest | 25,466 | | | 18,404 | | | 11,738 | |
The accompanying Notes are an integral part of these Consolidated Financial Statements.
| | | | | | | | | | | | | | | | | | | | | | | | | | | | | | | | | | | | | | | | | | | | | | | | | | | |
| CAPITAL SOUTHWEST CORPORATION AND SUBSIDIARIES |
| CONSOLIDATED SCHEDULE OF INVESTMENTS |
|
| March 31, 2023 |
| | | | | | | | | | | | | | | | | |
Portfolio Company1,18 | | | Type of Investment2 | | Industry | | Current Interest Rate3 | | Acquisition Date14 | | Maturity | | Principal | | Cost12,17 | | Fair Value4 |
Non-control/Non-affiliate Investments5 | | | | | | | | | | | | | | | | | |
| 360 QUOTE TOPCO, LLC | | | Revolving Loan | | Media & marketing | | SOFR+6.50% (Floor 1.00%)/Q, Current Coupon 11.55% | | 6/16/2022 | | 6/16/2027 | | $ | 3,250 | | | $ | 3,209 | | | $ | 3,006 | |
| | | First Lien19 | | | | SOFR+6.50% (Floor 1.00%)/Q, Current Coupon 11.55% | | 6/16/2022 | | 6/16/2027 | | 25,000 | | | 24,674 | | | 23,125 | |
| | | | | | | | | | | | | | | 27,883 | | | 26,131 | |
| AAC NEW HOLDCO INC. | | | First Lien | | Healthcare services | | 18.00% PIK | | 12/11/2020 | | 6/25/2025 | | 10,199 | | | 10,199 | | | 9,842 | |
| | | Delayed Draw Term Loan10 | | | | 18.00% PIK | | 1/31/2023 | | 6/25/2025 | | 274 | | | 270 | | | 264 | |
| | | 374,543 shares common stock | | | | — | | 12/11/2020 | | — | | — | | | 1,785 | | | 716 | |
| | | Warrants (Expiration - December 11, 2025) | | | | — | | 12/11/2020 | | — | | — | | | 2,198 | | | 881 | |
| | | | | | | | | | | | | | | 14,452 | | | 11,703 | |
| ACACIA BUYERCO V LLC | | | Revolver Loan10 | | Software & IT services | | SOFR+6.50% (Floor 1.00%) | | 11/25/2022 | | 11/26/2027 | | — | | | (37) | | | — | |
| | | First Lien - Term Loan A | | | | SOFR+6.50% (Floor 1.00%)/Q, Current Coupon 11.35% | | 11/25/2022 | | 11/26/2027 | | 5,000 | | | 4,905 | | | 4,920 | |
| | | Delayed Draw Term Loan10 | | | | SOFR+6.50% (Floor 1.00%)/Q, Current Coupon 11.43% | | 11/25/2022 | | 11/26/2027 | | 7,500 | | | 7,332 | | | 7,380 | |
| | | 1,000,000 Class B-2 Units9,13 | | | | — | | 11/25/2022 | | — | | — | | | 1,000 | | | 1,000 | |
| | | | | | | | | | | | | | | 13,200 | | | 13,300 | |
| ACCELERATION, LLC | | | Revolving Loan10 | | Media & marketing | | SOFR+8.50% (Floor 1.00%)/Q, Current Coupon 13.56%20 | | 6/13/2022 | | 6/14/2027 | | 3,700 | | | 3,616 | | | 3,700 | |
| | | First Lien - Term Loan A | | | | SOFR+7.50% (Floor 1.00%)/Q, Current Coupon 12.35% | | 6/13/2022 | | 6/14/2027 | | 9,228 | | | 9,067 | | | 9,228 | |
| | | First Lien - Term Loan B | | | | SOFR+8.50% (Floor 1.00%)/Q, Current Coupon 13.35% | | 6/13/2022 | | 6/14/2027 | | 9,228 | | | 9,066 | | | 9,228 | |
| | | First Lien - Term Loan C | | | | SOFR+9.50% (Floor 1.00%)/Q, Current Coupon 14.35% | | 6/13/2022 | | 6/14/2027 | | 9,228 | | | 9,066 | | | 9,228 | |
| | | Delayed Draw Term Loan10 | | | | SOFR+8.50% (Floor 1.00%) | | 6/13/2022 | | 6/14/2027 | | — | | | (42) | | | — | |
| | | 13,451.22 Preferred Units9,13 | | | | — | | 6/13/2022 | | — | | — | | | 893 | | | 1,482 | |
| | | 1,611.22 Common Units9,13 | | | | — | | 6/13/2022 | | — | | — | | | 107 | | | 165 | |
| | | | | | | | | | | | | | | 31,773 | | | 33,031 | |
|
| | | | | | | | | | | |
| CAPITAL SOUTHWEST CORPORATION AND SUBSIDIARIES |
| CONSOLIDATED STATEMENTS OF CASH FLOWS |
| (In thousands) |
| | | | | | |
| | Years Ended March 31, |
| | 2020 | | 2019 | | 2018 |
| Cash flows from operating activities | |
| | |
| | |
|
| Net (decrease) increase in net assets from operations | $ | (22,351 | ) | | $ | 33,058 |
| | $ | 39,307 |
|
| Adjustments to reconcile net (decrease) increase in net assets from operations to net cash used in operating activities: | | | | | |
| Purchases and originations of investments | (196,606 | ) | | (229,598 | ) | | (166,181 | ) |
| Proceeds from sales and repayments of debt investments in portfolio companies | 67,794 |
| | 74,669 |
| | 82,489 |
|
| Proceeds from sales and return of capital of equity investments in portfolio companies | 55,960 |
| | 33,928 |
| | 104 |
|
| Payment of accreted original issue discounts | 788 |
| | 524 |
| | 1,477 |
|
| Depreciation and amortization | 2,405 |
| | 1,393 |
| | 927 |
|
| Net pension benefit | (82 | ) | | (51 | ) | | (46 | ) |
| Realized (gain) loss on investments before income tax | (46,084 | ) | | (20,854 | ) | | (1,582 | ) |
| Taxes payable on deemed distribution of long-term capital gains | 3,461 |
| | — |
| | — |
|
| Net change in unrealized appreciation on investments | 92,131 |
| | 11,684 |
| | (21,359 | ) |
| Accretion of discounts on investments | (1,938 | ) | | (1,390 | ) | | (857 | ) |
| Payment-in-kind interest and dividends | (2,079 | ) | | (681 | ) | | (306 | ) |
| Stock option and restricted awards expense | 2,853 |
| | 2,271 |
| | 1,708 |
|
| Deferred income taxes | 1,368 |
| | 53 |
| | (537 | ) |
| Changes in other assets and liabilities: | | | | | |
| Increase in dividend and interest receivable | (1,137 | ) | | (3,850 | ) | | (2,082 | ) |
| Decrease in escrow receivables | 111 |
| | 310 |
| | 426 |
|
| (Increase) decrease in tax receivable | 36 |
| | (74 | ) | | (109 | ) |
| (Increase) decrease in other receivables | 910 |
| | (797 | ) | | 180 |
|
| Decrease (increase) in other assets | (644 | ) | | 4,236 |
| | 1,958 |
|
| (Decrease) increase in other liabilities | (543 | ) | | (695 | ) | | 620 |
|
| Increase (decrease) in payable for unsettled transaction | (1,158 | ) | | 1,158 |
| | — |
|
| Increase (decrease) in taxes payable | (3,142 | ) | | — |
| | — |
|
| Net cash used in operating activities | (47,947 | ) | | (94,706 | ) | | (63,863 | ) |
| Cash flows from financing activities | | | | | |
| Proceeds from common stock offering | 26,084 |
| | 18,891 |
| | — |
|
| Equity offering costs paid | (105 | ) | | (127 | ) | | — |
|
| Borrowings under credit facility | 132,000 |
| | 146,000 |
| | 76,000 |
|
| Repayments of credit facility | (119,000 | ) | | (45,000 | ) | | (61,000 | ) |
| Debt issuance costs paid | (742 | ) | | (1,827 | ) | | (1,739 | ) |
| Proceeds from notes | 73,500 |
| | 19,524 |
| | 55,775 |
|
| Dividends to shareholders | (50,343 | ) | | (42,535 | ) | | (18,586 | ) |
| Proceeds from exercise of employee stock options | — |
| | 2,169 |
| | 125 |
|
| Common stock withheld for payroll taxes upon vesting of restricted stock | (418 | ) | | (187 | ) | | (86 | ) |
| Repurchase of common stock | (9,209 | ) | | (185 | ) | | (588 | ) |
| Spin-off Compensation Plan distribution | — |
| | — |
| | (517 | ) |
| Net cash provided by financing activities | 51,767 |
| | 96,723 |
| | 49,384 |
|
| Net increase (decrease) in cash and cash equivalents | 3,820 |
| | 2,017 |
| | (14,479 | ) |
| Cash and cash equivalents at beginning of year | 9,924 |
| | 7,907 |
| | 22,386 |
|
| Cash and cash equivalents at end of year | $ | 13,744 |
| | $ | 9,924 |
| | $ | 7,907 |
|
| Supplemental cash flow disclosures: | | | | | |
| Cash paid for income taxes | $ | 4,524 |
| | $ | 802 |
| | $ | 708 |
|
| Cash paid for interest | 13,944 |
| | 10,912 |
| | 3,405 |
|
| Supplemental disclosure of noncash financing activities: | | | | | |
| Dividends declared, not yet paid | $ | — |
| | $ | — |
| | $ | 4,525 |
|
| | | | | | | | | | | | | | | | | | | | | | | | | | | | | | | | | | | | | | | | | | | | | | | | | | | |
| CAPITAL SOUTHWEST CORPORATION AND SUBSIDIARIES |
| CONSOLIDATED SCHEDULE OF INVESTMENTS |
|
| March 31, 2023 |
| | | | | | | | | | | | | | | | | |
Portfolio Company1,18 | | | Type of Investment2 | | Industry | | Current Interest Rate3 | | Acquisition Date14 | | Maturity | | Principal | | Cost12,17 | | Fair Value4 |
| ACCELERATION PARTNERS, LLC | | | First Lien8 | | Media & marketing | | SOFR+8.15% (Floor 1.00%)/Q, Current Coupon 12.90%20 | | 12/1/2020 | | 12/1/2025 | | 19,550 | | | 19,162 | | | 19,550 | |
| | | 1,019 Preferred Units9,13 | | | | — | | 12/1/2020 | | — | | — | | | 1,019 | | | 1,223 | |
| | | 1,019 Class A Common Units9,13 | | | | — | | 12/1/2020 | | — | | — | | | 14 | | | — | |
| | | | | | | | | | | | | | | 20,195 | | | 20,773 | |
| ACE GATHERING, INC. | | | Second Lien15 | | Energy services (midstream) | | SOFR+12.00% (Floor 2.00%)/Q, Current Coupon 16.85% | | 12/13/2018 | | 12/13/2023 | | 7,698 | | | 7,668 | | | 7,082 | |
| ALLIANCE SPORTS GROUP, L.P. | | | Unsecured convertible Note | | Consumer products & retail | | 6.00% PIK | | 7/15/2020 | | 9/30/2024 | | 173 | | | 173 | | | 201 | |
| | | 3.88% membership preferred interest | | | | — | | 8/1/2017 | | — | | — | | | 2,500 | | | 2,691 | |
| | | | | | | | | | | | | | | 2,673 | | | 2,892 | |
| AMERICAN NUTS OPERATIONS LLC | | | First Lien - Term Loan A | | Food, agriculture and beverage | | SOFR+6.75%, 1.00% PIK (Floor 1.00%)/Q, Current Coupon 12.49% | | 3/11/2022 | | 4/10/2026 | | 11,716 | | | 11,667 | | | 10,978 | |
| | | First Lien - Term Loan B | | | | SOFR+8.75%, 1.00% PIK (Floor 1.00%)/Q, Current Coupon 14.49% | | 3/11/2022 | | 4/10/2026 | | 11,716 | | | 11,667 | | | 9,958 | |
| | | 3,000,000 units of Class A common stock9,13 | | | | — | | 4/10/2018 | | — | | — | | | 3,000 | | | — | |
| | | | | | | | | | | | | | | 26,334 | | | 20,936 | |
| AMERICAN TELECONFERENCING SERVICES, LTD. (DBA PREMIERE GLOBAL SERVICES, INC.) | | | Revolving Loan10,16 | | Telecommunications | | P+5.50%/Q (Floor 2.00%), Current Coupon 9.00% | | 9/17/2021 | | 4/7/2023 | | 862 | | | 853 | | | 44 | |
| | | First Lien16 | | | | P+5.50%/Q (Floor 2.00%), Current Coupon 9.00% | | 9/21/2016 | | 6/8/2023 | | 4,899 | | | 4,858 | | | 251 | |
| | | | | | | | | | | | | | | 5,711 | | | 295 | |
| ARBORWORKS, LLC | | | Revolving Loan10 | | Environmental services | | L+7.00%, 3.00% PIK (Floor 1.00%)/Q, Current Coupon 14.83% | | 11/17/2021 | | 11/9/2026 | | 2,000 | | | 1,956 | | | 1,502 | |
| | | First Lien | | | | L+7.00%, 3.00% PIK (Floor 1.00%)/Q, Current Coupon 14.85% | | 11/17/2021 | | 11/9/2026 | | 12,610 | | | 12,417 | | | 9,470 | |
| | | 100 Class A Units9,13 | | | | — | | 11/17/2021 | | — | | — | | | 100 | | | — | |
| | | | | | | | | | | | | | | 14,473 | | | 10,972 | |
| ASC ORTHO MANAGEMENT COMPANY, LLC | | | 2,572 Common Units9,13 | | Healthcare services | | — | | 8/31/2018 | | — | | — | | | 1,026 | | | 847 | |
| | | | | | | | | | | | | | | | | | | | | | | | | | | | | | | | | | | | | | | | | | | | | | | | | | | |
| CAPITAL SOUTHWEST CORPORATION AND SUBSIDIARIES |
| CONSOLIDATED SCHEDULE OF INVESTMENTS |
|
| March 31, 2023 |
| | | | | | | | | | | | | | | | | |
Portfolio Company1,18 | | | Type of Investment2 | | Industry | | Current Interest Rate3 | | Acquisition Date14 | | Maturity | | Principal | | Cost12,17 | | Fair Value4 |
| ATS OPERATING, LLC | | | Revolving Loan10 | | Consumer products & retail | | SOFR+6.50% (Floor 1.00%)/Q, Current Coupon 11.39% | | 1/18/2022 | | 1/18/2027 | | 500 | | | 462 | | | 492 | |
| | | First Lien - Term Loan A | | | | SOFR+5.50% (Floor 1.00%)/Q, Current Coupon 10.35% | | 1/18/2022 | | 1/18/2027 | | 9,250 | | | 9,104 | | | 9,102 | |
| | | First Lien - Term Loan B | | | | SOFR+7.50% (Floor 1.00%)/Q, Current Coupon 12.35% | | 1/18/2022 | | 1/18/2027 | | 9,250 | | | 9,102 | | | 9,102 | |
| | | 1,000,000 Preferred units9,13 | | | | — | | 1/18/2022 | | — | | — | | | 1,000 | | | 1,000 | |
| | | | | | | | | | | | | | | 19,668 | | | 19,696 | |
| BINSWANGER HOLDING CORP. | | | 900,000 shares of common stock | | Distribution | | — | | 3/9/2017 | | — | | — | | | 900 | | | — | |
| BROAD SKY NETWORKS LLC (DBA EPIC IO TECHNOLOGIES) | | | 1,131,579 Series A Preferred units9,13 | | Telecommunications | | — | | 12/11/2020 | | — | | — | | | 1,132 | | | 1,649 | |
| | | 89,335 Series C Preferred units9,13 | | | | — | | 10/21/2022 | | — | | — | | | 89 | | | 130 | |
| | | | | | | | | | | | | | | 1,221 | | | 1,779 | |
| C&M CONVEYOR, INC. | | | First Lien - Term Loan A15 | | Business services | | SOFR+7.50% (Floor 1.50%)/M, Current Coupon 12.28% | | 1/3/2023 | | 9/30/2026 | | 6,500 | | | 6,377 | | | 6,377 | |
| | | First Lien - Term Loan B15 | | | | SOFR+5.50% (Floor 1.50%)/M, Current Coupon 10.28% | | 1/3/2023 | | 9/30/2026 | | 6,500 | | | 6,377 | | | 6,377 | |
| | | | | | | | | | | | | | | 12,754 | | | 12,754 | |
| CADMIUM, LLC | | | Revolving Loan | | Software & IT services | | L+7.00% (Floor 1.00%)/Q, Current Coupon 12.16% | | 1/7/2022 | | 12/22/2026 | | 615 | | | 611 | | | 594 | |
| | | First Lien | | | | L+7.00% (Floor 1.00%)/Q, Current Coupon 12.16% | | 1/7/2022 | | 12/22/2026 | | 7,385 | | | 7,326 | | | 7,134 | |
| | | | | | | | | | | | | | | 7,937 | | | 7,728 | |
| CAMIN CARGO CONTROL, INC. | | | First Lien | | Energy services (midstream) | | SOFR+6.50% (Floor 1.00%)/M, Current Coupon 11.42% | | 6/2/2021 | | 6/4/2026 | | 5,692 | | | 5,652 | | | 5,692 | |
| CAVALIER BUYER, INC. | | | Revolving Loan10 | | Healthcare services | | SOFR+8.00% (Floor 2.00%) | | 2/10/2023 | | 2/10/2028 | | — | | | (19) | | | — | |
| | | First Lien | | | | SOFR+8.00% (Floor 2.00%)/Q, Current Coupon 12.88% | | 2/10/2023 | | 2/10/2028 | | 6,500 | | | 6,372 | | | 6,372 | |
| | | 625,000 Preferred Units9,13 | | | | — | | 2/10/2023 | | — | | — | | | 625 | | | 625 | |
| | | 625,000 Class A-1 Units9,13 | | | | — | | 2/10/2023 | | — | | — | | | — | | | — | |
| | | | | | | | | | | | | | | 6,978 | | | 6,997 | |
| | | | | | | | | | | | | | | | | | | | | | | | | | | | | | | | | | | | | | | | | | | | | | | | | | | |
| CAPITAL SOUTHWEST CORPORATION AND SUBSIDIARIES |
| CONSOLIDATED SCHEDULE OF INVESTMENTS |
|
| March 31, 2023 |
| | | | | | | | | | | | | | | | | |
Portfolio Company1,18 | | | Type of Investment2 | | Industry | | Current Interest Rate3 | | Acquisition Date14 | | Maturity | | Principal | | Cost12,17 | | Fair Value4 |
| CRAFTY APES, LLC | | | First Lien8 | | Media & marketing | | SOFR+7.02% (Floor 1.00%)/Q, Current Coupon 12.07%20 | | 6/9/2021 | | 11/1/2024 | | 15,000 | | | 14,911 | | | 15,000 | |
| EVEREST TRANSPORTATION SYSTEMS, LLC | | | First Lien | | Transportation & logistics | | SOFR+8.00% (Floor 1.00%)/M, Current Coupon 12.91% | | 11/9/2021 | | 8/26/2026 | | 8,566 | | | 8,498 | | | 8,566 | |
| EXACT BORROWER, LLC | | | Revolving Loan10 | | Media & marketing | | SOFR+7.50% (Floor 2.00%) | | 12/7/2022 | | 8/6/2027 | | — | | | (47) | | | — | |
| | | First Lien - Term Loan A | | | | SOFR+7.50% (Floor 2.00%)/Q, Current Coupon 12.24% | | 12/7/2022 | | 8/6/2027 | | 9,450 | | | 9,271 | | | 9,271 | |
| | | First Lien - Term Loan B | | | | SOFR+7.50% (Floor 2.00%)/Q, Current Coupon 12.24% | | 12/7/2022 | | 8/6/2027 | | 9,450 | | | 9,271 | | | 9,271 | |
| | | Delayed Draw Term Loan10 | | | | SOFR+7.50% (Floor 2.00%) | | 12/7/2022 | | 8/6/2027 | | — | | | (23) | | | — | |
| | | Promissory Note | | | | 13.574% | | 12/7/2022 | | 12/6/2028 | | 385 | | | 385 | | | 385 | |
| | | 615.156 Common units | | | | | | 12/7/2022 | | — | | — | | | 615 | | | 770 | |
| | | | | | | | | | | | | | | 19,472 | | | 19,697 | |
| FLIP ELECTRONICS, LLC | | | First Lien | | Technology products & components | | SOFR+7.50% (Floor 1.00%)/Q, Current Coupon 12.41%20 | | 1/4/2021 | | 1/2/2026 | | 31,845 | | | 31,214 | | | 31,845 | |
| | | Delayed Draw Term Loan | | | | SOFR+7.50% (Floor 1.00%)/Q, Current Coupon 12.25% | | 3/24/2022 | | 1/2/2026 | | 2,818 | | | 2,777 | | | 2,818 | |
| | | 2,000,000 Common Units9,11,13 | | | | — | | 1/4/2021 | | — | | — | | | 2,000 | | | 17,678 | |
| | | | | | | | | | | | | | | 35,991 | | | 52,341 | |
| FM SYLVAN, INC. | | | Revolving Loan10 | | Industrial services | | SOFR+8.00% (Floor 1.00%)/Q, Current Coupon 12.94% | | 11/8/2022 | | 11/8/2027 | | 2,000 | | | 1,816 | | | 2,000 | |
| | | First Lien | | | | SOFR+8.00% (Floor 1.00%)/Q, Current Coupon 12.85% | | 11/8/2022 | | 11/8/2027 | | 11,963 | | | 11,737 | | | 11,963 | |
| | | | | | | | | | | | | | | 13,553 | | | 13,963 | |
| FOOD PHARMA SUBSIDIARY HOLDINGS, LLC | | | First Lien | | Food, agriculture & beverage | | L+6.50% (Floor 1.00%)/Q, Current Coupon 11.25% | | 6/1/2021 | | 6/1/2026 | | 7,030 | | | 6,908 | | | 7,030 | |
| | | 75,000 Class A Units9,13 | | | | — | | 6/1/2021 | | — | | — | | | 750 | | | 911 | |
| | | | | | | | | | | | | | | 7,658 | | | 7,941 | |
| | | | | | | | | | | | | | | | | | | | | | | | | | | | | | | | | | | | | | | | | | | | | | | | | | | |
| CAPITAL SOUTHWEST CORPORATION AND SUBSIDIARIES |
| CONSOLIDATED SCHEDULE OF INVESTMENTS |
|
| March 31, 2023 |
| | | | | | | | | | | | | | | | | |
Portfolio Company1,18 | | | Type of Investment2 | | Industry | | Current Interest Rate3 | | Acquisition Date14 | | Maturity | | Principal | | Cost12,17 | | Fair Value4 |
| GAINS INTERMEDIATE, LLC | | | Revolving Loan10 | | Business services | | SOFR+7.50% (Floor 2.00%) | | 12/15/2022 | | 12/15/2027 | | — | | | (47) | | | — | |
| | | First Lien - Term Loan A | | | | SOFR+6.50% (Floor 2.00%)/Q, Current Coupon 11.35% | | 12/15/2022 | | 12/15/2027 | | 7,500 | | | 7,357 | | | 7,358 | |
| | | First Lien - Term Loan B | | | | SOFR+8.50% (Floor 2.00%)/Q, Current Coupon 13.35% | | 12/15/2022 | | 12/15/2027 | | 7,500 | | | 7,356 | | | 7,358 | |
| | | Delayed Draw Term Loan10 | | | | SOFR+7.50% (Floor 2.00%) | | 12/15/2022 | | 12/15/2027 | | — | | | (162) | | | — | |
| | | | | | | | | | | | | | | 14,504 | | | 14,716 | |
| GUARDIAN FLEET SERVICES, INC. | | | First Lien | | Transportation & logistics | | SOFR+7.25%, 1.75% PIK (Floor 2.50%)/Q, Current Coupon 14.05% | | 2/10/2023 | | 2/10/2028 | | 4,511 | | | 4,376 | | | 4,376 | |
| | | 1,500,000 Class A Units9,13 | | | | — | | 2/10/2023 | | — | | — | | | 1,500 | | | 1,500 | |
| | | Warrants (Expiration - February 10, 2033) | | | | — | | 2/10/2023 | | — | | — | | | 80 | | | 80 | |
| | | | | | | | | | | | | | | 5,956 | | | 5,956 | |
| GULF PACIFIC ACQUISITION, LLC | | | Revolving Loan10 | | Food, agriculture & beverage | | SOFR+6.00% (Floor 1.00%)/Q, Current Coupon 10.99%20 | | 9/30/2022 | | 9/29/2028 | | 353 | | | 335 | | | 347 | |
| | | First Lien | | | | SOFR+6.00% (Floor 1.00%)/Q, Current Coupon 11.05% | | 9/30/2022 | | 9/29/2028 | | 3,642 | | | 3,574 | | | 3,573 | |
| | | Delayed Draw Term Loan10 | | | | SOFR+6.00% (Floor 1.00%)/Q, Current Coupon 11.11% | | 9/30/2022 | | 9/29/2028 | | 303 | | | 286 | | | 297 | |
| | | | | | | | | | | | | | | 4,195 | | | 4,217 | |
| HYBRID APPAREL, LLC | | | Second Lien15 | | Consumer products & retail | | SOFR+8.25% (Floor 1.00%)/Q, Current Coupon 13.10% | | 6/30/2021 | | 6/30/2026 | | 15,750 | | | 15,528 | | | 13,120 | |
| INFOLINKS MEDIA BUYCO, LLC | | | First Lien | | Media & marketing | | L+5.50% (Floor 1.00%)/Q, Current Coupon 10.66% | | 11/1/2021 | | 10/30/2026 | | 7,653 | | | 7,537 | | | 7,653 | |
| | | Delayed Draw Term Loan10 | | | | L+5.50% (Floor 1.00%) | | 11/1/2021 | | 10/30/2026 | | — | | | (16) | | | — | |
| | | 1.68% LP interest9,10,11,13 | | | | — | | 10/29/2021 | | — | | — | | | 588 | | | 944 | |
| | | | | | | | | | | | | | | 8,109 | | | 8,597 | |
| | | | | | | | | | | | | | | | | | | | | | | | | | | | | | | | | | | | | | | | | | | | | | | | | | | |
| CAPITAL SOUTHWEST CORPORATION AND SUBSIDIARIES |
| CONSOLIDATED SCHEDULE OF INVESTMENTS |
|
| March 31, 2023 |
| | | | | | | | | | | | | | | | | |
Portfolio Company1,18 | | | Type of Investment2 | | Industry | | Current Interest Rate3 | | Acquisition Date14 | | Maturity | | Principal | | Cost12,17 | | Fair Value4 |
| ISI ENTERPRISES, LLC | | | Revolving Loan10 | | Software & IT services | | L+7.00% (Floor 1.00%) | | 10/1/2021 | | 10/1/2026 | | — | | | (28) | | | — | |
| | | First Lien | | | | L+7.00% (Floor 1.00%)/Q, Current Coupon 11.75% | | 10/1/2021 | | 10/1/2026 | | 5,000 | | | 4,926 | | | 5,000 | |
| | | 1,000,000 Series A Preferred units | | | | — | | 10/1/2021 | | — | | — | | | 1,000 | | | 1,000 | |
| | | | | | | | | | | | | | | 5,898 | | | 6,000 | |
| ISLAND PUMP AND TANK, LLC | | | Revolving Loan10 | | Environmental services | | SOFR+7.50% (Floor 2.00%)/Q, Current Coupon 12.67% | | 3/2/2023 | | 8/3/2026 | | 500 | | | 471 | | | 471 | |
| | | First Lien | | | | SOFR+7.50% (Floor 2.00%)/Q Current Coupon 12.66% | | 3/2/2023 | | 8/3/2026 | | 9,000 | | | 8,823 | | | 8,823 | |
| | | 750,000 Preferred units9,13 | | | | — | | 3/2/2023 | | — | | — | | | 750 | | | 750 | |
| | | | | | | | | | | | | | | 10,044 | | | 10,044 | |
| JVMC HOLDINGS CORP. | | | First Lien | | Financial services | | L+6.50% (Floor 1.00%)/M, Current Coupon 11.34% | | 2/28/2019 | | 2/28/2024 | | 6,132 | | | 6,117 | | | 6,132 | |
KMS, INC.15 | | | First Lien | | Distribution | | L+7.25% (Floor 1.00%)/Q, Current Coupon 12.44% | | 10/4/2021 | | 10/2/2026 | | 15,800 | | | 15,681 | | | 14,299 | |
| | | Delayed Draw Term Loan10 | | | | L+7.25% (Floor 1.00%)/Q, Current Coupon 12.44% | | 10/4/2021 | | 10/2/2026 | | 2,228 | | | 2,174 | | | 2,016 | |
| | | | | | | | | | | | | | | 17,855 | | | 16,315 | |
| LASH OPCO, LLC | | | Revolving Loan10 | | Consumer products & retail | | L+7.00% (Floor 1.00%)/S, Current Coupon 11.89%20 | | 12/29/2021 | | 9/18/2025 | | 343 | | | 336 | | | 330 | |
| | | First Lien | | | | L+7.00% (Floor 1.00%)/S, Current Coupon 11.84% | | 12/29/2021 | | 3/18/2026 | | 10,532 | | | 10,315 | | | 10,110 | |
| | | | | | | | | | | | | | | 10,651 | | | 10,440 | |
| LGM PHARMA, LLC | | | First Lien | | Healthcare products | | L+8.50% (Floor 1.00%), 1.00% PIK/Q, Current Coupon 14.16% | | 11/15/2017 | | 11/15/2023 | | 11,477 | | | 11,436 | | | 11,477 | |
| | | Delayed Draw Term Loan | | | | L+10.00% (Floor 1.00%), 1.00% PIK/Q, Current Coupon 15.66% | | 7/24/2020 | | 11/15/2023 | | 2,501 | | | 2,491 | | | 2,501 | |
| | | Unsecured convertible note9,13 | | | | 25.00% PIK | | 12/21/2021 | | 12/31/2024 | | 113 | | | 113 | | | 113 | |
| | | 142,278.89 units of Class A common stock9,13 | | | | — | | 11/15/2017 | | — | | — | | | 1,600 | | | 1,692 | |
| | | | | | | | | | | | | | | 15,640 | | | 15,783 | |
| | | | | | | | | | | | | | | | | | | | | | | | | | | | | | | | | | | | | | | | | | | | | | | | | | | |
| CAPITAL SOUTHWEST CORPORATION AND SUBSIDIARIES |
| CONSOLIDATED SCHEDULE OF INVESTMENTS |
|
| March 31, 2023 |
| | | | | | | | | | | | | | | | | |
Portfolio Company1,18 | | | Type of Investment2 | | Industry | | Current Interest Rate3 | | Acquisition Date14 | | Maturity | | Principal | | Cost12,17 | | Fair Value4 |
| LIGHTNING INTERMEDIATE II, LLC (DBA VIMERGY) | | | Revolving Loan10 | | Healthcare products | | SOFR+6.50% (Floor 1.00%) | | 6/6/2022 | | 6/7/2027 | | — | | | (31) | | | — | |
| | | First Lien | | | | SOFR+6.50% (Floor 1.00%)/S, Current Coupon 11.54% | | 6/6/2022 | | 6/7/2027 | | 22,714 | | | 22,318 | | | 22,305 | |
| | | 0.88% LLC interest9,13 | | | | — | | 6/6/2022 | | — | | — | | | 600 | | | 416 | |
| | | | | | | | | | | | | | | 22,887 | | | 22,721 | |
| LLFLEX, LLC | | | First Lien15 | | Containers & packaging | | L+9.00% (Floor 1.00%)/Q, Current Coupon 13.75% | | 8/16/2021 | | 8/14/2026 | | 10,835 | | | 10,656 | | | 10,131 | |
| MAKO STEEL LP | | | Revolving Loan10 | | Business services | | L+7.25% (Floor 0.75%)/S, Current Coupon 11.89%20 | | 3/15/2021 | | 3/13/2026 | | 943 | | | 921 | | | 939 | |
| | | First Lien | | | | L+7.25% (Floor 0.75%)/Q, Current Coupon 12.30% | | 3/15/2021 | | 3/13/2026 | | 7,879 | | | 7,778 | | | 7,839 | |
| | | | | | | | | | | | | | | 8,699 | | | 8,778 | |
| MERCURY ACQUISITION 2021, LLC (DBA TELE-TOWN HALL) | | | First Lien | | Telecommunications | | L+8.00% (Floor 1.00%)/Q, Current Coupon 12.75% | | 12/6/2021 | | 12/7/2026 | | 12,344 | | | 12,150 | | | 11,949 | |
| | | Second Lien | | | | L+11.00% (Floor 1.00%)/Q, Current Coupon 15.75% | | 12/6/2021 | | 12/7/2026 | | 2,759 | | | 2,715 | | | 2,593 | |
| | | 2,089,599 Series A units9,13 | | | | — | | 12/6/2021 | | — | | — | | | — | | | 770 | |
| | | | | | | | | | | | | | | 14,865 | | | 15,312 | |
| MICROBE FORMULAS LLC | | | Revolving Loan10 | | Healthcare products | | SOFR+6.25% (Floor 1.00%) | | 4/4/2022 | | 4/3/2028 | | — | | | (27) | | | — | |
| | | First Lien | | | | SOFR+6.25% (Floor 1.00%)/M, Current Coupon 11.09% | | 4/4/2022 | | 4/3/2028 | | 11,621 | | | 11,421 | | | 11,505 | |
| | | | | | | | | | | | | | | 11,394 | | | 11,505 | |
| MUENSTER MILLING COMPANY, LLC | | | Revolving Loan10 | | Food, agriculture & beverage | | SOFR+7.25% (Floor 1.00%) | | 8/10/2021 | | 8/10/2026 | | — | | | (67) | | | — | |
| | | First Lien | | | | SOFR+7.25% (Floor 1.00%)/Q, Current Coupon 11.99% | | 8/10/2021 | | 8/10/2026 | | 21,800 | | | 21,457 | | | 21,800 | |
| | | 1,000,000 Class A units9,13 | | | | — | | 12/15/2022 | | — | | — | | | 1,000 | | | 1,185 | |
| | | | | | | | | | | | | | | 22,390 | | | 22,985 | |
| | | | | | | | | | | | | | | | | | | | | | | | | | | | | | | | | | | | | | | | | | | | | | | | | | | |
| CAPITAL SOUTHWEST CORPORATION AND SUBSIDIARIES |
| CONSOLIDATED SCHEDULE OF INVESTMENTS |
|
| March 31, 2023 |
| | | | | | | | | | | | | | | | | |
Portfolio Company1,18 | | | Type of Investment2 | | Industry | | Current Interest Rate3 | | Acquisition Date14 | | Maturity | | Principal | | Cost12,17 | | Fair Value4 |
| NATIONAL CREDIT CARE, LLC | | | First Lien - Term Loan A | | Consumer services | | L+6.50% (Floor 1.00%)/Q, Current Coupon 11.25% | | 12/23/2021 | | 12/23/2026 | | 9,716 | | | 9,564 | | | 9,550 | |
| | | First Lien - Term Loan B | | | | L+7.50% (Floor 1.00%)/Q, Current Coupon 12.25% | | 12/23/2021 | | 12/23/2026 | | 9,716 | | | 9,563 | | | 9,550 | |
| | | 191,049.33 Class A-3 Preferred units9,11,13 | | | | — | | 3/17/2022 | | — | | — | | | 2,000 | | | 2,000 | |
| | | | | | | | | | | | | | | 21,127 | | | 21,100 | |
| NEUROPSYCHIATRIC HOSPITALS, LLC | | | Revolving Loan | | Healthcare services | | L+8.00% (Floor 1.00%)/Q, Current Coupon 12.75% | | 5/14/2021 | | 5/14/2026 | | 4,400 | | | 4,338 | | | 4,180 | |
| | | First Lien - Term Loan A | | | | L+7.00% (Floor 1.00%)/Q, Current Coupon 11.75% | | 3/21/2023 | | 5/14/2026 | | 7,478 | | | 7,375 | | | 7,104 | |
| | | First Lien - Term Loan B | | | | L+9.00% (Floor 1.00%)/Q, Current Coupon 13.75% | | 3/21/2023 | | 5/14/2026 | | 7,478 | | | 7,375 | | | 6,356 | |
| | | First Lien - Term Loan C | | | | SOFR+10.00% (Floor 1.00%)/Q, Current Coupon 15.00% | | 3/21/2023 | | 5/14/2026 | | 3,176 | | | 3,097 | | | 3,097 | |
| | | | | | | | | | | | | | | 22,185 | | | 20,737 | |
| NEW SKINNY MIXES, LLC | | | Revolving Loan10 | | Food, agriculture & beverage | | SOFR+8.00% (Floor 2.00%) | | 12/21/2022 | | 12/21/2027 | | — | | | (76) | | | — | |
| | | First Lien | | | | SOFR+8.00% (Floor 2.00%)/Q, Current Coupon 12.79% | | 12/21/2022 | | 12/21/2027 | | 13,000 | | | 12,750 | | | 12,753 | |
| | | Delayed Draw Term Loan10 | | | | SOFR+8.00% (Floor 2.00%) | | 12/21/2022 | | 12/21/2027 | | — | | | (28) | | | — | |
| | | | | | | | | | | | | | | 12,646 | | | 12,753 | |
| NINJATRADER, INC. | | | Revolving Loan10 | | Financial services | | L+6.25% (Floor 1.00%) | | 12/18/2019 | | 12/18/2024 | | — | | | (3) | | | — | |
| | | First Lien | | | | L+6.25% (Floor 1.00%)/Q, Current Coupon 11.00% | | 12/18/2019 | | 12/18/2024 | | 23,150 | | | 22,864 | | | 23,150 | |
| | | Delayed Draw Term Loan10 | | | | L+6.25% (Floor 1.00%) | | 12/31/2020 | | 12/18/2024 | | — | | | (28) | | | — | |
| | | 2,000,000 Preferred Units9,11,13 | | | | — | | 12/18/2019 | | — | | — | | | 2,000 | | | 11,138 | |
| | | | | | | | | | | | | | | 24,833 | | | 34,288 | |
| NWN PARENT HOLDINGS, LLC | | | Revolving Loan10 | | Software & IT services | | SOFR+8.00% (Floor 1.00%)/Q, Current Coupon 12.85%20 | | 5/7/2021 | | 5/7/2026 | | 1,020 | | | 997 | | | 1,006 | |
| | | First Lien | | | | SOFR+8.00% (Floor 1.00%)/Q, Current Coupon 12.87% | | 5/7/2021 | | 5/7/2026 | | 12,688 | | | 12,519 | | | 12,510 | |
| | | | | | | | | | | | | | | 13,516 | | | 13,516 | |
| | | | | | | | | | | | | | | | | | | | | | | | | | | | | | | | | | | | | | | | | | | | | | | | | | | |
| CAPITAL SOUTHWEST CORPORATION AND SUBSIDIARIES |
| CONSOLIDATED SCHEDULE OF INVESTMENTS |
|
| March 31, 2023 |
| | | | | | | | | | | | | | | | | |
Portfolio Company1,18 | | | Type of Investment2 | | Industry | | Current Interest Rate3 | | Acquisition Date14 | | Maturity | | Principal | | Cost12,17 | | Fair Value4 |
| OPCO BORROWER, LLC (DBA GIVING HOME HEALTH CARE) | | | Revolving Loan10 | | Healthcare services | | SOFR+6.50% (Floor 1.00%) | | 8/19/2022 | | 8/19/2027 | | — | | | (7) | | | — | |
| | | First Lien | | | | SOFR+6.50% (Floor 1.00%)/M, Current Coupon 11.50% | | 8/19/2022 | | 8/19/2027 | | 9,052 | | | 8,970 | | | 9,052 | |
| | | Second Lien | | | | 12.50% | | 8/19/2022 | | 2/19/2028 | | 3,000 | | | 2,755 | | | 3,000 | |
| | | Warrants (Expiration - August 19, 2029) | | | | — | | 8/19/2022 | | — | | — | | | 207 | | | 399 | |
| | | | | | | | | | | | | | | 11,925 | | | 12,451 | |
PIPELINE TECHNIQUE LTD.9 | | | Revolving Loan10 | | Energy services (midstream) | | P+6.25% (Floor 2.00%)/Q, Current Coupon 14.25% | | 8/23/2022 | | 8/19/2027 | | 500 | | | 441 | | | 490 | |
| | | First Lien | | | | SOFR+7.25% (Floor 1.00%)/Q, Current Coupon 12.32% | | 8/23/2022 | | 8/19/2027 | | 9,750 | | | 9,574 | | | 9,565 | |
| | | | | | | | | | | | | | | 10,015 | | | 10,055 | |
| RESEARCH NOW GROUP, INC. | | | Second Lien | | Business services | | L+9.50% (Floor 1.00%)/S, Current Coupon 14.31% | | 12/8/2017 | | 12/20/2025 | | 10,500 | | | 10,163 | | | 6,431 | |
| ROOF OPCO, LLC | | | Revolving Loan10 | | Consumer services | | SOFR+6.50% (Floor 1.00%) | | 8/27/2021 | | 8/27/2026 | | — | | | (42) | | | — | |
| | | First Lien | | | | SOFR+6.50% (Floor 1.00%)/Q, Current Coupon 11.35% | | 8/27/2021 | | 8/27/2026 | | 21,633 | | | 21,267 | | | 21,071 | |
| | | 535,714.29 Class A Units9,13 | | | | — | | 9/23/2022 | | — | | — | | | 750 | | | 750 | |
| | | | | | | | | | | | | | | 21,975 | | | 21,821 | |
| RTIC SUBSIDIARY HOLDINGS, LLC | | | Revolving Loan10 | | Consumer products & retail | | SOFR+7.75% (Floor 1.25%)/M, Current Coupon 12.56%20 | | 9/1/2020 | | 9/1/2025 | | 822 | | | 813 | | | 715 | |
| | | First Lien | | | | SOFR+7.75% (Floor 1.25%)/M, Current Coupon 12.52% | | 9/1/2020 | | 9/1/2025 | | 6,166 | | | 6,123 | | | 5,364 | |
| | | | | | | | | | | | | | | 6,936 | | | 6,079 | |
| SCRIP INC. | | | First Lien8 | | Healthcare products | | L+10.98% (Floor 2.00%)/M, Current Coupon 15.83% | | 3/21/2019 | | 3/21/2024 | | 16,750 | | | 16,634 | | | 15,594 | |
| | | 100 shares of common stock | | | | — | | 3/21/2019 | | — | | — | | | 1,000 | | | 751 | |
| | | | | | | | | | | | | | | 17,634 | | | 16,345 | |
| | | | | | | | | | | | | | | | | | | | | | | | | | | | | | | | | | | | | | | | | | | | | | | | | | | |
| CAPITAL SOUTHWEST CORPORATION AND SUBSIDIARIES |
| CONSOLIDATED SCHEDULE OF INVESTMENTS |
|
| March 31, 2023 |
| | | | | | | | | | | | | | | | | |
Portfolio Company1,18 | | | Type of Investment2 | | Industry | | Current Interest Rate3 | | Acquisition Date14 | | Maturity | | Principal | | Cost12,17 | | Fair Value4 |
SHEARWATER RESEARCH, INC.9 | | | Revolving Loan10 | | Consumer products & retail | | L+6.25% (Floor 1.00%) | | 4/30/2021 | | 4/30/2026 | | — | | | (30) | | | — | |
| | | First Lien | | | | L+6.25% (Floor 1.00%)/Q, Current Coupon 11.06% | | 4/30/2021 | | 4/30/2026 | | 13,643 | | | 13,462 | | | 13,643 | |
| | | 1,200,000 Class A Preferred Units | | | | — | | 4/30/2021 | | — | | — | | | 978 | | | 2,558 | |
| | | 40,000 Class A Common Units | | | | — | | 4/30/2021 | | — | | — | | | 33 | | | 85 | |
| | | | | | | | | | | | | | | 14,443 | | | 16,286 | |
| SIB HOLDINGS, LLC | | | Revolving Loan | | Business services | | L+6.25% (Floor 1.00%)/M, Current Coupon 11.23%20 | | 10/29/2021 | | 10/29/2026 | | 702 | | | 694 | | | 681 | |
| | | First Lien | | | | L+6.25% (Floor 1.00%)/M, Current Coupon 11.21% | | 10/29/2021 | | 10/29/2026 | | 11,382 | | | 11,235 | | | 11,040 | |
| | | 238,095.24 Common Units9,13 | | | | — | | 10/29/2021 | | — | | — | | | 500 | | | 411 | |
| | | | | | | | | | | | | | | 12,429 | | | 12,132 | |
| SOUTH COAST TERMINALS, LLC | | | Revolving Loan10 | | Specialty chemicals | | L+5.25% (Floor 1.00%) | | 12/13/2021 | | 12/11/2026 | | — | | | (28) | | | — | |
| | | First Lien | | | | L+5.25% (Floor 1.00%)/M, Current Coupon 10.03% | | 12/13/2021 | | 12/11/2026 | | 17,839 | | | 17,560 | | | 17,839 | |
| | | | | | | | | | | | | | | 17,532 | | | 17,839 | |
| SPECTRUM OF HOPE, LLC | | | First Lien | | Healthcare services | | SOFR+7.50% (Floor 1.00%)/M, Current Coupon 12.24% | | 9/6/2022 | | 6/11/2024 | | 22,358 | | | 22,020 | | | 21,934 | |
| | | 1,000,000 Common units9,13 | | | | — | | 2/17/2023 | | — | | — | | | 1,000 | | | 1,000 | |
| | | | | | | | | | | | | | | 23,020 | | | 22,934 | |
| SPOTLIGHT AR, LLC | | | Revolving Loan10 | | Business services | | L+6.75% (Floor 1.00%) | | 12/8/2021 | | 6/8/2026 | | — | | | (28) | | | — | |
| | | First Lien | | | | L+6.75% (Floor 1.00%)/Q, Current Coupon 11.50% | | 12/8/2021 | | 6/8/2026 | | 7,481 | | | 7,370 | | | 7,481 | |
| | | 750 Common Units9,11,13 | | | | — | | 12/8/2021 | | — | | — | | | 750 | | | 972 | |
| | | | | | | | | | | | | | | 8,092 | | | 8,453 | |
| SYSTEC CORPORATION (DBA INSPIRE AUTOMATION) | | | Revolving Loan10 | | Business services | | L+7.50% (Floor 1.00%)/Q, Current Coupon 12.32%20 | | 8/13/2021 | | 8/13/2025 | | 1,600 | | | 1,576 | | | 1,600 | |
| | | First Lien | | | | L+7.50% (Floor 1.00%)/Q, Current Coupon 12.25% | | 8/13/2021 | | 8/13/2025 | | 9,000 | | | 8,886 | | | 9,000 | |
| | | | | | | | | | | | | | | 10,462 | | | 10,600 | |
| | | | | | | | | | | | | | | | | | | | | | | | | | | | | | | | | | | | | | | | | | | | | | | | | | | |
| CAPITAL SOUTHWEST CORPORATION AND SUBSIDIARIES |
| CONSOLIDATED SCHEDULE OF INVESTMENTS |
|
| March 31, 2023 |
| | | | | | | | | | | | | | | | | |
Portfolio Company1,18 | | | Type of Investment2 | | Industry | | Current Interest Rate3 | | Acquisition Date14 | | Maturity | | Principal | | Cost12,17 | | Fair Value4 |
| THE PRODUCTO GROUP, LLC | | | First Lien | | Industrial products | | SOFR+8.00% (Floor 1.00%)/M, Current Coupon 12.92% | | 12/31/2021 | | 12/31/2026 | | 17,655 | | | 17,355 | | | 17,655 | |
| | | 1,500,000 Class A units9,13 | | | | — | | 12/31/2021 | | — | | — | | | 1,500 | | | 7,833 | |
| | | | | | | | | | | | | | | 18,855 | | | 25,488 | |
| TRAFERA, LLC (FKA TRINITY 3, LLC) | | | First Lien15 | | Technology products & components | | L+6.50% (Floor 1.00%)/Q, Current Coupon 11.26% | | 9/30/2020 | | 9/30/2025 | | 5,775 | | | 5,727 | | | 5,775 | |
| | | Unsecured convertible note9,13 | | | | 10.00% PIK | | 2/7/2022 | | 3/31/2026 | | 92 | | | 92 | | | 92 | |
| | | 896.43 Class A units9,11,13 | | | | — | | 11/15/2019 | | — | | — | | | 1,205 | | | 1,509 | |
| | | | | | | | | | | | | | | 7,024 | | | 7,376 | |
| US COURTSCRIPT HOLDINGS, INC. | | | First Lien | | Business services | | SOFR+6.00% (Floor 1.00%)/Q, Current Coupon 10.87%20 | | 5/17/2022 | | 5/17/2027 | | 16,800 | | | 16,540 | | | 16,800 | |
| | | 1,000,000 Class D-3 LP Units9,13 | | | | — | | 5/17/2022 | | — | | — | | | 1,000 | | | 1,354 | |
| | | 211,862.61 Class D-4 LP Units9,13 | | | | — | | 10/31/2022 | | — | | — | | | 212 | | | 278 | |
| | | 211,465.87 Class D-5 LP Units9,13 | | | | — | | 1/10/2023 | | — | | — | | | 211 | | | 275 | |
| | | | | | | | | | | | | | | 17,963 | | | 18,707 | |
| USA DEBUSK, LLC | | | First Lien | | Industrial services | | L+5.75% (Floor 1.00%)/M, Current Coupon 10.59% | | 2/25/2020 | | 9/8/2026 | | 11,498 | | | 11,367 | | | 11,498 | |
| VERSICARE MANAGEMENT LLC | | | Revolving Loan10 | | Healthcare services | | SOFR+8.00% (Floor 1.00%) | | 8/18/2022 | | 8/18/2027 | | — | | | (44) | | | — | |
| | | First Lien - Term Loan A | | | | SOFR+8.00% (Floor 1.00%)/Q, Current Coupon 12.85% | | 8/18/2022 | | 8/18/2027 | | 13,500 | | | 13,256 | | | 13,257 | |
| | | Delayed Draw Term Loan10 | | | | SOFR+8.00% (Floor 1.00%)/Q, Current Coupon 13.16% | | 8/18/2022 | | 8/18/2027 | | 2,400 | | | 2,332 | | | 2,357 | |
| | | | | | | | | | | | | | | 15,544 | | | 15,614 | |
| VISTAR MEDIA INC. | | | 171,617 shares of Series A preferred stock9,13 | | Media & marketing | | — | | 4/3/2019 | | — | | — | | | 1,874 | | | 9,054 | |
| VTX HOLDINGS, INC. (DBA VERTEX ONE) | | | 1,597,707 Series A Preferred units9,13 | | Software & IT services | | — | | 7/23/2019 | | — | | — | | | 1,598 | | | 2,694 | |
| | | | | | | | | | | | | | | | | | | | | | | | | | | | | | | | | | | | | | | | | | | | | | | | | | | |
| CAPITAL SOUTHWEST CORPORATION AND SUBSIDIARIES |
| CONSOLIDATED SCHEDULE OF INVESTMENTS |
|
| March 31, 2023 |
| | | | | | | | | | | | | | | | | |
Portfolio Company1,18 | | | Type of Investment2 | | Industry | | Current Interest Rate3 | | Acquisition Date14 | | Maturity | | Principal | | Cost12,17 | | Fair Value4 |
| WALL STREET PREP, INC. | | | Revolving Loan10 | | Education | | L+7.00% (Floor 1.00%) | | 7/19/2021 | | 7/20/2026 | | — | | | (13) | | | — | |
| | | First Lien | | | | L+7.00% (Floor 1.00%)/Q, Current Coupon 11.75% | | 7/19/2021 | | 7/20/2026 | | 10,588 | | | 10,436 | | | 10,588 | |
| | | 1,000,000 Class A-1 Preferred Shares | | | | — | | 7/19/2021 | | — | | — | | | 1,000 | | | 1,205 | |
| | | | | | | | | | | | | | | 11,423 | | | 11,793 | |
| WELL-FOAM, INC. | | | Revolving Loan10 | | Energy services (upstream) | | L+8.00% (Floor 1.00%) | | 9/9/2021 | | 9/9/2026 | | — | | | (64) | | | — | |
| | | First Lien | | | | L+8.00% (Floor 1.00%)/Q, Current Coupon 12.75% | | 9/9/2021 | | 9/9/2026 | | 17,730 | | | 17,466 | | | 17,730 | |
| | | | | | | | | | | | | | | 17,402 | | | 17,730 | |
| WINTER SERVICES OPERATIONS, LLC | | | Revolving Loan10 | | Business services | | L+7.00% (Floor 1.00%) | | 11/19/2021 | | 11/19/2026 | | — | | | (65) | | | — | |
| | | First Lien | | | | L+7.00% (Floor 1.00%)/Q, Current Coupon 11.75% | | 11/19/2021 | | 11/19/2026 | | 20,000 | | | 19,693 | | | 20,000 | |
| | | Delayed Draw Term Loan10 | | | | L+7.00% (Floor 1.00%) | | 11/19/2021 | | 11/19/2026 | | — | | | (32) | | | — | |
| | | | | | | | | | | | | | | 19,596 | | | 20,000 | |
| ZENFOLIO INC. | | | Revolving Loan | | Business services | | SOFR+9.00% (Floor 1.00%)/Q, Current Coupon 13.82% | | 7/17/2017 | | 7/17/2025 | | 2,000 | | | 1,994 | | | 1,954 | |
| | | First Lien | | | | SOFR+9.00% (Floor 1.00%)/Q, Current Coupon 13.82% | | 7/17/2017 | | 7/17/2025 | | 18,913 | | | 18,762 | | | 18,478 | |
| | | | | | | | | | | | | | | 20,756 | | | 20,432 | |
| ZIPS CAR WASH, LLC | | | Delayed Draw Term Loan - A | | Consumer services | | SOFR+7.25% (Floor 1.00%)/M, Current Coupon 12.15%20 | | 2/11/2022 | | 3/1/2024 | | 15,840 | | | 15,611 | | | 15,634 | |
| | | Delayed Draw Term Loan - B | | | | SOFR+7.25% (Floor 1.00%)/M, Current Coupon 12.12%20 | | 2/11/2022 | | 3/1/2024 | | 3,970 | | | 3,914 | | | 3,919 | |
| | | | | | | | | | | | | | | 19,525 | | | 19,553 | |
| | | | | | | | | | | | | | | | | |
| Total Non-control/Non-affiliate Investments (163.7% of net assets at fair value) | | | | | | | | | | $ | 947,829 | | | $ | 966,627 | |
| | | | | | | | | | | | | | | | | | | | | | | | | | | | | | | | | | | | | | | | | | | | | | | | | | | |
| CAPITAL SOUTHWEST CORPORATION AND SUBSIDIARIES |
| CONSOLIDATED SCHEDULE OF INVESTMENTS |
|
| March 31, 2023 |
| | | | | | | | | | | | | | | | | |
Portfolio Company1,18 | | | Type of Investment2 | | Industry | | Current Interest Rate3 | | Acquisition Date14 | | Maturity | | Principal | | Cost12,17 | | Fair Value4 |
| | | | | | | | | | | | | | | | | |
Affiliate Investments6 | | | | | | | | | | | | | | | | | |
| AIR CONDITIONING SPECIALIST, INC. | | | Revolving Loan10 | | Consumer services | | SOFR+7.25% (Floor 1.00%)/Q, Current Coupon 12.40% | | 11/9/2021 | | 11/9/2026 | | $ | 800 | | | $ | 766 | | | $ | 800 | |
| | | First Lien | | | | SOFR+7.25% (Floor 1.00%)/Q, Current Coupon 12.12%20 | | 11/9/2021 | | 11/9/2026 | | 27,438 | | | 26,940 | | | 27,438 | |
| | | 766,738.93 Preferred Units9,13 | | | | — | | 11/9/2021 | | — | | — | | | 809 | | | 1,202 | |
| | | | | | | | | | | | | | | 28,515 | | | 29,440 | |
| CATBIRD NYC, LLC | | | Revolving Loan10 | | Consumer products & retail | | SOFR+7.00% (Floor 1.00%) | | 10/15/2021 | | 10/15/2026 | | — | | | (57) | | | — | |
| | | First Lien | | | | SOFR+7.00% (Floor 1.00%)/Q, Current Coupon 11.88% | | 10/15/2021 | | 10/15/2026 | | 15,500 | | | 15,265 | | | 15,500 | |
| | | 1,000,000 Class A units9,11,13 | | | | — | | 10/15/2021 | | — | | — | | | 1,000 | | | 1,658 | |
| | | 500,000 Class B units9,10,11,13 | | | | — | | 10/15/2021 | | — | | — | | | 500 | | | 714 | |
| | | | | | | | | | | | | | | 16,708 | | | 17,872 | |
| CENTRAL MEDICAL SUPPLY LLC | | | Revolving Loan10 | | Healthcare services | | L+9.00% (Floor 1.75%)/Q, Current Coupon 13.75% | | 5/22/2020 | | 5/22/2025 | | 300 | | | 287 | | | 296 | |
| | | First Lien | | | | L+9.00% (Floor 1.75%)/Q, Current Coupon 13.75% | | 5/22/2020 | | 5/22/2025 | | 7,500 | | | 7,427 | | | 7,402 | |
| | | Delayed Draw Capex Term Loan10 | | | | L+9.00% (Floor 1.75%)/Q, Current Coupon 13.75% | | 5/22/2020 | | 5/22/2025 | | 100 | | | 87 | | | 99 | |
| | | 1,380,500 Preferred Units9,13 | | | | — | | 5/22/2020 | | — | | — | | | 976 | | | 357 | |
| | | | | | | | | | | | | | | 8,777 | | | 8,154 | |
| CHANDLER SIGNS, LLC | | | 1,500,000 units of Class A-1 common stock9,13 | | Business services | | — | | 1/4/2016 | | — | | — | | | 1,500 | | | 3,215 | |
| DELPHI BEHAVIORAL HEALTH GROUP, LLC | | | Protective Advance16 | | | | L+16.70% PIK (Floor 1.00%)/Q, Current Coupon 21.06% | | 8/31/2021 | | 4/7/2023 | | 1,448 | | | 1,448 | | | — | |
| | | First Lien16 | | Healthcare services | | L+11.00% PIK (Floor 1.00%)/S, Current Coupon 15.74% | | 4/8/2020 | | 4/7/2023 | | 1,649 | | | 1,649 | | | — | |
| | | First Lien16 | | | | L+9.00% PIK (Floor 1.00%)/S, Current Coupon 14.13% | | 4/8/2020 | | 4/7/2023 | | 1,829 | | | 1,829 | | | — | |
| | | 1,681.04 Common Units | | | | — | | 4/8/2020 | | — | | — | | | 3,615 | | | — | |
| | | | | | | | | | | | | | | 8,541 | | | — | |
| | | | | | | | | | | | | | | | | | | | | | | | | | | | | | | | | | | | | | | | | | | | | | | | | | | |
| CAPITAL SOUTHWEST CORPORATION AND SUBSIDIARIES |
| CONSOLIDATED SCHEDULE OF INVESTMENTS |
|
| March 31, 2023 |
| | | | | | | | | | | | | | | | | |
Portfolio Company1,18 | | | Type of Investment2 | | Industry | | Current Interest Rate3 | | Acquisition Date14 | | Maturity | | Principal | | Cost12,17 | | Fair Value4 |
| DYNAMIC COMMUNITIES, LLC | | | First Lien - Term Loan A | | Business services | | SOFR+4.50% PIK (Floor 2.00%)/Q, Current Coupon 9.41% | | 12/20/2022 | | 12/31/2026 | | 3,846 | | | 3,826 | | | 3,823 | |
| | | First Lien - Term Loan B | | | | SOFR+6.50% PIK (Floor 2.00%)/ Q, Current Coupon 11.41% | | 12/20/2022 | | 12/31/2026 | | 3,867 | | | 3,844 | | | 3,843 | |
| | | 250,000 Class A Preferred Units9,13 | | | | — | | 12/20/2022 | | — | | — | | | 250 | | | 625 | |
| | | 5,435,211.03 Class B Preferred Units9,13 | | | | — | | 12/20/2022 | | — | | — | | | 2,218 | | | 2,218 | |
| | | 255,984.22 Class C Preferred Units9,13 | | | | — | | 12/20/2022 | | — | | — | | | — | | | — | |
| | | 2,500,000 Common units9,13 | | | | — | | 12/20/2022 | | — | | — | | | — | | | — | |
| | | | | | | | | | | | | | | 10,138 | | | 10,509 | |
| GPT INDUSTRIES, LLC | | | Revolving Loan10 | | Industrial products | | SOFR+9.00% (Floor 2.00%) | | 1/30/2023 | | 1/31/2028 | | — | | | (58) | | | — | |
| | | First Lien19 | | | | SOFR+9.00% (Floor 2.00%)/Q, Current Coupon 13.93% | | 1/30/2023 | | 1/31/2028 | | 6,150 | | | 6,030 | | | 6,030 | |
| | | 1,000,000 Class A Preferred Units9,13 | | | | — | | 1/30/2023 | | — | | — | | | 1,000 | | | 1,000 | |
| | | | | | | | | | | | | | | 6,972 | | | 7,030 | |
| GRAMMATECH, INC. | | | Revolving Loan10 | | Software & IT services | | SOFR+9.50% (Floor 2.00%) | | 11/1/2019 | | 11/1/2024 | | — | | | (14) | | | — | |
| | | First Lien | | | | SOFR+9.50% (Floor 2.00%)/Q, Current Coupon 14.24% | | 11/1/2019 | | 11/1/2024 | | 10,031 | | | 9,967 | | | 10,031 | |
| | | 1,000 Class A units | | | | — | | 11/1/2019 | | — | | — | | | 1,000 | | | — | |
| | | 360.06 Class A-1 units | | | | — | | 1/10/2022 | | — | | — | | | 360 | | | 372 | |
| | | | | | | | | | | | | | | 11,313 | | | 10,403 | |
| | | | | | | | | | | | | | | | | | | | | | | | | | | | | | | | | | | | | | | | | | | | | | | | | | | |
| CAPITAL SOUTHWEST CORPORATION AND SUBSIDIARIES |
| CONSOLIDATED SCHEDULE OF INVESTMENTS |
|
| March 31, 2023 |
| | | | | | | | | | | | | | | | | |
Portfolio Company1,18 | | | Type of Investment2 | | Industry | | Current Interest Rate3 | | Acquisition Date14 | | Maturity | | Principal | | Cost12,17 | | Fair Value4 |
| ITA HOLDINGS GROUP, LLC | | | Revolving Loan | | Transportation & logistics | | SOFR+9.00%, 0.50% PIK (Floor 1.00%)/Q, Current Coupon 14.35% | | 2/14/2018 | | 5/12/2023 | | 7,000 | | | 6,974 | | | 7,014 | |
| | | First Lien - Term Loan | | | | SOFR+8.00%, 0.50% PIK (Floor 1.00%)/Q, Current Coupon 13.35% | | 2/14/2018 | | 5/12/2023 | | 10,114 | | | 10,139 | | | 10,114 | |
| | | First Lien - Term B Loan | | | | SOFR+11.00%, 0.50% PIK (Floor 1.00%)/Q, Current Coupon 16.35% | | 6/5/2018 | | 5/12/2023 | | 5,057 | | | 5,056 | | | 5,068 | |
| | | First Lien - PIK Note A | | | | 10.00% PIK | | 3/29/2019 | | 5/12/2023 | | 3,271 | | | 3,259 | | | 3,255 | |
| | | First Lien - PIK Note B | | | | 10.00% PIK | | 3/29/2019 | | 5/12/2023 | | 129 | | | 129 | | | 128 | |
| | | Warrants (Expiration - March 29, 2029)9,13 | | | | — | | 3/29/2019 | | — | | — | | | 538 | | | 4,046 | |
| | | 9.25% Class A Membership Interest9,13 | | | | — | | 2/14/2018 | | — | | — | | | 1,500 | | | 4,348 | |
| | | | | | | | | | | | | | | 27,595 | | | 33,973 | |
| LIGHTING RETROFIT INTERNATIONAL, LLC (DBA ENVOCORE) | | | Revolving Loan10 | | Environmental services | | 7.50% | | 12/31/2021 | | 12/31/2025 | | — | | | — | | | — | |
| | | First Lien | | | | 7.50% | | 12/31/2021 | | 12/31/2025 | | 5,143 | | | 5,143 | | | 5,143 | |
| | | Second Lien16 | | | | 10.00% PIK | | 12/31/2021 | | 12/31/2026 | | 5,208 | | | 5,208 | | | 3,594 | |
| | | 208,333.3333 Series A Preferred units9,13 | | | | — | | 12/31/2021 | | — | | — | | | — | | | — | |
| | | 203,124.9999 Common units9,13 | | | | — | | 12/31/2021 | | — | | — | | | — | | | — | |
| | | | | | | | | | | | | | | 10,351 | | | 8,737 | |
| OUTERBOX, LLC | | | Revolving Loan10 | | Media & marketing | | SOFR+6.75% (Floor 1.00%) | | 6/8/2022 | | 6/8/2027 | | — | | | (25) | | | — | |
| | | First Lien | | | | SOFR+6.75% (Floor 1.00%)/Q, Current Coupon 11.56%20 | | 6/8/2022 | | 6/8/2027 | | 14,625 | | | 14,428 | | | 14,552 | |
| | | 6,308.2584 Class A common units9,13 | | | | — | | 6/8/2022 | | — | | — | | | 631 | | | 773 | |
| | | | | | | | | | | | | | | 15,034 | | | 15,325 | |
| | | | | | | | | | | | | | | | | | | | | | | | | | | | | | | | | | | | | | | | | | | | | | | | | | | |
| CAPITAL SOUTHWEST CORPORATION AND SUBSIDIARIES |
| CONSOLIDATED SCHEDULE OF INVESTMENTS |
|
| March 31, 2023 |
| | | | | | | | | | | | | | | | | |
Portfolio Company1,18 | | | Type of Investment2 | | Industry | | Current Interest Rate3 | | Acquisition Date14 | | Maturity | | Principal | | Cost12,17 | | Fair Value4 |
| ROSELAND MANAGEMENT, LLC | | | Revolving Loan10 | | Healthcare services | | SOFR+8.00%,2.00% PIK (Floor 2.00%)/Q, Current Coupon 14.74% | | 11/9/2018 | | 11/12/2024 | | 575 | | | 566 | | | 555 | |
| | | First Lien | | | | SOFR+8.00%, 2.00% PIK (Floor 2.00%)/Q, Current Coupon 14.74% | | 11/9/2018 | | 11/12/2024 | | 15,051 | | | 15,008 | | | 14,524 | |
| | | 3,364 Class A-2 Units | | | | — | | 3/31/2023 | | — | | — | | | 202 | | | 694 | |
| | | 1,100 Class A-1 Units | | | | — | | 9/26/2022 | | — | | — | | | 66 | | | 161 | |
| | | 16,084 Class A Units | | | | — | | 11/9/2018 | | — | | — | | | 1,517 | | | 422 | |
| | | | | | | | | | | | | | | 17,359 | | | 16,356 | |
| SONOBI, INC. | | | 500,000 Class A Common Units9,13 | | Media & marketing | | — | | 9/17/2020 | | — | | — | | | 500 | | | 1,749 | |
| STATINMED, LLC | | | First Lien | | Healthcare services | | SOFR+9.50% PIK (Floor 2.00%)/M, Current Coupon 14.28% | | 7/1/2022 | | 7/1/2027 | | 7,288 | | | 7,288 | | | 7,288 | |
| | | Delayed Draw Term Loan | | | | SOFR+9.50% PIK (Floor 2.00%)/M, Current Coupon 14.28% | | 12/23/2022 | | 4/15/2023 | | 122 | | | 122 | | | 122 | |
| | | 4,718.62 Class A Preferred Units | | | | — | | 7/1/2022 | | — | | — | | | 4,838 | | | 3,767 | |
| | | 39,097.96 Class B Preferred Units | | | | — | | 7/1/2022 | | — | | — | | | 1,400 | | | — | |
| | | | | | | | | | | | | | | 13,648 | | | 11,177 | |
| STUDENT RESOURCE CENTER LLC | | | First Lien | | Education | | 8.50% PIK | | 12/31/2022 | | 12/30/2027 | | 8,889 | | | 8,727 | | | 8,720 | |
| | | 10,502,487.46 Preferred Units | | | | — | | 12/31/2022 | | — | | — | | | 5,845 | | | 5,845 | |
| | | 2,000,000.00 Preferred Units9,13 | | | | — | | 12/31/2022 | | — | | — | | | — | | | — | |
| | | | | | | | | | | | | | | 14,572 | | | 14,565 | |
| | | | | | | | | | | | | | | | | |
| Total Affiliate Investments (31.9% of net assets at fair value) | | | | | | | | | | | | $ | 191,523 | | | $ | 188,505 | |
| | | | | | | | | | | | | | | | | |
Control Investments7 | | | | | | | | | | | | | | | | | |
I-45 SLF LLC9, 10, 11 | | | 80% LLC equity interest | | Multi-sector holdings | | — | | 10/20/2015 | | — | | — | | | $ | 80,800 | | | $ | 51,256 | |
| Total Control Investments (8.7% of net assets at fair value) | | | | | | | | | | | | $ | 80,800 | | | $ | 51,256 | |
| | | | | | | | | | | | | | | | | |
| TOTAL INVESTMENTS (204.3% of net assets at fair value) | | | | | | | | | | | | $ | 1,220,152 | | | $ | 1,206,388 | |
1All debt investments are income-producing, unless otherwise noted. Equity investments are non-income producing, unless otherwise noted.
2All of the Company’s investments and the investments of SBIC I (as defined below), unless otherwise noted, are pledged as collateral for the Company’s senior secured credit facility or in support of the SBA-guaranteed debentures to be issued by Capital Southwest SBIC I, LP, our wholly-owned subsidiary that operates as a small business investment company ("SBIC I"), respectively.
3The accompanying Notesmajority of investments bear interest at a rate that may be determined by reference to Secured Overnight Financing Rate ("SOFR"), London Interbank Offered Rate (“LIBOR” or “L”), or Prime (“P”) and reset daily (D), monthly (M), quarterly (Q), or semiannually (S). For each investment, the Company has provided the spread over SOFR, LIBOR or Prime and the current contractual interest rate in effect at March 31, 2023. Certain investments are subject to an integral partinterest rate floor. Certain investments, as noted, accrue payment-in-kind ("PIK") interest. SOFR based contracts may include a credit spread adjustment (the "Adjustment") that is charged in addition to the stated spread. The Adjustment is applied when the SOFR rate, plus the Adjustment, exceeds the stated floor rate, as applicable. As of March 31, 2023, SOFR based contracts in the portfolio had Adjustments ranging from 0.10% to 0.26161%.
4The Company's investment portfolio is comprised entirely of debt and equity securities of privately held companies for which quoted prices falling within the categories of Level 1 and Level 2 inputs are not readily available. Therefore, the Company values all of its portfolio investments at fair value, as determined in good faith by the Board of Directors, using significant unobservable Level 3 inputs. Refer to Note 4 - Fair Value Measurements for further discussion.
5Non-Control/Non-Affiliate investments are generally defined by the Investment Company Act of 1940, as amended (the “1940 Act”), as investments that are neither control investments nor affiliate investments. At March 31, 2023, approximately 80.1% of the Company’s investment assets were non-control/non-affiliate investments. The fair value of these Consolidated Financial Statements.investments as a percent of net assets is 163.7%.
6Affiliate investments are generally defined by the 1940 Act as investments in which between 5% and 25% of the voting securities are owned and the investments are not classified as control investments. At March 31, 2023, approximately 15.6% of the Company’s investment assets were affiliate investments. The fair value of these investments as a percent of net assets is 31.9%.
7Control investments are generally defined by the 1940 Act as investments in which more than 25% of the voting securities are owned. At March 31, 2023, approximately 4.2% of the Company’s investment assets were control investments. The fair value of these investments as a percent of net assets is 8.7%.
8The investment is structured as a first lien last out term loan.
9Indicates assets that are not considered "qualifying assets" under Section 55(a) of the 1940 Act. Qualifying assets must represent at least 70% of total assets at the time of acquisition of any additional non-qualifying assets. As of March 31, 2023, approximately 13.9% of the Company's assets were non-qualifying assets.
10The investment has an unfunded commitment as of March 31, 2023. Refer to Note 11 - Commitments and Contingencies for further discussion.
11Income producing through dividends or distributions.
12As of March 31, 2023, the cumulative gross unrealized appreciation for U.S. federal income tax purposes was approximately $72.3 million; cumulative gross unrealized depreciation for federal income tax purposes was $76.8 million. Cumulative net unrealized depreciation was $4.5 million, based on a tax cost of $1,210.8 million.
13Investment is held through a wholly-owned taxable subsidiary.
14The Company generally acquires its investments in private transactions exempt from registration under the Securities Act of 1933, as amended (the "Securities Act"). These investments, which as of March 31, 2023 represented 204.3% of the Company's net assets or 95.9% of the Company's total assets, are generally subject to certain limitations on resale, and may be deemed "restricted securities" under the Securities Act.
15The investment is structured as a split lien term loan, which provides the Company with a first lien priority on certain assets of the obligor and a second lien priority on different assets of the obligor.
16Investment is on non-accrual status as of March 31, 2023, meaning the Company has ceased to recognize interest income on the investment.
17Negative cost in this column represents the original issue discount of certain undrawn revolvers and delayed draw term loans.
|
| | | | | | | | | | | | | | | | | | | | | | | | |
CAPITAL SOUTHWEST CORPORATION AND SUBSIDIARIES | |
| CONSOLIDATED SCHEDULE OF INVESTMENTS | |
| March 31, 2020 | |
| | | | | | | | | | | | | | | | | |
| | | | | | | Current | | | | | | | | | | |
| | | Type of | | | | Interest | | Acquisition | | | | | | | Fair | |
Portfolio Company1 | | Investment2 | | Industry | | Rate3 | | Date14 | Maturity | | Principal | | Cost17 | | Value4 | |
Non-control/Non-affiliate Investments5 | | | | | | | | | | | | | | | | |
| AAC HOLDINGS, INC. | | First Lien - Priming | | Healthcare services | | P +13.50% (Floor 1.00%)/Q, Current Coupon 16.75% | | 3/21/2019 | 4/15/2020 | | $ | 1,968 |
| | $ | 1,969 |
| | $ | 1,968 |
| |
| | | First Lien 16 | | | | L+6.75% (Floor 1.00%)/Q, 4.00% PIK, Current Coupon 13.33% | | 6/28/2017 | 6/30/2023 | | 9,079 |
| | 8,915 |
| | 3,977 |
| |
| | | | | | | | | | | | | | 10,884 |
| | 5,945 |
| |
| ACE GATHERING, INC. | | Second Lien15 | | Energy services (midstream) | | L+8.50% (Floor 2.00%)/Q, Current Coupon 10.50% | | 12/13/2018 | 12/13/2023 | | 9,688 |
| | 9,532 |
| | 9,445 |
| |
| ADAMS PUBLISHING GROUP, LLC | | First Lien | | Media, marketing & entertainment | | L+7.50% (Floor 1.75%)/Q, Current Coupon 9.29% | | 7/2/2018 | 7/2/2023 | | 10,730 |
| | 10,572 |
| | 10,312 |
| |
| | | Delayed Draw Term Loan | | | | L+7.50% (Floor 1.75%)/Q, Current Coupon 9.25% | | 7/2/2018 | 7/2/2023 | | 344 |
| | 320 |
| | 330 |
| |
| | | | | | | | | | | | | | 10,892 |
| | 10,642 |
| |
AG KINGS HOLDINGS INC.8,16 | | First Lien | | Food, agriculture & beverage | | L+10.02% (Floor 1.00%)/M, Current Coupon 12.69% | | 8/4/2016 | 8/8/2021 | | 9,308 |
| | 9,194 |
| | 5,445 |
| |
| ALLIANCE SPORTS GROUP, L.P. | | Senior subordinated debt | | Consumer products & retail | | 11.00% | | 8/1/2017 | 2/1/2023 | | 10,100 |
| | 9,980 |
| | 9,747 |
| |
| | | 3.88% preferred membership interest | | | | — | | 8/1/2017 | — | | — |
| | 2,500 |
| | 2,335 |
| |
| | | | | | | | | | | | | | 12,480 |
| | 12,082 |
| |
AMERICAN NUTS OPERATIONS LLC13 | | First Lien - Term Loan | | Food, agriculture and beverage | | L+9.50% (Floor 1.00%)/Q, Current Coupon 11.41% | | 4/10/2018 | 4/10/2023 | | 17,194 |
| | 16,963 |
| | 16,884 |
| |
| | | First Lien - Term Loan C10 | | | | L+9.50% (Floor 1.00%)/Q, Current Coupon 11.41% | | 12/21/2018 | 4/10/2023 | | 1,804 |
| | 1,781 |
| | 1,771 |
| |
| | | 3,000,000 units of Class A common stock9 | | | | — | | 4/10/2018 | — | | — |
| | 3,000 |
| | 1,523 |
| |
| | | | | | | | | | | | | | 21,744 |
| | 20,178 |
| |
19The investment is structured as a first lien first out term loan.
20The rate presented represents a weighted-average rate for borrowings under the facility as of March 31, 2023.
|
| | | | | | | | | | | | | | | | | | | | | | | | |
CAPITAL SOUTHWEST CORPORATION AND SUBSIDIARIES | |
| CONSOLIDATED SCHEDULE OF INVESTMENTS | |
| March 31, 2020 | |
| | | | | | | | | | | | | | | | | |
| | | | | | | Current | | | | | | | | | | |
| | | Type of | | | | Interest | | Acquisition | | | | | | | Fair | |
Portfolio Company1 | | Investment2 | | Industry | | Rate3 | | Date14 | Maturity | | Principal | | Cost17 | | Value4 | |
| AMERICAN TELECONFERENCING SERVICES, LTD. (DBA PREMIERE GLOBAL SERVICES, INC.) | | First Lien | | Telecommunications | | L+6.50% (Floor 1.00%)/Q, Current Coupon 8.24% | | 9/21/2016 | 6/8/2023 | | 5,926 |
| | 5,856 |
| | 3,348 |
| |
| | | Second Lien | | | | 0.5%, L+9.00% PIK (Floor 1.00%)/Q, Current Coupon 11.35% | | 11/3/2016 | 6/6/2024 | | 2,111 |
| | 2,072 |
| | 792 |
| |
| | | | | | | | | | | | | | 7,928 |
| | 4,140 |
| |
| AMWARE FULFILLMENT LLC | | First Lien | | Distribution | | L+9.50% (Floor 1.00%)/M, Current Coupon 10.95% | | 7/29/2016 | 12/31/2020 | | 12,027 |
| | 11,988 |
| | 11,991 |
| |
ASC ORTHO MANAGEMENT COMPANY, LLC13 | | Revolving Loan | | Healthcare services | | L+7.50% (Floor 1.00%)/Q, Current Coupon 8.70% | | 8/31/2018 | 8/31/2023 | | 1,500 |
| | 1,480 |
| | 1,425 |
| |
| | | First Lien | | | | L+7.50% (Floor 1.00%)/Q, Current Coupon 9.41% | | 8/31/2018 | 8/31/2023 | | 9,028 |
| | 8,894 |
| | 8,577 |
| |
| | | Second Lien | | | | 13.25% PIK | | 8/31/2018 | 12/1/2023 | | 3,709 |
| | 3,649 |
| | 3,275 |
| |
| | | 2,042 Common Units9 | | | | — | | 8/31/2018 | — | | — |
| | 750 |
| | 356 |
| |
| | | | | | | | | | | | | | 14,773 |
| | 13,633 |
| |
| BINSWANGER HOLDING CORP. | | First Lien | | Distribution | | L+8.50% (Floor 1.00%)/M, Current Coupon 9.96% | | 3/9/2017 | 3/9/2022 | | 11,604 |
| | 11,500 |
| | 11,163 |
| |
| | | 900,000 shares of common stock | | | | — | | 3/9/2017 | — | | — |
| | 900 |
| | 636 |
| |
| | | | | | | | | | | | | | 12,400 |
| | 11,799 |
| |
| BLASCHAK COAL CORP. | | Second Lien Term Loan15 | | Commodities & mining | | L+11.00%/Q, (Floor 1.00%) 1.00% PIK, Current Coupon 13.91% | | 7/30/2018 | 7/30/2023 | | 8,624 |
| | 8,497 |
| | 8,451 |
| |
| | | Second Lien- Term Loan B15 | | | | L+11.00%/Q, (Floor 1.00%) 1.00% PIK, Current Coupon 13.43% | | 3/30/2020 | 7/30/2023 | | 2,000 |
|
| 1,960 |
| | 1,960 |
| |
| | | | | | | | | | | | | | 10,457 |
| | 10,411 |
| |
|
| | | | | | | | | | | | | | | | | | | | | | | | |
CAPITAL SOUTHWEST CORPORATION AND SUBSIDIARIES | |
| CONSOLIDATED SCHEDULE OF INVESTMENTS | |
| March 31, 2020 | |
| | | | | | | | | | | | | | | | | |
| | | | | | | Current | | | | | | | | | | |
| | | Type of | | | | Interest | | Acquisition | | | | | | | Fair | |
Portfolio Company1 | | Investment2 | | Industry | | Rate3 | | Date14 | Maturity | | Principal | | Cost17 | | Value4 | |
CALIFORNIA PIZZA KITCHEN, INC.16 | | First Lien | | Restaurants | | L+6.00% (Floor 1.00%)/M, Current Coupon 7.62% | | 8/19/2016 | 8/23/2022 | | 4,825 |
| | 4,802 |
| | 2,441 |
| |
| CAPITAL PAWN HOLDINGS, LLC | | First Lien | | Consumer products & retail | | L+9.50%/Q, Current Coupon 11.41% | | 12/21/2017 | 7/8/2020 | | 11,097 |
| | 11,068 |
| | 11,075 |
| |
| CLICKBOOTH.COM, LLC | | Revolving Loan | | Media, marketing & entertainment | | L+8.50% (Floor 1.00%)/Q, Current Coupon 9.5% | | 12/5/2017 | 1/31/2025 | | 1,086 |
| | 1,080 |
| | 1,086 |
| |
| | | First Lien | | | | L+8.50% (Floor 1.00%)/Q, Current Coupon 10.41% | | 12/5/2017 | 1/31/2025 | | 19,000 |
| | 18,739 |
| | 19,000 |
| |
| | | | | | | | | | | | | | 19,819 |
| | 20,086 |
| |
DANFORTH ADVISORS, LLC13 | | Revolving Loan10 | | Business services | | L+7.25% (Floor 2.00%)/Q, Current Coupon 9.25% | | 9/28/2018 | 9/28/2023 | | 500 |
| | 486 |
| | 500 |
| |
| | | First Lien | | | | L+7.25% (Floor 2.00%)/Q, Current Coupon 9.25% | | 9/28/2018 | 9/28/2023 | | 7,250 |
| | 7,141 |
| | 7,250 |
| |
| | | 875 Class A equity units9 | | | | — | | 9/28/2018 | — | | — |
| | 875 |
| | 1,445 |
| |
| | | | | | | | | | | | | | 8,502 |
| | 9,195 |
| |
DELPHI INTERMEDIATE HEALTHCO, LLC 16 | | Revolving Loan | | Healthcare services | | L+9.50% (Floor 1.00%)/Q, Current Coupon 11.97% | | 10/2/2019 | 10/3/2022 | | 1,223 |
| | 1,223 |
| | 1,223 |
| |
| | | First Lien | | | | L+9.50% (Floor 1.00%)/Q, Current Coupon 11.20% | | 11/3/2017 | 10/3/2022 | | 10,605 |
| | 10,533 |
| | 5,101 |
| |
| | | | | | | | | | | | | | 11,756 |
| | 6,324 |
| |
| DRIVEN, INC. | | First Lien | | Business Services | | L+8.00% (Floor 2.00%)/Q, Current Coupon 10.00% | | 6/28/2019 | 6/28/2024 | | 11,940 |
| | 11,730 |
| | 11,940 |
| |
| DUNN PAPER, INC. | | Second Lien | | Paper & forest products | | L+8.75% (Floor 1.00%)/M, Current Coupon 9.75% | | 9/28/2016 | 8/26/2023 | | 3,000 |
| | 2,965 |
| | 3,000 |
| |
|
| | | | | | | | | | | | | | | | | | | | | | | | |
CAPITAL SOUTHWEST CORPORATION AND SUBSIDIARIES | |
| CONSOLIDATED SCHEDULE OF INVESTMENTS | |
| March 31, 2020 | |
| | | | | | | | | | | | | | | | | |
| | | | | | | Current | | | | | | | | | | |
| | | Type of | | | | Interest | | Acquisition | | | | | | | Fair | |
Portfolio Company1 | | Investment2 | | Industry | | Rate3 | | Date14 | Maturity | | Principal | | Cost17 | | Value4 | |
| ENVIRONMENTAL PEST SERVICE MANAGEMENT COMPANY, LLC | | First Lien | | Consumer services | | L+7.00%(Floor 1.00%)/Q, Current Coupon 8.91% | | 6/22/2018 | 6/22/2023 | | 15,292 |
| | 15,103 |
| | 15,292 |
| |
| | | Delayed Draw Term Loan10 | | | | L+7.00%(Floor 1.00%)/Q, Current Coupon 8.91% | | 6/22/2018 | 6/22/2023 | | 6,110 |
| | 6,015 |
| | 6,111 |
| |
| | | | | | | | | | | | | | 21,118 |
| | 21,403 |
| |
| ESCP DTFS, INC. | | First Lien - Term Loan A | | Industrial services | | L+6.50%(Floor 1.75%)/Q, Current Coupon 8.27% | | 1/31/2020 | 1/31/2025 | | 5,350 |
| | 5,253 |
| | 5,253 |
| |
| | | First Lien - Term Loan B | | | | L+8.50%(Floor 1.75%)/Q, Current Coupon 10.27% | | 1/31/2020 | 1/31/2025 | | 5,350 |
| | 5,253 |
| | 5,253 |
| |
| | | Delayed Draw Term Loan A110 | | | | L+6.50%(Floor 1.75%) | | 1/31/2020 | 1/31/2025 | | — |
| | (10 | ) | | — |
| |
| | | Delayed Draw Term Loan A210 | | | | L+8.50%(Floor 1.75%) | | 1/31/2020 | 1/31/2025 | | — |
| | (10 | ) | | — |
| |
| | | Delayed Draw Term Loan B110 | | | | L+6.50%(Floor 1.75%) | | 1/31/2020 | 1/31/2025 | | — |
| | (3 | ) | | — |
| |
| | | Delayed Draw Term Loan B210 | | | | L+8.50%(Floor 1.75%) | | 1/31/2020 | 1/31/2025 | | — |
| | (3 | ) | | — |
| |
| | | | | | | | | | | | | | 10,480 |
| | 10,506 |
| |
| FAST SANDWICH, LLC | | Revolving Loan10 | | Restaurants | | L+9.00% (Floor 1.00%)/Q, 5.0% PIK | | 5/24/2018 | 5/23/2023 | | — |
| | (43 | ) | | — |
| |
| | | First Lien | | | | L+9.00% (Floor 1.00%)/Q, 5.0% PIK,Current Coupon 15.91% | | 5/24/2018 | 5/23/2023 | | 3,393 |
| | 3,354 |
| | 3,179 |
| |
| | | | | | | | | | | | | | 3,311 |
| | 3,179 |
| |
| GS OPERATING, LLC | | First Lien | | Distribution | | L+6.50%(Floor 1.50%)/M, Current Coupon 8.00% | | 3/6/2020 | 2/24/2025 | | 8,000 |
| | 7,842 |
| | 7,842 |
| |
ICS DISTRIBUTION, LLC8 | | First Lien | | Industrial services | | L+8.21%(Floor 2.00%)/Q, Current Coupon 10.21% | | 10/31/2019 | 10/29/2024 | | 18,000 |
| | 17,617 |
| | 17,617 |
| |
|
| | | | | | | | | | | | | | | | | | | | | | | | |
CAPITAL SOUTHWEST CORPORATION AND SUBSIDIARIES | |
| CONSOLIDATED SCHEDULE OF INVESTMENTS | |
| March 31, 2020 | |
| | | | | | | | | | | | | | | | | |
| | | | | | | Current | | | | | | | | | | |
| | | Type of | | | | Interest | | Acquisition | | | | | | | Fair | |
Portfolio Company1 | | Investment2 | | Industry | | Rate3 | | Date14 | Maturity | | Principal | | Cost17 | | Value4 | |
| IENERGIZER LIMITED | | First Lien9 | | Business services | | L+6.00%(Floor 1.00%)/M, Current Coupon 7.00% | | 4/17/2019 | 4/17/2024 | | 12,000 |
| | 11,899 |
| | 12,000 |
| |
| JVMC HOLDINGS CORP. | | First Lien | | Financial services | | L+6.50% (Floor 1.00%)/M, Current Coupon 7.50% | | 2/28/2019 | 2/28/2024 | | 8,183 |
| | 8,115 |
| | 8,183 |
| |
| LANDPOINT HOLDCO, INC. | | First Lien | | Business Services | | L+7.00%(Floor 1.00%)/Q, Current Coupon 8.96% | | 12/30/2019 | 12/30/2024 | | 19,500 |
| | 19,128 |
| | 19,110 |
| |
LGM PHARMA, LLC13 | | First Lien | | Healthcare products | | L+8.50% (Floor 1.00%)/M, Current Coupon 10.02% | | 11/15/2017 | 11/15/2022 | | 11,541 |
| | 11,400 |
| | 11,472 |
| |
| | | 110,000 units of Class A common stock9 | | | | — | | 11/15/2017 | — | | — |
| | 1,100 |
| | 821 |
| |
| | | | | | | | | | | | | | 12,500 |
| | 12,293 |
| |
| LIGHTING RETROFIT INTERNATIONAL, LLC (DBA ENVOCORE) | | First Lien | | Environmental services | | 6%, L+3.00% PIK (Floor 2.00%)/Q, Current Coupon 11.00% | | 6/30/2017 | 6/30/2022 | | 13,439 |
| | 13,364 |
| | 12,149 |
| |
| | | 25,603 shares of Series C preferred stock | | | | | | 8/13/2018 | — |
| | — |
| | 25 |
| | — |
| |
| | | 396,825 shares of Series B preferred stock | | | | — | | 6/30/2017 | — | | — |
| | 500 |
| | — |
| |
| | | | | | | | | | | | | | 13,889 |
| | 12,149 |
| |
| MEDIA RECOVERY, INC. | | Earnout | | Industrial Products | | | | 11/25/2019 | | | | | 1,517 |
| | — |
| |
NINJATRADER, INC.13 | | Revolving Loan10 | | Financial Services | | L+6.00% (Floor 1.50%)/Q, Current Coupon 7.90% | | 12/18/2019 | 12/18/2024 | | 1,100 |
| | 1,093 |
| | 1,100 |
| |
| | | First Lien | | | | L+6.00% (Floor 1.50%)/Q, Current Coupon 7.90% | | 12/18/2019 | 12/18/2024 | | 18,250 |
| | 17,902 |
| | 18,250 |
| |
| | | 2,000,000 Preferred Units9 | | | | — | | 12/18/2019 | | | — |
| | 2,000 |
| | 2,000 |
| |
| | | | | | | | | | | | | | 20,995 |
| | 21,350 |
| |
|
| | | | | | | | | | | | | | | | | | | | | | | | |
CAPITAL SOUTHWEST CORPORATION AND SUBSIDIARIES | |
| CONSOLIDATED SCHEDULE OF INVESTMENTS | |
| March 31, 2020 | |
| | | | | | | | | | | | | | | | | |
| | | | | | | Current | | | | | | | | | | |
| | | Type of | | | | Interest | | Acquisition | | | | | | | Fair | |
Portfolio Company1 | | Investment2 | | Industry | | Rate3 | | Date14 | Maturity | | Principal | | Cost17 | | Value4 | |
| RESEARCH NOW GROUP, INC. | | Second Lien | | Business services | | L+9.50% (Floor 1.00%)/M, Current Coupon 11.26% | | 12/08/2017 | 12/20/2025 | | 10,500 |
| | 9,904 |
| | 10,217 |
| |
SCRIP INC.8 | | First Lien | | Healthcare products | | L+9.86% (Floor 2.00%)/M, Current Coupon 11.86% | | 3/21/2019 | 3/21/2024 | | 16,750 |
| | 16,332 |
| | 16,482 |
| |
| | | 100 shares of common stock | | | | — | | 3/21/2019 | — | | — |
| | 1,000 |
| | 1,000 |
| |
| | | | | | | | | | | | | | 17,332 |
| | 17,482 |
| |
TAX ADVISORS GROUP, LLC13 | | 143.3 Class A units9 | | Financial services | | — | | 6/23/2017 | — | | — |
| | 541 |
| | 1,053 |
| |
TRINITY 3, LLC13 | | First Lien | | Technology products & components | | L+7.50% (Floor 1.50%)/Q, Current Coupon 9.41% | | 11/15/2019 | 11/15/2024 | | 14,161 |
| | 13,894 |
| | 14,048 |
| |
| | | 562.5 Class A units9 | | | | — |
| | 11/15/2019 | | | — |
| | 563 |
| | 563 |
| |
| | | | | | | | | | | | | | 14,457 |
| | 14,611 |
| |
| TINUITI INC. | | 1,114 Preferred Units | | Media, marketing & entertainment | | | | 2/1/2017 | | | | | 1,114 |
| | 3,100 |
| |
| | | 1,443 Common Units | | | | | | 2/1/2017 | | | | | 277 |
| | 1,756 |
| |
| | | | | | | | | | | | | | 1,391 |
| | 4,856 |
| |
| USA DEBUSK, LLC | | First Lien | | Industrial Services | | L+5.75% (Floor 1.00%)/M, Current Coupon 6.75% | | 2/25/2020 | 10/22/2024 | | 7,980 |
| | 7,833 |
| | 7,833 |
| |
| VISTAR MEDIA INC. | | First Lien | | Media, marketing & entertainment | | L+7.5% (Floor 2.00%)/M, Current Coupon 9.5% | | 2/17/2017 | 4/3/2023 | | 11,416 |
| | 10,605 |
| | 11,416 |
| |
| | | 171,617 shares of Series A preferred stock | | | | — | | 4/3/2019 | | | — |
| | 1,874 |
| | 4,776 |
| |
| | | Warrants (Expiration - April 3, 2029) | | | | — | | 4/3/2019 | — | | — |
| | 620 |
| | 2,718 |
| |
| | | | | | | | | | | | | | 13,099 |
| | 18,910 |
| |
|
| | | | | | | | | | | | | | | | | | | | | | | | |
CAPITAL SOUTHWEST CORPORATION AND SUBSIDIARIES | |
| CONSOLIDATED SCHEDULE OF INVESTMENTS | |
| March 31, 2020 | |
| | | | | | | | | | | | | | | | | |
| | | | | | | Current | | | | | | | | | | |
| | | Type of | | | | Interest | | Acquisition | | | | | | | Fair | |
Portfolio Company1 | | Investment2 | | Industry | | Rate3 | | Date14 | Maturity | | Principal | | Cost17 | | Value4 | |
VTX HOLDINGS, INC.8 | | First Lien | | Software & IT services | | L+8.87% (Floor 2.00%)/Q, Current Coupon 10.87% | | 7/23/2019 | 7/23/2024 | | 20,075 |
| | 19,581 |
| | 19,914 |
| |
| | | 1,000,000 series A Preferred units | | | | | | 7/23/2019 | | | — |
| | 1,000 |
| | 1,000 |
| |
| | | | | | | | | | | | | | 20,581 |
| | 20,914 |
| |
| | | | | | | | | | | | | | | | | |
| Total Non-control/Non-affiliate Investments | | | | | | | | | | | | | $ | 436,463 |
| | $ | 421,280 |
| |
| | | | | | | | | | | | | | | | | |
Affiliate Investments6 | | | | | | | | | | | | | | | | |
CHANDLER SIGNS, LLC13 | | 1,500,000 units of Class A-1 common stock9 | | Business Services | | — | | 1/4/2016 | — | | $ | — |
| | $ | 1,500 |
| | $ | 3,110 |
| |
DYNAMIC COMMUNITIES, LLC13 | | Revolving Loan10 | | Business services | | L+8.00% (Floor 1.00%) | | 7/17/2018 | 7/17/2023 | | — |
| | (3 | ) | | — |
| |
| | | First Lien | | | | L+8.00% (Floor 1.00%)/M, Current Coupon 9.00% | | 7/17/2018 | 7/17/2023 | | 10,780 |
| | 10,625 |
| | 9,928 |
| |
| | | 2,000,000 Preferred Units9 | | | | — | | 7/17/2018 | — | | — |
| | 2,000 |
| | 1,850 |
| |
| | | | | | | | | | | | | | 12,622 |
| | 11,778 |
| |
| GRAMMATECH, INC. | | Revolving Loan | | Software & IT services | | L+7.50% (Floor 2.00%)/Q, Current Coupon 9.50% | | 11/1/2019 | 11/1/2024 | | 2,500 |
| | 2,460 |
| | 2,460 |
| |
| | | First Lien | |
| | L+7.50% (Floor 2.00%)/Q, Current Coupon 9.50% | | 11/1/2019 | 11/1/2024 | | 11,500 |
| | 11,312 |
| | 11,316 |
| |
| | | 1000 Class A units | | | | | | 11/1/2019 | | | — |
| | 1,000 |
| | 1,000 |
| |
| | | | | | | | | | | | | | 14,772 |
| | 14,776 |
| |
ITA HOLDINGS GROUP, LLC13 | | Revolving Loan10 | | Transportation & logistics | | L+9.00% (Floor 1.00%) | | 2/14/2018 | 2/14/2023 | | — |
| | (31 | ) | | — |
| |
| | | First Lien - Term Loan | | | | L+8.00% (Floor 1.00%)/Q, Current Coupon 9.91% | | 2/14/2018 | 2/14/2023 | | 10,030 |
| | 9,910 |
| | 9,900 |
| |
| | | First Lien - Term B Loan | | | | L+11.00% (Floor 1.00%)/Q, Current Coupon 12.91% | | 6/5/2018 | 2/14/2023 | | 5,015 |
| | 4,940 |
| | 5,136 |
| |
|
| | | | | | | | | | | | | | | | | | | | | | | | |
CAPITAL SOUTHWEST CORPORATION AND SUBSIDIARIES | |
| CONSOLIDATED SCHEDULE OF INVESTMENTS | |
| March 31, 2020 | |
| | | | | | | | | | | | | | | | | |
| | | | | | | Current | | | | | | | | | | |
| | | Type of | | | | Interest | | Acquisition | | | | | | | Fair | |
Portfolio Company1 | | Investment2 | | Industry | | Rate3 | | Date14 | Maturity | | Principal | | Cost17 | | Value4 | |
| | | First Lien - PIK Note A | | | | 10.00% PIK | | 3/29/2019 | 2/14/2023 | | 2,425 |
| | 1,950 |
| | 2,233 |
| |
| | | First Lien - PIK Note B | | | | 10.00% PIK | | 3/29/2019 | 2/14/2023 | | 96 |
| | 96 |
| | 88 |
| |
| | | Warrants (Expiration - March 29, 2029)9 | | | | — | | 3/29/2019 | — | | — |
| | 538 |
| | 2,762 |
| |
| | | 9.25% Class A Membership Interest9 | | | | — | | 2/14/2018 | — | | — |
| | 1,500 |
| | 2,099 |
| |
| | | | | | | | | | | | | | 18,903 |
| | 22,218 |
| |
| ROSELAND MANAGEMENT, LLC | | Revolving Loan10 | | Healthcare services | | L+7.00% (Floor 2.00%)/Q, Current Coupon 9.00% | | 11/9/2018 | 11/9/2023 | | 500 |
| | 475 |
| | 500 |
| |
| | | First Lien | | | | L+7.00% (Floor 2.00%)/Q, Current Coupon 9.00% | | 11/9/2018 | 11/9/2023 | | 10,369 |
| | 10,228 |
| | 10,369 |
| |
| | | 10,000 Class A Units | | | | — | | 11/9/2018 | — | | — |
| | 1,000 |
| | 1,334 |
| |
| | | | | | | | | | | | | | 11,703 |
| | 12,203 |
| |
| SIMR, LLC | | First Lien | | Healthcare services | | L+10.00% (Floor 2.00%)/M, 7.00% PIK, Current Coupon 19.00% | | 9/7/2018 | 9/7/2023 | | 11,693 |
| | 11,522 |
| | 11,190 |
| |
| | | 9,374,510.2 Class B Common Units | | | | — | | 9/7/2018 | — | | — |
| | 6,107 |
| | 1,742 |
| |
| | | | | | | | | | | | | | 17,629 |
| | 12,932 |
| |
| ZENFOLIO INC. | | Revolving Loan | | Business services | | L+9.00% (Floor 1.00%)/Q, Current Coupon 10.34% | | 7/17/2017 | 7/17/2022 | | 2,000 |
| | 1,991 |
| | 1,888 |
| |
| | | First Lien | | | | L+9.00% (Floor 1.00%)/Q, Current Coupon 10.91% | | 7/17/2017 | 7/17/2022 | | 13,906 |
| | 13,704 |
| | 13,127 |
| |
| | | 190 shares of common stock | | | | — | | 7/17/2017 | — | | — |
| | 1,900 |
| | — |
| |
| | | | | | | | | | | | | | 17,595 |
| | 15,015 |
| |
| | | | | | | | | | | | | | | | | |
| Total Affiliate Investments | | | | | | | | | | | | | $ | 94,724 |
| | $ | 92,032 |
| |
| | | | | | | | | | | | | | | | | |
|
| | | | | | | | | | | | | | | | | | | | | | | | |
CAPITAL SOUTHWEST CORPORATION AND SUBSIDIARIES | |
| CONSOLIDATED SCHEDULE OF INVESTMENTS | |
| March 31, 2020 | |
| | | | | | | | | | | | | | | | | |
| | | | | | | Current | | | | | | | | | | |
| | | Type of | | | | Interest | | Acquisition | | | | | | | Fair | |
Portfolio Company1 | | Investment2 | | Industry | | Rate3 | | Date14 | Maturity | | Principal | | Cost17 | | Value4 | |
Control Investments7 | | | | | | | | | | | | | | | | |
I-45 SLF LLC9,11 | | 80% LLC equity interest | | Multi-sector holdings | | — | | 10/20/2015 | — | | — |
| | $ | 68,000 |
| | $ | 39,760 |
| |
| | | | | | | | | | | | | | | | | |
| Total Control Investments | | | | | | | | | | | | | $ | 68,000 |
| | $ | 39,760 |
| |
| | | | | | | | | | | | | | | | | |
TOTAL INVESTMENTS12 | | | | | | | | | | | | | $ | 599,187 |
| | $ | 553,072 |
| |
| |
1
| All debt investments are income-producing, unless otherwise noted. Equity investments and warrants are non-income producing, unless otherwise noted. |
| |
2
| All of the Company’s investments, unless otherwise noted, are pledged as collateral for the Company’s senior secured credit facility. |
| |
3
| The majority of investments bear interest at a rate that may be determined by reference to London Interbank Offered Rate (“LIBOR” or “L”) or Prime (“P”) and reset daily (D), monthly (M), quarterly (Q), or semiannually (S). For each the Company has provided the spread over LIBOR or Prime and the current contractual interest rate in effect at March 31, 2020. Certain investments are subject to a LIBOR or Prime interest rate floor. Certain investments, as noted, accrue payment-in-kind ("PIK") interest. |
| |
4
| The Company's investment portfolio is comprised entirely of privately held debt and equity securities for which quoted prices falling within the categories of Level 1 and Level 2 inputs are not available. Therefore, the Company values all of its portfolio investments at fair value, as determined in good faith by the Board of Directors, using significant unobservable Level 3 inputs. Refer to Note 4 for further discussion. |
| |
5
| Non-Control/Non-Affiliate investments are generally defined by the Investment Company Act of 1940, as amended (the “1940 Act”), as investments that are neither control investments nor affiliate investments. At March 31, 2020, approximately 76.2% of the Company’s investment assets were non-control/non-affiliate investments. The fair value of these investments as a percent of net assets is 154.8%. |
| |
6
| Affiliate investments are generally defined by the 1940 Act as investments in which between 5% and 25% of the voting securities are owned and the investments are not classified as control investments. At March 31, 2020, approximately 16.6% of the Company’s investment assets were affiliate investments. The fair value of these investments as a percent of net assets is 33.8%. |
| |
7
| Control investments are generally defined by the 1940 Act as investments in which more than 25% of the voting securities are owned. At March 31, 2020, approximately 7.2% of the Company’s investment assets were control investments. The fair value of these investments as a percent of net assets is 14.6%. |
| |
8
| The investment is structured as a first lien last out term loan. |
| |
9
| Indicates assets that are considered "non-qualifying assets” under section 55(a) of the 1940 Act. Qualifying assets must represent at least 70% of total assets at the time of acquisition of any additional non-qualifying assets. As of March 31, 2020, approximately 11.9% of the Company's assets are non-qualifying assets. |
| |
10
| The investment has an unfunded commitment as of March 31, 2020. Refer to Note 11 - Commitments and Contingencies for further discussion. |
| |
11
| Income producing through dividends or distributions. |
| |
12
| As of March 31, 2020, the cumulative gross unrealized appreciation for federal income tax purposes is approximately $19.3 million; cumulative gross unrealized depreciation for federal income tax purposes is $63.4 million. Cumulative net unrealized depreciation is $44.1 million, based on a tax cost of $597.7 million. |
| |
13
| Our investment in ASC Ortho Management Company, LLC common units, Danforth Advisors, LLC Class A units, American Nuts Operations LLC Class A common stock, LGM Pharma, LLC Class A common stock, NinjaTrader, LLC preferred units, Trinity 3, LLC Class A units, Tax Advisors Group, LLC Class A units, Chandler Signs, LLC Class A-1 common stock, Dynamic Communities, LLC Preferred units, and ITA Holdings Group, LLC Class A membership interest are held through a wholly-owned taxable subsidiary of the Company. |
| |
14
| The Company generally acquires its investments in private transactions exempt from registration under the Securities Act of 1933, as amended (the "Securities Act"). These investments are generally subject to certain limitations on resale, and may be deemed "restricted securities" under the Securities Act. |
| |
15
| The investment is structured as a split lien term loan, which provides the Company with a first lien priority on certain assets of the obligor and a second lien priority on different assets of the obligor. |
| |
16
| Investment was on non-accrual status as of March 31, 2020, meaning the Company has ceased to recognize interest income on the investment. The current interest rate and terms disclosed on investments on non-accrual reflect the terms at the time of placement on non-accrual status. |
| |
17
| Negative cost in this column represents the original issue discount of certain undrawn revolvers and delayed draw term loans. |
A brief description of the portfolio company in which we made an investment that represents greater than 5% of our total assets as of March 31, 20202023 is included in Note 16.15 - Significant Subsidiaries.
The accompanying Notes are an integral part of these Consolidated Financial Statements.
| | | | | | | | | | | | | | | | | | | | | | | | | | | | | | | | | | | | | | | | | | | | | | | | | | |
| CAPITAL SOUTHWEST CORPORATION AND SUBSIDIARIES |
| CONSOLIDATED SCHEDULE OF INVESTMENTS |
| March 31, 2022 |
| | | | | | | | | | | | | | | | |
Portfolio Company1,18 | | Type of Investment2 | | Industry | | Current Interest Rate3 | | Acquisition Date14 | | Maturity | | Principal | | Cost12,17 | | Fair Value4 |
Non-control/Non-affiliate Investments5 | | | | | | | | | | | | | | | | |
| AAC NEW HOLDCO INC. | | First Lien | | Healthcare services | | 10.00%, 8.00% PIK | | 12/11/2020 | | 6/25/2025 | | $ | 8,653 | | | $ | 8,653 | | | $ | 8,350 | |
| | 374,543 Common | | | | — | | 12/11/2020 | | — | | — | | | 1,785 | | | 1,785 | |
| | Warrants (Expiration - December 11, 2025) | | | | — | | 12/11/2020 | | — | | — | | | 2,198 | | | 2,198 | |
| | | | | | | | | | | | | | 12,636 | | | 12,333 | |
| ACCELERATION PARTNERS, LLC | | First Lien8 | | Media & marketing | | L+8.17% (Floor 1.00%)/Q, Current Coupon 9.17% | | 12/1/2020 | | 12/1/2025 | | 11,875 | | | 11,600 | | | 11,875 | |
| | 1,000 Preferred Units9,13 | | | | — | | 12/1/2020 | | — | | — | | | 1,000 | | | 1,153 | |
| | 1,000 Class A Common Units9,13 | | | | — | | 12/1/2020 | | — | | — | | | — | | | — | |
| | | | | | | | | | | | | | 12,600 | | | 13,028 | |
| ACE GATHERING, INC. | | Second Lien15 | | Energy services (midstream) | | L+8.50% (Floor 2.00%)/Q, Current Coupon 10.50% | | 12/13/2018 | | 12/13/2023 | | 7,948 | | | 7,881 | | | 7,765 | |
| ALLIANCE SPORTS GROUP, L.P. | | Unsecured convertible note | | Consumer products & retail | | 6.00% PIK | | 7/15/2020 | | 9/30/2024 | | 173 | | | 173 | | | 495 | |
| | 3.88% preferred membership interest | | | | — | | 8/1/2017 | | — | | — | | | 2,500 | | | 3,681 | |
| | | | | | | | | | | | | | 2,673 | | | 4,176 | |
| AMERICAN NUTS OPERATIONS LLC | | First Lien - Term Loan A | | Food, agriculture and beverage | | SOFR+6.75% (Floor 1.00%)/Q, Current Coupon 7.75% | | 3/11/2022 | | 4/10/2026 | | 12,450 | | | 12,388 | | | 12,450 | |
| | First Lien - Term Loan B | | | | SOFR+8.75% (Floor 1.00%)/Q, Current Coupon 9.75% | | 3/11/2022 | | 4/10/2026 | | 12,450 | | | 12,388 | | | 12,450 | |
| | 3,000,000 units of Class A common stock9,13 | | | | — | | 4/10/2018 | | — | | — | | | 3,000 | | | 4,195 | |
| | | | | | | | | | | | | | 27,776 | | | 29,095 | |
| AMERICAN TELECONFERENCING SERVICES, LTD. (DBA PREMIERE GLOBAL SERVICES, INC.) | | Revolving Loan10,16 | | Telecommunications | | P+5.50%/Q, Current Coupon 9.00% | | 9/17/2021 | | 6/30/2022 | | 899 | | | 890 | | | 49 | |
| | First Lien16 | | | | P+5.50%/Q, Current Coupon 9.00% | | 9/21/2016 | | 6/8/2023 | | 4,899 | | | 4,858 | | | 269 | |
| | | | | | | | | | | | | | 5,748 | | | 318 | |
| AMWARE FULFILLMENT LLC | | First Lien | | Distribution | | L+9.00% (Floor 1.00%)/M, Current Coupon 10.00% | | 7/29/2016 | | 4/15/2022 | | 16,376 | | | 16,375 | | | 16,376 | |
|
| | | | | | | | | | | | | | | | | | | | | |
| CAPITAL SOUTHWEST CORPORATION AND SUBSIDIARIES |
| CONSOLIDATED SCHEDULE OF INVESTMENTS |
| March 31, 2019 |
| | | | | | | Current | | | | | | | | |
| | | Type of | | | | Interest | | | | | | | | Fair |
Portfolio Company1 | | Investment2,14 | | Industry | | Rate3 | | Maturity | | Principal | | Cost | | Value4 |
Non-control/Non-affiliate Investments5 | | | | | | | | | | | | | | |
| AAC HOLDINGS, INC. | | First Lien | | Healthcare services | | L+6.75% (Floor 1.00%)/Q, 4.00% PIK, Current Coupon 13.49% | | 6/30/2023 | | $ | 9,084 |
| | $ | 8,912 |
| | $ | 8,403 |
|
| | | First Lien | | Healthcare services | | L+11.00% (Floor 1.00%)/M | | 3/31/2020 | | 1,170 |
| | 1,158 |
| | 1,182 |
|
| | | | | | | | | | | | | 10,070 |
| | 9,585 |
|
| ACE GATHERING, INC. | | Second Lien15 | | Energy services (midstream) | | L+8.50% (Floor 2.00%)/Q, Current Coupon 11.09% | | 12/13/2023 | | 9,938 |
| | 9,747 |
| | 9,783 |
|
| ADAMS PUBLISHING GROUP, LLC | | First Lien | | Media, marketing & entertainment | | L+7.50% (Floor 1.00%)/Q, Current Coupon 10.30% | | 7/2/2023 | | 13,566 |
| | 13,320 |
| | 13,308 |
|
| | | Delayed Draw Term Loan10 | | | | L+7.50% (Floor 1.00%) | | 7/2/2023 | | — |
| | (29 | ) | | — |
|
| | | | | | | | | | | | | 13,291 |
| | 13,308 |
|
AG KINGS HOLDINGS INC.8,16 | | First Lien | | Food, agriculture & beverage | | L+10.02% (Floor 1.00%)/M, Current Coupon 12.69% | | 8/8/2021 | | 9,308 |
| | 9,194 |
| | 8,330 |
|
| ALLIANCE SPORTS GROUP, L.P. | | Senior subordinated debt | | Consumer products & retail | | 11% | | 2/1/2023 | | 10,100 |
| | 9,946 |
| | 9,807 |
|
| | | 3.88% preferred membership interest | | | | — | | — | | — |
| | 2,500 |
| | 2,500 |
|
| | | | | | | | | | | | | 12,446 |
| | 12,307 |
|
AMERICAN NUTS OPERATIONS LLC13 | | First Lien - Term Loan | | Food, agriculture and beverage | | L+9.50% (Floor 1.00%)/Q, Current Coupon 12.30% | | 4/10/2023 | | 17,369 |
| | 17,075 |
| | 16,822 |
|
| | | First Lien - Term Loan C10 | | | | L+9.50% (Floor 1.00%)/Q, Current Coupon 12.30% | | 4/10/2023 | | 1,750 |
| | 1,723 |
| | 1,695 |
|
| | | 3,000,000 units of Class A common stock9 | | | | — | | — | | — |
| | 3,000 |
| | 1,505 |
|
| | | | | | | | | | | | | 21,798 |
| | 20,022 |
|
| AMERICAN TELECONFERENCING SERVICES, LTD. | | First Lien | | Telecommunications | | L+6.50% (Floor 1.00%)/Q, Current Coupon 9.24% | | 12/8/2021 | | 6,023 |
| | 5,922 |
| | 3,953 |
|
| | | Second Lien | | | | L+9.50% (Floor 1.00%)/Q, Current Coupon 12.30% | | 6/6/2022 | | 2,006 |
| | 1,954 |
| | 1,103 |
|
| | | | | | | | | | | | | 7,876 |
| | 5,056 |
|
| | | | | | | | | | | | | | | | | | | | | | | | | | | | | | | | | | | | | | | | | | | | | | | | | | |
| CAPITAL SOUTHWEST CORPORATION AND SUBSIDIARIES |
| CONSOLIDATED SCHEDULE OF INVESTMENTS |
| March 31, 2022 |
| | | | | | | | | | | | | | | | |
Portfolio Company1,18 | | Type of Investment2 | | Industry | | Current Interest Rate3 | | Acquisition Date14 | | Maturity | | Principal | | Cost12,17 | | Fair Value4 |
| ARBORWORKS, LLC | | Revolving Loan10 | | Environmental services | | L+7.00% (Floor 1.00%) | | 11/17/2021 | | 11/9/2026 | | — | | | (56) | | | — | |
| | First Lien | | | | L+7.00% (Floor 1.00%)/Q, Current Coupon 8.00% | | 11/17/2021 | | 11/9/2026 | | 12,903 | | | 12,660 | | | 12,657 | |
| | 100 Class A Units | | | | — | | 11/17/2021 | | — | | — | | | 100 | | | 100 | |
| | | | | | | | | | | | | | 12,704 | | | 12,757 | |
| ASC ORTHO MANAGEMENT COMPANY, LLC | | 2,156 Common Units9,13 | | Healthcare services | | — | | 8/31/2018 | | — | | — | | | 801 | | | 584 | |
| ATS OPERATING, LLC | | Revolving Loan10 | | Consumer products & retail | | SOFR+6.50% (Floor 1.00%)/Q, Current Coupon 7.50% | | 1/18/2022 | | 1/18/2027 | | 1,000 | | | 952 | | | 952 | |
| | First Lien - Term Loan A | | | | SOFR+5.50% (Floor 1.00%)/Q, Current Coupon 6.50% | | 1/18/2022 | | 1/18/2027 | | 9,250 | | | 9,071 | | | 9,071 | |
| | First Lien - Term Loan B | | | | SOFR+7.50% (Floor 1.00%)/Q, Current Coupon 8.50% | | 1/18/2022 | | 1/18/2027 | | 9,250 | | | 9,071 | | | 9,071 | |
| | 1,000,000 Preferred units9,13 | | | | — | | 1/18/2022 | | — | | — | | | 1,000 | | | 1,000 | |
| | | | | | | | | | | | | | 20,094 | | | 20,094 | |
| BINSWANGER HOLDING CORP. | | First Lien | | Distribution | | L+8.50% (Floor 1.00%)/M, Current Coupon 9.50% | | 3/9/2017 | | 3/10/2023 | | 10,121 | | | 10,105 | | | 10,121 | |
| | 900,000 shares of common stock | | | | — | | 3/9/2017 | | — | | — | | | 900 | | | 924 | |
| | | | | | | | | | | | | | 11,005 | | | 11,045 | |
| BLASCHAK ANTHRACITE CORPORATION (FKA BLASCHAK COAL CORP.) | | Second Lien- Term Loan15 | | Commodities & mining | | L+11.00%, 3.00% PIK (Floor 1.00%)/Q, Current Coupon 15.00% | | 7/30/2018 | | 7/30/2023 | | 9,064 | | | 9,005 | | | 8,793 | |
| | Second Lien- Term Loan B15 | | | | L+11.00%, 3.00% PIK (Floor 1.00%)/Q, Current Coupon 15.00% | | 3/30/2020 | | 7/30/2023 | | 2,149 | | | 2,130 | | | 2,084 | |
| | | | | | | | | | | | | | 11,135 | | | 10,877 | |
| BROAD SKY NETWORKS LLC (DBA EPIC IO TECHNOLOGIES) | | 1,131,579 Series A Preferred units | | Telecommunications | | — | | 12/11/2020 | | — | | — | | | 1,132 | | | 1,420 | |
| CADMIUM, LLC | | Revolving Loan10 | | Software & IT services | | L+7.00% (Floor 1.00%)/Q, Current Coupon 8.00% | | 1/7/2022 | | 12/22/2026 | | 308 | | | 302 | | | 302 | |
| | First Lien | | | | L+7.00% (Floor 1.00%)/Q, Current Coupon 8.00% | | 1/7/2022 | | 12/22/2026 | | 7,385 | | | 7,313 | | | 7,314 | |
| | | | | | | | | | | | | | 7,615 | | | 7,616 | |
|
| | | | | | | | | | | | | | | | | | | | | |
| CAPITAL SOUTHWEST CORPORATION AND SUBSIDIARIES |
| CONSOLIDATED SCHEDULE OF INVESTMENTS |
| March 31, 2019 |
| | | | | | | Current | | | | | | | | |
| | | Type of | | | | Interest | | | | | | | | Fair |
Portfolio Company1 | | Investment2,14 | | Industry | | Rate3 | | Maturity | | Principal | | Cost | | Value4 |
| AMWARE FULFILLMENT LLC | | First Lien | | Distribution | | L+9.50% (Floor 1.00%)/M, Current Coupon 12.10% | | 12/31/2020 | | 12,753 |
| | 12,666 |
| | 12,651 |
|
ASC ORTHO MANAGEMENT COMPANY, LLC13 | | Revolving Loan10 | | Healthcare services | | L+7.50% (Floor 1.00%) | | 8/31/2023 | | — |
| | (27 | ) | | — |
|
| | | First Lien | | | | L+7.50% (Floor 1.00%)/Q, Current Coupon 10.30% | | 8/31/2023 | | 9,261 |
| | 9,094 |
| | 9,095 |
|
| | | Second Lien | | | | 13.25% PIK | | 12/1/2023 | | 3,250 |
| | 3,178 |
| | 3,178 |
|
| | | 2,042 Common Units9 | | | | — | | — | | — |
| | 750 |
| | 750 |
|
| | | | | | | | | | | | | 12,995 |
| | 13,023 |
|
| BINSWANGER HOLDING CORP. | | First Lien | | Distribution | | L+8.00% (Floor 1.00%)/M, Current Coupon 10.60% | | 3/9/2022 | | 12,150 |
| | 11,992 |
| | 12,016 |
|
| | | 900,000 shares of common stock | | | | — | | — | | — |
| | 900 |
| | 1,013 |
|
| | | | | | | | | | | | | 12,892 |
| | 13,029 |
|
| BLASCHAK COAL CORP. | | Second Lien15 | | Commodities & mining | | L+10.00%/Q, 1.00% PIK, Current Coupon 13.81% | | 7/30/2023 | | 8,537 |
| | 8,383 |
| | 8,511 |
|
| CALIFORNIA PIZZA KITCHEN, INC. | | First Lien | | Restaurants | | L+6.00% (Floor 1.00%)/M, Current Coupon 8.50% | | 8/23/2022 | | 4,875 |
| | 4,844 |
| | 4,723 |
|
| CAPITAL PAWN HOLDINGS, LLC | | First Lien | | Consumer products & retail | | L+9.50%/Q, Current Coupon 12.30% | | 7/8/2020 | | 11,448 |
| | 11,315 |
| | 11,310 |
|
| CLICKBOOTH.COM, LLC | | Revolving Loan10 | | Media, marketing & entertainment | | L+8.50% (Floor 1.00%) | | 12/5/2022 | | — |
| | (15 | ) | | — |
|
| | | First Lien | | | | L+8.50% (Floor 1.00%)/Q, Current Coupon 11.31% | | 12/5/2022 | | 16,953 |
| | 16,684 |
| | 17,292 |
|
| | | | | | | | | | | | | 16,669 |
| | 17,292 |
|
DANFORTH ADVISORS, LLC13 | | Revolving Loan10 | | Business services | | L+7.25% (Floor 2.00%)/Q, Current Coupon 10.05% | | 9/28/2023 | | 7,250 |
| | 7,117 |
| | 7,145 |
|
| | | First Lien | | | | L+7.25% (Floor 2.00%) | | 9/28/2023 | | — |
| | (18 | ) | | — |
|
| | | 875 Class A equity units9 | | | | — | | — | | — |
| | 875 |
| | 875 |
|
| | | | | | | | | | | | | 7,974 |
| | 8,020 |
|
| | | | | | | | | | | | | | | | | | | | | | | | | | | | | | | | | | | | | | | | | | | | | | | | | | |
| CAPITAL SOUTHWEST CORPORATION AND SUBSIDIARIES |
| CONSOLIDATED SCHEDULE OF INVESTMENTS |
| March 31, 2022 |
| | | | | | | | | | | | | | | | |
Portfolio Company1,18 | | Type of Investment2 | | Industry | | Current Interest Rate3 | | Acquisition Date14 | | Maturity | | Principal | | Cost12,17 | | Fair Value4 |
| CALIFORNIA PIZZA KITCHEN, INC. | | 48,423 shares of common stock | | Restaurants | | — | | 11/23/2020 | | — | | — | | | 1,317 | | | 2,090 | |
| CAMIN CARGO CONTROL, INC. | | First Lien | | Energy services (midstream) | | L+6.50% (Floor 1.00%)/Q, Current Coupon 7.50% | | 6/2/2021 | | 6/4/2026 | | 5,752 | | | 5,702 | | | 5,700 | |
| CITYVET, INC. | | Delayed Draw Term Loan10 | | Healthcare services | | L+6.50% (Floor 1.00%)/Q, Current Coupon 7.50% | | 3/5/2021 | | 3/5/2026 | | 13,000 | | | 12,656 | | | 13,247 | |
| | 271,739 Class A units9,13 | | | | — | | 3/5/2021 | | — | | — | | | 500 | | | 1,757 | |
| | | | | | | | | | | | | | 13,156 | | | 15,004 | |
CRAFTY APES, LLC8 | | First Lien | | Media & marketing | | L+6.21% (Floor 1.00%)/Q, Current Coupon 7.21% | | 6/9/2021 | | 11/1/2024 | | 10,000 | | | 9,921 | | | 10,000 | |
| DUNN PAPER, INC. | | Second Lien | | Paper & forest products | | L+9.25% (Floor 1.00%)/M, Current Coupon 10.25% | | 9/28/2016 | | 8/26/2023 | | 3,000 | | | 2,984 | | | 2,208 | |
| EVEREST TRANSPORTATION SYSTEMS, LLC | | First Lien | | Transportation & logistics | | L+8.00% (Floor 1.00%)/M, Current Coupon 9.00% | | 11/9/2021 | | 8/26/2026 | | 8,938 | | | 8,853 | | | 8,848 | |
| FAST SANDWICH, LLC | | Revolving Loan10 | | Restaurants | | L+9.00% (Floor 1.00%) | | 5/24/2018 | | 5/23/2023 | | — | | | (22) | | | — | |
| | First Lien | | | | L+9.00% (Floor 1.00%)/Q,Current Coupon 10.00% | | 5/24/2018 | | 5/23/2023 | | 3,277 | | | 3,262 | | | 3,277 | |
| | | | | | | | | | | | | | 3,240 | | | 3,277 | |
| FLIP ELECTRONICS, LLC | | First Lien | | Technology products & components | | SOFR+7.50% (Floor 1.00%)/M, Current Coupon 8.50% | | 1/4/2021 | | 1/2/2026 | | 17,755 | | | 17,443 | | | 17,755 | |
| | Delayed Draw Term Loan10 | | | | SOFR+7.50% (Floor 1.00%) | | 3/24/2022 | | 1/2/2026 | | — | | | (56) | | | — | |
| | 2,000,000 Common Units9,11,13 | | | | — | | 1/4/2021 | | — | | — | | | 2,000 | | | 6,373 | |
| | | | | | | | | | | | | | 19,387 | | | 24,128 | |
| FOOD PHARMA SUBSIDIARY HOLDINGS, LLC | | First Lien | | Food, agriculture & beverage | | L+6.50% (Floor 1.00%)/M, Current Coupon 7.50% | | 6/1/2021 | | 6/1/2026 | | 5,000 | | | 4,914 | | | 5,000 | |
| | Delayed Draw Term Loan10 | | | | L+6.50% (Floor 1.00%)/M, Current Coupon 7.50% | | 6/1/2021 | | 6/1/2026 | | 2,030 | | | 1,971 | | | 2,030 | |
| | 75,000 Class A Units9,13 | | | | — | | 6/1/2021 | | — | | — | | | 750 | | | 750 | |
| | | | | | | | | | | | | | 7,635 | | | 7,780 | |
|
| | | | | | | | | | | | | | | | | | | | | |
| CAPITAL SOUTHWEST CORPORATION AND SUBSIDIARIES |
| CONSOLIDATED SCHEDULE OF INVESTMENTS |
| March 31, 2019 |
| | | | | | | Current | | | | | | | | |
| | | Type of | | | | Interest | | | | | | | | Fair |
Portfolio Company1 | | Investment2,14 | | Industry | | Rate3 | | Maturity | | Principal | | Cost | | Value4 |
| DELPHI INTERMEDIATE HEALTHCO, LLC | | First Lien | | Healthcare services | | L+7.50% (Floor 1.00%)/Q, Current Coupon 10.23% | | 10/3/2022 | | 11,400 |
| | 11,310 |
| | 11,023 |
|
| DIGITAL RIVER, INC. | | First Lien | | Software & IT services | | L+6.00% (Floor 1.00%)/Q, Current Coupon 8.60% | | 2/12/2021 | | 6,285 |
| | 6,277 |
| | 6,128 |
|
| DUNN PAPER, INC. | | Second Lien | | Paper & forest products | | L+8.75% (Floor 1.00%)/M, Current Coupon 11.25% | | 8/25/2023 | | 3,000 |
| | 2,957 |
| | 2,883 |
|
ELITE SEM, INC.8 | | First Lien | | Media, marketing & entertainment | | L+8.40% (Floor 1.00%)/M, Current Coupon 11.00% | | 2/1/2022 | | 14,000 |
| | 13,717 |
| | 14,000 |
|
| | | 1,443 Investment Units (Preferred) | | | | 12% PIK | | — | | — |
| | 2,068 |
| | 4,457 |
|
| | | | | | | | | | | | | 15,785 |
| | 18,457 |
|
| ENVIRONMENTAL PEST SERVICE MANAGEMENT COMPANY, LLC | | First Lien | | Consumer services | | L+7.25% (Floor 1.00%)/Q, Current Coupon 10.06% | | 6/22/2023 | | 16,169 |
| | 15,921 |
| | 16,169 |
|
| | | Delayed Draw Term Loan10 | | | | L+7.25% (Floor 1.00%)/Q, Current Coupon 10.06% | | 6/22/2023 | | 6,461 |
| | 6,353 |
| | 6,461 |
|
| | | | | | | | | | | | | 22,274 |
| | 22,630 |
|
| FAST SANDWICH, LLC | | Revolving Loan10 | | Restaurants | | L+9.00% (Floor 1.00%) | | — |
| | — |
| | (57 | ) | | — |
|
| | | First Lien | | | | L+9.00% (Floor 1.00%)/Q, Current Coupon 11.80% | | 5/23/2023 | | 3,238 |
| | 3,191 |
| | 3,190 |
|
| | | | | | | | | | | | | 3,134 |
| | 3,190 |
|
| JVMC HOLDINGS CORP. | | First Lien | | Financial services | | L+6.50% (Floor 1.00%)/M, Current Coupon 9.00% | | 2/28/2024 | | 9,152 |
| | 9,062 |
| | 9,062 |
|
| | | Delayed Draw Term Loan10 | | | | L+6.50% (Floor 1.00%) | | 2/28/2024 | | — |
| | (7 | ) | | — |
|
| | | | | | | | | | | | | 9,055 |
| | 9,062 |
|
LGM PHARMA, LLC13 | | First Lien | | Healthcare products | | L+8.50% (Floor 1.00%)/M, Current Coupon 10.99% | | 11/15/2022 | | 9,875 |
| | 9,723 |
| | 10,073 |
|
| | | Delayed Draw Term Loan | | | | L+8.50% (Floor 1.00%)/M, Current Coupon 10.99% | | 11/15/2022 | | 1,785 |
| | 1,753 |
| | 1,820 |
|
| | | 110,000 units of Class A common stock9 | | | | — | | — | | — |
| | 1,100 |
| | 821 |
|
| | | | | | | | | | | | | | | | | | | | | | | | | | | | | | | | | | | | | | | | | | | | | | | | | | |
| CAPITAL SOUTHWEST CORPORATION AND SUBSIDIARIES |
| CONSOLIDATED SCHEDULE OF INVESTMENTS |
| March 31, 2022 |
| | | | | | | | | | | | | | | | |
Portfolio Company1,18 | | Type of Investment2 | | Industry | | Current Interest Rate3 | | Acquisition Date14 | | Maturity | | Principal | | Cost12,17 | | Fair Value4 |
| GS OPERATING, LLC | | Revolving Loan10 | | Distribution | | SOFR+6.00%(Floor 0.75%)/M, Current Coupon 6.75% | | 1/3/2022 | | 1/3/2028 | | 183 | | | 150 | | | 187 | |
| | First Lien | | | | SOFR+6.00%(Floor 0.75%)/M, Current Coupon 6.75% | | 1/3/2022 | | 1/3/2028 | | 8,534 | | | 8,367 | | | 8,704 | |
| | Delayed Draw Term Loan10 | | | | SOFR+6.00%(Floor 0.75%)/M, Current Coupon 6.75% | | 1/3/2022 | | 1/3/2028 | | 2,516 | | | 2,406 | | | 2,566 | |
| | | | | | | | | | | | | | 10,923 | | | 11,457 | |
| HYBRID APPAREL, LLC | | Second Lien15 | | Consumer products & retail | | L+8.25% (Floor 1.00%)/Q, Current Coupon 9.25% | | 6/30/2021 | | 6/30/2026 | | 15,750 | | | 15,473 | | | 15,246 | |
| INFOLINKS MEDIA BUYCO, LLC | | First Lien | | Media & marketing | | L+6.00% (Floor 1.00%)/M, Current Coupon 7.01% | | 11/1/2021 | | 10/30/2026 | | 7,731 | | | 7,587 | | | 7,615 | |
| | Delayed Draw Term Loan10 | | | | L+6.00% (Floor 1.00%) | | 11/1/2021 | | 10/30/2026 | | — | | | (21) | | | — | |
| | 1.68% LP interest9,10,13 | | | | — | | 10/29/2021 | | — | | — | | | 588 | | | 588 | |
| | | | | | | | | | | | | | 8,154 | | | 8,203 | |
| ISI ENTERPRISES, LLC | | Revolving Loan10 | | Software & IT services | | L+7.00% (Floor 1.00%)/Q, Current Coupon 8.00% | | 10/1/2021 | | 10/1/2026 | | 800 | | 764 | | | 800 | |
| | First Lien | | | | L+7.00% (Floor 1.00%)/Q, Current Coupon 8.00% | | 10/1/2021 | | 10/1/2026 | | 5,000 | | | 4,908 | | | 5,000 | |
| | 1,000,000 Series A Preferred units | | | | — | | 10/1/2021 | | — | | — | | | 1,000 | | | 1,000 | |
| | | | | | | | | | | | | | 6,672 | | | 6,800 | |
| JVMC HOLDINGS CORP. | | First Lien | | Financial services | | L+7.00% (Floor 1.00%)/M, Current Coupon 8.00% | | 2/28/2019 | | 2/28/2024 | | 6,589 | | | 6,558 | | | 6,589 | |
| KLEIN HERSH, LLC | | Revolving Loan10 | | Business services | | L+7.00% (Floor 0.75%) | | 11/13/2020 | | 11/13/2025 | | — | | | (13) | | | — | |
| | First Lien | | | | L+7.00% (Floor 0.75%)/Q, Current Coupon 7.85% | | 11/13/2020 | | 11/13/2025 | | 23,821 | | | 23,415 | | | 24,298 | |
| | | | | | | | | | | | | | 23,402 | | | 24,298 | |
| KMS, LLC | | First Lien15 | | Distribution | | L+7.25% (Floor 1.00%)/Q, Current Coupon 8.25% | | 10/4/2021 | | 10/2/2026 | | 15,920 | | | 15,773 | | | 15,920 | |
| | Delayed Draw Term Loan10 | | | | L+7.25% (Floor 1.00%) | | 10/4/2021 | | 10/2/2026 | | — | | | (41) | | | — | |
| | | | | | | | | | | | | | 15,732 | | | 15,920 | |
|
| | | | | | | | | | | | | | | | | | | | | |
| CAPITAL SOUTHWEST CORPORATION AND SUBSIDIARIES |
| CONSOLIDATED SCHEDULE OF INVESTMENTS |
| March 31, 2019 |
| | | | | | | Current | | | | | | | | |
| | | Type of | | | | Interest | | | | | | | | Fair |
Portfolio Company1 | | Investment2,14 | | Industry | | Rate3 | | Maturity | | Principal | | Cost | | Value4 |
| | | | | | | | | | | | | 12,576 |
| | 12,714 |
|
| LIGHTING RETROFIT INTERNATIONAL, LLC | | First Lien | | Environmental services | | L+9.25% (Floor 1.00%)/Q, Current Coupon 11.84% | | 6/30/2022 | | 13,688 |
| | 13,580 |
| | 12,606 |
|
| | | 25,603 shares of Series C preferred stock | | | | — | | — | | — |
| | 26 |
| | 28 |
|
| | | 396,825 shares of Series B preferred stock | | | | — | | — | | — |
| | 500 |
| | 307 |
|
| | | | | | | | | | | | | 14,106 |
| | 12,941 |
|
| RESEARCH NOW GROUP, INC. | | Second Lien | | Business services | | L+9.50% (Floor 1.00%)/M, Current Coupon 12.00% | | 12/20/2025 | | 10,500 |
| | 9,838 |
| | 10,437 |
|
SCRIP INC.8 | | First Lien | | Healthcare products | | L+10.00% (Floor 2.00%)/M, Current Coupon 12.49% | | 3/21/2024 | | 16,750 |
| | 16,250 |
| | 16,250 |
|
| | | 100 shares of common stock | | | | — | | — | | — |
| | 1,000 |
| | 1,000 |
|
| | | | | | | | | | | | | 17,250 |
| | 17,250 |
|
TAX ADVISORS GROUP, LLC13 | | 143.3 Class A units9 | | Financial services | | — | | — | | — |
| | 541 |
| | 645 |
|
| VISTAR MEDIA INC. | | First Lien | | Media, marketing & entertainment | | L+10.00% (Floor 1.00%)/M, Current Coupon 12.60% | | 2/16/2022 | | 7,975 |
| | 7,447 |
| | 7,975 |
|
| | | Warrants (Expiration - February 17, 2027) | | | | — | | — | | — |
| | 886 |
| | 2,378 |
|
| | | | | | | | | | | | | 8,333 |
| | 10,353 |
|
| | | | | | | | | | | | | | | |
| Total Non-control/Non-affiliate Investments | | | | | | | | | | | | $ | 305,596 |
| | $ | 304,663 |
|
Affiliate Investments6 | | | | | | | | | | | |
|
| |
|
|
CHANDLER SIGNS, LLC13 | | Senior subordinated debt | | Business services | | 12.00% / 1.00% PIK | | 7/4/2021 | | $ | 4,557 |
| | $ | 4,512 |
| | $ | 4,480 |
|
| | | 1,500,000 units of Class A-1 common stock9 | | | | — | | — | | — |
| | 1,500 |
| | 1,937 |
|
| | | | | | | | | | | | | 6,012 |
| | 6,417 |
|
DYNAMIC COMMUNITIES, LLC13 | | Revolving Loan10 | | Business services | | L+8.00% (Floor 1.00%) | | 7/17/2023 | | — |
| | (4 | ) | | — |
|
| | | First Lien | | | | L+8.00% (Floor 1.00%)/M, Current Coupon 10.59% | | 7/17/2023 | | 11,060 |
| | 10,863 |
| | 10,972 |
|
| | | 2,000,000 Preferred Units9 | | | | — | | — | | — |
| | 2,000 |
| | 2,849 |
|
| | | | | | | | | | | | | 12,859 |
| | 13,821 |
|
| | | | | | | | | | | | | | | | | | | | | | | | | | | | | | | | | | | | | | | | | | | | | | | | | | |
| CAPITAL SOUTHWEST CORPORATION AND SUBSIDIARIES |
| CONSOLIDATED SCHEDULE OF INVESTMENTS |
| March 31, 2022 |
| | | | | | | | | | | | | | | | |
Portfolio Company1,18 | | Type of Investment2 | | Industry | | Current Interest Rate3 | | Acquisition Date14 | | Maturity | | Principal | | Cost12,17 | | Fair Value4 |
| LASH OPCO, LLC | | Revolving Loan10 | | Consumer products & retail | | L+7.00% (Floor 1.00%) | | 12/29/2021 | | 9/18/2025 | | — | | | (10) | | | — | |
| | First Lien | | | | L+7.00% (Floor 1.00%)/M, Current Coupon 8.01% | | 12/29/2021 | | 3/18/2026 | | 6,484 | | | 6,345 | | | 6,341 | |
| | Delayed Draw Term Loan10 | | | | L+7.00% (Floor 1.00%)/M, Current Coupon 8.01% | | 12/29/2021 | | 3/18/2026 | | 4,154 | | | 4,034 | | | 4,063 | |
| | | | | | | | | | | | | | 10,369 | | | 10,404 | |
| LGM PHARMA, LLC | | First Lien | | Healthcare products | | L+8.50% (Floor 1.00%), 2.00% PIK/Q, Current Coupon 11.50% | | 11/15/2017 | | 11/15/2023 | | 11,422 | | | 11,346 | | | 10,851 | |
| | Delayed Draw Term Loan | | | | L+10.00% (Floor 1.00%), 2.00% PIK/Q, Current Coupon 13.00% | | 7/24/2020 | | 11/15/2023 | | 2,488 | | | 2,463 | | | 2,388 | |
| | Unsecured convertible note9,13 | | | | 25.00% PIK | | 12/21/2021 | | 12/31/2024 | | 88 | | | 88 | | | 88 | |
| | 142,278.89 units of Class A common stock9,13 | | | | — | | 11/15/2017 | | — | | — | | | 1,600 | | | 376 | |
| | | | | | | | | | | | | | 15,497 | | | 13,703 | |
| LLFLEX, LLC | | First Lien15 | | Containers & packaging | | L+9.00% (Floor 1.00%)/Q, Current Coupon 10.00% | | 8/16/2021 | | 8/14/2026 | | 10,945 | | | 10,723 | | | 10,671 | |
| MAKO STEEL LP | | Revolving Loan10 | | Business services | | L+7.25% (Floor (0.75%)/Q, Current Coupon 8.23% | | 3/15/2021 | | 3/13/2026 | | 943 | | | 913 | | | 910 | |
| | First Lien | | | | L+7.25% (Floor (0.75%)/Q, Current Coupon 8.38% | | 3/15/2021 | | 3/13/2026 | | 8,032 | | | 7,900 | | | 7,751 | |
| | | | | | | | | | | | | | 8,813 | | | 8,661 | |
| MERCURY ACQUISITION 2021, LLC (DBA TELE-TOWN HALL) | | First Lien | | Telecommunications | | L+8.00% (Floor 1.00%)/Q, Current Coupon 9.00% | | 12/6/2021 | | 12/7/2026 | | 12,469 | | | 12,232 | | | 12,232 | |
| | Second Lien | | | | L+11.00% (Floor 1.00%)/Q, Current Coupon 12.00% | | 12/6/2021 | | 12/7/2026 | | 3,292 | | | 3,229 | | | 3,229 | |
| | 2,089,599 Series A units9,13 | | | | — | | 12/6/2021 | | — | | — | | | — | | | 1,536 | |
| | | | | | | | | | | | | | 15,461 | | | 16,997 | |
|
| | | | | | | | | | | | | | | | | | | | | |
| CAPITAL SOUTHWEST CORPORATION AND SUBSIDIARIES |
| CONSOLIDATED SCHEDULE OF INVESTMENTS |
| March 31, 2019 |
| | | | | | | Current | | | | | | | | |
| | | Type of | | | | Interest | | | | | | | | Fair |
Portfolio Company1 | | Investment2,14 | | Industry | | Rate3 | | Maturity | | Principal | | Cost | | Value4 |
ITA HOLDINGS GROUP, LLC13 | | Revolving Loan10 | | Transportation & logistics | | L+9.00% (Floor 1.00%)/Q, 1.00% PIK, Current Coupon 12.60% | | 2/14/2023 | | 2,000 |
| | 1,960 |
| | 2,000 |
|
| | | First Lien - Term Loan | | | | L+8.00% (Floor 1.00%)/Q, 1.00% PIK, Current Coupon 11.60% | | 2/14/2023 | | 7,659 |
| | 7,533 |
| | 7,475 |
|
| | | First Lien - Term B Loan | | | | L+11.00% (Floor 1.00%)/Q, 1.00% PIK, Current Coupon 14.60% | | 2/14/2023 | | 3,830 |
| | 3,762 |
| | 3,829 |
|
| | | First Lien - PIK Note A | | | | 10.00% PIK | | 2/14/2023 | | 2,250 |
| | 1,692 |
| | 2,005 |
|
| | | First Lien - PIK Note B | | | | 10.00% PIK | | 2/14/2023 | | 89 |
| | 89 |
| | 79 |
|
| | | Warrants (Expiration - March 29, 2029)9 | | | | — | | — | | — |
| | 538 |
| | 1,557 |
|
| | | 9.25% Class A Membership Interest9 | | | | — | | — | | — |
| | 1,500 |
| | 923 |
|
| | | | | | | | | | | | | 17,074 |
| | 17,868 |
|
| ROSELAND MANAGEMENT, LLC | | Revolving Loan10 | | Healthcare services | | L+7.00% (Floor 2.00%) | | 11/9/2023 | | — |
| | (32 | ) | | — |
|
| | | First Lien | | | | L+7.00% (Floor 2.00%)/Q, Current Coupon 9.80% | | 11/9/2023 | | 10,474 |
| | 10,302 |
| | 10,474 |
|
| | | 10,000 Class A Units | | | | — | | — | | — |
| | 1,000 |
| | 1,487 |
|
| | | | | | | | | | | | | 11,270 |
| | 11,961 |
|
| SIMR, LLC | | First Lien | | Healthcare services | | L+9.00% (Floor 2.00%)/M, Current Coupon 11.62% | | 9/7/2023 | | 11,542 |
| | 11,332 |
| | 11,403 |
|
| | | 5,724,000 Class B Common Units | | | | — | | — | | — |
| | 5,724 |
| | 5,724 |
|
| | | | | | | | | | | | | 17,056 |
| | 17,127 |
|
| ZENFOLIO INC. | | Revolving Loan10 | | Business services | | L+9.00% (Floor 1.00%) | | 7/17/2022 | | — |
| | (13 | ) | | — |
|
| | | First Lien | | | | L+9.00% (Floor 1.00%)/Q, Current Coupon 11.60% | | 7/17/2022 | | 13,298 |
| | 13,119 |
| | 13,165 |
|
| | | 190 shares of common stock | | | | — | | — | | — |
| | 1,900 |
| | 546 |
|
| | | | | | | | | | | | | 15,006 |
| | 13,711 |
|
| | | | | | | | | | | | | | | |
| | | | | | | | | | | | | | | | | | | | | | | | | | | | | | | | | | | | | | | | | | | | | | | | | | |
| CAPITAL SOUTHWEST CORPORATION AND SUBSIDIARIES |
| CONSOLIDATED SCHEDULE OF INVESTMENTS |
| March 31, 2022 |
| | | | | | | | | | | | | | | | |
Portfolio Company1,18 | | Type of Investment2 | | Industry | | Current Interest Rate3 | | Acquisition Date14 | | Maturity | | Principal | | Cost12,17 | | Fair Value4 |
| MUENSTER MILLING COMPANY, LLC | | Revolving Loan10 | | Food, agriculture & beverage | | L+7.25%(Floor 1.00%) | | 8/10/2021 | | 8/10/2026 | | — | | | (87) | | | — | |
| | First Lien | | | | L+7.25% (Floor 1.00%)/Q, Current Coupon 8.25% | | 8/10/2021 | | 8/10/2026 | | 12,000 | | | 11,785 | | | 12,000 | |
| | Delayed Draw Term Loan10 | | | | L+7.25% (Floor 1.00%) | | 8/10/2021 | | 8/10/2026 | | — | | | (52) | | | — | |
| | | | | | | | | | | | | | 11,646 | | | 12,000 | |
| NATIONAL CREDIT CARE, LLC | | First Lien - Term Loan A | | Consumer services | | L+6.50% (Floor 1.00%)/Q, Current Coupon 7.50% | | 12/23/2021 | | 12/23/2026 | | 11,250 | | | 11,035 | | | 11,171 | |
| | First Lien - Term Loan B | | | | L+7.50% (Floor 1.00%)/Q, Current Coupon 8.50% | | 12/23/2021 | | 12/23/2026 | | 11,250 | | | 11,035 | | | 11,171 | |
| | 191,049.33 Class A-3 Preferred units9,13 | | | | — | | 3/17/2022 | | — | | — | | | 2,000 | | | 2,000 | |
| | | | | | | | | | | | | | 24,070 | | | 24,342 | |
| NEUROPSYCHIATRIC HOSPITALS, LLC | | Revolving Loan10 | | Healthcare services | | L+8.00% (Floor 1.00%)/Q, Current Coupon 9.00% | | 5/14/2021 | | 5/14/2026 | | 4,400 | | | 4,317 | | | 4,299 | |
| | First Lien | | | | L+8.00%(Floor 1.00%)/Q, Current Coupon 9.00% | | 5/14/2021 | | 5/14/2026 | | 14,913 | | | 14,657 | | | 14,569 | |
| | Delayed Draw Term Loan10 | | | | L+8.00% (Floor 1.00%) | | 5/14/2021 | | 5/14/2026 | | — | | | (82) | | | — | |
| | | | | | | | | | | | | | 18,892 | | | 18,868 | |
| NINJATRADER, INC. | | Revolving Loan10 | | Financial services | | L+6.25% (Floor 1.00%) | | 12/18/2019 | | 12/18/2024 | | — | | | (4) | | | — | |
| | First Lien | | | | L+6.25%(Floor 1.00%)/Q, Current Coupon 7.25% | | 12/18/2019 | | 12/18/2024 | | 23,150 | | | 22,719 | | | 23,150 | |
| | Delayed Draw Term Loan10 | | | | L+6.25% (Floor 1.00%) | | 12/31/2020 | | 12/18/2024 | | — | | | (45) | | | — | |
| | 2,000,000 Preferred Units9,11,13 | | | | — | | 12/18/2019 | | — | | — | | | 2,000 | | | 9,566 | |
| | | | | | | | | | | | | | 24,670 | | | 32,716 | |
| NWN PARENT HOLDINGS, LLC | | Revolving Loan10 | | Software & IT services | | L+6.50% (Floor 1.00%)/Q, Current Coupon 7.50% | | 5/7/2021 | | 5/7/2026 | | 420 | | 390 | | | 412 | |
| | First Lien | | | | L+6.50% (Floor 1.00%)/Q, Current Coupon 7.50% | | 5/7/2021 | | 5/7/2026 | | 13,066 | | | 12,844 | | | 12,818 | |
| | | | | | | | | | | | | | 13,234 | | | 13,230 | |
| RESEARCH NOW GROUP, INC. | | Second Lien | | Business services | | L+9.50% (Floor 1.00%)/M, Current Coupon 10.50% | | 12/8/2017 | | 12/20/2025 | | 10,500 | | | 10,066 | | | 10,217 | |
|
| | | | | | | | | | | | | | | | | | | | | |
| CAPITAL SOUTHWEST CORPORATION AND SUBSIDIARIES |
| CONSOLIDATED SCHEDULE OF INVESTMENTS |
| March 31, 2019 |
| | | | | | | Current | | | | | | | | |
| | | Type of | | | | Interest | | | | | | | | Fair |
Portfolio Company1 | | Investment2,14 | | Industry | | Rate3 | | Maturity | | Principal | | Cost | | Value4 |
| Total Affiliate Investments | | | | | | | | | | | | $ | 79,277 |
| | $ | 80,905 |
|
| | | | | | | | | | | | | | | |
Control Investments7 | | | | | | | | | | | | | | |
I-45 SLF LLC9,11 | | 80% LLC equity interest | | Multi-sector holdings | | — | | — | | — |
| | $ | 68,000 |
| | $ | 65,743 |
|
MEDIA RECOVERY, INC.11 | | 800,000 shares of Series A convertible preferred stock | | Industrial products | | — | | — | | — |
| | 800 |
| | 7,795 |
|
| | | 4,000,002 shares of common stock | | | | — | | — | | — |
| | 4,615 |
| | 44,965 |
|
| | | | | | | | | | | | | 5,415 |
| | 52,760 |
|
PRISM SPECTRUM HOLDINGS, LLC13 | | First Lien | | Environmental services | | L+9.50% (Floor 2.25%)/M, Current Coupon 12.12% | | 2/6/2023 | | 13,461 |
| | 13,229 |
| | 13,461 |
|
| | | 96,498.32 Class A units9 | | | | — | | — | | — |
| | 6,538 |
| | 6,539 |
|
| | | | | | | | | | | | | 19,767 |
| | 20,000 |
|
| | | | | | | | | | | | | | | |
| Total Control Investments | | | | | | | | | | | | 93,182 |
| | 138,503 |
|
| | | | | | | | | | | | | | | |
TOTAL INVESTMENTS12 | | | | | | | | | | | | $ | 478,055 |
| | $ | 524,071 |
|
| | | | | | | | | | | | | | | | | | | | | | | | | | | | | | | | | | | | | | | | | | | | | | | | | | |
| CAPITAL SOUTHWEST CORPORATION AND SUBSIDIARIES |
| CONSOLIDATED SCHEDULE OF INVESTMENTS |
| March 31, 2022 |
| | | | | | | | | | | | | | | | |
Portfolio Company1,18 | | Type of Investment2 | | Industry | | Current Interest Rate3 | | Acquisition Date14 | | Maturity | | Principal | | Cost12,17 | | Fair Value4 |
| ROOF OPCO, LLC | | Revolving Loan10 | | Consumer services | | L+6.00%(Floor 1.00%) | | 8/27/2021 | | 8/27/2026 | | — | | | (53) | | | — | |
| | First Lien | | | | L+6.00% (Floor 1.00%)/Q, Current Coupon 7.00% | | 8/27/2021 | | 8/27/2026 | | 11,000 | | | 10,802 | | | 10,791 | |
| | Delayed Draw Term Loan10 | | | | L+6.00% (Floor 1.00%)/Q, Current Coupon 7.00% | | 8/27/2021 | | 8/27/2026 | | 7,578 | | | 7,394 | | | 7,578 | |
| | | | | | | | | | | | | | 18,143 | | | 18,369 | |
| RTIC SUBSIDIARY HOLDINGS, LLC | | Revolving Loan | | Consumer products & retail | | L+7.75% (Floor 1.25%)/Q, Current Coupon 9.00% | | 9/1/2020 | | 9/1/2025 | | 1,370 | | | 1,357 | | | 1,370 | |
| | First Lien | | | | L+7.75% (Floor 1.25%)/Q, Current Coupon 9.00% | | 9/1/2020 | | 9/1/2025 | | 6,933 | | | 6,870 | | | 6,933 | |
| | | | | | | | | | | | | | 8,227 | | | 8,303 | |
| SCRIP, INC. | | First Lien8 | | Healthcare products | | L+9.43% (Floor 2.00%)/M, Current Coupon 11.43% | | 3/21/2019 | | 3/21/2024 | | 16,750 | | | 16,521 | | | 16,750 | |
| | 100 shares of common stock | | | | — | | 3/21/2019 | | — | | — | | | 1,000 | | | 1,601 | |
| | | | | | | | | | | | | | 17,521 | | | 18,351 | |
SHEARWATER RESEARCH, INC.9 | | Revolving Loan10 | | Consumer products & retail | | L+6.25% (Floor 1.00%) | | 4/30/2021 | | 4/30/2026 | | — | | | (40) | | | — | |
| | First Lien | | | | L+6.25% (Floor 1.00%)/Q, Current Coupon 7.25% | | 4/30/2021 | | 4/30/2026 | | 13,794 | | | 13,561 | | | 13,545 | |
| | Delayed Draw Term Loan10 | | | | L+6.25% (Floor 1.00%) | | 4/30/2021 | | 4/30/2026 | | — | | | (27) | | | — | |
| | 1,200,000 Class A Preferred Units | | | | — | | 4/30/2021 | | — | | — | | | 978 | | | 979 | |
| | 40,000 Class A Common Units | | | | — | | 4/30/2021 | | — | | — | | | 33 | | | 33 | |
| | | | | | | | | | | | | | 14,505 | | | 14,557 | |
| SIB HOLDINGS, LLC | | Revolving Loan10 | | Business services | | L+6.00% (Floor 1.00%)/M, Current Coupon 7.00% | | 10/29/2021 | | 10/29/2026 | | 47 | | | 37 | | | 46 | |
| | First Lien | | | | L+6.00% (Floor 1.00%)/M, Current Coupon 7.00% | | 10/29/2021 | | 10/29/2026 | | 7,427 | | | 7,324 | | | 7,323 | |
| | Delayed Draw Term Loan10 | | | | L+6.00% (Floor 1.00%) | | 10/29/2021 | | 10/29/2026 | | — | | | (9) | | | — | |
| | 238,095.24 Common Units9,13 | | | | — | | 10/29/2021 | | — | | — | | | 500 | | | 500 | |
| | | | | | | | | | | | | | 7,852 | | | 7,869 | |
98
| |
1
| All debt investments are income-producing, unless otherwise noted. Equity investments and warrants are non-income producing, unless otherwise noted. |
| |
2
| All of the Company’s investments, unless otherwise noted, are encumbered as security for the Company’s senior secured credit facility. |
| |
3
| The majority of investments bear interest at a rate that may be determined by reference to London Interbank Offered Rate (“LIBOR” or “L”) or Prime (“P”) and reset daily (D), monthly (M), quarterly (Q), or semiannually (S). For each the Company has provided the spread over LIBOR or Prime and the current contractual interest rate in effect at March 31, 2019. Certain investments are subject to a LIBOR or Prime interest rate floor. Certain investments, as noted, accrue payment-in-kind ("PIK") interest. |
| |
4
| The Company's investment portfolio is comprised entirely of privately held debt and equity securities for which quoted prices falling within the categories of Level 1 and Level 2 inputs are not available. Therefore, the Company values all of its portfolio investments at fair value, as determined in good faith by the Board of Directors, using significant unobservable Level 3 inputs. Refer to Note 4 for further discussion. |
| |
5
| Non-Control/Non-Affiliate investments are generally defined by the Investment Company Act of 1940 (the “1940 Act”) as investments that are neither control investments nor affiliate investments. At March 31, 2019, approximately 58.2% of the Company’s investment assets were non-control/non-affiliate investments. The fair value of these investments as a percent of net assets is 93.5%. |
| |
6
| Affiliate investments are generally defined by the 1940 Act as investments in which between 5% and 25% of the voting securities are owned and the investments are not classified as control investments. At March 31, 2019, approximately 15.4% of the Company’s investment assets were affiliate investments. The fair value of these investments as a percent of net assets is 24.8%. |
| |
7
| Control investments are generally defined by the 1940 Act as investments in which more than 25% of the voting securities are owned. At March 31, 2019, approximately 26.4% of the Company’s investment assets were control investments. The fair value of these investments as a percent of net assets is 42.5%. |
| |
8
| The investment is structured as a first lien last out term loan. |
| |
9
| Indicates assets that are considered "non-qualifying assets” under section 55(a) of the 1940 Act. Qualifying assets must represent at least 70% of total assets at the time of acquisition of any additional non-qualifying assets. As of March 31, 2019, approximately 16.1% of the Company's investment assets are non-qualifying assets. |
| |
10
| The investment has an unfunded commitment as of March 31, 2019. Refer to Note 12 - Commitments and Contingencies for further discussion. |
| |
11
| Income producing through dividends or distributions. |
| |
12
| As of March 31, 2019, the cumulative gross unrealized appreciation for federal income tax purposes is approximately $56.6 million; cumulative gross unrealized depreciation for federal income tax purposes is $11.6 million. Cumulative net unrealized appreciation is $45.0 million, based on a tax cost of $477.8 million. |
| |
13
| ASC Ortho Management Company, LLC common units, Danforth Advisors, LLC common units, American Nuts Operations LLC Class A common stock, LGM Pharma, LLC Class A common stock, Tax Advisors Group, LLC Class A units, Chandler Signs, LP Class A-1 common stock, Dynamic Communities, LLC Preferred units, ITA Holdings Group, LLC membership interest, and Prism Spectrum Holdings LLC Class A units are held through a wholly-owned taxable subsidiary. |
| |
14
| The Company generally acquires its investments in private transactions exempt from registration under the Securities Act of 1933, as amended (the "Securities Act"). These investments are generally subject to certain limitations on resale, and may be deemed "restricted securities" under the Securities Act. |
| |
15
| The investment is structured as a split lien term loan, which provides the Company with a first lien priority on certain assets of the obligor and a second lien priority on different assets of the obligor. |
| |
16
| Investment was on non-accrual status as of March 31, 2019, meaning the Company has ceased to recognize interest income on the investment. The current interest rate and terms disclosed on investments on non-accrual reflect the terms at the time of placement on non-accrual status. |
| | | | | | | | | | | | | | | | | | | | | | | | | | | | | | | | | | | | | | | | | | | | | | | | | | |
| CAPITAL SOUTHWEST CORPORATION AND SUBSIDIARIES |
| CONSOLIDATED SCHEDULE OF INVESTMENTS |
| March 31, 2022 |
| | | | | | | | | | | | | | | | |
Portfolio Company1,18 | | Type of Investment2 | | Industry | | Current Interest Rate3 | | Acquisition Date14 | | Maturity | | Principal | | Cost12,17 | | Fair Value4 |
| SOUTH COAST TERMINALS, LLC | | Revolving Loan10 | | Specialty chemicals | | L+6.25%(Floor 1.00%) | | 12/13/2021 | | 12/11/2026 | | — | | | (36) | | | — | |
| | First Lien | | | | L+6.25% (Floor 1.00%)/M, Current Coupon 7.25% | | 12/13/2021 | | 12/11/2026 | | 18,019 | | | 17,676 | | | 17,749 | |
| | | | | | | | | | | | | | 17,640 | | | 17,749 | |
| SPOTLIGHT AR, LLC | | Revolving Loan10 | | Business services | | L+7.00% (Floor 1.00%) | | 12/8/2021 | | 6/8/2026 | | — | | | (37) | | | — | |
| | First Lien | | | | L+7.00% (Floor 1.00%)/Q, Current Coupon 8.00% | | 12/8/2021 | | 6/8/2026 | | 7,500 | | | 7,359 | | | 7,358 | |
| | 750 Common Units9,13 | | | | — | | 12/8/2021 | | — | | — | | | 750 | | | 750 | |
| | | | | | | | | | | | | | 8,072 | | | 8,108 | |
| STUDENT RESOURCE CENTER LLC | | Revolving Loan10 | | Education | | L+8.00% (Floor 1.00%) | | 6/25/2021 | | 6/25/2026 | | — | | | (23) | | | — | |
| | First Lien | | | | L+8.00% (Floor 1.00%)/Q, Current Coupon 9.01% | | 6/25/2021 | | 6/25/2026 | | 18,823 | | | 18,489 | | | 18,597 | |
| | 2,000 Preferred Units9,13 | | | | — | | 6/25/2021 | | — | | — | | | 2,000 | | | 1,819 | |
| | | | | | | | | | | | | | 20,466 | | | 20,416 | |
| SYSTEC CORPORATION (DBA INSPIRE AUTOMATION) | | Revolving Loan10 | | Business services | | L+7.50% (Floor 1.00%)/Q, Current Coupon 8.50% | | 8/13/2021 | | 8/13/2025 | | 850 | | | 816 | | | 833 | |
| | First Lien | | | | L+7.50% (Floor 1.00%)/Q, Current Coupon 8.50% | | 8/13/2021 | | 8/13/2025 | | 9,000 | | | 8,844 | | | 8,820 | |
| | Delayed Draw Term Loan10 | | | | L+7.50% (Floor 1.00%) | | 8/13/2021 | | 8/13/2025 | | — | | | (25) | | | — | |
| | | | | | | | | | | | | | 9,635 | | | 9,653 | |
| THE PRODUCTO GROUP, LLC | | First Lien | | Industrial products | | L+9.00% (Floor 1.00%)/Q, Current Coupon 10.00% | | 12/31/2021 | | 12/31/2026 | | 12,644 | | | 12,401 | | | 12,391 | |
| | 1,500,000 Class A units9,13 | | | | — | | 12/31/2021 | | — | | — | | | 1,500 | | | 1,500 | |
| | | | | | | | | | | | | | 13,901 | | | 13,891 | |
| TRAFERA, LLC (FKA TRINITY 3, LLC) | | First Lien15 | | Technology products & components | | L+7.75%(Floor 1.00%)/Q, Current Coupon 8.75% | | 9/30/2020 | | 9/30/2025 | | 9,875 | | | 9,764 | | | 9,835 | |
| | Unsecured convertible note9,13 | | | | 10.00% PIK | | 2/7/2022 | | 3/31/2026 | | 84 | | | 84 | | | 84 | |
| | 896.43 Class A units9,11,13 | | | | — | | 11/15/2019 | | — | | — | | | 1,205 | | | 3,000 | |
| | | | | | | | | | | | | | 11,053 | | | 12,919 | |
| USA DEBUSK, LLC | | First Lien | | Industrial services | | L+5.75% (Floor 1.00%)/M, Current Coupon 6.75% | | 2/25/2020 | | 9/8/2026 | | 11,614 | | | 11,451 | | | 11,614 | |
| | | | | | | | | | | | | | | | | | | | | | | | | | | | | | | | | | | | | | | | | | | | | | | | | | |
| CAPITAL SOUTHWEST CORPORATION AND SUBSIDIARIES |
| CONSOLIDATED SCHEDULE OF INVESTMENTS |
| March 31, 2022 |
| | | | | | | | | | | | | | | | |
Portfolio Company1,18 | | Type of Investment2 | | Industry | | Current Interest Rate3 | | Acquisition Date14 | | Maturity | | Principal | | Cost12,17 | | Fair Value4 |
| VISTAR MEDIA INC. | | 171,617 shares of Series A preferred stock | | Media & marketing | | — | | 4/3/2019 | | — | | — | | | 1,874 | | | 9,273 | |
| VTX HOLDINGS, INC. (DBA VERTEX ONE) | | 1,597,707 Series A Preferred units | | Software & IT services | | — | | 7/23/2019 | | — | | — | | | 1,598 | | | 2,082 | |
| WALL STREET PREP, INC. | | Revolving Loan10 | | Education | | L+7.00% (Floor 1.00%) | | 7/19/2021 | | 7/20/2026 | | — | | | (17) | | | — | |
| | First Lien | | | | L+7.00% (Floor 1.00%)/Q, Current Coupon 8.00% | | 7/19/2021 | | 7/20/2026 | | 10,863 | | | 10,670 | | | 10,656 | |
| | 1,000,000 Class A-1 Preferred Shares | | | | — | | 7/19/2021 | | — | | — | | | 1,000 | | | 1,000 | |
| | | | | | | | | | | | | | 11,653 | | | 11,656 | |
| WELL-FOAM, INC. | | Revolving Loan10 | | Energy services (upstream) | | L+8.50% (Floor 1.00%) | | 9/9/2021 | | 9/9/2026 | | — | | | (83) | | | — | |
| | First Lien | | | | L+8.50% (Floor 1.00%)/Q, Current Coupon 9.50% | | 9/9/2021 | | 9/9/2026 | | 17,910 | | | 17,583 | | | 17,910 | |
| | | | | | | | | | | | | | 17,500 | | | 17,910 | |
| WINTER SERVICES OPERATIONS, LLC | | Revolving Loan10 | | Business services | | L+7.00% (Floor 1.00%)/Q, Current Coupon 8.00% | | 11/19/2021 | | 11/19/2026 | | 2,444 | | | 2,362 | | | 2,386 | |
| | First Lien | | | | L+7.00% (Floor 1.00%)/Q, Current Coupon 8.00% | | 11/19/2021 | | 11/19/2026 | | 20,000 | | | 19,624 | | | 19,520 | |
| | Delayed Draw Term Loan10 | | | | L+7.00% (Floor 1.00%) | | 11/19/2021 | | 11/19/2026 | | — | | | (41) | | | — | |
| | | | | | | | | | | | | | 21,945 | | | 21,906 | |
| ZENFOLIO INC. | | Revolving Loan10 | | Business services | | L+9.00% (Floor 1.00%)/Q, Current Coupon 10.00% | | 7/17/2017 | | 7/17/2023 | | 1,000 | | | 996 | | | 995 | |
| | First Lien | | | | L+9.00% (Floor 1.00%)/Q, Current Coupon 10.00% | | 7/17/2017 | | 7/17/2023 | | 18,915 | | | 18,785 | | | 18,820 | |
| | | | | | | | | | | | | | 19,781 | | | 19,815 | |
| ZIPS CAR WASH, LLC | | Delayed Draw Term Loan - A | | Consumer services | | L+7.25% (Floor 1.00%)/Q, Current Coupon 8.25% | | 2/11/2022 | | 3/1/2024 | | 16,000 | | | 15,691 | | | 15,691 | |
| | Delayed Draw Term Loan - B10 | | | | L+7.25% (Floor 1.00%)/Q, Current Coupon 8.26% | | 2/11/2022 | | 3/1/2024 | | 199 | | | 159 | | | 159 | |
| | | | | | | | | | | | | | 15,850 | | | 15,850 | |
| Total Non-control/Non-affiliate Investments (177.5% of net assets at fair value) | | | | | | | | | | $ | 721,392 | | | $ | 747,132 | |
| | | | | | | | | | | | | | | | | | | | | | | | | | | | | | | | | | | | | | | | | | | | | | | | | | |
| CAPITAL SOUTHWEST CORPORATION AND SUBSIDIARIES |
| CONSOLIDATED SCHEDULE OF INVESTMENTS |
| March 31, 2022 |
| | | | | | | | | | | | | | | | |
Portfolio Company1,18 | | Type of Investment2 | | Industry | | Current Interest Rate3 | | Acquisition Date14 | | Maturity | | Principal | | Cost12,17 | | Fair Value4 |
Affiliate Investments6 | | | | | | | | | | | | | | | | |
| AIR CONDITIONING SPECIALIST, INC. | | Revolving Loan10 | | Consumer services | | L+7.25% (Floor 1.00%) | | 11/9/2021 | | 11/9/2026 | | $ | — | | | $ | (18) | | | $ | — | |
| | First Lien | | | | L+7.25% (Floor 1.00%)/Q, Current Coupon 8.25% | | 11/9/2021 | | 11/9/2026 | | 12,778 | | | 12,535 | | | 12,535 | |
| | 623,693.55 Preferred Units9,13 | | | | — | | 11/9/2021 | | — | | — | | | 624 | | | 634 | |
| | | | | | | | | | | | | | 13,141 | | | 13,169 | |
| CATBIRD NYC, LLC | | Revolving Loan10 | | Consumer products & retail | | L+7.00% (Floor 1.00%) | | 10/15/2021 | | 10/15/2026 | | — | | | (73) | | | — | |
| | First Lien | | | | L+7.00% (Floor 1.00%)/Q, Current Coupon 8.00% | | 10/15/2021 | | 10/15/2026 | | 15,900 | | | 15,606 | | | 15,884 | |
| | 1,000,000 Class A units9,13 | | | | — | | 10/15/2021 | | — | | — | | | 1,000 | | | 1,221 | |
| | 500,000 Class B units9,10,13 | | | | — | | 10/15/2021 | | — | | — | | | 500 | | | 572 | |
| | | | | | | | | | | | | | 17,033 | | | 17,677 | |
| CENTRAL MEDICAL SUPPLY LLC | | Revolving Loan10 | | Healthcare services | | L+9.00% (Floor 1.75%)/Q, Current Coupon 10.75% | | 5/22/2020 | | 5/22/2025 | | 300 | | | 281 | | | 290 | |
| | First Lien | | | | L+9.00% (Floor 1.75%)/Q, Current Coupon 10.75% | | 5/22/2020 | | 5/22/2025 | | 7,500 | | | 7,398 | | | 7,260 | |
| | Delayed Draw Capex Term Loan10 | | | | L+9.00% (Floor 1.75%)/Q, Current Coupon 10.75% | | 5/22/2020 | | 5/22/2025 | | 100 | | | 81 | | | 97 | |
| | 1,380,500 Preferred Units9,13 | | | | — | | 5/22/2020 | | — | | — | | | 976 | | | 641 | |
| | | | | | | | | | | | | | 8,736 | | | 8,288 | |
| CHANDLER SIGNS, LLC | | 1,500,000 units of Class A-1 common stock9,13 | | Business services | | — | | 1/4/2016 | | — | | — | | | 1,500 | | | 924 | |
| DELPHI BEHAVIORAL HEALTH GROUP, LLC | | First Lien | | Healthcare services | | L+9.50% PIK (Floor 1.00%)/Q, Current Coupon 10.50% | | 4/8/2020 | | 4/7/2023 | | 1,541 | | | 1,541 | | | 1,402 | |
| | First Lien | | | | L+9.00% PIK (Floor 1.00%)/Q, Current Coupon 10.00% | | 4/8/2020 | | 4/7/2023 | | 1,732 | | | 1,732 | | | 1,472 | |
| | Protective Advance | | | | L+11.50% PIK (Floor 1.00%)/Q, Current Coupon 12.50% | | 8/31/2021 | | 4/7/2023 | | 526 | | | 526 | | | 526 | |
| | 1,681.04 Common Units | | | | — | | 4/8/2020 | | — | | — | | | 3,615 | | | 2,460 | |
| | | | | | | | | | | | | | 7,414 | | | 5,860 | |
| | | | | | | | | | | | | | | | | | | | | | | | | | | | | | | | | | | | | | | | | | | | | | | | | | |
| CAPITAL SOUTHWEST CORPORATION AND SUBSIDIARIES |
| CONSOLIDATED SCHEDULE OF INVESTMENTS |
| March 31, 2022 |
| | | | | | | | | | | | | | | | |
Portfolio Company1,18 | | Type of Investment2 | | Industry | | Current Interest Rate3 | | Acquisition Date14 | | Maturity | | Principal | | Cost12,17 | | Fair Value4 |
| DYNAMIC COMMUNITIES, LLC | | Revolving Loan10 | | Business services | | L+8.50% (Floor 1.00%) | | 7/17/2018 | | 7/17/2023 | | — | | | (1) | | | — | |
| | First Lien | | | | L+8.50% (Floor 1.00%)/Q, Current Coupon 9.51% | | 7/17/2018 | | 7/17/2023 | | 11,221 | | | 11,147 | | | 10,323 | |
| | Senior subordinated debt | | | | 25.00% PIK | | 12/4/2020 | | 1/16/2024 | | 650 | | | 650 | | | 650 | |
| | 2,000,000 Preferred Units9,13 | | | | — | | 7/17/2018 | | — | | — | | | 2,000 | | | 1,274 | |
| | | | | | | | | | | | | | 13,796 | | | 12,247 | |
| GRAMMATECH, INC. | | Revolving Loan10 | | Software & IT services | | L+9.50% (Floor 2.00%) | | 11/1/2019 | | 11/1/2024 | | — | | | (22) | | | — | |
| | First Lien | | | | L+9.50% (Floor 2.00%)/Q, Current Coupon 11.50% | | 11/1/2019 | | 11/1/2024 | | 11,500 | | | 11,384 | | | 9,775 | |
| | 1,000 Class A units | | | | — | | 11/1/2019 | 0 | — | | — | | | 1,000 | | | 674 | |
| | 56.259 Class A-1 units | | | | — | | 1/10/2022 | | — | | — | | | 56 | | | 38 | |
| | | | | | | | | | | | | | 12,418 | | | 10,487 | |
| ITA HOLDINGS GROUP, LLC | | Revolving Loan10 | | Transportation & logistics | | L+9.00% (Floor 1.00%)/Q, Current Coupon 10.00% | | 2/14/2018 | | 2/14/2023 | | 750 | | | 733 | | | 750 | |
| | First Lien - Term Loan | | | | L+8.00% (Floor 1.00%)/Q, Current Coupon 9.00% | | 2/14/2018 | | 2/14/2023 | | 10,071 | | | 10,041 | | | 10,041 | |
| | First Lien - Term B Loan | | | | L+11.00% (Floor 1.00%)/Q, Current Coupon 12.00% | | 6/5/2018 | | 2/14/2023 | | 5,036 | | | 5,010 | | | 5,061 | |
| | First Lien - PIK Note A | | | | 10.00% PIK | | 3/29/2019 | | 2/14/2023 | | 2,959 | | | 2,721 | | | 2,959 | |
| | First Lien - PIK Note B | | | | 10.00% PIK | | 3/29/2019 | | 2/14/2023 | | 117 | | | 117 | | | 117 | |
| | Warrants (Expiration - March 29, 2029)9,13 | | | | — | | 3/29/2019 | | — | | — | | | 538 | | | 3,199 | |
| | 9.25% Class A Membership Interest9,11,13 | | | | — | | 2/14/2018 | | — | | — | | | 1,500 | | | 3,063 | |
| | | | | | | | | | | | | | 20,660 | | | 25,190 | |
| LIGHTING RETROFIT INTERNATIONAL, LLC (DBA ENVOCORE) | | Revolving Loan10 | | Environmental services | | 7.50% | | 12/31/2021 | | 12/31/2025 | | — | | | — | | | — | |
| | First Lien | | | | 7.50% | | 12/31/2021 | | 12/31/2025 | | 5,195 | | | 5,195 | | | 4,780 | |
| | Second Lien16 | | | | 10.00% PIK | | 12/31/2021 | | 12/31/2026 | | 5,208 | | | 5,208 | | | 3,104 | |
| | 208,333.3333 Series A Preferred units9,13 | | | | — | | 12/31/2021 | | — | | — | | | — | | | — | |
| | 203,124.9999 Common units9,13 | | | | — | | 12/31/2021 | | — | | — | | | — | | | — | |
| | | | | | | | | | | | | | 10,403 | | | 7,884 | |
| | | | | | | | | | | | | | | | | | | | | | | | | | | | | | | | | | | | | | | | | | | | | | | | | | |
| CAPITAL SOUTHWEST CORPORATION AND SUBSIDIARIES |
| CONSOLIDATED SCHEDULE OF INVESTMENTS |
| March 31, 2022 |
| | | | | | | | | | | | | | | | |
Portfolio Company1,18 | | Type of Investment2 | | Industry | | Current Interest Rate3 | | Acquisition Date14 | | Maturity | | Principal | | Cost12,17 | | Fair Value4 |
| ROSELAND MANAGEMENT, LLC | | Revolving Loan10 | | Healthcare services | | L+7.00% (Floor 2.00%)/Q, Current Coupon 9.00% | | 11/9/2018 | | 11/9/2023 | | 575 | | | 564 | | | 575 | |
| | First Lien | | | | L+7.00% (Floor 2.00%)/Q, Current Coupon 9.00% | | 11/9/2018 | | 11/9/2023 | | 14,125 | | | 14,021 | | | 14,125 | |
| | 16,084 Class A Units | | | | — | | 11/9/2018 | | — | | — | | | 1,517 | | | 1,905 | |
| | | | | | | | | | | | | | 16,102 | | | 16,605 | |
| SIMR, LLC | | First Lien16 | | Healthcare services | | L+10.00%, 7.00% PIK (Floor 2.00%)/M, Current Coupon 19.00% | | 9/7/2018 | | 9/7/2023 | | 13,235 | | | 13,101 | | | 10,588 | |
| | 9,374,510.2 Class B Common Units | | | | — | | 9/7/2018 | | — | | — | | | 6,107 | | | — | |
| | 904,903.31 Class W Units | | | | — | | 2/4/2021 | | — | | — | | | — | | | — | |
| | | | | | | | | | | | | | 19,208 | | | 10,588 | |
| SONOBI, INC. | | 500,000 Class A Common Units9,13 | | Media & marketing | | — | | 9/17/2020 | | — | | — | | | 500 | | | 2,960 | |
| Total Affiliate Investments (31.3% of net assets at fair value) | | | | | | | | | | $ | 140,911 | | | $ | 131,879 | |
| | | | | | | | | | | | | | | | |
Control Investments7 | | | | | | | | | | | | | | | | |
I-45 SLF LLC9,10,11 | | 80% LLC equity interest | | Multi-sector holdings | | — | | 10/20/2015 | | — | | — | | | $ | 76,000 | | | $ | 57,603 | |
| Total Control Investments (13.7% of net assets at fair value) | | | | | | | | | | $ | 76,000 | | | $ | 57,603 | |
| | | | | | | | | | | | | | | | |
| TOTAL INVESTMENTS (222.5% of net assets at fair value) | | | | | | | | | | $ | 938,303 | | | $ | 936,614 | |
1All debt investments are income-producing, unless otherwise noted. Equity investments and warrants are non-income producing, unless otherwise noted.
2All of the Company’s investments and the investments of SBIC I (as defined below), unless otherwise noted, are pledged as collateral for the Company’s senior secured credit facility or in support of the SBA-guaranteed debentures to be issued by Capital Southwest SBIC I, LP, our wholly-owned subsidiary that operates as a small business investment company ("SBIC I"), respectively.
3The majority of investments bear interest at a rate that may be determined by reference to London Interbank Offered Rate (“LIBOR” or “L”), Secured Overnight Financing Rate ("SOFR") or Prime (“P”) and reset daily (D), monthly (M), quarterly (Q), or semiannually (S). For each investment, the Company has provided the spread over LIBOR, SOFR or Prime and the current contractual interest rate in effect at March 31, 2022. Certain investments are subject to an interest rate floor. Certain investments, as noted, accrue payment-in-kind ("PIK") interest.
4The Company's investment portfolio is comprised entirely of debt and equity securities of privately held companies for which quoted prices falling within the categories of Level 1 and Level 2 inputs are not readily available. Therefore, the Company values all of its portfolio investments at fair value, as determined in good faith by the Board of Directors, using significant unobservable Level 3 inputs. Refer to Note 4 for further discussion.
5Non-Control/Non-Affiliate investments are generally defined by the Investment Company Act of 1940, as amended (the “1940 Act”), as investments that are neither control investments nor affiliate investments. At March 31, 2022, approximately 79.8% of the Company’s investment assets were non-control/non-affiliate investments. The fair value of these investments as a percent of net assets is 177.5%.
6Affiliate investments are generally defined by the 1940 Act as investments in which between 5% and 25% of the voting securities are owned and the investments are not classified as control investments. At March 31, 2022, approximately 14.1% of the Company’s investment assets were affiliate investments. The fair value of these investments as a percent of net assets is 31.3%.
7Control investments are generally defined by the 1940 Act as investments in which more than 25% of the voting securities are owned. At March 31, 2022, approximately 6.2% of the Company’s investment assets were control investments. The fair value of these investments as a percent of net assets is 13.7%.
8The investment is structured as a first lien last out term loan.
9Indicates assets that are considered "non-qualifying assets” under section 55(a) of the 1940 Act. Qualifying assets must represent at least 70% of total assets at the time of acquisition of any additional non-qualifying assets. As of March 31, 2022, approximately 12.8% of the Company's assets are non-qualifying assets.
10The investment has an unfunded commitment as of March 31, 2022. Refer to Note 11 - Commitments and Contingencies for further discussion.
11Income producing through dividends or distributions.
12As of March 31, 2022, the cumulative gross unrealized appreciation for U.S. federal income tax purposes is approximately $67.8 million; cumulative gross unrealized depreciation for federal income tax purposes is $61.7 million. Cumulative net unrealized appreciation is $6.1 million, based on a tax cost of $852.4 million.
13Investment is held through a wholly-owned taxable subsidiary.
14The Company generally acquires its investments in private transactions exempt from registration under the Securities Act of 1933, as amended (the "Securities Act"). These investments, which as of March 31, 2022 represented 222.5% of the Company's net assets or 96.2% of the Company's total assets, are generally subject to certain limitations on resale, and may be deemed "restricted securities" under the Securities Act.
15The investment is structured as a split lien term loan, which provides the Company with a first lien priority on certain assets of the obligor and a second lien priority on different assets of the obligor.
16Investment is on non-accrual status as of March 31, 2022, meaning the Company has ceased to recognize interest income on the investment.
17Represents amortized cost. Negative cost in this column represents the original issue discount of certain undrawn revolvers and delayed draw term loans.
18Equity ownership may be held in shares or units of a company that is either wholly owned by the portfolio company or under common control by the same parent company to the portfolio company.
A brief description of the portfolio company in which we made an investment that represents greater than 5% of our total assets as of March 31, 2022 is included in Note 13. Significant Subsidiaries.
The accompanying Notes are an integral part of these Consolidated Financial Statements.
Notes to Consolidated Financial Statements
1. ORGANIZATION AND BASIS OF PRESENTATION
References in this AnnualQuarterly Report on Form 10-K10-Q to “we,” “our,” “us,” “CSWC,” or the “Company” refer to Capital Southwest Corporation, unless the context requires otherwise.
Organization
Capital Southwest Corporation is an internally managed investment company that specializes in providing customized financing to middle market companies in a broad range of investment segments located primarily in the United States. CSWC has elected to be regulated as a business development company under the 1940 Act. Our common stock currently trades on The Nasdaq Global Select Market under the ticker symbol “CSWC.”
CSWC was organized as a Texas corporation on April 19, 1961. On March 30, 1988, CSWC elected to be regulated as a business development company (“BDC”) under the 1940 Act. In order to comply with the 1940 Act requirements for a BDC, we must, among other things, generally invest at least 70% of our assets in eligible portfolio companies and limit the amount of leverage we incur.
We have elected, and intend to qualify annually, to be treated for U.S. federal income tax purposes as a regulated investment company (“RIC”) under Subchapter M of the U.S. Internal Revenue Code of 1986, as amended (the “Code”). As such, we generally will not have to pay corporate-level U.S. federal income tax at corporate rates on any ordinary income or capital gains that we distribute to our shareholders as dividends. To continue to maintain our RIC tax treatment, we must meet specified source-of-income and asset diversification requirements and timely distribute annually at least 90% of our net ordinary income and realized net short-term capital gains in excess of realized net long-term capital losses, if any. Depending on the level of taxableWe may be subject to U.S. federal income earned in a tax year, we may choose to carry forward taxable income in excess of current year distributions into the next year and pay a 4% U.S. federal excise tax on such income. Any such carryover taxableany income mustthat we do not timely distribute to our shareholders. Our U.S. federal income tax liability may be distributed through a dividend declared prior to filing the final tax return relatedreduced to the extent that we make certain distributions during the following calendar year and satisfy other procedural requirements.
We focus on investing in companies with histories of generating revenues and positive cash flow, established market positions and proven management teams with strong operating discipline. Our core business is to target senior debt investments and equity investments in lower middle market (“LMM”) companies. We also opportunistically target first and second lien loans in upper middle market (“UMM”) companies. Our target LMM companies typically have annual earnings before interest, taxes, depreciation and amortization (“EBITDA”) generally between $3.0 million and $20.0 million, and our LMM investments generally range in size from $5.0 million to $35.0 million. Our UMM investments generally include first and second lien loans in companies with EBITDA generally greater than $20.0 million and typically range in size from $5.0 million to $20.0 million. We make available significant managerial assistance to the companies in which we invest as we believe that generated such taxable income.providing managerial assistance to an investee company is critical to its business development activities.
Capital Southwest Management Corporation (“CSMC”), a wholly-owned subsidiary of CSWC, is the management company for CSWC. CSMC generally incurs all normal operating and administrative expenses, including, but not limited to, salaries and related benefits, rent, equipment and other administrative costs required for its day-to-day operations.
CSWC also has a direct wholly ownedwholly-owned subsidiary that has been elected to be a taxable entity (the “Taxable Subsidiary”). The primary purpose of the Taxable Subsidiary is to permit CSWC to hold certain interests in portfolio companies that are organized as limited liability companies, or LLCs (or other forms of pass-through entities), and still allow us to satisfy the RIC tax requirement that at least 90% of our gross income for U.S. federal income tax purposes must consist of qualifying investment income. The Taxable Subsidiary is taxed at normal corporate tax rates based on its taxable income.
We focus on investing in companies with historiesOn April 20, 2021, our wholly owned subsidiary, Capital Southwest SBIC I, LP (“SBIC I”) received a license from the U.S. Small Business Administration (the “SBA”) to operate as a small business investment company ("SBIC") under Section 301(c) of generating revenuesthe Small Business Investment Act of 1958, as amended. SBIC I has an investment strategy substantially similar to ours and positive cash flow, established market positions and proven management teams with strong operating discipline. We target senior debt investments and equitymakes similar types of investments in lower middle marketaccordance with SBA regulations. SBIC I and its general partner are consolidated for financial reporting purposes under generally accepted accounting principles in the United States ("LMM"U.S. GAAP") companies,, and the portfolio investments held by it are included in the consolidated financial statements.
Capital Southwest Management Corporation (“CSMC”), a wholly-owned subsidiary of CSWC, was the management company for CSWC. Effective December 31, 2020, CSMC merged with and into CSWC, with CSWC continuing as well as firstthe surviving entity in the merger. Prior to December 31, 2020, CSMC generally incurred all normal operating and second lien syndicated loans in upper middle market ("UMM") companies. Our target LMM companies typically have annual earnings before interest, taxes, depreciationadministrative expenses, including, but not limited to, salaries and amortization (“EBITDA”) between $3.0 millionrelated benefits, rent, equipment and $15.0 million,other administrative costs required for its day-to-day operations (the “Administrative Expenses”). After December 31, 2020, the Administrative Expenses will be directly incurred by CSWC. The Company continues to be internally managed and our LMM investments generally range in size from $5.0 million to $25.0 million. Our UMM investments generally include syndicated first and second lien loans in companies with EBITDA generally greater than $50.0 million and typically range in size from $5.0 million to $15.0 million. We make available significant managerial assistance to the companies in which we invest as we believe that providing managerial assistance to an investee company is critical to its business development activities.merger has no impact on the day-to-day operations of the business.
Basis of Presentation
The consolidated financial statements have been prepared in accordance with Generally Accepted Accounting Principles in the United States of America (“U.S. GAAP”). We meet the definition of an investment company and follow the
accounting and reporting guidance in the Financial Accounting Standards Board (“FASB”) Accounting Standards Codification (“ASC”) Topic 946, – Financial Services – Investment Companies (“ASC 946”). Under rules and regulations applicable to investment companies, we are generally precluded from consolidating any entity other than another investment company, subject to certain exceptions. One of the exceptions to this general principle occurs if the investment company has an investment in an operating company that provides services to the investment company. Accordingly, the consolidated financial statements include CSMC, our management company, and the Taxable Subsidiary. Prior to the merger of CSMC into CSWC that became effective December 31, 2020, we consolidated the results of CSWC's wholly owned management company.
Portfolio Investment Classification
We classify our investments in accordance with the requirements of the 1940 Act. Under the 1940 Act, “Control Investments” are generally defined as investments in which we own more than 25% of the voting securities; “Affiliate Investments” are generally defined as investments in which we own between 5% and 25% of the voting securities, and the investments are not classified as “Control Investments”; and “Non-Control/Non-Affiliate Investments” are generally defined as investments that are neither “Control Investments” nor “Affiliate Investments.”
Under the 1940 Act, a BDC must meet certain requirements, including investing at least 70% of ourits total assets in qualifying assets. As of March 31, 2020,2023, the Company has 88.1%86.1% of ourits assets in qualifying assets. The principal categories of qualifying assets relevant to our business are:
| |
(1) | Securities purchased in transactions not involving any public offering from the issuer of such securities, which issuer (subject to certain limited exceptions) is an eligible portfolio company, or from any person who is, or has been during the preceding 13 months, an affiliated person of an eligible portfolio company, or from any other person, subject to such rules as may be prescribed by the Securities and Exchange Commission ("SEC"). |
| |
(2) | Securities of any eligible portfolio company that we control. |
| |
(3) | Securities purchased in a private transaction from a U.S. issuer that is not an investment company or from an affiliated person of the issuer, or in transactions incident thereto, if the issuer is in bankruptcy and subject to reorganization or if the issuer, immediately prior to the purchase of its securities was unable to meet its obligations as they came due without material assistance other than conventional lending or financing arrangements. |
| |
(4) | Securities of an eligible portfolio company purchased from any person in a private transaction if there is no readily available market for such securities and we already own 60% of the outstanding equity of the eligible portfolio company. |
| |
(5) | Securities received in exchange for or distributed on or with respect to securities described in (1) through (4) above, or pursuant to the exercise of warrants or rights relating to such securities. |
| |
(6) | Cash, cash equivalents, U.S. government securities or high-quality debt securities maturing in one year or less from the time of investment. |
(1)securities purchased in transactions not involving any public offering from the issuer of such securities, which issuer (subject to certain limited exceptions) is an "eligible portfolio company," or from any person who is, or has been during the preceding 13 months, an affiliated person of an eligible portfolio company, or from any other person, subject to such rules as may be prescribed by the Securities and Exchange Commission ("SEC");
(2)securities of any eligible portfolio company that we control;
(3)securities purchased in a private transaction from a U.S. issuer that is not an investment company or from an affiliated person of the issuer, or in transactions incident thereto, if the issuer is in bankruptcy and subject to reorganization or if the issuer, immediately prior to the purchase of its securities was unable to meet its obligations as they came due without material assistance other than conventional lending or financing arrangements;
(4)securities of an eligible portfolio company purchased from any person in a private transaction if there is no readily available market for such securities and we already own 60% of the outstanding equity of the eligible portfolio company;
(5)securities received in exchange for or distributed on or with respect to securities described in (1) through (4) above, or pursuant to the exercise of warrants or rights relating to such securities; and
(6)cash, cash equivalents, U.S. government securities or high-quality debt securities maturing in one year or less from the time of investment.
Additionally,in order to qualify as afor RIC tax treatment for U.S. federal income tax purposes, we must, among other things meet the following requirements:
| |
(1) | Continue to maintain our election as a BDC under the 1940 Act at all times during each taxable year. |
| |
(2) | Derive in each taxable year at least 90% of our gross income from dividends, interest, payments with respect to certain securities, loans, gains from the sale of stock or other securities, net income from certain “qualified publicly traded partnerships,” or other income derived with respect to our business of investing in such stock or securities. |
| |
(3) | Diversify our holdings in accordance with two Diversification Requirements: (a) Diversify our holdings such that at the end of each quarter of the taxable year at least 50% of the value of our assets consists of cash, cash equivalents, U.S. Government securities, securities of other RICs, and such other securities if such other securities of any one issuer do not represent more than 5% of the value of our assets or more than 10% of the outstanding voting securities of the issuer; and (b) Diversify our holdings such that no more than 25% of the value of our assets is invested in the securities, other than U.S. government securities or securities of other RICs, (i) of one issuer, (ii) of two or more issuers that are controlled, as determined under applicable Code rules, by us and that are engaged in the same or similar or related trades or businesses or (iii) of certain "qualified publicly traded partnerships" (collectively, the "Diversification Requirements"). |
(1) continue to maintain our election as a BDC under the 1940 Act at all times during each taxable year;
(2) derive in each taxable year at least 90% of our gross income from dividends, interest, payments with respect to certain securities, loans, gains from the sale of stock or other securities, net income from certain "qualified publicly traded partnerships," or other income derived with respect to our business of investing in such stock or securities; and
(3) diversify our holdings in accordance with two diversification requirements: (a) diversify our holdings such that at the end of each quarter of the taxable year at least 50% of the value of our assets consists of cash, cash equivalents, U.S. Government securities, securities of other RICs, and such other securities if such other securities of any one issuer do not represent more than 5% of the value of our assets or more than 10% of the outstanding voting securities of the issuer; and (b) diversify our holdings such that no more than 25% of the value of our assets is invested in the securities, other than U.S. government securities or securities of other RICs, (i) of one issuer, (ii) of two or more issuers that are controlled, as determined under applicable Code rules, by us and that are engaged in the same or similar or related trades or businesses or (iii) of certain "qualified publicly traded partnerships" (collectively, the "Diversification Requirements");
The two Diversification Requirements must be satisfied quarterly. If a RIC satisfies the Diversification Requirements for one quarter, and then, due solely to fluctuations in market value, fails to meet one of the Diversification Requirements in the
next quarter, it retains RIC tax treatment. A RIC that fails to meet the Diversification Requirements as a result of a nonqualified acquisition may be subject to excess taxes unless the nonqualified acquisition is disposed of and the Diversification Requirements are satisfied within 30 days of the close of the quarter in which the Diversification Requirements are failed.
ThisFor the quarter ended March 31, 2023, we satisfied all RIC requirements and have 4.5%11.3% in nonqualified assets according to measurement criteria established in Section 851(d) of the Code.
2. SUMMARY OF SIGNIFICANT ACCOUNTING POLICIES
The following is a summary of significant accounting policies followed in the preparation of the consolidated financial statements of CSWC.
Fair Value Measurements We account for substantially all of our financial instruments at fair value in accordance with ASC Topic 820, – Fair Value Measurements and Disclosures (“(“ASC 820”). ASC 820 defines fair value, establishes a framework used to measure fair value and requires disclosures for fair value measurements, including the categorization of financial instruments into a three-level hierarchy based on the transparency of valuation inputs. ASC 820 requires disclosure of the fair value of financial instruments for which it is practical to estimate such value. We believe that the carrying amounts of our financial instruments such as cash, receivables and payables approximate the fair value of these items due to the short maturity of these instruments. This is considered a Level 1 valuation technique. The carrying value of our credit facility approximates fair value (Level 3 input). See Note 4 below for further discussion regarding the fair value measurements and hierarchy.
Investments Investments are stated at fair value and are reviewed and approved by our Board of Directors as described in the Notes to the Consolidated Schedule of Investments and Notes 3 and 4 below. Investments are recorded on a trade date basis.
Net Realized Gains or Losses and Net Unrealized Appreciation or Depreciation Realized gains or losses are measured by the difference between the net proceeds from the sale or redemption of an investment or a financial instrument and the cost basis of the investment or financial instrument, without regard to unrealized appreciation or depreciation previously recognized, and includes investments written offwritten-off during the period net of recoveries and realized gains or losses from in-kind redemptions. Net unrealized appreciation or depreciation reflects the net change in the fair value of the investment portfolio and financial instruments and the reclassification of any prior period unrealized appreciation or depreciation on exited investments and financial instruments to realized gains or losses.
Cash and Cash Equivalents Cash and cash equivalents, which consist of cash and highly liquid investments with an original maturity of three months or less at the date of purchase, are carried at cost, which approximates fair value. Cash may be held in a money market fund from time to time, which is a Level 1 security. At March 31, 2023 and March 31, 2022, cash held in money market funds amounted to $8.9 million and $6.5 million, respectively. Cash and cash equivalents includes deposits at financial institutions. We deposit our cash balances in financial institutions and, at times, such balances may be in excess of the Federal Deposit Insurance Corporation (“FDIC”) insurance limits. At March 31, 20202023 and 2019,March 31, 2022, cash balances totaling $12.6$20.3 million and $8.8$10.2 million, respectively, exceeded FDIC insurance limits, subjecting us to risk related to the uninsured balance. All of our cash deposits are held at large established high credit quality financial institutions and management believes that the risk of loss associated with any uninsured balances is remote.
Segment Information We operate and manage our business in a singular segment. As an investment company, we invest in portfolio companies in various industries and geographic areas as discussed in Note 3.
Consolidation As permitted under Regulation S-X and ASC 946, we generally do not consolidate our investment in a portfolio company other than an investment company subsidiary or a controlled operating company whose business consists of providing services to CSWC. Accordingly, we consolidatedconsolidate the results of CSWC’s wholly-ownedthe Taxable Subsidiary and CSWC’s wholly-owned management company, CSMC. Prior to its dissolution, we consolidated the results of CSWC’s wholly-owned subsidiary, CSVC.SBIC I. All intercompany balances have been eliminated upon consolidation.
Use of Estimates The preparation of consolidated financial statements in conformity with U.S. GAAP requires management to make estimates and assumptions that affect amounts reported in the consolidated financial statements and accompanying notes. Actual results could differ from those estimates. We have identified investment valuation and revenue recognition as our most critical accounting estimates.
Interest and Dividend Income Interest and dividend income is recorded on an accrual basis to the extent amounts are expected to be collected. Dividend income is recognized on the date dividends are declared by the portfolio company or at the
point an obligation exists for the portfolio company to make a distribution. Discounts/premiums received to par on loans purchased are capitalized and accreted or amortized into income over the life of the loan using the effective interest method. In accordance with our valuation policy, accrued interest and dividend income is evaluated quarterly for collectability. When we do not expect the debtor to be able to service all of its debt or other obligations, we will generally establish a reserve against interest income receivable, thereby placing the loan or debt security on non-accrual status, and cease to recognize interest income on that loan or debt security until the borrower has demonstrated the ability and intent to pay contractual amounts due. If a loan or debt security’s status significantly improves regarding its ability to service debt or other obligations, it will be restored to accrual basis. As of March 31, 2020, we had four2023, investments on non-accrual status which comprised ofrepresented approximately 3.3%0.3% of our total investment portfolio's fair value and approximately 5.8%1.3% of its cost. As of March 31, 2019, we had one investment2022, investments on non-accrual status which represented approximately 1.6%1.5% of our total investment portfolio's fair value and approximately 1.9%2.6% of its cost.
To maintain RIC tax treatment, non-cash sources of income such as accretion of interest income may need to be paid out to shareholders in the form of distributions, even though CSWC may not have collected the interest income. For the yearyears ended March 31, 2020,2023 and 2022, approximately 3.1%3.2% and 3.7%, respectively, of CSWC’s total investment income was attributable to non-cash interest income for the
accretion of discounts associated with debt investments, net of any premium reduction. For the year ended March 31, 2019, approximately 2.7% of CSWC’sCSWC's total investment income was attributable to non-cash interest income for the accretion of discounts associated with debt investments, net of any premium reduction.
Payment-in-Kind Interest The Company currently holds, and expects to hold in the future, some investments in its portfolio that contain payment-in-kind (“PIK”)PIK interest and dividend provisions. The PIK interest, and dividends, computed at the contractual rate specified in each loan agreement, areis added to the principal balance of the loan, rather than being paid to the Company in cash, and areis recorded as interest and dividend income. Thus, the actual collection of PIK interest and dividends may be deferred until the time of debt principal repayment or disposition of the equity investment.repayment. PIK interest, and dividends, which areis a non-cash sourcessource of income, areis included in the Company’s taxable income and therefore affectaffects the amount the Company is required to distribute to shareholders to maintain its qualification as a RIC for U.S. federal income tax purposes, even though the Company has not yet collected the cash. Generally, when current cash interest and/or principal payments on a loan become past due, or if the Company otherwise does not expect the borrower to be able to service its debt and other obligations, the Company will place the investment on non-accrual status and will generally cease recognizing PIK interest and dividend income on that loan for financial reporting purposes until all principal and interest have been brought current through payment or due to a restructuring such that the interest and dividend income is deemed to be collectible. The Company writes off any accrued and uncollected PIK interest and dividends when it is determined that the PIK interest and dividends areis no longer collectible. As of March 31, 20202023 and 2019,March 31, 2022, we have not written off any accrued and uncollected PIK interest and dividends from prior periods. For the year ended March 31, 2020,2023, we had twothree investments for which we stopped accruing PIK interest. For the year ended March 31, 2019, there were no2022, we had two investments for which we stopped accruing PIK interest. For the years ended March 31, 20202023 and 2019,2022, approximately 3.5%4.6% and 1.3%3.9%, respectively, of CSWC’s total investment income was attributable to non-cash PIK interest income.
Fee Income Fee income, generally collected in advance, includes fees for administration and dividend income.valuation services rendered by the Company. These fees are typically charged annually and are amortized into income over the year. The Company recognizes nonrecurring fees, including prepayment penalties, waiver fees and amendment fees, as fee income when earned. In addition, the Company may also be entitled to an exit fee that is amortized into income over the life of the loan. Loan exit fees to be paid at the termination of the loan are accreted into fee income over the contractual life of the loan.
Warrants In connection with the Company's debt investments, the Company will sometimesmay receive warrants or other equity-related securities from the borrower. The Company determines the cost basis of warrants based upon their respective fair values on the date of receipt in proportion to the total fair value of the debt and warrants received. Any resulting difference between the face amount of the debt and its recorded fair value resulting from the assignment of value to the warrants is treated as original issue discount (“OID”), and accreted into interest income using the effective interest method over the term of the debt investment.
Debt Issuance Costs Debt issuance costs include commitment fees and other costs related to CSWC’s senior secured credit facility, and its unsecured notes (as discussed further in Note 5) and the debentures guaranteed by the SBA (the "SBA Debentures"). The costs in connection with the credit facility have been capitalized and are amortized into interest expense over the term of the credit facility. The costs in connection with the unsecured notes and the SBA Debentures are a direct deduction from the related debt liability and amortized into interest expense over the term of the December 2022 Notes and the October 2024January 2026 Notes (as defined below)., the October 2026 Notes (as defined below) and the SBA Debentures.
Deferred Offering Costs Deferred offering costs include registration expenses related to our shelf registration statementsstatement and expenses related to the launch of the "at-the-market" ("ATM") program through which we can sell, from time to time, shares of our common stock (the "Equity ATM Program"). These expenses consist primarily of SEC registration fees, legal fees and accounting fees incurred related thereto. These expenses are included in other assets on the Consolidated
Statements of Assets and Liabilities. Upon the completion of an equity offering or a debt offering, the deferred expenses are charged to additional paid-in capital or debt issuance costs, respectively. If nothere are any deferred offering is completed prior tocosts remaining at the expiration of the shelf registration statement, thethese deferred costs are charged to expense.
Realized Losses on Extinguishment of Debt Upon the repayment of debt obligations that are deemed to be extinguishments, the difference between the principal amount due at maturity adjusted for any unamortized debt issuance costs is recognized as a loss (i.e., the unamortized debt issuance costs and any "make-whole" premium payment (as discussed in Note 5)) are recognized as a loss upon extinguishment of the underlying debt obligation).
Leases The Company is obligated under an operating lease pursuant to which it is leasing an office facility from a third party with a remaining term of approximately two10 years. The operating lease is included as an operating lease right-of-use ("ROU") asset and operating lease liability in the accompanying Consolidated Statements of Assets and Liabilities. The Company does not have any financing leases.
The ROU asset represents the Company’s right to use an underlying asset for the lease term and the operating lease liability represents the Company’s obligation to make lease payments arising from such lease. Operating lease ROU assets and liabilities are recognized at the commencement date based on the present value of lease payments over the remaining lease term. The Company’s leases dolease does not provide an implicit discount rate, and as such the Company uses its incremental borrowing rate based on the information available at the commencement date in determining the present value of the remaining lease payments. Lease expense is recognized on a straight-line basis over the remaining lease term.
Federal Income Taxes CSWC has elected, and intends to qualify annually, to be treated for U.S. federal income tax purposes as a RIC under Subsection M of the Code. By meeting these requirements, we will not be subject to corporateU.S. federal income taxes at corporate rates on ordinary income or capital gains timely distributed to shareholders. In order to qualify as a RIC, the Company is required to timely distribute to its shareholders at least 90% of investment company taxable income, as defined by the Code,
each year. Investment company taxable income generally differs from net income for financial reporting purposes due to temporary and permanent differences in the recognition of income and expenses. Investment company taxable income generally excludes net unrealized appreciation or depreciation, as investment gains and losses are not included in investment company taxable income until they are realized.
Depending on the level of taxable income or capital gains earned in a tax year, we may choose to carry forward taxable income or capital gains in excess of current year distributions into the next year and pay a 4% U.S. federal excise tax on such income. Any such carryover taxable income or capital gains must be distributed through a dividend declared on or prior to the later of (1) the filing of the U.S. federal income tax return for the applicable fiscal year and (2) the fifteenth day of the ninth month following the close of the year in which such taxable income was generated.
In lieu of distributing our net capital gains for a year, we may decide to retain some or all of our net capital gains. We will be required to pay a 21% corporate-levelcorporate rate U.S. federal income tax on any such retained net capital gains. We may elect to treat such retained capital gain as a deemed distribution to shareholders. Under such circumstances, shareholders will be required to include their share of such retained capital gain in income, but will receive a credit for the amount of corporate-level U.S. federal income tax paid at corporate rates with respect to their shares. As an investment company that qualifies as a RIC, federal income taxes payable on security gains that we elect to retain are accrued only on the last day of our tax year, December 31. Any net capital gains actually distributed to shareholders and properly reported by us as capital gain dividends are generally taxable to the shareholders as long-term capital gains. See Note 6 for further discussion.
CSMC,The Taxable Subsidiary, a wholly-owned subsidiary of CSWC, is not a RIC and the Taxable Subsidiary are not RICs and areis required to pay taxes at the corporate rate of 21% as of December 31, 2019.. For tax purposes, CSMC and the Taxable Subsidiary havehas elected to be treated as a taxable entities,entity, and therefore areis not consolidated for tax purposes and areis taxed at normal corporate tax rates based on taxable income and, as a result of theirits activities, may generate an income tax expenseprovision or benefit. The taxable income, or loss, of each of CSMC and the Taxable Subsidiary may differ from its book income, or loss, due to temporary book and tax timing differences and permanent differences. This income tax expense,provision, or benefit, if any, and the related tax assets and liabilities, are reflected in our consolidated financial statements.
Management evaluates tax positions taken or expected to be taken in the course of preparing the Company’s consolidated financial statements to determine whether the tax positions are “more-likely-than-not” to be sustained by the applicable tax authority. Tax positions with respect to tax at the CSWC level not deemed to meet the “more-likely-than-not” threshold would be recorded as an expense in the current year. Management’s conclusions regarding tax positions will be subject to review and may be adjusted at a later date based on factors including, but not limited to, on-going analyses of tax laws, regulations and interpretations thereof. The Company has concluded that it does not have any uncertain tax positions that
meet the recognition of measurement criteria of ASC Topic 740,Income Taxes (“, ("ASC 740”740") for the current period. Also, we account for interest and, if applicable, penalties for any uncertain tax positions as a component of income tax expense.provision. No interest or penalties expense was recorded during the years ended March 31, 2020, 20192023, 2022 and 2018.2021.
Deferred Taxes Deferred tax assets and liabilities are recorded for losses or income at our taxable subsidiaries using statutory tax rates. A valuation allowance is provided against deferred tax assets when it is more likely than not that some portion or all of the deferred tax asset will not be realized. ASC 740 requires the effects of changes in tax rates and laws on deferred tax balances to be recognized in the period in which the legislation was enacted. See Note 6 for further discussion.
Stock-Based Compensation We account for our stock-basedshare-based compensation using the fair value method, as prescribed by ASC Topic 718, Compensation – Stock Compensation. Accordingly, we recognize stock-basedshare-based compensation cost on a straight-line basis for all share-based payments awards granted to employees. The fair value of stock options are determined on the date of grant using the Black-Scholes pricing model and are expensed over the requisite service period of the related stock options. For restricted stock awards, we measure the grant date fair value based upon the market price of our common stock on the date of the grant. For restricted stock awards, we amortize this fair value to share-based compensation expense over the vesting term. We recognize forfeitures as they occur. We issue new shares upon the exercise of stock options. The unvested shares of restricted stock awarded pursuant to CSWC’s equity compensation plans are participating securities and are included in the basic and diluted earnings per share calculation. On October 26, 2010, we received an exemptive order from the SEC permitting us
The right to issuegrant restricted stock to our executive officers and certain key employees (the “Original Order”). On August 22, 2017, we received an exemptive order that supersedes the Original Order (the “Exemptive Order”) and, in addition to the relief grantedawards under the Original Order, allows us to withhold shares to satisfy tax withholding obligations related to2010 Plan terminated on July 18, 2021, ten years after the vesting of restricted stock granted pursuant todate that the 2010 Restricted Stock Award Plan (the “2010 Plan”) was approved by the Company’s shareholders pursuant to its terms. In connection with the termination of the 2010 Plan, the Company’s Board of Directors and shareholders approved the Capital Southwest Corporation 2021 Employee Restricted Stock Award Plan (the "2021 Employee Plan"), which became effective on July 28, 2021, as part of the compensation package for its employees, the terms of which are, in all material respects, identical to pay the exercise price2010 Plan. On July 19, 2021, we received an exemptive order that supersedes the prior exemptive order relating to the 2010 Plan (the “Order”) to permit the Company to (i) issue restricted stock as part of options tothe compensation package for its employees in the 2021 Employee Plan, and (ii) withhold shares of the Company’s common stock or purchase shares of ourthe Company’s common stock grantedfrom the participants to satisfy tax withholding obligations relating to the vesting of restricted stock pursuant to the 20092021 Employee Plan. In addition, the Company's Board of Directors and shareholders approved the Capital Southwest Corporation 2021 Non-Employee Director Restricted Stock Incentive Plan (the “2009 Plan”"Non-Employee Director Plan")., which became effective on July 27, 2022, as part of the compensation package for non-employee directors of the Board of Directors. In connection therewith, on May 16, 2022, we received an exemptive order that supersedes the Order (the "Superseding Order") and covers both employees and non-employee directors of the Board of Directors.
At the year ended March 31, 2020, there was no adjustment made for the dilutive effect of stock-based awards as there are no options to acquire shares of common stock outstanding. At the years ended March 31, 2019 and 2018, weighted-average basic shares were adjusted for the diluted effect of stock-based awards of 7,115 and 64,899, respectively.
Shareholder Distributions Distributions to common shareholders are recorded on the ex-dividend date. The amount of distributions, if any, is determined by the Board of Directors each quarter and is generally based upon the earnings estimated by management. Net realized capital gains, if any, generally are generally distributed, although the Company may decide to retain such capital gains for investment.
Presentation Presentation of certain amounts in the Consolidated Financial Statementsconsolidated financial statements for the prior year comparative consolidated financial statements is updated to conform to the current period presentation.
Recently Issued or Adopted Accounting Standards In February 2016,March 2020, the FASB issued ASU 2016-02, Leases, which requires lessees2020-04, "Reference rate reform (Topic 848)—Facilitation of the effects of reference rate reform on financial reporting." The amendments in this update provide optional expedients and exceptions for applying U.S. GAAP to recognize on the balance sheet a right-of-use asset, representing its rightcertain contracts and hedging relationships that reference LIBOR or another reference rate expected to use the underlying asset for the lease term,be discontinued due to reference rate reform and a lease liabilitybecame effective upon issuance for all leasesentities. The Company has agreements that have LIBOR as a reference rate with terms greater than 12 months. The guidance also requires qualitativecertain portfolio companies and quantitative disclosures designedcertain lenders. Many of these agreements include an alternative successor rate or language for choosing an alternative successor rate when LIBOR reference is no longer considered to assessbe appropriate. With respect to other agreements, the amount, timing,Company intends to work with its portfolio companies and uncertaintycertain lenders to modify agreements to choose an alternative successor rate. Contract modifications are required to be evaluated in determining whether the modifications result in the establishment of cash flows arising from leases. The standard requiresnew contracts or the usecontinuation of a modified retrospective transition approach, which includes a number of optional practical expedients that entities may elect to apply. In July 2018,existing contracts. On December 21, 2022, the FASB issued ASU 2018-10, Codification Improvements to Topic 842, Leases, which affects narrow aspects2022-06 "Reference rate reform (Topic 848)—Deferral of the guidance issued inSunset Date of Topic 848," which defers the sunset date of ASC 848 until December 31, 2024. ASU 2022-06 became effective upon issuance. The expedients and exceptions provided by the amendments do not apply to contract modifications and hedging relationships entered into or evaluated after December 31, 2024, except for hedging transactions as of December 31, 2024, that an entity has elected certain optional expedients for and that are retained through the end of the hedging relationship. The Company does not believe it will have a material impact on its consolidated financial statements or its disclosure and did not utilize the optional expedients and exceptions provided by ASU 2020-04 during the year ended March 31, 2023.
In June 2022, the FASB issued ASU 2022-03, “Fair Value Measurement (Topic 820) - Fair Value Measurement of Equity Securities Subject to Contractual Sale Restrictions,” which was issued to (1) clarify the guidance in ASU 2016-02.Topic 820, Fair Value Measurement, when measuring the fair value of an equity security subject to contractual restrictions that prohibit the sale of an equity security, (2) amend a related illustrative example, and (3) introduce new disclosure requirements for equity securities subject to contractual sale restrictions that are measured at fair value in accordance with Topic 820. The new guidance is effective for interim and annual periods beginning after December 15, 2018, and interim periods therein. CSWC adopted ASU 2016-02 effective April 1, 2019. Under ASC 842, Leases, ("ASC 842"), CSWC evaluates leases to determine if the leases are considered financing or operating leases.2023. The Company is currently has one operating lease for office space for whichevaluating the Company has recorded a right-of-use asset and lease liability for the operating lease obligation included in other assets and other liabilities, respectively, in the Consolidated Statements of Assets and Liabilities. Non-lease components (maintenance, property tax, insurance and parking) are not included in the lease cost. The lease expense is presented as a single lease cost that is amortized on a straight-line basis over the lifeimpact of the lease.
In August 2018,new standard on the FASB issued ASU 2018-13, Fair Value Measurement (Topic 820): Disclosure Framework - Changes to the Disclosure Requirements for Fair Value Measurement, which changes the fair value measurement disclosure requirements of ASC 820. The key provisions include new, eliminated and modified disclosure requirements. The new guidance is effective for fiscal years beginning after December 15, 2019, including interim periods therein. Early application is permitted. CSWC elected to early adopt ASU 2018-13 effective April 1, 2019. No significant changes to the fair value disclosures were necessary in the notes to theCompany's consolidated financial statements in order to comply with ASU 2018-13.
In March 2019, the SEC issued Final Rule Release No. 33-10618, FAST Act Modernization and Simplification of Regulation S-K, which amends certain SEC disclosure requirements. The amendments are intended to simplify certain disclosure requirements, improve readabilityrelated disclosures and navigability of disclosure documents, and discourage repetition and disclosure of immaterial information. The amendments are effective for all filings submitteddoes not believe it will have a material impact on or after May 2, 2019. The Company adopted the requisite amendments effective May 2, 2019. As it pertains to the Company for this Annual Report on Form 10-K, there were no significant changes to the Company’sits consolidated financial positionstatements or disclosures.its disclosure.
3. INVESTMENTS
The following tables showtable shows the composition of the investment portfolio, at costfair value and fair valuecost (with corresponding percentage of total portfolio investments), as of March 31, 20202023 and 2019:March 31, 2022:
| | | | | | | | | | | | | | | | | | | | | | | | | | | | | |
| Fair Value | | Percentage of Total Portfolio
at Fair Value | | Percentage of Net Assets
at Fair Value | | Cost | | Percentage of Total Portfolio
at Cost |
| (dollars in thousands) |
| March 31, 2023: | | | | | | | | | |
First lien loans1,2 | $ | 1,000,984 | | | 83.0 | % | | 169.5 | % | | $ | 1,018,595 | | | 83.5 | % |
Second lien loans2 | 35,820 | | | 3.0 | | | 6.1 | | | 44,038 | | | 3.6 | |
Subordinated debt3 | 791 | | | 0.1 | | | 0.1 | | | 763 | | | 0.1 | |
| Preferred equity | 63,393 | | | 5.2 | | | 10.7 | | | 43,634 | | | 3.6 | |
| Common equity & warrants | 54,144 | | | 4.5 | | | 9.2 | | | 32,322 | | | 2.6 | |
I-45 SLF LLC4 | 51,256 | | | 4.2 | | | 8.7 | | | 80,800 | | | 6.6 | |
| $ | 1,206,388 | | | 100.0 | % | | 204.3 | % | | $ | 1,220,152 | | | 100.0 | % |
| | | | | | | | | |
| March 31, 2022: | | | | | | | | | |
First lien loans1,2 | $ | 739,872 | | | 79.0 | % | | 175.8 | % | | $ | 745,290 | | | 79.4 | % |
Second lien loans2 | 52,645 | | | 5.6 | | | 12.5 | | | 55,976 | | | 6.0 | |
Subordinated debt3 | 1,317 | | | 0.1 | | | 0.3 | | | 994 | | | 0.1 | |
| Preferred equity | 44,663 | | | 4.8 | | | 10.6 | | | 25,544 | | | 2.7 | |
| Common equity & warrants | 40,514 | | | 4.3 | | | 9.6 | | | 34,499 | | | 3.7 | |
I-45 SLF LLC4 | 57,603 | | | 6.2 | | | 13.7 | | | 76,000 | | | 8.1 | |
| $ | 936,614 | | | 100.0 | % | | 222.5 | % | | $ | 938,303 | | | 100.0 | % |
1Included in first lien loans are loans structured as first lien last out loans. These loans may, in certain cases, be subordinated in payment priority to other senior secured lenders. As of March 31, 2023 and March 31, 2022, the fair value of the first lien last out loans are $50.1 million and $38.6 million, respectively.
2Included in first lien loans and second lien loans are loans structured as split lien term loans. These loans provide the Company with a first lien priority on certain assets of the obligor and a second lien priority on different assets of the obligor. As of March 31, 2023 and March 31, 2022, the fair value of the split lien term loans included in first lien loans is $45.0 million and $36.4 million, respectively. As of March 31, 2023 and March 31, 2022, the fair value of the split lien term loans included in second lien loans is $20.2 million and $33.9 million, respectively.
3Included in subordinated debt are unsecured convertible notes with a fair value of $0.4 million and $0.7 million as of March 31, 2023 and March 31, 2022, respectively.
4I-45 SLF LLC is a joint venture between CSWC and Main Street Capital Corporation. This entity primarily invests in syndicated senior secured loans to the UMM. The portfolio companies held by I-45 SLF LLC represent a diverse set of industry classifications, which are similar to those in which CSWC invests directly. See Note 15 for further discussion.
|
| | | | | | | | | | | | | | | | |
| | | | Percentage of | | | | | | Percentage of |
| | Fair | | Total Portfolio | | Percentage of | | | | Total Portfolio |
| | Value | | at Fair Value | | Net Assets | | Cost | | at Cost |
| | (dollars in thousands) |
| March 31, 2020: | | | | | | | | | |
First lien loans1 | $ | 427,447 |
| | 77.3 | % | | 157.0 | % | | $ | 446,925 |
| | 74.6 | % |
Second lien loans2 | 37,139 |
| | 6.7 |
| | 13.6 |
| | 38,580 |
| | 6.4 |
|
| Subordinated debt | 9,747 |
| | 1.8 |
| | 3.6 |
| | 9,980 |
| | 1.7 |
|
| Preferred equity | 16,624 |
| | 3.0 |
| | 6.1 |
| | 12,576 |
| | 2.1 |
|
| Common equity & warrants | 22,355 |
| | 4.0 |
| | 8.2 |
| | 21,609 |
| | 3.6 |
|
Financial instruments3 | — |
| | — |
| | — |
| | 1,517 |
| | 0.3 |
|
I-45 SLF LLC4 | 39,760 |
| | 7.2 |
| | 14.6 |
| | 68,000 |
| | 11.3 |
|
| | $ | 553,072 |
| | 100.0 | % | | 203.1 | % | | $ | 599,187 |
| | 100.0 | % |
| March 31, 2019: | | | | | | | | | |
First lien loans1 | $ | 317,544 |
| | 60.6 | % | | 97.4 | % | | $ | 319,278 |
| | 66.8 | % |
Second lien loans2 | 35,896 |
| | 6.8 |
| | 11.0 |
| | 36,057 |
| | 7.5 |
|
| Subordinated debt | 14,287 |
| | 2.7 |
| | 4.4 |
| | 14,458 |
| | 3.0 |
|
| Preferred equity | 17,936 |
| | 3.4 |
| | 5.5 |
| | 7,894 |
| | 1.7 |
|
| Common equity & warrants | 72,665 |
| | 14.0 |
| | 22.3 |
| | 32,368 |
| | 6.8 |
|
I-45 SLF LLC4 | 65,743 |
| | 12.5 |
| | 20.1 |
| | 68,000 |
| | 14.2 |
|
| | $ | 524,071 |
| | 100.0 | % | | 160.7 | % | | $ | 478,055 |
| | 100.0 | % |
| |
1
| Included in first lien loans are loans structured as first lien last out loans. These loans may in certain cases be subordinated in payment priority to other senior secured lenders. As of March 31, 2020 and 2019, the fair value of the first lien last out loans are $59.5 million and $38.6 million, respectively. |
| |
2
| Included in second lien loans are loans structured as split lien term loans. These loans provide the Company with a first lien priority on certain assets of the obligor and a second lien priority on different assets of the obligor. As of March 31, 2020 and 2019, the fair value of the split lien term loans are $19.9 million and $18.3 million, respectively. |
| |
3
| Included in financial instruments is the earnout received in connection with the sale of Media Recovery, Inc. |
| |
4
| I-45 SLF LLC is a joint venture between CSWC and Main Street Capital Corporation. This entity primarily invests in syndicated senior secured loans to the UMM. The portfolio companies held by I-45 SLF LLC represent a diverse set of industry classifications, which are similar to those in which CSWC invests directly. See Note 16 for further discussion. |
The following tables show the composition of the investment portfolio by industry, at costfair value and fair valuecost (with corresponding percentage of total portfolio investments), as of March 31, 20202023 and 2019:March 31, 2022:
| | | | | | | | | | | | | | | | | | | | | | | | | | | | | |
| Fair Value | | Percentage of Total Portfolio
at Fair Value | | Percentage of Net Assets
at Fair Value | | Cost | | Percentage of Total Portfolio
at Cost |
| (dollars in thousands) |
| March 31, 2023: | | | | | | | | | |
| Media & Marketing | $ | 149,357 | | | 12.4 | % | | 25.3 | % | | $ | 139,750 | | | 11.5 | % |
| Business Services | 146,727 | | | 12.2 | | | 24.9 | | | 147,056 | | | 12.1 | |
| Healthcare Services | 126,971 | | | 10.5 | | | 21.5 | | | 143,455 | | | 11.8 | |
| Consumer Services | 91,913 | | | 7.6 | | | 15.6 | | | 91,142 | | | 7.5 | |
| Consumer Products and Retail | 86,385 | | | 7.2 | | | 14.6 | | | 86,607 | | | 7.1 | |
| Food, Agriculture & Beverage | 68,833 | | | 5.7 | | | 11.7 | | | 73,223 | | | 6.0 | |
| Healthcare Products | 66,355 | | | 5.5 | | | 11.2 | | | 67,555 | | | 5.5 | |
| Technology Products & Components | 59,718 | | | 5.0 | | | 10.1 | | | 43,016 | | | 3.5 | |
I-45 SLF LLC1 | 51,256 | | | 4.2 | | | 8.7 | | | 80,800 | | | 6.6 | |
| Transportation & Logistics | 48,494 | | | 4.0 | | | 8.2 | | | 42,049 | | | 3.4 | |
| Software & IT Services | 47,641 | | | 3.9 | | | 8.1 | | | 47,563 | | | 3.9 | |
| Financial Services | 40,420 | | | 3.3 | | | 6.8 | | | 30,950 | | | 2.5 | |
| Industrial Products | 32,518 | | | 2.7 | | | 5.5 | | | 25,827 | | | 2.1 | |
| Environmental Services | 29,753 | | | 2.5 | | | 5.0 | | | 34,869 | | | 2.9 | |
| Education | 26,357 | | | 2.2 | | | 4.5 | | | 25,995 | | | 2.1 | |
| Industrial Services | 25,460 | | | 2.1 | | | 4.3 | | | 24,920 | | | 2.0 | |
| Energy Services (Midstream) | 22,829 | | | 1.9 | | | 3.9 | | | 23,337 | | | 1.9 | |
| Specialty Chemicals | 17,839 | | | 1.5 | | | 3.0 | | | 17,531 | | | 1.4 | |
| Energy Services (Upstream) | 17,730 | | | 1.5 | | | 3.0 | | | 17,402 | | | 1.4 | |
| Telecommunications | 17,386 | | | 1.4 | | | 2.9 | | | 21,796 | | | 1.9 | |
| Distribution | 16,315 | | | 1.4 | | | 2.8 | | | 18,755 | | | 1.5 | |
| Containers & Packaging | 10,131 | | | 0.8 | | | 1.7 | | | 10,656 | | | 0.9 | |
| Aerospace & Defense | 6,000 | | | 0.5 | | | 1.0 | | | 5,898 | | | 0.5 | |
| $ | 1,206,388 | | | 100.0 | % | | 204.3 | % | | $ | 1,220,152 | | | 100.0 | % |
| | | | | | | | | | | | | | Fair Value | | Percentage of Total Portfolio
at Fair Value | | Percentage of Net Assets
at Fair Value | | Cost | | Percentage of Total Portfolio
at Cost |
| | | | Percentage of | | | | | | Percentage of | | (dollars in thousands) |
| March 31, 2022: | | March 31, 2022: | |
| Business Services | | Business Services | $ | 123,697 | | | 13.2 | % | | 29.4 | % | | $ | 124,860 | | | 13.3 | % |
| Consumer Products & Retail | | Consumer Products & Retail | 90,457 | | | 9.7 | | | 21.5 | | | 88,375 | | | 9.4 | |
| Healthcare Services | | Healthcare Services | 88,131 | | | 9.4 | | | 21.0 | | | 96,946 | | | 10.3 | |
| Consumer Services | | Consumer Services | 71,730 | | | 7.7 | | | 17.0 | | | 71,203 | | | 7.6 | |
I-45 SLF LLC1 | | I-45 SLF LLC1 | 57,603 | | | 6.2 | | | 13.7 | | | 76,000 | | | 8.1 | |
| Distribution | | Distribution | 54,798 | | | 5.9 | | | 13.0 | | | 54,035 | | | 5.8 | |
| Food, Agriculture & Beverage | | Food, Agriculture & Beverage | 48,876 | | | 5.2 | | | 11.6 | | | 47,057 | | | 5.0 | |
| Media & Marketing | | Media & Marketing | 43,463 | | | 4.6 | | | 10.3 | | | 33,049 | | | 3.5 | |
| Financial Services | | Financial Services | 39,305 | | | 4.2 | | | 9.3 | | | 31,229 | | | 3.3 | |
| Technology Products & Components | | Technology Products & Components | 37,047 | | | 4.0 | | | 8.8 | | | 30,440 | | | 3.3 | |
| Transportation & Logistics | | Transportation & Logistics | 34,038 | | | 3.6 | | | 8.1 | | | 29,513 | | | 3.1 | |
| Software & IT Services | | Software & IT Services | 33,414 | | | 3.6 | | | 7.9 | | | 34,866 | | | 3.7 | |
| Education | | Education | 32,072 | | | 3.4 | | | 7.6 | | | 32,119 | | | 3.4 | |
| Healthcare Products | | Healthcare Products | 32,054 | | | 3.4 | | | 7.6 | | | 33,018 | | | 3.5 | |
| Environmental Services | | Environmental Services | 20,641 | | | 2.2 | | | 4.9 | | | 23,108 | | | 2.5 | |
| Telecommunications | | Telecommunications | 18,736 | | | 2.0 | | | 4.5 | | | 22,341 | | | 2.4 | |
| Energy Services (Upstream) | | Energy Services (Upstream) | 17,910 | | | 1.9 | | | 4.3 | | | 17,500 | | | 1.9 | |
| Specialty Chemicals | | Specialty Chemicals | 17,749 | | | 1.9 | | | 4.2 | | | 17,640 | | | 1.9 | |
| Industrial Products | | Industrial Products | 13,891 | | | 1.5 | | | 3.3 | | | 13,901 | | | 1.5 | |
| Energy Services (Midstream) | | Energy Services (Midstream) | 13,465 | | | 1.4 | | | 3.2 | | | 13,582 | | | 1.5 | |
| Industrial Services | | Industrial Services | 11,614 | | | 1.2 | | | 2.8 | | | 11,451 | | | 1.2 | |
| Commodities & Mining | | Commodities & Mining | 10,877 | | | 1.2 | | | 2.6 | | | 11,135 | | | 1.2 | |
| Containers & Packaging | | Containers & Packaging | 10,671 | | | 1.1 | | | 2.5 | | | 10,723 | | | 1.1 | |
| Aerospace & Defense | | Aerospace & Defense | 6,800 | | | 0.7 | | | 1.6 | | | 6,672 | | | 0.7 | |
| Restaurants | | Restaurants | 5,367 | | | 0.6 | | | 1.3 | | | 4,556 | | | 0.5 | |
| Paper & Forest Products | | Paper & Forest Products | 2,208 | | | 0.2 | | | 0.5 | | | 2,984 | | | 0.3 | |
| | | | Total Portfolio | | Percentage of | | | | Total Portfolio | | $ | 936,614 | | | 100.0 | % | | 222.5 | % | | $ | 938,303 | | | 100.0 | % |
| | Fair Value | | at Fair Value | | Net Assets | | Cost | | at Cost | |
| | (dollars in thousands) | |
| March 31, 2020: | | | | | | | | | | |
| Business Services | $ | 92,365 |
| | 16.7 | % | | 33.9 | % | | $ | 92,879 |
| | 15.5 | % | |
| Media, Marketing, & Entertainment | 54,494 |
| | 10.0 |
| | 20.0 |
| | 45,202 |
| | 7.5 |
| |
| Healthcare Services | 51,037 |
| | 9.2 |
| | 18.7 |
| | 66,744 |
| | 11.1 |
| |
I-45 SLF LLC1 | 39,760 |
| | 7.2 |
| | 14.6 |
| | 68,000 |
| | 11.3 |
| |
| Industrial Services | 35,956 |
| | 6.5 |
| | 13.2 |
| | 35,931 |
| | 6.0 |
| |
| Software & IT Services | 35,690 |
| | 6.5 |
| | 13.1 |
| | 35,353 |
| | 5.9 |
| |
| Distribution | 31,632 |
| | 5.7 |
| | 11.6 |
| | 32,229 |
| | 5.5 |
| |
| Financial Services | 30,586 |
| | 5.5 |
| | 11.2 |
| | 29,651 |
| | 4.9 |
| |
| Healthcare Products | 29,775 |
| | 5.4 |
| | 10.9 |
| | 29,832 |
| | 5.0 |
| |
| Food, Agriculture & Beverage | 25,624 |
| | 4.6 |
| | 9.4 |
| | 30,937 |
| | 5.2 |
| |
| Consumer Products and Retail | 23,157 |
| | 4.2 |
| | 8.5 |
| | 23,549 |
| | 3.9 |
| |
| Transportation & Logistics | 22,218 |
| | 4.0 |
| | 8.2 |
| | 18,903 |
| | 3.2 |
| |
| Consumer Services | 21,403 |
| | 3.9 |
| | 7.9 |
| | 21,118 |
| | 3.5 |
| |
| Technology Products & Components | 14,610 |
| | 2.6 |
| | 5.4 |
| | 14,457 |
| | 2.4 |
| |
| Environmental Services | 12,148 |
| | 2.2 |
| | 4.5 |
| | 13,889 |
| | 2.3 |
| |
| Commodities & Mining | 10,411 |
| | 1.9 |
| | 3.8 |
| | 10,458 |
| | 1.7 |
| |
| Energy Services (Midstream) | 9,445 |
| | 1.7 |
| | 3.5 |
| | 9,532 |
| | 1.6 |
| |
| Restaurants | 5,621 |
| | 1.0 |
| | 2.1 |
| | 8,113 |
| | 1.4 |
| |
| Telecommunications | 4,140 |
| | 0.7 |
| | 1.5 |
| | 7,928 |
| | 1.3 |
| |
| Paper & Forest Products | 3,000 |
| | 0.5 |
| | 1.1 |
| | 2,965 |
| | 0.5 |
| |
| Industrial Products | — |
| | — |
| | — |
| | 1,517 |
| | 0.3 |
| |
| | $ | 553,072 |
| | 100.0 | % | | 203.1 | % | | $ | 599,187 |
| | 100.0 | % | |
1I-45 SLF LLC is a joint venture between CSWC and Main Street Capital Corporation. This entity primarily invests in syndicated senior secured loans to the UMM. The portfolio companies in I-45 SLF LLC represent a diverse set of industry classifications, which are similar to those in which CSWC invests directly. See Note 15 for further discussion.
|
| | | | | | | | | | | | | | | | |
| | | | Percentage of | | | | | | Percentage of |
| | | | Total Portfolio | | Percentage of | | | | Total Portfolio |
| | Fair Value | | at Fair Value | | Net Assets | | Cost | | at Cost |
| | (dollars in thousands) |
| March 31, 2019: | | | | | | | | | |
I-45 SLF LLC1 | $ | 65,743 |
| | 12.5 | % | | 20.2 | % | | $ | 68,000 |
| | 14.2 | % |
| Healthcare Services | 62,719 |
| | 12.0 |
| | 19.2 |
| | 62,701 |
| | 13.1 |
|
| Media, Marketing, & Entertainment | 59,410 |
| | 11.3 |
| | 18.2 |
| | 54,079 |
| | 11.3 |
|
| Industrial Products | 52,760 |
| | 10.1 |
| | 16.2 |
| | 5,415 |
| | 1.1 |
|
| Business Services | 52,405 |
| | 10.0 |
| | 16.1 |
| | 51,688 |
| | 10.8 |
|
| Environmental Services | 32,941 |
| | 6.3 |
| | 10.1 |
| | 33,873 |
| | 7.1 |
|
| Healthcare Products | 29,964 |
| | 5.7 |
| | 9.2 |
| | 29,826 |
| | 6.2 |
|
| Food, Agriculture & Beverage | 28,352 |
| | 5.4 |
| | 8.7 |
| | 30,991 |
| | 6.5 |
|
| Distribution | 25,680 |
| | 4.9 |
| | 7.9 |
| | 25,558 |
| | 5.4 |
|
| Consumer Products and Retail | 23,618 |
| | 4.5 |
| | 7.2 |
| | 23,762 |
| | 5.0 |
|
| Consumer Services | 22,630 |
| | 4.3 |
| | 6.9 |
| | 22,274 |
| | 4.7 |
|
| Transportation & Logistics | 17,869 |
| | 3.4 |
| | 5.5 |
| | 17,074 |
| | 3.6 |
|
| Energy Services (Midstream) | 9,783 |
| | 1.9 |
| | 3.0 |
| | 9,747 |
| | 2.0 |
|
| Financial Services | 9,707 |
| | 1.8 |
| | 3.0 |
| | 9,596 |
| | 2.0 |
|
| Commodities & Mining | 8,511 |
| | 1.6 |
| | 2.6 |
| | 8,383 |
| | 1.8 |
|
| Restaurants | 7,912 |
| | 1.5 |
| | 2.4 |
| | 7,978 |
| | 1.7 |
|
| Software & IT Services | 6,128 |
| | 1.2 |
| | 1.9 |
| | 6,277 |
| | 1.3 |
|
| Telecommunications | 5,056 |
| | 1.0 |
| | 1.5 |
| | 7,876 |
| | 1.6 |
|
| Paper & Forest Products | 2,883 |
| | 0.6 |
| | 0.9 |
| | 2,957 |
| | 0.6 |
|
| | $ | 524,071 |
| | 100.0 | % | | 160.7 | % | | $ | 478,055 |
| | 100.0 | % |
| |
1
| I-45 SLF LLC is a joint venture between CSWC and Main Street Capital Corporation. This entity primarily invests in syndicated senior secured loans to the UMM. The portfolio companies held by I-45 SLF LLC represent a diverse set of industry classifications, which are similar to those in which CSWC invests directly. See Note 16 for further discussion. |
The following tables summarize the composition of the investment portfolio by geographic region of the United States, at costfair value and fair valuecost (with corresponding percentage of total portfolio investments), as of March 31, 20202023 and 2019:March 31, 2022:
| | | | | | | | | | | | | | | | | | | | | | | | | | | | | |
| Fair Value | | Percentage of Total Portfolio
at Fair Value | | Percentage of Net Assets
at Fair Value | | Cost | | Percentage of Total Portfolio
at Cost |
| (dollars in thousands) |
| March 31, 2023: | | | | | | | | | |
| Northeast | $ | 269,569 | | | 22.3 | % | | 45.7 | % | | $ | 255,995 | | | 21.0 | % |
| Southeast | 235,782 | | | 19.5 | | | 39.9 | | | 236,333 | | | 19.4 | |
| Southwest | 234,127 | | | 19.4 | | | 39.6 | | | 231,467 | | | 19.0 | |
| West | 233,079 | | | 19.3 | | | 39.5 | | | 232,109 | | | 19.0 | |
| Midwest | 156,233 | | | 13.1 | | | 26.4 | | | 158,989 | | | 13.0 | |
I-45 SLF LLC1 | 51,256 | | | 4.2 | | | 8.7 | | | 80,800 | | | 6.6 | |
| International | 26,342 | | | 2.2 | | | 4.5 | | | 24,459 | | | 2.0 | |
| $ | 1,206,388 | | | 100.0 | % | | 204.3 | % | | $ | 1,220,152 | | | 100.0 | % |
| | | | | | | | | |
| March 31, 2022: | | | | | | | | | |
| Northeast | $ | 225,578 | | | 24.1 | % | | 53.6 | % | | $ | 221,780 | | | 23.6 | % |
| Southwest | 206,057 | | | 22.0 | | | 49.0 | | | 204,443 | | | 21.8 | |
| West | 163,924 | | | 17.5 | | | 38.9 | | | 153,292 | | | 16.3 | |
| Southeast | 136,588 | | | 14.6 | | | 32.5 | | | 138,929 | | | 14.9 | |
| Midwest | 132,308 | | | 14.1 | | | 31.4 | | | 129,354 | | | 13.8 | |
I-45 SLF LLC1 | 57,603 | | | 6.1 | | | 13.7 | | | 76,000 | | | 8.1 | |
| International | 14,556 | | | 1.6 | | | 3.4 | | | 14,505 | | | 1.5 | |
| $ | 936,614 | | | 100.0 | % | | 222.5 | % | | $ | 938,303 | | | 100.0 | % |
|
| | | | | | | | | | | | | | | | |
| | | | Percentage of | | | | | | Percentage of |
| | | | Total Portfolio | | Percentage of | | | | Total Portfolio |
| | Fair Value | | at Fair Value | | Net Assets | | Cost | | at Cost |
| | (dollars in thousands) |
| March 31, 2020: | | | | | | | | | |
| Southwest | $ | 167,082 |
| | 30.2 | % | | 61.3 | % | | $ | 167,192 |
| | 27.9 | % |
| Northeast | 124,250 |
| | 22.4 |
| | 45.6 |
| | 121,201 |
| | 20.2 |
|
| Southeast | 107,541 |
| | 19.4 |
| | 39.5 |
| | 122,547 |
| | 20.5 |
|
I-45 SLF LLC1 | 39,760 |
| | 7.2 |
| | 14.6 |
| | 68,000 |
| | 11.3 |
|
| West | 58,985 |
| | 10.7 |
| | 21.7 |
| | 65,135 |
| | 10.9 |
|
| Midwest | 43,454 |
| | 7.9 |
| | 16.0 |
| | 43,214 |
| | 7.2 |
|
| International | 12,000 |
| | 2.2 |
| | 4.4 |
| | 11,898 |
| | 2.0 |
|
| | $ | 553,072 |
| | 100.0 | % | | 203.1 | % | | $ | 599,187 |
| | 100.0 | % |
| March 31, 2019: | | | | | | | | | |
| Southwest | $ | 139,306 |
| | 26.6 | % | | 42.7 | % | | $ | 89,399 |
| | 18.7 | % |
| Northeast | 125,657 |
| | 24.0 |
| | 38.5 |
| | 122,404 |
| | 25.6 |
|
| Southeast | 119,280 |
| | 22.8 |
| | 36.6 |
| | 120,889 |
| | 25.3 |
|
I-45 SLF LLC1 | 65,743 |
| | 12.5 |
| | 20.2 |
| | 68,000 |
| | 14.2 |
|
| West | 38,455 |
| | 7.3 |
| | 11.8 |
| | 41,647 |
| | 8.7 |
|
| Midwest | 35,630 |
| | 6.8 |
| | 10.9 |
| | 35,716 |
| | 7.5 |
|
| | $ | 524,071 |
| | 100.0 | % | | 160.7 | % | | $ | 478,055 |
| | 100.0 | % |
| |
1
| I-45 SLF LLC is a joint venture between CSWC and Main Street Capital. This entity primarily invests in syndicated senior secured loans to the UMM. The portfolio companies held by I-45 SLF LLC represent a diverse set of industry classifications, which are similar to those in which CSWC invests directly. See Note 16 for further discussion. |
1I-45 SLF LLC is a joint venture between CSWC and Main Street Capital Corporation. This entity primarily invests in syndicated senior secured loans to the UMM. The portfolio companies held by I-45 SLF LLC represent a diverse set of geographic regions, which are similar to those in which CSWC invests directly. See Note 15 for further discussion.
4. FAIR VALUE MEASUREMENTS
Investment Valuation Process
The valuation process is led by the finance department in conjunction with the investment team. The process includes a monthlyquarterly review of each investment by our executive officers and investment teams.team. Valuations of each portfolio security are prepared quarterly by the finance department using updated financial and other operational information collected by the investment teams.team. Each investment valuation is then subject to review by the executive officers and investment teams.team. In conjunction with the internal valuation process, we have also engaged multiple independent consulting firms specializing in financial due diligence, valuation, and business advisory services to provide third-party valuation reviews of certain investments. The third-party valuation firms provide a range of values for selected investments, which is presented to CSWC’s executive officers and then subsequently to the Board of Directors.
CSWC also uses a standard internal investment rating system in connection with its investment oversight, portfolio management, and investment valuation procedures for its debt portfolio. This system takes into account both quantitative and qualitative factors of the portfolio company and the investments held therein.
There is no single standard for determining fair value in good faith, as fair value depends upon the specific circumstances of each individual investment. While management believes our valuation methodologies are appropriate and consistent with market participants, the recorded fair values of our investments may differ significantly from fair values that would have been used had an active market for the securities existed. In addition, changes in the market environment and other events that may occur over the life of the investments may cause the gains or losses ultimately realized on these investments to be different than the valuations currently assigned. The Board of Directors has the ultimate responsibility for reviewing and approving,determining, in good faith, the fair value of CSWC’s investments in accordance with the 1940 Act.
Fair Value Hierarchy
CSWC has established and documented processes for determining the fair values of portfolio company investments on a recurring basis in accordance with the 1940 Act and ASC 820. Asrequired by ASC 820, when the inputs used to measure fair value fall within different levels of the hierarchy, the level within which the fair value measurement is categorized is based on the lowest level input that is significant to the fair value measurement in its entirety. For example, a Level 3 fair value measurement may include inputs that are observable (Levels 1 and 2) and unobservable (Level 3). Therefore, unrealized appreciation and depreciation related to such investments categorized within the Level 3 tables below may include changes in fair value that are attributable to both observable inputs (Levels 1 and 2) and unobservable inputs (Level 3). CSWC conducts reviews of fair value hierarchy classifications on a quarterly basis. We also use judgment and consider factors specific to the investment in determining the significance of an input to a fair value measurement.
The three levels of valuation inputs established by ASC 820 are as follows:
•Level 1: Investments whose values are based on unadjusted quoted prices in active markets for identical assets or liabilities.
•Level 2: Investments whose values are based on quoted prices for similar assets and liabilities in active markets, and inputs that are observable for the asset or liability, either directly or indirectly, for substantially the full term of the financial instrument.
•Level 3: Investments whose values are based on unobservable inputs that are significant to the overall fair value measurement.
As of March 31, 20202023 and 2019,March 31, 2022, 100% of the CSWC investment portfolio consisted of privately held debt and equity instruments for which inputs falling within the categories of Level 1 and Level 2 are generally not readily available. Therefore, CSWC determines the fair value of its investments (excluding investments for which fair value is measured at net asset value ("NAV")) in good faith using Level 3 inputs, pursuant to aCSWC's valuation policy and processprocedures that isare established by the management of CSWC, with assistance from multiple third-party valuation advisors which is subsequentlyand approved by our Board of Directors.
Investment Valuation Inputs
ASC 820 defines fair value in terms of the price that would be received upon the sale of an asset or paid to transfer a liability in an orderly transaction between market participants at the measurement date excluding transaction costs. Under ASC 820, the fair value measurement also assumes that the transaction to sell an asset occurs in the principal market for the asset or, in the absence of a principal market, the most advantageous market for the asset. The principal market is the market in which the reporting entity would sell or transfer the asset with the greatest volume and level of activity for the asset. In determining the
principal market for an asset or liability under ASC 820, it is assumed that the reporting entity has access to the market as of the measurement date.
The Level 3 inputs to CSWC’s valuation process reflect our best estimate of the assumptions that would be used by market participants in pricing the investment in a transaction in the principal or most advantageous market for the asset.
The fair value determination of each portfolio investment categorized as Level 3 required one or more of the following unobservable inputs:
Financial•financial information obtained from each portfolio company, including unaudited statements of operations and balance sheets for the most recent period available as compared to budgeted numbers;
Current•current and projected financial condition of the portfolio company;
Current•current and projected ability of the portfolio company to service its debt obligations;
•type and amount of collateral, if any, underlying the investment;
Current•current financial ratios (e.g., fixed charge coverage ratio, interest coverage ratio and net debt/EBITDA ratio) applicable to the investment;
Current•current liquidity of the investment and related financial ratios (e.g., current ratio and quick ratio);
Indicative•indicative dealer quotations from brokers, banks, and other market participants;
Market•market yields on other securities of similar risk;
Pending•pending debt or capital restructuring of the portfolio company;
Projected•projected operating results of the portfolio company;
Current•current information regarding any offers to purchase the investment;
Current•current ability of the portfolio company to raise any additional financing as needed;
Changes•changes in the economic environment which may have a material impact on the operating results of the portfolio company;
Internal•internal occurrences that may have an impact (both positive and negative) on the operating performance of the portfolio company;
Qualitative•qualitative assessment of key management;
Contractual•contractual rights, obligations or restrictions associated with the investment; and
Other•other factors deemed relevant.
CSWC uses several different valuation approaches depending on the security type including the Market Approach, the Income Approach, the Enterprise Value Waterfall Approach, and the NAV Valuation Method.
Market Approach
Market Approach is a qualitative and quantitative analysis of the aforementioned unobservable inputs. It is a combination of the Enterprise Value Waterfall Approach and Income Approach as described in detail below. For investments recently originated (within a quarterly reporting period) or where the value has not departed significantly from its cost, we generally rely on our cost basis or recent transaction price to determine the fair value, unless a material event has occurred since origination.
Income Approach
In valuing debt securities, CSWC typically uses an Income Approach model, which considers some or all of the factors listed above. Under the Income Approach, CSWC develops an expectation of the yield that a hypothetical market participant would require when purchasing each debt investment (the “Required Market Yield”). The Required Market Yield is calculated in a two-step process. First, using quarterly market data we estimate the current market yield of similar debt securities. Next, based on the factors described above, we modify the current market yield for each security to produce a unique Required Market Yield for each of our investments. The resulting Required Market Yield is the significant Level 3 input to the Income Approach model. If, with respect to an investment, the unobservable inputs have not fluctuated significantly from the date the investment was made or have not fluctuated significantly from CSWC’s expectations on the date the investment was made, and there have been no significant fluctuations in the market pricing for such investments, we may conclude that the Required Market Yield for that investment is equal to the stated rate on the investment. In instances where CSWC determines that the Required Market Yield is different from the stated rate on the investment, we discount the contractual cash flows on the debt instrument using the Required Market Yield in order to estimate the fair value of the debt security.
In addition, under the Income Approach, CSWC also determines the appropriateness of the use of third-party broker quotes, if any, as a significant Level 3 input in determining fair value. In determining the appropriateness of the use of third-party broker quotes, CSWC evaluates the level of actual transactions used by the broker to develop the quote, whether the quote was
an indicative price or binding offer, the depth and consistency of broker quotes, the source of the broker quotes, and the correlation of changes in broker quotes with underlying performance of the portfolio company and other market indices. To the extent sufficient observable inputs are available to determine fair value, CSWC may use third-party broker quotes or other independent pricing to determine the fair value of certain debt investments.
Fair value measurements using the Income Approach model can be sensitive to significant changes in one or more of the inputs. A significant increase (decrease) in the Required Market Yield for a particular debt security may result in a lower (higher) fair value for that security. A significant increase (decrease) in a third-party broker quote for a particular debt security may result in a higher (lower) value for that security.
Enterprise Value Waterfall Approach
In valuing equity securities (including warrants), CSWC estimates fair value using an Enterprise Value Waterfall valuation model. CSWC estimates the enterprise value of a portfolio company and then allocates the enterprise value to the portfolio company’s securities in order of their relative liquidation preference. In addition, CSWC assumes that any outstanding debt or other securities that are senior to CSWC’s equity securities are required to be repaid at par. Additionally, we may estimate the fair value of non-performing debt securities using the Enterprise Value Waterfall approach as needed.
To estimate the enterprise value of the portfolio company, CSWC uses a weighted valuation model based on public comparable companies, observable transactions and discounted cash flow analyses. A main input into the valuation model is a measure of the portfolio company’s financial performance, which generally is either earnings before interest, taxes, depreciation and amortization, as adjusted (“Adjusted EBITDA”) or revenues. In addition, we consider other factors, including but not limited to (1) offers from third parties to purchase the portfolio company and (2) the implied value of recent investments in the equity securities of the portfolio company. For certain non-performing assets, we may utilize the liquidation or collateral value of the portfolio company’scompany's assets in our estimation of its enterprise value.
The significant Level 3 inputs to the Enterprise Value Waterfall model are (1) an appropriate multiple derived from the comparable public companies and transactions, (2) discount rate assumptions used in the discounted cash flow model and (3) a measure of the portfolio company’s financial performance, which generally is either Adjusted EBITDA or revenues. Inputs can be based on historical operating results, projections of future operating results or a combination thereof. The operating results of a portfolio company may be unaudited, projected or pro forma financial information and may require adjustments for certain non-recurring items. CSWC also may consult with the portfolio company’s senior management to obtain updates on the portfolio company’s performance, including information such as industry trends, new product development, loss of customers and other operational issues. Fair value measurements using the Enterprise Value Waterfall model can be sensitive to significant changes in one or more of the inputs. A significant increase (decrease) in either the multiple, Adjusted EBITDA or revenues for a particular equity security would result in a higher (lower) fair value for that security.
NAV Valuation Method
Under the NAV valuation method, for an investment in an investment fund that does not have a readily determinable fair value, CSWC measures the fair value of the investment predominately based on the NAV of the investment fund as of the measurement date. However, in determining the fair value of the investment, we may consider whether adjustments to the NAV are necessary in certain circumstances, based on the analysis of any restrictions on redemption of our investment as of the measurement date, recent actual sales or redemptions of interests in the investment fund, expected future cash flows available to equity holders, or other uncertainties surrounding CSWC’s ability to realize the full NAV of its interests in the investment fund.
Option Pricing Model Method
The following fair value hierarchy tables set forth our investment portfolio by level as of March 31, 20202023 and 2019March 31, 2022 (in thousands):
| | | | | | | | | | | | | | | | | | | | | | | |
| | | Fair Value Measurements |
| | | at March 31, 2023 Using |
| Asset Category | Total | | Quoted Prices in Active Markets for Identical Assets
(Level 1) | | Significant Other Observable Inputs
(Level 2) | | Significant Unobservable Inputs
(Level 3) |
| First lien loans | $ | 1,000,984 | | | $ | — | | | $ | — | | | $ | 1,000,984 | |
| Second lien loans | 35,820 | | | — | | | — | | | 35,820 | |
| Subordinated debt | 791 | | | — | | | — | | | 791 | |
| Preferred equity | 63,393 | | | — | | | — | | | 63,393 | |
| Common equity & warrants | 54,144 | | | — | | | — | | | 54,144 | |
Investments measured at net asset value1 | 51,256 | | | — | | | — | | | — | |
| Total Investments | $ | 1,206,388 | | | $ | — | | | $ | — | | | $ | 1,155,132 | |
| | | | | | | | | | | | | | | | | | | | | | | |
| | | | | | | |
| | | Fair Value Measurements |
| | | at March 31, 2022 Using |
| Asset Category | Total | | Quoted Prices in Active Markets for Identical Assets
(Level 1) | | Significant Other Observable Inputs
(Level 2) | | Significant Unobservable Inputs
(Level 3) |
| First lien loans | $ | 739,872 | | | $ | — | | | $ | — | | | $ | 739,872 | |
| Second lien loans | 52,645 | | | — | | | — | | | 52,645 | |
| Subordinated debt | 1,317 | | | — | | | — | | | 1,317 | |
| Preferred equity | 44,663 | | | — | | | — | | | 44,663 | |
| Common equity & warrants | 40,514 | | | — | | | — | | | 40,514 | |
Investments measured at net asset value1 | 57,603 | | | — | | | — | | | — | |
| Total Investments | $ | 936,614 | | | $ | — | | | $ | — | | | $ | 879,011 | |
1Certain investments that are measured at fair value using the NAV per share (or its equivalent) practical expedient have not been categorized in the fair value hierarchy. The fair value amounts presented in this table are intended to permit reconciliation of the fair value hierarchy to the amounts presented in Consolidated Statements of Assets and Liabilities. For the investment valued at NAV per share at March 31, 2023 and March 31, 2022, the redemption restrictions dictate that we cannot withdraw our membership interest without unanimous approval. We are permitted to sell or transfer our membership interest and must deliver written notice of such transfer to the other member no later than 60 business days prior to the sale or transfer.
|
| | | | | | | | | | | | | |
| | | | Fair Value Measurements |
| | | | at March 31, 2020 Using |
| | | | Quoted Prices in | | Significant | | |
| | | | Active Markets | | Other | | Significant |
| | | | for Identical | | Observable | | Unobservable |
| | | | Assets | | Inputs | | Inputs |
| Asset Category | Total | | (Level 1) | | (Level 2) | | (Level 3) |
| First lien loans | $ | 427,447 |
| | — |
| | — |
| | $ | 427,447 |
|
| Second lien loans | 37,139 |
| | — |
| | — |
| | 37,139 |
|
| Subordinated debt | 9,747 |
| | — |
| | — |
| | 9,747 |
|
| Preferred equity | 16,624 |
| | — |
| | — |
| | 16,624 |
|
| Common equity & warrants | 22,355 |
| | — |
| | — |
| | 22,355 |
|
Investments measured at net asset value1 | 39,760 |
| | — |
| | — |
| | — |
|
| Total Investments | $ | 553,072 |
| | — |
| | — |
| | $ | 513,312 |
|
|
| | | | | | | | | | | | | |
| | | | Fair Value Measurements |
| | | | at March 31, 2019 Using |
| | | | Quoted Prices in | | Significant | | |
| | | | Active Markets | | Other | | Significant |
| | | | for Identical | | Observable | | Unobservable |
| | | | Assets | | Inputs | | Inputs |
Asset Category2 | Total | | (Level 1) | | (Level 2) | | (Level 3) |
| First lien loans | $ | 317,544 |
| | — |
| | — |
| | $ | 317,544 |
|
| Second lien loans | 35,896 |
| | — |
| | — |
| | 35,896 |
|
| Subordinated debt | 14,287 |
| | — |
| | — |
| | 14,287 |
|
| Preferred equity | 17,936 |
| | — |
| | — |
| | 17,936 |
|
| Common equity & warrants | 72,665 |
| | — |
| | — |
| | 72,665 |
|
Investments measured at net asset value1 | 65,743 |
| | — |
| | — |
| | — |
|
| Total Investments | $ | 524,071 |
| | — |
| | — |
| | $ | 458,328 |
|
| |
1
| Certain investments that are measured at fair value using the NAV per share (or its equivalent) practical expedient have not been categorized in the fair value hierarchy. The fair value amounts presented in this table are intended to permit reconciliation of the fair value hierarchy to the amounts presented in Consolidated Statements of Assets and Liabilities. For the investment valued at net asset value per share at March 31, 2020 and 2019, the redemption restrictions dictate that we cannot withdraw our membership interest without unanimous approval. We are permitted to sell or transfer our membership interest and must deliver written notice of such transfer to the other member no later than 60 business days prior to the sale or transfer. |
The tabletables below presentspresent the Valuation Techniques and Significant Level 3 Inputs (ranges and weighted averages) used in the valuation of CSWC’s debt and equity securities at March 31, 20202023 and 2019. Unobservable inputsMarch 31, 2022. Significant Level 3 Inputs were weighted by the relative fair value of the investments. The table istables are not intended to be all inclusive, but instead capturescapture the significant unobservable inputs relevant to our determination of fair value.
| | | | | | | | | | | | | | | | | | | | | | | | | | | | | |
| | | Fair Value at | | Significant | | | | |
| Valuation | | March 31, 2023 | | Unobservable | | | | Weighted |
| Type | Technique | | (in thousands) | | Inputs | | Range | | Average |
| | | | | | | | | |
| First lien loans | Income Approach | | $ | 953,918 | | | Discount Rate | | 6.9% - 26.2% | | 13.0% |
| | | | | Third Party Broker Quote | | 5.1 - 96.5 | | 93.9 |
| Market Approach | | 41,923 | | | Cost | | 94.1 - 98.1 | | 97.9 |
| | | | | | | | | |
| Enterprise Value Waterfall Approach | | 5,143 | | | EBITDA Multiple | | 9.4x - 9.4x | | 9.4x |
| | | | | Discount Rate | | 27.2% - 27.2% | | 27.2% |
| Second lien loans | Income Approach | | 32,226 | | | Discount Rate | | 18.3% - 34.3% | | 25.1% |
| | | | | Third Party Broker Quote | | 61.3 - 61.3 | | 61.3 |
| | | | | | | | | |
| | | | | | | | | |
| Enterprise Value Waterfall Approach | | 3,594 | | | EBITDA Multiple | | 9.4x - 9.4x | | 9.4x |
| | | | | Discount Rate | | 27.2% - 27.2% | | 27.2% |
| | | | | | | | | |
| Subordinated debt | Market Approach | | 205 | | | Cost | | 100.0 - 100.0 | | 100.0 |
| Enterprise Value Waterfall Approach | | 586 | | | EBITDA Multiple | | 6.0x - 7.7x | | 6.6x |
| | | | | Discount Rate | | 20.2% - 25.0% | | 21.8% |
| Preferred equity | Enterprise Value Waterfall Approach | | 59,518 | | | EBITDA Multiple | | 4.7x - 16.7x | | 9.8x |
| | | | | Discount Rate | | 11.7% - 30.8% | | 17.1% |
| Market Approach | | 3,875 | | | Cost | | 100.0 - 100.0 | | 100.0 |
| Common equity & warrants | Enterprise Value Waterfall Approach | | 53,064 | | | EBITDA Multiple | | 5.5x - 18.6x | | 9.5x |
| | | | | Discount Rate | | 11.4% - 36.6% | | 18.2% |
| Market Approach | | 1,080 | | | Cost | | 100.0 - 100.0 | | 100.0 |
| | | | | | | | | |
| Total Level 3 Investments | | | $ | 1,155,132 | | | | | | | |
|
| | | | | | | | | | | |
| | | | Fair Value at | | Significant | | | | |
| | Valuation | | March 31, 2020 | | Unobservable | | | | Weighted |
| Type | Technique | | (in thousands) | | Inputs | | Range | | Average |
| First lien loans | Income Approach | | $ | 401,266 |
| | Discount Rate | | 7.0% - 52.5% | | 12.0% |
| | | | | | Third Party Broker Quote | | 43.8 - 56.5 | | 49.9 |
| | Market Approach | | 26,181 |
| | Cost | | 98.0 - 98.2 | | 98.1 |
| Second lien loans | Income Approach | | 37,139 |
| | Discount Rate | | 10.3% - 19.8% | | 12.7% |
| | | | | | Third Party Broker Quote | | 37.5 | | 37.5 |
| Subordinated debt | Income Approach | | 9,747 |
| | Discount Rate | | 13.3% | | 13.3% |
| Preferred equity | Enterprise Value Waterfall Approach | | 16,624 |
| | EBITDA Multiple | | 7.4x - 11.4x | | 9.3x |
| | | | | | Discount Rate | | 17.2% - 22.9% | | 19.3% |
| Common equity & warrants | Enterprise Value Waterfall Approach | | 22,355 |
| | EBITDA Multiple | | 5.3x - 11.4x | | 8.2x |
| | | | | | Discount Rate | | 15.4% - 22.7% | | 19.2% |
| Financial instruments | Option Pricing Model | | — |
| | Assumed Volatility | | 2.0% | | 2.0% |
| Total Level 3 Investments | | | $ | 513,312 |
| | | | | | |
| | | | | | Fair Value at | | Significant | | | | | | Fair Value at | | Significant | |
| | Valuation | | March 31, 2019 | | Unobservable | | | | Weighted | | Valuation | | March 31, 2022 | | Unobservable | | Weighted |
| Type | Technique | | (in thousands) | | Inputs | | Range | | Average | Type | Technique | | (in thousands) | | Inputs | | Range | | Average |
| | First lien loans | Income Approach | | $ | 248,404 |
| | Discount Rate | | 9.6% - 20.5% | | 12.1% | First lien loans | Income Approach | | $ | 645,034 | | | Discount Rate | | 7.3% - 30.6% | | 10.7% |
| | | | | | Third Party Broker Quote | | 65.6 - 97.5 | | 90.1 | | Third Party Broker Quote | | 5.5 - 96.5 | | 93.2 |
| | Market Approach | | 69,140 |
| | Cost | | 97.0 - 99.0 | | 97.7 | | Market Approach | | 94,838 | | | Cost | | 80.2 - 99.0 | | 98.1 |
| | | | | Exit Value | | 100.0 - 102.0 | | 101.4 | | Exit Value | | 100.0 - 102.0 | | 101.8 |
| Second lien loans | Income Approach | | 35,896 |
| | Discount Rate | | 11.5% - 41.9% | | 13.9% | Second lien loans | Income Approach | | 49,541 | | | Discount Rate | | 10.3% - 37.8% | | 15.4% |
| | | | | | Third Party Broker Quote | | 55 | | 55.0 | | Third Party Broker Quote | | 97.3 - 97.3 | | 97.3 |
| | | Enterprise Value Waterfall Approach | | 3,104 | | | EBITDA Multiple | | 8.3x - 8.3x | | 8.3x |
| | | Discount Rate | | 22.1% - 22.1% | | 22.1% |
| Subordinated debt | Income Approach | | 14,287 |
| | Discount Rate | | 12.6% - 15.0% | | 13.4% | Subordinated debt | Income Approach | | 650 | | | Discount Rate | | 27.4% - 27.4% | | 27.4% |
| | | Market Approach | | 172 | | | Cost | | 100.0 - 100.0 | | 100.0 |
| | | Enterprise Value Waterfall Approach | | 495 | | | EBITDA Multiple | | 8.1x - 8.1x | | 8.1x |
| | | Discount Rate | | 20.5% - 20.5% | | 20.5 |
| Preferred equity | Enterprise Value Waterfall Approach | | 17,936 |
| | EBITDA Multiple | | 7.7x - 10.2x | | 9.5x | Preferred equity | Enterprise Value Waterfall Approach | | 41,563 | | | EBITDA Multiple | | 6.9x - 18.8x | | 10.6x |
| | | Discount Rate | | 12.5% - 40.8% | | 17.8% |
| | | | | | Discount Rate | | 15.5% - 19.3% | | 17.8% | | Market Approach | | 3,100 | | | Cost | | 100.0 - 100.0 | | 100.0 |
| Common equity & warrants | Enterprise Value Waterfall Approach | | 71,665 |
| | EBITDA Multiple | | 4.6x - 10.7x | | 8.8x | Common equity & warrants | Enterprise Value Waterfall Approach | | 36,667 | | | EBITDA Multiple | | 4.2x - 11.4x | | 8.5x |
| | | | | | Discount Rate | | 13.9% - 21.0% | | 18.4% | | Discount Rate | | 10.1% - 32.2% | | 18.1% |
| | Market Approach | | 1,000 |
| | Cost | | 100.0 | | 100.0 | | Market Approach | | 1,757 | | | Exit Value | | 351.4 - 351.4 | | 351.4 |
| | | Income Approach | | 2,090 | | | Third Party Broker Quote | | 158.7 - 158.7 | | 158.7 |
| Total Level 3 Investments | | | $ | 458,328 |
| | | | | | | Total Level 3 Investments | | $ | 879,011 | | |
Changes in Fair Value Levels
We monitor the availability of observable market data to assess the appropriate classification of financial instruments within the fair value hierarchy. Changes in economic conditions or model based valuation techniques may require the transfer of financial instruments from one fair value hierarchylevel to another. During the years ended March 31, 20202023 and 2019,2022, we had no transfers between levels.
The following table providestables provide a summary of changes in the fair value of investments measured using Level 3 inputs during the yearsyear ended March 31, 20202023 and 20192022 (in thousands):
| | | | | | | | | | | | | | | | | | | | | | | | | | | | | | | | | | | | | | | | | | | | | | | | | | | | | |
| Fair Value March 31, 2022 | | Realized & Unrealized Gains (Losses) | | Purchases of Investments1 | | Repayments | | PIK Interest Capitalized | | Divestitures | | Conversion/Reclassification of Security | | Fair Value March 31, 2023 | | YTD Unrealized Appreciation (Depreciation) on Investments held at period end |
| First lien loans | $ | 739,872 | | | $ | (17,150) | | | $ | 415,332 | | | $ | (128,932) | | | $ | 5,577 | | | $ | — | | | $ | (13,715) | | | $ | 1,000,984 | | | $ | (13,189) | |
| Second lien loans | 52,645 | | | (7,127) | | | 2,990 | | | (12,310) | | | 314 | | | (692) | | | — | | | 35,820 | | | (5,923) | |
| Subordinated debt | 1,317 | | | (398) | | | 385 | | | — | | | 74 | | | — | | | (587) | | | 791 | | | (294) | |
| Preferred equity | 44,663 | | | (3,360) | | | 7,788 | | | — | | | — | | | — | | | 14,302 | | | 63,393 | | | (267) | |
| Common equity & warrants | 40,514 | | | 10,547 | | | 5,747 | | | — | | | — | | | (2,664) | | | — | | | 54,144 | | | 11,730 | |
| Total Investments | $ | 879,011 | | | $ | (17,488) | | | $ | 432,242 | | | $ | (141,242) | | | $ | 5,965 | | | $ | (3,356) | | | $ | — | | | $ | 1,155,132 | | | $ | (7,943) | |
| | | | | | | | | | | | | | | | | |
| Fair Value March 31, 2021 | | Realized & Unrealized Gains (Losses) | | Purchases of Investments1 | | Repayments | | PIK Interest Capitalized | | Divestitures | | Conversion/Reclassification of Security | | Fair Value March 31, 2022 | | YTD Unrealized Appreciation (Depreciation) on Investments held at period end |
| First lien loans | $ | 524,161 | | | $ | 719 | | | $ | 464,758 | | | $ | (247,538) | | | $ | 2,455 | | | $ | — | | | $ | (4,683) | | | $ | 739,872 | | | $ | (960) | |
| Second lien loans | 36,919 | | | (2,325) | | | 18,902 | | | (7,223) | | | 1,217 | | | (53) | | | 5,208 | | | 52,645 | | | (2,699) | |
| Subordinated debt | 11,534 | | | 422 | | | 364 | | | (11,521) | | | 518 | | | — | | | — | | | 1,317 | | | 322 | |
| Preferred equity | 22,608 | | | 11,889 | | | 10,691 | | | — | | | — | | | — | | | (525) | | | 44,663 | | | 11,363 | |
| Common equity & warrants | 36,052 | | | 12,035 | | | 4,308 | | | — | | | — | | | (11,881) | | | — | | | 40,514 | | | 7,401 | |
| Total Investments | $ | 631,274 | | | $ | 22,740 | | | $ | 499,023 | | | $ | (266,282) | | | $ | 4,190 | | | $ | (11,934) | | | $ | — | | | $ | 879,011 | | | $ | 15,427 | |
1Includes purchases of new investments, as well as discount accretion on existing investments.
|
| | | | | | | | | | | | | | | | | | | | | | | | | | | | | | | | | | | |
| | Fair Value 3/31/2019 | | Realized & Unrealized Gains (Losses) | | Purchases of Investments1 | | Repayments | | PIK Interest Capitalized | | Divestitures | | Conversion of Security | | Fair Value 3/31/2020 | | YTD Unrealized Appreciation (Depreciation) on Investments held at period end |
| First lien loans | $ | 317,544 |
| | $ | (16,987 | ) | | $ | 189,293 |
| | $ | (51,133 | ) | | $ | 1,360 |
| | $ | (12,630 | ) | | $ | — |
| | $ | 427,447 |
| | $ | (17,370 | ) |
| Second lien loans | 35,896 |
| | (1,279 | ) | | 2,121 |
| | (250 | ) | | 651 |
| | — |
| | — |
| | 37,139 |
| | (1,279 | ) |
| Subordinated debt | 14,287 |
| | (30 | ) | | 47 |
| | (4,569 | ) | | 12 |
| | — |
| | — |
| | 9,747 |
| | (94 | ) |
| Preferred equity | 17,936 |
| | 555 |
| | 4,563 |
| | — |
| | 55 |
| | (8,081 | ) | | 1,596 |
| | 16,624 |
| | 1,000 |
|
| Common equity & warrants | 72,665 |
| | (784 | ) | | 1,003 |
| | — |
| | — |
| | (48,933 | ) | | (1,596 | ) | | 22,355 |
| | 2,291 |
|
| Financial Instruments | — |
| | (1,517 | ) | | 1,517 |
| | — |
| | — |
| | — |
| | — |
| | — |
| | (1,517 | ) |
| Total Investments | $ | 458,328 |
| | $ | (20,042 | ) | | $ | 198,544 |
| | $ | (55,952 | ) | | $ | 2,078 |
| | $ | (69,644 | ) | | $ | — |
| | $ | 513,312 |
| | $ | (16,969 | ) |
| | | | | | | | | | | | | | | | | | |
| | Fair Value 3/31/2018 | | Realized & Unrealized Gains (Losses) | | Purchases of Investments1 | | Repayments | | PIK Interest Capitalized | | Divestitures | | Conversion of Security from Debt to Equity | | Fair Value 3/31/2019 | | YTD Unrealized Appreciation (Depreciation) on Investments held at period end |
| First lien loans | $ | 197,110 |
| | $ | (3,640 | ) | | $ | 186,601 |
| | $ | (33,226 | ) | | $ | 43 |
| | $ | (28,805 | ) | | $ | (539 | ) | | $ | 317,544 |
| | $ | (3,675 | ) |
| Second lien loans | 23,229 |
| | (226 | ) | | 21,274 |
| | (8,562 | ) | | 181 |
| | — |
| | — |
| | 35,896 |
| | (228 | ) |
| Subordinated debt | 18,783 |
| | (2 | ) | | 60 |
| | (4,600 | ) | | 46 |
| | — |
| | — |
| | 14,287 |
| | 12 |
|
| Preferred equity | 38,541 |
| | 10,997 |
| | 2,657 |
| | — |
| | 231 |
| | (34,490 | ) | | — |
| | 17,936 |
| | 4,456 |
|
| Common equity & warrants | 48,319 |
| | 6,611 |
| | 17,196 |
| | — |
| | — |
| | — |
| | 539 |
| | 72,665 |
| | 6,612 |
|
| Total Investments | $ | 325,982 |
| | $ | 13,740 |
| | $ | 227,788 |
| | $ | (46,388 | ) | | $ | 501 |
| | $ | (63,295 | ) | | $ | — |
| | $ | 458,328 |
| | $ | 7,177 |
|
| |
1
| Includes purchases of new investments, as well as discount accretion on existing investments. |
5. BORROWINGS
In accordance with the 1940 Act, with certain limitations, effective April 25, 2019, the Company is only allowed to borrow amounts such that its asset coverage (i.e., the ratio of assets less liabilities not represented by senior securities to senior securities such as borrowings), calculated pursuant to the 1940 Act, is at least 150% after such borrowing. The Board of Directors also approved a resolution which limits the Company’s issuance of senior securities such that the asset coverage ratio, taking into account any such issuance, would not be less than 166%, which became effective April 25, 2019. On August 11, 2021, we received an exemptive order from SEC to permit us to exclude the senior securities issued by SBIC I or any future SBIC subsidiary of the Company from the definition of senior securities in the asset coverage requirement applicable to the Company under the 1940 Act. As of March 31, 2020,2023, the Company’s asset coverage was 189%235%.
The Company had the following borrowings outstanding as of March 31, 20202023 and 2019March 31, 2022 (amounts in thousands):
| | | | | | | | | | | | | | | | | |
| March 31, 2023 | Outstanding Balance | | Unamortized Debt Issuance Costs and Debt Discount/Premium(1) | | Recorded Value |
| SBA Debentures | $ | 120,000 | | | $ | (3,670) | | | $ | 116,330 | |
| Credit Facility | 235,000 | | | — | | | 235,000 | |
| January 2026 Notes | 140,000 | | | (949) | | | 139,051 | |
| October 2026 Notes | 150,000 | | | (2,737) | | | 147,263 | |
| $ | 645,000 | | | $ | (7,356) | | | $ | 637,644 | |
| | | | | |
| March 31, 2022 | | | | | |
| SBA Debentures | $ | 40,000 | | | $ | (1,648) | | | $ | 38,352 | |
| Credit Facility | 205,000 | | | — | | | 205,000 | |
| January 2026 Notes | 140,000 | | | (1,286) | | | 138,714 | |
| October 2026 Notes | 150,000 | | | (3,478) | | | 146,522 | |
| $ | 535,000 | | | $ | (6,412) | | | $ | 528,588 | |
|
| | | | | | | |
| | March 31, 2020 | | March 31, 2019 |
| Credit Facility | $ | 154,000 |
| | $ | 141,000 |
|
| | | | |
| December 2022 Notes | 77,136 |
| | 77,136 |
|
| Less: Unamortized debt issuance costs and debt discount | (1,324 | ) | | (2,037 | ) |
| Total December 2022 Notes | 75,812 |
| | 75,099 |
|
| | | | |
| October 2024 Notes | 75,000 |
| | — |
|
| Less: Unamortized debt issuance costs and debt discount | (1,516 | ) | | — |
|
| Total October 2024 Notes | 73,484 |
| | — |
|
| | | | |
| Total Borrowings | $ | 303,296 |
| | $ | 216,099 |
|
Credit Facility
In August 2016, CSWC entered into a senior secured credit facility (as amended, restated, supplemented or otherwise modified from time to time, the(the “Credit Facility”) to provide additional liquidity to support its investment and operational activities, which included total commitments of $100 million. The Credit Facility contained an accordion feature that allowed CSWC to increase the total commitments under the Credit Facility up to $150 million from new and existing lenders on the same terms and conditions as the existing commitments. In August 2017, we increased our total commitments by $15 million through adding an additional lender using the accordion feature. activities.
On November 16, 2017,August 9, 2021, CSWC entered into Amendment No. 1 (the “Amendment”)the Second Amended and Restated Senior Secured Revolving Credit Agreement (as amended or otherwise modified from time to its Credit Facility.time, the "Credit Agreement"). Prior to the Amendment,Credit Agreement, (1) borrowings under the Credit Facility accrued interest on a per annum basis at a rate equal to the applicable LIBOR rate plus 3.25%2.50% with no LIBOR floor.floor, and (2) the total borrowing capacity was $340 million with commitments from a diversified group of eleven lenders. The Credit Agreement (1) decreased the total borrowing capacity under the Credit Facility to $335 million with commitments from a diversified group of ten lenders, (2) reduced the interest rate on borrowings to LIBOR plus 2.15% with no LIBOR floor and removed conditions related thereto as previously set forth in the Amended and Restated Senior Secured Revolving Credit Agreement, and (3) extended the end of the Credit Facility's revolver period from December 21, 2022 to August 9, 2025 and extended the final maturity from December 21, 2023 to August 9, 2026. The Credit Agreement also modified certain covenants in the Credit Facility, including, among other things, to increase the minimum obligors’ net worth test from $180 million to $200 million.
The Credit Facility contains an accordion feature that allows CSWC paidto increase the total commitments under the Credit Facility up to $400 million from new and existing lenders on the same terms and conditions as the existing commitments. On May 11, 2022, CSWC entered into Amendment No. 2 (the "Amendment") to the Credit Agreement. The Amendment changed the benchmark interest rate from LIBOR to Adjusted Term SOFR. In addition, CSWC entered into an Incremental Commitment Agreement, pursuant to which the total commitments under the Credit Agreement increased from $335 million to $380 million. On November 16, 2022, CSWC entered into an Incremental Assumption Agreement that
increased the total commitments of the Credit Agreement by $20 million, which increased total commitments from $380 million to $400 million. The $20 million increase was provided by one existing lender and one new lender, bringing the total bank syndicate to eleven participants.
CSWC pays unused commitment fees of 0.50% to 1.50%1.00% per annum, based on utilization, on the unused lender commitments under the Credit Facility. The Amendment (1) increased the total borrowing capacity under the Credit Facility to $180 million, with commitments from a diversified group of eight lenders, (2) increased the Credit Facility’s accordion feature that allows for an increase in total commitments of up to $250 million under the Credit Facility from new and existing lenders on the same terms and conditions as the existing commitments, (3) reduced the interest rate on borrowings from LIBOR plus 3.25% down to LIBOR plus 3.00%, with a further step-down to LIBOR plus 2.75% at the time the Company’s net worth exceeds $325 million, (4) reduced unused commitment fees from a utilization-based grid of 0.50% to 1.5% down to a range of 0.50% to 1.0% per annum, and (5) extended the Credit Facility’s revolving period that ended on August 30, 2019 through November 16, 2020. Additionally, the final maturity of the Credit Facility was extended from August 30, 2020 to November 16, 2021. On April 16, 2018 and May 11, 2018, CSWC entered into Incremental Assumption Agreements, which increased the total commitments under the Credit Facility by $20 million and $10 million, respectively. The increases were executed in accordance with the accordion feature of the Credit Facility, increasing total commitments from $180 million to $210 million.
On December 21, 2018, CSWC entered into the Amended and Restated Senior Secured Revolving Credit Agreement (the "Credit Agreement"), and a related Amended and Restated Guarantee, Pledge and Security Agreement, to amend and restate its Credit Facility. The Credit Agreement (1) increased the total commitments by $60 million from $210 million to an aggregate total of $270 million, provided by a diversified group of nine lenders, (2) increased the Credit Facility's accordion feature to $350 million under the Credit Facility from new and existing lenders on the same terms and conditions as the existing commitments, (3) reduced the interest rate on borrowings from LIBOR plus 3.00% to LIBOR plus 2.50%, subject to certain conditions as outlined in the Credit Agreement, (4) reduced the minimum asset coverage with respect to senior securities representing indebtedness from 200% to 150% after the date on which such minimum asset coverage is permitted to be reduced by the Company under applicable law, and (5) extended the Credit Facility's revolving period from November 16, 2020 to December 21, 2022 and the final maturity was extended from November 16, 2021 to December 21, 2023.
The Credit Agreement modified certain covenants in the Credit Facility, including: (1) to provide for a minimum senior coverage ratio of 2-to-1 (in addition to the asset coverage ratio noted below), (2) to increase the minimum obligors’ net worth test from $160 million to $180 million, (3) to reduce the minimum consolidated interest coverage ratio from 2.50-to-1 to 2.25-to-1 as of the last day of any fiscal quarter, and (4) to provide for the fact that the Company will not declare or pay a dividend or distribution in cash or other property unless immediately prior to and after giving effect thereto the Company's asset coverage ratio exceeds 150% (and certain other conditions are satisfied). The Credit Facility also contains certain affirmative and negative covenants, including but not limited to: (1) certain reporting requirements, (2) maintaining RIC and BDC status, (3) maintaining a minimum
senior coverage ratio of 2 to 1, (4) maintaining a minimum shareholders’ equity, (4)(5) maintaining a minimum consolidated net worth, (6) maintaining a regulatory asset coverage of not less than 150%, (7) maintaining an interest coverage ratio of at least 2.25 to 1.0, and (5)(8) at any time the outstanding advances exceed 90% of the borrowing base, maintaining a minimum liquidity of not less than 10% of the covered debt amount.
On May 23, 2019, CSWC entered into an Incremental Assumption Agreement that increased the total commitments under the accordion feature of the Credit Facility by $25 million, which increased total commitments from $270 million to $295 million. On March 19, 2020, CSWC entered into an Incremental Assumption Agreement that increased the total commitments under the accordion feature of the Credit Facility by $30 million, which increased total commitments from $295 million to $325 million.
The Credit FacilityAgreement also contains customary events of default, including, without limitation, nonpayment, misrepresentation of representations and warranties in a material respect, breach of covenant, bankruptcy, and change of control, with customary cure and notice provisions. If the Company defaults on its obligations under the Credit Facility,Agreement, the lenders may have the right to foreclose upon and sell, or otherwise transfer, the collateral subject to their security interests. There are no changes to the covenants or the events of default in the Credit Facility as a result of the Amendment.
The Credit Facility is secured by (1) substantially all of the present and future property and assets of the Company and the guarantors and (2) 100% of the equity interests in the Company’s wholly-owned subsidiaries.subsidiary. As of March 31, 2020,2023, substantially all of the Company’s assets were pledged as collateral for the Credit Facility.Facility, except for assets held in SBIC I.
At March 31, 2020,2023, CSWC had $154.0$235.0 million in borrowings outstanding under the Credit Facility. CSWC recognized interest expense related to the Credit Facility, including unused commitment fees and amortization of deferred loan costs, of $8.3$13.2 million, $6.2 million and $7.3$6.8 million respectively, for the years ended March 31, 20202023, 2022 and 2019.2021, respectively. The weighted average interest rate on the Credit Facility was 4.82%5.22% and 5.41%, respectively,2.50% for the years ended March 31, 20202023 and 2019.2022, respectively. Average borrowings for the years ended March 31, 20202023 and 20192022 were $134.7$213.7 million and $99.8$173.5 million, respectively. As of March 31, 20202023 and 2019,2022, CSWC was in compliance with all financial covenants under the Credit Facility.Agreement.
December 2022 Notes
In December 2017, the Company issued $57.5 million in aggregate principal amount, including the underwriters’ full exercise of their option to purchase additional principal amounts to cover over-allotments, of 5.95% Notes due 2022 (the “December 2022 Notes”). The December 2022 Notes mature on December 15, 2022 and may be redeemed in whole or in part at any time, or from time to time, at the Company’s option on or after December 15, 2019. The December 2022 Notes bear interest at a rate of 5.95% per year, payable quarterly on March 15, June 15, September 15 and December 15 of each year, beginning on March 15, 2018. The December 2022 Notes are an unsecured obligation, rank pari passu with our other outstanding and future unsecured unsubordinated indebtedness and are effectively subordinated to all of our existing and future secured indebtedness, including borrowings under our Credit Facility.
On June 11, 2018, the Company entered into an ATM debt distribution agreement, pursuant to which it may offer for sale, from time to time, up to $50 million in aggregate principal amount of December 2022 Notes through B. Riley FBR, Inc., acting as its sales agent (the “2022 Notes Agent”). Sales of the December 2022 Notes may be made in negotiated transactions or transactions that are deemed to be "at the market offerings" as defined in Rule 415 under the Securities Act of 1933, as amended, including sales made directly on The Nasdaq Global Select Market, or similar securities exchanges or sales made through a market maker other than on an exchange at prices related to prevailing market prices or at negotiated prices.
The 2022 Notes Agent receives a commission from the Company equal to up to 2% of the gross sales of any December 2022 Notes sold through the 2022 Notes Agent under the debt distribution agreement. The 2022 Notes Agent is not required to sell any specific principal amount of December 2022 Notes, but will use its commercially reasonable efforts consistent with its sales and trading practices to sell the December 2022 Notes. The December 2022 Notes trade “flat,” which means that purchasers in the secondary market will not pay, and sellers will not receive, any accrued and unpaid interest on the December 2022 Notes that is not reflected in the trading price.
During the year ended March 31, 2020, the Company did not sell any December 2022 Notes. The Company has no current intention of issuing additional December 2022 Notes under this ATM debt distribution agreement. Accordingly, during the three months ended June 30, 2019, the Company amortized $0.2 million of the remaining debt issuance costs associated with the ATM debt distribution agreement, which is included in interest expense in the Consolidated Statement of Operations for the year ended March 31, 2020.
All issuances of December 2022 Notes rank equally in right of payment and form a single series of notes.
As of March 31, 2020, the carrying amount of the December 2022 Notes was $75.8 million on an aggregate principal amount of $77.1 million at a weighted average effective yield of 5.93%. As of March 31, 2020, the fair value of the December 2022 Notes was $67.9 million. The fair value is based on the closing price of the security of The Nasdaq Global Select Market, which is a Level 1 input under ASC 820. The Company recognized interest expense related to the December 2022 Notes, including amortization of deferred issuance costs, of $5.3 million and $4.8 million for the years ended March 31, 2020 and 2019, respectively. Average borrowings for the years ended March 31, 2020 and 2019 were $77.1 million and $70.1 million, respectively.
The indenture governing the December 2022 Notes contains certain covenants including but not limited to (i) a requirement that the Company comply with the asset coverage requirement of Section 61 of the 1940 Act as modified by Section 61(a) of the 1940 Act or any successor provisions thereto, after giving effect to any exemptive relief granted to the Company by the SEC, (ii) a requirement, subject to a limited exception, that the Company will not declare any cash dividend, or declare any other cash distribution, upon a class of its capital stock, or purchase any such capital stock, unless, in every such case, at the time of the declaration of any such dividend or distribution, or at the time of any such purchase, the Company has the minimum asset coverage required pursuant to Section 61 of the 1940 Act or any successor provision thereto after deducting the amount of such dividend, distribution or purchase price, as the case may be, giving effect to any exemptive relief granted to the Company by the SEC and (iii) a requirement to provide financial information to the holders of the December 2022 Notes and the trustee under the indenture if the Company should no longer be subject to the reporting requirements under the Securities Exchange Act of 1934, as amended, (the "Exchange Act"). The indenture and supplement relating to the December 2022 Notes also provides for customary events of default. As of March 31, 2020, the Company was in compliance with all covenants of the December 2022 Notes.
October 2024 Notes
In September 2019, the Company issued $65.0 million in aggregate principal amount of 5.375% Notes due 2024 (the “Existing October 2024 Notes”). OnIn October 8, 2019, the Company issued an additional $10.0 million in aggregate principal amount of the October 2024 Notes (the "Additional October 2024 Notes"). In August 2020, the Company issued an additional $50.0 million in aggregate principal amount of the October 2024 Notes (the "New Notes" together with the Existing October 2024 Notes and the Additional October 2024 Notes, the "October 2024 Notes"). The Additional October 2024 Notes are beingand the New Notes were treated as a single series with the Existing October 2024 Notes under the indenture and havehad the same terms as the Existing October 2024 Notes. The maturity date of the October 2024 Notes mature onwas October 1, 2024, and may be redeemedthe October 2024 Notes were redeemable in whole or in part at any time prior to July 1, 2024, at par plus a “make-whole” premium, and thereafter at par. The October 2024 Notes bearbore interest at a rate of 5.375% per year.
On September 24, 2021, the Company redeemed $125.0 million in aggregate principal amount of the issued and outstanding October 2024 Notes. The October 2024 Notes were redeemed at 100% of their principal amount, plus (i) the accrued and unpaid interest thereon, through, but excluding the redemption date, and (ii) a "make-whole" premium. Accordingly, the Company recognized a realized loss on extinguishment of debt, equal to the write-off of the related unamortized debt issuance costs of $1.8 million and the "make-whole" premium of $15.2 million during the three months ended September 30, 2021.
The Company did not recognize any interest expense related to the October 2024 Notes for the year ended March 31, 2023. For the years ended March 31, 2022 and 2021, the Company recognized interest expense related to the October 2024 Notes, including amortization of deferred issuance costs, of $3.6 million and $6.3 million, respectively. From April 1, 2021 through September 24, 2021 (the redemption date of the October 2024 Notes), average borrowings were $125.0 million. The October 2024 Notes had a weighted average effective yield of 5.375%.
January 2026 Notes
In December 2020, the Company issued $75.0 million in aggregate principal amount of 4.50% Notes due 2026 (the "Existing January 2026 Notes"). The Existing January 2026 Notes were issued at par. In February 2021, the Company issued an additional $65.0 million in aggregate principal amount of the January 2026 Notes (the "Additional January 2026 Notes" together with the Existing January 2026 Notes, the "January 2026 Notes"). The Additional January 2026 Notes were issued at a price of 102.11% of the aggregate principal amount of the Additional January 2026 Notes, resulting in a yield-to-maturity of approximately 4.0% at issuance. The Additional January 2026 Notes are treated as a single series with the Existing January 2026 Notes under the indenture and have the same terms as the Existing January 2026 Notes. The January 2026 Notes mature on January 31, 2026 and may be redeemed in whole or in part at any time prior to October 31, 2025, at par plus a "make-whole" premium, and thereafter at par. The January 2026 Notes bear interest at a rate of 4.50% per year, payable semi-annually on April 1January 31 and October 1July 31 of each year, beginning on April 1, 2020.year. The October 2024January 2026 Notes are the direct unsecured obligations of the Company and rank pari passu with our other outstanding and future unsecured unsubordinated indebtedness and are effectively or structurally subordinated to all of our existing and future secured indebtedness, including borrowings under our Credit Facility.Facility and the SBA Debentures.
As of March 31, 2020,2023, the carrying amount of the October 2024January 2026 Notes was $73.5$139.1 million on an aggregate principal amount of $75.0$140.0 million at a weighted average effective yield of 5.375%4.46%. As of March 31, 2020,2023, the fair value of the October 2024January 2026 Notes was $65.7$122.8 million. This is a Level 3 fair value measurement under ASC 820 based on a valuation model using a discounted cash flow analysis. The Company recognized interest expense related to the October 2024January 2026 Notes, including amortization of deferred issuance costs, of $2.2$6.6 million, $6.7 million and $1.2 million for the yearyears ended March 31, 2020. Since the issuance2023, 2022 and 2021, respectively. For each of the October 2024 Notes,years ended March 31, 2023 and 2022, average borrowings were $74.4$140.0 million.
The indenture governing the October 2024January 2026 Notes contains certain covenants, including certain covenants requiring the Company to comply with Section 18(a)(1)(A) as modified by Section 61(a)(2) of the 1940 Act, or any successor provisions, whether or not the Company continues to be subject to such provisions of the 1940 Act, but giving effect, in either case, to any exemptive relief granted to the Company by the SEC, to comply with Section 18(a)(1)(B) as modified by Section 61(a)(2) of the 1940 Act, or any successor provisions, after giving effect to any exemptive relief granted to the Company by the SEC and subject to certain other exceptions, and to provide financial information to the holders of the January 2026 Notes and the trustee under the indenture if the Company is no longer subject to the reporting requirements under the Securities Exchange Act of 1934, as amended (the "Exchange Act"). These covenants are subject to important limitations and exceptions that are described in the indenture and the third supplemental indenture relating to the January 2026 Notes.
In addition, holders of the January 2026 Notes can require the Company to repurchase some or all of the January 2026 Notes at a purchase price equal to 100% of their principal amount, plus accrued and unpaid interest to, but not including, the repurchase date upon the occurrence of a “Change of Control Repurchase Event,” as defined in the third supplemental indenture relating to the January 2026 Notes.
October 2026 Notes
In August 2021, the Company issued $100.0 million in aggregate principal amount of 3.375% Notes due 2026 (the "Existing October 2026 Notes"). The Existing October 2026 Notes were issued at a price of 99.418% of the aggregate principal amount of the Existing October 2026 Notes, resulting in a yield-to-maturity of 3.5%. In November 2021, the Company issued an additional $50.0 million in aggregate principal amount of the October 2026 Notes (the "Additional October 2026 Notes" together with the Existing October 2026 Notes, the "October 2026 Notes"). The Additional October 2026 Notes were issued at a price of 99.993% of the aggregate principal amount, resulting in a yield-to-maturity of approximately 3.375% at issuance. The Additional October 2026 Notes are treated as a single series with the Existing October 2026 Notes under the indenture and have the same terms as the Existing October 2026 Notes. The October 2026 Notes mature on October 1, 2026 and may be redeemed in whole or in part at any time prior to July 1, 2026, at par plus a "make-whole" premium, and thereafter at par. The October 2026 Notes bear interest at a rate of 3.375% per year, payable semi-annually in arrears on April 1 and October 1 of each year. The October 2026 Notes are the direct unsecured obligations of the Company and rank pari passu with our other outstanding and future unsecured unsubordinated indebtedness and are effectively or structurally subordinated to all of our existing and future secured indebtedness, including borrowings under our Credit Facility and the SBA Debentures.
As of March 31, 2023, the carrying amount of the October 2026 Notes was $147.3 million on an aggregate principal amount of $150.0 million at a weighted average effective yield of 3.5%. As of March 31, 2023, the fair value of the October 2026 Notes was $132.2 million. This is a Level 3 fair value measurement under ASC 820 based on a valuation model using a discounted cash flow analysis. The Company recognized interest expense related to the October 2026 Notes, including
amortization of deferred issuance costs, of $5.8 million and $3.1 million for the years ended March 31, 2023 and 2022, respectively. For the year ended March 31, 2023, average borrowings were $150.0 million. Since the issuance of the October 2026 Notes on August 27, 2021 through March 31, 2022, average borrowings were $132.9 million.
The indenture governing the October 2026 Notes contains certain covenants, including certain covenants requiring the Company to comply with Section 18(a)(1)(A) as modified by Section 61(a)(2) of the 1940 Act, or any successor provisions, whether or not the Company continues to be subject to such provisions of the 1940 Act, but giving effect, in either case, to any exemptive relief granted to the Company by the SEC, to comply with Section 18(a)(1)(B) as modified by Section 61(a)(2) of the 1940 Act, or any successor provisions, after giving effect to any exemptive relief granted to the Company by the SEC and subject to certain other exceptions, and to provide financial information to the holders of the October 20242026 Notes and the trustee under the indenture if the Company is no longer subject to the reporting requirements under the Exchange Act. These covenants are subject to important limitations and exceptions that are described in the indenture and the secondfourth supplemental indenture relating to the October 20242026 Notes.
In addition, holders of the October 2026 Notes can require the Company to repurchase some or all of the October 20242026 Notes at a purchase price equal to 100% of their principal amount, plus accrued and unpaid interest to, but not including, the repurchase date upon the occurrence of a “Change of Control Repurchase Event,” as defined in the secondfourth supplemental indenture relating to the October 20242026 Notes.
SBA Debentures
On April 20, 2021, SBIC I received a license from the SBA to operate as an SBIC under Section 301(c) of the Small Business Investment Act of 1958, as amended. The license allows SBIC I to obtain leverage by issuing SBA Debentures, subject to the issuance of a leverage commitment by the SBA. SBA Debentures are loans issued to an SBIC which have interest payable semi-annually and a ten-year maturity. The interest rate is fixed shortly after issuance at a market-driven spread over U.S. Treasury Notes with ten-year maturities. Interest on SBA Debentures is payable semi-annually on March 1 and September 1. Current statutes and regulations permit SBIC I to borrow up to $175 million in SBA Debentures with at least $87.5 million in regulatory capital (as defined in the SBA regulations).
On May 25, 2021, SBIC I received a leverage commitment from the SBA in the amount of $40.0 million to be issued on or prior to September 30, 2025. On January 28, 2022, SBIC I received an additional leverage commitment in the amount of $40.0 million to be issued on or prior to September 30, 2026. On November 22, 2022, SBIC I received an additional leverage commitment in the amount of $50.0 million to be issued on or prior to September 30, 2027. As of March 31, 2023, SBIC I had regulatory capital of $65.0 million and leverageable capital of $65.0 million. As of March 31, 2023, SBIC I had a total leverage commitment from the SBA in the amount of $130.0 million, of which $10.0 million remains unused. The SBA may limit the amount that may be drawn each year under these commitments, and each issuance of leverage is conditioned on the Company’s full compliance, as determined by the SBA, with the terms and conditions set forth in the SBA regulations.
As of March 31, 2023, the carrying amount of SBA Debentures was $116.3 million on an aggregate principal amount of $120.0 million. As of March 31, 2023, the fair value of the SBA Debentures was $115.8 million. The fair value of the SBA Debentures is estimated by discounting the remaining payments using current market rates for similar instruments and considering such factors as the legal maturity date and the ability of market participants to prepay the SBA Debentures, which are Level 3 inputs under ASC 820. The Company recognized interest expense and fees related to SBA Debentures of $3.2 million and $0.3 million for the years ended March 31, 2023 and 2022, respectively. The weighted average interest rate on the SBA Debentures was 3.38% and 1.30% for the years ended March 31, 2023 and 2022, respectively. For the years ended March 31, 2023 and 2022, average borrowings were $82.6 million and $17.0 million, respectively.
As of March 31, 2023, the Company's issued and outstanding SBA Debentures mature as follows (amounts in thousands):
| | | | | | | | | | | | | | | | | | | | |
| Pooling Date (1) | | Maturity Date | | Fixed Interest Rate | | March 31, 2023 |
| 9/22/2021 | | 9/1/2031 | | 1.575% | | $ | 15,000 | |
| 3/23/2022 | | 3/1/2032 | | 3.209% | | 25,000 | |
| 9/21/2022 | | 9/1/2032 | | 4.435% | | 40,000 | |
| 3/22/2023 | | 3/1/2033 | | 5.215% | | 40,000 | |
| | | | | | $ | 120,000 | |
(1)The SBA has two scheduled pooling dates for SBA Debentures (in March and in September). Certain SBA Debentures funded during the reporting periods may not be pooled until the subsequent pooling date.
Contractual Payment Obligations
A summary of the Company's contractual payment obligations for the repayment of outstanding indebtedness at March 31, 20202023 is as follows:
| | | | | | | | | | | | | | | | | | | | | | | | | | | | | | | | | | | | | | | | | |
| Years Ending March 31, | | | | |
| 2024 | | 2025 | | 2026 | | 2027 | | 2028 | | Thereafter | | Total |
| SBA Debentures | $ | — | | | $ | — | | | $ | — | | | $ | — | | | $ | — | | | $ | 120,000 | | | $ | 120,000 | |
| Credit Facility | — | | | — | | | — | | | 235,000 | | | — | | | — | | | 235,000 | |
| January 2026 Notes | — | | | — | | | 140,000 | | | — | | | — | | | — | | | 140,000 | |
| October 2026 Notes | — | | | — | | | — | | | 150,000 | | | — | | | — | | | 150,000 | |
| Total | $ | — | | | $ | — | | | $ | 140,000 | | | $ | 385,000 | | | $ | — | | | $ | 120,000 | | | $ | 645,000 | |
|
| | | | | | | | | | | | | | | | | | | | | | | | | | | |
| | Years Ending March 31, | | | | |
| | 2021 | | 2022 | | 2023 | | 2024 | | 2025 | | Thereafter | | Total |
| Credit Facility | $ | — |
| | $ | — |
| | $ | — |
| | $ | 154,000 |
| | $ | — |
| | $ | — |
| | $ | 154,000 |
|
| December 2022 Notes | — |
| | — |
| | 77,136 |
| | — |
| | — |
| | — |
| | 77,136 |
|
| October 2024 Notes | — |
| | — |
| | — |
| | — |
| | 75,000 |
| | — |
| | 75,000 |
|
| Total | $ | — |
| | $ | — |
| | $ | 77,136 |
| | $ | 154,000 |
| | $ | 75,000 |
| | $ | — |
| | $ | 306,136 |
|
6. INCOME TAXES
We have elected, and intend to qualify annually, to be treated for U.S. federal income tax purposes as a RIC under Subchapter M of the Code and have a tax year end of December 31. In order to qualify as a RIC, we must annually distribute at least 90% of our investment company taxable income, as defined by the Code, to our shareholders in a timely manner. Investment company income generally includes net short-term capital gains but excludes net long-term capital gains. A RIC is not subject to federal income tax on the portion of its ordinary income and long-term capital gains that is distributed to its shareholders, including “deemed distributions” as discussed below. As part of maintaining RIC tax treatment, undistributed taxable income and capital gain, which is subject to a 4% non-deductible U.S. federal excise tax, pertaining to a given fiscal year may be distributed up to 12 months subsequent to the end of that fiscal year, provided such dividends are declared on or prior to the later of (1) the filingextended due date of the U.S. federal income tax return for the applicable fiscal year orand (2) the fifteenth day of the ninth month following the close of the year in which such taxable income was generated.
For the tax years ended December 31, 2019, 20182022, 2021 and 2017,2020, CSWC qualified for RIC tax treatment. We intend to meet the applicable qualifications to be taxed as a RIC in future periods. However, CSWC’sthe Company’s ability to meet certain portfolio diversification requirements of RICs in future years may not be controllable by CSWC.the Company.
We have distributed or intend to distribute sufficient dividends to eliminate taxable income for our completed tax years. If we fail to satisfy the 90% distribution requirement or otherwise fail to qualify as a RIC in any tax year, we would be subject to tax in that year on all of our taxable income, regardless of whether we made any distributions to our shareholders. During the quarter ended March 31, 2020,2023, CSWC declared regular dividendsa quarterly dividend in the amount of $9.5$20.9 million, or $0.51$0.58 per share ($0.410.53 per share in regular dividends and $0.10 in supplemental dividends). During the tax year ended December 31, 2019, we declared total dividends of $49.2 million or $2.72 per share ($1.57 per share in regular dividends, $0.40 per share in supplemental dividends and $0.75 in special dividends). We declared quarterly dividends of $0.48 per share in March 2019 ($0.38 per share in regular dividends and $0.10$0.05 per share in supplemental dividends), $0.49 per share ($0.39 per share in regular dividends and $0.10 per share in supplemental dividends) in June 2019, $0.50 per share ($0.40 per share in regular dividends and $0.10 per share in supplemental dividends) in September 2019, and $1.25 per share ($0.40 per share in regular dividends, $0.10 per share in supplemental dividends and $0.75 in special dividends) in December 2019. For. Our distributions for the tax yearyears ended December 31, 2018, we declared total dividends2022 and 2021 were as follows:
| | | | | |
| Payment Date | Cash Dividend |
| Tax Year Ended December 31, 2022 | |
| March 31, 2022 | $ | 0.48 | |
June 30, 20221 | 0.63 | |
| September 30, 2022 | 0.50 | |
December 31, 20222 | 0.57 | |
| $ | 2.18 | |
| |
| Tax Year Ended December 31, 2021 | |
March 31, 20213 | $ | 0.52 | |
June 30, 20213 | 0.53 | |
September 30, 20213 | 0.54 | |
December 31, 20214 | 0.97 | |
| $ | 2.56 | |
| |
| | | | | |
| Tax Year Ended December 31, 2020 | |
March 31, 20203 | $ | 0.51 | |
June 30, 20203 | 0.51 | |
September 30, 20203 | 0.51 | |
December 31, 20203 | 0.51 | |
| $ | 2.04 | |
1On June 30, 2022, CSWC paid a regular dividend of $0.28$0.48 per share in March 2018, $0.89and a special dividend of $0.15 per share.
2On December 31, 2022, CSWC paid a regular dividend of $0.52 per share ($0.29and a supplemental dividend of $0.05 per share.
3On each of these dates, the dividend paid included a supplemental dividend of $0.10 per share.
4On December 31, 2021, CSWC paid a regular dividend of $0.47 per share in regular dividends and $0.60 per share ina supplemental dividends) in June 2018, $0.44 per share ($0.34 per share in regular dividends and $0.10 per share in supplemental dividends) in September 2018, and $0.46 per share ($0.36 per share in regular dividends and $0.10 per share in supplemental dividends) in December 2018. For the tax year ended December 31, 2017, we declared total dividendsdividend of $18.3 million, or $1.16$0.50 per share. We declared quarterly dividends of $0.45 per share ($0.19 in regular dividends and $0.26 in supplemental dividends) in March 2017, $0.21 per share in June 2017, $0.24 per share in September 2017, and $0.26 per share in December 2017.
Book and tax basis differences relating to shareholder dividends and distributions to our shareholders and other permanent book and tax differences are typically reclassified among the CSWC’s capital accounts. In addition, the character of income and gains to be distributed is determined in accordance with income tax regulations that may differ from U.S. GAAP; accordingly, for the fiscal years ended March 31, 20202023 and 2019,2022, CSWC reclassified for book purposes amounts arising from permanent book/tax differences related to the tax treatment of return of capital and/or deemed distributions, tax treatment of investments upon disposition, and non-deductible expenses, as follows (amounts in thousands):
| | | | | | | | | | | |
| Years Ended March 31, |
| 2023 | | 2022 |
| Additional capital | $ | (6,420) | | | $ | (7,648) | |
| Total distributable earnings | 6,420 | | | 7,648 | |
|
| | | | | | | |
| | Year ended | | Year ended |
| | March 31, 2020 | | March 31, 2019 |
| Additional capital | $ | 10,808 |
| | $ | (1,798 | ) |
| Total distributable earnings | $ | (10,808 | ) | | $ | 1,798 |
|
The determination of the tax attributes offor CSWC’s distributions is made after tax year end, based upon its taxable income for the full tax year and distributions paid for the full tax year. Therefore, theany determination of tax attributes made on an interim basis for fiscal year end is forward-looking based on currently available facts, rules and assumptions and may not be representative of the actual tax attributes of distributions determined at tax year end.
For tax purposes, the 20192022 dividends totaled $2.72$2.18 per share and were comprised entirely of (1) ordinary income totaling approximately $1.3033 per share and (2) long-term capital gains totaling approximately $1.4167 per share. Included in ordinary income per share is approximately $0.189 per share of qualified dividend income. In addition, 88.73%89.74% of each of the ordinary distributions represent interest-related dividends and 2.64% of the ordinary distribution paid on March 29, 2019 represents short-term capital gains dividends. 95.07%89.74% of total distributions represent the portion of CSWC’s dividends received by non-U.S. residents and foreign corporation shareholders that are generally exempt from U.S. withholding tax. Of the qualified dividends of $3.2 million, 14.5% are eligible for the dividends received deduction. For tax purposes, the 20182021 dividends totaled $2.07$2.56 per share and were comprised entirely of (1) ordinary income totaling approximately $0.739 per share, (2) long term capital gains totaling approximately $1.332 per share, and (3) qualified dividend income totaling approximately $0.121 per share.income. In addition, 57.99%87.40% of each of the ordinary distributions represent interest-related dividends and 37.08% of each of the ordinary distributions represents short-term capital gains dividends. 98.24%87.40% of total distributions represent the portion of CSWC’s dividends received by non-U.S. residents and foreign corporation shareholders that are generally exempt from U.S. withholding tax. Of the qualified dividends of $1.9 million, 16.4% are eligible for the dividends received deduction.
Ordinary dividend distributions from a RIC do not qualify for the 20% maximum tax rate (plus a 3.8% Medicare surtax, if applicable) on dividend income from domestic corporations and qualified foreign corporations, except to the extent that the RIC received the income in the form of qualifying dividends from domestic corporations and qualified foreign corporations. The tax attributes for distributions will generally include both ordinary income and capital gains, but may also include qualified dividends or return of capital.
The tax character of distributions paid for the tax years ended December 31, 20192022 and 20182021 was as follows (amounts in thousands):
| | | | | | | | | | | |
| Twelve Months Ended December 31, |
| 2022 | | 2021 |
| Ordinary income | $ | 60,960 | | | $ | 56,633 | |
| Distributions of long term capital gains | — | | | — | |
Distributions on tax basis1 | $ | 60,960 | | | $ | 56,633 | |
|
| | | | | | | |
| | Twelve Months Ended December 31, |
| | 2019 | | 2018 |
| Ordinary income | $ | 22,405 |
| | $ | 11,723 |
|
| Distributions of long term capital gains | 25,703 |
| | 21,625 |
|
Distributions on tax basis1 | $ | 48,108 |
| | $ | 33,348 |
|
| |
1
| Includes only those distributions which reduce estimated taxable income. |
As of March 31, 2020,2023, CSWC estimates that it has cumulative undistributed taxable income of approximately $25.9$16.1 million, or $1.44$0.45 per share, that will be carried forward toward distributions to be paid in future periods. We intend to meet the applicable qualifications to be taxed as a RIC in future periods.
The following reconciles net (decrease) increase in net assets resulting from operations to estimated RIC taxable income for the years ended March 31, 2020, 20192023, 2022 and 2018:2021:
| | | | | | | | | | | | | | | | | |
| Years Ended March 31, |
Reconciliation of RIC Distributable Income1 | 2023 | | 2022 | | 2021 |
| Net increase in net assets from operations | $ | 33,093 | | | $ | 42,815 | | | $ | 50,883 | |
| Net unrealized depreciation (appreciation) on investments | 18,589 | | | (11,467) | | | (28,755) | |
| Income/gain (expense/loss) recognized for tax on pass-through entities | 962 | | | 3,753 | | | (11,000) | |
| (Gain) loss recognized on dispositions | (1,473) | | | 152 | | | 2,206 | |
Capital loss carryover2 | 12,796 | | | (878) | | | 17,924 | |
| Net operating income - wholly-owned subsidiary | 809 | | | (10,757) | | | (378) | |
| Dividend income from wholly-owned subsidiary | 1,068 | | | 4,000 | | | — | |
| Non-deductible tax expense | 628 | | | 65 | | | 1,066 | |
| Loss on extinguishment of debt | (2,726) | | | 12,268 | | | — | |
| Non-deductible compensation | 3,243 | | | 3,679 | | | — | |
| Compensation related book/tax differences | 812 | | | 36 | | | — | |
| Interest on non-accrual loans | 3,343 | | | 4,171 | | | — | |
| Other book/tax differences | 1,191 | | | 1,530 | | | 870 | |
| Estimated distributable income before deductions for distributions | $ | 72,335 | | | $ | 49,367 | | | $ | 32,816 | |
Distributions3: | | | | | |
| Ordinary | $ | 70,034 | | | $ | 57,518 | | | $ | 38,917 | |
| Capital gains | — | | | — | | | — | |
| Deemed distributions | — | | | — | | | — | |
Distributions payable3 | — | | | — | | | — | |
| Estimated annual RIC undistributed taxable income | $ | 2,301 | | | $ | (8,151) | | | $ | (6,101) | |
|
| | | | | | | | | | | |
| | Years ended March 31, |
| | 2020 | | 2019 | | 2018 |
Reconciliation of RIC Taxable Income1 | | | | | |
| Net (decrease) increase in net assets resulting from operations | $ | (22,351 | ) | | $ | 33,058 |
| | $ | 39,307 |
|
| Net change in unrealized depreciation (appreciation) on investments | 92,814 |
| | 11,506 |
| | (21,492 | ) |
| Income/gain (expense/loss) recognized for tax on pass-through entities | 177 |
| | 223 |
| | (403 | ) |
| Realized (loss) gain recognized for tax | (2,302 | ) | | 761 |
| | 643 |
|
| Net operating loss - management company and taxable subsidiary | (587 | ) | | (256 | ) | | 316 |
|
| Non-deductible tax expense | 4,572 |
| | 881 |
| | 228 |
|
| Other book tax differences | (304 | ) | | 98 |
| | (62 | ) |
| Estimated taxable income (loss) before deductions for distributions | $ | 72,019 |
| | $ | 46,271 |
| | $ | 18,537 |
|
Distributions2: | | | | | |
| Ordinary | $ | 23,540 |
| | $ | 15,468 |
| | $ | 7,020 |
|
| Capital gains | 25,703 |
| | 21,625 |
| | 930 |
|
| Deemed distributions | 16,483 |
| | — |
| | — |
|
Distributions payable2 | — |
| | — |
| | 4,421 |
|
| Estimated annual RIC undistributed taxable income | $ | 6,293 |
| | $ | 9,178 |
| | $ | 6,166 |
|
2At March 31, 2023, the Company had long-term capital loss carryforwards of $30.2 million to offset future capital gains. These capital loss carryforwards are not subject to expiration.
| |
1
| The calculation of taxable income for each period is an estimate and will not be finally determined until the Company files its tax return each year. Final taxable income may be different than this estimate. |
| |
2
| Includes only those distributions which reduce estimated taxable income. |
3Includes only those distributions which reduce estimated distributable income.
As of March 31, 2020, 20192023, 2022 and 2018,2021, the components of estimated RIC accumulated earnings on a tax basis were as follows (amounts in thousands):
| | | | Years ended March 31, | | Years Ended March 31, |
Components of RIC Accumulated Earnings on a Tax Basis1 | 2020 | | 2019 | | 2018 | Components of RIC Accumulated Earnings on a Tax Basis1 | | 2023 | | 2022 | | 2021 |
| Undistributed ordinary income - tax basis | $ | 25,766 |
| | $ | 19,532 |
| | $ | 13,427 |
| Undistributed ordinary income - tax basis | | $ | 16,070 | | | $ | 12,682 | | | $ | 21,083 | |
| Undistributed net realized gain | 749 |
| | 384 |
| | 2,276 |
| |
| Undistributed net realized (loss) gain | | Undistributed net realized (loss) gain | | (30,201) | | | (17,252) | | | (17,924) | |
| Unrealized (depreciation) appreciation on investments | (47,487 | ) | | 45,724 |
| | 57,264 |
| Unrealized (depreciation) appreciation on investments | | (61,710) | | | (20,126) | | | (766) | |
| Other temporary differences | — |
| | (917 | ) | | (321 | ) | Other temporary differences | | (13,639) | | | — | | | (663) | |
Distributions payable2 | — |
| | — |
| | (4,421 | ) | |
| Components of distributable earnings at year-end | $ | (20,972 | ) | | $ | 64,723 |
| | $ | 68,225 |
| Components of distributable earnings at year-end | | $ | (89,480) | | | $ | (24,696) | | | $ | 1,730 | |
| |
1
| The calculation of taxable income for each period is an estimate and will not be finally determined until the Company files its tax return each year. Final taxable income may be different than this estimate. |
| |
2
| Includes only those distributions which reduce estimated taxable income. |
As1The calculation of March 31, 2020, includingtaxable income for each period is an estimate and will not be finally determined until the RIC and the Taxable Subsidiary, the cost of investments for U.S. federalCompany files its tax return each year. Final taxable income tax purposes was $597.7 million, with such investments having a gross unrealized appreciation of $19.3 million and gross unrealized depreciation of $63.4 million.may be different than this estimate.
A RIC may elect to retain all or a portion of its long-termnet capital gains by designating them as a “deemed distribution” to its shareholders and paying a federal tax on the long-termnet capital gains for the benefit of its shareholders. Shareholders then report their share of the retained capital gains on their income tax returns as if it had been received and report a tax credit for tax paid on their behalf by the RIC. Shareholders then add the amount of the “deemed distribution” net of such tax to the basis of their shares.
For the tax year ended December 31, 2019, we had net long-term capital gains of $42.2 million, of which $25.7 million was distributed to shareholders as capital gains dividends. We elected to retain net long-term capital gains of $16.5 million and designate the retained amount as a "deemed distribution" to our shareholders. As a result, we incurred federal taxes on the retained
amount on behalf of our shareholders in the amount of $3.5 million for the tax year ended December 31, 2019. For the tax years ended December 31, 20182022, 2021 and 2017, we distributed all2020, there were no long-term capital gains and therefore had no deemed distributions to our shareholders or federal taxes incurred related to such items.
In addition, the Taxable Subsidiary wholly-owned subsidiaries of CSWC, are not RICs and are required to pay taxes at the current corporate rate. For tax purposes, CSMC and the Taxable Subsidiary have elected to be treated as taxable entities, and therefore are not consolidated for tax purposes and are taxed at normal corporate tax rates based on their taxable income and, as a result of their activities, may generate income tax expense or benefit. The taxable income, or loss, of CSMC and the Taxable Subsidiary may differ from book income, or loss, due to temporary book and tax timing differences and permanent differences. This income tax expense, or benefit, if any, and the related tax assets and liabilities, are reflected in our consolidated financial statements. CSMC records bonus accruals on a quarterly basis. Deferred taxes related to the changes in the restoration plan and bonus accruals are also recorded on a quarterly basis. The Taxable Subsidiary records valuation adjustments related to its investments on a quarterly basis. Deferred taxes related to the unrealized gain/loss on investments are also recorded on a quarterly basis. A valuation allowance is provided against deferred tax assets when it is more likely than not that some portion or all of the deferred tax asset will not be realized. Establishing a valuation allowance of a deferred tax asset requires management to make estimates related to expectations of future taxable income. Estimates of future taxable income are based on forecasted cash flows from CSMC’s operations. As of March 31, 2020 and 2019, CSMC had a deferred tax asset of approximately $1.4 million and $1.8 million, respectively. As of March 31, 2020, we believe that we will be able to utilize all $1.4 million of our deferred tax assets. We will continue to assess our ability to realize our existing deferred tax assets. As of March 31, 2020 and 2019, the Taxable Subsidiary had a deferred tax liability of $1.0 million and a deferred tax asset of $26.8 thousand, respectively.
Based on our assessment of our unrecognized tax benefits, management believes that all benefits will be realized and they do not contain any uncertain tax positions.
The following table sets forth the significant components of the deferred tax assets and liabilities as of March 31, 2020 and 2019 (amounts in thousands):
|
| | | | | | | |
| | Years ended |
| | 2020 | | 2019 |
| Deferred tax asset: | | | |
| Net operating loss carryforwards | $ | — |
| | $ | 132 |
|
| Compensation | 776 |
| | 1,020 |
|
| Pension liability | 647 |
| | 596 |
|
| Net unrealized depreciation on investments | — |
| | 27 |
|
| Other | (21 | ) | | 32 |
|
| Total deferred tax asset | 1,402 |
| | 1,807 |
|
| Deferred tax liabilities: | | | |
| Net unrealized appreciation on investments | (963 | ) | | — |
|
| Total deferred tax liabilities | (963 | ) | | — |
|
| Total net deferred tax assets | $ | 439 |
| | $ | 1,807 |
|
In addition, we have a wholly-owned taxable subsidiary, or the Taxable Subsidiary, which holds a portion of one or more of our portfolio investments that are listed on the Consolidated Schedule of Investments. The Taxable Subsidiary is consolidated for financial reporting purposes in accordance with U.S. GAAP, so that our consolidated financial statements reflect our investments in the portfolio companies owned by the Taxable Subsidiary. The purpose of the Taxable Subsidiary is to permit us to hold certain interests in portfolio companies that are organized as limited liability companies, or LLCs (or other forms of pass-through entities) and still satisfy the RIC tax requirement that at least 90% of our gross income for U.S. federal income tax purposes must consist of qualifying investment income. Absent the Taxable Subsidiary, a proportionate amount of any gross income of a partnership or LLC (or other pass-through entity) portfolio investment would flow through directly to us. To the extent that our income did not consist of investment income, it could jeopardize our ability to qualify as a RIC and therefore cause us to incur significant amounts of corporate-level U.S. federal income taxes.taxes at corporate rates. Where interests in LLCs (or other pass-through entities) are owned by the Taxable Subsidiary, however, the income from those interests is taxed to the Taxable Subsidiary and does not flow through to us, thereby helping us preserve our RIC statustax treatment and resultant tax advantages. The Taxable Subsidiary is not consolidated for U.S. federal income tax purposes and may generate an income tax expenseprovision as a result of their ownership of the portfolio companies. ThisThe income tax expense,provision, or benefit, and the related tax assets and liabilities, if any, are reflected in our Consolidated Statement of Operations.
As of March 31, 2023, the cost of investments held at the RIC for U.S. federal income tax purposes was $1,172.7 million, with such investments having gross unrealized appreciation of $10.5 million and gross unrealized depreciation of $72.3 million, resulting in net unrealized depreciation of $61.8 million. As of March 31, 2023, the cost of investments held at the Taxable Subsidiary for U.S. federal income tax purposes was $38.1 million, with such investments having gross unrealized appreciation of $61.8 million and gross unrealized depreciation of $4.5 million, resulting in net unrealized appreciation of $57.3 million. On a consolidated basis, the total investment portfolio has net unrealized depreciation of $4.5 million for U.S. federal income tax purposes.
CSMC, a former wholly-owned subsidiary of CSWC, was not a RIC, and was required to pay taxes at the current corporate rate. Effective December 31, 2020, CSMC merged with and into CSWC, which is not subject to corporate federal income taxes. For tax purposes, CSMC had elected to be treated as a taxable entity, and therefore was not consolidated for tax purposes and was taxed at normal corporate tax rates based on its taxable income and, as a result of its activities, may generate an income tax provision or benefit. The Taxable Subsidiary is not a RIC and is required to pay taxes at the current corporate rate. For tax purposes, the Taxable Subsidiary has elected to be treated as a taxable entity, and therefore is not consolidated for tax purposes and is taxed at normal corporate tax rates based on its taxable income and, as a result of its activities, may generate an income tax provision or benefit.
The taxable income, or loss, of CSMC and the Taxable Subsidiary may differ from book income, or loss, due to temporary book and tax timing differences and permanent differences. This income tax provision, or benefit, if any, and the related tax assets and liabilities, are reflected in our consolidated financial statements. CSMC recorded deferred taxes related to the changes in the restoration plan and bonus accruals on a quarterly basis. The Taxable Subsidiary records valuation adjustments related to its investments on a quarterly basis. Deferred taxes related to the unrealized gain/loss on investments are also recorded on a quarterly basis. A valuation allowance is provided against deferred tax assets when it is more likely than not that some portion or all of the deferred tax asset will not be realized. Establishing a valuation allowance of a deferred tax asset requires management to make estimates related to expectations of future taxable income. As of March 31, 2023 and March 31, 2022, the Taxable Subsidiary had a deferred tax liability of $12.1 million and $5.7 million, respectively.
Based on our assessment of our unrecognized tax benefits, management believes that all benefits will be realized and they do not contain any uncertain tax positions.
The following table sets forth the significant components of the deferred tax assets and liabilities as of March 31, 2023 and March 31, 2022 (amounts in thousands):
| | | | | | | | | | | |
| March 31, 2023 | | March 31, 2022 |
| Deferred tax asset: | | | |
| Net operating loss carryforwards | $ | — | | | $ | — | |
| Interest | 219 | | 185 | |
| Total deferred tax asset | 219 | | 185 |
| Deferred tax liabilities: | | | |
| Net unrealized appreciation on investments | (11,413) | | | (4,899) | |
| Net basis differences in portfolio investments | (923) | | | (1,033) | |
| Total deferred tax liabilities | (12,336) | | | (5,932) | |
| Total net deferred tax (liabilities) assets | $ | (12,117) | | | $ | (5,747) | |
The income tax expense,provision, or benefit, and the related tax assets and liabilities, generated by CSWC CSMC and the Taxable Subsidiary, if any, are reflected in CSWC’s consolidated financial statements. For the year ended March 31, 2020,2023, we recognized a net income tax provision of $0.3 million, principally consisting of a $0.6 million accrual for U.S. federal excise tax and a $0.3 million tax benefit relating to the Taxable Subsidiary. For the year ended March 31, 2022, we recognized a net income tax provision of $0.6 million, principally consisting of a $0.1 million accrual for U.S. federal excise tax and a $0.5 million tax provision relating to the Taxable Subsidiary. For the year ended March 31, 2021, we recognized total net income tax expenseprovision of $2.1$2.4 million, principally consisting of a $1.1$0.6 million accrual for a 4% U.S. federal excise tax on our estimated undistributed taxable income,and a provision for U.S. federal income taxes relating to CSMC of $0.7$1.8 million (of(all of which $0.3 million is current expense and $0.4 million is deferred expense) and $0.3 millionrelated to the write off of the deferred tax expense relating to the Taxable Subsidiary. For the year ended March 31, 2019, we recognized a total net income tax provision of $1.0 million, principally consisting of a $0.9 million accrual for a 4% U.S. federal excise tax on our estimated undistributed taxable income, a provision for deferred U.S. federal income taxes relating to CSMC of $0.2 million and a $0.1 million benefit relating to the Taxable Subsidiary.asset at CSMC).
Although we believe our tax returns are correct, the final determination of tax examinations could be different from what was reported on the returns. In our opinion, we have made adequate tax provisions for years subject to examination. Generally, we are currently open to audit under the statute of limitations by the Internal Revenue Service as well as state taxing authorities for the years ended December 31, 20152019 through 2018.December 31, 2021.
The following table sets forth the significant components of the income tax expenseprovision as of March 31, 2020, 20192023, 2022 and 20182021 (amounts in thousands):
| | | | | | | | | | | | | | | | | |
| Years Ended March 31, |
| Components of Income Tax Provision | 2023 | | 2022 | | 2021 |
| 162(m) limitation | $ | — | | | $ | — | | | $ | 122 | |
| Excise tax | 630 | | | 65 | | | 637 | |
| Write-off of deferred tax asset | — | | | — | | | 1,837 | |
| Tax (benefit) provision related to Taxable Subsidiary | (301) | | | 550 | | | 50 | |
| Stock compensation benefits | — | | | — | | | (207) | |
| Other | — | | | — | | | 3 | |
| Total income tax provision (benefit) | $ | 329 | | | $ | 615 | | | $ | 2,442 | |
|
| | | | | | | | | | | |
| | Years ended March 31, |
| Components of Income Tax Expense | 2020 | | 2019 | | 2018 |
| Statutory federal income tax | $ | 270 |
| | $ | 73 |
| | $ | (91 | ) |
| 162(m) limitation | 1,488 |
| | 476 |
| | 710 |
|
| Excise tax | 1,110 |
| | 880 |
| | 228 |
|
| Valuation allowance | — |
| | — |
| | (1,324 | ) |
| Tax related to Taxable Subsidiary | 315 |
| | (109 | ) | | — |
|
| Prior year deferred tax true-up | — |
| | — |
| | (164 | ) |
| Compensation benefits | (1,129 | ) | | (280 | ) | | (426 | ) |
| Tax Reform | — |
| | — |
| | 1,246 |
|
| Other | 8 |
| | 8 |
| | 16 |
|
| Total income tax expense | $ | 2,062 |
| | $ | 1,048 |
| | $ | 195 |
|
7. SHAREHOLDERS’SHAREHOLDERS' EQUITY
Public Equity Offering
On October 26, 2010, we receivedNovember 17, 2022, the Company completed an exemptive order from the SEC permitting us to issue restrictedunderwritten public equity offering of 2,534,436 shares of common stock, to our executive officers and certain key employees, or the Original Order. On August 22, 2017, we received the Exemptive Order that supersedes the Original Order and in addition to the relief granted under the Original Order, allows us to withholdincluding shares to satisfy tax withholding obligations related to the vesting of restricted stock grantedissuable pursuant to the 2010 Restricted Stock Award Plan, or the 2010 Plan, andunderwriters' option to pay the exercisepurchase additional shares, at a public offering price of options to purchase shares of our common stock granted pursuant to the 2009 Stock Incentive Plan, or the 2009 Plan. During the year ended March 31, 2020, the Company repurchased 19,865 shares at an aggregate cost of approximately $0.4 million and a weighted average price$18.15 per share, raising $46.0 million of $21.04 in connection with the vesting of restricted stock awards. During the year ended March 31, 2019, the Company repurchased 9,732 shares at an aggregate cost of approximately $0.2gross proceeds. Net proceeds were $44.1 million after deducting underwriting discounts and a weighted average price per share of $19.18 in connection with the vesting of restricted stock awards.offering expenses.
Equity ATM Program
On March 4, 2019, the Company established an "at-the-market" offering (the "Equitythe Equity ATM Program")Program, pursuant to which the Company may offer and sell, from time to time through sales agents, shares of its common stock having an aggregate offering price of up to $50,000,000. On February 4, 2020, the Company (i) increased the maximum amount of shares of its common stock to be sold through the Equity ATM Program to $100,000,000 from $50,000,000 and (ii) added two additional sales agents to the Equity ATM Program. DuringOn May 26, 2021, the year endedCompany (i) increased the maximum amount of shares of its common stock to be sold through the Equity ATM Program to $250,000,000 from $100,000,000 and (ii) reduced the commission paid to the sales agents for the Equity ATM Program to 1.5% from 2.0% of the gross sales price of shares of the Company's common stock sold through the sales agents pursuant to the Equity ATM Program on and after May 26, 2021. On August 2, 2022, the Company increased the maximum amount of shares of its common stock to be sold through the Equity ATM Program to $650,000,000 from $250,000,000.
The following table summarizes certain information relating to shares sold under the Equity ATM Program:
| | | | | | | | | | | |
| |
| | | |
| | | |
| | | |
| | | |
| | | |
| | | |
| Years Ended March 31, |
| 2023 | | 2022 |
| Number of shares sold | 8,435,462 | | | 3,872,031 | |
| Gross proceeds received (in thousands) | $ | 161,216 | | | $ | 99,636 | |
Net proceeds received (in thousands)1 | $ | 158,798 | | | $ | 98,142 | |
| Weighted average price per share | $ | 19.11 | | | $ | 25.73 | |
1Net proceeds reflects proceeds after deducting commissions to the sales agents on shares sold and offering expenses. As of March 31, 2020,2023, no proceeds remained receivable. As of March 31, 2022, $1.7 million in proceeds remained receivable and was included in other receivables in the Consolidated Statement of Assets and Liabilities..
Cumulative to date, the Company has sold 1,231,43216,613,122 shares of its common stock under the Equity ATM Program at a weighted-average price of $21.71 per share,$20.75, raising $26.7$344.7 million of gross proceeds. Net proceeds were $26.2 million, after deducting commissions to the sales agents on shares sold. During the year ended March 31, 2019, the Company sold 263,656 shares of its common stock under the Equity ATM Program at a weighted-average price of $21.47 per share, raising $5.7 million of gross proceeds. Net proceeds were $5.5$339.1 million after commissions to the sales agents on shares sold.
On August 1, 2019, after receiving the requisite shareholder approval, As of March 31, 2023, the Company filed an amendmenthas $305.3 million available under the Equity ATM Program.
Share Repurchases
The right to grant restricted stock awards under the 2010 Plan terminated on July 18, 2021, ten years after the date that the 2010 Plan was approved by the Company’s shareholders pursuant to its Amendedterms. In connection with the termination of the 2010 Plan, the Company’s Board of Directors and Restated Articlesshareholders approved the 2021 Employee Plan, which became effective on July 28, 2021, as part of Incorporationthe compensation package for its employees, the terms of which are, in all material respects, identical to increase the amount2010 Plan. On July 19, 2021, we received an exemptive order that supersedes the prior exemptive order relating to the 2010 Plan (the “Order”) to permit the Company to (i) issue restricted stock as part of authorizedthe compensation package for its employees in the 2021 Employee Plan, and (ii) withhold shares of the Company’s common stock or purchase shares of the Company’s common stock from 25,000,000the participants to 40,000,000.satisfy tax withholding obligations relating to the vesting of restricted stock pursuant to the 2021 Employee Plan.
Share Repurchase Program
In January 2016,addition, the Company’sCompany's Board of Directors and shareholders approved the Capital Southwest Corporation 2021 Non-Employee Director Restricted Stock Plan (the "Non-Employee Director Plan"), which became effective on July 27, 2022, as part of the compensation package for non-employee directors of the Board of Directors. In connection therewith, on May 16, 2022, we received an exemptive order that supersedes the Order (the "Superseding Order") and covers both employees and non-employee directors of the Board of Directors. The following table summarizes certain information relating to shares repurchased in connection with the vesting of restricted stock awards:
| | | | | | | | | | | |
| |
| | | |
| | | |
| | | |
| | | |
| | | |
| Years Ended March 31, |
| 2023 | | 2022 |
| Number of shares repurchased | 49,590 | | | 52,124 | |
| Aggregate cost of shares repurchased (in thousands) | $ | 1,021 | | | $ | 1,408 | |
| Weighted average price per share | $ | 20.59 | | | $ | 27.01 | |
On July 28, 2021, the Company's Board of Directors approved a share repurchase program authorizing the Company to repurchase up to $10$20 million of its outstanding shares of common stock in the open market at certain thresholds below its NAV per share, in accordance with guidelines specified in Rules 10b5-1(c)(1)(i)(B) and 10b-18 under the Securities Exchange Act of 1934.Act. On March 1, 2016,August 31, 2021, the Company entered into a share repurchase agreement, which became effective immediately, and shall terminate on the earliest of: (1) the date on which a total of $10 million worth of common shares have been purchased under the plan; (2) the date on which the terms set forth in the purchase instructions have been met; or (3) the date that is one trading day after the date on which insider notifies broker in writing that this agreement shall terminate.
During the year ended March 31, 2020, the Company repurchased a total of 794,180 shares at an average price of $11.57 per share, including commissions paid and, as a result, the Company may repurchase up to an additional $43 thousand ofwill cease purchasing its common stock under the share repurchase program. Duringprogram upon the year ended March 31, 2019,earlier of, among other things: (1) the date on which the aggregate purchase price for all shares equals $20 million including, without limitation, all applicable fees, costs and expenses; or (2) upon written notice by the Company repurchased a total of 10,452 shares at an average price of $17.72 perto the broker that the share including commissions paid. The following table summarizes the Company’s share repurchases under the program forrepurchase agreement is terminated. During the years ended March 31, 20202023 and 2019: 2022, the Company did not repurchase any shares under the share repurchase program.
|
| | | | | | | |
| | Year Ended March 31, |
| Repurchases of Common Stock | 2020 | | 2019 |
| Number of shares repurchased | 794,180 |
| | 10,452 |
|
| Cost of shares repurchased, including commissions | $ | 9,209,154 |
| | $ | 185,217 |
|
| Weighted average price per share | $ | 11.57 |
| | $ | 17.72 |
|
| Net asset value per share at quarter end prior to repurchase | $ | 16.74 |
| | $ | 18.84 |
|
| Weighted average discount to net asset value at quarter end prior to repurchase | 30.9 | % | | 5.9 | % |
8. EMPLOYEE STOCK BASED COMPENSATION PLANS
Stock Awards
Under the 2010 Restricted Stock AwardPlan and the 2021 Employee Plan, a restricted stock award is an award of shares of our common stock, which have full voting and dividend rights but are restricted with regard to sale or transfer. Restricted stock awards are independent of stock grants and are generally subject to forfeiture if employment terminates prior to these restrictions lapsing. Unless otherwise specified in the award agreement, these shares vest in equal annual installments over a four-year period from the grant date and are expensed over the vesting period starting on the grant date.
On August 22, 2017, we received the Exemptive Order from the SEC that supersedes the Original Order and, in additionThe right to the relief grantedgrant restricted stock awards under the Original Order, allows2010 Plan terminated on July 18, 2021, ten years after the Companydate that the 2010 Plan was approved by the Company’s shareholders pursuant to withhold shares to satisfy tax withholding obligations related toits terms.
In connection with the vestingtermination of restricted stock granted pursuantthe 2010 Plan, the Company’s Board of Directors and shareholders approved the 2021 Employee Plan as part of the compensation packages for its employees, the terms of which are, in all material respects, identical to the 2010 Plan. The Third Amendment to the 20102021 Employee Plan which became effective on August 22, 2017, reflects amendments relating to the Exemptive Order.
On August 2, 2018, the Fourth Amendment to the 2010 Plan increased the number ofmakes available for issuance 1,200,000 shares of Companycommon stock. As of March 31, 2023, there are 1,005,633 shares of common stock available for issuance by 850,000 shares.under the 2021 Employee Plan.
In addition, the Company's Board of Directors and shareholders approved the Non-Employee Director Plan as part of the compensation package for non-employee directors of the Board of Directors. Under the Non-Employee Director Plan, at the beginning of each one-year term of service on our Board, each non-employee director will receive a number of shares equivalent to $50,000 based on the market value at the close of the Nasdaq Global Select Market on the date of grant. These shares will vest one year from the date of the grant and are expensed over the one-year term of non-employee directors. The Fourth Amendment also includes revisions regarding change in control provisions, minimum vesting periods, incorporationNon-Employee Director Plan makes available for issuance 120,000 shares of a clawback policy and other technical revisions.
The following table summarizes the restrictedcommon stock. As of March 31, 2023, there are 107,895 shares of common stock available for issuance forunder the year ended March 31, 2020:Non-Employee Director Plan.
|
| | |
Restricted stock available for issuance as of March 31, 2019 | 657,627 |
|
Additional restricted stock approved under the plan | — |
|
Restricted stock granted during the year ended March 31, 2020 | (97,845 | ) |
Restricted stock forfeited during the year ended March 31, 2020 | 20,150 |
|
Restricted stock available for issuance as of March 31, 2020 | 579,932 |
|
We expense the cost of the restricted stock awards, which is determined to equal the fair value of the restricted stock award at the date of grant on a straight-line basis over the requisite service period. For these purposes, the fair value of the restricted stock award is determined based upon the closing price of our common stock on the date of the grant.
For the fiscal years ended March 31, 2020, 2019,2023, 2022, and 2018,2021, we recognized total share based compensation expense of $2.9$3.7 million $2.2(of which $0.2 million was related to restricted stock issued to non-employee directors), $3.6 million and $1.7$2.9 million, respectively, related to the restricted stock issued to our employees and officers.issued.
During the three months ended June 30, 2019,2021, the Company modified restricted stock awards to accelerate vesting of the unvested awards as of the retirementseparation date for one employee. The Company accounted for this as a modification of awards and recognized incremental compensation cost of $0.2$0.6 million. The incremental compensation cost is measured as the excess of the fair value of the modified award over the fair value of the original award immediately before its terms were modified and recognized as compensation cost on the date of modification for vested awards.
As of March 31, 2020,2023, the total remaining unrecognized compensation expense related to non-vested restricted stock awards was $5.7$7.0 million, which will be amortized over the weighted-average vesting period of approximately 2.42.3 years.
The following table summarizes the restricted stock outstanding under the 2010 Plan and the 2021 Employee Plan as of March 31, 2020:2023:
| | | | | | | | | | | | | | | | | |
| | | Weighted Average | | Weighted Average |
| | | Fair Value Per | | Remaining Vesting |
| Restricted Stock Awards | Number of Shares | | Share at grant date | | Term (in Years) |
| Unvested at March 31, 2021 | 429,776 | | | $ | 17.05 | | | 2.5 |
| Granted | 172,945 | | | 27.60 | | | — | |
| Vested | (167,072) | | | 17.71 | | | — | |
| Forfeited | (39,656) | | | 16.07 | | | — | |
| Unvested at March 31, 2022 | 395,993 | | | $ | 21.48 | | | 2.4 |
| Granted | 199,042 | | | 21.25 | | | — | |
| Vested | (148,774) | | | 20.49 | | | — | |
| Forfeited | (13,550) | | | 24.71 | | | — | |
| Unvested at March 31, 2023 | 432,711 | | | $ | 21.61 | | | 2.4 |
|
| | | | | | | | | |
| | | | Weighted Average | | Weighted Average |
| | | | Fair Value Per | | Remaining Vesting |
| Restricted Stock Awards | Number of Shares | | Share at grant date | | Term (in Years) |
| Unvested at March 31, 2018 | 372,163 |
| | $ | 15.82 |
| | 2.9 |
|
| Granted | 204,400 |
| | 19.19 |
| | 3.6 |
|
| Vested | (120,286 | ) | | 15.86 |
| | — |
|
| Forfeited | (2,250 | ) | | 15.60 |
| | — |
|
| Unvested at March 31, 2019 | 454,027 |
| | $ | 17.33 |
| | 2.8 |
|
| Granted | 97,845 |
| | 21.11 |
| | 3.6 |
|
| Vested | (172,136 | ) | | 16.58 |
| | — |
|
| Forfeited | (20,150 | ) | | 18.78 |
| | — |
|
| Unvested at March 31, 2020 | 359,586 |
| | $ | 18.64 |
| | 2.4 |
|
Stock Options
On July 20, 2009, shareholders approved our 2009 Plan, which provides for the granting of stock options to employees and officers and authorizes the issuance of common stock upon exercise of stock options for up to 560,000 shares. All options are granted at or above market price, generally expire up to 10 years from the date of grant and are generally exercisable on or after the first anniversary of the date of grant in five annual installments.
On August 22, 2017, we received the Exemptive Order from the SEC that supersedes the Original Order and, in addition to the relief granted under the Original Order, allows us to withhold shares of our common stock to satisfy the exercise of options to purchase shares of our common stock granted pursuant to the 2009 Plan.
At March 31, 2020, there are no options to acquire shares of common stock outstanding. The 2009 Plan terminated on July 20, 2019, the tenth anniversary of the date that the 2009 Plan was approved by the Company's shareholders.
The following table summarizes activity in the 2009restricted stock outstanding under the Non-Employee Director Plan as of March 31, 2020:2023:
| | | | | | | | | | | | | | | | | |
| | | Weighted Average | | Weighted Average |
| | | Fair Value Per | | Remaining Vesting |
| Restricted Stock Awards | Number of Shares | | Share at grant date | | Term (in Years) |
| Unvested at March 31, 2022 | — | | | $ | — | | | — | |
| Granted | 12,105 | | | 20.66 | | | — | |
| Vested | — | | | — | | | — | |
| Forfeited | — | | | — | | | — | |
| Unvested at March 31, 2023 | 12,105 | | | $ | 20.66 | | | 0.4 |
|
| | | | | | | | | | | | |
| | | | | | Weighted | | |
| | | | | | Average | | Aggregate |
| | | | | | Exercise | | Intrinsic |
| | Number of Shares | | | | Price | | Value |
| 2009 Plan | | | | | |
| | |
|
| Balance at March 31, 2017 | 206,364 |
| | | | $ | 11.12 |
| | |
|
| Granted | — |
| | | | — |
| | |
|
| Exercised | (10,756 | ) | | | | 11.66 |
| | $ | 58,081 |
|
| Canceled/Forfeited | — |
| | | | — |
| | |
| Balance at March 31, 2018 | 195,608 |
| | | | 11.09 |
| | |
| Granted | — |
| | | | — |
| | |
| Exercised | (195,608 | ) | | | | 11.09 |
| | $ | 1,563,905 |
|
| Canceled/Forfeited | — |
| | | | — |
| | |
| Balance at March 31, 2019 | — |
| | | | — |
| | |
| Granted | — |
| | | | — |
| | |
| Exercised | — |
| | | | — |
| | |
| Canceled/Forfeited | — |
| | | | — |
| | |
| Balance at March 31, 2020 | — |
| | | | $ | — |
| | |
We recognize compensation cost using the straight-line method for all share-based payments. The fair value of stock options is determined on the date of grant using the Black-Scholes pricing model and is expensed over the requisite service period of the related stock options. Accordingly, for the year ended March 31, 2020, there was no expense recognized. For the years ended March 31, 2019 and 2018, we recognized stock option compensation expense of $38.7 thousand, and $154.6 thousand, respectively, related to the stock options held by our employees and officers. As of March 31, 2020, there is no remaining unrecognized compensation expense related to stock options.
At March 31, 2020, there are no remaining options outstanding. During the year ended March 31, 2019, no options were granted, 11,750 options vested with a total fair value of approximately $0.1 million and 195,608 options were exercised with an average exercise price of $11.09.
At March 31, 2018, the range of exercise prices was $7.55 to $11.66 and the weighted-average remaining contractual life of outstanding options was 5.6 years. The total number of options exercisable under both the 2009 Plan and the 1999 Plan at March 31, 2018 was 183,658 shares with a weighted-average exercise price of $11.07. During the year ended March 31, 2018, no options were granted, 69,272 options vested with a total fair value of approximately $0.4 million and 10,756 options were exercised with an average exercise price of $11.66.
9. OTHER EMPLOYEE COMPENSATION
We established a 401(k) plan (“401K(the “401K Plan”) effective October 1, 2015. All full-time employees are eligible to participate in the 401K Plan. The 401K Plan permits employees to defer a portion of their total annual compensation up to the Internal Revenue Service annual maximum based on age and eligibility. We made contributions to the 401K Plan of up to 4.5% of the Internal Revenue Service’s annual maximum eligible compensation, all of which is fully vested immediately. During each of the yearsyear ended March 31, 2020, 20192023, 2022 and 2018,2021, we made matching contributions of approximately $0.2 million, $0.1 million, and $0.1 million, respectively. million.
10. RETIREMENT PLANS
Until the Share Distribution, CSWC sponsored a qualified defined benefit pension plan that covered its employees and employees of certain of its controlled affiliates. In connection with the Share Distribution, we entered into an Employee Matters Agreement with CSWI on September 8, 2015, which was amended and restated on September 14, 2015. Under the Employee Matters Agreement, CSWC and CSMC withdrew as participating employers in the qualified defined benefit pension plan and CSWI became the Sponsoring Employer of the Qualified Retirement Plan and assumed all the liabilities, assets and future funding obligations for providing benefits for the covered Participants in the Qualified Retirement Plan.
Additionally, CSWC sponsors an unfunded Retirement Restoration Plan, which is a nonqualified plan that provides for the payment, upon retirement, of the difference between the maximum annual payment permissible under the qualified retirement plan pursuant to federal limitations and the amount which would otherwise have been payable under the qualified plan. The Company retained all liabilities associated with benefits accrued under the Retirement Restoration Plan on behalf of individuals who remain employees of the Company or CSMC following September 30, 2015 or who terminated employment prior to September 30, 2015 with vested benefits under the Retirement Restoration Plan. Unvested accrued benefits under the Retirement Restoration Plan were forfeited as of September 30, 2015. The Retirement Restoration Plan is a frozen plan under which no new service cost is being accrued by plan participants.
The following tables set forth the Retirement Restoration Plan’s net pension benefit and benefit obligation amounts at March 31, 2020, 20192023, 2022 and 2018,2021, as well as amounts recognized in our Consolidated Statements of Assets and Liabilities at March 31, 20202023 and 20192022 (amounts in thousands):
| | | | Years ended March 31, | | Years ended March 31, |
| | 2020 | | 2019 | | 2018 | | 2023 | | 2022 | | 2021 |
| Net pension cost | |
| | |
| | |
| Net pension cost | | | | | |
| Interest cost on projected benefit obligation | $ | 111 |
| | $ | 113 |
| | $ | 116 |
| Interest cost on projected benefit obligation | $ | 90 | | | $ | 79 | | | $ | 96 | |
| Net amortization | 31 |
| | 46 |
| | 48 |
| Net amortization | 33 | | | 37 | | | 35 | |
| Net pension cost from restoration plan | $ | 142 |
| | $ | 159 |
| | $ | 164 |
| Net pension cost from restoration plan | $ | 123 | | | $ | 116 | | | $ | 131 | |
| | | | | | | | | | | | | | | | | |
| | Years ended March 31, |
| | 2023 | | 2022 | | 2021 |
| Change in benefit obligation | | | | | |
| Benefit obligation at beginning of year | $ | 2,707 | | | $ | 2,979 | | | $ | 3,082 | |
| Interest cost | 90 | | | 79 | | | 96 | |
| Actuarial (gain) loss | (2,052) | | | (104) | | | 42 | |
| Benefits paid | (147) | | | (247) | | | (241) | |
| Benefit obligation at end of year | $ | 598 | | | $ | 2,707 | | | $ | 2,979 | |
|
| | | | | | | | | | | |
| | Years ended March 31, |
| | 2020 | | 2019 | | 2018 |
| Change in benefit obligation | |
| | |
| | |
|
| Benefit obligation at beginning of year | $ | 3,073 |
| | $ | 2,937 |
| | $ | 3,020 |
|
| Interest cost | 111 |
| | 113 |
| | 116 |
|
| Actuarial loss | 122 |
| | 232 |
| | 11 |
|
| Benefits paid | (224 | ) | | (209 | ) | | (210 | ) |
| Benefit obligation at end of year | $ | 3,082 |
| | $ | 3,073 |
| | $ | 2,937 |
|
| | | | Years ended March 31, | | Years ended March 31, |
| | 2020 | | 2019 | | 2023 | | 2022 |
| Amounts recognized in our Consolidated Statements of Assets and Liabilities | |
| | |
| Amounts recognized in our Consolidated Statements of Assets and Liabilities | | | |
| Projected benefit obligation | $ | (3,082 | ) | | $ | (3,073 | ) | Projected benefit obligation | $ | (598) | | | $ | (2,707) | |
| Net actuarial loss recognized as a component of equity | 1,091 |
| | 1,000 |
| |
| Net actuarial (gain) loss recognized as a component of equity | | Net actuarial (gain) loss recognized as a component of equity | (1,128) | | | 957 | |
| Total | $ | (1,991 | ) | | $ | (2,073 | ) | Total | $ | (1,726) | | | $ | (1,750) | |
| | | | | | | | |
| Accumulated benefit obligation | $ | (3,082 | ) | | $ | (3,073 | ) | Accumulated benefit obligation | $ | (598) | | | $ | (2,707) | |
The corridor approach is used to amortize the actuarial gains or losses based on 10% of the projected benefit obligation. The estimated netincrease in the actuarial loss that will be amortized from equity into net pension cost during 2021 is approximately $35.0 thousand.gain in the current year was primarily due to the death of a retired participant in the Retirement Restoration Plan.
The following assumptions were used in estimating the actuarial present value of the projected benefit obligations:
|
| | | | | | | | |
| | Years ended March 31, |
| | 2020 | | 2019 | | 2018 |
| Discount rate | 3.25 | % | | 3.75 | % | | 4.00 | % |
| | | | | | | | | | | | | | | | | |
| | Years ended March 31, |
| | 2023 | | 2022 | | 2021 |
| Discount rate | 5.00 | % | | 3.50 | % | | 2.75 | % |
The following assumptions were used in estimating the net periodic (income)/expense:
|
| | | | | | | | |
| | Years ended March 31, |
| | 2020 | | 2019 | | 2018 |
| Discount rate | 3.75 | % | | 4.00 | % | | 4.00 | % |
| | | | | | | | | | | | | | | | | |
| | Years ended March 31, |
| | 2023 | | 2022 | | 2021 |
| Discount rate | 3.50 | % | | 2.75 | % | | 3.25 | % |
Following are the expected benefit payments for the next five years and in the aggregate for the years 2026-20302029-2033 (amounts in thousands): | | | | | | | | | | | | | | | | | | | | | | | | | | | | | | | | | | | |
| 2024 | | 2025 | | 2026 | | 2027 | | 2028 | | 2029-2033 |
| Restoration Plan | $ | 47 | | | $ | 47 | | | $ | 47 | | | $ | 46 | | | $ | 46 | | | $ | 221 | |
|
| | | | | | | | | | | | | | | | | | | | | | | |
| | 2021 | | 2022 | | 2023 | | 2024 | | 2025 | | 2026-2030 |
| Restoration Plan | $ | 241 |
| | $ | 245 |
| | $ | 241 |
| | $ | 237 |
| | $ | 232 |
| | $ | 1,074 |
|
11. COMMITMENTS AND CONTINGENCIES
Commitments
In the normal course of business, the Company is a party to financial instruments with off-balance sheet risk, consisting primarily of unused commitments to extend financing to the Company’s portfolio companies. SinceBecause commitments may expire without being drawn upon, the total commitment amount does not necessarily represent future cash requirements. Additionally, our commitment to fund delayed draw term loans generally is triggered upon the satisfaction of certain pre-negotiated terms and conditions, such as meeting certain financial performance hurdles or financial covenants, which may limit a borrower's ability to draw on such delayed draw term loans.
The balances of unfunded debt commitments as of March 31, 2023 and March 31, 2022 were as follows (amounts in thousands):
| | | | | | | | | | | | | | |
| | March 31, | | March 31, |
| Portfolio Company | | 2023 | | 2022 |
| Revolving Loans | | | | |
| | | | |
| Acacia BuyerCo V LLC | | $ | 2,000 | | | $ | — | |
| Acceleration, LLC | | 1,300 | | | — | |
| Air Conditioning Specialist, Inc. | | 1,200 | | | 1,000 | |
| American Teleconferencing Services, Ltd. (DBA Premiere Global Services, Inc.) | | 154 | | | 117 | |
| ArborWorks, LLC | | 1,000 | | | 3,000 | |
| ATS Operating, LLC | | 2,000 | | | 1,500 | |
| Cadmium, LLC | | — | | | 308 | |
| Catbird NYC, LLC | | 4,000 | | | 4,000 | |
| Cavalier Buyer, Inc. | | 2,000 | | | — | |
| Central Medical Supply LLC | | 1,200 | | | 1,200 | |
| Dynamic Communities, LLC | | — | | | 500 | |
| Exact Borrower, LLC | | 2,500 | | | — | |
| Fast Sandwich, LLC | | — | | | 3,100 | |
| FM Sylvan, Inc. | | 8,000 | | | — | |
| Gains Intermediate, LLC | | 2,500 | | | — | |
| GPT Industries, LLC | | 3,000 | | | — | |
| GrammaTech, Inc. | | 2,500 | | | 2,500 | |
| GS Operating, LLC | | — | | | 1,540 | |
| Gulf Pacific Acquisition, LLC | | 657 | | | — | |
| ISI Enterprises, LLC | | 2,000 | | | 1,200 | |
| Island Pump and Tank, LLC | | 1,000 | | | — | |
| ITA Holdings Group, LLC | | — | | | 1,250 | |
| Klein Hersh, LLC | | — | | | 938 | |
| Lash OpCo, LLC | | 138 | | | 481 | |
| Lighting Retrofit International, LLC (DBA Envocore) | | 2,083 | | | 2,083 | |
| Lightning Intermediate II, LLC | | 1,852 | | | — | |
| Mako Steel LP | | 943 | | | 943 | |
| Microbe Formulas LLC | | 1,627 | | | — | |
| Muenster Milling Company, LLC | | 7,000 | | | 5,000 | |
| NeuroPsychiatric Hospitals, LLC | | — | | | 600 | |
| New Skinny Mixes, LLC | | 4,000 | | | — | |
| NinjaTrader, Inc. | | 2,500 | | | 2,500 | |
| NWN Parent Holdings, LLC | | 480 | | | 1,380 | |
|
| | | | | | | | | |
| | | | March 31, | | March 31, |
| | | | 2020 | | 2019 |
| Portfolio Company | Investment Type | | (amounts in thousands) |
| Adams Publishing Group, LLC | Delayed Draw Term Loan | | $ | — |
| | $ | 1,731 |
|
| American Nuts Operations LLC | Term Loan C | | 384 |
| | 438 |
|
| ASC Ortho Management Company, LLC | Revolving Loan | | — |
| | 1,500 |
|
| Clickbooth.com, LLC | Revolving Loan | | — |
| | 2,000 |
|
| Danforth Advisors, LLC | Revolving Loan | | 500 |
| | 1,000 |
|
| Dynamic Communities, LLC | Revolving Loan | | 500 |
| | 500 |
|
| ESCP DTFS Inc. | Delayed Draw Term Loan | | 5,250 |
| | — |
|
| Environmental Pest Service Management Company, LLC | Delayed Draw Term Loan | | 525 |
| | 525 |
|
| Fast Sandwich, LLC | Revolving Loan | | 4,150 |
| | 4,150 |
|
| ITA Holdings Group, LLC | Revolving Loan | | 2,000 |
| | 1,000 |
|
| JVMC Holdings Corp. | Delayed Draw Term Loan | | — |
| | 848 |
|
| NinjaTrader, LLC | Revolving Loan | | 400 |
| | — |
|
| Roseland Management, LLC | Revolving Loan | | 1,500 |
| | 2,000 |
|
| Zenfolio Inc. | Revolving Loan | | — |
| | 2,000 |
|
| Total unused commitments to extend financing | | | $ | 15,209 |
| | $ | 17,692 |
|
| | | | | | | | | | | | | | |
| | March 31, | | March 31, |
| Portfolio Company | | 2023 | | 2022 |
| Opco Borrower, LLC (DBA Giving Home Health Care) | | 833 | | | — | |
| Outerbox, LLC | | 2,000 | | | — | |
| Pipeline Technique Ltd. | | 2,833 | | | — | |
| Roof OpCo, LLC | | 3,056 | | | 3,056 | |
| Roseland Management, LLC | | 1,425 | | | 1,425 | |
| RTIC Subsidiary Holdings LLC | | 548 | | | — | |
| Shearwater Research, Inc. | | 2,446 | | | 2,446 | |
| SIB Holdings, LLC | | — | | | 655 | |
| South Coast Terminals LLC | | 1,935 | | | 1,935 | |
| Spotlight AR, LLC | | 2,000 | | | 2,000 | |
| Student Resource Center, LLC | | — | | | 1,333 | |
| Systec Corporation (DBA Inspire Automation) | | 400 | | | 1,150 | |
| Versicare Management LLC | | 2,500 | | | — | |
| Wall Street Prep, Inc. | | 1,000 | | | 1,000 | |
| Well-Foam, Inc. | | 4,500 | | | 4,500 | |
| Winter Services Operations, LLC | | 4,444 | | | 2,000 | |
| Zenfolio Inc. | | — | | | 1,000 | |
| Total Revolving Loans | | 87,554 | | | 57,640 | |
| Delayed Draw Term Loans | | | | |
| AAC New Holdco Inc. | | 199 | | | — | |
| Acacia BuyerCo V LLC | | 2,500 | | | — | |
| Acceleration, LLC | | 5,000 | | | — | |
| Central Medical Supply LLC | | 1,400 | | | 1,400 | |
| CityVet Inc. | | — | | | 7,000 | |
| Exact Borrower, LLC | | 2,500 | | | — | |
| Flip Electronics, LLC | | — | | | 2,818 | |
| FoodPharma Subsidiary Holdings, LLC | | — | | | 5,470 | |
| Gains Intermediate, LLC | | 5,000 | | | — | |
| GS Operating, LLC | | — | | | 3,205 | |
| Gulf Pacific Acquisition, LLC | | 1,212 | | | — | |
| Infolinks Media Buyco, LLC | | 2,250 | | | 2,250 | |
| KMS, LLC | | 2,286 | | | 4,571 | |
| Lash OpCo, LLC | | — | | | 2,846 | |
| Muenster Milling Company, LLC | | — | | | 6,000 | |
| NeuroPsychiatric Hospitals, LLC | | — | | | 10,000 | |
| New Skinny Mixes, LLC | | 3,000 | | | — | |
| NinjaTrader, Inc. | | 4,692 | | | 4,692 | |
| Roof OpCo, LLC | | — | | | 4,644 | |
| Shearwater Research, Inc. | | — | | | 3,262 | |
| SIB Holdings, LLC | | — | | | 1,871 | |
| Systec Corporation (DBA Inspire Automation) | | — | | | 3,000 | |
| US CourtScript Holdings, Inc. | | — | | | — | |
| Versicare Management LLC | | 2,600 | | | — | |
| Winter Services Operations, LLC | | 4,444 | | | 4,444 | |
| Zips Car Wash, LLC - B | | — | | | 3,801 | |
| | | | | | | | | | | | | | |
| | March 31, | | March 31, |
| Portfolio Company | | 2023 | | 2022 |
| Total Delayed Draw Term Loans | | 37,083 | | | 71,274 | |
| Total Unfunded Debt Commitments | | $ | 124,637 | | | $ | 128,914 | |
The following table provides additional information on the Company’s unfunded debt commitments regarding expirations (amounts in thousands):
| | | | | | | | | | | | | | |
| | March 31, | | March 31, |
| | 2023 | | 2022 |
| Unfunded Debt Commitments | | | | |
| Expiring during: | | | | |
| 2023 | | $ | — | | | $ | 39,946 | |
| 2024 | | 31,625 | | | 37,321 | |
| 2025 | | 10,637 | | | 5,000 | |
| 2026 | | 6,712 | | | 8,194 | |
| 2027 | | 38,062 | | | 38,453 | |
| 2028 | | 35,318 | | | — | |
| 2029 | | 2,283 | | | — | |
| Total Unfunded Debt Commitments | | $ | 124,637 | | | $ | 128,914 | |
The balances of unfunded equity commitments as of March 31, 2023 and March 31, 2022 were as follows (amounts in thousands):
| | | | | | | | | | | | | | |
| | March 31, | | March 31, |
| | 2023 | | 2022 |
| Unfunded Equity Commitments | | | | |
| Catbird NYC, LLC | | $ | 125 | | | $ | 125 | |
| Infolinks Media Buyco, LLC | | 412 | | | 412 | |
| I-45 SLF LLC | | — | | | 4,800 | |
| Total Unfunded Equity Commitments | | $ | 537 | | | $ | 5,337 | |
As of March 31, 2020,2023, total revolving and delayed draw loan commitments included commitments to issue letters of credit through a financial intermediary on behalf of certain portfolio companies. As of March 31, 2020 and March 31, 2019,2023, the Company had $3.4$0.9 million in letters of credit issued and outstanding under these commitments on behalf of portfolio companies. For all of these letters of credit issued and outstanding, the Company would be required to make payments to third parties if the portfolio companies were to default on their related payment obligations. Of these letters of credit, $3.4$0.3 million expire in May 2021.August 2023, $0.4 million expire in February 2024, and $0.2 million expire in April 2024. As of March 31, 2020 and March 31, 2019,2023, none of the letters of credit issued and outstanding were recorded as a liability on the Company's balance sheet as such letters of credit are considered in the valuation of the investments in the portfolio company.
Effective April 1, 2019, ASC 842 required that a lessee to evaluate its leases to determine whether they should be classified as operating or financing leases. The Company identified onepreviously had an operating lease for its office space. The leasespace that commenced on October 1, 2014 and expiresexpired February 28, 2022.
As CSWC classified this In March 2021, the Company executed an agreement to lease new office space that commenced on February 1, 2022 and expires September 30, 2032. The Company identified the foregoing as an operating lease prior to implementation, lease.
ASC 842 indicates that a right-of-usean ROU asset and lease liability should be recorded based on the effective date. As such, CSWC adopted ASC 842 effective April 1, 2019recorded an ROU asset, which is included in other assets on the Consolidated Statements of Assets and recorded a right-of-use assetLiabilities, and a lease liability, which is included in other liabilities on the Consolidated Statements of Assets and Liabilities, as of that date. After this date, theFebruary 1, 2022. The Company has recorded lease expense on a straight-line basis, consistent with the accounting treatment for lease expense prior to the adoption of ASC 842.basis.
Total lease expense incurred for the year ended March 31, 2020 was $229 thousand. Total lease expense for both the twothree years ended March 31, 20192023, 2022 and 20182021 was $233 thousand.$0.3 million, $0.3 million and $0.2 million, respectively. As of both March 31, 2020,2023 and 2022, the asset related to the operating lease was $0.4$1.8 million
and the lease liability was $0.5 million.$2.8 million and $2.7 million, respectively. As of March 31, 2020,2023, the remaining lease term was 1.89.5 years and the discount rate was 3.95%7.21%.
The following table shows future minimum payments under the Company's operating leaseleases as of March 31, 20202023 (in thousands):
| | | Year ending March 31, | Rent Commitment | Year ending March 31, | Rent Commitment |
| 2021 | $ | 266 |
| |
| 2022 | 248 |
| |
| 2023 | — |
| |
| 2024 | — |
| 2024 | $ | 406 | |
| 2025 | — |
| 2025 | 416 | |
| 2026 | | 2026 | 426 | |
| 2027 | | 2027 | 436 | |
| 2028 | | 2028 | 446 | |
| Thereafter | — |
| Thereafter | 2,132 | |
| Total | $ | 514 |
| Total | $ | 4,262 | |
Contingencies
We may, from time to time, be involved in litigation arising out of our operations in the normal course of business or otherwise. Furthermore, third parties may try to seek to impose liability on us in connection with the activities of our portfolio companies. WeTo our knowledge, we have no currently pending material legal proceedings to which we are partparty or to which any of our assets isare subject.
12. SELECTED QUARTERLY FINANCIAL DATA (UNAUDITED)
The following presents a summary of the unaudited quarterly consolidated financial information for the years ended March 31, 20202023 and 20192022 (in thousands except per share amounts):
| | | | | | | | | | | | | | | | | | | | | | | | | | | | | |
| | First | | Second | | Third | | Fourth | | |
| 2023 | Quarter | | Quarter | | Quarter | | Quarter | | Total |
| Net investment income | $ | 12,438 | | | $ | 14,444 | | | $ | 19,425 | | | $ | 22,404 | | | $ | 68,711 | |
| Net realized gain (loss) on investments, net of tax | 2,320 | | | (8,635) | | | (11,086) | | | 372 | | | (17,029) | |
| Net change in unrealized (depreciation) appreciation on investments, net of tax | (12,248) | | | 3,649 | | | (5,390) | | | (4,600) | | | (18,589) | |
| | | | | | | | | |
| | | | | | | | | |
| Net increase (decrease) in net assets from operations | 2,510 | | | 9,458 | | | 2,949 | | | 18,176 | | | 33,093 | |
| Pre-tax net investment income per share | 0.50 | | | 0.54 | | | 0.60 | | | 0.65 | | | 2.30 | |
| Net investment income per share | 0.49 | | | 0.52 | | | 0.62 | | | 0.64 | | | 2.29 | |
| Net increase (decrease) in net assets from operations per share | 0.10 | | | 0.34 | | | 0.09 | | | 0.52 | | | 1.10 | |
| | | | | | | | | |
| | First | | Second | | Third | | Fourth | | |
| 2022 | Quarter | | Quarter | | Quarter | | Quarter | | Total |
| Net investment income | $ | 9,043 | | | $ | 9,726 | | | $ | 11,899 | | | $ | 12,019 | | | $ | 42,687 | |
| Net realized (loss) gain on investments | (952) | | | 3,496 | | | 2,715 | | | 575 | | | 5,834 | |
| Net change in unrealized appreciation (depreciation) on investments, net of tax | 7,051 | | | (691) | | | (2,054) | | | 7,161 | | | 11,467 | |
| Realized loss on extinguishment of debt | — | | | (17,087) | | | — | | | — | | | (17,087) | |
| Realized loss on disposal of fixed assets | — | | | — | | | — | | | (86) | | | (86) | |
| Net increase (decrease) in net assets from operations | 15,142 | | | (4,556) | | | 12,560 | | | 19,669 | | | 42,815 | |
| Pre-tax net investment income per share | 0.45 | | | 0.45 | | | 0.51 | | | 0.50 | | | 1.90 | |
| Net investment income per share | 0.43 | | | 0.43 | | | 0.51 | | | 0.50 | | | 1.87 | |
| Net increase (decrease) in net assets from operations per share | 0.71 | | | (0.20) | | | 0.54 | | | 0.81 | | | 1.87 | |
|
| | | | | | | | | | | | | | | | | | | |
| | First | | Second | | Third | | Fourth | | |
| 2020 | Quarter | | Quarter | | Quarter | | Quarter | | Total |
| Net investment income | $ | 7,360 |
| | $ | 6,815 |
| | $ | 7,114 |
| | $ | 6,943 |
| | $ | 28,232 |
|
| Net realized gain (loss) on investments, net of tax | 1,217 |
| | 283 |
| | 40,818 |
| | (87 | ) | | 42,231 |
|
| Net change in unrealized depreciation on investments, net of tax | (1,864 | ) | | (4,369 | ) | | (54,765 | ) | | (31,816 | ) | | (92,814 | ) |
| Net increase (decrease) in net assets from operations | 6,713 |
| | 2,729 |
| | (6,833 | ) | | (24,960 | ) | | (22,351 | ) |
| Pre-tax net investment income per share | 0.44 |
| | 0.42 |
| | 0.44 |
| | 0.40 |
| | 1.68 |
|
| Net investment income per share | 0.42 |
| | 0.38 |
| | 0.39 |
| | 0.37 |
| | 1.57 |
|
| Net increase (decrease) in net assets from operations per share | 0.38 |
| | 0.15 |
| | (0.38 | ) | | (1.34 | ) | | (1.24 | ) |
| | | | | | | | | | |
| | First | | Second | | Third | | Fourth | | |
| 2019 | Quarter | | Quarter | | Quarter | | Quarter | | Total |
| Net investment income | $ | 4,617 |
| | $ | 5,546 |
| | $ | 6,675 |
| | $ | 6,872 |
| | $ | 23,710 |
|
| Net realized gain on investments | 18,819 |
| | 94 |
| | 1,883 |
| | 58 |
| | 20,854 |
|
| Net change in unrealized (depreciation) appreciation on investments, net of tax | (11,783 | ) | | 948 |
| | (4,238 | ) | | 3,567 |
| | (11,506 | ) |
| Net increase in net assets from operations | 11,653 |
| | 6,588 |
| | 4,320 |
| | 10,497 |
| | 33,058 |
|
| Pre-tax net investment income per share | 0.31 |
| | 0.36 |
| | 0.40 |
| | 0.42 |
| | 1.48 |
|
| Net investment income per share | 0.29 |
| | 0.34 |
| | 0.39 |
| | 0.40 |
| | 1.42 |
|
| Net increase in net assets from operations per share | 0.72 |
| | 0.40 |
| | 0.25 |
| | 0.61 |
| | 1.98 |
|
13. RELATED PARTY TRANSACTIONS
As a BDC, we are obligated under the 1940 Act to make available to our portfolio companies significant managerial assistance. “Making available significant managerial assistance” refers to any arrangement whereby we offer to provide significant guidance and counsel concerning the management, operations, or business objectives and policies of a portfolio company. We also are also deemed to be providing managerial assistance to all portfolio companies that we control, either by ourselves or in conjunction with others. The nature and extent of significant managerial assistance provided by us will vary according to the particular needs of each portfolio company.
During each of the years ended March 31, 2020, 2019,2023 and 2018,2022, we receiveddid not receive any management and other fees from certain of our portfolio companies totaling $0.2 million, $0.3 million, and $0.4 million, respectively, which were recognized as fees and other income on the Consolidated Statementscompanies. As of Operations. During the year endedboth March 31, 2020, we received a transaction fee of $1.2 million in connection with the sale of Media Recovery, Inc. Additionally, as of2023 and March 31, 2020 and 2019,2022, we had dividends receivable from I-45 SLF LLC of $2.1$1.9 million, and $2.5 million, respectively, which were included in dividends and interest receivables on the Consolidated Statements of Assets and Liabilities.
14. SUBSEQUENT EVENTS
On April 22, 2020, the Board Additionally, we recognized administrative fee income from I-45 SLF LLC of Directors declared a total dividend of $0.51 per share, comprised of a regular dividend of $0.41 and a supplemental dividend of $0.10, for the quarter ended June 30, 2020. The record date for the dividend is June 15, 2020. The payment date for the dividend is June 30, 2020.
On May 28, 2020, the Board of Directors declared a total dividend of $0.51 per share, comprised of a regular dividend of $0.41 and a supplemental dividend of $0.10, for the quarter ended September 30, 2020. The record date for the dividend is September 15, 2020. The payment date for the dividend is September 30, 2020.
COVID-19
The Company has been closely monitoring the COVID-19 pandemic, its broader impact on the global economy and the more recent impacts on the U.S. economy. As of June 2, 2020, there is no indication of a reportable subsequent event impacting the Company’s financial statements$0.1 million for the year ended March 31, 2020. The Company cannot predict2023, which was included in fee income on the extent to which its financial condition and resultsConsolidated Statement of operations will be affected at this time. The potential impact to our results will depend to a large extent on future developments and new information that may emerge regarding the duration and severityOperations.
15. SELECTED14. SUMMARY OF PER SHARE DATA AND RATIOSINFORMATION
The following presents a summary of the selected per share data for the years ended March 31, 2016 through 2020 (in thousands except per share amounts):
|
| | | | | | | | | | | | | | | | | | | |
| | Years Ended March 31, |
| Per Share Data: | 2020 | | 2019 | | 2018 | | 2017 | | 2016 |
Investment income1 | $ | 3.45 |
| | $ | 3.10 |
| | $ | 2.18 |
| | $ | 1.48 |
| | $ | 0.58 |
|
Operating expenses1 | (1.76 | ) | | (1.62 | ) | | (1.16 | ) | | (0.87 | ) | | (1.34 | ) |
Income taxes1 | (0.12 | ) | | (0.06 | ) | | (0.01 | ) | | (0.11 | ) | | 0.08 |
|
Net investment income (loss)1 | 1.57 |
| | 1.42 |
| | 1.01 |
| | 0.50 |
| | (0.68 | ) |
Net realized gain (loss), net of tax1 | 2.35 |
| | 1.24 |
| | 0.10 |
| | 0.50 |
| | (0.88 | ) |
Net change in unrealized (depreciation) appreciation on investments, net of tax1 | (5.16 | ) | | (0.68 | ) | | 1.34 |
| | 0.49 |
| | 1.02 |
|
| Total (decrease) increase from investment operations | (1.24 | ) | | 1.98 |
| | 2.45 |
| | 1.49 |
| | (0.54 | ) |
| Dividends to shareholders | (2.75 | ) | | (2.27 | ) | | (0.99 | ) | | (0.79 | ) | | (0.14 | ) |
| Distribution from additional capital for spin-off | — |
| | — |
| | — |
| | — |
| | (1.67 | ) |
| Spin-off Compensation Plan distribution, net of tax | — |
| | — |
| | (0.03 | ) | | (0.08 | ) | | (0.08 | ) |
| Decrease in unrealized appreciation due to distributions to CSWI | — |
| | — |
| | — |
| | — |
| | (29.15 | ) |
Exercise of employee stock options2 | — |
| | (0.12 | ) | | 0.01 |
| | (0.09 | ) | | 0.03 |
|
(Issuance) forfeiture of restricted stock3 | (0.06 | ) | | (0.23 | ) | | (0.18 | ) | | (0.15 | ) | | (0.49 | ) |
| Accretive (dilutive) effect of share issuances and repurchases | 0.45 |
| | 0.06 |
| | (0.04 | ) | | — |
| | — |
|
| Share based compensation expense | 0.16 |
| | 0.13 |
| | 0.11 |
| | 0.08 |
| | 0.08 |
|
| Common stock withheld for payroll taxes upon vesting of restricted stock | — |
| | (0.01 | ) | | (0.01 | ) | | — |
| | — |
|
| Repurchase of common stock | 0.15 |
| | — |
| | — |
| | — |
| | — |
|
| Net change in pension plan funded status | (0.01 | ) | | (0.01 | ) | | (0.05 | ) | | — |
| | — |
|
Other4 | (0.19 | ) | | 0.01 |
| | 0.01 |
| | — |
| | — |
|
| Increase (decrease) in net asset value | (3.49 | ) | | (0.46 | ) | | 1.28 |
| | 0.46 |
| | (31.96 | ) |
| Net asset value | | | | | | | | | |
| Beginning of year | 18.62 |
| | 19.08 |
| | 17.80 |
| | 17.34 |
| | 49.30 |
|
| End of year | $ | 15.13 |
| | $ | 18.62 |
| | $ | 19.08 |
| | $ | 17.80 |
| | $ | 17.34 |
|
| Ratios and Supplemental Data | | | | | | | | | |
| Ratio of operating expenses to average net assets | 9.87 | % | | 8.61 | % | | 6.35 | % | | 4.95 | % | | 4.48 | % |
| Ratio of net investment income to average net assets | 8.77 | % | | 7.53 | % | | 5.51 | % | | 2.83 | % | | (2.27 | )% |
| Portfolio turnover | 22.76 | % | | 23.38 | % | | 25.42 | % | | 23.57 | % | | 4.20 | % |
Total investment return5 | (37.52 | )% | | 38.34 | % | | 6.61 | % | | 27.88 | % | | (20.71 | )% |
Total return based on change in NAV6 | (3.97 | )% | | 9.49 | % | | 12.75 | % | | 7.21 | % | | (2.15 | )% |
| Per share market value at end of year | $ | 11.42 |
| | $ | 21.04 |
| | $ | 17.02 |
| | $ | 16.91 |
| | $ | 13.87 |
|
| Weighted-average basic shares outstanding | 18,000 |
| | 16,727 |
| | 16,074 |
| | 15,825 |
| | 15,636 |
|
| Weighted-average fully diluted shares outstanding | 18,000 |
| | 16,734 |
| | 16,139 |
| | 15,877 |
| | 15,724 |
|
| Common shares outstanding at end of year | 17,998 |
| | 17,503 |
| | 16,162 |
| | 16,011 |
| | 15,726 |
|
| |
1
| Based on weighted-average basic shares outstanding for the period. |
| |
2
| Net decrease is due to the exercise of employee stock options at prices less than beginning of period net asset value. |
| |
3
| Reflects impact of the different share amounts as a result of issuance or forfeiture of restricted stock during the period. |
| |
4
| Includes the impact of the different share amounts as a result of calculating certain per share data based on the weighted-average basic shares outstanding during the period and certain per share data based on the shares outstanding as of a period end. The balance increases with the increase in variability of shares outstanding throughout the year due to share issuance and repurchase activity. |
| |
5
| Total investment return based on purchase of stock at the current market price on the first day and a sale at the current market price on the last day of each period reported on the table and assumes reinvestment of dividends at prices obtained by CSWC’s dividend reinvestment plan during the period. The return does not reflect any sales load that may be paid by an investor. |
| |
6
| Total return based on change in NAV was calculated using the sum of ending NAV plus dividends to shareholders and other non-operating changes during the period, as divided by the beginning NAV.
|
16. SIGNIFICANT SUBSIDIARIES
Media Recovery Inc.
Media Recovery, Inc., dba SpotSee Holdings, through its subsidiary ShockWatch, provides solutions that currently enable over 3,000 customers and some 200 partners in 62 countries to detect mishandling that causes product damage and spoilage during transport and storage. The ShockWatch product portfolio includes impact, tilt, temperature, vibration, and humidity detection systems and is widely used in the energy, transportation, aerospace, defense, food, pharmaceutical, medical device, consumer goods and manufacturing sectors.
On November 25, 2019, the Company sold its investment in Media Recovery, Inc. Below is certain selected key financial data from Media Recovery, Inc.'s Balance Sheet at March 31, 2020 and 2019 and the twelve months ended March 31,2023, 2022, 2021, 2020, 2019, 2018, and 2018 Income Statement for the periods in which our investment in Media Recovery, Inc. exceeded the threshold in at least one of the tests under Rule 3-09 of Regulation S-X (amounts2017 (share amounts presented in thousands).
| | | | | | | | | | | | | | | | | | | | | | | | | | | | | | | | | | | | | | | | | |
| Years Ended |
| March 31, |
| Per Share Data: | 2023 | | 2022 | | 2021 | | 2020 | | 2019 | | 2018 | | 2017 |
Investment income1 | $ | 3.97 | | | $ | 3.60 | | | $ | 3.57 | | | $ | 3.45 | | | $ | 3.10 | | | $ | 2.18 | | | $ | 1.48 | |
Operating expenses1 | (1.67) | | | (1.70) | | | (1.78) | | | (1.76) | | | (1.62) | | | (1.16) | | | (0.87) | |
Income taxes1 | (0.01) | | | (0.03) | | | (0.13) | | | (0.12) | | | (0.06) | | | (0.01) | | | (0.11) | |
Net investment income1 | 2.29 | | | 1.87 | | | 1.66 | | | 1.57 | | | 1.42 | | | 1.01 | | | 0.50 | |
Net realized (loss) gain, net of tax1 | (0.57) | | | 0.26 | | | (0.45) | | | 2.35 | | | 1.24 | | | 0.10 | | | 0.50 | |
Net unrealized (depreciation) appreciation on investments, net of tax1 | (0.62) | | | 0.50 | | | 1.51 | | | (5.16) | | | (0.68) | | | 1.34 | | | 0.49 | |
Realized loss on extinguishment of debt1 | — | | | (0.75) | | | (0.05) | | | — | | | — | | | — | | | — | |
| Total increase (decrease) from investment operations | 1.10 | | | 1.88 | | | 2.67 | | | (1.24) | | | 1.98 | | | 2.45 | | | 1.49 | |
| Accretive effect of share issuances and repurchases | 0.50 | | | 1.45 | | | 0.30 | | | 0.45 | | | 0.06 | | | (0.04) | | | — | |
| Dividends to shareholders | (2.28) | | | (2.52) | | | (2.05) | | | (2.75) | | | (2.27) | | | (0.99) | | | (0.79) | |
| Spin-off Compensation Plan Distribution, net of tax | — | | | — | | | — | | | — | | | — | | | (0.03) | | | (0.08) | |
Issuance of restricted stock1,2 | (0.14) | | | (0.10) | | | (0.16) | | | (0.06) | | | (0.23) | | | (0.18) | | | (0.15) | |
| Common stock withheld for payroll taxes upon vesting of restricted stock | (0.01) | | | (0.03) | | | — | | | — | | | (0.01) | | | (0.01) | | | — | |
Exercise of employee stock options3 | — | | | — | | | — | | | — | | | (0.12) | | | 0.01 | | | (0.09) | |
| Share based compensation expense | 0.10 | | | 0.14 | | | 0.14 | | | 0.16 | | | 0.13 | | | 0.11 | | | 0.08 | |
| Change in restoration plan | 0.06 | | | 0.01 | | | — | | | (0.01) | | | (0.01) | | | (0.05) | | | — | |
| Repurchase of common stock | — | | | — | | | — | | | 0.15 | | | — | | | — | | | — | |
Other4 | 0.18 | | | 0.02 | | | (0.02) | | | (0.19) | | | 0.01 | | | 0.01 | | | — | |
| (Decrease) increase in net asset value | (0.49) | | | 0.85 | | | 0.88 | | | (3.49) | | | (0.46) | | | 1.28 | | | 0.46 | |
| Net asset value | | | | | | | | | | | | | |
| Beginning of period | 16.86 | | | 16.01 | | | 15.13 | | | 18.62 | | | 19.08 | | | 17.80 | | | 17.34 | |
| End of period | $ | 16.37 | | | $ | 16.86 | | | $ | 16.01 | | | $ | 15.13 | | | $ | 18.62 | | | $ | 19.08 | | | $ | 17.80 | |
| | | | | | | | | | | | | |
| Ratios and Supplemental Data | | | | | | | | | | | | | |
| Ratio of operating expenses to average net assets | 10.06 | % | | 10.31 | % | | 11.51 | % | | 9.87 | % | | 8.61 | % | | 6.35 | % | | 4.95 | % |
| Ratio of net investment income to average net assets | 13.75 | % | | 11.31 | % | | 10.74 | % | | 8.77 | % | | 7.53 | % | | 5.51 | % | | 2.83 | % |
| Portfolio turnover | 13.68 | % | | 33.91 | % | | 18.81 | % | | 22.76 | % | | 23.38 | % | | 25.42 | % | | 23.57 | % |
Total investment return5 | (15.36) | % | | 18.10 | % | | 118.56 | % | | (37.52) | % | | 38.34 | % | | 6.61 | % | | 27.88 | % |
Total return based on change in NAV6 | 10.62 | % | | 21.05 | % | | 19.37 | % | | (3.97) | % | | 9.49 | % | | 12.75 | % | | 7.21 | % |
| | | | | | | | | | | | | |
|
| | | | | | | |
| | March 31, 2020 | | March 31, 2019 |
| Current Assets | $ | — |
| | $ | 8,489 |
|
| Non-Current Assets | — |
| | 23,527 |
|
| Current Liabilities | — |
| | 3,089 |
|
| Non-Current Liabilities | — |
| | 1,627 |
|
| | | | | | | | | | | | | | | | | | | | | | | | | | | | | | | | | | | | | | | | | |
| Per share market value at the end of the period | $ | 17.78 | | | $ | 23.73 | | | $ | 22.16 | | | $ | 11.42 | | | $ | 21.04 | | | $ | 17.02 | | | $ | 16.91 | |
| Weighted-average basic shares outstanding | 30,016 | | | 22,840 | | | 19,060 | | | 18,000 | | | 16,074 | | | 16,074 | | | 15,825 | |
| Weighted-average diluted shares outstanding | 30,016 | | | 22,840 | | | 19,060 | | | 18,000 | | | 16,139 | | | 16,139 | | | 15,877 | |
| Common shares outstanding at end of period | 36,076 | | | 24,959 | | | 21,005 | | | 17,998 | | | 17,503 | | | 16,162 | | | 16,011 | |
1Based on weighted average of common shares outstanding for the period.
2Reflects impact of the different share amounts as a result of issuance or forfeiture of restricted stock during the period.
3Net decrease is due to the exercise of employee stock options at prices less than beginning of period net asset value.
4Includes the impact of the different share amounts as a result of calculating certain per share data based on the weighted-average basic shares outstanding during the period and certain per share data based on the shares outstanding as of a period end. The balance increases with the increase in variability of shares outstanding throughout the year due to share issuance and repurchase activity.
5Total investment return based on purchase of stock at the current market price on the first day and a sale at the current market price on the last day of each period reported on the table and assumes reinvestment of dividends at prices obtained by CSWC’s dividend reinvestment plan during the period. The return does not reflect any sales load that may be paid by an investor.
6Total return based on change in NAV was calculated using the sum of ending NAV plus dividends to shareholders and other non-operating changes during the period, as divided by the beginning NAV, and has not been annualized.
|
| | | | | | | | | | | |
| | Twelve Months Ended March 31, |
| | 2020 | | 2019 | | 2018 |
| Revenue | $ | — |
| | $ | 22,346 |
| | $ | 22,242 |
|
| Income from continuing operations | — |
| | 2,124 |
| | 2,673 |
|
| Net income | — |
| | 2,124 |
| | 2,673 |
|
15. SIGNIFICANT SUBSIDIARIES
I-45 SLF LLC
In September 2015, we entered into a limited liability company agreement with Main Street Capital Corporation ("Main Street") to form I-45 SLF LLC (the "I-45"Initial I-45 LLC Agreement"). I-45 SLF LLC began investing in UMM syndicated senior secured loans during the quarter ended December 31, 2015. The initial equity capital commitment to I-45 SLF LLC totaled $85.0 million, consisting of $68.0 million from CSWC and $17.0 million from Main Street, all of which was funded as of March 31, 2020. CSWC owns 80% of I-45 SLF LLC and has a profits interest of 75.6%, while Main Street owns 20% and has a profits interest of 24.4%. I-45 SLF LLC’s Board of Managers make all investment and operational decisions for the fund, and consists of equal representation from CSWC and Main Street. On April 30, 2020, pursuant to the terms of the Initial I-45 LLC Agreement, each of CSWC and Main Street made an additional equity capital commitment of $12.8 million and $3.2 million, respectively, which resulted in a total equity capital commitment to I-45 SLF LLC of $80.8 million and $20.2 million, respectivelyrespectively.
On March 11, 2021, the Company and Main Street entered into the Second Amended and Restated Limited Liability Company Operating Agreement (the "Amendment"), which increased the current profits interest that is allocated to the Company on a pro rata basis from (a) 75.6% to (b) an amount equal to: (i) 76.2625% as of the date of the Amendment through the quarter ended March 31, 2021; (ii) 76.925% for quarter ended June 30, 2021; (iii) 77.5875% for the quarter ended September 30, 2021; and (iv) 78.25% for the quarter ended December 31, 2021 and periods thereafter.
On March 25, 2021, I-45 SLF LLC declared a return of capital dividend to its members in the amount of $10.0 million. As of March 31, 2023, total funded equity capital totaled $101.0 million, consisting of $80.8 million from CSWC and $20.2 million from Main Street. CSWC owns 80% of I-45 SLF LLC and has a current profits interest of 78.25%, while Main Street owns 20% and has a current profits interest of 21.75%. I-45 SLF LLC's Board of Managers makes all investment and operational decisions for the fund, and consists of equal representation from CSWC and Main Street.
As of March 31, 20202023 and 2019,March 31, 2022, I-45 SLF LLC had total assets of $177.8$152.8 million and $246.5$189.1 million, respectively. I-45 SLF LLC had approximately $170.9$143.7 million and $237.5$176.7 million of credittotal investments at fair value as of March 31, 20202023 and 2019,March 31, 2022, respectively. The portfolio companies in I-45 SLF LLC are in industries similar to those in which CSWC may invest directly. As of March 31, 2020, no credit investments were unsettled trades. As of March 31, 2019, approximately $0.9 million, of the credit investments were unsettled trades. For the years ended March 31, 20202023 and 2019,2022, I-45 SLF LLC declared total dividends of $12.7$9.4 million and $12.4$8.6 million, respectively.
Additionally, I-45 SLF LLC closed on a $75.0 million 5-year senior secured credit facility (the “I-45 credit facility”) in November 2015. The I-45 credit facility includes an accordion feature which will allow I-45 SLF LLC to achieve leverage of approximately 2x debt-to-equity. Borrowings under the I-45 credit facility are secured by all of the assets of I-45 SLF LLC and bear interest at a rate equal to LIBOR plus 2.5% per annum. During the year ended March 31, 2017, I-45 SLF LLC increased debt commitments outstanding by an additional $90.0 million by adding three additional lenders to the syndicate, bringing total debt commitments to $165.0 million. In July 2017, the I-45 credit facility was amended to extend the maturity to July 2022 and to reduce2022. Additionally, the amendment reduced the interest rate on borrowings to LIBOR plus 2.4% per annum. In November 2019, the I-45 credit facility was amended to extend the maturity to November 2024 and to reduce the interest rate on borrowings to LIBOR plus 2.25% per annum. Under
the I-45 credit facility, $125.0 million has been drawn as of March 31, 2020. On April 30, 2020, the I-45 credit facility was amended to permanently reduce the I-45 credit facility amount through a prepayment of $15.0 million.
Belowmillion and to change the minimum utilization requirements. In March 2021, the I-45 credit facility was amended to extend the maturity to March 25, 2026 and to reduce the interest rate on borrowings to LIBOR plus 2.15%. On March 30, 2023, the I-45 credit facility was further amended to permanently reduce the I-45 credit facility debt commitments to $100.0 million and replace LIBOR with Term SOFR as the reference interest rate. After giving effect to the amendment, the interest rate on borrowings is a listing ofTerm SOFR plus 2.41% per annum. Under the individual loans in I-45 SLF LLC’s portfoliocredit facility, $86.0 million has been drawn as of March 31, 2020 and 2019:2023.
145
I-45 SLF LLC Loan Portfolio as of March 31, 2020 |
| | | | | | | | | | | | | | | | | | | |
| Portfolio Company | Industry | | Investment Type | | Maturity Date | | Current Interest Rate1 | | Principal | | Cost | | Fair Value2 |
| AAC Holdings, Inc. | Healthcare services | | First Lien - Priming Facility | | 3/31/2020 | | P+13.50% (Floor 1.00%) | | $ | 1,597,752 |
| | $ | 1,597,752 |
| | $ | 1,597,752 |
|
AAC Holdings, Inc.5 | Healthcare services | | First Lien | | 6/30/2023 | | L+ 6.75% (Floor 1.00%), 4.00% PIK | | 7,370,773 |
| | 7,264,031 |
| | 3,224,713 |
|
| ADS Tactical | Aerospace & defense | | First Lien | | 7/26/2023 | | L+6.25% (Floor 0.75%) | | 4,947,537 |
| | 4,928,495 |
| | 4,734,793 |
|
| ALKU, LLC | Business services | | First Lien | | 7/29/2026 | | L+5.50% (Floor 1.00%) | | 3,000,000 |
| | 2,971,923 |
| | 2,820,000 |
|
| American Teleconferencing Services, Ltd. | Telecommunications | | First Lien | | 6/8/2023 | | L+6.50%
(Floor 1.00%) | | 6,770,762 |
| | 6,622,685 |
| | 3,825,480 |
|
| ATX Canada Acquisitionco Inc. | Technology products & components | | First Lien | | 6/11/2021 | | L+7.00% (Floor 1.00%), 1.0% PIK | | 4,573,072 |
| | 4,560,879 |
| | 3,795,650 |
|
California Pizza Kitchen, Inc.5 | Restaurants | | First Lien | | 8/23/2022 | | L+6.00%
(Floor 1.00%) | | 6,759,837 |
| | 6,740,537 |
| | 3,417,943 |
|
| Corel | Software & IT services | | First Lien | | 7/2/2026 | | L+5.00% | | 4,968,750 |
| | 4,720,313 |
| | 4,409,766 |
|
| Geo Parent Corporation | Building & infrastructure products | | First Lien | | 12/19/2025 | | L+5.25% | | 4,950,000 |
| | 4,909,365 |
| | 4,677,750 |
|
| Go Wireless Holdings, Inc. | Consumer products & retail | | First Lien | | 12/22/2024 | | L+6.50%
(Floor 1.00%) | | 6,212,500 |
| | 6,170,181 |
| | 5,042,469 |
|
| Hunter Defense Technologies, Inc. | Aerospace & defense | | First Lien | | 3/29/2023 | | L+7.00%
(Floor 1.00%) | | 5,855,755 |
| | 5,772,233 |
| | 5,870,395 |
|
| Imagine! Print Solutions, LLC | Media, marketing & entertainment | | Second Lien | | 6/21/2023 | | L+8.75%
(Floor 1.00%) | | 3,000,000 |
| | 2,975,680 |
| | 412,500 |
|
| InfoGroup Inc. | Software & IT services | | First Lien | | 4/3/2023 | | L+5.00%
(Floor 1.00%) | | 2,910,000 |
| | 2,895,349 |
| | 2,610,270 |
|
| Integro Parent Inc. | Business services | | First Lien | | 10/31/2022 | | L+5.75%
(Floor 1.00%) | | 3,301,120 |
| | 3,255,919 |
| | 3,251,603 |
|
| Intermedia Holdings, Inc. | Software & IT services | | First Lien | | 7/21/2025 | | L+6.00%
(Floor 1.00%) | | 5,793,852 |
| | 5,764,737 |
| | 5,301,375 |
|
| Isagenix International, LLC | Consumer products & retail | | First Lien | | 6/14/2025 | | L+5.75%
(Floor 1.00%) | | 1,953,321 |
| | 1,938,866 |
| | 727,612 |
|
| JAB Wireless, Inc. | Telecommunications | | First Lien | | 5/2/2023 | | L+8.00%
(Floor 1.00%) | | 7,840,000 |
| | 7,791,185 |
| | 7,702,800 |
|
| KORE Wireless Group Inc. | Telecommunications | | First Lien | | 12/20/2024 | | L+5.50% | | 4,754,117 |
| | 4,720,532 |
| | 4,397,558 |
|
|
| | | | | | | | | | | | | | | | | | | |
| Portfolio Company | Industry | | Investment Type | | Maturity Date | | Current Interest Rate1 | | Principal | | Cost | | Fair Value2 |
| Lab Logistics, LLC | Healthcare services | | First Lien | | 9/25/2023 | | L+6.50% (Floor 1.00%) | | 5,401,756 |
| | 5,360,681 |
| | 4,971,150 |
|
| Lift Brands, Inc. | Consumer services | | First Lien | | 4/16/2023 | | L+7.00% (Floor 1.00%), 1.0% PIK | | 4,810,104 |
| | 4,784,674 |
| | 3,689,292 |
|
| Lightbox Intermediate, L.P. | Software & IT services | | First Lien | | 5/9/2026 | | L+5.00% | | 2,977,500 |
| | 2,938,297 |
| | 2,932,838 |
|
| LOGIX Holdings Company, LLC | Telecommunications | | First Lien | | 12/23/2024 | | L+5.75%
(Floor 1.00%) | | 5,953,001 |
| | 5,917,748 |
| | 4,911,226 |
|
| LSF9 Atlantis Holdings, LLC | Telecommunications | | First Lien | | 5/1/2023 | | L+6.00%
(Floor 1.00%) | | 6,518,750 |
| | 6,485,032 |
| | 5,382,043 |
|
| Lulu's Fashion Lounge, LLC | Consumer products & retail | | First Lien | | 8/26/2022 | | L+9.00% (Floor 1.00%) | | 3,778,409 |
| | 3,706,876 |
| | 3,230,539 |
|
| Mills Fleet Farm Group LLC | Consumer products & retail | | First Lien | | 10/24/2024 | | L+6.25% (Floor 1.00%), 0.75% PIK | | 4,957,991 |
| | 4,882,891 |
| | 4,214,293 |
|
| NBG Acquisition, Inc. | Wholesale | | First Lien | | 4/26/2024 | | L+5.50%
(Floor 1.00%) | | 2,812,500 |
| | 2,779,876 |
| | 1,597,500 |
|
| Nomad Buyer, Inc. | Healthcare services | | First Lien | | 8/1/2025 | | L+5.00% | | 2,955,000 |
| | 2,818,702 |
| | 2,748,150 |
|
| Novetta Solutions, LLC | Software & IT services | | First Lien | | 10/17/2022 | | L+5.00%
(Floor 1.00%) | | 4,895,734 |
| | 4,813,041 |
| | 4,364,841 |
|
PaySimple - Delayed Draw3 | Software & IT services | | First Lien | | 8/23/2025 | | L+5.50% | | 933,880 |
| | 919,845 |
| | 849,831 |
|
| PaySimple, Inc. | Software & IT services | | First Lien | | 8/23/2025 | | L+5.50% | | 4,262,739 |
| | 4,205,957 |
| | 3,879,092 |
|
| Peraton Corp. (fka MHVC Acquisition Corp.) | Aerospace & defense | | First Lien | | 4/29/2024 | | L+5.25%
(Floor 1.00%) | | 6,329,280 |
| | 6,309,704 |
| | 5,917,877 |
|
| Pet Supermarket, Inc. | Consumer products & retail | | First Lien | | 7/5/2022 | | L+5.50%
(Floor 1.00%) | | 4,810,070 |
| | 4,791,909 |
| | 4,425,265 |
|
| PT Network, LLC | Healthcare products | | First Lien | | 11/30/2023 | | L+5.50% (Floor 1.00%), 2.0% PIK | | 4,418,280 |
| | 4,418,279 |
| | 4,024,169 |
|
| Signify Health, LLC | Healthcare services | | First Lien | | 12/23/2024 | | L+4.50% (Floor 1.00%) | | 5,096,000 |
| | 5,061,228 |
| | 4,280,640 |
|
| Tacala, LLC | Consumer products & retail | | Second Lien | | 2/7/2028 | | L+7.50% | | 4,500,000 |
| | 4,492,489 |
| | 3,521,250 |
|
| TestEquity, LLC | Capital equipment | | First Lien | | 4/28/2022 | | L+5.50%
(Floor 1.00%) | | 3,815,993 |
| | 3,800,086 |
| | 3,186,354 |
|
| TestEquity, LLC - Term Loan B | Capital equipment | | First Lien | | 4/28/2022 | | L+5.50%
| | 959,034 |
| | 954,854 |
| | 800,793 |
|
| TGP Holdings III LLC | Durable consumer goods | | Second Lien | | 9/25/2025 | | L+8.50%
(Floor 1.00%) | | 2,500,000 |
| | 2,474,215 |
| | 1,837,500 |
|
| The Hoover Group, Inc. | Energy services (midstream) | | First Lien | | 1/28/2021 | | L+7.25%
(Floor 1.00%) | | 6,369,996 |
| | 6,306,165 |
| | 5,892,246 |
|
|
| | | | | | | | | | | | | | | | | | | |
| Portfolio Company | Industry | | Investment Type | | Maturity Date | | Current Interest Rate1 | | Principal | | Cost | | Fair Value2 |
| Time Manufacturing Acquisition | Capital equipment | | First Lien | | 2/3/2023 | | L+5.00%
(Floor 1.00%) | | 4,847,569 |
| | 4,825,207 |
| | 4,435,525 |
|
| UniTek Global Services, Inc. | Telecommunications | | First Lien | | 8/26/2024 | | L+5.50% (Floor 1.00%), 1.0% PIK | | 2,970,169 |
| | 2,949,235 |
| | 2,687,409 |
|
| U.S. TelePacific Corp. | Telecommunications | | First Lien | | 5/2/2023 | | L+6.00%
(Floor 1.00%) | | 5,200,139 |
| | 5,158,075 |
| | 4,056,108 |
|
| Vida Capital, Inc. | Financial services | | First Lien | | 10/1/2026 | | L+6.00% | | 3,965,000 |
| | 3,909,608 |
| | 3,667,625 |
|
VIP Cinema Holdings, Inc. - Superiority DIP5 | Hotel, gaming & leisure | | First Lien | | 5/20/2020 | | L+8.0% | | 719,367 |
| | 707,617 |
| | 129,486 |
|
VIP Cinema Holdings, Inc.5 | Hotel, gaming & leisure | | First Lien | | 3/1/2023 | | P+7.00%
(Floor 1.00%) | | 4,375,000 |
| | 4,364,343 |
| | 787,500 |
|
Wireless Vision Holdings, LLC4 | Telecommunications | | First Lien | | 9/29/2022 | | L+8.91% (Floor 1.00%), 1.0% PIK | | 7,326,695 |
| | 7,252,903 |
| | 6,263,591 |
|
| YS Garments, LLC | Consumer products & retail | | First Lien | | 8/9/2024 | | P+6.00% | | 4,812,500 |
| | 4,777,378 |
| | 4,355,313 |
|
| Total Investments | | | | | | | | | | | $ | 207,767,577 |
| | $ | 170,859,875 |
|
| |
1
| Represents the interest rate as of March 31, 2020. All interest rates are payable in cash, unless otherwise noted. The majority of investments bear interest at a rate that may be determined by reference to London Interbank Offered Rate (“LIBOR” or “L”) or Prime (“Prime”) which reset daily, monthly, quarterly, or semiannually. For each the Company has provided the spread over LIBOR or Prime in effect at March 31, 2020. Certain investments are subject to a LIBOR or Prime interest rate floor. |
| |
2
| Represents the fair value determined utilizing a similar process as the Company in accordance with ASC 820. However, the determination of such fair value is determined by the Board of Managers of the Joint Venture. It is not included in the Company’s Board of Directors’ valuation process described elsewhere herein. |
| |
3
| The investment has approximately $0.5 million in an unfunded delayed draw commitment as of March 31, 2020. |
| |
4
| The investment is structured as a first lien last out term loan and may earn interest in addition to the stated rate. |
| |
5 | Investment was on non-accrual status as of March 31, 2020, meaning the Company has ceased to recognize interest income on the investment. |
|
| | | | | | | | | | | | | | | | | | | |
| | | | | | | | Current | | | | | | |
| | | | Investment | | Maturity | | Interest | | | | | | |
| Portfolio Company | Industry | | Type | | Date | | Rate1 | | Principal | | Cost | | Fair Value2 |
| AAC Holdings, Inc. | Healthcare services | | First Lien | | 6/30/2023 | | L+ 6.75%
(Floor 1.00%),
4.00% PIK | | $ | 7,375,229 |
| | $ | 7,253,490 |
| | $ | 6,822,087 |
|
| | | | First Lien | | 3/31/2020 | | L+11.00%
(Floor 1.00%) | | 949,844 |
| | 940,346 |
| | 959,343 |
|
| Allen Media, LLC | Media, marketing & entertainment | | First Lien | | 8/30/2023 | | L+6.50%
(Floor 1.00%) | | 5,642,857 |
| | 5,496,176 |
| | 5,480,625 |
|
| American Scaffold Holdings, Inc. | Aerospace & defense | | First Lien | | 3/31/2022 | | L+6.50%
(Floor 1.00%) | | 2,625,000 |
| | 2,604,634 |
| | 2,611,875 |
|
| American Teleconferencing Services, Ltd. | Telecommunications | | First Lien | | 12/8/2021 | | L+6.50%
(Floor 1.00%) | | 6,881,388 |
| | 6,641,473 |
| | 4,515,911 |
|
| ATI Investment Sub, Inc. | Technology products & components | | First Lien | | 6/22/2021 | | L+7.25%
(Floor 1.00%) | | 1,817,558 |
| | 1,795,449 |
| | 1,691,420 |
|
| ATX Canada Acquisitionco Inc. | Technology products & components | | First Lien | | 6/11/2021 | | L+6.00%
(Floor 1.00%) | | 4,688,923 |
| | 4,665,710 |
| | 4,454,477 |
|
| California Pizza Kitchen, Inc. | Restaurants | | First Lien | | 8/23/2022 | | L+6.00%
(Floor 1.00%) | | 6,829,887 |
| | 6,802,221 |
| | 6,616,487 |
|
| Chloe Ox Parent, LLC (Censeo Health) | Healthcare services | | First Lien | | 12/23/2024 | | L+4.50%
(Floor 1.00%) | | 5,148,000 |
| | 5,105,429 |
| | 5,148,000 |
|
| CMN.com, LLC | Consumer services | | First Lien | | 11/3/2021 | | L+6.00%
(Floor 1.00%) | | 9,431,480 |
| | 9,347,289 |
| | 9,431,480 |
|
| Digital River, Inc. | Software & IT services | | First Lien | | 2/12/2021 | | L+6.50%
(Floor 1.00%) | | 8,002,967 |
| | 7,997,848 |
| | 7,802,893 |
|
| Geo Parent Corporation | Building & infrastructure products | | First Lien | | 12/19/2025 | | L+5.50% | | 5,000,000 |
| | 4,951,736 |
| | 4,987,500 |
|
| Go Wireless Holdings, Inc. | Consumer products & retail | | First Lien | | 12/31/2024 | | L+6.50%
(Floor 1.00%) | | 6,562,500 |
| | 6,508,367 |
| | 6,439,453 |
|
| Hunter Defense Technologies, Inc. | Aerospace & defense | | First Lien | | 3/29/2023 | | L+7.00%
(Floor 1.00%) | | 6,256,250 |
| | 6,149,119 |
| | 6,256,250 |
|
| iEnergizer Limited | Business services | | First Lien | | 5/1/2019 | | L+6.00%
(Floor 1.25%) | | 7,307,444 |
| | 7,300,086 |
| | 7,307,444 |
|
| Imagine! Print Solutions, LLC | Media, marketing & entertainment | | Second Lien | | 6/21/2023 | | L+8.75%
(Floor 1.00%) | | 3,000,000 |
| | 2,968,111 |
| | 2,700,000 |
|
| InfoGroup Inc. | Software & IT services | | First Lien | | 4/3/2023 | | L+5.00%
(Floor 1.50%) | | 2,940,000 |
| | 2,920,233 |
| | 2,892,225 |
|
| Integro Parent Inc. | Business services | | First Lien | | 10/28/2022 | | L+5.75%
(Floor 1.00%) | | 4,838,924 |
| | 4,746,329 |
| | 4,838,924 |
|
| Intermedia Holdings, Inc. | Software & IT services | | First Lien | | 7/21/2025 | | L+6.00%
(Floor 1.00%) | | 3,847,499 |
| | 3,812,532 |
| | 3,857,137 |
|
|
| | | | | | | | | | | | | | | | | | | |
| Isagenix International, LLC | Healthcare products | | First Lien | | 6/16/2025 | | L+5.75%
(Floor 1.00%) | | 2,062,501 |
| | 2,044,219 |
| | 1,851,095 |
|
| JAB Wireless, Inc. | Telecommunications | | First Lien | | 5/2/2023 | | L+8.00%
(Floor 1.00%) | | 7,920,000 |
| | 7,855,060 |
| | 7,920,000 |
|
| KORE Wireless Group Inc. | Telecommunications | | First Lien | | 12/20/2024 | | L+5.50% | | 3,325,000 |
| | 3,292,962 |
| | 3,308,375 |
|
| Lift Brands, Inc. | Consumer services | | First Lien | | 4/16/2023 | | L+7.00%
(Floor 1.00%) | | 4,950,000 |
| | 4,898,080 |
| | 4,742,100 |
|
| LOGIX Holdings Company, LLC | Telecommunications | | First Lien | | 12/23/2024 | | L+5.75%
(Floor 1.00%) | | 6,016,500 |
| | 5,972,674 |
| | 6,061,624 |
|
| LSF9 Atlantis Holdings, LLC | Telecommunications | | First Lien | | 5/1/2023 | | L+6.00%
(Floor 1.00%) | | 6,693,750 |
| | 6,647,863 |
| | 6,246,106 |
|
| Lulu's Fashion Lounge, LLC | Consumer products & retail | | First Lien | | 8/26/2022 | | L+7.00%
(Floor 1.00%) | | 4,034,090 |
| | 3,940,388 |
| | 3,913,068 |
|
| Mills Fleet Farm Group LLC | Consumer products & retail | | First Lien | | 10/24/2024 | | L+6.25%
(Floor 1.00%) | | 4,987,500 |
| | 4,894,986 |
| | 4,987,500 |
|
| NBG Acquisition, Inc. | Wholesale | | First Lien | | 4/26/2024 | | L+5.50%
(Floor 1.00%) | | 2,887,500 |
| | 2,845,678 |
| | 2,844,188 |
|
New Era Technology, Inc.3 | Software & IT services | | First Lien | | 6/22/2023 | | L+6.50%
(Floor 1.00%) | | 4,407,251 |
| | 4,336,247 |
| | 4,349,076 |
|
| | | | Delayed Draw Term Loan | | 6/22/2023 | | L+6.50%
(Floor 1.00%) | | 221,013 |
| | 221,551 |
| | 218,095 |
|
| New Media Holdings II LLC | Media, marketing & entertainment | | First Lien | | 7/14/2022 | | L+6.25%
(Floor 1.00%) | | 9,311,991 |
| | 9,298,489 |
| | 9,277,071 |
|
| Nomad Buyer, Inc. | Healthcare services | | First Lien | | 8/1/2025 | | L+5.00% | | 2,985,000 |
| | 2,821,449 |
| | 2,906,644 |
|
| Novetta Solutions, LLC | Software & IT services | | First Lien | | 10/17/2022 | | L+5.00%
(Floor 1.00%) | | 4,946,868 |
| | 4,830,392 |
| | 4,857,206 |
|
| Peraton Corp. (fka MHVC Acquisition Corp.) | Aerospace & defense | | First Lien | | 4/29/2024 | | L+5.25%
(Floor 1.00%) | | 6,394,363 |
| | 6,369,724 |
| | 6,170,560 |
|
| Pet Supermarket, Inc. | Consumer products & retail | | First Lien | | 7/5/2022 | | L+5.50%
(Floor 1.00%) | | 4,859,916 |
| | 4,833,425 |
| | 4,762,717 |
|
| PT Network, LLC | Healthcare products | | First Lien | | 11/30/2021 | | L+5.50%
(Floor 1.00%) | | 4,369,332 |
| | 4,369,332 |
| | 4,125,086 |
|
| STL Parent Corp. (American Railcar) | Transportation & logistics | | First Lien | | 12/5/2022 | | L+7.00% | | 3,975,000 |
| | 3,846,305 |
| | 3,855,750 |
|
| Tacala, LLC | Consumer products & retail | | Second Lien | | 1/30/2026 | | L+7.00% | | 3,000,000 |
| | 2,986,989 |
| | 2,994,750 |
|
| Teleguam Holdings, LLC | Telecommunications | | Second Lien | | 7/25/2024 | | L+8.50%
(Floor 1.00%) | | 2,000,000 |
| | 1,969,537 |
| | 2,012,500 |
|
| Terra Millennium Corporation | Industrial products | | First Lien | | 10/31/2022 | | L+6.75%
(Floor 1.00%) | | 7,526,019 |
| | 7,478,308 |
| | 7,488,389 |
|
| TestEquity, LLC | Capital equipment | | First Lien | | 4/28/2022 | | L+5.50%
(Floor 1.00%) | | 4,803,961 |
| | 4,773,980 |
| | 4,765,530 |
|
| TGP Holdings III LLC | Durable consumer goods | | Second Lien | | 9/25/2025 | | L+8.50%
(Floor 1.00%) | | 2,500,000 |
| | 2,469,503 |
| | 2,400,000 |
|
|
| | | | | | | | | | | | | | | | | | | |
| The Hoover Group, Inc. | Energy services (midstream) | | First Lien | | 1/28/2021 | | L+7.25%
(Floor 1.00%) | | 6,436,593 |
| | 6,335,553 |
| | 6,243,495 |
|
| Time Manufacturing Acquisition | Capital equipment | | First Lien | | 2/3/2023 | | L+5.00%
(Floor 1.00%) | | 4,910,038 |
| | 4,879,401 |
| | 4,928,450 |
|
| Turning Point Brands, Inc. | Consumer products & retail | | Second Lien | | 3/7/2024 | | L+7.00% | | 3,000,000 |
| | 2,973,482 |
| | 3,030,000 |
|
| UniTek Global Services, Inc. | Telecommunications | | First Lien | | 8/20/2024 | | L+5.50%
(Floor 1.00%) | | 2,985,000 |
| | 2,959,958 |
| | 2,958,135 |
|
| U.S. TelePacific Corp. | Telecommunications | | First Lien | | 5/2/2023 | | L+5.00%
(Floor 1.00%) | | 6,844,420 |
| | 6,777,409 |
| | 6,660,510 |
|
| VIP Cinema Holdings, Inc. | Hotel, gaming & leisure | | First Lien | | 3/1/2023 | | L+6.00%
(Floor 1.00%) | | 4,500,000 |
| | 4,485,268 |
| | 4,207,500 |
|
Wireless Vision Holdings, LLC4 | Telecommunications | | First Lien | | 9/29/2022 | | L+8.50%
(Floor 1.00%),
1.00% PIK | | 7,865,229 |
| | 7,753,144 |
| | 7,778,711 |
|
| YS Garments, LLC | Consumer products & retail | | First Lien | | 8/9/2024 | | L+6.00%
(Floor 1.00%) | | 4,937,500 |
| | 4,893,176 |
| | 4,869,609 |
|
| Total Investments | | | | | | | | | | | $ | 242,061,110 |
| | $ | 237,547,371 |
|
| |
1
| Represents the interest rate as of March 31, 2019. All interest rates are payable in cash, unless otherwise noted. The majority of investments bear interest at a rate that may be determined by reference to London Interbank Offered Rate (“LIBOR” or “L”) or Prime (“Prime”) which reset daily, monthly, quarterly, or semiannually. For each the Company has provided the spread over LIBOR or Prime in effect at March 31, 2019. Certain investments are subject to a LIBOR or Prime interest rate floor. |
| |
2
| Represents the fair value determined utilizing a similar process as the Company in accordance with ASC 820. However, the fair value is determined by the Board of Managers of the Joint Venture. It is not included in the Company’s Board of Directors’ valuation process described elsewhere herein. |
| |
3
| The investment has approximately $0.3 million in an unfunded delayed draw commitment as of March 31, 2019. |
| |
4 | The investment is structured as a first lien last out term loan and may earn interest in addition to the stated rate. |
At March 31, 2020,2023, our investment in I-45 SLF LLC did not exceed the 10% threshold in any of the tests under Rule 4-08(g) and did not exceed the 20% threshold in any of the tests under Rule 3-09 of Regulation S-X. However, at March 31, 2021, our investment in I-45 SLF LLC exceeded the 10% threshold in at least one of the tests under Rule 4-08(g) and exceeded the 20% thresholdthresholds in at least one of the tests under Rule 3-09 of Regulation S-X. Accordingly, we have included the financial statements of I-45 SLF LLC as an exhibit to our Annual Report on Form 10-K for the fiscal year ended March 31, 2020 the financial statements of I-45 SLF LLC.2023. Below is certain summarized financial information for I-45 SLF LLC as of March 31, 20202023 and 2019March 31, 2022 and for the years ended March 31, 2020, 20192023, 2022 and 20182021 (amounts in thousands):
| | | | | | | | | | | |
| March 31, 2023 | | March 31, 2022 |
| Selected Balance Sheet Information: | | | |
| Investments, at fair value (cost $169,874 and $187,714) | $ | 143,712 | | | $ | 176,704 | |
| Cash and cash equivalents | 6,478 | | | 9,949 | |
| Interest receivable | 1,145 | | | 850 | |
| Accounts receivable | 1,038 | | | 123 | |
| Deferred financing costs and other assets | 416 | | | 1,518 | |
| Total assets | $ | 152,789 | | | $ | 189,144 | |
| | | |
| Senior credit facility payable | $ | 86,000 | | | $ | 114,500 | |
| Other liabilities | 2,674 | | | 2,596 | |
| Total liabilities | $ | 88,674 | | | $ | 117,096 | |
| Members’ equity | 64,115 | | | 72,048 | |
| Total liabilities and members' equity | $ | 152,789 | | | $ | 189,144 | |
| | | | | | | | | | | | | | | | | | | | | |
| | | Years Ended March 31, |
| | | | | 2023 | | 2022 | | 2021 |
| Selected Statement of Operations Information: | | | | | | | | | |
| Total revenues | | | | | $ | 16,914 | | | $ | 12,804 | | | $ | 13,930 | |
| Total expenses | | | | | (7,542) | | | (4,166) | | | (4,565) | |
| Net investment income | | | | | 9,372 | | | 8,638 | | | 9,365 | |
| Net unrealized (depreciation) appreciation | | | | | (15,153) | | | (4,569) | | | 30,467 | |
| Net realized gains (losses) | | | | | 1,224 | | | 1,047 | | | (15,313) | |
| Net (decrease) increase in members’ equity resulting from operations | | | | | $ | (4,557) | | | $ | 5,116 | | | $ | 24,519 | |
|
| | | | | | | |
| | March 31, 2020 | | March 31, 2019 |
| Selected Balance Sheet Information: | | | |
| Investments, at fair value (cost $207,768 and $242,061) | $ | 170,860 |
| | $ | 237,547 |
|
| Cash and cash equivalents | 3,739 |
| | 6,406 |
|
| Due from broker | 38 |
| | — |
|
| Deferred financing costs | 2,095 |
| | 1,615 |
|
| Interest receivable | 1,076 |
| | 979 |
|
| Total assets | $ | 177,808 |
| | $ | 246,547 |
|
| | | | |
| Senior credit facility payable | $ | 125,000 |
| | $ | 160,000 |
|
| Payable for unsettled transactions | — |
| | 940 |
|
| Other liabilities | 3,029 |
| | 3,606 |
|
| Total liabilities | $ | 128,029 |
| | $ | 164,546 |
|
| Members’ equity | 49,779 |
| | 82,001 |
|
| Total liabilities and net assets | $ | 177,808 |
| | $ | 246,547 |
|
Below is a summary of I-45 SLF LLC’s portfolio, followed by a listing of the individual loans in I-45 SLF LLC’s portfolio as of March 31, 2023 and March 31, 2022 (in thousands):
I-45 SLF LLC Loan Portfolio as of March 31, 2023
| | | | | | | | | | | | | | | | | | | | | | | | | | | | | | | | | | | | | | | | | | | | |
| | | | | | | | Current | | | | | | |
| | | | Investment | | Maturity | | Interest | | | | | | |
| Portfolio Company | | Industry | | Type | | Date | | Rate1 | | Principal | | Cost | | Fair Value2 |
| AAC New Holdco Inc. | | Healthcare services | | First Lien | | 6/25/2025 | | 18.00% PIK | | $ | 2,238 | | | $ | 2,239 | | | $ | 2,160 | |
| | | | Delayed Draw Term Loan5 | | 6/25/2025 | | 18.00% PIK | | 60 | | | 59 | | | 58 | |
| | | | 304,075 shares common stock | | — | | — | | — | | | 1,449 | | | 581 | |
| | | | Warrants (Expiration - December 11, 2025) | | — | | — | | — | | | 482 | | | 193 | |
| ADS Tactical, Inc. | | Aerospace & defense | | First Lien | | 3/19/2026 | | L+5.75% (Floor 1.00%) | | 6,058 | | | 5,975 | | | 5,634 | |
American Teleconferencing Services, Ltd.3 | | Telecommunications | | Revolving Loan | | 4/7/2023 | | P+5.50% (Floor 2.00%) | | 985 | | | 978 | | | 51 | |
| | | | First Lien | | 6/8/2023 | | P+5.50% (Floor 2.00%) | | 5,597 | | | 5,566 | | | 287 | |
| Burning Glass Intermediate Holding Company, Inc. | | Software & IT services | | Revolving Loan4 | | 6/10/2028 | | L+5.00% (Floor 1.00%) | | 123 | | | 118 | | | 123 | |
| | | | First Lien | | 6/10/2028 | | L+5.00% (Floor 1.00%) | | 3,157 | | | 3,113 | | | 3,157 | |
| Corel Inc. | | Software & IT services | | First Lien | | 7/2/2026 | | SOFR+5.00% | | 6,440 | | | 6,311 | | | 6,050 | |
| Emerald Technologies (U.S.) Acquisitionco, Inc. | | Technology products & components | | First Lien | | 12/29/2027 | | SOFR+6.25% (Floor 1.00%) | | 4,485 | | | 4,430 | | | 4,261 | |
| Evergreen AcqCo 1 LP | | Consumer products & retail | | First Lien | | 4/26/2028 | | SOFR+5.50% (Floor 0.75%) | | 2,606 | | | 2,584 | | | 2,501 | |
| Evergreen North America Acquisitions, LLC | | Industrial services | | First Lien | | 8/13/2026 | | L+6.75% (Floor 1.00%) | | 6,673 | | | 6,575 | | | 6,673 | |
| Geo Parent Corporation | | Building & infrastructure products | | First Lien | | 12/19/2025 | | SOFR+5.25% | | 6,769 | | | 6,743 | | | 6,397 | |
| Infogain Corporation | | Software & IT services | | First Lien | | 7/28/2028 | | SOFR+5.75% (Floor 1.00%) | | 4,735 | | | 4,678 | | | 4,684 | |
| Integro Parent Inc. | | Business services | | First Lien | | 5/8/2023 | | SOFR+12.25% PIK (Floor 1.00%) | | 369 | | | 369 | | | 347 | |
| Intermedia Holdings, Inc. | | Software & IT services | | First Lien | | 7/21/2025 | | L+6.00% (Floor 1.00%) | | 6,607 | | | 6,562 | | | 5,088 | |
| Inventus Power, Inc. | | Technology products & components | | First Lien | | 3/29/2024 | | SOFR+5.00% (Floor 1.00%) | | 6,860 | | | 6,836 | | | 6,791 | |
| INW Manufacturing, LLC | | Food, agriculture, & beverage | | First Lien | | 3/25/2027 | | L+5.75% (Floor 0.75%) | | 2,775 | | | 2,713 | | | 2,391 | |
|
| | | | | | | | | | | |
| | Years Ended March 31, |
| | 2020 | | 2019 | | 2018 |
| Selected Statement of Operations Information: | | | | | |
| Total revenues | $ | 20,300 |
| | $ | 21,397 |
| | $ | 17,066 |
|
| Total expenses | 8,045 |
| | 8,759 |
| | 6,613 |
|
| Net investment income | 12,255 |
| | 12,638 |
| | 10,453 |
|
| Net unrealized (depreciation) appreciation | (32,394 | ) | | (6,647 | ) | | (615 | ) |
| Net realized gains | 603 |
| | 400 |
| | 1,660 |
|
| Net (decrease) increase in members’ equity resulting from operations | $ | (19,536 | ) | | $ | 6,391 |
| | $ | 11,498 |
|
| | | | | | | | | | | | | | | | | | | | | | | | | | | | | | | | | | | | | | | | | | | | |
| | | | | | | | Current | | | | | | |
| | | | Investment | | Maturity | | Interest | | | | | | |
| Portfolio Company | | Industry | | Type | | Date | | Rate1 | | Principal | | Cost | | Fair Value2 |
Isagenix International, LLC3 | | Consumer products & retail | | First Lien | | 6/14/2025 | | L+7.75% (Floor 1.00%) | | 1,650 | | | 1,641 | | | 561 | |
| KORE Wireless Group Inc. | | Telecommunications | | First Lien | | 12/20/2024 | | SOFR+5.50% | | 5,597 | | | 5,582 | | | 5,317 | |
| Lab Logistics, LLC | | Healthcare services | | First Lien | | 9/25/2023 | | SOFR+7.25% (Floor 1.00%) | | 10,050 | | | 10,017 | | | 9,929 | |
| Lash OpCo, LLC | | Consumer products & retail | | First Lien | | 3/18/2026 | | L+7.00% (Floor 1.00%) | | 6,113 | | | 5,999 | | | 5,868 | |
| Lift Brands, Inc. | | Consumer services | | Tranche A | | 6/29/2025 | | SOFR+7.50% (Floor 1.00%) | | 2,477 | | | 2,477 | | | 2,427 | |
| | | | Tranche B | | 6/29/2025 | | 9.50% PIK | | 602 | | | 602 | | | 548 | |
| | | | Tranche C | | 6/29/2025 | | — | | 565 | | | 565 | | | 514 | |
| | | | 1,051 shares common stock | | — | | — | | — | | | 749 | | | 553 | |
| Lightbox Intermediate, L.P. | | Software & IT services | | First Lien | | 5/9/2026 | | L+5.00% | | 6,876 | | | 6,831 | | | 6,636 | |
| LOGIX Holdings Company, LLC | | Telecommunications | | First Lien | | 12/23/2024 | | L+5.75% (Floor 1.00%) | | 4,443 | | | 4,431 | | | 3,638 | |
| Mills Fleet Farm Group LLC | | Consumer products & retail | | First Lien | | 10/24/2024 | | L+6.25% (Floor 1.00%) | | 4,491 | | | 4,462 | | | 4,401 | |
| National Credit Care | | Consumer services | | First Lien - Term Loan A | | 12/23/2026 | | L+6.50% (Floor 1.00%) | | 2,159 | | | 2,125 | | | 2,122 | |
| | | | First Lien - Term Loan B | | 12/23/2026 | | L+7.50% (Floor 1.00%) | | 2,159 | | | 2,125 | | | 2,122 | |
NBG Acquisition, Inc.3 | | Wholesale | | First Lien | | 4/26/2024 | | L+5.50% (Floor 1.00%) | | 2,606 | | | 2,593 | | | 78 | |
| NinjaTrader, Inc. | | Financial services | | First Lien | | 12/18/2024 | | L+6.25% (Floor 1.00%) | | 5,000 | | | 4,939 | | | 5,000 | |
| Research Now Group, Inc. | | Business services | | First Lien | | 12/20/2024 | | L+5.50% (Floor 1.00%) | | 5,874 | | | 5,837 | | | 4,505 | |
| Retail Services WIS Corporation | | Business services | | First Lien | | 5/20/2025 | | L+7.75% (Floor 1.00%) | | 2,827 | | | 2,793 | | | 2,742 | |
| SIB Holdings, LLC | | Business services | | First Lien | | 10/29/2026 | | L+6.25% (Floor 1.00%) | | 2,929 | | | 2,884 | | | 2,841 | |
| Stellant Midco, LLC | | Aerospace & defense | | First Lien | | 10/2/2028 | | SOFR+5.50% (Floor 0.75%) | | 2,265 | | | 2,247 | | | 2,172 | |
| Tacala, LLC | | Consumer products & retail | | First Lien | | 2/5/2027 | | L+3.50% (Floor 0.75%) | | 990 | | | 950 | | | 974 | |
| | | | Second Lien | | 2/4/2028 | | L+7.50% (Floor 0.75%) | | 6,000 | | | 5,958 | | | 5,501 | |
| TEAM Services Group, LLC | | Healthcare services | | First Lien | | 12/20/2027 | | L+5.00% (Floor 1.00%) | | 6,620 | | | 6,582 | | | 6,454 | |
| U.S. TelePacific Corp. | | Telecommunications | | First Lien | | 5/1/2026 | | SOFR+1.00%, 7.25% PIK (Floor 1.00%) | | 5,635 | | | 5,635 | | | 1,479 | |
| | | | | | | | | | | | | | | | | | | | | | | | | | | | | | | | | | | | | | | | | | | | |
| | | | | | | | Current | | | | | | |
| | | | Investment | | Maturity | | Interest | | | | | | |
| Portfolio Company | | Industry | | Type | | Date | | Rate1 | | Principal | | Cost | | Fair Value2 |
| Veregy Consolidated, Inc. | | Environmental services | | First Lien | | 11/3/2027 | | L+6.00% (Floor 1.00%) | | 1,955 | | | 1,951 | | | 1,683 | |
| Vida Capital, Inc. | | Financial services | | First Lien | | 10/1/2026 | | L+6.00% | | 3,265 | | | 3,236 | | | 2,408 | |
Wahoo Fitness Acquisition, LLC3 | | Consumer products & retail | | First Lien | | 8/14/2028 | | SOFR+5.75% (Floor 1.00%) | | 4,875 | | | 4,751 | | | 2,071 | |
| YS Garments, LLC | | Consumer products & retail | | First Lien | | 8/9/2026 | | L+7.50% (Floor 1.00%) | | 4,157 | | | 4,132 | | | 3,741 | |
| Total Investments | | | | | | | | | | | | $ | 169,874 | | | $ | 143,712 | |
1Represents the interest rate as of March 31, 2023. All interest rates are payable in cash, unless otherwise noted. The majority of investments bear interest at a rate that may be determined by reference to London Interbank Offered Rate (“LIBOR” or “L”), Prime (“P”) or Secured Overnight Financing Rate ("SOFR"), which reset daily, monthly, quarterly, or semiannually. For each investment, the Company has provided the spread over LIBOR, Prime, or SOFR in effect at March 31, 2023. Certain investments are subject to an interest rate floor.
2Represents the fair value determined utilizing a similar process as the Company in accordance with ASC 820. However, the determination of such fair value is determined by the Board of Managers of I-45 SLF LLC. It is not included in the Company’s Board of Directors’ valuation process described elsewhere herein.
3Investment is on non-accrual status as of March 31, 2023, meaning the Company has ceased to recognize interest income on the investment.
4The investment has approximately $246.6 thousand in an unfunded revolving loan commitment as of March 31, 2023.
5The investment has approximately $43.8 thousand in an unfunded delayed draw loan commitment as of March 31, 2023.
I-45 SLF LLC Loan Portfolio as of March 31, 2022
| | | | | | | | | | | | | | | | | | | | | | | | | | | | | | | | | | | | | | | | | | | | |
| | | | | | | | Current | | | | | | |
| | | | Investment | | Maturity | | Interest | | | | | | |
| Portfolio Company | | Industry | | Type | | Date | | Rate1 | | Principal | | Cost2 | | Fair Value3 |
| AAC New Holdco Inc. | | Healthcare services | | First Lien | | 6/25/2025 | | 10.00%, 8.00% PIK | | $ | 1,899 | | | $ | 1,899 | | | $ | 1,833 | |
| | | | 304,075 shares common stock | | — | | — | | — | | | 1,449 | | | 1,449 | |
| | | | Warrants (Expiration - December 11, 2025) | | — | | — | | — | | | 482 | | | 482 | |
| ADS Tactical, Inc. | | Aerospace & defense | | First Lien | | 3/19/2026 | | L+5.75% (Floor 1.00%) | | 6,394 | | 6,283 | | 6,133 |
American Teleconferencing Services, Ltd.4 | | Telecommunications | | Revolving Loan | | 6/30/2022 | | P+5.50% | | 1,027 | | 1,021 | | 64 |
| | | | First Lien | | 6/8/2023 | | P+5.50% | | 5,598 | | 5,566 | | 308 |
| ATX Networks (Toronto) Corporation | | Technology products & components | | First Lien | | 9/1/2026 | | L+7.50% (Floor 1.00%) | | 2,617 | | 2,610 | | 2,499 |
| | | | Senior Subordinated Debt | | 9/1/2028 | | 10.00% PIK | | 1,081 | | 1,081 | | 729 |
| | | | 196 Class A units | | — | | — | | — | | | — | | — |
| Burning Glass Intermediate Holding Company, Inc. | | Software & IT services | | Revolving Loan5 | | 6/10/2028 | | L+5.00% (Floor 1.00%) | | 74 | | 67 | | 67 |
| | | | First Lien | | 6/10/2028 | | L+5.00% (Floor 1.00%) | | 3,189 | | 3,140 | | 3,189 |
| Corel, Inc. | | Software & IT services | | First Lien | | 7/2/2026 | | L+5.00% | | 6,803 | | 6,650 | | 6,805 |
| Emerald Technologies (U.S.) Acquisitionco, Inc. | | Technology products & components | | First Lien | | 12/29/2027 | | SOFR +6.25% (Floor 1.00%) | | 3,125 | | | 3,063 | | 3,078 |
| Evergreen AcqCo 1 LP | | Consumer products & retail | | First Lien | | 4/26/2028 | | L+5.50% (Floor 0.75%) | | 4,179 | | 4,142 | | 4,158 |
| Evergreen North America Acquisitions, LLC | | Industrial services | | First Lien | | 8/13/2026 | | L+6.75% (Floor 1.00%) | | 6,740 | | 6,623 | | 6,740 |
| Geo Parent Corporation | | Building & infrastructure products | | First Lien | | 12/19/2025 | | L+5.25% | | 6,840 | | 6,809 | | 6,806 |
| GS Operating, LLC | | Distribution | | First Lien | | 1/3/2028 | | SOFR +6.00% (Floor 0.75%) | | 4,988 | | 4,891 | | 4,988 |
| Infogain Corporation | | Software & IT services | | First Lien | | 7/28/2028 | | L+5.75% (Floor 1.00%) | | 4,784 | | 4,719 | | 4,769 |
| InfoGroup Inc. | | Software & IT services | | First Lien | | 4/3/2023 | | L+5.00% (Floor 1.00%) | | 2,850 | | 2,845 | | 2,704 |
| Integro Parent Inc. | | Business services | | First Lien | | 10/28/2022 | | L+5.75% (Floor 1.00%) | | 3,217 | | 3,209 | | 3,043 |
| Intermedia Holdings, Inc. | | Software & IT services | | First Lien | | 7/21/2025 | | L+6.00% (Floor 1.00%) | | 5,677 | | 5,659 | | 5,638 |
| | | | | | | | | | | | | | | | | | | | | | | | | | | | | | | | | | | | | | | | | | | | |
| | | | | | | | Current | | | | | | |
| | | | Investment | | Maturity | | Interest | | | | | | |
| Portfolio Company | | Industry | | Type | | Date | | Rate1 | | Principal | | Cost2 | | Fair Value3 |
| Inventus Power, Inc. | | Technology products & components | | First Lien | | 3/29/2024 | | SOFR +5.00% (Floor 1.00%) | | 6,930 | | 6,884 | | 6,791 |
| INW Manufacturing, LLC | | Food, agriculture, & beverage | | First Lien | | 3/25/2027 | | L+5.75% (Floor 0.75%) | | 2,925 | | 2,867 | | 2,867 |
| Isagenix International, LLC | | Consumer products & retail | | First Lien | | 6/14/2025 | | L+5.75% (Floor 1.00%) | | 1,685 | | 1,677 | | 1,088 |
| KORE Wireless Group Inc. | | Telecommunications | | First Lien | | 12/20/2024 | | L+5.50% | | 4,658 | | 4,639 | | 4,640 |
| Lab Logistics, LLC | | Healthcare services | | First Lien | | 9/25/2023 | | L+7.25% (Floor 1.00%) | | 6,242 | | 6,213 | | 6,242 |
| Lash OpCo, LLC | | Consumer products & retail | | First Lien | | 3/18/2026 | | L+7.00% (Floor 1.00%) | | 4,988 | | 4,881 | | 4,878 |
| | | | Delayed Draw Term Loan6 | | 3/18/2026 | | L+7.00% (Floor 1.00%) | | 1,187 | | 1,152 | | 1,161 |
| Lift Brands, Inc. | | Consumer services | | Tranche A | | 6/29/2025 | | L+7.50% (Floor 1.00%) | | 2,502 | | 2,502 | | 2,252 |
| | | | Tranche B | | 6/29/2025 | | 9.50% PIK | | 583 | | 583 | | 437 |
| | | | Tranche C | | 6/29/2025 | | — | | 565 | | 564 | | 423 |
| | | | 1,051 shares common stock | | — | | — | | — | | | 749 | | 749 |
| Lightbox Intermediate, L.P. | | Software & IT services | | First Lien | | 5/9/2026 | | L+5.00% | | 4,948 | | 4,914 | | 4,874 |
| LOGIX Holdings Company, LLC | | Telecommunications | | First Lien | | 12/23/2024 | | L+5.75% (Floor 1.00%) | | 5,826 | | 5,807 | | 5,491 |
| Mills Fleet Farm Group LLC | | Consumer products & retail | | First Lien | | 10/24/2024 | | L+6.25% (Floor 1.00%) | | 4,623 | | 4,584 | | 4,623 |
| National Credit Care, LLC | | Consumer services | | First Lien - Term Loan A | | 12/23/2026 | | L+6.50% (Floor 1.00%) | | 2,500 | | 2,453 | | 2,483 |
| | | | First Lien - Term Loan B | | 12/23/2026 | | L+7.50% (Floor 1.00%) | | 2,500 | | 2,453 | | 2,483 |
| NBG Acquisition, Inc. | | Wholesale | | First Lien | | 4/26/2024 | | L+5.50% (Floor 1.00%) | | 2,663 | | 2,647 | | 1,807 |
| NinjaTrader, Inc. | | Financial services | | First Lien | | 12/18/2024 | | L+6.25% (Floor 1.00%) | | 5,000 | | 4,908 | | 5,000 |
| NorthStar Group Services, Inc. | | Environmental services | | First Lien | | 11/9/2026 | | L+5.50% (Floor 1.00%) | | 2,961 | | 2,948 | | 2,950 |
| Research Now Group, Inc. | | Business services | | First Lien | | 12/20/2024 | | L+5.50% (Floor 1.00%) | | 4,936 | | 4,936 | | 4,861 |
| Retail Services WIS Corporation | | Business services | | First Lien | | 5/20/2025 | | L+7.75% (Floor 1.00%) | | 2,959 | | 2,912 | | 2,914 |
| SIB Holdings, LLC | | Business services | | First Lien | | 10/29/2026 | | L+6.00% (Floor 1.00%) | | 3,000 | | 2,945 | | 2,958 |
| Stellant Midco, LLC | | Aerospace & defense | | First Lien | | 10/2/2028 | | L+5.50% (Floor 0.75%) | | 2,289 | | 2,267 | | 2,254 |
| | | | | | | | | | | | | | | | | | | | | | | | | | | | | | | | | | | | | | | | | | | | |
| | | | | | | | Current | | | | | | |
| | | | Investment | | Maturity | | Interest | | | | | | |
| Portfolio Company | | Industry | | Type | | Date | | Rate1 | | Principal | | Cost2 | | Fair Value3 |
| Tacala, LLC | | Consumer products & retail | | Second Lien | | 2/7/2028 | | L+7.50% (Floor 0.75%) | | 5,000 | | 4,991 | | 4,944 |
| TEAM Services Group, LLC | | Healthcare services | | First Lien | | 12/20/2027 | | L+5.00% (Floor 1.00%) | | 6,687 | | 6,644 | | 6,637 |
| TestEquity, LLC | | Capital equipment | | First Lien | | 4/28/2022 | | L+6.25% (Floor 1.00%) | | 3,805 | | 3,804 | | 3,805 |
| | | | First Lien - Term Loan B | | 4/28/2022 | | L+6.25% (Floor 1.00%) | | 942 | | 942 | | 942 |
| UniTek Global Services, Inc. | | Telecommunications | | First Lien | | 8/20/2024 | | L+5.50%, 2.00% PIK (Floor 1.00%) | | 2,814 | | 2,802 | | 2,627 |
| U.S. TelePacific Corp. | | Telecommunications | | First Lien | | 5/1/2026 | | L+1.00%, 7.25% PIK (Floor 1.00%) | | 5,239 | | 5,239 | | 3,714 |
| Veregy Consolidated, Inc. | | Environmental services | | First Lien | | 11/3/2027 | | L+6.00% (Floor 1.00%) | | 1,975 | | 1,970 | | 1,936 |
| Vida Capital, Inc. | | Financial services | | First Lien | | 10/1/2026 | | L+6.00% | | 3,565 | | 3,531 | | 3,283 |
| Wahoo Fitness Acquisition, LLC | | Consumer products & retail | | First Lien | | 8/14/2028 | | L+5.75% (Floor 1.00%) | | 4,969 | | 4,833 | | 4,869 |
| YS Garments, LLC | | Consumer products & retail | | First Lien | | 8/9/2024 | | L+5.50% (Floor 1.00%) | | 4,282 | | 4,265 | | 4,239 |
| Total Investments | | | | | | | | | | | | $ | 187,714 | | | $ | 176,704 | |
1Represents the interest rate as of March 31, 2022. All interest rates are payable in cash, unless otherwise noted. The majority of investments bear interest at a rate that may be determined by reference to London Interbank Offered Rate (“LIBOR” or “L”), Secured Overnight Financing Rate ("SOFR") or Prime (“Prime”) which reset daily, monthly, quarterly, or semiannually. For each, the Company has provided the spread over LIBOR, SOFR or Prime in effect at March 31, 2022. Certain investments are subject to an interest rate floor. Certain investments, as noted, accrue payment-in-kind ("PIK") interest.
2Represents amortized cost.
3Represents the fair value determined utilizing a similar process as the Company in accordance with ASC 820. However, the determination of such fair value is determined by the Board of Managers of I-45 SLF LLC. It is not included in the Company’s Board of Directors’ valuation process described elsewhere herein.
4Investment is on non-accrual status as of March 31, 2022, meaning the Company has ceased to recognize interest income on the investment.
5The investment has approximately $0.3 million in an unfunded revolving loan commitment as of March 31, 2022.
6The investment has approximately $0.8 million in an unfunded delayed draw term loan commitment as of March 31, 2022.
16. SUBSEQUENT EVENTS
On April 26, 2023, the Board of Directors declared a total dividend of $0.59 per share, comprised of a regular dividend of $0.54 and a supplemental dividend of $0.05, for the quarter ending June 30, 2023. The record date for the dividend is June 15, 2023. The payment date for the dividend is June 30, 2023.
On April 26, 2023, pursuant to Rule 2a-5 under the 1940 Act, the Board of Directors designated a committee of certain officers of the Company as the Board's valuation designee (the "Valuation Designee") to determine the fair value of the Company's investments that do not have readily available market quotations, subject to the oversight of the Board of Directors, effective beginning as of the fiscal quarter ending June 30, 2023.
SCHEDULE 12-14
Schedule of Investments in and Advances to Affiliates
(In thousands)
| | | | | | | | | | | | | | | | | | | | | | | | | | | | | | | | | | | | | | | | | | | | | | | | | | |
| Portfolio Company | Type of Investment (1) | March 31, 2023 Principal Amount - Debt Investments | | Amount of Interest or Dividends Credited in Income (2) | | Fair Value at March 31, 2022 | | Gross Additions (3) | | Gross Reductions (4) | | Amount of Realized Gain/(Loss) (5) | | Amount of Unrealized Gain/(Loss) | | Fair Value at March 31, 2023 |
| Control Investments | | | | | | | | | | | | | | | |
| I-45 SLF LLC | 80% LLC equity interest | $ | — | | | $ | 7,337 | | | $ | 57,603 | | | $ | 4,800 | | | $ | — | | | $ | — | | | $ | (11,147) | | | $ | 51,256 | |
| Total Control Investments | | $ | — | | | $ | 7,337 | | | $ | 57,603 | | | $ | 4,800 | | | $ | — | | | $ | — | | | $ | (11,147) | | | $ | 51,256 | |
| | | | | | | | | | | | | | | | |
| Affiliate Investments | | | | | | | | | | | | | | | |
| Air Conditioning Specialists, Inc. | Revolving Loan | $ | 800 | | | $ | 15 | | | $ | — | | | $ | 1,384 | | | $ | (600) | | | $ | — | | | $ | 16 | | | $ | 800 | |
| First Lien | 27,438 | | | 1,905 | | | 12,535 | | | 14,574 | | | (170) | | | — | | | 499 | | | 27,438 | |
| 766,738.93 Preferred Units | — | | | — | | | 634 | | | 186 | | | — | | | — | | | 382 | | | 1,202 | |
| Catbird NYC, LLC | Revolving Loan | — | | | 36 | | | — | | | 16 | | | — | | | — | | | (16) | | | — | |
| First Lien | 15,500 | | | 1,635 | | | 15,884 | | | 59 | | | (400) | | | — | | | (43) | | | 15,500 | |
| 1,000,000 Class A Units | — | | | 88 | | | 1,221 | | | — | | | — | | | — | | | 437 | | | 1,658 | |
| 500,000 Class B Units | — | | | 53 | | | 572 | | | — | | | — | | | — | | | 142 | | | 714 | |
| Central Medical Supply LLC | Revolving Loan | 300 | | | 49 | | | 290 | | | 6 | | | — | | | — | | | — | | | 296 | |
| First Lien | 7,500 | | | 950 | | | 7,260 | | | 29 | | | — | | | — | | | 113 | | | 7,402 | |
| Delayed Draw Term Loan | 100 | | | 25 | | | 97 | | | 6 | | | — | | | — | | | (4) | | | 99 | |
| 1,380,500 Preferred Units | — | | | — | | | 641 | | | — | | | — | | | — | | | (284) | | | 357 | |
| Chandler Signs, LLC | 1,500,000 units of Class A-1 common stock | — | | | — | | | 924 | | | — | | | — | | | — | | | 2,291 | | | 3,215 | |
| Delphi Intermediate Healthco LLC | First Lien | 1,649 | | | 108 | | | 1,402 | | | 108 | | | — | | | — | | | (1,510) | | | — | |
| First Lien | 1,829 | | | 98 | | | 1,472 | | | 97 | | | — | | | — | | | (1,569) | | | — | |
| Protective Advance | 1,448 | | | 79 | | | 526 | | | 922 | | | — | | | — | | | (1,448) | | | — | |
| 1,681.04 Common Units | — | | | — | | | 2,460 | | | — | | | — | | | — | | | (2,460) | | | — | |
|
| | | | | | | | | | | | | | | | | | | | | | | | | | | | | |
| Portfolio Company | Type of Investment (1) | | Amount of Interest or Dividends Credited in Income (2) | | Fair Value at March 31, 2019 | | Gross Additions (3) | | Gross Reductions (4) | | Amount of Realized Gain/(Loss) (5) | | Amount of Unrealized Gain/(Loss) | | Fair Value at March 31, 2020 |
| Control Investments | | | |
| | |
| | |
| | |
| | |
| | |
| | |
| I-45 SLF LLC | 80% LLC equity interest | | $ | 9,590 |
| | $ | 65,743 |
| | $ | — |
| | $ | — |
| | $ | — |
| | $ | (25,983 | ) | | $ | 39,760 |
|
| | | | | | | | | | | | | | | | |
| Prism Spectrum Holdings, LLC | First lien | | 265 |
| | 13,461 |
| | 7 |
| | (13,461 | ) | | 226 |
| | (233 | ) | | — |
|
| | 96,498.32 Class A units | | — |
| | 6,539 |
| | — |
| | (6,539 | ) | | — |
| | — |
| | — |
|
| | | | | | | | | | | | | | | | |
| Media Recovery, Inc. | 800,000 shares Series A Convertible Preferred Stock, convertible into 800,000 shares common stock | | 424 |
| | 7,795 |
| | — |
| | (7,349 | ) | | 6,549 |
| | (6,995 | ) | | — |
|
| | 4,000,002 shares common stock | | 2,122 |
| | 44,965 |
| | — |
| | (42,394 | ) | | 37,779 |
| | (40,350 | ) | | — |
|
| | | | | | | | | | | | | | | | |
| Total Control Investments | | | $ | 12,401 |
| | $ | 138,503 |
| | $ | 7 |
| | $ | (69,743 | ) | | $ | 44,554 |
| | $ | (73,561 | ) | | $ | 39,760 |
|
| | | | | | | | | | | | | | | | | | | | | | | | | | | | | | | | | | | | | | | | | | | | | | | | | | |
| Portfolio Company | Type of Investment (1) | March 31, 2023 Principal Amount - Debt Investments | | Amount of Interest or Dividends Credited in Income (2) | | Fair Value at March 31, 2022 | | Gross Additions (3) | | Gross Reductions (4) | | Amount of Realized Gain/(Loss) (5) | | Amount of Unrealized Gain/(Loss) | | Fair Value at March 31, 2023 |
| Dynamic Communities, LLC | Revolving Loan | — | | | 1 | | | — | | | — | | | — | | | 1 | | | (1) | | | — | |
| First Lien | — | | | 286 | | | 10,323 | | | 12 | | | (11,159) | | | — | | | 824 | | | — | |
| First Lien - Term Loan A | 3,846 | | | 249 | | | — | | | 9,554 | | | (4,604) | | | (1,124) | | | (3) | | | 3,823 | |
| First Lien - Term Loan B | 3,867 | | | 118 | | | — | | | 9,423 | | | (4,484) | | | (1,095) | | | (1) | | | 3,843 | |
| Senior subordinated debt | — | | | 41 | | | 650 | | | 41 | | | (587) | | | (104) | | | — | | | — | |
| 2,000,000 Preferred units | — | | | — | | | 1,274 | | | — | | | — | | | (2,000) | | | 726 | | | — | |
| 250,000 Class A Preferred units | — | | | — | | | — | | | 250 | | | — | | | — | | | 375 | | | 625 | |
| 5,435,211.03 Class B Preferred units | — | | | — | | | — | | | 2,218 | | | — | | | — | | | — | | | 2,218 | |
| 255,984.22 Class C Preferred units | — | | | — | | | — | | | — | | | — | | | — | | | — | | | — | |
| 2,500,000 Common units | — | | | — | | | — | | | — | | | — | | | — | | | — | | | — | |
| GPT Industries, LLC | Revolving loan | — | | | 5 | | | — | | | (58) | | | — | | | — | | | 58 | | | — | |
| First lien | 6,150 | | | 148 | | | — | | | 6,030 | | | — | | | — | | | — | | | 6,030 | |
| 1,000,000 Class A Preferred Units | — | | | — | | | — | | | 1,000 | | | — | | | — | | | — | | | 1,000 | |
| GrammaTech, Inc. | Revolving Loan | — | | | 10 | | | — | | | 9 | | | — | | | — | | | (9) | | | — | |
| First Lien | 10,031 | | | 1,336 | | | 9,775 | | | 67 | | | (1,500) | | | 15 | | | 1,674 | | | 10,031 | |
| 1,000 Class A units | — | | | — | | | 674 | | | — | | | — | | | — | | | (674) | | | — | |
| 360.06 Class A-1 units | — | | | — | | | 38 | | | 304 | | | — | | | — | | | 30 | | | 372 | |
| ITA Holdings Group, LLC | Revolving loan | 7,000 | | | 786 | | | 750 | | | 6,241 | | | — | | | — | | | 23 | | | 7,014 | |
| First Lien - Term Loan | 10,114 | | | 1,232 | | | 10,041 | | | 98 | | | — | | | — | | | (25) | | | 10,114 | |
| First Lien - Term Loan B | 5,057 | | | 766 | | | 5,061 | | | 47 | | | — | | | — | | | (40) | | | 5,068 | |
| First Lien - PIK Note A | 3,271 | | | 545 | | | 2,959 | | | 538 | | | — | | | — | | | (242) | | | 3,255 | |
| First Lien - PIK Note B | 129 | | | 13 | | | 117 | | | 12 | | | — | | | — | | | (1) | | | 128 | |
| Warrants | — | | | — | | | 3,199 | | | — | | | — | | | — | | | 847 | | | 4,046 | |
| 9.25% Class A membership interest | — | | | — | | | 3,063 | | | — | | | — | | | — | | | 1,285 | | | 4,348 | |
|
| | | | | | | | | | | | | | | | | | | | | | | | | | | | | |
| Portfolio Company | Type of Investment (1) | | Amount of Interest or Dividends Credited in Income (2) | | Fair Value at March 31, 2019 | | Gross Additions (3) | | Gross Reductions (4) | | Amount of Realized Gain/(Loss) (5) | | Amount of Unrealized Gain/(Loss) | | Fair Value at March 31, 2020 |
| Affiliate Investments | | | | | | | | | | | | | | | |
| Chandler Signs, LLC | Senior subordinated debt (12.00% cash, 1.00% PIK) | | $ | 422 |
| | $ | 4,480 |
| | $ | 25 |
| | $ | (4,569 | ) | | $ | 32 |
| | $ | 32 |
| | $ | — |
|
| | 1,500,000 units of Class A-1 common stock | | 8 |
| | 1,937 |
| | — |
| | — |
| | — |
| | 1,173 |
| | 3,110 |
|
| | | | | | | | | | | | | | | | |
| Dynamic Communities, LLC | Revolving loan | | 4 |
| | — |
| | 1 |
| | — |
| | — |
| | (1 | ) | | — |
|
| | First lien | | 1,152 |
| | 10,972 |
| | 41 |
| | (280 | ) | | — |
| | (805 | ) | | 9,928 |
|
| | 2,000,000 Preferred units | | 133 |
| | 2,849 |
| | — |
| | — |
| | — |
| | (999 | ) | | 1,850 |
|
| | | | | | | | | | | | | | | | |
| GrammaTech, Inc. | Revolving Loan | | 14 |
| | — |
| | 2,460 |
| | — |
| | — |
| | — |
| | 2,460 |
|
| | First lien | | 452 |
| | — |
| | 11,312 |
| | — |
| | — |
| | 4 |
| | 11,316 |
|
| | 1000 Class A Units | | — |
| | — |
| | 1,000 |
| | — |
| | — |
| | — |
| | 1,000 |
|
| | | | | | | | | | | | | | | | |
| ITA Holdings Group, LLC | Revolving loan | | 228 |
| | 2,000 |
| | 2,560 |
| | (4,550 | ) | | — |
| | (10 | ) | | — |
|
| | First lien - Term Loan | | 979 |
| | 7,475 |
| | 3,034 |
| | (666 | ) | | 10 |
| | 47 |
| | 9,900 |
|
| | First lien - Term B Loan | | 610 |
| | 3,829 |
| | 1,506 |
| | (333 | ) | | 6 |
| | 128 |
| | 5,136 |
|
| | First Lien - PIK Note A | | 317 |
| | 2,005 |
| | 257 |
| | — |
| | — |
| | (29 | ) | | 2,233 |
|
| | First Lien - PIK Note B | | 9 |
| | 79 |
| | 7 |
| | — |
| | — |
| | 2 |
| | 88 |
|
| | Warrants | | — |
| | 1,557 |
| | — |
| | — |
| | — |
| | 1,205 |
| | 2,762 |
|
| | 9.25% Class A membership interest | | — |
| | 923 |
| | — |
| | — |
| | — |
| | 1,176 |
| | 2,099 |
|
| Roseland Management, LLC | Revolving loan | | 21 |
| | — |
| | 507 |
| | — |
| | — |
| | (7 | ) | | 500 |
|
| | First lien | | 1,011 |
| | 10,474 |
| | 32 |
| | (105 | ) | | — |
| | (32 | ) | | 10,369 |
|
| | 10,000 Class A Units | | — |
| | 1,487 |
| | — |
| | — |
| | — |
| | (153 | ) | | 1,334 |
|
| SIMR, LLC | First lien | | 1,610 |
| | 11,403 |
| | 523 |
| | (335 | ) | | 1 |
| | (402 | ) | | 11,190 |
|
| | 9,374,510.2 Class B Common units | | — |
| | 5,724 |
| | 383 |
| | — |
| | — |
| | (4,365 | ) | | 1,742 |
|
| | | | | | | | | | | | | | | | | | | | | | | | | | | | | | | | | | | | | | | | | | | | | | | | | | |
| Portfolio Company | Type of Investment (1) | March 31, 2023 Principal Amount - Debt Investments | | Amount of Interest or Dividends Credited in Income (2) | | Fair Value at March 31, 2022 | | Gross Additions (3) | | Gross Reductions (4) | | Amount of Realized Gain/(Loss) (5) | | Amount of Unrealized Gain/(Loss) | | Fair Value at March 31, 2023 |
| Lighting Retrofit International, LLC (DBA Envocore) | Revolving Loan | — | | | 34 | | | — | | | 833 | | | (833) | | | — | | | — | | | — | |
| First Lien | 5,143 | | | 393 | | | 4,780 | | | — | | | (53) | | | — | | | 416 | | | 5,143 | |
| Second Lien | 5,208 | | | — | | | 3,104 | | | — | | | — | | | — | | | 490 | | | 3,594 | |
| 208,333.3333 Series A Preferred units | — | | | — | | | — | | | — | | | — | | | — | | | — | | | — | |
| 203,124.9999 Common units | — | | | — | | | — | | | — | | | — | | | — | | | — | | | — | |
| Outerbox, LLC | Revolving Loan | — | | | 9 | | | — | | | (25) | | | — | | | — | | | 25 | | | — | |
| First Lien | 14,625 | | | 982 | | | — | | | 14,429 | | | — | | | — | | | 123 | | | 14,552 | |
| 6,308.2584 Class A common units | — | | | — | | | — | | | 631 | | | — | | | — | | | 142 | | | 773 | |
| Roseland Management, LLC | Revolving Loan | 575 | | | 81 | | | 575 | | | 2 | | | — | | | — | | | (22) | | | 555 | |
| First Lien | 15,051 | | | 1,883 | | | 14,125 | | | 1,132 | | | (145) | | | — | | | (588) | | | 14,524 | |
| 3,364 Class A-2 Units | — | | | — | | | — | | | 202 | | | — | | | — | | | 492 | | | 694 | |
| 1,100 Class A-1 units | — | | | — | | | — | | | 66 | | | — | | | — | | | 95 | | | 161 | |
| 16,084 Class A units | — | | | — | | | 1,905 | | | — | | | — | | | — | | | (1,483) | | | 422 | |
| SIMR, LLC | First Lien | — | | | — | | | 10,588 | | | 191 | | | (13,081) | | | (211) | | | 2,513 | | | — | |
| First Lien - Incremental | — | | | — | | | — | | | 191 | | | (191) | | | — | | | — | | | — | |
| 9,374,510.2 Class B Common Units | — | | | — | | | — | | | — | | | — | | | (6,107) | | | 6,107 | | | — | |
| 904,903.31 Class W Units | — | | | — | | | — | | | — | | | — | | | — | | | — | | | — | |
| Sonobi, Inc. | 500,000 Class A Common units | — | | | — | | | 2,960 | | | — | | | — | | | — | | | (1,211) | | | 1,749 | |
| STATinMED, LLC | First Lien | 7,288 | | | 699 | | | — | | | 7,479 | | | (191) | | | — | | | — | | | 7,288 | |
| Delayed Draw Term Loan | 122 | | | 6 | | | — | | | 121 | | | — | | | — | | | 1 | | | 122 | |
| 4,718.62 Class A Preferred Units | — | | | — | | | — | | | 4,838 | | | — | | | — | | | (1,071) | | | 3,767 | |
| 39,097.96 Class B Preferred Units | — | | | — | | | — | | | 1,400 | | | — | | | — | | | (1,400) | | | — | |
| | | Portfolio Company | Type of Investment (1) | | Amount of Interest or Dividends Credited in Income (2) | | Fair Value at March 31, 2019 | | Gross Additions (3) | | Gross Reductions (4) | | Amount of Realized Gain/(Loss) (5) | | Amount of Unrealized Gain/(Loss) | | Fair Value at March 31, 2020 | Portfolio Company | Type of Investment (1) | March 31, 2023 Principal Amount - Debt Investments | | Amount of Interest or Dividends Credited in Income (2) | | Fair Value at March 31, 2022 | | Gross Additions (3) | | Gross Reductions (4) | | Amount of Realized Gain/(Loss) (5) | | Amount of Unrealized Gain/(Loss) | | Fair Value at March 31, 2023 |
| Zenfolio Inc. | Revolving loan | | 29 |
| | — |
| | 2,004 |
| | — |
| | — |
| | (116 | ) | | 1,888 |
| |
| Student Resource Center LLC | | Student Resource Center LLC | First Lien | 8,889 | | | 195 | | | — | | | 8,727 | | | — | | | — | | | (7) | | | 8,720 | |
| | First lien | | 1,701 |
| | 13,165 |
| | 1,076 |
| | (500 | ) | | 8 |
| | (622 | ) | | 13,127 |
| | 10,502,487.46 Preferred units | — | | | — | | | — | | | 5,845 | | | — | | | — | | | — | | | 5,845 | |
| | 190 shares of common stock | | — |
| | 546 |
| | — |
| | — |
| | — |
| | (546 | ) | | — |
| | 2,000,000 Preferred units | — | | | — | | | — | | | — | | | — | | | — | | | — | | | — | |
| Total Affiliate Investments | | | $ | 8,700 |
| | $ | 80,905 |
| | $ | 26,728 |
| | $ | (11,338 | ) | | $ | 57 |
| | $ | (4,320 | ) | | $ | 92,032 |
| Total Affiliate Investments | | $ | 162,930 | | | $ | 14,859 | | | $ | 131,879 | | | $ | 99,235 | | | $ | (37,998) | | | (10,625) | | | $ | 6,014 | | | $ | 188,505 | |
| Total Control & Affiliate Investments | | | $ | 21,101 |
| | $ | 219,408 |
| | $ | 26,735 |
| | $ | (81,081 | ) | | $ | 44,611 |
| | $ | (77,881 | ) | | $ | 131,792 |
| Total Control & Affiliate Investments | | $ | 162,930 | | | $ | 22,196 | | | $ | 189,482 | | | $ | 104,035 | | | $ | (37,998) | | | $ | (10,625) | | | $ | (5,133) | | | $ | 239,761 | |
This schedule should be read(1)The principal amount and ownership detail as shown in conjunction with our Consolidated Financial Statements, including the Consolidated Schedules of InvestmentsInvestments.
(2)Represents the total amount of interest or dividends credited to income for the portion of the year an investment was included in the Control or Affiliate categories, respectively.
(3)Gross additions include increases in the cost basis of investments resulting from new portfolio investments, follow-on investments, accrued PIK interest, and Notesaccretion of OID. Gross additions also include movement of an existing portfolio company into this category and out of a different category.
(4)Gross reductions include decreases in the cost basis of investments resulting from principal repayments or sales and the exchange of one or more existing securities for one or more new securities. Gross reductions also include movement of an existing portfolio company out of this category and into a different category.
(5)The schedule does not reflect realized gains or losses on escrow receivables for investments which were previously exited and were not held during the period presented. Gains and losses on escrow receivables are classified in the Consolidated Statements of Operations according to Consolidated Financial Statements.the control classification at the time the investment was exited.
| |
(1) | The principal amount and ownership detail as shown in the Consolidated Schedules of Investments. |
| |
(2) | Represents the total amount of interest or dividends credited to income for the portion of the year an investment was included in the Control or Affiliate categories, respectively. |
| |
(3) | Gross additions include increases in the cost basis of investments resulting from new portfolio investments, follow-on investments, accrued PIK interest, and accretion of OID. Gross additions also include movement of an existing portfolio company into this category and out of a different category.
|
| |
(4) | Gross reductions include decreases in the cost basis of investments resulting from principal repayments or sales and the exchange of one or more existing securities for one or more new securities. Gross reductions also include movement of an existing portfolio out of this category and into a different category. |
| |
(5) | The schedule does not reflect realized gains or losses on escrow receivables for investments which were previously exited and were not held during the period presented. Gains and losses on escrow receivables are classified in the Consolidated Statements of Operations according to the control classification at the time the investment was exited. |
Item 9. Changes in and Disagreements with Accountants on Accounting and Financial Disclosure
None.
Item 9A. Controls and Procedures
Evaluation of Disclosure Controls and Procedures
We maintain disclosure controls and procedures, as defined in Rules 13a-15(e) and 15d-15(e) of the Exchange Act, that are designed to provide reasonable assurance that information required to be disclosed in our filings and submissions under the Exchange Act is recorded, processed, summarized and reported within the periods specified in the rules and forms of the SEC and that such information is accumulated and communicated to our management, including our Chief Executive Officer and Chief Financial Officer, as appropriate, to allow timely discussions regarding the required disclosure.
We completed an evaluation under the supervision and with participation of management, including the Chief Executive Officer and Chief Financial Officer, of the effectiveness of the design and operation of our disclosure controls and procedures as of March 31, 2020.2023. Based upon this evaluation, the Chief Executive Officer and Chief Financial Officer have concluded that as of March 31, 2020,2023, our disclosure controls and procedures were effective to provide the reasonable assurance described above. We note that the design of any system of controls is based in part upon certain assumptions about the likelihood of future events, and there can be no assurance that any design will succeed in achieving the stated goals under all potential future conditions.
Management’s Report on Internal Control over Financial Reporting
Management is responsible for establishing and maintaining adequate internal control over financial reporting, as defined in Exchange Act Rules 13a-15(f). Under the supervision and with the participation of management, including the Chief Executive Officer and Chief Financial Officer, we conducted an evaluation of the effectiveness of our internal control over financial reporting based on the criteria established in the 2013 Internal Control — Integrated Framework issued by the Committee of Sponsoring Organizations of the Treadway Commission (COSO). Based on our evaluation under the framework in the 2013 Internal Control — Integrated Framework, management concluded that our internal control over financial reporting was effective as of March 31, 2020. RSM US, LLP, our independent registered public accounting firm, has audited the effectiveness of the Company’s internal control over financial reporting as of March 31, 2020, as stated in its report which is included in Item 8 of Part II of this Annual Report.2023.
Changes in Internal Control over Financial Reporting
There have been no changes in our internal control over financial reporting (as defined in Rule 13(a)-15(f) of the Exchange Act) during the three months ended March 31, 20202023 that have materially affected, or are reasonably likely to materially affect, our internal controls over financial reporting.
Limitations on Controls
Because of its inherent limitations, management does not expect that our disclosure controls and our internal controls over financial reporting will prevent or detect all misstatements. Also, projections of any evaluation of effectiveness to future periods are subject to the risk that controls may become inadequate because of changes in conditions or that the degree of compliance with policies and procedures may deteriorate. Any control system, no matter how well designed and operated, is based upon certain assumptions and can only provide reasonable, not absolute, assurance that its objectives will be met. Further, no evaluation of controls can provide absolute assurance that misstatements due to errors or fraud will not occur or that all control issues and instances of fraud, if any within the Company, have been detected.
Item 9B. Other Information
FEES AND EXPENSES
The following table is intended to assist you in understanding the costs and expenses you will bear directly or indirectly. We caution you that some of the percentages indicated in the table below are estimates and may vary. Except where the context suggests otherwise, whenever there is a reference to fees or expenses paid by “you,” “us” or “CSWC,” or that “we” will pay fees or expenses, you will indirectly bear such fees or expenses as investors in us.
| | | | | | | | | | | |
| Shareholder Transaction Expenses: | | | |
| Sales load (as a percentage of offering price) | | — | % | (1) |
| Offering expenses (as a percentage of offering price) | | — | % | (2) |
| Dividend reinvestment plan expenses | | — | % | (3) |
| Total shareholder transaction expenses (as a percentage of offering price) | | — | % | |
| | | |
| Annual Expenses (as a percentage of net assets attributable to common stock for the fiscal year ended March 31, 2023): | | | |
| Operating expenses | | 3.62 | % | (4) |
| Interest payments on borrowed funds | | 7.54 | % | (5) |
| Income tax provision | | 0.06 | % | (6) |
| Acquired fund fees and expenses | | 1.52 | % | (7) |
| Total annual expenses | | 12.74 | % | |
|
| | | | |
| Shareholder Transaction Expenses: | | | |
| Sales load (as a percentage of offering price) | | — | % | (1) |
| Offering expenses (as a percentage of offering price) | | — | % | (2) |
| Dividend reinvestment plan expenses | | — | % | (3) |
| Total shareholder transaction expenses (as a percentage of offering price) | | — | % | |
| | | | |
| Annual Expenses (as a percentage of net assets attributable to common stock for the fiscal year ended March 31, 2020): | | | |
| Operating expenses | | 5.15 | % | (4) |
| Interest payments on borrowed funds | | 6.72 | % | (5) |
| Income tax expense | | 0.60 | % | (6) |
| Acquired fund fees and expenses | | 2.77 | % | (7) |
| Total annual expenses | | 15.24 | % | |
(1)In the event that our securities are sold to or through underwriters, a corresponding prospectus supplement will disclose the applicable sales load.
| |
(1) | In the event that our securities are sold to or through underwriters, a corresponding prospectus supplement will disclose the applicable sales load. |
| |
(2) | In the event that we conduct an offering of our securities, a corresponding prospectus supplement will disclose the estimated offering expenses. |
| |
(3) | The expenses of administering our dividend reinvestment plan (“DRIP”) are included in operating expenses. The DRIP does not allow shareholders to sell shares through the DRIP. If a shareholder wishes to sell shares they would be required to select a broker of their choice and pay any fees or other costs associated with the sale. |
| |
(4) | Operating expenses in this table represent the estimated annual operating expenses of CSWC and its consolidated subsidiaries based on actual operating expenses for the year ended March 31, 2020. We do not have an investment adviser and are internally managed by our executive officers under the supervision of our board of directors. As a result, we do not pay investment advisory fees, but instead we pay the operating costs associated with employing investment management professionals including, without limitation, compensation expenses related to salaries, discretionary bonuses and restricted stock grants. |
| |
(5) | Interest payments on borrowed funds represents our estimated annual interest payments based on actual interest rate terms under our Credit Facility, our anticipated drawdowns from our Credit Facility, the 5.95% Notes due 2022 (the "December 2022 Notes") and the 5.375% Notes due 2024 (the “October 2024 Notes”). As of March 31, 2020, we had $154.0 million outstanding under our Credit Facility, $77.1 million in aggregate principal of our December 2022 Notes outstanding and $75.0 million in aggregate principal of our October 2024 Notes outstanding. Any future issuances of debt securities will be made at the discretion of management and our board of directors after evaluating the investment opportunities and economic situation of the Company and the market as a whole. |
| |
(6) | Income tax expense relates to the accrual of (a) deferred and current tax provision (benefit) for U.S. federal income taxes and (b) excise, state and other taxes. Deferred taxes are non-cash in nature and may vary significantly from period to period. We are required to include deferred taxes in calculating our annual expenses even though deferred taxes are not currently payable or receivable. Income tax expense represents the estimated annual income tax expense of CSWC and its consolidated subsidiaries based actual income tax expense for the year ended March 31, 2020. |
| |
(7) | Acquired fund fees and expenses represent the estimated indirect expense incurred due to our investment in the I-45 Senior Loan Fund based upon the actual amount incurred for the fiscal year ended March 31, 2020. |
(2)In the event that we conduct an offering of our securities, a corresponding prospectus supplement will disclose the estimated offering expenses.
(3)The expenses of administering our dividend reinvestment plan (“DRIP”) are included in operating expenses. The DRIP does not allow shareholders to sell shares through the DRIP. If a shareholder wishes to sell shares they would be required to select a broker of their choice and pay any fees or other costs associated with the sale.
(4)Operating expenses in this table represent the estimated annual operating expenses of CSWC and its consolidated subsidiaries based on actual operating expenses for the year ended March 31, 2023. We do not have an investment adviser and are internally managed by our executive officers under the supervision of our Board of Directors. As a result, we do not pay investment advisory fees, but instead we pay the operating costs associated with employing investment management professionals including, without limitation, compensation expenses related to salaries, discretionary bonuses and restricted stock grants.
(5)Interest payments on borrowed funds represents our estimated annual interest payments based on actual interest rate terms under our Credit Facility and our anticipated drawdowns from our Credit Facility, our actual interest rate terms under the SBA Debentures and our anticipated drawdowns of the SBA Debentures, the 4.50% Notes due 2026 (the "January 2026 Notes") and the 3.375% Notes due 2026 (the "October 2026 Notes"). As of March 31, 2023, we had $235.0 million outstanding under our Credit Facility, $120.0 million outstanding under the SBA Debentures, $140.0 million in aggregate principal of our January 2026 Notes outstanding and $150.0 million in aggregate principal of our October 2026 Notes outstanding. Any future issuances of debt securities will be made at the discretion of management and our board of directors after evaluating the investment opportunities and economic situation of the Company and the market as a whole.
(6)Income tax provision relates to the accrual of (a) deferred and current tax provision (benefit) for U.S. federal income taxes and (b) excise, state and other taxes. Deferred taxes are non-cash in nature and may vary significantly from period to period. We are required to include deferred taxes in calculating our annual expenses even though deferred taxes are not currently payable or receivable. Income tax provision represents the estimated annual income tax expense of CSWC and its consolidated subsidiaries based on actual income tax expense for the year ended March 31, 2023.
(7)Acquired fund fees and expenses represent the estimated indirect expense incurred due to our investment in I-45 SLF LLC, a joint venture with Main Street Capital Corporation, based upon the actual amount incurred for the fiscal year ended March 31, 2023.
Example
The following example demonstrates the projected dollar amount of total cumulative expenses that would be incurred over various periods with respect to a hypothetical investment in our common stock. In calculating the following expense amounts, we have assumed we would have no additional leverage and that our annual operating expenses would remain at the levels set forth in the table above.
| | | | | | | | | | | | | | | | | | | | | | | | | | |
| | 1 Year | | 3 Years | | 5 Years | | 10 Years |
| You would pay the following expenses on a $1,000 investment, assuming 5.0% annual return | | $ | 127 | | | $ | 353 | | | $ | 545 | | | $ | 910 | |
|
| | | | | | | | | | | | | | | | |
| | | 1 Year | | 3 Years | | 5 Years | | 10 Years |
| You would pay the following expenses on a $1,000 investment, assuming 5.0% annual return | | $ | 152 |
| | $ | 412 |
| | $ | 621 |
| | $ | 984 |
|
The example and the expenses in the table above should not be considered a representation of our future expenses, and actual expenses may be greater or less than those shown. While the example assumes, as required by the SEC, a 5.0% annual return, our performance will vary and may result in a return greater or less than 5.0%. In addition, while
the example
assumes reinvestment of all dividends at NAV, participants in our DRIP will receive a number of shares of our common stock, determined by dividing the total dollar amount of the dividend payable to a participant by the average purchase price of all shares of common stock purchased by the administrator of the DRIP in the event that shares are purchased in the open market to satisfy the share requirements of the DRIP, which may be at, above or below NAV. See "Business - Dividend Reinvestment Plan” included in Item I of Part I of this Annual Report on Form 10-K for additional information regarding our DRIP.
Item 9C. Disclosure Regarding Foreign Jurisdictions that Prevent Inspections
Not applicable.
PART III
Item 10. Directors, Executive Officers and Corporate Governance
The information required by this Item 10 will be contained in the definitive proxy statement relating to our 20202023 annual meeting of shareholders to be filed with the SEC no later than 120 days after the close of our fiscal year ended March 31, 2020,2023, and is incorporated herein by reference.
Item 11. Executive Compensation
The information required by this Item 11 will be contained in the definitive proxy statement relating to our 20202023 annual meeting of shareholders to be filed with the SEC no later than 120 days after the close of our fiscal year ended March 31, 2020,2023, and is incorporated herein by reference.
Item 12. Security Ownership of Certain Beneficial Owners and Management and Related Shareholder Matters
The information required by this Item 12 will be contained in the definitive proxy statement relating to our 20202023 annual meeting of shareholders to be filed with the SEC no later than 120 days after the close of our fiscal year ended March 31, 2020,2023, and is incorporated herein by reference.
Item 13. Certain Relationships and Related Transactions, and Director Independence
The information required by this Item 13 will be contained in the definitive proxy statement relating to our 20202023 annual meeting of shareholders under the headings of “Certain Relationships and Related Transactions” and “Corporate Governance” to be filed with the Securities and Exchange Commission no later than 120 days after the close of our fiscal year ended March 31, 2020,2023, and is incorporated herein by reference.
Item 14. Principal Accountant Fees and Services
The information required by this Item 14 will be contained in the definitive proxy statement relating to our 20202023 annual meeting of shareholders under the heading of “Ratification and Appointment of Independent Registered Public Accounting Firm for the Year Ended March 31, 2020”2023” to be filed with the Securities and Exchange Commission no later than 120 days after the close of our fiscal year ended March 31, 2020,2023, and is incorporated herein by reference.
PART IV
Item 15. Exhibits, Financial Statement Schedules
The following documents are filed or incorporated by reference as part of this Annual Report:
1. Consolidated Financial Statements
2. Consolidated Financial Statement Schedule
3. Exhibits
|
| | | | |
| Exhibit No. | Description |
| |
| |
| Articles of Incorporation, dated April 19, 1961, including amendments dated June 30, 1969, July 20, 1987, April 23, 2007 and July 15, 2013 (incorporated by reference to Exhibit (a) to Registration Statement on Form N-2 (Reg.(File No. 333-220385) filed on September 8, 2017). |
| |
| |
| |
| |
| |
| |
| |
| |
| |
| |
| |
| |
| |
| |
| |
| SecondThird Supplemental Indenture, dated as of September 27, 2019,December 29, 2020, relating to the 5.375%4.50% Notes due 2024,2026, by and between the Company and U.S. Bank National Association, as trustee (incorporated by reference to Exhibit 4.2 ofto Current Report on Form 8-K (File No. 814-00061) filed on September 27, 2019)December 29, 2020). |
|
| |
Exhibit No. | Description |
| |
| |
| |
| |
| |
| |
| |
| |
| |
| |
| |
| |
| |
| |
| Amended and Restated Guarantee, Pledge and Security Agreement dated as of December 21, 2018 among Capital Southwest Corporation, as Borrower, the Subsidiary Guarantors party hereto, ING Capital LLC, as Revolving Administrative Agent for the Revolving Lenders, each Financing Agent and Designated Indebtedness Holder party hereto and ING Capital, LLC, as Collateral Agent (incorporated by reference to Exhibit 10.2 to Current Report on Form 8-K (File No. 814-00061) filed on December 21, 2018). |
| |
| |
| |
| Second Amended and Restated Senior Secured Revolving Credit Agreement dated as of December 21, 2018August 9, 2021 among Capital Southwest Corporation, as Borrower, the Lenders party hereto, ING Capital LLC, as Administrative Agent, Arranger and Bookrunner and Texas Capital Bank, N.A., as Documentation Agent (incorporated by reference to Exhibit 10.1 to Current Report on Form 8-K (File No. 814-00061) filed on December 21, 2018)August 9, 2021). |
| | | | | |
| Exhibit No. | Description |
| |
| |
| |
| Amendment No. 1 to theSecond Amended and Restated Senior Secured Revolving Credit Agreement, dated November 16, 2017,as of September 10, 2021, by and among the Company,Capital Southwest Corporation, as Borrower, Capital Southwest Equity Investments, Inc., as Subsidiary Guarantor, the lenders party thereto, and ING Capital LLC, and the subsidiary guarantors theretoas Administrative Agent (incorporated by reference to Exhibit 10.1 to Current Report on Form 8-K (File No. 814-00061) filed on November 17, 2017)September 10, 2021). |
| |
| |
| |
| Incremental AssumptionRestated Senior Secured Revolving Credit Agreement, dated as of May 11, 20182022, by and among Capital Southwest Corporation, as Borrower, the guarantor party thereto, the lenders from time to time party thereto and ING Capital LLC, as Administrative Agent, and Increasing LenderTexas Capital Bank, as Documentation Agent (incorporated by reference to Exhibit 10.1 to Current Report on Form 8-K (File No. 814-00061) filed on May 14, 2018)12, 2022). |
| |
| |
| |
| |
| |
| |
| |
| |
| |
|
| |
Exhibit No. | Description |
| |
| |
| |
| |
| |
| |
|
|
| |
| |
| |
| Form of Third Amendment, dated August 2, 2022, to Third Amended and Restated Equity Distribution Agreement, dated February 4, 2020,May 26, 2021, between the Company and each of Jefferies LLC and Raymond James & Associates, Inc., respectively (incorporated by reference to Exhibit 10.1 to Current Report on Form 8-K filed on August 2, 2022). |
| |
| |
| |
| |
| |
| |
| |
| |
| |
| |
| |
| |
| |
| |
| |
| |
| |
* Filed herewith.
+ Indicates management contract or compensatory plan or arrangement.
^ The certifications attached as Exhibit 32.1 and 32.2 accompany this Annual Report pursuant to 18 U.S.C. Section 1350, as adopted pursuant to Section 906 of the Sarbanes-Oxley Act of 2002, and shall not be deemed “filed” by the registrant for purposes of Section 18 of the Exchange Act, and are not to be incorporated by reference into any of the registrant’s filings under the Securities Act or the Exchange Act, whether made before or after the date of this Annual Report, irrespective of any general incorporation language contained in any such filing.
Item 16. Form 10-K Summary
None.
SIGNATURES
Pursuant to the requirements of Section 13 or 15(d) of the Securities Exchange Act of 1934, the Registrant has duly caused this report to be signed on its behalf by the undersigned, thereunto duly authorized.
|
| | | | | | | |
| CAPITAL SOUTHWEST CORPORATION |
| By: | /s/ Bowen S. Diehl |
| | Bowen S. Diehl President and Chief Executive Officer |
Date: June 2, 2020May 23, 2023
POWER OF ATTORNEY
KNOW ALL MEN BY THESE PRESENTS that each individual whose signature appears below hereby constitutes and appoints Bowen S. Diehl and Michael Sarner, and each or either of them, acting individually, as his true and lawful attorney-in-fact and agent, with full power of substitution and resubstitution, for him and in his name, place and stead, in any and all capacities to sign any and all amendments to this Annual Report, and to file the same, with all exhibits thereto and other documents in connection therewith, with the SEC, granting unto said attorney-in-fact and agent, and each of them, full power and authority to do and perform each and every act and thing requisite and necessary to be done in connection therewith, as fully for all intents and purposes as he might or could do in person, hereby ratifying and confirming all that said attorney-in-fact and agent, or any of them, or their or his substitutes, may lawfully do or cause to be done or by virtue hereof.
Pursuant to the requirement of the Securities and Exchange Act of 1934, this report has been signed below by the following persons on behalf of the Registrant and in the capacities and on the dates indicated:
| | | | | | | | |
| Signature | Title | Date |
| | |
| /s/ David R. Brooks | Chairman of the Board | May 23, 2023 |
| David R. Brooks | | |
| | |
Signature | Title | Date |
| | |
/s/ David R. Brooks | Chairman of the Board | June 2, 2020 |
David R. Brooks | | |
| | |
| /s/ Christine S. Battist | Director | June 2, 2020May 23, 2023 |
| Christine S. Battist | | |
| | |
| /s/ Jack D. Furst | Director | June 2, 2020May 23, 2023 |
| Jack D. Furst | | |
| | |
/s/ T. Duane MorganRamona Rogers-Windsor | Director | June 2, 2020May 23, 2023 |
T. Duane MorganRamona Rogers-Windsor | | |
| | |
| /s/ William R. Thomas | Director | June 2, 2020May 23, 2023 |
| William R. Thomas | | |
| | |
| /s/ Bowen S. Diehl | President and Chief Executive Officer | June 2, 2020May 23, 2023 |
| Bowen S. Diehl | | |
| | |
| /s/ Michael S. Sarner | Chief Financial Officer | June 2, 2020May 23, 2023 |
| Michael S. Sarner | (Chief Financial/Accounting Officer) | |