0000018230us-gaap:FairValueInputsLevel3Memberus-gaap:AssetBackedSecuritiesMemberus-gaap:FairValueMeasurementsRecurringMember2021-12-31VariableInterestEntityPrimaryBeneficiaryMember2022-12-31
UNITED STATES
SECURITIES AND EXCHANGE COMMISSION
Washington, D.C. 20549
FORM 10-K
(Mark One)
| | | | | |
| ☒ | ANNUAL REPORT PURSUANT TO SECTION 13 OR 15(d) OF THE SECURITIES EXCHANGE ACT OF 1934 |
For the fiscal year ended December 31, 20212023
OR
| | | | | |
| ☐ | TRANSITION REPORT PURSUANT TO SECTION 13 OR 15(d) OF THE SECURITIES EXCHANGE ACT OF 1934 |
For the transition period from to .
Commission File No. 1-768
CATERPILLAR INC.
(Exact name of Registrant as specified in its charter)
| | | | | | | | | | | | | | | | | |
| Delaware | 37-0602744 |
| (State or other jurisdiction of incorporation) | (IRS Employer I.D. No.) |
| 510 Lake Cook Road,5205 N. O'Connor Boulevard, | Suite 100, | Deerfield,Irving, | IllinoisTexas | 6001575039 |
| (Address of principal executive offices) | (Zip Code) |
Registrant’s telephone number, including area code: (224) 551-4000(972) 891-7700
Securities registered pursuant to Section 12(b) of the Act:
| | | | | | | | | | | |
| Title of each class | Trading Symbol (s) | Name of each exchange on which registered | |
| Common Stock ($1.00 par value) | CAT | New York Stock Exchange | (1) |
8% Debentures due February 15, 2023 | CAT23 | New York Stock Exchange | |
| 5.3% Debentures due September 15, 2035 | CAT35 | New York Stock Exchange | |
(1) In addition to the New York Stock Exchange, Caterpillar common stock is also listed on stock exchanges in France and Switzerland.
Securities registered pursuant to Section 12(g) of the Act: None
Indicate by check mark if the Registrant is a well-known seasoned issuer, as defined in Rule 405 of the Securities Act. Yes ý No o
Indicate by check mark if the Registrant is not required to file reports pursuant to Section 13 or Section 15(d) of the Act. Yes o No ý
Indicate by check mark whether the Registrant (1) has filed all reports required to be filed by Section 13 or 15(d) of the Securities Exchange Act of 1934 during the preceding 12 months (or for such shorter period that the Registrant was required to file such reports), and (2) has been subject to such filing requirements for the past 90 days. Yes ý No o
Indicate by check mark whether the Registrant has submitted electronically every Interactive Data File required to be submitted pursuant to Rule 405 of Regulation S-T (§232.405 of this chapter) during the preceding 12 months (or for such shorter period that the registrant was required to submit such files). Yes ý No o
Indicate by check mark whether the Registrant is a large accelerated filer, an accelerated filer, a non-accelerated filer, a smaller reporting company or emerging growth company. See the definitions of “large accelerated filer,” “accelerated filer”, “smaller reporting company” and "emerging growth company" in Rule 12b-2 of the Exchange Act. (Check one):
| | | | | | | | | | | |
| Large accelerated filer | x | Accelerated filer | o |
| | | |
| Non-accelerated filer | o | Smaller reporting company | ☐ |
| | | |
| | Emerging growth company | ☐ |
If an emerging growth company, indicate by check mark if the registrant has elected not to use the extended transition period for complying with any new or revised financial accounting standards provided pursuant to Section 13(a) of the Exchange Act. o
Indicate by check mark whether the registrant has filed a report on and attestation to its management's assessment of the effectiveness of its internal control over financial reporting under Section 404(b) of the Sarbanes-Oxley Act (15 U.s.C. 7262(b)) by the registered public accounting firm that prepared or issued its audit report.ý
If securities are registered pursuant to Section 12(b) of the Act, indicate by check mark whether the financial statements of the registrant included in the filing reflect the correction of an error to previously issued financial statements. o
Indicate by check mark whether any of those error corrections are restatements that required a recovery analysis of incentive-based compensation received by any of the registrant’s executive officers during the relevant recovery period pursuant to §240.10D-1(b). o
Indicate by check mark whether the Registrant is a shell company (as defined in Rule 12b-2 of the Exchange Act). Yes ☐ No ý
As of June 30, 2021,2023, there were 547,471,467510,143,097 shares of common stock of the Registrant outstanding, and the aggregate market value of the voting stock held by non-affiliates of the Registrant (assuming only for purposes of this computation that directors and executive officers may be affiliates) was approximately $118.1$125.0 billion.
As of December 31, 2021,2023, there were 535,888,051499,377,269 shares of common stock of the Registrant outstanding.
Documents Incorporated by Reference
Portions of the documents listed below have been incorporated by reference into the indicated parts of this Form 10-K, as specified in the responses to the item numbers involved.
| | | | | |
| Part III | 20222024 Annual Meeting Proxy Statement (Proxy Statement) to be filed with the Securities and Exchange Commission (SEC) within 120 days after the end of the fiscal year. |
PART I
Item 1.Business.
General
Originally organized as Caterpillar Tractor Co. in 1925 in the State of California, our company was reorganized as Caterpillar Inc. in 1986 in the State of Delaware. As used herein, the term “Caterpillar,” “we,” “us,” “our” or “the company” refers to Caterpillar Inc. and its subsidiaries unless designated or identified otherwise.
Overview
With 20212023 sales and revenues of $50.971$67.060 billion, Caterpillar is the world’s leading manufacturer of construction and mining equipment, off-highway diesel and natural gas engines, industrial gas turbines and diesel-electric locomotives. The company principally operates through its three primary segments - Construction Industries, Resource Industries and Energy & Transportation - and also provides financing and related services through its Financial Products segment. Caterpillar is also a leading U.S. exporter. Through a global network of independent dealers and direct sales of certain products, Caterpillar builds long-term relationships with customers around the world.
Enterprise Strategy
Our company strategy, rolled out in 2017, reflects our legacy and our continuing commitment to meet the needs of our customers and the communities in which we live and work. United by our Values, Caterpillar employees around the world share a focused view of our business through the Operating & Execution Model, through which we are making strategic choices today to create long-term profitable growth. Since 2017, we focused on three strategic areas: Expanded Offerings, Operational Excellence and Services. In 2022, we updated our strategy to also include Sustainability as a strategic area. For nearly 100 years, our longstanding commitment to sustainability has inspired us to set and achieve meaningful environmental, social and governance goals. It’s also allowed us to develop innovative products, technologies and services to support our customers on their sustainability journey. The addition of sustainability as a strategic area, together with operational excellence, expanded offerings and services, highlights our work to help customers build a better, more sustainable world.
Currently, we have five operating segments, of which four are reportable segments and are described below.
Categories of Business Organization
1. Machinery, Energy & Transportation — Caterpillar Inc. and its subsidiaries, excluding Financial Products. Machinery, Energy & Transportation information relates to the design, manufacturing and marketing of our products.
2. Financial Products — Our finance and insurance subsidiaries, primarily Caterpillar Financial Services Corporation (Cat Financial) and Caterpillar Insurance Holdings Inc. (Insurance Services). Financial Products information relates to the financing to customers and dealers for the purchase and lease of Caterpillar and other equipment.
Other information about our operations in 2021,2023, including certain risks associated with our operations, is included in Part II, Item 7 “Management’s Discussion and Analysis of Financial Condition and Results of Operations.”
Construction Industries
Our Construction Industries segment is primarily responsible for supporting customers using machinery in infrastructure forestry and building construction. The majority of machine sales in this segment are made in the heavy and general construction, rental, quarry and aggregates markets and mining.
The nature of customer demand for construction machinery varies around the world. Customers in developing economies often prioritize purchase price in making their investment decisions, while customers in developed economies generally weigh productivity and other performance criteria that contribute to lower owning and operating costs over the lifetime of the machine. To meet customer expectations in developing economies, Caterpillar developed differentiated product offerings that target customers in those markets,regions, including our SEM brand machines. We believe that these customer-driven product innovations enable us to compete more effectively in developing economies. The majority of Construction Industries' research and development spending in 20212023 focused on the next generation of construction machines.
The competitive environment for construction machinery is characterized by some global competitors and many regional and specialized local competitors.Examples of global competitors include CASE (part of CNH Industrial N.V.), Deere Construction & Forestry (part of Deere & Company), Doosan Infracore Co., Ltd.Bobcat (Part of Doosan Group), Hitachi Construction Machinery Co., Ltd., Hyundai Construction Equipment Co., Ltd., Hyundai Doosan Infracore Co., Ltd. and Hyundai Construction Equipment Co., Ltd. (both part of Hyundai Heavy Industries Holdings Co.)Group), J.C. Bamford Excavators Ltd., Kobelco Construction Machinery (part of Kobe Steel, Ltd), Komatsu Ltd., Kubota Farm & Industrial Machinery (part of Kubota Corporation), Sany Heavy Industry Co., Ltd., and Volvo Construction Equipment (part of the Volvo Group).As an example of regional and local competitors, our competitors in China also include Guangxi LiuGong Machinery Co., Ltd., Longking Holdings Ltd., Sany Heavy Industry Co., Ltd.,Co, XCMG Construction Machinery Co., Ltd., Shandong Lingong Construction Machinery Co., Ltd. (SDLG, part of theJV with Volvo Group)Construction Equipment) and Shantui Construction Machinery Co., Ltd., (part of Shandong Heavy Industry Group Co.).Each of these companies has varying product lines that compete with Caterpillar products, and each has varying degrees of regional focus.
The Construction Industries product portfolio includes the following machines andproduct families as well as related parts and work tools:
| | | | | | | | | | | | | | |
·asphalt pavers | | · forestry excavatorsmotor graders | | · small and medium |
·backhoe loaders
| | ·motorgraders
| | track-type tractors (small, medium) |
·compactors
| | ·pipelayers
| | ·track-type loaders
|
· cold planers
| | ·road reclaimers
| | ·wheel excavators
|
· compact track andbackhoe loaders | | · site prep tractorspipelayers | | · compact,track excavators (mini, small and |
· cold planers | | · road reclaimers | | medium, large) |
multi-terrain loaders· compactors | | · skid steer loaders | | medium· wheel loadersexcavators |
· compact track loaders mini, small, medium | | · telehandlers | | · wheel loaders (compact, small,
utility vehicles |
· forestry machines | | · track-type loaders | | medium) and large excavators | | | | |
| · material handlers | | | | |
| | | | |
| | | | |
| | | | |
Resource Industries
The Resource Industries segment is primarily responsible for supporting customers using machinery in mining and heavy construction and quarry and aggregates. Caterpillar offers a broad product range and services to deliver comprehensive solutions for our customers. We develop and manufacture high productivity equipment for both surface and underground mining operations around the world, as well as provide drivetrains, hydraulic systems, electronics and software for Caterpillar machines and engines.Our equipment is used to extract and haul copper, iron ore, coal, oil sands, aggregates, gold and other minerals and ores, as well as a variety of heavy construction applications.In addition to equipment, Resource Industries also develops and sells technology products and services to provide customers fleet management systems, equipment management analytics and autonomous machine capabilities.
Customers in most markets place an emphasis on equipment that is highly productive, reliable and provides the lowest total cost of ownership over the life of the equipment.In some developing markets, customers often prioritize purchase price in making their investment decisions. We believe our ability to control the integration and design of key machine components and innovative technologies represents a competitive advantage. Our research and development efforts remain focused on providing customers the lowest total cost of ownership enabled through the highest quality, most productive products and services in the industry.
The competitive environment for Resource Industries consists of a few larger global competitors that compete in several of the markets that we serve and a substantial number of smaller companies that compete in a more limited range of products, applications, and regional markets. Our global surface competitors include Deere Construction & Forestry (part of Deere & Company), Epiroc AB, Hitachi Construction Machinery Co., Ltd., Komatsu Ltd., Liebherr-International AG, Sandvik AB, and Volvo Construction Equipment. Our global underground competitors include Epiroc AB, Komatsu Ltd., and Sandvik AB.
The Resource Industries product portfolio includes the following machines and related parts and servicesservices:
| | | | | | | | | | | | | | |
· electric rope shovels | | ·longwall miners
| | ·landfill compactors
|
·draglines
| | · large wheel loaders | | · soil compactors |
· hydraulic shovelsdraglines | | · off-highway trucks | | · machinery components |
· rotary drillshydraulic shovels | | · articulated trucks | | · autonomous ready vehicles and solutions |
· hard rock vehiclesrotary drills | | · wheel tractor scrapers | | · select work tools |
· large track-type tractorshard rock vehicles | | · wheel dozers | | · safety services and mining performance |
· large mining truckstrack-type tractors | | · fleet management | | solutions |
·large mining trucks | | ·landfill compactors | | | |
| | | | |
| | | | |
| | | | |
| | | | |
| | | | |
Energy & Transportation
Our Energy & Transportation segment supports customers in oil and gas, power generation, marine, rail and industrial applications, including Caterpillar machines. The product and services portfolio includes reciprocating engines, generator sets, integrated systems and solutions, turbines and turbine-related services, electrified powertrain and zero-emission power sources and service solutions development, the remanufacturing of Caterpillar engines and components, and remanufacturing services for other companies, diesel-electric locomotives and other rail-related products and services and product support of on-highway vocational trucks for North America.
Regulatory emissions standards require us to continue to make investments as new products and new regulations are introduced. Ongoing compliance with these regulations remains a focus. Emissions compliance in developing markets is complex due to rapidly evolving and unique requirements where enforcement processes can often vary. We employ robust product development, manufacturing processes and testing to help us comply with these regulations.
The competitive environment for reciprocating engines in marine, oil and gas, industrial and electric power generation systems along with turbines in oil and gas and electric power generation consists of a few larger global competitors that compete in a variety of markets that Caterpillar serves, and a substantial number of smaller companies that compete in a limited-size product range, geographic region and/or application. Principal global competitors include Cummins Inc., Deutz AG, INNIO Jenbacher GmbH, Rolls-Royce Power Systems and Wärtsilä Corp.Siemens Energy Global GmbH. Other competitors, such as FiatVolvo Penta AB, FPT Industrial SpA (Iveco Group), INNIO, GE Power,Vernova, Kawasaki Heavy Industries Energy SolutionsSolution & Marine Engineering, MAN Energy Solutions (VW), Mitsubishi Heavy Industries Ltd., Siemens Energy Global GmbH,Volvo Penta AB, Weichai Power Co., Ltd., and other emerging market competitors compete in certain markets in which Caterpillar competes. An additional set of competitors, including Aggreko plc, Generac Holdings, Kohler Energy, Baker Hughes Co., Generac Holdings, Kohler Power Systems, and others, are primarily packagers who source engines and/or other components from domestic and international suppliers and market products regionally and internationally through a variety of distribution channels. In rail-related businesses, our global competitors include Wabtec Freight, The Greenbrier Companies, Voestalpine AG, and Vossloh AG, Alstom SA, Siemens Mobility, and CRRC Corp., LTD., The Greenbrier Companies, Siemens Mobility, Voestalpine AG, Vossloh AG and Wabtec Freight. We also compete with other companies on a more limited range of products, services and/or geographic regions.
The Energy & Transportation portfolio includes the following products and related parts:
•Reciprocating engine powered generator sets
•Reciprocating engines, drivetrain and integrated systems and solutions supplied to the industrial industry as well as Caterpillar machinery
•Integrated systems and solutions used in the electric power generation industry
•Turbines, centrifugal gas compressors and related services
•Reciprocating engines, drivetrain and integrated systems and solutions for the marine and oil and gas industries
•Remanufactured reciprocating engines and components
•Diesel-electric locomotives and components and other rail-related products and services
Financial Products Segment
The business of our Financial Products Segment is primarily conducted by Cat Financial, Insurance Services and their respective subsidiaries and affiliates. Cat Financial is a wholly owned finance subsidiary of Caterpillar Inc. and it provides retail and wholesale financing alternatives to customers and dealers around the world for Caterpillar products and services, as well as financing for vehicles and power generation facilities and marine vessels that, in most cases, incorporate Caterpillar products. Retail financing is primarily comprised of installment sale contracts and other equipment-related loans, working capital loans, finance leases and operating leases. Wholesale financing to Caterpillar dealers consists primarily of inventory and rental fleet financing. In addition, Cat Financial purchases short-term wholesale trade receivables from Caterpillar. The various financing plans offered by Cat Financial are designed to support sales of Caterpillar products and services and generate financing income for Cat Financial. A significant portion of our activity is conducted in North America and we have additional offices and subsidiaries in Latin America, Asia/Pacific, Europe Africa and the Middle East.Africa.
For over 40 years, Cat Financial has been providing financing for Caterpillar products, contributing to our knowledge of asset values, industry trends, financing structures and customer needs.
In certain instances, Cat Financial’s operations are subject to supervision and regulation by state, federal and various foreign governmental authorities, and may be subject to various laws and judicial and administrative decisions imposing various requirements and restrictions which, among other things, (i) regulate credit granting activities and the administration of loans, (ii) establish maximum interest rates, finance charges and other charges, (iii) require disclosures to customers, (iv) govern secured transactions, (v) set collection, foreclosure, repossession and other trade practices and (vi) regulate the use and reporting of information related to a borrower’s credit experience. Cat Financial’s ability to comply with these and other governmental and legal requirements and restrictions affects its operations.
Cat Financial’s retail loans (totaling 48 percent*) include:
•Loans that allow customers and dealers to use their Caterpillar equipment or other assets as collateral to obtain financing.
•Installment sale contracts, which are equipment loans that enable customers to purchase equipment with a down payment or trade-in and structurestructured payments over time.
Cat Financial's retail leases (totaling 36 percent*) include:
•Finance (non-tax) leases, where the lessee for tax purposes is considered to be the owner of the equipment during the term of the lease, that either require or allow the customer to purchase the equipment for a fixed price at the end of the term.
•Tax leases that are classified as either operating or finance leases for financial accounting purposes, depending on the characteristics of the lease. For tax purposes, we are considered the owner of the equipment.
•Governmental lease-purchase plans in the U.S. that offer low interest rates and flexible terms to qualified non-federal government agencies.
Cat Financial also purchases short-term receivables from Caterpillar (15 percent*).Caterpillar.
Cat Financial’s wholesale loans and leases (1 percent*) include inventory/rental programs, which provide assistance to dealers by financing their new Caterpillar inventory and rental fleets.
*Indicates the percentage of Cat Financial’s total portfolio at December 31, 2021. We define total portfolio as total finance receivables (net of unearned income and allowance for credit losses) plus equipment on operating leases, less accumulated depreciation. For more information on the above and Cat Financial’s concentration of credit risk, please refer to Note 7 — “Cat Financial Financing Activities” of Part II, Item 8 "Financial Statements and Supplementary Data."
_____________________________
Cat Financial operates in a highly competitive environment, with financing for users of Caterpillar equipment and services available through a variety of sources, principally commercial banks and finance and leasing companies. Our competitors include Wells Fargo Equipment Finance Inc., Banc of America Leasing & Capital LLC, BNP Paribas Leasing Solutions Limited, Australia and New Zealand Banking Group Limited, Société Générale S.A. and various other banks and finance companies. In addition, many of the manufacturers that compete with Caterpillar also own financial subsidiaries, such as John Deere Capital Corporation, Komatsu Financial L.P., Volvo Financial Services and Kubota Credit Corporation, which utilize many below-market interest rate programs (funded by the manufacturer) to support machine sales. We andCat Financial works with the broader Caterpillar work togetherorganization to provide a broad array of financial merchandising programs to compete around the world.
Cat Financial’sThe financial results of Cat Financial are largely dependent upon the ability of Caterpillar dealers to sell equipment and customers’ willingness to enter into financing or leasing agreements. Cat Financial is also affected by, among other things, the availability of funds from its financing sources, its cost of funds relative to its competitors and general economic conditions such as inflation and market interest rates.
Cat Financial has a match-funding policy that addresses interest rate risk by aligning the interest rate profile (fixed or floating rate and duration) of its debt portfolio with the interest rate profile of its receivables portfolio within predetermined ranges on an ongoing basis. In connection with that policy, Cat Financial uses interest rate derivative instruments to modify the debt structure to match assets within the receivables portfolio. This matched funding reduces the volatility of margins between interest-bearing assets and interest-bearing liabilities, regardless of which direction interest rates move. For more information regarding match funding, please see Note 4 — “Derivative financial instruments and risk management” of Part II, Item 8 "Financial Statements and Supplementary Data." See also the risk factors associated with our financial products business included in Item 1 A. of this Form 10-K.
In managing foreign currency risk for Cat Financial’s operations, the objective is to minimize earnings volatility resulting from conversion and the remeasurement of net foreign currency balance sheet positions, and future transactions denominated in foreign currencies. This policy allows the use of foreign currency forward, option and cross currency contracts to offset the risk of currency mismatch between the assets and liabilities, and exchange rate risk associated with future transactions denominated in foreign currencies.
Cat Financial provides financing only when certain criteria are met. Credit decisions are based on a variety of credit quality factors including prior payment experience, customer financial information, credit ratings, loan-to-value ratios and other internal metrics. Cat Financial typically maintains a security interest in retail-financed equipment and generally requires physical damage insurance coverage on financed equipment. Cat Financial finances a significant portion of Caterpillar dealers’ sales and inventory of Caterpillar equipment throughout the world. Cat Financial’s competitive position is improved by marketing programs offered in conjunction with Caterpillar and/or Caterpillar dealers. Under these programs, Caterpillar, or the dealer, funds an amount at the outset of the transaction, which Cat Financial then recognizes as revenue over the term of the financing. We believe that these marketing programs provide Cat Financial a significant competitive advantage in financing Caterpillar products.
Caterpillar Insurance Company, a wholly owned subsidiary of Caterpillar Insurance Holdings Inc., is a U.S. insurance company domiciled in Missouri and primarily regulated by the Missouri Department of Insurance. Caterpillar Insurance Company is licensed to conduct property and casualty insurance business in 50 states, the District of Columbia and Guam, and as such, is also regulated in those jurisdictions. The State of Missouri acts as the lead regulatory authority and monitors Caterpillar Insurance Company’s financial status to ensure that it is in compliance with minimum solvency requirements, as well as other financial ratios prescribed by the National Association of Insurance Commissioners. Caterpillar Insurance Company is also licensed to conduct insurance business through a branch in Zurich, Switzerland and, as such, is regulated by the Swiss Financial Market Supervisory Authority.
Caterpillar Life Insurance Company, a wholly owned subsidiary of Caterpillar, is a U.S. insurance company domiciled in Missouri and primarily regulated by the Missouri Department of Insurance. Caterpillar Life Insurance Company is licensed to conduct life and accident and health insurance business in 26 states and the District of Columbia and, as such, is also regulated in those jurisdictions. The State of Missouri acts as the lead regulatory authority and it monitors the financial status to ensure that it is in compliance with minimum solvency requirements, as well as other financial ratios prescribed by the National Association of Insurance Commissioners. Caterpillar Life Insurance Company provides reinsurance coverage to Caterpillar Insurance Company. Specifically, Caterpillar Life Insurance Company has entered into a reinsurance agreement with Caterpillar Insurance Company, assuming 100% of the risk of an Accident and Health Stop Loss Insurance Policy to cover a Caterpillar Voluntary Employees' Benefits Association (VEBA) Trust for medical losses sustained by a select group of Caterpillar retirees and dependents.
Caterpillar Insurance Co. Ltd., a wholly owned subsidiary of Caterpillar Insurance Holdings Inc., is a captive insurance company domiciled in Bermuda and regulated by the Bermuda Monetary Authority. Caterpillar Insurance Co. Ltd. holdsis registered as a Class 2 license (as defined by(General Business) and Class B (Long-Term) insurer with the Bermuda Monetary Authority. Under its Class 2 insurance license, Caterpillar Insurance Amendment Act of 1995), which primarilyCo. Ltd. insures its parent and affiliates. Caterpillar Insurance Co.Ltd.affiliates for general liability, property, auto liability and cargo. It also provides reinsurance to Caterpillar Insurance Company under a quota share reinsurance agreementsagreement for its contractual liability and contractors'contractors’ equipment programs in the United States. Finally,In addition, Caterpillar Insurance Co. Ltd. holds areinsures 100% of the international employee benefit plans of Caterpillar Inc. through retrocession agreements with other insurers. The employee benefits coverages include medical and accident coverages. which are reported under its Class B2 insurance license to provideand life and disability reinsurance covering Caterpillar Inc.'s International employee benefits program.coverages, which are reported under its Class B insurance license. The Bermuda Monetary Authority is responsible for monitoring Caterpillar Insurance Co. Ltd.'s compliance with solvency requirements and requires an Annual Financial Filing for this purpose.
Caterpillar Product Services Corporation (CPSC), a wholly owned subsidiary of Caterpillar, is a warranty company domiciled in Missouri. CPSC previously conducted a machine extended service contract program in Germany and France by providing machine extended warranty reimbursement protection to dealers in Germany and France. The program was discontinued effective January 1, 2013, though CPSC continues to provide extended warranty reimbursement protection under existing contracts.
Caterpillar Insurance Services Corporation, a wholly owned subsidiary of Caterpillar Insurance Holdings Inc., is a Tennessee insurance agency licensed in all 50 states, the District of Columbia and Guam. It provides brokerage and insurance services for all property and casualty and life and health lines of business.
Caterpillar’s insurance group provides protection and service for claims under the following programs:
•Contractual Liability Insurance to insure certain service contract obligations of Caterpillar and its affiliates, Caterpillar dealers and original equipment manufacturers (OEMs).
•Cargo reinsurance for the worldwide cargo risks of Caterpillar products.
•Contractors’ Equipment Physical Damage Insurance for equipment manufactured by Caterpillar or OEMs, which is leased, rented or sold by third party dealers to customers.
•General liability, employer’s liability, auto liability and property insurance for Caterpillar.
•Life, healthdisability, medical and disabilityaccident reinsurance for Caterpillar's international employee benefits program (non-U.S.).
•Reinsurance to cover VEBA Trust for medical claims of certain Caterpillar retirees and dependents.
•Brokerage and insurance services for property and casualty and life and health business.
Competitive Environment
Caterpillar products and services are sold worldwide into a variety of highly competitive markets. In all markets, we compete on the basis of product performance, customer service, quality and price. From time to time, the intensity of competition results in price discounting in a particular industry or region. Such price discounting puts pressure on margins and can negatively impact operating profit. Outside the United States, certain competitors enjoy competitive advantages inherent to operating in their home countries or regions.
Raw Materials and Component Products
We source our raw materials and manufactured components from suppliers both domestically and internationally. These purchases include unformed materials and rough and finished parts. Unformed materials include a variety of steel products, which are then cut or formed to shape and machined in our facilities. Rough parts include various sized steel and iron castings and forgings, which are machined to final specification levels inside our facilities. Finished parts are ready to assemble components, which are made either to Caterpillar specifications or to supplier developed specifications. We machine and assemble some of the components used in our machines, engines and power generation units and to support our after-market dealer parts sales. We also purchase various goods and services used in production, logistics, offices and product development processes. We maintain global strategic sourcing models to meet our global facilities’ production needs while building long-term supplier relationships and leveraging enterprise spend. We expect our suppliers to maintain, at all times, industry-leading levels of quality and the ability to timely deliver raw materials and component products for our machine and engine products. However, in some cases, increases in demand or supply chain disruptions have led to parts and components constraints across some products. We use a variety of agreements with suppliers to protect our intellectual property and processes to monitor and mitigate risks of the supply base causing a business disruption. The risks monitored include supplier financial viability, the ability to increase or decrease production levels, business continuity, quality and delivery.
Patents and Trademarks
We own a number of patents and trademarks, which have been obtained over a period of years and relate to the products we manufacture and the services we provide. These patents and trademarks are generally considered beneficial to our business. We do not regard our business as being dependent upon any single patent or group of patents.
Order Backlog
The dollar amount of backlog believed to be firm was approximately $23.1$27.5 billion at December 31, 20212023 and $14.2$30.4 billion at December 31, 2020.2022. Compared with year-end 2020,2022, the order backlog increaseddecreased across the three primary segments, with the largest increase in Energy & Transportation.segments. Of the total backlog at December 31, 2021,2023, approximately $4.3$5.8 billion was not expected to be filled in 2022.2024.
Dealers and Distributors
We distribute our machines principally through a worldwide organization of dealers (dealer network), 4443 located in the United States and 116113 located outside the United States, serving 193191 countries. We sell reciprocating engines principally through the dealer network and to other manufacturers for use in products. We also sell some of the reciprocating engines manufactured by our subsidiary Perkins Engines Company Limited through its worldwide network of 9088 distributors covering 171185 countries. We sell the FG Wilson branded electric power generation systems through its worldwide network of 110 distributors covering 109 countries. We also sell some of the large, medium speed reciprocating engines under the MaK brand through a worldwide network of 20 distributors covering 130 countries.
Our dealers do not deal exclusively with our products; however, in most cases sales and servicing of our products are the dealers’ principal business. We sell some products, primarily turbines and locomotives, directly to end customers through sales forces employed by the company. At times, these employees are assisted by independent sales representatives.
While the large majority of our worldwide dealers are independently owned and operated, we own and operate a dealership in Japan that covers approximately 80% of the Japanese market: Nippon Caterpillar Division. We are currently operating this Japanese dealer directly and we report its results in the All Other operating segment. There are also three independent dealers in the Southern Region of Japan.
For Caterpillar brandedCaterpillar-branded products, the company’s relationship with each of its independent dealers is memorialized in standard sales and service agreements. Pursuant to these agreements, the company grants the dealer the right to purchase and sell its products and to service the products in a specified geographic service territory. The company establishes prices to dealers after receiving input from dealers on transactional pricing in the marketplace. The company also agrees to defend its intellectual property and to provide warranty and technical support to the dealer. The agreement further grants the dealer a non-exclusive license to use the company’s trademarks, service marks and brand names. In some instances, a separate trademark agreement exists between the company and a dealer.
In exchange for these rights, the agreement obligates the dealer to develop and promote the sale of the company’s products to current and prospective customers in the dealer’s service territory. Each dealer agrees to employ adequate sales and support personnel to market, sell and promote the company’s products, demonstrate and exhibit the products, perform the company’s product improvement programs, inform the company concerning any features that might affect the safe operation of any of the company’s products and maintain detailed books and records of the dealer’s financial condition, sales and inventories and make these books and records available at the company’s reasonable request.
These sales and service agreements are terminable at will by either party primarily upon 90 days written notice.
Human Capital
Core Values
Caterpillar’s global workforce is united by Our Values In Action, Caterpillar’s Code of Conduct. Integrity, Excellence, Teamwork, Commitment and Sustainability provide the foundation for our values-based culture. Our diversity and inclusion principles are embedded in our values. Our values unite us, and reflect our diverse cultures, languages, geographies, and businesses, as one Caterpillar team.
Health and Safety
The health and safety of our employees is an important focus at Caterpillar, and we strive to continually reduce our recordable injuries. As part of this focus on health and safety, Caterpillar has established a peer-to-peer safety mentorship and education program for manufacturing new hires to accelerate acclimation toinjuries utilizing programs that amplify our safety culture, in many global locations.globally. In 2021,2023, the Company achieved a recordable injury frequency rate of 0.41,0.40, compared to the 20202022 recordable injury frequency rate of 0.42.
The COVID-19 pandemic0.44. In addition, Caterpillar has continuedrefreshed our safety strategy to further reinforce the importance of a safeenhance our focus on preventing serious injuries and healthy workforce. In responseto encourage learning from those closest to the pandemic, the Company continues to utilize safeguards to protect our essential employees, including increased frequency of cleaning and disinfecting, social distancing practices, face coverings, temperature screening, supporting vaccination opportunities in many workplaces and paid time off to receive vaccinations away from work. We implemented workplace pandemic measures consistent with specific regulatory requirements and guidance from health authorities. We also maintained travel restrictions and remote work, for employees who were able to work from home. Our medical teams provide ongoing training and education to support the emotional health and resilience of our workforce.
Talent Development and Training
In addition to our focus on values and safety, we strive to continually attract, develop, engage, and retain a high-performing diverse global team that executes our enterprise strategy of long-term profitable growth.
We are committed to employee development and helping individuals reach their full potential, by making on-going investments in our team. Our global internships, engineering co-ops, and career programs for engineering, marketing, and manufacturing provide development opportunities for early career employees. We also have a continual focus on strengthening technical, professional and leadership capabilities at every level.level using contemporary learning strategies to foster high performance. Strategic talent reviews and succession planning occur at a minimum, annually, across our businesses.
Our leadership development programs and focus on encouraging a variety of experiences to help employees broaden understanding and increase perspective. Our leadership curriculums include managing for inclusion and building resilient and high performing teams as a core development principle and a professional skill.
principles. Additionally, skill-based programs to upskill our manufacturing employees are developed locally and tailored to the specific needs of the business. In China, we continue to invest in programs that encourage women to pursue engineering management and leadership roles. In India, we tailored recruiting campaigns and on-site benefits to attract female employees. Caterpillar, along with other companies across industries, participates in the OneTen coalition. The coalition is committed to upskill, hire and advance Black Americans over the next 10 years into family-sustaining careers.
Diversity and Inclusion
We are committed to fostering a diverse workforce and an inclusive environment.environment that is representative of the many customers and communities we serve around the globe. Our strategic approach weaves diversity and inclusion seamlessly into the business, ensuring that the principles guide us in our daily operating rhythm. Our 14 Employee Resource Groups (ERGs), which are sponsored and supported by leadership, help ensure different voices and perspectives contribute to our strategy for long-term profitable growth. They also engage our employees, helping contribute to development and retention.
Our ERGs provide many contributions, such as mentoring programs that connect diverse employees with senior leaders who can support their career goals, partnerships with recruiters and diverse early career and professional organizations that can assist in strengthening the diverse talent pipeline and programs that educate and inform on the richness of the global cultures that we share.
Compensation, Benefits and Employee Insights
Providing competitive benefits and compensation underpins our commitment to our engaged and productive employees. Our pay-for-performance philosophy aligns employee’s individual contributions, behaviors and business results with individual rewards. Our comprehensive Total Health programs focus on purpose, as well as physical and mental health, emotional financial, and social health.support, and financial wellness. The annual Employee Insights Survey provides all employees the opportunity to confidentially share their perspectives and engages leaders to listen, learn and respond to employee feedback.feedback to help foster a positive work environment.
Employment
Management aligns employment levels with the needs of the business. We believe we have the appropriate human capital resources to successfully operate and deliver our enterprise strategy. As of December 31, 2021,2023, we employed about 107,700113,200 full-time persons of whom approximately 63,40062,400 were located outside the United States. In the United States, we employed approximately 44,30050,800 full-time persons, most of whom are at-will employees and, therefore, not subject to any type of employment contract or agreement. At select business units, we have hired certain highly specialized employees under employment contracts that specify a term of employment, pay and other benefits.
| | Full-Time Employees at Year-End | Full-Time Employees at Year-End | |
| | | 2021 | | 2020 | |
| | |
| | |
| Inside U.S. | |
| Inside U.S. | |
| Inside U.S. | Inside U.S. | 44,300 | | 40,300 | |
| Outside U.S. | Outside U.S. | 63,400 | | 57,000 | |
| Outside U.S. | |
| Outside U.S. | |
| Total | |
| Total | |
| Total | Total | 107,700 | | 97,300 | |
| | By Region: | By Region: | | | | |
| | By Region: | |
| | By Region: | |
| North America | |
| North America | |
| North America | North America | 44,700 | | 40,500 | |
| EAME | EAME | 17,600 | | 17,700 | |
| EAME | |
| EAME | |
| Latin America | |
| Latin America | |
| Latin America | Latin America | 19,500 | | 15,900 | |
| Asia/Pacific | Asia/Pacific | 25,900 | | 23,200 | |
| Asia/Pacific | |
| Asia/Pacific | |
| Total | |
| Total | |
| Total | Total | 107,700 | | 97,300 | |
|
As of December 31, 2021,2023, there were approximately 7,7107,973 hourly production employees in the United States who were covered by collective bargaining agreements with various labor unions, including The United Automobile, Aerospace and Agricultural Implement Workers of America (UAW), The International Association of Machinists and The United Steelworkers. Outside the United States, the company enters into employment contracts and agreements in those countries in which such relationships are mandatory or customary. The provisions of these agreements generally correspond in each case with the required or customary terms in the subject jurisdiction.
Environmental Matters
The company is regulated by federal, state and international environmental laws governing our use, transport and disposal of substances and control of emissions. In addition to governing our manufacturing and other operations, these laws often impact the development of our products, including, but not limited to, required compliance with air emissions standards applicable to internal combustion engines. We have made, and will continue to make, significant research and development and capital expenditures to comply with these emissions standards.
We are engaged in remedial activities at a number of locations, often with other companies, pursuant to federal and state laws. When it is probable we will pay remedial costs at a site, and those costs can be reasonably estimated, the investigation, remediation, and operating and maintenance costs of the remedial action are accrued against our earnings. Costs are accrued
based on consideration of currently available data and information with respect to each individual site, including available technologies, current applicable laws and regulations, and prior remediation experience. Where no amount within a range of estimates is more likely, we accrue the minimum. Where multiple potentially responsible parties are involved, we consider our proportionate share of the probable costs. In formulating the estimate of probable costs, we do not consider amounts expected to be recovered from insurance companies or others. We reassess these accrued amounts on a quarterly basis. The amount recorded for environmental remediation is not material and is included in the line item "Accrued expenses" in Statement 3 — "Consolidated Financial Position at December 31" of Part II, Item 8 "Financial Statements and Supplementary Data." There is no more than a remote chance that a material amount for remedial activities at any individual site, or at all the sites in the aggregate, will be required.
Available Information
The company files electronically with the Securities and Exchange Commission (SEC) required reports on Form 8-K, Form 10-Q, Form 10-K and Form 11-K; proxy materials; ownership reports for insiders as required by Section 16 of the Securities Exchange Act of 1934 (Exchange Act); registration statements on Forms S-3 and S-8, as necessary; and other forms or reports as required. The SEC maintains a website (www.sec.gov) that contains reports, proxy and information statements, and other information regarding issuers that file electronically with the SEC. The company maintains a website (www.Caterpillar.com) and copies of our annual report on Form 10-K, quarterly reports on Form 10-Q, current reports on Form 8-K and any amendments to these reports filed or furnished with the SEC are available free of charge through our website (www.Caterpillar.com/secfilings) as soon as reasonably practicable after filing with the SEC. Copies of our board committee charters, our board’s Guidelines on Corporate Governance Issues, Worldwide Code of Conduct and other corporate governance information are available on our website (www.Caterpillar.com/governance). and are also available free of charge. The information contained on the company’s website is not included in, or incorporated by reference into, this annual report on Form 10-K.
Additional company information may be obtained as follows:
Current information -
•view additional financial information on-line at www.Caterpillar.com/en/investors/financial-information.html
•request, view or download materials on-line or register for email alerts at www.Caterpillar.com/materialsrequest
Historical information -
•view/download on-line at www.Caterpillar.com/historical
Item 1A.Risk Factors.
The statements in this section describe the most significant risks to our business and should be considered carefully in conjunction with Part II, Item 7 “Management’s Discussion and Analysis of Financial Condition and Results of Operations” and the “Notes to Consolidated Financial Statements” of Part II, Item 8 “Financial Statements and Supplementary Data” to this Form 10-K. In addition, the statements in this section and other sections of this Form 10-K, including in Part II, Item 7 “Management's Discussion and Analysis of Financial Condition and Results of Operations,” include “forward-looking statements” as that term is defined in the Private Securities Litigation Reform Act of 1995 and involve uncertainties that could significantly impact results. Forward-looking statements give current expectations or forecasts of future events about the company or our outlook. You can identify forward-looking statements by the fact they do not relate to historical or current facts and by the use of words such as “believe,” “expect,” “estimate,” “anticipate,” “will be,” “should,” “plan,” “forecast,” “target,” “guide,” “project,” “intend,” “could” and similar words or expressions.
Forward-looking statements are based on assumptions and on known risks and uncertainties. Although we believe we have been prudent in our assumptions, any or all of our forward-looking statements may prove to be inaccurate, and we can make no guarantees about our future performance. Should known or unknown risks or uncertainties materialize or underlying assumptions prove inaccurate, actual results could materially differ from past results and/or those anticipated, estimated or projected.
We undertake no obligation to publicly update forward-looking statements, whether as a result of new information, future events or otherwise. You should, however, consult any subsequent disclosures we make in our filings with the SEC on Form 10-Q or Form 8-K.
The following is a cautionary discussion of risks, uncertainties and assumptions that we believe are material to our business. In addition to the factors discussed elsewhere in this report, the following are some of the important factors that, individually or in the aggregate, we believe could make our actual results differ materially from those described in any forward-looking statements. It is impossible to predict or identify all such factors and, as a result, you should not consider the following factors to be a complete discussion of risks, uncertainties and assumptions.
RISKS RELATED TO THE COVID-19 PANDEMIC
The COVID-19 pandemic could materially adversely affect our business, results of operations and/or financial condition.
COVID-19 was identified in late 2019 and spread globally. Efforts to combat the virus have been complicated by viral variants and access to, and acceptance and effectiveness of, vaccines globally. COVID 19 has had, and continues to have, a significant impact around the world, prompting governments and businesses to take unprecedented measures in response. Such measures have included travel bans and restrictions, quarantines, shelter in place orders and shutdowns. These measures have impacted and may continue to impact all or portions of our workforce and operations and the operations of our customers, dealers and suppliers. Although certain restrictions related to the COVID-19 pandemic have eased, uncertainty continues to exist regarding such measures and potential future measures. Current material and component shortages, logistics constraints and labor inefficiencies have limited and could continue to limit our ability to meet customer demand, which could have a material adverse effect on our business, results of operations and/or financial condition.
The COVID-19 pandemic caused a global recession and the sustainability of the economic recovery observed in 2021 remains unclear. The COVID-19 pandemic has also significantly increased economic and customer demand uncertainty, has caused inflationary pressure in the U.S. and elsewhere and has led to volatility in customer demand for the Company’s products and services and caused supply chain disruptions. Economic uncertainties could continue to affect customer demand for the Company’s products and services, the value of the equipment financed or leased, the demand for financing and the financial condition and credit risk of our dealers and customers.
Continued uncertainties related to the magnitude, duration and persistent effects of the COVID-19 pandemic may adversely affect our business. These uncertainties include, among other things: the duration and impact of the resurgence in COVID-19 cases in any country, state, or region; the emergence, contagiousness, and threat of new and different strains of the virus; the availability, acceptance, and effectiveness of vaccines; prolonged reduction or closure of the Company’s operations; disruptions in the supply chain; labor inefficiencies; increased logistics costs; the impact of the pandemic on the Company’s customers and dealers; the impact of disruptions in the global capital markets and/or declines in our financial performance or credit ratings, which could impact the Company’s ability to obtain funding in the future; and the impact of the pandemic on customer demand
for our products and services as discussed above. All of these factors could materially and adversely affect our business, results of operations and/or financial condition.
The ultimate impact of the COVID-19 pandemic on the Company’s financial and operational results will be determined by the length of time that the pandemic continues, its effect on the demand for the Company’s products and services and the supply chain, as well as the effect of governmental regulations imposed in response to the pandemic. The overall magnitude of the COVID-19 pandemic and the continued fluidity of the situation could materially and adversely impact our business, results of operations and/or financial condition.
MACROECONOMIC RISKS
Our business and the industries we serve are highly sensitive to global and regional economic conditions.
Our results of operations are materially affected by economic conditions globally and regionally and in the particular industries we serve. The demand for our products and services tends to be cyclical and can be significantly reduced in periods of economic weakness characterized by lower levels of government and business investment, lower levels of business confidence, lower corporate earnings, high real interest rates, lower credit activity or tighter credit conditions, perceived or actual industry overcapacity, higher unemployment and lower consumer spending. A prolonged period of economic weakness may also result in increased expenses due to higher allowances for doubtful accounts and potential goodwill and asset impairment charges. Economic conditions vary across regions and countries, and demand for our products and services generally increases in those regions and countries experiencing economic growth and investment. Slower economic growth or a change in the global mix of regions and countries experiencing economic growth and investment could have an adverse effect on our business, results of operations and financial condition.
The energy, transportation, and mining industries are major userssignificant adopters of our products, including the mineral extraction, oil and natural gas industries. Customers inCaterpillar products. In these industries frequentlycustomers are likely to base their purchase decisions to purchase our products and services on theupon expected future performance of these industries, which in turn are dependent in part on commodity prices. Prices of commodities in these industries are frequently volatiledynamics, including price. Commodity price volatility may be abrupt and can change abruptly and unpredictablyunpredictable in response to generalglobal economic conditions, and trends, government actions, regulatory actions, commodity inventories, productionchanges, supply/demand dynamics, innovation, and consumption levels, technological innovations, commodity substitutions market expectations and any disruptions in production or distribution or changes in consumption.among others. Economic conditions affecting the industries we serve may reduce capital expenditures in response to a variety of the future alsoaforementioned conditions. Reduction in these capital expenditures may lead to reduced capital expenditures by our customers. Reduced capital expenditures by our customers are likely to lead to a decrease in thedecreased demand for ourCaterpillar products and services and may also result in a decrease in demand foras well as aftermarket parts as customers are likelymay choose to extend preventative maintenance schedules and delay major overhauls when possible.
The rates of infrastructure spending, commercial construction and housing starts also play a significant role in our results. Our products are an integral component of these activities, and as these activities decrease, demand for our products and services may be significantly impacted, which could negatively impact our results.
Catastrophic events, including global pandemics, could materially adversely affect our business, results of operations and/or financial condition.
The occurrence of a major earthquake, fire, flood, tsunami or other weather event, power loss, telecommunications failure, software or hardware malfunctions, pandemics, cyber-attack, war, terrorist attack or other catastrophic event that our disaster recovery plans do not adequately address, could adversely affect our employees, our systems, our ability to produce and distribute our products, and our reputation. For example, a pandemic had a significant impact around the world, prompting governments and businesses to take unprecedented measures in response. Such measuresincluded travel bans and restrictions, quarantines, shelter in place orders and shutdowns. Those measures impacted or could again impact all or portions of our workforce and operations and the operations of our customers, dealers and suppliers. Current material and component shortages, logistics constraints and labor inefficiencies limited and or could continue to limit our ability to meet customer demand, which could have a material adverse effect on our business, results of operations and/or financial condition.
Pandemics can significantly increase economic and customer demand uncertainty, cause inflationary pressure in the U.S. and elsewhere and lead to volatility in customer demand for the Company’s products and services and cause supply chain disruptions. Economic uncertainties could continue to affect customer demand for the Company’s products and services, the value of the equipment financed or leased, the demand for financing and the financial condition and credit risk of our dealers and customers.
A catastrophic event resulting in the destruction or disruption of our workforce, our systems, our ability to produce and distribute our products, any of our data centers or our critical business or information technology systems could adversely affect our ability to conduct normal business operations and our operating results or cash flows. The adverse effects of any such catastrophic event would be exacerbated if experienced at the same time as another unexpected and adverse event.
Commodity price changes, material price increases, fluctuations in demand for our products and services, significant disruptions to our supply chains or significant shortages of labor and material may adversely impact our financial results or our ability to meet commitments to customers.
We are a significant user of steel and many other commodities required for the manufacture of our products. Increases in the prices of such commodities would increase our costs, negatively impacting our business, results of operations and financial condition if we are unable to fully offset the effect of these increased costs through price increases, productivity improvements, or cost reduction programs or hedging programs.
We rely on suppliers to produce or secure material required for the manufacture of our products. Production challenges at suppliers (including suppliers of semiconductors), a disruption in deliveries to or from suppliers or decreased availability of raw materials or commodities could have an adverse effect on our ability to meet our commitments to customers or increase our operating costs.On the other hand, in circumstances where demand for our products is less than we expect, we may experience excess inventories and be forced to incur additional costs and our profitability may suffer. Additionally, we have experienced and expect to continue to experience transportation delays for parts, components and finished machines due to significant demands in global transportation and congestion at ports throughout the globe. Our business, competitive position, results of operations or financial condition could be negatively impacted if supply is insufficient for our operations, if significant transportation delays interfere with deliveries, if we experience excess inventories or if we are unable to adjust our production schedules or our purchases from suppliers to reflect changes in customer demand and market fluctuations on a timely basis.
Changes in government monetary or fiscal policies may negatively impact our results.
Most countries where our products and services are sold have established central banks to regulate monetary systems and influence economic activities, generally by adjusting interest rates. Interest rate changes affect overall economic growth, which affects demand for residential and nonresidential structures, as well as energy and mined products, which in turn affects sales of our products and services that support these activities. Interest rate changes may also affect our customers’ ability to finance machine purchases, can change the optimal time to keep machines in a fleet and can impact the ability of our suppliers to finance the production of parts and components necessary to manufacture and support our products. Increases in interest rates could negatively impact sales and create supply chain inefficiencies.
Central banks and other policy arms of many countries may take actions to vary the amount of liquidity and credit available in an economy. The impact from a change in liquidity and credit policies could negatively affect the customers and markets we serve or our suppliers, create supply chain inefficiencies and could adversely impact our business, results of operations and financial condition.
Changes in monetary and fiscal policies, along with other factors, may cause currency exchange rates to fluctuate. Actions that lead the currency exchange rate of a country where we manufacture products to increase relative to other currencies could reduce the competitiveness of products made in that country, which could adversely affect our competitive position, results of operations and financial condition.
Government policies on taxes and spending also affect our business. Throughout the world, government spending finances a significant portion of infrastructure development, such as highways, rail systems, airports, sewer and water systems, waterways and dams. Tax regulations determine asset depreciation lives and impact the after-tax returns on business activity and investment, both of which influence investment decisions. Unfavorable developments, such as decisions to reduce public spending or to increase taxes, could negatively impact our results.
Our global operations are exposed to political and economic risks, commercial instability and events beyond our control in the countries in which we operate.
Our global operations are dependent upon products manufactured, purchased and sold in the U.S. and internationally, including in countries with political and economic instability or uncertainty. Some countries have greater political and economic volatility and greater vulnerability to infrastructure and labor disruptions than others. Our business could be negatively impacted by adverse fluctuations in freight costs, fuel costs (e.g., diesel, bunker, jet), limitations on shipping and receiving capacity, and other disruptions in the transportation and shipping infrastructure at important geographic points of exit and entry for our products. Operating in different regions and countries exposes us to numerous risks, including:
•multiple and potentially conflicting laws, regulations and policies that are subject to change;
•imposition of currency restrictions, restrictions on repatriation of earnings or other restraints;
•imposition of new or additional tariffs or quotas;
•withdrawal from or modification of trade agreements or the negotiation of new trade agreements;
•imposition of new or additional trade and economic sanctions laws imposed by the U.S. or foreign governments;
•war or acts of terrorism; and
•political and economic instability or civil unrest that may severely disrupt economic activity in affected countries.
The occurrence of one or more of these events may negatively impact our business, results of operations and financial condition.
OPERATIONAL RISKS
The success of our business depends on our ability to develop, produce and market quality products that meet our customers’ needs.
Our business relies on continued global demand for our brands and products. To achieve business goals, we must develop and sell products that appeal to our dealers, OEMs and end-user customers. This is dependent on a number of factors, including our
ability to maintain key dealer relationships; our ability to produce products that meet the quality, performance and price expectations of our customers and our ability to develop effective sales, advertising and marketing programs. In addition, our continued success in selling products that appeal to our customers is dependent on leading-edge innovation, with respect to both products and operations, and on the availability and effectiveness of legal protection for our innovations. Failure to continue to deliver high quality, innovative, competitive products to the marketplace, to adequately protect our intellectual property rights; to supply products that meet applicable regulatory requirements, including engine exhaust emission requirements or to predict market demands for, or gain market acceptance of, our products, could have a negative impact on our business, results of operations and financial condition.
We operate in a highly competitive environment, which could adversely affect our sales and pricing.
We operate in a highly competitive environment. We compete on the basis of a variety of factors, including product performance, customer service, quality and price. There can be no assurance that our products will be able to compete successfully with other companies’ products. Thus, our share of industry sales could be reduced due to aggressive pricing or product strategies pursued by competitors, unanticipated product or manufacturing difficulties, our failure to price our products competitively, our failure to produce our products at a competitive cost or an unexpected buildup in competitors’ new machine or dealer-owned rental fleets, which could lead to downward pressure on machine rental rates and/or used equipment prices.
Lack of customer acceptance of price increases we announce from time to time, changes in customer requirements for price discounts, changes in our customers’ behavior or a weak pricing environment could have an adverse impact on our business, results of operations and financial condition.
In addition, our results and ability to compete may be impacted negatively by changes in our geographic and product mix of sales.
Increased information technology security threats and more sophisticated computer crime pose a risk to our systems, networks, products and services.
We rely upon information technology systems and networks, some of which are managed by third parties, in connection with a variety of business activities. Additionally, we collect and store sensitive information relating to our business, customers, dealers, suppliers and employees. Operating these information technology systems and networks and processing and maintaining this data in a secure manner, is critical to our business operations and strategy. Information technology security threats -- from user error to cybersecurity attacks designed to gain unauthorized access to our systems, networks and data -- are increasing in frequency and sophistication. Cybersecurity attacks from threat actors globally range from random attempts to coordinated and targeted attacks, including sophisticated computer crime and advanced persistent threats. These threats pose a risk to the security of our systems and networks and the confidentiality, availability and integrity of our data. Cybersecurity attacks could also include attacks targeting customer data or the security, integrity and/or reliability of the hardware and software installed in our products. It is possible that our information technology systems and networks, or those managed or provided by third parties, could have vulnerabilities, which could go unnoticed for a period of time. While various procedures and controls have been and are being utilized to mitigate such risks, there can be no guarantee that the actions and controls we have implemented and are implementing, or which we cause or have caused third-party service providers to implement, will be sufficient to protect and mitigate associated risks to our systems, information or other property.
We have experienced cyber securitycybersecurity threats and vulnerabilities in our systems and those of our third party providers, and we have experienced viruses and attacks targeting our information technology systems and networks. Such prior events, to date, have not had a material impact on our financial condition, results of operations or liquidity. However, the potential consequences of a future material cybersecurity attack include reputational damage, litigation with third parties, government enforcement actions, penalties, disruption to systems, unauthorized release of confidential or otherwise protected information, corruption of data, diminution in the value of our investment in research, development and engineering, and increased cybersecurity protection and remediation costs, which in turn could adversely affect our competitiveness, results of operations and financial condition. Due to the evolving nature of such security threats, the potential impact of any future incident cannot be predicted. Further, the amount of insurance coverage we maintain may be inadequate to cover claims or liabilities relating to a cybersecurity attack.
In addition, data we collect, store and process are subject to a variety of U.S. and international laws and regulations, such as the European Union's General Data Protection Regulation that became effective in May 2018 and the California Consumer Privacy Act, that became effective in January 2020, which may carry significant potential penalties for noncompliance.
Our business is subject to the inventory management decisions and sourcing practices of our dealers and our OEM customers.
We sell finished products primarily through an independent dealer network and directly to OEMs and are subject to risks relating to their inventory management decisions and operational and sourcing practices. Both carry inventories of finished products as part of ongoing operations and adjust those inventories based on their assessments of future needs and market conditions, including levels of used equipment inventory and machine rental usage rates. Such adjustments may impact our results positively or negatively. If the inventory levels of our dealers and OEM customers are higher than they desire, they may postpone product purchases from us, which could cause our sales to be lower than the end-user demand for our products and negatively impact our results. Similarly, our results could be negatively impacted through the loss of time-sensitive sales if our dealers and OEM customers do not maintain inventory levels sufficient to meet customer demand.
We may not realize all of the anticipated benefits of our acquisitions, joint ventures or divestitures, or these benefits may take longer to realize than expected.
In pursuing our business strategy, we routinely evaluate targets and enter into agreements regarding possible acquisitions, divestitures and joint ventures. We often compete with others for the same opportunities. To be successful, we conduct due diligence to identify valuation issues and potential loss contingencies, negotiate transaction terms, complete complex transactions and manage post-closing matters such as the integration of acquired businesses. Further, while we seek to mitigate risks and liabilities of such transactions through due diligence, among other things, there may be risks and liabilities that our due diligence efforts fail to discover, that are not accurately or completely disclosed to us or that we inadequately assess. We may incur unanticipated costs or expenses following a completed acquisition, including post-closing asset impairment charges, expenses associated with eliminating duplicate facilities, litigation, and other liabilities. Risks associated with our past or future acquisitions also include the following:
•the failure to achieve the acquisition's revenue or profit forecast;
•the business culture of the acquired business may not match well with our culture;
•technological and product synergies, economies of scale and cost reductions may not occur as expected;
•unforeseen expenses, delays or conditions may be imposed upon the acquisition, including due to required regulatory approvals or consents;
•we may acquire or assume unexpected liabilities or be subject to unexpected penalties or other enforcement actions;
•faulty assumptions may be made regarding the macroeconomic environment or the integration process;
•unforeseen difficulties may arise in integrating operations, processes and systems;
•higher than expected investments may be required to implement necessary compliance processes and related systems, including information technology systems, accounting systems and internal controls over financial reporting;
•we may fail to retain, motivate and integrate key management and other employees of the acquired business;
•higher than expected costs may arise due to unforeseen changes in tax, trade, environmental, labor, safety, payroll or pension policies in any jurisdiction in which the acquired business conducts its operations; and
•we may experience problems in retaining customers and integrating customer bases.
Many of these factors will be outside of our control and any one of them could result in increased costs, decreases in the amount of expected revenues and diversion of management’s time and attention. They may also delay the realization of the benefits we anticipate when we enter into a transaction.
In order to conserve cash for operations, we may undertake acquisitions financed in part through public offerings or private placements of debt or equity securities, or other arrangements. Such acquisition financing could result in a decrease in our earnings and adversely affect other leverage measures. If we issue equity securities or equity-linked securities, the issued securities may have a dilutive effect on the interests of the holders of our common shares.
Failure to implement our acquisition strategy, including successfully integrating acquired businesses, could have an adverse effect on our business, financial condition and results of operations. Furthermore, we make strategic divestitures from time to time. In the case of divestitures, we may agree to indemnify acquiring parties for certain liabilities arising from our former businesses. These divestitures may also result in continued financial involvement in the divested businesses following the transaction, including through guarantees or other financial arrangements. Lower performance by those divested businesses could affect our future financial results.
Union disputes or other labor matters could adversely affect our operations and financial results.
Some of our employees are represented by labor unions in a number of countries under various collective bargaining agreements with varying durations and expiration dates. There can be no assurance that any current or future issues with our employees will be resolved or that we will not encounter future strikes, work stoppages or other disputes with labor unions or our employees. We may not be able to satisfactorily renegotiate collective bargaining agreements in the United States and other countries when they expire. If we fail to renegotiate our existing collective bargaining agreements, we could encounter strikes or work stoppages or other disputes with labor unions. In addition, existing collective bargaining agreements may not prevent a strike or work stoppage at our facilities in the future. We may also be subject to general country strikes or work stoppages unrelated to our business or collective bargaining agreements. A work stoppage or other limitations on production at our facilities for any reason could have an adverse effect on our business, results of operations and financial condition. In addition, many of our customers and suppliers have unionized work forces. Strikes or work stoppages experienced by our customers or suppliers could have an adverse effect on our business, results of operations and financial condition.
Unexpected events may increase our cost of doing business or disrupt our operations.
The occurrence of one or more unexpected events, including war, acts of terrorism or violence, civil unrest, fires, tornadoes, tsunamis, hurricanes, earthquakes, floods and other forms of severe weather in the United States or in other countries in which we operate or in which our suppliers are located could adversely affect our operations and financial performance. Natural disasters, pandemic illness, including the current COVID-19 outbreak, equipment failures, power outages or other unexpected events could result in physical damage to and complete or partial closure of one or more of our manufacturing facilities or distribution centers, temporary or long-term disruption in the supply of component products from some local and international suppliers, and disruption and delay in the transport of our products to dealers, end-users and distribution centers. Existing insurance coverage may not provide protection for all of the costs that may arise from such events.
FINANCIAL RISKS
Disruptions or volatility in global financial markets could limit our sources of liquidity, or the liquidity of our customers, dealers and suppliers.
Continuing to meet our cash requirements over the long-term requires substantial liquidity and access to varied sources of funds, including capital and credit markets. Global economic conditions may cause volatility and disruptions in the capital and credit markets. Market volatility, changes in counterparty credit risk, the impact of government intervention in financial markets and general economic conditions may also adversely impact our ability to access capital and credit markets to fund operating needs. Global or regional economic downturns could cause financial markets to decrease the availability of liquidity, credit and credit capacity for certain issuers, including certain customers, dealers and suppliers. An inability to access capital and credit markets may have an adverse effect on our business, results of operations, financial condition and competitive position. Furthermore, changes in global economic conditions, including material cost increases and decreases in economic activity in key markets we serve, and the success of plans to manage cost increases, inventory and other important elements of our business may significantly impact our ability to generate funds from operations.
In addition, demand for our products generally depends on customers’ ability to pay for our products, which, in turn, depends on their access to funds. Changes in global economic conditions may result in customers experiencing increased difficulty in generating funds from operations. Capital and credit market volatility and uncertainty may cause financial institutions to revise their lending standards, resulting in customers’ decreased access to capital. If capital and credit market volatility occurs, customers’ liquidity may decline which, in turn, would reduce their ability to purchase our products.
Failure to maintain our credit ratings wouldcould increase our cost of borrowing and could adversely affect our cost of funds, liquidity, competitive position and access to capital markets.
Each of Caterpillar’s and Cat Financial’s costs of borrowing and their respective ability to access the capital markets are affected not only by market conditions but also by the short- and long-term credit ratings assigned to their respective debt by the major credit rating agencies. These ratings are based, in significant part, on each of Caterpillar’s and Cat Financial’s performance as measured by financial metrics such as net worth, profitability, interest coverage and leverage ratios, as well as transparency with rating agencies and timeliness of financial reporting. There can be no assurance that Caterpillar and Cat Financial will be able to maintain their credit ratings. We receive debt ratings from the major credit rating agencies. A downgrade of our credit rating by any of the major credit rating agencies wouldcould result in increased borrowing costs and could adversely affect Caterpillar’s and Cat Financial’s liquidity, competitive position and access to the capital markets, including restricting, in whole or in part, access to the commercial paper market. There can be no assurance that the commercial paper market will continue to be a reliable source of short-term financing for Cat Financial or an available source of short-term financing for Caterpillar. An inability to access the capital markets could have an adverse effect on our cash flow, results of operations and financial condition.
Our Financial Products segment is subject to risks associated with the financial services industry.
Cat Financial is significant to our operations and provides financing support for a significant share of our global sales. The inability of Cat Financial to access funds to support its financing activities to our customers could have an adverse effect on our business, results of operations and financial condition.
Continuing to meet Cat Financial's cash requirements over the long-term could require substantial liquidity and access to sources of funds, including capital and credit markets. Cat Financial has continued to maintain access to key global medium- termmedium-term note and commercial paper markets, but there can be no assurance that such markets will continue to represent a reliable source of financing. If global economic conditions were to deteriorate, Cat Financial could face materially higher financing costs, become unable to access adequate funding to operate and grow its business and/or meet its debt service obligations as they mature.Cat Financial also could and be required to draw upon contractually committed lending agreements and/or seek other funding sources.However, there can be no assurance that such agreements and other funding sources would be sufficient or even available under extreme market conditions. Any of these events could negatively impact Cat Financial’s business, as well as our and Cat Financial's results of operations and financial condition.
Market disruption and volatility may also lead to numerous risks in connection with these events, including but not limited to:
•Market developments that may affect customer confidence levels and cause declines in the demand for financing and adverse changes in payment patterns, causing increases in delinquencies and default rates, which could increase Cat Financial’s write-offs and provision for credit losses.
•The process Cat Financial uses to estimate losses inherent in its credit exposure requires a high degree of management’s judgment regarding numerous subjective qualitative factors, including forecasts of economic conditions and how economic predictors might impair the ability of its borrowers to repay their loans. Financial market disruption and volatility may impact the accuracy of these judgments.
•Cat Financial’s ability to engage in routine funding transactions or to engage or to borrow from other financial institutions on acceptable terms or at all could be adversely affected by disruptions in the capital markets or other events, including actions by rating agencies and deteriorating investor expectations.
•As Cat Financial’s lendingborrowing agreements are primarily with financial institutions, their ability to perform in accordance with any of our underlying agreements could be adversely affected by market volatility and/or disruptions in financial markets.
Changes in interest rates or market liquidity conditions could adversely affect Cat Financial's and our earnings and/or cash flow.
Changes in interest rates and market liquidity conditions could have an adverse impact on Cat Financial's and our earnings and cash flows. Changes in market interest rates may influence its and our borrowing costs, returns on financial investments and the valuation of derivative contracts.Because a significant number of the loans made by Cat Financial are made atutilizing fixed interest rates, its business results are subject to fluctuations in interest rates. Certain loans made by Cat Financial and various financing extended to Cat Financial are made at variable rates that use LIBOR floating reference rates or indices, including the Secured Overnight Financing Rate, or SOFR, an index calculated by short-term repurchase agreements, backed by Treasury securities,as a benchmark for establishing the interest rate. LIBOR is the subject of recent proposals for reform. On July 27, 2017, the United Kingdom’s Financial Conduct Authority ("FCA") announced that it intends to stop persuading or compelling banks to submit LIBOR rates after 2021. On November 18, 2020, ICE Benchmark Administration ("IBA"), the administrator of USD LIBOR, announced plans to consult on its intention to cease the publication of all GBP, EUR, CHF and JPY LIBOR settings immediately following the LIBOR publication on December 31, 2021. On November 30, 2020, IBA,
Together with the support of the United States Federal Reserve and the FCA, announced plans to consult on ceasing publication of USD LIBOR on December 31, 2021 for only the one-week and two-month USD LIBOR tenors, and on June 30, 2023 for all other USD LIBOR tenors. While the November 30 announcement extends the transition period to June 2023, the United States Federal Reserve concurrently issued a statement advising banks to stop new USD LIBOR issuances by the end of 2021. These reforms may cause LIBOR to cease to exist, new methods of calculating LIBOR to be established if LIBOR continues to exist after 2021 or alternative reference rates to be established. The consequences of these developments cannot be entirely predicted and could have an adverse impact on the market value for or value of LIBOR-linked securities, loans, derivatives, and other financial obligations or extensions of credit held by or due to Cat Financial as well as the revenue and expenses associated with those securities, loans and financial instruments. Cat Financial haswe created a cross-functional team that will assessassesses risk across multiple categories as it relates to the use of LIBORfloating reference rates or indices, such as SOFR, in securities, loans, derivatives, and other financial obligations or extensions of credit held by or due to us. Other changes in market interest rates may influence Cat Financial’s borrowing costs and could reduce its and our earnings and cash flows, returns on financial investments and the valuation of derivative contracts. Cat Financial manages interest rate and market liquidity risks through a variety of techniques that include a match funding strategy, the selective use of derivatives and a broadly diversified funding program. There can be no assurance, however, that fluctuations in interest rates and market liquidity conditions will not have an adverse impact on its and our earnings and cash flows. If any of the variety of instruments and strategies Cat Financial uses to hedge its exposure to these types of risk is ineffective, this may have an adverse impact on our earnings and cash flows.With respect to Insurance Services' investment activities, changes in the equity and bond markets could result in a decline in value of its investment portfolio, resulting in an unfavorable impact to earnings.
An increase in delinquencies, repossessions or net losses of Cat Financial customers could adversely affect its results.
Inherent in the operation of Cat Financial is the credit risk associated with its customers. The creditworthiness of each customer and the rate of delinquencies, repossessions and net losses on customer obligations are directly impacted by several factors, including relevant industry and economic conditions, the availability of capital, the experience and expertise of the customer's management team, commodity prices, political events and the sustained value of the underlying collateral. Any increase in delinquencies, repossessions and net losses on customer obligations could have a material adverse effect on Cat Financial's and our earnings and cash flows. Cat Financial evaluates and adjusts its allowance for credit losses related to past due and non-performing receivables on a regular basis. However, adverse economic conditions or other factors that might cause deterioration of the financial health of its customers could change the timing and level of payments received and necessitate an increase in Cat Financial's estimated losses, which could also have a material adverse effect on Cat Financial's and our earnings and cash flows.
Currency exchange rate fluctuations affect our results of operations.
We conduct operations in many countries involving transactions denominated in a variety of currencies. We are subject to currency-exchange rate risk to the extent that our costs are denominated in currencies other than those in which we earn revenues. Fluctuations in currency exchange rates have had, and will continue to have, an impact on our results as expressed in U.S. dollars. There can be no assurance that currency exchange rate fluctuations will not adversely affect our results of operations, financial condition and cash flows. While the use of currency hedging instruments may provide us with protection from adverse fluctuations in currency exchange rates, by utilizing these instruments we potentially forego the benefits that might result from favorable fluctuations in currency exchange rates. In addition, our outlooks do not assume fluctuations in currency exchange rates. Adverse fluctuations in currency exchange rates from the date of our outlooks could cause our actual results to differ materially from those anticipated in any outlooks and adversely impact our business, results of operations and financial condition.
We also face risks arising from the imposition of exchange controls and currency devaluations. Exchange controls may limit our ability to convert foreign currencies into U.S. dollars or to remit dividends and other payments by our foreign subsidiaries or businesses located in or conducted within a country imposing controls. Currency devaluations result in a diminished value of funds denominated in the currency of the country instituting the devaluation.
Restrictive covenants in our debt agreements could limit our financial and operating flexibility.
We maintain a number of credit facilities to support general corporate purposes (facilities) and have issued debt securities to manage liquidity and fund operations (debt securities). The agreements relating to a number of the facilities and the debt securities contain certain restrictive covenants applicable to us and certain subsidiaries, including Cat Financial. These covenants include maintaining a minimum consolidated net worth (defined as the consolidated shareholder’s equity including
preferred stock but excluding the pension and other post-retirement benefits balance within accumulated other comprehensive income (loss)), limitations on the incurrence of liens and certain restrictions on consolidation and merger. Cat Financial has also agreed under certain of these agreements not to exceed a certain leverage ratio (consolidated debt to consolidated net worth, calculated (1) on a monthly basis as the average of the leverage ratios determined on the last day of each of the six preceding calendar months and (2) at each December 31), to maintain a minimum interest coverage ratio (profit(calculated as (1) profit excluding income taxes, interest expense and net gain/gain (loss) from interest rate derivatives to (2) interest expense calculated at the end of each calendarfiscal quarter for the rollingprior four consecutive fiscal quarter period then most recently ended) and not to terminate, amend or modify its support agreement with us.
A breach of one or more of the covenants could result in adverse consequences that could negatively impact our business, results of operations and financial condition. These consequences may include the acceleration of amounts outstanding under certain of the facilities, triggering of an obligation to redeem certain debt securities, termination of existing unused commitments by our lenders, refusal by our lenders to extend further credit under one or more of the facilities or to enter into new facilities or the lowering or modification of our credit ratings or those of one or more of our subsidiaries.
Sustained increases in funding obligations under our pension plans may impair our liquidity or financial condition.
We maintain certain defined benefit pension plans for our employees, which impose on us certain funding obligations. InWe use many assumptions in determining our future payment obligations under the plans, we assume certain rates of return on the plan assets and a certain level of future benefit payments.plans. Significant adverse changes in credit or capital markets could result in actual rates of return on pension investments being materially lower than projected and result in increased contribution requirements. These factors could significantly increase our payment obligations under the plans, and as a result, adversely affect our business and overall financial condition.We expectmay be required to make material contributions to our pension plans in the future and may be required to make contributions that could be material. We may fund contributions through the use of cash on hand, the proceeds of borrowings, shares of our common stock or a combination of the foregoing, as permitted by applicable law. These factors could significantly increase our payment obligations under the plans, and as a result, adversely affect our business and overall financial condition.
LEGAL & REGULATORY RISKS
Our global operations are subject to a wide-range of trade and anti-corruption laws and regulations.
Due to the international scope of our operations, we are subject to a complex system of import- and export-related laws and regulations. These include U.S. regulations issued by Customs and Border Protection, the Bureau of Industry and Security, the Office of Antiboycott Compliance, the Directorate of Defense Trade Controls and the Office of Foreign Assets Control, as well as the counterparts of these agencies in other countries. Any alleged or actual violations may subject us to increased government scrutiny, investigation and civil and criminal penalties, and may limit our ability to import or export our products or to provide services outside the United States. Furthermore, embargoes and sanctions imposed by the U.S. and other governments restricting or prohibiting sales to specific persons or countries or based on product classification may expose us to potential criminal and civil sanctions. We cannot predict the nature, scope or effect of future regulatory requirements to which our operations might be subject. We also cannot predict in certain locations the manner in which existing laws might be administered or interpreted.
In addition, the U.S. Foreign Corrupt Practices Act and similar foreign anti-corruption laws generally prohibit companies and their intermediaries from making improper payments or providing anything of value to improperly influence foreign government officials for the purpose of obtaining or retaining business or obtaining an unfair advantage. Recent years have seen a substantial increase in the global enforcement of anti-corruption laws. Our operations outside the United States, including in developing countries, expose us to the risk of such violations. Violations of anti-corruption laws or regulations by our employees, intermediaries acting on our behalf, or our joint venture partners may result in severe criminal or civil sanctions. Violations may also disrupt our business, and may result in an adverse effect on our reputation, business and results of operations or financial condition.
International trade policies may impact demand for our products and our competitive position.
Government policies on international trade and investment such as import quotas, capital controls or tariffs, whether adopted by individual governments or addressed by regional trade blocs, can affect the demand for our products and services, impact the competitive position of our products or prevent us from being able to sell products in certain countries. The implementation of more restrictive trade policies (such as more detailed inspections, higher tariffs or new barriers to entry) in countries where we sell large quantities of products and services could negatively impact our business, results of operations and financial condition. For example, a government’s adoption of “buy national” policies or retaliation by another government against such policies could have a negative impact on our results of operations.
We may incur additional tax expense or become subject to additional tax exposure.
We are subject to income taxes in the United States and numerous other jurisdictions. Our future results of operations could be adversely affected by changes in the effective tax rate as a result of a change in the mix of earnings between U.S. and non-U.S. jurisdictions or among jurisdictions with differing statutory tax rates. In addition, our future results of operations could also be adversely affected by changes in our overall profitability, changes in tax laws or treaties or in their application or interpretation, changes in tax rates, changes in generally accepted accounting principles, changes in the valuation of deferred tax assets and liabilities, changes in the amount of earnings indefinitely reinvested in certain non-U.S. jurisdictions, the results of audits and examinations of previously filed tax returns and continuing assessments of our tax exposures. We are also subject to the continuous examination of our income tax returns by the U.S. Internal Revenue Service and other tax authorities. We regularly assess the likelihood of an adverse outcome resulting from these examinations. If our effective tax rates were to increase, or if the ultimate determination of our taxes owed is for an amount in excess of amounts previously accrued, our operating results, cash flows and financial condition could be adversely affected. For information regarding additional legal matters related to our taxes, please see Note 6 — “Income taxes” and Note 22 — “Environmental and legal matters” of Part II, Item 8 “Financial Statements and Supplementary Data” to this Annual Report on Form 10-K.
Costs associated with lawsuits or investigations or adverse rulings in enforcement or other legal proceedings may have an adverse effect on our results of operations.
We are subject to a variety of legal proceedings and legal compliance risks in virtually every part of the world. We face risk of exposure to various types of claims, lawsuits and government investigations. We are involved in various claims and lawsuits related to product design, manufacture and performance liability (including claimed asbestos exposure), contracts, employment issues, environmental matters, intellectual property rights, tax, securities and other legal proceedings that arise in and outside of the ordinary course of our business. The industries in which we operate are also periodically reviewed or investigated by regulators, which could lead to enforcement actions, fines and penalties or the assertion of private litigation claims. It is not possible to predict with certainty the outcome of claims, investigations and lawsuits, and we could in the future incur judgments, fines or penalties or enter into settlements of lawsuits and claims that could have an adverse effect on our reputation, business, results of operations or financial condition in any particular period.
The global and diverse nature of our operations means that legal and compliance risks will continue to exist and additional legal proceedings and other contingencies, the outcome of which cannot be predicted with certainty, may arise from time to time. In addition, subsequent developments in legal proceedings may affect our assessment and estimates of loss contingencies recorded as a reserve and require us to make payments in excess of our reserves. Such payments could have an adverse effect on our reputation, business and results of operations or financial condition.
New regulations or changes in financial services regulation could adversely impact Caterpillar and Cat Financial.
Cat Financial’s operations are highly regulated by governmental authorities in the locations where it operates, which can impose significant additional costs and/or restrictions on its business. In the United States, for example, certain Cat Financial activities are subject to the U.S. Dodd-Frank Wall Street Reform and Consumer Protection Act (Dodd-Frank), which includes extensive provisions regulating the financial services industry. As a result, Cat Financial has become and could continue to become subject to additional regulatory costs that could be significant and have an adverse effect on Cat Financial’s and our results of operations and financial condition. Changes in regulations or additional regulations in the United States or internationally impacting the financial services industry could also add significant cost or operational constraints that might have an adverse effect on Cat Financial’s and our results of operations and financial condition.
We are subject to stringent environmental laws and regulations that impose significant compliance costs.
Our facilities, operations and products are subject to increasingly stringent environmental laws and regulations globally, including laws and regulations governing emissions to noise, air, releases to soil and discharges to water and the generation, handling, storage, transportation, treatment and disposal of non-hazardous and hazardous waste materials. Some environmental laws impose strict, retroactive and joint and several liability for the remediation of the release of hazardous substances, even for conduct that was lawful at the time it occurred, or for the conduct of, or conditions caused by, prior operators, predecessors or other third parties. Failure to comply with environmental laws could expose us to penalties or clean-up costs, civil or criminal liability and sanctions on certain of our activities, as well as damage to property or natural resources. The potential liabilities, sanctions, damages and remediation efforts related to any non-compliance with such laws and regulations could negatively impact our ability to conduct our operations and our financial condition and results of operations. In addition, there can be no assurances that we will not be adversely affected by costs, liabilities or claims with respect to existing or subsequently acquired operations or under present laws and regulations or those that may be adopted or imposed in the future.
Environmental laws and regulations may change from time to time, as may related interpretations and other guidance. Changes in environmental laws or regulations could result in higher expenses and payments. Uncertainty relating to environmental laws or regulations may also affect how we conduct our operations and structure our investments and could limit our ability to enforce our rights. Changes in environmental and climate change laws or regulations, including laws relating to greenhouse gas emissions, could lead to new or additional investment in product designs and could increase environmental compliance expenditures. Changes in climate change concerns, or in the regulation of such concerns, including greenhouse gas emissions, could subject us to additional costs and restrictions, including increased energy and raw materials costs. If environmental laws or regulations are either changed or adopted and impose significant operational restrictions and compliance requirements upon us or our products, they could negatively impact our reputation, business, capital expenditures, results of operations, financial condition and competitive position.
The Company’s amended and restated bylaws provide that the Court of Chancery of the State of Delaware will be the exclusive forum for certain legal actions between the Company and its shareholders, which could discourage claims or limit the ability of the Company’s shareholders to bring a claim in a judicial forum viewed by the shareholders as more favorable for disputes with the Company or the Company’s directors, officers or other employees.
The Company’s amended and restated bylaws provide to the fullest extent permitted by law that unless the Company consents in writing to the selection of an alternative forum, the Court of Chancery of the State of Delaware will be the sole and exclusive forum for (i) any derivative action or proceeding brought on behalf of the Company, (ii) any action asserting a claim of breach of fiduciary duty owed by any director, officer or other employee of the Company to the Company or the Company’s shareholders, (iii) any action asserting a claim against the Company or any director or officer or other employee of the Company arising pursuant to any provision of the Delaware General Corporation Law or the Company’s certificate of incorporation or bylaws (as either may be amended from time to time) or (iv) any action asserting a claim against the Company or any director or officer or other employee of the Company governed by the internal affairs doctrine.
The exclusive forum provisions in our bylaws could limit our shareholders’ ability to bring a claim in a judicial forum that it finds favorable for disputes with the Company or its directors, officers or other employees. Alternatively, if a court were to find the choice of forum provision contained in the Company’s amended and restated bylaws to be inapplicable or unenforceable in an action, the Company may incur additional costs associated with resolving such action in other jurisdictions. The exclusive forum provision in the Company’s amended and restated bylaws will not preclude or contract the scope of exclusive federal or concurrent jurisdiction for actions brought under the federal securities laws including the Securities Exchange Act of 1934, as amended, or the Securities Act of 1933, as amended, or the respective rules and regulations promulgated thereunder.
Item 1B.Unresolved Staff Comments.
None.
Item 1C. Cybersecurity
As required by Item 106 of Regulation S-K, the following sets forth information regarding our cybersecurity strategy, risk management and governance.
Cybersecurity Strategy and Risk Management
Cybersecurity is critical to advancing our overall objectives and enabling our digital efforts. As a global company, we face a wide variety of cybersecurity threats that range from common attacks such as ransomware and denial-of-service, to attacks from more advanced adversaries. Our customers, suppliers, and other partners face similar cybersecurity threats, and a cybersecurity incident impacting these entities could materially adversely affect our operations, performance and results. These cybersecurity threats and related risks make it imperative that we maintain focus on cybersecurity and systemic risks.
We maintain a comprehensive cybersecurity program which is integrated within the Company’s enterprise risk management system and encompasses the corporate information technology and operational technology environments as well as customer-facing products. Our cybersecurity program has implemented a governance structure and process to identify, assess, manage, mitigate, respond to and report on cybersecurity risks. We utilize cybersecurity policies and frameworks based on industry and government standards. Our cyber risk management program controls are based on recognized best practices and standards, including the National Institute of Standards and Technology (NIST) Cyber Security Framework and the International Organization for Standardization (ISO 27001) Information Security Management System Requirements. We partner with third parties to support and evaluate our cybersecurity program. These third-party services span areas including cybersecurity maturity assessments, incident response, penetration testing, consulting on best practices, and others. We also consume threat intelligence from several paid and non-paid sources.
We maintain a 24 x 7 operations center which serves as a central location for the reporting of cybersecurity matters, provides monitoring of our global cybersecurity environment, and coordinates the investigation and remediation of alerts. As cybersecurity events occur, the cybersecurity team focuses on responding to and containing the threat and minimizing impact. In the event of an incident, the cybersecurity team assesses, among other factors, safety impact, supply chain and manufacturing disruption, data and personal information loss, business operations disruption, projected cost and potential for reputational harm, with participation from technical, legal and law enforcement support, as appropriate.
We have implemented a cybersecurity awareness program which covers topics such as phishing, social networking safety, password security and mobile device usage. We have mandatory training in the areas of cybersecurity, privacy, and confidential information handling. We also conduct regular phishing training and simulations for our employees and contractors. We provide extensive specialized role-based training to technical professionals in cybersecurity, secure application development, and other focus areas. We also conduct periodic tabletop exercises to validate our preparation for cyber events.
We operate a third-party cybersecurity program with the goal of minimizing disruption to the Company’s business and production operations, strengthening supply chain resilience, and supporting the integrity of components and systems used in its products and services. We rely heavily on our supply chain to deliver our products and services to our customers, and a cybersecurity incident at a supplier, subcontractor or joint venture partner could materially adversely impact us. We assess third-party cybersecurity controls through a cybersecurity third-party risk assessment process. Identified deficiencies are addressed through a risk remediation process. For select suppliers, we engage third-party cybersecurity monitoring and alerting services, and seek to work directly with those suppliers to address potential deficiencies identified.
As of the date of this report, we do not believe that risks from any cybersecurity threats, including as a result of any previous cybersecurity incidents, have materially affected or are reasonably likely to affect us, including our business strategy, results of operations or financial condition. That said, as discussed more fully under Item 1A. “Risk Factors—Operational Risks— Increased information technology security threats and more sophisticated computer crime pose a risk to our systems, networks, products and services” of this Form 10-K, these threats pose a risk to the security of our systems and networks and the confidentiality, availability and integrity of our data. Cybersecurity attacks could also include attacks targeting customer data or the security, integrity and/or reliability of the hardware and software installed in our products. It is possible that our information technology systems and networks, or those managed or provided by third parties, could have vulnerabilities, which could go unnoticed for a period of time. While various procedures and controls have been and are being utilized to mitigate such risks, there can be no guarantee that the actions and controls we have implemented and are implementing, or which we cause or have caused third-party service providers to implement, will be sufficient to protect and mitigate associated risks to our systems, information or other property.
Cybersecurity Governance
Caterpillar’s board has oversight for risk management with a focus on the most significant risks facing the Company, including strategic, operational, financial and legal compliance risks. The board’s risk oversight process builds upon management’s risk assessment and mitigation processes, which include an enterprise risk management program of which our cybersecurity processes are an integral component.
The board implements its risk oversight function both as a board and through delegation to board committees, which meet regularly and report back to the board. The board has delegated the oversight of specific risks to board committees that align with their functional responsibilities. The Audit Committee (the “AC”) assists the board in overseeing the enterprise risk management program and evaluates and monitors risks related to, among other things, the Company’s information security program. The AC assesses cybersecurity and information technology risks and the controls implemented to monitor and mitigate these risks. The Company’s Chief Information Officer & Senior Vice President, Caterpillar IT (the “CIO”) attends all bimonthly AC meetings and provides cybersecurity updates to the AC and board.
Our cybersecurity program is overseen by our CIO, who has been a Caterpillar employee for nearly twenty-five years. Prior to her current appointment as our CIO in September 2020, she was the Chief Information Officer for the Company’s Financial Products Division. Her extensive background in IT includes global leadership for large-scale systems transformations, cybersecurity, cloud and application management, global data center management, worldwide network, servers and storage, database management and end-user services. Our CIO leads a cross-functional cybersecurity team comprised of professionals from our product, cybersecurity, legal and compliance organizations who focus on managing the security of our connected solutions. This team manages the Company’s global IT systems, IT risk management, cybersecurity, global infrastructure and IT transformations.
Item 1C.1D.Executive Officers of the Registrant.
| | | | | | | | | | | | | | |
| Name and age | | Present Caterpillar Inc. position
and date of initial election | | Principal positions held during the
past five years if other than
Caterpillar Inc. position currently held |
D. James Umpleby III (63)(65) | | Chairman of the Board (2018) and Chief Executive Officer (2017) | | Group President (2013-2016) |
Andrew R.J. Bonfield (59)(61) | | Chief Financial Officer (2018) | | Group Chief Financial Officer for a multinational electricity and gas utility company (2010-2018) |
Bob De Lange (52)(54) | | Group President (2017) | | Vice President (2015-2016), Worldwide Product Manager, Medium Wheel Loaders, (2013-2014) |
Denise C. Johnson (55)(57) | | Group President (2016) | | Vice President (2012-2016) |
Joseph E. Creed (46)(48) | | Chief Operating Officer (2023) | | Group President (2021) | | (2021-2023), Vice President, Oil & Gas and Marine Division (2019-2020), Interim Chief Financial Officer (2018), Vice President, Finance Services Division (2017), Group Chief Financial Officer, Energy and Transportation (2013-2016) |
Anthony D. Fassino (51)(53) | | Group President (2021) | | Vice President, Building Construction Products (2018-2020), Director of Worldwide Forestry Products (2016-2018) |
Suzette M. Long (56)Derek R. Owens (50) | | Chief Legal Officer and General Counsel (2017)(2023) | | Interim ExecutiveSenior Vice President Law and Public Policy (2017)(2023), Deputy General Counsel (2013-2017)(2021-2023), Associate General Counsel, Litigation & Investigations (2019-2021), Assistant United States Attorney, U.S. Attorney's Office of the Department of Justice (2005-2019) |
Cheryl H. Johnson (61)(63) | | Chief Human Resources Officer (2017) | | Executive Vice President of Human Resources for a global multi-industry aerospace, defense and industrial manufacturing company (2012-2017) |
G. Michael Marvel (60)William E. Schaupp (52) | | Vice President and Chief Accounting Officer (2019)(2022) | | Finance Director, Global Finance Services Division (2021-2022) Vice President and Controller and Chief Accounting Officer of PPG Industries, Inc. (2018-2021) |
| Jason E. Kaiser (45) | | Director of Corporate Financial Reporting (2018-2019)Group President (2024) | | Senior Vice President, Electric Power Division (2021-2023), Chief Financial Officer for Solar Turbines Incorporated (2013-2018)General Manager, Electric Power Division (2019-2021), Product Manager, Electric Power Division (2016-2019) |
Item 2.Properties.
General Information
Caterpillar’s operations are highly integrated. Although the majority of our plants are involved primarily in production relating to our Construction Industries, Resource Industries or Energy & Transportation segments, several plants are involved in manufacturing relating to more than one business segment. In addition, several plants reported in our financial statements under the All Other segment are involved in the manufacturing of components that are used in the assembly of products for more than one business segment. Caterpillar’s parts distribution centers are involved in the storage and distribution of parts for Construction Industries, Resource Industries and Energy & Transportation. The research and development activities carried on at our Technical Centers in Aurora and Mossville, Illinois involve products for Construction Industries, Resource Industries and Energy & Transportation.
We believe the properties we own to be generally well maintained and adequate for present use. Through planned capital expenditures, we expect these properties to remain adequate for future needs. Properties we lease are covered by leases expiring over terms of generally one to ten years. We do not anticipate any difficulty in retaining occupancy of any leased facilities, either by renewing leases prior to expiration or by replacing them with equivalent leased facilities.
Headquarters and Other Key Offices
Our corporate headquarters is in a leased office located in Deerfield, Illinois.Irving, Texas. Our Financial Products business is headquartered in offices in Nashville, Tennessee. Additional key offices are located inside and outside the United States.
Technical Center, Training Centers, Demonstration Areas and Proving Grounds
We operate Technical Centers located in Aurora and Mossville, Illinois; Wuxi, China; and Chennai, India. Our demonstration centers are located in Tinaja Hills, Arizona; Edwards, Illinois; Chichibu, Japan and Malaga, Spain. We have various other technical and training centers, demonstration areas and proving grounds located both inside and outside the United States.
Parts Distribution Centers
Distribution of our parts is conducted from parts distribution centers inside and outside the United States. We operate parts distribution centers in the following locations: Arvin, California; Denver, Colorado; Miami, Florida; Atlanta, Georgia; Morton, Illinois; St. Paul, Minnesota; Clayton, Ohio; York, Pennsylvania; Waco, Texas; Spokane, Washington; Melbourne, Australia; Queensland, Australia; Grimbergen, Belgium; Piracicaba, Brazil; Shanghai, China; Sagami, Japan; San Luis Potosi, Mexico; Singapore, Republic of Singapore; Moscow, Russia; Johannesburg, South Africa; and Dubai, United Arab Emirates. We also own or lease other facilities that support our distribution activities.
Remanufacturing and Components
Remanufacturing of our products is reported in our Energy & Transportation segment and is conducted primarily at the facilities in the following locations: Franklin, Indiana; Bogor, Indonesia; Corinth, Mississippi; Prentiss County, Mississippi; West Fargo, North Dakota; Piracicaba, Brazil; Shanghai, China; and Nuevo Laredo, Mexico.
Component manufacturing is reported in the All Other segment and is conducted primarily at facilities in the following locations: East Peoria, Illinois; Mapleton, Illinois; Peoria, Illinois; Bogor, Indonesia; Menominee, Michigan; Boonville, Missouri; West Plains, Missouri; Goldsboro, North Carolina; Sumter, South Carolina; Tianjin, China; Xuzhou, China; Atessa, Italy; Bazzano, Italy; Frosinone, Italy; San Eusebio, Italy; Ramos Arizpe, Mexico; Pyeongtaek, South Korea; and Skinningrove, United Kingdom.
We also lease or own other facilities that support our remanufacturing and component manufacturing activities.
Manufacturing
Manufacturing of products for our Construction Industries, Resource Industries and Energy & Transportation segments is conducted primarily at the locations listed below. These facilities are believed to be suitable for their intended purposes, with adequate capacities for current and projected needs for existing products.
Our principal manufacturing facilities include those used by the following segments in the following locations:
| | | | | | | | | | | | | | |
| Segment | | U.S. Facilities | | Facilities Outside the U.S. |
| | | | | |
| Construction Industries | | Arkansas: North Little Rock | | Brazil: Campo Largo, Piracicaba |
| | | Georgia: Athens | | China: Suzhou, Wujiang, Xuzhou, Qingzhou |
| | | Illinois: Decatur, East Peoria | | France: Grenoble, Echirolles |
| | | Kansas: Wamego | | Hungary: Godollo |
| | Minnesota: Brooklyn Park | | India: Hosur, Thiruvallur |
| | | North Carolina: Clayton, Sanford | | Indonesia: Jakarta
|
| | Texas: Victoria
| | Italy: Minerbio, Cattolica |
| | Texas: Victoria | | | Japan: Akashi |
| | | | Mexico: Torreon |
| | | | Netherlands: Den Bosch |
| | | | Poland: Janow, Sosnowiec |
| | | | Russia: Tosno
|
| | | | Thailand: Rayong |
| | | | | United Kingdom: Desford, Stockton |
| | | | |
| | | | |
| | | | | |
| Resource Industries | | Illinois: Decatur, East Peoria | | China: Qingzhou, Wuxi |
| | | South Carolina: Sumter | | Germany: Dortmund, Lunen |
| | | Texas: Denison | | India: Thiruvallur |
| | Wisconsin: South Milwaukee | | Indonesia: Batam |
| | | | | Italy: Jesi
|
| | | | Mexico: Acuna, Monterrey, Reynosa |
| | | | | Russia: Tosno
|
| | | | Thailand: Rayong |
| | | | | United Kingdom: Peterlee Springvale |
| | | | | |
| | | | | |
| Energy & Transportation | | Alabama: Albertville, Montgomery | | Australia: Cardiff, Perth, Redbank, Revesby |
| | California: San Diego | | Brazil: Curitiba, Hortolandia, Piracicaba, Sete Lagoas |
| | Georgia: Griffin, Patterson | | China: Tianjin, Wuxi |
| | | Illinois:East Peoria, Mossville, Mapleton, Pontiac | | Czech Republic: Zatec, Zebrak |
| | | Indiana: Lafayette, Muncie | | Germany: Kiel, Mannheim, Rostock |
| | | Kentucky: Decoursey, Mayfield | | India: Aurangabad, Hosur |
| | Oklahoma: Broken Arrow | | Indonesia: Batam
|
| | North Carolina: Winston-Salem
| | Italy: Pistoria |
| | North Carolina: Winston-Salem | | Mexico: San Luis Potosi, Tijuana |
| | Texas: Channelview, DeSoto, Fort Worth, Mabank, San Antonio, Schertz, Seguin, Sherman | | Mexico: San Luis Potosi, Tijuana
|
| | | | United Kingdom: Larne, Peterborough, Sandiacre, South Queensferry, Springvale, Stafford, Wimborne |
| | | | | |
Item 3.Legal Proceedings.
Certain legal proceedings in which we are involved are discussed in Note 22 — "Environmental and legal matters" of Part II, Item 8 "Financial Statements and Supplementary Data" and should be considered an integral part of Part I, Item 3 "Legal Proceedings", which is hereby incorporated by reference.
Item 4.Mine Safety Disclosures.
Not applicable.
PART II
Item 5.Market for Registrant’s Common Equity, Related Stockholder Matters and Issuer Purchases of Equity Securities.
Common Stock (NYSE: CAT)
Listing Information: Caterpillar common stock is listed on the New York Stock Exchange in the United States, and on stock exchanges in France and Switzerland.
Number of Shareholders: Shareholders of record at the end of 20212023 totaled 22,559,21,217, compared with 23,29921,935 at the end of 2020.2022.
Performance Graph: Total Cumulative Shareholder Return for Five-Year Period Ending December 31, 20212023
The graph below shows the cumulative shareholder return assuming an investment of $100 on December 31, 2016,2018, and reinvestment of dividends issued thereafter.
| | | | | 2016 | | 2017 | | 2018 | | 2019 | | 2020 | | 2021 | | | 2018 | | 2019 | | 2020 | | 2021 | | 2022 | | 2023 |
| Caterpillar Inc. | Caterpillar Inc. | | $ | 100.00 | | | $ | 175.03 | | | $ | 144.30 | | | $ | 172.46 | | | $ | 218.96 | | | $ | 253.90 | |
| S&P 500 | S&P 500 | | $ | 100.00 | | | $ | 121.83 | | | $ | 116.49 | | | $ | 153.17 | | | $ | 181.35 | | | $ | 233.41 | |
| S&P 500 Machinery | S&P 500 Machinery | | $ | 100.00 | | | $ | 133.94 | | | $ | 121.46 | | | $ | 158.26 | | | $ | 195.32 | | | $ | 234.70 | |
Non-U.S. Employee Stock Purchase Plans
As of December 31, 2021,2023, we had 28 employee stock purchase plans (the “EIP Plans”) administered outside the United States for our non-U.S. employees, which had approximately 13,00014,000 active participants in the aggregate. During the fourth quarter of 2021,2023, approximately 83,00078,000 shares of Caterpillar common stock were purchased by the EIP Plans pursuant to the terms of such plans.
Issuer Purchases of Equity Securities
| | | | | | | | | | | | | | | | | | | | | | | | | | |
| Period | | Total Number of Shares Purchased2,3 | | Average Price Paid per Share2,3 | | Total Number
of Shares Purchased
as Part of Publicly Announced Program | | Approximate Dollar Value of Shares that May Yet be Purchased under the Program (in billions)1 |
| October 1-31, 2021 | | 908,433 | | | $ | 195.66 | | | 908,433 | | | $ | 2.966 | |
| November 1-30, 2021 | | 2,350,143 | | | $ | 205.52 | | | 2,350,143 | | | $ | 2.483 | |
| December 1-31, 2021 | | 1,956,330 | | | $ | 196.66 | | | 1,956,330 | | | $ | 2.099 | |
| Total | | 5,214,906 | | | $ | 200.48 | | | 5,214,906 | | | |
| | | | | | | | |
1 In July 2018, the Board approved a share repurchase authorization of up to $10.0 billion of Caterpillar common stock effective January 1, 2019, with no expiration (the 2018 Authorization). As of December 31, 2021, approximately $2.1 billion remained available under the 2018 Authorization. |
|
2 During the fourth quarter of 2021, we entered into an ASR with a third-party financial institution to purchase $500 million of our common stock. In November 2021, upon payment of the $500 million to the financial institution, we received 2.0 million shares. In December 2021, upon final settlement of the ASR, we received an additional 0.5 million shares. In total, we repurchased 2.5 million shares under this ASR at an average price per share of $200.93. |
3 In October, November and December of 2021, we repurchased 0.9 million, 0.4 million and 1.4 million shares respectively, for an aggregate of $545 million in open market transactions at an average price per share of $195.66, $205.54 and $201.33, respectively. |
|
| | | | | | | | | | | | | | | | | | | | | | | | | | |
| Period | | Total Number
of Shares
Purchased | | Average Price Paid per Share | | Total Number
of Shares Purchased
as Part of Publicly Announced Program | | Approximate Dollar Value of Shares that May Yet be Purchased under the Program (in billions)1 |
| October 1-31, 2023 | | 965,566 | | | $ | 260.01 | | | 965,566 | | | $ | 10.340 | |
| November 1-30, 2023 | | 7,250,965 | | | $ | 239.97 | | | 7,250,965 | | 2 | $ | 8.300 | |
| December 1-31, 2023 | | 1,749,834 | | | $ | 271.45 | | | 1,749,834 | | | $ | 7.825 | |
| Total | | 9,966,365 | | | $ | 247.44 | | | 9,966,365 | | | |
| | | | | | | | |
1 In May 2022, the Board approved a share repurchase authorization (the 2022 Authorization) of up to $15.0 billion of Caterpillar common stock effective August 1, 2022, with no expiration. As of December 31, 2023, approximately $7.8 billion remained available under the 2022 Authorization. |
2 Includes shares acquired pursuant to the accelerated share repurchase agreement entered into during the fourth quarter of 2023. |
| | | | | | | | |
Item 6.[Reserved]
Item 7.Management’s Discussion and Analysis of Financial Condition and Results of Operations.
The following Management’s Discussion and Analysis of Financial Condition and Results of Operations (MD&A) is intended to provide information that will assist the reader in understanding the company’s Consolidated Financial Statements, the changes in certain key items in those financial statements between select periods and the primary factors that accounted for those changes. In addition, we discuss how certain accounting principles, policies and critical estimates affect our Consolidated Financial Statements. Our discussion also contains certain forward lookingforward-looking statements related to future events and expectations. This MD&A should be read in conjunction with our discussion of cautionary statements and significant risks to the company’s business under Item 1A. Risk Factors of the 20212023 Form 10-K.
Highlights for 2021the full-year 2023 include:
•Sales and revenues for 20212023 were $50.971$67.060 billion, an increase of 22$7.633 billion, or 13 percent, from 2020.compared with $59.427 billion for 2022. Sales were higher across all regions and in the three primary segments.
•Operating profit as a percent of sales and revenues was 13.519.3 percent in 2021,2023, compared with 10.913.3 percent in 2020.2022. Adjusted operating profit margin was 20.5 percent in 2023, compared with 15.4 percent in 2022.
•Profit was $11.83 per share for 2021,2023 was $20.12, and excluding the items in the table below,adjusted profit per share was $10.81. For 2020, profit$21.21. Profit per share for 2022 was $5.46 per share,$12.64, and excluding the items in the table below, adjusted profit per share was $6.56.$13.84.
•In order for our results to be more meaningful to our readers, we have separately quantified the impact of several significant items. A detailed reconciliation of GAAP to non-GAAP financial measures is included on page 54.47.
| | | | | | | | | | | | | | | | | | | | |
| | | | | | |
| | Full Year 2021 | | Full Year 2020 |
| (Dollars in millions except per share data) | | Profit Before Taxes | Profit
Per Share | | Profit Before Taxes | Profit
Per Share |
| Profit............................................................................. | | $ | 8,204 | | $ | 11.83 | | | $ | 3,995 | | $ | 5.46 | |
Mark-to-market (gains) losses...................................... | | (833) | | (1.17) | | | 383 | | 0.55 | |
Restructuring costs....................................................... | | 90 | | 0.15 | | | 354 | | 0.55 | |
| Adjusted profit............................................................... | | $ | 7,461 | | $ | 10.81 | | | $ | 4,732 | | $ | 6.56 | |
| | | | | | |
| | | | | | | | | | | | | | | | | | | | |
| | | | | | |
| | Full Year 2023 | | Full Year 2022 |
| (Dollars in millions except per share data) | | Profit Before Taxes | Profit
Per Share | | Profit Before Taxes | Profit
Per Share |
| Profit | | $ | 13,050 | | $ | 20.12 | | | $ | 8,752 | | $ | 12.64 | |
Restructuring costs - Longwall divestiture | | 586 | | 1.14 | | | — | | — | |
Other restructuring costs | | 194 | | 0.30 | | | 299 | | 0.43 | |
| Mark-to-market (gains) losses | | (97) | | (0.14) | | | (606) | | (0.91) | |
| Deferred tax valuation allowance adjustments | | — | | (0.21) | | | — | | — | |
| Goodwill impairment | | — | | — | | | 925 | | 1.68 | |
| Adjusted profit | | $ | 13,733 | | $ | 21.21 | | | $ | 9,370 | | $ | 13.84 | |
| | | | | | |
•Enterprise operating cash flow was $7.2$12.9 billion in 2021.2023. Caterpillar ended 20212023 with $9.3$7.0 billion of enterprise cash.
OVERVIEW
OurTotal sales and revenues for 20212023 were $50.971$67.060 billion, an increase of $9.223$7.633 billion, or 2213 percent, compared with $41.748$59.427 billion in 2020.for 2022. The increase was primarily due to higher sales volume, driven by higher end-user demand for equipment and services and the impact from changes in dealer inventories, along with favorable price realization. and higher sales volume. Profit per share was $11.83$20.12 in 2021,2023, compared with profit per share of $5.46$12.64 in 2020.2022. Profit was $6.489$10.335 billion in 2021,2023, compared with $2.998$6.705 billion in 2020.2022. The increase was primarily due to favorable price realization, higher sales volume and favorable price realization. Mark-to-marketthe absence of a 2022 goodwill impairment charge related to the Rail division, partially offset by higher selling, general and administrative (SG&A) and research and development (R&D) expenses, unfavorable manufacturing costs, the impact of the divestiture of the company's Longwall business and lower mark-to-market gains for remeasurement of pension and other postemployment benefit (OPEB) plans,plans.
Trends and Economic Conditions
Outlook for Key End Markets
Overall demand remains healthy across most of our end markets for our products and services.
In Construction Industries, we expect North America to remain healthy in 2024. We expect non-residential construction in North America to remain at similar demand levels as 2023 due to government-related infrastructure investments. Residential construction is expected to remain healthy relative to historical levels. In Asia Pacific, excluding China, we expect some softening in economic conditions. We anticipate China will remain at a relatively low level in the excavator industry above 10-tons. In EAME, we anticipate the region will be slightly down due to economic uncertainty in Europe, partially offset by continuing strong construction demand in the Middle East. Construction activity in Latin America is expected to increase due to easing financial conditions. In addition, we anticipate the ongoing benefit of our services initiatives will positively impact Construction Industries in 2024.
In Resource Industries, in 2024, for both mining and heavy construction and quarry and aggregates, we anticipate lower sales volume compared to 2023, primarily due to off-highway and articulated trucks. While we continue to see a high level of quoting activity overall, we anticipate lower order rates as customers display capital discipline. Customer product utilization remains high, the number of parked trucks remains low, the age of the fleet remains elevated and our autonomous solutions continue to have strong customer acceptance. We expect higher services revenues, including robust rebuild activity in 2024. We continue to believe the energy transition will support increased commodity demand over time, expanding our total addressable market and providing further opportunities for long-term profitable growth.
In Energy & Transportation, in Oil & Gas, we expect reciprocating engines and services to increase slightly in 2024 compared to 2023. Well servicing in North America is showing some short-term moderation. Gas compression order backlog remains healthy and we continue to remain optimistic about future demand. Power Generation reciprocating engine demand is expected to remain strong due to continued data center growth. Solar Turbines has a strong backlog and continues to experience robust quoting activity. Industrial demand is expected to soften from a strong 2023. In Transportation, we anticipate high-speed marine to increase slightly as customers continue to upgrade aging fleets.
Company Trends and Expectations
For the full-year 2024, we anticipate sales and revenues will be broadly similar to 2023, supported by continued healthy underlying demand across most of our end markets for our products and services and slightly favorable price realization. We anticipate another year of services growth in 2024. We do not expect a significant change in machine dealer inventories in 2024, compared to an increase in 2023. In Construction Industries, sales of equipment to end users is expected to be broadly similar to 2023. In Construction Industries, we do not expect dealer inventory to increase in 2024 as it did in 2023. We also anticipate services initiatives will benefit the segment. Resource Industries' sales in 2024 are expected to be lower, driven by lower sales volume primarily in off-highway and articulated trucks. We also expect an unfavorable impact from changes in dealer inventories in Resource Industries. In 2024, we expect services revenues will increase in Resource Industries. Within Energy & Transportation in 2024, we expect slightly higher sales. Power Generation, Oil & Gas and Transportation sales are expected to increase. Industrial sales are expected to be lower compared to historically strong levels in 2023.
In 2024, we expect a small benefit from price realization during the first half of the year from price actions taken in the second half of 2023. We expect price realization to modestly exceed manufacturing costs, with moderation throughout the year as we lap favorable price trends from 2023. For 2024, we expect short-term incentive compensation expense to be about $1.2 billion, compared to $1.7 billion in 2023. We expect the short-term incentive compensation expense benefit year over year to be offset by increases in SG&A/R&D expenses as we continue to invest in strategic initiatives aimed at future long-term profitable growth, such as services growth and technology, including autonomy, alternative fuels, connectivity and digital and electrification. In addition, we anticipate an impact due to an unfavorable mix of products. In 2024, we expect restructuring costs to be between $300 million and $450 million and expect capital expenditures to be in the range of $2.0 billion to $2.5 billion. We expect the global annual effective tax rate, favorable impacts from foreign currency exchange (gains) lossesexcluding discrete items, to be between 22.5 percent and lower restructuring expenses were mostly offset by unfavorable manufacturing costs and higher selling, general and administrative (SG&A) and research and development (R&D) expenses.23.5 percent.
Fourth-quarter 2021In the first quarter of 2024, we expect sales and revenues were $13.798 billion, up $2.563 billion, or 23 percent, from $11.235 billionto be broadly similar to the first quarter of 2023. We expect demand to remain healthy, but anticipate slightly lower machine dealer inventory build as compared to the first quarter of 2023. We anticipate price realization will remain favorable. We expect Construction Industries' sales to remain flat to slightly higher, including favorable price realization. Resource Industries' sales are expected to be lower driven by lower sales volume, partially offset by favorable price realization. In Energy & Transportation, we expect sales to be flat to slightly higher.
In the first quarter of 2024, we expect favorable price realization to more than offset unfavorable manufacturing costs. We expect manufacturing costs to increase primarily due to cost absorption. We do not expect an inventory increase as compared to the increase in the fourthfirst quarter of 2020. Fourth-quarter 20212023. We also anticipate an increase in SG&A/R&D expenses due to investment in strategic initiatives. In Construction Industries, we expect favorable price realization to be offset by increased SG&A/R&D expenses and slightly higher manufacturing costs, including cost absorption. In Resource Industries, we expect the profit was $3.91 per share, compared with $1.42 per share in the fourth quarter of 2020. Fourth-quarter 2021 profit was $2.120 billion, compared with $780 million in the fourth quarter of 2020.impact from lower sales volume to be partially offset by favorable price realization. In Energy & Transportation, we anticipate favorable price realization to be offset by higher manufacturing costs.
Response to COVID-19 and Global Business Conditions:
We continue to monitor a variety of external factors including the ongoing impact of the COVID-19 pandemic around the world, and have implemented safeguards in our facilities to protect team members in line with local governmental requirements and guidance from health authorities.
Operations continue to be impacted by a variety of external factors including the pandemic,such as supply chain disruptions, and associatedinflationary cost and labor pressures. Areas of particular focus include transportation, certain components transportation and raw materials. Transportation shortages have resulted in delays and increased costs. In addition, our suppliers are dealing with availability issues and freight delays, which leads to delays of production in our facilities. We continue to develop and modify contingency planswork to minimize supply chain challenges that may impact our ability to meet increasing customer demand. To help mitigate supply chain challenges, we have proactively redirected components and altered our assembly processes. We continue to assess the environment andto determine if additional actions need to be taken.
Risk Factors
Risk factors are taking appropriate price actions in response to rising costs. We will continue to monitordisclosed within Item 1A. Risk Factors of the situation as conditions remain fluid and evolve, but we expect these challenges to continue this year.2023 Form 10-K.
Notes:
•Glossary of terms included on pages 40-42;35-37; first occurrence of terms shown in bold italics.
•Information on non-GAAP financial measures is included on page 54.47.
•Some amounts within this report are rounded to the millions or billions and may not add. In addition, the sum of the components reported across periods may not equal the total amount reported year-to-date due to rounding.
20212023 COMPARED WITH 20202022
CONSOLIDATED SALES AND REVENUES
The chart above graphically illustrates reasons for the change in consolidated sales and revenues between 20202022 (at left) and 20212023 (at right). Caterpillar management utilizes these charts internally to visually communicate with the company’s Boardboard of Directorsdirectors and employees.
Total sales and revenues for 20212023 were $50.971$67.060 billion, an increase of $9.223$7.633 billion, or 2213 percent, compared with $41.748$59.427 billion in 2020.2022. The increase was primarily due to favorable price realization and higher sales volume. The increase in sales volume was driven by higher end-user demand forsales of equipment and services andto end users, partially offset by the impact from changes in dealer inventories, along with favorable price realization. Dealers decreased their inventoriesinventories. Dealer inventory increased about $2.9$2.4 billion in 2020,during 2022, compared to a decreasean increase of about $100 million in 2021.$2.1 billion during 2023.
Sales were higher across all regions and in the three primary segments.
North America sales increased 2325 percent driven by higher end-user demand forsales of equipment to end users, favorable price realization and services,the impact from changes in dealer inventories. Dealer inventory increased more during 2023 than during 2022.
Sales decreased 2 percent in Latin America due to the impact from changes in dealer inventories and lower services sales volume, partially offset by favorable price realization. Dealers decreased inventoriesrealization and favorable currency impacts primarily related to the Brazilian real. Dealer inventory increased during 2022, compared to a decrease during 2023.
EAME sales increased 6 percent due to favorable price realization and higher sales of equipment to end users, partially offset by the impact from changes in dealer inventories. Dealer inventory increased more during 20202022 than during 2021.2023.
SalesAsia/Pacific sales increased 512 percent in Latin America duedriven by favorable price realization, partially offset by unfavorable currency impacts, primarily related to higher end-user demand forthe Australian dollar and Japanese yen, lower sales of equipment and servicesto end users and the impact from changes in dealer inventories.Dealers decreased inventories Dealer inventory increased more during 2020,2022 than during 2023.
Dealer inventory increased about $2.1 billion during 2023, compared to an increase during 2021.
EAME sales increased 24 percent due to higher end-user demand for equipment and services, the impact of changes in dealer inventories, favorable currency impacts primarily related to a stronger euro and British pound and favorable price realization. Dealers decreased inventories during 2020, compared to an increase during 2021.
Asia/Pacific sales increased 15 percent driven by higher end-user demand for equipment and services, the impact of changes in dealer inventories and favorable currency impacts related to a stronger Australian dollar and Chinese yuan. Dealers decreased their inventories during 2020, compared to remaining about flat during 2021.
Dealers decreased their inventories about $2.9 billion in 2020, compared to a decrease of about $100 million in 2021.$2.4 billion during 2022. Dealers are independent, and the reasons for changes in their inventory levels vary, including their expectations of future demand and product delivery times. Dealers’ demand expectations take into account seasonal changes, macroeconomic conditions, machine rental rates and other factors. Delivery times can vary based on availability of product from Caterpillar factories and product distribution centers. We do not expect a significant change in machine dealer inventories to be about flat in 2022 compared to 2021.2024.
| | Sales and Revenues by Segment | |
| Sales and Revenues by Segment | |
Sales and Revenues by Segment | | (Millions of dollars) | (Millions of dollars) | | 2020 | | Sales
Volume | | Price
Realization | | Currency | | | Inter-Segment / Other | | 2021 | | $
Change | | %
Change | (Millions of dollars) | | 2022 | | Sales
Volume | | Price
Realization | | Currency | | | | Inter-Segment / Other | | 2023 | | $
Change | | %
Change |
| Construction Industries | Construction Industries | | $ | 16,918 | | | $ | 4,063 | | | $ | 732 | | | $ | 323 | | | | $ | 70 | | | $ | 22,106 | | | $ | 5,188 | | | 31 | % | Construction Industries | | $ | 25,269 | | | $ | | $ | (314) | | | $ | | $ | 2,678 | | | $ | | $ | (197) | | | | | $ | | | | $ | (18) | | | $ | | $ | 27,418 | | | $ | | $ | 2,149 | | | 9 | | 9 | % |
| Resource Industries | Resource Industries | | 7,906 | | | 1,833 | | | 100 | | | 123 | | | | 1 | | | 9,963 | | | 2,057 | | | 26 | % | Resource Industries | | 12,314 | | | (114) | | (114) | | | 1,422 | | 1,422 | | | (77) | | (77) | | | | | 38 | | | | 38 | | | 13,583 | | 13,583 | | | 1,269 | | 1,269 | | | 10 | | 10 | % |
| Energy & Transportation | Energy & Transportation | | 17,470 | | | 1,683 | | | 101 | | | 222 | | | | 811 | | | 20,287 | | | 2,817 | | | 16 | % | Energy & Transportation | | 23,752 | | | 2,529 | | 2,529 | | | 1,500 | | 1,500 | | | (11) | | (11) | | | | | 231 | | | | 231 | | | 28,001 | | 28,001 | | | 4,249 | | 4,249 | | | 18 | | 18 | % |
| All Other Segment | All Other Segment | | 467 | | | 30 | | | (1) | | | 3 | | | | 12 | | | 511 | | | 44 | | | 9 | % | All Other Segment | | 450 | | | (8) | | (8) | | | (5) | | (5) | | | (1) | | (1) | | | | | 13 | | | | 13 | | | 449 | | 449 | | | (1) | | (1) | | | — | | — | % |
| Corporate Items and Eliminations | Corporate Items and Eliminations | | (3,739) | | | (46) | | | — | | | — | | | | (894) | | | (4,679) | | | (940) | | | | Corporate Items and Eliminations | | (5,211) | | | (115) | | (115) | | | 1 | | 1 | | | 7 | | 7 | | | | | (264) | | | | (264) | | | (5,582) | | (5,582) | | | (371) | | (371) | | | | | |
| Machinery, Energy & Transportation | Machinery, Energy & Transportation | | 39,022 | | | 7,563 | | | 932 | | | 671 | | | | — | | | 48,188 | | | 9,166 | | | 23 | % | Machinery, Energy & Transportation | | 56,574 | | | 1,978 | | 1,978 | | | 5,596 | | 5,596 | | | (279) | | (279) | | | | | — | | | | — | | | 63,869 | | 63,869 | | | 7,295 | | 7,295 | | | 13 | | 13 | % |
| | Financial Products Segment | Financial Products Segment | | 3,044 | | | — | | | — | | | — | | | | 29 | | | 3,073 | | | 29 | | | 1 | % |
| Financial Products Segment | |
| Financial Products Segment | | | 3,253 | | | — | | | — | | | — | | | | | 532 | | | 3,785 | | | 532 | | | 16 | % |
| Corporate Items and Eliminations | Corporate Items and Eliminations | | (318) | | | — | | | — | | | — | | | | 28 | | | (290) | | | 28 | | | | Corporate Items and Eliminations | | (400) | | | — | | — | | | — | | — | | | — | | — | | | | | (194) | | | | (194) | | | (594) | | (594) | | | (194) | | (194) | | | | | |
Financial Products Revenues | Financial Products Revenues | | 2,726 | | | — | | | — | | | — | | | | 57 | | | 2,783 | | | 57 | | | 2 | % | Financial Products Revenues | | 2,853 | | | — | | — | | | — | | — | | | — | | — | | | | | 338 | | | | 338 | | | 3,191 | | 3,191 | | | 338 | | 338 | | | 12 | | 12 | % |
| | Consolidated Sales and Revenues | Consolidated Sales and Revenues | | $ | 41,748 | | | $ | 7,563 | | | $ | 932 | | | $ | 671 | | | | $ | 57 | | | $ | 50,971 | | | $ | 9,223 | | | 22 | % |
| Consolidated Sales and Revenues | |
| Consolidated Sales and Revenues | | | $ | 59,427 | | | $ | 1,978 | | | $ | 5,596 | | | $ | (279) | | | | | $ | 338 | | | $ | 67,060 | | | $ | 7,633 | | | 13 | % |
|
| | Sales and Revenues by Geographic Region | Sales and Revenues by Geographic Region | Sales and Revenues by Geographic Region |
| North America | | Latin America | | EAME | | Asia/Pacific | | External Sales and Revenues | | Inter-Segment | | Total Sales and Revenues |
| North America | | | North America | | Latin America | | EAME | | Asia/Pacific | | External Sales and Revenues | | Inter-Segment | | Total Sales and Revenues |
| (Millions of dollars) | (Millions of dollars) | $ | | % Chg | | $ | | % Chg | | $ | | % Chg | | $ | | % Chg | | $ | | % Chg | | $ | | % Chg | | $ | | % Chg | (Millions of dollars) | $ | | % Chg | | $ | | % Chg | | $ | | % Chg | | $ | | % Chg | | $ | | % Chg | | $ | | % Chg | | $ | | % Chg |
| 2021 | | | | | | | | | | | | | | | | | | | | | | | | | | | |
| 2023 | |
| Construction Industries | |
| Construction Industries | |
| Construction Industries | Construction Industries | $ | 9,676 | | | 31% | | $ | 1,913 | | | 86% | | $ | 4,858 | | | 40% | | $ | 5,547 | | | 11% | | $ | 21,994 | | | 30% | | $ | 112 | | | 167% | | $ | 22,106 | | | 31 | % | $ | 15,343 | | | 24% | | 24% | | $ | 2,307 | | | (19%) | | (19%) | | $ | 5,254 | | | 3% | | 3% | | $ | 4,390 | | | (9%) | | (9%) | | $ | 27,294 | | | 9% | | 9% | | $ | 124 | | | (13%) | | (13%) | | $ | 27,418 | | | 9 | | 9 | % |
| Resource Industries | Resource Industries | 2,987 | | | 31% | | 1,724 | | | 38% | | 1,987 | | | 27% | | 2,804 | | | 20% | | 9,502 | | | 28% | | 461 | | | —% | | 9,963 | | | 26 | % | Resource Industries | 5,256 | | | 16% | | 16% | | 2,040 | | | 11% | | 11% | | 2,069 | | | (6%) | | (6%) | | 3,879 | | | 13% | | 13% | | 13,244 | | | 10% | | 10% | | 339 | | | 13% | | 13% | | 13,583 | | | 10 | | 10 | % |
| Energy & Transportation | Energy & Transportation | 7,611 | | | 11% | | 1,233 | | | 32% | | 4,908 | | | 10% | | 2,918 | | | 20% | | 16,670 | | | 14% | | 3,617 | | | 29% | | 20,287 | | | 16 | % | Energy & Transportation | 11,982 | | | 31% | | 31% | | 1,983 | | | 11% | | 11% | | 5,929 | | | 13% | | 13% | | 3,461 | | | 10% | | 10% | | 23,355 | | | 21% | | 21% | | 4,646 | | | 5% | | 5% | | 28,001 | | | 18 | | 18 | % |
| All Other Segment | All Other Segment | 56 | | | 107% | | 2 | | | (50%) | | 18 | | | (31%) | | 69 | | | 23% | | 145 | | | 28% | | 366 | | | 3% | | 511 | | | 9 | % | All Other Segment | 65 | | | 2% | | 2% | | (1) | | | (150%) | | (150%) | | 18 | | | 127% | | 127% | | 49 | | | (66%) | | (66%) | | 131 | | | (10%) | | (10%) | | 318 | | | 4% | | 4% | | 449 | | | — | | — | % |
| Corporate Items and Eliminations | Corporate Items and Eliminations | (106) | | | (1) | | | (1) | | | (15) | | | (123) | | | (4,556) | | | (4,679) | | |
| Machinery, Energy & Transportation | Machinery, Energy & Transportation | 20,224 | | | 23% | | 4,871 | | | 51% | | 11,770 | | | 24% | | 11,323 | | | 15% | | 48,188 | | | 23% | | — | | | —% | | 48,188 | | | 23 | % |
| Machinery, Energy & Transportation | |
| Machinery, Energy & Transportation | | 32,513 | | | 25% | | 6,326 | | | (2%) | | 13,265 | | | 6% | | 11,765 | | | 2% | | 63,869 | | | 13% | | — | | | —% | | 63,869 | | | 13 | % |
| | Financial Products Segment | |
| Financial Products Segment | |
| Financial Products Segment | Financial Products Segment | 1,935 | | | —% | | 265 | | | 3% | | 402 | | | 3% | | 471 | | | 1% | | 3,073 | | 1 | 1% | | — | | | —% | | 3,073 | | | 1 | % | 2,440 | | | 17% | | 17% | | 416 | | | 20% | | 20% | | 491 | | | 24% | | 24% | | 438 | | | 2% | | 2% | | 3,785 | | 1 | 1 | 16% | | — | | | —% | | —% | | 3,785 | | | 16 | | 16 | % |
| Corporate Items and Eliminations | Corporate Items and Eliminations | (136) | | | (50) | | | (35) | | | (69) | | | (290) | | | — | | | (290) | | |
| Financial Products Revenues | Financial Products Revenues | 1,799 | | | 3% | | 215 | | | —% | | 367 | | | 4% | | 402 | | | —% | | 2,783 | | | 2% | | — | | | —% | | 2,783 | | | 2 | % |
| | Consolidated Sales and Revenues | $ | 22,023 | | | 21% | | $ | 5,086 | | | 48% | | $ | 12,137 | | | 23% | | $ | 11,725 | | | 14% | | $ | 50,971 | | | 22% | | $ | — | | | —% | | $ | 50,971 | | | 22 | % |
| | 2020 | | | | | | | | | | | | | | | | | | | | |
| Construction Industries | $ | 7,365 | | | $ | 1,031 | | | $ | 3,466 | | | $ | 5,014 | | | $ | 16,876 | | | | | $ | 42 | | | $ | 16,918 | | |
| Resource Industries | 2,286 | | | 1,253 | | | 1,570 | | | 2,337 | | | 7,446 | | | | | 460 | | | 7,906 | | |
| Energy & Transportation | 6,843 | | | 932 | | | 4,448 | | | 2,441 | | | 14,664 | | | | | 2,806 | | | 17,470 | | |
| All Other Segment | 27 | | | 4 | | | 26 | | | 56 | | | 113 | | | | | 354 | | | 467 | | |
| Corporate Items and Eliminations | (62) | | | (4) | | | (6) | | | (5) | | | (77) | | | | | (3,662) | | | (3,739) | | |
| Machinery, Energy & Transportation | 16,459 | | | 3,216 | | | 9,504 | | | 9,843 | | | 39,022 | | | | | — | | | 39,022 | | |
| | |
| Financial Products Segment | 1,930 | | | 257 | | | 392 | | | 465 | | | 3,044 | | 1 | | | — | | | 3,044 | | |
| Corporate Items and Eliminations | (175) | | | (41) | | | (38) | | | (64) | | | (318) | | | | | — | | | (318) | | |
| Financial Products Revenues | |
| Financial Products Revenues | Financial Products Revenues | 1,755 | | | 216 | | | 354 | | | 401 | | | 2,726 | | | | | — | | | 2,726 | | | 2,093 | | | 12% | | 12% | | 339 | | | 26% | | 26% | | 408 | | | 17% | | 17% | | 351 | | | (3%) | | (3%) | | 3,191 | | | 12% | | 12% | | — | | | —% | | —% | | 3,191 | | | 12 | | 12 | % |
| | | |
| Consolidated Sales and Revenues | Consolidated Sales and Revenues | $ | 18,214 | | | $ | 3,432 | | | $ | 9,858 | | | $ | 10,244 | | | $ | 41,748 | | | | | $ | — | | | $ | 41,748 | | |
| Consolidated Sales and Revenues | |
| Consolidated Sales and Revenues | | $ | 34,606 | | | 24% | | $ | 6,665 | | | (1%) | | $ | 13,673 | | | 7% | | $ | 12,116 | | | 2% | | $ | 67,060 | | | 13% | | $ | — | | | —% | | $ | 67,060 | | | 13 | % |
| 1 Includes revenues from Machinery, Energy & Transportation of $351 million and $362 million in 2021 and 2020, respectively. | | 2022 | |
| 2022 | |
| 2022 | |
| Construction Industries | |
| Construction Industries | |
| Construction Industries | |
| Resource Industries | |
| Resource Industries | |
| Resource Industries | |
| Energy & Transportation | |
| Energy & Transportation | |
| Energy & Transportation | |
| All Other Segment | |
| All Other Segment | |
| All Other Segment | |
| Corporate Items and Eliminations | |
| Corporate Items and Eliminations | |
| Corporate Items and Eliminations | |
| Machinery, Energy & Transportation | |
| Machinery, Energy & Transportation | |
| Machinery, Energy & Transportation | |
| | | | | | | | | | | | | | | | | | | | |
| | | | | | | | | | | | | | | | | | | | |
| | | | | | | | | | | | | | | | | | | | |
| Financial Products Segment | |
| Financial Products Segment | |
| Financial Products Segment | |
| Corporate Items and Eliminations | |
| Corporate Items and Eliminations | |
| Corporate Items and Eliminations | |
| Financial Products Revenues | |
| Financial Products Revenues | |
| Financial Products Revenues | |
| | | | | | | | | | | | | | | | | | | | |
| | | | | | | | | | | | | | | | | | | | |
| | | | | | | | | | | | | | | | | | | | |
| Consolidated Sales and Revenues | |
| Consolidated Sales and Revenues | |
| Consolidated Sales and Revenues | |
| 1 Includes revenues from Machinery, Energy & Transportation of $690 million and $478 million in 2023 and 2022, respectively. | |
| 1 Includes revenues from Machinery, Energy & Transportation of $690 million and $478 million in 2023 and 2022, respectively. | |
| 1 Includes revenues from Machinery, Energy & Transportation of $690 million and $478 million in 2023 and 2022, respectively. | |
Construction Industries
Our Construction Industries segment is primarily responsible for supporting customers using machinery in infrastructure and building construction. The majority of machine sales in this segment are made in the heavy and general construction, rental, quarry and aggregates and mining.
The nature of customer demand for construction machinery varies around the world. Customers in developing economies often prioritize purchase price in making their investment decisions, while customers in developed economies generally weigh productivity and other performance criteria that contribute to lower owning and operating costs over the lifetime of the machine. To meet customer expectations in developing economies, Caterpillar developed differentiated product offerings that target customers in those regions, including our SEM brand machines. We believe that these customer-driven product innovations enable us to compete more effectively in developing economies. The majority of Construction Industries' research and development spending in 2023 focused on the next generation of construction machines.
The competitive environment for construction machinery is characterized by some global competitors and many regional and specialized local competitors.Examples of global competitors include CASE (part of CNH Industrial N.V.), Deere Construction & Forestry (part of Deere & Company), Doosan Bobcat (Part of Doosan Group), Hitachi Construction Machinery Co., Ltd., Hyundai Construction Equipment Co., Ltd., Hyundai Doosan Infracore Co., Ltd. (both part of Hyundai Heavy Industries Group), J.C. Bamford Excavators Ltd., Kobelco Construction Machinery (part of Kobe Steel, Ltd), Komatsu Ltd., Kubota Farm & Industrial Machinery (part of Kubota Corporation), Sany Heavy Industry Co., Ltd., and Volvo Construction Equipment (part of the Volvo Group).As an example of regional and local competitors, our competitors in China also include Guangxi LiuGong Machinery Co., Ltd., Longking Holdings Ltd., Sany Heavy Industry Co, XCMG Construction Machinery Co., Ltd., Shandong Lingong Construction Machinery Co., Ltd. (SDLG, JV with Volvo Construction Equipment) and Shantui Construction Machinery Co., Ltd., (part of Shandong Heavy Industry Group Co.).Each of these companies has varying product lines that compete with Caterpillar products, and each has varying degrees of regional focus.
The Construction Industries portfolio includes the following product families as well as related parts and work tools:
| | | | | | | | | | | | | | |
| · asphalt pavers | | · motor graders | | · track-type tractors (small, medium) |
| · backhoe loaders | | · pipelayers | | · track excavators (mini, small |
| · cold planers | | · road reclaimers | | medium, large) |
| · compactors | | · skid steer loaders | | · wheel excavators |
| · compact track loaders | | · telehandlers | | · wheel loaders (compact, small,
|
| · forestry machines | | · track-type loaders | | medium) |
| · material handlers | | | | |
Resource Industries
The Resource Industries segment is primarily responsible for supporting customers using machinery in mining and heavy construction and quarry and aggregates. Caterpillar offers a broad product range and services to deliver comprehensive solutions for our customers. We develop and manufacture high productivity equipment for both surface and underground mining operations around the world, as well as provide hydraulic systems, electronics and software for Caterpillar machines and engines.Our equipment is used to extract and haul copper, iron ore, coal, oil sands, aggregates, gold and other minerals and ores, as well as a variety of heavy construction applications.In addition to equipment, Resource Industries also develops and sells technology products and services to provide customers fleet management systems, equipment management analytics and autonomous machine capabilities.
Customers in most markets place an emphasis on equipment that is highly productive, reliable and provides the lowest total cost of ownership over the life of the equipment.In some developing markets, customers often prioritize purchase price in making their investment decisions. We believe our ability to control the integration and design of key machine components and innovative technologies represents a competitive advantage. Our research and development efforts remain focused on providing customers the lowest total cost of ownership enabled through the highest quality, most productive products and services in the industry.
The competitive environment for Resource Industries consists of a few larger global competitors that compete in several of the markets that we serve and a substantial number of smaller companies that compete in a more limited range of products, applications, and regional markets. Our global surface competitors include Deere Construction & Forestry (part of Deere & Company), Epiroc AB, Hitachi Construction Machinery Co., Ltd., Komatsu Ltd., Liebherr-International AG, Sandvik AB, and Volvo Construction Equipment. Our global underground competitors include Epiroc AB, Komatsu Ltd., and Sandvik AB.
The Resource Industries product portfolio includes the following machines and related parts and services:
| | | | | | | | | | | | | | |
·electric rope shovels | | ·large wheel loaders | | ·soil compactors |
·draglines | | ·off-highway trucks | | ·machinery components |
·hydraulic shovels | | ·articulated trucks | | ·autonomous ready vehicles and solutions |
·rotary drills | | ·wheel tractor scrapers | | ·select work tools |
·hard rock vehicles | | ·wheel dozers | | ·safety services and mining performance |
·large track-type tractors | | ·fleet management | | solutions |
·large mining trucks | | ·landfill compactors | | |
| | | | |
| | | | |
| | | | |
| | | | |
| | | | |
Energy & Transportation
Our Energy & Transportation segment supports customers in oil and gas, power generation, marine, rail and industrial applications, including Caterpillar machines. The product and services portfolio includes reciprocating engines, generator sets, integrated systems and solutions, turbines and turbine-related services, electrified powertrain and zero-emission power sources and service solutions development, the remanufacturing of Caterpillar engines and components, remanufacturing services for other companies, diesel-electric locomotives and other rail-related products and services and product support of on-highway vocational trucks for North America.
Regulatory emissions standards require us to continue to make investments as new products and new regulations are introduced. Ongoing compliance with these regulations remains a focus. Emissions compliance in developing markets is complex due to rapidly evolving and unique requirements where enforcement processes can often vary. We employ robust product development, manufacturing processes and testing to help us comply with these regulations.
The competitive environment for reciprocating engines in marine, oil and gas, industrial and electric power generation systems along with turbines in oil and gas and electric power generation consists of a few larger global competitors that compete in a variety of markets that Caterpillar serves, and a substantial number of smaller companies that compete in a limited-size product range, geographic region and/or application. Principal global competitors include Cummins Inc., Deutz AG, Rolls-Royce Power Systems and Siemens Energy Global GmbH. Other competitors, such as Volvo Penta AB, FPT Industrial (Iveco Group), INNIO, GE Vernova, Kawasaki Heavy Industries Energy Solution & Marine Engineering, MAN Energy Solutions (VW), Weichai Power Co., Ltd., and other emerging market competitors compete in certain markets in which Caterpillar competes. An additional set of competitors, including Aggreko plc, Generac Holdings, Kohler Energy, Baker Hughes Co., and others, are primarily packagers who source engines and/or other components from domestic and international suppliers and market products regionally and internationally through a variety of distribution channels. In rail-related businesses, our global competitors include Wabtec Freight, The Greenbrier Companies, Voestalpine AG, and Vossloh AG, Alstom SA, Siemens Mobility, and CRRC Corp., LTD. We also compete with other companies on a more limited range of products, services and/or geographic regions.
The Energy & Transportation portfolio includes the following products and related parts:
•Reciprocating engine powered generator sets
•Reciprocating engines, drivetrain and integrated systems and solutions supplied to the industrial industry as well as Caterpillar machinery
•Integrated systems and solutions used in the electric power generation industry
•Turbines, centrifugal gas compressors and related services
•Reciprocating engines, drivetrain and integrated systems and solutions for the marine and oil and gas industries
•Diesel-electric locomotives and components and other rail-related products and services
Financial Products Segment
The business of our Financial Products Segment is primarily conducted by Cat Financial, Insurance Services and their respective subsidiaries and affiliates. Cat Financial is a wholly owned finance subsidiary of Caterpillar Inc. and it provides retail and wholesale financing alternatives to customers and dealers around the world for Caterpillar products and services, as well as financing for vehicles and power generation facilities that, in most cases, incorporate Caterpillar products. Retail financing is primarily comprised of installment sale contracts and other equipment-related loans, working capital loans, finance leases and operating leases. Wholesale financing to Caterpillar dealers consists primarily of inventory and rental fleet financing. In addition, Cat Financial purchases short-term wholesale trade receivables from Caterpillar. The various financing plans offered by Cat Financial are designed to support sales of Caterpillar products and services and generate financing income for Cat Financial. A significant portion of our activity is conducted in North America and we have additional offices and subsidiaries in Latin America, Asia/Pacific, Europe and Africa.
For over 40 years, Cat Financial has been providing financing for Caterpillar products, contributing to our knowledge of asset values, industry trends, financing structures and customer needs.
In certain instances, Cat Financial’s operations are subject to supervision and regulation by state, federal and various foreign governmental authorities, and may be subject to various laws and judicial and administrative decisions imposing various requirements and restrictions which, among other things, (i) regulate credit granting activities and the administration of loans, (ii) establish maximum interest rates, finance charges and other charges, (iii) require disclosures to customers, (iv) govern secured transactions, (v) set collection, foreclosure, repossession and other trade practices and (vi) regulate the use and reporting of information related to a borrower’s credit experience. Cat Financial’s ability to comply with these and other governmental and legal requirements and restrictions affects its operations.
Cat Financial’s retail loans include:
•Loans that allow customers and dealers to use their Caterpillar equipment or other assets as collateral to obtain financing.
•Installment sale contracts, which are equipment loans that enable customers to purchase equipment with structured payments over time.
Cat Financial's retail leases include:
•Finance (non-tax) leases, where the lessee for tax purposes is considered to be the owner of the equipment during the term of the lease, that either require or allow the customer to purchase the equipment for a fixed price at the end of the term.
•Tax leases that are classified as either operating or finance leases for financial accounting purposes, depending on the characteristics of the lease. For tax purposes, we are considered the owner of the equipment.
Cat Financial also purchases short-term receivables from Caterpillar.
Cat Financial’s wholesale loans and leases include inventory/rental programs, which provide assistance to dealers by financing their new Caterpillar inventory and rental fleets.
Cat Financial operates in a highly competitive environment, with financing for users of Caterpillar equipment and services available through a variety of sources, principally commercial banks and finance and leasing companies. Our competitors include Wells Fargo Equipment Finance Inc., Banc of America Leasing & Capital LLC, BNP Paribas Leasing Solutions Limited, Australia and New Zealand Banking Group Limited, Société Générale S.A. and various other banks and finance companies. In addition, many of the manufacturers that compete with Caterpillar also own financial subsidiaries, such as John Deere Capital Corporation, Komatsu Financial L.P., Volvo Financial Services and Kubota Credit Corporation, which utilize many below-market interest rate programs (funded by the manufacturer) to support machine sales. Cat Financial works with the broader Caterpillar organization to provide a broad array of financial merchandising programs to compete around the world.
The financial results of Cat Financial are largely dependent upon the ability of Caterpillar dealers to sell equipment and customers’ willingness to enter into financing or leasing agreements. Cat Financial is also affected by, among other things, the availability of funds from its financing sources, its cost of funds relative to its competitors and general economic conditions such as inflation and market interest rates.
Cat Financial has a match-funding policy that addresses interest rate risk by aligning the interest rate profile (fixed or floating rate and duration) of its debt portfolio with the interest rate profile of its receivables portfolio within predetermined ranges on an ongoing basis. In connection with that policy, Cat Financial uses interest rate derivative instruments to modify the debt structure to match assets within the receivables portfolio. This matched funding reduces the volatility of margins between interest-bearing assets and interest-bearing liabilities, regardless of which direction interest rates move. For more information regarding match funding, please see Note 4 — “Derivative financial instruments and risk management” of Part II, Item 8 "Financial Statements and Supplementary Data." See also the risk factors associated with our financial products business included in Item 1 A. of this Form 10-K.
In managing foreign currency risk for Cat Financial’s operations, the objective is to minimize earnings volatility resulting from conversion and the remeasurement of net foreign currency balance sheet positions, and future transactions denominated in foreign currencies. This policy allows the use of foreign currency forward, option and cross currency contracts to offset the risk of currency mismatch between the assets and liabilities, and exchange rate risk associated with future transactions denominated in foreign currencies.
Cat Financial provides financing only when certain criteria are met. Credit decisions are based on a variety of credit quality factors including prior payment experience, customer financial information, credit ratings, loan-to-value ratios and other internal metrics. Cat Financial typically maintains a security interest in retail-financed equipment and generally requires physical damage insurance coverage on financed equipment. Cat Financial finances a significant portion of Caterpillar dealers’ sales and inventory of Caterpillar equipment throughout the world. Cat Financial’s competitive position is improved by marketing programs offered in conjunction with Caterpillar and/or Caterpillar dealers. Under these programs, Caterpillar, or the dealer, funds an amount at the outset of the transaction, which Cat Financial then recognizes as revenue over the term of the financing. We believe that these marketing programs provide Cat Financial a significant competitive advantage in financing Caterpillar products.
Caterpillar Insurance Company, a wholly owned subsidiary of Caterpillar Insurance Holdings Inc., is a U.S. insurance company domiciled in Missouri and primarily regulated by the Missouri Department of Insurance. Caterpillar Insurance Company is licensed to conduct property and casualty insurance business in 50 states, the District of Columbia and Guam, and as such, is also regulated in those jurisdictions. The State of Missouri acts as the lead regulatory authority and monitors Caterpillar Insurance Company’s financial status to ensure that it is in compliance with minimum solvency requirements, as well as other financial ratios prescribed by the National Association of Insurance Commissioners. Caterpillar Insurance Company is also licensed to conduct insurance business through a branch in Zurich, Switzerland and, as such, is regulated by the Swiss Financial Market Supervisory Authority.
Caterpillar Life Insurance Company, a wholly owned subsidiary of Caterpillar, is a U.S. insurance company domiciled in Missouri and primarily regulated by the Missouri Department of Insurance. Caterpillar Life Insurance Company is licensed to conduct life and accident and health insurance business in 26 states and the District of Columbia and, as such, is also regulated in those jurisdictions. The State of Missouri acts as the lead regulatory authority and it monitors the financial status to ensure that it is in compliance with minimum solvency requirements, as well as other financial ratios prescribed by the National Association of Insurance Commissioners. Caterpillar Life Insurance Company provides reinsurance coverage to Caterpillar Insurance Company. Specifically, Caterpillar Life Insurance Company has entered into a reinsurance agreement with Caterpillar Insurance Company, assuming 100% of the risk of an Accident and Health Stop Loss Insurance Policy to cover a Caterpillar Voluntary Employees' Benefits Association (VEBA) Trust for medical losses sustained by a select group of Caterpillar retirees and dependents.
Caterpillar Insurance Co. Ltd., a wholly owned subsidiary of Caterpillar Insurance Holdings Inc., is a captive insurance company domiciled in Bermuda and regulated by the Bermuda Monetary Authority. Caterpillar Insurance Co. Ltd. is registered as a Class 2 (General Business) and Class B (Long-Term) insurer with the Bermuda Monetary Authority. Under its Class 2 insurance license, Caterpillar Insurance Co. Ltd. insures its parent and affiliates for general liability, property, auto liability and cargo. It also provides reinsurance to Caterpillar Insurance Company under a quota share reinsurance agreement for its contractual liability and contractors’ equipment programs in the United States. In addition, Caterpillar Insurance Co. Ltd. reinsures 100% of the international employee benefit plans of Caterpillar Inc. through retrocession agreements with other insurers. The employee benefits coverages include medical and accident coverages. which are reported under its Class 2 insurance license and life and disability coverages, which are reported under its Class B insurance license. The Bermuda Monetary Authority is responsible for monitoring compliance with solvency requirements and requires an Annual Financial Filing for this purpose.
Caterpillar Insurance Services Corporation, a wholly owned subsidiary of Caterpillar Insurance Holdings Inc., is a Tennessee insurance agency licensed in all 50 states, the District of Columbia and Guam. It provides brokerage and insurance services for all property and casualty and life and health lines of business.
Caterpillar’s insurance group provides protection and service for claims under the following programs:
•Contractual Liability Insurance to insure certain service contract obligations of Caterpillar and its affiliates, Caterpillar dealers and original equipment manufacturers (OEMs).
•Cargo reinsurance for the worldwide cargo risks of Caterpillar products.
•Contractors’ Equipment Physical Damage Insurance for equipment manufactured by Caterpillar or OEMs, which is leased, rented or sold by third party dealers to customers.
•General liability, employer’s liability, auto liability and property insurance for Caterpillar.
•Life, disability, medical and accident reinsurance for Caterpillar's international employee benefits program (non-U.S.).
•Reinsurance to cover VEBA Trust for medical claims of certain Caterpillar retirees and dependents.
•Brokerage and insurance services for property and casualty and life and health business.
Competitive Environment
Caterpillar products and services are sold worldwide into a variety of highly competitive markets. In all markets, we compete on the basis of product performance, customer service, quality and price. From time to time, the intensity of competition results in price discounting in a particular industry or region. Such price discounting puts pressure on margins and can negatively impact operating profit. Outside the United States, certain competitors enjoy competitive advantages inherent to operating in their home countries or regions.
Raw Materials and Component Products
We source our raw materials and manufactured components from suppliers both domestically and internationally. These purchases include unformed materials and rough and finished parts. Unformed materials include a variety of steel products, which are then cut or formed to shape and machined in our facilities. Rough parts include various sized steel and iron castings and forgings, which are machined to final specification levels inside our facilities. Finished parts are ready to assemble components, which are made either to Caterpillar specifications or to supplier developed specifications. We machine and assemble some of the components used in our machines, engines and power generation units and to support our after-market dealer parts sales. We also purchase various goods and services used in production, logistics, offices and product development processes. We maintain global strategic sourcing models to meet our global facilities’ production needs while building long-term supplier relationships and leveraging enterprise spend. We expect our suppliers to maintain, at all times, industry-leading levels of quality and the ability to timely deliver raw materials and component products for our machine and engine products. However, in some cases, increases in demand or supply chain disruptions have led to parts and components constraints across some products. We use a variety of agreements with suppliers to protect our intellectual property and processes to monitor and mitigate risks of the supply base causing a business disruption. The risks monitored include supplier financial viability, the ability to increase or decrease production levels, business continuity, quality and delivery.
Patents and Trademarks
We own a number of patents and trademarks, which have been obtained over a period of years and relate to the products we manufacture and the services we provide. These patents and trademarks are generally considered beneficial to our business. We do not regard our business as being dependent upon any single patent or group of patents.
Order Backlog
The dollar amount of backlog believed to be firm was approximately $27.5 billion at December 31, 2023 and $30.4 billion at December 31, 2022. Compared with year-end 2022, the order backlog decreased across the three primary segments. Of the total backlog at December 31, 2023, approximately $5.8 billion was not expected to be filled in 2024.
Dealers and Distributors
We distribute our machines principally through a worldwide organization of dealers (dealer network), 43 located in the United States and 113 located outside the United States, serving 191 countries. We sell reciprocating engines principally through the dealer network and to other manufacturers for use in products. We also sell some of the reciprocating engines manufactured by our subsidiary Perkins Engines Company Limited through its worldwide network of 88 distributors covering 185 countries. We sell the FG Wilson branded electric power generation systems through its worldwide network of 110 distributors covering 109 countries.
Our dealers do not deal exclusively with our products; however, in most cases sales and servicing of our products are the dealers’ principal business. We sell some products, primarily turbines and locomotives, directly to end customers through sales forces employed by the company. At times, these employees are assisted by independent sales representatives.
While the large majority of our worldwide dealers are independently owned and operated, we own and operate a dealership in Japan that covers approximately 80% of the Japanese market: Nippon Caterpillar Division. We are currently operating this Japanese dealer directly and we report its results in the All Other operating segment. There are also three independent dealers in the Southern Region of Japan.
For Caterpillar-branded products, the company’s relationship with each of its independent dealers is memorialized in standard sales and service agreements. Pursuant to these agreements, the company grants the dealer the right to purchase and sell its products and to service the products in a specified geographic service territory. The company establishes prices to dealers after receiving input from dealers on transactional pricing in the marketplace. The company also agrees to defend its intellectual property and to provide warranty and technical support to the dealer. The agreement further grants the dealer a non-exclusive license to use the company’s trademarks, service marks and brand names. In some instances, a separate trademark agreement exists between the company and a dealer.
In exchange for these rights, the agreement obligates the dealer to develop and promote the sale of the company’s products to current and prospective customers in the dealer’s service territory. Each dealer agrees to employ adequate sales and support personnel to market, sell and promote the company’s products, demonstrate and exhibit the products, perform the company’s product improvement programs, inform the company concerning any features that might affect the safe operation of any of the company’s products and maintain detailed books and records of the dealer’s financial condition, sales and inventories and make these books and records available at the company’s reasonable request.
These sales and service agreements are terminable at will by either party primarily upon 90 days written notice.
Human Capital
Core Values
Caterpillar’s global workforce is united by Our Values In Action, Caterpillar’s Code of Conduct. Integrity, Excellence, Teamwork, Commitment and Sustainability provide the foundation for our values-based culture. Our diversity and inclusion principles are embedded in our values. Our values unite us, and reflect our diverse cultures, languages, geographies, and businesses, as one Caterpillar team.
Health and Safety
The health and safety of our employees is an important focus at Caterpillar, and we strive to continually reduce our recordable injuries utilizing programs that amplify our safety culture, globally. In 2023, the Company achieved a recordable injury frequency rate of 0.40, compared to the 2022 recordable injury frequency rate of 0.44. In addition, Caterpillar has refreshed our safety strategy to enhance our focus on preventing serious injuries and to encourage learning from those closest to the work.
Talent Development and Training
In addition to our focus on values and safety, we strive to continually attract, develop, engage, and retain a high-performing diverse global team that executes our enterprise strategy of long-term profitable growth.
We are committed to employee development and helping individuals reach their full potential, by making on-going investments in our team. Our global internships, engineering co-ops, and career programs for engineering, marketing, and manufacturing provide development opportunities for early career employees. We also have a continual focus on strengthening technical, professional and leadership capabilities at every level using contemporary learning strategies to foster high performance. Strategic talent reviews and succession planning occur at a minimum, annually, across our businesses.
Our leadership development programs focus on encouraging a variety of experiences to help employees broaden understanding and increase perspective. Our leadership curriculums include managing for inclusion and building resilient and high performing teams as core development principles. Additionally, skill-based programs to upskill our manufacturing employees are developed locally and tailored to the specific needs of the business.
Diversity and Inclusion
We are committed to fostering a diverse workforce and an inclusive environment that is representative of the many customers and communities we serve around the globe. Our strategic approach weaves diversity and inclusion seamlessly into the business, ensuring that the principles guide us in our daily operating rhythm. Our 14 Employee Resource Groups (ERGs), which are sponsored and supported by leadership, help ensure different voices and perspectives contribute to our strategy for long-term profitable growth. They also engage our employees, helping contribute to development and retention.
Our ERGs provide many contributions, such as mentoring programs that connect diverse employees with senior leaders who can support their career goals, partnerships with recruiters and diverse early career and professional organizations that can assist in strengthening the diverse talent pipeline and programs that educate and inform on the richness of the global cultures that we share.
Compensation, Benefits and Employee Insights
Providing competitive benefits and compensation underpins our commitment to our engaged and productive employees. Our pay-for-performance philosophy aligns employee’s individual contributions, behaviors and business results with individual rewards. Our comprehensive Total Health programs focus on purpose, as well as physical and mental health, emotional and social support, and financial wellness. The annual Employee Insights Survey provides all employees the opportunity to confidentially share their perspectives and engages leaders to listen, learn and respond to employee feedback to help foster a positive work environment.
Employment
Management aligns employment levels with the needs of the business. We believe we have the appropriate human capital resources to successfully operate and deliver our enterprise strategy. As of December 31, 2023, we employed about 113,200 full-time persons of whom approximately 62,400 were located outside the United States. In the United States, we employed approximately 50,800 full-time persons, most of whom are at-will employees and, therefore, not subject to any type of employment contract or agreement. At select business units, we have hired certain highly specialized employees under employment contracts that specify a term of employment, pay and other benefits.
| | | | | | | | | | | | | | |
| Full-Time Employees at Year-End | | | | |
| | 2023 | | 2022 | |
| Inside U.S. | 50,800 | | 48,200 | |
| Outside U.S. | 62,400 | | 60,900 | |
| Total | 113,200 | | 109,100 | |
| | | | |
| By Region: | | | | |
| North America | 51,200 | | 48,700 | |
| EAME | 16,600 | | 16,900 | |
| Latin America | 20,300 | | 19,100 | |
| Asia/Pacific | 25,100 | | 24,400 | |
| Total | 113,200 | | 109,100 | |
| | | | |
As of December 31, 2023, there were 7,973 hourly production employees in the United States who were covered by collective bargaining agreements with various labor unions, including The United Automobile, Aerospace and Agricultural Implement Workers of America (UAW), The International Association of Machinists and The United Steelworkers. Outside the United States, the company enters into employment contracts and agreements in those countries in which such relationships are mandatory or customary. The provisions of these agreements generally correspond in each case with the required or customary terms in the subject jurisdiction.
Environmental Matters
The company is regulated by federal, state and international environmental laws governing our use, transport and disposal of substances and control of emissions. In addition to governing our manufacturing and other operations, these laws often impact the development of our products, including, but not limited to, required compliance with air emissions standards applicable to internal combustion engines. We have made, and will continue to make, significant research and development and capital expenditures to comply with these emissions standards.
We are engaged in remedial activities at a number of locations, often with other companies, pursuant to federal and state laws. When it is probable we will pay remedial costs at a site, and those costs can be reasonably estimated, the investigation, remediation, and operating and maintenance costs of the remedial action are accrued against our earnings. Costs are accrued
based on consideration of currently available data and information with respect to each individual site, including available technologies, current applicable laws and regulations, and prior remediation experience. Where no amount within a range of estimates is more likely, we accrue the minimum. Where multiple potentially responsible parties are involved, we consider our proportionate share of the probable costs. In formulating the estimate of probable costs, we do not consider amounts expected to be recovered from insurance companies or others. We reassess these accrued amounts on a quarterly basis. The amount recorded for environmental remediation is not material and is included in the line item "Accrued expenses" in Statement 3 — "Consolidated Financial Position at December 31" of Part II, Item 8 "Financial Statements and Supplementary Data." There is no more than a remote chance that a material amount for remedial activities at any individual site, or at all the sites in the aggregate, will be required.
Available Information
The company files electronically with the Securities and Exchange Commission (SEC) required reports on Form 8-K, Form 10-Q, Form 10-K and Form 11-K; proxy materials; ownership reports for insiders as required by Section 16 of the Securities Exchange Act of 1934 (Exchange Act); registration statements on Forms S-3 and S-8, as necessary; and other forms or reports as required. The SEC maintains a website (www.sec.gov) that contains reports, proxy and information statements, and other information regarding issuers that file electronically with the SEC. The company maintains a website (www.Caterpillar.com) and copies of our annual report on Form 10-K, quarterly reports on Form 10-Q, current reports on Form 8-K and any amendments to these reports filed or furnished with the SEC are available free of charge through our website (www.Caterpillar.com/secfilings) as soon as reasonably practicable after filing with the SEC. Copies of our board committee charters, our board’s Guidelines on Corporate Governance Issues, Worldwide Code of Conduct and other corporate governance information are available on our website (www.Caterpillar.com/governance) and are also available free of charge. The information contained on the company’s website is not included in, or incorporated by reference into, this annual report on Form 10-K.
Additional company information may be obtained as follows:
Current information -
•view additional financial information on-line at www.Caterpillar.com/en/investors/financial-information.html
•request, view or download materials on-line or register for email alerts at www.Caterpillar.com/materialsrequest
Historical information -
•view/download on-line at www.Caterpillar.com/historical
Item 1A.Risk Factors.
The statements in this section describe the most significant risks to our business and should be considered carefully in conjunction with Part II, Item 7 “Management’s Discussion and Analysis of Financial Condition and Results of Operations” and the “Notes to Consolidated Financial Statements” of Part II, Item 8 “Financial Statements and Supplementary Data” to this Form 10-K. In addition, the statements in this section and other sections of this Form 10-K, including in Part II, Item 7 “Management's Discussion and Analysis of Financial Condition and Results of Operations,” include “forward-looking statements” as that term is defined in the Private Securities Litigation Reform Act of 1995 and involve uncertainties that could significantly impact results. Forward-looking statements give current expectations or forecasts of future events about the company or our outlook. You can identify forward-looking statements by the fact they do not relate to historical or current facts and by the use of words such as “believe,” “expect,” “estimate,” “anticipate,” “will be,” “should,” “plan,” “forecast,” “target,” “guide,” “project,” “intend,” “could” and similar words or expressions.
Forward-looking statements are based on assumptions and on known risks and uncertainties. Although we believe we have been prudent in our assumptions, any or all of our forward-looking statements may prove to be inaccurate, and we can make no guarantees about our future performance. Should known or unknown risks or uncertainties materialize or underlying assumptions prove inaccurate, actual results could materially differ from past results and/or those anticipated, estimated or projected.
We undertake no obligation to publicly update forward-looking statements, whether as a result of new information, future events or otherwise. You should, however, consult any subsequent disclosures we make in our filings with the SEC on Form 10-Q or Form 8-K.
The following is a cautionary discussion of risks, uncertainties and assumptions that we believe are material to our business. In addition to the factors discussed elsewhere in this report, the following are some of the important factors that, individually or in the aggregate, we believe could make our actual results differ materially from those described in any forward-looking statements. It is impossible to predict or identify all such factors and, as a result, you should not consider the following factors to be a complete discussion of risks, uncertainties and assumptions.
MACROECONOMIC RISKS
Our business and the industries we serve are highly sensitive to global and regional economic conditions.
Our results of operations are materially affected by economic conditions globally and regionally and in the particular industries we serve. The demand for our products and services tends to be cyclical and can be significantly reduced in periods of economic weakness characterized by lower levels of government and business investment, lower levels of business confidence, lower corporate earnings, high real interest rates, lower credit activity or tighter credit conditions, perceived or actual industry overcapacity, higher unemployment and lower consumer spending. A prolonged period of economic weakness may also result in increased expenses due to higher allowances for doubtful accounts and potential goodwill and asset impairment charges. Economic conditions vary across regions and countries, and demand for our products and services generally increases in those regions and countries experiencing economic growth and investment. Slower economic growth or a change in the global mix of regions and countries experiencing economic growth and investment could have an adverse effect on our business, results of operations and financial condition.
The energy, transportation, and mining industries are significant adopters of Caterpillar products. In these industries customers are likely to base their purchase decisions upon expected future commodity dynamics, including price. Commodity price volatility may be abrupt and unpredictable in response to global economic conditions, government actions, regulatory changes, supply/demand dynamics, innovation, and commodity substitutions among others. Economic conditions affecting the industries we serve may reduce capital expenditures in response to a variety of the aforementioned conditions. Reduction in these capital expenditures may lead to decreased demand for Caterpillar products and services as well as aftermarket parts as customers may choose to extend preventative maintenance and delay overhauls when possible.
The rates of infrastructure spending, commercial construction and housing starts also play a significant role in our results. Our products are an integral component of these activities, and as these activities decrease, demand for our products and services may be significantly impacted, which could negatively impact our results.
Catastrophic events, including global pandemics, could materially adversely affect our business, results of operations and/or financial condition.
The occurrence of a major earthquake, fire, flood, tsunami or other weather event, power loss, telecommunications failure, software or hardware malfunctions, pandemics, cyber-attack, war, terrorist attack or other catastrophic event that our disaster recovery plans do not adequately address, could adversely affect our employees, our systems, our ability to produce and distribute our products, and our reputation. For example, a pandemic had a significant impact around the world, prompting governments and businesses to take unprecedented measures in response. Such measuresincluded travel bans and restrictions, quarantines, shelter in place orders and shutdowns. Those measures impacted or could again impact all or portions of our workforce and operations and the operations of our customers, dealers and suppliers. Current material and component shortages, logistics constraints and labor inefficiencies limited and or could continue to limit our ability to meet customer demand, which could have a material adverse effect on our business, results of operations and/or financial condition.
Pandemics can significantly increase economic and customer demand uncertainty, cause inflationary pressure in the U.S. and elsewhere and lead to volatility in customer demand for the Company’s products and services and cause supply chain disruptions. Economic uncertainties could continue to affect customer demand for the Company’s products and services, the value of the equipment financed or leased, the demand for financing and the financial condition and credit risk of our dealers and customers.
A catastrophic event resulting in the destruction or disruption of our workforce, our systems, our ability to produce and distribute our products, any of our data centers or our critical business or information technology systems could adversely affect our ability to conduct normal business operations and our operating results or cash flows. The adverse effects of any such catastrophic event would be exacerbated if experienced at the same time as another unexpected and adverse event.
Commodity price changes, material price increases, fluctuations in demand for our products and services, significant disruptions to our supply chains or significant shortages of labor and material may adversely impact our financial results or our ability to meet commitments to customers.
We are a significant user of steel and many other commodities required for the manufacture of our products. Increases in the prices of such commodities would increase our costs, negatively impacting our business, results of operations and financial condition if we are unable to fully offset the effect of these increased costs through price increases, productivity improvements, cost reduction programs or hedging programs.
We rely on suppliers to produce or secure material required for the manufacture of our products. Production challenges at suppliers (including suppliers of semiconductors), a disruption in deliveries to or from suppliers or decreased availability of raw materials or commodities could have an adverse effect on our ability to meet our commitments to customers or increase our operating costs.On the other hand, in circumstances where demand for our products is less than we expect, we may experience excess inventories and be forced to incur additional costs and our profitability may suffer. Our business, competitive position, results of operations or financial condition could be negatively impacted if supply is insufficient for our operations, if significant transportation delays interfere with deliveries, if we experience excess inventories or if we are unable to adjust our production schedules or our purchases from suppliers to reflect changes in customer demand and market fluctuations on a timely basis.
Changes in government monetary or fiscal policies may negatively impact our results.
Most countries where our products and services are sold have established central banks to regulate monetary systems and influence economic activities, generally by adjusting interest rates. Interest rate changes affect overall economic growth, which affects demand for residential and nonresidential structures, as well as energy and mined products, which in turn affects sales of our products and services that support these activities. Interest rate changes may also affect our customers’ ability to finance machine purchases, can change the optimal time to keep machines in a fleet and can impact the ability of our suppliers to finance the production of parts and components necessary to manufacture and support our products. Increases in interest rates could negatively impact sales and create supply chain inefficiencies.
Central banks and other policy arms of many countries may take actions to vary the amount of liquidity and credit available in an economy. The impact from a change in liquidity and credit policies could negatively affect the customers and markets we serve or our suppliers, create supply chain inefficiencies and could adversely impact our business, results of operations and financial condition.
Changes in monetary and fiscal policies, along with other factors, may cause currency exchange rates to fluctuate. Actions that lead the currency exchange rate of a country where we manufacture products to increase relative to other currencies could reduce the competitiveness of products made in that country, which could adversely affect our competitive position, results of operations and financial condition.
Government policies on taxes and spending also affect our business. Throughout the world, government spending finances a significant portion of infrastructure development, such as highways, rail systems, airports, sewer and water systems, waterways and dams. Tax regulations determine asset depreciation lives and impact the after-tax returns on business activity and investment, both of which influence investment decisions. Unfavorable developments, such as decisions to reduce public spending or to increase taxes, could negatively impact our results.
Our global operations are exposed to political and economic risks, commercial instability and events beyond our control in the countries in which we operate.
Our global operations are dependent upon products manufactured, purchased and sold in the U.S. and internationally, including in countries with political and economic instability or uncertainty. Some countries have greater political and economic volatility and greater vulnerability to infrastructure and labor disruptions than others. Our business could be negatively impacted by adverse fluctuations in freight costs, fuel costs (e.g., diesel, bunker, jet), limitations on shipping and receiving capacity, and other disruptions in the transportation and shipping infrastructure at important geographic points of exit and entry for our products. Operating in different regions and countries exposes us to numerous risks, including:
•multiple and potentially conflicting laws, regulations and policies that are subject to change;
•imposition of currency restrictions, restrictions on repatriation of earnings or other restraints;
•imposition of new or additional tariffs or quotas;
•withdrawal from or modification of trade agreements or the negotiation of new trade agreements;
•imposition of new or additional trade and economic sanctions laws imposed by the U.S. or foreign governments;
•war or acts of terrorism; and
•political and economic instability or civil unrest that may severely disrupt economic activity in affected countries.
The occurrence of one or more of these events may negatively impact our business, results of operations and financial condition.
OPERATIONAL RISKS
The success of our business depends on our ability to develop, produce and market quality products that meet our customers’ needs.
Our business relies on continued global demand for our brands and products. To achieve business goals, we must develop and sell products that appeal to our dealers, OEMs and end-user customers. This is dependent on a number of factors, including our ability to maintain key dealer relationships; our ability to produce products that meet the quality, performance and price expectations of our customers and our ability to develop effective sales, advertising and marketing programs. In addition, our continued success in selling products that appeal to our customers is dependent on leading-edge innovation, with respect to both products and operations, and on the availability and effectiveness of legal protection for our innovations. Failure to continue to deliver high quality, innovative, competitive products to the marketplace, to adequately protect our intellectual property rights; to supply products that meet applicable regulatory requirements, including engine exhaust emission requirements or to predict market demands for, or gain market acceptance of, our products, could have a negative impact on our business, results of operations and financial condition.
We operate in a highly competitive environment, which could adversely affect our sales and pricing.
We operate in a highly competitive environment. We compete on the basis of a variety of factors, including product performance, customer service, quality and price. There can be no assurance that our products will be able to compete successfully with other companies’ products. Thus, our share of industry sales could be reduced due to aggressive pricing or product strategies pursued by competitors, unanticipated product or manufacturing difficulties, our failure to price our products competitively, our failure to produce our products at a competitive cost or an unexpected buildup in competitors’ new machine or dealer-owned rental fleets, which could lead to downward pressure on machine rental rates and/or used equipment prices.
Lack of customer acceptance of price increases we announce from time to time, changes in customer requirements for price discounts, changes in our customers’ behavior or a weak pricing environment could have an adverse impact on our business, results of operations and financial condition.
In addition, our results and ability to compete may be impacted negatively by changes in our geographic and product mix of sales.
Increased information technology security threats and more sophisticated computer crime pose a risk to our systems, networks, products and services.
We rely upon information technology systems and networks, some of which are managed by third parties, in connection with a variety of business activities. Additionally, we collect and store sensitive information relating to our business, customers, dealers, suppliers and employees. Operating these information technology systems and networks and processing and maintaining this data in a secure manner, is critical to our business operations and strategy. Information technology security threats -- from user error to cybersecurity attacks designed to gain unauthorized access to our systems, networks and data -- are increasing in frequency and sophistication. Cybersecurity attacks from threat actors globally range from random attempts to coordinated and targeted attacks, including sophisticated computer crime and advanced persistent threats. These threats pose a risk to the security of our systems and networks and the confidentiality, availability and integrity of our data. Cybersecurity attacks could also include attacks targeting customer data or the security, integrity and/or reliability of the hardware and software installed in our products. It is possible that our information technology systems and networks, or those managed or provided by third parties, could have vulnerabilities, which could go unnoticed for a period of time. While various procedures and controls have been and are being utilized to mitigate such risks, there can be no guarantee that the actions and controls we have implemented and are implementing, or which we cause or have caused third-party service providers to implement, will be sufficient to protect and mitigate associated risks to our systems, information or other property.
We have experienced cybersecurity threats and vulnerabilities in our systems and those of our third party providers, and we have experienced viruses and attacks targeting our information technology systems and networks. Such prior events, to date, have not had a material impact on our financial condition, results of operations or liquidity. However, the potential consequences of a future material cybersecurity attack include reputational damage, litigation with third parties, government enforcement actions, penalties, disruption to systems, unauthorized release of confidential or otherwise protected information, corruption of data, diminution in the value of our investment in research, development and engineering, and increased cybersecurity protection and remediation costs, which in turn could adversely affect our competitiveness, results of operations and financial condition. Due to the evolving nature of such security threats, the potential impact of any future incident cannot be predicted. Further, the amount of insurance coverage we maintain may be inadequate to cover claims or liabilities relating to a cybersecurity attack.
In addition, data we collect, store and process are subject to a variety of U.S. and international laws and regulations, such as the European Union's General Data Protection Regulation and the California Consumer Privacy Act, which may carry significant potential penalties for noncompliance.
Our business is subject to the inventory management decisions and sourcing practices of our dealers and our OEM customers.
We sell finished products primarily through an independent dealer network and directly to OEMs and are subject to risks relating to their inventory management decisions and operational and sourcing practices. Both carry inventories of finished products as part of ongoing operations and adjust those inventories based on their assessments of future needs and market conditions, including levels of used equipment inventory and machine rental usage rates. Such adjustments may impact our results positively or negatively. If the inventory levels of our dealers and OEM customers are higher than they desire, they may postpone product purchases from us, which could cause our sales to be lower than the end-user demand for our products and negatively impact our results. Similarly, our results could be negatively impacted through the loss of time-sensitive sales if our dealers and OEM customers do not maintain inventory levels sufficient to meet customer demand.
We may not realize all of the anticipated benefits of our acquisitions, joint ventures or divestitures, or these benefits may take longer to realize than expected.
In pursuing our business strategy, we routinely evaluate targets and enter into agreements regarding possible acquisitions, divestitures and joint ventures. We often compete with others for the same opportunities. To be successful, we conduct due diligence to identify valuation issues and potential loss contingencies, negotiate transaction terms, complete complex transactions and manage post-closing matters such as the integration of acquired businesses. Further, while we seek to mitigate risks and liabilities of such transactions through due diligence, among other things, there may be risks and liabilities that our due diligence efforts fail to discover, that are not accurately or completely disclosed to us or that we inadequately assess. We may incur unanticipated costs or expenses following a completed acquisition, including post-closing asset impairment charges, expenses associated with eliminating duplicate facilities, litigation, and other liabilities. Risks associated with our past or future acquisitions also include the following:
•the failure to achieve the acquisition's revenue or profit forecast;
•the business culture of the acquired business may not match well with our culture;
•technological and product synergies, economies of scale and cost reductions may not occur as expected;
•unforeseen expenses, delays or conditions may be imposed upon the acquisition, including due to required regulatory approvals or consents;
•we may acquire or assume unexpected liabilities or be subject to unexpected penalties or other enforcement actions;
•faulty assumptions may be made regarding the macroeconomic environment or the integration process;
•unforeseen difficulties may arise in integrating operations, processes and systems;
•higher than expected investments may be required to implement necessary compliance processes and related systems, including information technology systems, accounting systems and internal controls over financial reporting;
•we may fail to retain, motivate and integrate key management and other employees of the acquired business;
•higher than expected costs may arise due to unforeseen changes in tax, trade, environmental, labor, safety, payroll or pension policies in any jurisdiction in which the acquired business conducts its operations; and
•we may experience problems in retaining customers and integrating customer bases.
Many of these factors will be outside of our control and any one of them could result in increased costs, decreases in the amount of expected revenues and diversion of management’s time and attention. They may also delay the realization of the benefits we anticipate when we enter into a transaction.
In order to conserve cash for operations, we may undertake acquisitions financed in part through public offerings or private placements of debt or equity securities, or other arrangements. Such acquisition financing could result in a decrease in our earnings and adversely affect other leverage measures. If we issue equity securities or equity-linked securities, the issued securities may have a dilutive effect on the interests of the holders of our common shares.
Failure to implement our acquisition strategy, including successfully integrating acquired businesses, could have an adverse effect on our business, financial condition and results of operations. Furthermore, we make strategic divestitures from time to time. In the case of divestitures, we may agree to indemnify acquiring parties for certain liabilities arising from our former businesses. These divestitures may also result in continued financial involvement in the divested businesses following the transaction, including through guarantees or other financial arrangements. Lower performance by those divested businesses could affect our future financial results.
Union disputes or other labor matters could adversely affect our operations and financial results.
Some of our employees are represented by labor unions in a number of countries under various collective bargaining agreements with varying durations and expiration dates. There can be no assurance that any current or future issues with our employees will be resolved or that we will not encounter future strikes, work stoppages or other disputes with labor unions or our employees. We may not be able to satisfactorily renegotiate collective bargaining agreements in the United States and other countries when they expire. If we fail to renegotiate our existing collective bargaining agreements, we could encounter strikes or work stoppages or other disputes with labor unions. In addition, existing collective bargaining agreements may not prevent a strike or work stoppage at our facilities in the future. We may also be subject to general country strikes or work stoppages unrelated to our business or collective bargaining agreements. A work stoppage or other limitations on production at our facilities for any reason could have an adverse effect on our business, results of operations and financial condition. In addition, many of our customers and suppliers have unionized work forces. Strikes or work stoppages experienced by our customers or suppliers could have an adverse effect on our business, results of operations and financial condition.
Unexpected events may increase our cost of doing business or disrupt our operations.
The occurrence of one or more unexpected events, including war, acts of terrorism or violence, civil unrest, fires, tornadoes, tsunamis, hurricanes, earthquakes, floods and other forms of severe weather in the United States or in other countries in which we operate or in which our suppliers are located could adversely affect our operations and financial performance. Natural disasters, pandemic illness, equipment failures, power outages or other unexpected events could result in physical damage to and complete or partial closure of one or more of our manufacturing facilities or distribution centers, temporary or long-term disruption in the supply of component products from some local and international suppliers, and disruption and delay in the transport of our products to dealers, end-users and distribution centers. Existing insurance coverage may not provide protection for all of the costs that may arise from such events.
FINANCIAL RISKS
Disruptions or volatility in global financial markets could limit our sources of liquidity, or the liquidity of our customers, dealers and suppliers.
Continuing to meet our cash requirements over the long-term requires substantial liquidity and access to varied sources of funds, including capital and credit markets. Global economic conditions may cause volatility and disruptions in capital and credit markets. Market volatility, changes in counterparty credit risk, the impact of government intervention in financial markets and general economic conditions may also adversely impact our ability to access capital and credit markets to fund operating needs. Global or regional economic downturns could cause financial markets to decrease the availability of liquidity, credit and credit capacity for certain issuers, including certain customers, dealers and suppliers. An inability to access capital and credit markets may have an adverse effect on our business, results of operations, financial condition and competitive position. Furthermore, changes in global economic conditions, including material cost increases and decreases in economic activity in key markets we serve, and the success of plans to manage cost increases, inventory and other important elements of our business may significantly impact our ability to generate funds from operations.
In addition, demand for our products generally depends on customers’ ability to pay for our products, which, in turn, depends on their access to funds. Changes in global economic conditions may result in customers experiencing increased difficulty in generating funds from operations. Capital and credit market volatility and uncertainty may cause financial institutions to revise their lending standards, resulting in customers’ decreased access to capital. If capital and credit market volatility occurs, customers’ liquidity may decline which, in turn, would reduce their ability to purchase our products.
Failure to maintain our credit ratings could increase our cost of borrowing and could adversely affect our cost of funds, liquidity, competitive position and access to capital markets.
Each of Caterpillar’s and Cat Financial’s costs of borrowing and their respective ability to access the capital markets are affected not only by market conditions but also by the short- and long-term credit ratings assigned to their respective debt by the major credit rating agencies. These ratings are based, in significant part, on each of Caterpillar’s and Cat Financial’s performance as measured by financial metrics such as net worth, profitability, interest coverage and leverage ratios, as well as transparency with rating agencies and timeliness of financial reporting. There can be no assurance that Caterpillar and Cat Financial will be able to maintain their credit ratings. We receive debt ratings from the major credit rating agencies. A downgrade of our credit rating by any of the major credit rating agencies could result in increased borrowing costs and could adversely affect Caterpillar’s and Cat Financial’s liquidity, competitive position and access to the capital markets, including restricting, in whole or in part, access to the commercial paper market. There can be no assurance that the commercial paper market will continue to be a reliable source of short-term financing for Cat Financial or an available source of short-term financing for Caterpillar. An inability to access the capital markets could have an adverse effect on our cash flow, results of operations and financial condition.
Our Financial Products segment is subject to risks associated with the financial services industry.
Cat Financial is significant to our operations and provides financing support for a significant share of our global sales. The inability of Cat Financial to access funds to support its financing activities to our customers could have an adverse effect on our business, results of operations and financial condition.
Continuing to meet Cat Financial's cash requirements over the long-term could require substantial liquidity and access to sources of funds, including capital and credit markets. Cat Financial has continued to maintain access to key global medium-term note and commercial paper markets, but there can be no assurance that such markets will continue to represent a reliable source of financing. If global economic conditions were to deteriorate, Cat Financial could face materially higher financing costs, become unable to access adequate funding to operate and grow its business and/or meet its debt service obligations as they mature.Cat Financial also could be required to draw upon contractually committed lending agreements and/or seek other funding sources.However, there can be no assurance that such agreements and other funding sources would be sufficient or even available under extreme market conditions. Any of these events could negatively impact Cat Financial’s business, as well as our and Cat Financial's results of operations and financial condition.
Market disruption and volatility may also lead to numerous risks in connection with these events, including but not limited to:
•Market developments that may affect customer confidence levels and cause declines in the demand for financing and adverse changes in payment patterns, causing increases in delinquencies and default rates, which could increase Cat Financial’s write-offs and provision for credit losses.
•The process Cat Financial uses to estimate losses inherent in its credit exposure requires a high degree of management’s judgment regarding numerous subjective qualitative factors, including forecasts of economic conditions and how economic predictors might impair the ability of its borrowers to repay their loans. Financial market disruption and volatility may impact the accuracy of these judgments.
•Cat Financial’s ability to engage in routine funding transactions or to borrow from other financial institutions on acceptable terms or at all could be adversely affected by disruptions in the capital markets or other events, including actions by rating agencies and deteriorating investor expectations.
•As Cat Financial’s borrowing agreements are primarily with financial institutions, their ability to perform in accordance with any of our underlying agreements could be adversely affected by market volatility and/or disruptions in financial markets.
Changes in interest rates or market liquidity conditions could adversely affect Cat Financial's and our earnings and/or cash flow.
Changes in interest rates and market liquidity conditions could have an adverse impact on Cat Financial's and our earnings and cash flows. Changes in market interest rates may influence its and our borrowing costs, returns on financial investments and the valuation of derivative contracts.Because a significant number of the loans made by Cat Financial are made utilizing fixed interest rates, its business results are subject to fluctuations in interest rates. Certain loans made by Cat Financial and various financing extended to Cat Financial are made at variable rates that use floating reference rates or indices, including the Secured Overnight Financing Rate, or SOFR, an index calculated by short-term repurchase agreements, backed by Treasury securities,as a benchmark for establishing the interest rate.
Together with Cat Financial we created a cross-functional team that assesses risk across multiple categories as it relates to the use of floating reference rates or indices, such as SOFR, in securities, loans, derivatives, and other financial obligations or extensions of credit held by or due to us. Cat Financial manages interest rate and market liquidity risks through a variety of techniques that include a match funding strategy, the selective use of derivatives and a broadly diversified funding program. There can be no assurance, however, that fluctuations in interest rates and market liquidity conditions will not have an adverse impact on its and our earnings and cash flows. If any of the variety of instruments and strategies Cat Financial uses to hedge its exposure to these types of risk is ineffective, this may have an adverse impact on our earnings and cash flows.With respect to Insurance Services' investment activities, changes in equity and bond markets could result in a decline in value of its investment portfolio, resulting in an unfavorable impact to earnings.
An increase in delinquencies, repossessions or net losses of Cat Financial customers could adversely affect its results.
Inherent in the operation of Cat Financial is the credit risk associated with its customers. The creditworthiness of each customer and the rate of delinquencies, repossessions and net losses on customer obligations are directly impacted by several factors, including relevant industry and economic conditions, the availability of capital, the experience and expertise of the customer's management team, commodity prices, political events and the sustained value of the underlying collateral. Any increase in delinquencies, repossessions and net losses on customer obligations could have a material adverse effect on Cat Financial's and our earnings and cash flows. Cat Financial evaluates and adjusts its allowance for credit losses related to past due and non-performing receivables on a regular basis. However, adverse economic conditions or other factors that might cause deterioration of the financial health of its customers could change the timing and level of payments received and necessitate an increase in Cat Financial's estimated losses, which could also have a material adverse effect on Cat Financial's and our earnings and cash flows.
Currency exchange rate fluctuations affect our results of operations.
We conduct operations in many countries involving transactions denominated in a variety of currencies. We are subject to currency-exchange rate risk to the extent that our costs are denominated in currencies other than those in which we earn revenues. Fluctuations in currency exchange rates have had, and will continue to have, an impact on our results as expressed in U.S. dollars. There can be no assurance that currency exchange rate fluctuations will not adversely affect our results of operations, financial condition and cash flows. While the use of currency hedging instruments may provide us with protection from adverse fluctuations in currency exchange rates, by utilizing these instruments we potentially forego the benefits that might result from favorable fluctuations in currency exchange rates. In addition, our outlooks do not assume fluctuations in currency exchange rates. Adverse fluctuations in currency exchange rates from the date of our outlooks could cause our actual results to differ materially from those anticipated in any outlooks and adversely impact our business, results of operations and financial condition.
We also face risks arising from the imposition of exchange controls and currency devaluations. Exchange controls may limit our ability to convert foreign currencies into U.S. dollars or to remit dividends and other payments by our foreign subsidiaries or businesses located in or conducted within a country imposing controls. Currency devaluations result in a diminished value of funds denominated in the currency of the country instituting the devaluation.
Restrictive covenants in our debt agreements could limit our financial and operating flexibility.
We maintain a number of credit facilities to support general corporate purposes (facilities) and have issued debt securities to manage liquidity and fund operations (debt securities). The agreements relating to a number of the facilities and the debt securities contain certain restrictive covenants applicable to us and certain subsidiaries, including Cat Financial. These covenants include maintaining a minimum consolidated net worth (defined as the consolidated shareholder’s equity including
preferred stock but excluding the pension and other post-retirement benefits balance within accumulated other comprehensive income (loss)), limitations on the incurrence of liens and certain restrictions on consolidation and merger. Cat Financial has also agreed under certain of these agreements not to exceed a certain leverage ratio (consolidated debt to consolidated net worth, calculated (1) on a monthly basis as the average of the leverage ratios determined on the last day of each of the six preceding calendar months and (2) at each December 31), to maintain a minimum interest coverage ratio (calculated as (1) profit excluding income taxes, interest expense and net gain (loss) from interest rate derivatives to (2) interest expense calculated at the end of each fiscal quarter for the prior four consecutive fiscal quarter period and not to terminate, amend or modify its support agreement with us.
A breach of one or more of the covenants could result in adverse consequences that could negatively impact our business, results of operations and financial condition. These consequences may include the acceleration of amounts outstanding under certain of the facilities, triggering of an obligation to redeem certain debt securities, termination of existing unused commitments by our lenders, refusal by our lenders to extend further credit under one or more of the facilities or to enter into new facilities or the lowering or modification of our credit ratings or those of one or more of our subsidiaries.
Sustained increases in funding obligations under our pension plans may impair our liquidity or financial condition.
We maintain certain defined benefit pension plans for our employees, which impose on us certain funding obligations. We use many assumptions in determining our future payment obligations under the plans. Significant adverse changes in credit or capital markets could result in actual rates of return on pension investments being materially lower than projected and result in increased contribution requirements. These factors could significantly increase our payment obligations under the plans, and as a result, adversely affect our business and overall financial condition.We may be required to make material contributions to our pension plans in the future and may fund contributions through the use of cash on hand, the proceeds of borrowings, shares of our common stock or a combination of the foregoing, as permitted by applicable law.
LEGAL & REGULATORY RISKS
Our global operations are subject to a wide-range of trade and anti-corruption laws and regulations.
Due to the international scope of our operations, we are subject to a complex system of import- and export-related laws and regulations. These include U.S. regulations issued by Customs and Border Protection, the Bureau of Industry and Security, the Office of Antiboycott Compliance, the Directorate of Defense Trade Controls and the Office of Foreign Assets Control, as well as the counterparts of these agencies in other countries. Any alleged or actual violations may subject us to increased government scrutiny, investigation and civil and criminal penalties, and may limit our ability to import or export our products or to provide services outside the United States. Furthermore, embargoes and sanctions imposed by the U.S. and other governments restricting or prohibiting sales to specific persons or countries or based on product classification may expose us to potential criminal and civil sanctions. We cannot predict the nature, scope or effect of future regulatory requirements to which our operations might be subject. We also cannot predict in certain locations the manner in which existing laws might be administered or interpreted.
In addition, the U.S. Foreign Corrupt Practices Act and similar foreign anti-corruption laws generally prohibit companies and their intermediaries from making improper payments or providing anything of value to improperly influence foreign government officials for the purpose of obtaining or retaining business or obtaining an unfair advantage. Recent years have seen a substantial increase in the global enforcement of anti-corruption laws. Our operations outside the United States, including in developing countries, expose us to the risk of such violations. Violations of anti-corruption laws or regulations by our employees, intermediaries acting on our behalf, or our joint venture partners may result in severe criminal or civil sanctions. Violations may also disrupt our business, and may result in an adverse effect on our reputation, business and results of operations or financial condition.
International trade policies may impact demand for our products and our competitive position.
Government policies on international trade and investment such as import quotas, capital controls or tariffs, whether adopted by individual governments or addressed by regional trade blocs, can affect the demand for our products and services, impact the competitive position of our products or prevent us from being able to sell products in certain countries. The implementation of more restrictive trade policies (such as more detailed inspections, higher tariffs or new barriers to entry) in countries where we sell large quantities of products and services could negatively impact our business, results of operations and financial condition. For example, a government’s adoption of “buy national” policies or retaliation by another government against such policies could have a negative impact on our results of operations.
We may incur additional tax expense or become subject to additional tax exposure.
We are subject to income taxes in the United States and numerous other jurisdictions. Our future results of operations could be adversely affected by changes in the effective tax rate as a result of a change in the mix of earnings between U.S. and non-U.S. jurisdictions or among jurisdictions with differing statutory tax rates. In addition, our future results of operations could also be adversely affected by changes in our overall profitability, changes in tax laws or treaties or in their application or interpretation, changes in tax rates, changes in generally accepted accounting principles, changes in the valuation of deferred tax assets and liabilities, changes in the amount of earnings indefinitely reinvested in certain non-U.S. jurisdictions, the results of audits and examinations of previously filed tax returns and continuing assessments of our tax exposures. We are also subject to the continuous examination of our income tax returns by the U.S. Internal Revenue Service and other tax authorities. We regularly assess the likelihood of an adverse outcome resulting from these examinations. If our effective tax rates were to increase, or if the ultimate determination of our taxes owed is for an amount in excess of amounts previously accrued, our operating results, cash flows and financial condition could be adversely affected. For information regarding additional legal matters related to our taxes, please see Note 6 — “Income taxes” and Note 22 — “Environmental and legal matters” of Part II, Item 8 “Financial Statements and Supplementary Data” to this Annual Report on Form 10-K.
Costs associated with lawsuits or investigations or adverse rulings in enforcement or other legal proceedings may have an adverse effect on our results of operations.
We are subject to a variety of legal proceedings and legal compliance risks in virtually every part of the world. We face risk of exposure to various types of claims, lawsuits and government investigations. We are involved in various claims and lawsuits related to product design, manufacture and performance liability (including claimed asbestos exposure), contracts, employment issues, environmental matters, intellectual property rights, tax, securities and other legal proceedings that arise in and outside of the ordinary course of our business. The industries in which we operate are also periodically reviewed or investigated by regulators, which could lead to enforcement actions, fines and penalties or the assertion of private litigation claims. It is not possible to predict with certainty the outcome of claims, investigations and lawsuits, and we could in the future incur judgments, fines or penalties or enter into settlements of lawsuits and claims that could have an adverse effect on our reputation, business, results of operations or financial condition in any particular period.
The global and diverse nature of our operations means that legal and compliance risks will continue to exist and additional legal proceedings and other contingencies, the outcome of which cannot be predicted with certainty, may arise from time to time. In addition, subsequent developments in legal proceedings may affect our assessment and estimates of loss contingencies recorded as a reserve and require us to make payments in excess of our reserves. Such payments could have an adverse effect on our reputation, business and results of operations or financial condition.
New regulations or changes in financial services regulation could adversely impact Caterpillar and Cat Financial.
Cat Financial’s operations are highly regulated by governmental authorities in the locations where it operates, which can impose significant additional costs and/or restrictions on its business. In the United States, for example, certain Cat Financial activities are subject to the U.S. Dodd-Frank Wall Street Reform and Consumer Protection Act (Dodd-Frank), which includes extensive provisions regulating the financial services industry. As a result, Cat Financial has become and could continue to become subject to additional regulatory costs that could be significantand have an adverse effect on Cat Financial’s and our results of operations and financial condition. Changes in regulations or additional regulations in the United States or internationally impacting the financial services industry could also add significant cost or operational constraints that might have an adverse effect on Cat Financial’s and our results of operations and financial condition.
We are subject to stringent environmental laws and regulations that impose significant compliance costs.
Our facilities, operations and products are subject to increasingly stringent environmental laws and regulations globally, including laws and regulations governing emissions to noise, air, releases to soil and discharges to water and the generation, handling, storage, transportation, treatment and disposal of non-hazardous and hazardous waste materials. Some environmental laws impose strict, retroactive and joint and several liability for the remediation of the release of hazardous substances, even for conduct that was lawful at the time it occurred, or for the conduct of, or conditions caused by, prior operators, predecessors or other third parties. Failure to comply with environmental laws could expose us to penalties or clean-up costs, civil or criminal liability and sanctions on certain of our activities, as well as damage to property or natural resources. The potential liabilities, sanctions, damages and remediation efforts related to any non-compliance with such laws and regulations could negatively impact our ability to conduct our operations and our financial condition and results of operations. In addition, there can be no assurances that we will not be adversely affected by costs, liabilities or claims with respect to existing or subsequently acquired operations or under present laws and regulations or those that may be adopted or imposed in the future.
Environmental laws and regulations may change from time to time, as may related interpretations and other guidance. Changes in environmental laws or regulations could result in higher expenses and payments. Uncertainty relating to environmental laws or regulations may also affect how we conduct our operations and structure our investments and could limit our ability to enforce our rights. Changes in environmental and climate change laws or regulations, including laws relating to greenhouse gas emissions, could lead to new or additional investment in product designs and could increase environmental compliance expenditures. Changes in climate change concerns, or in the regulation of such concerns, including greenhouse gas emissions, could subject us to additional costs and restrictions, including increased energy and raw materials costs. If environmental laws or regulations are either changed or adopted and impose significant operational restrictions and compliance requirements upon us or our products, they could negatively impact our reputation, business, capital expenditures, results of operations, financial condition and competitive position.
The Company’s amended and restated bylaws provide that the Court of Chancery of the State of Delaware will be the exclusive forum for certain legal actions between the Company and its shareholders, which could discourage claims or limit the ability of the Company’s shareholders to bring a claim in a judicial forum viewed by the shareholders as more favorable for disputes with the Company or the Company’s directors, officers or other employees.
The Company’s amended and restated bylaws provide to the fullest extent permitted by law that unless the Company consents in writing to the selection of an alternative forum, the Court of Chancery of the State of Delaware will be the sole and exclusive forum for (i) any derivative action or proceeding brought on behalf of the Company, (ii) any action asserting a claim of breach of fiduciary duty owed by any director, officer or other employee of the Company to the Company or the Company’s shareholders, (iii) any action asserting a claim against the Company or any director or officer or other employee of the Company arising pursuant to any provision of the Delaware General Corporation Law or the Company’s certificate of incorporation or bylaws (as either may be amended from time to time) or (iv) any action asserting a claim against the Company or any director or officer or other employee of the Company governed by the internal affairs doctrine.
The exclusive forum provisions in our bylaws could limit our shareholders’ ability to bring a claim in a judicial forum that it finds favorable for disputes with the Company or its directors, officers or other employees. Alternatively, if a court were to find the choice of forum provision contained in the Company’s amended and restated bylaws to be inapplicable or unenforceable in an action, the Company may incur additional costs associated with resolving such action in other jurisdictions. The exclusive forum provision in the Company’s amended and restated bylaws will not preclude or contract the scope of exclusive federal or concurrent jurisdiction for actions brought under the federal securities laws including the Securities Exchange Act of 1934, as amended, or the Securities Act of 1933, as amended, or the respective rules and regulations promulgated thereunder.
Item 1B.Unresolved Staff Comments.
None.
Item 1C. Cybersecurity
As required by Item 106 of Regulation S-K, the following sets forth information regarding our cybersecurity strategy, risk management and governance.
Cybersecurity Strategy and Risk Management
Cybersecurity is critical to advancing our overall objectives and enabling our digital efforts. As a global company, we face a wide variety of cybersecurity threats that range from common attacks such as ransomware and denial-of-service, to attacks from more advanced adversaries. Our customers, suppliers, and other partners face similar cybersecurity threats, and a cybersecurity incident impacting these entities could materially adversely affect our operations, performance and results. These cybersecurity threats and related risks make it imperative that we maintain focus on cybersecurity and systemic risks.
We maintain a comprehensive cybersecurity program which is integrated within the Company’s enterprise risk management system and encompasses the corporate information technology and operational technology environments as well as customer-facing products. Our cybersecurity program has implemented a governance structure and process to identify, assess, manage, mitigate, respond to and report on cybersecurity risks. We utilize cybersecurity policies and frameworks based on industry and government standards. Our cyber risk management program controls are based on recognized best practices and standards, including the National Institute of Standards and Technology (NIST) Cyber Security Framework and the International Organization for Standardization (ISO 27001) Information Security Management System Requirements. We partner with third parties to support and evaluate our cybersecurity program. These third-party services span areas including cybersecurity maturity assessments, incident response, penetration testing, consulting on best practices, and others. We also consume threat intelligence from several paid and non-paid sources.
We maintain a 24 x 7 operations center which serves as a central location for the reporting of cybersecurity matters, provides monitoring of our global cybersecurity environment, and coordinates the investigation and remediation of alerts. As cybersecurity events occur, the cybersecurity team focuses on responding to and containing the threat and minimizing impact. In the event of an incident, the cybersecurity team assesses, among other factors, safety impact, supply chain and manufacturing disruption, data and personal information loss, business operations disruption, projected cost and potential for reputational harm, with participation from technical, legal and law enforcement support, as appropriate.
We have implemented a cybersecurity awareness program which covers topics such as phishing, social networking safety, password security and mobile device usage. We have mandatory training in the areas of cybersecurity, privacy, and confidential information handling. We also conduct regular phishing training and simulations for our employees and contractors. We provide extensive specialized role-based training to technical professionals in cybersecurity, secure application development, and other focus areas. We also conduct periodic tabletop exercises to validate our preparation for cyber events.
We operate a third-party cybersecurity program with the goal of minimizing disruption to the Company’s business and production operations, strengthening supply chain resilience, and supporting the integrity of components and systems used in its products and services. We rely heavily on our supply chain to deliver our products and services to our customers, and a cybersecurity incident at a supplier, subcontractor or joint venture partner could materially adversely impact us. We assess third-party cybersecurity controls through a cybersecurity third-party risk assessment process. Identified deficiencies are addressed through a risk remediation process. For select suppliers, we engage third-party cybersecurity monitoring and alerting services, and seek to work directly with those suppliers to address potential deficiencies identified.
As of the date of this report, we do not believe that risks from any cybersecurity threats, including as a result of any previous cybersecurity incidents, have materially affected or are reasonably likely to affect us, including our business strategy, results of operations or financial condition. That said, as discussed more fully under Item 1A. “Risk Factors—Operational Risks— Increased information technology security threats and more sophisticated computer crime pose a risk to our systems, networks, products and services” of this Form 10-K, these threats pose a risk to the security of our systems and networks and the confidentiality, availability and integrity of our data. Cybersecurity attacks could also include attacks targeting customer data or the security, integrity and/or reliability of the hardware and software installed in our products. It is possible that our information technology systems and networks, or those managed or provided by third parties, could have vulnerabilities, which could go unnoticed for a period of time. While various procedures and controls have been and are being utilized to mitigate such risks, there can be no guarantee that the actions and controls we have implemented and are implementing, or which we cause or have caused third-party service providers to implement, will be sufficient to protect and mitigate associated risks to our systems, information or other property.
Cybersecurity Governance
Caterpillar’s board has oversight for risk management with a focus on the most significant risks facing the Company, including strategic, operational, financial and legal compliance risks. The board’s risk oversight process builds upon management’s risk assessment and mitigation processes, which include an enterprise risk management program of which our cybersecurity processes are an integral component.
The board implements its risk oversight function both as a board and through delegation to board committees, which meet regularly and report back to the board. The board has delegated the oversight of specific risks to board committees that align with their functional responsibilities. The Audit Committee (the “AC”) assists the board in overseeing the enterprise risk management program and evaluates and monitors risks related to, among other things, the Company’s information security program. The AC assesses cybersecurity and information technology risks and the controls implemented to monitor and mitigate these risks. The Company’s Chief Information Officer & Senior Vice President, Caterpillar IT (the “CIO”) attends all bimonthly AC meetings and provides cybersecurity updates to the AC and board.
Our cybersecurity program is overseen by our CIO, who has been a Caterpillar employee for nearly twenty-five years. Prior to her current appointment as our CIO in September 2020, she was the Chief Information Officer for the Company’s Financial Products Division. Her extensive background in IT includes global leadership for large-scale systems transformations, cybersecurity, cloud and application management, global data center management, worldwide network, servers and storage, database management and end-user services. Our CIO leads a cross-functional cybersecurity team comprised of professionals from our product, cybersecurity, legal and compliance organizations who focus on managing the security of our connected solutions. This team manages the Company’s global IT systems, IT risk management, cybersecurity, global infrastructure and IT transformations.
Item 1D.Executive Officers of the Registrant.
| | | | | | | | | | | | | | |
| Name and age | | Present Caterpillar Inc. position
and date of initial election | | Principal positions held during the
past five years if other than
Caterpillar Inc. position currently held |
| D. James Umpleby III (65) | | Chairman of the Board (2018) and Chief Executive Officer (2017) | | Group President (2013-2016) |
| Andrew R.J. Bonfield (61) | | Chief Financial Officer (2018) | | Group Chief Financial Officer for a multinational electricity and gas utility company (2010-2018) |
| Bob De Lange (54) | | Group President (2017) | | Vice President (2015-2016), Worldwide Product Manager, Medium Wheel Loaders, (2013-2014) |
| Denise C. Johnson (57) | | Group President (2016) | | Vice President (2012-2016) |
| Joseph E. Creed (48) | | Chief Operating Officer (2023) | | Group President (2021-2023), Vice President, Oil & Gas and Marine Division (2019-2020), Interim Chief Financial Officer (2018), Vice President, Finance Services Division (2017), Group Chief Financial Officer, Energy and Transportation (2013-2016) |
| Anthony D. Fassino (53) | | Group President (2021) | | Vice President, Building Construction Products (2018-2020), Director of Worldwide Forestry Products (2016-2018) |
| Derek R. Owens (50) | | Chief Legal Officer and General Counsel (2023) | | Senior Vice President (2023), Deputy General Counsel (2021-2023), Associate General Counsel, Litigation & Investigations (2019-2021), Assistant United States Attorney, U.S. Attorney's Office of the Department of Justice (2005-2019) |
| Cheryl H. Johnson (63) | | Chief Human Resources Officer (2017) | | Executive Vice President of Human Resources for a global multi-industry aerospace, defense and industrial manufacturing company (2012-2017) |
| William E. Schaupp (52) | | Vice President and Chief Accounting Officer (2022) | | Finance Director, Global Finance Services Division (2021-2022) Vice President and Controller and Chief Accounting Officer of PPG Industries, Inc. (2018-2021) |
| Jason E. Kaiser (45) | | Group President (2024) | | Senior Vice President, Electric Power Division (2021-2023), General Manager, Electric Power Division (2019-2021), Product Manager, Electric Power Division (2016-2019) |
Item 2.Properties.
General Information
Caterpillar’s operations are highly integrated. Although the majority of our plants are involved primarily in production relating to our Construction Industries, Resource Industries or Energy & Transportation segments, several plants are involved in manufacturing relating to more than one business segment. In addition, several plants reported in our financial statements under the All Other segment are involved in the manufacturing of components that are used in the assembly of products for more than one business segment. Caterpillar’s parts distribution centers are involved in the storage and distribution of parts for Construction Industries, Resource Industries and Energy & Transportation. The research and development activities carried on at our Technical Centers in Aurora and Mossville, Illinois involve products for Construction Industries, Resource Industries and Energy & Transportation.
We believe the properties we own to be generally well maintained and adequate for present use. Through planned capital expenditures, we expect these properties to remain adequate for future needs. Properties we lease are covered by leases expiring over terms of generally one to ten years. We do not anticipate any difficulty in retaining occupancy of any leased facilities, either by renewing leases prior to expiration or by replacing them with equivalent leased facilities.
Headquarters and Other Key Offices
Our corporate headquarters is in a leased office located in Irving, Texas. Our Financial Products business is headquartered in offices in Nashville, Tennessee. Additional key offices are located inside and outside the United States.
Technical Center, Training Centers, Demonstration Areas and Proving Grounds
We operate Technical Centers located in Aurora and Mossville, Illinois; Wuxi, China; and Chennai, India. Our demonstration centers are located in Tinaja Hills, Arizona; Edwards, Illinois; Chichibu, Japan and Malaga, Spain. We have various other technical and training centers, demonstration areas and proving grounds located both inside and outside the United States.
Parts Distribution Centers
Distribution of our parts is conducted from parts distribution centers inside and outside the United States. We operate parts distribution centers in the following locations: Arvin, California; Denver, Colorado; Miami, Florida; Atlanta, Georgia; Morton, Illinois; St. Paul, Minnesota; Clayton, Ohio; York, Pennsylvania; Waco, Texas; Spokane, Washington; Melbourne, Australia; Queensland, Australia; Grimbergen, Belgium; Piracicaba, Brazil; Shanghai, China; Sagami, Japan; San Luis Potosi, Mexico; Singapore, Republic of Singapore; Moscow, Russia; Johannesburg, South Africa; and Dubai, United Arab Emirates. We also own or lease other facilities that support our distribution activities.
Remanufacturing and Components
Remanufacturing of our products is reported in our Energy & Transportation segment and is conducted primarily at the facilities in the following locations: Franklin, Indiana; Bogor, Indonesia; Corinth, Mississippi; Prentiss County, Mississippi; West Fargo, North Dakota; Piracicaba, Brazil; Shanghai, China; and Nuevo Laredo, Mexico.
Component manufacturing is reported in the All Other segment and is conducted primarily at facilities in the following locations: East Peoria, Illinois; Mapleton, Illinois; Peoria, Illinois; Bogor, Indonesia; Menominee, Michigan; Boonville, Missouri; West Plains, Missouri; Goldsboro, North Carolina; Sumter, South Carolina; Tianjin, China; Xuzhou, China; Atessa, Italy; Bazzano, Italy; Frosinone, Italy; San Eusebio, Italy; Ramos Arizpe, Mexico; Pyeongtaek, South Korea; and Skinningrove, United Kingdom.
We also lease or own other facilities that support our remanufacturing and component manufacturing activities.
Manufacturing
Manufacturing of products for our Construction Industries, Resource Industries and Energy & Transportation segments is conducted primarily at the locations listed below. These facilities are believed to be suitable for their intended purposes, with adequate capacities for current and projected needs for existing products.
Our principal manufacturing facilities include those used by the following segments in the following locations:
| | | | | | | | | | | | | | |
| Segment | | U.S. Facilities | | Facilities Outside the U.S. |
| | | | |
| Construction Industries | | Arkansas: North Little Rock | | Brazil: Campo Largo, Piracicaba |
| | Georgia: Athens | | China: Suzhou, Wujiang, Xuzhou, Qingzhou |
| | Illinois: Decatur, East Peoria | | France: Grenoble, Echirolles |
| | Kansas: Wamego | | Hungary: Godollo |
| | Minnesota: Brooklyn Park | | India: Hosur, Thiruvallur |
| | North Carolina: Clayton, Sanford | | Italy: Minerbio, Cattolica |
| | Texas: Victoria | | Japan: Akashi |
| | | | Mexico: Torreon |
| | | | Netherlands: Den Bosch |
| | | | Poland: Janow, Sosnowiec |
| | | | Thailand: Rayong |
| | | | United Kingdom: Desford, Stockton |
| | | | |
| | | | |
| | | | |
| Resource Industries | | Illinois: Decatur, East Peoria | | China: Qingzhou, Wuxi |
| | South Carolina: Sumter | | Germany: Lunen |
| | Texas: Denison | | India: Thiruvallur |
| | Wisconsin: South Milwaukee | | Indonesia: Batam |
| | | | Mexico: Acuna, Monterrey, Reynosa |
| | | | Thailand: Rayong |
| | | | United Kingdom: Peterlee |
| | | | |
| | | | |
| Energy & Transportation | | Alabama: Albertville, Montgomery | | Australia: Cardiff, Perth, Redbank, Revesby |
| | California: San Diego | | Brazil: Curitiba, Hortolandia, Piracicaba, Sete Lagoas |
| | Georgia: Griffin, Patterson | | China: Tianjin, Wuxi |
| | Illinois: East Peoria,Mossville, Mapleton, Pontiac | | Czech Republic: Zatec, Zebrak |
| | Indiana: Lafayette, Muncie | | Germany: Kiel, Mannheim, Rostock |
| | Kentucky: Decoursey, Mayfield | | India: Aurangabad, Hosur |
| | Oklahoma: Broken Arrow | | Italy: Pistoria |
| | North Carolina: Winston-Salem | | Mexico: San Luis Potosi, Tijuana |
| | Texas: Channelview, DeSoto, Fort Worth, Mabank, San Antonio, Schertz, Seguin, Sherman | | United Kingdom: Larne, Peterborough, Sandiacre, South Queensferry, Springvale, Stafford, Wimborne |
| | | | |
Item 3.Legal Proceedings.
Certain legal proceedings in which we are involved are discussed in Note 22 — "Environmental and legal matters" of Part II, Item 8 "Financial Statements and Supplementary Data" and should be considered an integral part of Part I, Item 3 "Legal Proceedings", which is hereby incorporated by reference.
Item 4.Mine Safety Disclosures.
Not applicable.
PART II
Item 5.Market for Registrant’s Common Equity, Related Stockholder Matters and Issuer Purchases of Equity Securities.
Common Stock (NYSE: CAT)
Listing Information: Caterpillar common stock is listed on the New York Stock Exchange in the United States, and on stock exchanges in France and Switzerland.
Number of Shareholders: Shareholders of record at the end of 2023 totaled 21,217, compared with 21,935 at the end of 2022.
Performance Graph: Total Cumulative Shareholder Return for Five-Year Period Ending December 31, 2023
The graph below shows the cumulative shareholder return assuming an investment of $100 on December 31, 2018, and reinvestment of dividends issued thereafter.
| | | | | | | | | | | | | | | | | | | | | | | | | | | | | | | | | | | | | | |
| | | 2018 | | 2019 | | 2020 | | 2021 | | 2022 | | 2023 |
| Caterpillar Inc. | | $ | 100.00 | | | $ | 119.51 | | | $ | 151.74 | | | $ | 175.95 | | | $ | 208.67 | | | $ | 262.82 | |
| S&P 500 | | $ | 100.00 | | | $ | 131.49 | | | $ | 155.68 | | | $ | 200.37 | | | $ | 164.08 | | | $ | 207.21 | |
| S&P 500 Machinery | | $ | 100.00 | | | $ | 130.29 | | | $ | 160.81 | | | $ | 193.23 | | | $ | 195.93 | | | $ | 235.49 | |
Non-U.S. Employee Stock Purchase Plans
As of December 31, 2023, we had 28 employee stock purchase plans (the “EIP Plans”) administered outside the United States for our non-U.S. employees, which had approximately 14,000 active participants in the aggregate. During the fourth quarter of 2023, approximately 78,000 shares of Caterpillar common stock were purchased by the EIP Plans pursuant to the terms of such plans.
Issuer Purchases of Equity Securities
| | | | | | | | | | | | | | | | | | | | | | | | | | |
| Period | | Total Number
of Shares
Purchased | | Average Price Paid per Share | | Total Number
of Shares Purchased
as Part of Publicly Announced Program | | Approximate Dollar Value of Shares that May Yet be Purchased under the Program (in billions)1 |
| October 1-31, 2023 | | 965,566 | | | $ | 260.01 | | | 965,566 | | | $ | 10.340 | |
| November 1-30, 2023 | | 7,250,965 | | | $ | 239.97 | | | 7,250,965 | | 2 | $ | 8.300 | |
| December 1-31, 2023 | | 1,749,834 | | | $ | 271.45 | | | 1,749,834 | | | $ | 7.825 | |
| Total | | 9,966,365 | | | $ | 247.44 | | | 9,966,365 | | | |
| | | | | | | | |
1 In May 2022, the Board approved a share repurchase authorization (the 2022 Authorization) of up to $15.0 billion of Caterpillar common stock effective August 1, 2022, with no expiration. As of December 31, 2023, approximately $7.8 billion remained available under the 2022 Authorization. |
2 Includes shares acquired pursuant to the accelerated share repurchase agreement entered into during the fourth quarter of 2023. |
| | | | | | | | |
Item 6.[Reserved]
Item 7.Management’s Discussion and Analysis of Financial Condition and Results of Operations.
The following Management’s Discussion and Analysis of Financial Condition and Results of Operations (MD&A) is intended to provide information that will assist the reader in understanding the company’s Consolidated Financial Statements, the changes in certain key items in those financial statements between select periods and the primary factors that accounted for those changes. In addition, we discuss how certain accounting principles, policies and critical estimates affect our Consolidated Financial Statements. Our discussion also contains certain forward-looking statements related to future events and expectations. This MD&A should be read in conjunction with our discussion of cautionary statements and significant risks to the company’s business under Item 1A. Risk Factors of the 2023 Form 10-K.
Highlights for the full-year 2023 include:
•Sales and revenues for 2023 were $67.060 billion, an increase of $7.633 billion, or 13 percent, compared with $59.427 billion for 2022. Sales were higher across the three primary segments.
•Operating profit as a percent of sales and revenues was 19.3 percent in 2023, compared with 13.3 percent in 2022. Adjusted operating profit margin was 20.5 percent in 2023, compared with 15.4 percent in 2022.
•Profit per share for 2023 was $20.12, and excluding the items in the table below, adjusted profit per share was $21.21. Profit per share for 2022 was $12.64, and excluding the items in the table below, adjusted profit per share was $13.84.
•In order for our results to be more meaningful to our readers, we have separately quantified the impact of several significant items. A detailed reconciliation of GAAP to non-GAAP financial measures is included on page 47.
| | | | | | | | | | | | | | | | | | | | |
| | | | | | |
| | Full Year 2023 | | Full Year 2022 |
| (Dollars in millions except per share data) | | Profit Before Taxes | Profit
Per Share | | Profit Before Taxes | Profit
Per Share |
| Profit | | $ | 13,050 | | $ | 20.12 | | | $ | 8,752 | | $ | 12.64 | |
Restructuring costs - Longwall divestiture | | 586 | | 1.14 | | | — | | — | |
Other restructuring costs | | 194 | | 0.30 | | | 299 | | 0.43 | |
| Mark-to-market (gains) losses | | (97) | | (0.14) | | | (606) | | (0.91) | |
| Deferred tax valuation allowance adjustments | | — | | (0.21) | | | — | | — | |
| Goodwill impairment | | — | | — | | | 925 | | 1.68 | |
| Adjusted profit | | $ | 13,733 | | $ | 21.21 | | | $ | 9,370 | | $ | 13.84 | |
| | | | | | |
•Enterprise operating cash flow was $12.9 billion in 2023. Caterpillar ended 2023 with $7.0 billion of enterprise cash.
OVERVIEW
Total sales and revenues for 2023 were $67.060 billion, an increase of $7.633 billion, or 13 percent, compared with $59.427 billion for 2022. The increase was primarily due to favorable price realization and higher sales volume. Profit per share was $20.12 in 2023, compared with profit per share of $12.64 in 2022. Profit was $10.335 billion in 2023, compared with $6.705 billion in 2022. The increase was primarily due to favorable price realization, higher sales volume and the absence of a 2022 goodwill impairment charge related to the Rail division, partially offset by higher selling, general and administrative (SG&A) and research and development (R&D) expenses, unfavorable manufacturing costs, the impact of the divestiture of the company's Longwall business and lower mark-to-market gains for remeasurement of pension and other postemployment benefit (OPEB) plans.
Trends and Economic Conditions
Outlook for Key End Markets
Overall demand remains healthy across most of our end markets for our products and services.
In Construction Industries, we expect North America to remain healthy in 2024. We expect non-residential construction in North America to remain at similar demand levels as 2023 due to government-related infrastructure investments. Residential construction is expected to remain healthy relative to historical levels. In Asia Pacific, excluding China, we expect some softening in economic conditions. We anticipate China will remain at a relatively low level in the excavator industry above 10-tons. In EAME, we anticipate the region will be slightly down due to economic uncertainty in Europe, partially offset by continuing strong construction demand in the Middle East. Construction activity in Latin America is expected to increase due to easing financial conditions. In addition, we anticipate the ongoing benefit of our services initiatives will positively impact Construction Industries in 2024.
In Resource Industries, in 2024, for both mining and heavy construction and quarry and aggregates, we anticipate lower sales volume compared to 2023, primarily due to off-highway and articulated trucks. While we continue to see a high level of quoting activity overall, we anticipate lower order rates as customers display capital discipline. Customer product utilization remains high, the number of parked trucks remains low, the age of the fleet remains elevated and our autonomous solutions continue to have strong customer acceptance. We expect higher services revenues, including robust rebuild activity in 2024. We continue to believe the energy transition will support increased commodity demand over time, expanding our total addressable market and providing further opportunities for long-term profitable growth.
In Energy & Transportation, in Oil & Gas, we expect reciprocating engines and services to increase slightly in 2024 compared to 2023. Well servicing in North America is showing some short-term moderation. Gas compression order backlog remains healthy and we continue to remain optimistic about future demand. Power Generation reciprocating engine demand is expected to remain strong due to continued data center growth. Solar Turbines has a strong backlog and continues to experience robust quoting activity. Industrial demand is expected to soften from a strong 2023. In Transportation, we anticipate high-speed marine to increase slightly as customers continue to upgrade aging fleets.
Company Trends and Expectations
For the full-year 2024, we anticipate sales and revenues will be broadly similar to 2023, supported by continued healthy underlying demand across most of our end markets for our products and services and slightly favorable price realization. We anticipate another year of services growth in 2024. We do not expect a significant change in machine dealer inventories in 2024, compared to an increase in 2023. In Construction Industries, sales of equipment to end users is expected to be broadly similar to 2023. In Construction Industries, we do not expect dealer inventory to increase in 2024 as it did in 2023. We also anticipate services initiatives will benefit the segment. Resource Industries' sales in 2024 are expected to be lower, driven by lower sales volume primarily in off-highway and articulated trucks. We also expect an unfavorable impact from changes in dealer inventories in Resource Industries. In 2024, we expect services revenues will increase in Resource Industries. Within Energy & Transportation in 2024, we expect slightly higher sales. Power Generation, Oil & Gas and Transportation sales are expected to increase. Industrial sales are expected to be lower compared to historically strong levels in 2023.
In 2024, we expect a small benefit from price realization during the first half of the year from price actions taken in the second half of 2023. We expect price realization to modestly exceed manufacturing costs, with moderation throughout the year as we lap favorable price trends from 2023. For 2024, we expect short-term incentive compensation expense to be about $1.2 billion, compared to $1.7 billion in 2023. We expect the short-term incentive compensation expense benefit year over year to be offset by increases in SG&A/R&D expenses as we continue to invest in strategic initiatives aimed at future long-term profitable growth, such as services growth and technology, including autonomy, alternative fuels, connectivity and digital and electrification. In addition, we anticipate an impact due to an unfavorable mix of products. In 2024, we expect restructuring costs to be between $300 million and $450 million and expect capital expenditures to be in the range of $2.0 billion to $2.5 billion. We expect the global annual effective tax rate, excluding discrete items, to be between 22.5 percent and 23.5 percent.
In the first quarter of 2024, we expect sales and revenues to be broadly similar to the first quarter of 2023. We expect demand to remain healthy, but anticipate slightly lower machine dealer inventory build as compared to the first quarter of 2023. We anticipate price realization will remain favorable. We expect Construction Industries' sales to remain flat to slightly higher, including favorable price realization. Resource Industries' sales are expected to be lower driven by lower sales volume, partially offset by favorable price realization. In Energy & Transportation, we expect sales to be flat to slightly higher.
In the first quarter of 2024, we expect favorable price realization to more than offset unfavorable manufacturing costs. We expect manufacturing costs to increase primarily due to cost absorption. We do not expect an inventory increase as compared to the increase in the first quarter of 2023. We also anticipate an increase in SG&A/R&D expenses due to investment in strategic initiatives. In Construction Industries, we expect favorable price realization to be offset by increased SG&A/R&D expenses and slightly higher manufacturing costs, including cost absorption. In Resource Industries, we expect the profit impact from lower sales volume to be partially offset by favorable price realization. In Energy & Transportation, we anticipate favorable price realization to be offset by higher manufacturing costs.
Global Business Conditions
We continue to monitor a variety of external factors around the world, such as supply chain disruptions, inflationary cost and labor pressures. Areas of particular focus include transportation, certain components and raw materials. We continue to work to minimize supply chain challenges that may impact our ability to meet customer demand. We continue to assess the environment to determine if additional actions need to be taken.
Risk Factors
Risk factors are disclosed within Item 1A. Risk Factors of the 2023 Form 10-K.
Notes:
•Glossary of terms included on pages 35-37; first occurrence of terms shown in bold italics.
•Information on non-GAAP financial measures is included on page 47.
•Some amounts within this report are rounded to the millions or billions and may not add. In addition, the sum of the components reported across periods may not equal the total amount reported year-to-date due to rounding.
2023 COMPARED WITH 2022
CONSOLIDATED OPERATING PROFITSALES AND REVENUES
The chart above graphically illustrates reasons for the change in consolidated operating profitsales and revenues between 20202022 (at left) and 20212023 (at right). Caterpillar management utilizes these charts internally to visually communicate with the company’s Boardboard of Directorsdirectors and employees. The bar entitled Other includes consolidating adjustments
Total sales and Machinery, Energy & Transportation other operating (income) expenses.
Operating profit was $6.878revenues for 2023 were $67.060 billion, in 2021, an increase of $2.325$7.633 billion, or 5113 percent, compared with $4.553$59.427 billion in 2020.2022. The increase was primarily due to higher sales volume, favorable price realization and higher profitsales volume. The increase in sales volume was driven by higher sales of equipment to end users, partially offset by the impact from Financial Productschanges in dealer inventories. Dealer inventory increased about $2.4 billion during 2022, compared to an increase of about $2.1 billion during 2023.
Sales were higher in the three primary segments.
North America sales increased 25 percent driven by higher sales of equipment to end users, favorable price realization and the impact from changes in dealer inventories. Dealer inventory increased more during 2023 than during 2022.
Sales decreased 2 percent in Latin America due to the impact from changes in dealer inventories and lower restructuring expenses (includedservices sales volume, partially offset by favorable price realization and favorable currency impacts primarily related to the Brazilian real. Dealer inventory increased during 2022, compared to a decrease during 2023.
EAME sales increased 6 percent due to favorable price realization and higher sales of equipment to end users, partially offset by the impact from changes in other),dealer inventories. Dealer inventory increased more during 2022 than during 2023.
Asia/Pacific sales increased 2 percent driven by favorable price realization, partially offset by unfavorable manufacturing costscurrency impacts, primarily related to the Australian dollar and higher SG&A/R&D expenses.
Unfavorable manufacturing costs reflected increased freightJapanese yen, lower sales of equipment to end users and higher material costs. In addition, unfavorable period manufacturing costs were driven by higher short-term incentive compensation expense, which was reinstatedthe impact from changes in 2021, and higher labor costs. Unfavorable period manufacturing costs were mostly offset by favorable cost absorption and lower warranty expense. Cost absorption was favorable asdealer inventories. Dealer inventory increased more during 20212022 than during 2020.2023.
Higher SG&A/R&D expenses reflected higher short-term incentive compensation expense and investments aligned with the company's strategy for profitable growth, including higher labor costs and acquisition-related expenses.
Short-term incentive compensation expense, which was reinstated in 2021, was $1.3Dealer inventory increased about $2.1 billion in 2021,during 2023, compared to no short-term incentive compensation expense recognizedan increase of about $2.4 billion during 2022. Dealers are independent, and the reasons for changes in 2020. Short-term incentive compensation expense is directly related to financialtheir inventory levels vary, including their expectations of future demand and operational performance, measured against targets set annually. For 2022, weproduct delivery times. Dealers’ demand expectations take into account seasonal changes, macroeconomic conditions, machine rental rates and other factors. Delivery times can vary based on availability of product from Caterpillar factories and product distribution centers. We do not expect short-term incentive compensation expense will be about $1.0 billion.
Operating profit margin was 13.5 percenta significant change in 2021, compared with 10.9 percentmachine dealer inventories in 2020.
| | | | | | | | | | | | | | | | | | | | | | | | | | |
| Profit (Loss) by Segment | | | | | | | | |
| (Millions of dollars) | | 2021 | | 2020 | | $
Change | | %
Change |
| Construction Industries | | $ | 3,706 | | | $ | 2,373 | | | $ | 1,333 | | | 56 | % |
| Resource Industries | | 1,291 | | | 896 | | | 395 | | | 44 | % |
| Energy & Transportation | | 2,768 | | | 2,405 | | | 363 | | | 15 | % |
| All Other Segment | | (14) | | | 28 | | | (42) | | | n/a |
| Corporate Items and Eliminations | | (1,388) | | | (1,381) | | | (7) | | | |
| Machinery, Energy & Transportation | | 6,363 | | | 4,321 | | | 2,042 | | | 47 | % |
| | | | | | | | |
| Financial Products Segment | | 908 | | | 590 | | | 318 | | | 54 | % |
| Corporate Items and Eliminations | | (92) | | | (53) | | | (39) | | | |
| Financial Products | | 816 | | | 537 | | | 279 | | | 52 | % |
| Consolidating Adjustments | | (301) | | | (305) | | | 4 | | | |
| Consolidated Operating Profit | | $ | 6,878 | | | $ | 4,553 | | | $ | 2,325 | | | 51 | % |
| | | | | | | | |
| | | | | | | | | | | | | | | | | | | | | | | | | | | | | | | | | | | | | | | | | | | | | | | | | | | | |
| Sales and Revenues by Segment |
| (Millions of dollars) | | 2022 | | Sales
Volume | | Price
Realization | | Currency | | | | Inter-Segment / Other | | 2023 | | $
Change | | %
Change |
| Construction Industries | | $ | 25,269 | | | $ | (314) | | | $ | 2,678 | | | $ | (197) | | | | | $ | (18) | | | $ | 27,418 | | | $ | 2,149 | | | 9 | % |
| Resource Industries | | 12,314 | | | (114) | | | 1,422 | | | (77) | | | | | 38 | | | 13,583 | | | 1,269 | | | 10 | % |
| Energy & Transportation | | 23,752 | | | 2,529 | | | 1,500 | | | (11) | | | | | 231 | | | 28,001 | | | 4,249 | | | 18 | % |
| All Other Segment | | 450 | | | (8) | | | (5) | | | (1) | | | | | 13 | | | 449 | | | (1) | | | — | % |
| Corporate Items and Eliminations | | (5,211) | | | (115) | | | 1 | | | 7 | | | | | (264) | | | (5,582) | | | (371) | | | |
| Machinery, Energy & Transportation | | 56,574 | | | 1,978 | | | 5,596 | | | (279) | | | | | — | | | 63,869 | | | 7,295 | | | 13 | % |
| | | | | | | | | | | | | | | | | | |
| Financial Products Segment | | 3,253 | | | — | | | — | | | — | | | | | 532 | | | 3,785 | | | 532 | | | 16 | % |
| Corporate Items and Eliminations | | (400) | | | — | | | — | | | — | | | | | (194) | | | (594) | | | (194) | | | |
Financial Products Revenues | | 2,853 | | | — | | | — | | | — | | | | | 338 | | | 3,191 | | | 338 | | | 12 | % |
| | | | | | | | | | | | | | | | | | |
| Consolidated Sales and Revenues | | $ | 59,427 | | | $ | 1,978 | | | $ | 5,596 | | | $ | (279) | | | | | $ | 338 | | | $ | 67,060 | | | $ | 7,633 | | | 13 | % |
| | | | | | | | | | | | | | | | | | |
| | | | | | | | | | | | | | | | | | | | | | | | | | | | | | | | | | | | | | | | | | | | | | | | | | | | | | | | | | | | | | | | | | | | | | | | | | | | | | | | | | | |
| Sales and Revenues by Geographic Region |
| North America | | Latin America | | EAME | | Asia/Pacific | | External Sales and Revenues | | Inter-Segment | | Total Sales and Revenues |
| (Millions of dollars) | $ | | % Chg | | $ | | % Chg | | $ | | % Chg | | $ | | % Chg | | $ | | % Chg | | $ | | % Chg | | $ | | % Chg |
| 2023 | | | | | | | | | | | | | | | | | | | | | | | | | | | |
| Construction Industries | $ | 15,343 | | | 24% | | $ | 2,307 | | | (19%) | | $ | 5,254 | | | 3% | | $ | 4,390 | | | (9%) | | $ | 27,294 | | | 9% | | $ | 124 | | | (13%) | | $ | 27,418 | | | 9 | % |
| Resource Industries | 5,256 | | | 16% | | 2,040 | | | 11% | | 2,069 | | | (6%) | | 3,879 | | | 13% | | 13,244 | | | 10% | | 339 | | | 13% | | 13,583 | | | 10 | % |
| Energy & Transportation | 11,982 | | | 31% | | 1,983 | | | 11% | | 5,929 | | | 13% | | 3,461 | | | 10% | | 23,355 | | | 21% | | 4,646 | | | 5% | | 28,001 | | | 18 | % |
| All Other Segment | 65 | | | 2% | | (1) | | | (150%) | | 18 | | | 127% | | 49 | | | (66%) | | 131 | | | (10%) | | 318 | | | 4% | | 449 | | | — | % |
| Corporate Items and Eliminations | (133) | | | | | (3) | | | | | (5) | | | | | (14) | | | | | (155) | | | | | (5,427) | | | | | (5,582) | | | |
| Machinery, Energy & Transportation | 32,513 | | | 25% | | 6,326 | | | (2%) | | 13,265 | | | 6% | | 11,765 | | | 2% | | 63,869 | | | 13% | | — | | | —% | | 63,869 | | | 13 | % |
| | | | | | | | | | | | | | | | | | | | | | | | | | | |
| Financial Products Segment | 2,440 | | | 17% | | 416 | | | 20% | | 491 | | | 24% | | 438 | | | 2% | | 3,785 | | 1 | 16% | | — | | | —% | | 3,785 | | | 16 | % |
| Corporate Items and Eliminations | (347) | | | | | (77) | | | | | (83) | | | | | (87) | | | | | (594) | | | | | — | | | | | (594) | | | |
| Financial Products Revenues | 2,093 | | | 12% | | 339 | | | 26% | | 408 | | | 17% | | 351 | | | (3%) | | 3,191 | | | 12% | | — | | | —% | | 3,191 | | | 12 | % |
| | | | | | | | | | | | | | | | | | | | | | | | | | | |
| Consolidated Sales and Revenues | $ | 34,606 | | | 24% | | $ | 6,665 | | | (1%) | | $ | 13,673 | | | 7% | | $ | 12,116 | | | 2% | | $ | 67,060 | | | 13% | | $ | — | | | —% | | $ | 67,060 | | | 13 | % |
| | | | | | | | | | | | | | | | | | | | | | | | | | | |
| 2022 | | | | | | | | | | | | | | | | | | | | | | | | | | | |
| Construction Industries | $ | 12,367 | | | | | $ | 2,843 | | | | | $ | 5,099 | | | | | $ | 4,818 | | | | | $ | 25,127 | | | | | $ | 142 | | | | | $ | 25,269 | | | |
| Resource Industries | 4,531 | | | | | 1,840 | | | | | 2,205 | | | | | 3,437 | | | | | 12,013 | | | | | 301 | | | | | 12,314 | | | |
| Energy & Transportation | 9,175 | | | | | 1,784 | | | | | 5,232 | | | | | 3,146 | | | | | 19,337 | | | | | 4,415 | | | | | 23,752 | | | |
| All Other Segment | 64 | | | | | 2 | | | | | (66) | | | | | 145 | | | | | 145 | | | | | 305 | | | | | 450 | | | |
| Corporate Items and Eliminations | (29) | | | | | (1) | | | | | (5) | | | | | (13) | | | | | (48) | | | | | (5,163) | | | | | (5,211) | | | |
| Machinery, Energy & Transportation | 26,108 | | | | | 6,468 | | | | | 12,465 | | | | | 11,533 | | | | | 56,574 | | | | | — | | | | | 56,574 | | | |
| | | | | | | | | | | | | | | | | | | | | | | | | | | |
| Financial Products Segment | 2,078 | | | | | 348 | | | | | 396 | | | | | 431 | | | | | 3,253 | | 1 | | | — | | | | | 3,253 | | | |
| Corporate Items and Eliminations | (205) | | | | | (78) | | | | | (47) | | | | | (70) | | | | | (400) | | | | | — | | | | | (400) | | | |
| Financial Products Revenues | 1,873 | | | | | 270 | | | | | 349 | | | | | 361 | | | | | 2,853 | | | | | — | | | | | 2,853 | | | |
| | | | | | | | | | | | | | | | | | | | | | | | | | | |
| Consolidated Sales and Revenues | $ | 27,981 | | | | | $ | 6,738 | | | | | $ | 12,814 | | | | | $ | 11,894 | | | | | $ | 59,427 | | | | | $ | — | | | | | $ | 59,427 | | | |
| | | | | | | | | | | | | | | | | | | | | | | | | | | |
1 Includes revenues from Machinery, Energy & Transportation of $690 million and $478 million in 2023 and 2022, respectively. |
Other Profit/Loss and Tax Items
•Interest expense excluding Financial Products in 2021 was $488 million, compared with $514 million in 2020. The decrease was due to lower average debt outstanding during 2021, compared with 2020.
Other income/expense in 2021 was income
The company experienced foreign currency exchange net losses in 2020, compared with net gains in 2021.
•The provision for income taxes for 2021 reflected an annual effective tax rate of 22.9 percent compared with 27.8 percent for 2020, excluding the discrete items discussed in the following paragraph. The decrease from 2020 was primarily related to changes in the geographic mix of profits from a tax perspective.Contents
The provision for income taxes for 2021 also included the following:
◦A tax charge of $190 million related to $833 million of pension and OPEB mark-to-market gains in 2021, compared to a $82 million tax benefit related to $383 million of mark-to-market losses in 2020.
◦A tax benefit of $36 million to reflect changes in estimates related to prior year’s U.S. taxes in 2021 compared to $80 million in 2020.
◦A tax benefit of $63 million in 2021, compared with $49 million in 2020, for the settlement of stock-based compensation awards with associated tax deductions in excess of cumulative U.S. GAAP compensation expense.
◦A tax benefit of $38 million in 2021 to recognize U.S. capital losses.
Construction Industries
Our Construction Industries’Industries segment is primarily responsible for supporting customers using machinery in infrastructure and building construction. The majority of machine sales in this segment are made in the heavy and general construction, rental, quarry and aggregates and mining.
The nature of customer demand for construction machinery varies around the world. Customers in developing economies often prioritize purchase price in making their investment decisions, while customers in developed economies generally weigh productivity and other performance criteria that contribute to lower owning and operating costs over the lifetime of the machine. To meet customer expectations in developing economies, Caterpillar developed differentiated product offerings that target customers in those regions, including our SEM brand machines. We believe that these customer-driven product innovations enable us to compete more effectively in developing economies. The majority of Construction Industries' research and development spending in 2023 focused on the next generation of construction machines.
The competitive environment for construction machinery is characterized by some global competitors and many regional and specialized local competitors.Examples of global competitors include CASE (part of CNH Industrial N.V.), Deere Construction & Forestry (part of Deere & Company), Doosan Bobcat (Part of Doosan Group), Hitachi Construction Machinery Co., Ltd., Hyundai Construction Equipment Co., Ltd., Hyundai Doosan Infracore Co., Ltd. (both part of Hyundai Heavy Industries Group), J.C. Bamford Excavators Ltd., Kobelco Construction Machinery (part of Kobe Steel, Ltd), Komatsu Ltd., Kubota Farm & Industrial Machinery (part of Kubota Corporation), Sany Heavy Industry Co., Ltd., and Volvo Construction Equipment (part of the Volvo Group).As an example of regional and local competitors, our competitors in China also include Guangxi LiuGong Machinery Co., Ltd., Longking Holdings Ltd., Sany Heavy Industry Co, XCMG Construction Machinery Co., Ltd., Shandong Lingong Construction Machinery Co., Ltd. (SDLG, JV with Volvo Construction Equipment) and Shantui Construction Machinery Co., Ltd., (part of Shandong Heavy Industry Group Co.).Each of these companies has varying product lines that compete with Caterpillar products, and each has varying degrees of regional focus.
The Construction Industries portfolio includes the following product families as well as related parts and work tools:
| | | | | | | | | | | | | | |
| · asphalt pavers | | · motor graders | | · track-type tractors (small, medium) |
| · backhoe loaders | | · pipelayers | | · track excavators (mini, small |
| · cold planers | | · road reclaimers | | medium, large) |
| · compactors | | · skid steer loaders | | · wheel excavators |
| · compact track loaders | | · telehandlers | | · wheel loaders (compact, small,
|
| · forestry machines | | · track-type loaders | | medium) |
| · material handlers | | | | |
Resource Industries
The Resource Industries segment is primarily responsible for supporting customers using machinery in mining and heavy construction and quarry and aggregates. Caterpillar offers a broad product range and services to deliver comprehensive solutions for our customers. We develop and manufacture high productivity equipment for both surface and underground mining operations around the world, as well as provide hydraulic systems, electronics and software for Caterpillar machines and engines.Our equipment is used to extract and haul copper, iron ore, coal, oil sands, aggregates, gold and other minerals and ores, as well as a variety of heavy construction applications.In addition to equipment, Resource Industries also develops and sells technology products and services to provide customers fleet management systems, equipment management analytics and autonomous machine capabilities.
Customers in most markets place an emphasis on equipment that is highly productive, reliable and provides the lowest total cost of ownership over the life of the equipment.In some developing markets, customers often prioritize purchase price in making their investment decisions. We believe our ability to control the integration and design of key machine components and innovative technologies represents a competitive advantage. Our research and development efforts remain focused on providing customers the lowest total cost of ownership enabled through the highest quality, most productive products and services in the industry.
The competitive environment for Resource Industries consists of a few larger global competitors that compete in several of the markets that we serve and a substantial number of smaller companies that compete in a more limited range of products, applications, and regional markets. Our global surface competitors include Deere Construction & Forestry (part of Deere & Company), Epiroc AB, Hitachi Construction Machinery Co., Ltd., Komatsu Ltd., Liebherr-International AG, Sandvik AB, and Volvo Construction Equipment. Our global underground competitors include Epiroc AB, Komatsu Ltd., and Sandvik AB.
The Resource Industries product portfolio includes the following machines and related parts and services:
| | | | | | | | | | | | | | |
·electric rope shovels | | ·large wheel loaders | | ·soil compactors |
·draglines | | ·off-highway trucks | | ·machinery components |
·hydraulic shovels | | ·articulated trucks | | ·autonomous ready vehicles and solutions |
·rotary drills | | ·wheel tractor scrapers | | ·select work tools |
·hard rock vehicles | | ·wheel dozers | | ·safety services and mining performance |
·large track-type tractors | | ·fleet management | | solutions |
·large mining trucks | | ·landfill compactors | | |
| | | | |
| | | | |
| | | | |
| | | | |
| | | | |
Energy & Transportation
Our Energy & Transportation segment supports customers in oil and gas, power generation, marine, rail and industrial applications, including Caterpillar machines. The product and services portfolio includes reciprocating engines, generator sets, integrated systems and solutions, turbines and turbine-related services, electrified powertrain and zero-emission power sources and service solutions development, the remanufacturing of Caterpillar engines and components, remanufacturing services for other companies, diesel-electric locomotives and other rail-related products and services and product support of on-highway vocational trucks for North America.
Regulatory emissions standards require us to continue to make investments as new products and new regulations are introduced. Ongoing compliance with these regulations remains a focus. Emissions compliance in developing markets is complex due to rapidly evolving and unique requirements where enforcement processes can often vary. We employ robust product development, manufacturing processes and testing to help us comply with these regulations.
The competitive environment for reciprocating engines in marine, oil and gas, industrial and electric power generation systems along with turbines in oil and gas and electric power generation consists of a few larger global competitors that compete in a variety of markets that Caterpillar serves, and a substantial number of smaller companies that compete in a limited-size product range, geographic region and/or application. Principal global competitors include Cummins Inc., Deutz AG, Rolls-Royce Power Systems and Siemens Energy Global GmbH. Other competitors, such as Volvo Penta AB, FPT Industrial (Iveco Group), INNIO, GE Vernova, Kawasaki Heavy Industries Energy Solution & Marine Engineering, MAN Energy Solutions (VW), Weichai Power Co., Ltd., and other emerging market competitors compete in certain markets in which Caterpillar competes. An additional set of competitors, including Aggreko plc, Generac Holdings, Kohler Energy, Baker Hughes Co., and others, are primarily packagers who source engines and/or other components from domestic and international suppliers and market products regionally and internationally through a variety of distribution channels. In rail-related businesses, our global competitors include Wabtec Freight, The Greenbrier Companies, Voestalpine AG, and Vossloh AG, Alstom SA, Siemens Mobility, and CRRC Corp., LTD. We also compete with other companies on a more limited range of products, services and/or geographic regions.
The Energy & Transportation portfolio includes the following products and related parts:
•Reciprocating engine powered generator sets
•Reciprocating engines, drivetrain and integrated systems and solutions supplied to the industrial industry as well as Caterpillar machinery
•Integrated systems and solutions used in the electric power generation industry
•Turbines, centrifugal gas compressors and related services
•Reciprocating engines, drivetrain and integrated systems and solutions for the marine and oil and gas industries
•Diesel-electric locomotives and components and other rail-related products and services
Financial Products Segment
The business of our Financial Products Segment is primarily conducted by Cat Financial, Insurance Services and their respective subsidiaries and affiliates. Cat Financial is a wholly owned finance subsidiary of Caterpillar Inc. and it provides retail and wholesale financing alternatives to customers and dealers around the world for Caterpillar products and services, as well as financing for vehicles and power generation facilities that, in most cases, incorporate Caterpillar products. Retail financing is primarily comprised of installment sale contracts and other equipment-related loans, working capital loans, finance leases and operating leases. Wholesale financing to Caterpillar dealers consists primarily of inventory and rental fleet financing. In addition, Cat Financial purchases short-term wholesale trade receivables from Caterpillar. The various financing plans offered by Cat Financial are designed to support sales of Caterpillar products and services and generate financing income for Cat Financial. A significant portion of our activity is conducted in North America and we have additional offices and subsidiaries in Latin America, Asia/Pacific, Europe and Africa.
For over 40 years, Cat Financial has been providing financing for Caterpillar products, contributing to our knowledge of asset values, industry trends, financing structures and customer needs.
In certain instances, Cat Financial’s operations are subject to supervision and regulation by state, federal and various foreign governmental authorities, and may be subject to various laws and judicial and administrative decisions imposing various requirements and restrictions which, among other things, (i) regulate credit granting activities and the administration of loans, (ii) establish maximum interest rates, finance charges and other charges, (iii) require disclosures to customers, (iv) govern secured transactions, (v) set collection, foreclosure, repossession and other trade practices and (vi) regulate the use and reporting of information related to a borrower’s credit experience. Cat Financial’s ability to comply with these and other governmental and legal requirements and restrictions affects its operations.
Cat Financial’s retail loans include:
•Loans that allow customers and dealers to use their Caterpillar equipment or other assets as collateral to obtain financing.
•Installment sale contracts, which are equipment loans that enable customers to purchase equipment with structured payments over time.
Cat Financial's retail leases include:
•Finance (non-tax) leases, where the lessee for tax purposes is considered to be the owner of the equipment during the term of the lease, that either require or allow the customer to purchase the equipment for a fixed price at the end of the term.
•Tax leases that are classified as either operating or finance leases for financial accounting purposes, depending on the characteristics of the lease. For tax purposes, we are considered the owner of the equipment.
Cat Financial also purchases short-term receivables from Caterpillar.
Cat Financial’s wholesale loans and leases include inventory/rental programs, which provide assistance to dealers by financing their new Caterpillar inventory and rental fleets.
Cat Financial operates in a highly competitive environment, with financing for users of Caterpillar equipment and services available through a variety of sources, principally commercial banks and finance and leasing companies. Our competitors include Wells Fargo Equipment Finance Inc., Banc of America Leasing & Capital LLC, BNP Paribas Leasing Solutions Limited, Australia and New Zealand Banking Group Limited, Société Générale S.A. and various other banks and finance companies. In addition, many of the manufacturers that compete with Caterpillar also own financial subsidiaries, such as John Deere Capital Corporation, Komatsu Financial L.P., Volvo Financial Services and Kubota Credit Corporation, which utilize many below-market interest rate programs (funded by the manufacturer) to support machine sales. Cat Financial works with the broader Caterpillar organization to provide a broad array of financial merchandising programs to compete around the world.
The financial results of Cat Financial are largely dependent upon the ability of Caterpillar dealers to sell equipment and customers’ willingness to enter into financing or leasing agreements. Cat Financial is also affected by, among other things, the availability of funds from its financing sources, its cost of funds relative to its competitors and general economic conditions such as inflation and market interest rates.
Cat Financial has a match-funding policy that addresses interest rate risk by aligning the interest rate profile (fixed or floating rate and duration) of its debt portfolio with the interest rate profile of its receivables portfolio within predetermined ranges on an ongoing basis. In connection with that policy, Cat Financial uses interest rate derivative instruments to modify the debt structure to match assets within the receivables portfolio. This matched funding reduces the volatility of margins between interest-bearing assets and interest-bearing liabilities, regardless of which direction interest rates move. For more information regarding match funding, please see Note 4 — “Derivative financial instruments and risk management” of Part II, Item 8 "Financial Statements and Supplementary Data." See also the risk factors associated with our financial products business included in Item 1 A. of this Form 10-K.
In managing foreign currency risk for Cat Financial’s operations, the objective is to minimize earnings volatility resulting from conversion and the remeasurement of net foreign currency balance sheet positions, and future transactions denominated in foreign currencies. This policy allows the use of foreign currency forward, option and cross currency contracts to offset the risk of currency mismatch between the assets and liabilities, and exchange rate risk associated with future transactions denominated in foreign currencies.
Cat Financial provides financing only when certain criteria are met. Credit decisions are based on a variety of credit quality factors including prior payment experience, customer financial information, credit ratings, loan-to-value ratios and other internal metrics. Cat Financial typically maintains a security interest in retail-financed equipment and generally requires physical damage insurance coverage on financed equipment. Cat Financial finances a significant portion of Caterpillar dealers’ sales and inventory of Caterpillar equipment throughout the world. Cat Financial’s competitive position is improved by marketing programs offered in conjunction with Caterpillar and/or Caterpillar dealers. Under these programs, Caterpillar, or the dealer, funds an amount at the outset of the transaction, which Cat Financial then recognizes as revenue over the term of the financing. We believe that these marketing programs provide Cat Financial a significant competitive advantage in financing Caterpillar products.
Caterpillar Insurance Company, a wholly owned subsidiary of Caterpillar Insurance Holdings Inc., is a U.S. insurance company domiciled in Missouri and primarily regulated by the Missouri Department of Insurance. Caterpillar Insurance Company is licensed to conduct property and casualty insurance business in 50 states, the District of Columbia and Guam, and as such, is also regulated in those jurisdictions. The State of Missouri acts as the lead regulatory authority and monitors Caterpillar Insurance Company’s financial status to ensure that it is in compliance with minimum solvency requirements, as well as other financial ratios prescribed by the National Association of Insurance Commissioners. Caterpillar Insurance Company is also licensed to conduct insurance business through a branch in Zurich, Switzerland and, as such, is regulated by the Swiss Financial Market Supervisory Authority.
Caterpillar Life Insurance Company, a wholly owned subsidiary of Caterpillar, is a U.S. insurance company domiciled in Missouri and primarily regulated by the Missouri Department of Insurance. Caterpillar Life Insurance Company is licensed to conduct life and accident and health insurance business in 26 states and the District of Columbia and, as such, is also regulated in those jurisdictions. The State of Missouri acts as the lead regulatory authority and it monitors the financial status to ensure that it is in compliance with minimum solvency requirements, as well as other financial ratios prescribed by the National Association of Insurance Commissioners. Caterpillar Life Insurance Company provides reinsurance coverage to Caterpillar Insurance Company. Specifically, Caterpillar Life Insurance Company has entered into a reinsurance agreement with Caterpillar Insurance Company, assuming 100% of the risk of an Accident and Health Stop Loss Insurance Policy to cover a Caterpillar Voluntary Employees' Benefits Association (VEBA) Trust for medical losses sustained by a select group of Caterpillar retirees and dependents.
Caterpillar Insurance Co. Ltd., a wholly owned subsidiary of Caterpillar Insurance Holdings Inc., is a captive insurance company domiciled in Bermuda and regulated by the Bermuda Monetary Authority. Caterpillar Insurance Co. Ltd. is registered as a Class 2 (General Business) and Class B (Long-Term) insurer with the Bermuda Monetary Authority. Under its Class 2 insurance license, Caterpillar Insurance Co. Ltd. insures its parent and affiliates for general liability, property, auto liability and cargo. It also provides reinsurance to Caterpillar Insurance Company under a quota share reinsurance agreement for its contractual liability and contractors’ equipment programs in the United States. In addition, Caterpillar Insurance Co. Ltd. reinsures 100% of the international employee benefit plans of Caterpillar Inc. through retrocession agreements with other insurers. The employee benefits coverages include medical and accident coverages. which are reported under its Class 2 insurance license and life and disability coverages, which are reported under its Class B insurance license. The Bermuda Monetary Authority is responsible for monitoring compliance with solvency requirements and requires an Annual Financial Filing for this purpose.
Caterpillar Insurance Services Corporation, a wholly owned subsidiary of Caterpillar Insurance Holdings Inc., is a Tennessee insurance agency licensed in all 50 states, the District of Columbia and Guam. It provides brokerage and insurance services for all property and casualty and life and health lines of business.
Caterpillar’s insurance group provides protection and service for claims under the following programs:
•Contractual Liability Insurance to insure certain service contract obligations of Caterpillar and its affiliates, Caterpillar dealers and original equipment manufacturers (OEMs).
•Cargo reinsurance for the worldwide cargo risks of Caterpillar products.
•Contractors’ Equipment Physical Damage Insurance for equipment manufactured by Caterpillar or OEMs, which is leased, rented or sold by third party dealers to customers.
•General liability, employer’s liability, auto liability and property insurance for Caterpillar.
•Life, disability, medical and accident reinsurance for Caterpillar's international employee benefits program (non-U.S.).
•Reinsurance to cover VEBA Trust for medical claims of certain Caterpillar retirees and dependents.
•Brokerage and insurance services for property and casualty and life and health business.
Competitive Environment
Caterpillar products and services are sold worldwide into a variety of highly competitive markets. In all markets, we compete on the basis of product performance, customer service, quality and price. From time to time, the intensity of competition results in price discounting in a particular industry or region. Such price discounting puts pressure on margins and can negatively impact operating profit. Outside the United States, certain competitors enjoy competitive advantages inherent to operating in their home countries or regions.
Raw Materials and Component Products
We source our raw materials and manufactured components from suppliers both domestically and internationally. These purchases include unformed materials and rough and finished parts. Unformed materials include a variety of steel products, which are then cut or formed to shape and machined in our facilities. Rough parts include various sized steel and iron castings and forgings, which are machined to final specification levels inside our facilities. Finished parts are ready to assemble components, which are made either to Caterpillar specifications or to supplier developed specifications. We machine and assemble some of the components used in our machines, engines and power generation units and to support our after-market dealer parts sales. We also purchase various goods and services used in production, logistics, offices and product development processes. We maintain global strategic sourcing models to meet our global facilities’ production needs while building long-term supplier relationships and leveraging enterprise spend. We expect our suppliers to maintain, at all times, industry-leading levels of quality and the ability to timely deliver raw materials and component products for our machine and engine products. However, in some cases, increases in demand or supply chain disruptions have led to parts and components constraints across some products. We use a variety of agreements with suppliers to protect our intellectual property and processes to monitor and mitigate risks of the supply base causing a business disruption. The risks monitored include supplier financial viability, the ability to increase or decrease production levels, business continuity, quality and delivery.
Patents and Trademarks
We own a number of patents and trademarks, which have been obtained over a period of years and relate to the products we manufacture and the services we provide. These patents and trademarks are generally considered beneficial to our business. We do not regard our business as being dependent upon any single patent or group of patents.
Order Backlog
The dollar amount of backlog believed to be firm was approximately $27.5 billion at December 31, 2023 and $30.4 billion at December 31, 2022. Compared with year-end 2022, the order backlog decreased across the three primary segments. Of the total backlog at December 31, 2023, approximately $5.8 billion was not expected to be filled in 2024.
Dealers and Distributors
We distribute our machines principally through a worldwide organization of dealers (dealer network), 43 located in the United States and 113 located outside the United States, serving 191 countries. We sell reciprocating engines principally through the dealer network and to other manufacturers for use in products. We also sell some of the reciprocating engines manufactured by our subsidiary Perkins Engines Company Limited through its worldwide network of 88 distributors covering 185 countries. We sell the FG Wilson branded electric power generation systems through its worldwide network of 110 distributors covering 109 countries.
Our dealers do not deal exclusively with our products; however, in most cases sales and servicing of our products are the dealers’ principal business. We sell some products, primarily turbines and locomotives, directly to end customers through sales forces employed by the company. At times, these employees are assisted by independent sales representatives.
While the large majority of our worldwide dealers are independently owned and operated, we own and operate a dealership in Japan that covers approximately 80% of the Japanese market: Nippon Caterpillar Division. We are currently operating this Japanese dealer directly and we report its results in the All Other operating segment. There are also three independent dealers in the Southern Region of Japan.
For Caterpillar-branded products, the company’s relationship with each of its independent dealers is memorialized in standard sales and service agreements. Pursuant to these agreements, the company grants the dealer the right to purchase and sell its products and to service the products in a specified geographic service territory. The company establishes prices to dealers after receiving input from dealers on transactional pricing in the marketplace. The company also agrees to defend its intellectual property and to provide warranty and technical support to the dealer. The agreement further grants the dealer a non-exclusive license to use the company’s trademarks, service marks and brand names. In some instances, a separate trademark agreement exists between the company and a dealer.
In exchange for these rights, the agreement obligates the dealer to develop and promote the sale of the company’s products to current and prospective customers in the dealer’s service territory. Each dealer agrees to employ adequate sales and support personnel to market, sell and promote the company’s products, demonstrate and exhibit the products, perform the company’s product improvement programs, inform the company concerning any features that might affect the safe operation of any of the company’s products and maintain detailed books and records of the dealer’s financial condition, sales and inventories and make these books and records available at the company’s reasonable request.
These sales and service agreements are terminable at will by either party primarily upon 90 days written notice.
Human Capital
Core Values
Caterpillar’s global workforce is united by Our Values In Action, Caterpillar’s Code of Conduct. Integrity, Excellence, Teamwork, Commitment and Sustainability provide the foundation for our values-based culture. Our diversity and inclusion principles are embedded in our values. Our values unite us, and reflect our diverse cultures, languages, geographies, and businesses, as one Caterpillar team.
Health and Safety
The health and safety of our employees is an important focus at Caterpillar, and we strive to continually reduce our recordable injuries utilizing programs that amplify our safety culture, globally. In 2023, the Company achieved a recordable injury frequency rate of 0.40, compared to the 2022 recordable injury frequency rate of 0.44. In addition, Caterpillar has refreshed our safety strategy to enhance our focus on preventing serious injuries and to encourage learning from those closest to the work.
Talent Development and Training
In addition to our focus on values and safety, we strive to continually attract, develop, engage, and retain a high-performing diverse global team that executes our enterprise strategy of long-term profitable growth.
We are committed to employee development and helping individuals reach their full potential, by making on-going investments in our team. Our global internships, engineering co-ops, and career programs for engineering, marketing, and manufacturing provide development opportunities for early career employees. We also have a continual focus on strengthening technical, professional and leadership capabilities at every level using contemporary learning strategies to foster high performance. Strategic talent reviews and succession planning occur at a minimum, annually, across our businesses.
Our leadership development programs focus on encouraging a variety of experiences to help employees broaden understanding and increase perspective. Our leadership curriculums include managing for inclusion and building resilient and high performing teams as core development principles. Additionally, skill-based programs to upskill our manufacturing employees are developed locally and tailored to the specific needs of the business.
Diversity and Inclusion
We are committed to fostering a diverse workforce and an inclusive environment that is representative of the many customers and communities we serve around the globe. Our strategic approach weaves diversity and inclusion seamlessly into the business, ensuring that the principles guide us in our daily operating rhythm. Our 14 Employee Resource Groups (ERGs), which are sponsored and supported by leadership, help ensure different voices and perspectives contribute to our strategy for long-term profitable growth. They also engage our employees, helping contribute to development and retention.
Our ERGs provide many contributions, such as mentoring programs that connect diverse employees with senior leaders who can support their career goals, partnerships with recruiters and diverse early career and professional organizations that can assist in strengthening the diverse talent pipeline and programs that educate and inform on the richness of the global cultures that we share.
Compensation, Benefits and Employee Insights
Providing competitive benefits and compensation underpins our commitment to our engaged and productive employees. Our pay-for-performance philosophy aligns employee’s individual contributions, behaviors and business results with individual rewards. Our comprehensive Total Health programs focus on purpose, as well as physical and mental health, emotional and social support, and financial wellness. The annual Employee Insights Survey provides all employees the opportunity to confidentially share their perspectives and engages leaders to listen, learn and respond to employee feedback to help foster a positive work environment.
Employment
Management aligns employment levels with the needs of the business. We believe we have the appropriate human capital resources to successfully operate and deliver our enterprise strategy. As of December 31, 2023, we employed about 113,200 full-time persons of whom approximately 62,400 were $22.106located outside the United States. In the United States, we employed approximately 50,800 full-time persons, most of whom are at-will employees and, therefore, not subject to any type of employment contract or agreement. At select business units, we have hired certain highly specialized employees under employment contracts that specify a term of employment, pay and other benefits.
| | | | | | | | | | | | | | |
| Full-Time Employees at Year-End | | | | |
| | 2023 | | 2022 | |
| Inside U.S. | 50,800 | | 48,200 | |
| Outside U.S. | 62,400 | | 60,900 | |
| Total | 113,200 | | 109,100 | |
| | | | |
| By Region: | | | | |
| North America | 51,200 | | 48,700 | |
| EAME | 16,600 | | 16,900 | |
| Latin America | 20,300 | | 19,100 | |
| Asia/Pacific | 25,100 | | 24,400 | |
| Total | 113,200 | | 109,100 | |
| | | | |
As of December 31, 2023, there were 7,973 hourly production employees in the United States who were covered by collective bargaining agreements with various labor unions, including The United Automobile, Aerospace and Agricultural Implement Workers of America (UAW), The International Association of Machinists and The United Steelworkers. Outside the United States, the company enters into employment contracts and agreements in those countries in which such relationships are mandatory or customary. The provisions of these agreements generally correspond in each case with the required or customary terms in the subject jurisdiction.
Environmental Matters
The company is regulated by federal, state and international environmental laws governing our use, transport and disposal of substances and control of emissions. In addition to governing our manufacturing and other operations, these laws often impact the development of our products, including, but not limited to, required compliance with air emissions standards applicable to internal combustion engines. We have made, and will continue to make, significant research and development and capital expenditures to comply with these emissions standards.
We are engaged in remedial activities at a number of locations, often with other companies, pursuant to federal and state laws. When it is probable we will pay remedial costs at a site, and those costs can be reasonably estimated, the investigation, remediation, and operating and maintenance costs of the remedial action are accrued against our earnings. Costs are accrued
based on consideration of currently available data and information with respect to each individual site, including available technologies, current applicable laws and regulations, and prior remediation experience. Where no amount within a range of estimates is more likely, we accrue the minimum. Where multiple potentially responsible parties are involved, we consider our proportionate share of the probable costs. In formulating the estimate of probable costs, we do not consider amounts expected to be recovered from insurance companies or others. We reassess these accrued amounts on a quarterly basis. The amount recorded for environmental remediation is not material and is included in the line item "Accrued expenses" in Statement 3 — "Consolidated Financial Position at December 31" of Part II, Item 8 "Financial Statements and Supplementary Data." There is no more than a remote chance that a material amount for remedial activities at any individual site, or at all the sites in the aggregate, will be required.
Available Information
The company files electronically with the Securities and Exchange Commission (SEC) required reports on Form 8-K, Form 10-Q, Form 10-K and Form 11-K; proxy materials; ownership reports for insiders as required by Section 16 of the Securities Exchange Act of 1934 (Exchange Act); registration statements on Forms S-3 and S-8, as necessary; and other forms or reports as required. The SEC maintains a website (www.sec.gov) that contains reports, proxy and information statements, and other information regarding issuers that file electronically with the SEC. The company maintains a website (www.Caterpillar.com) and copies of our annual report on Form 10-K, quarterly reports on Form 10-Q, current reports on Form 8-K and any amendments to these reports filed or furnished with the SEC are available free of charge through our website (www.Caterpillar.com/secfilings) as soon as reasonably practicable after filing with the SEC. Copies of our board committee charters, our board’s Guidelines on Corporate Governance Issues, Worldwide Code of Conduct and other corporate governance information are available on our website (www.Caterpillar.com/governance) and are also available free of charge. The information contained on the company’s website is not included in, or incorporated by reference into, this annual report on Form 10-K.
Additional company information may be obtained as follows:
Current information -
•view additional financial information on-line at www.Caterpillar.com/en/investors/financial-information.html
•request, view or download materials on-line or register for email alerts at www.Caterpillar.com/materialsrequest
Historical information -
•view/download on-line at www.Caterpillar.com/historical
Item 1A.Risk Factors.
The statements in this section describe the most significant risks to our business and should be considered carefully in conjunction with Part II, Item 7 “Management’s Discussion and Analysis of Financial Condition and Results of Operations” and the “Notes to Consolidated Financial Statements” of Part II, Item 8 “Financial Statements and Supplementary Data” to this Form 10-K. In addition, the statements in this section and other sections of this Form 10-K, including in Part II, Item 7 “Management's Discussion and Analysis of Financial Condition and Results of Operations,” include “forward-looking statements” as that term is defined in the Private Securities Litigation Reform Act of 1995 and involve uncertainties that could significantly impact results. Forward-looking statements give current expectations or forecasts of future events about the company or our outlook. You can identify forward-looking statements by the fact they do not relate to historical or current facts and by the use of words such as “believe,” “expect,” “estimate,” “anticipate,” “will be,” “should,” “plan,” “forecast,” “target,” “guide,” “project,” “intend,” “could” and similar words or expressions.
Forward-looking statements are based on assumptions and on known risks and uncertainties. Although we believe we have been prudent in our assumptions, any or all of our forward-looking statements may prove to be inaccurate, and we can make no guarantees about our future performance. Should known or unknown risks or uncertainties materialize or underlying assumptions prove inaccurate, actual results could materially differ from past results and/or those anticipated, estimated or projected.
We undertake no obligation to publicly update forward-looking statements, whether as a result of new information, future events or otherwise. You should, however, consult any subsequent disclosures we make in our filings with the SEC on Form 10-Q or Form 8-K.
The following is a cautionary discussion of risks, uncertainties and assumptions that we believe are material to our business. In addition to the factors discussed elsewhere in this report, the following are some of the important factors that, individually or in the aggregate, we believe could make our actual results differ materially from those described in any forward-looking statements. It is impossible to predict or identify all such factors and, as a result, you should not consider the following factors to be a complete discussion of risks, uncertainties and assumptions.
MACROECONOMIC RISKS
Our business and the industries we serve are highly sensitive to global and regional economic conditions.
Our results of operations are materially affected by economic conditions globally and regionally and in the particular industries we serve. The demand for our products and services tends to be cyclical and can be significantly reduced in periods of economic weakness characterized by lower levels of government and business investment, lower levels of business confidence, lower corporate earnings, high real interest rates, lower credit activity or tighter credit conditions, perceived or actual industry overcapacity, higher unemployment and lower consumer spending. A prolonged period of economic weakness may also result in increased expenses due to higher allowances for doubtful accounts and potential goodwill and asset impairment charges. Economic conditions vary across regions and countries, and demand for our products and services generally increases in those regions and countries experiencing economic growth and investment. Slower economic growth or a change in the global mix of regions and countries experiencing economic growth and investment could have an adverse effect on our business, results of operations and financial condition.
The energy, transportation, and mining industries are significant adopters of Caterpillar products. In these industries customers are likely to base their purchase decisions upon expected future commodity dynamics, including price. Commodity price volatility may be abrupt and unpredictable in response to global economic conditions, government actions, regulatory changes, supply/demand dynamics, innovation, and commodity substitutions among others. Economic conditions affecting the industries we serve may reduce capital expenditures in response to a variety of the aforementioned conditions. Reduction in these capital expenditures may lead to decreased demand for Caterpillar products and services as well as aftermarket parts as customers may choose to extend preventative maintenance and delay overhauls when possible.
The rates of infrastructure spending, commercial construction and housing starts also play a significant role in our results. Our products are an integral component of these activities, and as these activities decrease, demand for our products and services may be significantly impacted, which could negatively impact our results.
Catastrophic events, including global pandemics, could materially adversely affect our business, results of operations and/or financial condition.
The occurrence of a major earthquake, fire, flood, tsunami or other weather event, power loss, telecommunications failure, software or hardware malfunctions, pandemics, cyber-attack, war, terrorist attack or other catastrophic event that our disaster recovery plans do not adequately address, could adversely affect our employees, our systems, our ability to produce and distribute our products, and our reputation. For example, a pandemic had a significant impact around the world, prompting governments and businesses to take unprecedented measures in response. Such measuresincluded travel bans and restrictions, quarantines, shelter in place orders and shutdowns. Those measures impacted or could again impact all or portions of our workforce and operations and the operations of our customers, dealers and suppliers. Current material and component shortages, logistics constraints and labor inefficiencies limited and or could continue to limit our ability to meet customer demand, which could have a material adverse effect on our business, results of operations and/or financial condition.
Pandemics can significantly increase economic and customer demand uncertainty, cause inflationary pressure in the U.S. and elsewhere and lead to volatility in customer demand for the Company’s products and services and cause supply chain disruptions. Economic uncertainties could continue to affect customer demand for the Company’s products and services, the value of the equipment financed or leased, the demand for financing and the financial condition and credit risk of our dealers and customers.
A catastrophic event resulting in the destruction or disruption of our workforce, our systems, our ability to produce and distribute our products, any of our data centers or our critical business or information technology systems could adversely affect our ability to conduct normal business operations and our operating results or cash flows. The adverse effects of any such catastrophic event would be exacerbated if experienced at the same time as another unexpected and adverse event.
Commodity price changes, material price increases, fluctuations in demand for our products and services, significant disruptions to our supply chains or significant shortages of labor and material may adversely impact our financial results or our ability to meet commitments to customers.
We are a significant user of steel and many other commodities required for the manufacture of our products. Increases in the prices of such commodities would increase our costs, negatively impacting our business, results of operations and financial condition if we are unable to fully offset the effect of these increased costs through price increases, productivity improvements, cost reduction programs or hedging programs.
We rely on suppliers to produce or secure material required for the manufacture of our products. Production challenges at suppliers (including suppliers of semiconductors), a disruption in deliveries to or from suppliers or decreased availability of raw materials or commodities could have an adverse effect on our ability to meet our commitments to customers or increase our operating costs.On the other hand, in circumstances where demand for our products is less than we expect, we may experience excess inventories and be forced to incur additional costs and our profitability may suffer. Our business, competitive position, results of operations or financial condition could be negatively impacted if supply is insufficient for our operations, if significant transportation delays interfere with deliveries, if we experience excess inventories or if we are unable to adjust our production schedules or our purchases from suppliers to reflect changes in customer demand and market fluctuations on a timely basis.
Changes in government monetary or fiscal policies may negatively impact our results.
Most countries where our products and services are sold have established central banks to regulate monetary systems and influence economic activities, generally by adjusting interest rates. Interest rate changes affect overall economic growth, which affects demand for residential and nonresidential structures, as well as energy and mined products, which in turn affects sales of our products and services that support these activities. Interest rate changes may also affect our customers’ ability to finance machine purchases, can change the optimal time to keep machines in a fleet and can impact the ability of our suppliers to finance the production of parts and components necessary to manufacture and support our products. Increases in interest rates could negatively impact sales and create supply chain inefficiencies.
Central banks and other policy arms of many countries may take actions to vary the amount of liquidity and credit available in an economy. The impact from a change in liquidity and credit policies could negatively affect the customers and markets we serve or our suppliers, create supply chain inefficiencies and could adversely impact our business, results of operations and financial condition.
Changes in monetary and fiscal policies, along with other factors, may cause currency exchange rates to fluctuate. Actions that lead the currency exchange rate of a country where we manufacture products to increase relative to other currencies could reduce the competitiveness of products made in that country, which could adversely affect our competitive position, results of operations and financial condition.
Government policies on taxes and spending also affect our business. Throughout the world, government spending finances a significant portion of infrastructure development, such as highways, rail systems, airports, sewer and water systems, waterways and dams. Tax regulations determine asset depreciation lives and impact the after-tax returns on business activity and investment, both of which influence investment decisions. Unfavorable developments, such as decisions to reduce public spending or to increase taxes, could negatively impact our results.
Our global operations are exposed to political and economic risks, commercial instability and events beyond our control in the countries in which we operate.
Our global operations are dependent upon products manufactured, purchased and sold in the U.S. and internationally, including in countries with political and economic instability or uncertainty. Some countries have greater political and economic volatility and greater vulnerability to infrastructure and labor disruptions than others. Our business could be negatively impacted by adverse fluctuations in freight costs, fuel costs (e.g., diesel, bunker, jet), limitations on shipping and receiving capacity, and other disruptions in the transportation and shipping infrastructure at important geographic points of exit and entry for our products. Operating in different regions and countries exposes us to numerous risks, including:
•multiple and potentially conflicting laws, regulations and policies that are subject to change;
•imposition of currency restrictions, restrictions on repatriation of earnings or other restraints;
•imposition of new or additional tariffs or quotas;
•withdrawal from or modification of trade agreements or the negotiation of new trade agreements;
•imposition of new or additional trade and economic sanctions laws imposed by the U.S. or foreign governments;
•war or acts of terrorism; and
•political and economic instability or civil unrest that may severely disrupt economic activity in affected countries.
The occurrence of one or more of these events may negatively impact our business, results of operations and financial condition.
OPERATIONAL RISKS
The success of our business depends on our ability to develop, produce and market quality products that meet our customers’ needs.
Our business relies on continued global demand for our brands and products. To achieve business goals, we must develop and sell products that appeal to our dealers, OEMs and end-user customers. This is dependent on a number of factors, including our ability to maintain key dealer relationships; our ability to produce products that meet the quality, performance and price expectations of our customers and our ability to develop effective sales, advertising and marketing programs. In addition, our continued success in selling products that appeal to our customers is dependent on leading-edge innovation, with respect to both products and operations, and on the availability and effectiveness of legal protection for our innovations. Failure to continue to deliver high quality, innovative, competitive products to the marketplace, to adequately protect our intellectual property rights; to supply products that meet applicable regulatory requirements, including engine exhaust emission requirements or to predict market demands for, or gain market acceptance of, our products, could have a negative impact on our business, results of operations and financial condition.
We operate in a highly competitive environment, which could adversely affect our sales and pricing.
We operate in a highly competitive environment. We compete on the basis of a variety of factors, including product performance, customer service, quality and price. There can be no assurance that our products will be able to compete successfully with other companies’ products. Thus, our share of industry sales could be reduced due to aggressive pricing or product strategies pursued by competitors, unanticipated product or manufacturing difficulties, our failure to price our products competitively, our failure to produce our products at a competitive cost or an unexpected buildup in competitors’ new machine or dealer-owned rental fleets, which could lead to downward pressure on machine rental rates and/or used equipment prices.
Lack of customer acceptance of price increases we announce from time to time, changes in customer requirements for price discounts, changes in our customers’ behavior or a weak pricing environment could have an adverse impact on our business, results of operations and financial condition.
In addition, our results and ability to compete may be impacted negatively by changes in our geographic and product mix of sales.
Increased information technology security threats and more sophisticated computer crime pose a risk to our systems, networks, products and services.
We rely upon information technology systems and networks, some of which are managed by third parties, in connection with a variety of business activities. Additionally, we collect and store sensitive information relating to our business, customers, dealers, suppliers and employees. Operating these information technology systems and networks and processing and maintaining this data in a secure manner, is critical to our business operations and strategy. Information technology security threats -- from user error to cybersecurity attacks designed to gain unauthorized access to our systems, networks and data -- are increasing in frequency and sophistication. Cybersecurity attacks from threat actors globally range from random attempts to coordinated and targeted attacks, including sophisticated computer crime and advanced persistent threats. These threats pose a risk to the security of our systems and networks and the confidentiality, availability and integrity of our data. Cybersecurity attacks could also include attacks targeting customer data or the security, integrity and/or reliability of the hardware and software installed in our products. It is possible that our information technology systems and networks, or those managed or provided by third parties, could have vulnerabilities, which could go unnoticed for a period of time. While various procedures and controls have been and are being utilized to mitigate such risks, there can be no guarantee that the actions and controls we have implemented and are implementing, or which we cause or have caused third-party service providers to implement, will be sufficient to protect and mitigate associated risks to our systems, information or other property.
We have experienced cybersecurity threats and vulnerabilities in our systems and those of our third party providers, and we have experienced viruses and attacks targeting our information technology systems and networks. Such prior events, to date, have not had a material impact on our financial condition, results of operations or liquidity. However, the potential consequences of a future material cybersecurity attack include reputational damage, litigation with third parties, government enforcement actions, penalties, disruption to systems, unauthorized release of confidential or otherwise protected information, corruption of data, diminution in the value of our investment in research, development and engineering, and increased cybersecurity protection and remediation costs, which in turn could adversely affect our competitiveness, results of operations and financial condition. Due to the evolving nature of such security threats, the potential impact of any future incident cannot be predicted. Further, the amount of insurance coverage we maintain may be inadequate to cover claims or liabilities relating to a cybersecurity attack.
In addition, data we collect, store and process are subject to a variety of U.S. and international laws and regulations, such as the European Union's General Data Protection Regulation and the California Consumer Privacy Act, which may carry significant potential penalties for noncompliance.
Our business is subject to the inventory management decisions and sourcing practices of our dealers and our OEM customers.
We sell finished products primarily through an independent dealer network and directly to OEMs and are subject to risks relating to their inventory management decisions and operational and sourcing practices. Both carry inventories of finished products as part of ongoing operations and adjust those inventories based on their assessments of future needs and market conditions, including levels of used equipment inventory and machine rental usage rates. Such adjustments may impact our results positively or negatively. If the inventory levels of our dealers and OEM customers are higher than they desire, they may postpone product purchases from us, which could cause our sales to be lower than the end-user demand for our products and negatively impact our results. Similarly, our results could be negatively impacted through the loss of time-sensitive sales if our dealers and OEM customers do not maintain inventory levels sufficient to meet customer demand.
We may not realize all of the anticipated benefits of our acquisitions, joint ventures or divestitures, or these benefits may take longer to realize than expected.
In pursuing our business strategy, we routinely evaluate targets and enter into agreements regarding possible acquisitions, divestitures and joint ventures. We often compete with others for the same opportunities. To be successful, we conduct due diligence to identify valuation issues and potential loss contingencies, negotiate transaction terms, complete complex transactions and manage post-closing matters such as the integration of acquired businesses. Further, while we seek to mitigate risks and liabilities of such transactions through due diligence, among other things, there may be risks and liabilities that our due diligence efforts fail to discover, that are not accurately or completely disclosed to us or that we inadequately assess. We may incur unanticipated costs or expenses following a completed acquisition, including post-closing asset impairment charges, expenses associated with eliminating duplicate facilities, litigation, and other liabilities. Risks associated with our past or future acquisitions also include the following:
•the failure to achieve the acquisition's revenue or profit forecast;
•the business culture of the acquired business may not match well with our culture;
•technological and product synergies, economies of scale and cost reductions may not occur as expected;
•unforeseen expenses, delays or conditions may be imposed upon the acquisition, including due to required regulatory approvals or consents;
•we may acquire or assume unexpected liabilities or be subject to unexpected penalties or other enforcement actions;
•faulty assumptions may be made regarding the macroeconomic environment or the integration process;
•unforeseen difficulties may arise in integrating operations, processes and systems;
•higher than expected investments may be required to implement necessary compliance processes and related systems, including information technology systems, accounting systems and internal controls over financial reporting;
•we may fail to retain, motivate and integrate key management and other employees of the acquired business;
•higher than expected costs may arise due to unforeseen changes in tax, trade, environmental, labor, safety, payroll or pension policies in any jurisdiction in which the acquired business conducts its operations; and
•we may experience problems in retaining customers and integrating customer bases.
Many of these factors will be outside of our control and any one of them could result in increased costs, decreases in the amount of expected revenues and diversion of management’s time and attention. They may also delay the realization of the benefits we anticipate when we enter into a transaction.
In order to conserve cash for operations, we may undertake acquisitions financed in part through public offerings or private placements of debt or equity securities, or other arrangements. Such acquisition financing could result in a decrease in our earnings and adversely affect other leverage measures. If we issue equity securities or equity-linked securities, the issued securities may have a dilutive effect on the interests of the holders of our common shares.
Failure to implement our acquisition strategy, including successfully integrating acquired businesses, could have an adverse effect on our business, financial condition and results of operations. Furthermore, we make strategic divestitures from time to time. In the case of divestitures, we may agree to indemnify acquiring parties for certain liabilities arising from our former businesses. These divestitures may also result in continued financial involvement in the divested businesses following the transaction, including through guarantees or other financial arrangements. Lower performance by those divested businesses could affect our future financial results.
Union disputes or other labor matters could adversely affect our operations and financial results.
Some of our employees are represented by labor unions in a number of countries under various collective bargaining agreements with varying durations and expiration dates. There can be no assurance that any current or future issues with our employees will be resolved or that we will not encounter future strikes, work stoppages or other disputes with labor unions or our employees. We may not be able to satisfactorily renegotiate collective bargaining agreements in the United States and other countries when they expire. If we fail to renegotiate our existing collective bargaining agreements, we could encounter strikes or work stoppages or other disputes with labor unions. In addition, existing collective bargaining agreements may not prevent a strike or work stoppage at our facilities in the future. We may also be subject to general country strikes or work stoppages unrelated to our business or collective bargaining agreements. A work stoppage or other limitations on production at our facilities for any reason could have an adverse effect on our business, results of operations and financial condition. In addition, many of our customers and suppliers have unionized work forces. Strikes or work stoppages experienced by our customers or suppliers could have an adverse effect on our business, results of operations and financial condition.
Unexpected events may increase our cost of doing business or disrupt our operations.
The occurrence of one or more unexpected events, including war, acts of terrorism or violence, civil unrest, fires, tornadoes, tsunamis, hurricanes, earthquakes, floods and other forms of severe weather in the United States or in other countries in which we operate or in which our suppliers are located could adversely affect our operations and financial performance. Natural disasters, pandemic illness, equipment failures, power outages or other unexpected events could result in physical damage to and complete or partial closure of one or more of our manufacturing facilities or distribution centers, temporary or long-term disruption in the supply of component products from some local and international suppliers, and disruption and delay in the transport of our products to dealers, end-users and distribution centers. Existing insurance coverage may not provide protection for all of the costs that may arise from such events.
FINANCIAL RISKS
Disruptions or volatility in global financial markets could limit our sources of liquidity, or the liquidity of our customers, dealers and suppliers.
Continuing to meet our cash requirements over the long-term requires substantial liquidity and access to varied sources of funds, including capital and credit markets. Global economic conditions may cause volatility and disruptions in capital and credit markets. Market volatility, changes in counterparty credit risk, the impact of government intervention in financial markets and general economic conditions may also adversely impact our ability to access capital and credit markets to fund operating needs. Global or regional economic downturns could cause financial markets to decrease the availability of liquidity, credit and credit capacity for certain issuers, including certain customers, dealers and suppliers. An inability to access capital and credit markets may have an adverse effect on our business, results of operations, financial condition and competitive position. Furthermore, changes in global economic conditions, including material cost increases and decreases in economic activity in key markets we serve, and the success of plans to manage cost increases, inventory and other important elements of our business may significantly impact our ability to generate funds from operations.
In addition, demand for our products generally depends on customers’ ability to pay for our products, which, in turn, depends on their access to funds. Changes in global economic conditions may result in customers experiencing increased difficulty in generating funds from operations. Capital and credit market volatility and uncertainty may cause financial institutions to revise their lending standards, resulting in customers’ decreased access to capital. If capital and credit market volatility occurs, customers’ liquidity may decline which, in turn, would reduce their ability to purchase our products.
Failure to maintain our credit ratings could increase our cost of borrowing and could adversely affect our cost of funds, liquidity, competitive position and access to capital markets.
Each of Caterpillar’s and Cat Financial’s costs of borrowing and their respective ability to access the capital markets are affected not only by market conditions but also by the short- and long-term credit ratings assigned to their respective debt by the major credit rating agencies. These ratings are based, in significant part, on each of Caterpillar’s and Cat Financial’s performance as measured by financial metrics such as net worth, profitability, interest coverage and leverage ratios, as well as transparency with rating agencies and timeliness of financial reporting. There can be no assurance that Caterpillar and Cat Financial will be able to maintain their credit ratings. We receive debt ratings from the major credit rating agencies. A downgrade of our credit rating by any of the major credit rating agencies could result in increased borrowing costs and could adversely affect Caterpillar’s and Cat Financial’s liquidity, competitive position and access to the capital markets, including restricting, in whole or in part, access to the commercial paper market. There can be no assurance that the commercial paper market will continue to be a reliable source of short-term financing for Cat Financial or an available source of short-term financing for Caterpillar. An inability to access the capital markets could have an adverse effect on our cash flow, results of operations and financial condition.
Our Financial Products segment is subject to risks associated with the financial services industry.
Cat Financial is significant to our operations and provides financing support for a significant share of our global sales. The inability of Cat Financial to access funds to support its financing activities to our customers could have an adverse effect on our business, results of operations and financial condition.
Continuing to meet Cat Financial's cash requirements over the long-term could require substantial liquidity and access to sources of funds, including capital and credit markets. Cat Financial has continued to maintain access to key global medium-term note and commercial paper markets, but there can be no assurance that such markets will continue to represent a reliable source of financing. If global economic conditions were to deteriorate, Cat Financial could face materially higher financing costs, become unable to access adequate funding to operate and grow its business and/or meet its debt service obligations as they mature.Cat Financial also could be required to draw upon contractually committed lending agreements and/or seek other funding sources.However, there can be no assurance that such agreements and other funding sources would be sufficient or even available under extreme market conditions. Any of these events could negatively impact Cat Financial’s business, as well as our and Cat Financial's results of operations and financial condition.
Market disruption and volatility may also lead to numerous risks in connection with these events, including but not limited to:
•Market developments that may affect customer confidence levels and cause declines in the demand for financing and adverse changes in payment patterns, causing increases in delinquencies and default rates, which could increase Cat Financial’s write-offs and provision for credit losses.
•The process Cat Financial uses to estimate losses inherent in its credit exposure requires a high degree of management’s judgment regarding numerous subjective qualitative factors, including forecasts of economic conditions and how economic predictors might impair the ability of its borrowers to repay their loans. Financial market disruption and volatility may impact the accuracy of these judgments.
•Cat Financial’s ability to engage in routine funding transactions or to borrow from other financial institutions on acceptable terms or at all could be adversely affected by disruptions in the capital markets or other events, including actions by rating agencies and deteriorating investor expectations.
•As Cat Financial’s borrowing agreements are primarily with financial institutions, their ability to perform in accordance with any of our underlying agreements could be adversely affected by market volatility and/or disruptions in financial markets.
Changes in interest rates or market liquidity conditions could adversely affect Cat Financial's and our earnings and/or cash flow.
Changes in interest rates and market liquidity conditions could have an adverse impact on Cat Financial's and our earnings and cash flows. Changes in market interest rates may influence its and our borrowing costs, returns on financial investments and the valuation of derivative contracts.Because a significant number of the loans made by Cat Financial are made utilizing fixed interest rates, its business results are subject to fluctuations in interest rates. Certain loans made by Cat Financial and various financing extended to Cat Financial are made at variable rates that use floating reference rates or indices, including the Secured Overnight Financing Rate, or SOFR, an index calculated by short-term repurchase agreements, backed by Treasury securities,as a benchmark for establishing the interest rate.
Together with Cat Financial we created a cross-functional team that assesses risk across multiple categories as it relates to the use of floating reference rates or indices, such as SOFR, in securities, loans, derivatives, and other financial obligations or extensions of credit held by or due to us. Cat Financial manages interest rate and market liquidity risks through a variety of techniques that include a match funding strategy, the selective use of derivatives and a broadly diversified funding program. There can be no assurance, however, that fluctuations in interest rates and market liquidity conditions will not have an adverse impact on its and our earnings and cash flows. If any of the variety of instruments and strategies Cat Financial uses to hedge its exposure to these types of risk is ineffective, this may have an adverse impact on our earnings and cash flows.With respect to Insurance Services' investment activities, changes in equity and bond markets could result in a decline in value of its investment portfolio, resulting in an unfavorable impact to earnings.
An increase in delinquencies, repossessions or net losses of Cat Financial customers could adversely affect its results.
Inherent in the operation of Cat Financial is the credit risk associated with its customers. The creditworthiness of each customer and the rate of delinquencies, repossessions and net losses on customer obligations are directly impacted by several factors, including relevant industry and economic conditions, the availability of capital, the experience and expertise of the customer's management team, commodity prices, political events and the sustained value of the underlying collateral. Any increase in delinquencies, repossessions and net losses on customer obligations could have a material adverse effect on Cat Financial's and our earnings and cash flows. Cat Financial evaluates and adjusts its allowance for credit losses related to past due and non-performing receivables on a regular basis. However, adverse economic conditions or other factors that might cause deterioration of the financial health of its customers could change the timing and level of payments received and necessitate an increase in Cat Financial's estimated losses, which could also have a material adverse effect on Cat Financial's and our earnings and cash flows.
Currency exchange rate fluctuations affect our results of operations.
We conduct operations in many countries involving transactions denominated in a variety of currencies. We are subject to currency-exchange rate risk to the extent that our costs are denominated in currencies other than those in which we earn revenues. Fluctuations in currency exchange rates have had, and will continue to have, an impact on our results as expressed in U.S. dollars. There can be no assurance that currency exchange rate fluctuations will not adversely affect our results of operations, financial condition and cash flows. While the use of currency hedging instruments may provide us with protection from adverse fluctuations in currency exchange rates, by utilizing these instruments we potentially forego the benefits that might result from favorable fluctuations in currency exchange rates. In addition, our outlooks do not assume fluctuations in currency exchange rates. Adverse fluctuations in currency exchange rates from the date of our outlooks could cause our actual results to differ materially from those anticipated in any outlooks and adversely impact our business, results of operations and financial condition.
We also face risks arising from the imposition of exchange controls and currency devaluations. Exchange controls may limit our ability to convert foreign currencies into U.S. dollars or to remit dividends and other payments by our foreign subsidiaries or businesses located in or conducted within a country imposing controls. Currency devaluations result in a diminished value of funds denominated in the currency of the country instituting the devaluation.
Restrictive covenants in our debt agreements could limit our financial and operating flexibility.
We maintain a number of credit facilities to support general corporate purposes (facilities) and have issued debt securities to manage liquidity and fund operations (debt securities). The agreements relating to a number of the facilities and the debt securities contain certain restrictive covenants applicable to us and certain subsidiaries, including Cat Financial. These covenants include maintaining a minimum consolidated net worth (defined as the consolidated shareholder’s equity including
preferred stock but excluding the pension and other post-retirement benefits balance within accumulated other comprehensive income (loss)), limitations on the incurrence of liens and certain restrictions on consolidation and merger. Cat Financial has also agreed under certain of these agreements not to exceed a certain leverage ratio (consolidated debt to consolidated net worth, calculated (1) on a monthly basis as the average of the leverage ratios determined on the last day of each of the six preceding calendar months and (2) at each December 31), to maintain a minimum interest coverage ratio (calculated as (1) profit excluding income taxes, interest expense and net gain (loss) from interest rate derivatives to (2) interest expense calculated at the end of each fiscal quarter for the prior four consecutive fiscal quarter period and not to terminate, amend or modify its support agreement with us.
A breach of one or more of the covenants could result in adverse consequences that could negatively impact our business, results of operations and financial condition. These consequences may include the acceleration of amounts outstanding under certain of the facilities, triggering of an obligation to redeem certain debt securities, termination of existing unused commitments by our lenders, refusal by our lenders to extend further credit under one or more of the facilities or to enter into new facilities or the lowering or modification of our credit ratings or those of one or more of our subsidiaries.
Sustained increases in funding obligations under our pension plans may impair our liquidity or financial condition.
We maintain certain defined benefit pension plans for our employees, which impose on us certain funding obligations. We use many assumptions in determining our future payment obligations under the plans. Significant adverse changes in credit or capital markets could result in actual rates of return on pension investments being materially lower than projected and result in increased contribution requirements. These factors could significantly increase our payment obligations under the plans, and as a result, adversely affect our business and overall financial condition.We may be required to make material contributions to our pension plans in the future and may fund contributions through the use of cash on hand, the proceeds of borrowings, shares of our common stock or a combination of the foregoing, as permitted by applicable law.
LEGAL & REGULATORY RISKS
Our global operations are subject to a wide-range of trade and anti-corruption laws and regulations.
Due to the international scope of our operations, we are subject to a complex system of import- and export-related laws and regulations. These include U.S. regulations issued by Customs and Border Protection, the Bureau of Industry and Security, the Office of Antiboycott Compliance, the Directorate of Defense Trade Controls and the Office of Foreign Assets Control, as well as the counterparts of these agencies in other countries. Any alleged or actual violations may subject us to increased government scrutiny, investigation and civil and criminal penalties, and may limit our ability to import or export our products or to provide services outside the United States. Furthermore, embargoes and sanctions imposed by the U.S. and other governments restricting or prohibiting sales to specific persons or countries or based on product classification may expose us to potential criminal and civil sanctions. We cannot predict the nature, scope or effect of future regulatory requirements to which our operations might be subject. We also cannot predict in certain locations the manner in which existing laws might be administered or interpreted.
In addition, the U.S. Foreign Corrupt Practices Act and similar foreign anti-corruption laws generally prohibit companies and their intermediaries from making improper payments or providing anything of value to improperly influence foreign government officials for the purpose of obtaining or retaining business or obtaining an unfair advantage. Recent years have seen a substantial increase in the global enforcement of anti-corruption laws. Our operations outside the United States, including in developing countries, expose us to the risk of such violations. Violations of anti-corruption laws or regulations by our employees, intermediaries acting on our behalf, or our joint venture partners may result in severe criminal or civil sanctions. Violations may also disrupt our business, and may result in an adverse effect on our reputation, business and results of operations or financial condition.
International trade policies may impact demand for our products and our competitive position.
Government policies on international trade and investment such as import quotas, capital controls or tariffs, whether adopted by individual governments or addressed by regional trade blocs, can affect the demand for our products and services, impact the competitive position of our products or prevent us from being able to sell products in certain countries. The implementation of more restrictive trade policies (such as more detailed inspections, higher tariffs or new barriers to entry) in countries where we sell large quantities of products and services could negatively impact our business, results of operations and financial condition. For example, a government’s adoption of “buy national” policies or retaliation by another government against such policies could have a negative impact on our results of operations.
We may incur additional tax expense or become subject to additional tax exposure.
We are subject to income taxes in the United States and numerous other jurisdictions. Our future results of operations could be adversely affected by changes in the effective tax rate as a result of a change in the mix of earnings between U.S. and non-U.S. jurisdictions or among jurisdictions with differing statutory tax rates. In addition, our future results of operations could also be adversely affected by changes in our overall profitability, changes in tax laws or treaties or in their application or interpretation, changes in tax rates, changes in generally accepted accounting principles, changes in the valuation of deferred tax assets and liabilities, changes in the amount of earnings indefinitely reinvested in certain non-U.S. jurisdictions, the results of audits and examinations of previously filed tax returns and continuing assessments of our tax exposures. We are also subject to the continuous examination of our income tax returns by the U.S. Internal Revenue Service and other tax authorities. We regularly assess the likelihood of an adverse outcome resulting from these examinations. If our effective tax rates were to increase, or if the ultimate determination of our taxes owed is for an amount in excess of amounts previously accrued, our operating results, cash flows and financial condition could be adversely affected. For information regarding additional legal matters related to our taxes, please see Note 6 — “Income taxes” and Note 22 — “Environmental and legal matters” of Part II, Item 8 “Financial Statements and Supplementary Data” to this Annual Report on Form 10-K.
Costs associated with lawsuits or investigations or adverse rulings in enforcement or other legal proceedings may have an adverse effect on our results of operations.
We are subject to a variety of legal proceedings and legal compliance risks in virtually every part of the world. We face risk of exposure to various types of claims, lawsuits and government investigations. We are involved in various claims and lawsuits related to product design, manufacture and performance liability (including claimed asbestos exposure), contracts, employment issues, environmental matters, intellectual property rights, tax, securities and other legal proceedings that arise in and outside of the ordinary course of our business. The industries in which we operate are also periodically reviewed or investigated by regulators, which could lead to enforcement actions, fines and penalties or the assertion of private litigation claims. It is not possible to predict with certainty the outcome of claims, investigations and lawsuits, and we could in the future incur judgments, fines or penalties or enter into settlements of lawsuits and claims that could have an adverse effect on our reputation, business, results of operations or financial condition in any particular period.
The global and diverse nature of our operations means that legal and compliance risks will continue to exist and additional legal proceedings and other contingencies, the outcome of which cannot be predicted with certainty, may arise from time to time. In addition, subsequent developments in legal proceedings may affect our assessment and estimates of loss contingencies recorded as a reserve and require us to make payments in excess of our reserves. Such payments could have an adverse effect on our reputation, business and results of operations or financial condition.
New regulations or changes in financial services regulation could adversely impact Caterpillar and Cat Financial.
Cat Financial’s operations are highly regulated by governmental authorities in the locations where it operates, which can impose significant additional costs and/or restrictions on its business. In the United States, for example, certain Cat Financial activities are subject to the U.S. Dodd-Frank Wall Street Reform and Consumer Protection Act (Dodd-Frank), which includes extensive provisions regulating the financial services industry. As a result, Cat Financial has become and could continue to become subject to additional regulatory costs that could be significantand have an adverse effect on Cat Financial’s and our results of operations and financial condition. Changes in regulations or additional regulations in the United States or internationally impacting the financial services industry could also add significant cost or operational constraints that might have an adverse effect on Cat Financial’s and our results of operations and financial condition.
We are subject to stringent environmental laws and regulations that impose significant compliance costs.
Our facilities, operations and products are subject to increasingly stringent environmental laws and regulations globally, including laws and regulations governing emissions to noise, air, releases to soil and discharges to water and the generation, handling, storage, transportation, treatment and disposal of non-hazardous and hazardous waste materials. Some environmental laws impose strict, retroactive and joint and several liability for the remediation of the release of hazardous substances, even for conduct that was lawful at the time it occurred, or for the conduct of, or conditions caused by, prior operators, predecessors or other third parties. Failure to comply with environmental laws could expose us to penalties or clean-up costs, civil or criminal liability and sanctions on certain of our activities, as well as damage to property or natural resources. The potential liabilities, sanctions, damages and remediation efforts related to any non-compliance with such laws and regulations could negatively impact our ability to conduct our operations and our financial condition and results of operations. In addition, there can be no assurances that we will not be adversely affected by costs, liabilities or claims with respect to existing or subsequently acquired operations or under present laws and regulations or those that may be adopted or imposed in the future.
Environmental laws and regulations may change from time to time, as may related interpretations and other guidance. Changes in environmental laws or regulations could result in higher expenses and payments. Uncertainty relating to environmental laws or regulations may also affect how we conduct our operations and structure our investments and could limit our ability to enforce our rights. Changes in environmental and climate change laws or regulations, including laws relating to greenhouse gas emissions, could lead to new or additional investment in product designs and could increase environmental compliance expenditures. Changes in climate change concerns, or in the regulation of such concerns, including greenhouse gas emissions, could subject us to additional costs and restrictions, including increased energy and raw materials costs. If environmental laws or regulations are either changed or adopted and impose significant operational restrictions and compliance requirements upon us or our products, they could negatively impact our reputation, business, capital expenditures, results of operations, financial condition and competitive position.
The Company’s amended and restated bylaws provide that the Court of Chancery of the State of Delaware will be the exclusive forum for certain legal actions between the Company and its shareholders, which could discourage claims or limit the ability of the Company’s shareholders to bring a claim in a judicial forum viewed by the shareholders as more favorable for disputes with the Company or the Company’s directors, officers or other employees.
The Company’s amended and restated bylaws provide to the fullest extent permitted by law that unless the Company consents in writing to the selection of an alternative forum, the Court of Chancery of the State of Delaware will be the sole and exclusive forum for (i) any derivative action or proceeding brought on behalf of the Company, (ii) any action asserting a claim of breach of fiduciary duty owed by any director, officer or other employee of the Company to the Company or the Company’s shareholders, (iii) any action asserting a claim against the Company or any director or officer or other employee of the Company arising pursuant to any provision of the Delaware General Corporation Law or the Company’s certificate of incorporation or bylaws (as either may be amended from time to time) or (iv) any action asserting a claim against the Company or any director or officer or other employee of the Company governed by the internal affairs doctrine.
The exclusive forum provisions in our bylaws could limit our shareholders’ ability to bring a claim in a judicial forum that it finds favorable for disputes with the Company or its directors, officers or other employees. Alternatively, if a court were to find the choice of forum provision contained in the Company’s amended and restated bylaws to be inapplicable or unenforceable in an action, the Company may incur additional costs associated with resolving such action in other jurisdictions. The exclusive forum provision in the Company’s amended and restated bylaws will not preclude or contract the scope of exclusive federal or concurrent jurisdiction for actions brought under the federal securities laws including the Securities Exchange Act of 1934, as amended, or the Securities Act of 1933, as amended, or the respective rules and regulations promulgated thereunder.
Item 1B.Unresolved Staff Comments.
None.
Item 1C. Cybersecurity
As required by Item 106 of Regulation S-K, the following sets forth information regarding our cybersecurity strategy, risk management and governance.
Cybersecurity Strategy and Risk Management
Cybersecurity is critical to advancing our overall objectives and enabling our digital efforts. As a global company, we face a wide variety of cybersecurity threats that range from common attacks such as ransomware and denial-of-service, to attacks from more advanced adversaries. Our customers, suppliers, and other partners face similar cybersecurity threats, and a cybersecurity incident impacting these entities could materially adversely affect our operations, performance and results. These cybersecurity threats and related risks make it imperative that we maintain focus on cybersecurity and systemic risks.
We maintain a comprehensive cybersecurity program which is integrated within the Company’s enterprise risk management system and encompasses the corporate information technology and operational technology environments as well as customer-facing products. Our cybersecurity program has implemented a governance structure and process to identify, assess, manage, mitigate, respond to and report on cybersecurity risks. We utilize cybersecurity policies and frameworks based on industry and government standards. Our cyber risk management program controls are based on recognized best practices and standards, including the National Institute of Standards and Technology (NIST) Cyber Security Framework and the International Organization for Standardization (ISO 27001) Information Security Management System Requirements. We partner with third parties to support and evaluate our cybersecurity program. These third-party services span areas including cybersecurity maturity assessments, incident response, penetration testing, consulting on best practices, and others. We also consume threat intelligence from several paid and non-paid sources.
We maintain a 24 x 7 operations center which serves as a central location for the reporting of cybersecurity matters, provides monitoring of our global cybersecurity environment, and coordinates the investigation and remediation of alerts. As cybersecurity events occur, the cybersecurity team focuses on responding to and containing the threat and minimizing impact. In the event of an incident, the cybersecurity team assesses, among other factors, safety impact, supply chain and manufacturing disruption, data and personal information loss, business operations disruption, projected cost and potential for reputational harm, with participation from technical, legal and law enforcement support, as appropriate.
We have implemented a cybersecurity awareness program which covers topics such as phishing, social networking safety, password security and mobile device usage. We have mandatory training in the areas of cybersecurity, privacy, and confidential information handling. We also conduct regular phishing training and simulations for our employees and contractors. We provide extensive specialized role-based training to technical professionals in cybersecurity, secure application development, and other focus areas. We also conduct periodic tabletop exercises to validate our preparation for cyber events.
We operate a third-party cybersecurity program with the goal of minimizing disruption to the Company’s business and production operations, strengthening supply chain resilience, and supporting the integrity of components and systems used in its products and services. We rely heavily on our supply chain to deliver our products and services to our customers, and a cybersecurity incident at a supplier, subcontractor or joint venture partner could materially adversely impact us. We assess third-party cybersecurity controls through a cybersecurity third-party risk assessment process. Identified deficiencies are addressed through a risk remediation process. For select suppliers, we engage third-party cybersecurity monitoring and alerting services, and seek to work directly with those suppliers to address potential deficiencies identified.
As of the date of this report, we do not believe that risks from any cybersecurity threats, including as a result of any previous cybersecurity incidents, have materially affected or are reasonably likely to affect us, including our business strategy, results of operations or financial condition. That said, as discussed more fully under Item 1A. “Risk Factors—Operational Risks— Increased information technology security threats and more sophisticated computer crime pose a risk to our systems, networks, products and services” of this Form 10-K, these threats pose a risk to the security of our systems and networks and the confidentiality, availability and integrity of our data. Cybersecurity attacks could also include attacks targeting customer data or the security, integrity and/or reliability of the hardware and software installed in our products. It is possible that our information technology systems and networks, or those managed or provided by third parties, could have vulnerabilities, which could go unnoticed for a period of time. While various procedures and controls have been and are being utilized to mitigate such risks, there can be no guarantee that the actions and controls we have implemented and are implementing, or which we cause or have caused third-party service providers to implement, will be sufficient to protect and mitigate associated risks to our systems, information or other property.
Cybersecurity Governance
Caterpillar’s board has oversight for risk management with a focus on the most significant risks facing the Company, including strategic, operational, financial and legal compliance risks. The board’s risk oversight process builds upon management’s risk assessment and mitigation processes, which include an enterprise risk management program of which our cybersecurity processes are an integral component.
The board implements its risk oversight function both as a board and through delegation to board committees, which meet regularly and report back to the board. The board has delegated the oversight of specific risks to board committees that align with their functional responsibilities. The Audit Committee (the “AC”) assists the board in overseeing the enterprise risk management program and evaluates and monitors risks related to, among other things, the Company’s information security program. The AC assesses cybersecurity and information technology risks and the controls implemented to monitor and mitigate these risks. The Company’s Chief Information Officer & Senior Vice President, Caterpillar IT (the “CIO”) attends all bimonthly AC meetings and provides cybersecurity updates to the AC and board.
Our cybersecurity program is overseen by our CIO, who has been a Caterpillar employee for nearly twenty-five years. Prior to her current appointment as our CIO in September 2020, she was the Chief Information Officer for the Company’s Financial Products Division. Her extensive background in IT includes global leadership for large-scale systems transformations, cybersecurity, cloud and application management, global data center management, worldwide network, servers and storage, database management and end-user services. Our CIO leads a cross-functional cybersecurity team comprised of professionals from our product, cybersecurity, legal and compliance organizations who focus on managing the security of our connected solutions. This team manages the Company’s global IT systems, IT risk management, cybersecurity, global infrastructure and IT transformations.
Item 1D.Executive Officers of the Registrant.
| | | | | | | | | | | | | | |
| Name and age | | Present Caterpillar Inc. position
and date of initial election | | Principal positions held during the
past five years if other than
Caterpillar Inc. position currently held |
| D. James Umpleby III (65) | | Chairman of the Board (2018) and Chief Executive Officer (2017) | | Group President (2013-2016) |
| Andrew R.J. Bonfield (61) | | Chief Financial Officer (2018) | | Group Chief Financial Officer for a multinational electricity and gas utility company (2010-2018) |
| Bob De Lange (54) | | Group President (2017) | | Vice President (2015-2016), Worldwide Product Manager, Medium Wheel Loaders, (2013-2014) |
| Denise C. Johnson (57) | | Group President (2016) | | Vice President (2012-2016) |
| Joseph E. Creed (48) | | Chief Operating Officer (2023) | | Group President (2021-2023), Vice President, Oil & Gas and Marine Division (2019-2020), Interim Chief Financial Officer (2018), Vice President, Finance Services Division (2017), Group Chief Financial Officer, Energy and Transportation (2013-2016) |
| Anthony D. Fassino (53) | | Group President (2021) | | Vice President, Building Construction Products (2018-2020), Director of Worldwide Forestry Products (2016-2018) |
| Derek R. Owens (50) | | Chief Legal Officer and General Counsel (2023) | | Senior Vice President (2023), Deputy General Counsel (2021-2023), Associate General Counsel, Litigation & Investigations (2019-2021), Assistant United States Attorney, U.S. Attorney's Office of the Department of Justice (2005-2019) |
| Cheryl H. Johnson (63) | | Chief Human Resources Officer (2017) | | Executive Vice President of Human Resources for a global multi-industry aerospace, defense and industrial manufacturing company (2012-2017) |
| William E. Schaupp (52) | | Vice President and Chief Accounting Officer (2022) | | Finance Director, Global Finance Services Division (2021-2022) Vice President and Controller and Chief Accounting Officer of PPG Industries, Inc. (2018-2021) |
| Jason E. Kaiser (45) | | Group President (2024) | | Senior Vice President, Electric Power Division (2021-2023), General Manager, Electric Power Division (2019-2021), Product Manager, Electric Power Division (2016-2019) |
Item 2.Properties.
General Information
Caterpillar’s operations are highly integrated. Although the majority of our plants are involved primarily in production relating to our Construction Industries, Resource Industries or Energy & Transportation segments, several plants are involved in manufacturing relating to more than one business segment. In addition, several plants reported in our financial statements under the All Other segment are involved in the manufacturing of components that are used in the assembly of products for more than one business segment. Caterpillar’s parts distribution centers are involved in the storage and distribution of parts for Construction Industries, Resource Industries and Energy & Transportation. The research and development activities carried on at our Technical Centers in Aurora and Mossville, Illinois involve products for Construction Industries, Resource Industries and Energy & Transportation.
We believe the properties we own to be generally well maintained and adequate for present use. Through planned capital expenditures, we expect these properties to remain adequate for future needs. Properties we lease are covered by leases expiring over terms of generally one to ten years. We do not anticipate any difficulty in retaining occupancy of any leased facilities, either by renewing leases prior to expiration or by replacing them with equivalent leased facilities.
Headquarters and Other Key Offices
Our corporate headquarters is in a leased office located in Irving, Texas. Our Financial Products business is headquartered in offices in Nashville, Tennessee. Additional key offices are located inside and outside the United States.
Technical Center, Training Centers, Demonstration Areas and Proving Grounds
We operate Technical Centers located in Aurora and Mossville, Illinois; Wuxi, China; and Chennai, India. Our demonstration centers are located in Tinaja Hills, Arizona; Edwards, Illinois; Chichibu, Japan and Malaga, Spain. We have various other technical and training centers, demonstration areas and proving grounds located both inside and outside the United States.
Parts Distribution Centers
Distribution of our parts is conducted from parts distribution centers inside and outside the United States. We operate parts distribution centers in the following locations: Arvin, California; Denver, Colorado; Miami, Florida; Atlanta, Georgia; Morton, Illinois; St. Paul, Minnesota; Clayton, Ohio; York, Pennsylvania; Waco, Texas; Spokane, Washington; Melbourne, Australia; Queensland, Australia; Grimbergen, Belgium; Piracicaba, Brazil; Shanghai, China; Sagami, Japan; San Luis Potosi, Mexico; Singapore, Republic of Singapore; Moscow, Russia; Johannesburg, South Africa; and Dubai, United Arab Emirates. We also own or lease other facilities that support our distribution activities.
Remanufacturing and Components
Remanufacturing of our products is reported in our Energy & Transportation segment and is conducted primarily at the facilities in the following locations: Franklin, Indiana; Bogor, Indonesia; Corinth, Mississippi; Prentiss County, Mississippi; West Fargo, North Dakota; Piracicaba, Brazil; Shanghai, China; and Nuevo Laredo, Mexico.
Component manufacturing is reported in the All Other segment and is conducted primarily at facilities in the following locations: East Peoria, Illinois; Mapleton, Illinois; Peoria, Illinois; Bogor, Indonesia; Menominee, Michigan; Boonville, Missouri; West Plains, Missouri; Goldsboro, North Carolina; Sumter, South Carolina; Tianjin, China; Xuzhou, China; Atessa, Italy; Bazzano, Italy; Frosinone, Italy; San Eusebio, Italy; Ramos Arizpe, Mexico; Pyeongtaek, South Korea; and Skinningrove, United Kingdom.
We also lease or own other facilities that support our remanufacturing and component manufacturing activities.
Manufacturing
Manufacturing of products for our Construction Industries, Resource Industries and Energy & Transportation segments is conducted primarily at the locations listed below. These facilities are believed to be suitable for their intended purposes, with adequate capacities for current and projected needs for existing products.
Our principal manufacturing facilities include those used by the following segments in the following locations:
| | | | | | | | | | | | | | |
| Segment | | U.S. Facilities | | Facilities Outside the U.S. |
| | | | |
| Construction Industries | | Arkansas: North Little Rock | | Brazil: Campo Largo, Piracicaba |
| | Georgia: Athens | | China: Suzhou, Wujiang, Xuzhou, Qingzhou |
| | Illinois: Decatur, East Peoria | | France: Grenoble, Echirolles |
| | Kansas: Wamego | | Hungary: Godollo |
| | Minnesota: Brooklyn Park | | India: Hosur, Thiruvallur |
| | North Carolina: Clayton, Sanford | | Italy: Minerbio, Cattolica |
| | Texas: Victoria | | Japan: Akashi |
| | | | Mexico: Torreon |
| | | | Netherlands: Den Bosch |
| | | | Poland: Janow, Sosnowiec |
| | | | Thailand: Rayong |
| | | | United Kingdom: Desford, Stockton |
| | | | |
| | | | |
| | | | |
| Resource Industries | | Illinois: Decatur, East Peoria | | China: Qingzhou, Wuxi |
| | South Carolina: Sumter | | Germany: Lunen |
| | Texas: Denison | | India: Thiruvallur |
| | Wisconsin: South Milwaukee | | Indonesia: Batam |
| | | | Mexico: Acuna, Monterrey, Reynosa |
| | | | Thailand: Rayong |
| | | | United Kingdom: Peterlee |
| | | | |
| | | | |
| Energy & Transportation | | Alabama: Albertville, Montgomery | | Australia: Cardiff, Perth, Redbank, Revesby |
| | California: San Diego | | Brazil: Curitiba, Hortolandia, Piracicaba, Sete Lagoas |
| | Georgia: Griffin, Patterson | | China: Tianjin, Wuxi |
| | Illinois: East Peoria,Mossville, Mapleton, Pontiac | | Czech Republic: Zatec, Zebrak |
| | Indiana: Lafayette, Muncie | | Germany: Kiel, Mannheim, Rostock |
| | Kentucky: Decoursey, Mayfield | | India: Aurangabad, Hosur |
| | Oklahoma: Broken Arrow | | Italy: Pistoria |
| | North Carolina: Winston-Salem | | Mexico: San Luis Potosi, Tijuana |
| | Texas: Channelview, DeSoto, Fort Worth, Mabank, San Antonio, Schertz, Seguin, Sherman | | United Kingdom: Larne, Peterborough, Sandiacre, South Queensferry, Springvale, Stafford, Wimborne |
| | | | |
Item 3.Legal Proceedings.
Certain legal proceedings in which we are involved are discussed in Note 22 — "Environmental and legal matters" of Part II, Item 8 "Financial Statements and Supplementary Data" and should be considered an integral part of Part I, Item 3 "Legal Proceedings", which is hereby incorporated by reference.
Item 4.Mine Safety Disclosures.
Not applicable.
PART II
Item 5.Market for Registrant’s Common Equity, Related Stockholder Matters and Issuer Purchases of Equity Securities.
Common Stock (NYSE: CAT)
Listing Information: Caterpillar common stock is listed on the New York Stock Exchange in the United States, and on stock exchanges in France and Switzerland.
Number of Shareholders: Shareholders of record at the end of 2023 totaled 21,217, compared with 21,935 at the end of 2022.
Performance Graph: Total Cumulative Shareholder Return for Five-Year Period Ending December 31, 2023
The graph below shows the cumulative shareholder return assuming an investment of $100 on December 31, 2018, and reinvestment of dividends issued thereafter.
| | | | | | | | | | | | | | | | | | | | | | | | | | | | | | | | | | | | | | |
| | | 2018 | | 2019 | | 2020 | | 2021 | | 2022 | | 2023 |
| Caterpillar Inc. | | $ | 100.00 | | | $ | 119.51 | | | $ | 151.74 | | | $ | 175.95 | | | $ | 208.67 | | | $ | 262.82 | |
| S&P 500 | | $ | 100.00 | | | $ | 131.49 | | | $ | 155.68 | | | $ | 200.37 | | | $ | 164.08 | | | $ | 207.21 | |
| S&P 500 Machinery | | $ | 100.00 | | | $ | 130.29 | | | $ | 160.81 | | | $ | 193.23 | | | $ | 195.93 | | | $ | 235.49 | |
Non-U.S. Employee Stock Purchase Plans
As of December 31, 2023, we had 28 employee stock purchase plans (the “EIP Plans”) administered outside the United States for our non-U.S. employees, which had approximately 14,000 active participants in the aggregate. During the fourth quarter of 2023, approximately 78,000 shares of Caterpillar common stock were purchased by the EIP Plans pursuant to the terms of such plans.
Issuer Purchases of Equity Securities
| | | | | | | | | | | | | | | | | | | | | | | | | | |
| Period | | Total Number
of Shares
Purchased | | Average Price Paid per Share | | Total Number
of Shares Purchased
as Part of Publicly Announced Program | | Approximate Dollar Value of Shares that May Yet be Purchased under the Program (in billions)1 |
| October 1-31, 2023 | | 965,566 | | | $ | 260.01 | | | 965,566 | | | $ | 10.340 | |
| November 1-30, 2023 | | 7,250,965 | | | $ | 239.97 | | | 7,250,965 | | 2 | $ | 8.300 | |
| December 1-31, 2023 | | 1,749,834 | | | $ | 271.45 | | | 1,749,834 | | | $ | 7.825 | |
| Total | | 9,966,365 | | | $ | 247.44 | | | 9,966,365 | | | |
| | | | | | | | |
1 In May 2022, the Board approved a share repurchase authorization (the 2022 Authorization) of up to $15.0 billion of Caterpillar common stock effective August 1, 2022, with no expiration. As of December 31, 2023, approximately $7.8 billion remained available under the 2022 Authorization. |
2 Includes shares acquired pursuant to the accelerated share repurchase agreement entered into during the fourth quarter of 2023. |
| | | | | | | | |
Item 6.[Reserved]
Item 7.Management’s Discussion and Analysis of Financial Condition and Results of Operations.
The following Management’s Discussion and Analysis of Financial Condition and Results of Operations (MD&A) is intended to provide information that will assist the reader in understanding the company’s Consolidated Financial Statements, the changes in certain key items in those financial statements between select periods and the primary factors that accounted for those changes. In addition, we discuss how certain accounting principles, policies and critical estimates affect our Consolidated Financial Statements. Our discussion also contains certain forward-looking statements related to future events and expectations. This MD&A should be read in conjunction with our discussion of cautionary statements and significant risks to the company’s business under Item 1A. Risk Factors of the 2023 Form 10-K.
Highlights for the full-year 2023 include:
•Sales and revenues for 2023 were $67.060 billion, in 2021, an increase of $5.188$7.633 billion, or 3113 percent, compared with $16.918$59.427 billion for 2022. Sales were higher across the three primary segments.
•Operating profit as a percent of sales and revenues was 19.3 percent in 2023, compared with 13.3 percent in 2022. Adjusted operating profit margin was 20.5 percent in 2023, compared with 15.4 percent in 2022.
•Profit per share for 2023 was $20.12, and excluding the items in the table below, adjusted profit per share was $21.21. Profit per share for 2022 was $12.64, and excluding the items in the table below, adjusted profit per share was $13.84.
•In order for our results to be more meaningful to our readers, we have separately quantified the impact of several significant items. A detailed reconciliation of GAAP to non-GAAP financial measures is included on page 47.
| | | | | | | | | | | | | | | | | | | | |
| | | | | | |
| | Full Year 2023 | | Full Year 2022 |
| (Dollars in millions except per share data) | | Profit Before Taxes | Profit
Per Share | | Profit Before Taxes | Profit
Per Share |
| Profit | | $ | 13,050 | | $ | 20.12 | | | $ | 8,752 | | $ | 12.64 | |
Restructuring costs - Longwall divestiture | | 586 | | 1.14 | | | — | | — | |
Other restructuring costs | | 194 | | 0.30 | | | 299 | | 0.43 | |
| Mark-to-market (gains) losses | | (97) | | (0.14) | | | (606) | | (0.91) | |
| Deferred tax valuation allowance adjustments | | — | | (0.21) | | | — | | — | |
| Goodwill impairment | | — | | — | | | 925 | | 1.68 | |
| Adjusted profit | | $ | 13,733 | | $ | 21.21 | | | $ | 9,370 | | $ | 13.84 | |
| | | | | | |
•Enterprise operating cash flow was $12.9 billion in 2020.2023. Caterpillar ended 2023 with $7.0 billion of enterprise cash.
OVERVIEW
Total sales and revenues for 2023 were $67.060 billion, an increase of $7.633 billion, or 13 percent, compared with $59.427 billion for 2022. The increase was primarily due to favorable price realization and higher sales volume. Profit per share was $20.12 in 2023, compared with profit per share of $12.64 in 2022. Profit was $10.335 billion in 2023, compared with $6.705 billion in 2022. The increase was primarily due to favorable price realization, higher sales volume and the absence of a 2022 goodwill impairment charge related to the Rail division, partially offset by higher selling, general and administrative (SG&A) and research and development (R&D) expenses, unfavorable manufacturing costs, the impact of the divestiture of the company's Longwall business and lower mark-to-market gains for remeasurement of pension and other postemployment benefit (OPEB) plans.
Trends and Economic Conditions
Outlook for Key End Markets
Overall demand remains healthy across most of our end markets for our products and services.
In Construction Industries, we expect North America to remain healthy in 2024. We expect non-residential construction in North America to remain at similar demand levels as 2023 due to government-related infrastructure investments. Residential construction is expected to remain healthy relative to historical levels. In Asia Pacific, excluding China, we expect some softening in economic conditions. We anticipate China will remain at a relatively low level in the excavator industry above 10-tons. In EAME, we anticipate the region will be slightly down due to economic uncertainty in Europe, partially offset by continuing strong construction demand in the Middle East. Construction activity in Latin America is expected to increase due to easing financial conditions. In addition, we anticipate the ongoing benefit of our services initiatives will positively impact Construction Industries in 2024.
In Resource Industries, in 2024, for both mining and heavy construction and quarry and aggregates, we anticipate lower sales volume compared to 2023, primarily due to off-highway and articulated trucks. While we continue to see a high level of quoting activity overall, we anticipate lower order rates as customers display capital discipline. Customer product utilization remains high, the number of parked trucks remains low, the age of the fleet remains elevated and our autonomous solutions continue to have strong customer acceptance. We expect higher services revenues, including robust rebuild activity in 2024. We continue to believe the energy transition will support increased commodity demand over time, expanding our total addressable market and providing further opportunities for long-term profitable growth.
In Energy & Transportation, in Oil & Gas, we expect reciprocating engines and services to increase slightly in 2024 compared to 2023. Well servicing in North America is showing some short-term moderation. Gas compression order backlog remains healthy and we continue to remain optimistic about future demand. Power Generation reciprocating engine demand is expected to remain strong due to continued data center growth. Solar Turbines has a strong backlog and continues to experience robust quoting activity. Industrial demand is expected to soften from a strong 2023. In Transportation, we anticipate high-speed marine to increase slightly as customers continue to upgrade aging fleets.
Company Trends and Expectations
For the full-year 2024, we anticipate sales and revenues will be broadly similar to 2023, supported by continued healthy underlying demand across most of our end markets for our products and services and slightly favorable price realization. We anticipate another year of services growth in 2024. We do not expect a significant change in machine dealer inventories in 2024, compared to an increase in 2023. In Construction Industries, sales of equipment to end users is expected to be broadly similar to 2023. In Construction Industries, we do not expect dealer inventory to increase in 2024 as it did in 2023. We also anticipate services initiatives will benefit the segment. Resource Industries' sales in 2024 are expected to be lower, driven by lower sales volume primarily in off-highway and articulated trucks. We also expect an unfavorable impact from changes in dealer inventories in Resource Industries. In 2024, we expect services revenues will increase in Resource Industries. Within Energy & Transportation in 2024, we expect slightly higher sales. Power Generation, Oil & Gas and Transportation sales are expected to increase. Industrial sales are expected to be lower compared to historically strong levels in 2023.
In 2024, we expect a small benefit from price realization during the first half of the year from price actions taken in the second half of 2023. We expect price realization to modestly exceed manufacturing costs, with moderation throughout the year as we lap favorable price trends from 2023. For 2024, we expect short-term incentive compensation expense to be about $1.2 billion, compared to $1.7 billion in 2023. We expect the short-term incentive compensation expense benefit year over year to be offset by increases in SG&A/R&D expenses as we continue to invest in strategic initiatives aimed at future long-term profitable growth, such as services growth and technology, including autonomy, alternative fuels, connectivity and digital and electrification. In addition, we anticipate an impact due to an unfavorable mix of products. In 2024, we expect restructuring costs to be between $300 million and $450 million and expect capital expenditures to be in the range of $2.0 billion to $2.5 billion. We expect the global annual effective tax rate, excluding discrete items, to be between 22.5 percent and 23.5 percent.
In the first quarter of 2024, we expect sales and revenues to be broadly similar to the first quarter of 2023. We expect demand to remain healthy, but anticipate slightly lower machine dealer inventory build as compared to the first quarter of 2023. We anticipate price realization will remain favorable. We expect Construction Industries' sales to remain flat to slightly higher, including favorable price realization. Resource Industries' sales are expected to be lower driven by lower sales volume, partially offset by favorable price realization. In Energy & Transportation, we expect sales to be flat to slightly higher.
In the first quarter of 2024, we expect favorable price realization to more than offset unfavorable manufacturing costs. We expect manufacturing costs to increase primarily due to cost absorption. We do not expect an inventory increase as compared to the increase in the first quarter of 2023. We also anticipate an increase in SG&A/R&D expenses due to investment in strategic initiatives. In Construction Industries, we expect favorable price realization to be offset by increased SG&A/R&D expenses and slightly higher manufacturing costs, including cost absorption. In Resource Industries, we expect the profit impact from lower sales volume to be partially offset by favorable price realization. In Energy & Transportation, we anticipate favorable price realization to be offset by higher manufacturing costs.
Global Business Conditions
We continue to monitor a variety of external factors around the world, such as supply chain disruptions, inflationary cost and labor pressures. Areas of particular focus include transportation, certain components and raw materials. We continue to work to minimize supply chain challenges that may impact our ability to meet customer demand. We continue to assess the environment to determine if additional actions need to be taken.
Risk Factors
Risk factors are disclosed within Item 1A. Risk Factors of the 2023 Form 10-K.
Notes:
•Glossary of terms included on pages 35-37; first occurrence of terms shown in bold italics.
•Information on non-GAAP financial measures is included on page 47.
•Some amounts within this report are rounded to the millions or billions and may not add. In addition, the sum of the components reported across periods may not equal the total amount reported year-to-date due to rounding.
2023 COMPARED WITH 2022
CONSOLIDATED SALES AND REVENUES
The chart above graphically illustrates reasons for the change in consolidated sales and revenues between 2022 (at left) and 2023 (at right). Caterpillar management utilizes these charts internally to visually communicate with the company’s board of directors and employees.
Total sales and revenues for 2023 were $67.060 billion, an increase of $7.633 billion, or 13 percent, compared with $59.427 billion in 2022. The increase was primarily due to favorable price realization and favorable currency impacts related to the Chinese yuan, euro and Australian dollar.higher sales volume. The increase in sales volume was driven by higher end-user demand forsales of equipment and aftermarket partsto end users, partially offset by the impact from changes in dealer inventories. Dealer inventory increased about $2.4 billion during 2022, compared to an increase of about $2.1 billion during 2023.
Sales were higher in the three primary segments.
North America sales increased 25 percent driven by higher sales of equipment to end users, favorable price realization and the impact from changes in dealer inventories. Dealer inventory increased more during 2023 than during 2022.
Sales decreased 2 percent in Latin America due to the impact from changes in dealer inventories and lower services sales volume, partially offset by favorable price realization and favorable currency impacts primarily related to the Brazilian real. Dealer inventory increased during 2022, compared to a decrease during 2023.
EAME sales increased 6 percent due to favorable price realization and higher sales of equipment to end users, partially offset by the impact from changes in dealer inventories. Dealer inventory increased more during 2022 than during 2023.
Asia/Pacific sales increased 2 percent driven by favorable price realization, partially offset by unfavorable currency impacts, primarily related to the Australian dollar and Japanese yen, lower sales of equipment to end users and the impact from changes in dealer inventories. Dealer inventory increased more during 2022 than during 2023.
Dealer inventory increased about $2.1 billion during 2023, compared to an increase of about $2.4 billion during 2022. Dealers decreasedare independent, and the reasons for changes in their inventory levels vary, including their expectations of future demand and product delivery times. Dealers’ demand expectations take into account seasonal changes, macroeconomic conditions, machine rental rates and other factors. Delivery times can vary based on availability of product from Caterpillar factories and product distribution centers. We do not expect a significant change in machine dealer inventories during 2020,in 2024.
| | | | | | | | | | | | | | | | | | | | | | | | | | | | | | | | | | | | | | | | | | | | | | | | | | | | |
| Sales and Revenues by Segment |
| (Millions of dollars) | | 2022 | | Sales
Volume | | Price
Realization | | Currency | | | | Inter-Segment / Other | | 2023 | | $
Change | | %
Change |
| Construction Industries | | $ | 25,269 | | | $ | (314) | | | $ | 2,678 | | | $ | (197) | | | | | $ | (18) | | | $ | 27,418 | | | $ | 2,149 | | | 9 | % |
| Resource Industries | | 12,314 | | | (114) | | | 1,422 | | | (77) | | | | | 38 | | | 13,583 | | | 1,269 | | | 10 | % |
| Energy & Transportation | | 23,752 | | | 2,529 | | | 1,500 | | | (11) | | | | | 231 | | | 28,001 | | | 4,249 | | | 18 | % |
| All Other Segment | | 450 | | | (8) | | | (5) | | | (1) | | | | | 13 | | | 449 | | | (1) | | | — | % |
| Corporate Items and Eliminations | | (5,211) | | | (115) | | | 1 | | | 7 | | | | | (264) | | | (5,582) | | | (371) | | | |
| Machinery, Energy & Transportation | | 56,574 | | | 1,978 | | | 5,596 | | | (279) | | | | | — | | | 63,869 | | | 7,295 | | | 13 | % |
| | | | | | | | | | | | | | | | | | |
| Financial Products Segment | | 3,253 | | | — | | | — | | | — | | | | | 532 | | | 3,785 | | | 532 | | | 16 | % |
| Corporate Items and Eliminations | | (400) | | | — | | | — | | | — | | | | | (194) | | | (594) | | | (194) | | | |
Financial Products Revenues | | 2,853 | | | — | | | — | | | — | | | | | 338 | | | 3,191 | | | 338 | | | 12 | % |
| | | | | | | | | | | | | | | | | | |
| Consolidated Sales and Revenues | | $ | 59,427 | | | $ | 1,978 | | | $ | 5,596 | | | $ | (279) | | | | | $ | 338 | | | $ | 67,060 | | | $ | 7,633 | | | 13 | % |
| | | | | | | | | | | | | | | | | | |
| | | | | | | | | | | | | | | | | | | | | | | | | | | | | | | | | | | | | | | | | | | | | | | | | | | | | | | | | | | | | | | | | | | | | | | | | | | | | | | | | | | |
| Sales and Revenues by Geographic Region |
| North America | | Latin America | | EAME | | Asia/Pacific | | External Sales and Revenues | | Inter-Segment | | Total Sales and Revenues |
| (Millions of dollars) | $ | | % Chg | | $ | | % Chg | | $ | | % Chg | | $ | | % Chg | | $ | | % Chg | | $ | | % Chg | | $ | | % Chg |
| 2023 | | | | | | | | | | | | | | | | | | | | | | | | | | | |
| Construction Industries | $ | 15,343 | | | 24% | | $ | 2,307 | | | (19%) | | $ | 5,254 | | | 3% | | $ | 4,390 | | | (9%) | | $ | 27,294 | | | 9% | | $ | 124 | | | (13%) | | $ | 27,418 | | | 9 | % |
| Resource Industries | 5,256 | | | 16% | | 2,040 | | | 11% | | 2,069 | | | (6%) | | 3,879 | | | 13% | | 13,244 | | | 10% | | 339 | | | 13% | | 13,583 | | | 10 | % |
| Energy & Transportation | 11,982 | | | 31% | | 1,983 | | | 11% | | 5,929 | | | 13% | | 3,461 | | | 10% | | 23,355 | | | 21% | | 4,646 | | | 5% | | 28,001 | | | 18 | % |
| All Other Segment | 65 | | | 2% | | (1) | | | (150%) | | 18 | | | 127% | | 49 | | | (66%) | | 131 | | | (10%) | | 318 | | | 4% | | 449 | | | — | % |
| Corporate Items and Eliminations | (133) | | | | | (3) | | | | | (5) | | | | | (14) | | | | | (155) | | | | | (5,427) | | | | | (5,582) | | | |
| Machinery, Energy & Transportation | 32,513 | | | 25% | | 6,326 | | | (2%) | | 13,265 | | | 6% | | 11,765 | | | 2% | | 63,869 | | | 13% | | — | | | —% | | 63,869 | | | 13 | % |
| | | | | | | | | | | | | | | | | | | | | | | | | | | |
| Financial Products Segment | 2,440 | | | 17% | | 416 | | | 20% | | 491 | | | 24% | | 438 | | | 2% | | 3,785 | | 1 | 16% | | — | | | —% | | 3,785 | | | 16 | % |
| Corporate Items and Eliminations | (347) | | | | | (77) | | | | | (83) | | | | | (87) | | | | | (594) | | | | | — | | | | | (594) | | | |
| Financial Products Revenues | 2,093 | | | 12% | | 339 | | | 26% | | 408 | | | 17% | | 351 | | | (3%) | | 3,191 | | | 12% | | — | | | —% | | 3,191 | | | 12 | % |
| | | | | | | | | | | | | | | | | | | | | | | | | | | |
| Consolidated Sales and Revenues | $ | 34,606 | | | 24% | | $ | 6,665 | | | (1%) | | $ | 13,673 | | | 7% | | $ | 12,116 | | | 2% | | $ | 67,060 | | | 13% | | $ | — | | | —% | | $ | 67,060 | | | 13 | % |
| | | | | | | | | | | | | | | | | | | | | | | | | | | |
| 2022 | | | | | | | | | | | | | | | | | | | | | | | | | | | |
| Construction Industries | $ | 12,367 | | | | | $ | 2,843 | | | | | $ | 5,099 | | | | | $ | 4,818 | | | | | $ | 25,127 | | | | | $ | 142 | | | | | $ | 25,269 | | | |
| Resource Industries | 4,531 | | | | | 1,840 | | | | | 2,205 | | | | | 3,437 | | | | | 12,013 | | | | | 301 | | | | | 12,314 | | | |
| Energy & Transportation | 9,175 | | | | | 1,784 | | | | | 5,232 | | | | | 3,146 | | | | | 19,337 | | | | | 4,415 | | | | | 23,752 | | | |
| All Other Segment | 64 | | | | | 2 | | | | | (66) | | | | | 145 | | | | | 145 | | | | | 305 | | | | | 450 | | | |
| Corporate Items and Eliminations | (29) | | | | | (1) | | | | | (5) | | | | | (13) | | | | | (48) | | | | | (5,163) | | | | | (5,211) | | | |
| Machinery, Energy & Transportation | 26,108 | | | | | 6,468 | | | | | 12,465 | | | | | 11,533 | | | | | 56,574 | | | | | — | | | | | 56,574 | | | |
| | | | | | | | | | | | | | | | | | | | | | | | | | | |
| Financial Products Segment | 2,078 | | | | | 348 | | | | | 396 | | | | | 431 | | | | | 3,253 | | 1 | | | — | | | | | 3,253 | | | |
| Corporate Items and Eliminations | (205) | | | | | (78) | | | | | (47) | | | | | (70) | | | | | (400) | | | | | — | | | | | (400) | | | |
| Financial Products Revenues | 1,873 | | | | | 270 | | | | | 349 | | | | | 361 | | | | | 2,853 | | | | | — | | | | | 2,853 | | | |
| | | | | | | | | | | | | | | | | | | | | | | | | | | |
| Consolidated Sales and Revenues | $ | 27,981 | | | | | $ | 6,738 | | | | | $ | 12,814 | | | | | $ | 11,894 | | | | | $ | 59,427 | | | | | $ | — | | | | | $ | 59,427 | | | |
| | | | | | | | | | | | | | | | | | | | | | | | | | | |
1 Includes revenues from Machinery, Energy & Transportation of $690 million and $478 million in 2023 and 2022, respectively. |
CONSOLIDATED OPERATING PROFIT
The chart above graphically illustrates reasons for the change in consolidated operating profit between 2022 (at left) and 2023 (at right). Caterpillar management utilizes these charts internally to visually communicate with the company’s board of directors and employees. The bar entitled Other includes consolidating adjustments and Machinery, Energy & Transportation other operating (income) expenses.
Operating profit was $12.966 billion in 2023, an increase of $5.062 billion, or 64 percent, compared with $7.904 billion in 2022. The increase was primarily due to favorable price realization, higher sales volume and the absence of a 2022 goodwill impairment charge related to the Rail division, partially offset by higher SG&A/R&D expenses, unfavorable manufacturing costs and the impact of the divestiture of the company's Longwall business. The increase in SG&A/R&D expenses was primarily driven by investments aligned with strategic initiatives, higher short-term incentive compensation expense and an unfavorable change in fair value adjustments related to deferred compensation plans. Unfavorable manufacturing costs reflected lower freight being more than offset by higher material costs, increased period manufacturing costs, the impact of manufacturing inefficiencies and unfavorable cost absorption. Cost absorption was unfavorable as inventory increased more during 2022 than during 2023.
Short-term incentive compensation expense is directly related to financial and operational performance, measured against targets set annually. Expense for 2023 was about $1.7 billion, compared with $1.4 billion in 2022. For 2024, we expect short-term incentive compensation expense will be about $1.2 billion.
In the first quarter of 2023, the divestiture of the company’s Longwall business was finalized, resulting in an unfavorable impact to operating profit of $586 million, primarily a non-cash item driven by the release of accumulated foreign currency translation.
Operating profit margin was 19.3 percent in 2023, compared with 13.3 percent in 2022.
| | | | | | | | | | | | | | | | | | | | | | | | | | |
| Profit (Loss) by Segment | | | | | | | | |
| (Millions of dollars) | | 2023 | | 2022 | | $
Change | | %
Change |
| Construction Industries | | $ | 6,975 | | | $ | 4,743 | | | $ | 2,232 | | | 47 | % |
| Resource Industries | | 2,834 | | | 1,827 | | | 1,007 | | | 55 | % |
| Energy & Transportation | | 4,936 | | | 3,309 | | | 1,627 | | | 49 | % |
| All Other Segment | | 18 | | | (11) | | | 29 | | | 264 | % |
| Corporate Items and Eliminations | | (2,104) | | | (2,435) | | | 331 | | | |
| Machinery, Energy & Transportation | | 12,659 | | | 7,433 | | | 5,226 | | | 70 | % |
| | | | | | | | |
| Financial Products Segment | | 909 | | | 864 | | | 45 | | | 5 | % |
| Corporate Items and Eliminations | | 14 | | | 26 | | | (12) | | | |
| Financial Products | | 923 | | | 890 | | | 33 | | | 4 | % |
| Consolidating Adjustments | | (616) | | | (419) | | | (197) | | | |
| Consolidated Operating Profit | | $ | 12,966 | | | $ | 7,904 | | | $ | 5,062 | | | 64 | % |
| | | | | | | | |
Other Profit/Loss and Tax Items
•Interest expense excluding Financial Products in 2023 was $511 million, compared with $443 million in 2022. The increase was due to higher average borrowing rates.
•Other income (expense) in 2023 was income of $595 million, compared with income of $1.291 billion in 2022. The change was primarily driven by lower mark-to-market gains for remeasurement of pension and OPEB plans and unfavorable impacts from pension and OPEB plan costs and foreign currency exchange, partially offset by higher investment and interest income.
•The provision for income taxes for 2023 reflected an annual effective tax rate of 21.4 percent, compared with 23.2 percent for 2022, excluding the discrete items discussed below. The decrease from 2022 was primarily related to changes in the geographic mix of profits from a tax perspective.
The 2023 annual effective tax rate excludes the impact of the nondeductible loss of $586 million related to the divestiture of the company’s Longwall business. The company also recorded a tax charge of $26 million related to $97 million of pension and OPEB mark-to-market gains in the fourth quarter of 2023, compared to a tax charge of $124 million related to $606 million of mark-to-market gains in the fourth quarter of 2022. In addition, the company recorded a discrete tax benefit of $57 million in 2023 for the settlement of stock-based compensation awards with associated tax deductions in excess of cumulative U.S. GAAP compensation expense, compared with a $33 million benefit for 2022. In 2023, the company recorded a discrete tax benefit of $88 million due to a change in the valuation allowance for certain non-U.S. deferred tax assets. In 2022, the company also recorded discrete benefits of $90 million to reflect changes in estimates related to prior years and a tax benefit of $36 million related to the goodwill impairment charge of $925 million.
Construction Industries
Construction Industries’ total sales were $27.418 billion in 2023, an increase of $2.149 billion, or 9 percent, compared with $25.269 billion in 2022. The increase was due to favorable price realization, partially offset by lower sales volume. The decrease in sales volume was driven by the impact from changes in dealer inventories, that were about flatpartially offset by higher sales of equipment to end users. Dealer inventory increased more during 2021.2022 than during 2023.
•In North America, sales increased due to favorable price realization and higher end-user demand,sales volume. Higher sales volume was driven by higher sales of equipment to end users and the impact from changes in dealer inventories. Dealer inventory increased more during 2023 than during 2022.
•Sales decreased in Latin America primarily due to lower sales volume, partially offset by favorable price realization. Lower sales volume was driven by the impact from changes in dealer inventories and favorable price realization. Dealers decreased inventories more in 2020 than in 2021.
•Saleslower sales of equipment to end users. Dealer inventory increased in Latin America primarily due to the impact from changes in dealer inventories, higher end-user demand and favorable price realization. Dealers increased inventories during 2021,2022, compared with a decrease in 2020.during 2023.
•In EAME, sales increased due to higher end-user demand, the impact from changes in dealer inventoriesfavorable price realization and favorable currency impacts, from a strongerprimarily related to the euro, and British pound. Dealers increased inventories during 2021, compared with a decrease in 2020.
•Sales increased in Asia/Pacificpartially offset by lower sales volume. Lower sales volume was due to the impact from changes in dealer inventories and favorablelower sales of equipment to end users. Dealer inventory increased during 2022, compared with a decrease during 2023.
•Sales decreased in Asia/Pacific due to lower sales volume and unfavorable currency impacts, primarily related to the Japanese yen, Australian dollar and Chinese yuan, and Australian dollar. Dealers decreased inventories during 2020, compared with a slight increase in 2021.partially offset by favorable price realization. Lower sales volume was driven by lower sales of equipment to end users.
Construction Industries’ profit was $3.706$6.975 billion in 2021,2023, an increase of $1.333$2.232 billion, or 5647 percent, compared with $2.373$4.743 billion in 2020.2022. The increase was mainly due to favorable price realization.
Construction Industries’ profit as a percent of total sales was 25.4 percent in 2023, compared with 18.8 percent in 2022.
Resource Industries
Resource Industries’ total sales were $13.583 billion in 2023, an increase of $1.269 billion, or 10 percent, compared with $12.314 billion in 2022. The increase was due to favorable price realization, partially offset by lower sales volume. Sales volume decreased as higher sales of equipment to end users were more than offset by the impact from changes in dealer inventories and lower aftermarket parts sales volume. Dealer inventory increased more during 2022 than during 2023.
Resource Industries’ profit was $2.834 billion in 2023, an increase of $1.007 billion, or 55 percent, compared with $1.827 billion in 2022. The increase was mainly due to favorable price realization, partially offset by unfavorable manufacturing costs and currency impacts. Unfavorable manufacturing costs were driven by higher materials costs, the impact of manufacturing inefficiencies and unfavorable cost absorption, partially offset by lower freight. Cost absorption was unfavorable as inventory increased more during 2022 than during 2023.
Resource Industries’ profit as a percent of total sales was 20.9 percent for 2023, compared with 14.8 percent for 2022.
Energy & Transportation
| | | | | | | | | | | | | | | | | | | | | | | | | | |
| Sales by Application | | | | | | | | |
| (Millions of dollars) | | 2023 | | 2022 | | $
Change | | % Change |
| Oil and Gas | | $ | 6,988 | | | $ | 5,330 | | | $ | 1,658 | | | 31 | % |
| Power Generation | | 6,362 | | | 4,940 | | | 1,422 | | | 29 | % |
| Industrial | | 4,871 | | | 4,426 | | | 445 | | | 10 | % |
| Transportation | | 5,134 | | | 4,641 | | | 493 | | | 11 | % |
| External Sales | | 23,355 | | | 19,337 | | | 4,018 | | | 21 | % |
| Inter-Segment | | 4,646 | | | 4,415 | | | 231 | | | 5 | % |
| Total Sales | | $ | 28,001 | | | $ | 23,752 | | | $ | 4,249 | | | 18 | % |
| | | | | | | | |
| | | | | | | | |
Energy & Transportation’s total sales were $28.001 billion in 2023, an increase of $4.249 billion, or 18 percent, compared with $23.752 billion in 2022. Sales increased across all applications and inter-segment sales. The increase in sales was primarily due to higher sales volume and favorable price realization.
•Oil and Gas – Sales increased for turbines and turbine-related services. Sales also increased in reciprocating engines used in well servicing and gas compression applications.
•Power Generation – Sales increased in large reciprocating engines, primarily data center applications, and small reciprocating engines. Turbines and turbine-related services increased as well.
•Industrial – Sales were up across all regions.
•Transportation – Sales increased in rail services and marine. International locomotive deliveries were also higher.
Energy & Transportation’s profit was $4.936 billion in 2023, an increase of $1.627 billion, or 49 percent, compared with $3.309 billion in 2022. The increase was mainly due to favorable price realization and higher sales volume, partially offset by unfavorable manufacturing costs and higher SG&A/R&D expenses.
Unfavorable manufacturing costs reflected higher material costs, increased variable labor and burden, primarily freight, and higher period manufacturing costs. The increase in period manufacturing costs was driven by higher short-term incentive compensation expense and higher labor costs.
Higher SG&A/R&D expenses were driven primarily by higher short-term incentive compensation expense.
Construction Industries’ profit as a percent of total sales was 16.8 percent in 2021, compared with 14.0 percent in 2020.
Resource Industries
Resource Industries’ total sales were $9.963 billion in 2021, an increase of $2.057 billion, or 26 percent, compared with $7.906 billion in 2020. The increase was due to higher sales volume driven by higher end-user demand for equipment and aftermarket parts and the impact from changes in dealer inventories. End-user demand was higher in mining as well as heavy construction and quarry and aggregates. Dealers decreased inventories more during 2020 than during 2021.
Resource Industries’ profit was $1.291 billion in 2021, an increase of $395 million, or 44 percent, compared with $896 million in 2020. The increase was mainly due to higher sales volume and favorable price realization, partially offset by unfavorable manufacturing costs and higher SG&A/R&D expenses.
Unfavorable manufacturing costs reflected higher variable labor and burden, primarily freight, as well as higher material and period manufacturing costs, partially offset by the favorable impact of cost absorption. Higher period manufacturing costs were driven by higher short-term incentive compensation expense. Cost absorption was favorable as inventorymaterial costs, increased during 2021, compared with a decrease during 2020.
Higherperiod manufacturing costs and the impact of manufacturing inefficiencies, partially offset by lower freight. The increase in SG&A/R&D expenses werewas primarily driven primarily by investments aligned with strategic initiatives and higher short-term incentive compensation expense and investments aligned with growth initiatives, primarily labor costs.
Resource Industries’ profit as a percent of total sales was 13.0 percent for 2021, compared with 11.3 percent for 2020.
Energy & Transportation
| | | | | | | | | | | | | | | | | | | | | | | | | | |
| Sales by Application | | | | | | | | |
| (Millions of dollars) | | 2021 | | 2020 | | $
Change | | % Change |
| Oil and Gas | | $ | 4,460 | | | $ | 3,701 | | | $ | 759 | | | 21 | % |
| Power Generation | | 4,292 | | | 3,963 | | | 329 | | | 8 | % |
| Industrial | | 3,612 | | | 2,945 | | | 667 | | | 23 | % |
| Transportation | | 4,306 | | | 4,055 | | | 251 | | | 6 | % |
| External Sales | | 16,670 | | | 14,664 | | | 2,006 | | | 14 | % |
| Inter-Segment | | 3,617 | | | 2,806 | | | 811 | | | 29 | % |
| Total Sales | | $ | 20,287 | | | $ | 17,470 | | | $ | 2,817 | | | 16 | % |
| | | | | | | | |
| | | | | | | | |
Energy & Transportation’s total sales were $20.287 billion in 2021, an increase of $2.817 billion, or 16 percent, compared with $17.470 billion in 2020. Sales increased across all applications and inter-segment sales.
•Oil and Gas – Sales increased mainly due to higher sales of reciprocating engine aftermarket parts in all regions as well as higher sales in turbines and turbine-related services.
•Power Generation – Sales increased due to higher sales of aftermarket parts and large reciprocating engines, primarily data centers. Sales also increased due to favorable currency impacts.
•Industrial – Sales increased due to higher demand across all regions.
•Transportation – Sales increased due to higher deliveries of locomotives, which were primarily international, and rail services. Sales also increased due to favorable currency impacts.
Energy & Transportation’s profit was $2.768 billion in 2021, an increase of $363 million, or 15 percent, compared with $2.405 billion in 2020. The increase was due to higher sales volume and favorable price realization, partially offset by unfavorable manufacturing costs and higher SG&A/R&D expenses. Increased manufacturing costs were mainly driven by higher period manufacturing costs and higher variable labor and burden, primarily freight. In addition, segment profit was favorably impacted by lower other operating expense.
Both SG&A/R&D expenses and period manufacturing costs were driven by higher short-term incentive compensation expense and investments aligned with growth initiatives, including acquisition-related expenses.
Energy & Transportation’s profit as a percent of total sales was 13.617.6 percent in 2021,2023, compared with 13.813.9 percent in 2020.2022.
Financial Products Segment
Financial Products’ segment revenues were $3.073$3.785 billion in 2021,2023, an increase of $29$532 million, or 1 percent, from 2020.
Financial Products’ segment profit was $908 million in 2021, an increase of $318 million, or 5416 percent, compared with $590 million$3.253 billion in 2020.2022. The increase was primarily due to higher average financing rates across all regions.
Financial Products’ segment profit was $909 million in 2023, an increase of $45 million, or 5 percent, compared with $864 million in 2022. The increase was mainly due to higher net yield on average earning assets and lower provision for credit losses at Cat Financial, a favorable impact from returned or repossessed equipment and a favorable impact from equity securities in Insurance Services. These favorable impacts were partially offset by an increase in SG&A expenses primarily due to higher short-term incentive compensation expense.expenses.
At the end of 2021, past dues at Cat Financial were 1.95 percent, compared with 3.49 percent at the end of 2020. Past dues decreased across all portfolio segments as global markets generally improved. Write-offs, net of recoveries, were $205 million for 2021, compared with $222 million for 2020. As of December 31, 2021, Cat Financial's allowance for credit losses totaled $337 million, or 1.22 percent of finance receivables, compared with $479 million, or 1.77 percent of finance receivables at December 31, 2020.
Corporate Items and EliminationsCONSOLIDATED OPERATING PROFIT
Expense for corporate items and eliminations was $1.480 billion in 2021, a slight increase of $46 million from 2020.
FOURTH QUARTER 2021 COMPARED WITH FOURTH QUARTER 2020
CONSOLIDATED SALES AND REVENUES
The chart above graphically illustrates reasons for the change in consolidated sales and revenuesoperating profit between the fourth quarter of 20202022 (at left) and the fourth quarter of 20212023 (at right). Caterpillar management utilizes these charts internally to visually communicate with the company’s Boardboard of Directorsdirectors and employees. The bar entitled Other includes consolidating adjustments and Machinery, Energy & Transportation other operating (income) expenses.
Total sales and revenues for the fourth quarter of 2021 were $13.798Operating profit was $12.966 billion in 2023, an increase of $2.563$5.062 billion, or 2364 percent, compared with $11.235$7.904 billion in 2022. The increase was primarily due to favorable price realization, higher sales volume and the absence of a 2022 goodwill impairment charge related to the Rail division, partially offset by higher SG&A/R&D expenses, unfavorable manufacturing costs and the impact of the divestiture of the company's Longwall business. The increase in SG&A/R&D expenses was primarily driven by investments aligned with strategic initiatives, higher short-term incentive compensation expense and an unfavorable change in fair value adjustments related to deferred compensation plans. Unfavorable manufacturing costs reflected lower freight being more than offset by higher material costs, increased period manufacturing costs, the impact of manufacturing inefficiencies and unfavorable cost absorption. Cost absorption was unfavorable as inventory increased more during 2022 than during 2023.
Short-term incentive compensation expense is directly related to financial and operational performance, measured against targets set annually. Expense for 2023 was about $1.7 billion, compared with $1.4 billion in 2022. For 2024, we expect short-term incentive compensation expense will be about $1.2 billion.
In the first quarter of 2023, the divestiture of the company’s Longwall business was finalized, resulting in an unfavorable impact to operating profit of $586 million, primarily a non-cash item driven by the release of accumulated foreign currency translation.
Operating profit margin was 19.3 percent in 2023, compared with 13.3 percent in 2022.
| | | | | | | | | | | | | | | | | | | | | | | | | | |
| Profit (Loss) by Segment | | | | | | | | |
| (Millions of dollars) | | 2023 | | 2022 | | $
Change | | %
Change |
| Construction Industries | | $ | 6,975 | | | $ | 4,743 | | | $ | 2,232 | | | 47 | % |
| Resource Industries | | 2,834 | | | 1,827 | | | 1,007 | | | 55 | % |
| Energy & Transportation | | 4,936 | | | 3,309 | | | 1,627 | | | 49 | % |
| All Other Segment | | 18 | | | (11) | | | 29 | | | 264 | % |
| Corporate Items and Eliminations | | (2,104) | | | (2,435) | | | 331 | | | |
| Machinery, Energy & Transportation | | 12,659 | | | 7,433 | | | 5,226 | | | 70 | % |
| | | | | | | | |
| Financial Products Segment | | 909 | | | 864 | | | 45 | | | 5 | % |
| Corporate Items and Eliminations | | 14 | | | 26 | | | (12) | | | |
| Financial Products | | 923 | | | 890 | | | 33 | | | 4 | % |
| Consolidating Adjustments | | (616) | | | (419) | | | (197) | | | |
| Consolidated Operating Profit | | $ | 12,966 | | | $ | 7,904 | | | $ | 5,062 | | | 64 | % |
| | | | | | | | |
Other Profit/Loss and Tax Items
•Interest expense excluding Financial Products in 2023 was $511 million, compared with $443 million in 2022. The increase was due to higher average borrowing rates.
•Other income (expense) in 2023 was income of $595 million, compared with income of $1.291 billion in 2022. The change was primarily driven by lower mark-to-market gains for remeasurement of pension and OPEB plans and unfavorable impacts from pension and OPEB plan costs and foreign currency exchange, partially offset by higher investment and interest income.
•The provision for income taxes for 2023 reflected an annual effective tax rate of 21.4 percent, compared with 23.2 percent for 2022, excluding the discrete items discussed below. The decrease from 2022 was primarily related to changes in the geographic mix of profits from a tax perspective.
The 2023 annual effective tax rate excludes the impact of the nondeductible loss of $586 million related to the divestiture of the company’s Longwall business. The company also recorded a tax charge of $26 million related to $97 million of pension and OPEB mark-to-market gains in the fourth quarter of 2020.2023, compared to a tax charge of $124 million related to $606 million of mark-to-market gains in the fourth quarter of 2022. In addition, the company recorded a discrete tax benefit of $57 million in 2023 for the settlement of stock-based compensation awards with associated tax deductions in excess of cumulative U.S. GAAP compensation expense, compared with a $33 million benefit for 2022. In 2023, the company recorded a discrete tax benefit of $88 million due to a change in the valuation allowance for certain non-U.S. deferred tax assets. In 2022, the company also recorded discrete benefits of $90 million to reflect changes in estimates related to prior years and a tax benefit of $36 million related to the goodwill impairment charge of $925 million.
Construction Industries
Construction Industries’ total sales were $27.418 billion in 2023, an increase of $2.149 billion, or 9 percent, compared with $25.269 billion in 2022. The increase was mostly due to favorable price realization, partially offset by lower sales volume. The decrease in sales volume was driven by the impact from changes in dealer inventories, partially offset by higher sales of equipment to end users. Dealer inventory increased more during 2022 than during 2023.
•In North America, sales increased due to favorable price realization and higher sales volume. Higher sales volume was driven by higher end-user demand forsales of equipment and servicesto end users and the impact from changes in dealer inventories, along withinventories. Dealer inventory increased more during 2023 than during 2022.
•Sales decreased in Latin America primarily due to lower sales volume, partially offset by favorable price realization. Dealers decreasedLower sales volume was driven by the impact from changes in dealer inventories and lower sales of equipment to end users. Dealer inventory increased during the fourth quarter of 2020,2022, compared to remaining about flatwith a decrease during the fourth quarter of 2021.2023.
Sales were higher across the three primary segments.
North America•In EAME, sales increased 29 percentdue to favorable price realization and favorable currency impacts, primarily related to the euro, partially offset by lower sales volume. Lower sales volume was due to the impact from changes in dealer inventories higher end-user demand for services and lower sales of equipment to end users. Dealer inventory increased during 2022, compared with a decrease during 2023.
•Sales decreased in Asia/Pacific due to lower sales volume and unfavorable currency impacts, primarily related to the Japanese yen, Australian dollar and Chinese yuan, partially offset by favorable price realization. Dealers decreased inventories during the fourth quarterLower sales volume was driven by lower sales of 2020,equipment to end users.
Construction Industries’ profit was $6.975 billion in 2023, an increase of $2.232 billion, or 47 percent, compared with dealer inventories that were about flat during the fourth quarter of 2021.
Sales increased 40 percent$4.743 billion in Latin America primarily2022. The increase was mainly due to higher end-user demand for equipment and services and favorable price realization.
EAMEConstruction Industries’ profit as a percent of total sales increased 24was 25.4 percent primarilyin 2023, compared with 18.8 percent in 2022.
Resource Industries
Resource Industries’ total sales were $13.583 billion in 2023, an increase of $1.269 billion, or 10 percent, compared with $12.314 billion in 2022. The increase was due to favorable price realization, partially offset by lower sales volume. Sales volume decreased as higher end-user demand forsales of equipment and services and the impact from changes in dealer inventories. Dealers decreased inventoriesto end users were more during the fourth quarter of 2020 than during the fourth quarter of 2021.
Asia/Pacific sales increased 9 percent primarily due tooffset by the impact from changes in dealer inventories higher end-user demand for equipment and services andlower aftermarket parts sales volume. Dealer inventory increased more during 2022 than during 2023.
Resource Industries’ profit was $2.834 billion in 2023, an increase of $1.007 billion, or 55 percent, compared with $1.827 billion in 2022. The increase was mainly due to favorable price realization. Dealers decreased inventoriesrealization, partially offset by unfavorable manufacturing costs and currency impacts. Unfavorable manufacturing costs were driven by higher materials costs, the impact of manufacturing inefficiencies and unfavorable cost absorption, partially offset by lower freight. Cost absorption was unfavorable as inventory increased more during the fourth quarter of 2020, compared with an increase2022 than during the fourth quarter of 2021.
Dealers decreased inventories about $1.100 billion during the fourth quarter of 2020, compared to a decrease of about $100 million during the fourth quarter of 2021. Dealers are independent, and the reasons for changes in their inventory levels vary, including their expectations of future demand and product delivery times. Dealers’ demand expectations take into account seasonal changes, macroeconomic conditions, machine rental rates and other factors. Delivery times can vary based on availability of product from Caterpillar factories and product distribution centers.
| | | | | | | | | | | | | | | | | | | | | | | | | | | | | | | | | | | | | | | | | | | | | | | | | | | | |
| Sales and Revenues by Segment |
| (Millions of dollars) | | Fourth Quarter 2020 | | Sales
Volume | | Price
Realization | | Currency | | | | Inter-Segment / Other | | Fourth Quarter 2021 | | $
Change | | %
Change |
| Construction Industries | | $ | 4,508 | | | $ | 929 | | | $ | 299 | | | $ | (23) | | | | | $ | 23 | | | $ | 5,736 | | | $ | 1,228 | | | 27 | % |
| Resource Industries | | 2,180 | | | 467 | | | 121 | | | 2 | | | | | (8) | | | 2,762 | | | 582 | | | 27 | % |
| Energy & Transportation | | 4,811 | | | 640 | | | 88 | | | (7) | | | | | 196 | | | 5,728 | | | 917 | | | 19 | % |
| All Other Segment | | 137 | | | 7 | | | — | | | (1) | | | | | (9) | | | 134 | | | (3) | | | (2 | %) |
| Corporate Items and Eliminations | | (1,066) | | | 6 | | | (1) | | | — | | | | | (202) | | | (1,263) | | | (197) | | | |
| Machinery, Energy & Transportation | | 10,570 | | | 2,049 | | | 507 | | | (29) | | | | | — | | | 13,097 | | | 2,527 | | | 24 | % |
| | | | | | | | | | | | | | | | | | |
| Financial Products Segment | | 743 | | | — | | | — | | | — | | | | | 33 | | | 776 | | | 33 | | | 4 | % |
| Corporate Items and Eliminations | | (78) | | | — | | | — | | | — | | | | | 3 | | | (75) | | | 3 | | | |
| Financial Products Revenues | | 665 | | | — | | | — | | | — | | | | | 36 | | | 701 | | | 36 | | | 5 | % |
| | | | | | | | | | | | | | | | | | |
| Consolidated Sales and Revenues | | $ | 11,235 | | | $ | 2,049 | | | $ | 507 | | | $ | (29) | | | | | $ | 36 | | | $ | 13,798 | | | $ | 2,563 | | | 23 | % |
| | | | | | | | | | | | | | | | | | |
| | | | | | | | | | | | | | | | | | | | | | | | | | | | | | | | | | | | | | | | | | | | | | | | | | | | | | | | | | | | | | | | | | | | | | | | | | | | | | | | | | | |
| Sales and Revenues by Geographic Region |
| North America | | Latin America | | EAME | | Asia/Pacific | | External Sales and Revenues | | Inter-Segment | | Total Sales and Revenues |
| (Millions of dollars) | $ | | % Chg | | $ | | % Chg | | $ | | % Chg | | $ | | % Chg | | $ | | % Chg | | $ | | % Chg | | $ | | % Chg |
| Fourth Quarter 2021 | | | | | | | | | | | | | | | | | | | | | | | | | | | |
| Construction Industries | $ | 2,635 | | | 39% | | $ | 563 | | | 74% | | $ | 1,246 | | | 47% | | $ | 1,245 | | | (12%) | | $ | 5,689 | | | 27% | | $ | 47 | | | 96% | | $ | 5,736 | | | 27 | % |
| Resource Industries | 857 | | | 44% | | 415 | | | 5% | | 532 | | | 29% | | 839 | | | 29% | | 2,643 | | | 29% | | 119 | | | (6%) | | 2,762 | | | 27 | % |
| Energy & Transportation | 1,913 | | | 12% | | 398 | | | 50% | | 1,475 | | | 9% | | 965 | | | 36% | | 4,751 | | | 18% | | 977 | | | 25% | | 5,728 | | | 19 | % |
| All Other Segment | 14 | | | 180% | | 1 | | | —% | | 8 | | | (11%) | | 15 | | | (17%) | | 38 | | | 19% | | 96 | | | (9%) | | 134 | | | (2 | %) |
| Corporate Items and Eliminations | (17) | | | | | — | | | | | — | | | | | (7) | | | | | (24) | | | | | (1,239) | | | | | (1,263) | | | |
| Machinery, Energy & Transportation | 5,402 | | | 29% | | 1,377 | | | 40% | | 3,261 | | | 24% | | 3,057 | | | 9% | | 13,097 | | | 24% | | — | | | —% | | 13,097 | | | 24 | % |
| | | | | | | | | | | | | | | | | | | | | | | | | | | |
| Financial Products Segment | 493 | | | 6% | | 70 | | | 9% | | 101 | | | 7% | | 112 | | | (7%) | | 776 | | 1 | 4% | | — | | | —% | | 776 | | | 4 | % |
| Corporate Items and Eliminations | (37) | | | | | (15) | | | | | (9) | | | | | (14) | | | | | (75) | | | | | — | | | | | (75) | | | |
| Financial Products Revenues | 456 | | | 8% | | 55 | | | 2% | | 92 | | | 10% | | 98 | | | (6%) | | 701 | | | 5% | | — | | | —% | | 701 | | | 5 | % |
| | | | | | | | | | | | | | | | | | | | | | | | | | | |
| Consolidated Sales and Revenues | $ | 5,858 | | | 27% | | $ | 1,432 | | | 38% | | $ | 3,353 | | | 24% | | $ | 3,155 | | | 9% | | $ | 13,798 | | | 23% | | $ | — | | | —% | | $ | 13,798 | | | 23 | % |
| | | | | | | | | | | | | | | | | | | | | | | | | | | |
| Fourth Quarter 2020 | | | | | | | | | | | | | | | | | | | | | | | | | | | |
| Construction Industries | $ | 1,895 | | | | | $ | 324 | | | | | $ | 848 | | | | | $ | 1,417 | | | | | $ | 4,484 | | | | | $ | 24 | | | | | $ | 4,508 | | | |
| Resource Industries | 596 | | | | | 394 | | | | | 412 | | | | | 651 | | | | | 2,053 | | | | | 127 | | | | | 2,180 | | | |
| Energy & Transportation | 1,705 | | | | | 265 | | | | | 1,353 | | | | | 707 | | | | | 4,030 | | | | | 781 | | | | | 4,811 | | | |
| All Other Segment | 5 | | | | | — | | | | | 9 | | | | | 18 | | | | | 32 | | | | | 105 | | | | | 137 | | | |
| Corporate Items and Eliminations | (27) | | | | | 1 | | | | | (2) | | | | | (1) | | | | | (29) | | | | | (1,037) | | | | | (1,066) | | | |
| Machinery, Energy & Transportation | 4,174 | | | | | 984 | | | | | 2,620 | | | | | 2,792 | | | | | 10,570 | | | | | — | | | | | 10,570 | | | |
| | | | | | | | | | | | | | | | | | | | | | | | | | | |
| Financial Products Segment | 464 | | | | | 64 | | | | | 94 | | | | | 121 | | | | | 743 | | 1 | | | — | | | | | 743 | | | |
| Corporate Items and Eliminations | (41) | | | | | (10) | | | | | (10) | | | | | (17) | | | | | (78) | | | | | — | | | | | (78) | | | |
| Financial Products Revenues | 423 | | | | | 54 | | | | | 84 | | | | | 104 | | | | | 665 | | | | | — | | | | | 665 | | | |
| | | | | | | | | | | | | | | | | | | | | | | | | | | |
| Consolidated Sales and Revenues | $ | 4,597 | | | | | $ | 1,038 | | | | | $ | 2,704 | | | | | $ | 2,896 | | | | | $ | 11,235 | | | | | $ | — | | | | | $ | 11,235 | | | |
| | | | | | | | | | | | | | | | | | | | | | | | | | | |
1 Includes revenues from Machinery, Energy & Transportation of $88 million for both the three months ended December 31, 2021 and 2020. |
| | | | | | | | | | | | | | | | | | | | | | | | | | |
| Sales by Application | | | | | | | | |
| (Millions of dollars) | | 2023 | | 2022 | | $
Change | | % Change |
| Oil and Gas | | $ | 6,988 | | | $ | 5,330 | | | $ | 1,658 | | | 31 | % |
| Power Generation | | 6,362 | | | 4,940 | | | 1,422 | | | 29 | % |
| Industrial | | 4,871 | | | 4,426 | | | 445 | | | 10 | % |
| Transportation | | 5,134 | | | 4,641 | | | 493 | | | 11 | % |
| External Sales | | 23,355 | | | 19,337 | | | 4,018 | | | 21 | % |
| Inter-Segment | | 4,646 | | | 4,415 | | | 231 | | | 5 | % |
| Total Sales | | $ | 28,001 | | | $ | 23,752 | | | $ | 4,249 | | | 18 | % |
| | | | | | | | |
| | | | | | | | |
Energy & Transportation’s total sales were $28.001 billion in 2023, an increase of $4.249 billion, or 18 percent, compared with $23.752 billion in 2022. Sales increased across all applications and inter-segment sales. The increase in sales was primarily due to higher sales volume and favorable price realization.
Table•Oil and Gas – Sales increased for turbines and turbine-related services. Sales also increased in reciprocating engines used in well servicing and gas compression applications.•Power Generation – Sales increased in large reciprocating engines, primarily data center applications, and small reciprocating engines. Turbines and turbine-related services increased as well.
•Industrial – Sales were up across all regions.
•Transportation – Sales increased in rail services and marine. International locomotive deliveries were also higher.
Energy & Transportation’s profit was $4.936 billion in 2023, an increase of Contents$1.627 billion, or 49 percent, compared with $3.309 billion in 2022. The increase was mainly due to favorable price realization and higher sales volume, partially offset by unfavorable manufacturing costs and higher SG&A/R&D expenses. Unfavorable manufacturing costs were driven by higher material costs, increased period manufacturing costs and the impact of manufacturing inefficiencies, partially offset by lower freight. The increase in SG&A/R&D expenses was primarily driven by investments aligned with strategic initiatives and higher short-term incentive compensation expense.
Energy & Transportation’s profit as a percent of total sales was 17.6 percent in 2023, compared with 13.9 percent in 2022.
Financial Products Segment
Financial Products’ segment revenues were $3.785 billion in 2023, an increase of $532 million, or 16 percent, compared with $3.253 billion in 2022. The increase was primarily due to higher average financing rates across all regions.
Financial Products’ segment profit was $909 million in 2023, an increase of $45 million, or 5 percent, compared with $864 million in 2022. The increase was mainly due to higher net yield on average earning assets and lower provision for credit losses at Cat Financial, partially offset by an increase in SG&A expenses.
CONSOLIDATED OPERATING PROFITConstruction Industries
Our Construction Industries segment is primarily responsible for supporting customers using machinery in infrastructure and building construction. The majority of machine sales in this segment are made in the heavy and general construction, rental, quarry and aggregates and mining.
The nature of customer demand for construction machinery varies around the world. Customers in developing economies often prioritize purchase price in making their investment decisions, while customers in developed economies generally weigh productivity and other performance criteria that contribute to lower owning and operating costs over the lifetime of the machine. To meet customer expectations in developing economies, Caterpillar developed differentiated product offerings that target customers in those regions, including our SEM brand machines. We believe that these customer-driven product innovations enable us to compete more effectively in developing economies. The majority of Construction Industries' research and development spending in 2023 focused on the next generation of construction machines.
The competitive environment for construction machinery is characterized by some global competitors and many regional and specialized local competitors.Examples of global competitors include CASE (part of CNH Industrial N.V.), Deere Construction & Forestry (part of Deere & Company), Doosan Bobcat (Part of Doosan Group), Hitachi Construction Machinery Co., Ltd., Hyundai Construction Equipment Co., Ltd., Hyundai Doosan Infracore Co., Ltd. (both part of Hyundai Heavy Industries Group), J.C. Bamford Excavators Ltd., Kobelco Construction Machinery (part of Kobe Steel, Ltd), Komatsu Ltd., Kubota Farm & Industrial Machinery (part of Kubota Corporation), Sany Heavy Industry Co., Ltd., and Volvo Construction Equipment (part of the Volvo Group).As an example of regional and local competitors, our competitors in China also include Guangxi LiuGong Machinery Co., Ltd., Longking Holdings Ltd., Sany Heavy Industry Co, XCMG Construction Machinery Co., Ltd., Shandong Lingong Construction Machinery Co., Ltd. (SDLG, JV with Volvo Construction Equipment) and Shantui Construction Machinery Co., Ltd., (part of Shandong Heavy Industry Group Co.).Each of these companies has varying product lines that compete with Caterpillar products, and each has varying degrees of regional focus.
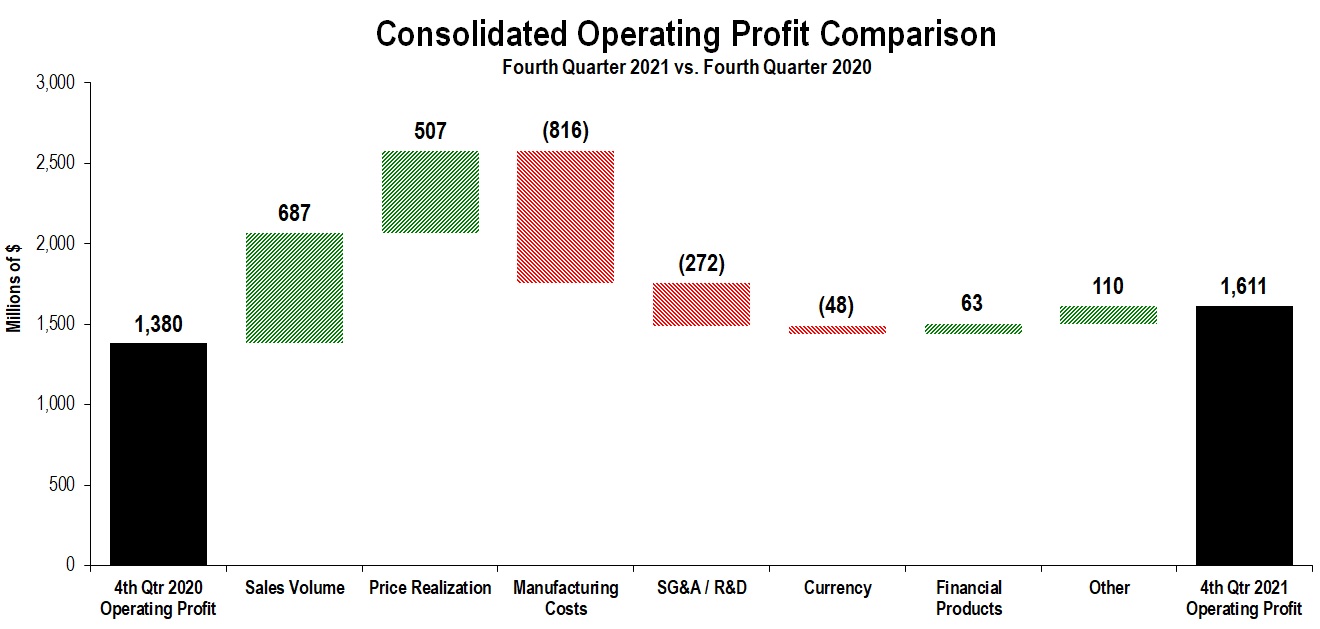
| | | | | | | | | | | | | | |
| · asphalt pavers | | · motor graders | | · track-type tractors (small, medium) |
| · backhoe loaders | | · pipelayers | | · track excavators (mini, small |
| · cold planers | | · road reclaimers | | medium, large) |
| · compactors | | · skid steer loaders | | · wheel excavators |
| · compact track loaders | | · telehandlers | | · wheel loaders (compact, small,
|
| · forestry machines | | · track-type loaders | | medium) |
| · material handlers | | | | |
Resource Industries
The Resource Industries segment is primarily responsible for supporting customers using machinery in mining and heavy construction and quarry and aggregates. Caterpillar offers a broad product range and services to deliver comprehensive solutions for our customers. We develop and manufacture high productivity equipment for both surface and underground mining operations around the world, as well as provide hydraulic systems, electronics and software for Caterpillar machines and engines.Our equipment is used to extract and haul copper, iron ore, coal, oil sands, aggregates, gold and other minerals and ores, as well as a variety of heavy construction applications.In addition to equipment, Resource Industries also develops and sells technology products and services to provide customers fleet management systems, equipment management analytics and autonomous machine capabilities.
Customers in most markets place an emphasis on equipment that is highly productive, reliable and provides the lowest total cost of ownership over the life of the equipment.In some developing markets, customers often prioritize purchase price in making their investment decisions. We believe our ability to control the integration and design of key machine components and innovative technologies represents a competitive advantage. Our research and development efforts remain focused on providing customers the lowest total cost of ownership enabled through the highest quality, most productive products and services in the industry.
The competitive environment for Resource Industries consists of a few larger global competitors that compete in several of the markets that we serve and a substantial number of smaller companies that compete in a more limited range of products, applications, and regional markets. Our global surface competitors include Deere Construction & Forestry (part of Deere & Company), Epiroc AB, Hitachi Construction Machinery Co., Ltd., Komatsu Ltd., Liebherr-International AG, Sandvik AB, and Volvo Construction Equipment. Our global underground competitors include Epiroc AB, Komatsu Ltd., and Sandvik AB.
The Resource Industries product portfolio includes the following machines and related parts and services:
| | | | | | | | | | | | | | |
·electric rope shovels | | ·large wheel loaders | | ·soil compactors |
·draglines | | ·off-highway trucks | | ·machinery components |
·hydraulic shovels | | ·articulated trucks | | ·autonomous ready vehicles and solutions |
·rotary drills | | ·wheel tractor scrapers | | ·select work tools |
·hard rock vehicles | | ·wheel dozers | | ·safety services and mining performance |
·large track-type tractors | | ·fleet management | | solutions |
·large mining trucks | | ·landfill compactors | | |
| | | | |
| | | | |
| | | | |
| | | | |
| | | | |
Energy & Transportation
Our Energy & Transportation segment supports customers in oil and gas, power generation, marine, rail and industrial applications, including Caterpillar machines. The product and services portfolio includes reciprocating engines, generator sets, integrated systems and solutions, turbines and turbine-related services, electrified powertrain and zero-emission power sources and service solutions development, the remanufacturing of Caterpillar engines and components, remanufacturing services for other companies, diesel-electric locomotives and other rail-related products and services and product support of on-highway vocational trucks for North America.
Regulatory emissions standards require us to continue to make investments as new products and new regulations are introduced. Ongoing compliance with these regulations remains a focus. Emissions compliance in developing markets is complex due to rapidly evolving and unique requirements where enforcement processes can often vary. We employ robust product development, manufacturing processes and testing to help us comply with these regulations.
The competitive environment for reciprocating engines in marine, oil and gas, industrial and electric power generation systems along with turbines in oil and gas and electric power generation consists of a few larger global competitors that compete in a variety of markets that Caterpillar serves, and a substantial number of smaller companies that compete in a limited-size product range, geographic region and/or application. Principal global competitors include Cummins Inc., Deutz AG, Rolls-Royce Power Systems and Siemens Energy Global GmbH. Other competitors, such as Volvo Penta AB, FPT Industrial (Iveco Group), INNIO, GE Vernova, Kawasaki Heavy Industries Energy Solution & Marine Engineering, MAN Energy Solutions (VW), Weichai Power Co., Ltd., and other emerging market competitors compete in certain markets in which Caterpillar competes. An additional set of competitors, including Aggreko plc, Generac Holdings, Kohler Energy, Baker Hughes Co., and others, are primarily packagers who source engines and/or other components from domestic and international suppliers and market products regionally and internationally through a variety of distribution channels. In rail-related businesses, our global competitors include Wabtec Freight, The Greenbrier Companies, Voestalpine AG, and Vossloh AG, Alstom SA, Siemens Mobility, and CRRC Corp., LTD. We also compete with other companies on a more limited range of products, services and/or geographic regions.
The Energy & Transportation portfolio includes the following products and related parts:
•Reciprocating engine powered generator sets
•Reciprocating engines, drivetrain and integrated systems and solutions supplied to the industrial industry as well as Caterpillar machinery
•Integrated systems and solutions used in the electric power generation industry
•Turbines, centrifugal gas compressors and related services
•Reciprocating engines, drivetrain and integrated systems and solutions for the marine and oil and gas industries
•Diesel-electric locomotives and components and other rail-related products and services
Financial Products Segment
The business of our Financial Products Segment is primarily conducted by Cat Financial, Insurance Services and their respective subsidiaries and affiliates. Cat Financial is a wholly owned finance subsidiary of Caterpillar Inc. and it provides retail and wholesale financing alternatives to customers and dealers around the world for Caterpillar products and services, as well as financing for vehicles and power generation facilities that, in most cases, incorporate Caterpillar products. Retail financing is primarily comprised of installment sale contracts and other equipment-related loans, working capital loans, finance leases and operating leases. Wholesale financing to Caterpillar dealers consists primarily of inventory and rental fleet financing. In addition, Cat Financial purchases short-term wholesale trade receivables from Caterpillar. The various financing plans offered by Cat Financial are designed to support sales of Caterpillar products and services and generate financing income for Cat Financial. A significant portion of our activity is conducted in North America and we have additional offices and subsidiaries in Latin America, Asia/Pacific, Europe and Africa.
For over 40 years, Cat Financial has been providing financing for Caterpillar products, contributing to our knowledge of asset values, industry trends, financing structures and customer needs.
In certain instances, Cat Financial’s operations are subject to supervision and regulation by state, federal and various foreign governmental authorities, and may be subject to various laws and judicial and administrative decisions imposing various requirements and restrictions which, among other things, (i) regulate credit granting activities and the administration of loans, (ii) establish maximum interest rates, finance charges and other charges, (iii) require disclosures to customers, (iv) govern secured transactions, (v) set collection, foreclosure, repossession and other trade practices and (vi) regulate the use and reporting of information related to a borrower’s credit experience. Cat Financial’s ability to comply with these and other governmental and legal requirements and restrictions affects its operations.
Cat Financial’s retail loans include:
•Loans that allow customers and dealers to use their Caterpillar equipment or other assets as collateral to obtain financing.
•Installment sale contracts, which are equipment loans that enable customers to purchase equipment with structured payments over time.
Cat Financial's retail leases include:
•Finance (non-tax) leases, where the lessee for tax purposes is considered to be the owner of the equipment during the term of the lease, that either require or allow the customer to purchase the equipment for a fixed price at the end of the term.
•Tax leases that are classified as either operating or finance leases for financial accounting purposes, depending on the characteristics of the lease. For tax purposes, we are considered the owner of the equipment.
Cat Financial also purchases short-term receivables from Caterpillar.
Cat Financial’s wholesale loans and leases include inventory/rental programs, which provide assistance to dealers by financing their new Caterpillar inventory and rental fleets.
Cat Financial operates in a highly competitive environment, with financing for users of Caterpillar equipment and services available through a variety of sources, principally commercial banks and finance and leasing companies. Our competitors include Wells Fargo Equipment Finance Inc., Banc of America Leasing & Capital LLC, BNP Paribas Leasing Solutions Limited, Australia and New Zealand Banking Group Limited, Société Générale S.A. and various other banks and finance companies. In addition, many of the manufacturers that compete with Caterpillar also own financial subsidiaries, such as John Deere Capital Corporation, Komatsu Financial L.P., Volvo Financial Services and Kubota Credit Corporation, which utilize many below-market interest rate programs (funded by the manufacturer) to support machine sales. Cat Financial works with the broader Caterpillar organization to provide a broad array of financial merchandising programs to compete around the world.
The financial results of Cat Financial are largely dependent upon the ability of Caterpillar dealers to sell equipment and customers’ willingness to enter into financing or leasing agreements. Cat Financial is also affected by, among other things, the availability of funds from its financing sources, its cost of funds relative to its competitors and general economic conditions such as inflation and market interest rates.
Cat Financial has a match-funding policy that addresses interest rate risk by aligning the interest rate profile (fixed or floating rate and duration) of its debt portfolio with the interest rate profile of its receivables portfolio within predetermined ranges on an ongoing basis. In connection with that policy, Cat Financial uses interest rate derivative instruments to modify the debt structure to match assets within the receivables portfolio. This matched funding reduces the volatility of margins between interest-bearing assets and interest-bearing liabilities, regardless of which direction interest rates move. For more information regarding match funding, please see Note 4 — “Derivative financial instruments and risk management” of Part II, Item 8 "Financial Statements and Supplementary Data." See also the risk factors associated with our financial products business included in Item 1 A. of this Form 10-K.
In managing foreign currency risk for Cat Financial’s operations, the objective is to minimize earnings volatility resulting from conversion and the remeasurement of net foreign currency balance sheet positions, and future transactions denominated in foreign currencies. This policy allows the use of foreign currency forward, option and cross currency contracts to offset the risk of currency mismatch between the assets and liabilities, and exchange rate risk associated with future transactions denominated in foreign currencies.
Cat Financial provides financing only when certain criteria are met. Credit decisions are based on a variety of credit quality factors including prior payment experience, customer financial information, credit ratings, loan-to-value ratios and other internal metrics. Cat Financial typically maintains a security interest in retail-financed equipment and generally requires physical damage insurance coverage on financed equipment. Cat Financial finances a significant portion of Caterpillar dealers’ sales and inventory of Caterpillar equipment throughout the world. Cat Financial’s competitive position is improved by marketing programs offered in conjunction with Caterpillar and/or Caterpillar dealers. Under these programs, Caterpillar, or the dealer, funds an amount at the outset of the transaction, which Cat Financial then recognizes as revenue over the term of the financing. We believe that these marketing programs provide Cat Financial a significant competitive advantage in financing Caterpillar products.
Caterpillar Insurance Company, a wholly owned subsidiary of Caterpillar Insurance Holdings Inc., is a U.S. insurance company domiciled in Missouri and primarily regulated by the Missouri Department of Insurance. Caterpillar Insurance Company is licensed to conduct property and casualty insurance business in 50 states, the District of Columbia and Guam, and as such, is also regulated in those jurisdictions. The State of Missouri acts as the lead regulatory authority and monitors Caterpillar Insurance Company’s financial status to ensure that it is in compliance with minimum solvency requirements, as well as other financial ratios prescribed by the National Association of Insurance Commissioners. Caterpillar Insurance Company is also licensed to conduct insurance business through a branch in Zurich, Switzerland and, as such, is regulated by the Swiss Financial Market Supervisory Authority.
Caterpillar Life Insurance Company, a wholly owned subsidiary of Caterpillar, is a U.S. insurance company domiciled in Missouri and primarily regulated by the Missouri Department of Insurance. Caterpillar Life Insurance Company is licensed to conduct life and accident and health insurance business in 26 states and the District of Columbia and, as such, is also regulated in those jurisdictions. The State of Missouri acts as the lead regulatory authority and it monitors the financial status to ensure that it is in compliance with minimum solvency requirements, as well as other financial ratios prescribed by the National Association of Insurance Commissioners. Caterpillar Life Insurance Company provides reinsurance coverage to Caterpillar Insurance Company. Specifically, Caterpillar Life Insurance Company has entered into a reinsurance agreement with Caterpillar Insurance Company, assuming 100% of the risk of an Accident and Health Stop Loss Insurance Policy to cover a Caterpillar Voluntary Employees' Benefits Association (VEBA) Trust for medical losses sustained by a select group of Caterpillar retirees and dependents.
Caterpillar Insurance Co. Ltd., a wholly owned subsidiary of Caterpillar Insurance Holdings Inc., is a captive insurance company domiciled in Bermuda and regulated by the Bermuda Monetary Authority. Caterpillar Insurance Co. Ltd. is registered as a Class 2 (General Business) and Class B (Long-Term) insurer with the Bermuda Monetary Authority. Under its Class 2 insurance license, Caterpillar Insurance Co. Ltd. insures its parent and affiliates for general liability, property, auto liability and cargo. It also provides reinsurance to Caterpillar Insurance Company under a quota share reinsurance agreement for its contractual liability and contractors’ equipment programs in the United States. In addition, Caterpillar Insurance Co. Ltd. reinsures 100% of the international employee benefit plans of Caterpillar Inc. through retrocession agreements with other insurers. The employee benefits coverages include medical and accident coverages. which are reported under its Class 2 insurance license and life and disability coverages, which are reported under its Class B insurance license. The Bermuda Monetary Authority is responsible for monitoring compliance with solvency requirements and requires an Annual Financial Filing for this purpose.
Caterpillar Insurance Services Corporation, a wholly owned subsidiary of Caterpillar Insurance Holdings Inc., is a Tennessee insurance agency licensed in all 50 states, the District of Columbia and Guam. It provides brokerage and insurance services for all property and casualty and life and health lines of business.
Caterpillar’s insurance group provides protection and service for claims under the following programs:
•Contractual Liability Insurance to insure certain service contract obligations of Caterpillar and its affiliates, Caterpillar dealers and original equipment manufacturers (OEMs).
•Cargo reinsurance for the worldwide cargo risks of Caterpillar products.
•Contractors’ Equipment Physical Damage Insurance for equipment manufactured by Caterpillar or OEMs, which is leased, rented or sold by third party dealers to customers.
•General liability, employer’s liability, auto liability and property insurance for Caterpillar.
•Life, disability, medical and accident reinsurance for Caterpillar's international employee benefits program (non-U.S.).
•Reinsurance to cover VEBA Trust for medical claims of certain Caterpillar retirees and dependents.
•Brokerage and insurance services for property and casualty and life and health business.
Competitive Environment
Caterpillar products and services are sold worldwide into a variety of highly competitive markets. In all markets, we compete on the basis of product performance, customer service, quality and price. From time to time, the intensity of competition results in price discounting in a particular industry or region. Such price discounting puts pressure on margins and can negatively impact operating profit. Outside the United States, certain competitors enjoy competitive advantages inherent to operating in their home countries or regions.
Raw Materials and Component Products
We source our raw materials and manufactured components from suppliers both domestically and internationally. These purchases include unformed materials and rough and finished parts. Unformed materials include a variety of steel products, which are then cut or formed to shape and machined in our facilities. Rough parts include various sized steel and iron castings and forgings, which are machined to final specification levels inside our facilities. Finished parts are ready to assemble components, which are made either to Caterpillar specifications or to supplier developed specifications. We machine and assemble some of the components used in our machines, engines and power generation units and to support our after-market dealer parts sales. We also purchase various goods and services used in production, logistics, offices and product development processes. We maintain global strategic sourcing models to meet our global facilities’ production needs while building long-term supplier relationships and leveraging enterprise spend. We expect our suppliers to maintain, at all times, industry-leading levels of quality and the ability to timely deliver raw materials and component products for our machine and engine products. However, in some cases, increases in demand or supply chain disruptions have led to parts and components constraints across some products. We use a variety of agreements with suppliers to protect our intellectual property and processes to monitor and mitigate risks of the supply base causing a business disruption. The risks monitored include supplier financial viability, the ability to increase or decrease production levels, business continuity, quality and delivery.
Patents and Trademarks
We own a number of patents and trademarks, which have been obtained over a period of years and relate to the products we manufacture and the services we provide. These patents and trademarks are generally considered beneficial to our business. We do not regard our business as being dependent upon any single patent or group of patents.
Order Backlog
The dollar amount of backlog believed to be firm was approximately $27.5 billion at December 31, 2023 and $30.4 billion at December 31, 2022. Compared with year-end 2022, the order backlog decreased across the three primary segments. Of the total backlog at December 31, 2023, approximately $5.8 billion was not expected to be filled in 2024.
Dealers and Distributors
We distribute our machines principally through a worldwide organization of dealers (dealer network), 43 located in the United States and 113 located outside the United States, serving 191 countries. We sell reciprocating engines principally through the dealer network and to other manufacturers for use in products. We also sell some of the reciprocating engines manufactured by our subsidiary Perkins Engines Company Limited through its worldwide network of 88 distributors covering 185 countries. We sell the FG Wilson branded electric power generation systems through its worldwide network of 110 distributors covering 109 countries.
Our dealers do not deal exclusively with our products; however, in most cases sales and servicing of our products are the dealers’ principal business. We sell some products, primarily turbines and locomotives, directly to end customers through sales forces employed by the company. At times, these employees are assisted by independent sales representatives.
While the large majority of our worldwide dealers are independently owned and operated, we own and operate a dealership in Japan that covers approximately 80% of the Japanese market: Nippon Caterpillar Division. We are currently operating this Japanese dealer directly and we report its results in the All Other operating segment. There are also three independent dealers in the Southern Region of Japan.
For Caterpillar-branded products, the company’s relationship with each of its independent dealers is memorialized in standard sales and service agreements. Pursuant to these agreements, the company grants the dealer the right to purchase and sell its products and to service the products in a specified geographic service territory. The company establishes prices to dealers after receiving input from dealers on transactional pricing in the marketplace. The company also agrees to defend its intellectual property and to provide warranty and technical support to the dealer. The agreement further grants the dealer a non-exclusive license to use the company’s trademarks, service marks and brand names. In some instances, a separate trademark agreement exists between the company and a dealer.
In exchange for these rights, the agreement obligates the dealer to develop and promote the sale of the company’s products to current and prospective customers in the dealer’s service territory. Each dealer agrees to employ adequate sales and support personnel to market, sell and promote the company’s products, demonstrate and exhibit the products, perform the company’s product improvement programs, inform the company concerning any features that might affect the safe operation of any of the company’s products and maintain detailed books and records of the dealer’s financial condition, sales and inventories and make these books and records available at the company’s reasonable request.
These sales and service agreements are terminable at will by either party primarily upon 90 days written notice.
Human Capital
Core Values
Caterpillar’s global workforce is united by Our Values In Action, Caterpillar’s Code of Conduct. Integrity, Excellence, Teamwork, Commitment and Sustainability provide the foundation for our values-based culture. Our diversity and inclusion principles are embedded in our values. Our values unite us, and reflect our diverse cultures, languages, geographies, and businesses, as one Caterpillar team.
Health and Safety
The health and safety of our employees is an important focus at Caterpillar, and we strive to continually reduce our recordable injuries utilizing programs that amplify our safety culture, globally. In 2023, the Company achieved a recordable injury frequency rate of 0.40, compared to the 2022 recordable injury frequency rate of 0.44. In addition, Caterpillar has refreshed our safety strategy to enhance our focus on preventing serious injuries and to encourage learning from those closest to the work.
Talent Development and Training
In addition to our focus on values and safety, we strive to continually attract, develop, engage, and retain a high-performing diverse global team that executes our enterprise strategy of long-term profitable growth.
We are committed to employee development and helping individuals reach their full potential, by making on-going investments in our team. Our global internships, engineering co-ops, and career programs for engineering, marketing, and manufacturing provide development opportunities for early career employees. We also have a continual focus on strengthening technical, professional and leadership capabilities at every level using contemporary learning strategies to foster high performance. Strategic talent reviews and succession planning occur at a minimum, annually, across our businesses.
Our leadership development programs focus on encouraging a variety of experiences to help employees broaden understanding and increase perspective. Our leadership curriculums include managing for inclusion and building resilient and high performing teams as core development principles. Additionally, skill-based programs to upskill our manufacturing employees are developed locally and tailored to the specific needs of the business.
Diversity and Inclusion
We are committed to fostering a diverse workforce and an inclusive environment that is representative of the many customers and communities we serve around the globe. Our strategic approach weaves diversity and inclusion seamlessly into the business, ensuring that the principles guide us in our daily operating rhythm. Our 14 Employee Resource Groups (ERGs), which are sponsored and supported by leadership, help ensure different voices and perspectives contribute to our strategy for long-term profitable growth. They also engage our employees, helping contribute to development and retention.
Our ERGs provide many contributions, such as mentoring programs that connect diverse employees with senior leaders who can support their career goals, partnerships with recruiters and diverse early career and professional organizations that can assist in strengthening the diverse talent pipeline and programs that educate and inform on the richness of the global cultures that we share.
Compensation, Benefits and Employee Insights
Providing competitive benefits and compensation underpins our commitment to our engaged and productive employees. Our pay-for-performance philosophy aligns employee’s individual contributions, behaviors and business results with individual rewards. Our comprehensive Total Health programs focus on purpose, as well as physical and mental health, emotional and social support, and financial wellness. The annual Employee Insights Survey provides all employees the opportunity to confidentially share their perspectives and engages leaders to listen, learn and respond to employee feedback to help foster a positive work environment.
Employment
Management aligns employment levels with the needs of the business. We believe we have the appropriate human capital resources to successfully operate and deliver our enterprise strategy. As of December 31, 2023, we employed about 113,200 full-time persons of whom approximately 62,400 were located outside the United States. In the United States, we employed approximately 50,800 full-time persons, most of whom are at-will employees and, therefore, not subject to any type of employment contract or agreement. At select business units, we have hired certain highly specialized employees under employment contracts that specify a term of employment, pay and other benefits.
| | | | | | | | | | | | | | |
| Full-Time Employees at Year-End | | | | |
| | 2023 | | 2022 | |
| Inside U.S. | 50,800 | | 48,200 | |
| Outside U.S. | 62,400 | | 60,900 | |
| Total | 113,200 | | 109,100 | |
| | | | |
| By Region: | | | | |
| North America | 51,200 | | 48,700 | |
| EAME | 16,600 | | 16,900 | |
| Latin America | 20,300 | | 19,100 | |
| Asia/Pacific | 25,100 | | 24,400 | |
| Total | 113,200 | | 109,100 | |
| | | | |
As of December 31, 2023, there were 7,973 hourly production employees in the United States who were covered by collective bargaining agreements with various labor unions, including The United Automobile, Aerospace and Agricultural Implement Workers of America (UAW), The International Association of Machinists and The United Steelworkers. Outside the United States, the company enters into employment contracts and agreements in those countries in which such relationships are mandatory or customary. The provisions of these agreements generally correspond in each case with the required or customary terms in the subject jurisdiction.
Environmental Matters
The company is regulated by federal, state and international environmental laws governing our use, transport and disposal of substances and control of emissions. In addition to governing our manufacturing and other operations, these laws often impact the development of our products, including, but not limited to, required compliance with air emissions standards applicable to internal combustion engines. We have made, and will continue to make, significant research and development and capital expenditures to comply with these emissions standards.
We are engaged in remedial activities at a number of locations, often with other companies, pursuant to federal and state laws. When it is probable we will pay remedial costs at a site, and those costs can be reasonably estimated, the investigation, remediation, and operating and maintenance costs of the remedial action are accrued against our earnings. Costs are accrued
based on consideration of currently available data and information with respect to each individual site, including available technologies, current applicable laws and regulations, and prior remediation experience. Where no amount within a range of estimates is more likely, we accrue the minimum. Where multiple potentially responsible parties are involved, we consider our proportionate share of the probable costs. In formulating the estimate of probable costs, we do not consider amounts expected to be recovered from insurance companies or others. We reassess these accrued amounts on a quarterly basis. The amount recorded for environmental remediation is not material and is included in the line item "Accrued expenses" in Statement 3 — "Consolidated Financial Position at December 31" of Part II, Item 8 "Financial Statements and Supplementary Data." There is no more than a remote chance that a material amount for remedial activities at any individual site, or at all the sites in the aggregate, will be required.
Available Information
The company files electronically with the Securities and Exchange Commission (SEC) required reports on Form 8-K, Form 10-Q, Form 10-K and Form 11-K; proxy materials; ownership reports for insiders as required by Section 16 of the Securities Exchange Act of 1934 (Exchange Act); registration statements on Forms S-3 and S-8, as necessary; and other forms or reports as required. The SEC maintains a website (www.sec.gov) that contains reports, proxy and information statements, and other information regarding issuers that file electronically with the SEC. The company maintains a website (www.Caterpillar.com) and copies of our annual report on Form 10-K, quarterly reports on Form 10-Q, current reports on Form 8-K and any amendments to these reports filed or furnished with the SEC are available free of charge through our website (www.Caterpillar.com/secfilings) as soon as reasonably practicable after filing with the SEC. Copies of our board committee charters, our board’s Guidelines on Corporate Governance Issues, Worldwide Code of Conduct and other corporate governance information are available on our website (www.Caterpillar.com/governance) and are also available free of charge. The information contained on the company’s website is not included in, or incorporated by reference into, this annual report on Form 10-K.
Additional company information may be obtained as follows:
Current information -
•view additional financial information on-line at www.Caterpillar.com/en/investors/financial-information.html
•request, view or download materials on-line or register for email alerts at www.Caterpillar.com/materialsrequest
Historical information -
•view/download on-line at www.Caterpillar.com/historical
Item 1A.Risk Factors.
The statements in this section describe the most significant risks to our business and should be considered carefully in conjunction with Part II, Item 7 “Management’s Discussion and Analysis of Financial Condition and Results of Operations” and the “Notes to Consolidated Financial Statements” of Part II, Item 8 “Financial Statements and Supplementary Data” to this Form 10-K. In addition, the statements in this section and other sections of this Form 10-K, including in Part II, Item 7 “Management's Discussion and Analysis of Financial Condition and Results of Operations,” include “forward-looking statements” as that term is defined in the Private Securities Litigation Reform Act of 1995 and involve uncertainties that could significantly impact results. Forward-looking statements give current expectations or forecasts of future events about the company or our outlook. You can identify forward-looking statements by the fact they do not relate to historical or current facts and by the use of words such as “believe,” “expect,” “estimate,” “anticipate,” “will be,” “should,” “plan,” “forecast,” “target,” “guide,” “project,” “intend,” “could” and similar words or expressions.
Forward-looking statements are based on assumptions and on known risks and uncertainties. Although we believe we have been prudent in our assumptions, any or all of our forward-looking statements may prove to be inaccurate, and we can make no guarantees about our future performance. Should known or unknown risks or uncertainties materialize or underlying assumptions prove inaccurate, actual results could materially differ from past results and/or those anticipated, estimated or projected.
We undertake no obligation to publicly update forward-looking statements, whether as a result of new information, future events or otherwise. You should, however, consult any subsequent disclosures we make in our filings with the SEC on Form 10-Q or Form 8-K.
The following is a cautionary discussion of risks, uncertainties and assumptions that we believe are material to our business. In addition to the factors discussed elsewhere in this report, the following are some of the important factors that, individually or in the aggregate, we believe could make our actual results differ materially from those described in any forward-looking statements. It is impossible to predict or identify all such factors and, as a result, you should not consider the following factors to be a complete discussion of risks, uncertainties and assumptions.
MACROECONOMIC RISKS
Our business and the industries we serve are highly sensitive to global and regional economic conditions.
Our results of operations are materially affected by economic conditions globally and regionally and in the particular industries we serve. The demand for our products and services tends to be cyclical and can be significantly reduced in periods of economic weakness characterized by lower levels of government and business investment, lower levels of business confidence, lower corporate earnings, high real interest rates, lower credit activity or tighter credit conditions, perceived or actual industry overcapacity, higher unemployment and lower consumer spending. A prolonged period of economic weakness may also result in increased expenses due to higher allowances for doubtful accounts and potential goodwill and asset impairment charges. Economic conditions vary across regions and countries, and demand for our products and services generally increases in those regions and countries experiencing economic growth and investment. Slower economic growth or a change in the global mix of regions and countries experiencing economic growth and investment could have an adverse effect on our business, results of operations and financial condition.
The energy, transportation, and mining industries are significant adopters of Caterpillar products. In these industries customers are likely to base their purchase decisions upon expected future commodity dynamics, including price. Commodity price volatility may be abrupt and unpredictable in response to global economic conditions, government actions, regulatory changes, supply/demand dynamics, innovation, and commodity substitutions among others. Economic conditions affecting the industries we serve may reduce capital expenditures in response to a variety of the aforementioned conditions. Reduction in these capital expenditures may lead to decreased demand for Caterpillar products and services as well as aftermarket parts as customers may choose to extend preventative maintenance and delay overhauls when possible.
The rates of infrastructure spending, commercial construction and housing starts also play a significant role in our results. Our products are an integral component of these activities, and as these activities decrease, demand for our products and services may be significantly impacted, which could negatively impact our results.
Catastrophic events, including global pandemics, could materially adversely affect our business, results of operations and/or financial condition.
The occurrence of a major earthquake, fire, flood, tsunami or other weather event, power loss, telecommunications failure, software or hardware malfunctions, pandemics, cyber-attack, war, terrorist attack or other catastrophic event that our disaster recovery plans do not adequately address, could adversely affect our employees, our systems, our ability to produce and distribute our products, and our reputation. For example, a pandemic had a significant impact around the world, prompting governments and businesses to take unprecedented measures in response. Such measuresincluded travel bans and restrictions, quarantines, shelter in place orders and shutdowns. Those measures impacted or could again impact all or portions of our workforce and operations and the operations of our customers, dealers and suppliers. Current material and component shortages, logistics constraints and labor inefficiencies limited and or could continue to limit our ability to meet customer demand, which could have a material adverse effect on our business, results of operations and/or financial condition.
Pandemics can significantly increase economic and customer demand uncertainty, cause inflationary pressure in the U.S. and elsewhere and lead to volatility in customer demand for the Company’s products and services and cause supply chain disruptions. Economic uncertainties could continue to affect customer demand for the Company’s products and services, the value of the equipment financed or leased, the demand for financing and the financial condition and credit risk of our dealers and customers.
A catastrophic event resulting in the destruction or disruption of our workforce, our systems, our ability to produce and distribute our products, any of our data centers or our critical business or information technology systems could adversely affect our ability to conduct normal business operations and our operating results or cash flows. The adverse effects of any such catastrophic event would be exacerbated if experienced at the same time as another unexpected and adverse event.
Commodity price changes, material price increases, fluctuations in demand for our products and services, significant disruptions to our supply chains or significant shortages of labor and material may adversely impact our financial results or our ability to meet commitments to customers.
We are a significant user of steel and many other commodities required for the manufacture of our products. Increases in the prices of such commodities would increase our costs, negatively impacting our business, results of operations and financial condition if we are unable to fully offset the effect of these increased costs through price increases, productivity improvements, cost reduction programs or hedging programs.
We rely on suppliers to produce or secure material required for the manufacture of our products. Production challenges at suppliers (including suppliers of semiconductors), a disruption in deliveries to or from suppliers or decreased availability of raw materials or commodities could have an adverse effect on our ability to meet our commitments to customers or increase our operating costs.On the other hand, in circumstances where demand for our products is less than we expect, we may experience excess inventories and be forced to incur additional costs and our profitability may suffer. Our business, competitive position, results of operations or financial condition could be negatively impacted if supply is insufficient for our operations, if significant transportation delays interfere with deliveries, if we experience excess inventories or if we are unable to adjust our production schedules or our purchases from suppliers to reflect changes in customer demand and market fluctuations on a timely basis.
Changes in government monetary or fiscal policies may negatively impact our results.
Most countries where our products and services are sold have established central banks to regulate monetary systems and influence economic activities, generally by adjusting interest rates. Interest rate changes affect overall economic growth, which affects demand for residential and nonresidential structures, as well as energy and mined products, which in turn affects sales of our products and services that support these activities. Interest rate changes may also affect our customers’ ability to finance machine purchases, can change the optimal time to keep machines in a fleet and can impact the ability of our suppliers to finance the production of parts and components necessary to manufacture and support our products. Increases in interest rates could negatively impact sales and create supply chain inefficiencies.
Central banks and other policy arms of many countries may take actions to vary the amount of liquidity and credit available in an economy. The impact from a change in liquidity and credit policies could negatively affect the customers and markets we serve or our suppliers, create supply chain inefficiencies and could adversely impact our business, results of operations and financial condition.
Changes in monetary and fiscal policies, along with other factors, may cause currency exchange rates to fluctuate. Actions that lead the currency exchange rate of a country where we manufacture products to increase relative to other currencies could reduce the competitiveness of products made in that country, which could adversely affect our competitive position, results of operations and financial condition.
Government policies on taxes and spending also affect our business. Throughout the world, government spending finances a significant portion of infrastructure development, such as highways, rail systems, airports, sewer and water systems, waterways and dams. Tax regulations determine asset depreciation lives and impact the after-tax returns on business activity and investment, both of which influence investment decisions. Unfavorable developments, such as decisions to reduce public spending or to increase taxes, could negatively impact our results.
Our global operations are exposed to political and economic risks, commercial instability and events beyond our control in the countries in which we operate.
Our global operations are dependent upon products manufactured, purchased and sold in the U.S. and internationally, including in countries with political and economic instability or uncertainty. Some countries have greater political and economic volatility and greater vulnerability to infrastructure and labor disruptions than others. Our business could be negatively impacted by adverse fluctuations in freight costs, fuel costs (e.g., diesel, bunker, jet), limitations on shipping and receiving capacity, and other disruptions in the transportation and shipping infrastructure at important geographic points of exit and entry for our products. Operating in different regions and countries exposes us to numerous risks, including:
•multiple and potentially conflicting laws, regulations and policies that are subject to change;
•imposition of currency restrictions, restrictions on repatriation of earnings or other restraints;
•imposition of new or additional tariffs or quotas;
•withdrawal from or modification of trade agreements or the negotiation of new trade agreements;
•imposition of new or additional trade and economic sanctions laws imposed by the U.S. or foreign governments;
•war or acts of terrorism; and
•political and economic instability or civil unrest that may severely disrupt economic activity in affected countries.
The occurrence of one or more of these events may negatively impact our business, results of operations and financial condition.
OPERATIONAL RISKS
The success of our business depends on our ability to develop, produce and market quality products that meet our customers’ needs.
Our business relies on continued global demand for our brands and products. To achieve business goals, we must develop and sell products that appeal to our dealers, OEMs and end-user customers. This is dependent on a number of factors, including our ability to maintain key dealer relationships; our ability to produce products that meet the quality, performance and price expectations of our customers and our ability to develop effective sales, advertising and marketing programs. In addition, our continued success in selling products that appeal to our customers is dependent on leading-edge innovation, with respect to both products and operations, and on the availability and effectiveness of legal protection for our innovations. Failure to continue to deliver high quality, innovative, competitive products to the marketplace, to adequately protect our intellectual property rights; to supply products that meet applicable regulatory requirements, including engine exhaust emission requirements or to predict market demands for, or gain market acceptance of, our products, could have a negative impact on our business, results of operations and financial condition.
We operate in a highly competitive environment, which could adversely affect our sales and pricing.
We operate in a highly competitive environment. We compete on the basis of a variety of factors, including product performance, customer service, quality and price. There can be no assurance that our products will be able to compete successfully with other companies’ products. Thus, our share of industry sales could be reduced due to aggressive pricing or product strategies pursued by competitors, unanticipated product or manufacturing difficulties, our failure to price our products competitively, our failure to produce our products at a competitive cost or an unexpected buildup in competitors’ new machine or dealer-owned rental fleets, which could lead to downward pressure on machine rental rates and/or used equipment prices.
Lack of customer acceptance of price increases we announce from time to time, changes in customer requirements for price discounts, changes in our customers’ behavior or a weak pricing environment could have an adverse impact on our business, results of operations and financial condition.
In addition, our results and ability to compete may be impacted negatively by changes in our geographic and product mix of sales.
Increased information technology security threats and more sophisticated computer crime pose a risk to our systems, networks, products and services.
We rely upon information technology systems and networks, some of which are managed by third parties, in connection with a variety of business activities. Additionally, we collect and store sensitive information relating to our business, customers, dealers, suppliers and employees. Operating these information technology systems and networks and processing and maintaining this data in a secure manner, is critical to our business operations and strategy. Information technology security threats -- from user error to cybersecurity attacks designed to gain unauthorized access to our systems, networks and data -- are increasing in frequency and sophistication. Cybersecurity attacks from threat actors globally range from random attempts to coordinated and targeted attacks, including sophisticated computer crime and advanced persistent threats. These threats pose a risk to the security of our systems and networks and the confidentiality, availability and integrity of our data. Cybersecurity attacks could also include attacks targeting customer data or the security, integrity and/or reliability of the hardware and software installed in our products. It is possible that our information technology systems and networks, or those managed or provided by third parties, could have vulnerabilities, which could go unnoticed for a period of time. While various procedures and controls have been and are being utilized to mitigate such risks, there can be no guarantee that the actions and controls we have implemented and are implementing, or which we cause or have caused third-party service providers to implement, will be sufficient to protect and mitigate associated risks to our systems, information or other property.
We have experienced cybersecurity threats and vulnerabilities in our systems and those of our third party providers, and we have experienced viruses and attacks targeting our information technology systems and networks. Such prior events, to date, have not had a material impact on our financial condition, results of operations or liquidity. However, the potential consequences of a future material cybersecurity attack include reputational damage, litigation with third parties, government enforcement actions, penalties, disruption to systems, unauthorized release of confidential or otherwise protected information, corruption of data, diminution in the value of our investment in research, development and engineering, and increased cybersecurity protection and remediation costs, which in turn could adversely affect our competitiveness, results of operations and financial condition. Due to the evolving nature of such security threats, the potential impact of any future incident cannot be predicted. Further, the amount of insurance coverage we maintain may be inadequate to cover claims or liabilities relating to a cybersecurity attack.
In addition, data we collect, store and process are subject to a variety of U.S. and international laws and regulations, such as the European Union's General Data Protection Regulation and the California Consumer Privacy Act, which may carry significant potential penalties for noncompliance.
Our business is subject to the inventory management decisions and sourcing practices of our dealers and our OEM customers.
We sell finished products primarily through an independent dealer network and directly to OEMs and are subject to risks relating to their inventory management decisions and operational and sourcing practices. Both carry inventories of finished products as part of ongoing operations and adjust those inventories based on their assessments of future needs and market conditions, including levels of used equipment inventory and machine rental usage rates. Such adjustments may impact our results positively or negatively. If the inventory levels of our dealers and OEM customers are higher than they desire, they may postpone product purchases from us, which could cause our sales to be lower than the end-user demand for our products and negatively impact our results. Similarly, our results could be negatively impacted through the loss of time-sensitive sales if our dealers and OEM customers do not maintain inventory levels sufficient to meet customer demand.
We may not realize all of the anticipated benefits of our acquisitions, joint ventures or divestitures, or these benefits may take longer to realize than expected.
In pursuing our business strategy, we routinely evaluate targets and enter into agreements regarding possible acquisitions, divestitures and joint ventures. We often compete with others for the same opportunities. To be successful, we conduct due diligence to identify valuation issues and potential loss contingencies, negotiate transaction terms, complete complex transactions and manage post-closing matters such as the integration of acquired businesses. Further, while we seek to mitigate risks and liabilities of such transactions through due diligence, among other things, there may be risks and liabilities that our due diligence efforts fail to discover, that are not accurately or completely disclosed to us or that we inadequately assess. We may incur unanticipated costs or expenses following a completed acquisition, including post-closing asset impairment charges, expenses associated with eliminating duplicate facilities, litigation, and other liabilities. Risks associated with our past or future acquisitions also include the following:
•the failure to achieve the acquisition's revenue or profit forecast;
•the business culture of the acquired business may not match well with our culture;
•technological and product synergies, economies of scale and cost reductions may not occur as expected;
•unforeseen expenses, delays or conditions may be imposed upon the acquisition, including due to required regulatory approvals or consents;
•we may acquire or assume unexpected liabilities or be subject to unexpected penalties or other enforcement actions;
•faulty assumptions may be made regarding the macroeconomic environment or the integration process;
•unforeseen difficulties may arise in integrating operations, processes and systems;
•higher than expected investments may be required to implement necessary compliance processes and related systems, including information technology systems, accounting systems and internal controls over financial reporting;
•we may fail to retain, motivate and integrate key management and other employees of the acquired business;
•higher than expected costs may arise due to unforeseen changes in tax, trade, environmental, labor, safety, payroll or pension policies in any jurisdiction in which the acquired business conducts its operations; and
•we may experience problems in retaining customers and integrating customer bases.
Many of these factors will be outside of our control and any one of them could result in increased costs, decreases in the amount of expected revenues and diversion of management’s time and attention. They may also delay the realization of the benefits we anticipate when we enter into a transaction.
In order to conserve cash for operations, we may undertake acquisitions financed in part through public offerings or private placements of debt or equity securities, or other arrangements. Such acquisition financing could result in a decrease in our earnings and adversely affect other leverage measures. If we issue equity securities or equity-linked securities, the issued securities may have a dilutive effect on the interests of the holders of our common shares.
Failure to implement our acquisition strategy, including successfully integrating acquired businesses, could have an adverse effect on our business, financial condition and results of operations. Furthermore, we make strategic divestitures from time to time. In the case of divestitures, we may agree to indemnify acquiring parties for certain liabilities arising from our former businesses. These divestitures may also result in continued financial involvement in the divested businesses following the transaction, including through guarantees or other financial arrangements. Lower performance by those divested businesses could affect our future financial results.
Union disputes or other labor matters could adversely affect our operations and financial results.
Some of our employees are represented by labor unions in a number of countries under various collective bargaining agreements with varying durations and expiration dates. There can be no assurance that any current or future issues with our employees will be resolved or that we will not encounter future strikes, work stoppages or other disputes with labor unions or our employees. We may not be able to satisfactorily renegotiate collective bargaining agreements in the United States and other countries when they expire. If we fail to renegotiate our existing collective bargaining agreements, we could encounter strikes or work stoppages or other disputes with labor unions. In addition, existing collective bargaining agreements may not prevent a strike or work stoppage at our facilities in the future. We may also be subject to general country strikes or work stoppages unrelated to our business or collective bargaining agreements. A work stoppage or other limitations on production at our facilities for any reason could have an adverse effect on our business, results of operations and financial condition. In addition, many of our customers and suppliers have unionized work forces. Strikes or work stoppages experienced by our customers or suppliers could have an adverse effect on our business, results of operations and financial condition.
Unexpected events may increase our cost of doing business or disrupt our operations.
The occurrence of one or more unexpected events, including war, acts of terrorism or violence, civil unrest, fires, tornadoes, tsunamis, hurricanes, earthquakes, floods and other forms of severe weather in the United States or in other countries in which we operate or in which our suppliers are located could adversely affect our operations and financial performance. Natural disasters, pandemic illness, equipment failures, power outages or other unexpected events could result in physical damage to and complete or partial closure of one or more of our manufacturing facilities or distribution centers, temporary or long-term disruption in the supply of component products from some local and international suppliers, and disruption and delay in the transport of our products to dealers, end-users and distribution centers. Existing insurance coverage may not provide protection for all of the costs that may arise from such events.
FINANCIAL RISKS
Disruptions or volatility in global financial markets could limit our sources of liquidity, or the liquidity of our customers, dealers and suppliers.
Continuing to meet our cash requirements over the long-term requires substantial liquidity and access to varied sources of funds, including capital and credit markets. Global economic conditions may cause volatility and disruptions in capital and credit markets. Market volatility, changes in counterparty credit risk, the impact of government intervention in financial markets and general economic conditions may also adversely impact our ability to access capital and credit markets to fund operating needs. Global or regional economic downturns could cause financial markets to decrease the availability of liquidity, credit and credit capacity for certain issuers, including certain customers, dealers and suppliers. An inability to access capital and credit markets may have an adverse effect on our business, results of operations, financial condition and competitive position. Furthermore, changes in global economic conditions, including material cost increases and decreases in economic activity in key markets we serve, and the success of plans to manage cost increases, inventory and other important elements of our business may significantly impact our ability to generate funds from operations.
In addition, demand for our products generally depends on customers’ ability to pay for our products, which, in turn, depends on their access to funds. Changes in global economic conditions may result in customers experiencing increased difficulty in generating funds from operations. Capital and credit market volatility and uncertainty may cause financial institutions to revise their lending standards, resulting in customers’ decreased access to capital. If capital and credit market volatility occurs, customers’ liquidity may decline which, in turn, would reduce their ability to purchase our products.
Failure to maintain our credit ratings could increase our cost of borrowing and could adversely affect our cost of funds, liquidity, competitive position and access to capital markets.
Each of Caterpillar’s and Cat Financial’s costs of borrowing and their respective ability to access the capital markets are affected not only by market conditions but also by the short- and long-term credit ratings assigned to their respective debt by the major credit rating agencies. These ratings are based, in significant part, on each of Caterpillar’s and Cat Financial’s performance as measured by financial metrics such as net worth, profitability, interest coverage and leverage ratios, as well as transparency with rating agencies and timeliness of financial reporting. There can be no assurance that Caterpillar and Cat Financial will be able to maintain their credit ratings. We receive debt ratings from the major credit rating agencies. A downgrade of our credit rating by any of the major credit rating agencies could result in increased borrowing costs and could adversely affect Caterpillar’s and Cat Financial’s liquidity, competitive position and access to the capital markets, including restricting, in whole or in part, access to the commercial paper market. There can be no assurance that the commercial paper market will continue to be a reliable source of short-term financing for Cat Financial or an available source of short-term financing for Caterpillar. An inability to access the capital markets could have an adverse effect on our cash flow, results of operations and financial condition.
Our Financial Products segment is subject to risks associated with the financial services industry.
Cat Financial is significant to our operations and provides financing support for a significant share of our global sales. The inability of Cat Financial to access funds to support its financing activities to our customers could have an adverse effect on our business, results of operations and financial condition.
Continuing to meet Cat Financial's cash requirements over the long-term could require substantial liquidity and access to sources of funds, including capital and credit markets. Cat Financial has continued to maintain access to key global medium-term note and commercial paper markets, but there can be no assurance that such markets will continue to represent a reliable source of financing. If global economic conditions were to deteriorate, Cat Financial could face materially higher financing costs, become unable to access adequate funding to operate and grow its business and/or meet its debt service obligations as they mature.Cat Financial also could be required to draw upon contractually committed lending agreements and/or seek other funding sources.However, there can be no assurance that such agreements and other funding sources would be sufficient or even available under extreme market conditions. Any of these events could negatively impact Cat Financial’s business, as well as our and Cat Financial's results of operations and financial condition.
Market disruption and volatility may also lead to numerous risks in connection with these events, including but not limited to:
•Market developments that may affect customer confidence levels and cause declines in the demand for financing and adverse changes in payment patterns, causing increases in delinquencies and default rates, which could increase Cat Financial’s write-offs and provision for credit losses.
•The process Cat Financial uses to estimate losses inherent in its credit exposure requires a high degree of management’s judgment regarding numerous subjective qualitative factors, including forecasts of economic conditions and how economic predictors might impair the ability of its borrowers to repay their loans. Financial market disruption and volatility may impact the accuracy of these judgments.
•Cat Financial’s ability to engage in routine funding transactions or to borrow from other financial institutions on acceptable terms or at all could be adversely affected by disruptions in the capital markets or other events, including actions by rating agencies and deteriorating investor expectations.
•As Cat Financial’s borrowing agreements are primarily with financial institutions, their ability to perform in accordance with any of our underlying agreements could be adversely affected by market volatility and/or disruptions in financial markets.
Changes in interest rates or market liquidity conditions could adversely affect Cat Financial's and our earnings and/or cash flow.
Changes in interest rates and market liquidity conditions could have an adverse impact on Cat Financial's and our earnings and cash flows. Changes in market interest rates may influence its and our borrowing costs, returns on financial investments and the valuation of derivative contracts.Because a significant number of the loans made by Cat Financial are made utilizing fixed interest rates, its business results are subject to fluctuations in interest rates. Certain loans made by Cat Financial and various financing extended to Cat Financial are made at variable rates that use floating reference rates or indices, including the Secured Overnight Financing Rate, or SOFR, an index calculated by short-term repurchase agreements, backed by Treasury securities,as a benchmark for establishing the interest rate.
Together with Cat Financial we created a cross-functional team that assesses risk across multiple categories as it relates to the use of floating reference rates or indices, such as SOFR, in securities, loans, derivatives, and other financial obligations or extensions of credit held by or due to us. Cat Financial manages interest rate and market liquidity risks through a variety of techniques that include a match funding strategy, the selective use of derivatives and a broadly diversified funding program. There can be no assurance, however, that fluctuations in interest rates and market liquidity conditions will not have an adverse impact on its and our earnings and cash flows. If any of the variety of instruments and strategies Cat Financial uses to hedge its exposure to these types of risk is ineffective, this may have an adverse impact on our earnings and cash flows.With respect to Insurance Services' investment activities, changes in equity and bond markets could result in a decline in value of its investment portfolio, resulting in an unfavorable impact to earnings.
An increase in delinquencies, repossessions or net losses of Cat Financial customers could adversely affect its results.
Inherent in the operation of Cat Financial is the credit risk associated with its customers. The creditworthiness of each customer and the rate of delinquencies, repossessions and net losses on customer obligations are directly impacted by several factors, including relevant industry and economic conditions, the availability of capital, the experience and expertise of the customer's management team, commodity prices, political events and the sustained value of the underlying collateral. Any increase in delinquencies, repossessions and net losses on customer obligations could have a material adverse effect on Cat Financial's and our earnings and cash flows. Cat Financial evaluates and adjusts its allowance for credit losses related to past due and non-performing receivables on a regular basis. However, adverse economic conditions or other factors that might cause deterioration of the financial health of its customers could change the timing and level of payments received and necessitate an increase in Cat Financial's estimated losses, which could also have a material adverse effect on Cat Financial's and our earnings and cash flows.
Currency exchange rate fluctuations affect our results of operations.
We conduct operations in many countries involving transactions denominated in a variety of currencies. We are subject to currency-exchange rate risk to the extent that our costs are denominated in currencies other than those in which we earn revenues. Fluctuations in currency exchange rates have had, and will continue to have, an impact on our results as expressed in U.S. dollars. There can be no assurance that currency exchange rate fluctuations will not adversely affect our results of operations, financial condition and cash flows. While the use of currency hedging instruments may provide us with protection from adverse fluctuations in currency exchange rates, by utilizing these instruments we potentially forego the benefits that might result from favorable fluctuations in currency exchange rates. In addition, our outlooks do not assume fluctuations in currency exchange rates. Adverse fluctuations in currency exchange rates from the date of our outlooks could cause our actual results to differ materially from those anticipated in any outlooks and adversely impact our business, results of operations and financial condition.
We also face risks arising from the imposition of exchange controls and currency devaluations. Exchange controls may limit our ability to convert foreign currencies into U.S. dollars or to remit dividends and other payments by our foreign subsidiaries or businesses located in or conducted within a country imposing controls. Currency devaluations result in a diminished value of funds denominated in the currency of the country instituting the devaluation.
Restrictive covenants in our debt agreements could limit our financial and operating flexibility.
We maintain a number of credit facilities to support general corporate purposes (facilities) and have issued debt securities to manage liquidity and fund operations (debt securities). The agreements relating to a number of the facilities and the debt securities contain certain restrictive covenants applicable to us and certain subsidiaries, including Cat Financial. These covenants include maintaining a minimum consolidated net worth (defined as the consolidated shareholder’s equity including
preferred stock but excluding the pension and other post-retirement benefits balance within accumulated other comprehensive income (loss)), limitations on the incurrence of liens and certain restrictions on consolidation and merger. Cat Financial has also agreed under certain of these agreements not to exceed a certain leverage ratio (consolidated debt to consolidated net worth, calculated (1) on a monthly basis as the average of the leverage ratios determined on the last day of each of the six preceding calendar months and (2) at each December 31), to maintain a minimum interest coverage ratio (calculated as (1) profit excluding income taxes, interest expense and net gain (loss) from interest rate derivatives to (2) interest expense calculated at the end of each fiscal quarter for the prior four consecutive fiscal quarter period and not to terminate, amend or modify its support agreement with us.
A breach of one or more of the covenants could result in adverse consequences that could negatively impact our business, results of operations and financial condition. These consequences may include the acceleration of amounts outstanding under certain of the facilities, triggering of an obligation to redeem certain debt securities, termination of existing unused commitments by our lenders, refusal by our lenders to extend further credit under one or more of the facilities or to enter into new facilities or the lowering or modification of our credit ratings or those of one or more of our subsidiaries.
Sustained increases in funding obligations under our pension plans may impair our liquidity or financial condition.
We maintain certain defined benefit pension plans for our employees, which impose on us certain funding obligations. We use many assumptions in determining our future payment obligations under the plans. Significant adverse changes in credit or capital markets could result in actual rates of return on pension investments being materially lower than projected and result in increased contribution requirements. These factors could significantly increase our payment obligations under the plans, and as a result, adversely affect our business and overall financial condition.We may be required to make material contributions to our pension plans in the future and may fund contributions through the use of cash on hand, the proceeds of borrowings, shares of our common stock or a combination of the foregoing, as permitted by applicable law.
LEGAL & REGULATORY RISKS
Our global operations are subject to a wide-range of trade and anti-corruption laws and regulations.
Due to the international scope of our operations, we are subject to a complex system of import- and export-related laws and regulations. These include U.S. regulations issued by Customs and Border Protection, the Bureau of Industry and Security, the Office of Antiboycott Compliance, the Directorate of Defense Trade Controls and the Office of Foreign Assets Control, as well as the counterparts of these agencies in other countries. Any alleged or actual violations may subject us to increased government scrutiny, investigation and civil and criminal penalties, and may limit our ability to import or export our products or to provide services outside the United States. Furthermore, embargoes and sanctions imposed by the U.S. and other governments restricting or prohibiting sales to specific persons or countries or based on product classification may expose us to potential criminal and civil sanctions. We cannot predict the nature, scope or effect of future regulatory requirements to which our operations might be subject. We also cannot predict in certain locations the manner in which existing laws might be administered or interpreted.
In addition, the U.S. Foreign Corrupt Practices Act and similar foreign anti-corruption laws generally prohibit companies and their intermediaries from making improper payments or providing anything of value to improperly influence foreign government officials for the purpose of obtaining or retaining business or obtaining an unfair advantage. Recent years have seen a substantial increase in the global enforcement of anti-corruption laws. Our operations outside the United States, including in developing countries, expose us to the risk of such violations. Violations of anti-corruption laws or regulations by our employees, intermediaries acting on our behalf, or our joint venture partners may result in severe criminal or civil sanctions. Violations may also disrupt our business, and may result in an adverse effect on our reputation, business and results of operations or financial condition.
International trade policies may impact demand for our products and our competitive position.
Government policies on international trade and investment such as import quotas, capital controls or tariffs, whether adopted by individual governments or addressed by regional trade blocs, can affect the demand for our products and services, impact the competitive position of our products or prevent us from being able to sell products in certain countries. The implementation of more restrictive trade policies (such as more detailed inspections, higher tariffs or new barriers to entry) in countries where we sell large quantities of products and services could negatively impact our business, results of operations and financial condition. For example, a government’s adoption of “buy national” policies or retaliation by another government against such policies could have a negative impact on our results of operations.
We may incur additional tax expense or become subject to additional tax exposure.
We are subject to income taxes in the United States and numerous other jurisdictions. Our future results of operations could be adversely affected by changes in the effective tax rate as a result of a change in the mix of earnings between U.S. and non-U.S. jurisdictions or among jurisdictions with differing statutory tax rates. In addition, our future results of operations could also be adversely affected by changes in our overall profitability, changes in tax laws or treaties or in their application or interpretation, changes in tax rates, changes in generally accepted accounting principles, changes in the valuation of deferred tax assets and liabilities, changes in the amount of earnings indefinitely reinvested in certain non-U.S. jurisdictions, the results of audits and examinations of previously filed tax returns and continuing assessments of our tax exposures. We are also subject to the continuous examination of our income tax returns by the U.S. Internal Revenue Service and other tax authorities. We regularly assess the likelihood of an adverse outcome resulting from these examinations. If our effective tax rates were to increase, or if the ultimate determination of our taxes owed is for an amount in excess of amounts previously accrued, our operating results, cash flows and financial condition could be adversely affected. For information regarding additional legal matters related to our taxes, please see Note 6 — “Income taxes” and Note 22 — “Environmental and legal matters” of Part II, Item 8 “Financial Statements and Supplementary Data” to this Annual Report on Form 10-K.
Costs associated with lawsuits or investigations or adverse rulings in enforcement or other legal proceedings may have an adverse effect on our results of operations.
We are subject to a variety of legal proceedings and legal compliance risks in virtually every part of the world. We face risk of exposure to various types of claims, lawsuits and government investigations. We are involved in various claims and lawsuits related to product design, manufacture and performance liability (including claimed asbestos exposure), contracts, employment issues, environmental matters, intellectual property rights, tax, securities and other legal proceedings that arise in and outside of the ordinary course of our business. The industries in which we operate are also periodically reviewed or investigated by regulators, which could lead to enforcement actions, fines and penalties or the assertion of private litigation claims. It is not possible to predict with certainty the outcome of claims, investigations and lawsuits, and we could in the future incur judgments, fines or penalties or enter into settlements of lawsuits and claims that could have an adverse effect on our reputation, business, results of operations or financial condition in any particular period.
The global and diverse nature of our operations means that legal and compliance risks will continue to exist and additional legal proceedings and other contingencies, the outcome of which cannot be predicted with certainty, may arise from time to time. In addition, subsequent developments in legal proceedings may affect our assessment and estimates of loss contingencies recorded as a reserve and require us to make payments in excess of our reserves. Such payments could have an adverse effect on our reputation, business and results of operations or financial condition.
New regulations or changes in financial services regulation could adversely impact Caterpillar and Cat Financial.
Cat Financial’s operations are highly regulated by governmental authorities in the locations where it operates, which can impose significant additional costs and/or restrictions on its business. In the United States, for example, certain Cat Financial activities are subject to the U.S. Dodd-Frank Wall Street Reform and Consumer Protection Act (Dodd-Frank), which includes extensive provisions regulating the financial services industry. As a result, Cat Financial has become and could continue to become subject to additional regulatory costs that could be significantand have an adverse effect on Cat Financial’s and our results of operations and financial condition. Changes in regulations or additional regulations in the United States or internationally impacting the financial services industry could also add significant cost or operational constraints that might have an adverse effect on Cat Financial’s and our results of operations and financial condition.
We are subject to stringent environmental laws and regulations that impose significant compliance costs.
Our facilities, operations and products are subject to increasingly stringent environmental laws and regulations globally, including laws and regulations governing emissions to noise, air, releases to soil and discharges to water and the generation, handling, storage, transportation, treatment and disposal of non-hazardous and hazardous waste materials. Some environmental laws impose strict, retroactive and joint and several liability for the remediation of the release of hazardous substances, even for conduct that was lawful at the time it occurred, or for the conduct of, or conditions caused by, prior operators, predecessors or other third parties. Failure to comply with environmental laws could expose us to penalties or clean-up costs, civil or criminal liability and sanctions on certain of our activities, as well as damage to property or natural resources. The potential liabilities, sanctions, damages and remediation efforts related to any non-compliance with such laws and regulations could negatively impact our ability to conduct our operations and our financial condition and results of operations. In addition, there can be no assurances that we will not be adversely affected by costs, liabilities or claims with respect to existing or subsequently acquired operations or under present laws and regulations or those that may be adopted or imposed in the future.
Environmental laws and regulations may change from time to time, as may related interpretations and other guidance. Changes in environmental laws or regulations could result in higher expenses and payments. Uncertainty relating to environmental laws or regulations may also affect how we conduct our operations and structure our investments and could limit our ability to enforce our rights. Changes in environmental and climate change laws or regulations, including laws relating to greenhouse gas emissions, could lead to new or additional investment in product designs and could increase environmental compliance expenditures. Changes in climate change concerns, or in the regulation of such concerns, including greenhouse gas emissions, could subject us to additional costs and restrictions, including increased energy and raw materials costs. If environmental laws or regulations are either changed or adopted and impose significant operational restrictions and compliance requirements upon us or our products, they could negatively impact our reputation, business, capital expenditures, results of operations, financial condition and competitive position.
The Company’s amended and restated bylaws provide that the Court of Chancery of the State of Delaware will be the exclusive forum for certain legal actions between the Company and its shareholders, which could discourage claims or limit the ability of the Company’s shareholders to bring a claim in a judicial forum viewed by the shareholders as more favorable for disputes with the Company or the Company’s directors, officers or other employees.
The Company’s amended and restated bylaws provide to the fullest extent permitted by law that unless the Company consents in writing to the selection of an alternative forum, the Court of Chancery of the State of Delaware will be the sole and exclusive forum for (i) any derivative action or proceeding brought on behalf of the Company, (ii) any action asserting a claim of breach of fiduciary duty owed by any director, officer or other employee of the Company to the Company or the Company’s shareholders, (iii) any action asserting a claim against the Company or any director or officer or other employee of the Company arising pursuant to any provision of the Delaware General Corporation Law or the Company’s certificate of incorporation or bylaws (as either may be amended from time to time) or (iv) any action asserting a claim against the Company or any director or officer or other employee of the Company governed by the internal affairs doctrine.
The exclusive forum provisions in our bylaws could limit our shareholders’ ability to bring a claim in a judicial forum that it finds favorable for disputes with the Company or its directors, officers or other employees. Alternatively, if a court were to find the choice of forum provision contained in the Company’s amended and restated bylaws to be inapplicable or unenforceable in an action, the Company may incur additional costs associated with resolving such action in other jurisdictions. The exclusive forum provision in the Company’s amended and restated bylaws will not preclude or contract the scope of exclusive federal or concurrent jurisdiction for actions brought under the federal securities laws including the Securities Exchange Act of 1934, as amended, or the Securities Act of 1933, as amended, or the respective rules and regulations promulgated thereunder.
Item 1B.Unresolved Staff Comments.
None.
Item 1C. Cybersecurity
As required by Item 106 of Regulation S-K, the following sets forth information regarding our cybersecurity strategy, risk management and governance.
Cybersecurity Strategy and Risk Management
Cybersecurity is critical to advancing our overall objectives and enabling our digital efforts. As a global company, we face a wide variety of cybersecurity threats that range from common attacks such as ransomware and denial-of-service, to attacks from more advanced adversaries. Our customers, suppliers, and other partners face similar cybersecurity threats, and a cybersecurity incident impacting these entities could materially adversely affect our operations, performance and results. These cybersecurity threats and related risks make it imperative that we maintain focus on cybersecurity and systemic risks.
We maintain a comprehensive cybersecurity program which is integrated within the Company’s enterprise risk management system and encompasses the corporate information technology and operational technology environments as well as customer-facing products. Our cybersecurity program has implemented a governance structure and process to identify, assess, manage, mitigate, respond to and report on cybersecurity risks. We utilize cybersecurity policies and frameworks based on industry and government standards. Our cyber risk management program controls are based on recognized best practices and standards, including the National Institute of Standards and Technology (NIST) Cyber Security Framework and the International Organization for Standardization (ISO 27001) Information Security Management System Requirements. We partner with third parties to support and evaluate our cybersecurity program. These third-party services span areas including cybersecurity maturity assessments, incident response, penetration testing, consulting on best practices, and others. We also consume threat intelligence from several paid and non-paid sources.
We maintain a 24 x 7 operations center which serves as a central location for the reporting of cybersecurity matters, provides monitoring of our global cybersecurity environment, and coordinates the investigation and remediation of alerts. As cybersecurity events occur, the cybersecurity team focuses on responding to and containing the threat and minimizing impact. In the event of an incident, the cybersecurity team assesses, among other factors, safety impact, supply chain and manufacturing disruption, data and personal information loss, business operations disruption, projected cost and potential for reputational harm, with participation from technical, legal and law enforcement support, as appropriate.
We have implemented a cybersecurity awareness program which covers topics such as phishing, social networking safety, password security and mobile device usage. We have mandatory training in the areas of cybersecurity, privacy, and confidential information handling. We also conduct regular phishing training and simulations for our employees and contractors. We provide extensive specialized role-based training to technical professionals in cybersecurity, secure application development, and other focus areas. We also conduct periodic tabletop exercises to validate our preparation for cyber events.
We operate a third-party cybersecurity program with the goal of minimizing disruption to the Company’s business and production operations, strengthening supply chain resilience, and supporting the integrity of components and systems used in its products and services. We rely heavily on our supply chain to deliver our products and services to our customers, and a cybersecurity incident at a supplier, subcontractor or joint venture partner could materially adversely impact us. We assess third-party cybersecurity controls through a cybersecurity third-party risk assessment process. Identified deficiencies are addressed through a risk remediation process. For select suppliers, we engage third-party cybersecurity monitoring and alerting services, and seek to work directly with those suppliers to address potential deficiencies identified.
As of the date of this report, we do not believe that risks from any cybersecurity threats, including as a result of any previous cybersecurity incidents, have materially affected or are reasonably likely to affect us, including our business strategy, results of operations or financial condition. That said, as discussed more fully under Item 1A. “Risk Factors—Operational Risks— Increased information technology security threats and more sophisticated computer crime pose a risk to our systems, networks, products and services” of this Form 10-K, these threats pose a risk to the security of our systems and networks and the confidentiality, availability and integrity of our data. Cybersecurity attacks could also include attacks targeting customer data or the security, integrity and/or reliability of the hardware and software installed in our products. It is possible that our information technology systems and networks, or those managed or provided by third parties, could have vulnerabilities, which could go unnoticed for a period of time. While various procedures and controls have been and are being utilized to mitigate such risks, there can be no guarantee that the actions and controls we have implemented and are implementing, or which we cause or have caused third-party service providers to implement, will be sufficient to protect and mitigate associated risks to our systems, information or other property.
Cybersecurity Governance
Caterpillar’s board has oversight for risk management with a focus on the most significant risks facing the Company, including strategic, operational, financial and legal compliance risks. The board’s risk oversight process builds upon management’s risk assessment and mitigation processes, which include an enterprise risk management program of which our cybersecurity processes are an integral component.
The board implements its risk oversight function both as a board and through delegation to board committees, which meet regularly and report back to the board. The board has delegated the oversight of specific risks to board committees that align with their functional responsibilities. The Audit Committee (the “AC”) assists the board in overseeing the enterprise risk management program and evaluates and monitors risks related to, among other things, the Company’s information security program. The AC assesses cybersecurity and information technology risks and the controls implemented to monitor and mitigate these risks. The Company’s Chief Information Officer & Senior Vice President, Caterpillar IT (the “CIO”) attends all bimonthly AC meetings and provides cybersecurity updates to the AC and board.
Our cybersecurity program is overseen by our CIO, who has been a Caterpillar employee for nearly twenty-five years. Prior to her current appointment as our CIO in September 2020, she was the Chief Information Officer for the Company’s Financial Products Division. Her extensive background in IT includes global leadership for large-scale systems transformations, cybersecurity, cloud and application management, global data center management, worldwide network, servers and storage, database management and end-user services. Our CIO leads a cross-functional cybersecurity team comprised of professionals from our product, cybersecurity, legal and compliance organizations who focus on managing the security of our connected solutions. This team manages the Company’s global IT systems, IT risk management, cybersecurity, global infrastructure and IT transformations.
Item 1D.Executive Officers of the Registrant.
| | | | | | | | | | | | | | |
| Name and age | | Present Caterpillar Inc. position
and date of initial election | | Principal positions held during the
past five years if other than
Caterpillar Inc. position currently held |
| D. James Umpleby III (65) | | Chairman of the Board (2018) and Chief Executive Officer (2017) | | Group President (2013-2016) |
| Andrew R.J. Bonfield (61) | | Chief Financial Officer (2018) | | Group Chief Financial Officer for a multinational electricity and gas utility company (2010-2018) |
| Bob De Lange (54) | | Group President (2017) | | Vice President (2015-2016), Worldwide Product Manager, Medium Wheel Loaders, (2013-2014) |
| Denise C. Johnson (57) | | Group President (2016) | | Vice President (2012-2016) |
| Joseph E. Creed (48) | | Chief Operating Officer (2023) | | Group President (2021-2023), Vice President, Oil & Gas and Marine Division (2019-2020), Interim Chief Financial Officer (2018), Vice President, Finance Services Division (2017), Group Chief Financial Officer, Energy and Transportation (2013-2016) |
| Anthony D. Fassino (53) | | Group President (2021) | | Vice President, Building Construction Products (2018-2020), Director of Worldwide Forestry Products (2016-2018) |
| Derek R. Owens (50) | | Chief Legal Officer and General Counsel (2023) | | Senior Vice President (2023), Deputy General Counsel (2021-2023), Associate General Counsel, Litigation & Investigations (2019-2021), Assistant United States Attorney, U.S. Attorney's Office of the Department of Justice (2005-2019) |
| Cheryl H. Johnson (63) | | Chief Human Resources Officer (2017) | | Executive Vice President of Human Resources for a global multi-industry aerospace, defense and industrial manufacturing company (2012-2017) |
| William E. Schaupp (52) | | Vice President and Chief Accounting Officer (2022) | | Finance Director, Global Finance Services Division (2021-2022) Vice President and Controller and Chief Accounting Officer of PPG Industries, Inc. (2018-2021) |
| Jason E. Kaiser (45) | | Group President (2024) | | Senior Vice President, Electric Power Division (2021-2023), General Manager, Electric Power Division (2019-2021), Product Manager, Electric Power Division (2016-2019) |
Item 2.Properties.
General Information
Caterpillar’s operations are highly integrated. Although the majority of our plants are involved primarily in production relating to our Construction Industries, Resource Industries or Energy & Transportation segments, several plants are involved in manufacturing relating to more than one business segment. In addition, several plants reported in our financial statements under the All Other segment are involved in the manufacturing of components that are used in the assembly of products for more than one business segment. Caterpillar’s parts distribution centers are involved in the storage and distribution of parts for Construction Industries, Resource Industries and Energy & Transportation. The research and development activities carried on at our Technical Centers in Aurora and Mossville, Illinois involve products for Construction Industries, Resource Industries and Energy & Transportation.
We believe the properties we own to be generally well maintained and adequate for present use. Through planned capital expenditures, we expect these properties to remain adequate for future needs. Properties we lease are covered by leases expiring over terms of generally one to ten years. We do not anticipate any difficulty in retaining occupancy of any leased facilities, either by renewing leases prior to expiration or by replacing them with equivalent leased facilities.
Headquarters and Other Key Offices
Our corporate headquarters is in a leased office located in Irving, Texas. Our Financial Products business is headquartered in offices in Nashville, Tennessee. Additional key offices are located inside and outside the United States.
Technical Center, Training Centers, Demonstration Areas and Proving Grounds
We operate Technical Centers located in Aurora and Mossville, Illinois; Wuxi, China; and Chennai, India. Our demonstration centers are located in Tinaja Hills, Arizona; Edwards, Illinois; Chichibu, Japan and Malaga, Spain. We have various other technical and training centers, demonstration areas and proving grounds located both inside and outside the United States.
Parts Distribution Centers
Distribution of our parts is conducted from parts distribution centers inside and outside the United States. We operate parts distribution centers in the following locations: Arvin, California; Denver, Colorado; Miami, Florida; Atlanta, Georgia; Morton, Illinois; St. Paul, Minnesota; Clayton, Ohio; York, Pennsylvania; Waco, Texas; Spokane, Washington; Melbourne, Australia; Queensland, Australia; Grimbergen, Belgium; Piracicaba, Brazil; Shanghai, China; Sagami, Japan; San Luis Potosi, Mexico; Singapore, Republic of Singapore; Moscow, Russia; Johannesburg, South Africa; and Dubai, United Arab Emirates. We also own or lease other facilities that support our distribution activities.
Remanufacturing and Components
Remanufacturing of our products is reported in our Energy & Transportation segment and is conducted primarily at the facilities in the following locations: Franklin, Indiana; Bogor, Indonesia; Corinth, Mississippi; Prentiss County, Mississippi; West Fargo, North Dakota; Piracicaba, Brazil; Shanghai, China; and Nuevo Laredo, Mexico.
Component manufacturing is reported in the All Other segment and is conducted primarily at facilities in the following locations: East Peoria, Illinois; Mapleton, Illinois; Peoria, Illinois; Bogor, Indonesia; Menominee, Michigan; Boonville, Missouri; West Plains, Missouri; Goldsboro, North Carolina; Sumter, South Carolina; Tianjin, China; Xuzhou, China; Atessa, Italy; Bazzano, Italy; Frosinone, Italy; San Eusebio, Italy; Ramos Arizpe, Mexico; Pyeongtaek, South Korea; and Skinningrove, United Kingdom.
We also lease or own other facilities that support our remanufacturing and component manufacturing activities.
Manufacturing
Manufacturing of products for our Construction Industries, Resource Industries and Energy & Transportation segments is conducted primarily at the locations listed below. These facilities are believed to be suitable for their intended purposes, with adequate capacities for current and projected needs for existing products.
Our principal manufacturing facilities include those used by the following segments in the following locations:
| | | | | | | | | | | | | | |
| Segment | | U.S. Facilities | | Facilities Outside the U.S. |
| | | | |
| Construction Industries | | Arkansas: North Little Rock | | Brazil: Campo Largo, Piracicaba |
| | Georgia: Athens | | China: Suzhou, Wujiang, Xuzhou, Qingzhou |
| | Illinois: Decatur, East Peoria | | France: Grenoble, Echirolles |
| | Kansas: Wamego | | Hungary: Godollo |
| | Minnesota: Brooklyn Park | | India: Hosur, Thiruvallur |
| | North Carolina: Clayton, Sanford | | Italy: Minerbio, Cattolica |
| | Texas: Victoria | | Japan: Akashi |
| | | | Mexico: Torreon |
| | | | Netherlands: Den Bosch |
| | | | Poland: Janow, Sosnowiec |
| | | | Thailand: Rayong |
| | | | United Kingdom: Desford, Stockton |
| | | | |
| | | | |
| | | | |
| Resource Industries | | Illinois: Decatur, East Peoria | | China: Qingzhou, Wuxi |
| | South Carolina: Sumter | | Germany: Lunen |
| | Texas: Denison | | India: Thiruvallur |
| | Wisconsin: South Milwaukee | | Indonesia: Batam |
| | | | Mexico: Acuna, Monterrey, Reynosa |
| | | | Thailand: Rayong |
| | | | United Kingdom: Peterlee |
| | | | |
| | | | |
| Energy & Transportation | | Alabama: Albertville, Montgomery | | Australia: Cardiff, Perth, Redbank, Revesby |
| | California: San Diego | | Brazil: Curitiba, Hortolandia, Piracicaba, Sete Lagoas |
| | Georgia: Griffin, Patterson | | China: Tianjin, Wuxi |
| | Illinois: East Peoria,Mossville, Mapleton, Pontiac | | Czech Republic: Zatec, Zebrak |
| | Indiana: Lafayette, Muncie | | Germany: Kiel, Mannheim, Rostock |
| | Kentucky: Decoursey, Mayfield | | India: Aurangabad, Hosur |
| | Oklahoma: Broken Arrow | | Italy: Pistoria |
| | North Carolina: Winston-Salem | | Mexico: San Luis Potosi, Tijuana |
| | Texas: Channelview, DeSoto, Fort Worth, Mabank, San Antonio, Schertz, Seguin, Sherman | | United Kingdom: Larne, Peterborough, Sandiacre, South Queensferry, Springvale, Stafford, Wimborne |
| | | | |
Item 3.Legal Proceedings.
Certain legal proceedings in which we are involved are discussed in Note 22 — "Environmental and legal matters" of Part II, Item 8 "Financial Statements and Supplementary Data" and should be considered an integral part of Part I, Item 3 "Legal Proceedings", which is hereby incorporated by reference.
Item 4.Mine Safety Disclosures.
Not applicable.
PART II
Item 5.Market for Registrant’s Common Equity, Related Stockholder Matters and Issuer Purchases of Equity Securities.
Common Stock (NYSE: CAT)
Listing Information: Caterpillar common stock is listed on the New York Stock Exchange in the United States, and on stock exchanges in France and Switzerland.
Number of Shareholders: Shareholders of record at the end of 2023 totaled 21,217, compared with 21,935 at the end of 2022.
Performance Graph: Total Cumulative Shareholder Return for Five-Year Period Ending December 31, 2023
The graph below shows the cumulative shareholder return assuming an investment of $100 on December 31, 2018, and reinvestment of dividends issued thereafter.
| | | | | | | | | | | | | | | | | | | | | | | | | | | | | | | | | | | | | | |
| | | 2018 | | 2019 | | 2020 | | 2021 | | 2022 | | 2023 |
| Caterpillar Inc. | | $ | 100.00 | | | $ | 119.51 | | | $ | 151.74 | | | $ | 175.95 | | | $ | 208.67 | | | $ | 262.82 | |
| S&P 500 | | $ | 100.00 | | | $ | 131.49 | | | $ | 155.68 | | | $ | 200.37 | | | $ | 164.08 | | | $ | 207.21 | |
| S&P 500 Machinery | | $ | 100.00 | | | $ | 130.29 | | | $ | 160.81 | | | $ | 193.23 | | | $ | 195.93 | | | $ | 235.49 | |
Non-U.S. Employee Stock Purchase Plans
As of December 31, 2023, we had 28 employee stock purchase plans (the “EIP Plans”) administered outside the United States for our non-U.S. employees, which had approximately 14,000 active participants in the aggregate. During the fourth quarter of 2023, approximately 78,000 shares of Caterpillar common stock were purchased by the EIP Plans pursuant to the terms of such plans.
Issuer Purchases of Equity Securities
| | | | | | | | | | | | | | | | | | | | | | | | | | |
| Period | | Total Number
of Shares
Purchased | | Average Price Paid per Share | | Total Number
of Shares Purchased
as Part of Publicly Announced Program | | Approximate Dollar Value of Shares that May Yet be Purchased under the Program (in billions)1 |
| October 1-31, 2023 | | 965,566 | | | $ | 260.01 | | | 965,566 | | | $ | 10.340 | |
| November 1-30, 2023 | | 7,250,965 | | | $ | 239.97 | | | 7,250,965 | | 2 | $ | 8.300 | |
| December 1-31, 2023 | | 1,749,834 | | | $ | 271.45 | | | 1,749,834 | | | $ | 7.825 | |
| Total | | 9,966,365 | | | $ | 247.44 | | | 9,966,365 | | | |
| | | | | | | | |
1 In May 2022, the Board approved a share repurchase authorization (the 2022 Authorization) of up to $15.0 billion of Caterpillar common stock effective August 1, 2022, with no expiration. As of December 31, 2023, approximately $7.8 billion remained available under the 2022 Authorization. |
2 Includes shares acquired pursuant to the accelerated share repurchase agreement entered into during the fourth quarter of 2023. |
| | | | | | | | |
Item 6.[Reserved]
Item 7.Management’s Discussion and Analysis of Financial Condition and Results of Operations.
The following Management’s Discussion and Analysis of Financial Condition and Results of Operations (MD&A) is intended to provide information that will assist the reader in understanding the company’s Consolidated Financial Statements, the changes in certain key items in those financial statements between select periods and the primary factors that accounted for those changes. In addition, we discuss how certain accounting principles, policies and critical estimates affect our Consolidated Financial Statements. Our discussion also contains certain forward-looking statements related to future events and expectations. This MD&A should be read in conjunction with our discussion of cautionary statements and significant risks to the company’s business under Item 1A. Risk Factors of the 2023 Form 10-K.
Highlights for the full-year 2023 include:
•Sales and revenues for 2023 were $67.060 billion, an increase of $7.633 billion, or 13 percent, compared with $59.427 billion for 2022. Sales were higher across the three primary segments.
•Operating profit as a percent of sales and revenues was 19.3 percent in 2023, compared with 13.3 percent in 2022. Adjusted operating profit margin was 20.5 percent in 2023, compared with 15.4 percent in 2022.
•Profit per share for 2023 was $20.12, and excluding the items in the table below, adjusted profit per share was $21.21. Profit per share for 2022 was $12.64, and excluding the items in the table below, adjusted profit per share was $13.84.
•In order for our results to be more meaningful to our readers, we have separately quantified the impact of several significant items. A detailed reconciliation of GAAP to non-GAAP financial measures is included on page 47.
| | | | | | | | | | | | | | | | | | | | |
| | | | | | |
| | Full Year 2023 | | Full Year 2022 |
| (Dollars in millions except per share data) | | Profit Before Taxes | Profit
Per Share | | Profit Before Taxes | Profit
Per Share |
| Profit | | $ | 13,050 | | $ | 20.12 | | | $ | 8,752 | | $ | 12.64 | |
Restructuring costs - Longwall divestiture | | 586 | | 1.14 | | | — | | — | |
Other restructuring costs | | 194 | | 0.30 | | | 299 | | 0.43 | |
| Mark-to-market (gains) losses | | (97) | | (0.14) | | | (606) | | (0.91) | |
| Deferred tax valuation allowance adjustments | | — | | (0.21) | | | — | | — | |
| Goodwill impairment | | — | | — | | | 925 | | 1.68 | |
| Adjusted profit | | $ | 13,733 | | $ | 21.21 | | | $ | 9,370 | | $ | 13.84 | |
| | | | | | |
•Enterprise operating cash flow was $12.9 billion in 2023. Caterpillar ended 2023 with $7.0 billion of enterprise cash.
OVERVIEW
Total sales and revenues for 2023 were $67.060 billion, an increase of $7.633 billion, or 13 percent, compared with $59.427 billion for 2022. The increase was primarily due to favorable price realization and higher sales volume. Profit per share was $20.12 in 2023, compared with profit per share of $12.64 in 2022. Profit was $10.335 billion in 2023, compared with $6.705 billion in 2022. The increase was primarily due to favorable price realization, higher sales volume and the absence of a 2022 goodwill impairment charge related to the Rail division, partially offset by higher selling, general and administrative (SG&A) and research and development (R&D) expenses, unfavorable manufacturing costs, the impact of the divestiture of the company's Longwall business and lower mark-to-market gains for remeasurement of pension and other postemployment benefit (OPEB) plans.
Trends and Economic Conditions
Outlook for Key End Markets
Overall demand remains healthy across most of our end markets for our products and services.
In Construction Industries, we expect North America to remain healthy in 2024. We expect non-residential construction in North America to remain at similar demand levels as 2023 due to government-related infrastructure investments. Residential construction is expected to remain healthy relative to historical levels. In Asia Pacific, excluding China, we expect some softening in economic conditions. We anticipate China will remain at a relatively low level in the excavator industry above 10-tons. In EAME, we anticipate the region will be slightly down due to economic uncertainty in Europe, partially offset by continuing strong construction demand in the Middle East. Construction activity in Latin America is expected to increase due to easing financial conditions. In addition, we anticipate the ongoing benefit of our services initiatives will positively impact Construction Industries in 2024.
In Resource Industries, in 2024, for both mining and heavy construction and quarry and aggregates, we anticipate lower sales volume compared to 2023, primarily due to off-highway and articulated trucks. While we continue to see a high level of quoting activity overall, we anticipate lower order rates as customers display capital discipline. Customer product utilization remains high, the number of parked trucks remains low, the age of the fleet remains elevated and our autonomous solutions continue to have strong customer acceptance. We expect higher services revenues, including robust rebuild activity in 2024. We continue to believe the energy transition will support increased commodity demand over time, expanding our total addressable market and providing further opportunities for long-term profitable growth.
In Energy & Transportation, in Oil & Gas, we expect reciprocating engines and services to increase slightly in 2024 compared to 2023. Well servicing in North America is showing some short-term moderation. Gas compression order backlog remains healthy and we continue to remain optimistic about future demand. Power Generation reciprocating engine demand is expected to remain strong due to continued data center growth. Solar Turbines has a strong backlog and continues to experience robust quoting activity. Industrial demand is expected to soften from a strong 2023. In Transportation, we anticipate high-speed marine to increase slightly as customers continue to upgrade aging fleets.
Company Trends and Expectations
For the full-year 2024, we anticipate sales and revenues will be broadly similar to 2023, supported by continued healthy underlying demand across most of our end markets for our products and services and slightly favorable price realization. We anticipate another year of services growth in 2024. We do not expect a significant change in machine dealer inventories in 2024, compared to an increase in 2023. In Construction Industries, sales of equipment to end users is expected to be broadly similar to 2023. In Construction Industries, we do not expect dealer inventory to increase in 2024 as it did in 2023. We also anticipate services initiatives will benefit the segment. Resource Industries' sales in 2024 are expected to be lower, driven by lower sales volume primarily in off-highway and articulated trucks. We also expect an unfavorable impact from changes in dealer inventories in Resource Industries. In 2024, we expect services revenues will increase in Resource Industries. Within Energy & Transportation in 2024, we expect slightly higher sales. Power Generation, Oil & Gas and Transportation sales are expected to increase. Industrial sales are expected to be lower compared to historically strong levels in 2023.
In 2024, we expect a small benefit from price realization during the first half of the year from price actions taken in the second half of 2023. We expect price realization to modestly exceed manufacturing costs, with moderation throughout the year as we lap favorable price trends from 2023. For 2024, we expect short-term incentive compensation expense to be about $1.2 billion, compared to $1.7 billion in 2023. We expect the short-term incentive compensation expense benefit year over year to be offset by increases in SG&A/R&D expenses as we continue to invest in strategic initiatives aimed at future long-term profitable growth, such as services growth and technology, including autonomy, alternative fuels, connectivity and digital and electrification. In addition, we anticipate an impact due to an unfavorable mix of products. In 2024, we expect restructuring costs to be between $300 million and $450 million and expect capital expenditures to be in the range of $2.0 billion to $2.5 billion. We expect the global annual effective tax rate, excluding discrete items, to be between 22.5 percent and 23.5 percent.
In the first quarter of 2024, we expect sales and revenues to be broadly similar to the first quarter of 2023. We expect demand to remain healthy, but anticipate slightly lower machine dealer inventory build as compared to the first quarter of 2023. We anticipate price realization will remain favorable. We expect Construction Industries' sales to remain flat to slightly higher, including favorable price realization. Resource Industries' sales are expected to be lower driven by lower sales volume, partially offset by favorable price realization. In Energy & Transportation, we expect sales to be flat to slightly higher.
In the first quarter of 2024, we expect favorable price realization to more than offset unfavorable manufacturing costs. We expect manufacturing costs to increase primarily due to cost absorption. We do not expect an inventory increase as compared to the increase in the first quarter of 2023. We also anticipate an increase in SG&A/R&D expenses due to investment in strategic initiatives. In Construction Industries, we expect favorable price realization to be offset by increased SG&A/R&D expenses and slightly higher manufacturing costs, including cost absorption. In Resource Industries, we expect the profit impact from lower sales volume to be partially offset by favorable price realization. In Energy & Transportation, we anticipate favorable price realization to be offset by higher manufacturing costs.
Global Business Conditions
We continue to monitor a variety of external factors around the world, such as supply chain disruptions, inflationary cost and labor pressures. Areas of particular focus include transportation, certain components and raw materials. We continue to work to minimize supply chain challenges that may impact our ability to meet customer demand. We continue to assess the environment to determine if additional actions need to be taken.
Risk Factors
Risk factors are disclosed within Item 1A. Risk Factors of the 2023 Form 10-K.
Notes:
•Glossary of terms included on pages 35-37; first occurrence of terms shown in bold italics.
•Information on non-GAAP financial measures is included on page 47.
•Some amounts within this report are rounded to the millions or billions and may not add. In addition, the sum of the components reported across periods may not equal the total amount reported year-to-date due to rounding.
2023 COMPARED WITH 2022
CONSOLIDATED SALES AND REVENUES
The chart above graphically illustrates reasons for the change in consolidated operating profitsales and revenues between the fourth quarter of 20202022 (at left) and the fourth quarter of 20212023 (at right). Caterpillar management utilizes these charts internally to visually communicate with the company’s Boardcompany’s board of Directorsdirectors and employees. The bar entitled Other includes consolidating adjustments
Total sales and Machinery, Energy & Transportation other operating (income) expenses.
Operating profitrevenues for the fourth quarter of 2021 was $1.6112023 were $67.060 billion, an increase of $231 million,$7.633 billion, or 1713 percent, compared with $1.380$59.427 billion in the fourth quarter of 2020. Higher manufacturing costs and selling, general and administrative (SG&A) and research and development (R&D) expenses were more than offset by higher sales volume,2022. The increase was primarily due to favorable price realization and net restructuring income due to a gain on the sale of a facility.
Unfavorable manufacturing costs reflected higher variable labor and burden, primarily freight, and higher material costs.
sales volume. The increase in SG&A/R&D expensessales volume was driven by higher short-term incentive compensation expense, which was reinstatedsales of equipment to end users, partially offset by the impact from changes in 2021,dealer inventories. Dealer inventory increased about $2.4 billion during 2022, compared to an increase of about $2.1 billion during 2023.
Sales were higher labor costsin the three primary segments.
North America sales increased 25 percent driven by higher sales of equipment to end users, favorable price realization and the impact from changes in dealer inventories. Dealer inventory increased more during 2023 than during 2022.
Sales decreased 2 percent in Latin America due to the impact from changes in dealer inventories and lower services sales volume, partially offset by favorable price realization and favorable currency impacts primarily related to the Brazilian real. Dealer inventory increased headcount and investments aligned with the company's strategy for profitable growth, including acquisition-related expenses.
Short-term incentive compensation expense, which was reinstated in 2021, was about $200 million in the fourth quarter of 2021,during 2022, compared to no short-term incentive compensation expense recognizeda decrease during 2023.
EAME sales increased 6 percent due to favorable price realization and higher sales of equipment to end users, partially offset by the impact from changes in dealer inventories. Dealer inventory increased more during 2022 than during 2023.
Asia/Pacific sales increased 2 percent driven by favorable price realization, partially offset by unfavorable currency impacts, primarily related to the fourth quarterAustralian dollar and Japanese yen, lower sales of 2020.equipment to end users and the impact from changes in dealer inventories. Dealer inventory increased more during 2022 than during 2023.
Operating profit margin was 11.7 percentDealer inventory increased about $2.1 billion during 2023, compared to an increase of about $2.4 billion during 2022. Dealers are independent, and the reasons for the fourth quarterchanges in their inventory levels vary, including their expectations of 2021, compared with 12.3 percent for the fourth quarterfuture demand and product delivery times. Dealers’ demand expectations take into account seasonal changes, macroeconomic conditions, machine rental rates and other factors. Delivery times can vary based on availability of 2020.
| | | | | | | | | | | | | | | | | | | | | | | | | | |
| Profit (Loss) by Segment | | | | | | | | |
| (Millions of dollars) | | Fourth Quarter 2021 | | Fourth Quarter 2020 | | $
Change | | %
Change |
| Construction Industries | | $ | 788 | | | $ | 630 | | | $ | 158 | | | 25 | % |
| Resource Industries | | 305 | | | 273 | | | 32 | | | 12 | % |
| Energy & Transportation | | 675 | | | 687 | | | (12) | | | (2 | %) |
| All Other Segment | | (12) | | | (3) | | | (9) | | | (300 | %) |
| Corporate Items and Eliminations | | (281) | | | (281) | | | — | | | |
| Machinery, Energy & Transportation | | 1,475 | | | 1,306 | | | 169 | | | 13 | % |
| | | | | | | | |
| Financial Products Segment | | 248 | | | 195 | | | 53 | | | 27 | % |
| Corporate Items and Eliminations | | (37) | | | (47) | | | 10 | | | |
| Financial Products | | 211 | | | 148 | | | 63 | | | 43 | % |
| Consolidating Adjustments | | (75) | | | (74) | | | (1) | | | |
| Consolidated Operating Profit | | $ | 1,611 | | | $ | 1,380 | | | $ | 231 | | | 17 | % |
| | | | | | | | |
Other Profit/Loss and Tax Items | | | | | | | | | | | | | | | | | | | | | | | | | | | | | | | | | | | | | | | | | | | | | | | | | | | | |
| Sales and Revenues by Segment |
| (Millions of dollars) | | 2022 | | Sales
Volume | | Price
Realization | | Currency | | | | Inter-Segment / Other | | 2023 | | $
Change | | %
Change |
| Construction Industries | | $ | 25,269 | | | $ | (314) | | | $ | 2,678 | | | $ | (197) | | | | | $ | (18) | | | $ | 27,418 | | | $ | 2,149 | | | 9 | % |
| Resource Industries | | 12,314 | | | (114) | | | 1,422 | | | (77) | | | | | 38 | | | 13,583 | | | 1,269 | | | 10 | % |
| Energy & Transportation | | 23,752 | | | 2,529 | | | 1,500 | | | (11) | | | | | 231 | | | 28,001 | | | 4,249 | | | 18 | % |
| All Other Segment | | 450 | | | (8) | | | (5) | | | (1) | | | | | 13 | | | 449 | | | (1) | | | — | % |
| Corporate Items and Eliminations | | (5,211) | | | (115) | | | 1 | | | 7 | | | | | (264) | | | (5,582) | | | (371) | | | |
| Machinery, Energy & Transportation | | 56,574 | | | 1,978 | | | 5,596 | | | (279) | | | | | — | | | 63,869 | | | 7,295 | | | 13 | % |
| | | | | | | | | | | | | | | | | | |
| Financial Products Segment | | 3,253 | | | — | | | — | | | — | | | | | 532 | | | 3,785 | | | 532 | | | 16 | % |
| Corporate Items and Eliminations | | (400) | | | — | | | — | | | — | | | | | (194) | | | (594) | | | (194) | | | |
Financial Products Revenues | | 2,853 | | | — | | | — | | | — | | | | | 338 | | | 3,191 | | | 338 | | | 12 | % |
| | | | | | | | | | | | | | | | | | |
| Consolidated Sales and Revenues | | $ | 59,427 | | | $ | 1,978 | | | $ | 5,596 | | | $ | (279) | | | | | $ | 338 | | | $ | 67,060 | | | $ | 7,633 | | | 13 | % |
| | | | | | | | | | | | | | | | | | |
| | | | | | | | | | | | | | | | | | | | | | | | | | | | | | | | | | | | | | | | | | | | | | | | | | | | | | | | | | | | | | | | | | | | | | | | | | | | | | | | | | | |
| Sales and Revenues by Geographic Region |
| North America | | Latin America | | EAME | | Asia/Pacific | | External Sales and Revenues | | Inter-Segment | | Total Sales and Revenues |
| (Millions of dollars) | $ | | % Chg | | $ | | % Chg | | $ | | % Chg | | $ | | % Chg | | $ | | % Chg | | $ | | % Chg | | $ | | % Chg |
| 2023 | | | | | | | | | | | | | | | | | | | | | | | | | | | |
| Construction Industries | $ | 15,343 | | | 24% | | $ | 2,307 | | | (19%) | | $ | 5,254 | | | 3% | | $ | 4,390 | | | (9%) | | $ | 27,294 | | | 9% | | $ | 124 | | | (13%) | | $ | 27,418 | | | 9 | % |
| Resource Industries | 5,256 | | | 16% | | 2,040 | | | 11% | | 2,069 | | | (6%) | | 3,879 | | | 13% | | 13,244 | | | 10% | | 339 | | | 13% | | 13,583 | | | 10 | % |
| Energy & Transportation | 11,982 | | | 31% | | 1,983 | | | 11% | | 5,929 | | | 13% | | 3,461 | | | 10% | | 23,355 | | | 21% | | 4,646 | | | 5% | | 28,001 | | | 18 | % |
| All Other Segment | 65 | | | 2% | | (1) | | | (150%) | | 18 | | | 127% | | 49 | | | (66%) | | 131 | | | (10%) | | 318 | | | 4% | | 449 | | | — | % |
| Corporate Items and Eliminations | (133) | | | | | (3) | | | | | (5) | | | | | (14) | | | | | (155) | | | | | (5,427) | | | | | (5,582) | | | |
| Machinery, Energy & Transportation | 32,513 | | | 25% | | 6,326 | | | (2%) | | 13,265 | | | 6% | | 11,765 | | | 2% | | 63,869 | | | 13% | | — | | | —% | | 63,869 | | | 13 | % |
| | | | | | | | | | | | | | | | | | | | | | | | | | | |
| Financial Products Segment | 2,440 | | | 17% | | 416 | | | 20% | | 491 | | | 24% | | 438 | | | 2% | | 3,785 | | 1 | 16% | | — | | | —% | | 3,785 | | | 16 | % |
| Corporate Items and Eliminations | (347) | | | | | (77) | | | | | (83) | | | | | (87) | | | | | (594) | | | | | — | | | | | (594) | | | |
| Financial Products Revenues | 2,093 | | | 12% | | 339 | | | 26% | | 408 | | | 17% | | 351 | | | (3%) | | 3,191 | | | 12% | | — | | | —% | | 3,191 | | | 12 | % |
| | | | | | | | | | | | | | | | | | | | | | | | | | | |
| Consolidated Sales and Revenues | $ | 34,606 | | | 24% | | $ | 6,665 | | | (1%) | | $ | 13,673 | | | 7% | | $ | 12,116 | | | 2% | | $ | 67,060 | | | 13% | | $ | — | | | —% | | $ | 67,060 | | | 13 | % |
| | | | | | | | | | | | | | | | | | | | | | | | | | | |
| 2022 | | | | | | | | | | | | | | | | | | | | | | | | | | | |
| Construction Industries | $ | 12,367 | | | | | $ | 2,843 | | | | | $ | 5,099 | | | | | $ | 4,818 | | | | | $ | 25,127 | | | | | $ | 142 | | | | | $ | 25,269 | | | |
| Resource Industries | 4,531 | | | | | 1,840 | | | | | 2,205 | | | | | 3,437 | | | | | 12,013 | | | | | 301 | | | | | 12,314 | | | |
| Energy & Transportation | 9,175 | | | | | 1,784 | | | | | 5,232 | | | | | 3,146 | | | | | 19,337 | | | | | 4,415 | | | | | 23,752 | | | |
| All Other Segment | 64 | | | | | 2 | | | | | (66) | | | | | 145 | | | | | 145 | | | | | 305 | | | | | 450 | | | |
| Corporate Items and Eliminations | (29) | | | | | (1) | | | | | (5) | | | | | (13) | | | | | (48) | | | | | (5,163) | | | | | (5,211) | | | |
| Machinery, Energy & Transportation | 26,108 | | | | | 6,468 | | | | | 12,465 | | | | | 11,533 | | | | | 56,574 | | | | | — | | | | | 56,574 | | | |
| | | | | | | | | | | | | | | | | | | | | | | | | | | |
| Financial Products Segment | 2,078 | | | | | 348 | | | | | 396 | | | | | 431 | | | | | 3,253 | | 1 | | | — | | | | | 3,253 | | | |
| Corporate Items and Eliminations | (205) | | | | | (78) | | | | | (47) | | | | | (70) | | | | | (400) | | | | | — | | | | | (400) | | | |
| Financial Products Revenues | 1,873 | | | | | 270 | | | | | 349 | | | | | 361 | | | | | 2,853 | | | | | — | | | | | 2,853 | | | |
| | | | | | | | | | | | | | | | | | | | | | | | | | | |
| Consolidated Sales and Revenues | $ | 27,981 | | | | | $ | 6,738 | | | | | $ | 12,814 | | | | | $ | 11,894 | | | | | $ | 59,427 | | | | | $ | — | | | | | $ | 59,427 | | | |
| | | | | | | | | | | | | | | | | | | | | | | | | | | |
1 Includes revenues from Machinery, Energy & Transportation of $690 million and $478 million in 2023 and 2022, respectively. |
•Interest expense excluding Financial Products in the fourth quarter of 2021 was $112 million, compared with $130 million in the fourth quarter of 2020. The decrease was due to lower average debt outstanding during the fourth quarter of 2021, compared with the fourth quarter of 2020.
•
•The provision for income taxes for the fourth quarter of 2021 reflected an annual effective tax rate of 22.9 percent, compared with 27.8 percent for the fourth quarter of 2020, excluding the discrete items discussed in the following paragraph. The decrease from 2020 was primarily related to changes in the geographic mix of profits from a tax perspective.
The provision for income taxes for the fourth quarter of 2021 also included the following:
◦A tax benefit of $118 million for the change from the third-quarter estimated annual tax rate of 25 percent, compared to a $96 million benefit for the reduction in the annual effective tax rate in the fourth quarter of 2020.
◦A tax charge of $190 million related to $833 million of pension and OPEB mark-to-market gains in the fourth quarter of 2021, compared to a $92 million tax benefit related to $438 million of mark-to-market losses in the fourth quarter of 2020.
◦A tax benefit of $40 million in the fourth quarter of 2021 primarily related to recognition of U.S. capital losses compared to $28 million in the fourth quarter of 2020 for the settlement of stock-based compensation awards with associated tax deductions in excess of cumulative U.S. GAAP compensation expense.
Construction Industries
Our Construction Industries segment is primarily responsible for supporting customers using machinery in infrastructure and building construction. The majority of machine sales in this segment are made in the heavy and general construction, rental, quarry and aggregates and mining.
The nature of customer demand for construction machinery varies around the world. Customers in developing economies often prioritize purchase price in making their investment decisions, while customers in developed economies generally weigh productivity and other performance criteria that contribute to lower owning and operating costs over the lifetime of the machine. To meet customer expectations in developing economies, Caterpillar developed differentiated product offerings that target customers in those regions, including our SEM brand machines. We believe that these customer-driven product innovations enable us to compete more effectively in developing economies. The majority of Construction Industries' research and development spending in 2023 focused on the next generation of construction machines.
The competitive environment for construction machinery is characterized by some global competitors and many regional and specialized local competitors.Examples of global competitors include CASE (part of CNH Industrial N.V.), Deere Construction & Forestry (part of Deere & Company), Doosan Bobcat (Part of Doosan Group), Hitachi Construction Machinery Co., Ltd., Hyundai Construction Equipment Co., Ltd., Hyundai Doosan Infracore Co., Ltd. (both part of Hyundai Heavy Industries Group), J.C. Bamford Excavators Ltd., Kobelco Construction Machinery (part of Kobe Steel, Ltd), Komatsu Ltd., Kubota Farm & Industrial Machinery (part of Kubota Corporation), Sany Heavy Industry Co., Ltd., and Volvo Construction Equipment (part of the Volvo Group).As an example of regional and local competitors, our competitors in China also include Guangxi LiuGong Machinery Co., Ltd., Longking Holdings Ltd., Sany Heavy Industry Co, XCMG Construction Machinery Co., Ltd., Shandong Lingong Construction Machinery Co., Ltd. (SDLG, JV with Volvo Construction Equipment) and Shantui Construction Machinery Co., Ltd., (part of Shandong Heavy Industry Group Co.).Each of these companies has varying product lines that compete with Caterpillar products, and each has varying degrees of regional focus.
The Construction Industries portfolio includes the following product families as well as related parts and work tools:
| | | | | | | | | | | | | | |
| · asphalt pavers | | · motor graders | | · track-type tractors (small, medium) |
| · backhoe loaders | | · pipelayers | | · track excavators (mini, small |
| · cold planers | | · road reclaimers | | medium, large) |
| · compactors | | · skid steer loaders | | · wheel excavators |
| · compact track loaders | | · telehandlers | | · wheel loaders (compact, small,
|
| · forestry machines | | · track-type loaders | | medium) |
| · material handlers | | | | |
Resource Industries
The Resource Industries segment is primarily responsible for supporting customers using machinery in mining and heavy construction and quarry and aggregates. Caterpillar offers a broad product range and services to deliver comprehensive solutions for our customers. We develop and manufacture high productivity equipment for both surface and underground mining operations around the world, as well as provide hydraulic systems, electronics and software for Caterpillar machines and engines.Our equipment is used to extract and haul copper, iron ore, coal, oil sands, aggregates, gold and other minerals and ores, as well as a variety of heavy construction applications.In addition to equipment, Resource Industries also develops and sells technology products and services to provide customers fleet management systems, equipment management analytics and autonomous machine capabilities.
Customers in most markets place an emphasis on equipment that is highly productive, reliable and provides the lowest total cost of ownership over the life of the equipment.In some developing markets, customers often prioritize purchase price in making their investment decisions. We believe our ability to control the integration and design of key machine components and innovative technologies represents a competitive advantage. Our research and development efforts remain focused on providing customers the lowest total cost of ownership enabled through the highest quality, most productive products and services in the industry.
The competitive environment for Resource Industries consists of a few larger global competitors that compete in several of the markets that we serve and a substantial number of smaller companies that compete in a more limited range of products, applications, and regional markets. Our global surface competitors include Deere Construction & Forestry (part of Deere & Company), Epiroc AB, Hitachi Construction Machinery Co., Ltd., Komatsu Ltd., Liebherr-International AG, Sandvik AB, and Volvo Construction Equipment. Our global underground competitors include Epiroc AB, Komatsu Ltd., and Sandvik AB.
The Resource Industries product portfolio includes the following machines and related parts and services:
| | | | | | | | | | | | | | |
·electric rope shovels | | ·large wheel loaders | | ·soil compactors |
·draglines | | ·off-highway trucks | | ·machinery components |
·hydraulic shovels | | ·articulated trucks | | ·autonomous ready vehicles and solutions |
·rotary drills | | ·wheel tractor scrapers | | ·select work tools |
·hard rock vehicles | | ·wheel dozers | | ·safety services and mining performance |
·large track-type tractors | | ·fleet management | | solutions |
·large mining trucks | | ·landfill compactors | | |
| | | | |
| | | | |
| | | | |
| | | | |
| | | | |
Energy & Transportation
Our Energy & Transportation segment supports customers in oil and gas, power generation, marine, rail and industrial applications, including Caterpillar machines. The product and services portfolio includes reciprocating engines, generator sets, integrated systems and solutions, turbines and turbine-related services, electrified powertrain and zero-emission power sources and service solutions development, the remanufacturing of Caterpillar engines and components, remanufacturing services for other companies, diesel-electric locomotives and other rail-related products and services and product support of on-highway vocational trucks for North America.
Regulatory emissions standards require us to continue to make investments as new products and new regulations are introduced. Ongoing compliance with these regulations remains a focus. Emissions compliance in developing markets is complex due to rapidly evolving and unique requirements where enforcement processes can often vary. We employ robust product development, manufacturing processes and testing to help us comply with these regulations.
The competitive environment for reciprocating engines in marine, oil and gas, industrial and electric power generation systems along with turbines in oil and gas and electric power generation consists of a few larger global competitors that compete in a variety of markets that Caterpillar serves, and a substantial number of smaller companies that compete in a limited-size product range, geographic region and/or application. Principal global competitors include Cummins Inc., Deutz AG, Rolls-Royce Power Systems and Siemens Energy Global GmbH. Other competitors, such as Volvo Penta AB, FPT Industrial (Iveco Group), INNIO, GE Vernova, Kawasaki Heavy Industries Energy Solution & Marine Engineering, MAN Energy Solutions (VW), Weichai Power Co., Ltd., and other emerging market competitors compete in certain markets in which Caterpillar competes. An additional set of competitors, including Aggreko plc, Generac Holdings, Kohler Energy, Baker Hughes Co., and others, are primarily packagers who source engines and/or other components from domestic and international suppliers and market products regionally and internationally through a variety of distribution channels. In rail-related businesses, our global competitors include Wabtec Freight, The Greenbrier Companies, Voestalpine AG, and Vossloh AG, Alstom SA, Siemens Mobility, and CRRC Corp., LTD. We also compete with other companies on a more limited range of products, services and/or geographic regions.
The Energy & Transportation portfolio includes the following products and related parts:
•Reciprocating engine powered generator sets
•Reciprocating engines, drivetrain and integrated systems and solutions supplied to the industrial industry as well as Caterpillar machinery
•Integrated systems and solutions used in the electric power generation industry
•Turbines, centrifugal gas compressors and related services
•Reciprocating engines, drivetrain and integrated systems and solutions for the marine and oil and gas industries
•Diesel-electric locomotives and components and other rail-related products and services
Financial Products Segment
The business of our Financial Products Segment is primarily conducted by Cat Financial, Insurance Services and their respective subsidiaries and affiliates. Cat Financial is a wholly owned finance subsidiary of Caterpillar Inc. and it provides retail and wholesale financing alternatives to customers and dealers around the world for Caterpillar products and services, as well as financing for vehicles and power generation facilities that, in most cases, incorporate Caterpillar products. Retail financing is primarily comprised of installment sale contracts and other equipment-related loans, working capital loans, finance leases and operating leases. Wholesale financing to Caterpillar dealers consists primarily of inventory and rental fleet financing. In addition, Cat Financial purchases short-term wholesale trade receivables from Caterpillar. The various financing plans offered by Cat Financial are designed to support sales of Caterpillar products and services and generate financing income for Cat Financial. A significant portion of our activity is conducted in North America and we have additional offices and subsidiaries in Latin America, Asia/Pacific, Europe and Africa.
For over 40 years, Cat Financial has been providing financing for Caterpillar products, contributing to our knowledge of asset values, industry trends, financing structures and customer needs.
In certain instances, Cat Financial’s operations are subject to supervision and regulation by state, federal and various foreign governmental authorities, and may be subject to various laws and judicial and administrative decisions imposing various requirements and restrictions which, among other things, (i) regulate credit granting activities and the administration of loans, (ii) establish maximum interest rates, finance charges and other charges, (iii) require disclosures to customers, (iv) govern secured transactions, (v) set collection, foreclosure, repossession and other trade practices and (vi) regulate the use and reporting of information related to a borrower’s credit experience. Cat Financial’s ability to comply with these and other governmental and legal requirements and restrictions affects its operations.
Cat Financial’s retail loans include:
•Loans that allow customers and dealers to use their Caterpillar equipment or other assets as collateral to obtain financing.
•Installment sale contracts, which are equipment loans that enable customers to purchase equipment with structured payments over time.
Cat Financial's retail leases include:
•Finance (non-tax) leases, where the lessee for tax purposes is considered to be the owner of the equipment during the term of the lease, that either require or allow the customer to purchase the equipment for a fixed price at the end of the term.
•Tax leases that are classified as either operating or finance leases for financial accounting purposes, depending on the characteristics of the lease. For tax purposes, we are considered the owner of the equipment.
Cat Financial also purchases short-term receivables from Caterpillar.
Cat Financial’s wholesale loans and leases include inventory/rental programs, which provide assistance to dealers by financing their new Caterpillar inventory and rental fleets.
Cat Financial operates in a highly competitive environment, with financing for users of Caterpillar equipment and services available through a variety of sources, principally commercial banks and finance and leasing companies. Our competitors include Wells Fargo Equipment Finance Inc., Banc of America Leasing & Capital LLC, BNP Paribas Leasing Solutions Limited, Australia and New Zealand Banking Group Limited, Société Générale S.A. and various other banks and finance companies. In addition, many of the manufacturers that compete with Caterpillar also own financial subsidiaries, such as John Deere Capital Corporation, Komatsu Financial L.P., Volvo Financial Services and Kubota Credit Corporation, which utilize many below-market interest rate programs (funded by the manufacturer) to support machine sales. Cat Financial works with the broader Caterpillar organization to provide a broad array of financial merchandising programs to compete around the world.
The financial results of Cat Financial are largely dependent upon the ability of Caterpillar dealers to sell equipment and customers’ willingness to enter into financing or leasing agreements. Cat Financial is also affected by, among other things, the availability of funds from its financing sources, its cost of funds relative to its competitors and general economic conditions such as inflation and market interest rates.
Cat Financial has a match-funding policy that addresses interest rate risk by aligning the interest rate profile (fixed or floating rate and duration) of its debt portfolio with the interest rate profile of its receivables portfolio within predetermined ranges on an ongoing basis. In connection with that policy, Cat Financial uses interest rate derivative instruments to modify the debt structure to match assets within the receivables portfolio. This matched funding reduces the volatility of margins between interest-bearing assets and interest-bearing liabilities, regardless of which direction interest rates move. For more information regarding match funding, please see Note 4 — “Derivative financial instruments and risk management” of Part II, Item 8 "Financial Statements and Supplementary Data." See also the risk factors associated with our financial products business included in Item 1 A. of this Form 10-K.
In managing foreign currency risk for Cat Financial’s operations, the objective is to minimize earnings volatility resulting from conversion and the remeasurement of net foreign currency balance sheet positions, and future transactions denominated in foreign currencies. This policy allows the use of foreign currency forward, option and cross currency contracts to offset the risk of currency mismatch between the assets and liabilities, and exchange rate risk associated with future transactions denominated in foreign currencies.
Cat Financial provides financing only when certain criteria are met. Credit decisions are based on a variety of credit quality factors including prior payment experience, customer financial information, credit ratings, loan-to-value ratios and other internal metrics. Cat Financial typically maintains a security interest in retail-financed equipment and generally requires physical damage insurance coverage on financed equipment. Cat Financial finances a significant portion of Caterpillar dealers’ sales and inventory of Caterpillar equipment throughout the world. Cat Financial’s competitive position is improved by marketing programs offered in conjunction with Caterpillar and/or Caterpillar dealers. Under these programs, Caterpillar, or the dealer, funds an amount at the outset of the transaction, which Cat Financial then recognizes as revenue over the term of the financing. We believe that these marketing programs provide Cat Financial a significant competitive advantage in financing Caterpillar products.
Caterpillar Insurance Company, a wholly owned subsidiary of Caterpillar Insurance Holdings Inc., is a U.S. insurance company domiciled in Missouri and primarily regulated by the Missouri Department of Insurance. Caterpillar Insurance Company is licensed to conduct property and casualty insurance business in 50 states, the District of Columbia and Guam, and as such, is also regulated in those jurisdictions. The State of Missouri acts as the lead regulatory authority and monitors Caterpillar Insurance Company’s financial status to ensure that it is in compliance with minimum solvency requirements, as well as other financial ratios prescribed by the National Association of Insurance Commissioners. Caterpillar Insurance Company is also licensed to conduct insurance business through a branch in Zurich, Switzerland and, as such, is regulated by the Swiss Financial Market Supervisory Authority.
Caterpillar Life Insurance Company, a wholly owned subsidiary of Caterpillar, is a U.S. insurance company domiciled in Missouri and primarily regulated by the Missouri Department of Insurance. Caterpillar Life Insurance Company is licensed to conduct life and accident and health insurance business in 26 states and the District of Columbia and, as such, is also regulated in those jurisdictions. The State of Missouri acts as the lead regulatory authority and it monitors the financial status to ensure that it is in compliance with minimum solvency requirements, as well as other financial ratios prescribed by the National Association of Insurance Commissioners. Caterpillar Life Insurance Company provides reinsurance coverage to Caterpillar Insurance Company. Specifically, Caterpillar Life Insurance Company has entered into a reinsurance agreement with Caterpillar Insurance Company, assuming 100% of the risk of an Accident and Health Stop Loss Insurance Policy to cover a Caterpillar Voluntary Employees' Benefits Association (VEBA) Trust for medical losses sustained by a select group of Caterpillar retirees and dependents.
Caterpillar Insurance Co. Ltd., a wholly owned subsidiary of Caterpillar Insurance Holdings Inc., is a captive insurance company domiciled in Bermuda and regulated by the Bermuda Monetary Authority. Caterpillar Insurance Co. Ltd. is registered as a Class 2 (General Business) and Class B (Long-Term) insurer with the Bermuda Monetary Authority. Under its Class 2 insurance license, Caterpillar Insurance Co. Ltd. insures its parent and affiliates for general liability, property, auto liability and cargo. It also provides reinsurance to Caterpillar Insurance Company under a quota share reinsurance agreement for its contractual liability and contractors’ equipment programs in the United States. In addition, Caterpillar Insurance Co. Ltd. reinsures 100% of the international employee benefit plans of Caterpillar Inc. through retrocession agreements with other insurers. The employee benefits coverages include medical and accident coverages. which are reported under its Class 2 insurance license and life and disability coverages, which are reported under its Class B insurance license. The Bermuda Monetary Authority is responsible for monitoring compliance with solvency requirements and requires an Annual Financial Filing for this purpose.
Caterpillar Insurance Services Corporation, a wholly owned subsidiary of Caterpillar Insurance Holdings Inc., is a Tennessee insurance agency licensed in all 50 states, the District of Columbia and Guam. It provides brokerage and insurance services for all property and casualty and life and health lines of business.
Caterpillar’s insurance group provides protection and service for claims under the following programs:
•Contractual Liability Insurance to insure certain service contract obligations of Caterpillar and its affiliates, Caterpillar dealers and original equipment manufacturers (OEMs).
•Cargo reinsurance for the worldwide cargo risks of Caterpillar products.
•Contractors’ Equipment Physical Damage Insurance for equipment manufactured by Caterpillar or OEMs, which is leased, rented or sold by third party dealers to customers.
•General liability, employer’s liability, auto liability and property insurance for Caterpillar.
•Life, disability, medical and accident reinsurance for Caterpillar's international employee benefits program (non-U.S.).
•Reinsurance to cover VEBA Trust for medical claims of certain Caterpillar retirees and dependents.
•Brokerage and insurance services for property and casualty and life and health business.
Competitive Environment
Caterpillar products and services are sold worldwide into a variety of highly competitive markets. In all markets, we compete on the basis of product performance, customer service, quality and price. From time to time, the intensity of competition results in price discounting in a particular industry or region. Such price discounting puts pressure on margins and can negatively impact operating profit. Outside the United States, certain competitors enjoy competitive advantages inherent to operating in their home countries or regions.
Raw Materials and Component Products
We source our raw materials and manufactured components from suppliers both domestically and internationally. These purchases include unformed materials and rough and finished parts. Unformed materials include a variety of steel products, which are then cut or formed to shape and machined in our facilities. Rough parts include various sized steel and iron castings and forgings, which are machined to final specification levels inside our facilities. Finished parts are ready to assemble components, which are made either to Caterpillar specifications or to supplier developed specifications. We machine and assemble some of the components used in our machines, engines and power generation units and to support our after-market dealer parts sales. We also purchase various goods and services used in production, logistics, offices and product development processes. We maintain global strategic sourcing models to meet our global facilities’ production needs while building long-term supplier relationships and leveraging enterprise spend. We expect our suppliers to maintain, at all times, industry-leading levels of quality and the ability to timely deliver raw materials and component products for our machine and engine products. However, in some cases, increases in demand or supply chain disruptions have led to parts and components constraints across some products. We use a variety of agreements with suppliers to protect our intellectual property and processes to monitor and mitigate risks of the supply base causing a business disruption. The risks monitored include supplier financial viability, the ability to increase or decrease production levels, business continuity, quality and delivery.
Patents and Trademarks
We own a number of patents and trademarks, which have been obtained over a period of years and relate to the products we manufacture and the services we provide. These patents and trademarks are generally considered beneficial to our business. We do not regard our business as being dependent upon any single patent or group of patents.
Order Backlog
The dollar amount of backlog believed to be firm was approximately $27.5 billion at December 31, 2023 and $30.4 billion at December 31, 2022. Compared with year-end 2022, the order backlog decreased across the three primary segments. Of the total backlog at December 31, 2023, approximately $5.8 billion was not expected to be filled in 2024.
Dealers and Distributors
We distribute our machines principally through a worldwide organization of dealers (dealer network), 43 located in the United States and 113 located outside the United States, serving 191 countries. We sell reciprocating engines principally through the dealer network and to other manufacturers for use in products. We also sell some of the reciprocating engines manufactured by our subsidiary Perkins Engines Company Limited through its worldwide network of 88 distributors covering 185 countries. We sell the FG Wilson branded electric power generation systems through its worldwide network of 110 distributors covering 109 countries.
Our dealers do not deal exclusively with our products; however, in most cases sales and servicing of our products are the dealers’ principal business. We sell some products, primarily turbines and locomotives, directly to end customers through sales forces employed by the company. At times, these employees are assisted by independent sales representatives.
While the large majority of our worldwide dealers are independently owned and operated, we own and operate a dealership in Japan that covers approximately 80% of the Japanese market: Nippon Caterpillar Division. We are currently operating this Japanese dealer directly and we report its results in the All Other operating segment. There are also three independent dealers in the Southern Region of Japan.
For Caterpillar-branded products, the company’s relationship with each of its independent dealers is memorialized in standard sales and service agreements. Pursuant to these agreements, the company grants the dealer the right to purchase and sell its products and to service the products in a specified geographic service territory. The company establishes prices to dealers after receiving input from dealers on transactional pricing in the marketplace. The company also agrees to defend its intellectual property and to provide warranty and technical support to the dealer. The agreement further grants the dealer a non-exclusive license to use the company’s trademarks, service marks and brand names. In some instances, a separate trademark agreement exists between the company and a dealer.
In exchange for these rights, the agreement obligates the dealer to develop and promote the sale of the company’s products to current and prospective customers in the dealer’s service territory. Each dealer agrees to employ adequate sales and support personnel to market, sell and promote the company’s products, demonstrate and exhibit the products, perform the company’s product improvement programs, inform the company concerning any features that might affect the safe operation of any of the company’s products and maintain detailed books and records of the dealer’s financial condition, sales and inventories and make these books and records available at the company’s reasonable request.
These sales and service agreements are terminable at will by either party primarily upon 90 days written notice.
Human Capital
Core Values
Caterpillar’s global workforce is united by Our Values In Action, Caterpillar’s Code of Conduct. Integrity, Excellence, Teamwork, Commitment and Sustainability provide the foundation for our values-based culture. Our diversity and inclusion principles are embedded in our values. Our values unite us, and reflect our diverse cultures, languages, geographies, and businesses, as one Caterpillar team.
Health and Safety
The health and safety of our employees is an important focus at Caterpillar, and we strive to continually reduce our recordable injuries utilizing programs that amplify our safety culture, globally. In 2023, the Company achieved a recordable injury frequency rate of 0.40, compared to the 2022 recordable injury frequency rate of 0.44. In addition, Caterpillar has refreshed our safety strategy to enhance our focus on preventing serious injuries and to encourage learning from those closest to the work.
Talent Development and Training
In addition to our focus on values and safety, we strive to continually attract, develop, engage, and retain a high-performing diverse global team that executes our enterprise strategy of long-term profitable growth.
We are committed to employee development and helping individuals reach their full potential, by making on-going investments in our team. Our global internships, engineering co-ops, and career programs for engineering, marketing, and manufacturing provide development opportunities for early career employees. We also have a continual focus on strengthening technical, professional and leadership capabilities at every level using contemporary learning strategies to foster high performance. Strategic talent reviews and succession planning occur at a minimum, annually, across our businesses.
Our leadership development programs focus on encouraging a variety of experiences to help employees broaden understanding and increase perspective. Our leadership curriculums include managing for inclusion and building resilient and high performing teams as core development principles. Additionally, skill-based programs to upskill our manufacturing employees are developed locally and tailored to the specific needs of the business.
Diversity and Inclusion
We are committed to fostering a diverse workforce and an inclusive environment that is representative of the many customers and communities we serve around the globe. Our strategic approach weaves diversity and inclusion seamlessly into the business, ensuring that the principles guide us in our daily operating rhythm. Our 14 Employee Resource Groups (ERGs), which are sponsored and supported by leadership, help ensure different voices and perspectives contribute to our strategy for long-term profitable growth. They also engage our employees, helping contribute to development and retention.
Our ERGs provide many contributions, such as mentoring programs that connect diverse employees with senior leaders who can support their career goals, partnerships with recruiters and diverse early career and professional organizations that can assist in strengthening the diverse talent pipeline and programs that educate and inform on the richness of the global cultures that we share.
Compensation, Benefits and Employee Insights
Providing competitive benefits and compensation underpins our commitment to our engaged and productive employees. Our pay-for-performance philosophy aligns employee’s individual contributions, behaviors and business results with individual rewards. Our comprehensive Total Health programs focus on purpose, as well as physical and mental health, emotional and social support, and financial wellness. The annual Employee Insights Survey provides all employees the opportunity to confidentially share their perspectives and engages leaders to listen, learn and respond to employee feedback to help foster a positive work environment.
Employment
Management aligns employment levels with the needs of the business. We believe we have the appropriate human capital resources to successfully operate and deliver our enterprise strategy. As of December 31, 2023, we employed about 113,200 full-time persons of whom approximately 62,400 were located outside the United States. In the United States, we employed approximately 50,800 full-time persons, most of whom are at-will employees and, therefore, not subject to any type of employment contract or agreement. At select business units, we have hired certain highly specialized employees under employment contracts that specify a term of employment, pay and other benefits.
| | | | | | | | | | | | | | |
| Full-Time Employees at Year-End | | | | |
| | 2023 | | 2022 | |
| Inside U.S. | 50,800 | | 48,200 | |
| Outside U.S. | 62,400 | | 60,900 | |
| Total | 113,200 | | 109,100 | |
| | | | |
| By Region: | | | | |
| North America | 51,200 | | 48,700 | |
| EAME | 16,600 | | 16,900 | |
| Latin America | 20,300 | | 19,100 | |
| Asia/Pacific | 25,100 | | 24,400 | |
| Total | 113,200 | | 109,100 | |
| | | | |
As of December 31, 2023, there were 7,973 hourly production employees in the United States who were covered by collective bargaining agreements with various labor unions, including The United Automobile, Aerospace and Agricultural Implement Workers of America (UAW), The International Association of Machinists and The United Steelworkers. Outside the United States, the company enters into employment contracts and agreements in those countries in which such relationships are mandatory or customary. The provisions of these agreements generally correspond in each case with the required or customary terms in the subject jurisdiction.
Environmental Matters
The company is regulated by federal, state and international environmental laws governing our use, transport and disposal of substances and control of emissions. In addition to governing our manufacturing and other operations, these laws often impact the development of our products, including, but not limited to, required compliance with air emissions standards applicable to internal combustion engines. We have made, and will continue to make, significant research and development and capital expenditures to comply with these emissions standards.
We are engaged in remedial activities at a number of locations, often with other companies, pursuant to federal and state laws. When it is probable we will pay remedial costs at a site, and those costs can be reasonably estimated, the investigation, remediation, and operating and maintenance costs of the remedial action are accrued against our earnings. Costs are accrued
based on consideration of currently available data and information with respect to each individual site, including available technologies, current applicable laws and regulations, and prior remediation experience. Where no amount within a range of estimates is more likely, we accrue the minimum. Where multiple potentially responsible parties are involved, we consider our proportionate share of the probable costs. In formulating the estimate of probable costs, we do not consider amounts expected to be recovered from insurance companies or others. We reassess these accrued amounts on a quarterly basis. The amount recorded for environmental remediation is not material and is included in the line item "Accrued expenses" in Statement 3 — "Consolidated Financial Position at December 31" of Part II, Item 8 "Financial Statements and Supplementary Data." There is no more than a remote chance that a material amount for remedial activities at any individual site, or at all the sites in the aggregate, will be required.
Available Information
The company files electronically with the Securities and Exchange Commission (SEC) required reports on Form 8-K, Form 10-Q, Form 10-K and Form 11-K; proxy materials; ownership reports for insiders as required by Section 16 of the Securities Exchange Act of 1934 (Exchange Act); registration statements on Forms S-3 and S-8, as necessary; and other forms or reports as required. The SEC maintains a website (www.sec.gov) that contains reports, proxy and information statements, and other information regarding issuers that file electronically with the SEC. The company maintains a website (www.Caterpillar.com) and copies of our annual report on Form 10-K, quarterly reports on Form 10-Q, current reports on Form 8-K and any amendments to these reports filed or furnished with the SEC are available free of charge through our website (www.Caterpillar.com/secfilings) as soon as reasonably practicable after filing with the SEC. Copies of our board committee charters, our board’s Guidelines on Corporate Governance Issues, Worldwide Code of Conduct and other corporate governance information are available on our website (www.Caterpillar.com/governance) and are also available free of charge. The information contained on the company’s website is not included in, or incorporated by reference into, this annual report on Form 10-K.
Additional company information may be obtained as follows:
Current information -
•view additional financial information on-line at www.Caterpillar.com/en/investors/financial-information.html
•request, view or download materials on-line or register for email alerts at www.Caterpillar.com/materialsrequest
Historical information -
•view/download on-line at www.Caterpillar.com/historical
Item 1A.Risk Factors.
The statements in this section describe the most significant risks to our business and should be considered carefully in conjunction with Part II, Item 7 “Management’s Discussion and Analysis of Financial Condition and Results of Operations” and the “Notes to Consolidated Financial Statements” of Part II, Item 8 “Financial Statements and Supplementary Data” to this Form 10-K. In addition, the statements in this section and other sections of this Form 10-K, including in Part II, Item 7 “Management's Discussion and Analysis of Financial Condition and Results of Operations,” include “forward-looking statements” as that term is defined in the Private Securities Litigation Reform Act of 1995 and involve uncertainties that could significantly impact results. Forward-looking statements give current expectations or forecasts of future events about the company or our outlook. You can identify forward-looking statements by the fact they do not relate to historical or current facts and by the use of words such as “believe,” “expect,” “estimate,” “anticipate,” “will be,” “should,” “plan,” “forecast,” “target,” “guide,” “project,” “intend,” “could” and similar words or expressions.
Forward-looking statements are based on assumptions and on known risks and uncertainties. Although we believe we have been prudent in our assumptions, any or all of our forward-looking statements may prove to be inaccurate, and we can make no guarantees about our future performance. Should known or unknown risks or uncertainties materialize or underlying assumptions prove inaccurate, actual results could materially differ from past results and/or those anticipated, estimated or projected.
We undertake no obligation to publicly update forward-looking statements, whether as a result of new information, future events or otherwise. You should, however, consult any subsequent disclosures we make in our filings with the SEC on Form 10-Q or Form 8-K.
The following is a cautionary discussion of risks, uncertainties and assumptions that we believe are material to our business. In addition to the factors discussed elsewhere in this report, the following are some of the important factors that, individually or in the aggregate, we believe could make our actual results differ materially from those described in any forward-looking statements. It is impossible to predict or identify all such factors and, as a result, you should not consider the following factors to be a complete discussion of risks, uncertainties and assumptions.
MACROECONOMIC RISKS
Our business and the industries we serve are highly sensitive to global and regional economic conditions.
Our results of operations are materially affected by economic conditions globally and regionally and in the particular industries we serve. The demand for our products and services tends to be cyclical and can be significantly reduced in periods of economic weakness characterized by lower levels of government and business investment, lower levels of business confidence, lower corporate earnings, high real interest rates, lower credit activity or tighter credit conditions, perceived or actual industry overcapacity, higher unemployment and lower consumer spending. A prolonged period of economic weakness may also result in increased expenses due to higher allowances for doubtful accounts and potential goodwill and asset impairment charges. Economic conditions vary across regions and countries, and demand for our products and services generally increases in those regions and countries experiencing economic growth and investment. Slower economic growth or a change in the global mix of regions and countries experiencing economic growth and investment could have an adverse effect on our business, results of operations and financial condition.
The energy, transportation, and mining industries are significant adopters of Caterpillar products. In these industries customers are likely to base their purchase decisions upon expected future commodity dynamics, including price. Commodity price volatility may be abrupt and unpredictable in response to global economic conditions, government actions, regulatory changes, supply/demand dynamics, innovation, and commodity substitutions among others. Economic conditions affecting the industries we serve may reduce capital expenditures in response to a variety of the aforementioned conditions. Reduction in these capital expenditures may lead to decreased demand for Caterpillar products and services as well as aftermarket parts as customers may choose to extend preventative maintenance and delay overhauls when possible.
The rates of infrastructure spending, commercial construction and housing starts also play a significant role in our results. Our products are an integral component of these activities, and as these activities decrease, demand for our products and services may be significantly impacted, which could negatively impact our results.
Catastrophic events, including global pandemics, could materially adversely affect our business, results of operations and/or financial condition.
The occurrence of a major earthquake, fire, flood, tsunami or other weather event, power loss, telecommunications failure, software or hardware malfunctions, pandemics, cyber-attack, war, terrorist attack or other catastrophic event that our disaster recovery plans do not adequately address, could adversely affect our employees, our systems, our ability to produce and distribute our products, and our reputation. For example, a pandemic had a significant impact around the world, prompting governments and businesses to take unprecedented measures in response. Such measuresincluded travel bans and restrictions, quarantines, shelter in place orders and shutdowns. Those measures impacted or could again impact all or portions of our workforce and operations and the operations of our customers, dealers and suppliers. Current material and component shortages, logistics constraints and labor inefficiencies limited and or could continue to limit our ability to meet customer demand, which could have a material adverse effect on our business, results of operations and/or financial condition.
Pandemics can significantly increase economic and customer demand uncertainty, cause inflationary pressure in the U.S. and elsewhere and lead to volatility in customer demand for the Company’s products and services and cause supply chain disruptions. Economic uncertainties could continue to affect customer demand for the Company’s products and services, the value of the equipment financed or leased, the demand for financing and the financial condition and credit risk of our dealers and customers.
A catastrophic event resulting in the destruction or disruption of our workforce, our systems, our ability to produce and distribute our products, any of our data centers or our critical business or information technology systems could adversely affect our ability to conduct normal business operations and our operating results or cash flows. The adverse effects of any such catastrophic event would be exacerbated if experienced at the same time as another unexpected and adverse event.
Commodity price changes, material price increases, fluctuations in demand for our products and services, significant disruptions to our supply chains or significant shortages of labor and material may adversely impact our financial results or our ability to meet commitments to customers.
We are a significant user of steel and many other commodities required for the manufacture of our products. Increases in the prices of such commodities would increase our costs, negatively impacting our business, results of operations and financial condition if we are unable to fully offset the effect of these increased costs through price increases, productivity improvements, cost reduction programs or hedging programs.
We rely on suppliers to produce or secure material required for the manufacture of our products. Production challenges at suppliers (including suppliers of semiconductors), a disruption in deliveries to or from suppliers or decreased availability of raw materials or commodities could have an adverse effect on our ability to meet our commitments to customers or increase our operating costs.On the other hand, in circumstances where demand for our products is less than we expect, we may experience excess inventories and be forced to incur additional costs and our profitability may suffer. Our business, competitive position, results of operations or financial condition could be negatively impacted if supply is insufficient for our operations, if significant transportation delays interfere with deliveries, if we experience excess inventories or if we are unable to adjust our production schedules or our purchases from suppliers to reflect changes in customer demand and market fluctuations on a timely basis.
Changes in government monetary or fiscal policies may negatively impact our results.
Most countries where our products and services are sold have established central banks to regulate monetary systems and influence economic activities, generally by adjusting interest rates. Interest rate changes affect overall economic growth, which affects demand for residential and nonresidential structures, as well as energy and mined products, which in turn affects sales of our products and services that support these activities. Interest rate changes may also affect our customers’ ability to finance machine purchases, can change the optimal time to keep machines in a fleet and can impact the ability of our suppliers to finance the production of parts and components necessary to manufacture and support our products. Increases in interest rates could negatively impact sales and create supply chain inefficiencies.
Central banks and other policy arms of many countries may take actions to vary the amount of liquidity and credit available in an economy. The impact from a change in liquidity and credit policies could negatively affect the customers and markets we serve or our suppliers, create supply chain inefficiencies and could adversely impact our business, results of operations and financial condition.
Changes in monetary and fiscal policies, along with other factors, may cause currency exchange rates to fluctuate. Actions that lead the currency exchange rate of a country where we manufacture products to increase relative to other currencies could reduce the competitiveness of products made in that country, which could adversely affect our competitive position, results of operations and financial condition.
Government policies on taxes and spending also affect our business. Throughout the world, government spending finances a significant portion of infrastructure development, such as highways, rail systems, airports, sewer and water systems, waterways and dams. Tax regulations determine asset depreciation lives and impact the after-tax returns on business activity and investment, both of which influence investment decisions. Unfavorable developments, such as decisions to reduce public spending or to increase taxes, could negatively impact our results.
Our global operations are exposed to political and economic risks, commercial instability and events beyond our control in the countries in which we operate.
Our global operations are dependent upon products manufactured, purchased and sold in the U.S. and internationally, including in countries with political and economic instability or uncertainty. Some countries have greater political and economic volatility and greater vulnerability to infrastructure and labor disruptions than others. Our business could be negatively impacted by adverse fluctuations in freight costs, fuel costs (e.g., diesel, bunker, jet), limitations on shipping and receiving capacity, and other disruptions in the transportation and shipping infrastructure at important geographic points of exit and entry for our products. Operating in different regions and countries exposes us to numerous risks, including:
•multiple and potentially conflicting laws, regulations and policies that are subject to change;
•imposition of currency restrictions, restrictions on repatriation of earnings or other restraints;
•imposition of new or additional tariffs or quotas;
•withdrawal from or modification of trade agreements or the negotiation of new trade agreements;
•imposition of new or additional trade and economic sanctions laws imposed by the U.S. or foreign governments;
•war or acts of terrorism; and
•political and economic instability or civil unrest that may severely disrupt economic activity in affected countries.
The occurrence of one or more of these events may negatively impact our business, results of operations and financial condition.
OPERATIONAL RISKS
The success of our business depends on our ability to develop, produce and market quality products that meet our customers’ needs.
Our business relies on continued global demand for our brands and products. To achieve business goals, we must develop and sell products that appeal to our dealers, OEMs and end-user customers. This is dependent on a number of factors, including our ability to maintain key dealer relationships; our ability to produce products that meet the quality, performance and price expectations of our customers and our ability to develop effective sales, advertising and marketing programs. In addition, our continued success in selling products that appeal to our customers is dependent on leading-edge innovation, with respect to both products and operations, and on the availability and effectiveness of legal protection for our innovations. Failure to continue to deliver high quality, innovative, competitive products to the marketplace, to adequately protect our intellectual property rights; to supply products that meet applicable regulatory requirements, including engine exhaust emission requirements or to predict market demands for, or gain market acceptance of, our products, could have a negative impact on our business, results of operations and financial condition.
We operate in a highly competitive environment, which could adversely affect our sales and pricing.
We operate in a highly competitive environment. We compete on the basis of a variety of factors, including product performance, customer service, quality and price. There can be no assurance that our products will be able to compete successfully with other companies’ products. Thus, our share of industry sales could be reduced due to aggressive pricing or product strategies pursued by competitors, unanticipated product or manufacturing difficulties, our failure to price our products competitively, our failure to produce our products at a competitive cost or an unexpected buildup in competitors’ new machine or dealer-owned rental fleets, which could lead to downward pressure on machine rental rates and/or used equipment prices.
Lack of customer acceptance of price increases we announce from time to time, changes in customer requirements for price discounts, changes in our customers’ behavior or a weak pricing environment could have an adverse impact on our business, results of operations and financial condition.
In addition, our results and ability to compete may be impacted negatively by changes in our geographic and product mix of sales.
Increased information technology security threats and more sophisticated computer crime pose a risk to our systems, networks, products and services.
We rely upon information technology systems and networks, some of which are managed by third parties, in connection with a variety of business activities. Additionally, we collect and store sensitive information relating to our business, customers, dealers, suppliers and employees. Operating these information technology systems and networks and processing and maintaining this data in a secure manner, is critical to our business operations and strategy. Information technology security threats -- from user error to cybersecurity attacks designed to gain unauthorized access to our systems, networks and data -- are increasing in frequency and sophistication. Cybersecurity attacks from threat actors globally range from random attempts to coordinated and targeted attacks, including sophisticated computer crime and advanced persistent threats. These threats pose a risk to the security of our systems and networks and the confidentiality, availability and integrity of our data. Cybersecurity attacks could also include attacks targeting customer data or the security, integrity and/or reliability of the hardware and software installed in our products. It is possible that our information technology systems and networks, or those managed or provided by third parties, could have vulnerabilities, which could go unnoticed for a period of time. While various procedures and controls have been and are being utilized to mitigate such risks, there can be no guarantee that the actions and controls we have implemented and are implementing, or which we cause or have caused third-party service providers to implement, will be sufficient to protect and mitigate associated risks to our systems, information or other property.
We have experienced cybersecurity threats and vulnerabilities in our systems and those of our third party providers, and we have experienced viruses and attacks targeting our information technology systems and networks. Such prior events, to date, have not had a material impact on our financial condition, results of operations or liquidity. However, the potential consequences of a future material cybersecurity attack include reputational damage, litigation with third parties, government enforcement actions, penalties, disruption to systems, unauthorized release of confidential or otherwise protected information, corruption of data, diminution in the value of our investment in research, development and engineering, and increased cybersecurity protection and remediation costs, which in turn could adversely affect our competitiveness, results of operations and financial condition. Due to the evolving nature of such security threats, the potential impact of any future incident cannot be predicted. Further, the amount of insurance coverage we maintain may be inadequate to cover claims or liabilities relating to a cybersecurity attack.
In addition, data we collect, store and process are subject to a variety of U.S. and international laws and regulations, such as the European Union's General Data Protection Regulation and the California Consumer Privacy Act, which may carry significant potential penalties for noncompliance.
Our business is subject to the inventory management decisions and sourcing practices of our dealers and our OEM customers.
We sell finished products primarily through an independent dealer network and directly to OEMs and are subject to risks relating to their inventory management decisions and operational and sourcing practices. Both carry inventories of finished products as part of ongoing operations and adjust those inventories based on their assessments of future needs and market conditions, including levels of used equipment inventory and machine rental usage rates. Such adjustments may impact our results positively or negatively. If the inventory levels of our dealers and OEM customers are higher than they desire, they may postpone product purchases from us, which could cause our sales to be lower than the end-user demand for our products and negatively impact our results. Similarly, our results could be negatively impacted through the loss of time-sensitive sales if our dealers and OEM customers do not maintain inventory levels sufficient to meet customer demand.
We may not realize all of the anticipated benefits of our acquisitions, joint ventures or divestitures, or these benefits may take longer to realize than expected.
In pursuing our business strategy, we routinely evaluate targets and enter into agreements regarding possible acquisitions, divestitures and joint ventures. We often compete with others for the same opportunities. To be successful, we conduct due diligence to identify valuation issues and potential loss contingencies, negotiate transaction terms, complete complex transactions and manage post-closing matters such as the integration of acquired businesses. Further, while we seek to mitigate risks and liabilities of such transactions through due diligence, among other things, there may be risks and liabilities that our due diligence efforts fail to discover, that are not accurately or completely disclosed to us or that we inadequately assess. We may incur unanticipated costs or expenses following a completed acquisition, including post-closing asset impairment charges, expenses associated with eliminating duplicate facilities, litigation, and other liabilities. Risks associated with our past or future acquisitions also include the following:
•the failure to achieve the acquisition's revenue or profit forecast;
•the business culture of the acquired business may not match well with our culture;
•technological and product synergies, economies of scale and cost reductions may not occur as expected;
•unforeseen expenses, delays or conditions may be imposed upon the acquisition, including due to required regulatory approvals or consents;
•we may acquire or assume unexpected liabilities or be subject to unexpected penalties or other enforcement actions;
•faulty assumptions may be made regarding the macroeconomic environment or the integration process;
•unforeseen difficulties may arise in integrating operations, processes and systems;
•higher than expected investments may be required to implement necessary compliance processes and related systems, including information technology systems, accounting systems and internal controls over financial reporting;
•we may fail to retain, motivate and integrate key management and other employees of the acquired business;
•higher than expected costs may arise due to unforeseen changes in tax, trade, environmental, labor, safety, payroll or pension policies in any jurisdiction in which the acquired business conducts its operations; and
•we may experience problems in retaining customers and integrating customer bases.
Many of these factors will be outside of our control and any one of them could result in increased costs, decreases in the amount of expected revenues and diversion of management’s time and attention. They may also delay the realization of the benefits we anticipate when we enter into a transaction.
In order to conserve cash for operations, we may undertake acquisitions financed in part through public offerings or private placements of debt or equity securities, or other arrangements. Such acquisition financing could result in a decrease in our earnings and adversely affect other leverage measures. If we issue equity securities or equity-linked securities, the issued securities may have a dilutive effect on the interests of the holders of our common shares.
Failure to implement our acquisition strategy, including successfully integrating acquired businesses, could have an adverse effect on our business, financial condition and results of operations. Furthermore, we make strategic divestitures from time to time. In the case of divestitures, we may agree to indemnify acquiring parties for certain liabilities arising from our former businesses. These divestitures may also result in continued financial involvement in the divested businesses following the transaction, including through guarantees or other financial arrangements. Lower performance by those divested businesses could affect our future financial results.
Union disputes or other labor matters could adversely affect our operations and financial results.
Some of our employees are represented by labor unions in a number of countries under various collective bargaining agreements with varying durations and expiration dates. There can be no assurance that any current or future issues with our employees will be resolved or that we will not encounter future strikes, work stoppages or other disputes with labor unions or our employees. We may not be able to satisfactorily renegotiate collective bargaining agreements in the United States and other countries when they expire. If we fail to renegotiate our existing collective bargaining agreements, we could encounter strikes or work stoppages or other disputes with labor unions. In addition, existing collective bargaining agreements may not prevent a strike or work stoppage at our facilities in the future. We may also be subject to general country strikes or work stoppages unrelated to our business or collective bargaining agreements. A work stoppage or other limitations on production at our facilities for any reason could have an adverse effect on our business, results of operations and financial condition. In addition, many of our customers and suppliers have unionized work forces. Strikes or work stoppages experienced by our customers or suppliers could have an adverse effect on our business, results of operations and financial condition.
Unexpected events may increase our cost of doing business or disrupt our operations.
The occurrence of one or more unexpected events, including war, acts of terrorism or violence, civil unrest, fires, tornadoes, tsunamis, hurricanes, earthquakes, floods and other forms of severe weather in the United States or in other countries in which we operate or in which our suppliers are located could adversely affect our operations and financial performance. Natural disasters, pandemic illness, equipment failures, power outages or other unexpected events could result in physical damage to and complete or partial closure of one or more of our manufacturing facilities or distribution centers, temporary or long-term disruption in the supply of component products from some local and international suppliers, and disruption and delay in the transport of our products to dealers, end-users and distribution centers. Existing insurance coverage may not provide protection for all of the costs that may arise from such events.
FINANCIAL RISKS
Disruptions or volatility in global financial markets could limit our sources of liquidity, or the liquidity of our customers, dealers and suppliers.
Continuing to meet our cash requirements over the long-term requires substantial liquidity and access to varied sources of funds, including capital and credit markets. Global economic conditions may cause volatility and disruptions in capital and credit markets. Market volatility, changes in counterparty credit risk, the impact of government intervention in financial markets and general economic conditions may also adversely impact our ability to access capital and credit markets to fund operating needs. Global or regional economic downturns could cause financial markets to decrease the availability of liquidity, credit and credit capacity for certain issuers, including certain customers, dealers and suppliers. An inability to access capital and credit markets may have an adverse effect on our business, results of operations, financial condition and competitive position. Furthermore, changes in global economic conditions, including material cost increases and decreases in economic activity in key markets we serve, and the success of plans to manage cost increases, inventory and other important elements of our business may significantly impact our ability to generate funds from operations.
In addition, demand for our products generally depends on customers’ ability to pay for our products, which, in turn, depends on their access to funds. Changes in global economic conditions may result in customers experiencing increased difficulty in generating funds from operations. Capital and credit market volatility and uncertainty may cause financial institutions to revise their lending standards, resulting in customers’ decreased access to capital. If capital and credit market volatility occurs, customers’ liquidity may decline which, in turn, would reduce their ability to purchase our products.
Failure to maintain our credit ratings could increase our cost of borrowing and could adversely affect our cost of funds, liquidity, competitive position and access to capital markets.
Each of Caterpillar’s and Cat Financial’s costs of borrowing and their respective ability to access the capital markets are affected not only by market conditions but also by the short- and long-term credit ratings assigned to their respective debt by the major credit rating agencies. These ratings are based, in significant part, on each of Caterpillar’s and Cat Financial’s performance as measured by financial metrics such as net worth, profitability, interest coverage and leverage ratios, as well as transparency with rating agencies and timeliness of financial reporting. There can be no assurance that Caterpillar and Cat Financial will be able to maintain their credit ratings. We receive debt ratings from the major credit rating agencies. A downgrade of our credit rating by any of the major credit rating agencies could result in increased borrowing costs and could adversely affect Caterpillar’s and Cat Financial’s liquidity, competitive position and access to the capital markets, including restricting, in whole or in part, access to the commercial paper market. There can be no assurance that the commercial paper market will continue to be a reliable source of short-term financing for Cat Financial or an available source of short-term financing for Caterpillar. An inability to access the capital markets could have an adverse effect on our cash flow, results of operations and financial condition.
Our Financial Products segment is subject to risks associated with the financial services industry.
Cat Financial is significant to our operations and provides financing support for a significant share of our global sales. The inability of Cat Financial to access funds to support its financing activities to our customers could have an adverse effect on our business, results of operations and financial condition.
Continuing to meet Cat Financial's cash requirements over the long-term could require substantial liquidity and access to sources of funds, including capital and credit markets. Cat Financial has continued to maintain access to key global medium-term note and commercial paper markets, but there can be no assurance that such markets will continue to represent a reliable source of financing. If global economic conditions were to deteriorate, Cat Financial could face materially higher financing costs, become unable to access adequate funding to operate and grow its business and/or meet its debt service obligations as they mature.Cat Financial also could be required to draw upon contractually committed lending agreements and/or seek other funding sources.However, there can be no assurance that such agreements and other funding sources would be sufficient or even available under extreme market conditions. Any of these events could negatively impact Cat Financial’s business, as well as our and Cat Financial's results of operations and financial condition.
Market disruption and volatility may also lead to numerous risks in connection with these events, including but not limited to:
•Market developments that may affect customer confidence levels and cause declines in the demand for financing and adverse changes in payment patterns, causing increases in delinquencies and default rates, which could increase Cat Financial’s write-offs and provision for credit losses.
•The process Cat Financial uses to estimate losses inherent in its credit exposure requires a high degree of management’s judgment regarding numerous subjective qualitative factors, including forecasts of economic conditions and how economic predictors might impair the ability of its borrowers to repay their loans. Financial market disruption and volatility may impact the accuracy of these judgments.
•Cat Financial’s ability to engage in routine funding transactions or to borrow from other financial institutions on acceptable terms or at all could be adversely affected by disruptions in the capital markets or other events, including actions by rating agencies and deteriorating investor expectations.
•As Cat Financial’s borrowing agreements are primarily with financial institutions, their ability to perform in accordance with any of our underlying agreements could be adversely affected by market volatility and/or disruptions in financial markets.
Changes in interest rates or market liquidity conditions could adversely affect Cat Financial's and our earnings and/or cash flow.
Changes in interest rates and market liquidity conditions could have an adverse impact on Cat Financial's and our earnings and cash flows. Changes in market interest rates may influence its and our borrowing costs, returns on financial investments and the valuation of derivative contracts.Because a significant number of the loans made by Cat Financial are made utilizing fixed interest rates, its business results are subject to fluctuations in interest rates. Certain loans made by Cat Financial and various financing extended to Cat Financial are made at variable rates that use floating reference rates or indices, including the Secured Overnight Financing Rate, or SOFR, an index calculated by short-term repurchase agreements, backed by Treasury securities,as a benchmark for establishing the interest rate.
Together with Cat Financial we created a cross-functional team that assesses risk across multiple categories as it relates to the use of floating reference rates or indices, such as SOFR, in securities, loans, derivatives, and other financial obligations or extensions of credit held by or due to us. Cat Financial manages interest rate and market liquidity risks through a variety of techniques that include a match funding strategy, the selective use of derivatives and a broadly diversified funding program. There can be no assurance, however, that fluctuations in interest rates and market liquidity conditions will not have an adverse impact on its and our earnings and cash flows. If any of the variety of instruments and strategies Cat Financial uses to hedge its exposure to these types of risk is ineffective, this may have an adverse impact on our earnings and cash flows.With respect to Insurance Services' investment activities, changes in equity and bond markets could result in a decline in value of its investment portfolio, resulting in an unfavorable impact to earnings.
An increase in delinquencies, repossessions or net losses of Cat Financial customers could adversely affect its results.
Inherent in the operation of Cat Financial is the credit risk associated with its customers. The creditworthiness of each customer and the rate of delinquencies, repossessions and net losses on customer obligations are directly impacted by several factors, including relevant industry and economic conditions, the availability of capital, the experience and expertise of the customer's management team, commodity prices, political events and the sustained value of the underlying collateral. Any increase in delinquencies, repossessions and net losses on customer obligations could have a material adverse effect on Cat Financial's and our earnings and cash flows. Cat Financial evaluates and adjusts its allowance for credit losses related to past due and non-performing receivables on a regular basis. However, adverse economic conditions or other factors that might cause deterioration of the financial health of its customers could change the timing and level of payments received and necessitate an increase in Cat Financial's estimated losses, which could also have a material adverse effect on Cat Financial's and our earnings and cash flows.
Currency exchange rate fluctuations affect our results of operations.
We conduct operations in many countries involving transactions denominated in a variety of currencies. We are subject to currency-exchange rate risk to the extent that our costs are denominated in currencies other than those in which we earn revenues. Fluctuations in currency exchange rates have had, and will continue to have, an impact on our results as expressed in U.S. dollars. There can be no assurance that currency exchange rate fluctuations will not adversely affect our results of operations, financial condition and cash flows. While the use of currency hedging instruments may provide us with protection from adverse fluctuations in currency exchange rates, by utilizing these instruments we potentially forego the benefits that might result from favorable fluctuations in currency exchange rates. In addition, our outlooks do not assume fluctuations in currency exchange rates. Adverse fluctuations in currency exchange rates from the date of our outlooks could cause our actual results to differ materially from those anticipated in any outlooks and adversely impact our business, results of operations and financial condition.
We also face risks arising from the imposition of exchange controls and currency devaluations. Exchange controls may limit our ability to convert foreign currencies into U.S. dollars or to remit dividends and other payments by our foreign subsidiaries or businesses located in or conducted within a country imposing controls. Currency devaluations result in a diminished value of funds denominated in the currency of the country instituting the devaluation.
Restrictive covenants in our debt agreements could limit our financial and operating flexibility.
We maintain a number of credit facilities to support general corporate purposes (facilities) and have issued debt securities to manage liquidity and fund operations (debt securities). The agreements relating to a number of the facilities and the debt securities contain certain restrictive covenants applicable to us and certain subsidiaries, including Cat Financial. These covenants include maintaining a minimum consolidated net worth (defined as the consolidated shareholder’s equity including
preferred stock but excluding the pension and other post-retirement benefits balance within accumulated other comprehensive income (loss)), limitations on the incurrence of liens and certain restrictions on consolidation and merger. Cat Financial has also agreed under certain of these agreements not to exceed a certain leverage ratio (consolidated debt to consolidated net worth, calculated (1) on a monthly basis as the average of the leverage ratios determined on the last day of each of the six preceding calendar months and (2) at each December 31), to maintain a minimum interest coverage ratio (calculated as (1) profit excluding income taxes, interest expense and net gain (loss) from interest rate derivatives to (2) interest expense calculated at the end of each fiscal quarter for the prior four consecutive fiscal quarter period and not to terminate, amend or modify its support agreement with us.
A breach of one or more of the covenants could result in adverse consequences that could negatively impact our business, results of operations and financial condition. These consequences may include the acceleration of amounts outstanding under certain of the facilities, triggering of an obligation to redeem certain debt securities, termination of existing unused commitments by our lenders, refusal by our lenders to extend further credit under one or more of the facilities or to enter into new facilities or the lowering or modification of our credit ratings or those of one or more of our subsidiaries.
Sustained increases in funding obligations under our pension plans may impair our liquidity or financial condition.
We maintain certain defined benefit pension plans for our employees, which impose on us certain funding obligations. We use many assumptions in determining our future payment obligations under the plans. Significant adverse changes in credit or capital markets could result in actual rates of return on pension investments being materially lower than projected and result in increased contribution requirements. These factors could significantly increase our payment obligations under the plans, and as a result, adversely affect our business and overall financial condition.We may be required to make material contributions to our pension plans in the future and may fund contributions through the use of cash on hand, the proceeds of borrowings, shares of our common stock or a combination of the foregoing, as permitted by applicable law.
LEGAL & REGULATORY RISKS
Our global operations are subject to a wide-range of trade and anti-corruption laws and regulations.
Due to the international scope of our operations, we are subject to a complex system of import- and export-related laws and regulations. These include U.S. regulations issued by Customs and Border Protection, the Bureau of Industry and Security, the Office of Antiboycott Compliance, the Directorate of Defense Trade Controls and the Office of Foreign Assets Control, as well as the counterparts of these agencies in other countries. Any alleged or actual violations may subject us to increased government scrutiny, investigation and civil and criminal penalties, and may limit our ability to import or export our products or to provide services outside the United States. Furthermore, embargoes and sanctions imposed by the U.S. and other governments restricting or prohibiting sales to specific persons or countries or based on product classification may expose us to potential criminal and civil sanctions. We cannot predict the nature, scope or effect of future regulatory requirements to which our operations might be subject. We also cannot predict in certain locations the manner in which existing laws might be administered or interpreted.
In addition, the U.S. Foreign Corrupt Practices Act and similar foreign anti-corruption laws generally prohibit companies and their intermediaries from making improper payments or providing anything of value to improperly influence foreign government officials for the purpose of obtaining or retaining business or obtaining an unfair advantage. Recent years have seen a substantial increase in the global enforcement of anti-corruption laws. Our operations outside the United States, including in developing countries, expose us to the risk of such violations. Violations of anti-corruption laws or regulations by our employees, intermediaries acting on our behalf, or our joint venture partners may result in severe criminal or civil sanctions. Violations may also disrupt our business, and may result in an adverse effect on our reputation, business and results of operations or financial condition.
International trade policies may impact demand for our products and our competitive position.
Government policies on international trade and investment such as import quotas, capital controls or tariffs, whether adopted by individual governments or addressed by regional trade blocs, can affect the demand for our products and services, impact the competitive position of our products or prevent us from being able to sell products in certain countries. The implementation of more restrictive trade policies (such as more detailed inspections, higher tariffs or new barriers to entry) in countries where we sell large quantities of products and services could negatively impact our business, results of operations and financial condition. For example, a government’s adoption of “buy national” policies or retaliation by another government against such policies could have a negative impact on our results of operations.
We may incur additional tax expense or become subject to additional tax exposure.
We are subject to income taxes in the United States and numerous other jurisdictions. Our future results of operations could be adversely affected by changes in the effective tax rate as a result of a change in the mix of earnings between U.S. and non-U.S. jurisdictions or among jurisdictions with differing statutory tax rates. In addition, our future results of operations could also be adversely affected by changes in our overall profitability, changes in tax laws or treaties or in their application or interpretation, changes in tax rates, changes in generally accepted accounting principles, changes in the valuation of deferred tax assets and liabilities, changes in the amount of earnings indefinitely reinvested in certain non-U.S. jurisdictions, the results of audits and examinations of previously filed tax returns and continuing assessments of our tax exposures. We are also subject to the continuous examination of our income tax returns by the U.S. Internal Revenue Service and other tax authorities. We regularly assess the likelihood of an adverse outcome resulting from these examinations. If our effective tax rates were to increase, or if the ultimate determination of our taxes owed is for an amount in excess of amounts previously accrued, our operating results, cash flows and financial condition could be adversely affected. For information regarding additional legal matters related to our taxes, please see Note 6 — “Income taxes” and Note 22 — “Environmental and legal matters” of Part II, Item 8 “Financial Statements and Supplementary Data” to this Annual Report on Form 10-K.
Costs associated with lawsuits or investigations or adverse rulings in enforcement or other legal proceedings may have an adverse effect on our results of operations.
We are subject to a variety of legal proceedings and legal compliance risks in virtually every part of the world. We face risk of exposure to various types of claims, lawsuits and government investigations. We are involved in various claims and lawsuits related to product design, manufacture and performance liability (including claimed asbestos exposure), contracts, employment issues, environmental matters, intellectual property rights, tax, securities and other legal proceedings that arise in and outside of the ordinary course of our business. The industries in which we operate are also periodically reviewed or investigated by regulators, which could lead to enforcement actions, fines and penalties or the assertion of private litigation claims. It is not possible to predict with certainty the outcome of claims, investigations and lawsuits, and we could in the future incur judgments, fines or penalties or enter into settlements of lawsuits and claims that could have an adverse effect on our reputation, business, results of operations or financial condition in any particular period.
The global and diverse nature of our operations means that legal and compliance risks will continue to exist and additional legal proceedings and other contingencies, the outcome of which cannot be predicted with certainty, may arise from time to time. In addition, subsequent developments in legal proceedings may affect our assessment and estimates of loss contingencies recorded as a reserve and require us to make payments in excess of our reserves. Such payments could have an adverse effect on our reputation, business and results of operations or financial condition.
New regulations or changes in financial services regulation could adversely impact Caterpillar and Cat Financial.
Cat Financial’s operations are highly regulated by governmental authorities in the locations where it operates, which can impose significant additional costs and/or restrictions on its business. In the United States, for example, certain Cat Financial activities are subject to the U.S. Dodd-Frank Wall Street Reform and Consumer Protection Act (Dodd-Frank), which includes extensive provisions regulating the financial services industry. As a result, Cat Financial has become and could continue to become subject to additional regulatory costs that could be significantand have an adverse effect on Cat Financial’s and our results of operations and financial condition. Changes in regulations or additional regulations in the United States or internationally impacting the financial services industry could also add significant cost or operational constraints that might have an adverse effect on Cat Financial’s and our results of operations and financial condition.
We are subject to stringent environmental laws and regulations that impose significant compliance costs.
Our facilities, operations and products are subject to increasingly stringent environmental laws and regulations globally, including laws and regulations governing emissions to noise, air, releases to soil and discharges to water and the generation, handling, storage, transportation, treatment and disposal of non-hazardous and hazardous waste materials. Some environmental laws impose strict, retroactive and joint and several liability for the remediation of the release of hazardous substances, even for conduct that was lawful at the time it occurred, or for the conduct of, or conditions caused by, prior operators, predecessors or other third parties. Failure to comply with environmental laws could expose us to penalties or clean-up costs, civil or criminal liability and sanctions on certain of our activities, as well as damage to property or natural resources. The potential liabilities, sanctions, damages and remediation efforts related to any non-compliance with such laws and regulations could negatively impact our ability to conduct our operations and our financial condition and results of operations. In addition, there can be no assurances that we will not be adversely affected by costs, liabilities or claims with respect to existing or subsequently acquired operations or under present laws and regulations or those that may be adopted or imposed in the future.
Environmental laws and regulations may change from time to time, as may related interpretations and other guidance. Changes in environmental laws or regulations could result in higher expenses and payments. Uncertainty relating to environmental laws or regulations may also affect how we conduct our operations and structure our investments and could limit our ability to enforce our rights. Changes in environmental and climate change laws or regulations, including laws relating to greenhouse gas emissions, could lead to new or additional investment in product designs and could increase environmental compliance expenditures. Changes in climate change concerns, or in the regulation of such concerns, including greenhouse gas emissions, could subject us to additional costs and restrictions, including increased energy and raw materials costs. If environmental laws or regulations are either changed or adopted and impose significant operational restrictions and compliance requirements upon us or our products, they could negatively impact our reputation, business, capital expenditures, results of operations, financial condition and competitive position.
The Company’s amended and restated bylaws provide that the Court of Chancery of the State of Delaware will be the exclusive forum for certain legal actions between the Company and its shareholders, which could discourage claims or limit the ability of the Company’s shareholders to bring a claim in a judicial forum viewed by the shareholders as more favorable for disputes with the Company or the Company’s directors, officers or other employees.
The Company’s amended and restated bylaws provide to the fullest extent permitted by law that unless the Company consents in writing to the selection of an alternative forum, the Court of Chancery of the State of Delaware will be the sole and exclusive forum for (i) any derivative action or proceeding brought on behalf of the Company, (ii) any action asserting a claim of breach of fiduciary duty owed by any director, officer or other employee of the Company to the Company or the Company’s shareholders, (iii) any action asserting a claim against the Company or any director or officer or other employee of the Company arising pursuant to any provision of the Delaware General Corporation Law or the Company’s certificate of incorporation or bylaws (as either may be amended from time to time) or (iv) any action asserting a claim against the Company or any director or officer or other employee of the Company governed by the internal affairs doctrine.
The exclusive forum provisions in our bylaws could limit our shareholders’ ability to bring a claim in a judicial forum that it finds favorable for disputes with the Company or its directors, officers or other employees. Alternatively, if a court were to find the choice of forum provision contained in the Company’s amended and restated bylaws to be inapplicable or unenforceable in an action, the Company may incur additional costs associated with resolving such action in other jurisdictions. The exclusive forum provision in the Company’s amended and restated bylaws will not preclude or contract the scope of exclusive federal or concurrent jurisdiction for actions brought under the federal securities laws including the Securities Exchange Act of 1934, as amended, or the Securities Act of 1933, as amended, or the respective rules and regulations promulgated thereunder.
Item 1B.Unresolved Staff Comments.
None.
Item 1C. Cybersecurity
As required by Item 106 of Regulation S-K, the following sets forth information regarding our cybersecurity strategy, risk management and governance.
Cybersecurity Strategy and Risk Management
Cybersecurity is critical to advancing our overall objectives and enabling our digital efforts. As a global company, we face a wide variety of cybersecurity threats that range from common attacks such as ransomware and denial-of-service, to attacks from more advanced adversaries. Our customers, suppliers, and other partners face similar cybersecurity threats, and a cybersecurity incident impacting these entities could materially adversely affect our operations, performance and results. These cybersecurity threats and related risks make it imperative that we maintain focus on cybersecurity and systemic risks.
We maintain a comprehensive cybersecurity program which is integrated within the Company’s enterprise risk management system and encompasses the corporate information technology and operational technology environments as well as customer-facing products. Our cybersecurity program has implemented a governance structure and process to identify, assess, manage, mitigate, respond to and report on cybersecurity risks. We utilize cybersecurity policies and frameworks based on industry and government standards. Our cyber risk management program controls are based on recognized best practices and standards, including the National Institute of Standards and Technology (NIST) Cyber Security Framework and the International Organization for Standardization (ISO 27001) Information Security Management System Requirements. We partner with third parties to support and evaluate our cybersecurity program. These third-party services span areas including cybersecurity maturity assessments, incident response, penetration testing, consulting on best practices, and others. We also consume threat intelligence from several paid and non-paid sources.
We maintain a 24 x 7 operations center which serves as a central location for the reporting of cybersecurity matters, provides monitoring of our global cybersecurity environment, and coordinates the investigation and remediation of alerts. As cybersecurity events occur, the cybersecurity team focuses on responding to and containing the threat and minimizing impact. In the event of an incident, the cybersecurity team assesses, among other factors, safety impact, supply chain and manufacturing disruption, data and personal information loss, business operations disruption, projected cost and potential for reputational harm, with participation from technical, legal and law enforcement support, as appropriate.
We have implemented a cybersecurity awareness program which covers topics such as phishing, social networking safety, password security and mobile device usage. We have mandatory training in the areas of cybersecurity, privacy, and confidential information handling. We also conduct regular phishing training and simulations for our employees and contractors. We provide extensive specialized role-based training to technical professionals in cybersecurity, secure application development, and other focus areas. We also conduct periodic tabletop exercises to validate our preparation for cyber events.
We operate a third-party cybersecurity program with the goal of minimizing disruption to the Company’s business and production operations, strengthening supply chain resilience, and supporting the integrity of components and systems used in its products and services. We rely heavily on our supply chain to deliver our products and services to our customers, and a cybersecurity incident at a supplier, subcontractor or joint venture partner could materially adversely impact us. We assess third-party cybersecurity controls through a cybersecurity third-party risk assessment process. Identified deficiencies are addressed through a risk remediation process. For select suppliers, we engage third-party cybersecurity monitoring and alerting services, and seek to work directly with those suppliers to address potential deficiencies identified.
As of the date of this report, we do not believe that risks from any cybersecurity threats, including as a result of any previous cybersecurity incidents, have materially affected or are reasonably likely to affect us, including our business strategy, results of operations or financial condition. That said, as discussed more fully under Item 1A. “Risk Factors—Operational Risks— Increased information technology security threats and more sophisticated computer crime pose a risk to our systems, networks, products and services” of this Form 10-K, these threats pose a risk to the security of our systems and networks and the confidentiality, availability and integrity of our data. Cybersecurity attacks could also include attacks targeting customer data or the security, integrity and/or reliability of the hardware and software installed in our products. It is possible that our information technology systems and networks, or those managed or provided by third parties, could have vulnerabilities, which could go unnoticed for a period of time. While various procedures and controls have been and are being utilized to mitigate such risks, there can be no guarantee that the actions and controls we have implemented and are implementing, or which we cause or have caused third-party service providers to implement, will be sufficient to protect and mitigate associated risks to our systems, information or other property.
Cybersecurity Governance
Caterpillar’s board has oversight for risk management with a focus on the most significant risks facing the Company, including strategic, operational, financial and legal compliance risks. The board’s risk oversight process builds upon management’s risk assessment and mitigation processes, which include an enterprise risk management program of which our cybersecurity processes are an integral component.
The board implements its risk oversight function both as a board and through delegation to board committees, which meet regularly and report back to the board. The board has delegated the oversight of specific risks to board committees that align with their functional responsibilities. The Audit Committee (the “AC”) assists the board in overseeing the enterprise risk management program and evaluates and monitors risks related to, among other things, the Company’s information security program. The AC assesses cybersecurity and information technology risks and the controls implemented to monitor and mitigate these risks. The Company’s Chief Information Officer & Senior Vice President, Caterpillar IT (the “CIO”) attends all bimonthly AC meetings and provides cybersecurity updates to the AC and board.
Our cybersecurity program is overseen by our CIO, who has been a Caterpillar employee for nearly twenty-five years. Prior to her current appointment as our CIO in September 2020, she was the Chief Information Officer for the Company’s Financial Products Division. Her extensive background in IT includes global leadership for large-scale systems transformations, cybersecurity, cloud and application management, global data center management, worldwide network, servers and storage, database management and end-user services. Our CIO leads a cross-functional cybersecurity team comprised of professionals from our product, cybersecurity, legal and compliance organizations who focus on managing the security of our connected solutions. This team manages the Company’s global IT systems, IT risk management, cybersecurity, global infrastructure and IT transformations.
Item 1D.Executive Officers of the Registrant.
| | | | | | | | | | | | | | |
| Name and age | | Present Caterpillar Inc. position
and date of initial election | | Principal positions held during the
past five years if other than
Caterpillar Inc. position currently held |
| D. James Umpleby III (65) | | Chairman of the Board (2018) and Chief Executive Officer (2017) | | Group President (2013-2016) |
| Andrew R.J. Bonfield (61) | | Chief Financial Officer (2018) | | Group Chief Financial Officer for a multinational electricity and gas utility company (2010-2018) |
| Bob De Lange (54) | | Group President (2017) | | Vice President (2015-2016), Worldwide Product Manager, Medium Wheel Loaders, (2013-2014) |
| Denise C. Johnson (57) | | Group President (2016) | | Vice President (2012-2016) |
| Joseph E. Creed (48) | | Chief Operating Officer (2023) | | Group President (2021-2023), Vice President, Oil & Gas and Marine Division (2019-2020), Interim Chief Financial Officer (2018), Vice President, Finance Services Division (2017), Group Chief Financial Officer, Energy and Transportation (2013-2016) |
| Anthony D. Fassino (53) | | Group President (2021) | | Vice President, Building Construction Products (2018-2020), Director of Worldwide Forestry Products (2016-2018) |
| Derek R. Owens (50) | | Chief Legal Officer and General Counsel (2023) | | Senior Vice President (2023), Deputy General Counsel (2021-2023), Associate General Counsel, Litigation & Investigations (2019-2021), Assistant United States Attorney, U.S. Attorney's Office of the Department of Justice (2005-2019) |
| Cheryl H. Johnson (63) | | Chief Human Resources Officer (2017) | | Executive Vice President of Human Resources for a global multi-industry aerospace, defense and industrial manufacturing company (2012-2017) |
| William E. Schaupp (52) | | Vice President and Chief Accounting Officer (2022) | | Finance Director, Global Finance Services Division (2021-2022) Vice President and Controller and Chief Accounting Officer of PPG Industries, Inc. (2018-2021) |
| Jason E. Kaiser (45) | | Group President (2024) | | Senior Vice President, Electric Power Division (2021-2023), General Manager, Electric Power Division (2019-2021), Product Manager, Electric Power Division (2016-2019) |
Item 2.Properties.
General Information
Caterpillar’s operations are highly integrated. Although the majority of our plants are involved primarily in production relating to our Construction Industries, Resource Industries or Energy & Transportation segments, several plants are involved in manufacturing relating to more than one business segment. In addition, several plants reported in our financial statements under the All Other segment are involved in the manufacturing of components that are used in the assembly of products for more than one business segment. Caterpillar’s parts distribution centers are involved in the storage and distribution of parts for Construction Industries, Resource Industries and Energy & Transportation. The research and development activities carried on at our Technical Centers in Aurora and Mossville, Illinois involve products for Construction Industries, Resource Industries and Energy & Transportation.
We believe the properties we own to be generally well maintained and adequate for present use. Through planned capital expenditures, we expect these properties to remain adequate for future needs. Properties we lease are covered by leases expiring over terms of generally one to ten years. We do not anticipate any difficulty in retaining occupancy of any leased facilities, either by renewing leases prior to expiration or by replacing them with equivalent leased facilities.
Headquarters and Other Key Offices
Our corporate headquarters is in a leased office located in Irving, Texas. Our Financial Products business is headquartered in offices in Nashville, Tennessee. Additional key offices are located inside and outside the United States.
Technical Center, Training Centers, Demonstration Areas and Proving Grounds
We operate Technical Centers located in Aurora and Mossville, Illinois; Wuxi, China; and Chennai, India. Our demonstration centers are located in Tinaja Hills, Arizona; Edwards, Illinois; Chichibu, Japan and Malaga, Spain. We have various other technical and training centers, demonstration areas and proving grounds located both inside and outside the United States.
Parts Distribution Centers
Distribution of our parts is conducted from parts distribution centers inside and outside the United States. We operate parts distribution centers in the following locations: Arvin, California; Denver, Colorado; Miami, Florida; Atlanta, Georgia; Morton, Illinois; St. Paul, Minnesota; Clayton, Ohio; York, Pennsylvania; Waco, Texas; Spokane, Washington; Melbourne, Australia; Queensland, Australia; Grimbergen, Belgium; Piracicaba, Brazil; Shanghai, China; Sagami, Japan; San Luis Potosi, Mexico; Singapore, Republic of Singapore; Moscow, Russia; Johannesburg, South Africa; and Dubai, United Arab Emirates. We also own or lease other facilities that support our distribution activities.
Remanufacturing and Components
Remanufacturing of our products is reported in our Energy & Transportation segment and is conducted primarily at the facilities in the following locations: Franklin, Indiana; Bogor, Indonesia; Corinth, Mississippi; Prentiss County, Mississippi; West Fargo, North Dakota; Piracicaba, Brazil; Shanghai, China; and Nuevo Laredo, Mexico.
Component manufacturing is reported in the All Other segment and is conducted primarily at facilities in the following locations: East Peoria, Illinois; Mapleton, Illinois; Peoria, Illinois; Bogor, Indonesia; Menominee, Michigan; Boonville, Missouri; West Plains, Missouri; Goldsboro, North Carolina; Sumter, South Carolina; Tianjin, China; Xuzhou, China; Atessa, Italy; Bazzano, Italy; Frosinone, Italy; San Eusebio, Italy; Ramos Arizpe, Mexico; Pyeongtaek, South Korea; and Skinningrove, United Kingdom.
We also lease or own other facilities that support our remanufacturing and component manufacturing activities.
Manufacturing
Manufacturing of products for our Construction Industries, Resource Industries and Energy & Transportation segments is conducted primarily at the locations listed below. These facilities are believed to be suitable for their intended purposes, with adequate capacities for current and projected needs for existing products.
Our principal manufacturing facilities include those used by the following segments in the following locations:
| | | | | | | | | | | | | | |
| Segment | | U.S. Facilities | | Facilities Outside the U.S. |
| | | | |
| Construction Industries | | Arkansas: North Little Rock | | Brazil: Campo Largo, Piracicaba |
| | Georgia: Athens | | China: Suzhou, Wujiang, Xuzhou, Qingzhou |
| | Illinois: Decatur, East Peoria | | France: Grenoble, Echirolles |
| | Kansas: Wamego | | Hungary: Godollo |
| | Minnesota: Brooklyn Park | | India: Hosur, Thiruvallur |
| | North Carolina: Clayton, Sanford | | Italy: Minerbio, Cattolica |
| | Texas: Victoria | | Japan: Akashi |
| | | | Mexico: Torreon |
| | | | Netherlands: Den Bosch |
| | | | Poland: Janow, Sosnowiec |
| | | | Thailand: Rayong |
| | | | United Kingdom: Desford, Stockton |
| | | | |
| | | | |
| | | | |
| Resource Industries | | Illinois: Decatur, East Peoria | | China: Qingzhou, Wuxi |
| | South Carolina: Sumter | | Germany: Lunen |
| | Texas: Denison | | India: Thiruvallur |
| | Wisconsin: South Milwaukee | | Indonesia: Batam |
| | | | Mexico: Acuna, Monterrey, Reynosa |
| | | | Thailand: Rayong |
| | | | United Kingdom: Peterlee |
| | | | |
| | | | |
| Energy & Transportation | | Alabama: Albertville, Montgomery | | Australia: Cardiff, Perth, Redbank, Revesby |
| | California: San Diego | | Brazil: Curitiba, Hortolandia, Piracicaba, Sete Lagoas |
| | Georgia: Griffin, Patterson | | China: Tianjin, Wuxi |
| | Illinois: East Peoria,Mossville, Mapleton, Pontiac | | Czech Republic: Zatec, Zebrak |
| | Indiana: Lafayette, Muncie | | Germany: Kiel, Mannheim, Rostock |
| | Kentucky: Decoursey, Mayfield | | India: Aurangabad, Hosur |
| | Oklahoma: Broken Arrow | | Italy: Pistoria |
| | North Carolina: Winston-Salem | | Mexico: San Luis Potosi, Tijuana |
| | Texas: Channelview, DeSoto, Fort Worth, Mabank, San Antonio, Schertz, Seguin, Sherman | | United Kingdom: Larne, Peterborough, Sandiacre, South Queensferry, Springvale, Stafford, Wimborne |
| | | | |
Item 3.Legal Proceedings.
Certain legal proceedings in which we are involved are discussed in Note 22 — "Environmental and legal matters" of Part II, Item 8 "Financial Statements and Supplementary Data" and should be considered an integral part of Part I, Item 3 "Legal Proceedings", which is hereby incorporated by reference.
Item 4.Mine Safety Disclosures.
Not applicable.
PART II
Item 5.Market for Registrant’s Common Equity, Related Stockholder Matters and Issuer Purchases of Equity Securities.
Common Stock (NYSE: CAT)
Listing Information: Caterpillar common stock is listed on the New York Stock Exchange in the United States, and on stock exchanges in France and Switzerland.
Number of Shareholders: Shareholders of record at the end of 2023 totaled 21,217, compared with 21,935 at the end of 2022.
Performance Graph: Total Cumulative Shareholder Return for Five-Year Period Ending December 31, 2023
The graph below shows the cumulative shareholder return assuming an investment of $100 on December 31, 2018, and reinvestment of dividends issued thereafter.
| | | | | | | | | | | | | | | | | | | | | | | | | | | | | | | | | | | | | | |
| | | 2018 | | 2019 | | 2020 | | 2021 | | 2022 | | 2023 |
| Caterpillar Inc. | | $ | 100.00 | | | $ | 119.51 | | | $ | 151.74 | | | $ | 175.95 | | | $ | 208.67 | | | $ | 262.82 | |
| S&P 500 | | $ | 100.00 | | | $ | 131.49 | | | $ | 155.68 | | | $ | 200.37 | | | $ | 164.08 | | | $ | 207.21 | |
| S&P 500 Machinery | | $ | 100.00 | | | $ | 130.29 | | | $ | 160.81 | | | $ | 193.23 | | | $ | 195.93 | | | $ | 235.49 | |
Non-U.S. Employee Stock Purchase Plans
As of December 31, 2023, we had 28 employee stock purchase plans (the “EIP Plans”) administered outside the United States for our non-U.S. employees, which had approximately 14,000 active participants in the aggregate. During the fourth quarter of 2023, approximately 78,000 shares of Caterpillar common stock were purchased by the EIP Plans pursuant to the terms of such plans.
Issuer Purchases of Equity Securities
| | | | | | | | | | | | | | | | | | | | | | | | | | |
| Period | | Total Number
of Shares
Purchased | | Average Price Paid per Share | | Total Number
of Shares Purchased
as Part of Publicly Announced Program | | Approximate Dollar Value of Shares that May Yet be Purchased under the Program (in billions)1 |
| October 1-31, 2023 | | 965,566 | | | $ | 260.01 | | | 965,566 | | | $ | 10.340 | |
| November 1-30, 2023 | | 7,250,965 | | | $ | 239.97 | | | 7,250,965 | | 2 | $ | 8.300 | |
| December 1-31, 2023 | | 1,749,834 | | | $ | 271.45 | | | 1,749,834 | | | $ | 7.825 | |
| Total | | 9,966,365 | | | $ | 247.44 | | | 9,966,365 | | | |
| | | | | | | | |
1 In May 2022, the Board approved a share repurchase authorization (the 2022 Authorization) of up to $15.0 billion of Caterpillar common stock effective August 1, 2022, with no expiration. As of December 31, 2023, approximately $7.8 billion remained available under the 2022 Authorization. |
2 Includes shares acquired pursuant to the accelerated share repurchase agreement entered into during the fourth quarter of 2023. |
| | | | | | | | |
Item 6.[Reserved]
Item 7.Management’s Discussion and Analysis of Financial Condition and Results of Operations.
The following Management’s Discussion and Analysis of Financial Condition and Results of Operations (MD&A) is intended to provide information that will assist the reader in understanding the company’s Consolidated Financial Statements, the changes in certain key items in those financial statements between select periods and the primary factors that accounted for those changes. In addition, we discuss how certain accounting principles, policies and critical estimates affect our Consolidated Financial Statements. Our discussion also contains certain forward-looking statements related to future events and expectations. This MD&A should be read in conjunction with our discussion of cautionary statements and significant risks to the company’s business under Item 1A. Risk Factors of the 2023 Form 10-K.
Highlights for the full-year 2023 include:
•Sales and revenues for 2023 were $67.060 billion, an increase of $7.633 billion, or 13 percent, compared with $59.427 billion for 2022. Sales were higher across the three primary segments.
•Operating profit as a percent of sales and revenues was 19.3 percent in 2023, compared with 13.3 percent in 2022. Adjusted operating profit margin was 20.5 percent in 2023, compared with 15.4 percent in 2022.
•Profit per share for 2023 was $20.12, and excluding the items in the table below, adjusted profit per share was $21.21. Profit per share for 2022 was $12.64, and excluding the items in the table below, adjusted profit per share was $13.84.
•In order for our results to be more meaningful to our readers, we have separately quantified the impact of several significant items. A detailed reconciliation of GAAP to non-GAAP financial measures is included on page 47.
| | | | | | | | | | | | | | | | | | | | |
| | | | | | |
| | Full Year 2023 | | Full Year 2022 |
| (Dollars in millions except per share data) | | Profit Before Taxes | Profit
Per Share | | Profit Before Taxes | Profit
Per Share |
| Profit | | $ | 13,050 | | $ | 20.12 | | | $ | 8,752 | | $ | 12.64 | |
Restructuring costs - Longwall divestiture | | 586 | | 1.14 | | | — | | — | |
Other restructuring costs | | 194 | | 0.30 | | | 299 | | 0.43 | |
| Mark-to-market (gains) losses | | (97) | | (0.14) | | | (606) | | (0.91) | |
| Deferred tax valuation allowance adjustments | | — | | (0.21) | | | — | | — | |
| Goodwill impairment | | — | | — | | | 925 | | 1.68 | |
| Adjusted profit | | $ | 13,733 | | $ | 21.21 | | | $ | 9,370 | | $ | 13.84 | |
| | | | | | |
•Enterprise operating cash flow was $12.9 billion in 2023. Caterpillar ended 2023 with $7.0 billion of enterprise cash.
OVERVIEW
Total sales and revenues for 2023 were $67.060 billion, an increase of $7.633 billion, or 13 percent, compared with $59.427 billion for 2022. The increase was primarily due to favorable price realization and higher sales volume. Profit per share was $20.12 in 2023, compared with profit per share of $12.64 in 2022. Profit was $10.335 billion in 2023, compared with $6.705 billion in 2022. The increase was primarily due to favorable price realization, higher sales volume and the absence of a 2022 goodwill impairment charge related to the Rail division, partially offset by higher selling, general and administrative (SG&A) and research and development (R&D) expenses, unfavorable manufacturing costs, the impact of the divestiture of the company's Longwall business and lower mark-to-market gains for remeasurement of pension and other postemployment benefit (OPEB) plans.
Trends and Economic Conditions
Outlook for Key End Markets
Overall demand remains healthy across most of our end markets for our products and services.
In Construction Industries, we expect North America to remain healthy in 2024. We expect non-residential construction in North America to remain at similar demand levels as 2023 due to government-related infrastructure investments. Residential construction is expected to remain healthy relative to historical levels. In Asia Pacific, excluding China, we expect some softening in economic conditions. We anticipate China will remain at a relatively low level in the excavator industry above 10-tons. In EAME, we anticipate the region will be slightly down due to economic uncertainty in Europe, partially offset by continuing strong construction demand in the Middle East. Construction activity in Latin America is expected to increase due to easing financial conditions. In addition, we anticipate the ongoing benefit of our services initiatives will positively impact Construction Industries in 2024.
In Resource Industries, in 2024, for both mining and heavy construction and quarry and aggregates, we anticipate lower sales volume compared to 2023, primarily due to off-highway and articulated trucks. While we continue to see a high level of quoting activity overall, we anticipate lower order rates as customers display capital discipline. Customer product utilization remains high, the number of parked trucks remains low, the age of the fleet remains elevated and our autonomous solutions continue to have strong customer acceptance. We expect higher services revenues, including robust rebuild activity in 2024. We continue to believe the energy transition will support increased commodity demand over time, expanding our total addressable market and providing further opportunities for long-term profitable growth.
In Energy & Transportation, in Oil & Gas, we expect reciprocating engines and services to increase slightly in 2024 compared to 2023. Well servicing in North America is showing some short-term moderation. Gas compression order backlog remains healthy and we continue to remain optimistic about future demand. Power Generation reciprocating engine demand is expected to remain strong due to continued data center growth. Solar Turbines has a strong backlog and continues to experience robust quoting activity. Industrial demand is expected to soften from a strong 2023. In Transportation, we anticipate high-speed marine to increase slightly as customers continue to upgrade aging fleets.
Company Trends and Expectations
For the full-year 2024, we anticipate sales and revenues will be broadly similar to 2023, supported by continued healthy underlying demand across most of our end markets for our products and services and slightly favorable price realization. We anticipate another year of services growth in 2024. We do not expect a significant change in machine dealer inventories in 2024, compared to an increase in 2023. In Construction Industries, sales of equipment to end users is expected to be broadly similar to 2023. In Construction Industries, we do not expect dealer inventory to increase in 2024 as it did in 2023. We also anticipate services initiatives will benefit the segment. Resource Industries' sales in 2024 are expected to be lower, driven by lower sales volume primarily in off-highway and articulated trucks. We also expect an unfavorable impact from changes in dealer inventories in Resource Industries. In 2024, we expect services revenues will increase in Resource Industries. Within Energy & Transportation in 2024, we expect slightly higher sales. Power Generation, Oil & Gas and Transportation sales are expected to increase. Industrial sales are expected to be lower compared to historically strong levels in 2023.
In 2024, we expect a small benefit from price realization during the first half of the year from price actions taken in the second half of 2023. We expect price realization to modestly exceed manufacturing costs, with moderation throughout the year as we lap favorable price trends from 2023. For 2024, we expect short-term incentive compensation expense to be about $1.2 billion, compared to $1.7 billion in 2023. We expect the short-term incentive compensation expense benefit year over year to be offset by increases in SG&A/R&D expenses as we continue to invest in strategic initiatives aimed at future long-term profitable growth, such as services growth and technology, including autonomy, alternative fuels, connectivity and digital and electrification. In addition, we anticipate an impact due to an unfavorable mix of products. In 2024, we expect restructuring costs to be between $300 million and $450 million and expect capital expenditures to be in the range of $2.0 billion to $2.5 billion. We expect the global annual effective tax rate, excluding discrete items, to be between 22.5 percent and 23.5 percent.
In the first quarter of 2024, we expect sales and revenues to be broadly similar to the first quarter of 2023. We expect demand to remain healthy, but anticipate slightly lower machine dealer inventory build as compared to the first quarter of 2023. We anticipate price realization will remain favorable. We expect Construction Industries' sales to remain flat to slightly higher, including favorable price realization. Resource Industries' sales are expected to be lower driven by lower sales volume, partially offset by favorable price realization. In Energy & Transportation, we expect sales to be flat to slightly higher.
In the first quarter of 2024, we expect favorable price realization to more than offset unfavorable manufacturing costs. We expect manufacturing costs to increase primarily due to cost absorption. We do not expect an inventory increase as compared to the increase in the first quarter of 2023. We also anticipate an increase in SG&A/R&D expenses due to investment in strategic initiatives. In Construction Industries, we expect favorable price realization to be offset by increased SG&A/R&D expenses and slightly higher manufacturing costs, including cost absorption. In Resource Industries, we expect the profit impact from lower sales volume to be partially offset by favorable price realization. In Energy & Transportation, we anticipate favorable price realization to be offset by higher manufacturing costs.
Global Business Conditions
We continue to monitor a variety of external factors around the world, such as supply chain disruptions, inflationary cost and labor pressures. Areas of particular focus include transportation, certain components and raw materials. We continue to work to minimize supply chain challenges that may impact our ability to meet customer demand. We continue to assess the environment to determine if additional actions need to be taken.
Risk Factors
Risk factors are disclosed within Item 1A. Risk Factors of the 2023 Form 10-K.
Notes:
•Glossary of terms included on pages 35-37; first occurrence of terms shown in bold italics.
•Information on non-GAAP financial measures is included on page 47.
•Some amounts within this report are rounded to the millions or billions and may not add. In addition, the sum of the components reported across periods may not equal the total amount reported year-to-date due to rounding.
2023 COMPARED WITH 2022
CONSOLIDATED SALES AND REVENUES
The chart above graphically illustrates reasons for the change in consolidated sales and revenues between 2022 (at left) and 2023 (at right). Caterpillar management utilizes these charts internally to visually communicate with the company’s board of directors and employees.
Total sales and revenues for 2023 were $67.060 billion, an increase of $7.633 billion, or 13 percent, compared with $59.427 billion in 2022. The increase was primarily due to favorable price realization and higher sales volume. The increase in sales volume was driven by higher sales of equipment to end users, partially offset by the impact from changes in dealer inventories. Dealer inventory increased about $2.4 billion during 2022, compared to an increase of about $2.1 billion during 2023.
Sales were higher in the three primary segments.
North America sales increased 25 percent driven by higher sales of equipment to end users, favorable price realization and the impact from changes in dealer inventories. Dealer inventory increased more during 2023 than during 2022.
Sales decreased 2 percent in Latin America due to the impact from changes in dealer inventories and lower services sales volume, partially offset by favorable price realization and favorable currency impacts primarily related to the Brazilian real. Dealer inventory increased during 2022, compared to a decrease during 2023.
EAME sales increased 6 percent due to favorable price realization and higher sales of equipment to end users, partially offset by the impact from changes in dealer inventories. Dealer inventory increased more during 2022 than during 2023.
Asia/Pacific sales increased 2 percent driven by favorable price realization, partially offset by unfavorable currency impacts, primarily related to the Australian dollar and Japanese yen, lower sales of equipment to end users and the impact from changes in dealer inventories. Dealer inventory increased more during 2022 than during 2023.
Dealer inventory increased about $2.1 billion during 2023, compared to an increase of about $2.4 billion during 2022. Dealers are independent, and the reasons for changes in their inventory levels vary, including their expectations of future demand and product delivery times. Dealers’ demand expectations take into account seasonal changes, macroeconomic conditions, machine rental rates and other factors. Delivery times can vary based on availability of product from Caterpillar factories and product distribution centers. We do not expect a significant change in machine dealer inventories in 2024.
| | | | | | | | | | | | | | | | | | | | | | | | | | | | | | | | | | | | | | | | | | | | | | | | | | | | |
| Sales and Revenues by Segment |
| (Millions of dollars) | | 2022 | | Sales
Volume | | Price
Realization | | Currency | | | | Inter-Segment / Other | | 2023 | | $
Change | | %
Change |
| Construction Industries | | $ | 25,269 | | | $ | (314) | | | $ | 2,678 | | | $ | (197) | | | | | $ | (18) | | | $ | 27,418 | | | $ | 2,149 | | | 9 | % |
| Resource Industries | | 12,314 | | | (114) | | | 1,422 | | | (77) | | | | | 38 | | | 13,583 | | | 1,269 | | | 10 | % |
| Energy & Transportation | | 23,752 | | | 2,529 | | | 1,500 | | | (11) | | | | | 231 | | | 28,001 | | | 4,249 | | | 18 | % |
| All Other Segment | | 450 | | | (8) | | | (5) | | | (1) | | | | | 13 | | | 449 | | | (1) | | | — | % |
| Corporate Items and Eliminations | | (5,211) | | | (115) | | | 1 | | | 7 | | | | | (264) | | | (5,582) | | | (371) | | | |
| Machinery, Energy & Transportation | | 56,574 | | | 1,978 | | | 5,596 | | | (279) | | | | | — | | | 63,869 | | | 7,295 | | | 13 | % |
| | | | | | | | | | | | | | | | | | |
| Financial Products Segment | | 3,253 | | | — | | | — | | | — | | | | | 532 | | | 3,785 | | | 532 | | | 16 | % |
| Corporate Items and Eliminations | | (400) | | | — | | | — | | | — | | | | | (194) | | | (594) | | | (194) | | | |
Financial Products Revenues | | 2,853 | | | — | | | — | | | — | | | | | 338 | | | 3,191 | | | 338 | | | 12 | % |
| | | | | | | | | | | | | | | | | | |
| Consolidated Sales and Revenues | | $ | 59,427 | | | $ | 1,978 | | | $ | 5,596 | | | $ | (279) | | | | | $ | 338 | | | $ | 67,060 | | | $ | 7,633 | | | 13 | % |
| | | | | | | | | | | | | | | | | | |
| | | | | | | | | | | | | | | | | | | | | | | | | | | | | | | | | | | | | | | | | | | | | | | | | | | | | | | | | | | | | | | | | | | | | | | | | | | | | | | | | | | |
| Sales and Revenues by Geographic Region |
| North America | | Latin America | | EAME | | Asia/Pacific | | External Sales and Revenues | | Inter-Segment | | Total Sales and Revenues |
| (Millions of dollars) | $ | | % Chg | | $ | | % Chg | | $ | | % Chg | | $ | | % Chg | | $ | | % Chg | | $ | | % Chg | | $ | | % Chg |
| 2023 | | | | | | | | | | | | | | | | | | | | | | | | | | | |
| Construction Industries | $ | 15,343 | | | 24% | | $ | 2,307 | | | (19%) | | $ | 5,254 | | | 3% | | $ | 4,390 | | | (9%) | | $ | 27,294 | | | 9% | | $ | 124 | | | (13%) | | $ | 27,418 | | | 9 | % |
| Resource Industries | 5,256 | | | 16% | | 2,040 | | | 11% | | 2,069 | | | (6%) | | 3,879 | | | 13% | | 13,244 | | | 10% | | 339 | | | 13% | | 13,583 | | | 10 | % |
| Energy & Transportation | 11,982 | | | 31% | | 1,983 | | | 11% | | 5,929 | | | 13% | | 3,461 | | | 10% | | 23,355 | | | 21% | | 4,646 | | | 5% | | 28,001 | | | 18 | % |
| All Other Segment | 65 | | | 2% | | (1) | | | (150%) | | 18 | | | 127% | | 49 | | | (66%) | | 131 | | | (10%) | | 318 | | | 4% | | 449 | | | — | % |
| Corporate Items and Eliminations | (133) | | | | | (3) | | | | | (5) | | | | | (14) | | | | | (155) | | | | | (5,427) | | | | | (5,582) | | | |
| Machinery, Energy & Transportation | 32,513 | | | 25% | | 6,326 | | | (2%) | | 13,265 | | | 6% | | 11,765 | | | 2% | | 63,869 | | | 13% | | — | | | —% | | 63,869 | | | 13 | % |
| | | | | | | | | | | | | | | | | | | | | | | | | | | |
| Financial Products Segment | 2,440 | | | 17% | | 416 | | | 20% | | 491 | | | 24% | | 438 | | | 2% | | 3,785 | | 1 | 16% | | — | | | —% | | 3,785 | | | 16 | % |
| Corporate Items and Eliminations | (347) | | | | | (77) | | | | | (83) | | | | | (87) | | | | | (594) | | | | | — | | | | | (594) | | | |
| Financial Products Revenues | 2,093 | | | 12% | | 339 | | | 26% | | 408 | | | 17% | | 351 | | | (3%) | | 3,191 | | | 12% | | — | | | —% | | 3,191 | | | 12 | % |
| | | | | | | | | | | | | | | | | | | | | | | | | | | |
| Consolidated Sales and Revenues | $ | 34,606 | | | 24% | | $ | 6,665 | | | (1%) | | $ | 13,673 | | | 7% | | $ | 12,116 | | | 2% | | $ | 67,060 | | | 13% | | $ | — | | | —% | | $ | 67,060 | | | 13 | % |
| | | | | | | | | | | | | | | | | | | | | | | | | | | |
| 2022 | | | | | | | | | | | | | | | | | | | | | | | | | | | |
| Construction Industries | $ | 12,367 | | | | | $ | 2,843 | | | | | $ | 5,099 | | | | | $ | 4,818 | | | | | $ | 25,127 | | | | | $ | 142 | | | | | $ | 25,269 | | | |
| Resource Industries | 4,531 | | | | | 1,840 | | | | | 2,205 | | | | | 3,437 | | | | | 12,013 | | | | | 301 | | | | | 12,314 | | | |
| Energy & Transportation | 9,175 | | | | | 1,784 | | | | | 5,232 | | | | | 3,146 | | | | | 19,337 | | | | | 4,415 | | | | | 23,752 | | | |
| All Other Segment | 64 | | | | | 2 | | | | | (66) | | | | | 145 | | | | | 145 | | | | | 305 | | | | | 450 | | | |
| Corporate Items and Eliminations | (29) | | | | | (1) | | | | | (5) | | | | | (13) | | | | | (48) | | | | | (5,163) | | | | | (5,211) | | | |
| Machinery, Energy & Transportation | 26,108 | | | | | 6,468 | | | | | 12,465 | | | | | 11,533 | | | | | 56,574 | | | | | — | | | | | 56,574 | | | |
| | | | | | | | | | | | | | | | | | | | | | | | | | | |
| Financial Products Segment | 2,078 | | | | | 348 | | | | | 396 | | | | | 431 | | | | | 3,253 | | 1 | | | — | | | | | 3,253 | | | |
| Corporate Items and Eliminations | (205) | | | | | (78) | | | | | (47) | | | | | (70) | | | | | (400) | | | | | — | | | | | (400) | | | |
| Financial Products Revenues | 1,873 | | | | | 270 | | | | | 349 | | | | | 361 | | | | | 2,853 | | | | | — | | | | | 2,853 | | | |
| | | | | | | | | | | | | | | | | | | | | | | | | | | |
| Consolidated Sales and Revenues | $ | 27,981 | | | | | $ | 6,738 | | | | | $ | 12,814 | | | | | $ | 11,894 | | | | | $ | 59,427 | | | | | $ | — | | | | | $ | 59,427 | | | |
| | | | | | | | | | | | | | | | | | | | | | | | | | | |
1 Includes revenues from Machinery, Energy & Transportation of $690 million and $478 million in 2023 and 2022, respectively. |
CONSOLIDATED OPERATING PROFIT
The chart above graphically illustrates reasons for the change in consolidated operating profit between 2022 (at left) and 2023 (at right). Caterpillar management utilizes these charts internally to visually communicate with the company’s board of directors and employees. The bar entitled Other includes consolidating adjustments and Machinery, Energy & Transportation other operating (income) expenses.
Operating profit was $12.966 billion in 2023, an increase of $5.062 billion, or 64 percent, compared with $7.904 billion in 2022. The increase was primarily due to favorable price realization, higher sales volume and the absence of a 2022 goodwill impairment charge related to the Rail division, partially offset by higher SG&A/R&D expenses, unfavorable manufacturing costs and the impact of the divestiture of the company's Longwall business. The increase in SG&A/R&D expenses was primarily driven by investments aligned with strategic initiatives, higher short-term incentive compensation expense and an unfavorable change in fair value adjustments related to deferred compensation plans. Unfavorable manufacturing costs reflected lower freight being more than offset by higher material costs, increased period manufacturing costs, the impact of manufacturing inefficiencies and unfavorable cost absorption. Cost absorption was unfavorable as inventory increased more during 2022 than during 2023.
Short-term incentive compensation expense is directly related to financial and operational performance, measured against targets set annually. Expense for 2023 was about $1.7 billion, compared with $1.4 billion in 2022. For 2024, we expect short-term incentive compensation expense will be about $1.2 billion.
In the first quarter of 2023, the divestiture of the company’s Longwall business was finalized, resulting in an unfavorable impact to operating profit of $586 million, primarily a non-cash item driven by the release of accumulated foreign currency translation.
Operating profit margin was 19.3 percent in 2023, compared with 13.3 percent in 2022.
| | | | | | | | | | | | | | | | | | | | | | | | | | |
| Profit (Loss) by Segment | | | | | | | | |
| (Millions of dollars) | | 2023 | | 2022 | | $
Change | | %
Change |
| Construction Industries | | $ | 6,975 | | | $ | 4,743 | | | $ | 2,232 | | | 47 | % |
| Resource Industries | | 2,834 | | | 1,827 | | | 1,007 | | | 55 | % |
| Energy & Transportation | | 4,936 | | | 3,309 | | | 1,627 | | | 49 | % |
| All Other Segment | | 18 | | | (11) | | | 29 | | | 264 | % |
| Corporate Items and Eliminations | | (2,104) | | | (2,435) | | | 331 | | | |
| Machinery, Energy & Transportation | | 12,659 | | | 7,433 | | | 5,226 | | | 70 | % |
| | | | | | | | |
| Financial Products Segment | | 909 | | | 864 | | | 45 | | | 5 | % |
| Corporate Items and Eliminations | | 14 | | | 26 | | | (12) | | | |
| Financial Products | | 923 | | | 890 | | | 33 | | | 4 | % |
| Consolidating Adjustments | | (616) | | | (419) | | | (197) | | | |
| Consolidated Operating Profit | | $ | 12,966 | | | $ | 7,904 | | | $ | 5,062 | | | 64 | % |
| | | | | | | | |
Other Profit/Loss and Tax Items
•Interest expense excluding Financial Products in 2023 was $511 million, compared with $443 million in 2022. The increase was due to higher average borrowing rates.
•Other income (expense) in 2023 was income of $595 million, compared with income of $1.291 billion in 2022. The change was primarily driven by lower mark-to-market gains for remeasurement of pension and OPEB plans and unfavorable impacts from pension and OPEB plan costs and foreign currency exchange, partially offset by higher investment and interest income.
•The provision for income taxes for 2023 reflected an annual effective tax rate of 21.4 percent, compared with 23.2 percent for 2022, excluding the discrete items discussed below. The decrease from 2022 was primarily related to changes in the geographic mix of profits from a tax perspective.
The 2023 annual effective tax rate excludes the impact of the nondeductible loss of $586 million related to the divestiture of the company’s Longwall business. The company also recorded a tax charge of $26 million related to $97 million of pension and OPEB mark-to-market gains in the fourth quarter of 2023, compared to a tax charge of $124 million related to $606 million of mark-to-market gains in the fourth quarter of 2022. In addition, the company recorded a discrete tax benefit of $57 million in 2023 for the settlement of stock-based compensation awards with associated tax deductions in excess of cumulative U.S. GAAP compensation expense, compared with a $33 million benefit for 2022. In 2023, the company recorded a discrete tax benefit of $88 million due to a change in the valuation allowance for certain non-U.S. deferred tax assets. In 2022, the company also recorded discrete benefits of $90 million to reflect changes in estimates related to prior years and a tax benefit of $36 million related to the goodwill impairment charge of $925 million.
Construction Industries
Construction Industries’ total sales were $5.736$27.418 billion in the fourth quarter of 2021,2023, an increase of $1.228$2.149 billion, or 279 percent, compared with $4.508$25.269 billion in the fourth quarter of 2020.2022. The increase was due to higher sales volume, driven by the impact from changes in dealer inventories and higher end-user demand, along with favorable price realization. Dealers decreased inventories more during the fourth quarter of 2020 than during the fourth quarter of 2021.
▪In North America,realization, partially offset by lower sales increased due to higher sales volume and favorable price realization. Highervolume. The decrease in sales volume was driven by the impact from changes in dealer inventories, as dealers decreased inventoriespartially offset by higher sales of equipment to end users. Dealer inventory increased more during the fourth quarter of 20202022 than during the fourth quarter of 2021.2023.
▪•SalesIn North America, sales increased in Latin America primarily due to favorable price realization and higher sales volume and favorable price realization.volume. Higher sales volume was driven by higher end-user demandsales of equipment to end users and the impact from changes in dealer inventories. DealersDealer inventory increased inventoriesmore during the fourth quarter of 2021, compared to a decrease2023 than during the fourth quarter of 2020.2022.
▪In EAME, sales increased due to higher sales volume from higher end-user demand and the impact of changes in dealer inventories. Dealers decreased inventories more during the fourth quarter of 2020 than during the fourth quarter of 2021.
▪•Sales decreased in Asia/PacificLatin America primarily due to lower sales volume, partially offset by favorable price realization. DecreasedLower sales volume reflected lower end-user demand, partially offsetwas driven by the impact from changes in dealer inventories.inventories and lower sales of equipment to end users. Dealer inventory increased during 2022, compared with a decrease during 2023.
•In EAME, sales increased due to favorable price realization and favorable currency impacts, primarily related to the euro, partially offset by lower sales volume. Lower sales volume was due to the impact from changes in China,dealer inventories and lower sales of equipment to end users. Dealer inventory increased during 2022, compared with a decrease during 2023.
•Sales decreased in Asia/Pacific due to lower sales volume and unfavorable currency impacts, primarily related to the Japanese yen, Australian dollar and Chinese yuan, partially offset by favorable price realization. Lower sales volume was driven by lower end-user demand, were partially offset by higher sales across most of the rest of the region. Dealers decreased inventories during the fourth quarter of 2020, comparedequipment to an increase during the fourth quarter of 2021.end users.
Construction Industries’ profit was $788 million$6.975 billion in the fourth quarter of 2021,2023, an increase of $158 million,$2.232 billion, or 2547 percent, compared with $630 million$4.743 billion in the fourth quarter of 2020. Higher manufacturing costs and SG&A/R&D expenses were more than offset by higher sales volume and2022. The increase was mainly due to favorable price realization. Increased manufacturing costs reflected higher variable labor and burden, primarily freight, as well as higher material costs.
The increase in SG&A/R&D expenses was driven by higher short-term incentive compensation expense.
Construction Industries’ profit as a percent of total sales was 13.725.4 percent in the fourth quarter of 2021,2023, compared with 14.018.8 percent in the fourth quarter of 2020.
Resource Industries
Resource Industries’ total sales were $2.762$13.583 billion in the fourth quarter of 2021,2023, an increase of $582 million,$1.269 billion, or 2710 percent, compared with $2.180$12.314 billion in the fourth quarter of 2020.2022. The increase was primarily due to favorable price realization, partially offset by lower sales volume. Sales volume decreased as higher sales volume, drivenof equipment to end users were more than offset by higher end-user demand for equipmentthe impact from changes in dealer inventories and lower aftermarket parts and favorable price realization. End-user demand was higher in mining as well as heavy construction and quarry and aggregates.sales volume. Dealer inventory increased more during 2022 than during 2023.
Resource Industries’ profit was $305 million$2.834 billion in the fourth quarter of 2021,2023, an increase of $32 million,$1.007 billion, or 1255 percent, compared with $273 million$1.827 billion in the fourth quarter of 2020. Increased2022. The increase was mainly due to favorable price realization, partially offset by unfavorable manufacturing costs and SG&A/R&D expenses were more than offset by higher sales volume and favorable price realization.currency impacts. Unfavorable manufacturing costs reflected higher variable labor and burden, primarily freight, and material costs.
The increase in SG&A/R&D expenses waswere driven by investments aligned with growth initiatives, primarily labor,higher materials costs, the impact of manufacturing inefficiencies and higher short-term incentive compensation expense.unfavorable cost absorption, partially offset by lower freight. Cost absorption was unfavorable as inventory increased more during 2022 than during 2023.
Resource Industries’ profit as a percent of total sales was 11.020.9 percent in the fourth quarter of 2021,for 2023, compared with 12.514.8 percent in the fourth quarter of 2020.for 2022.
Energy & Transportation
| | Sales by Application | Sales by Application | |
| (Millions of dollars) | |
| (Millions of dollars) | |
| (Millions of dollars) | (Millions of dollars) | | Fourth Quarter 2021 | | Fourth Quarter 2020 | | $
Change | | % Change | | 2023 | | 2022 | | $
Change | | % Change |
| Oil and Gas | Oil and Gas | | $ | 1,320 | | | $ | 1,079 | | | $ | 241 | | | 22 | % | Oil and Gas | | $ | 6,988 | | | $ | | $ | 5,330 | | | $ | | $ | 1,658 | | | 31 | | 31 | % |
| Power Generation | Power Generation | | 1,267 | | | 1,180 | | | 87 | | | 7 | % | Power Generation | | 6,362 | | | 4,940 | | 4,940 | | | 1,422 | | 1,422 | | | 29 | | 29 | % |
| Industrial | Industrial | | 952 | | | 736 | | | 216 | | | 29 | % | Industrial | | 4,871 | | | 4,426 | | 4,426 | | | 445 | | 445 | | | 10 | | 10 | % |
| Transportation | Transportation | | 1,212 | | | 1,035 | | | 177 | | | 17 | % | Transportation | | 5,134 | | | 4,641 | | 4,641 | | | 493 | | 493 | | | 11 | | 11 | % |
| External Sales | External Sales | | 4,751 | | | 4,030 | | | 721 | | | 18 | % | External Sales | | 23,355 | | | 19,337 | | 19,337 | | | 4,018 | | 4,018 | | | 21 | | 21 | % |
| Inter-Segment | Inter-Segment | | 977 | | | 781 | | | 196 | | | 25 | % | Inter-Segment | | 4,646 | | | 4,415 | | 4,415 | | | 231 | | 231 | | | 5 | | 5 | % |
| Total Sales | Total Sales | | $ | 5,728 | | | $ | 4,811 | | | $ | 917 | | | 19 | % | Total Sales | | $ | 28,001 | | | $ | | $ | 23,752 | | | $ | | $ | 4,249 | | | 18 | | 18 | % |
| |
Energy & Transportation’s total sales were $5.728$28.001 billion in the fourth quarter of 2021,2023, an increase of $917 million,$4.249 billion, or 1918 percent, compared with $4.811$23.752 billion in the fourth quarter of 2020.2022. Sales increased across all applications and inter-segment sales. The increase in sales was primarily due to higher sales volume and favorable price realization.
▪•Oil and Gas – Sales increased for reciprocating engines aftermarket parts across all regions, turbines and turbine-related services andservices. Sales also increased in reciprocating engines used in well servicing and gas compression.compression applications.
▪•Power Generation – Sales rose due to higher sales volumeincreased in large reciprocating engines, aftermarket partsprimarily data center applications, and small reciprocating engine applications.engines. Turbines and turbine-related services increased as well.
▪•Industrial – Sales were up due to higher demand across all regions.
▪•Transportation –Sales– Sales increased due to higherin rail services and marine. International locomotive deliveries of locomotives, which were primarily international, and rail services.also higher.
Energy & Transportation’s profit was $675 million$4.936 billion in the fourth quarter2023, an increase of 2021, a decrease of $12 million,$1.627 billion, or 249 percent, compared with $687 million$3.309 billion in the fourth quarter of 2020.2022. The decreaseincrease was mainly due to favorable price realization and higher sales volume, partially offset by unfavorable manufacturing costs and higher SG&A/R&D expenses, mostly offset by higher sales volume and favorable price realization.expenses. Unfavorable manufacturing costs reflectedwere driven by higher variable labor and burden, primarily freight, highermaterial costs, increased period manufacturing costs and material costs.
Boththe impact of manufacturing inefficiencies, partially offset by lower freight. The increase in SG&A/R&D expenses and period manufacturing costs increasedwas primarily due todriven by investments aligned with strategic initiatives and higher short-term incentive compensation expense and investments aligned with growth initiatives, including acquisition-related expenses.expense.
Energy & Transportation’s profit as a percent of total sales was 11.817.6 percent in the fourth quarter of 2021,2023, compared with 14.313.9 percent in the fourth quarter of 2020.2022.
Financial Products Segment
Financial Products’ segment revenues were $776 million$3.785 billion in the fourth quarter of 2021,2023, an increase of $33$532 million, or 416 percent, from the fourth quarter of 2020.compared with $3.253 billion in 2022. The increase was primarily due to higher average financing rates across all regions.
Financial Products’ segment profit was $248$909 million in the fourth quarter of 2021,2023, an increase of $53$45 million, or 275 percent, compared with $195$864 million in the fourth quarter of 2020.2022. The increase was mainly due to a favorable impact from returned or repossessed equipmenthigher net yield on average earning assets and lower provision for credit losses at Cat Financial, partially offset by an increase in SG&A expenses primarily due to higher short-term incentive compensation expense.expenses.
Corporate Items and Eliminations
Expense for corporate items and eliminations was $318$2.090 billion in 2023, a decrease of $319 million from 2022, primarily driven by the absence of a 2022 goodwill impairment charge related to the Rail division and decreased expenses due to timing differences, partially offset by higher restructuring costs, which included the impact of the divestiture of the company's Longwall business and other restructuring costs, higher corporate costs, an unfavorable change in fair value adjustments related to deferred compensation plans and unfavorable impacts of segment reporting methodology differences.
In the fourthfirst quarter of 2021, about flat2023, the divestiture of the company’s Longwall business was finalized, resulting in an unfavorable impact to operating profit of $586 million, primarily a non-cash item driven by the fourth quarterrelease of 2020.accumulated foreign currency translation. This impact was included in total restructuring costs.
2022 COMPARED WITH 20192021
For discussions related to the consolidated sales and revenue and consolidated operating profit between 20202022 and 2019,2021, refer to Part II, Item 7. Management's Discussion and Analysis of Financial Condition and Results of Operations of the Company's Annual Report on Form 10-K for the fiscal year ended December 31, 2020,2022, which was filed with the United States Securities and Exchange Commission on February 17, 2021.15, 2023 and hereby incorporated by reference.
RESTRUCTURING COSTS
In 2022,2024, we expect to incur about $600$300 to $450 million of restructuring costs primarily related to strategic actions to address a small number of products.costs. We expect that prior restructuring actions will result in an incremental benefit to operating costs, primarily Costs of goods sold and SG&A expenses of about $75$25 million in 20222024 compared with 2021.2023.
Additional information related to restructuring costs is included in Note 25 -— "Restructuring Costs" of Part II, Item 8 "Financial Statements and Supplemental Data."
GLOSSARY OF TERMS
1.Adjusted Operating Profit Margin – Operating profit excluding restructuring costs, which include the divestiture of the company's Longwall business, and 2022 goodwill impairment charges as a percent of sales and revenues.
2.Adjusted Profit Per Share – Profit per share excluding restructuring costs, which include the divestiture of the company's Longwall business, certain deferred tax valuation allowance adjustments, pension and OPEB mark-to-market gains/losses and restructuring income/costs.2022 goodwill impairment charges.
3.All Other Segment– Primarily includes activities such as: business strategy; product management and development; manufacturing and sourcing of filters and fluids, undercarriage, ground-engaging tools, fluid transfer products, precision seals, rubber sealing and connecting components primarily for Cat® products; parts distribution; integrated logistics solutions; distribution services responsible for dealer development and administration, including a wholly owned dealer in Japan; dealer portfolio management and ensuring the most efficient and effective distribution of machines, engines and parts; brand management and marketing strategy; and digital investments for new customer and dealer solutions that integrate data analytics with state-of-the-art digital technologies while transforming the buying experience.
4.Consolidating Adjustments– Elimination of transactions between Machinery, Energy & Transportation and Financial Products.
5.Construction Industries– A segment primarily responsible for supporting customers using machinery in infrastructure and building construction applications. Responsibilities include business strategy, product design, product management and development, manufacturing, marketing and sales and product support. The product portfolio includes asphalt pavers; backhoe loaders; compactors; cold planers; compactors; compact track and multi-terrain loaders; mini, small, medium and large track excavators;forestry machines; material handlers; motor graders; pipelayers; road reclaimers; skid steer loaders; telehandlers; small and medium track-type tractors; track-type loaders; utility vehicles;track-type tractors (small, medium); track excavators (mini, small, medium, large); wheel excavators; compact,wheel loaders (compact, small, and medium wheel loaders;medium); and related parts and work tools.
6.Corporate Items and Eliminations– Includes corporate-level expenses, timing differences (as some expenses are reported in segment profit on a cash basis), methodology differences between segment and consolidated external reporting, certain restructuring costs and inter-segment eliminations.
7.Currency– With respect to sales and revenues, currency represents the translation impact on sales resulting from changes in foreign currency exchange rates versus the U.S. dollar. With respect to operating profit, currency represents the net translation impact on sales and operating costs resulting from changes in foreign currency exchange rates versus the U.S. dollar. Currency only includes the impact on sales and operating profit for the Machinery, Energy & Transportation line of business; currency impacts on Financial Products revenues and operating profit are included in the Financial Products portions of the respective analyses. With respect to other income/expense, currency represents the effects of forward and option contracts entered into by the company to reduce the risk of fluctuations in exchange rates (hedging) and the net effect of changes in foreign currency exchange rates on our foreign currency assets and liabilities for consolidated results (translation).
8.Dealer Inventories– Represents dealer machine and engine inventories, excluding aftermarket parts.
9.EAME– A geographic region including Europe, Africa, the Middle East and the CommonwealthEurasia.
10.Earning Assets– Assets consisting primarily of total finance receivables net of unearned income, plus equipment on operating leases lessnet of accumulated depreciation at Cat Financial.
11.Energy & Transportation– A segment primarily responsible for supporting customers using reciprocating engines, turbines, diesel-electric locomotives and related services across industries serving Oil and Gas, Power Generation, Industrial and Transportation applications, including marine- and rail-related businesses. Responsibilities include business strategy, product design, product management, development and development,testing manufacturing, marketing and sales and product support. The product and services portfolio includes turbines, centrifugal gas compressors, and turbine-related services; reciprocating engine-powered generator sets; integrated systems and solutions used in the electric power generation industry; reciprocating engines, drivetrain and integrated systems and solutions for the marine and oil and gas industries; reciprocating engines, drivetrain and integrated systems and solutions supplied to the industrial industry as well as Cat machinery;Caterpillar machines; electrified powertrain and zero-emission power sources and service solutions development; and diesel-electric locomotives and components and other rail-related products and services, including remanufacturing and leasing. Responsibilities also include the remanufacturing of Caterpillar reciprocating engines and components and remanufacturing services for other companies; and product support of on-highway vocational trucks for North America.
12.Financial Products – The company defines Financial Products as our finance and insurance subsidiaries, primarily Caterpillar Financial Services Corporation (Cat Financial) and Caterpillar Insurance Holdings Inc. (Insurance Services). Financial Products’ information relates to the financing to customers and dealers for the purchase and lease of Caterpillar and other equipment.
13.Financial Products Segment – Provides financing alternatives to customers and dealers around the world for Caterpillar products and services, as well as financing for vehicles, power generation facilities and marine vessels that, in most cases, incorporate Caterpillar products. Financing plans include operating and finance leases, revolving charge accounts, installment sale contracts, repair/rebuild financing, working capital loans and wholesale financing plans. The segment also provides insurance and risk management products and services that help customers and dealers manage their business risk. Insurance and risk management products offered include physical damage insurance, inventory protection plans, extended service coverage and maintenance plans for machines and engines, and dealer property and casualty insurance. The various forms of financing, insurance and risk management products offered to customers and dealers help support the purchase and lease of Caterpillar equipment. The segment also earns revenues from Machinery, Energy & Transportation, but the related costs are not allocated to operating segments. Financial Products’ segment profit is determined on a pretax basis and includes other income/expense items.
14.Latin America– A geographic region including Central and South American countries and Mexico.
15.Machinery, Energy & Transportation (ME&T) – The company defines ME&T as Caterpillar Inc. and its subsidiaries, excluding Financial Products. ME&T’s information relates to the design, manufacturing and marketing of its products.
16.Machinery, Energy & Transportation Other Operating (Income) Expenses– Comprised primarily of gains/losses on disposal of long-lived assets, gains/losses on divestitures and legal settlements and accruals.
17.Manufacturing Costs– Manufacturing costs exclude the impacts of currency and represent the volume-adjusted change for variable costs and the absolute dollar change for period manufacturing costs. Variable manufacturing costs are defined as having a direct relationship with the volume of production. This includes material costs, direct labor and other costs that vary directly with production volume, such as freight, power to operate machines and supplies that are consumed in the manufacturing process. Period manufacturing costs support production but are defined as generally not having a direct relationship to short-term changes in volume. Examples include machinery and equipment repair, depreciation on manufacturing assets, facility support, procurement, factory scheduling, manufacturing planning and operations management.
18.Mark-to-market gains/losses– Represents the net gain or loss of actual results differing from the company’s assumptions and the effects of changing assumptions for our defined benefit pension and OPEB plans. These gains and losses are immediately recognized through earnings upon the annual remeasurement in the fourth quarter, or on an interim basis as triggering events warrant remeasurement.
19.Pension and Other Postemployment Benefits (OPEB)– The company’s defined-benefit pension and postretirement benefit plans.
20.Price Realization– The impact of net price changes excluding currency and new product introductions. Price realization includes geographic mix of sales, which is the impact of changes in the relative weighting of sales prices between geographic regions.
21.Resource Industries– A segment primarily responsible for supporting customers using machinery in mining, heavy construction and quarry and aggregates. Responsibilities include business strategy, product design, product management
and development, manufacturing, marketing and sales and product support. The product portfolio includes large track-type tractors; large mining trucks; hard rock vehicles; longwall miners; electric rope shovels; draglines; hydraulic shovels; rotary drills; large wheel loaders; off-highway trucks; articulated trucks; wheel tractor scrapers; wheel dozers; landfill compactors; soil compactors; select work tools; machinery components; electronics and control systems and related parts. In addition to equipment, Resource Industries also develops and sells technology products and services to provide customers fleet management, equipment management analytics, autonomous machine capabilities, safety services and mining performance solutions. Resource Industries also manages areas that provide services to other parts of the company, including strategic procurement, lean center of excellence, integrated manufacturing, research and development for drivetrains, hydraulic systems, automation, electronics and software for Cat machines and engines.
22.Restructuring Costs – May include costs for employee separation, long-lived asset impairments, contract terminations and contract terminations.divestiture impacts. These costs are included in Other operating (income) expenses except for defined-benefit plan curtailment losses and special termination benefits, which are included in Other income (expense). Restructuring costs also include other exit-related costs, which may consist of accelerated depreciation, inventory write-downs, building demolition, equipment relocation and project management costs and LIFO inventory decrement benefits from inventory liquidations at closed facilities, all of which are primarily included in Cost of goods sold.
23.Sales Volume – With respect to sales and revenues, sales volume represents the impact of changes in the quantities sold for Machinery, Energy & Transportation as well as the incremental sales impact of new product introductions, including emissions-related product updates. With respect to operating profit, sales volume represents the impact of changes in the quantities sold for Machinery, Energy & Transportation combined with product mix as well as the net operating profit impact of new product introductions, including emissions-related product updates. Product mix represents the net operating profit impact of changes in the relative weighting of Machinery, Energy & Transportation sales with respect to total sales. The impact of sales volume on segment profit includes inter-segment sales.
24.Services – Enterprise services include, but are not limited to, aftermarket parts, Financial Products revenues and other service-related revenues. Machinery, Energy & Transportation segments exclude most Financial Products revenues.
LIQUIDITY AND CAPITAL RESOURCES
Sources of funds
We generate significant capital resources from operating activities, which are the primary source of funding for our ME&T operations. Funding for these businesses is also available from commercial paper and long-term debt issuances. Financial Products’ operations are funded primarily from commercial paper, term debt issuances and collections from its existing portfolio. During 2021,2023, we had positive operating cash flow within both our ME&T and Financial Products' operations. On a consolidated basis, we ended 20212023 with $9.25$6.98 billion of cash, a decrease of $98$26 million from year-end 2020.2022. In addition, ME&T has invested in available-for-sale debt securities and bank time deposits that are considered highly liquid and are available for current operations. These ME&T securities were $3.85 billion as of December 31, 2023 and are included in Prepaid expenses and other current assets and Other assets in the Consolidated Statement of Financial Position. We intend to maintain a strong cash and liquidity position.
Consolidated operating cash flow for 20212023 was $7.20$12.89 billion, up $871 million$5.12 billion compared to 2020.2022. The increase was primarily due to higher profit before taxes adjusted for non-cash items including higher accruals for short-term incentive compensation. In addition,and lower payments for short-term incentive compensation favorably impacted cash flow. Partially offsetting these items were increased working capital requirements compared to last year.requirements. Within working capital, changes in accounts receivableinventories and inventory unfavorablyaccrued expenses favorably impacted cash flow but were partially offset by favorable changes in accounts payable and accrued expenses. See further discussion of operating cash flow under ME&T and Financial Products.customer advances.
Total debt as of December 31, 20212023 was $37.79$37.88 billion, an increase of $626$885 million from year-end 2020.2022. Debt related to ME&T decreased $1.37 billionincreased $18 million in 2021 due to the repayment of maturing debt. In addition, during the first quarter of 2021, we issued $500 million of ten year bonds at 1.9 percent and utilized the net proceeds to redeem all our $500 million 2.6 percent notes due in 2022.2023. Debt related to Financial productsProducts increased by $2.01 billion$883 million due to portfolio funding requirements.
We have three global credit facilities with a syndicate of banks totaling $10.50 billion (Credit Facility) available in the aggregate to both Caterpillar and Cat Financial for general liquidity purposes. Based on management’s allocation decision, which can be revised from time to time, the portion of the Credit Facility available to ME&T as of December 31, 20212023 was $2.75 billion. Information on our Credit Facility is as follows:
•In August 2023, we entered into a new 364-day facility. The 364-day facility of $3.15 billion (of which $825 million is available to ME&T) expires on September 1, 2022.in August 2024.
•TheIn August 2023, we amended and extended the three-year facility as(as amended and restated, in September 2021,the "three-year facility"). The three-year facility of $2.73 billion (of which $715 million is available to ME&T) expires in September 2024.August 2026.
•TheIn August 2023, we amended and extended the five-year facility as(as amended and restated, in September 2021,the "five-year facility"). The five-year facility of $4.62 billion (of which $1.21 billion is available to ME&T) expires in September 2026.August 2028.
At December 31, 2021,2023, Caterpillar’s consolidated net worth was $16.58$19.55 billion, which was above the $9.00 billion required under the Credit Facility. The consolidated net worth is defined as the consolidated shareholder’sshareholders' equity including preferred stock but excluding the pension and other postretirement benefits balance within Accumulated other comprehensive income (loss).AOCI.
At December 31, 2021,2023, Cat Financial’s covenant interest coverage ratio was 2.511.73 to 1. This iswas above the 1.15 to 1 minimum ratio, calculated as (1) profit excluding income taxes, interest expense and net gain/(loss) from interest rate derivatives to (2) interest expense calculated at the end of each calendarfiscal quarter for the rollingprior four consecutive fiscal quarter period, then most recently ended, required by the Credit Facility.
In addition, at December 31, 2021,2023, Cat Financial’s six-month covenant leverage ratio was 7.256.88 to 1 and year-end covenant leverage ratio was 7.916.95 to 1. This iswas below the maximum ratio of debt to net worth of 10 to 1, calculated (1) on a monthly basis as the average of the leverage ratios determined on the last day of each of the six preceding calendar months and (2) at each December 31, required by the Credit Facility.
In the event Caterpillar or Cat Financial does not meet one or more of their respective financial covenants under the Credit Facility in the future (and are unable to obtain a consent or waiver), the syndicate of banks may terminate the commitments allocated to the party that does not meet its covenants. Additionally, in such event, certain of Cat Financial's other lenders under other loan agreements where similar financial covenants or cross default provisions are applicable may, at their election, choose to pursue remedies under those loan agreements, including accelerating the repayment of outstanding borrowings. At December 31, 2021,2023, there were no borrowings under the Credit Facility.
Our total credit commitments and available credit as of December 31, 20212023 were:
| | | | | | | December 31, 2021 | | December 31, 2023 |
| (Millions of dollars) | (Millions of dollars) | | Consolidated | | Machinery,
Energy &
Transportation | | Financial
Products | (Millions of dollars) | | Consolidated | | Machinery,
Energy &
Transportation | | Financial
Products |
| Credit lines available: | Credit lines available: | | | | | | | Credit lines available: | | |
| Global credit facilities | Global credit facilities | | $ | 10,500 | | | $ | 2,750 | | | $ | 7,750 | |
| Other external | Other external | | 3,251 | | | 184 | | | 3,067 | |
| Total credit lines available | Total credit lines available | | 13,751 | | | 2,934 | | | 10,817 | |
| Less: Commercial paper outstanding | Less: Commercial paper outstanding | | (4,896) | | | — | | | (4,896) | |
| Less: Utilized credit | Less: Utilized credit | | (568) | | | (9) | | | (559) | |
| Available credit | Available credit | | $ | 8,287 | | | $ | 2,925 | | | $ | 5,362 | |
|
The other consolidated credit lines with banks as of December 31, 20212023 totaled $3.25$4.16 billion. These committed and uncommitted credit lines, which may be eligible for renewal at various future dates or have no specified expiration date, are used primarily by our subsidiaries for local funding requirements. Caterpillar or Cat Financial may guarantee subsidiary borrowings under these lines.
We receive debt ratings from the major credit rating agencies. Fitch maintains a "high-A" debt rating, while Moody’s Fitch and S&P maintain a “mid-A” debt rating. A downgrade of our credit ratings by any of the major credit rating agencies wouldcould result in increased borrowing costs and could make access to certain credit markets more difficult. In the event economic conditions deteriorate such that access to debt markets becomes unavailable, ME&T’s operations would rely on cash flow from operations, use of existing cash balances, borrowings from Cat Financial and access to our committed credit facilities. Our Financial Products’ operations would rely on cash flow from its existing portfolio, existing cash balances, access to our committed credit facilities and other credit line facilities of Cat Financial, and potential borrowings from Caterpillar. In addition, we maintain a support agreement with Cat Financial, which requires Caterpillar to remain the sole owner of Cat Financial and may, under certain circumstances, require Caterpillar to make payments to Cat Financial should Cat Financial fail to maintain certain financial ratios.
We facilitate voluntary supply chainsupplier finance programs (the “Programs”) through participating financial institutions. The Programs are available to a wide range of suppliers and allows them the option to manage their cash flow. We are not a party to the agreements between the participating financial institutions and the suppliers in connection with the Programs. The range of payment terms we negotiate with our suppliers is consistent, irrespective of whether a supplier participates in the Programs. The amounts payable to participating financial institutions for suppliers who voluntarily participate in the Programs and included in accounts payable in the Consolidated Statement of Financial Position were $822 million and $533 million at December 31, 2021 and December 31, 2020, respectively. The amounts settled through the Programs and paid to participating financial institutions were $4.1 billion and $3.2 billion in 2021 and 2020, respectively. We account for the payments made under the Programs, the same as our other accounts payable, as a reduction to our cash flows from operations. We do not believe that changes in the availability of supply chain financingthe Programs will have a significant impact on our liquidity. Additional information related to the Programs is included in Note 1J — "New accounting guidance" of Part II, Item 8 "Financial Statements and Supplementary Data".
Material cash requirements for contractual obligations
We believe our balances of cash and cash equivalents of $9.25$6.98 billion and available-for-sale debt securities and bank time deposits of $964 million$3.85 billion as of December 31, 2021,2023, along with cash generated by ongoing operations and continued access to debt markets, will be sufficient to satisfy our cash requirements over the next 12 months and beyond.
We have committed cash outflowoutflows related to postretirement benefit obligations, long-term debt and operating lease agreements. See Notes 12, 14 and 20, respectively, of Part II, Item 8 “Financial Statements and Supplementary Data” for additional information.
We have short-term obligations related to the purchase of goods and services made in the ordinary course of business. These consistconsist of invoices received and recorded as liabilities as of December 31, 2021,2023, but scheduled for payment in 20222024 of $8.15$7.91 billion. In addition, we have contractual obligations for material and services on order at December 31, 2021,2023, but not yet invoiced or delivered, of $7.28$7.22 billion.
We also have long-term contractual obligations primarily for logistics services agreements; systems support, software licenses and development contracts; information technology consulting contracts and outsourcing contracts for benefit plan administration. These obligations total $1.16$1.49 billion, with $550$704 million due in the next 12 months.
Machinery, Energy & Transportation
Net cash provided by operating activities was $7.18$11.69 billion in 2021,2023, compared with $4.05$6.36 billion in 2020.2022. The increase was primarily due to higher profit in 2021before taxes adjusted for non-cash items which included higher accruals for short-term incentive compensation. In addition,and lower payments for short-term incentive compensation favorably impacted cash flow. Partially offsetting these items were increased working capital requirements. Within working capital, changes in inventoryinventories and accounts receivable unfavorablyaccrued expenses favorably impacted cash flow but were partially offset by favorable changes in accounts payable and accrued expenses.customer advances.
Net cash used for investing activities in 20212023 was $1.23$3.92 billion, compared with net cash used of $1.34$1.81 billion in 2020.2022. The change was primarily due to increased activity related to intercompany lending with Financial Products, mostly offset by increased investments in securities. During 2021, we invested $1.19 billion in bank time deposits with varying maturity dates within one year and receivedsecurities, net of proceeds from time deposits that maturedmaturities and sale of $225 million. We also acquired the Oil & Gas division of the Weir Group PLC for $359 million, net of cash acquiredsecurities, and an increase in February 2021.capital spend.
Net cash used for financing activities during 20212023 was $6.30$7.65 billion, compared with net cash used of $1.18$6.80 billion in 2020.2022. The change was primarily due to the repayment of debthigher share repurchases and lower proceeds from the issuance of debt. In addition, we repurchased $2.67 billion of Caterpillar common stockdividends paid in 2021 compared to $1.13 billion in 2020.2023.
While our short-term priorities for the use of cash may vary from time to time as business needs and conditions dictate, our long-term cash deployment strategy is focused on the following priorities. Our top priority is to maintain a strong financial position in support of a Mid-Amid-A rating. Next, we intend to fund operational requirements and commitments. Then, we intend to fund priorities that profitably grow the company and return capital to shareholders through dividend growth and share repurchases. Additional information on cash deployment is as follows:
Strong financial position — Our top priority is to maintain a strong financial position in support of a mid-A rating. We track a diverse group of financial metrics that focus on liquidity, leverage, cash flow and margins which align with our cash deployment actions and the various methodologies used by the major credit rating agencies.
Operational excellence and commitments — Capital expenditures were $1.13$1.66 billion during 2021,2023, compared to $994 million$1.30 billion in 2020.2022. We expect ME&T’s capital expenditures in 20222024 to be around $1.4$2.0 billion to $2.5 billion. We made $340$361 million of contributions to our pension and OPEB plans during 2021. By2023. In comparison, we made $262 million of contributions to our OPEB plans in 2020. We expect to make approximately $357$346 million of contributions to our pension and OPEB plans in 2022. We expect to make approximately $273 million of contributions to our pension and OPEB plans in 2024.
Fund strategic growth initiatives and return capital to shareholders — We intend to utilize our liquidity and debt capacity to fund targeted investments that drive long-term profitable growth focused in the areas of expanded offerings, services and services,sustainability, including acquisitions.
As part of our capital allocation strategy, ME&T free cash flow is a liquidity measure we use to determine the cash generated and available for financing activities including debt repayments, dividends and share repurchases. We define ME&T free cash flow as cash from ME&T operations less capital expenditures, excluding discretionary pension and other postretirement benefit plan contributions less capital expenditures.and cash payments related to settlements with the U.S. Internal Revenue Service. A goal of our capital allocation strategy is to return substantially all ME&T free cash flow to shareholders over time in the form of dividends and share repurchases, while maintaining our mid-A rating.
Our share repurchase plans are subject to the company’s cash deployment priorities and are evaluated on an ongoing basis considering the financial condition of the company, and the economic outlook, corporate cash flow, the company's liquidity needs, the economic outlook, and the health and stability of global credit markets. The timing and amount of future repurchases may vary depending on market conditions and investing priorities. In July 2018,May 2022, the Board of Directors approved ana new share repurchase authorization to repurchase(the 2022 Authorization) of up to $10$15.0 billion of Caterpillar common stock (the 2018 Authorization) effective JanuaryAugust 1, 2019,2022 with no expiration. In 2021,2023, we repurchased $2.67$4.98 billion of Caterpillar common stock, with $2.10$7.8 billion remaining under the 20182022 Authorization as of December 31, 2021.2023. Caterpillar's basic shares outstanding as of December 31, 20212023 were approximately 536499 million.
Each quarter, our Board of Directors reviews the company's dividend for the applicable quarter. The Board evaluates the financial condition of the company and considers the economic outlook, corporate cash flow, the company's liquidity needs, the economic outlook, and the health and stability of global credit markets to determine whether to maintain or change the quarterly dividend. In December 2021,2023, the Board of Directors approved maintaining our quarterly dividend representing $1.11$1.30 per share, and we continue to expect our strong financial position to support the dividend. Dividends paid totaled $2.33$2.56 billion in 2021.2023.
Financial Products
Financial Products operating cash flow was $1.42$1.11 billion in 2021,2023, compared with $1.27$1.52 billion in 2020.2022. Net cash used for investing activities was $1.40$1.42 billion in 2021,2023, compared with net cash provided by investing activities of $791$356 million used in 2020.2022. The change was primarily due to portfolio related activity. Net cash provided by financing activities was $257$278 million in 2021,2023, compared with net cash used of $2.50 billion$964 million in 2020.2022. The change was primarily due to higher portfolio funding requirements.
Off-balance sheet arrangements
We are a party to certain off-balance sheet arrangements, primarily in the form of guarantees. Information related to guarantees appears in Note 21 –— “Guarantees and product warranty” of Part II, Item 8 “Financial Statements and Supplementary Data.”
RECENT ACCOUNTING PRONOUNCEMENTS
For a discussion of recent accounting pronouncements, see Note 1J — “New accounting guidance” of Part II, Item 8 “Financial Statements and Supplementary Data.”
CRITICAL ACCOUNTING ESTIMATES
The preparation of financial statements in conformity with generally accepted accounting principles requires management to make estimates and assumptions that affect reported amounts. The more significant estimates include: residual values for leased assets, fair values for goodwill impairment tests, warranty liability, reserves for product liability and insurance losses, postretirement benefits, post-sale discounts, credit losses and income taxes. We have incorporated many years of data into the determination of each of these estimates and we have not historically experienced significant adjustments. We review these assumptions at least annually with the Audit Committee of the Board of Directors. Following are the methods and assumptions used in determining our estimates and an indication of the risks inherent in each.
Residual values for leased assets –— We determine the residual value of Cat Financial’s leased equipment based on its estimated end-of-term market value. We estimate the residual value of leased equipment at the inception of the lease based on a number of factors, including historical wholesale market sales prices, past remarketing experience and any known significant market/product trends. We also consider the following critical factors in our residual value estimates: lease term, market size and demand, total expected hours of usage, machine configuration, application, location, model changes, quantities, third-party residual guarantees and contractual customer purchase options.
Upon termination of the lease, the equipment is either purchased by the lessee or sold to a third party,third-party, in which case we may record a gain or a loss for the difference between the estimated residual value and the sale price.proceeds.
During the term of our leases, we monitor residual values. For operating leases, we record adjustments to depreciation expense reflecting changes in residual value estimates prospectively on a straight-line basis. For finance leases, we recognize residual value adjustments through a reduction of finance revenue over the remaining lease term.
We evaluate the carrying value of equipment on operating leases for potential impairment when we determine a triggering event has occurred. When a triggering event occurs, we perform a test for recoverability by comparing projected undiscounted future cash flows to the carrying value of the equipment on operating leases. If the test for recoverability identifies a possible impairment, we measure the fair value of the equipment on operating leases in accordance with the fair value measurement framework. We recognize an impairment charge for the amount by which the carrying value of the equipment on operating leases exceeds its estimated fair value.
At December 31, 2021,2023, the aggregate residual value of equipment on operating leases was $1.87$1.70 billion. Without consideration of other factors such as third-party residual guarantees or contractual customer purchase options, a 10 percent non-temporary decrease in the market value of our equipment subject to operating leases would reduce residual value estimates and result in the recognition of approximately $85$75 million of additional annual depreciation expense.
Fair values for goodwill impairment tests —– We test goodwill for impairment annually, at the reporting unit level, and whenever events or circumstances make it more likely than not that an impairment may have occurred, such as a significant adverse change in the business climate or a decision to sell all or a portion of a reporting unit. We perform our annual goodwill impairment test as of October 1 and monitor for interim triggering events on an ongoing basis.
We review goodwill for impairment utilizing either a qualitative assessment or a quantitative goodwill impairment test. If we choose to perform a qualitative assessment and determine the fair value more likely than not exceeds the carrying value, no further evaluation is necessary. For reporting units where we perform the quantitative goodwill impairment test, we compare the fair value of each reporting unit, which we primarily determine using an income approach based on the present value of discounted cash flows, to the respective carrying value, which includes goodwill. If the fair value of the reporting unit exceeds its carrying value, we do not consider the goodwill impaired. If the carrying value is higher than the fair value, we recognize the difference as an impairment loss.
For reporting units where we perform a quantitative goodwill impairment test, the process requires valuation of the respective reporting unit, which we primarily determine using an income approach based on a discounted five year forecasted cash flow with a year-five residual value.We compute the residual value using the constant growth method, which values the forecasted cash flows in perpetuity.The assumptions about future cash flows and growth rates are based on each reporting unit's long-term forecast and are subject to review and approval by senior management.A reporting unit’s discount rate is a risk-adjusted weighted average cost of capital, which we believe approximates the rate from a market participant’s perspective.The estimated fair value could be impacted by changes in market conditions, interest rates, growth rates, tax rates, costs, pricing and capital expenditures.We categorize the fair value determination as Level 3 in the fair value hierarchy due to its use of internal projections and unobservable measurement inputs.
We completed our annual assessment of goodwill in the fourth quarter of 20212023 and determined that there was no impairment of goodwill. Caterpillar’sCaterpillar's market capitalization has remained significantly above the net book value of the Company.
An unfavorable change in our expectations for the financial performance of our reporting units, particularly long-term growth and profitability, would reduce the fair value of our reporting units. The demand for our equipment and related parts is highly cyclical and significantly impacted by commodity prices, although the impact may vary by reporting unit. The energy and mining industries are major users of our products, including the mineral extraction, oil and natural gas industries. Decisions to purchase our products are dependent upon the performance of those industries, which in turn are dependent in part on commodity prices. Lower commodity prices or industry specific circumstances that have a negative impact to the valuation assumptions may reduce the fair value of our reporting units. Should such events occur and it becomes more likely than not that a reporting unit’s fair value has fallen below its carrying value, we will perform an interim goodwill impairment test(s), in addition to the annual impairment test. Future impairment tests may result in a goodwill impairment, depending on the outcome of the quantitative impairment test. We would report a goodwill impairment as a non-cash charge to earnings.
WarrantyProduct warranty liability –— At the time we recognize a sale, we record estimated future warranty costs. We determine the product warranty liability by applying historical claim rate experience to the current field population and dealer inventory. Generally, we base historical claim rates on actual warranty experience for each product by machine model/engine
size by customer or dealer location (inside or outside North America). We develop specific rates for each product shipment month and update them monthly based on actual warranty claim experience. Warranty costs may differ from those estimated if actual claim rates are higher or lower than our historical rates.
Product liability and insurance loss reserve –— We determine these reserves based upon reported claims in process of settlement and actuarial estimates for losses incurred but not reported. Loss reserves, including incurred but not reported reserves, are based on estimates and ultimate settlements may vary significantly from such estimates due to increased claims frequency or severity over historical levels. The amount of these reserves totaled $1.2$1.4 billion and $1.3 billion at both December 31, 20212023 and 2020.2022, respectively. The majority of the balance in both 20212023 and 20202022 consisted of unearned insurance premiums.
Postretirement benefits –— We sponsor defined benefit pension plans and/or other postretirement benefit plans (retirement healthcare and life insurance) to employees in many of our locations throughout the world. There are assumptions used in the accounting for these defined benefit plans that include discount rate, expected return on plan assets, expected rate of compensation increase, the future health care trend rate, mortality and other economic and demographic assumptions. The actuarial assumptions we use may change or differ significantly from actual results, which may result in a material impact to our consolidated financial statements.
The effects of actual results differing from our assumptions and the effects of changing assumptions are considered actuarial gains or losses. We utilize a mark-to-market approach in recognizing actuarial gains or losses immediately through earnings upon the annual remeasurement in the fourth quarter, or on an interim basis as triggering events warrant remeasurement.
Primary actuarial assumptions were determined as follows:
•We use the assumed discount rate to discount future benefit obligations back to today’s dollars. The U.S. discount rate is based on a benefit cash flow-matching approach and represents the rate at which our benefit obligations could effectively be settled as of our measurement date, December 31. The benefit cash flow-matching approach involves analyzing Caterpillar’s projected cash flows against a high quality bond yield curve, calculated using a wide population of corporate Aa bonds available on the measurement date. We use a similar approach to determine the assumed discount rate for our most significant non-U.S. plans. In estimating the service and interest cost components of net periodic benefit cost, we utilize a full yield curve approach in determining a discount rate. This approach applies the specific spot rates along the yield curve used in the determination of the benefit obligation to the relevant projected cash flows. Discount rates are sensitive to changes in interest rates. A decrease in the discount rate would increase our obligation and future expense.
•The expected long-term rate of return on plan assets is based on our estimate of long-term passive returns for equities and fixed income securities weighted by the allocation of our plan assets. Based on historical performance, we increase the passive returns due to our active management of the plan assets. This rate is impacted by changes in general market conditions, but because it represents a long-term rate, it is not significantly impacted by short-term market swings. Changes in our allocation of plan assets would also impact this rate. For example, a shift to more fixed income securities would lower the rate. A decrease in the rate would increase our expense. The expected return on plan assets is based on the fair value of plan assetsasset allocations as of our measurement date, December 31.
•We use the expected rate of compensation increase to develop benefit obligations using projected pay at retirement. It represents average long-term salary increases. This rate is influenced by our long-term compensation policies. An increase in the rate would increase our obligation and expense.
•The assumed health care trend rate represents the rate at which health care costs are assumed to increase and is based on historical and expected experience. Changes in our projections of future health care costs due to general economic conditions and those specific to health care (e.g., technology driven cost changes) will impact this trend rate. An increase in the trend rate would increase our obligation and expense.
•We use the mortality assumption to estimate the life expectancy of plan participants. An increase in the life expectancy of plan participants will result in an increase in our obligation and expense.
Postretirement Benefit Plan Actuarial Assumptions Sensitivity
The effects of a one percentage-point change in certain actuarial assumptions on 20212023 pension and OPEB costs and obligations are as follows:
| | | | | 2021 Benefit Cost Increase (Decrease) | | Year-end Benefit Obligation Increase (Decrease) | | | 2023 Benefit Cost Increase (Decrease) | | Year-end Benefit Obligation Increase (Decrease) |
| (Millions of dollars) | (Millions of dollars) | | One percentage-
point increase | | One percentage-
point decrease | | One percentage-
point increase | | One percentage-
point decrease | (Millions of dollars) | | One percentage-
point increase | | One percentage-
point decrease | | One percentage-
point increase | | One percentage-
point decrease |
U.S. Pension Benefits: 1 | U.S. Pension Benefits: 1 | | | | | | | | | U.S. Pension Benefits: 1 | | |
| Assumed discount rate | Assumed discount rate | | $ | 115 | | | $ | (149) | | | $ | (1,910) | | | $ | 2,329 | |
| | Expected long-term rate of return on plan assets | Expected long-term rate of return on plan assets | | (171) | | | 171 | | | — | | | — | |
| Expected long-term rate of return on plan assets | |
| Expected long-term rate of return on plan assets | |
| Non-U.S. Pension Benefits: | Non-U.S. Pension Benefits: | |
| Assumed discount rate | |
| Assumed discount rate | |
| Assumed discount rate | Assumed discount rate | | 22 | | | (30) | | | (591) | | | 756 | |
| Expected rate of compensation increase | Expected rate of compensation increase | | 5 | | | (4) | | | 39 | | | (32) | |
| Expected long-term rate of return on plan assets | Expected long-term rate of return on plan assets | | (44) | | | 44 | | | — | | | — | |
| Other Postretirement Benefits: | Other Postretirement Benefits: | | | | | | | | | Other Postretirement Benefits: | | |
| Assumed discount rate | Assumed discount rate | | 12 | | | (14) | | | (343) | | | 413 | |
| Expected rate of compensation increase | Expected rate of compensation increase | | — | | | — | | | 1 | | | (1) | |
| Expected long-term rate of return on plan assets | Expected long-term rate of return on plan assets | | (1) | | | 1 | | | — | | | — | |
| 1 Effective December 31, 2019, all U.S. pension benefits were frozen, and accordingly the expected rate of compensation increase assumption is no longer applicable. | 1 Effective December 31, 2019, all U.S. pension benefits were frozen, and accordingly the expected rate of compensation increase assumption is no longer applicable. | |
1 Effective December 31, 2019, all U.S. pension benefits were frozen, and accordingly the expected rate of compensation increase assumption is no longer applicable. | |
|
Actuarial Assumptions
| | | | | | | U.S. Pension Benefits | | Non-U.S. Pension Benefits | | Other Postretirement Benefits | | U.S. Pension Benefits | | Non-U.S. Pension Benefits | | Other Postretirement Benefits |
| | | | 2021 | | 2020 | | 2019 | | 2021 | | 2020 | | 2019 | | 2021 | | 2020 | | 2019 | | | 2023 | | 2022 | | 2021 | | 2023 | | 2022 | | 2021 | | 2023 | | 2022 | | 2021 |
| Weighted-average assumptions used to determine benefit obligation, end of year: | Weighted-average assumptions used to determine benefit obligation, end of year: | | | | | | | | | | | | | | | | | | | Weighted-average assumptions used to determine benefit obligation, end of year: | | | | | | | | | | | | |
| Discount rate | Discount rate | | 2.8 | % | | 2.4 | % | | 3.2 | % | | 1.8 | % | | 1.4 | % | | 1.9 | % | | 2.7 | % | | 2.3 | % | | 3.2 | % | Discount rate | | 5.0 | % | | 5.4 | % | | 2.8 | % | | 3.9 | % | | 4.3 | % | | 1.8 | % | | 5.1 | % | | 5.4 | % | | 2.7 | % |
Rate of compensation increase 1 | Rate of compensation increase 1 | | — | % | | — | % | | — | % | | 2.0 | % | | 2.0 | % | | 2.0 | % | | 4.0 | % | | 4.0 | % | | 4.0 | % | Rate of compensation increase 1 | | — | % | | — | % | | — | % | | 2.3 | % | | 2.3 | % | | 2.0 | % | | 4.0 | % | | 4.0 | % | | 4.0 | % |
| | Weighted-average assumptions used to determine net periodic benefit cost: | Weighted-average assumptions used to determine net periodic benefit cost: | | | | | | | |
| Weighted-average assumptions used to determine net periodic benefit cost: | |
| Weighted-average assumptions used to determine net periodic benefit cost: | |
Discount rate used to measure service cost 1 | |
Discount rate used to measure service cost 1 | |
Discount rate used to measure service cost 1 | Discount rate used to measure service cost 1 | | — | % | | — | % | | 4.3 | % | | 1.4 | % | | 1.5 | % | | 2.5 | % | | 2.5 | % | | 3.2 | % | | 4.1 | % | | — | % | | — | % | | — | % | | 3.8 | % | | 1.7 | % | | 1.4 | % | | 5.4 | % | | 2.8 | % | | 2.5 | % |
| Discount rate used to measure interest cost | Discount rate used to measure interest cost | | 1.8 | % | | 2.8 | % | | 3.9 | % | | 1.2 | % | | 1.7 | % | | 2.3 | % | | 1.6 | % | | 2.8 | % | | 3.9 | % | Discount rate used to measure interest cost | | 5.2 | % | | 2.3 | % | | 1.8 | % | | 4.2 | % | | 1.7 | % | | 1.2 | % | | 5.3 | % | | 2.2 | % | | 1.6 | % |
| Expected rate of return on plan assets | Expected rate of return on plan assets | | 4.2 | % | | 5.1 | % | | 5.9 | % | | 2.9 | % | | 3.3 | % | | 3.8 | % | | 6.5 | % | | 7.0 | % | | 7.2 | % | Expected rate of return on plan assets | | 5.8 | % | | 4.0 | % | | 4.2 | % | | 5.2 | % | | 3.1 | % | | 2.9 | % | | 7.4 | % | | 6.9 | % | | 6.5 | % |
Rate of compensation increase 1 | Rate of compensation increase 1 | | — | % | | — | % | | 4.0 | % | | 2.0 | % | | 2.0 | % | | 3.0 | % | | 4.0 | % | | 4.0 | % | | 4.1 | % | Rate of compensation increase 1 | | — | % | | — | % | | — | % | | 2.3 | % | | 2.0 | % | | 2.0 | % | | 4.0 | % | | 4.0 | % | | 4.0 | % |
| | Health care cost trend rates at year-end: | Health care cost trend rates at year-end: | | | | | | | | | | | | | | | |
| Health care cost trend rates at year-end: | |
| Health care cost trend rates at year-end: | |
| Health care trend rate assumed for next year | |
| Health care trend rate assumed for next year | |
| Health care trend rate assumed for next year | Health care trend rate assumed for next year | | 5.6 | % | | 5.8 | % | | 6.1 | % | | 6.2 | % | | 6.5 | % | | 5.6 | % |
| Rate that the cost trend rate gradually declines to | Rate that the cost trend rate gradually declines to | | 5.0 | % | | 5.0 | % | | 5.0 | % | Rate that the cost trend rate gradually declines to | | 4.7 | % | | 4.7 | % | | 5.0 | % |
| Year that the cost trend rate reaches ultimate rate | Year that the cost trend rate reaches ultimate rate | | 2025 | | 2025 | | 2025 | Year that the cost trend rate reaches ultimate rate | | 2030 | | 2030 | | 2025 |
| 1 Effective December 31, 2019, all U.S. pension benefits were frozen, and accordingly this assumption is no longer applicable. | 1 Effective December 31, 2019, all U.S. pension benefits were frozen, and accordingly this assumption is no longer applicable. | |
1 Effective December 31, 2019, all U.S. pension benefits were frozen, and accordingly this assumption is no longer applicable. | |
|
See Note 12 -— “Postemployment benefit plans” of Part II, Item 8 “Financial Statement and Supplemental Data” for further information regarding the accounting for postretirement benefits.
Post-sale discount reserve –— We provide discounts to dealers through merchandising programs. We have numerous programs that are designed to promote the sale of our products. The most common dealer programs provide a discount when the dealer sells a product to a targeted end user. The amount of accrued post-sale discounts was $1.4$2.1 billion and $1.6 billion at both December 31, 20212023 and 2020.2022, respectively. The reserve represents discounts that we expect to pay on previously sold units and is reviewed at least quarterly. We adjust the reserve if discounts paid differ from those estimated. Historically, those adjustments have not been material.
Allowance for credit losses -— The allowance for credit losses is management’s estimate of expected losses over the life of our finance receivable portfolio calculated using loss forecast models that take into consideration historical credit loss experience, current economic conditions and forecasts and scenarios that capture country and industry-specific economic factors. In addition, we consider qualitative factors not able to be fully captured in our loss forecast models, including borrower-specific and company-specific factors. These qualitative factors are subjective and require a degree of management judgment.
We measure the allowance for credit losses on a collective (pool) basis when similar risk characteristics exist and on an individual basis when we determine that similar risk characteristics do not exist. We identify finance receivables for individual evaluation based on past-duepast due status and information available about the customer, such as financial statements, news reports and published credit ratings, as well as general information regarding industry trends and the economic environment in which our customers operate. The allowance for credit losses attributable to finance receivables that are individually evaluated is based on the present value of expected future cash flows discounted at the receivables' effective interest rate, the fair value of the collateral for collateral-dependent receivables or the observable market price of the receivable. In determining collateral value, we estimate the current fair market value of the collateral less selling costs. We also consider credit enhancements such as additional collateral and contractual third-party guarantees.
While management believes it has exercised prudent judgment and applied reasonable assumptions, there can be no assurance that in the future, changes in economic conditions or other factors would not cause changes in the financial health of our customers. If the financial health of our customers deteriorates, the timing and level of payments received could be impacted and therefore, could result in a change to our estimated losses.
Income taxes –— We are subject to the income tax laws of the many jurisdictions in which we operate. These tax laws are complex, and the manner in which they apply to our facts is sometimes open to interpretation. In establishing the provision for income taxes, we must make judgments about the application of these inherently complex tax laws. Our income tax positions and analysis are based on currently enacted tax law. Future changes in tax law or related interpretations could significantly impact the provision for income taxes, the amount of taxes payable, and the deferred tax asset and liability balances. Changes in tax law are reflected in the period of enactment with related interpretations considered in the period received.
Despite our belief that our tax return positions are consistent with applicable tax laws, we believe that taxing authorities could challenge certain positions. Settlement of any challenge can result in no change, a complete disallowance, or some partial adjustment reached through negotiations or litigation. We record tax benefits for uncertain tax positions based upon management’s evaluation of the information available at the reporting date. To be recognized in the financial statements, a tax benefit must be at least more likely than not of being sustained based on technical merits. The benefit for positions meeting the recognition threshold is measured as the largest benefit more likely than not of being realized upon ultimate settlement with a taxing authority that has full knowledge of all relevant information. Significant judgment is required in making these determinations and adjustments to unrecognized tax benefits may be necessary to reflect actual taxes payable upon settlement. Adjustments related to positions impacting the effective tax rate affect the provision for income taxes. Adjustments related to positions impacting the timing of deductions impact deferred tax assets and liabilities. For tax years 2007 to 2012 including the impact of a loss carryback to 2005, the IRS has proposed to tax in the United States profits earned from certain parts transactions by Caterpillar SARL (CSARL), based on the IRS examination team’s application of “substance-over-form” or “assignment-of-income” judicial doctrines. CSARL is primarily taxable locally in Switzerland. We are vigorously contesting the proposed increases to tax and penalties for these years of approximately $2.3 billion. We believe that the relevant transactions complied with applicable tax laws and did not violate judicial doctrines. The purchase of parts by CSARL from unrelated parties and the subsequent sale of those parts to unrelated dealers outside the United States have substantial legal, commercial, and economic consequences for the parties involved. Therefore, we have concluded that the largest amount of benefit that is more likely than not to be sustained related to this position is the entire benefit. As a result, no amount related to these IRS adjustments is reflected in unrecognized tax benefits. We have filed U.S. income tax returns on this same basis for years after 2012. We currently believe the ultimate disposition of this matter will not have a material adverse effect on our consolidated financial position, liquidity or results of operations.
Deferred tax assets generally represent tax benefits for tax deductions or credits available in future tax returns. Certain estimates and assumptions are required to determine whether it is more likely than not that all or some portion of the benefit of a deferred tax asset will not be realized. In making this assessment, management analyzes the trend of U.S. GAAP earnings and estimates the impact of future taxable income, reversing temporary differences and available prudent and feasible tax planning strategies. We give less weight in this analysis to mark-to-market adjustments to remeasure our pension and OPEB plans as we do not consider these adjustments indicative of ongoing earnings trends. Should a change in facts or circumstances lead to a change in judgment about the ultimate realizability of a deferred tax asset, we record or adjust the related valuation allowance in the period that the change in facts and circumstances occurs, along with a corresponding increase or decrease in the provision for income taxes.
Additional information related to income taxes is included in Note 6 -— “Income taxes” of Part II, Item 8 “Financial statements and Supplementary Data.”
OTHER MATTERS
Information related to legal proceedings appears in Note 22—22 — Environmental and Legal Matters of Part II, Item 8 “Financial Statements and Supplementary Data.”
RETIREMENT BENEFITS
We recognize mark-to-market gains and losses immediately through earnings upon the remeasurement of our pension and OPEB plans. Mark-to-market gains and losses represent the effects of actual results differing from our assumptions and the effects of changing assumptions. Changes in discount rates and differences between the actual return on plan assets and the expected return on plan assets generally have the largest impact on mark-to-market gains and losses.
The table below summarizes the amounts of net periodic benefit cost recognized for 2021, 20202023, 2022 and 2019,2021, respectively, and includes expected cost for 2022.2024.
| | | | (Millions of dollars) | |
| | (Millions of dollars) | |
| | | | (Millions of dollars) | (Millions of dollars) | | 2022 Expected | | 2021 | | 2020 | | 2019 | | 2024 Expected | | 2023 | | 2022 | | 2021 |
| U.S. Pension Benefits | U.S. Pension Benefits | | $ | (269) | | | $ | (388) | | | $ | (309) | | | $ | (7) | |
| Non-U.S. Pension Benefits | Non-U.S. Pension Benefits | | (13) | | | (19) | | | 18 | | | 19 | |
| Other Postretirement Benefits | Other Postretirement Benefits | | 161 | | | 118 | | | 147 | | | 158 | |
| Mark-to-market loss (gain) | Mark-to-market loss (gain) | | — | | 1 | (833) | | | 383 | | | 468 | |
| | Total net periodic benefit cost (benefit) | Total net periodic benefit cost (benefit) | | $ | (121) | | | $ | (1,122) | | | $ | 239 | | | $ | 638 | |
| Total net periodic benefit cost (benefit) | |
| Total net periodic benefit cost (benefit) | |
| | | |
1 Expected net periodic benefit cost (benefit) does not include an estimate for mark-to-market gains or losses.
•Expected increasedecrease in expense in 20222024 compared to 20212023 -— Excluding the impact of mark-to-market gains and losses, our net periodic benefit cost is expected to increase $168decrease $56 million in 2022. The2024. This expected increasedecrease is primarily due to changeslower interest cost in assumptions causing2024 as a result of lower discount rates at year-end 2023 (U.S. pension plans discount rate for 2024 interest cost is 5.0 percent compared to 5.2 percent for 2023) and a higher expected return on assets due to a higher world-wide asset base at year-end 2023 ($16.3 billion) compared to year-end 2022 ($15.8 billion).
•Increase in expense in 2023 compared to 2022 — Primarily due to lower mark-to-market gains in 2023 compared to 2022 and higher interest cost in 2023 as a result of higher discount rates at year-end 2022.
•Increase in expense in 2022 compared to 2021 — Primarily due to lower mark-to-market gains in 2022 compared to 2021 and higher interest cost in 2022 as a result of higher discount rates at year-end 2021 (U.S. pension plans discount rate for 2022 interest cost is 2.3% compared to 1.8% for 2021) and lower expected return on plan assets in 2022 (U.S. pension plans expected return on plans assets is 4.0 percent for 2022 compared to 4.2 percent in 2021).
•Decrease in expense in 2021 compared to 2020 - Primarily due to mark-to-market gains in 2021 compared to mark-to-market losses in 2020 and lower interest cost in 2021 as a result of lower discount rates at year-end 2020.
•Decrease in expense in 2020 compared to 2019 - Primarily due to lower interest cost in 2020 as a result of lower discount rates at year-end 2019, the elimination of service cost for our U.S. pension plans freezing benefit accruals and lower mark-to-market losses in 2020 compared to 2019.2021.
The primary factors that resulted in mark-to-market losses (gains) for 2021, 20202023, 2022 and 20192021 are described below. We include the net mark-to-market losses (gains) in Other income (expense) in the Results of Operations.
51•2023 net mark-to-market gain of $97 million — Primarily due to higher actual return on plan assets compared to the expected return on plan assets (U.S. pension plans had an actual rate of return of 10.4 percent compared to an expected rate of return of 5.8 percent) and favorable claims experience related to our other postretirement benefit plans. This was partially offset by lower discount rates at the end of 2023 compared to the end of 2022.
Table•2022 net mark-to-market gain of Contents$606 million•2021 net mark-to-market gain of $833 million -— Primarily due to higher discount rates at the end of 2021 compared to the end of 2020. This was partially offset by various assumption changes and a lower actual return on plan assets compared to the expected return on plan assets (U.S. pension plans had an actual rate of return of 3.6 percent compared to an expected rate of return of 4.2 percent).
•2020 net mark-to-market loss of $383 million - Primarily due to lower discount rates at the end of 2020 compared to the end of 2019. This was partially offset by a higher actual return on plan assets compared to the expected return on plan assets (U.S. pension plans had an actual rate of return of 16.7 percent compared to an expected rate of return of 5.1 percent).
•2019 net mark-to-market loss of $468 million - Primarily due to lower discount rates at the end of 2019 compared to the end of 2018. This was partially offset by a higher actual return on plan assets compared to the expected return on plan assets (U.S. pension plans had an actual rate of return of 22.3 percent compared to an expected rate of return of 5.9 percent).
SENSITIVITY
Foreign Exchange Rate Sensitivity
ME&T operations use foreign currency forward and option contracts to manage unmatched foreign currency cash inflow and outflow. Our objective is to minimize the risk of exchange rate movements that would reduce the U.S. dollar value of our foreign currency cash flow. Our policy allows for managing anticipated foreign currency cash flow for up to approximately five years. Based on the anticipated and firmly committed cash inflow and outflow for our ME&T operations for the next 12 months and the foreign currency derivative instruments in place at year-end, a hypothetical 10 percent weakening of the U.S. dollar relative to all other currencies would adversely affect our expected 20222024 cash flow for our ME&T operations by approximately $89$200 million. Last year similar assumptions and calculations yielded a potential $126$98 million adverse impact on 20212023 cash flow. We determine our net exposures by calculating the difference in cash inflow and outflow by currency and adding or subtracting outstanding foreign currency derivative instruments. We multiply these net amounts by 10 percent to determine the sensitivity.
In managing foreign currency risk for our Financial Products operations, our objective is to minimize earnings volatility resulting from conversion and the remeasurement of net foreign currency balance sheet positions and future transactions denominated in foreign currencies. Since our policy allows the use of foreign currency forward, option and cross currency contracts to offset the risk of currency mismatch between our assets and liabilities and exchange rate risk associated with future transactions denominated in foreign currencies, a 10 percent change in the value of the U.S. dollar relative to all other currencies would not have a material effect on our consolidated financial position, results of operations or cash flow. Neither our policy nor the effect of a 10 percent change in the value of the U.S. dollar has changed from that reported at the end of last year.
The effect of the hypothetical change in exchange rates ignores the effect this movement may have on other variables, including competitive risk. If it were possible to quantify this competitive impact, the results would probably be different from the sensitivity effects shown above. In addition, it is unlikely that all currencies would uniformly strengthen or weaken relative to the U.S. dollar. In reality, some currencies may weaken while others may strengthen. Our primary exposure (excluding competitive risk) is to exchange rate movements in the Chinese yuan, Australian dollar, Chinese yuan, Euro, Japanese yenBritish pound and Swiss franc.Mexican peso.
Interest Rate Sensitivity
For our ME&T operations, we have the option to use interest rate contracts to lower the cost of borrowed funds by attaching fixed-to-floating interest rate contracts to fixed-rate debt, and by entering into forward rate agreements on future debt issuances. A hypothetical 100 basis point adverse move in interest rates along the entire interest rate yield curve would have a minimal impact to the 20222024 pre-tax earnings of ME&T. Last year, similar assumptions and calculations yielded a minimal impact to 20212023 pre-tax earnings.
For our Financial Products operations, we use interest rate derivative instruments primarily to meet our match-funding objectives and strategies. We have a match-funding policy that addresses the interest rate risk by aligning the interest rate profile (fixed or floating rate and duration) of our debt portfolio with the interest rate profile of our finance receivable portfolio within a predetermined range on an ongoing basis. In connection with that policy, we use interest rate derivative instruments to modify the debt structure to match assets within the finance receivable portfolio. Match funding reduces the volatility of margins between interest-bearing assets and interest-bearing liabilities, regardless of which direction interest rates move.
In order to properly manage sensitivity to changes in interest rates, Financial Products measures the potential impact of different interest rate assumptions on pre-tax earnings. All on-balance sheet positions, including derivative financial instruments, are included in the analysis. The primary assumptions included in the analysis are that there are no new fixed rate assets or liabilities, the proportion of fixed rate debt to fixed rate assets remains unchanged and the level of floating rate assets and debt remain constant. An analysis of the December 31, 20212023 balance sheet, using these assumptions, estimates the impact of a 100 basis point immediate and sustained adverse change in interest rates to have a minimal impact on 20222024 pre-tax earnings. Last year, similar assumptions and calculations yielded a minimal impact to 20212023 pre-tax earnings.
This analysis does not necessarily represent our current outlook of future market interest rate movement, nor does it consider any actions management could undertake in response to changes in interest rates. Accordingly, no assurance can be given that actual results would be consistent with the results of our estimate.
NON-GAAP FINANCIAL MEASURES
We provide the following definitions for the non-GAAP financial measures used in this report. These non-GAAP financial measures have no standardized meaning prescribed by U.S. GAAP and therefore are unlikely to be comparable to the calculation of similar measures for other companies. Management does not intend these items to be considered in isolation or as a substitute for the related GAAP measures.
We believe it is important to separately quantify the profit impact of twofive significant items in order for our results to be meaningful to our readers. These items consist of (i) restructuring costs related to the divestiture of the company's Longwall business, (ii) other restructuring costs, (iii) pension and OPEB mark-to-market (gains) gains/losses resulting from plan remeasurements, (iv) certain deferred tax valuation allowance adjustments and (ii) restructuring (income) costs, which were incurred to generate longer-term benefits.(v) goodwill impairment in 2022. We do not consider these items indicative of earnings from ongoing business activities and believe the non-GAAP measures will provide investors with useful perspective on underlying business results and trends and aid with assessing our period-over-period results. In addition, we provide a calculation of ME&T free cash flow as we believe it is an important measure for investors to determine the cash generation available for financing activities including debt repayments, dividends and share repurchases.
Reconciliations of adjusted results to the most directly comparable GAAP measures are as follows:
| | | | | | | | | | | | | | | | | | | | | | | | | | | | | | | | | | | | | | | | | | | | |
| (Dollars in millions except per share data) | | Operating Profit | | Operating Profit Margin | | Profit Before Taxes | | Provision (Benefit) for Income Taxes | | Effective Tax Rate | | Profit | | Profit per Share |
| | | | | | | | | | | | | | |
| Three Months Ended December 31, 2021 - US GAAP | | $ | 1,611 | | | 11.7 | % | | $ | 2,562 | | | $ | 429 | | | 16.7 | % | | $ | 2,120 | | | $ | 3.91 | |
| Pension/OPEB mark-to-market (gains) losses | | — | | | — | % | | (833) | | | (190) | | | 22.8 | % | | (643) | | | $ | (1.19) | |
| Restructuring (income) costs | | (34) | | | (0.2) | % | | (34) | | | (15) | | | 44.1 | % | | (19) | | | $ | (0.03) | |
| Three Months Ended December 31, 2021 - Adjusted | | $ | 1,577 | | | 11.4 | % | | $ | 1,695 | | | $ | 224 | | | 13.2 | % | | $ | 1,458 | | | $ | 2.69 | |
| | | | | | | | | | | | | | |
| Three Months Ended December 31, 2020 - US GAAP | | $ | 1,380 | | | 12.3 | % | | $ | 941 | | | $ | 167 | | | 17.7 | % | | $ | 780 | | | $ | 1.42 | |
| Pension/OPEB mark-to-market (gains) losses | | — | | | — | % | | 438 | | | 92 | | | 21.0 | % | | 346 | | | $ | 0.63 | |
| Restructuring (income) costs | | 58 | | | 0.5 | % | | 58 | | | 18 | | | 31.0 | % | | 40 | | | $ | 0.07 | |
| Three Months Ended December 31, 2020 - Adjusted | | $ | 1,438 | | | 12.8 | % | | $ | 1,437 | | | $ | 277 | | | 19.3 | % | | $ | 1,166 | | | $ | 2.12 | |
| | | | | | | | | | | | | | |
| Twelve Months Ended December 31, 2021 - US GAAP | | $ | 6,878 | | | 13.5 | % | | $ | 8,204 | | | $ | 1,742 | | | 21.2 | % | | $ | 6,489 | | | $ | 11.83 | |
| Pension/OPEB mark-to-market (gains) losses | | — | | | — | % | | (833) | | | (190) | | | 22.8 | % | | (643) | | | $ | (1.17) | |
| Restructuring (income) costs | | 90 | | | 0.2 | % | | 90 | | | 4 | | | 4.4 | % | | 86 | | | $ | 0.15 | |
| Twelve Months Ended December 31, 2021 - Adjusted | | $ | 6,968 | | | 13.7 | % | | $ | 7,461 | | | $ | 1,556 | | | 20.9 | % | | $ | 5,932 | | | $ | 10.81 | |
| | | | | | | | | | | | | | |
| Twelve Months Ended December 31, 2020 - US GAAP | | $ | 4,553 | | | 10.9 | % | | $ | 3,995 | | | $ | 1,006 | | | 25.2 | % | | $ | 2,998 | | | $ | 5.46 | |
| Pension/OPEB mark-to-market (gains) losses | | — | | | — | % | | 383 | | | 82 | | | 21.4 | % | | 301 | | | $ | 0.55 | |
| Restructuring (income) costs | | 354 | | | 0.8 | % | | 354 | | | 53 | | | 15.0 | % | | 301 | | | $ | 0.55 | |
| Twelve Months Ended December 31, 2020 - Adjusted | | $ | 4,907 | | | 11.8 | % | | $ | 4,732 | | | $ | 1,141 | | | 24.1 | % | | $ | 3,600 | | | $ | 6.56 | |
| | | | | | | | | | | | | | |
| | | | | | | | | | | | | | |
| | | | | | | | | | | | | | | | | | | | | | | | | | | | | | | | | | | | | | | | | | | | |
| (Dollars in millions except per share data) | | Operating Profit | | Operating Profit Margin | | Profit Before Taxes | | Provision (Benefit) for Income Taxes | | Effective Tax Rate | | Profit | | Profit per Share |
| | | | | | | | | | | | | | |
| | | | | | | | | | | | | | |
| | | | | | | | | | | | | | |
| | | | | | | | | | | | | | |
| | | | | | | | | | | | | | |
| | | | | | | | | | | | | | |
| | | | | | | | | | | | | | |
| | | | | | | | | | | | | | |
| | | | | | | | | | | | | | |
| | | | | | | | | | | | | | |
| | | | | | | | | | | | | | |
| | | | | | | | | | | | | | |
| Twelve Months Ended December 31, 2023 - U.S. GAAP | | $ | 12,966 | | | 19.3 | % | | $ | 13,050 | | | $ | 2,781 | | | 21.3 | % | | $ | 10,335 | | | $ | 20.12 | |
| | | | | | | | | | | | | | |
| Restructuring costs - Longwall divestiture | | 586 | | | 0.9 | % | | 586 | | | — | | | — | % | | 586 | | | 1.14 | |
| Other restructuring costs | | 194 | | | 0.3 | % | | 194 | | | 48 | | | 25.0 | % | | 146 | | | 0.30 | |
| Pension/OPEB mark-to-market (gains) losses | | — | | | — | % | | (97) | | | (26) | | | 26.8 | % | | (71) | | | (0.14) | |
| Deferred tax valuation allowance adjustments | | — | | | — | % | | — | | | 106 | | | — | % | | (106) | | | (0.21) | |
| Twelve Months Ended December 31, 2023 - Adjusted | | $ | 13,746 | | | 20.5 | % | | $ | 13,733 | | | $ | 2,909 | | | 21.2 | % | | $ | 10,890 | | | $ | 21.21 | |
| | | | | | | | | | | | | | |
| Twelve Months Ended December 31, 2022 - U.S. GAAP | | $ | 7,904 | | | 13.3 | % | | $ | 8,752 | | | $ | 2,067 | | | 23.6 | % | | $ | 6,705 | | | $ | 12.64 | |
| Goodwill impairment | | 925 | | | 1.6 | % | | 925 | | | 36 | | | 3.9 | % | | 889 | | | 1.68 | |
| Restructuring costs | | 299 | | | 0.5 | % | | 299 | | | 72 | | | 24.0 | % | | 227 | | | 0.43 | |
| Pension/OPEB mark-to-market (gains) losses | | — | | | — | % | | (606) | | | (124) | | | 20.5 | % | | (482) | | | (0.91) | |
| Twelve Months Ended December 31, 2022 - Adjusted | | $ | 9,128 | | | 15.4 | % | | $ | 9,370 | | | $ | 2,051 | | | 21.9 | % | | $ | 7,339 | | | $ | 13.84 | |
| | | | | | | | | | | | | | |
| | | | | | | | | | | | | | |
Reconciliations of ME&T free cash flow to the most directly comparable GAAP measure, net cash provided by operating activities are as follows:
| | | Millions of dollars | Millions of dollars | | | Twelve Months Ended December 31, |
| | | | 2021 | | 2020 |
| Millions of dollars | |
| | Millions of dollars | | | | | Twelve Months Ended December 31, |
| | | | | | 2023 | | | | | | | | 2023 | | 2022 |
ME&T net cash provided by operating activities 1 | ME&T net cash provided by operating activities 1 | | | $ | 7,177 | | | $ | 4,054 | |
| ME&T discretionary pension contributions | | | — | | | — | |
| | ME&T capital expenditures | ME&T capital expenditures | | | (1,129) | | | (994) | |
| ME&T capital expenditures | |
| ME&T capital expenditures | |
| Cash payments related to settlements with the U.S. Internal Revenue Service | |
| ME&T free cash flow | ME&T free cash flow | | | $ | 6,048 | | | $ | 3,060 | |
1 See reconciliation of ME&T net cash provided by operating activities to consolidated net cash provided by operating activities on page 58. | 1 See reconciliation of ME&T net cash provided by operating activities to consolidated net cash provided by operating activities on page 51. | | 1 See reconciliation of ME&T net cash provided by operating activities to consolidated net cash provided by operating activities on page 51. |
|
Supplemental Consolidating Data
We are providing supplemental consolidating data for the purpose of additional analysis. We have grouped the data as follows:
Consolidated – Caterpillar Inc. and its subsidiaries.
Machinery, Energy & Transportation – We define ME&T as it is presented in the supplemental data as Caterpillar Inc. and its subsidiaries, excluding Financial Products. ME&T's information relates to the design, manufacturing and marketing of our products.
Financial Products – We define Financial Products as it is presented in the supplemental data as our finance and insurance subsidiaries, primarily Caterpillar Financial Services Corporation (Cat Financial) and Cat Insurance Holdings Inc. (Insurance Services). Financial Products’ information relates to the financing to customers and dealers for the purchase and lease of Caterpillar and other equipment.
Consolidating Adjustments – Eliminations of transactions between ME&T and Financial Products.
The nature of the ME&T and Financial Products businesses is different, especially with regard to the financial position and cash flow items. Caterpillar management utilizes this presentation internally to highlight these differences. We believe this presentation will assist readers in understanding our business.
Pages 5649 to 5851 reconcile ME&T and Financial Products to Caterpillar Inc. consolidated financial information. Certain amounts for prior periods have been reclassified to conform to current year presentation.
| | Supplemental Data for Results of Operations | Supplemental Data for Results of Operations | Supplemental Data for Results of Operations |
| For The Years Ended December 31 | |
| For The Years Ended December 31, | |
| | |
| | |
| | | | | | Supplemental consolidating data | | | | | Supplemental consolidating data | |
| | | | Consolidated | | Machinery,
Energy & Transportation | | Financial
Products | | Consolidating
Adjustments | | | | Consolidated | | Machinery,
Energy & Transportation | | Financial
Products | | Consolidating
Adjustments | |
| (Millions of dollars) | (Millions of dollars) | | 2021 | | 2020 | | 2019 | | 2021 | | 2020 | | 2019 | | 2021 | | 2020 | | 2019 | | 2021 | | 2020 | | 2019 | | (Millions of dollars) | | 2023 | | 2022 | | 2021 | | 2023 | | 2022 | | 2021 | | 2023 | | 2022 | | 2021 | | 2023 | | 2022 | | 2021 | |
| Sales and revenues: | Sales and revenues: | | | | | | | | | | | | | | | | | | | | | | | | | | Sales and revenues: | | | | | | | | | |
| Sales of Machinery, Energy & Transportation | Sales of Machinery, Energy & Transportation | | $ | 48,188 | | | $ | 39,022 | | | $ | 50,755 | | | $ | 48,188 | | | $ | 39,022 | | | $ | 50,755 | | | $ | — | | | $ | — | | | $ | — | | | $ | — | | | $ | — | | | $ | — | | | Sales of Machinery, Energy & Transportation | | $ | 63,869 | | | $ | | $ | 56,574 | | | $ | | $ | 48,188 | | | $ | | $ | 63,869 | | | $ | | $ | 56,574 | | | $ | | $ | 48,188 | | | $ | | $ | — | | | $ | | $ | — | | | $ | | $ | — | | | $ | | $ | — | | | | $ | — | | | $ | | $ | — | | | |
| Revenues of Financial Products | Revenues of Financial Products | | 2,783 | | | 2,726 | | | 3,045 | | | — | | | — | | | — | | | 3,172 | | | 3,110 | | | 3,571 | | | (389) | | 1 | (384) | | 1 | (526) | | 1 | Revenues of Financial Products | | 3,191 | | | 2,853 | | 2,853 | | | 2,783 | | 2,783 | | | — | | — | | | — | | — | | | — | | — | | | 3,927 | | 3,927 | | | 3,376 | | 3,376 | | | 3,172 | | 3,172 | | | (736) | | (736) | | 1 | 1 | (523) | | 1 | 1 | (389) | | 1 | 1 |
| Total sales and revenues | Total sales and revenues | | 50,971 | | | 41,748 | | | 53,800 | | | 48,188 | | | 39,022 | | | 50,755 | | | 3,172 | | | 3,110 | | | 3,571 | | | (389) | | | (384) | | | (526) | | |
| | Operating costs: | Operating costs: | | | | | | | | | | | | | | | | | | | | | | | | | |
| | Operating costs: | |
| | Operating costs: | | | | | | | | | | | | | | | | | | | | |
| Cost of goods sold | Cost of goods sold | | 35,513 | | | 29,082 | | | 36,630 | | | 35,521 | | | 29,088 | | | 36,634 | | | — | | | — | | | — | | | (8) | | 2 | (6) | | 2 | (4) | | 2 | Cost of goods sold | | 42,767 | | | 41,350 | | 41,350 | | | 35,513 | | 35,513 | | | 42,776 | | 42,776 | | | 41,356 | | 41,356 | | | 35,521 | | 35,521 | | | — | | — | | | — | | — | | | — | | — | | | (9) | | (9) | | 2 | 2 | (6) | | 2 | 2 | (8) | | 2 | 2 |
| Selling, general and administrative expenses | Selling, general and administrative expenses | | 5,365 | | | 4,642 | | | 5,162 | | | 4,724 | | | 3,915 | | | 4,444 | | | 654 | | | 746 | | | 737 | | | (13) | | 2 | (19) | | 2 | (19) | | 2 | Selling, general and administrative expenses | | 6,371 | | | 5,651 | | 5,651 | | | 5,365 | | 5,365 | | | 5,696 | | 5,696 | | | 4,999 | | 4,999 | | | 4,724 | | 4,724 | | | 704 | | 704 | | | 672 | | 672 | | | 654 | | 654 | | | (29) | | (29) | | 2 | 2 | (20) | | 2 | 2 | (13) | | 2 | 2 |
| Research and development expenses | Research and development expenses | | 1,686 | | | 1,415 | | | 1,693 | | | 1,686 | | | 1,415 | | | 1,693 | | | — | | | — | | | — | | | — | | | — | | | — | | | Research and development expenses | | 2,108 | | | 1,814 | | 1,814 | | | 1,686 | | 1,686 | | | 2,108 | | 2,108 | | | 1,814 | | 1,814 | | | 1,686 | | 1,686 | | | — | | — | | | — | | — | | | — | | — | | | — | | — | | | | — | | | — | | — | | | |
| Interest expense of Financial Products | Interest expense of Financial Products | | 455 | | | 589 | | | 754 | | | — | | | — | | | — | | | 455 | | | 591 | | | 786 | | | — | | | (2) | | 3 | (32) | | 3 |
| Goodwill impairment charge | |
| Goodwill impairment charge | |
| Goodwill impairment charge | |
| Other operating (income) expenses | |
| Other operating (income) expenses | |
| Other operating (income) expenses | Other operating (income) expenses | | 1,074 | | | 1,467 | | | 1,271 | | | (106) | | | 283 | | | 14 | | | 1,247 | | | 1,236 | | | 1,297 | | | (67) | | 2 | (52) | | 2 | (40) | | 2 | | 1,818 | | | 1,218 | | 1,218 | | | 1,074 | | 1,074 | | | 630 | | 630 | | | 47 | | 47 | | | (106) | | (106) | | | 1,268 | | 1,268 | | | 1,249 | | 1,249 | | | 1,247 | | 1,247 | | | (80) | | (80) | | 2 | 2 | (78) | | 2 | 2 | (67) | | 2 | 2 |
| Total operating costs | Total operating costs | | 44,093 | | | 37,195 | | | 45,510 | | | 41,825 | | | 34,701 | | | 42,785 | | | 2,356 | | | 2,573 | | | 2,820 | | | (88) | | | (79) | | | (95) | | |
| Operating profit | Operating profit | | 6,878 | | | 4,553 | | | 8,290 | | | 6,363 | | | 4,321 | | | 7,970 | | | 816 | | | 537 | | | 751 | | | (301) | | | (305) | | | (431) | | |
| Operating profit | |
| Operating profit | |
| Interest expense excluding Financial Products | |
| Interest expense excluding Financial Products | |
| Interest expense excluding Financial Products | Interest expense excluding Financial Products | | 488 | | | 514 | | | 421 | | | 488 | | | 513 | | | 429 | | | — | | | — | | | — | | | — | | | 1 | | 3 | (8) | | 3 |
| Other income (expense) | Other income (expense) | | 1,814 | | | (44) | | | (57) | | | 2,276 | | | (62) | | | (535) | | | 87 | | | 32 | | | 80 | | | (549) | | 4 | (14) | | 4 | 398 | | 4 |
| Other income (expense) | |
| Other income (expense) | | | 595 | | | 1,291 | | | 1,814 | | | 340 | | | 1,374 | | | 2,276 | | | (16) | | | (26) | | | 87 | | | 271 | | 4 | (57) | | 4 | (549) | | 4 |
| | Consolidated profit before taxes | |
| Consolidated profit before taxes | |
| Consolidated profit before taxes | Consolidated profit before taxes | | 8,204 | | | 3,995 | | | 7,812 | | | 8,151 | | | 3,746 | | | 7,006 | | | 903 | | | 569 | | | 831 | | | (850) | | | (320) | | | (25) | | | | 13,050 | | | 8,752 | | 8,752 | | | 8,204 | | 8,204 | | | 12,488 | | 12,488 | | | 8,363 | | 8,363 | | | 8,151 | | 8,151 | | | 907 | | 907 | | | 864 | | 864 | | | 903 | | 903 | | | (345) | | (345) | | | | (475) | | | | (850) | | | |
| Provision (benefit) for income taxes | Provision (benefit) for income taxes | | 1,742 | | | 1,006 | | | 1,746 | | | 1,517 | | | 853 | | | 1,512 | | | 225 | | | 153 | | | 234 | | | — | | | — | | | — | | | Provision (benefit) for income taxes | | 2,781 | | | 2,067 | | 2,067 | | | 1,742 | | 1,742 | | | 2,560 | | 2,560 | | | 1,858 | | 1,858 | | | 1,517 | | 1,517 | | | 221 | | 221 | | | 209 | | 209 | | | 225 | | 225 | | | — | | — | | | | — | | | | — | | | |
| Profit of consolidated companies | Profit of consolidated companies | | 6,462 | | | 2,989 | | | 6,066 | | | 6,634 | | | 2,893 | | | 5,494 | | | 678 | | | 416 | | | 597 | | | (850) | | | (320) | | | (25) | | | Profit of consolidated companies | | 10,269 | | | 6,685 | | 6,685 | | | 6,462 | | 6,462 | | | 9,928 | | 9,928 | | | 6,505 | | 6,505 | | | 6,634 | | 6,634 | | | 686 | | 686 | | | 655 | | 655 | | | 678 | | 678 | | | (345) | | (345) | | | | (475) | | | | (850) | | | |
| Equity in profit (loss) of unconsolidated affiliated companies | Equity in profit (loss) of unconsolidated affiliated companies | | 31 | | | 14 | | | 28 | | | 42 | | | 29 | | | 49 | | | — | | | — | | | — | | | (11) | | 5 | (15) | | 5 | (21) | | 5 | Equity in profit (loss) of unconsolidated affiliated companies | | 63 | | | 19 | | 19 | | | 31 | | 31 | | | 67 | | 67 | | | 26 | | 26 | | | 42 | | 42 | | | — | | — | | | — | | — | | | — | | — | | | (4) | | (4) | | 5 | 5 | (7) | | 5 | 5 | (11) | | 5 | 5 |
| | | Profit of consolidated and affiliated companies | Profit of consolidated and affiliated companies | | 6,493 | | | 3,003 | | | 6,094 | | | 6,676 | | | 2,922 | | | 5,543 | | | 678 | | | 416 | | | 597 | | | (861) | | | (335) | | | (46) | | |
| | Profit of consolidated and affiliated companies | |
| | Profit of consolidated and affiliated companies | |
| | Less: Profit (loss) attributable to noncontrolling interests | |
| | Less: Profit (loss) attributable to noncontrolling interests | |
| | Less: Profit (loss) attributable to noncontrolling interests | Less: Profit (loss) attributable to noncontrolling interests | | 4 | | | 5 | | | 1 | | | 3 | | | 5 | | | — | | | 12 | | | 15 | | | 22 | | | (11) | | 6 | (15) | | 6 | (21) | | 6 | | (3) | | | (1) | | (1) | | | 4 | | 4 | | | (4) | | (4) | | | (1) | | (1) | | | 3 | | 3 | | | 5 | | 5 | | | 7 | | 7 | | | 12 | | 12 | | | (4) | | (4) | | 6 | 6 | (7) | | 6 | 6 | (11) | | 6 | 6 |
| Profit 7 | Profit 7 | | $ | 6,489 | | | $ | 2,998 | | | $ | 6,093 | | | $ | 6,673 | | | $ | 2,917 | | | $ | 5,543 | | | $ | 666 | | | $ | 401 | | | $ | 575 | | | $ | (850) | | | $ | (320) | | | $ | (25) | | |
Profit 7 | |
Profit 7 | |
1Elimination of Financial Products' revenues earned from ME&T.
2Elimination of net expenses recorded bybetween ME&T paid toand Financial Products.
3Elimination of interest expense recorded between Financial Products and ME&T.
4Elimination of discount recorded by ME&T on receivables sold to Financial Products and of interest earned between ME&T and Financial Products as well as dividends paid by Financial Products to ME&T.
5Elimination of equity profit (loss) earned from Financial Products’ subsidiaries partially owned by ME&T subsidiaries.
6Elimination of noncontrolling interest profit (loss) recorded by Financial Products for subsidiaries partially owned by ME&T subsidiaries.
7Profit attributable to common shareholders.
| | Supplemental Data for Financial Position | Supplemental Data for Financial Position | |
| At December 31 | | Supplemental consolidating data | |
| At December 31, | |
| At December 31, | |
| At December 31, | |
| | |
| | |
| | | | Consolidated | | Machinery,
Energy & Transportation | | Financial
Products | | Consolidating
Adjustments | | | Consolidated | | Machinery,
Energy & Transportation | | Financial
Products | | Consolidating
Adjustments | |
| (Millions of dollars) | (Millions of dollars) | | 2021 | | 2020 | | 2021 | | 2020 | | 2021 | | 2020 | | 2021 | | 2020 | | (Millions of dollars) | | 2023 | | 2022 | | 2023 | | 2022 | | 2023 | | 2022 | | 2023 | | 2022 | |
| Assets | Assets | | | | | | | | | | | | | | | | | | Assets | | | | | |
| Current assets: | Current assets: | | | | | | | | | | | | | | | | | | Current assets: | | | | | |
| Cash and cash equivalents | Cash and cash equivalents | | $ | 9,254 | | | $ | 9,352 | | | $ | 8,428 | | | $ | 8,822 | | | $ | 826 | | | $ | 530 | | | $ | — | | | $ | — | | | Cash and cash equivalents | | $ | 6,978 | | | $ | | $ | 7,004 | | | $ | | $ | 6,106 | | | $ | | $ | 6,042 | | | $ | | $ | 872 | | | $ | | $ | 962 | | | $ | | $ | — | | | | $ | — | | | |
| Receivables - trade and other | Receivables - trade and other | | 8,477 | | | 7,317 | | | 3,279 | | | 3,846 | | | 435 | | | 397 | | | 4,763 | | 1,2 | 3,074 | | 1,2 | Receivables - trade and other | | 9,310 | | | 8,856 | | 8,856 | | | 3,971 | | 3,971 | | | 3,710 | | 3,710 | | | 570 | | 570 | | | 519 | | 519 | | | 4,769 | | 4,769 | | 1,2 | 1,2 | 4,627 | | 1,2 | 1,2 |
| Receivables - finance | Receivables - finance | | 8,898 | | | 9,463 | | | — | | | — | | | 13,828 | | | 13,681 | | | (4,930) | | 2 | (4,218) | | 2 | Receivables - finance | | 9,510 | | | 9,013 | | 9,013 | | | — | | — | | | — | | — | | | 14,499 | | 14,499 | | | 13,902 | | 13,902 | | | (4,989) | | (4,989) | | 2 | 2 | (4,889) | | 2 | 2 |
| | Prepaid expenses and other current assets | Prepaid expenses and other current assets | | 2,788 | | | 1,930 | | | 2,567 | | | 1,376 | | | 358 | | | 624 | | | (137) | | 3 | (70) | | 3 |
| Prepaid expenses and other current assets | |
| Prepaid expenses and other current assets | | | 4,586 | | | 2,642 | | | 4,327 | | | 2,488 | | | 341 | | | 290 | | | (82) | | 3 | (136) | | 3 |
| Inventories | Inventories | | 14,038 | | | 11,402 | | | 14,038 | | | 11,402 | | | — | | | — | | | — | | | — | | | Inventories | | 16,565 | | | 16,270 | | 16,270 | | | 16,565 | | 16,565 | | | 16,270 | | 16,270 | | | — | | — | | | — | | — | | | — | | — | | | | — | | | |
| Total current assets | Total current assets | | 43,455 | | | 39,464 | | | 28,312 | | | 25,446 | | | 15,447 | | | 15,232 | | | (304) | | | (1,214) | | |
| | Property, plant and equipment - net | |
| | Property, plant and equipment - net | |
| | Property, plant and equipment - net | Property, plant and equipment - net | | 12,090 | | | 12,401 | | | 8,172 | | | 8,309 | | | 3,918 | | | 4,092 | | | — | | | — | | | | 12,680 | | | 12,028 | | 12,028 | | | 8,694 | | 8,694 | | | 8,186 | | 8,186 | | | 3,986 | | 3,986 | | | 3,842 | | 3,842 | | | — | | — | | | | — | | | |
| Long-term receivables - trade and other | Long-term receivables - trade and other | | 1,204 | | | 1,185 | | | 375 | | | 363 | | | 204 | | | 164 | | | 625 | | 1,2 | 658 | | 1,2 | Long-term receivables - trade and other | | 1,238 | | | 1,265 | | 1,265 | | | 565 | | 565 | | | 418 | | 418 | | | 85 | | 85 | | | 339 | | 339 | | | 588 | | 588 | | 1,2 | 1,2 | 508 | | 1,2 | 1,2 |
| Long-term receivables - finance | Long-term receivables - finance | | 12,707 | | | 12,222 | | | — | | | — | | | 13,358 | | | 12,895 | | | (651) | | 2 | (673) | | 2 | Long-term receivables - finance | | 12,664 | | | 12,013 | | 12,013 | | | — | | — | | | — | | — | | | 13,299 | | 13,299 | | | 12,552 | | 12,552 | | | (635) | | (635) | | 2 | 2 | (539) | | 2 | 2 |
| | | Noncurrent deferred and refundable income taxes | |
| | Noncurrent deferred and refundable income taxes | |
| | Noncurrent deferred and refundable income taxes | Noncurrent deferred and refundable income taxes | | 1,840 | | | 1,523 | | | 2,396 | | | 2,058 | | | 105 | | | 110 | | | (661) | | 4 | (645) | | 4 | | 2,816 | | | 2,213 | | 2,213 | | | 3,360 | | 3,360 | | | 2,755 | | 2,755 | | | 148 | | 148 | | | 115 | | 115 | | | (692) | | (692) | | 4 | 4 | (657) | | 4 | 4 |
| Intangible assets | Intangible assets | | 1,042 | | | 1,308 | | | 1,042 | | | 1,308 | | | — | | | — | | | — | | | — | | | Intangible assets | | 564 | | | 758 | | 758 | | | 564 | | 564 | | | 758 | | 758 | | | — | | — | | | — | | — | | | — | | — | | | | — | | | |
| Goodwill | Goodwill | | 6,324 | | | 6,394 | | | 6,324 | | | 6,394 | | | — | | | — | | | — | | | — | | | Goodwill | | 5,308 | | | 5,288 | | 5,288 | | | 5,308 | | 5,308 | | | 5,288 | | 5,288 | | | — | | — | | | — | | — | | | — | | — | | | | — | | | |
| Other assets | Other assets | | 4,131 | | | 3,827 | | | 3,388 | | | 3,158 | | | 1,952 | | | 1,871 | | | (1,209) | | 5 | (1,202) | | 5 | Other assets | | 5,257 | | | 4,593 | | 4,593 | | | 4,218 | | 4,218 | | | 3,882 | | 3,882 | | | 2,082 | | 2,082 | | | 1,892 | | 1,892 | | | (1,043) | | (1,043) | | 5 | 5 | (1,181) | | 5 | 5 |
| Total assets | Total assets | | $ | 82,793 | | | $ | 78,324 | | | $ | 50,009 | | | $ | 47,036 | | | $ | 34,984 | | | $ | 34,364 | | | $ | (2,200) | | | $ | (3,076) | | |
| | Liabilities | Liabilities | | | | | | | | | | | | | | | | | |
| | Liabilities | |
| | Liabilities | | | | | | | | | | | | | | | | | | |
| Current liabilities: | Current liabilities: | | | | | | | | | | | | | | | | | | Current liabilities: | | | | | | | | | | | | | | | | | |
| Short-term borrowings | Short-term borrowings | | $ | 5,404 | | | $ | 2,015 | | | $ | 9 | | | $ | 10 | | | $ | 5,395 | | | $ | 2,005 | | | $ | — | | | $ | — | | |
| Short-term borrowings with consolidated companies | | — | | | — | | | — | | | — | | | — | | | 1,000 | | | — | | | (1,000) | | 6 |
| Accounts payable | |
| Accounts payable | |
| Accounts payable | Accounts payable | | 8,154 | | | 6,128 | | | 8,079 | | | 6,060 | | | 242 | | | 212 | | | (167) | | 7 | (144) | | 7 | | 7,906 | | | 8,689 | | 8,689 | | | 7,827 | | 7,827 | | | 8,657 | | 8,657 | | | 314 | | 314 | | | 294 | | 294 | | | (235) | | (235) | | 6,7 | 6,7 | (262) | | 6 | 6 |
| Accrued expenses | Accrued expenses | | 3,757 | | | 3,642 | | | 3,385 | | | 3,099 | | | 372 | | | 543 | | | — | | | — | | |
| Accrued wages, salaries and employee benefits | Accrued wages, salaries and employee benefits | | 2,242 | | | 1,096 | | | 2,186 | | | 1,081 | | | 56 | | | 15 | | | — | | | — | | |
| Accrued wages, salaries and employee benefits | |
| Accrued wages, salaries and employee benefits | | | 2,757 | | | 2,313 | | | 2,696 | | | 2,264 | | | 61 | | | 49 | | | — | | | — | | |
| Customer advances | Customer advances | | 1,087 | | | 1,108 | | | 1,086 | | | 1,108 | | | 1 | | | — | | | — | | | — | | |
| Dividends payable | |
| Dividends payable | |
| Dividends payable | Dividends payable | | 595 | | | 562 | | | 595 | | | 562 | | | — | | | — | | | — | | | — | | | | 649 | | | 620 | | 620 | | | 649 | | 649 | | | 620 | | 620 | | | — | | — | | | — | | — | | | — | | — | | | — | | — | | | |
| Other current liabilities | Other current liabilities | | 2,256 | | | 2,017 | | | 1,773 | | | 1,530 | | | 642 | | | 580 | | | (159) | | 4,8 | (93) | | 4,8 | Other current liabilities | | 3,123 | | | 2,690 | | 2,690 | | | 2,583 | | 2,583 | | | 2,215 | | 2,215 | | | 647 | | 647 | | | 635 | | 635 | | | (107) | | (107) | | 4,8 | 4,8 | (160) | | 4,8 | 4,8 |
| Long-term debt due within one year | Long-term debt due within one year | | 6,352 | | | 9,149 | | | 45 | | | 1,420 | | | 6,307 | | | 7,729 | | | — | | | — | | | Long-term debt due within one year | | 8,763 | | | 5,322 | | 5,322 | | | 1,044 | | 1,044 | | | 120 | | 120 | | | 7,719 | | 7,719 | | | 5,202 | | 5,202 | | | — | | — | | | — | | — | | | |
| Total current liabilities | Total current liabilities | | 29,847 | | | 25,717 | | | 17,158 | | | 14,870 | | | 13,015 | | | 12,084 | | | (326) | | | (1,237) | | |
| | Long-term debt due after one year | Long-term debt due after one year | | 26,033 | | | 25,999 | | | 9,772 | | | 9,764 | | | 16,287 | | | 16,250 | | | (26) | | 6 | (15) | | 6 |
| | Long-term debt due after one year | |
| | Long-term debt due after one year | | | 24,472 | | | 25,714 | | | 8,626 | | | 9,529 | | | 15,893 | | | 16,216 | | | (47) | | 9 | (31) | | 9 |
| Liability for postemployment benefits | Liability for postemployment benefits | | 5,592 | | | 6,872 | | | 5,592 | | | 6,872 | | | — | | | — | | | — | | | — | | | Liability for postemployment benefits | | 4,098 | | | 4,203 | | 4,203 | | | 4,098 | | 4,098 | | | 4,203 | | 4,203 | | | — | | — | | | — | | — | | | — | | — | | | — | | — | | | |
| Other liabilities | Other liabilities | | 4,805 | | | 4,358 | | | 4,106 | | | 3,691 | | | 1,425 | | | 1,385 | | | (726) | | 4 | (718) | | 4 | Other liabilities | | 4,675 | | | 4,604 | | 4,604 | | | 3,806 | | 3,806 | | | 3,677 | | 3,677 | | | 1,607 | | 1,607 | | | 1,638 | | 1,638 | | | (738) | | (738) | | 4 | 4 | (711) | | 4 | 4 |
| Total liabilities | Total liabilities | | 66,277 | | | 62,946 | | | 36,628 | | | 35,197 | | | 30,727 | | | 29,719 | | | (1,078) | | | (1,970) | | |
| Commitments and contingencies | Commitments and contingencies | | | | | | | | | | | | | | | | | |
| Commitments and contingencies | |
| Commitments and contingencies | | | | | | | | | | | | | | | | | | |
| | Shareholders’ equity | |
| Shareholders’ equity | |
| Shareholders’ equity | Shareholders’ equity | | | | | | | | | | | | | | | | | | | | | | | | | | | | | | | | | | |
| Common stock | Common stock | | 6,398 | | | 6,230 | | | 6,398 | | | 6,230 | | | 919 | | | 919 | | | (919) | | 9 | (919) | | 9 | Common stock | | 6,403 | | | 6,560 | | 6,560 | | | 6,403 | | 6,403 | | | 6,560 | | 6,560 | | | 905 | | 905 | | | 905 | | 905 | | | (905) | | (905) | | 10 | 10 | (905) | | 10 | 10 |
| Treasury stock | Treasury stock | | (27,643) | | | (25,178) | | | (27,643) | | | (25,178) | | | — | | | — | | | — | | | — | | | Treasury stock | | (36,339) | | | (31,748) | | (31,748) | | | (36,339) | | (36,339) | | | (31,748) | | (31,748) | | | — | | — | | | — | | — | | | — | | — | | | — | | — | | | |
| Profit employed in the business | Profit employed in the business | | 39,282 | | | 35,167 | | | 35,390 | | | 31,091 | | | 3,881 | | | 4,065 | | | 11 | | 9 | 11 | | 9 | Profit employed in the business | | 51,250 | | | 43,514 | | 43,514 | | | 46,783 | | 46,783 | | | 39,435 | | 39,435 | | | 4,457 | | 4,457 | | | 4,068 | | 4,068 | | | 10 | | 10 | | 10 | 10 | 11 | | 10 | 10 |
| Accumulated other comprehensive income (loss) | Accumulated other comprehensive income (loss) | | (1,553) | | | (888) | | | (799) | | | (352) | | | (754) | | | (536) | | | — | | | — | | |
| Noncontrolling interests | Noncontrolling interests | | 32 | | | 47 | | | 35 | | | 48 | | | 211 | | | 197 | | | (214) | | 9 | (198) | | 9 |
| Noncontrolling interests | |
| Noncontrolling interests | | | 9 | | | 22 | | | 12 | | | 25 | | | 74 | | | 206 | | | (77) | | 10 | (209) | | 10 |
| Total shareholders’ equity | Total shareholders’ equity | | 16,516 | | | 15,378 | | | 13,381 | | | 11,839 | | | 4,257 | | | 4,645 | | | (1,122) | | | (1,106) | | |
| Total liabilities and shareholders’ equity | Total liabilities and shareholders’ equity | | $ | 82,793 | | | $ | 78,324 | | | $ | 50,009 | | | $ | 47,036 | | | $ | 34,984 | | | $ | 34,364 | | | $ | (2,200) | | | $ | (3,076) | | |
| Total liabilities and shareholders’ equity | |
| Total liabilities and shareholders’ equity | |
1Elimination of receivables between ME&T and Financial Products.
2Reclassification of ME&T’s trade receivables purchased by Financial Products and Financial Products’ wholesale inventory receivables.
3Elimination of ME&T's insurance premiums that are prepaid to Financial Products.
4Reclassification reflecting required netting of deferred tax assets/liabilities by taxing jurisdiction.
5Elimination of other intercompany assets between ME&T and Financial Products.
6Elimination of debtpayables between ME&T and Financial Products.
7EliminationReclassification of Financial Products' payables between ME&T and Financial Products.to accrued expenses or customer advances.
8Elimination of prepaid insurance in Financial Products’ other liabilities.
9Elimination of debt between ME&T and Financial Products.
10Eliminations associated with ME&T’s investments in Financial Products’ subsidiaries.
| | Supplemental Data for Statement of Cash Flow | Supplemental Data for Statement of Cash Flow | |
| For the Years Ended December 31 | | | | Supplemental consolidating data | |
| For the Years Ended December 31, | |
| For the Years Ended December 31, | |
| For the Years Ended December 31, | | | | | Supplemental consolidating data | |
| | | | Consolidated | | Machinery,
Energy & Transportation | | Financial
Products | | Consolidating
Adjustments | | | | Consolidated | | Machinery,
Energy & Transportation | | Financial
Products | | Consolidating
Adjustments | |
| (Millions of dollars) | (Millions of dollars) | | 2021 | | 2020 | | 2021 | | 2020 | | 2021 | | 2020 | | 2021 | | 2020 | | (Millions of dollars) | | 2023 | | 2022 | | 2023 | | 2022 | | 2023 | | 2022 | | 2023 | | 2022 | |
| Cash flow from operating activities: | Cash flow from operating activities: | | | | | | | | | | | | | | | | | | Cash flow from operating activities: | | | | | |
| Profit (loss) of consolidated and affiliated companies | | $ | 6,493 | | | $ | 3,003 | | | $ | 6,676 | | | $ | 2,922 | | | $ | 678 | | | $ | 416 | | | $ | (861) | | 1,5 | $ | (335) | | 1,5 |
| Profit of consolidated and affiliated companies | | Profit of consolidated and affiliated companies | | $ | 10,332 | | | $ | 6,704 | | | $ | 9,995 | | | $ | 6,531 | | | $ | 686 | | | $ | 655 | | | $ | (349) | | 1,5 | $ | (482) | | 1,5 |
| Adjustments for non-cash items: | Adjustments for non-cash items: | | | | | | | | | Adjustments for non-cash items: | | | | | | | | | | | | | | | | | |
| Depreciation and amortization | Depreciation and amortization | | 2,352 | | | 2,432 | | | 1,550 | | | 1,630 | | | 802 | | | 802 | | | — | | | — | | | Depreciation and amortization | | 2,144 | | | 2,219 | | 2,219 | | | 1,361 | | 1,361 | | | 1,439 | | 1,439 | | | 783 | | 783 | | | 780 | | 780 | | | — | | — | | | | — | | | |
| | Actuarial (gain) loss on pension and postretirement benefits | Actuarial (gain) loss on pension and postretirement benefits | | (833) | | | 383 | | | (833) | | | 384 | | | — | | | (1) | | | — | | | — | | |
| Actuarial (gain) loss on pension and postretirement benefits | |
| Actuarial (gain) loss on pension and postretirement benefits | |
| Provision (benefit) for deferred income taxes | Provision (benefit) for deferred income taxes | | (383) | | | (74) | | | (329) | | | (85) | | | (54) | | | 11 | | | — | | | — | | |
| | Provision (benefit) for deferred income taxes | |
| Provision (benefit) for deferred income taxes | |
| Loss on divestiture | |
| Loss on divestiture | |
| Loss on divestiture | |
| Goodwill impairment charge | |
| Goodwill impairment charge | |
| Goodwill impairment charge | |
| Other | |
| Other | |
| Other | Other | | 216 | | | 1,000 | | | 131 | | | 613 | | | (209) | | | 98 | | | 294 | | 2 | 289 | | 2 | | 375 | | | 701 | | 701 | | | 444 | | 444 | | | 452 | | 452 | | | (577) | | (577) | | | (205) | | (205) | | | 508 | | 508 | | 2 | 2 | 454 | | 2 | 2 |
| | Changes in assets and liabilities, net of acquisitions and divestitures: | |
| Changes in assets and liabilities, net of acquisitions and divestitures: | |
| Changes in assets and liabilities, net of acquisitions and divestitures: | Changes in assets and liabilities, net of acquisitions and divestitures: | | | | | | | | | | | | | | | | | | | | | |
| Receivables - trade and other | Receivables - trade and other | | (1,259) | | | 1,442 | | | (463) | | | 395 | | | 47 | | | 50 | | | (843) | | 2,3 | 997 | | 2,3 | Receivables - trade and other | | (437) | | | (220) | | (220) | | | (367) | | (367) | | | (390) | | (390) | | | 61 | | 61 | | | 143 | | 143 | | | (131) | | (131) | | 2,3 | 2,3 | 27 | | 2,3 | 2,3 |
| Inventories | Inventories | | (2,586) | | | (34) | | | (2,581) | | | (29) | | | — | | | — | | | (5) | | 2 | (5) | | 2 | Inventories | | (364) | | | (2,589) | | (2,589) | | | (360) | | (360) | | | (2,572) | | (2,572) | | | — | | — | | | — | | — | | | (4) | | (4) | | 2 | 2 | (17) | | 2 | 2 |
| Accounts payable | Accounts payable | | 2,041 | | | 98 | | | 2,015 | | | 51 | | | 49 | | | 18 | | | (23) | | 2 | 29 | | 2 | Accounts payable | | (754) | | | 798 | | 798 | | | (836) | | (836) | | | 811 | | 811 | | | 41 | | 41 | | | 82 | | 82 | | | 41 | | 41 | | 2 | 2 | (95) | | 2 | 2 |
| Accrued expenses | Accrued expenses | | 196 | | | (366) | | | 288 | | | (364) | | | (92) | | | (2) | | | — | | | — | | |
| Accrued wages, salaries and employee benefits | Accrued wages, salaries and employee benefits | | 1,107 | | | (544) | | | 1,066 | | | (510) | | | 41 | | | (34) | | | — | | | — | | |
| Accrued wages, salaries and employee benefits | |
| Accrued wages, salaries and employee benefits | | | 486 | | | 90 | | | 474 | | | 97 | | | 12 | | | (7) | | | — | | | — | | |
| Customer advances | Customer advances | | 34 | | | (126) | | | 33 | | | (126) | | | 1 | | | — | | | — | | | — | | |
| Other assets—net | |
| Other assets—net | |
| Other assets—net | Other assets—net | | (97) | | | (201) | | | (200) | | | (133) | | | 25 | | | (71) | | | 78 | | 2 | 3 | | 2 | | (95) | | | (210) | | (210) | | | 94 | | 94 | | | (183) | | (183) | | | (110) | | (110) | | | (35) | | (35) | | | (79) | | (79) | | 2 | 2 | 8 | | 2 | 2 |
| Other liabilities—net | Other liabilities—net | | (83) | | | (686) | | | (176) | | | (694) | | | 132 | | | (22) | | | (39) | | 2 | 30 | | 2 | Other liabilities—net | | 439 | | | (754) | | (754) | | | 216 | | 216 | | | (821) | | (821) | | | 118 | | 118 | | | 71 | | 71 | | | 105 | | 105 | | 2 | 2 | (4) | | 2 | 2 |
| Net cash provided by (used for) operating activities | Net cash provided by (used for) operating activities | | 7,198 | | | 6,327 | | | 7,177 | | | 4,054 | | | 1,420 | | | 1,265 | | | (1,399) | | | 1,008 | | |
| | Cash flow from investing activities: | Cash flow from investing activities: | | | | | | | | | | | | | | | | | |
| | Cash flow from investing activities: | |
| | Cash flow from investing activities: | |
| Capital expenditures—excluding equipment leased to others | |
| Capital expenditures—excluding equipment leased to others | |
| Capital expenditures—excluding equipment leased to others | Capital expenditures—excluding equipment leased to others | | (1,093) | | | (978) | | | (1,088) | | | (976) | | | (16) | | | (14) | | | 11 | | 2 | 12 | | 2 | | (1,597) | | | (1,296) | | (1,296) | | | (1,624) | | (1,624) | | | (1,279) | | (1,279) | | | (22) | | (22) | | | (20) | | (20) | | | 49 | | 49 | | 2 | 2 | 3 | | 2 | 2 |
| Expenditures for equipment leased to others | Expenditures for equipment leased to others | | (1,379) | | | (1,137) | | | (41) | | | (18) | | | (1,347) | | | (1,139) | | | 9 | | 2 | 20 | | 2 | Expenditures for equipment leased to others | | (1,495) | | | (1,303) | | (1,303) | | | (39) | | (39) | | | (19) | | (19) | | | (1,466) | | (1,466) | | | (1,310) | | (1,310) | | | 10 | | 10 | | 2 | 2 | 26 | | 2 | 2 |
| Proceeds from disposals of leased assets and property, plant and equipment | Proceeds from disposals of leased assets and property, plant and equipment | | 1,265 | | | 772 | | | 186 | | | 147 | | | 1,095 | | | 651 | | | (16) | | 2 | (26) | | 2 | Proceeds from disposals of leased assets and property, plant and equipment | | 781 | | | 830 | | 830 | | | 55 | | 55 | | | 78 | | 78 | | | 781 | | 781 | | | 764 | | 764 | | | (55) | | (55) | | 2 | 2 | (12) | | 2 | 2 |
| Additions to finance receivables | Additions to finance receivables | | (13,002) | | | (12,385) | | | — | | | — | | | (13,845) | | | (13,525) | | | 843 | | 3 | 1,140 | | 3 | Additions to finance receivables | | (15,161) | | | (13,239) | | (13,239) | | | — | | — | | | — | | — | | | (17,321) | | (17,321) | | | (14,223) | | (14,223) | | | 2,160 | | 2,160 | | 3 | 3 | 984 | | 3 | 3 |
| Collections of finance receivables | Collections of finance receivables | | 12,430 | | | 12,646 | | | — | | | — | | | 13,337 | | | 14,077 | | | (907) | | 3 | (1,431) | | 3 | Collections of finance receivables | | 14,034 | | | 13,177 | | 13,177 | | | — | | — | | | — | | — | | | 15,634 | | 15,634 | | | 14,052 | | 14,052 | | | (1,600) | | (1,600) | | 3 | 3 | (875) | | 3 | 3 |
| Net intercompany purchased receivables | Net intercompany purchased receivables | | — | | | — | | | — | | | — | | | (609) | | | 1,043 | | | 609 | | 3 | (1,043) | | 3 | Net intercompany purchased receivables | | — | | | — | | — | | | — | | — | | | — | | — | | | 1,080 | | 1,080 | | | 492 | | 492 | | | (1,080) | | (1,080) | | 3 | 3 | (492) | | 3 | 3 |
| Proceeds from sale of finance receivables | Proceeds from sale of finance receivables | | 51 | | | 42 | | | — | | | — | | | 51 | | | 42 | | | — | | | — | | |
| Net intercompany borrowings | Net intercompany borrowings | | — | | | — | | | 1,000 | | | (401) | | | 5 | | | 7 | | | (1,005) | | 4 | 394 | | 4 |
| Net intercompany borrowings | |
| Net intercompany borrowings | | | — | | | — | | | — | | | — | | | 10 | | | 9 | | | (10) | | 4 | (9) | | 4 |
| Investments and acquisitions (net of cash acquired) | Investments and acquisitions (net of cash acquired) | | (490) | | | (111) | | | (490) | | | (111) | | | — | | | — | | | — | | | — | | |
| Proceeds from sale of businesses and investments (net of cash sold) | Proceeds from sale of businesses and investments (net of cash sold) | | 36 | | | 25 | | | 36 | | | 25 | | | — | | | — | | | — | | | — | | |
| Proceeds from sale of securities | | 785 | | | 345 | | | 274 | | | 24 | | | 511 | | | 321 | | | — | | | — | | |
| Proceeds from sale of businesses and investments (net of cash sold) | |
| Proceeds from sale of businesses and investments (net of cash sold) | |
| Proceeds from maturities and sale of securities | |
| Proceeds from maturities and sale of securities | |
| Proceeds from maturities and sale of securities | | | 1,891 | | | 2,383 | | | 1,642 | | | 1,948 | | | 249 | | | 435 | | | — | | | — | | |
| Investments in securities | Investments in securities | | (1,766) | | | (638) | | | (1,189) | | | (21) | | | (577) | | | (617) | | | — | | | — | | | Investments in securities | | (4,405) | | | (3,077) | | (3,077) | | | (3,982) | | (3,982) | | | (2,549) | | (2,549) | | | (423) | | (423) | | | (528) | | (528) | | | — | | — | | | | — | | | |
| Other—net | Other—net | | 79 | | | (66) | | | 81 | | | (11) | | | (2) | | | (55) | | | — | | | — | | |
| Net cash provided by (used for) investing activities | Net cash provided by (used for) investing activities | | (3,084) | | | (1,485) | | | (1,231) | | | (1,342) | | | (1,397) | | | 791 | | | (456) | | | (934) | | |
| Net cash provided by (used for) investing activities | |
| Net cash provided by (used for) investing activities | | | (5,871) | | | (2,541) | | | (3,921) | | | (1,810) | | | (1,424) | | | (356) | | | (526) | | | (375) | | |
| | Cash flow from financing activities: | |
| Cash flow from financing activities: | |
| Cash flow from financing activities: | Cash flow from financing activities: | | | | | | | | | | | | | | | | | | | | | | | | | | | | | | |
| Dividends paid | Dividends paid | | (2,332) | | | (2,243) | | | (2,332) | | | (2,243) | | | (850) | | | (320) | | | 850 | | 5 | 320 | | 5 | Dividends paid | | (2,563) | | | (2,440) | | (2,440) | | | (2,563) | | (2,563) | | | (2,440) | | (2,440) | | | (425) | | (425) | | | (475) | | (475) | | | 425 | | 425 | | 5 | 5 | 475 | | 5 | 5 |
| | Common stock issued, including treasury shares reissued | Common stock issued, including treasury shares reissued | | 135 | | | 229 | | | 135 | | | 229 | | | — | | | — | | | — | | | — | | |
| Common stock issued, including treasury shares reissued | |
| Common stock issued, including treasury shares reissued | |
| Common shares repurchased | Common shares repurchased | | (2,668) | | | (1,130) | | | (2,668) | | | (1,130) | | | — | | | — | | | — | | | — | | |
| Common shares repurchased | |
| Common shares repurchased | |
| Net intercompany borrowings | |
| Net intercompany borrowings | |
| Net intercompany borrowings | Net intercompany borrowings | | — | | | — | | | (5) | | | (7) | | | (1,000) | | | 401 | | | 1,005 | | 4 | (394) | | 4 | | — | | | — | | — | | | (10) | | (10) | | | (9) | | (9) | | | — | | — | | | — | | — | | | 10 | | 10 | | 4 | 4 | 9 | | 4 | 4 |
| Proceeds from debt issued (original maturities greater than three months) | Proceeds from debt issued (original maturities greater than three months) | | 6,989 | | | 10,431 | | | 494 | | | 1,991 | | | 6,495 | | | 8,440 | | | — | | | — | | | Proceeds from debt issued (original maturities greater than three months) | | 8,257 | | | 6,674 | | 6,674 | | | — | | — | | | — | | — | | | 8,257 | | 8,257 | | | 6,674 | | 6,674 | | | — | | — | | | | — | | | |
| Payments on debt (original maturities greater than three months) | Payments on debt (original maturities greater than three months) | | (9,796) | | | (8,237) | | | (1,919) | | | (26) | | | (7,877) | | | (8,211) | | | — | | | — | | | Payments on debt (original maturities greater than three months) | | (6,318) | | | (7,728) | | (7,728) | | | (106) | | (106) | | | (25) | | (25) | | | (6,212) | | (6,212) | | | (7,703) | | (7,703) | | | — | | — | | | | — | | | |
| Short-term borrowings - net (original maturities three months or less) | Short-term borrowings - net (original maturities three months or less) | | 3,488 | | | (2,804) | | | (1) | | | 5 | | | 3,489 | | | (2,809) | | | — | | | — | | | Short-term borrowings - net (original maturities three months or less) | | (1,345) | | | 402 | | 402 | | | (3) | | (3) | | | (138) | | (138) | | | (1,342) | | (1,342) | | | 540 | | 540 | | | — | | — | | | | — | | | |
| Other—net | Other—net | | (4) | | | (1) | | | (4) | | | (1) | | | — | | | — | | | — | | | — | | |
| Net cash provided by (used for) financing activities | Net cash provided by (used for) financing activities | | (4,188) | | | (3,755) | | | (6,300) | | | (1,182) | | | 257 | | | (2,499) | | | 1,855 | | | (74) | | |
| Net cash provided by (used for) financing activities | |
| Net cash provided by (used for) financing activities | |
| Effect of exchange rate changes on cash | |
| Effect of exchange rate changes on cash | |
| Effect of exchange rate changes on cash | Effect of exchange rate changes on cash | | (29) | | | (13) | | | (35) | | | (10) | | | 6 | | | (3) | | | — | | | — | | | | (110) | | | (194) | | (194) | | | (60) | | (60) | | | (131) | | (131) | | | (50) | | (50) | | | (63) | | (63) | | | — | | — | | | | — | | | |
| Increase (decrease) in cash, cash equivalents and restricted cash | Increase (decrease) in cash, cash equivalents and restricted cash | | (103) | | | 1,074 | | | (389) | | | 1,520 | | | 286 | | | (446) | | | — | | | — | | | Increase (decrease) in cash, cash equivalents and restricted cash | | (28) | | | (2,250) | | (2,250) | | | 62 | | 62 | | | (2,384) | | (2,384) | | | (90) | | (90) | | | 134 | | 134 | | | — | | — | | | | — | | | |
| Cash, cash equivalents and restricted cash at beginning of period | Cash, cash equivalents and restricted cash at beginning of period | | 9,366 | | | 8,292 | | | 8,822 | | | 7,302 | | | 544 | | | 990 | | | — | | | — | | | Cash, cash equivalents and restricted cash at beginning of period | | 7,013 | | | 9,263 | | 9,263 | | | 6,049 | | 6,049 | | | 8,433 | | 8,433 | | | 964 | | 964 | | | 830 | | 830 | | | — | | — | | | | — | | | |
| Cash, cash equivalents and restricted cash at end of period | Cash, cash equivalents and restricted cash at end of period | | $ | 9,263 | | | $ | 9,366 | | | $ | 8,433 | | | $ | 8,822 | | | $ | 830 | | | $ | 544 | | | $ | — | | | $ | — | | | Cash, cash equivalents and restricted cash at end of period | | $ | 6,985 | | | $ | | $ | 7,013 | | | $ | | $ | 6,111 | | | $ | | $ | 6,049 | | | $ | | $ | 874 | | | $ | | $ | 964 | | | $ | | $ | — | | | | $ | — | | | |
1Elimination of equity profit earned from Financial Products’ subsidiaries partially owned by ME&T subsidiaries.
2Elimination of non-cash adjustments and changes in assets and liabilities related to consolidated reporting.
3Reclassification of Financial Products’ cash flow activity from investing to operating for receivables that arose from the sale of inventory.
4Elimination of net proceeds and payments to/from ME&T and Financial Products.
5Elimination of dividend activity between Financial Products and ME&T.
Item 7A.Quantitative and Qualitative Disclosures About Market Risk.
Information required by Item 7A appears in Note 1 — “Operations and summary of significant accounting policies,” Note 4 — “Derivative financial instruments and risk management,” Note 18 — “Fair value disclosures” and Note 19 — “Concentration of credit risk” of Part II, Item 8 “Financial Statements and Supplementary Data.” Other information required by Item 7A is included in Part II, Item 7 “Management’s Discussion and Analysis of Financial Condition and Results of Operations.”
Item 8.Financial Statements and Supplementary Data.
MANAGEMENT’S REPORT ON
INTERNAL CONTROL OVER FINANCIAL REPORTING
The management of Caterpillar Inc. (company) is responsible for establishing and maintaining adequate internal control over financial reporting as such term is defined in Rule 13a-15(f) under the Exchange Act. Our internal control over financial reporting is a process designed to provide reasonable assurance regarding the reliability of our financial reporting and the preparation of financial statements for external purposes in accordance with generally accepted accounting principles. Our internal control over financial reporting includes those policies and procedures that (i) pertain to the maintenance of records that, in reasonable detail, accurately and fairly reflect the transactions and dispositions of the assets of the company; (ii) provide reasonable assurance that transactions are recorded as necessary to permit preparation of financial statements in accordance with generally accepted accounting principles, and that receipts and expenditures of the company are being made only in accordance with authorizations of management and directors of the company; and (iii) provide reasonable assurance regarding prevention or timely detection of unauthorized acquisition, use, or disposition of the company’s assets that could have a material effect on the financial statements.
Because of its inherent limitations, internal control over financial reporting may not prevent or detect misstatements. Also, projections of any evaluation of effectiveness to future periods are subject to the risk that controls may become inadequate because of changes in conditions, or that the degree of compliance with the policies or procedures may deteriorate.
Management assessed the effectiveness of the company’s internal control over financial reporting as of December 31, 2021.2023. In making this assessment, we used the criteria set forth by the Committee of Sponsoring Organizations of the Treadway Commission (COSO) in Internal Control—Integrated Framework (2013). Based on our assessment we concluded that, as of December 31, 2021,2023, the company’s internal control over financial reporting was effective based on those criteria.
The effectiveness of the company’s internal control over financial reporting as of December 31, 20212023 has been audited by PricewaterhouseCoopers LLP, an independent registered public accounting firm. Their report appears on pages 61-62.54-55.
| | | | | | | | |
| | /s/ D. James Umpleby III | |
| | D. James Umpleby III | |
| | Chief Executive Officer | |
| | | |
| | |
| | | |
| | /s/ Andrew R.J. Bonfield | |
| | Andrew R.J. Bonfield | |
| | Chief Financial Officer | |
| | | |
| | | |
| | | |
| | February 16, 20222024 | |
REPORT OF INDEPENDENT REGISTERED PUBLIC ACCOUNTING FIRM
To the Board of Directors and Shareholders of Caterpillar Inc.
Opinions on the Financial Statements and Internal Control over Financial Reporting
We have audited the accompanying consolidated statement of financial position of Caterpillar Inc. and its subsidiaries (the “Company”) as of December 31, 20212023 and 2020,2022, and the related consolidated statements of results of operations, of comprehensive income (loss), of changes in shareholders' equity and of cash flow for each of the three years in the period ended December 31, 2021,2023, including the related notes (collectively referred to as the “consolidated financial statements”). We also have audited the Company's internal control over financial reporting as of December 31, 2021,2023, based on criteria established in Internal Control - Integrated Framework(2013) issued by the Committee of Sponsoring Organizations of the Treadway Commission (COSO).
In our opinion, the consolidated financial statements referred to above present fairly, in all material respects, the financial position of the Company as of December 31, 20212023 and 2020,2022, and the results of its operations and its cash flows for each of the three years in the period ended December 31, 20212023 in conformity with accounting principles generally accepted in the United States of America. Also in our opinion, the Company maintained, in all material respects, effective internal control over financial reporting as of December 31, 2021,2023, based on criteria established in Internal Control - Integrated Framework(2013) issued by the COSO.
Basis for Opinions
The Company's management is responsible for these consolidated financial statements, for maintaining effective internal control over financial reporting, and for its assessment of the effectiveness of internal control over financial reporting, included in the accompanying Management’s Report on Internal Control Over Financial Reporting. Our responsibility is to express opinions on the Company’s consolidated financial statements and on the Company's internal control over financial reporting based on our audits. We are a public accounting firm registered with the Public Company Accounting Oversight Board (United States) (PCAOB) and are required to be independent with respect to the Company in accordance with the U.S. federal securities laws and the applicable rules and regulations of the Securities and Exchange Commission and the PCAOB.
We conducted our audits in accordance with the standards of the PCAOB. Those standards require that we plan and perform the audits to obtain reasonable assurance about whether the consolidated financial statements are free of material misstatement, whether due to error or fraud, and whether effective internal control over financial reporting was maintained in all material respects.
Our audits of the consolidated financial statements included performing procedures to assess the risks of material misstatement of the consolidated financial statements, whether due to error or fraud, and performing procedures that respond to those risks. Such procedures included examining, on a test basis, evidence regarding the amounts and disclosures in the consolidated financial statements. Our audits also included evaluating the accounting principles used and significant estimates made by management, as well as evaluating the overall presentation of the consolidated financial statements. Our audit of internal control over financial reporting included obtaining an understanding of internal control over financial reporting, assessing the risk that a material weakness exists, and testing and evaluating the design and operating effectiveness of internal control based on the assessed risk. Our audits also included performing such other procedures as we considered necessary in the circumstances. We believe that our audits provide a reasonable basis for our opinions.
Definition and Limitations of Internal Control over Financial Reporting
A company’s internal control over financial reporting is a process designed to provide reasonable assurance regarding the reliability of financial reporting and the preparation of financial statements for external purposes in accordance with generally accepted accounting principles. A company’s internal control over financial reporting includes those policies and procedures that (i) pertain to the maintenance of records that, in reasonable detail, accurately and fairly reflect the transactions and dispositions of the assets of the company; (ii) provide reasonable assurance that transactions are recorded as necessary to permit preparation of financial statements in accordance with generally accepted accounting principles, and that receipts and expenditures of the company are being made only in accordance with authorizations of management and directors of the company; and (iii) provide reasonable assurance regarding prevention or timely detection of unauthorized acquisition, use, or disposition of the company’s assets that could have a material effect on the financial statements.
Because of its inherent limitations, internal control over financial reporting may not prevent or detect misstatements. Also, projections of any evaluation of effectiveness to future periods are subject to the risk that controls may become inadequate because of changes in conditions, or that the degree of compliance with the policies or procedures may deteriorate.
Critical Audit Matters
The critical audit matter communicated below is a matter arising from the current period audit of the consolidated financial statements that was communicated or required to be communicated to the audit committee and that (i) relates to accounts or disclosures that are material to the consolidated financial statements and (ii) involved our especially challenging, subjective, or complex judgments. The communication of critical audit matters does not alter in any way our opinion on the consolidated financial statements, taken as a whole, and we are not, by communicating the critical audit matter below, providing a separate opinion on the critical audit matter or on the accounts or disclosures to which it relates.
Uncertain Tax Position - Caterpillar SARL IRS ExaminationProduct Warranty Liability
As described in Note 6Notes 2 and 21 to the consolidated financial statements, as a result of the audits of the Company’s U.S. 2007product warranty liability as of December 31, 2023 was $1,894 million. At the time the Company recognizes a sale, management records estimated future warranty costs. Management determines the product warranty liability by applying historical claim rate experience to 2012 income tax returns, including the impact of a loss carryback to 2005, the Internal Revenue Service (“IRS”) has proposed to tax in the U.S. profits earned from certain parts transactionscurrent field population and dealer inventory. Generally, management bases historical claim rates on actual warranty experience for each product by Caterpillar SARL (“CSARL”)machine model/engine size by customer or dealer location (inside or outside North America). This proposal isManagement develops specific rates for each product shipment month and updates them monthly based on the IRS examination team’s application of the “substance-over-form” or “assignment-of-income” judicial doctrines. As described by management, the Company is vigorously contesting the proposed increases to tax and penalties for these years of approximately $2.3 billion, as management believes that the relevant transactions complied with applicable tax laws and did not violate judicial doctrines. As disclosed by management, the purchase of parts by CSARL from unrelated parties and the subsequent sale of those parts to unrelated dealers outside the U.S. have substantial legal, commercial, and economic consequences for the parties involved. Management has concluded that the largest amount of benefit that is more likely than not to be sustained related to this position is the entire benefit. As a result, no amount related to these IRS adjustments is reflected in the Company’s unrecognized tax benefits. The Company has filed U.S. income tax returns on this same basis for years after 2012.actual warranty claim experience.
The principal considerations for our determination that performing procedures relating to the uncertain tax position arising from the CSARL IRS Examinationproduct warranty liability is a critical audit matter are (i) the significant judgment by management in evaluatingwhen developing the amountestimate of the benefit that is more likely than not to be sustained related to the position;product warranty liability, (ii) a high degree of auditor judgment, subjectivity, and effort in performing procedures and evaluating whether the position was more likely than notmanagement’s significant assumption related to be sustained;historical claim rates, and (iii) the audit effort involved the use of professionals with specialized skill and knowledge.
Addressing the matter involved performing procedures and evaluating audit evidence in connection with forming our overall opinion on the consolidated financial statements. These procedures included testing the effectiveness of controls relating to management’s estimate of the uncertain tax position arising from the CSARL IRS Examination.product warranty liability. These procedures also included, among others (i) evaluating management’s process for determiningtesting the reasonablenesscompleteness and accuracy of the uncertain tax position, including reading certain intercompany and third-party agreements which are relevant to evaluating the legal form and substance of the CSARL transaction flows; (ii) evaluating management’s assessment of whether the position was more likely than not to produce a tax benefit and the determinationunderlying data provided by management and (ii) the involvement of the largest amount of benefit that is more likely than not to be sustained related to this position; and (iii) evaluating the Revenue Agent Reports (“RARs”) from the IRS and management’s protests of the RARs. Professionalsprofessionals with specialized skill and knowledge were used to assist in evaluating the applicable tax lawsreasonableness of management’s estimate by performing one or a combination of procedures, including (a) developing an independent actuarial estimate of the product warranty liability, and judicial doctrinescomparing the independent estimate to management’s actuarial determined liability; and (b) evaluating the appropriateness of management’s actuarial methodologies and the reasonableness of management’s significant assumption related to this matter as well as changes in relevant tax regulations, rulings, and case law.historical claim rates.
/s/ PricewaterhouseCoopers LLP
Chicago, IllinoisDallas, Texas
February 16, 20222024
We have served as the Company’s auditor since 1925.
| | STATEMENT 1 | STATEMENT 1 | Caterpillar Inc. | STATEMENT 1 | Caterpillar Inc. |
| Consolidated Results of Operations for the Years Ended December 31 | |
| Consolidated Results of Operations for the Years Ended December 31, | |
| (Dollars in millions except per share data) | (Dollars in millions except per share data) | |
| (Dollars in millions except per share data) | |
| (Dollars in millions except per share data) | |
| | |
| | |
| | | 2021 | | 2020 | | 2019 | 2023 | | 2022 | | 2021 |
| Sales and revenues: | Sales and revenues: | | | | | | Sales and revenues: | | | |
| Sales of Machinery, Energy & Transportation | Sales of Machinery, Energy & Transportation | $ | 48,188 | | | $ | 39,022 | | | $ | 50,755 | |
| Revenues of Financial Products | Revenues of Financial Products | 2,783 | | | 2,726 | | | 3,045 | |
| Total sales and revenues | Total sales and revenues | 50,971 | | | 41,748 | | | 53,800 | |
| | Operating costs: | Operating costs: | | | | | |
| Operating costs: | |
| Operating costs: | | | | |
| Cost of goods sold | Cost of goods sold | 35,513 | | | 29,082 | | | 36,630 | |
| Selling, general and administrative expenses | Selling, general and administrative expenses | 5,365 | | | 4,642 | | | 5,162 | |
| Research and development expenses | Research and development expenses | 1,686 | | | 1,415 | | | 1,693 | |
| Interest expense of Financial Products | Interest expense of Financial Products | 455 | | | 589 | | | 754 | |
| Goodwill impairment charge | |
| Other operating (income) expenses | Other operating (income) expenses | 1,074 | | | 1,467 | | | 1,271 | |
| Total operating costs | Total operating costs | 44,093 | | | 37,195 | | | 45,510 | |
| | Operating profit | Operating profit | 6,878 | | | 4,553 | | | 8,290 | |
| Operating profit | |
| Operating profit | |
| | Interest expense excluding Financial Products | |
| Interest expense excluding Financial Products | |
| Interest expense excluding Financial Products | Interest expense excluding Financial Products | 488 | | | 514 | | | 421 | |
| Other income (expense) | Other income (expense) | 1,814 | | | (44) | | | (57) | |
| | Consolidated profit before taxes | Consolidated profit before taxes | 8,204 | | | 3,995 | | | 7,812 | |
| Consolidated profit before taxes | |
| Consolidated profit before taxes | |
| | Provision (benefit) for income taxes | |
| Provision (benefit) for income taxes | |
| Provision (benefit) for income taxes | Provision (benefit) for income taxes | 1,742 | | | 1,006 | | | 1,746 | |
| Profit of consolidated companies | Profit of consolidated companies | 6,462 | | | 2,989 | | | 6,066 | |
| | Equity in profit (loss) of unconsolidated affiliated companies | Equity in profit (loss) of unconsolidated affiliated companies | 31 | | | 14 | | | 28 | |
| Equity in profit (loss) of unconsolidated affiliated companies | |
| Equity in profit (loss) of unconsolidated affiliated companies | |
| | Profit of consolidated and affiliated companies | |
| Profit of consolidated and affiliated companies | |
| Profit of consolidated and affiliated companies | Profit of consolidated and affiliated companies | 6,493 | | | 3,003 | | | 6,094 | |
| | Less: Profit (loss) attributable to noncontrolling interests | Less: Profit (loss) attributable to noncontrolling interests | 4 | | | 5 | | | 1 | |
| Less: Profit (loss) attributable to noncontrolling interests | |
| Less: Profit (loss) attributable to noncontrolling interests | |
| Profit 1 | Profit 1 | $ | 6,489 | | | $ | 2,998 | | | $ | 6,093 | |
Profit 1 | |
Profit 1 | |
| | Profit per common share | |
| | Profit per common share | |
| | Profit per common share | Profit per common share | $ | 11.93 | | | $ | 5.51 | | | $ | 10.85 | |
Profit per common share — diluted 2 | Profit per common share — diluted 2 | $ | 11.83 | | | $ | 5.46 | | | $ | 10.74 | |
| | Weighted-average common shares outstanding (millions) | Weighted-average common shares outstanding (millions) | | | | | |
| Weighted-average common shares outstanding (millions) | |
| Weighted-average common shares outstanding (millions) | | | | |
| - Basic | - Basic | 544.0 | | | 544.1 | | | 561.6 | |
- Diluted 2 | - Diluted 2 | 548.5 | | | 548.6 | | | 567.5 | |
| |
1 Profit attributable to common shareholders.
2 Diluted by assumed exercise of stock-based compensation awards using the treasury stock method.
| | | | | | | | | | | | | | |
| See accompanying notes to Consolidated Financial Statements. |
| | STATEMENT 2 | STATEMENT 2 | | | Caterpillar Inc. | STATEMENT 2 | | | Caterpillar Inc. |
Consolidated Comprehensive Income (Loss) for the Years Ended December 31 | | Consolidated Comprehensive Income (Loss) for the Years Ended December 31, | | Consolidated Comprehensive Income (Loss) for the Years Ended December 31, |
| (Millions of dollars) | (Millions of dollars) | |
| | | 2021 | | 2020 | | 2019 |
| | | | 2023 | | 2022 | | 2021 |
| | Profit (loss) of consolidated and affiliated companies | |
| Profit (loss) of consolidated and affiliated companies | |
| Profit (loss) of consolidated and affiliated companies | Profit (loss) of consolidated and affiliated companies | $ | 6,493 | | | $ | 3,003 | | | $ | 6,094 | |
| Other comprehensive income (loss), net of tax (Note 17): | Other comprehensive income (loss), net of tax (Note 17): | | | | | |
| Foreign currency translation: | |
| Foreign currency translation: | |
| Foreign currency translation: | Foreign currency translation: | (598) | | | 577 | | | 16 | |
| Pension and other postretirement benefits: | Pension and other postretirement benefits: | (30) | | | (29) | | | (34) | |
| Derivative financial instruments: | Derivative financial instruments: | (3) | | | 97 | | | (8) | |
| Available-for-sale securities: | Available-for-sale securities: | (34) | | | 34 | | | 35 | |
| | Total other comprehensive income (loss), net of tax | Total other comprehensive income (loss), net of tax | (665) | | | 679 | | | 9 | |
| Total other comprehensive income (loss), net of tax | |
| Total other comprehensive income (loss), net of tax | |
| Comprehensive income (loss) | Comprehensive income (loss) | 5,828 | | | 3,682 | | | 6,103 | |
| Less: comprehensive income attributable to the noncontrolling interests | 4 | | | 5 | | | 1 | |
| Less: comprehensive income (loss) attributable to the noncontrolling interests | |
| Comprehensive income (loss) attributable to shareholders | Comprehensive income (loss) attributable to shareholders | $ | 5,824 | | | $ | 3,677 | | | $ | 6,102 | |
|
| | | | | | | | | | | | | | |
| See accompanying notes to Consolidated Financial Statements. |
| | STATEMENT 3 | STATEMENT 3 | Caterpillar Inc. | |
| Consolidated Financial Position at December 31 | | |
| STATEMENT 3 | |
| STATEMENT 3 | |
| Consolidated Financial Position at December 31, | |
| Consolidated Financial Position at December 31, | |
| Consolidated Financial Position at December 31, | |
| (Dollars in millions) | |
| (Dollars in millions) | |
| (Dollars in millions) | (Dollars in millions) | | |
| | | 2021 | | 2020 | |
| | |
| | |
| Assets | |
| Assets | |
| Assets | Assets | | | | |
| Current assets: | Current assets: | | | | |
| Current assets: | |
| Current assets: | |
| Cash and cash equivalents | |
| Cash and cash equivalents | |
| Cash and cash equivalents | Cash and cash equivalents | $ | 9,254 | | | $ | 9,352 | | |
| Receivables – trade and other | Receivables – trade and other | 8,477 | | | 7,317 | | |
| Receivables – trade and other | |
| Receivables – trade and other | |
| Receivables – finance | |
| Receivables – finance | |
| Receivables – finance | Receivables – finance | 8,898 | | | 9,463 | | |
| | Prepaid expenses and other current assets | Prepaid expenses and other current assets | 2,788 | | | 1,930 | | |
| | Prepaid expenses and other current assets | |
| | Prepaid expenses and other current assets | |
| Inventories | Inventories | 14,038 | | | 11,402 | | |
| Inventories | |
| Inventories | |
| Total current assets | |
| Total current assets | |
| Total current assets | Total current assets | 43,455 | | | 39,464 | | |
| | Property, plant and equipment – net | Property, plant and equipment – net | 12,090 | | | 12,401 | | |
| | Property, plant and equipment – net | |
| | Property, plant and equipment – net | |
| Long-term receivables – trade and other | |
| Long-term receivables – trade and other | |
| Long-term receivables – trade and other | Long-term receivables – trade and other | 1,204 | | | 1,185 | | |
| Long-term receivables – finance | Long-term receivables – finance | 12,707 | | | 12,222 | | |
| Long-term receivables – finance | |
| Long-term receivables – finance | |
| Noncurrent deferred and refundable income taxes | |
| Noncurrent deferred and refundable income taxes | |
| Noncurrent deferred and refundable income taxes | Noncurrent deferred and refundable income taxes | 1,840 | | | 1,523 | | |
| Intangible assets | Intangible assets | 1,042 | | | 1,308 | | |
| Intangible assets | |
| Intangible assets | |
| Goodwill | |
| Goodwill | |
| Goodwill | Goodwill | 6,324 | | | 6,394 | | |
| Other assets | Other assets | 4,131 | | | 3,827 | | |
| Other assets | |
| Other assets | |
| Total assets | |
| Total assets | |
| Total assets | Total assets | $ | 82,793 | | | $ | 78,324 | | |
| | Liabilities | Liabilities | | | | |
| | Liabilities | |
| | Liabilities | |
| Current liabilities: | |
| Current liabilities: | |
| Current liabilities: | Current liabilities: | | | | |
| Short-term borrowings: | Short-term borrowings: | | | | |
| Short-term borrowings: | |
| Short-term borrowings: | |
| Machinery, Energy & Transportation | |
| Machinery, Energy & Transportation | |
| Machinery, Energy & Transportation | Machinery, Energy & Transportation | $ | 9 | | | $ | 10 | | |
| Financial Products | Financial Products | 5,395 | | | 2,005 | | |
| Financial Products | |
| Financial Products | |
| Accounts payable | |
| Accounts payable | |
| Accounts payable | Accounts payable | 8,154 | | | 6,128 | | |
| Accrued expenses | Accrued expenses | 3,757 | | | 3,642 | | |
| Accrued expenses | |
| Accrued expenses | |
| Accrued wages, salaries and employee benefits | |
| Accrued wages, salaries and employee benefits | |
| Accrued wages, salaries and employee benefits | Accrued wages, salaries and employee benefits | 2,242 | | | 1,096 | | |
| Customer advances | Customer advances | 1,087 | | | 1,108 | | |
| Customer advances | |
| Customer advances | |
| Dividends payable | |
| Dividends payable | |
| Dividends payable | Dividends payable | 595 | | | 562 | | |
| Other current liabilities | Other current liabilities | 2,256 | | | 2,017 | | |
| Other current liabilities | |
| Other current liabilities | |
| Long-term debt due within one year: | |
| Long-term debt due within one year: | |
| Long-term debt due within one year: | Long-term debt due within one year: | | | | |
| Machinery, Energy & Transportation | Machinery, Energy & Transportation | 45 | | | 1,420 | | |
| Machinery, Energy & Transportation | |
| Machinery, Energy & Transportation | |
| Financial Products | |
| Financial Products | |
| Financial Products | Financial Products | 6,307 | | | 7,729 | | |
| Total current liabilities | Total current liabilities | 29,847 | | | 25,717 | | |
| Total current liabilities | |
| Total current liabilities | |
| Long-term debt due after one year: | |
| Long-term debt due after one year: | |
| Long-term debt due after one year: | Long-term debt due after one year: | | | | |
| Machinery, Energy & Transportation | Machinery, Energy & Transportation | 9,746 | | | 9,749 | | |
| Machinery, Energy & Transportation | |
| Machinery, Energy & Transportation | |
| Financial Products | |
| Financial Products | |
| Financial Products | Financial Products | 16,287 | | | 16,250 | | |
| Liability for postemployment benefits | Liability for postemployment benefits | 5,592 | | | 6,872 | | |
| Liability for postemployment benefits | |
| Liability for postemployment benefits | |
| Other liabilities | |
| Other liabilities | |
| Other liabilities | Other liabilities | 4,805 | | | 4,358 | | |
| Total liabilities | Total liabilities | 66,277 | | | 62,946 | | |
| Total liabilities | |
| Total liabilities | |
| Commitments and contingencies (Notes 21 and 22) | |
| Commitments and contingencies (Notes 21 and 22) | |
| Commitments and contingencies (Notes 21 and 22) | Commitments and contingencies (Notes 21 and 22) | | | | |
| Shareholders’ equity | Shareholders’ equity | | | | |
| Shareholders’ equity | |
| Shareholders’ equity | |
| Common stock of $1.00 par value: | Common stock of $1.00 par value: | | | | |
Authorized shares: 2,000,000,000 Issued shares: (2021 and 2020 – 814,894,624 shares) at paid-in amount | 6,398 | | | 6,230 | | |
| Treasury stock: (2021 - 279,006,573 shares; and 2020 - 269,590,777 shares) at cost | (27,643) | | | (25,178) | | |
| Common stock of $1.00 par value: | |
| Common stock of $1.00 par value: | |
Authorized shares: 2,000,000,000 Issued shares: (2023 and 2022 – 814,894,624 shares) at paid-in amount | |
Authorized shares: 2,000,000,000 Issued shares: (2023 and 2022 – 814,894,624 shares) at paid-in amount | |
Authorized shares: 2,000,000,000 Issued shares: (2023 and 2022 – 814,894,624 shares) at paid-in amount | |
| Treasury stock: (2023 - 315,517,355 shares; and 2022 - 298,549,134 shares) at cost | |
| Treasury stock: (2023 - 315,517,355 shares; and 2022 - 298,549,134 shares) at cost | |
| Treasury stock: (2023 - 315,517,355 shares; and 2022 - 298,549,134 shares) at cost | |
| Profit employed in the business | |
| Profit employed in the business | |
| Profit employed in the business | Profit employed in the business | 39,282 | | | 35,167 | | |
| Accumulated other comprehensive income (loss) | Accumulated other comprehensive income (loss) | (1,553) | | | (888) | | |
| Accumulated other comprehensive income (loss) | |
| Accumulated other comprehensive income (loss) | |
| Noncontrolling interests | |
| Noncontrolling interests | |
| Noncontrolling interests | Noncontrolling interests | 32 | | | 47 | | |
| Total shareholders’ equity | Total shareholders’ equity | 16,516 | | | 15,378 | | |
| Total shareholders’ equity | |
| Total shareholders’ equity | |
| Total liabilities and shareholders’ equity | |
| Total liabilities and shareholders’ equity | |
| Total liabilities and shareholders’ equity | Total liabilities and shareholders’ equity | $ | 82,793 | | | $ | 78,324 | | |
|
| | | | | | | | | | | | | | |
| See accompanying notes to Consolidated Financial Statements. |
| | STATEMENT 4 | STATEMENT 4 | | Caterpillar Inc. | STATEMENT 4 | | Caterpillar Inc. |
| Changes in Consolidated Shareholders’ Equity for the Years Ended December 31 | Changes in Consolidated Shareholders’ Equity for the Years Ended December 31 | Changes in Consolidated Shareholders’ Equity for the Years Ended December 31 |
| (Dollars in millions) | (Dollars in millions) | |
| | | Common
stock | | Treasury
stock | | Profit
employed
in the
business | | Accumulated
other
comprehensive
income (loss) | | Noncontrolling
interests | | Total |
| Balance at December 31, 2018 | $ | 5,827 | | | $ | (20,531) | | | $ | 30,427 | | | $ | (1,684) | | | $ | 41 | | | $ | 14,080 | |
| Adjustments to adopt new accounting guidance | | | | | | | | | | | |
| Lease accounting | — | | | — | | | 235 | | | — | | | — | | | 235 | |
| Reclassification of certain tax effects from accumulated other comprehensive income | — | | | — | | | (108) | | | 108 | | | — | | | — | |
| | Balance at January 1, 2019 | $ | 5,827 | | | $ | (20,531) | | | $ | 30,554 | | | $ | (1,576) | | | $ | 41 | | | $ | 14,315 | |
| | | Common
stock | | Treasury
stock | | Profit
employed
in the
business | | Accumulated
other
comprehensive
income (loss) | | Noncontrolling
interests | | Total |
| | Balance at December 31, 2020 | |
| | Balance at December 31, 2020 | |
| | Balance at December 31, 2020 | |
| Profit (loss) of consolidated and affiliated companies | Profit (loss) of consolidated and affiliated companies | — | | | — | | | 6,093 | | | — | | | 1 | | | 6,094 | |
| Foreign currency translation, net of tax | Foreign currency translation, net of tax | — | | | — | | | — | | | 16 | | | — | | | 16 | |
| Pension and other postretirement benefits, net of tax | Pension and other postretirement benefits, net of tax | — | | | — | | | — | | | (34) | | | — | | | (34) | |
| Derivative financial instruments, net of tax | Derivative financial instruments, net of tax | — | | | — | | | — | | | (8) | | | — | | | (8) | |
| Available-for-sale securities, net of tax | Available-for-sale securities, net of tax | — | | | — | | | — | | | 35 | | | — | | | 35 | |
| | Change in ownership from noncontrolling interests | |
| Dividends declared | Dividends declared | — | | | — | | | (2,210) | | | — | | | — | | | (2,210) | |
| Distribution to noncontrolling interests | Distribution to noncontrolling interests | — | | | — | | | — | | | — | | | (3) | | | (3) | |
| Common shares issued from treasury stock for stock-based compensation: 5,126,379 | (4) | | | 242 | | | — | | | — | | | — | | | 238 | |
| Common shares issued from treasury stock for stock-based compensation: 3,571,503 | |
| Stock-based compensation expense | Stock-based compensation expense | 205 | | | — | | | — | | | — | | | — | | | 205 | |
| | Common shares repurchased: 30,586,507 | — | | | (3,928) | | | — | | | — | | | — | | | (3,928) | |
| Common shares repurchased: 12,987,299 | |
| Common shares repurchased: 12,987,299 | |
| Common shares repurchased: 12,987,299 | |
| Other | Other | (93) | | | — | | | — | | | — | | | 2 | | | (91) | |
| Balance at December 31, 2019 | $ | 5,935 | | | $ | (24,217) | | | $ | 34,437 | | | $ | (1,567) | | | $ | 41 | | | $ | 14,629 | |
| Adjustments to adopt new accounting guidance | | | | | | | | | |
| Credit losses | — | | | — | | | (25) | | | — | | | — | | | (25) | |
| Balance at December 31, 2021 | |
| | Balance at January 1, 2020 | $ | 5,935 | | | $ | (24,217) | | | $ | 34,412 | | | $ | (1,567) | | | $ | 41 | | | $ | 14,604 | |
| | Profit (loss) of consolidated and affiliated companies | |
| | Profit (loss) of consolidated and affiliated companies | |
| | Profit (loss) of consolidated and affiliated companies | Profit (loss) of consolidated and affiliated companies | — | | | — | | | 2,998 | | | — | | | 5 | | | 3,003 | |
| Foreign currency translation, net of tax | Foreign currency translation, net of tax | — | | | — | | | — | | | 577 | | | — | | | 577 | |
| Pension and other postretirement benefits, net of tax | Pension and other postretirement benefits, net of tax | — | | | — | | | — | | | (29) | | | — | | | (29) | |
| Derivative financial instruments, net of tax | Derivative financial instruments, net of tax | — | | | — | | | — | | | 97 | | | — | | | 97 | |
| Available-for-sale securities, net of tax | Available-for-sale securities, net of tax | — | | | — | | | — | | | 34 | | | — | | | 34 | |
| | Change in ownership from noncontrolling interests | |
| Dividends declared | Dividends declared | — | | | — | | | (2,247) | | | — | | | — | | | (2,247) | |
| | Common shares issued from treasury stock for stock-based compensation: 5,317,243 | (61) | | | 290 | | | — | | | — | | | — | | | 229 | |
| Distribution to noncontrolling interests | |
| Common shares issued from treasury stock for stock-based compensation: 2,340,887 | |
| Stock-based compensation expense | Stock-based compensation expense | 202 | | | — | | | — | | | — | | | — | | | 202 | |
| | Common shares repurchased: 10,096,006 | — | | | (1,250) | | | — | | | — | | | — | | | (1,250) | |
| Common shares repurchased: 21,882,818 | |
| Common shares repurchased: 21,882,818 | |
| Common shares repurchased: 21,882,818 | |
| Other | Other | 154 | | | (1) | | | 4 | | | — | | | 1 | | | 158 | |
| Balance at December 31, 2020 | $ | 6,230 | | | $ | (25,178) | | | $ | 35,167 | | | $ | (888) | | | $ | 47 | | | $ | 15,378 | |
| Balance at December 31, 2022 | |
(Continued)
| | STATEMENT 4 | STATEMENT 4 | | Caterpillar Inc. | STATEMENT 4 | | Caterpillar Inc. |
| Changes in Consolidated Shareholders’ Equity for the Years Ended December 31 | Changes in Consolidated Shareholders’ Equity for the Years Ended December 31 | Changes in Consolidated Shareholders’ Equity for the Years Ended December 31 |
| (Dollars in millions) | (Dollars in millions) | |
| | | Common
stock | | Treasury
stock | | Profit
employed
in the
business | | Accumulated
other
comprehensive
income (loss) | | Noncontrolling
interests | | Total |
| | | Common
stock | | Treasury
stock | | Profit
employed
in the
business | | Accumulated
other
comprehensive
income (loss) | | Noncontrolling
interests | | Total |
| Balance at December 31, 2022 | |
| | Balance at January 1, 2021 | $ | 6,230 | | | $ | (25,178) | | | $ | 35,167 | | | $ | (888) | | | $ | 47 | | | $ | 15,378 | |
| | Profit (loss) of consolidated and affiliated companies | |
| | Profit (loss) of consolidated and affiliated companies | |
| | Profit (loss) of consolidated and affiliated companies | Profit (loss) of consolidated and affiliated companies | — | | | — | | | 6,489 | | | — | | | 4 | | | 6,493 | |
| Foreign currency translation, net of tax | Foreign currency translation, net of tax | — | | | — | | | — | | | (598) | | | — | | | (598) | |
| Pension and other postretirement benefits, net of tax | Pension and other postretirement benefits, net of tax | — | | | — | | | — | | | (30) | | | — | | | (30) | |
| Derivative financial instruments, net of tax | Derivative financial instruments, net of tax | — | | | — | | | — | | | (3) | | | — | | | (3) | |
| Available-for-sale securities, net of tax | Available-for-sale securities, net of tax | — | | | — | | | — | | | (34) | | | — | | | (34) | |
| Change in ownership from noncontrolling interests | Change in ownership from noncontrolling interests | — | | | — | | | — | | | — | | | (14) | | | (14) | |
Dividends declared 1 | Dividends declared 1 | — | | | — | | | (2,374) | | | — | | | — | | | (2,374) | |
| Distribution to noncontrolling interests | — | | | — | | | — | | | — | | | (4) | | | (4) | |
| Common shares issued from treasury stock for stock-based compensation: 3,571,503 | (68) | | | 203 | | | — | | | — | | | — | | | 135 | |
| | Common shares issued from treasury stock for stock-based compensation: 2,497,799 | |
| Common shares issued from treasury stock for stock-based compensation: 2,497,799 | |
| Common shares issued from treasury stock for stock-based compensation: 2,497,799 | |
| Stock-based compensation expense | Stock-based compensation expense | 200 | | | — | | | — | | | — | | | — | | | 200 | |
| Common shares repurchased: 12,987,299 2 | — | | | (2,668) | | | — | | | — | | | — | | | (2,668) | |
Common shares repurchased: 19,466,020 2 | |
Common shares repurchased: 19,466,020 2 | |
Common shares repurchased: 19,466,020 2 | |
| Outstanding authorized accelerated share repurchase | |
| Other | Other | 36 | | | — | | | — | | | — | | | (1) | | | 35 | |
| Balance at December 31, 2021 | $ | 6,398 | | | $ | (27,643) | | | $ | 39,282 | | | $ | (1,553) | | | $ | 32 | | | $ | 16,516 | |
| Balance at December 31, 2023 | |
1Dividends per share of common stock of $4.36, $4.12$5.10, $4.71 and $3.95$4.36 were declared in the years ended December 31, 2021, 20202023, 2022 and 2019,2021, respectively.
2See Note 16 regarding shares repurchased.
| | | | | | | | | | | | | | |
| See accompanying notes to Consolidated Financial Statements. |
| | STATEMENT 5 | STATEMENT 5 | | Caterpillar Inc. | STATEMENT 5 | | Caterpillar Inc. |
| Consolidated Statement of Cash Flow for the Years Ended December 31 | |
| Consolidated Statement of Cash Flow for the Years Ended December 31, | |
| (Millions of dollars) | |
| (Millions of dollars) | |
| (Millions of dollars) | (Millions of dollars) | |
| | | 2021 | | 2020 | | 2019 |
| | |
| | | 2023 | | 2022 | | 2021 |
| Cash flow from operating activities: | Cash flow from operating activities: | | | | | | Cash flow from operating activities: | | | |
| Profit (loss) of consolidated and affiliated companies | $ | 6,493 | | | $ | 3,003 | | | $ | 6,094 | |
| Profit of consolidated and affiliated companies | |
| Adjustments for non-cash items: | Adjustments for non-cash items: | | | | | | Adjustments for non-cash items: | | | |
| Depreciation and amortization | Depreciation and amortization | 2,352 | | | 2,432 | | | 2,577 | |
| Actuarial (gain) loss on pension and postretirement benefits | Actuarial (gain) loss on pension and postretirement benefits | (833) | | | 383 | | | 468 | |
| Provision (benefit) for deferred income taxes | Provision (benefit) for deferred income taxes | (383) | | | (74) | | | 28 | |
| | Loss on divestiture | |
| Goodwill impairment charge | |
| Other | Other | 216 | | | 1,000 | | | 675 | |
| Changes in assets and liabilities, net of acquisitions and divestitures: | Changes in assets and liabilities, net of acquisitions and divestitures: | | | | | | Changes in assets and liabilities, net of acquisitions and divestitures: | | | |
Receivables – trade and other | Receivables – trade and other | (1,259) | | | 1,442 | | | 171 | |
| Inventories | Inventories | (2,586) | | | (34) | | | 274 | |
| Accounts payable | Accounts payable | 2,041 | | | 98 | | | (1,025) | |
| Accrued expenses | Accrued expenses | 196 | | | (366) | | | 172 | |
| Accrued wages, salaries and employee benefits | Accrued wages, salaries and employee benefits | 1,107 | | | (544) | | | (757) | |
| Customer advances | Customer advances | 34 | | | (126) | | | (10) | |
Other assets – net | Other assets – net | (97) | | | (201) | | | (93) | |
Other liabilities – net | Other liabilities – net | (83) | | | (686) | | | (1,662) | |
| Net cash provided by (used for) operating activities | Net cash provided by (used for) operating activities | 7,198 | | | 6,327 | | | 6,912 | |
| | Cash flow from investing activities: | Cash flow from investing activities: | | | | | |
| Cash flow from investing activities: | |
| Cash flow from investing activities: | | | | |
Capital expenditures – excluding equipment leased to others | Capital expenditures – excluding equipment leased to others | (1,093) | | | (978) | | | (1,056) | |
| Expenditures for equipment leased to others | Expenditures for equipment leased to others | (1,379) | | | (1,137) | | | (1,613) | |
| Proceeds from disposals of leased assets and property, plant and equipment | Proceeds from disposals of leased assets and property, plant and equipment | 1,265 | | | 772 | | | 1,153 | |
| Additions to finance receivables | Additions to finance receivables | (13,002) | | | (12,385) | | | (12,777) | |
| Collections of finance receivables | Collections of finance receivables | 12,430 | | | 12,646 | | | 12,183 | |
| Proceeds from sale of finance receivables | Proceeds from sale of finance receivables | 51 | | | 42 | | | 235 | |
| Investments and acquisitions (net of cash acquired) | Investments and acquisitions (net of cash acquired) | (490) | | | (111) | | | (47) | |
| Proceeds from sale of businesses and investments (net of cash sold) | Proceeds from sale of businesses and investments (net of cash sold) | 36 | | | 25 | | | 41 | |
| Proceeds from sale of securities | 785 | | | 345 | | | 529 | |
| Proceeds from maturities and sale of securities | |
| Investments in securities | Investments in securities | (1,766) | | | (638) | | | (552) | |
Other – net | Other – net | 79 | | | (66) | | | (24) | |
| Net cash provided by (used for) investing activities | Net cash provided by (used for) investing activities | (3,084) | | | (1,485) | | | (1,928) | |
| | Cash flow from financing activities: | Cash flow from financing activities: | | | | | |
| Cash flow from financing activities: | |
| Cash flow from financing activities: | | | | |
| Dividends paid | Dividends paid | (2,332) | | | (2,243) | | | (2,132) | |
| Common stock issued, including treasury shares reissued | Common stock issued, including treasury shares reissued | 135 | | | 229 | | | 238 | |
| Common shares repurchased | Common shares repurchased | (2,668) | | | (1,130) | | | (4,047) | |
| | | Proceeds from debt issued (original maturities greater than three months): | |
| | Proceeds from debt issued (original maturities greater than three months): | |
| | Proceeds from debt issued (original maturities greater than three months): | Proceeds from debt issued (original maturities greater than three months): | | | | | | | | |
| - Machinery, Energy & Transportation | - Machinery, Energy & Transportation | 494 | | | 1,991 | | | 1,479 | |
| - Financial Products | - Financial Products | 6,495 | | | 8,440 | | | 8,362 | |
| Payments on debt (original maturities greater than three months): | Payments on debt (original maturities greater than three months): | | | | | | Payments on debt (original maturities greater than three months): | | | |
| - Machinery, Energy & Transportation | - Machinery, Energy & Transportation | (1,919) | | | (26) | | | (12) | |
| - Financial Products | - Financial Products | (7,877) | | | (8,211) | | | (8,285) | |
Short-term borrowings – net (original maturities three months or less) | Short-term borrowings – net (original maturities three months or less) | 3,488 | | | (2,804) | | | (138) | |
Other – net | Other – net | (4) | | | (1) | | | (3) | |
| Net cash provided by (used for) financing activities | Net cash provided by (used for) financing activities | (4,188) | | | (3,755) | | | (4,538) | |
| Effect of exchange rate changes on cash | Effect of exchange rate changes on cash | (29) | | | (13) | | | (44) | |
| Increase (decrease) in cash, cash equivalents and restricted cash | Increase (decrease) in cash, cash equivalents and restricted cash | (103) | | | 1,074 | | | 402 | |
| Cash, cash equivalents and restricted cash at beginning of period | Cash, cash equivalents and restricted cash at beginning of period | 9,366 | | | 8,292 | | | 7,890 | |
| Cash, cash equivalents and restricted cash at end of period | Cash, cash equivalents and restricted cash at end of period | $ | 9,263 | | | $ | 9,366 | | | $ | 8,292 | |
Cash equivalents primarily represent short-term, highly liquid investments with original maturities of generally three months or less.
| | | | | | | | | | | | | | |
| See accompanying notes to Consolidated Financial Statements. |
NOTES TO CONSOLIDATED FINANCIAL STATEMENTS
1.Operations and summary of significant accounting policies
A. Nature of operations
Information in our financial statements and related commentary are presented in the following categories:
Machinery, Energy & Transportation (ME&T) – We define ME&T as Caterpillar Inc. and its subsidiaries, excluding Financial Products. ME&T's information relates to the design, manufacturing and marketing of our products.
Financial Products – We define Financial Products as our finance and insurance subsidiaries, primarily Caterpillar Financial Services Corporation (Cat Financial) and Caterpillar Insurance Holdings Inc. (Insurance Services). Financial Products’ information relates to the financing to customers and dealers for the purchase and lease of Caterpillar and other equipment.
We sell our products primarily under the brands “Caterpillar,” “CAT,” design versions of “CAT” and “Caterpillar,” “EMD,” “FG Wilson,” “MaK,” “MWM,” “Perkins,” “Progress Rail,” “SEM” and “Solar Turbines.”
We conduct operations in our ME&T line of business under highly competitive conditions, including intense price competition. We place great emphasis on the high quality and performance of our products and our dealers’ service support. Although no one competitor is believed to produce all of the same types of equipment that we do, there are numerous companies, large and small, which compete with us in the sale of each of our products.
We distribute our machines principally through a worldwide organization of dealers (dealer network), 4443 located in the United States and 116113 located outside the United States, serving 193191 countries. We sell reciprocating engines principally through the dealer network and to other manufacturers for use in products. We also sell some of the reciprocating engines manufactured by our subsidiary Perkins Engines Company Limited through its worldwide network of 9088 distributors covering 171185 countries. We sell the FG Wilson branded electric power generation systems through its worldwide network of 110 distributors covering 109 countries. We also sell some of the large, medium speed reciprocating engines under the MaK brand through a worldwide network of 20 distributors covering 130 countries. Our dealers do not deal exclusively with our products; however, in most cases sales and servicing of our products are the dealers’ principal business. We sell some products, primarily turbines and locomotives, to end customers through sales forces employed by the company. At times, these employees are assisted by independent sales representatives.
The Financial Products line of business also conducts operations under highly competitive conditions. Financing for users of Caterpillar products is available through a variety of competitive sources, principally commercial banks and finance and leasing companies. We offer various financing, insurance and risk management products designed to support sales of our products and generate financing income for our company. We conduct a significant portion of Financial Products activity in North America, with additional offices in Latin America, Asia/Pacific, Europe Africa and the Middle East.
B. Basis of presentation
The consolidated financial statements include the accounts of Caterpillar Inc. and its subsidiaries where we have a controlling financial interest.
Investments in companies where our ownership exceeds 20 percent and we do not have a controlling interest or where the ownership is less than 20 percent and for which we have a significant influence are accounted for by the equity method.
We consolidate all variable interest entities (VIEs) where Caterpillar Inc. is the primary beneficiary. For VIEs, we assess whether we are the primary beneficiary as prescribed by the accounting guidance on the consolidation of VIEs. The primary beneficiary of a VIE is the party that has both the power to direct the activities that most significantly impact the entity’s economic performance and the obligation to absorb losses or the right to receive benefits that could potentially be significant to the VIE. See Note 21 for further discussion on a consolidated VIE.
Cat Financial has end-user customers and dealers that are VIEs of which we are not the primary beneficiary. Although we have provided financial support to these entities and therefore have a variable interest, we do not have the power to direct the activities that most significantly impact their economic performance. Our maximum exposure to loss from our involvement with these VIEs is limited to the credit risk inherently present in the financial support that we have provided. These risks wereCredit risk was evaluated and reflected in our financial statements as part of our overall portfolio of finance receivables and related allowance for credit losses.
We include shipping and handling costs in Cost of goods sold in Statement 1. Other operating (income) expenses primarily include Cat Financial’s depreciation on equipment leased to others, (gains) losses on divestitures, Insurance Services’ underwriting expenses, employee separation charges, (gains) losses on disposal of long-lived assets and long-lived asset impairment charges, legal settlements and accruals, contract termination costs and employee separation charges.
Prepaid expenses and other current assets in Statement 3 primarily include time deposits,investments in debt and equity securities, prepaid insurance, contract assets,and refundable income taxes, right of return assets, prepaid and refundable income taxes,insurance, contract assets, assets held for sale, core to be returned for remanufacturing, and restricted cash and other short-term investments.
Certain amounts for prior years have been reclassified to conform with the current-year financial statement presentation.
C. Inventories
We state inventories at the lower of cost or net realizable value. We principally determine cost using the last-in, first-out (LIFO) method. The value of inventories on the LIFO basis represented about 6065 percent of total inventories at both December 31, 20212023 and 2020.2022, respectively.
If the FIFO (first-in, first-out) method had been in use, inventories would have been $2,599$3,423 million and $2,132$3,321 million higher than reported at December 31, 20212023 and 2020,2022, respectively.
D. Depreciation and amortization
We compute depreciation of plant and equipment principally using accelerated methods. We compute depreciation on equipment leased to others, primarily for Financial Products, using the straight-line method over the term of the lease. The depreciable basis is the original cost of the equipment less the estimated residual value of the equipment at the end of the lease term. In 2021, 20202023, 2022 and 2019,2021, Cat Financial depreciation on equipment leased to others was $755$713 million, $758$718 million and $813$755 million, respectively, which we include in Other operating (income) expenses in Statement 1. In 2021, 20202023, 2022 and 2019,2021, consolidated depreciation expense was $2,050$1,929 million, $2,122$1,937 million and $2,253$2,050 million, respectively. We compute amortization of purchased finite-lived intangibles principally using the straight-line method, generally not to exceed a period of 20 years.
E. Foreign currency translation
The functional currency for most of our ME&T consolidated subsidiaries is the U.S. dollar. The functional currency for most of our Financial Products consolidated subsidiaries is the respective local currency. We include gains and losses resulting from the remeasurement of foreign currency amounts to the functional currency in Other income (expense) in Statement 1. We include gains and losses resulting from translating assets and liabilities from the functional currency to U.S. dollars in Accumulated other comprehensive income (loss) (AOCI) in Statement 3.
F. Derivative financial instruments
Our earnings and cash flow are subject to fluctuations due to changes in foreign currency exchange rates, interest rates and commodity prices. Our Risk Management Policy (policy) allows for the use of derivative financial instruments to prudently manage foreign currency exchange rate, interest rate and commodity price exposures. Our policy specifies that derivatives are not to be used for speculative purposes. Derivatives that we use are primarily foreign currency forward, option and cross currency contracts, interest rate contracts and commodity forward and option contracts. All derivatives are recorded at fair value. See Note 4 for more information.
G. Income taxes
We determine the provision for income taxes using the asset and liability approach taking into account guidance related to uncertain tax positions. Tax laws require items to be included in tax filings at different times than the items are reflected in the financial statements. We recognize a current liability for the estimated taxes payable for the current year. Deferred taxes represent the future tax consequences expected to occur when the reported amounts of assets and liabilities are recovered or paid. We adjust deferred taxes for enacted changes in tax rates and tax laws. We record valuation allowances to reduce deferred tax assets when it is more likely than not that a tax benefit will not be realized. See Note 6 for further discussion.
H. Goodwill
For acquisitions accounted for as a business combination, goodwill represents the excess of the cost over the fair value of the net assets acquired. We are required to test goodwill for impairment, at the reporting unit level, annually and when events or circumstances make it more likely than not that an impairment may have occurred. A reporting unit is an operating segment or one level below an operating segment (referred to as a component) to which goodwill is assigned when initially recorded. We assign goodwill to reporting units based on our integration plans and the expected synergies resulting from the acquisition. Because Caterpillar is a highly integrated company, the businesses we acquire are sometimes combined with or integrated into existing reporting units. When changes occur in the composition of our operating segments or reporting units, we reassign goodwill to the affected reporting units based on their relative fair values.
We perform our annual goodwill impairment test as of October 1 and monitor for interim triggering events on an ongoing basis. We review goodwill for impairment utilizing either a qualitative assessment or a quantitative goodwill impairment test. If we choose to perform a qualitative assessment and determine the fair value more likely than not exceeds the carrying value, no further evaluation is necessary. For reporting units where we perform the quantitative goodwill impairment test, we compare the fair value of each reporting unit, which we primarily determine using an income approach based on the present value of discounted cash flows, to the respective carrying value, which includes goodwill. If the fair value of the reporting unit exceeds its carrying value, we do not consider the goodwill impaired. If the carrying value is higher than the fair value, we would recognize the difference as an impairment loss. See Note 10 for further details.
I. Estimates in financial statements
The preparation of financial statements in conformity with accounting principles generally accepted in the United States of America requires management to make estimates and assumptions that affect reported amounts. The more significant estimates include: residual values for leased assets; fair values for goodwill impairment tests; warranty liability and reserves for product liability and insurance losses, postretirement benefits, post-sale discounts, credit losses and income taxes.
J. New accounting guidance
A. Adoption of new accounting standards
Reference rate reform Supplier finance programs(Accounting Standards Update (ASU) 2020-04) – (ASU 2022-04) — In March 2020,September 2022, the Financial Accounting Standards Board (FASB) issued accounting guidance to easeenhance the potential burdentransparency of supplier finance programs. The new standard requires annual disclosure of the key terms of the program, a description of where in accounting for reference rate reform related activities that impact debt, leases, derivativesthe financial statements amounts outstanding under the program are presented, a rollforward of such amounts, and other contracts.interim disclosure of amounts outstanding as of the end of each period. The guidance does not affect recognition, measurement, or financial statement presentation of supplier finance programs. The ASU was effective on January 1, 2023, except for the rollforward, which is optional and may be elected over time as reference rate reform activities occur between March 12, 2020 through December 31, 2022. Ineffective on January 2021, we elected to adopt optional expedients impacting our derivative instruments. In addition, in October 2021, we elected to adopt optional expedients for contract modifications.1, 2024. Our adoption of this guidance results in the optional expedients did not have a material impact onfollowing disclosures relating to our financial statements.supplier finance programs and related obligations.
We facilitate voluntary supplier finance programs (the “Programs”) through participating financial institutions. The Programs are available to a wide range of suppliers and allow them the option to manage their cash flow. We are not a party to the agreements between the participating financial institutions and the suppliers in connection with the Programs. The range of payment terms, typically 60-90 days, we negotiate with our suppliers is consistent, irrespective of whether a supplier participates in the Programs. The amount of obligations outstanding that are confirmed as valid to the participating financial institutions for suppliers who voluntarily participate in the Programs, included in Accounts payable in Statement 3, were $803 million and $862 million at December 31, 2023 and 2022, respectively.
We consider the applicability and impact of all ASUs. We adopted the following ASUs effective January 1, 2021,2023, none of which had a material impact on our financial statements:
| | | | | |
| ASU | Description |
2020-012021-08 | Investments - Equity securities, equity method and joint ventures and derivatives and hedgingBusiness combinations |
2020-082022-02 | Codification improvements – ReceivablesFinancial instruments - Nonrefundable fees and other costsCredit losses |
2021-012022-06 | Reference rate reform - Scope |
B. Accounting standards issued but not yet adopted
Segment reporting (ASU 2023-07) — In November 2023, the FASB issued accounting guidance that requires incremental disclosures related to reportable segments which includes significant segment expense categories and amounts for each reportable segment. The guidance is effective January 1, 2024, and will be adopted retrospectively. The adoption will result in incremental disclosures related to reportable segments in the 2024 year-end financial statements and interim periods beginning in 2025.We are in the process of evaluating the effect of this new guidance on the related disclosures.
Income tax reporting (ASU 2023-09) — In December 2023, the FASB issued accounting guidance to expand the annual disclosure requirements for income taxes, primarily related to the rate reconciliation and income taxes paid. This guidance is effective January 1, 2025, with early adoption permitted. This guidance can be applied prospectively or retrospectively. We are in the process of evaluating the effect of this new guidance on the related disclosures.
We consider the applicability and impact of all ASUs. We assessed ASUs not listed above and determined that they either were not applicable or were not expected to have a material impact on our financial statements.
2. Sales and revenue recognition
A. Sales of Machinery, Energy & Transportation
We recognize sales of ME&T when all the following criteria are satisfied: (i) a contract with an independently owned and operated dealer or an end user exists which has commercial substance; (ii) it is probable we will collect the amount charged to the dealer or end user; and (iii) we have completed our performance obligation whereby the dealer or end user has obtained control of the product. A contract with commercial substance exists once we receive and accept a purchase order under a dealer sales agreement, or once we enter into a contract with an end user. If collectibility is not probable, the sale is deferred and not recognized until collection is probable or payment is received. Control of our products typically transfers when title and risk of ownership of the product has transferred to the dealer or end user. Typically, where product is produced and sold in the same country, title and risk of ownership transfer when we ship the product. Products that are exported from a country for sale typically transfer title and risk of ownership at the border of the destination country.
Our remanufacturing operations are primarily focused on the remanufacture of Cat engines and components and rail related products. In this business, we inspect, clean and remanufacture used engines and related components (core). In connection with the sale of our remanufactured product to dealers, we collect a deposit that is repaid if the dealer returns an acceptable core within a specified time period. Caterpillar owns and has title to the cores when they are returned from dealers. The rebuilt engine or component (the core plus any new content) is then sold as a remanufactured product to dealers and end users. We recognize revenue pursuant to the same transfer of control criteria as ME&T sales noted above. At the time of sale, we recognize the deposit in Other current liabilities in Statement 3, and we recognize the core to be returned as an asset in Prepaid expenses and other current assets in Statement 3 at the estimated replacement cost (based on historical experience with usable cores). Upon receipt of an acceptable core, we repay the deposit and relieve the liability. We then transfer the returned core asset into inventory. In the event that the deposit is forfeited (i.e., upon failure by the dealer to return an acceptable core in the specified time period), we recognize the core deposit and the cost of the core in Sales and Cost of goods sold, respectively.
We provide discounts to dealers through merchandising programs. We have numerous programs that are designed to promote the sale of our products. The most common dealer programs provide a discount when the dealer sells a product to a targeted end user. Generally, we estimate the cost of these discounts for each product by model by geographic region based on historical experience and known changes in merchandising programs. We report the cost of these discounts as a reduction to the transaction price when we recognize the product sale. We accrue a corresponding post-sale discount reserve in Statement 3, which represents discounts we expect to pay on units sold. If discounts paid differ from those estimated, we report the difference as a change in the transaction price.
Except for replacement parts, no right of return exists on the sale of our products. We estimate replacement part returns based on historical experience and recognize a parts return asset in Prepaid expenses and other current assets in Statement 3, which represents our right to recover replacement parts we expect will be returned. We also recognize a refund liability in Other current liabilities in Statement 3 for the refund we expect to pay for returned parts. If actual replacement part returns differ from those estimated, we recognize the difference in the estimated replacement part return asset and refund liability in Cost of goods sold and Sales, respectively.
Trade receivables represent amounts due from dealers and end users for the sale of our products, and include amounts due from wholesale inventory financing provided by Cat Financial for a dealer's purchase of inventory. See Note 7 for further information. We recognize trade receivables from dealers and end users in Receivables – trade and other and Long-term receivables – trade and other in Statement 3. Trade receivables from dealers and end users were $7,923 million, $7,551 million and $7,267 million as of December 31, 2023, 2022 and 2021, respectively. Long-term trade receivables from dealers and end users were $589 million, $506 million and $624 million as of December 31, 2023, 2022 and 2021, respectively.
Our standard dealer invoice terms are established by marketing region. Our invoice terms for end user sales are established by the responsible business unit. Payments from dealers are due shortly after the time of sale. When we make a sale to a dealer, the dealer is responsible for payment even if the product is not sold to an end user. Dealers and end users must make payment within the established invoice terms to avoid potential interest costs. Interest at or above prevailing market rates may be charged on any past due balance, and generally our practice is to not forgive this interest. In addition, Cat Financial provides wholesale inventory financing for a dealer’s purchase of inventory. Wholesale inventory receivables have varying payment terms. We include wholesale inventory receivables in Receivables – trade and other and Long-term receivables – trade and other in Statement 3. See Note 7 for further information. We recognize trade receivables from dealers and end users in Receivables - trade and other and Long-term receivables trade and other in Statement 3. Trade receivables from dealers and end users were $7,267 million, $6,310 million and $7,648 million as of December 31, 2021, 2020 and 2019, respectively. Long-term trade receivables from dealers and end users were $624 million, $657 million and $693 million as of December 31, 2021, 2020 and 2019, respectively.
We establish an allowance for credit losses for ME&T receivables when it becomes probable that we will not collect the receivable. Our allowance for credit losses is not significant.significant for ME&T receivables.
For certain contracts, we invoice for payment when contractual milestones are achieved. We recognize a contract asset when a sale is recognized before achieving the contractual milestone for invoicing. We reduce the contract asset when we invoice for payment and recognize a corresponding trade receivable. Contract assets are included in Prepaid expenses and other current assets in Statement 3. Contract assets were $246 million, $247 million and $187 million as of December 31, 2023, 2022 and 2021, respectively.
We invoice in advance of recognizing the sale of certain products. We recognize advanced customer payments as a contract liability in Customer advances and Other liabilities in Statement 3. Contract liabilities were $1,557$2,389 million, $1,526$2,314 million and $1,654$1,557 million as of December 31, 2021, 20202023, 2022 and 2019,2021, respectively. We reduce the contract liability when we recognize revenue. During 2021,2023, we recognized $903$1,660 million of revenue that was recorded as a contract liability at the beginning of 2021.2023. During 2020,2022, we recognized $1,012$902 million of revenue that was recorded as a contract liability at the beginning of 2020.2022.
We have elected the practical expedient to not adjust the amount of revenue to be recognized under a contract with a dealer or end user for the effects of time value of money when the timing difference between receipt of payment and recognition of revenue is less than one year.
As of December 31, 2021,2023, we have entered into contracts with dealers and end users for which sales have not been recognized as we have not satisfied our performance obligations and transferred control of the products. The dollar amount of unsatisfied performance obligations for contracts with an original duration greater than one year is $6.4$12.5 billion, with about one-thirdone-half of the amount expected to be completed and revenue recognized in the twelve months following December 31, 2021.2023. We have elected the practical expedient to not disclose unsatisfied performance obligations with an original contract duration of one year or less. Contracts with an original duration of one year or less are primarily sales to dealers for machinery, engines and replacement parts.
We exclude sales and other related taxes from the transaction price. We account for shipping and handling costs associated with outbound freight after control over a product has transferred as a fulfillment cost which is included in Cost of goods sold.
We provide a standard manufacturer’s warranty of our products at no additional cost. At the time we recognize a sale, we record estimated future warranty costs. See Note 21 for further discussion of our product warranty liabilities.
See Note 23 for further disaggregated sales and revenues information.
B. Revenues of Financial Products
Revenues of Financial Products are generated primarily from finance revenue on finance receivables and rental payments on operating leases. We record finance revenue over the life of the related finance receivablereceivables using the interest method, including the accretion of certain direct origination costs that are deferred. We recognizeOperating lease revenue from rental payments received on operating leasesis recorded on a straight-line basis over the term of the lease.
We suspend recognition of finance revenue and operating lease revenue and place the account on non-accrual status when management determines that collection of future income is not probable (generally after 120 days past due). We resume recognition of revenue, and recognize previously suspended income, when we consider collection of remaining amounts to be probable. Payments received while the finance receivable is on non-accrual status are applied to interest and principal in accordance with the contractual terms. We write off interest earned but uncollected prior to the receivablereceivables being placed on non-accrual status through Provision for credit losses when, in the judgment of management, we consider it to be uncollectible. See Note 7 for more information.
3. Stock-based compensation
Our stock-based compensation plans primarily provide for the granting of stock options, restricted stock units (RSUs) and performance-based restricted stock units (PRSUs) to Officers and other key employees, as well as non-employee Directors. Stock options permit a holder to buy Caterpillar stock at the stock’s price when the option was granted. RSUs are agreements to issue shares of Caterpillar stock at the time of vesting. PRSUs are similar to RSUs and include performance conditions in the vesting terms of the award.
Our long-standing practices and policies specify that the Compensation Committee (the Committee) of the Board of Directors approve all stock-based compensation awards. The award approval process specifies the grant date, value and terms of the award. We consistently apply the same terms and conditions to all employee grants, including Officers. The Committee approves all individual Officer grants. We determine the number of stock-based compensation award units included in an individual’s award based on the methodology approved by the Committee. The exercise price methodology approved by the Committee is the closing price of the Company stock on the date of the grant. In June of 2014, shareholders approved the Caterpillar Inc. 2014 Long-Term Incentive Plan (the 2014 Plan) under which all new stock-based compensation awards arewere granted. In June of 2017,2023, shareholders amendedapproved the Caterpillar Inc. 2023 Long-Term Incentive Plan (the 2023 Plan), which superseded and restatedreplaced the Plan. The Plan initially provided that up to 38,800,000 Common Shares would be reserved for future issuance under the Plan, subject to adjustment in certain events. Subsequent to the shareholder approval of the amendment and restatement of the Plan, an additional 36,000,000 Common Shares became available for all awards under the2014 Plan.
Common stock issued from Treasury stock under the plans totaled 2,497,799 for 2023, 2,340,887 for 2022 and 3,571,503 for 2021, 5,317,243 for 2020 and 5,126,379 for 2019.2021. The total number of shares authorized for equity awards under the amended and restated Caterpillar Inc. 2014 Long-Term Incentive2023 Plan is 74,800,000,42,500,000. As of which 33,880,674December 31, 2023, 43,041,378 shares remained available for issuance, aswhich includes shares returned to the 2023 Plan upon cancellation or shares withheld for taxes incurred in connection with issuance or vesting of December 31, 2021.grants made under the 2014 Plan.
Stock option and RSU awards generally vest according to a three-year graded vesting schedule. One-third of the award will become vested on the first anniversary of the grant date, one-third of the award will become vested on the second anniversary of the grant date and one-third of the award will become vested on the third anniversary of the grant date. PRSU awards generally have a three-year performance period and cliff vest at the end of the period based upon achievement of performance targets established at the time of grant.
Upon separation from service, if the participant is 55 years of age or older with more than five years of service, the participant meets the criteria for a “Long Service Separation.” Award terms for stock option and RSU grants allow for continued vesting as of each vesting date specified in the award document for employees who meet the criteria for a “Long Service Separation” and fulfill a requisite service period of six months. We recognize compensation expense for eligible employees for the grants over the period from the grant date to the end date of the six-month requisite service period. For employees who become eligible for a “Long Service Separation” subsequent to the end date of the six-month requisite service period and prior to the completion of the vesting period, we recognized compensation expense over the period from the grant date to the date eligibility is achieved.
Award terms for PRSU grants allow for continued vesting upon achievement of the performance target specified in the award document for employees who meet the criteria for a “Long Service Separation” and fulfill a requisite service period of six months. We recognize compensation expense for the PRSU grants with respect to employees who have met the criteria for a “Long Service Separation” over the period from the grant date to the end of the six-month requisite service period. For employees who become eligible for a “Long Service Separation” subsequent to the end date of the six-month requisite service period and prior to the completion of the vesting period, we recognize compensation expense over the period from the grant date to the date eligibility is achieved.
At grant, option awards have a term life of ten years. For awards granted prior to 2016, if the “Long Service Separation” criteria are met, the vested options have a life that is the lesser of ten years from the original grant date or five years from the separation date. For awards granted beginning in 2016, the vested options have a life equal to ten years from the original grant date.
Accounting guidance on share-based payments requires companies to estimate the fair value of options on the date of grant using an option-pricing model. The fair value of our option grants was estimated using the Black-Scholes option-pricing model. The Black-Scholes option-pricing model considers a range of assumptions related to volatility, risk-free interest rate and historical employee behavior. Expected volatility was based on historical Caterpillar stock price movement and current implied volatilities from traded options on Caterpillar stock. The risk-free interest rate was based on U.S. Treasury security yields at the time of grant. The weighted-average dividend yield was based on historical information. We determine the expected life from the actual historical employee exercise behavior. The following table provides the assumptions used in determining the fair value of the Optionoption awards for the years ended December 31, 2021, 20202023, 2022 and 2019,2021, respectively.
| | | | | | Grant Year | Grant Year |
| | | 2021 | | 2020 | | 2019 | | 2023 | | 2022 | | 2021 |
| Weighted-average dividend yield | Weighted-average dividend yield | 2.6 | % | | 2.5 | % | | 2.6 | % | Weighted-average dividend yield | 2.6 | % | | 2.6 | % | | 2.6 | % |
| Weighted-average volatility | Weighted-average volatility | 32.9 | % | | 25.7 | % | | 29.1 | % | Weighted-average volatility | 31.0 | % | | 31.7 | % | | 32.9 | % |
| Range of volatilities | Range of volatilities | 29.2%-45.8% | | 24.5%-29.7% | | 25.1%- 38.7% | Range of volatilities | 28.5%-35.5% | | 25.3%-36.8% | | 29.2%- 45.8% |
| Range of risk-free interest rates | Range of risk-free interest rates | 0.06%-1.41% | | 1.21%-1.39% | | 2.48%-2.68% | Range of risk-free interest rates | 3.92%-5.03% | | 1.03%-2% | | 0.06%-1.41% |
| Weighted-average expected lives | Weighted-average expected lives | 8 years | | 8 years | | 7 years | Weighted-average expected lives | 7 years | | 8 years |
|
Beginning with the 2018 grant, weWe credit RSU and PRSU awards with dividend equivalent units on each date that we pay a cash dividend to holders of Common stock. We determine the fair value of the RSU and PRSU awards granted in 2021, 20202023, 2022 and 20192021 as the closing stock price on the date of the grant.
Please refer to Tables I and II below for additional information on our stock-based compensation awards.
| | | TABLE I — Financial Information Related to Stock-based Compensation | |
| TABLE I — Financial Information Related to Stock-based Compensation | |
TABLE I — Financial Information Related to Stock-based Compensation | | | | | Stock options | | RSUs | | PRSUs |
| | | Shares | | Weighted-
Average
Exercise
Price | | Shares | | Weighted-
Average
Grant Date Fair Value | | Shares | | Weighted-
Average
Grant Date Fair Value |
| | | | | | | | | | | | | Stock options | | RSUs | | PRSUs |
| Outstanding at January 1, 2021 | 10,076,983 | | | $ | 109.60 | | | 1,327,950 | | | $ | 134.89 | | | 727,757 | | | $ | 132.81 | |
| | | | Shares | | Weighted-
Average
Exercise
Price | | Shares | | Weighted-
Average
Grant Date Fair Value | | Shares | | Weighted-
Average
Grant Date Fair Value |
| | | | | | |
| Outstanding at January 1, 2023 | |
| Granted to officers and key employees | Granted to officers and key employees | 1,084,821 | | | $ | 219.76 | | | 472,698 | | | $ | 216.50 | | | 285,056 | | | $ | 215.45 | |
| Exercised | Exercised | (3,399,720) | | | $ | 103.45 | | | — | | | $ | — | | | — | | | $ | — | |
| Vested | Vested | — | | | $ | — | | | (665,357) | | | $ | 138.90 | | | (356,618) | | | $ | 138.35 | |
| Forfeited / expired | Forfeited / expired | (39,664) | | | $ | 161.34 | | | (35,110) | | | $ | 167.12 | | | (10,822) | | | $ | 163.02 | |
| Outstanding at December 31, 2021 | 7,722,420 | | | $ | 127.52 | | | 1,100,181 | | | $ | 166.50 | | | 645,373 | | | $ | 165.74 | |
| Exercisable at December 31, 2021 | 4,914,111 | | | $ | 106.36 | | | | | | |
| Outstanding at December 31, 2023 | |
| Exercisable at December 31, 2023 | |
|
| | | | | | | | | | | | | | | | | | | | | | | | | | | | | | | | | | | | | | | | | | | | | | | | | | |
| Stock options outstanding and exercisable as of December 31, 2021: |
| | | | |
| | | Outstanding | | Exercisable |
| Exercise Prices | | Shares Outstanding at 12/31/2021 | | Weighted-
Average
Remaining
Contractual Life (Years) | | Weighted-
Average
Exercise Price | | Aggregate Intrinsic Value 1 | | Shares Outstanding at 12/31/2021 | | Weighted-
Average
Remaining
Contractual Life (Years) | | Weighted-
Average
Exercise Price | | Aggregate Intrinsic Value 1 |
| $74.77-$83.00 | | 1,846,000 | | | 3.75 | | $ | 78.65 | | | $ | 236 | | | 1,846,000 | | | 3.75 | | $ | 78.65 | | | $ | 236 | |
| $89.75-$96.31 | | 1,225,687 | | | 4.01 | | $ | 95.20 | | | 137 | | | 1,225,182 | | | 4.01 | | $ | 95.20 | | | 137 | |
| $110.09 | | 39,909 | | | 0.17 | | $ | 110.09 | | | 4 | | | 39,909 | | | 0.17 | | $ | 110.09 | | | 4 | |
| $127.60-$138.35 | | 2,675,475 | | | 7.88 | | $ | 131.81 | | | 200 | | | 936,141 | | | 7.68 | | $ | 134.01 | | | 68 | |
| $151.12-$219.76 | | 1,935,349 | | | 7.93 | | $ | 189.01 | | | 34 | | | 866,879 | | | 6.26 | | $ | 151.12 | | | 48 | |
| | | 7,722,420 | | | | | $ | 127.52 | | | $ | 611 | | | 4,914,111 | | | | | $ | 106.36 | | | $ | 493 | |
| | | | | | | | | | | | | | | | | | | | | | | | | | | | | | | | | | | | | | | | | | | | | | | | | | |
| | | | | | | | | | | | | | | | |
| Stock options outstanding and exercisable as of December 31, 2023: |
| | | | |
| | | Outstanding | | Exercisable |
| Exercise Prices | | Shares Outstanding at 12/31/2023 | | Weighted-
Average
Remaining
Contractual Life (Years) | | Weighted-
Average
Exercise Price | | Aggregate Intrinsic Value 1 | | Shares Outstanding at 12/31/2023 | | Weighted-
Average
Remaining
Contractual Life (Years) | | Weighted-
Average
Exercise Price | | Aggregate Intrinsic Value 1 |
| $74.77-$83.00 | | 629,402 | | | 1.66 | | $ | 79.18 | | | $ | 136 | | | 629,402 | | | 1.66 | | $ | 79.18 | | | $ | 136 | |
| $95.66-$96.31 | | 462,978 | | | 2.92 | | $ | 95.72 | | | 93 | | | 462,473 | | | 2.92 | | $ | 95.72 | | | 92 | |
| $127.60 | | 642,416 | | | 6.25 | | $ | 127.60 | | | 108 | | | 642,416 | | | 6.25 | | $ | 127.60 | | | 108 | |
| $138.35-$151.12 | | 756,964 | | | 4.78 | | $ | 144.22 | | | 115 | | | 756,964 | | | 4.78 | | $ | 144.22 | | | 115 | |
| $196.70-$219.76 | | 1,885,071 | | | 7.78 | | $ | 208.14 | | | 165 | | | 875,459 | | | 7.60 | | $ | 212.23 | | | 73 | |
| $253.98 | | 764,532 | | | 9.31 | | $ | 253.98 | | | 32 | | | — | | | 0.00 | | $ | — | | | — | |
| | | 5,141,363 | | | | | $ | 169.57 | | | $ | 649 | | | 3,366,714 | | | | | $ | 139.91 | | | $ | 524 | |
1 The difference between a stock award’s exercise price and the underlying stock’s closing market price at December 31, 2021,2023, for awards with market price greater than the exercise price. Amounts are in millions of dollars.
The computations of weighted-average exercise prices and aggregate intrinsic values are not applicable to RSUs or PRSUs since these awards represent an agreement to issue shares of stock at the time of vesting. At December 31, 2021,2023, there were 1,100,181829,386 outstanding RSUs with a weighted average remaining contractual life of 1.4 years and 645,373480,759 outstanding PRSUs with a weighted-average remaining contractual life of 1.41.5 years.
| | TABLE II— Additional Stock-based Award Information | | TABLE II— Additional Stock-based Award Information | |
| TABLE II— Additional Stock-based Award Information | |
| | (Dollars in millions except per share data) | |
| (Dollars in millions except per share data) | |
| (Dollars in millions except per share data) | (Dollars in millions except per share data) | | 2021 | | 2020 | | 2019 | | 2023 | | 2022 | | 2021 |
| Stock options activity: | Stock options activity: | | | | | | | Stock options activity: | | | | |
| Weighted-average fair value per share of stock awards granted | Weighted-average fair value per share of stock awards granted | | $ | 56.30 | | | $ | 25.98 | | | $ | 40.98 | |
| Intrinsic value of stock awards exercised | Intrinsic value of stock awards exercised | | $ | 374 | | | $ | 386 | | | $ | 264 | |
Fair value of stock awards vested 1 | Fair value of stock awards vested 1 | | $ | 59 | | | $ | 64 | | | $ | 100 | |
| Cash received from stock awards exercised | Cash received from stock awards exercised | | $ | 212 | | | $ | 282 | | | $ | 298 | |
| | RSUs activity: | RSUs activity: | | | | | | |
| RSUs activity: | |
| RSUs activity: | | | |
| Weighted-average fair value per share of stock awards granted | Weighted-average fair value per share of stock awards granted | | $ | 216.50 | | | $ | 128.07 | | | $ | 138.61 | |
Fair value of stock awards vested 2 | Fair value of stock awards vested 2 | | $ | 136 | | | $ | 87 | | | $ | 110 | |
| | PRSUs activity: | PRSUs activity: | | | | | | |
| PRSUs activity: | |
| PRSUs activity: | | | |
| Weighted-average fair value per share of stock awards granted | Weighted-average fair value per share of stock awards granted | | $ | 215.45 | | | $ | 128.41 | | | $ | 138.67 | |
Fair value of stock awards vested 2 | Fair value of stock awards vested 2 | | $ | 74 | | | $ | 59 | | | $ | 59 | |
1 Based on the grant date fair value.
2 Based on the underlying stock’s closing market price on the vesting date.
In accordance with guidance on share-based payments, stock-based compensation expense is based on the grant date fair value and is classified within Cost of goods sold, Selling, general and administrative expenses and Research and development expenses corresponding to the same line item as the cash compensation paid to respective employees, officers and non-employee directors. We recognize stock-based compensation expense on a straight-line basis over the requisite service period for awards with terms that specify cliff or graded vesting and contain only service conditions. Stock-based compensation expense for PRSUs is based on the probable number of shares expected to vest and is recognized primarily on a straight-line basis.
Before tax, stock-based compensation expense for 2023, 2022 and 2021 2020 and 2019 was $200$208 million, $202$193 million and $205$200 million, respectively, with a corresponding income tax benefit of $23$33 million, $34$32 million and $35$23 million, respectively.
The amount of stock-based compensation expense capitalized for the years ended December 31, 2021, 20202023, 2022 and 20192021 did not have a significant impact on our financial statements.
At December 31, 2021,2023, there was $143$134 million of total unrecognized compensation cost from stock-based compensation arrangements granted under the plans, which is related to non-vested stock-based awards. We expect to recognize the compensation expense over a weighted-average period of approximately 1.7 years.
We currently use shares in Treasury stock to satisfy share award exercises.
The cash tax benefits realized from stock awards exercised for 2023, 2022 and 2021 2020 and 2019 were $102$89 million, $108$63 million and $89$102 million, respectively. We use the direct only method and tax law ordering approach to calculate the tax effects of stock-based compensation.
4. Derivative financial instruments and risk management
Our earnings and cash flow are subject to fluctuations due to changes in foreign currency exchange rates, interest rates and commodity prices. Our Risk Management Policy (policy) allows for the use of derivative financial instruments to prudently manage foreign currency exchange rate, interest rate and commodity price exposures. Our policy specifies that derivatives are not to be used for speculative purposes. Derivatives that we use are primarily foreign currency forward, option and cross currency contracts, interest rate contracts and commodity forward and option contracts. Our derivative activities are subject to the management, direction and control of our senior financial officers. We present at least annually to the Audit Committee of the Board of Directors on our risk management practices, including our use of financial derivative instruments.
We recognize all derivatives at their fair value in Statement 3. On the date the derivative contract is entered into, we designate the derivative as (1) a hedge of the fair value of a recognized asset or liability (fair value hedge), (2) a hedge of a forecasted transaction or the variability of cash flow (cash flow hedge) or (3) an undesignated instrument. We record in current earnings changes in the fair value of a derivative that is qualified, designated and highly effective as a fair value hedge, along with the gain or loss on the hedged recognized asset or liability that is attributable to the hedged risk. We record in AOCI changes in the fair value of a derivative that is qualified, designated and highly effective as a cash flow hedge, to the extent effective, in Statement 3 until we reclassify them to earnings in the same period or periods during which the hedged transaction affects earnings. We report changes in the fair value of undesignated derivative instruments in current earnings. We classify cash flows from designated derivative financial instruments within the same category as the item being hedged on Statement 5. We include cash flows from undesignated derivative financial instruments in the investing category on Statement 5.
We formally document all relationships between hedging instruments and hedged items, as well as the risk-management objective and strategy for undertaking various hedge transactions. This process includes linking all derivatives that are designated as fair value hedges to specific assets and liabilities in Statement 3 and linking cash flow hedges to specific forecasted transactions or variability of cash flow.
We also formally assess, both at the hedge’s inception and on an ongoing basis, whether the designated derivatives that are used in hedging transactions are highly effective in offsetting changes in fair values or cash flow of hedged items. When a derivative is determined not to be highly effective as a hedge or the underlying hedged transaction is no longer probable, we discontinue hedge accounting prospectively, in accordance with the derecognition criteria for hedge accounting.
A.Foreign currency exchange rate risk
Foreign currency exchange rate movements create a degree of risk by affecting the U.S. dollar value of sales made and costs incurred in foreign currencies. Movements in foreign currency rates also affect our competitive position as these changes may affect business practices and/or pricing strategies of non-U.S.-based competitors. Additionally, we have balance sheet positions denominated in foreign currencies, thereby creating exposure to movements in exchange rates.
Our ME&T operations purchase, manufacture and sell products in many locations around the world. As we have a diversified revenue and cost base, we manage our future foreign currency cash flow exposure on a net basis. We use foreign currency forward and option contracts to manage unmatched foreign currency cash inflow and outflow. Our objective is to minimize the risk of exchange rate movements that would reduce the U.S. dollar value of our foreign currency cash flow. Our policy allows for managing anticipated foreign currency cash flow for up to approximately five years. As of December 31, 2021,2023, the maximum term of these outstanding contracts at inception was approximately 60 months.
We generally designate as cash flow hedges at inception of the contract any Australian dollar, Brazilian real, British pound, Canadian dollar, Chinese yuan, Euro, Indian rupee, Japanese yen, Mexican peso, Norwegian Krona, Singapore dollar or Thailand bahtforeign currency forward or option contracts that meet the requirements for hedge accounting and the maturity extends beyond the current quarter-end. We perform designation on a specific exposure basis to support hedge accounting. The remainder of ME&T foreign currency contracts are undesignated.
In managing foreign currency risk for our Financial Products operations, our objective is to minimize earnings volatility resulting from conversion and the remeasurement of net foreign currency balance sheet positions and future transactions denominated in foreign currencies. Our policy allows the use of foreign currency forward, option and cross currency contracts to offset the risk of currency mismatch between our assets and liabilities and exchange rate risk associated with future transactions denominated in foreign currencies. Our foreign currency forward and option contracts are primarily undesignated. We designate fixed-to-fixed cross currency contracts as cash flow hedges to protect against movements in exchange rates on foreign currency fixed-rate assets and liabilities.
B.Interest rate risk
Interest rate movements create a degree of risk by affecting the amount of our interest payments and the value of our fixed-rate debt. Our practice is to use interest rate contracts to manage our exposure to interest rate changes.
Our ME&T operations generally use fixed-rate debt as a source of funding. Our objective is to minimize the cost of borrowed funds. Our policy allows us to enter into fixed-to-floating interest rate contracts and forward rate agreements to meet that objective. We designate fixed-to-floating interest rate contracts as fair value hedges at inception of the contract, and we designate certain forward rate agreements as cash flow hedges at inception of the contract.
Financial Products operations has a match-funding policy that addresses interest rate risk by aligning the interest rate profile (fixed or floating rate and duration) of Cat Financial’s debt portfolio with the interest rate profile of our receivables portfolio within predetermined ranges on an ongoing basis. In connection with that policy, we use interest rate derivative instruments to modify the debt structure to match assets within the receivables portfolio. This matched funding reduces the volatility of margins between interest-bearing assets and interest-bearing liabilities, regardless of which direction interest rates move.
Our policy allows us to use fixed-to-floating, floating-to-fixed and floating-to-floating interest rate contracts to meet the match-funding objective. We designate fixed-to-floating interest rate contracts as fair value hedges to protect debt against changes in fair value due to changes in the benchmark interest rate. We designate most floating-to-fixed interest rate contracts as cash flow hedges to protect against the variability of cash flows due to changes in the benchmark interest rate.
We have, at certain times, liquidated fixed-to-floating and floating-to-fixed interest rate contracts at both ME&T and Financial Products. We amortize the gains or losses associated with these contracts at the time of liquidation into earnings over the original term of the previously designated hedged item.
C.Commodity price risk
Commodity price movements create a degree of risk by affecting the price we must pay for certain raw materials. Our policy is to use commodity forward and option contracts to manage the commodity risk and reduce the cost of purchased materials.
Our ME&T operations purchase base and precious metals embedded in the components we purchase from suppliers. Our suppliers pass on to us price changes in the commodity portion of the component cost. In addition, we are subject to price changes on energy products such as natural gas and diesel fuel purchased for operational use.
Our objective is to minimize volatility in the price of these commodities. Our policy allows us to enter into commodity forward and option contracts to lock in the purchase price of a portion of these commodities within a five-year horizon. All such commodity forward and option contracts are undesignated.
The location and fair value of derivative instruments reported in Statement 3 were as follows:
| | | | | | | | | | | | | | | | | |
| Consolidated
Statement of Financial Position Location | | Asset (Liability) Fair Value |
| (Millions of dollars) | | | Years ended December 31, |
| | | | 2021 | | 2020 |
| Designated derivatives | | | | | |
| Foreign exchange contracts | | | | | |
| Machinery, Energy & Transportation | Receivables — trade and other | | $ | 58 | | | $ | 74 | |
| Machinery, Energy & Transportation | Long-term receivables — trade and other | | 28 | | | 71 | |
| Machinery, Energy & Transportation | Accrued expenses | | (26) | | | (36) | |
| Machinery, Energy & Transportation | Other liabilities | | (6) | | | (1) | |
| Financial Products | Receivables — trade and other | | 109 | | | 1 | |
| Financial Products | Long-term receivables — trade and other | | 33 | | | 1 | |
| Financial Products | Accrued expenses | | (32) | | | (148) | |
| | | | | |
| Interest rate contracts | | | | | |
| | | | | |
| Machinery, Energy & Transportation | Long-term receivables — trade and other | | — | | | 4 | |
| | | | | |
| Financial Products | Receivables — trade and other | | 7 | | | 2 | |
| Financial Products | Long-term receivables — trade and other | | 31 | | | 57 | |
| Financial Products | Accrued expenses | | (15) | | | (5) | |
| | | | $ | 187 | | | $ | 20 | |
| | | | | |
| Undesignated derivatives | | | | | |
| Foreign exchange contracts | | | | | |
| Machinery, Energy & Transportation | Receivables — trade and other | | $ | 18 | | | $ | 10 | |
| | | | | |
| Machinery, Energy & Transportation | Accrued expenses | | (6) | | | (1) | |
| | | | | |
| Financial Products | Receivables — trade and other | | 21 | | | 17 | |
| Financial Products | Long-term receivables — trade and other | | 7 | | | 7 | |
| Financial Products | Accrued expenses | | (36) | | | (107) | |
| | | | | |
| | | | | |
| | | | | |
| | | | | |
| | | | | |
| Commodity contracts | | | | | |
| Machinery, Energy & Transportation | Receivables — trade and other | | 30 | | | 35 | |
| Machinery, Energy & Transportation | Long-term receivables — trade and other | | — | | | 2 | |
| Machinery, Energy & Transportation | Accrued expenses | | (9) | | | — | |
| | | | | |
| | | | $ | 25 | | | $ | (37) | |
| | | | | |
| | | | | | | | | | | | | | | | | | | | | | | | | | | | |
| (Millions of dollars) | Fair Value | | | | | |
| December 31, 2023 | | December 31, 2022 | | | | | |
| Assets 1 | | Liabilities 2 | | Assets 1 | | Liabilities 2 | | | | | |
| Designated derivatives | | | | | | | | | | | | |
| Foreign exchange contracts | $ | 389 | | | $ | (155) | | | $ | 462 | | | $ | (152) | | | | | | |
| Interest rate contracts | 58 | | | (209) | | | 93 | | | (288) | | | | | | |
| Total | $ | 447 | | | $ | (364) | | | $ | 555 | | | $ | (440) | | | | | | |
| | | | | | | | | | | | |
| Undesignated derivatives | | | | | | | | | | | | |
| Foreign exchange contracts | $ | 55 | | | $ | (82) | | | $ | 65 | | | $ | (47) | | | | | | |
| Commodity contracts | 18 | | | (9) | | | 24 | | | (9) | | | | | | |
| Total | $ | 73 | | | $ | (91) | | | $ | 89 | | | $ | (56) | | | | | | |
| | | | | | | | | | | | |
1 Assets are classified in Statement 3 as Receivables - trade and other or Long-term receivables - trade and other. | | | | | |
2 Liabilities are classified in Statement 3 as Accrued expenses or Other liabilities. | | | | | |
The total notional amounts of the derivative instruments as of December 31, 2023 and 2022 were as follows:
| | | | | | | | | | | | | | |
| Years ended December 31, |
| (Millions of dollars) | | 2021 | | 2020 |
| | | | |
| Machinery, Energy & Transportation | | $ | 5,085 | | | $ | 3,553 | |
| Financial Products | | $ | 13,852 | | | $ | 11,260 | |
| | | | |
$25.6 billion and $24.3 billion, respectively. The notional amounts of the derivative financial instruments do not represent amounts exchanged by the parties. We calculate the amounts exchanged by the parties by reference toreferencing the notional amounts and by other terms of the derivatives, such as foreign currency exchange rates, interest rates or commodity prices.
The effect of derivatives designatedGains (losses) on derivative instruments are categorized as hedging instruments on Statement 1 was as follows:
| | | | | | | | | | | | | | | | | | | | | | | | | | | |
| Cash Flow Hedges | | | | | | | | | |
| (Millions of dollars) | | Year ended December 31, 2021 | |
| | | | | Recognized in Earnings | |
| | Amount of
Gains (Losses) Recognized in AOCI | | Classification of
Gains (Losses) | | Amount of Gains (Losses) Reclassified from AOCI | | Amount of the line items in Statement 1 | |
| Foreign exchange contracts | | | | | | | | | |
| Machinery, Energy & Transportation | | $ | (21) | | | Sales of Machinery, Energy & Transportation | | $ | (13) | | | $ | 48,188 | | |
| | | | Cost of goods sold | | 46 | | | 35,513 | | |
| Financial Products | | 190 | | | Interest expense of Financial Products | | (5) | | | 455 | | |
| | | | Other income (expense) | | 199 | | | 1,814 | | |
| Interest rate contracts | | | | | | | | | |
| Machinery, Energy & Transportation | | 7 | | | Interest expense excluding Financial Products | | (3) | | | 488 | | |
| Financial Products | | 19 | | | Interest expense of Financial Products | | (28) | | | 455 | | |
| | | $ | 195 | | | | | $ | 196 | | | | |
| | | | | | | | | |
| | | Year ended December 31, 2020 | |
| | | | | Recognized in Earnings | |
| | | Amount of
Gains (Losses) Recognized in AOCI | | Classification of
Gains (Losses) | | Amount of Gains (Losses) Reclassified from AOCI | | Amount of the line items in Statement 1 | |
| Foreign exchange contracts | | | | | | | | | |
| Machinery, Energy & Transportation | | $ | 48 | | | Sales of Machinery, Energy & Transportation | | $ | 2 | | | $ | 39,022 | | |
| | | | Cost of goods sold | | (55) | | | 29,082 | | |
| Financial Products | | (130) | | | Interest expense of Financial Products | | 32 | | | 589 | | |
| | | | Other income (expense) | | (164) | | | (44) | | |
| Interest rate contracts | | | | | | | | | |
| Machinery, Energy & Transportation | | (11) | | | Interest expense excluding Financial Products | | (4) | | | 514 | | |
| Financial Products | | (23) | | | Interest expense of Financial Products | | (52) | | | 589 | | |
| | | $ | (116) | | | | | $ | (241) | | | | |
| | | | | | | | | |
| | | Year ended December 31, 2019 | |
| | | | | Recognized in Earnings | |
| | | Amount of
Gains (Losses) Recognized in AOCI | | Classification of
Gains (Losses) | | Amount of Gains (Losses) Reclassified from AOCI | | Amount of the line items in Statement 1 | |
| Foreign exchange contracts | | | | | | | | | |
| Machinery, Energy & Transportation | | $ | 34 | | | Sales of Machinery, Energy & Transportation | | $ | 11 | | | $ | 50,755 | | |
| | | | Cost of goods sold | | (3) | | | 36,630 | | |
| Financial Products | | 93 | | Interest expense of Financial Products | | 33 | | | 754 | | |
| | | | Other income (expense) | | 37 | | | (57) | | |
| Interest rate contracts | | | | | | | | | |
| Machinery, Energy & Transportation | | — | | | Interest expense excluding Financial Products | | (4) | | | 421 | | |
| Financial Products | | (70) | | | Interest expense of Financial Products | | (8) | | | 754 | | |
| | | $ | 57 | | | | | $ | 66 | | | | |
| | | | | | | | | | | | | | | | | | | | | | | | | | | | | | | | | | | | | | | | | | | | | | | | | | | | | |
| (Millions of dollars) | Years ended December 31, |
| Fair Value / Undesignated Hedges | | Cash Flow Hedges |
| Gains (Losses) Recognized in Statement 11 | | Gains (Losses) Recognized in AOCI | | Gains (Losses) Reclassified from AOCI2 |
| 2023 | | 2022 | | 2021 | | 2023 | | 2022 | | 2021 | | 2023 | | 2022 | | 2021 |
| Foreign exchange contracts | $ | 12 | | | $ | (57) | | | $ | 104 | | | $ | 39 | | | $ | 264 | | | $ | 169 | | | $ | (58) | | | $ | 329 | | | $ | 227 | |
| Interest rate contracts | (135) | | | (6) | | | 24 | | | 9 | | | 111 | | | 26 | | | 55 | | | 11 | | | (31) | |
| Commodity contracts | 10 | | | 51 | | | 56 | | | — | | | — | | | — | | | — | | | — | | | — | |
| Total | $ | (113) | | | $ | (12) | | | $ | 184 | | | $ | 48 | | | $ | 375 | | | $ | 195 | | | $ | (3) | | | $ | 340 | | | $ | 196 | |
| | | | | | | | | | | | | | | | | |
1 Foreign exchange contract and Commodity contract gains (losses) are included in Other income (expense) in Statement 1. Interest rate contract gains (losses) are included in Interest expense of Financial Products and Interest expense excluding Financial Products in Statement 1. |
2 Foreign exchange contract gains (losses) are primarily included in Other income (expense) in Statement 1. Interest rate contract gains (losses) are primarily included in Interest expense of Financial Products in Statement 1. |
The effect of derivatives not designated as hedging instruments onfollowing amounts were recorded in Statement 1 was as follows: 3 related to cumulative basis adjustments for fair value hedges:
| | | | | | | | | | | | | | | | | | | | | | | | | | |
| | | | | Years ended December 31, |
| (Millions of dollars) | | Classification of Gains (Losses) | | 2021 | | 2020 | | 2019 |
| Foreign exchange contracts | | | | | | | | |
| Machinery, Energy & Transportation | | Other income (expense) | | $ | 15 | | | $ | 38 | | | $ | 13 | |
| Financial Products | | Other income (expense) | | 89 | | | (112) | | | (37) | |
| | | | | | | | |
| | | | | | | | |
| | | | | | | | |
| Commodity contracts | | | | | | | | |
| Machinery, Energy & Transportation | | Other income (expense) | | 56 | | | 11 | | | 18 | |
| | | | | $ | 160 | | | $ | (63) | | | $ | (6) | |
| | | | | | | | |
| | | | | | | | | | | | | | | | | | | | | | | |
| (Millions of dollars) | Years ended December 31, |
| Carrying Value of the Hedged Liabilities | | Cumulative Amount of Fair Value Hedging Adjustment Included in the Carrying Value of the Hedged Liabilities |
| 2023 | | 2022 | | 2023 | | 2022 |
| Long-term debt due within one year | $ | 982 | | | $ | — | | | $ | (23) | | | $ | — | |
| Long-term debt due after one year | 4,245 | | | 4,173 | | | (156) | | | (280) | |
| Total | $ | 5,227 | | | $ | 4,173 | | | $ | (179) | | | $ | (280) | |
| | | | | | | |
We enter into International Swaps and Derivatives Association (ISDA) master netting agreements within ME&T and Financial Products that permit the net settlement of amounts owed under their respective derivative contracts. Under these master netting agreements, net settlement generally permits the company or the counterparty to determine the net amount payable for contracts due on the same date and in the same currency for similar types of derivative transactions. The master netting agreements generallymay also provide for net settlement of all outstanding contracts with a counterparty in the case of an event of default or a termination event.
Collateral is generallytypically not required of the counterparties or of our company under the master netting agreements. As of December 31, 20212023 and 2020,2022, no cash collateral was received or pledged under the master netting agreements.
The effect of the net settlement provisions of the master netting agreements on our derivative balances upon an event of default or termination event was as follows:
| | | | | | | | | | | | | | | | | | | | | | | | | | | | | | | | | | | | | | | | | |
| December 31, 2021 | | | | | | | | Gross Amounts Not Offset in the Statement of Financial Position | | | |
| (Millions of dollars) | | Gross Amount of Recognized Assets | | Gross Amounts Offset in the Statement of Financial Position | | Net Amount of Assets Presented in the Statement of Financial Position | | Financial Instruments | | Cash Collateral Received | | Net Amount of Assets | |
| Derivatives | | | | | | | | | | | | | |
| Machinery, Energy & Transportation | | $ | 134 | | | $ | — | | | $ | 134 | | | $ | (47) | | | $ | — | | | $ | 87 | | |
| Financial Products | | 208 | | | — | | | 208 | | | (67) | | | — | | | 141 | | |
| Total | | $ | 342 | | | $ | — | | | $ | 342 | | | $ | (114) | | | $ | — | | | $ | 228 | | |
| | | | | | | | | | | | | | | | | | | | | | | | | | | | | | | | | | | | | | | | | |
| December 31, 2021 | | | | | | | | Gross Amounts Not Offset in the Statement of Financial Position | | | |
| (Millions of dollars) | | Gross Amount of Recognized Liabilities | | Gross Amounts Offset in the Statement of Financial Position | | Net Amount of Liabilities Presented in the Statement of Financial Position | | Financial Instruments | | Cash Collateral Pledged | | Net Amount of Liabilities | |
| Derivatives | | | | | | | | | | | | | |
| Machinery, Energy & Transportation | | $ | (47) | | | $ | — | | | $ | (47) | | | $ | 47 | | | $ | — | | | $ | — | | |
| Financial Products | | (83) | | | — | | | (83) | | | 67 | | | — | | | (16) | | |
| Total | | $ | (130) | | | $ | — | | | $ | (130) | | | $ | 114 | | | $ | — | | | $ | (16) | | |
| | | | | | | | | | | | | | | | | | | | | | | | | | | | | | | | | | | | | | | | | |
| December 31, 2020 | | | | | | | | Gross Amounts Not Offset in the Statement of Financial Position | | | |
| (Millions of dollars) | | Gross Amount of Recognized Assets | | Gross Amounts Offset in the Statement of Financial Position | | Net Amount of Assets Presented in the Statement of Financial Position | | Financial Instruments | | Cash Collateral Received | | Net Amount of Assets | |
| Derivatives | | | | | | | | | | | | | |
| Machinery, Energy & Transportation | | $ | 196 | | | $ | — | | | $ | 196 | | | $ | (38) | | | $ | — | | | $ | 158 | | |
| Financial Products | | 85 | | | — | | | 85 | | | (57) | | | — | | | 28 | | |
| Total | | $ | 281 | | | $ | — | | | $ | 281 | | | $ | (95) | | | $ | — | | | $ | 186 | | |
| | | | | | | | | | | | | | | | | | | | | | | | | | | | | | | | | | | | | | | | | |
| December 31, 2020 | | | | | | | | Gross Amounts Not Offset in the Statement of Financial Position | | | |
| (Millions of dollars) | | Gross Amount of Recognized Liabilities | | Gross Amounts Offset in the Statement of Financial Position | | Net Amount of Liabilities Presented in the Statement of Financial Position | | Financial Instruments | | Cash Collateral Pledged | | Net Amount of Liabilities | |
| Derivatives | | | | | | | | | | | | | |
| Machinery, Energy & Transportation | | $ | (38) | | | $ | — | | | $ | (38) | | | $ | 38 | | | $ | — | | | $ | — | | |
| Financial Products | | (260) | | | — | | | (260) | | | 57 | | | — | | | (203) | | |
| Total | | $ | (298) | | | $ | — | | | $ | (298) | | | $ | 95 | | | $ | — | | | $ | (203) | | |
| | | | | | | | | | | | | | | | | | | | | | | |
| (Millions of dollars) | December 31, 2023 | | December 31, 2022 |
| Assets | | Liabilities | | Assets | | Liabilities |
| Gross Amounts Recognized | $ | 520 | | | $ | (455) | | | $ | 644 | | | $ | (496) | |
| Financial Instruments Not Offset | (202) | | | 202 | | | (233) | | | 233 | |
| | | | | | | |
| Net Amount | $ | 318 | | | $ | (253) | | | $ | 411 | | | $ | (263) | |
| | | | | | | |
5. Other income (expense)
| | | |
| | | | | Years ended December 31, | |
| (Millions of dollars) | (Millions of dollars) | | 2021 | | 2020 | | 2019 | |
| (Millions of dollars) | |
| (Millions of dollars) | |
| Investment and interest income | |
| Investment and interest income | |
| Investment and interest income | Investment and interest income | | $ | 80 | | | $ | 112 | | | $ | 202 | | |
Foreign exchange gains (losses) 1 | Foreign exchange gains (losses) 1 | | 110 | | | (193) | | | (67) | | |
Foreign exchange gains (losses) 1 | |
Foreign exchange gains (losses) 1 | |
| License fee income | |
| License fee income | |
| License fee income | License fee income | | 123 | | | 104 | | | 121 | | |
| Gains (losses) on securities | Gains (losses) on securities | | 134 | | | 37 | | | 65 | | |
| Gains (losses) on securities | |
| Gains (losses) on securities | |
Net periodic pension and OPEB income (cost), excluding service cost | |
Net periodic pension and OPEB income (cost), excluding service cost | |
Net periodic pension and OPEB income (cost), excluding service cost | Net periodic pension and OPEB income (cost), excluding service cost | | 1,279 | |
| (90) | | | (363) | | |
| Miscellaneous income (loss) | Miscellaneous income (loss) | | 88 | | | (14) | | | (15) | | |
| Miscellaneous income (loss) | |
| Miscellaneous income (loss) | |
| Total | Total | | $ | 1,814 | | | $ | (44) | | | $ | (57) | | |
| Total | |
| Total | |
| 1 Includes gains (losses) from foreign exchange derivative contracts. See Note 4 for further details. | |
| 1 Includes gains (losses) from foreign exchange derivative contracts. See Note 4 for further details. | |
| 1 Includes gains (losses) from foreign exchange derivative contracts. See Note 4 for further details. | 1 Includes gains (losses) from foreign exchange derivative contracts. See Note 4 for further details. | |
| | |
6. Income taxes
Reconciliation of the U.S. federal statutory rate to effective rate:
| | Years ended December 31, |
| | Years ended December 31, | | | | Years ended December 31, |
| (Millions of dollars) | (Millions of dollars) | | 2021 | | 2020 | | 2019 | (Millions of dollars) | | 2023 | | 2022 | | 2021 |
| Taxes at U.S. statutory rate | Taxes at U.S. statutory rate | | $ | 1,723 | | | 21.0 | % | | $ | 839 | | | 21.0 | % | | $ | 1,641 | | | 21.0 | % | Taxes at U.S. statutory rate | | $ | 2,740 | | | 21.0 | | 21.0 | % | | $ | 1,838 | | | 21.0 | | 21.0 | % | | $ | 1,723 | | | 21.0 | | 21.0 | % |
| (Decreases) increases resulting from: | (Decreases) increases resulting from: | | | | | | | | | | | | | (Decreases) increases resulting from: | | |
| Non-U.S. subsidiaries taxed at other than the U.S. rate | Non-U.S. subsidiaries taxed at other than the U.S. rate | | 211 | | | 2.6 | % | | 285 | | | 7.1 | % | | 365 | | | 4.7 | % | Non-U.S. subsidiaries taxed at other than the U.S. rate | | 129 | | | 1.0 | | 1.0 | % | | 184 | | | 2.1 | | 2.1 | % | | 224 | | | 2.7 | | 2.7 | % |
State and local taxes, net of federal 1 | State and local taxes, net of federal 1 | | 28 | | | 0.3 | % | | 32 | | | 0.8 | % | | 59 | | | 0.8 | % | State and local taxes, net of federal 1 | | 93 | | | 0.7 | | 0.7 | % | | 91 | | | 1.0 | | 1.0 | % | | 21 | | | 0.3 | | 0.3 | % |
| Interest and penalties, net of tax | | 45 | | | 0.6 | % | | 28 | | | 0.7 | % | | 34 | | | 0.4 | % |
| | U.S. tax incentives | U.S. tax incentives | | (123) | | | (1.5) | % | | (52) | | | (1.3) | % | | (149) | | | (1.9) | % |
| | Net excess tax benefits from stock-based compensation | | (63) | | | (0.8) | % | | (49) | | | (1.2) | % | | (41) | | | (0.5) | % |
| Prior year tax adjustments | | (36) | | | (0.4) | % | | (80) | | | (2.0) | % | | (178) | | | (2.3) | % |
| U.S. tax incentives | |
| U.S. tax incentives | | | (170) | | | (1.3) | % | | (166) | | | (1.9) | % | | (123) | | | (1.5) | % |
| | | Nondeductible goodwill | |
| | Nondeductible goodwill | |
| | Nondeductible goodwill | | | — | | | — | % | | 159 | | | 1.8 | % | | — | | | — | % |
| Other—net | Other—net | | (43) | | | (0.6) | % | | 3 | | | 0.1 | % | | 15 | | | 0.2 | % | Other—net | | (11) | | | (0.1) | | (0.1) | % | | (39) | | | (0.4) | | (0.4) | % | | (103) | | | (1.3) | | (1.3) | % |
| Provision (benefit) for income taxes | Provision (benefit) for income taxes | | $ | 1,742 | | | 21.2 | % | | $ | 1,006 | | | 25.2 | % | | $ | 1,746 | | | 22.4 | % | Provision (benefit) for income taxes | | $ | 2,781 | | | 21.3 | | 21.3 | % | | $ | 2,067 | | | 23.6 | | 23.6 | % | | $ | 1,742 | | | 21.2 | | 21.2 | % |
| 1 Excludes amounts included in net excess tax benefits from stock-based compensation. | |
1 Excludes amount included in nondeductible goodwill line item. | |
1 Excludes amount included in nondeductible goodwill line item. | |
1 Excludes amount included in nondeductible goodwill line item. | |
|
The negative impact on the effective rate from the portion of the goodwill impairment not deductible for tax purposes is reported in the effective tax rate reconciliation line item above labeled "Nondeductible goodwill." Included in the line item above labeled “Non-U.S. subsidiaries taxed at other than the U.S. rate” are the effects of local and U.S. taxes related to earnings of non-U.S. subsidiaries, changes in the amount of unrecognized tax benefits associated with these earnings, losses at non-U.S. subsidiaries without local tax benefits due to valuation allowances and other permanent differences between tax and U.S. GAAP results.
The line item above labeled "Prior year tax adjustments" includes a $36 million benefit in 2021 to reflect changes in estimates and an $80 million benefit in 2020 including the impact of regulations received. During 2019, we recorded a $178 million tax benefit to adjust previously unrecognized tax benefits as a result of receipt of additional guidance related to the calculation of the one-time mandatory deemed repatriation of non-U.S. earnings required by U.S. tax legislation enacted on December 22, 2017.
Distributions of profits from non-U.S. subsidiaries are not expected to cause a significant incremental U.S. tax impact in the future. However, these distributions may be subject to non-U.S. withholding taxes if profits are distributed from certain jurisdictions. Undistributed profits of non-U.S. subsidiaries of approximately $15 billion are considered indefinitely reinvested. Determination of the amount of unrecognized deferred tax liability related to indefinitely reinvested profits is not feasible primarily due to our legal entity structure and the complexity of U.S. and local tax laws.
| | | | | | | | | | | | | | | | | | | | |
| The components of profit (loss) before taxes were: | | | | | | |
| | | Years ended December 31, |
| (Millions of dollars) | | 2021 | | 2020 | | 2019 |
| U.S. | | $ | 2,740 | | | $ | 590 | | | $ | 2,888 | |
| Non-U.S. | | 5,464 | | | 3,405 | | | 4,924 | |
| | | $ | 8,204 | | | $ | 3,995 | | | $ | 7,812 | |
| | | | | | |
| | | | | | | | | | | | | | | | | | | | |
| The components of profit (loss) before taxes were: | | | | | | |
| | | Years ended December 31, |
| (Millions of dollars) | | 2023 | | 2022 | | 2021 |
| U.S. | | $ | 6,463 | | | $ | 2,962 | | | $ | 2,740 | |
| Non-U.S. | | 6,587 | | | 5,790 | | | 5,464 | |
| | | $ | 13,050 | | | $ | 8,752 | | | $ | 8,204 | |
| | | | | | |
Profit before taxes, as shown above, is based on the location of the entity to which such earnings are attributable. Where an entity’s earnings are subject to taxation, however, may not correlate solely to where an entity is located. Thus, the income tax provision shown below as U.S. or non-U.S. may not correspond to the earnings shown above.
| | The components of the provision (benefit) for income taxes were: | The components of the provision (benefit) for income taxes were: | |
| | |
| | |
| | | | Years ended December 31, | | Years ended December 31, |
| (Millions of dollars) | (Millions of dollars) | | 2021 | | 2020 | | 2019 | (Millions of dollars) | | 2023 | | 2022 | | 2021 |
| Current tax provision (benefit): | Current tax provision (benefit): | | | | | | | Current tax provision (benefit): | | |
U.S.1 | U.S.1 | | $ | 766 | | | $ | 18 | | | $ | 405 | |
| Non-U.S. | Non-U.S. | | 1,283 | | | 1,031 | | | 1,261 | |
| State (U.S.) | State (U.S.) | | 76 | | | 31 | | | 52 | |
| | | | 2,125 | | | 1,080 | | | 1,718 | |
| | Deferred tax provision (benefit): | Deferred tax provision (benefit): | | | | | | |
| Deferred tax provision (benefit): | |
| Deferred tax provision (benefit): | | | | | |
U.S.1 | U.S.1 | | (387) | | | (44) | | | 17 | |
| Non-U.S. | Non-U.S. | | 54 | | | (34) | | | (7) | |
| State (U.S.) | State (U.S.) | | (50) | | | 4 | | | 18 | |
| | | | (383) | | | (74) | | | 28 | |
| Total provision (benefit) for income taxes | Total provision (benefit) for income taxes | | $ | 1,742 | | | $ | 1,006 | | | $ | 1,746 | |
1 Includes U.S. taxes related to non-U.S. earnings. We account for U.S. taxes on global intangible low-taxed income as a period cost. | 1 Includes U.S. taxes related to non-U.S. earnings. We account for U.S. taxes on global intangible low-taxed income as a period cost. | 1 Includes U.S. taxes related to non-U.S. earnings. We account for U.S. taxes on global intangible low-taxed income as a period cost. |
We paid net income tax and related interest of $2,949 million, $3,076 million and $1,759 million $1,311 millionin 2023, 2022 and $1,847 million in 2021, 2020 and 2019, respectively.
Accounting for income taxes under U.S. GAAP requires that individual tax-paying entities of the company offset all deferred tax liabilities and assets within each particular tax jurisdiction and present them as a noncurrent deferred tax liability or asset in the Consolidated Financial Position. Amounts in different tax jurisdictions cannot be offset against each other. The amount of deferred income taxes at December 31, included on the following lines in Statement 3, were as follows:
| | | | | | | | | | | | | | | | |
| | | December 31, |
| (Millions of dollars) | | 2023 | | 2022 | | |
| Assets: | | | | | | |
| | | | | | |
| Noncurrent deferred and refundable income taxes | | $ | 2,634 | | | $ | 2,047 | | | |
| | | | | | |
| Liabilities: | | | | | | |
| | | | | | |
| Other liabilities | | 454 | | | 471 | | | |
| Deferred income taxes—net | | $ | 2,180 | | | $ | 1,576 | | | |
| | | | | | |
| | | | | | | | | | | | | | | | |
| | | December 31, |
| (Millions of dollars) | | 2021 | | 2020 | | |
| Assets: | | | | | | |
| | | | | | |
| Noncurrent deferred and refundable income taxes | | $ | 1,669 | | | $ | 1,358 | | | |
| | | | | | |
| Liabilities: | | | | | | |
| | | | | | |
| Other liabilities | | 412 | | | 418 | | | |
| Deferred income taxes—net | | $ | 1,257 | | | $ | 940 | | | |
| | | | | | |
| | | | | | | | | | | | | | |
| The components of deferred tax assets and liabilities were: | | | | |
| | | December 31, |
| (Millions of dollars) | | 2023 | | 2022 |
| Deferred income tax assets: | | | | |
| Tax carryforwards | | $ | 1,389 | | | $ | 1,349 | |
| Research expenditures | | 1,350 | | | 949 | |
| Postemployment benefits | | 656 | | | 728 | |
| Employee compensation and benefits | | 634 | | | 459 | |
| Warranty reserves | | 325 | | | 282 | |
| Post sale discounts | | 253 | | | 159 | |
| Lease obligations | | 144 | | | 144 | |
| Inventory valuation | | 138 | | | 147 | |
| | | | |
| Allowance for credit losses | | 109 | | | 113 | |
| | | | |
| | | | |
| Other—net | | 197 | | | 376 | |
| | | 5,195 | | | 4,706 | |
| | | | |
| Deferred income tax liabilities: | | | | |
| Capital and intangible assets, including lease basis differences | | (1,312) | | | (1,401) | |
| Undistributed profits, including translation adjustments | | (401) | | | (344) | |
| Other outside basis differences | | (267) | | | (264) | |
| | | | |
| Bond discount | | (101) | | | (107) | |
| | | (2,081) | | | (2,116) | |
| Valuation allowance for deferred tax assets | | (934) | | | (1,014) | |
| Deferred income taxes—net | | $ | 2,180 | | | $ | 1,576 | |
| | | | |
| | | | | | | | | | | | | | |
| The components of deferred tax assets and liabilities were: | | | | |
| | | December 31, |
| (Millions of dollars) | | 2021 | | 2020 |
| Deferred income tax assets: | | | | |
| Tax carryforwards | | $ | 1,380 | | | $ | 1,346 | |
| Postemployment benefits other than pensions | | 848 | | | 919 | |
| Employee compensation and benefits | | 464 | | | 267 | |
| Research expenditures | | 415 | | | 193 | |
| Intercompany prepayments | | 280 | | | — | |
| Warranty reserves | | 266 | | | 247 | |
| Lease obligations | | 159 | | | 154 | |
| Post sale discounts | | 143 | | | 153 | |
| Pension | | 111 | | | 396 | |
| Allowance for credit losses | | 106 | | | 126 | |
| | | | |
| Other—net | | 235 | | | 317 | |
| | | 4,407 | | | 4,118 | |
| | | | |
| Deferred income tax liabilities: | | | | |
| Capital and intangible assets, including lease basis differences | | (1,457) | | | (1,526) | |
| Other outside basis differences | | (264) | | | (284) | |
| Translation | | (188) | | | (147) | |
| Bond discount | | (112) | | | (117) | |
| Undistributed profits of non-U.S. subsidiaries | | (101) | | | (95) | |
| | | (2,122) | | | (2,169) | |
| Valuation allowance for deferred tax assets | | (1,028) | | | (1,009) | |
| Deferred income taxes—net | | $ | 1,257 | | | $ | 940 | |
| | | | |
At December 31, 2021, approximately $890 million of2023, deferred tax assets for U.S. state tax net operating losses (NOLs) and $130credit carryforwards of $86 million ofexpire on or before 2043 while the remaining $42 million may be carried carryforward indefinitely. Of these U.S. state deferred tax assets, $95 million were reduced by valuation allowances. The deferred tax assets for U.S. federal losses and credit carryforwards of $157 million expire on or before 2034 and were available. The state NOLs primarily expire over the next twenty years. The statesubject to a full valuation allowance. Deferred tax assets for losses and credit carryforwards primarily expireof non-U.S. entities of $266 million expires on or before 2044 while the remaining $838 million may be carried over the next fifteen years, with some credits having an unlimited carryforward period. In total, we have established a valuation allowance of $150 million related to certain of these carryforwards.
At December 31, 2021, approximately $790 million of capital losses are available to carryforward on the U.S. federal tax return. These losses have a five-year carryforward period and will expire in 2027.
At December 31, 2021, approximately $90 million of U.S. foreign tax credits were available to carryforward on the U.S. federal tax return. These credits have a ten-year carryforward period and begin to expire in 2028.
At December 31, 2021, amounts and expiration dates of net operating loss and interest carryforwards in various non-U.S. taxing jurisdictions were:
| | | | | | | | | | | | | | | | | | | | | | | | | | | | | | | | | | | | | | |
| (Millions of dollars) |
| 2022 | | 2023 | | 2024 | | 2025-2027 | | 2028-2042 | | Unlimited | | Total |
| $ | 4 | | | $ | 3 | | | $ | 14 | | | $ | 32 | | | $ | 844 | | | $ | 3,876 | | | $ | 4,773 | |
At December 31, 2021, non-U.S.indefinitely. Non-U.S. entities that have not yet demonstrated consistent and/or sustainable profitability to support the realization of net deferred tax assets, including certain entities in Luxembourg, have recorded valuation allowances of $770$682 million including certain entities in Luxembourg.against tax carryforwards and other deferred tax assets.
A reconciliation of the beginning and ending amount of gross unrecognized tax benefits for uncertain tax positions, including positions impacting only the timing of tax benefits, follows.
| Reconciliation of unrecognized tax benefits: 1 | Reconciliation of unrecognized tax benefits: 1 | |
| | |
| | |
| | | | Years ended December 31, | | Years ended December 31, |
| (Millions of dollars) | (Millions of dollars) | | 2021 | | 2020 | | 2019 | (Millions of dollars) | | 2023 | | 2022 | | 2021 |
| Beginning balance | Beginning balance | | $ | 1,759 | | | $ | 1,778 | | | $ | 1,796 | |
| | Additions for tax positions related to current year | |
| Additions for tax positions related to current year | |
| Additions for tax positions related to current year | Additions for tax positions related to current year | | 141 | | | 44 | | | 72 | |
| Additions for tax positions related to prior years | Additions for tax positions related to prior years | | 43 | | | 46 | | | 112 | |
| Reductions for tax positions related to prior years | Reductions for tax positions related to prior years | | (30) | | | (12) | | | (201) | |
Reductions for settlements 2 | Reductions for settlements 2 | | (24) | | | (94) | | | — | |
| Reductions for expiration of statute of limitations | Reductions for expiration of statute of limitations | | (3) | | | (3) | | | (1) | |
| | Ending balance | Ending balance | | $ | 1,886 | | | $ | 1,759 | | | $ | 1,778 | |
| Ending balance | |
| Ending balance | |
| | Amount that, if recognized, would impact the effective tax rate | Amount that, if recognized, would impact the effective tax rate | | $ | 1,688 | | | $ | 1,657 | | | $ | 1,616 | |
| Amount that, if recognized, would impact the effective tax rate | |
| Amount that, if recognized, would impact the effective tax rate | |
1Foreign currency impacts are included within each line as applicable.
2Includes cash payment or other reduction of assets to settle liability.
We classify interest and penalties on income taxes as a component of the provision for income taxes. We recognized a net provision for interest and penalties of $54$36 million, $38$49 million and $43$54 million during the years ended December 31, 2021, 20202023, 2022 and 2019,2021, respectively. The total amount of interest and penalties accrued was $297$135 million and $264$95 million as of December 31, 20212023 and 2020,2022, respectively.
In Revenue Agent’s Reports issued atOn September 8, 2022, the end ofcompany reached a settlement with the field examinations of our U.S. income tax returns for 2007 to 2012 including the impact of a loss carryback to 2005, the Internal Revenue Service has(IRS) that resolves all issues for tax years 2007 through 2016, without any penalties. The company's settlement includes, among other issues, the resolution of disputed tax treatment of profits earned by Caterpillar SARL (CSARL) from certain parts transactions. We vigorously contested the IRS's application of the "substance-over-form" or "assignment-of-income" judicial doctrines and its proposed increases to tax and imposition of accuracy related penalties. The settlement does not include any increases to tax in the United States profits earned from certain parts transactions by Caterpillar SARL (CSARL) based on those judicial doctrines and does not include any penalties. The final tax assessed by the examination team’s applicationIRS for all issues under the settlement was $490 million for the ten-year period. This amount was primarily paid in 2022 along with associated interest of $250 million. The settlement was within the “substance-over-form” or “assignment-of-income” judicial doctrines. We are vigorously contesting the proposed increases to tax and penalties for these yearstotal amount of approximately $2.3 billion. We believe that the relevant transactions complied with applicable tax laws and did not violate judicial doctrines. We have filed U.S. income tax returns on this same basis for years after 2012. Based on the information currently available, we do not anticipate a significant change to ourgross unrecognized tax benefits for this position withinuncertain tax positions and enables us to avoid the next 12 months. We currently believecosts and burdens of further disputes with the ultimate dispositionIRS. As a result of this matter will not havethe settlement, we recorded a material adverse effect on our consolidated financial position, liquidity or resultstax benefit of operations.$41 million in 2022 to reflect changes in estimates of prior years' taxes and related interest, net of tax.
WithWe are subject to the exceptioncontinuous examination of a loss carryback to 2005,our U.S. federal income tax returns by the IRS, and tax years prior2017 to 20072019 are generally no longer subject to U.S. tax assessment.currently under examination. In our major non-U.S. jurisdictions including Australia, Brazil, China, Germany, India, Japan, Mexico, Switzerland, Singapore and the U.K., tax years are typically subject to examination for three to ten years. Due to the uncertainty related to
the timing and potential outcome of audits, we cannot estimate the range of reasonably possible change in unrecognized tax benefits in the next 12 months.
7. Cat Financial Financing Activities
A.Wholesale inventory receivables
Wholesale inventory receivables are receivables of Cat Financial that arise when Cat Financial provides financing for a dealer’s purchase of inventory and were $1,098$1,632 million and $1,233$1,102 million, at December 31, 20212023 and 2020,2022, respectively. We include these receivables in Receivables—trade and other and Long-term receivables—trade and other in Statement 3.
| | Contractual maturities of outstanding wholesale inventory receivables: | |
| Contractual maturities of outstanding wholesale inventory receivables: | |
Contractual maturities of outstanding wholesale inventory receivables: | | (Millions of dollars) | (Millions of dollars) | | December 31, 2021 | (Millions of dollars) | | December 31, 2023 |
| Amounts Due In | Amounts Due In | | Wholesale
Loans | | Wholesale
Leases | | | Total | Amounts Due In | | Wholesale
Loans | | Wholesale
Leases | | | | Total |
| 2022 | | $ | 421 | | | $ | 46 | | | | $ | 467 | |
| 2023 | | 237 | | | 38 | | | | 275 | |
| 2024 | 2024 | | 117 | | | 30 | | | | 147 | |
| 2025 | 2025 | | 56 | | | 22 | | | | 78 | |
| 2026 | 2026 | | 21 | | | 9 | | | | 30 | |
| 2027 | |
| 2028 | |
| Thereafter | Thereafter | | 5 | | | — | | | | 5 | |
| Total | Total | | 857 | | | 145 | | | | 1,002 | |
Guaranteed residual value 1 | Guaranteed residual value 1 | | 68 | | | 27 | | | | 95 | |
Unguaranteed residual value 1 | Unguaranteed residual value 1 | | 2 | | | 29 | | | | 31 | |
| Less: Unearned income | Less: Unearned income | | (11) | | | (19) | | | | (30) | |
| Total | Total | | $ | 916 | | | $ | 182 | | | | $ | 1,098 | |
| 1 For Wholesale loans, represents residual value on failed sale leasebacks. | 1 For Wholesale loans, represents residual value on failed sale leasebacks. | |
1 For Wholesale loans, represents residual value on failed sale leasebacks. | |
|
Cat Financial’s wholesale inventory receivables generally may be repaid or refinanced without penalty prior to contractual maturity.
Please refer to Note 18 for fair value information.
B.Finance receivables
Finance receivables are receivables of Cat Financial and are reported in Statement 3 net of an allowance for credit losses.
| | Contractual maturities of outstanding finance receivables: | |
| Contractual maturities of outstanding finance receivables: | |
Contractual maturities of outstanding finance receivables: | | (Millions of dollars) | (Millions of dollars) | | December 31, 2021 | (Millions of dollars) | | December 31, 2023 |
| Amounts Due In | Amounts Due In | | Retail
Loans | | Retail
Leases | | | Total | Amounts Due In | | Retail
Loans | | Retail
Leases | | | | Total |
| 2022 | | $ | 5,839 | | | $ | 3,137 | | | | $ | 8,976 | |
| 2023 | | 3,892 | | | 2,070 | | | | 5,962 | |
| 2024 | 2024 | | 2,571 | | | 1,101 | | | | 3,672 | |
| 2025 | 2025 | | 1,448 | | | 510 | | | | 1,958 | |
| 2026 | 2026 | | 647 | | | 217 | | | | 864 | |
| 2027 | |
| 2028 | |
| Thereafter | Thereafter | | 195 | | | 34 | | | | 229 | |
| Total | Total | | 14,592 | | | 7,069 | | | | 21,661 | |
Guaranteed residual value 1 | Guaranteed residual value 1 | | 16 | | | 386 | | | | 402 | |
Unguaranteed residual value 1 | Unguaranteed residual value 1 | | 3 | | | 720 | | | | 723 | |
| Less: Unearned income | Less: Unearned income | | (304) | | | (554) | | | | (858) | |
| Total | Total | | $ | 14,307 | | | $ | 7,621 | | | | $ | 21,928 | |
| 1 For Retail loans, represents residual value on failed sale leasebacks. | 1 For Retail loans, represents residual value on failed sale leasebacks. | |
1 For Retail loans, represents residual value on failed sale leasebacks. | |
|
Cat Financial’s finance receivables generally may be repaid or refinanced without penalty prior to contractual maturity.
Please refer to Note 18 for fair value information.
C.Allowance for credit losses
Portfolio segments
A portfolio segment is the level at which Cat Financial develops a systematic methodology for determining its allowance for credit losses. Cat Financial's portfolio segments and related methods for estimating expected credit losses are as follows:
Customer
Cat Financial provides loans and finance leases to end-user customers primarily for the purpose of financing new and used Caterpillar machinery, engines and equipment for commercial use, the majority of which operate in construction-related industries.use. Cat Financial also provides financing for vehicles, power generation facilities and marine vessels that, in most cases, incorporate Caterpillar products. The average original term of Cat Financial's customer finance receivable portfolio was approximately 5051 months with an average remaining term of approximately 27 months as of December 31, 2021.2023.
Cat Financial typically maintains a security interest in financed equipment and generally requires physical damage insurance coverage on the financed equipment, both of which provide Cat Financial with certain rights and protections. If Cat Financial's collection efforts fail to bring a defaulted account current, Cat Financial generally can repossess the financed equipment, after satisfying local legal requirements, and sell it within the Caterpillar dealer network or through third-party auctions.
Cat Financial estimates the allowance for credit losses related to its customer finance receivables based on loss forecast models utilizing probabilities of default and the estimated loss given default based on past loss experience adjusted for current conditions and reasonable and supportable forecasts capturing country and industry-specific economic factors.
During the year ended December 31, 2021,2023, Cat Financial's forecasts for the markets in which it operates reflected a general improvement in economic conditions, which had deteriorated due tocontinuation of the COVID-19 pandemic, resulting from a growing economy, improvedtrend of relatively low unemployment rates and a decrease in delinquencies.delinquencies within their portfolio. However, industry delinquencies show an increasing trend as the central bank actions aimed at reducing inflation have weakened global economic growth. The company believes the economic forecasts employed represent reasonable and supportable forecasts, followed by a reversion to long-term trends.
Dealer
Cat Financial provides financing to Caterpillar dealers in the form of wholesale financing plans. Cat Financial's wholesale financing plans provide assistance to dealers by financing their mostly new Caterpillar equipment inventory and rental fleets on a secured and unsecured basis. In addition, Cat Financial provides a variety of secured and unsecured loans to Caterpillar dealers.
Cat Financial estimates the allowance for credit losses for dealer finance receivables based on historical loss rates with consideration of current economic conditions and reasonable and supportable forecasts.
In general, Cat Financial's Dealer portfolio segment has not historically experienced large increases or decreases in credit losses based on changes in economic conditions due to its close working relationships with the dealers and their financial strength. Therefore, Cat Financial made no adjustments to historical loss rates during the year ended December 31, 2021.2023.
Classes of finance receivables
Cat Financial further evaluates portfolio segments by the class of finance receivables, which is defined as a level of information (below a portfolio segment) in which the finance receivables have the same initial measurement attribute and a similar method for assessing and monitoring credit risk. Cat Financial's classes, which align with management reporting for credit losses, are as follows:
•North America -— Finance receivables originated in the United States and Canada.
•EAME -— Finance receivables originated in Europe, Africa, the Middle East and the Commonwealth of Independent States.Eurasia.
•Asia/Pacific -— Finance receivables originated in Australia, New Zealand, China, Japan, Southeast Asia and India.
•Mining —- Finance receivables related to large mining customers worldwide.
•Latin America —- Finance receivables originated in Mexico and Central and South American countries.
•Caterpillar Power Finance —- Finance receivables originated worldwide related to marine vessels with Caterpillar engines and Caterpillar electrical power generation, gas compression and co-generation systems and non-Caterpillar equipment that is powered by these systems.
Receivable balances, including accrued interest, are written off against the allowance for credit losses when, in the judgment of management, they are considered uncollectible (generally upon repossession of the collateral). Generally, the amount of the write-off is determined by comparing the fair value of the collateral, less cost to sell, to the amortized cost.cost of the receivable. Subsequent recoveries, if any, are credited to the allowance for credit losses when received.
An analysis of the allowance for credit losses was as follows:
| | | | | | | | | | | | | | | | | | | | | | | | | | | | | | | | | | | | | | |
| (Millions of dollars) | | December 31, 2021 | | December 31, 2020 |
| | Customer | | Dealer | | Total | | Customer | | Dealer | | Total |
| Allowance for Credit Losses: | | | | | | | | | | | | |
| Beginning balance | | $ | 431 | | | $ | 44 | | | $ | 475 | | | $ | 375 | | | $ | 45 | | | $ | 420 | |
Adjustment to adopt new accounting guidance 1 | | — | | | — | | | — | | | 12 | | | — | | | 12 | |
| Write-offs | | (256) | | | — | | | (256) | | | (263) | | | — | | | (263) | |
| Recoveries | | 51 | | | — | | | 51 | | | 41 | | | — | | | 41 | |
| Provision for credit losses | | 30 | | | 38 | | | 68 | | | 262 | | | (1) | | | 261 | |
| Other | | (5) | | | — | | | (5) | | | 4 | | | — | | | 4 | |
| Ending balance | | $ | 251 | | | $ | 82 | | | $ | 333 | | | $ | 431 | | | $ | 44 | | | $ | 475 | |
| | | | | | | | | | | | |
| | | | | | | | | | | | |
| | | | | | | | | | | | |
| | | | | | | | | | | | |
| | | | | | | | | | | | |
| | | | | | | | | | | | |
| | | | | | | | | | | | |
| | | | | | | | | | | | |
| Finance Receivables | | $ | 20,135 | | | $ | 1,793 | | | $ | 21,928 | | | $ | 19,238 | | | $ | 2,922 | | | $ | 22,160 | |
| | | | | | | | | | | | |
1 Adjustment to adopt new accounting guidance related to credit losses. | | | | | | |
| | | | | | | | | | | | | | | | | | | | | | | | | | | | | | | | | | | | | | |
| (Millions of dollars) | | December 31, 2023 | | December 31, 2022 |
| | Customer | | Dealer | | Total | | Customer | | Dealer | | Total |
| Allowance for Credit Losses: | | | | | | | | | | | | |
| Beginning balance | | $ | 277 | | | $ | 65 | | | $ | 342 | | | $ | 251 | | | $ | 82 | | | $ | 333 | |
| | | | | | | | | | | | |
| Write-offs | | (115) | | | — | | | (115) | | | (108) | | | — | | | (108) | |
| Recoveries | | 50 | | | — | | | 50 | | | 62 | | | — | | | 62 | |
Provision for credit losses1 | | 61 | | | (14) | | | 47 | | | 75 | | | (17) | | | 58 | |
| Other | | 3 | | | — | | | 3 | | | (3) | | | — | | | (3) | |
| Ending balance | | $ | 276 | | | $ | 51 | | | $ | 327 | | | $ | 277 | | | $ | 65 | | | $ | 342 | |
| | | | | | | | | | | | |
| Finance Receivables | | $ | 20,571 | | | $ | 1,878 | | | $ | 22,449 | | | $ | 19,772 | | | $ | 1,585 | | | $ | 21,357 | |
| | | | | | | | | | | | |
1 Excludes provision for credit losses on unfunded commitments and other miscellaneous receivables. | | | | | | |
Gross write-offs by origination year for the Customer portfolio segment were as follows:
| | | | | | | | | | | | | | | | | | | | | | | | | | | | | | | | | | | | | | | | | | | | | | | |
| (Millions of dollars) | Year Ended December 31, 2023 |
| 2023 | | 2022 | | 2021 | | 2020 | | 2019 | | Prior | | Revolving Finance Receivables | | Total |
| | | | | | | | | | | | | | | |
| North America | $ | 2 | | | $ | 11 | | | $ | 11 | | | $ | 5 | | | $ | 3 | | | $ | 2 | | | $ | 12 | | | $ | 46 | |
| EAME | 1 | | | 5 | | | 6 | | | 4 | | | 1 | | | — | | | — | | | 17 | |
| Asia/Pacific | 2 | | | 5 | | | 8 | | | 5 | | | 1 | | | — | | | — | | | 21 | |
| | | | | | | | | | | | | | | |
| Latin America | — | | | 8 | | | 5 | | | 6 | | | 1 | | | 10 | | | — | | | 30 | |
| Power | — | | | — | | | — | | | — | | | — | | | 1 | | | — | | | 1 | |
| Total | $ | 5 | | | $ | 29 | | | $ | 30 | | | $ | 20 | | | $ | 6 | | | $ | 13 | | | $ | 12 | | | $ | 115 | |
| | | | | | | | | | | | | | | |
| | | | | | | | | | |
Credit quality of finance receivables
At origination, Cat Financial evaluates credit risk based on a variety of credit quality factors including prior payment experience, customer financial information, credit ratings, loan-to-value ratios, probabilities of default, industry trends, macroeconomic factors and other internal metrics. On an ongoing basis, Cat Financial monitors credit quality based on past-due status as there is a meaningful correlation between the past-due status of customers and the risk of loss. In determining past-due status, Cat Financial considers the entire finance receivable past due when any installment is over 30 days past due.
Customer
The tables below summarize the aging category of Cat Financial's amortized cost of finance receivables in the Customer portfolio segment by origination year:
| | | |
| | | | | | | | | | | | | | | | | | | | | | | | |
| (Millions of dollars) | (Millions of dollars) | December 31, 2021 | (Millions of dollars) | December 31, 2023 |
| 2021 | | 2020 | | 2019 | | 2018 | | 2017 | | Prior | | Revolving
Finance
Receivables | | | Total Finance Receivables |
| 2023 | | | 2023 | | 2022 | | 2021 | | 2020 | | 2019 | | Prior | | Revolving
Finance
Receivables | | | | Total Finance Receivables |
| North America | North America | | | | | | | | | | | | | | | | | North America | | | | | | | | | | | |
| Current | Current | $ | 4,792 | | | $ | 2,596 | | | $ | 1,426 | | | $ | 630 | | | $ | 182 | | | $ | 32 | | | $ | 182 | | | | $ | 9,840 | |
| 31-60 days past due | 31-60 days past due | 27 | | | 32 | | | 20 | | | 12 | | | 4 | | | 1 | | | 5 | | | | 101 | |
| 61-90 days past due | 61-90 days past due | 7 | | | 8 | | | 5 | | | 3 | | | 1 | | | 1 | | | 5 | | | | 30 | |
| 91+ days past due | 91+ days past due | 9 | | | 17 | | | 12 | | | 13 | | | 5 | | | 4 | | | 5 | | | | 65 | |
| | EAME | EAME | | | |
| EAME | |
| EAME | |
| Current | |
| Current | |
| Current | Current | 1,499 | | | 836 | | | 577 | | | 352 | | | 140 | | | 26 | | | — | | | | 3,430 | |
| 31-60 days past due | 31-60 days past due | 5 | | | 4 | | | 3 | | | 1 | | | 1 | | | — | | | — | | | | 14 | |
| 61-90 days past due | 61-90 days past due | 3 | | | 3 | | | 3 | | | 1 | | | — | | | — | | | — | | | | 10 | |
| 91+ days past due | 91+ days past due | 3 | | | 11 | | | 2 | | | 2 | | | — | | | 2 | | | — | | | | 20 | |
| | Asia/Pacific | Asia/Pacific | | | |
| Asia/Pacific | |
| Asia/Pacific | |
| Current | |
| Current | |
| Current | Current | 1,271 | | | 803 | | | 307 | | | 71 | | | 16 | | | 2 | | | — | | | | 2,470 | |
| 31-60 days past due | 31-60 days past due | 10 | | | 14 | | | 10 | | | 2 | | | — | | | — | | | — | | | | 36 | |
| 61-90 days past due | 61-90 days past due | 3 | | | 7 | | | 4 | | | 1 | | | — | | | — | | | — | | | | 15 | |
| 91+ days past due | 91+ days past due | 2 | | | 10 | | | 10 | | | 3 | | | — | | | — | | | — | | | | 25 | |
| | Mining | Mining | | | |
| Mining | |
| Mining | |
| Current | |
| Current | |
| Current | Current | 851 | | | 347 | | | 307 | | | 193 | | | 36 | | | 161 | | | 36 | | | | 1,931 | |
| 31-60 days past due | 31-60 days past due | 6 | | | — | | | — | | | — | | | — | | | — | | | — | | | | 6 | |
| 61-90 days past due | 61-90 days past due | 1 | | | — | | | — | | | — | | | 4 | | | — | | | — | | | | 5 | |
| 91+ days past due | 91+ days past due | — | | | 1 | | | 8 | | | 9 | | | 3 | | | 1 | | | — | | | | 22 | |
| | Latin America | Latin America | | | |
| Latin America | |
| Latin America | |
| Current | |
| Current | |
| Current | Current | 617 | | | 299 | | | 160 | | | 70 | | | 17 | | | 18 | | | — | | | | 1,181 | |
| 31-60 days past due | 31-60 days past due | 4 | | | 7 | | | 3 | | | 3 | | | 1 | | | — | | | — | | | | 18 | |
| 61-90 days past due | 61-90 days past due | 3 | | | 3 | | | 1 | | | 1 | | | — | | | — | | | — | | | | 8 | |
| 91+ days past due | 91+ days past due | 4 | | | 9 | | | 9 | | | 7 | | | 7 | | | 14 | | | — | | | | 50 | |
| | Caterpillar Power Finance | | | |
| Power | |
| Power | |
| Power | |
| Current | |
| Current | |
| Current | |
| 31-60 days past due | |
| 61-90 days past due | |
| 91+ days past due | |
| | Totals by Aging Category | |
| Totals by Aging Category | |
| Totals by Aging Category | |
| Current | |
| Current | |
| Current | Current | 117 | | | 145 | | | 97 | | | 70 | | | 180 | | | 104 | | | 101 | | | | 814 | |
| 31-60 days past due | 31-60 days past due | — | | | — | | | — | | | — | | | — | | | — | | | — | | | | — | |
| 61-90 days past due | 61-90 days past due | — | | | — | | | — | | | — | | | — | | | — | | | — | | | | — | |
| 91+ days past due | 91+ days past due | — | | | — | | | — | | | — | | | — | | | 44 | | | — | | | | 44 | |
| Total Customer | Total Customer | $ | 9,234 | | | $ | 5,152 | | | $ | 2,964 | | | $ | 1,444 | | | $ | 597 | | | $ | 410 | | | $ | 334 | | | | $ | 20,135 | |
|
| | | |
| | | | | | | | | | | | | | | | | | | | | | | | |
| (Millions of dollars) | (Millions of dollars) | December 31, 2020 | (Millions of dollars) | December 31, 2022 |
| 2020 | | 2019 | | 2018 | | 2017 | | 2016 | | Prior | | Revolving
Finance
Receivables | | | Total Finance Receivables |
| 2022 | | | 2022 | | 2021 | | 2020 | | 2019 | | 2018 | | Prior | | Revolving
Finance
Receivables | | | | Total Finance Receivables |
| North America | North America | | | | | | | | | | | | | | | | | North America | | | | | | | | | | | |
| Current | Current | $ | 3,777 | | | $ | 2,423 | | | $ | 1,344 | | | $ | 522 | | | $ | 212 | | | $ | 27 | | | $ | 89 | | | | $ | 8,394 | |
| 31-60 days past due | 31-60 days past due | 52 | | | 49 | | | 33 | | | 16 | | | 7 | | | 2 | | | — | | | | 159 | |
| 61-90 days past due | 61-90 days past due | 22 | | | 25 | | | 16 | | | 9 | | | 2 | | | 1 | | | — | | | | 75 | |
| 91+ days past due | 91+ days past due | 14 | | | 35 | | | 31 | | | 20 | | | 9 | | | 4 | | | 2 | | | | 115 | |
| | EAME | EAME | | | |
| EAME | |
| EAME | |
| Current | |
| Current | |
| Current | Current | 1,605 | | | 931 | | | 501 | | | 203 | | | 60 | | | 18 | | | — | | | | 3,318 | |
| 31-60 days past due | 31-60 days past due | 5 | | | 15 | | | 3 | | | 2 | | | — | | | — | | | — | | | | 25 | |
| 61-90 days past due | 61-90 days past due | 1 | | | 1 | | | 2 | | | 1 | | | — | | | — | | | — | | | | 5 | |
| 91+ days past due | 91+ days past due | 7 | | | 7 | | | 12 | | | 4 | | | 39 | | | 43 | | | — | | | | 112 | |
| | Asia/Pacific | Asia/Pacific | | | |
| Asia/Pacific | |
| Asia/Pacific | |
| Current | |
| Current | |
| Current | Current | 1,375 | | | 745 | | | 321 | | | 61 | | | 10 | | | 3 | | | — | | | | 2,515 | |
| 31-60 days past due | 31-60 days past due | 12 | | | 22 | | | 13 | | | 6 | | | — | | | — | | | — | | | | 53 | |
| 61-90 days past due | 61-90 days past due | 7 | | | 11 | | | 7 | | | 1 | | | — | | | — | | | — | | | | 26 | |
| 91+ days past due | 91+ days past due | 4 | | | 10 | | | 9 | | | 3 | | | — | | | — | | | — | | | | 26 | |
| | Mining | Mining | | | |
| Mining | |
| Mining | |
| Current | |
| Current | |
| Current | Current | 490 | | | 571 | | | 287 | | | 152 | | | 92 | | | 151 | | | 137 | | | | 1,880 | |
| 31-60 days past due | 31-60 days past due | 5 | | | — | | | 5 | | | 1 | | | — | | | — | | | — | | | | 11 | |
| 61-90 days past due | 61-90 days past due | — | | | — | | | — | | | — | | | — | | | — | | | — | | | | — | |
| 91+ days past due | 91+ days past due | — | | | 11 | | | 8 | | | 2 | | | — | | | — | | | 1 | | | | 22 | |
| | Latin America | Latin America | | | |
| Latin America | |
| Latin America | |
| Current | |
| Current | |
| Current | Current | 561 | | | 348 | | | 151 | | | 48 | | | 13 | | | 34 | | | — | | | | 1,155 | |
| 31-60 days past due | 31-60 days past due | 3 | | | 6 | | | 4 | | | 3 | | | — | | | — | | | — | | | | 16 | |
| 61-90 days past due | 61-90 days past due | 1 | | | 7 | | | 6 | | | 3 | | | 2 | | | — | | | — | | | | 19 | |
| 91+ days past due | 91+ days past due | 2 | | | 14 | | | 11 | | | 24 | | | 5 | | | 4 | | | — | | | | 60 | |
| | Caterpillar Power Finance | | | |
| Power | |
| Power | |
| Power | |
| Current | |
| Current | |
| Current | |
| 31-60 days past due | |
| 61-90 days past due | |
| 91+ days past due | |
| | Totals by Aging Category | |
| Totals by Aging Category | |
| Totals by Aging Category | |
| Current | |
| Current | |
| Current | Current | 217 | | | 172 | | | 111 | | | 273 | | | 99 | | | 117 | | | 119 | | | | 1,108 | |
| 31-60 days past due | 31-60 days past due | — | | | — | | | 6 | | | — | | | — | | | — | | | — | | | | 6 | |
| 61-90 days past due | 61-90 days past due | — | | | — | | | — | | | — | | | — | | | 9 | | | — | | | | 9 | |
| 91+ days past due | 91+ days past due | 2 | | | — | | | 20 | | | 3 | | | 25 | | | 79 | | | — | | | | 129 | |
| Total Customer | Total Customer | $ | 8,162 | | | $ | 5,403 | | | $ | 2,901 | | | $ | 1,357 | | | $ | 575 | | | $ | 492 | | | $ | 348 | | | | $ | 19,238 | |
|
Finance receivables in the Customer portfolio segment are substantially secured by collateral, primarily in the form of Caterpillar and other equipment. For those contracts where the borrower is experiencing financial difficulty, repayment of the outstanding amounts is generally expected to be provided through the operation or repossession and sale of the equipment.
Dealer
As of December 31, 2021,2023 and 2022, Cat Financial's total amortized cost of finance receivables within the Dealer portfolio segment was current, with the exception of $78$44 million and $58 million, respectively, that was 91+ days past due in Latin America, all of which was originated in 2017. As of December 31, 2020, Cat Financial's total amortized cost of finance receivables within the Dealer portfolio segment was current, with the exception of $81 million that was 91+ days past due in Latin America. Of these past due receivables, $78 million were originated in 2017 and $3 million were originated prior to 2016.2018.
Non-accrual finance receivables
Recognition of income is suspended and the finance receivable is placed on non-accrual status when management determines that collection of future income is not probable. Contracts on non-accrual status are generally more than 120 days past due or have been restructured in a troubled debt restructuring (TDR). Recognition is resumed and previously suspended income is recognized when the collection of remaining amounts is considered probable. Payments received while the finance receivable is on non-accrual status are applied to interest and principal in accordance with the contractual terms. Interest earned but uncollected prior to the receivable being placed on non-accrual status is written off through Provision for credit losses when, in the judgment of management, it is considered uncollectible.
In Cat Financial's Customer portfolio segment, finance receivables which were on non-accrual status and finance receivables over 90 days past due and still accruing income were as follows:
| | | | | | | | | | |
| December 31, 2021 | | December 31, 2020 |
| December 31, 2023 | |
| December 31, 2023 | |
| December 31, 2023 | | | December 31, 2022 |
| | | Amortized Cost | | Amortized Cost | | Amortized Cost | | Amortized Cost |
(Millions of dollars) | (Millions of dollars) | Non-accrual
With an
Allowance | | Non-accrual
Without an
Allowance | | 91+ Still
Accruing | | Non-accrual
With an
Allowance | | Non-accrual
Without an
Allowance | | 91+ Still
Accruing | (Millions of dollars) | Non-accrual
With an
Allowance | | Non-accrual
Without an
Allowance | | 91+ Still
Accruing | | Non-accrual
With an
Allowance | | Non-accrual
Without an
Allowance | | 91+ Still
Accruing |
| | | | | | | | | | | | |
| North America | |
| North America | |
| North America | North America | $ | 47 | | | $ | 9 | | | $ | 12 | | | $ | 86 | | | $ | 1 | | | $ | 34 | |
| EAME | EAME | 18 | | | 1 | | | 2 | | | 113 | | | 1 | | | 1 | |
| Asia/Pacific | Asia/Pacific | 19 | | | — | | | 7 | | | 13 | | | — | | | 13 | |
| Mining | Mining | 8 | | | 1 | | | 14 | | | 21 | | | 1 | | | — | |
| Latin America | Latin America | 52 | | | 4 | | | 1 | | | 63 | | | — | | | 1 | |
| Caterpillar Power Finance | 40 | | | 11 | | | — | | | 170 | | | 17 | | | — | |
| Power | |
| Total | Total | $ | 184 | | | $ | 26 | | | $ | 36 | | | $ | 466 | | | $ | 20 | | | $ | 49 | |
|
There was $12 million, $12were $44 million and $28$58 million, of interest income recognized during the years ended December 31, 2021, 2020 and 2019, respectively, for customer finance receivables on non-accrual status.
As of December 31, 2021 and 2020,in finance receivables in Cat Financial's Dealer portfolio segment on non-accrual status were $78 millionfor the year ended December 31, 2023 and $81 million, respectively,2022, all of which was in Latin America. There
Modifications
Cat Financial periodically modifies the terms of their finance receivable agreements in response to borrowers’ financial difficulty. Typically, the types of modifications granted are payment deferrals, interest-only payment periods and/or term extensions. Many modifications Cat Financial grants are for commercial reasons or for borrowers experiencing some form of short-term financial stress and may result in insignificant payment delays. Cat Financial does not consider these borrowers to be experiencing financial difficulty. Modifications for borrowers Cat Financial does consider to be experiencing financial difficulty typically result in payment deferrals and/or reduced payments for a period of four months or longer, term extension of six months or longer or a combination of both.
During the year ended December 31, 2023, there were no finance receivablesreceivable modifications granted to borrowers experiencing financial difficulty in Cat Financial's Dealer portfolio segment. The amortized cost basis of finance receivables modified for borrowers experiencing financial difficulty in the Customer portfolio segment more than 90during the year ended December 31, 2023, was $47 million, or 0.21 percent of Cat Financial's finance receivable portfolio.
For the year ended December 31, 2023, the financial effects of term extensions for borrowers experiencing financial difficulty added a weighted average of 15 months to the terms of modified contracts. For the year ended December 31, 2023, the financial effects of payment delays for borrowers experiencing financial difficulty resulted in weighted average payment deferrals and/or interest only payment periods of 7 months.
After Cat Financial modifies a finance receivable, they continue to track its performance under its most recent modified terms. As of December 31, 2023, all of the finance receivables modified with borrowers experiencing financial difficulty are current except for in EAME where there was $2 million that was 31-60 days past due, $1 million that was 61-90 days past due, and still accruing income as of December 31, 2021 and 2020 and no interest income$1 million that was recognized on dealer finance receivables on non-accrual status during the years ended December 31, 2021, 2020 and 2019.91+ days past due.
Troubled debt restructurings
A restructuringThe effect of amost modifications made to finance receivable constitutes a TDR when the lender grants a concession it would not otherwise consider to a borrowerreceivables for borrowers experiencing financial difficulties. Concessions granted may include extended contract maturities, inclusion of interest only periods, below market interest rates, payment deferrals and reduction of principal and/or accrued interest. Cat Financial individually evaluates TDR contracts and establishes andifficulty is already included in the allowance for credit losses based on the present value of expected future cash flows discounted atmethodologies used to estimate the receivable's effective interest rate,allowance; therefore, a change to the fair value ofallowance for credit losses is generally not recorded upon modification. On rare occasions when principal forgiveness is provided, the collateralamount forgiven is written off against the allowance for collateral-dependent receivables or the observable market price of the receivable.credit losses.
There were no finance receivables modified as TDRs during the years ended December 31, 2021, 2020 and 2019 for the Dealer portfolio segment. Cat Financial’s finance receivables in the Customer portfolio segment modified as TDRs for the years ended December 31, were as follows:
| | | | | | | | | | | | | | | | | | | | | | | | | | | | | | | | | | | |
| | | | | | | | | | | |
| (Millions of dollars) | Year ended December 31, 2021 | | Year ended December 31, 2020 | | Year ended December 31, 2019 |
| Pre-TDR
Amortized Cost | | Post-TDR
Amortized Cost | | Pre-TDR
Amortized Cost | | Post-TDR
Amortized Cost | | Pre-TDR
Amortized Cost | | Post-TDR
Amortized Cost |
| Customer | | | | | | | | | | | |
| North America | $ | 6 | | | $ | 6 | | | $ | 13 | | | $ | 13 | | | $ | 11 | | | $ | 11 | |
| EAME | 3 | | | 3 | | | — | | | — | | | 17 | | | 17 | |
| Asia/Pacific | 4 | | | 4 | | | 12 | | | 12 | | | — | | | — | |
| Mining | 11 | | | 5 | | | 35 | | | 35 | | | 8 | | | 8 | |
| Latin America | 12 | | | 12 | | | 45 | | | 45 | | | 5 | | | 3 | |
| Caterpillar Power Finance | 26 | | | 22 | | | 115 | | | 115 | | | 168 | | | 165 | |
| Total | $ | 62 | | | $ | 52 | | | $ | 220 | | | $ | 220 | | | $ | 209 | | | $ | 204 | |
| | | | | | | | | | | |
The Post-TDR amortized costs in the Customer portfolio segment with a payment default (defined as 91+ days past due) which had been modified within twelve months prior to the default date, were as follows:
| | | | | | | | | | | | | | | | | | | | |
| (Millions of dollars) | | Years ended December 31, |
| Customer | | 2021 | | 2020 | | 2019 |
| North America | | $ | 1 | | | $ | 8 | | | $ | 5 | |
| EAME | | — | | | 10 | | | — | |
| Asia/Pacific | | 6 | | | 2 | | | — | |
| Mining | | — | | | 10 | | | — | |
| Latin America | | 15 | | | 1 | | | — | |
| Caterpillar Power Finance | | 7 | | | 18 | | | 10 | |
| Total | | $ | 29 | | | $ | 49 | | | $ | 15 | |
| | | | | | |
8. Inventories
Inventories (principally using the LIFO method) are comprised of the following:
| | | | | December 31, | | | December 31, |
| (Millions of dollars) | (Millions of dollars) | | 2021 | | 2020 | (Millions of dollars) | | 2023 | | 2022 |
| Raw materials | Raw materials | | $ | 5,528 | | | $ | 4,021 | |
| Work-in-process | Work-in-process | | 1,318 | | | 1,052 | |
| Finished goods | Finished goods | | 6,907 | | | 6,054 | |
| Supplies | Supplies | | 285 | | | 275 | |
| Total inventories | Total inventories | | $ | 14,038 | | | $ | 11,402 | |
|
9. Property, plant and equipment
| | | | | | | | | | | | | | | | | | | | |
| | | | | December 31, |
| (Millions of dollars) | | Useful
Lives (Years) | | 2023 | | 2022 |
| Land | | — | | $ | 616 | | | $ | 622 | |
| Buildings and land improvements | | 20-45 | | 7,154 | | | 7,016 | |
| Machinery, equipment and other | | 2-10 | | 12,150 | | | 12,282 | |
| Software | | 3-7 | | 1,607 | | | 1,556 | |
| Equipment leased to others | | 1-7 | | 5,837 | | | 5,568 | |
| Construction-in-process | | — | | 1,259 | | | 1,020 | |
| Total property, plant and equipment, at cost | | | | 28,623 | | | 28,064 | |
| Less: Accumulated depreciation | | | | (15,943) | | | (16,036) | |
| Property, plant and equipment–net | | | | $ | 12,680 | | | $ | 12,028 | |
| | | | | | |
9. Property, plant and equipment
| | | | | | | | | | | | | | | | | | | | |
| | | | | December 31, |
| (Millions of dollars) | | Useful
Lives (Years) | | 2021 | | 2020 |
| Land | | — | | $ | 648 | | | $ | 681 | |
| Buildings and land improvements | | 20-45 | | 7,113 | | | 7,091 | |
| Machinery, equipment and other | | 2-10 | | 12,868 | | | 13,004 | |
| Software | | 3-7 | | 1,697 | | | 1,679 | |
| Equipment leased to others | | 1-7 | | 5,733 | | | 6,077 | |
| Construction-in-process | | — | | 812 | | | 739 | |
| Total property, plant and equipment, at cost | | | | 28,871 | | | 29,271 | |
| Less: Accumulated depreciation | | | | (16,781) | | | (16,870) | |
| Property, plant and equipment–net | | | | $ | 12,090 | | | $ | 12,401 | |
| | | | | | |
10. Intangible assets and goodwill
A.Intangible assets
Intangible assets were comprised of the following:
| | | | | | December 31, 2021 |
| (Millions of dollars) | | Weighted
Amortizable
Life (Years) | | Gross
Carrying
Amount | | Accumulated
Amortization | | Net |
| Customer relationships | | 15 | | $ | 2,421 | | | $ | (1,709) | | | $ | 712 | |
| Intellectual property | | 12 | | 1,472 | | | (1,192) | | | 280 | |
| Other | | 14 | | 156 | | | (106) | | | 50 | |
| Total finite-lived intangible assets | | 14 | | $ | 4,049 | | | $ | (3,007) | | | $ | 1,042 | |
| | | | | | | | December 31, 2020 |
| Weighted
Amortizable
Life (Years) | | Gross
Carrying
Amount | | Accumulated
Amortization | | Net |
| (Millions of dollars) | |
| (Millions of dollars) | |
| (Millions of dollars) | |
| Customer relationships | |
| Customer relationships | |
| Customer relationships | Customer relationships | | 15 | | $ | 2,493 | | | $ | (1,600) | | | $ | 893 | |
| Intellectual property | Intellectual property | | 12 | | 1,439 | | | (1,073) | | | 366 | |
| Intellectual property | |
| Intellectual property | |
| Other | Other | | 14 | | 164 | | | (115) | | | 49 | |
| Other | |
| Other | |
| Total finite-lived intangible assets | |
| Total finite-lived intangible assets | |
| Total finite-lived intangible assets | Total finite-lived intangible assets | | 14 | | $ | 4,096 | | | $ | (2,788) | | | $ | 1,308 | |
| | | | | | Weighted
Amortizable
Life (Years) | |
| | Weighted
Amortizable
Life (Years) | |
| | Weighted
Amortizable
Life (Years) | |
| Customer relationships | |
| Customer relationships | |
| Customer relationships | |
| Intellectual property | |
| Intellectual property | |
| Intellectual property | |
| Other | |
| Other | |
| Other | |
| Total finite-lived intangible assets | |
| Total finite-lived intangible assets | |
| Total finite-lived intangible assets | |
| 1 For the year ended December 31, 2023, $1.0 billion of intangible assets were fully amortized and have been removed. | |
| 1 For the year ended December 31, 2023, $1.0 billion of intangible assets were fully amortized and have been removed. | |
| 1 For the year ended December 31, 2023, $1.0 billion of intangible assets were fully amortized and have been removed. | |
Finite-lived intangible assets are amortized over their estimated useful lives and tested for impairment if events or changes in circumstances indicate that the asset may be impaired.
Amortization expense related to intangible assets was $218 million, $284 million and $302 million $311 millionfor 2023, 2022 and $324 million for 2021, 2020 and 2019, respectively.
As of December 31, 2021,2023, amortization expense related to intangible assets is expected to be:
| | | | | | | | | | | | | | | | | | | | | | | | | | | | | | | | |
| (Millions of dollars) |
| 2022 | | 2023 | | 2024 | | 2025 | | 2026 | | Thereafter |
| $286 | | $227 | | $169 | | $159 | | $88 | | $113 |
| | | | | | | | | | |
| | | | | | | | | | | | | | | | | | | | | | | | | | | | | | | | |
| (Millions of dollars) |
| 2024 | | 2025 | | 2026 | | 2027 | | 2028 | | Thereafter |
| $175 | | $166 | | $95 | | $31 | | $24 | | $73 |
| | | | | | | | | | |
B.Goodwill
There were no goodwill impairments during 2021, 20202023 or 2019.2021.
Our annual impairment tests completed in the fourth quarter of 2022 indicated the fair value of each reporting unit was substantially above its respective carrying value, including goodwill, with the exception of our Rail reporting unit.
The Rail reporting unit is a part of our Energy & Transportation segment. Rail’s product portfolio includes diesel-electric locomotives and other rail-related products and services. The annual impairment test completed in the fourth quarter of 2022 indicated that the fair value of Rail was below its carrying value. Accordingly, we recognized a goodwill impairment charge of $925 million, resulting in a full impairment of Rail’s goodwill balance as of October 1, 2022. There was a $36 million tax benefit associated with this impairment charge. The valuation of the Rail reporting unit was based on estimates of future cash flows, which assumed a reduced demand forecast, lower margins due to continued inflationary cost pressures, and a discount rateapproximately 140 basis points higher than utilized in the prior year valuation. The reduction in the demand forecast in the fourth quarter of 2022 was primarily driven by fourth quarter commercial developments, resulting in a lower outlook for the Company’s locomotive offerings.
The changes in carrying amount of goodwill by reportable segment for the years ended December 31, 20212023 and 20202022 were as follows:
| | (Millions of dollars) | (Millions of dollars) | | December 31, 2020 | | Acquisitions | | | Other Adjustments 1 | | December 31, 2021 |
| (Millions of dollars) | |
| (Millions of dollars) | | | December 31, 2022 | | Acquisitions | | | | Impairment Loss | | Other Adjustments 1 | | December 31, 2023 |
| Construction Industries | Construction Industries | | | | | | | | | |
| Goodwill | |
| Goodwill | |
| Goodwill | Goodwill | | $ | 320 | | | $ | 4 | | | | $ | (22) | | | $ | 302 | |
| Impairments | Impairments | | (22) | | | — | | | | — | | | (22) | |
| Net goodwill | Net goodwill | | 298 | | | 4 | | | | (22) | | | 280 | |
| Resource Industries | Resource Industries | | | |
| Goodwill | Goodwill | | 4,253 | | | 22 | | | | (93) | | | 4,182 | |
| Goodwill | |
| Goodwill | |
| Impairments | Impairments | | (1,175) | | | — | | | | — | | | (1,175) | |
| Net goodwill | Net goodwill | | 3,078 | | | 22 | | | | (93) | | | 3,007 | |
| Energy & Transportation | Energy & Transportation | | | |
| Goodwill | Goodwill | | 2,959 | | | 49 | | | | (23) | | | 2,985 | |
| Goodwill | |
| Goodwill | |
| Impairment | |
| Net goodwill | |
All Other 2 | All Other 2 | | | |
| Goodwill | |
| Goodwill | |
| Goodwill | Goodwill | | 59 | | | — | | | | (7) | | | 52 | |
| | Consolidated total | Consolidated total | | | |
| | Consolidated total | |
| | Consolidated total | |
| Goodwill | |
| Goodwill | |
| Goodwill | Goodwill | | 7,591 | | | 75 | | | | (145) | | | 7,521 | |
| Impairments | Impairments | | (1,197) | | | — | | | | — | | | (1,197) | |
| Net goodwill | Net goodwill | | $ | 6,394 | | | $ | 75 | | | | $ | (145) | | | $ | 6,324 | |
| | December 31, 2019 | | Acquisitions | | | Other Adjustments 1 | | December 31, 2020 |
| | December 31, 2021 | |
| | December 31, 2021 | |
| | December 31, 2021 | | | Acquisitions | | | | Impairment Loss | | Other Adjustments 1 | | December 31, 2022 |
| Construction Industries | Construction Industries | | | | | | | | | |
| Goodwill | |
| Goodwill | |
| Goodwill | Goodwill | | $ | 306 | | | $ | — | | | | $ | 14 | | | $ | 320 | |
| Impairments | Impairments | | (22) | | | — | | | | — | | | (22) | |
| Net goodwill | Net goodwill | | 284 | | | — | | | | 14 | | | 298 | |
| Resource Industries | Resource Industries | | | |
| Goodwill | Goodwill | | 4,156 | | | — | | | | 97 | | | 4,253 | |
| Goodwill | |
| Goodwill | |
| Impairments | Impairments | | (1,175) | | | — | | | | — | | | (1,175) | |
| Net goodwill | Net goodwill | | 2,981 | | | — | | | | 97 | | | 3,078 | |
| Energy & Transportation | Energy & Transportation | | | |
| Goodwill | Goodwill | | 2,875 | | | 41 | | | | 43 | | | 2,959 | |
| Goodwill | |
| Goodwill | |
| Impairment | |
| Net goodwill | |
All Other 2 | All Other 2 | | | |
| Goodwill | |
| Goodwill | |
| Goodwill | Goodwill | | 56 | | | — | | | | 3 | | | 59 | |
| | Consolidated total | Consolidated total | | | |
| | Consolidated total | |
| | Consolidated total | |
| Goodwill | |
| Goodwill | |
| Goodwill | Goodwill | | 7,393 | | | 41 | | | | 157 | | | 7,591 | |
| Impairments | Impairments | | (1,197) | | | — | | | | — | | | (1,197) | |
| Net goodwill | Net goodwill | | $ | 6,196 | | | $ | 41 | | | | $ | 157 | | | $ | 6,394 | |
| 1 Other adjustments are comprised primarily of foreign currency translation. 2 Includes All Other operating segment (See Note 23). | |
1 Other adjustments are comprised primarily of foreign currency translation. 2 Includes All Other operating segment (See Note 23). | |
1 Other adjustments are comprised primarily of foreign currency translation. 2 Includes All Other operating segment (See Note 23). | | |
11.Investments in debt and equity securities
We have investments in certain debt and equity securities, primarily at Insurance Services, which we record at fair value and primarily include in Other assets in Statement 3.
We classify debt securities primarily as available-for-sale. We include the unrealized gains and losses arising from the revaluation of available-for-sale debt securities, net of applicable deferred income taxes, in equity (AOCI in Statement 3). We include the unrealized gains and losses arising from the revaluation of the equity securities in Other income (expense) in Statement 1. We generally determine realized gains and losses on sales of investments using the specific identification method for available-for-sale debt and equity securities and include them in Other income (expense) in Statement 1.
The cost basis and fair value of available-for-sale debt securities with unrealized gains and losses included in equity (AOCI in Statement 3) were as follows:
| | | | December 31, 2021 | | December 31, 2020 |
| Available-for-sale debt securities | | Available-for-sale debt securities | | December 31, 2023 | | December 31, 2022 |
| (Millions of dollars) | (Millions of dollars) | | Cost
Basis | | Unrealized
Pretax Net
Gains
(Losses) | | Fair
Value | | Cost
Basis | | Unrealized
Pretax Net
Gains
(Losses) | | Fair
Value | (Millions of dollars) | | Cost
Basis | | Unrealized
Pretax Net
Gains
(Losses) | | Fair
Value | | Cost
Basis | | Unrealized
Pretax Net
Gains
(Losses) | | Fair
Value |
| Government debt | | | | | | | | | | | | |
| Government debt securities | | Government debt securities | | |
| U.S. treasury bonds | U.S. treasury bonds | | $ | 10 | | | $ | — | | | $ | 10 | | | $ | 10 | | | $ | — | | | $ | 10 | |
| Other U.S. and non-U.S. government bonds | Other U.S. and non-U.S. government bonds | | 61 | | | — | | | 61 | | | 58 | | | 1 | | | 59 | |
| | Corporate bonds | | | | | | | | | | | | |
| Corporate bonds | | 1,027 | | | 19 | | | 1,046 | | | 962 | | | 50 | | | 1,012 | |
| Corporate debt securities | |
| Corporate debt securities | |
| Corporate debt securities | | | | | |
| Corporate bonds and other debt securities | |
| Asset-backed securities | Asset-backed securities | | 175 | | | 1 | | | 176 | | | 156 | | | 3 | | | 159 | |
| | Mortgage-backed debt securities | |
| Mortgage-backed debt securities | |
| Mortgage-backed debt securities | Mortgage-backed debt securities | | | | | | | | | | | | | | | | |
| U.S. governmental agency | U.S. governmental agency | | 319 | | | 6 | | | 325 | | | 362 | | | 12 | | | 374 | |
| Residential | Residential | | 4 | | | — | | | 4 | | | 5 | | | — | | | 5 | |
| Commercial | Commercial | | 98 | | | 1 | | | 99 | | | 60 | | | 4 | | | 64 | |
| Total debt securities | | $ | 1,694 | | | $ | 27 | | | $ | 1,721 | | | $ | 1,613 | | | $ | 70 | | | $ | 1,683 | |
| Total available-for-sale debt securities | |
| |
| | | | | | | | | | | | | | | | | | | | | | | | | | | | | | | | | | | |
| Available-for-sale debt securities in an unrealized loss position: |
| |
| | December 31, 2023 |
| | Less than 12 months 1 | | 12 months or more 1 | | Total |
| (Millions of dollars) | Fair Value | | Unrealized
Losses | | Fair Value | | Unrealized
Losses | | Fair Value | | Unrealized
Losses |
| Government debt securities | | | | | | | | | | | |
| Other U.S. and non-U.S. government bonds | $ | — | | | $ | — | | | $ | 25 | | | $ | 3 | | | $ | 25 | | | $ | 3 | |
| | | | | | | | | | | |
| | | | | | | | | | | |
| Corporate debt securities | | | | | | | | | | | |
| Corporate bonds | 765 | | | — | | | 1,011 | | | 45 | | | 1,776 | | | 45 | |
| Asset-backed securities | 9 | | | — | | | 97 | | | 3 | | | 106 | | | 3 | |
| | | | | | | | | | | |
| Mortgage-backed debt securities | | | | | | | | | | | |
| U.S. governmental agency | 33 | | | — | | | 287 | | | 25 | | | 320 | | | 25 | |
| Residential | — | | | — | | | — | | | — | | | — | | | — | |
| Commercial | 2 | | | — | | | 121 | | | 9 | | | 123 | | | 9 | |
| Total | $ | 809 | | | $ | — | | | $ | 1,541 | | | $ | 85 | | | $ | 2,350 | | | $ | 85 | |
| | | | | | | | | | | | | | | | | | | | | | | | | | | | | | | | | | | |
| | December 31, 2022 |
| | Less than 12 months 1 | | 12 months or more 1 | | Total |
| (Millions of dollars) | Fair Value | | Unrealized
Losses | | Fair Value | | Unrealized
Losses | | Fair Value | | Unrealized
Losses |
| Government debt securities | | | | | | | | | | | |
| Other U.S. and non-U.S. government bonds | $ | 19 | | | $ | 1 | | | $ | 20 | | | $ | 4 | | | $ | 39 | | | $ | 5 | |
| | | | | | | | | | | |
| Corporate debt securities | | | | | | | | | | | |
| Corporate bonds | 1,815 | | | 46 | | | 357 | | | 50 | | | 2,172 | | | 96 | |
| Asset-backed securities | 75 | | | 2 | | | 55 | | | 3 | | | 130 | | | 5 | |
| | | | | | | | | | | |
| Mortgage-backed debt securities | | | | | | | | | | | |
| U.S. governmental agency | 229 | | | 16 | | | 98 | | | 15 | | | 327 | | | 31 | |
| Residential | 2 | | | — | | | 1 | | | 1 | | | 3 | | | 1 | |
| Commercial | 63 | | | 5 | | | 54 | | | 5 | | | 117 | | | 10 | |
| Total | $ | 2,203 | | | $ | 70 | | | $ | 585 | | | $ | 78 | | | $ | 2,788 | | | $ | 148 | |
| | | | | | | | | | | |
1 Indicates the length of time that individual securities have been in a continuous unrealized loss position. |
| | | | | | | | | | | |
The unrealized losses on our investments in government debt securities, corporate debt securities, and mortgage-backed debt securities relate to changes in underlying interest rates and credit spreads since time of purchase. We do not intend to sell the investments, and it is not likely that we will be required to sell the investments before recovery of their respective amortized cost basis. In addition, we did not expect credit-related losses on these investments as of December 31, 2021, the total unrealized losses for available-for-sale investments with net losses in AOCI was $6 million. As of December 31, 2020, there was no available-for-sale investments with net losses in AOCI.2023.
The cost basis and fair value of available-for-sale debt securities at December 31, 2021,2023, by contractual maturity, are shown below. Expected maturities will differ from contractual maturities because borrowers may have the right to prepay and creditors may have the right to call obligations.
| | | December 31, 2021 |
| | December 31, 2023 | |
| | December 31, 2023 | |
| | December 31, 2023 | |
| (Millions of dollars) | (Millions of dollars) | | Cost Basis | | Fair Value | (Millions of dollars) | | Cost Basis | | Fair Value |
| Due in one year or less | Due in one year or less | | $ | 120 | | | $ | 121 | |
| Due after one year through five years | Due after one year through five years | | 750 | | | 763 | |
| Due after five years through ten years | Due after five years through ten years | | 332 | | | 337 | |
| Due after ten years | Due after ten years | | 71 | | | 72 | |
| U.S. governmental agency mortgage-backed securities | U.S. governmental agency mortgage-backed securities | | 319 | | | 325 | |
| Residential mortgage-backed securities | Residential mortgage-backed securities | | 4 | | | 4 | |
| Commercial mortgage-backed securities | Commercial mortgage-backed securities | | 98 | | | 99 | |
| Total debt securities – available-for-sale | Total debt securities – available-for-sale | | $ | 1,694 | | | $ | 1,721 | |
|
| | | Sales of available-for-sale debt securities: | Sales of available-for-sale debt securities: | |
| Sales of available-for-sale debt securities: | |
| Sales of available-for-sale debt securities: | |
| | |
| | |
| | | | Years Ended December 31, | | Years Ended December 31, |
| (Millions of dollars) | (Millions of dollars) | | 2021 | | 2020 | | 2019 | (Millions of dollars) | | 2023 | | 2022 | | 2021 |
| Proceeds from the sale of available-for-sale securities | Proceeds from the sale of available-for-sale securities | | $ | 454 | | | $ | 290 | | | $ | 260 | |
| Gross gains from the sale of available-for-sale securities | Gross gains from the sale of available-for-sale securities | | $ | 4 | | | $ | 2 | | | $ | 1 | |
| Gross losses from the sale of available-for-sale securities | Gross losses from the sale of available-for-sale securities | | $ | — | | | $ | 1 | | | $ | 1 | |
| |
In addition, we had $964$1,900 million of investments in time deposits classified as held-to-maturity debt securities as of December 31, 2021.2023. We did not have any investments classified as held-to-maturity debt securities as of December 31, 2022. All these investments mature within one year and we include them in Prepaid expenses and other current assets in Statement 3. We did not have any investments classified as held-to-maturity debt securities as of December 31, 2020. We record held-to-maturity debt securities at amortized cost, which approximates fair value. We did not have any unrealized gains or losses on these securities as of December 31, 2021 and 2020.
For the years ended December 31, 20212023 and 2020,2022, the net unrealized gains (losses) for equity securities held at December 31, 20212023 and 20202022 were $105$(12) million and $47$(49) million, respectively.
12.Postemployment benefit plans
We provide defined benefit pension plans, defined contribution plans and/or other postretirement benefit plans (retirement health care and life insurance) to employees in many of our locations throughout the world. Our defined benefit pension plans provide a benefit based on years of service and/or the employee’s average earnings near retirement. Our defined contribution plans allow employees to contribute a portion of their salary to help save for retirement, and in most cases, we provide a matching contribution. The benefit obligation related to our non-U.S. defined benefit pension plans are for employees located primarily in Europe, Japan and Brazil. For other postretirement benefits (OPEB), substantially all of our benefit obligation is for employees located in the United States.
Our U.S. defined benefit pension plans for support and management employees were frozen for certain employees on December 31, 2010 and were frozen for the remaining employees on December 31, 2019. On the respective transition dates employees moved to a retirement benefit that provided a frozen pension benefit and a 401(k) plan that will include a matching contribution and an annual employer contribution.
A. Obligations, assets and funded status
| | | | | | | | | | | | | | | | | | | | | | | | | | | | | | | | | | | | | | |
| | | U.S. Pension Benefits | | Non-U.S.
Pension Benefits | | Other Postretirement
Benefits |
| | 2021 | | 2020 | | 2021 | | 2020 | | 2021 | | 2020 |
Weighted-average assumptions used to determine benefit obligation, end of year: | | | | | | | | | | | | |
| Discount rate | | 2.8 | % | | 2.4 | % | | 1.8 | % | | 1.4 | % | | 2.7 | % | | 2.3 | % |
Rate of compensation increase 1 | | — | % | | — | % | | 2.0 | % | | 2.0 | % | | 4.0 | % | | 4.0 | % |
| | | | | | | | | | | | |
1 Effective December 31, 2019, all U.S. pension benefits were frozen, and accordingly this assumption is no longer applicable. |
| | | | | | | | | | | | | | | | | | | | | | | | | | | | | | | | | | | | | | |
| | | U.S. Pension Benefits | | Non-U.S.
Pension Benefits | | Other Postretirement
Benefits |
| (Millions of dollars) | | 2023 | | 2022 | | 2023 | | 2022 | | 2023 | | 2022 |
| Accumulated benefit obligation, end of year | | $ | 13,137 | | | $ | 13,069 | | | $ | 3,151 | | | $ | 2,859 | | | | | |
| Change in benefit obligation: | | | | | | | | | | | | |
| Benefit obligation, beginning of year | | $ | 13,069 | | | $ | 17,895 | | | $ | 2,956 | | | $ | 4,436 | | | $ | 2,866 | | | $ | 3,736 | |
Service cost 1 | | — | | | — | | | 40 | | | 50 | | | 67 | | | 99 | |
| Interest cost | | 656 | | | 401 | | | 124 | | | 69 | | | 144 | | | 80 | |
| Plan amendments | | — | | | — | | | — | | | — | | | — | | | (29) | |
| Actuarial loss (gain) | | 394 | | | (4,231) | | | 169 | | | (1,084) | | | (115) | | | (779) | |
| Foreign currency exchange rates | | — | | | — | | | 178 | | | (333) | | | 14 | | | — | |
| Participant contributions | | — | | | — | | | 5 | | | 5 | | | 43 | | | 43 | |
| Benefits paid - gross | | (982) | | | (995) | | | (196) | | | (179) | | | (285) | | | (292) | |
| Less: federal subsidy on benefits paid | | — | | | — | | | — | | | — | | | 7 | | | 8 | |
| Curtailments, settlements and termination benefits | | — | | | (1) | | | (2) | | | (8) | | | — | | | — | |
| Acquisitions, divestitures and other | | — | | | — | | | (9) | | | — | | | — | | | — | |
| Benefit obligation, end of year | | $ | 13,137 | | | $ | 13,069 | | | $ | 3,265 | | | $ | 2,956 | | | $ | 2,741 | | | $ | 2,866 | |
| Change in plan assets: | | | | | | | | | | | | |
| Fair value of plan assets, beginning of year | | $ | 12,456 | | | $ | 17,227 | | | $ | 3,244 | | | $ | 4,552 | | | $ | 102 | | | $ | 130 | |
| Actual return on plan assets | | 1,220 | | | (3,821) | | | 160 | | | (852) | | | 33 | | | (25) | |
| Foreign currency exchange rates | | — | | | — | | | 190 | | | (328) | | | — | | | — | |
| Company contributions | | 44 | | | 46 | | | 66 | | | 54 | | | 251 | | | 246 | |
| Participant contributions | | — | | | — | | | 5 | | | 5 | | | 43 | | | 43 | |
| Benefits paid | | (982) | | | (995) | | | (196) | | | (179) | | | (285) | | | (292) | |
| Settlements and termination benefits | | — | | | (1) | | | (2) | | | (8) | | | — | | | — | |
| Fair value of plan assets, end of year | | $ | 12,738 | | | $ | 12,456 | | | $ | 3,467 | | | $ | 3,244 | | | $ | 144 | | | $ | 102 | |
| | | | | | | | | | | | |
| Over (under) funded status | | $ | (399) | | | $ | (613) | | | $ | 202 | | | $ | 288 | | | $ | (2,597) | | | $ | (2,764) | |
| | | | | | | | | | | | |
| Amounts recognized in Statement 3: | | | | | | | | | | | | |
| Other assets (non-current asset) | | $ | 354 | | | $ | 256 | | | $ | 563 | | | $ | 615 | | | $ | — | | | $ | — | |
| Accrued wages, salaries and employee benefits (current liability) | | (52) | | | (48) | | | (20) | | | (18) | | | (162) | | | (224) | |
Liability for postemployment benefits (non-current liability) 2 | | (701) | | | (821) | | | (341) | | | (309) | | | (2,435) | | | (2,540) | |
| Net (liability) asset recognized | | $ | (399) | | | $ | (613) | | | $ | 202 | | | $ | 288 | | | $ | (2,597) | | | $ | (2,764) | |
| | | | | | | | | | | | |
| | | | | | | | | | | | | | | | | | | | | | | | | | | | | | | | | | | | | | |
| | | | | | | | | | | | |
| Amounts recognized in AOCI (pre-tax): | | | | | | | | | | | | |
| Prior service cost (credit) | | $ | — | | | $ | — | | | $ | 21 | | | $ | 20 | | | $ | (19) | | | $ | (29) | |
| | | | | | | | | | | | |
| Weighted-average assumptions used to determine benefit obligation, end of year: | | | | | | | | | | | | |
| Discount rate | | 5.0 | % | | 5.4 | % | | 3.9 | % | | 4.3 | % | | 5.1 | % | | 5.4 | % |
Rate of compensation increase 1 | | — | % | | — | % | | 2.3 | % | | 2.3 | % | | 4.0 | % | | 4.0 | % |
| | | | | | | | | | | | |
We use the assumed discount rate to discount future benefit obligations back to today’s dollars. The1 All U.S. discount ratepension benefits are frozen, and accordingly there is based on a benefit cash flow-matching approachno longer any service cost and represents the rate at which our benefit obligations could effectively be settled as of our measurement date, December 31. The benefit cash flow-matching approach involves analyzing Caterpillar’s projected cash flows against a high quality bond yield curve, calculated using a wide population of corporate Aa bonds available on the measurement date. We use a similar process to determine the assumed discount rate for our most significant non-U.S. plans. This rate is sensitive to changes in interest rates. A decrease in the discount rate would increase our obligation and future expense.certain assumptions are no longer applicable.
| | | | | | | | | | | | | | | | | | | | | | | | | | | | | | | | | | | | | | |
| | | U.S. Pension Benefits | | Non-U.S.
Pension Benefits | | Other Postretirement
Benefits |
| (Millions of dollars) | | 2021 | | 2020 | | 2021 | | 2020 | | 2021 | | 2020 |
| Accumulated benefit obligation, end of year | | $ | 17,895 | | | $ | 19,177 | | | $ | 4,311 | | | $ | 4,680 | | | | | |
| Change in benefit obligation: | | | | | | | | | | | | |
| Benefit obligation, beginning of year | | $ | 19,177 | | | $ | 17,773 | | | $ | 4,847 | | | $ | 4,666 | | | $ | 4,051 | | | $ | 3,960 | |
Service cost 1 | | — | | | — | | | 57 | | | 55 | | | 100 | | | 94 | |
| Interest cost | | 330 | | | 483 | | | 53 | | | 68 | | | 64 | | | 103 | |
| Plan amendments | | — | | | — | | | — | | | 6 | | | — | | | (8) | |
Actuarial losses (gains) 2 | | (610) | | | 1,922 | | | (142) | | | 258 | | | (211) | | | 192 | |
| Foreign currency exchange rates | | — | | | — | | | (154) | | | 213 | | | (15) | | | (25) | |
| Participant contributions | | — | | | — | | | 4 | | | 4 | | | 48 | | | 44 | |
| Benefits paid - gross | | (996) | | | (997) | | | (184) | | | (159) | | | (310) | | | (317) | |
| Less: federal subsidy on benefits paid | | — | | | — | | | — | | | — | | | 9 | | | 8 | |
| Curtailments, settlements and termination benefits | | (6) | | | (4) | | | (45) | | | (264) | | | — | | | — | |
| Benefit obligation, end of year | | $ | 17,895 | | | $ | 19,177 | | | $ | 4,436 | | | $ | 4,847 | | | $ | 3,736 | | | $ | 4,051 | |
| Change in plan assets: | | | | | | | | | | | | |
| Fair value of plan assets, beginning of year | | $ | 17,589 | | | $ | 15,994 | | | $ | 4,731 | | | $ | 4,525 | | | $ | 147 | | | $ | 255 | |
| Actual return on plan assets | | 595 | | | 2,552 | | | 99 | | | 385 | | | 34 | | | 23 | |
| Foreign currency exchange rates | | — | | | — | | | (139) | | | 164 | | | — | | | — | |
| Company contributions | | 45 | | | 44 | | | 84 | | | 76 | | | 211 | | | 142 | |
| Participant contributions | | — | | | — | | | 4 | | | 4 | | | 48 | | | 44 | |
| Benefits paid | | (996) | | | (997) | | | (184) | | | (159) | | | (310) | | | (317) | |
| Settlements and termination benefits | | (6) | | | (4) | | | (43) | | | (264) | | | — | | | — | |
| Fair value of plan assets, end of year | | $ | 17,227 | | | $ | 17,589 | | | $ | 4,552 | | | $ | 4,731 | | | $ | 130 | | | $ | 147 | |
| | | | | | | | | | | | |
| Over (under) funded status | | $ | (668) | | | $ | (1,588) | | | $ | 116 | | | $ | (116) | | | $ | (3,606) | | | $ | (3,904) | |
| | | | | | | | | | | | |
| Components of net amount recognized in financial position: | | | | | | | | | | | | |
| Other assets (non-current asset) | | $ | 592 | | | $ | 409 | | | $ | 538 | | | $ | 556 | | | $ | — | | | $ | — | |
| Accrued wages, salaries and employee benefits (current liability) | | (45) | | | (44) | | | (16) | | | (25) | | | (240) | | | (186) | |
Liability for postemployment benefits (non-current liability) 3 | | (1,215) | | | (1,953) | | | (406) | | | (647) | | | (3,366) | | | (3,718) | |
| Net (liability) asset recognized | | $ | (668) | | | $ | (1,588) | | | $ | 116 | | | $ | (116) | | | $ | (3,606) | | | $ | (3,904) | |
| | | | | | | | | | | | |
| | | | | | | | | | | | | | | | | | | | | | | | | | | | | | | | | | | | | | |
| | | | | | | | | | | | |
| Amounts recognized in Accumulated other comprehensive income (pre-tax) consist of: | | | | | | | | | | | | |
| Prior service cost (credit) | | $ | — | | | $ | — | | | $ | 23 | | | $ | 24 | | | $ | (5) | | | $ | (46) | |
| | | | | | | | | | | | |
| | | | | | | | | | | | |
1 Effective December 31, 2019, all U.S. pension benefits were frozen, and accordingly there is no longer any service cost.
2 For 2021,2023, Actuarial loss (gain) impacting the benefit obligation was primarily due to lower discount rates at the end of 2023 compared to the end of 2022. For 2022, Actuarial loss (gain) impacting the benefit obligation was primarily due to higher discount rates at the end of 20212022 compared to the end of 2020. For 2020, Actuarial loss (gain) impacting the benefit obligation was primarily due to lower discount rates at the end of 2020 compared to the end of 2019.
3 The Liability for postemployment benefits reported in Statement 3 includes our liability for other postemployment benefits and our liability for non-qualified deferred compensation plans. For 2021, these liabilities were $67 million and $538 million, respectively. For 2020, these liabilities were $63 million and $491 million, respectively.
| | | |
| | | | | U.S. Pension Benefits | | Non-U.S.
Pension Benefits | |
| (Millions of dollars) | (Millions of dollars) | | 2021 | | 2020 | | 2021 | | 2020 | |
| (Millions of dollars) | |
| (Millions of dollars) | |
| Pension plans with projected benefit obligation in excess of plan assets: | |
| Pension plans with projected benefit obligation in excess of plan assets: | |
| Pension plans with projected benefit obligation in excess of plan assets: | Pension plans with projected benefit obligation in excess of plan assets: | | | | | | | | | |
| Projected benefit obligation | Projected benefit obligation | | $ | 14,403 | | | $ | 15,300 | | | $ | 743 | | | $ | 2,171 | | |
| Projected benefit obligation | |
| Projected benefit obligation | |
| Fair value of plan assets | |
| Fair value of plan assets | |
| Fair value of plan assets | Fair value of plan assets | | $ | 13,143 | | | $ | 13,302 | | | $ | 319 | | | $ | 1,499 | | |
| | Pension plans with accumulated benefit obligation in excess of plan assets: | Pension plans with accumulated benefit obligation in excess of plan assets: | | |
| | Pension plans with accumulated benefit obligation in excess of plan assets: | |
| | Pension plans with accumulated benefit obligation in excess of plan assets: | |
| Accumulated benefit obligation | Accumulated benefit obligation | | $ | 14,403 | | | $ | 15,300 | | | $ | 603 | | | $ | 1,988 | | |
| Accumulated benefit obligation | |
| Accumulated benefit obligation | |
| Fair value of plan assets | |
| Fair value of plan assets | |
| Fair value of plan assets | Fair value of plan assets | | $ | 13,143 | | | $ | 13,302 | | | $ | 234 | | | $ | 1,425 | | |
| |
The accumulated postretirement benefit obligation exceeds plan assets for all of our other postretirement benefit plans for all years presented.
B. Net periodic benefit cost
| | | | | U.S. Pension Benefits | | Non-U.S. Pension Benefits | | Other Postretirement Benefits | | | U.S. Pension Benefits | | Non-U.S. Pension Benefits | | Other Postretirement Benefits |
| (Millions of dollars) | (Millions of dollars) | | 2021 | | 2020 | | 2019 | | 2021 | | 2020 | | 2019 | | 2021 | | 2020 | | 2019 | (Millions of dollars) | | 2023 | | 2022 | | 2021 | | 2023 | | 2022 | | 2021 | | 2023 | | 2022 | | 2021 |
| Components of net periodic benefit cost: | | | | | | | | | | | | | | | | | | |
| Net periodic benefit cost: | | Net periodic benefit cost: | | |
Service cost 1 | Service cost 1 | | $ | — | | | $ | — | | | $ | 115 | | | $ | 57 | | | $ | 55 | | | $ | 80 | | | $ | 100 | | | $ | 94 | | | $ | 80 | |
| Interest cost | Interest cost | | 330 | | | 483 | | | 600 | | | 53 | | | 68 | | | 94 | | | 64 | | | 103 | | | 136 | |
| Expected return on plan assets | Expected return on plan assets | | (718) | | | (791) | | | (721) | | | (128) | | | (135) | | | (148) | | | (6) | | | (12) | | | (18) | |
| Curtailments, settlements and termination benefits | Curtailments, settlements and termination benefits | | — | | | (1) | | | (1) | | | (1) | | | 30 | | | (7) | | | — | | | — | | | — | |
| Amortization of prior service cost (credit) | Amortization of prior service cost (credit) | | — | | | — | | | — | | | — | | | — | | | — | | | (40) | | | (38) | | | (40) | |
Actuarial loss (gain) 2 | Actuarial loss (gain) 2 | | (487) | | | 162 | | | 72 | | | (115) | | | 32 | | | 90 | | | (231) | | | 189 | | | 306 | |
Net Periodic benefit cost (benefit) 3 | Net Periodic benefit cost (benefit) 3 | | $ | (875) | | | $ | (147) | | | $ | 65 | | | $ | (134) | | | $ | 50 | | | $ | 109 | | | $ | (113) | | | $ | 336 | | | $ | 464 | |
| | Other changes in plan assets and benefit obligations recognized in other comprehensive income (pre-tax): | | | | | | | | | | | | | | | | | | |
| Amounts recognized in other comprehensive income (pre-tax): | |
| Amounts recognized in other comprehensive income (pre-tax): | |
| Amounts recognized in other comprehensive income (pre-tax): | | | |
| Current year prior service cost (credit) | Current year prior service cost (credit) | | $ | — | | | $ | — | | | $ | — | | | $ | — | | | $ | 8 | | | $ | (4) | | | $ | — | | | $ | (7) | | | $ | 8 | |
| Amortization of prior service (cost) credit | Amortization of prior service (cost) credit | | — | | | — | | | — | | | — | | | — | | | — | | | 40 | | | 38 | | | 40 | |
| Total recognized in other comprehensive income | Total recognized in other comprehensive income | | — | | | — | | | — | | | — | | | 8 | | | (4) | | | 40 | | | 31 | | | 48 | |
| Total recognized in net periodic cost and other comprehensive income | Total recognized in net periodic cost and other comprehensive income | | $ | (875) | | | $ | (147) | | | $ | 65 | | | $ | (134) | | | $ | 58 | | | $ | 105 | | | $ | (73) | | | $ | 367 | | | $ | 512 | |
| | Weighted-average assumptions used to determine net periodic benefit cost: | Weighted-average assumptions used to determine net periodic benefit cost: | | | | | | | | | | | | | | | | | | |
| Weighted-average assumptions used to determine net periodic benefit cost: | |
| Weighted-average assumptions used to determine net periodic benefit cost: | | | |
Discount rate used to measure service cost 1 | Discount rate used to measure service cost 1 | | — | % | | — | % | | 4.3 | % | | 1.4 | % | | 1.5 | % | | 2.5 | % | | 2.5 | % | | 3.2 | % | | 4.1 | % | Discount rate used to measure service cost 1 | | — | % | | — | % | | — | % | | 3.8 | % | | 1.7 | % | | 1.4 | % | | 5.4 | % | | 2.8 | % | | 2.5 | % |
| Discount rate used to measure interest cost | Discount rate used to measure interest cost | | 1.8 | % | | 2.8 | % | | 3.9 | % | | 1.2 | % | | 1.7 | % | | 2.3 | % | | 1.6 | % | | 2.8 | % | | 3.9 | % | Discount rate used to measure interest cost | | 5.2 | % | | 2.3 | % | | 1.8 | % | | 4.2 | % | | 1.7 | % | | 1.2 | % | | 5.3 | % | | 2.2 | % | | 1.6 | % |
Expected rate of return on plan assets 4 | | 4.2 | % | | 5.1 | % | | 5.9 | % | | 2.9 | % | | 3.3 | % | | 3.8 | % | | 6.5 | % | | 7.0 | % | | 7.2 | % |
| Expected rate of return on plan assets | | Expected rate of return on plan assets | | 5.8 | % | | 4.0 | % | | 4.2 | % | | 5.2 | % | | 3.1 | % | | 2.9 | % | | 7.4 | % | | 6.9 | % | | 6.5 | % |
Rate of compensation increase 1 | Rate of compensation increase 1 | | — | % | | — | % | | 4.0 | % | | 2.0 | % | | 2.0 | % | | 3.0 | % | | 4.0 | % | | 4.0 | % | | 4.1 | % | Rate of compensation increase 1 | | — | % | | — | % | | — | % | | 2.3 | % | | 2.0 | % | | 2.0 | % | | 4.0 | % | | 4.0 | % | | 4.0 | % |
1 Effective December 31, 2019, allAll U.S. pension benefits wereare frozen, and accordingly there is no longer any service cost and certain assumptions are no longer applicable.
2 Actuarial loss (gain) represents the effects of actual results differing from our assumptions and the effects of changing assumptions. We recognize actuarial loss (gain) immediately through earnings upon the annual remeasurement in the fourth quarter, or on an interim basis as triggering events warrant remeasurement.
3 The service cost component is included in Operating costs and all other components are included in Other income (expense) in Statement 1.
4 The weighted-average rates for 2022 are 4.0 percent and 3.1 percent for U.S. and non-U.S. pension plans, respectively.
The discount rates used in the determination of our service and interest cost components utilize a full yield curve approach which applies specific spot rates along the yield curve used in the calculation of the benefit obligation to the relevant projected cash flows.
Our U.S. expected long-term rate of return on U.S. plan assets is based on our estimate of long-term passive returns for equities and fixed income securities weighted by the allocationfair value of our pension assets. Based on historical performance, we increase the passive returns due to our active managementplan asset allocations as of the plan assets. To arrive at our expected long-term return, the amount added for active management was 0.35 percent for 2021, and 0.40 percent for 2020 and 2019.December 31. We use a similar process to determine this rate for our non-U.S. plans.
The assumed health care trend rate represents the rate at which health care costs are assumed to increase. We assumed a weighted-average increase of 5.86.5 percent in our calculation of 20212023 benefit expense. We expect a weighted-average increase of 5.66.2 percent during 2022.2024. The 20222024 rates are assumed to decrease gradually to the ultimate health care trend rate of 54.7 percent in 2025. This rate represents 3 percent general inflation plus 2 percent additional health care inflation.2030.
C. Expected contributions and Benefit payments
The following table presents information about expected contributions and benefit payments for pension and other postretirement benefit plans:
| | (Millions of dollars) | (Millions of dollars) | | 2022 | |
| Expected employer contributions: | Expected employer contributions: | | | | | | | |
| Expected employer contributions: | |
| Expected employer contributions: | |
| U.S. Pension Benefits | |
| U.S. Pension Benefits | |
| U.S. Pension Benefits | U.S. Pension Benefits | | $ | 46 | | |
| Non-U.S. Pension Benefits | Non-U.S. Pension Benefits | | $ | 55 | | |
| Non-U.S. Pension Benefits | |
| Non-U.S. Pension Benefits | |
| Other Postretirement Benefits | Other Postretirement Benefits | | $ | 256 | | |
| Other Postretirement Benefits | |
| Other Postretirement Benefits | |
| | Expected benefit payments: | |
| | Expected benefit payments: | |
| | Expected benefit payments: | Expected benefit payments: | | 2022 | | 2023 | | 2024 | | 2025 | | 2026 | | 2027-
2031 | | Total | | 2024 | | 2025 | | 2026 | | 2027 | | 2028 | | 2029-
2033 | | Total |
| U.S. Pension Benefits | U.S. Pension Benefits | | $ | 1,035 | | | $ | 1,020 | | | $ | 1,020 | | | $ | 1,020 | | | $ | 1,020 | | | $ | 4,960 | | | $ | 10,075 | |
| Non-U.S. Pension Benefits | Non-U.S. Pension Benefits | | $ | 210 | | | $ | 175 | | | $ | 180 | | | $ | 185 | | | $ | 195 | | | $ | 1,045 | | | $ | 1,990 | |
| Other Postretirement Benefits | Other Postretirement Benefits | | $ | 275 | | | $ | 270 | | | $ | 265 | | | $ | 260 | | | $ | 260 | | | $ | 1,250 | | | $ | 2,580 | |
| | Expected Medicare Part D subsidy: | Expected Medicare Part D subsidy: | | $ | 7 | | | $ | 7 | | | $ | 7 | | | $ | 7 | | | $ | 6 | | | $ | 26 | | | $ | 60 | |
| Expected Medicare Part D subsidy: | |
| Expected Medicare Part D subsidy: | |
|
The above table reflects the total expected employer contributions and expected benefits to be paid from the plan or from company assets and does not include the participants’ share of the cost. The expected benefit payments for our other postretirement benefits include payments for prescription drug benefits. The above table also includes Medicare Part D subsidy amounts expected to be received by the company which will offset other postretirement benefit payments.
D. Plan assets
In general, our strategy for both the U.S. and non-U.S. pensions includes ongoing alignment of our investments to our liabilities, while reducing risk in our portfolio. The current U.S. pension target asset allocation is 85 percent fixed income and 15 percent equities. We will revise this target allocation periodically to ensure it reflects our overall objectives. The non-U.S. pension weighted-average target allocations are 8259 percent fixed income, 1019 percent insurance contracts, 12 percent equities, 56 percent real estate, and 34 percent other. The target allocations for each plan vary based upon local statutory requirements, demographics of plan participants and funded status. We primarily invest the non-U.S. plan assets in non-U.S. securities.
Our target allocation for the other postretirement benefit plans is 70 percent equities and 30 percent fixed income.
We rebalance the U.S. plans to within the appropriate target asset allocation ranges on a monthly basis. The frequency of rebalancing for the non-U.S. plans varies depending on the plan. As a result of our diversification strategies, there are no significant concentrations of risk within the portfolio of investments.
We permit the use of certain derivative instruments where appropriate and necessary for achieving overall investment policy objectives. The plans do not use derivative contracts for speculative purposes.
The accounting guidance on fair value measurements specifies a fair value hierarchy based upon the observability of inputs used in valuation techniques (Level 1, 2 and 3). Certain assets that are measured at fair value using the net asset value per share (or its equivalent) practical expedient have not been classified in the fair value hierarchy. See Note 18 for a discussion of the fair value hierarchy.
We determine fair values as follows:
•Equity securities are primarily based on valuations for identical instruments in active markets.
•Fixed income securities are primarily based upon models that take into consideration such market-based factors as recent sales, risk-free yield curves and prices of similarly rated bonds.
•Real estate is stated at the fund’s net asset value or at appraised value.
•Insurance contracts are valued on an insurer pricing basis updated for changes in insurance market pricing, market rates, and inflation.
•Cash, short-term instruments and other are based on the carrying amount, which approximates fair value, or the fund’s net asset value.
The fair value of the pension and other postretirement benefit plan assets by category is summarized below:
| | | | | December 31, 2021 | | | December 31, 2023 |
| (Millions of dollars) | (Millions of dollars) | | Level 1 | | Level 2 | | Level 3 | | Measured at NAV | | Total Assets at Fair Value | (Millions of dollars) | | Level 1 | | Level 2 | | Level 3 | | Measured at NAV | | Total Assets at Fair Value |
| U.S. Pension | U.S. Pension | | | | | | | | | | | U.S. Pension | | |
| Equity securities: | Equity securities: | | | | | | | | | | | Equity securities: | | |
| U.S. equities | U.S. equities | | $ | 1,644 | | | $ | 25 | | | $ | 23 | | | $ | 149 | | | $ | 1,841 | |
| Non-U.S. equities | Non-U.S. equities | | 1,398 | | | — | | | 2 | | | — | | | 1,400 | |
| | Fixed income securities: | Fixed income securities: | | | | | | | | |
| Fixed income securities: | |
| Fixed income securities: | | | | | | | |
| U.S. corporate bonds | U.S. corporate bonds | | — | | | 7,289 | | | 40 | | | 37 | | | 7,366 | |
| Non-U.S. corporate bonds | Non-U.S. corporate bonds | | — | | | 1,569 | | | — | | | — | | | 1,569 | |
| U.S. government bonds | U.S. government bonds | | — | | | 4,341 | | | — | | | — | | | 4,341 | |
| U.S. governmental agency mortgage-backed securities | U.S. governmental agency mortgage-backed securities | | — | | | 24 | | | — | | | — | | | 24 | |
| Non-U.S. government bonds | Non-U.S. government bonds | | — | | | 172 | | | — | | | — | | | 172 | |
| | Real estate | Real estate | | — | | | — | | | 7 | | | — | | | 7 | |
| Real estate | |
| Real estate | |
| | Cash, short-term instruments and other | Cash, short-term instruments and other | | 228 | | | 60 | | | — | | | 219 | | | 507 | |
| Cash, short-term instruments and other | |
| Cash, short-term instruments and other | |
| Total U.S. pension assets | Total U.S. pension assets | | $ | 3,270 | | | $ | 13,480 | | | $ | 72 | | | $ | 405 | | | $ | 17,227 | |
| | | | | December 31, 2020 | | | December 31, 2022 |
| (Millions of dollars) | (Millions of dollars) | | Level 1 | | Level 2 | | Level 3 | | Measured at NAV | | Total Assets at Fair Value | (Millions of dollars) | | Level 1 | | Level 2 | | Level 3 | | Measured at NAV | | Total Assets at Fair Value |
| U.S. Pension | U.S. Pension | | | | | | | | | | | U.S. Pension | | | | | | |
| Equity securities: | Equity securities: | | | | | | | | | Equity securities: | | | | | | |
| U.S. equities | U.S. equities | | $ | 2,292 | | | $ | 5 | | | $ | 28 | | | $ | 133 | | | $ | 2,458 | |
| Non-U.S. equities | Non-U.S. equities | | 1,838 | | | — | | | 1 | | | — | | | 1,839 | |
| | Fixed income securities: | Fixed income securities: | | | | | | | | |
| Fixed income securities: | |
| Fixed income securities: | | | | | | | |
| U.S. corporate bonds | U.S. corporate bonds | | — | | | 7,395 | | | 53 | | | 119 | | | 7,567 | |
| Non-U.S. corporate bonds | Non-U.S. corporate bonds | | — | | | 1,372 | | | — | | | — | | | 1,372 | |
| U.S. government bonds | U.S. government bonds | | — | | | 3,618 | | | — | | | — | | | 3,618 | |
| U.S. governmental agency mortgage-backed securities | U.S. governmental agency mortgage-backed securities | | — | | | 27 | | | — | | | — | | | 27 | |
| Non-U.S. government bonds | Non-U.S. government bonds | | — | | | 133 | | | — | | | — | | | 133 | |
| | Real estate | Real estate | | — | | | — | | | 9 | | | — | | | 9 | |
| Real estate | |
| Real estate | |
| | Cash, short-term instruments and other | |
| Cash, short-term instruments and other | |
| Cash, short-term instruments and other | Cash, short-term instruments and other | | 363 | | | 22 | | | — | | | 181 | | | 566 | |
| Total U.S. pension assets | Total U.S. pension assets | | $ | 4,493 | | | $ | 12,572 | | | $ | 91 | | | $ | 433 | | | $ | 17,589 | |
|
| | | | | December 31, 2021 | | | December 31, 2023 |
| (Millions of dollars) | (Millions of dollars) | | Level 1 | | Level 2 | | Level 3 | | Measured at NAV | | Total Assets at Fair Value | (Millions of dollars) | | Level 1 | | Level 2 | | Level 3 | | Measured at NAV | | Total Assets at Fair Value |
| Non-U.S. Pension | Non-U.S. Pension | | | | | | | | | | | Non-U.S. Pension | | | | | | |
| Equity securities: | Equity securities: | | | | | | | | | Equity securities: | | | | | | |
| U.S. equities | U.S. equities | | $ | 72 | | | $ | — | | | $ | — | | | $ | — | | | $ | 72 | |
| Non-U.S. equities | Non-U.S. equities | | 266 | | | 32 | | | — | | | 37 | | | 335 | |
Global equities 1 | Global equities 1 | | 31 | | | 15 | | | — | | | 46 | | | 92 | |
| | Fixed income securities: | Fixed income securities: | | | | | | | | |
| Fixed income securities: | |
| Fixed income securities: | | | | | | | |
| U.S. corporate bonds | U.S. corporate bonds | | — | | | 327 | | | — | | | — | | | 327 | |
| Non-U.S. corporate bonds | Non-U.S. corporate bonds | | — | | | 889 | | | — | | | — | | | 889 | |
| U.S. government bonds | U.S. government bonds | | — | | | 152 | | | — | | | — | | | 152 | |
| Non-U.S. government bonds | Non-U.S. government bonds | | — | | | 1,752 | | | — | | | — | | | 1,752 | |
Global fixed income 1 | Global fixed income 1 | | — | | | 88 | | | — | | | 297 | | | 385 | |
| | Real estate | Real estate | | — | | | 225 | | | — | | | — | | | 225 | |
| Real estate | |
| Real estate | |
| | Insurance contracts | |
| Insurance contracts | |
| Insurance contracts | |
| Cash, short-term instruments and other 2 | Cash, short-term instruments and other 2 | | 56 | | | 267 | | | — | | | — | | | 323 | |
Cash, short-term instruments and other 2 | |
Cash, short-term instruments and other 2 | |
| Total non-U.S. pension assets | Total non-U.S. pension assets | | $ | 425 | | | $ | 3,747 | | | $ | — | | | $ | 380 | | | $ | 4,552 | |
| | | | | December 31, 2020 | | | December 31, 2022 |
| (Millions of dollars) | (Millions of dollars) | | Level 1 | | Level 2 | | Level 3 | | Measured at NAV | | Total Assets at Fair Value | (Millions of dollars) | | Level 1 | | Level 2 | | Level 3 | | Measured at NAV | | Total Assets at Fair Value |
| Non-U.S. Pension | Non-U.S. Pension | | | | | | | | | | | Non-U.S. Pension | | | | | | |
| Equity securities: | Equity securities: | | | | | | | | | Equity securities: | | | | | | |
| U.S. equities | U.S. equities | | $ | 97 | | | $ | — | | | $ | — | | | $ | — | | | $ | 97 | |
| Non-U.S. equities | Non-U.S. equities | | 368 | | | 33 | | | — | | | 50 | | | 451 | |
Global equities 1 | Global equities 1 | | 29 | | | 17 | | | — | | | 49 | | | 95 | |
| | Fixed income securities: | Fixed income securities: | | | | | | | | |
| Fixed income securities: | |
| Fixed income securities: | | | | | | | |
| U.S. corporate bonds | U.S. corporate bonds | | — | | | 314 | | | — | | | — | | | 314 | |
| Non-U.S. corporate bonds | Non-U.S. corporate bonds | | — | | | 987 | | | — | | | — | | | 987 | |
| U.S. government bonds | U.S. government bonds | | — | | | 2 | | | — | | | — | | | 2 | |
| Non-U.S. government bonds | Non-U.S. government bonds | | — | | | 1,743 | | | — | | | — | | | 1,743 | |
Global fixed income 1 | Global fixed income 1 | | — | | | 131 | | | — | | | 325 | | | 456 | |
| | Real estate | Real estate | | — | | | 239 | | | — | | | — | | | 239 | |
| Real estate | |
| Real estate | |
| Cash, short-term instruments and other 2 | |
Cash, short-term instruments and other 2 | |
Cash, short-term instruments and other 2 | Cash, short-term instruments and other 2 | | 71 | | | 276 | | | — | | | — | | | 347 | |
| Total non-U.S. pension assets | Total non-U.S. pension assets | | $ | 565 | | | $ | 3,742 | | | $ | — | | | $ | 424 | | | $ | 4,731 | |
| 1 Includes funds that invest in both U.S. and non-U.S. securities. | 1 Includes funds that invest in both U.S. and non-U.S. securities. | |
1 Includes funds that invest in both U.S. and non-U.S. securities. | |
2 Includes funds that invest in multiple asset classes, hedge funds and other. | 2 Includes funds that invest in multiple asset classes, hedge funds and other. | 2 Includes funds that invest in multiple asset classes, hedge funds and other. |
|
| | | | | | | | | | | | | | | | | | | | | | | | | | | | | | | | |
| | | December 31, 2021 |
| (Millions of dollars) | | Level 1 | | Level 2 | | Level 3 | | Measured at NAV | | Total Assets at Fair Value |
| Other Postretirement Benefits | | | | | | | | | | |
| Equity securities: | | | | | | | | | | |
| U.S. equities | | $ | 49 | | | $ | — | | | $ | — | | | $ | — | | | $ | 49 | |
| Non-U.S. equities | | 17 | | | — | | | — | | | — | | | 17 | |
| | | | | | | | | | |
| | | | | | | | | | |
| | | | | | | | | | |
| | | | | | | | | | |
| | | | | | | | | | |
| | | | | | | | | | |
| | | | | | | | | | |
| | | | | | | | | | |
| Cash, short-term instruments and other | | — | | | 2 | | | — | | | 62 | | | 64 | |
| Total other postretirement benefit assets | | $ | 66 | | | $ | 2 | | | $ | — | | | $ | 62 | | | $ | 130 | |
| | | | | | | | | | | | | | | | | | | | | | | | | | | | | | | | |
| | | December 31, 2020 |
| (Millions of dollars) | | Level 1 | | Level 2 | | Level 3 | | Measured at NAV | | Total Assets at Fair Value |
| Other Postretirement Benefits | | | | | | | | | | |
| Equity securities: | | | | | | | | | | |
| U.S. equities | | $ | 88 | | | $ | — | | | $ | — | | | $ | — | | | $ | 88 | |
| Non-U.S. equities | | 21 | | | — | | | — | | | — | | | 21 | |
| | | | | | | | | | |
| Fixed income securities: | | | | | | | | | | |
| U.S. corporate bonds | | — | | | 11 | | | — | | | 1 | | | 12 | |
| Non-U.S. corporate bonds | | — | | | 2 | | | — | | | — | | | 2 | |
| U.S. government bonds | | — | | | 3 | | | — | | | — | | | 3 | |
| U.S. governmental agency mortgage-backed securities | | — | | | 6 | | | — | | | — | | | 6 | |
| Non-U.S. government bonds | | — | | | 3 | | | — | | | — | | | 3 | |
| | | | | | | | | | |
| Cash, short-term instruments and other | | — | | | 2 | | | — | | | 10 | | | 12 | |
| Total other postretirement benefit assets | | $ | 109 | | | $ | 27 | | | $ | — | | | $ | 11 | | | $ | 147 | |
| | | | | | | | | | |
| | | | | | | | | | | | | | | | | | | | | | | | | | | | | | | | |
| | | December 31, 2023 |
| (Millions of dollars) | | Level 1 | | Level 2 | | Level 3 | | Measured at NAV | | Total Assets at Fair Value |
| Other Postretirement Benefits | | | | | | | | | | |
| Equity securities: | | | | | | | | | | |
| U.S. equities | | $ | 65 | | | $ | — | | | $ | — | | | $ | 5 | | | $ | 70 | |
| Non-U.S. equities | | 23 | | | — | | | — | | | 2 | | | 25 | |
| | | | | | | | | | |
| Fixed income securities: | | | | | | | | | | |
| U.S. corporate bonds | | — | | | — | | | — | | | 30 | | | 30 | |
| | | | | | | | | | |
| | | | | | | | | | |
| | | | | | | | | | |
| | | | | | | | | | |
| | | | | | | | | | |
| Cash, short-term instruments and other | | 1 | | | — | | | — | | | 18 | | | 19 | |
| Total other postretirement benefit assets | | $ | 89 | | | $ | — | | | $ | — | | | $ | 55 | | | $ | 144 | |
| | | | | | | | | | | | | | | | | | | | | | | | | | | | | | | | |
| | | | | | | | | | |
| | | December 31, 2022 |
| (Millions of dollars) | | Level 1 | | Level 2 | | Level 3 | | Measured at NAV | | Total Assets at Fair Value |
| Other Postretirement Benefits | | | | | | | | | | |
| Equity securities: | | | | | | | | | | |
| U.S. equities | | $ | 41 | | | $ | — | | | $ | — | | | $ | 2 | | | $ | 43 | |
| Non-U.S. equities | | 16 | | | — | | | — | | | 3 | | | 19 | |
| | | | | | | | | | |
| | | | | | | | | | |
| | | | | | | | | | |
| | | | | | | | | | |
| | | | | | | | | | |
| | | | | | | | | | |
| | | | | | | | | | |
| | | | | | | | | | |
| Cash, short-term instruments and other | | 3 | | | — | | | — | | | 37 | | | 40 | |
| Total other postretirement benefit assets | | $ | 60 | | | $ | — | | | $ | — | | | $ | 42 | | | $ | 102 | |
| | | | | | | | | | |
The activity attributable to U.S. pension assets measured at fair value using Level 3 inputs for the years ended December 31, 20212023 and 20202022 was insignificant. During 2023, activity in our non-U.S. pension Level 3 assets involved insurance contracts, including purchases of $633 million, settlements of $9 million and unrealized gains of $51 million. We valued these instruments using pricing models that, in management’s judgment, reflect the assumptions a market participant would use.
E. Defined contribution plans
We have both U.S. and non-U.S. employee defined contribution plans to help employees save for retirement. Our primary U.S. 401(k) plan allows eligible employees to contribute a portion of their cash compensation to the plan on a tax-deferred basis. Employees with frozen defined benefit pension accruals are eligible for matching contributions equal to 100 percent of employee contributions to the plan up to 6 percent of cash compensation and an annual employer contribution that ranges from 3 to 5 percent of cash compensation (depending on years of service and age). Employees that were still accruing benefits under a defined benefit pension plan up to December 31, 2019 were eligible for matching contributions equal to 50 percent of employee contributions up to 6 percent of cash compensation. All our U.S. defined benefit pension plans were frozen on December 31, 2019 for remaining employees still accruing a benefit. Starting in 2020, these employees receive matching contributions equal to 100 percent of employee contributions to the plan up to 6 percent of cash compensation and an annual employer contribution that ranges from 3 to 5 percent of cash compensation (depending on years of service and age).
These 401(k) plans include various investment funds, including a non-leveraged employee stock ownership plan (ESOP). As of December 31, 20212023 and 2020,2022, the ESOP held 12.411.3 million and 13.212.0 million shares, respectively. We allocate all of the shares held by the ESOP to participant accounts. Dividends paid to participants are automatically reinvested into company shares unless the participant elects to have all or a portion of the dividend paid to the participant. Various other U.S. and non-U.S. defined contribution plans generally allow eligible employees to contribute a portion of their cash compensation to the plans, and in most cases, we provide a matching contribution to the funds.
Total company costs related to U.S. and non-U.S. defined contribution plans were as follows:
| | (Millions of dollars) | (Millions of dollars) | | 2021 | | 2020 | | 2019 |
| U.S. plans | U.S. plans | | $ | 440 | | | $ | 384 | | | $ | 414 | |
| U.S. plans | |
| U.S. plans | |
| Non-U.S. plans | |
| Non-U.S. plans | |
| Non-U.S. plans | Non-U.S. plans | | 114 | | | 89 | | | 83 | |
| | | | $ | 554 | | | $ | 473 | | | $ | 497 | |
| | | |
|
For our U.S. plans, changes in annual defined contribution costs are primarily due to fair value adjustments related to our non-qualified deferred compensation plans.
13.Short-term borrowings
| | | |
| | | | | December 31, | | December 31, |
| (Millions of dollars) | (Millions of dollars) | | 2021 | | 2020 | | |
| Machinery, Energy & Transportation: | Machinery, Energy & Transportation: | | | | | | |
| Machinery, Energy & Transportation: | |
| Machinery, Energy & Transportation: | |
| Notes payable to banks | |
| Notes payable to banks | |
| Notes payable to banks | Notes payable to banks | | $ | 9 | | | $ | 10 | | | |
| | | | | 9 | | | 10 | | | |
| | | |
| | | |
| Financial Products: | |
| Financial Products: | |
| Financial Products: | Financial Products: | | | | | | |
| Notes payable to banks | Notes payable to banks | | 213 | | | 307 | | | |
| Notes payable to banks | |
| Notes payable to banks | |
| Commercial paper | |
| Commercial paper | |
| Commercial paper | Commercial paper | | 4,896 | | | 1,321 | | | |
| Demand notes | Demand notes | | 286 | | | 377 | | | |
| Demand notes | |
| Demand notes | |
| | |
| | |
| | | | 5,395 | | | 2,005 | | | |
| Total short-term borrowings | Total short-term borrowings | | $ | 5,404 | | | $ | 2,015 | | | |
| Total short-term borrowings | |
| Total short-term borrowings | |
|
The weighted-average interest rates on short-term borrowings outstanding were:
| | | |
| | | | | December 31, | | December 31, |
| | | | 2021 | | 2020 | | |
| Notes payable to banks | Notes payable to banks | | 4.4 | % | | 3.7 | % | | |
| Notes payable to banks | |
| Notes payable to banks | |
| Commercial paper | |
| Commercial paper | |
| Commercial paper | Commercial paper | | 0.1 | % | | 0.1 | % | | |
| Demand notes | Demand notes | | 0.2 | % | | 0.3 | % | | |
| Demand notes | |
| Demand notes | |
|
Please refer to Note 18 for fair value information on short-term borrowings.
14. Long-term debt
| | | | | December 31, | |
| (Millions of dollars) | (Millions of dollars) | Effective Yield to Maturity 1 | | 2021 | | 2020 | |
| (Millions of dollars) | |
| (Millions of dollars) | |
| Machinery, Energy & Transportation: | |
| Machinery, Energy & Transportation: | |
| Machinery, Energy & Transportation: | Machinery, Energy & Transportation: | | | | | | |
Notes—$759 million of 5.200% due 2041 2 | Notes—$759 million of 5.200% due 2041 2 | 5.27% | | $ | 752 | | | $ | 752 | | |
Debentures—$500 million of 2.600% due 2022 2 | 2.70% | | — | | | 499 | | |
| Debentures—$82 million of 8.000% due 2023 | 8.06% | | 82 | | | 82 | | |
Notes—$759 million of 5.200% due 2041 2 | |
Notes—$759 million of 5.200% due 2041 2 | |
| | Debentures—$1,000 million of 3.400% due 2024 | |
| | Debentures—$1,000 million of 3.400% due 2024 | |
| | Debentures—$1,000 million of 3.400% due 2024 | Debentures—$1,000 million of 3.400% due 2024 | 3.46% | | 999 | | | 998 | | |
Debentures—$193 million of 6.625% due 2028 2 | Debentures—$193 million of 6.625% due 2028 2 | 6.68% | | 192 | | | 192 | | |
Debentures—$193 million of 6.625% due 2028 2 | |
Debentures—$193 million of 6.625% due 2028 2 | |
Debentures—$500 million of 2.600% due 2029 2 | |
Debentures—$500 million of 2.600% due 2029 2 | |
Debentures—$500 million of 2.600% due 2029 2 | Debentures—$500 million of 2.600% due 2029 2 | 2.67% | | 498 | | | 497 | | |
Debentures—$800 million of 2.600% due 2030 2 | Debentures—$800 million of 2.600% due 2030 2 | 2.72% | | 793 | | | 793 | | |
Debentures—$800 million of 2.600% due 2030 2 | |
Debentures—$800 million of 2.600% due 2030 2 | |
Debentures—$500 million of 1.900% due 2031 2 | |
Debentures—$500 million of 1.900% due 2031 2 | |
Debentures—$500 million of 1.900% due 2031 2 | Debentures—$500 million of 1.900% due 2031 2 | 2.04% | | 495 | | | — | | |
Debentures—$242 million of 7.300% due 2031 2 | Debentures—$242 million of 7.300% due 2031 2 | 7.38% | | 240 | | | 240 | | |
Debentures—$242 million of 7.300% due 2031 2 | |
Debentures—$242 million of 7.300% due 2031 2 | |
Debentures—$307 million of 5.300% due 2035 2 | |
Debentures—$307 million of 5.300% due 2035 2 | |
Debentures—$307 million of 5.300% due 2035 2 | Debentures—$307 million of 5.300% due 2035 2 | 8.64% | | 226 | | | 223 | | |
Debentures—$460 million of 6.050% due 2036 2 | Debentures—$460 million of 6.050% due 2036 2 | 6.12% | | 456 | | | 456 | | |
Debentures—$460 million of 6.050% due 2036 2 | |
Debentures—$460 million of 6.050% due 2036 2 | |
Debentures—$65 million of 8.250% due 2038 2 | |
Debentures—$65 million of 8.250% due 2038 2 | |
Debentures—$65 million of 8.250% due 2038 2 | Debentures—$65 million of 8.250% due 2038 2 | 8.38% | | 64 | | | 64 | | |
Debentures—$160 million of 6.950% due 2042 2 | Debentures—$160 million of 6.950% due 2042 2 | 7.02% | | 158 | | | 158 | | |
Debentures—$160 million of 6.950% due 2042 2 | |
Debentures—$160 million of 6.950% due 2042 2 | |
Debentures—$1,722 million of 3.803% due 2042 2 | |
Debentures—$1,722 million of 3.803% due 2042 2 | |
Debentures—$1,722 million of 3.803% due 2042 2 | Debentures—$1,722 million of 3.803% due 2042 2 | 6.39% | | 1,316 | | | 1,296 | | |
| Debentures—$500 million of 4.300% due 2044 | Debentures—$500 million of 4.300% due 2044 | 4.39% | | 493 | | | 493 | | |
| Debentures—$500 million of 4.300% due 2044 | |
| Debentures—$500 million of 4.300% due 2044 | |
Debentures—$1,000 million of 3.250% due 2049 2 | |
Debentures—$1,000 million of 3.250% due 2049 2 | |
Debentures—$1,000 million of 3.250% due 2049 2 | Debentures—$1,000 million of 3.250% due 2049 2 | 3.34% | | 983 | | | 983 | | |
Debentures—$1,200 million of 3.250% due 2050 2 | Debentures—$1,200 million of 3.250% due 2050 2 | 3.32% | | 1,185 | | | 1,185 | | |
Debentures—$1,200 million of 3.250% due 2050 2 | |
Debentures—$1,200 million of 3.250% due 2050 2 | |
| Debentures—$500 million of 4.750% due 2064 | |
| Debentures—$500 million of 4.750% due 2064 | |
| Debentures—$500 million of 4.750% due 2064 | Debentures—$500 million of 4.750% due 2064 | 4.81% | | 494 | | | 494 | | |
Debentures—$246 million of 7.375% due 2097 2 | Debentures—$246 million of 7.375% due 2097 2 | 7.51% | | 241 | | | 241 | | |
| Finance lease obligations & other | | 79 | | | 103 | | |
Debentures—$246 million of 7.375% due 2097 2 | |
Debentures—$246 million of 7.375% due 2097 2 | |
Finance lease obligations & other 3 | |
Finance lease obligations & other 3 | |
Finance lease obligations & other 3 | |
| Total Machinery, Energy & Transportation | Total Machinery, Energy & Transportation | | 9,746 | | | 9,749 | | |
| Total Machinery, Energy & Transportation | |
| Total Machinery, Energy & Transportation | |
| Financial Products: | |
| Financial Products: | |
| Financial Products: | Financial Products: | | | | | |
| | Medium-term notes | Medium-term notes | | 16,127 | | | 16,012 | | |
| | Medium-term notes | |
| | Medium-term notes | |
| Other | |
| Other | |
| Other | Other | | 160 | | | 238 | | |
| Total Financial Products | Total Financial Products | | 16,287 | | | 16,250 | | |
| Total Financial Products | |
| Total Financial Products | |
| Total long-term debt due after one year | Total long-term debt due after one year | | $ | 26,033 | | | $ | 25,999 | | |
| Total long-term debt due after one year | |
| Total long-term debt due after one year | |
1 Effective yield to maturity includes the impact of discounts, premiums and debt issuance costs.
2 Redeemable at our option in whole or in part at any time at a redemption price equal to the greater of (i) 100% of the principal amount or (ii) the discounted present value of the notes or debentures, calculated in accordance with the terms of such notes or debentures.
3 Includes $(133) million and $(168) million of mark-to-market adjustments related to fair value interest rate swap contracts as of December 31, 2023 and 2022, respectively.
All outstanding notes and debentures are unsecured and rank equally with one another.
On April 9, 2020, we issued $1.2 billion of 3.250% Senior Notes due 2050 and $800 million of 2.600% Senior Notes due 2030. On March 12, 2021 we issued $500 million of 1.900% Senior Notes due 2031.
Cat Financial’s medium-term notes are offered by prospectus and are issued through agents at fixed and floating rates. Medium-term notes due after one year have a weighted average interest rate of 1.5%3.5% with remaining maturities up to 65 years at December 31, 2021.2023.
The aggregate amounts of maturities of long-term debt during each of the years 20222024 through 2026,2028, including amounts due within one year and classified as current, are:
| | | | | | | | | | | | | | | | | | | | | | | | | | | | | | | | |
| | | December 31, |
| (Millions of dollars) | | 2022 | | 2023 | | 2024 | | 2025 | | 2026 |
| Machinery, Energy & Transportation | | $ | 45 | | | $ | 103 | | | $ | 1,013 | | | $ | 10 | | | $ | 6 | |
| Financial Products | | 6,307 | | | 5,221 | | | 7,129 | | | 1,629 | | | 1,555 | |
| | | $ | 6,352 | | | $ | 5,324 | | | $ | 8,142 | | | $ | 1,639 | | | $ | 1,561 | |
| | | | | | | | | | |
The above table includes $5 million of medium-term notes that can be called at par. | | | | | | | | | | | | | | | | | | | | | | | | | | | | | | | | |
| | | December 31, |
| (Millions of dollars) | | 2024 | | 2025 | | 2026 | | 2027 | | 2028 |
| Machinery, Energy & Transportation | | $ | 1,044 | | | $ | 19 | | | $ | 15 | | | $ | 13 | | | $ | 199 | |
| Financial Products | | 7,719 | | | 7,811 | | | 5,634 | | | 2,479 | | | 14 | |
| | | $ | 8,763 | | | $ | 7,830 | | | $ | 5,649 | | | $ | 2,492 | | | $ | 213 | |
| | | | | | | | | | |
Medium-term notes of $1.35 billion$500 million maturing in the first quarter of 20222024 were excluded from the current maturities of long-term debt in Statement 3 as of December 31, 20212023 due to a $2.0 billion$500 million issuance of medium-term notes on January 10, 2022 of8, 2024 which $1.5 billion mature in 2024 and $500 million mature in 2027. The preceding maturity table reflects the reclassification of $1.35 billion$500 million from maturities in 20222024 to 2024.2027.
Interest paid on short-term and long-term borrowings for 2023, 2022 and 2021 2020 and 2019 was $920$1,711 million, $1,089$959 million and $1,057$920 million, respectively.
Please refer to Note 18 for fair value information on long-term debt.
15.Credit commitments
| | | | | December 31, 2021 | | | December 31, 2023 |
| (Millions of dollars) | (Millions of dollars) | | Consolidated | | Machinery,
Energy &
Transportation | | Financial
Products | (Millions of dollars) | | Consolidated | | Machinery,
Energy &
Transportation | | Financial
Products |
| Credit lines available: | Credit lines available: | | | | | | | Credit lines available: | | |
| Global credit facilities | Global credit facilities | | $ | 10,500 | | | $ | 2,750 | | | $ | 7,750 | |
| Other external | Other external | | 3,251 | | | 184 | | | 3,067 | |
| Total credit lines available | Total credit lines available | | 13,751 | | | 2,934 | | | 10,817 | |
| Less: Commercial paper outstanding | Less: Commercial paper outstanding | | (4,896) | | | — | | | (4,896) | |
| Less: Utilized credit | Less: Utilized credit | | (568) | | | (9) | | | (559) | |
| Available credit | Available credit | | $ | 8,287 | | | $ | 2,925 | | | $ | 5,362 | |
|
We have 3three global credit facilities with a syndicate of banks totaling $10.50 billion (Credit Facility) available in the aggregate to both Caterpillar and Cat Financial for general liquidity purposes. Based on management's allocation decision, which can be revised from time to time, the portion of the Credit Facility available to ME&T as of December 31, 20212023 was $2.75 billion. Information on our Credit Facility is as follows:
•In August 2023, we entered into a new 364-day facility. The 364-day facility of $3.15 billion (of which $825 million is available to ME&T) expires on September 1, 2022.in August 2024.
•TheIn August 2023, we amended and extended the three-year facility as(as amended and restated, in September 2021,the "three-year facility"). The three-year facility of $2.73 billion (of which $715 million is available to ME&T) expires in September 2024.August 2026.
•TheIn August 2023, we amended and extended the five-year facility as(as amended and restated, in September 2021,the "five-year facility"). The five-year facility of $4.62 billion (of which $1.21 billion is available to ME&T) expires in September 2026.
Other consolidated credit lines with banks as of December 31, 20212023 totaled $3.25$4.16 billion. These committed and uncommitted credit lines, which may be eligible for renewal at various future dates or have no specified expiration date, are used primarily by our subsidiaries for local funding requirements. Caterpillar or Cat Financial may guarantee subsidiary borrowings under these lines.
At December 31, 2021,2023, Caterpillar’s consolidated net worth was $16.58$19.55 billion, which was above the $9.00 billion required under the Credit Facility. The consolidated net worth is defined as the consolidated shareholders’ equity including preferred stock but excluding the pension and other postretirement benefits balance within AOCI.
At December 31, 2021,2023, Cat Financial’s covenant interest coverage ratio was 2.511.73 to 1. This iswas above the 1.15 to 1 minimum ratio, calculated as (1) profit excluding income taxes, interest expense and net gain/(loss) from interest rate derivatives to (2) interest expense calculated at the end of each calendarfiscal quarter for the rollingprior four consecutive fiscal quarter period, then most recently ended, required by the Credit Facility.
In addition, at December 31, 2021,2023, Cat Financial’s six-month covenant leverage ratio was 7.256.88 to 1 and year-end covenant leverage ratio was 7.916.95 to 1. This iswas below the maximum ratio of debt to net worth of 10 to 1, calculated (1) on a monthly basis as the average of the leverage ratios determined on the last day of each of the six preceding calendar months and (2) at each December 31, required by the Credit Facility.
In the event Caterpillar or Cat Financial does not meet one or more of their respective financial covenants under the Credit Facility in the future (and are unable to obtain a consent or waiver), the syndicate of banks may terminate the commitments allocated to the party that does not meet its covenants. Additionally, in such event, certain of Cat Financial’s other lenders under other loan agreements where similar financial covenants or cross default provisions are applicable may, at their election, choose to pursue remedies under those loan agreements, including accelerating the repayment of outstanding borrowings. At December 31, 2021,2023, there were no borrowings under the Credit Facility.
16.Profit per share
| | Computations of profit per share: | Computations of profit per share: | |
| (Dollars in millions except per share data) | |
| (Dollars in millions except per share data) | |
| (Dollars in millions except per share data) | (Dollars in millions except per share data) | | 2021 | | 2020 | | 2019 | | 2023 | | 2022 | | 2021 |
Profit for the period (A) 1 | Profit for the period (A) 1 | | $ | 6,489 | | | $ | 2,998 | | | $ | 6,093 | |
| Determination of shares (in millions): | Determination of shares (in millions): | | | | | | | Determination of shares (in millions): | | | | |
| Weighted average number of common shares outstanding (B) | Weighted average number of common shares outstanding (B) | | 544.0 | | | 544.1 | | | 561.6 | |
| Shares issuable on exercise of stock awards, net of shares assumed to be purchased out of proceeds at average market price | Shares issuable on exercise of stock awards, net of shares assumed to be purchased out of proceeds at average market price | | 4.5 | | | 4.5 | | | 5.9 | |
Average common shares outstanding for fully diluted computation (C) 2 | Average common shares outstanding for fully diluted computation (C) 2 | | 548.5 | | | 548.6 | | | 567.5 | |
| Profit per share of common stock: | Profit per share of common stock: | | | | | | | Profit per share of common stock: | | | | |
| Assuming no dilution (A/B) | Assuming no dilution (A/B) | | $ | 11.93 | | | $ | 5.51 | | | $ | 10.85 | |
Assuming full dilution (A/C) 2 | Assuming full dilution (A/C) 2 | | $ | 11.83 | | | $ | 5.46 | | | $ | 10.74 | |
| Shares outstanding as of December 31 (in millions) | Shares outstanding as of December 31 (in millions) | | 535.9 | | | 545.3 | | | 550.1 | |
1Profit attributable to common shareholders.
2Diluted by assumed exercise of stock-based compensation awards using the treasury stock method.
For the yearyears ended December 31, 2021, 20202023, 2022 and 2019,2021, we excluded 0.8 million, 2.0 million and 1.1 million 4.6 million and 3.0 millionof outstanding stock options, respectively, from the computation of diluted earnings per share because the effect would have been antidilutive.
In July 2018, the Board approved a share repurchase authorization (the 2018 Authorization) of up to $10.0 billion of Caterpillar common stock effective January 1, 2019, with no expiration. In May 2022, the Board approved a new share repurchase authorization (the 2022 Authorization) of up to $15.0 billion of Caterpillar common stock effective August 1, 2022, with no expiration. Utilization of the 2022 Authorization for all share repurchases commenced on August 1, 2022, leaving $70 million unutilized under the 2018 Authorization. As of December 31, 2021,2023, approximately $2.1$7.8 billion remained available under the 20182022 Authorization.
During 2021, 20202023, 2022 and 2019,2021, we repurchased 13.019.5 million, 10.121.9 million and 30.613.0 million shares of Caterpillar common stock, respectively, at an aggregate cost of $2.7$4.7 billion, $1.3$4.2 billion and $4.0$2.7 billion, respectively. We made these purchases through a combination of accelerated stock repurchase agreements with third-party financial institutions and open market transactions.
17.Accumulated other comprehensive income (loss)
We present comprehensive income and its components in Statement 2. Changes in the balances for each component of Accumulated other comprehensive income (loss)AOCI were as follows:
| | | (Millions of dollars) | (Millions of dollars) | | | |
| | 2021 | | 2020 | | 2019 | | |
| Foreign currency translation: | | | | | | | |
| (Millions of dollars) | |
| | (Millions of dollars) | |
| 2023 | |
| 2023 | |
| 2023 | |
| 2023 | |
| 2023 | |
| 2023 | |
| 2023 | |
| 2023 | |
| 2023 | |
| 2023 | |
| 2023 | |
| 2023 | |
| 2023 | |
| 2023 | |
| 2023 | |
| Foreign currency translation | |
| Foreign currency translation | |
| Foreign currency translation | |
| Beginning balance | Beginning balance | $ | (910) | | | $ | (1,487) | | | $ | (1,601) | | | |
| Adjustments to adopt new accounting guidance related to reclassification of certain tax effects from AOCI | — | | | — | | | 98 | | | |
| Balance at January 1 | (910) | | | (1,487) | | | (1,503) | | | |
| Beginning balance | |
| Beginning balance | |
| | Gains (losses) on foreign currency translation | |
| | Gains (losses) on foreign currency translation | |
| | Gains (losses) on foreign currency translation | Gains (losses) on foreign currency translation | (559) | | | 513 | | | 21 | | | |
| Less: Tax provision /(benefit) | Less: Tax provision /(benefit) | 41 | | | (42) | | | 5 | | | |
| Less: Tax provision /(benefit) | |
| Less: Tax provision /(benefit) | |
| Net gains (losses) on foreign currency translation | |
| Net gains (losses) on foreign currency translation | |
| Net gains (losses) on foreign currency translation | Net gains (losses) on foreign currency translation | (600) | | | 555 | | | 16 | | | |
| (Gains) losses reclassified to earnings | (Gains) losses reclassified to earnings | 2 | | | 22 | | | — | | | |
| (Gains) losses reclassified to earnings | |
| (Gains) losses reclassified to earnings | |
| Less: Tax provision /(benefit) | |
| Less: Tax provision /(benefit) | |
| Less: Tax provision /(benefit) | Less: Tax provision /(benefit) | — | | | — | | | — | | | |
| Net (gains) losses reclassified to earnings | Net (gains) losses reclassified to earnings | 2 | | | 22 | | | — | | | |
| Net (gains) losses reclassified to earnings | |
| Net (gains) losses reclassified to earnings | |
| Other comprehensive income (loss), net of tax | Other comprehensive income (loss), net of tax | (598) | | | 577 | | | 16 | | | |
| Other comprehensive income (loss), net of tax | |
| Other comprehensive income (loss), net of tax | |
| Ending balance | |
| Ending balance | |
| Ending balance | Ending balance | $ | (1,508) | | | $ | (910) | | | $ | (1,487) | | | |
| | Pension and other postretirement benefits | Pension and other postretirement benefits | | |
| | Pension and other postretirement benefits | |
| | Pension and other postretirement benefits | |
| Beginning balance | Beginning balance | $ | (32) | | | $ | (3) | | | $ | 12 | | | |
| Adjustments to adopt new accounting guidance related to reclassification of certain tax effects from AOCI | — | | | — | | | 19 | | | |
| Balance at January 1 | (32) | | | (3) | | | 31 | | | |
| Beginning balance | |
| Beginning balance | |
| | Current year prior service credit (cost) | |
| | Current year prior service credit (cost) | |
| | Current year prior service credit (cost) | Current year prior service credit (cost) | — | | | (1) | | | (4) | | | |
| Less: Tax provision /(benefit) | Less: Tax provision /(benefit) | — | | | — | | | — | | | |
| Less: Tax provision /(benefit) | |
| Less: Tax provision /(benefit) | |
| Net current year prior service credit (cost) | |
| Net current year prior service credit (cost) | |
| Net current year prior service credit (cost) | Net current year prior service credit (cost) | — | | | (1) | | | (4) | | | |
| Amortization of prior service (credit) cost | Amortization of prior service (credit) cost | (40) | | | (38) | | | (40) | | | |
| Amortization of prior service (credit) cost | |
| Amortization of prior service (credit) cost | |
| Less: Tax provision /(benefit) | |
| Less: Tax provision /(benefit) | |
| Less: Tax provision /(benefit) | Less: Tax provision /(benefit) | (10) | | | (10) | | | (10) | | | |
| Net amortization of prior service (credit) cost | Net amortization of prior service (credit) cost | (30) | | | (28) | | | (30) | | | |
| Net amortization of prior service (credit) cost | |
| Net amortization of prior service (credit) cost | |
| Other comprehensive income (loss), net of tax | |
| Other comprehensive income (loss), net of tax | |
| Other comprehensive income (loss), net of tax | Other comprehensive income (loss), net of tax | (30) | | | (29) | | | (34) | | | |
| Ending balance | Ending balance | $ | (62) | | | $ | (32) | | | $ | (3) | | | |
| Ending balance | |
| Ending balance | |
| | Derivative financial instruments | |
| | Derivative financial instruments | |
| | Derivative financial instruments | Derivative financial instruments | | |
| Beginning balance | Beginning balance | $ | — | | | $ | (97) | | | $ | (80) | | | |
| Adjustments to adopt new accounting guidance related to reclassification of certain tax effects from AOCI | — | | | — | | | (9) | | | |
| Balance at January 1 | — | | | (97) | | | (89) | | | |
| Beginning balance | |
| Beginning balance | |
| | Gains (losses) deferred | |
| | Gains (losses) deferred | |
| | Gains (losses) deferred | Gains (losses) deferred | 195 | | | (116) | | | 57 | | | |
| Less: Tax provision /(benefit) | Less: Tax provision /(benefit) | 21 | | | (25) | | | 14 | | | |
| Less: Tax provision /(benefit) | |
| Less: Tax provision /(benefit) | |
| Net gains (losses) deferred | |
| Net gains (losses) deferred | |
| Net gains (losses) deferred | Net gains (losses) deferred | 174 | | | (91) | | | 43 | | | |
| (Gains) losses reclassified to earnings | (Gains) losses reclassified to earnings | (196) | | | 241 | | | (66) | | | |
| (Gains) losses reclassified to earnings | |
| (Gains) losses reclassified to earnings | |
| Less: Tax provision /(benefit) | |
| Less: Tax provision /(benefit) | |
| Less: Tax provision /(benefit) | Less: Tax provision /(benefit) | (19) | | | 53 | | | (15) | | | |
| Net (gains) losses reclassified to earnings | Net (gains) losses reclassified to earnings | (177) | | | 188 | | | (51) | | | |
| Net (gains) losses reclassified to earnings | |
| Net (gains) losses reclassified to earnings | |
| Other comprehensive income (loss), net of tax | |
| Other comprehensive income (loss), net of tax | |
| Other comprehensive income (loss), net of tax | Other comprehensive income (loss), net of tax | (3) | | | 97 | | | (8) | | | |
| Ending balance | Ending balance | $ | (3) | | | $ | — | | | $ | (97) | | | |
| Ending balance | |
| Ending balance | |
| | | Available-for-sale securities | |
| | Available-for-sale securities | |
| | Available-for-sale securities | |
| Beginning balance | |
| Beginning balance | |
| Beginning balance | |
| | Gains (losses) deferred | |
| | Gains (losses) deferred | |
| | Gains (losses) deferred | |
| Less: Tax provision /(benefit) | |
| Less: Tax provision /(benefit) | |
| Less: Tax provision /(benefit) | |
| Net gains (losses) deferred | |
| Net gains (losses) deferred | |
| Net gains (losses) deferred | |
| (Gains) losses reclassified to earnings | |
| (Gains) losses reclassified to earnings | |
| (Gains) losses reclassified to earnings | |
| Less: Tax provision /(benefit) | |
| Less: Tax provision /(benefit) | |
| Less: Tax provision /(benefit) | |
| Net (gains) losses reclassified to earnings | |
| Net (gains) losses reclassified to earnings | |
| Net (gains) losses reclassified to earnings | |
| Other comprehensive income (loss), net of tax | |
| Other comprehensive income (loss), net of tax | |
| Other comprehensive income (loss), net of tax | |
| Ending balance | |
| Ending balance | |
| Ending balance | |
| | Total AOCI Ending Balance at December 31, | |
| | Total AOCI Ending Balance at December 31, | |
| | Total AOCI Ending Balance at December 31, | |
| | | | | | | | | | | | | | | | | | | | | | | |
| | | | | | | | | |
| 2021 | | 2020 | | 2019 | | | | |
| Available-for-sale securities | | | | | | | | | |
| Beginning balance | $ | 54 | | | $ | 20 | | | $ | (15) | | | | | |
| Adjustments to adopt recognition and measurement of financial assets and liabilities guidance | — | | | — | | | — | | | | | |
| Balance at January 1 | 54 | | | 20 | | | (15) | | | | | |
| Gains (losses) deferred | (39) | | | 45 | | | 45 | | | | | |
| Less: Tax provision /(benefit) | (8) | | | 10 | | | 10 | | | | | |
| Net gains (losses) deferred | (31) | | | 35 | | | 35 | | | | | |
| (Gains) losses reclassified to earnings | (4) | | | (1) | | | — | | | | | |
| Less: Tax provision /(benefit) | (1) | | | — | | | — | | | | | |
| Net (gains) losses reclassified to earnings | (3) | | | (1) | | | — | | | | | |
| Other comprehensive income (loss), net of tax | (34) | | | 34 | | | 35 | | | | | |
| Ending balance | $ | 20 | | | $ | 54 | | | $ | 20 | | | | | |
| | | | | | | | | |
| Total AOCI Ending Balance at December 31 | $ | (1,553) | | | $ | (888) | | | $ | (1,567) | | | | | |
18.Fair value disclosures
A.Fair value measurements
The guidance on fair value measurements defines fair value as the exchange price that would be received for an asset or paid to transfer a liability (an exit price) in the principal or most advantageous market for the asset or liability in an orderly transaction between market participants. This guidance also specifies a fair value hierarchy based upon the observability of inputs used in valuation techniques. Observable inputs (highest level) reflect market data obtained from independent sources, while unobservable inputs (lowest level) reflect internally developed market assumptions. In accordance with this guidance, fair value measurements are classified under the following hierarchy:
•Level 1 –— Quoted prices for identical instruments in active markets.
•Level 2 –— Quoted prices for similar instruments in active markets; quoted prices for identical or similar instruments in markets that are not active; and model-derived valuations in which all significant inputs or significant value-drivers are observable in active markets.
•Level 3 –— Model-derived valuations in which one or more significant inputs or significant value-drivers are unobservable.
When available, we use quoted market prices to determine fair value, and we classify such measurements within Level 1. In some cases where market prices are not available, we make use of observable market based inputs to calculate fair value, in which case the measurements are classified within Level 2. If quoted or observable market prices are not available, fair value is based upon valuations in which one or more significant inputs are unobservable, including internally developed models that use, where possible, current market-based parameters such as interest rates, yield curves and currency rates. These measurements are classified within Level 3.
We classify fair value measurements according to the lowest level input or value-driver that is significant to the valuation. We may therefore classify a measurement within Level 3 even though there may be significant inputs that are readily observable.
Fair value measurement includes the consideration of nonperformance risk. Nonperformance risk refers to the risk that an obligation (either by a counterparty or Caterpillar) will not be fulfilled. For financial assets traded in an active market (Level 1 and certain Level 2), the nonperformance risk is included in the market price. For certain other financial assets and liabilities (certain Level 2 and Level 3), our fair value calculations have been adjusted accordingly.
Investments in debt and equity securities
We have investments in certain debt and equity securities primarily at Insurance Services, that are recorded at fair value. Fair values for our U.S. treasury bonds and large capitalization value and smaller company growth equity securities are based upon valuations for identical instruments in active markets. Fair values for other government bonds,debt securities, corporate bondsdebt securities and mortgage-backed debt securities are based upon models that take into consideration such market-based factors as recent sales, risk-free yield curves and prices of similarly rated bonds.
We also have investments in time deposits classified as held-to-maturity debt securities. The fair value of these investments is based upon valuations observed in less active markets than Level 1. These investments have a maturity of less than one year and are recorded at amortized costs, which approximate fair value.
In addition, Insurance Services has an equity investment in a real estate investment trust (REIT) which is recorded at fair value based on the net asset value (NAV) of the investment and is not classified within the fair value hierarchy.
See Note 11 for additional information on our investments in debt and equity securities.
Derivative financial instruments
The fair value of interest rate contracts is primarily based on a standard industry accepted valuation model that utilizes the appropriate market-based forward swap curves and zero-coupon interest rates to determine discounted cash flows. The fair value of foreign currency and commodity forward, option and cross currency contracts is based on standard industry accepted valuation models that discount cash flows resulting from the differential between the contract price and the market-based forward rate.
See Note 4 for additional information.
Assets and liabilities measured on a recurring basis at fair value primarily related to Financial Products, included in Statement 3 as of December 31, 20212023 and 20202022 were as follows:
| | | | | December 31, 2021 | | | December 31, 2023 |
| (Millions of dollars) | (Millions of dollars) | | Level 1 | | Level 2 | | Level 3 | | Measured at NAV | | Total
Assets / Liabilities,
at Fair Value | (Millions of dollars) | | Level 1 | | Level 2 | | Level 3 | | Measured at NAV | | Total
Assets / Liabilities,
at Fair Value |
| Assets | Assets | | | | | | | | | | | Assets | | | | | | |
| Debt securities | Debt securities | | | | | | | | | Debt securities | | | | | | |
| Government debt | | | | | | | | |
| Government debt securities | | Government debt securities | | | | | | |
| U.S. treasury bonds | U.S. treasury bonds | | $ | 10 | | | $ | — | | | $ | — | | | $ | — | | | $ | 10 | |
| Other U.S. and non-U.S. government bonds | Other U.S. and non-U.S. government bonds | | — | | | 61 | | | — | | | — | | | 61 | |
| | Corporate bonds | | | | | | |
| Corporate bonds | | — | | | 1,046 | | | — | | | — | | | 1,046 | |
| Corporate debt securities | |
| Corporate debt securities | |
| Corporate debt securities | | | | | | | |
| Corporate bonds and other debt securities | |
| Asset-backed securities | Asset-backed securities | | — | | | 176 | | | — | | | — | | | 176 | |
| | Mortgage-backed debt securities | |
| Mortgage-backed debt securities | |
| Mortgage-backed debt securities | Mortgage-backed debt securities | | | | | | | | | | | | |
| U.S. governmental agency | U.S. governmental agency | | — | | | 325 | | | — | | | — | | | 325 | |
| Residential | Residential | | — | | | 4 | | | — | | | — | | | 4 | |
| Commercial | Commercial | | — | | | 99 | | | — | | | — | | | 99 | |
| Total debt securities | Total debt securities | | 10 | | | 1,711 | | | — | | | — | | | 1,721 | |
| Equity securities | Equity securities | | | Equity securities | | | | | | | | | | |
| Large capitalization value | Large capitalization value | | 217 | | | — | | | — | | | — | | | 217 | |
| Smaller company growth | Smaller company growth | | 98 | | | — | | | — | | | — | | | 98 | |
| REIT | REIT | | — | | | — | | | — | | | 167 | | | 167 | |
| Total equity securities | Total equity securities | | 315 | | | — | | | — | | | 167 | | | 482 | |
| Derivative financial instruments - assets | Derivative financial instruments - assets | |
| Foreign currency contracts - net | Foreign currency contracts - net | | — | | | 168 | | | — | | | — | | | 168 | |
| Foreign currency contracts - net | |
| Foreign currency contracts - net | |
| | Commodity contracts - net | |
| Commodity contracts - net | |
| Commodity contracts - net | |
| Total assets | |
| | Liabilities | |
| Liabilities | |
| Liabilities | | | | | | | |
| Derivative financial instruments - liabilities | |
| | Interest rate contracts - net | Interest rate contracts - net | | — | | | 23 | | | — | | | — | | | 23 | |
| Commodity contracts - net | | — | | | 21 | | | — | | | — | | | 21 | |
| Total Assets | | $ | 325 | | | $ | 1,923 | | | $ | — | | | $ | 167 | | | $ | 2,415 | |
| | Interest rate contracts - net | |
| | Interest rate contracts - net | |
| | Total liabilities | |
| Total liabilities | |
| Total liabilities | |
|
| | | | | December 31, 2020 | | | December 31, 2022 |
| (Millions of dollars) | (Millions of dollars) | | Level 1 | | Level 2 | | Level 3 | | Measured at NAV | | Total
Assets / Liabilities,
at Fair Value | (Millions of dollars) | | Level 1 | | Level 2 | | Level 3 | | Measured at NAV | | Total
Assets / Liabilities,
at Fair Value |
| Assets | Assets | | | | | | | | | | Assets | | | | | | |
| Debt securities | Debt securities | | | | | | | | | Debt securities | | | | | | |
| Government debt | | | | | | | | |
| Government debt securities | | Government debt securities | | | | | | |
| U.S. treasury bonds | U.S. treasury bonds | | $ | 10 | | | $ | — | | | $ | — | | | $ | — | | | $ | 10 | |
| Other U.S. and non-U.S. government bonds | Other U.S. and non-U.S. government bonds | | — | | | 59 | | | — | | | — | | | 59 | |
| | Corporate bonds | | | | | | | | |
| Corporate bonds | | — | | | 1,012 | | | — | | | — | | | 1,012 | |
| Corporate debt securities | |
| Corporate debt securities | |
| Corporate debt securities | | | | | | | |
| Corporate bonds and other debt securities | |
| Asset-backed securities | Asset-backed securities | | — | | | 159 | | | — | | | — | | | 159 | |
| | Mortgage-backed debt securities | |
| Mortgage-backed debt securities | |
| Mortgage-backed debt securities | Mortgage-backed debt securities | | | | | | | | | | | | | | |
| U.S. governmental agency | U.S. governmental agency | | — | | | 374 | | | — | | | — | | | 374 | |
| Residential | Residential | | — | | | 5 | | | — | | | — | | | 5 | |
| Commercial | Commercial | | — | | | 64 | | | — | | | — | | | 64 | |
| Total debt securities | Total debt securities | | 10 | | | 1,673 | | | — | | | — | | | 1,683 | |
| Equity securities | Equity securities | | | | | | | | | Equity securities | | | | | | |
| Large capitalization value | Large capitalization value | | 199 | | | — | | | — | | | — | | | 199 | |
| Smaller company growth | Smaller company growth | | 58 | | | — | | | — | | | — | | | 58 | |
| REIT | REIT | | — | | | — | | | — | | | 148 | | | 148 | |
| Total equity securities | Total equity securities | | 257 | | | — | | | — | | | 148 | | | 405 | |
| Derivative financial instruments - assets | Derivative financial instruments - assets | |
| Interest rate contracts - net | | — | | | 58 | | | — | | | — | | | 58 | |
| Foreign currency contracts - net | |
| Foreign currency contracts - net | |
| Foreign currency contracts - net | |
| | Commodity contracts - net | Commodity contracts - net | | — | | | 37 | | | — | | | — | | | 37 | |
| Total Assets | | $ | 267 | | | $ | 1,768 | | | $ | — | | | $ | 148 | | | $ | 2,183 | |
| Commodity contracts - net | |
| Commodity contracts - net | |
| Total assets | |
| | Liabilities | Liabilities | | | | | | | | |
| Liabilities | |
| Liabilities | | | | | | | |
| Derivative financial instruments - liabilities | Derivative financial instruments - liabilities | |
| Foreign currency contracts - net | | $ | — | | | $ | 112 | | | $ | — | | | $ | — | | | $ | 112 | |
| Total Liabilities | | $ | — | | | $ | 112 | | | $ | — | | | $ | — | | | $ | 112 | |
| Interest rate contracts - net | |
| Interest rate contracts - net | |
| Interest rate contracts - net | |
| Total liabilities | |
|
In addition to the amounts above, certain Cat Financial loans are subject to measurement at fair value on a nonrecurring basis and are classified as Level 3 measurements. A loan is measured at fair value when management determines that collection of contractual amounts due is not probable and the loan is individually evaluated. In these cases, an allowance for credit losses may be established based either on the present value of expected future cash flows discounted at the receivables’ effective interest rate, the fair value of the collateral for collateral-dependent receivables, or the observable market price of the receivable. In determining collateral value, Cat Financial estimates the current fair market value of the collateral less selling costs. Cat Financial had loans carried at fair value of $100$55 million and $243$68 million as of December 31, 20212023 and 2020,2022, respectively.
B.Fair values of financial instruments
In addition to the methods and assumptions we use to record the fair value of financial instruments as discussed in the Fair value measurements section above, we useduse the following methods and assumptions to estimate the fair value of our financial instruments:
Cash and cash equivalents
Carrying amount approximates fair value. We classify cash and cash equivalents as Level 1. See Statement 3.
Restricted cash and short-term investments
Carrying amount approximates fair value. We include restricted cash and short-term investments in Prepaid expenses and other current assets in Statement 3. We classify these instruments as Level 1 except for time deposits which are Level 2.2, and certain corporate debt securities which are Level 3. See Note 11 for additional information.
Finance receivables
We estimate fair value by discounting the future cash flows using current rates, representative of receivables with similar remaining maturities.
Wholesale inventory receivables
We estimate fair value by discounting the future cash flows using current rates, representative of receivables with similar remaining maturities.
Short-term borrowings
Carrying amount approximates fair value. We classify short-term borrowings as Level 1. See Note 13 for additional information.
Long-term debt
We estimate fair value for fixed and floating rate debt based on quoted market prices.
Guarantees
The fair value of guarantees is based upon our estimate of the premium a market participant would require to issue the same guarantee in a stand-alone arms-length transaction with an unrelated party. If quoted or observable market prices are not available, fair value is based upon internally developed models that utilize current market-based assumptions. We classify guarantees as Level 3. See Note 21 for additional information.
Our financial instruments not carried at fair value were as follows:
| | | |
| | | | | | | 2021 | | 2020 | | | | | | 2023 | | 2022 | | | | | | |
| (Millions of dollars) | (Millions of dollars) | | Carrying
Amount | | Fair
Value | | Carrying
Amount | | Fair
Value | | | Fair Value Levels | | Reference | (Millions of dollars) | | Carrying
Amount | | Fair
Value | | Carrying
Amount | | Fair
Value | | | | | | Fair Value Levels | | Reference |
| Assets at December 31, | Assets at December 31, | | | | | | | | | | | | | | Assets at December 31, | | | | | | | | | | |
Finance receivables–net (excluding finance leases 1) | Finance receivables–net (excluding finance leases 1) | | $ | 13,837 | | | $ | 13,836 | | | $ | 14,028 | | | $ | 14,357 | | | | 3 | | Notes 7 & 19 | Finance receivables–net (excluding finance leases 1) | | $ | 15,386 | | | $ | | $ | 15,017 | | | $ | | $ | 13,965 | | | $ | | $ | 13,377 | | | | | | | 3 | | | | | | 3 | | Notes 7 & 19 |
Wholesale inventory receivables–net (excluding finance leases 1) | Wholesale inventory receivables–net (excluding finance leases 1) | | 773 | | | 753 | | | 929 | | | 911 | | | | 3 | | Notes 7 & 19 | Wholesale inventory receivables–net (excluding finance leases 1) | | 1,415 | | | 1,368 | | 1,368 | | | 827 | | 827 | | | 778 | | 778 | | | | | | | 3 | | | | | | 3 | | Notes 7 & 19 |
| | Liabilities at December 31, | Liabilities at December 31, | | | | | | | | | | | | |
| Liabilities at December 31, | |
| Liabilities at December 31, | | | | | | | | | | | | | |
| Long-term debt (including amounts due within one year): | Long-term debt (including amounts due within one year): | | | | | | | | | | | | | Long-term debt (including amounts due within one year): | | | | | | | | | | | | |
| Machinery, Energy & Transportation | Machinery, Energy & Transportation | | 9,791 | | | 12,420 | | | 11,169 | | | 14,549 | | | | 2 | | Note 14 | Machinery, Energy & Transportation | | 9,623 | | | 9,550 | | 9,550 | | | 9,618 | | 9,618 | | | 9,240 | | 9,240 | | | | | | | 2 | | | | | | 2 | | Note 14 |
| Financial Products | Financial Products | | 22,594 | | | 22,797 | | | 23,979 | | | 24,614 | | | | 2 | | Note 14 | Financial Products | | 23,612 | | | 23,299 | | 23,299 | | | 21,418 | | 21,418 | | | 20,686 | | 20,686 | | | | | | | 2 | | | | | | 2 | | Note 14 |
1Represents finance leases and failed sale leasebacks of $8,083$6,953 million and $7,961$7,325 million at December 31, 20212023 and 2020,2022, respectively.
19.Concentration of credit risk
Financial instruments with potential credit risk consist primarily of trade and finance receivables and short-term and long-term investments. Additionally, to a lesser extent, we have a potential credit risk associated with counterparties to derivative contracts.
Trade receivables are primarily short-term receivables from independently owned and operated dealers and customers which arise in the normal course of business. We perform regular credit evaluations of our dealers and customers. Collateral generally is not required, and the majority of our trade receivables are unsecured. We do, however, when deemed necessary, make use of various devices such as security agreements and letters of credit to protect our interests. No single dealer or customer represents a significant concentration of credit risk.
Finance receivables and wholesale inventory receivables primarily represent receivables under installment sales contracts, receivables arising from leasing transactions and notes receivable. We typically maintain a security interest in retail financed equipment and, in some instances, wholesale financed equipment. We also typicallygenerally require physical damage insurance coverage on financed equipment. No single customer or dealer represented a significant concentration of credit risk.
Short-term and long-term investments are held with high quality institutions and, by policy, the amount of credit exposure to any one institution is limited. Long-term investments, primarily included in Other assets in Statement 3, are comprised primarily of available-for-sale debt securities and equity securities at Insurance Services.securities.
For derivative contracts, collateral is generally not required of the counterparties or of our company. The company generally enters into International Swaps and Derivatives Association (ISDA) master netting agreements within ME&T and Financial Products that permit the net settlement of amounts owed under their respective derivative contracts. Our exposure to credit loss in the event of nonperformance by the counterparties is limited to only those gains that we have recorded, but for which we have not yet received cash payment. The master netting agreements reduce the amount of loss the company would incur should the counterparties fail to meet their obligations. At December 31, 20212023 and 2020,2022, the maximum exposure to credit loss was $342$520 million and $281$644 million, respectively, before the application of any master netting agreements.
Please referRefer to Note 18 above for fair value information.
20.Leases
A. Lessee arrangements
We lease certain property, information technology equipment, warehouse equipment, vehicles and other equipment through operating leases. We recognize a lease liability and corresponding right-of-use asset based on the present value of lease payments. To determine the present value of lease payments for most of our leases, we use our incremental borrowing rate based on information available on the lease commencement date. For certain property and information technology equipment leases, we have elected to separate payments for lease components from non-lease components. For all other leases, we have elected not to separate payments for lease and non-lease components. Our lease agreements may include options to extend or terminate the lease. When it is reasonably certain that we will exercise that option, we have included the option in the recognition of right-of-use assets and lease liabilities. We have elected not to recognize right-of-use assets or lease liabilities for leases with a term of twelve months or less.
Our finance leases are not significant and therefore are not included in the following disclosures.
The components of lease costs were as follows:
| | | (Millions of dollars) | (Millions of dollars) | | | |
| | Year Ended December 31, |
| (Millions of dollars) | |
| | 2021 | | | 2020 |
| (Millions of dollars) | |
| Years Ended December 31, | |
| Years Ended December 31, | |
| Years Ended December 31, | |
| 2023 | | | 2023 | | | 2022 | | 2021 |
| Operating lease cost | Operating lease cost | $ | 214 | | | | $ | 204 | |
| Short-term lease cost | Short-term lease cost | $ | 46 | | | | $ | 50 | |
| |
We recognize operating lease right-of-use assets in Other assets in Statement 3. We recognize the operating lease liabilities in Other current liabilities and Other liabilities.
Supplemental information related to leases was as follows:
| | | (Millions of dollars) | (Millions of dollars) | |
| December 31, 2021 | | December 31, 2020 |
| (Millions of dollars) | |
| (Millions of dollars) | |
| | December 31, 2023 | |
| | December 31, 2023 | |
| | December 31, 2023 | | | December 31, 2022 |
| Operating Leases | Operating Leases | | | | |
| Other assets | |
| Other assets | |
| Other assets | Other assets | | $ | 625 | | | $ | 603 | |
| Other current liabilities | Other current liabilities | | $ | 158 | | | $ | 163 | |
| Other liabilities | Other liabilities | | $ | 484 | | | $ | 457 | |
| | | Weighted average remaining lease term | Weighted average remaining lease term | |
| | Weighted average remaining lease term | |
| | Weighted average remaining lease term | |
| Operating leases | |
| Operating leases | |
| Operating leases | Operating leases | | 7 years | | 7 years | | 7 years | | 7 years |
| | | Weighted average discount rates | Weighted average discount rates | |
| | Weighted average discount rates | |
| | Weighted average discount rates | |
| Operating leases | |
| Operating leases | |
| Operating leases | Operating leases | | 2 | % | | 2 | % | | 3 | % | | 2 | % |
| |
Maturities of operating lease liabilities were as follows:
| | | (Millions of dollars) | (Millions of dollars) | | December 31, 2021 | |
| | (Millions of dollars) | |
| | (Millions of dollars) | |
| | Amounts Due In | Amounts Due In | | | |
| 2022 | | $ | 165 | | |
| 2023 | | 126 | | |
| | Amounts Due In | |
| | Amounts Due In | |
| 2024 | |
| 2024 | |
| 2024 | 2024 | | 94 | | |
| 2025 | 2025 | | 69 | | |
| 2025 | |
| 2025 | |
| 2026 | 2026 | | 51 | | |
| 2026 | |
| 2026 | |
| 2027 | |
| 2027 | |
| 2027 | |
| 2028 | |
| 2028 | |
| 2028 | |
| Thereafter | |
| Thereafter | |
| Thereafter | Thereafter | | 190 | | |
| Total lease payments | Total lease payments | | 695 | | |
| Total lease payments | |
| Total lease payments | |
| Less: Imputed interest | Less: Imputed interest | | (53) | | |
| Less: Imputed interest | |
| Less: Imputed interest | |
| Total | |
| Total | |
| Total | Total | | $ | 642 | | |
| |
Supplemental cash flow information related to leases was as follows:
| | | (Millions of dollars) | (Millions of dollars) | |
| Year ended December 31 |
| 2021 | | 2020 |
| (Millions of dollars) | |
| (Millions of dollars) | |
| | Years ended December 31, | |
| | Years ended December 31, | |
| | Years ended December 31, | |
| | 2023 | | | | 2023 | | 2022 | | 2021 |
| Cash paid for amounts included in the measurement of lease liabilities | Cash paid for amounts included in the measurement of lease liabilities | | | | |
| Operating cash flows from operating leases | |
| Operating cash flows from operating leases | |
| Operating cash flows from operating leases | Operating cash flows from operating leases | | $ | 206 | | | $ | 201 | |
| | Right-of-use assets obtained in exchange for lease obligations: | Right-of-use assets obtained in exchange for lease obligations: | |
| | Right-of-use assets obtained in exchange for lease obligations: | |
| | Right-of-use assets obtained in exchange for lease obligations: | |
| Operating leases | |
| Operating leases | |
| Operating leases | Operating leases | | $ | 238 | | | $ | 178 | |
| |
B. Lessor arrangements
We lease Caterpillar machinery, engines and other equipment to customers and dealers around the world, primarily through Cat Financial. Cat Financial leases to customers primarily through sales-type (non-tax) leases, where the lessee for tax purposes is considered to be the owner of the equipment during the term of the lease. Cat Financial also offers tax leases that are classified as either operating or direct finance leases for financial accounting purposes, depending on the characteristics of the lease. For tax purposes, Cat Financial is considered the owner of the equipment. Our lease agreements may include options for the lessee to purchase the underlying asset at the end of the lease term for either a stated fixed price or fair market value.
We determine the residual value of Cat Financial’s leased equipment based on its estimated end-of-term market value. We estimate the residual value of leased equipment at the inception of the lease based on a number of factors, including historical wholesale market sales prices, past remarketing experience and any known significant market/product trends. We also consider the following critical factors in our residual value estimates: lease term, market size and demand, total expected hours of usage, machine configuration, application, location, model changes, quantities, third-party residual guarantees and contractual customer purchase options.
During the term of our leases, we monitor residual values. For operating leases, we record adjustments to depreciation expense reflecting changes in residual value estimates prospectively on a straight-line basis. For finance leases, we recognize residual value adjustments through a reduction of finance revenue over the remaining lease term.
See Note 7 for contractual maturities of finance lease receivables (sales-type and direct finance leases).
The carrying amount of equipment leased to others, included in Property, plant and equipment - net in Statement 3, under operating leases was as follows:
| | | December 31, |
| | December 31, | |
| | December 31, | |
| | December 31, | |
| (Millions of dollars) | (Millions of dollars) | | 2021 | | 2020 | (Millions of dollars) | | 2023 | | 2022 |
| Equipment leased to others - at original cost | Equipment leased to others - at original cost | | $ | 5,733 | | | $ | 6,077 | |
| Less: Accumulated depreciation | Less: Accumulated depreciation | | (1,870) | | | (2,035) | |
| Equipment leased to others - net | Equipment leased to others - net | | $ | 3,863 | | | $ | 4,042 | |
|
Payments due for operating leases as of December 31, 2021,2023, were as follows:
| | | | | | | | | | | | | | | | | | | | | | | | | | | | | | | | | | | | | | |
| | | | | | | | | | | | |
| (Millions of dollars) | | | | | | | | | | | | |
| 2022 | | 2023 | | 2024 | | 2025 | | 2026 | | Thereafter | | Total |
| $761 | | $478 | | $272 | | $145 | | $56 | | $28 | | $1,740 |
| | | | | | | | | | | | |
| | | | | | | | | | | | | | | | | | | | | | | | | | | | | | | | | | | | | | |
| | | | | | | | | | | | |
| (Millions of dollars) | | | | | | | | | | | | |
| 2024 | | 2025 | | 2026 | | 2027 | | 2028 | | Thereafter | | Total |
| $894 | | $586 | | $329 | | $157 | | $80 | | $29 | | $2,075 |
| | | | | | | | | | | | |
Revenues from finance and operating leases, primarily included in Revenues of Financial Products on Statement 1, were as follows:
| | | (Millions of dollars) | (Millions of dollars) | | | |
| | Year ended December 31 |
| (Millions of dollars) | |
| | 2021 | | | 2020 |
| (Millions of dollars) | |
| Year ended December 31, | |
| Year ended December 31, | |
| Year ended December 31, | |
| 2023 | | | 2023 | | | 2022 | | 2021 |
| Finance lease revenue | Finance lease revenue | $ | 485 | | | | $ | 492 | |
| Operating lease revenue | Operating lease revenue | 1,128 | | | | 1,124 | |
| Total | Total | $ | 1,613 | | | | $ | 1,616 | |
|
We present revenues net of sales and other related taxes.
0
21.Guarantees and product warranty
Caterpillar dealerDealer performance guarantees
We have provided mainly consists of an indemnity to a third-party insurance company for potential losses related to performance bonds issued on behalf of Caterpillar dealers. The bonds have varying terms and are issued to insure governmental agencies against nonperformance by certain dealers. We also providedThe guarantees began to third-parties related to the performance of contractual obligations by certain Caterpillar dealers. These guarantees have varying terms and cover potential financial losses incurred byexpire during the third parties resulting fromquarter of 2023. No payments were made under the dealers’ nonperformance.
In 2016, we provided a guarantee to an end user related to the performance of contractual obligations by a Caterpillar dealer. Under the guarantee, which expires in 2025, non-performance by the Caterpillar dealer could require Caterpillar to satisfy the contractual obligations by providing goods, services or financial compensation to the end user up to an annual designated cap.
Supplier consortium performance guarantee
We have provided a guarantee to a customer in Europe related to the performance of contractual obligations by a supplier consortium to which one of our Caterpillar subsidiaries is a member. The guarantee covers potential damages incurred by the customer resulting from the supplier consortium's non-performance. The damages are capped except for failure of the consortium to meet certain obligations outlined in the contract in the normal course of business. The guarantee will expire when the supplier consortium performs all of its contractual obligations, which is expected to be completed in 2022.guarantees.
We have dealer performance guarantees and third-party performance guarantees that do not limit potential payment to end users related to indemnities and other commercial contractual obligations. In addition, we have entered into contracts involving industry standard indemnifications that do not limit potential payment. For these unlimited guarantees, we are unable to estimate a maximum potential amount of future payments that could result from claims made.
No significant loss has been experienced or is anticipated under any of these guarantees. At both December 31, 20212023 and 2020,2022, the related recorded liability was $5 million.$3 million and $2 million, respectively. The maximum potential amount of future payments that we can estimate (undiscounted and without reduction for any amounts that may possibly be recovered under recourse or collateralized provisions) and we could be required to make under the guarantees at December 31 was as follows:
| | (Millions of dollars) | (Millions of dollars) | | 2021 | | 2020 | (Millions of dollars) | | 2023 | | 2022 |
| Caterpillar dealer performance guarantees | Caterpillar dealer performance guarantees | | $ | 747 | | | $ | 993 | |
| | Supplier consortium performance guarantee | | 242 | | | 258 | |
| | Other guarantees | |
| | Other guarantees | |
| | | Other guarantees | Other guarantees | | 232 | | | 234 | |
| Total guarantees | Total guarantees | | $ | 1,221 | | | $ | 1,485 | |
|
Cat Financial provides guarantees to purchase certain loans of Caterpillar dealers from a special-purpose corporation (SPC) that qualifies as a variable interest entity. The purpose of the SPC is to provide short-term working capital loans to Caterpillar dealers. This SPC issues commercial paper and uses the proceeds to fund its loan program. Cat Financial receives a fee for providing this guarantee. Cat Financial is the primary beneficiary of the SPC as its guarantees result in Cat Financial having both the power to direct the activities that most significantly impact the SPC’s economic performance and the obligation to absorb losses, and therefore Cat Financial has consolidated the financial statements of the SPC. As of December 31, 20212023 and 2020,2022, the SPC’s assets of $888 million$1.35 billion and $1,026$971 million, respectively, were primarily comprised of loans to dealers, and the SPC’s liabilities of $888 million$1.35 billion and $1,025$970 million, respectively, were primarily comprised of commercial paper. The assets of the SPC are not available to pay Cat Financial’s creditors. Cat Financial may be obligated to perform under the guarantee if the SPC experiences losses. No loss has been experienced or is anticipated under this loan purchase agreement.
Cat Financial has commitments to extend credit to customers and Caterpillar dealers through lines of credit and other pre-approved credit arrangements. Cat Financial applies the same credit policies and approval process for these commitments to extend credit as we do for other financing. Collateral is not required, for these commitments, but if credit is extended, collateral may beis generally required upon funding. The amount of unused commitments to extend credit to Caterpillar dealerscustomers that are not unconditionally cancellable was $10.71 billion$774 million at December 31, 2021.2023. Cat Financial also has pre-approved lines of credit and other credit arrangements with Caterpillar dealers; however, we generally hashave the right to unconditionally cancel, alter, or amend the terms of these dealer commitments at any time. The amount of unused commitments to extend credit to customers was $641 million at December 31, 2021. A significant portion of these commitments is not expected to be fully drawn upon; therefore, the total commitment amounts do not represent a future cash requirement.
We determine our product warranty liability by applying historical claim rate experience to the current field population and dealer inventory. Generally, we base historical claim rates on actual warranty experience for each product by machine model/engine size by customer or dealer location (inside or outside North America). We develop specific rates for each product shipment month and update them monthly based on actual warranty claim experience.
The reconciliation of the change in our product warranty liability balances for the years ended December 31, was as follows:
| | | | | | | | | | | | | | |
| (Millions of dollars) | | 2021 | | 2020 |
| Warranty liability, beginning of period | | $ | 1,612 | | | $ | 1,541 | |
| Reduction in liability (payments) | | (854) | | | (897) | |
| Increase in liability (new warranties) | | 931 | | | 968 | |
| Warranty liability, end of period | | $ | 1,689 | | | $ | 1,612 | |
| | | | |
| | | | | | | | | | | | | | |
| (Millions of dollars) | | 2023 | | 2022 |
| Warranty liability, beginning of period | | $ | 1,761 | | | $ | 1,689 | |
| Reduction in liability (payments) | | (835) | | | (778) | |
| Increase in liability (new warranties) | | 968 | | | 850 | |
| Warranty liability, end of period | | $ | 1,894 | | | $ | 1,761 | |
| | | | |
22.Environmental and legal matters
The Company is regulated by federal, state and international environmental laws governing its use, transport and disposal of substances and control of emissions. In addition to governing our manufacturing and other operations, these laws often impact the development of our products, including, but not limited to, required compliance with air emissions standards applicable to internal combustion engines. We have made, and will continue to make, significant research and development and capital expenditures to comply with these emissions standards.
We are engaged in remedial activities at a number of locations, often with other companies, pursuant to federal and state laws. When it is probable we will pay remedial costs at a site, and those costs can be reasonably estimated, we accrue the investigation, remediation, and operating and maintenance costs against our earnings. We accrue costs based on consideration of currently available data and information with respect to each individual site, including available technologies, current applicable laws and regulations, and prior remediation experience. Where no amount within a range of estimates is more likely, we accrue the minimum. Where multiple potentially responsible parties are involved, we consider our proportionate share of the probable costs. In formulating the estimate of probable costs, we do not consider amounts expected to be recovered from insurance companies or others. We reassess these accrued amounts on a quarterly basis. The amount recorded for environmental remediation is not material and is included in Accrued expenses. We believe there is no more than a remote chance that a material amount for remedial activities at any individual site, or at all the sites in the aggregate, will be required.
On January 27, 2020, the Brazilian Federal Environmental Agency (“IBAMA”) issued Caterpillar Brasil Ltda a notice of violation regarding allegations around the requirements for use of imported oils at the Piracicaba, Brazil facility. We have instituted processes to address the allegations. While we are still discussing resolution of these allegations with IBAMA, the initial notice from IBAMA included a proposed fine of approximately $300,000. We do not expect this fine or our response to address the allegations to have a material adverse effect on the Company's consolidated results of operations, financial position or liquidity.
On January 7, 2015, the Company received a grand jury subpoena from the U.S. District CourtAttorney’s Office for the Central District of Illinois. TheIllinois issued a grand jury subpoena requested documents and information fromto the Company relating to,and thereafter issued additional subpoenas; these subpoenas sought information regarding, among other things, financial information concerning U.S. and non-U.S. Caterpillar subsidiaries (including undistributed profits of non-U.S. subsidiaries and the movementmovements of cash among U.S. and non-U.S. subsidiaries). The Company has received additional subpoenas relating to this investigation requesting additional documents and information relating to, among other things,Caterpillar subsidiaries, the purchase and resale of replacement parts by Caterpillar Inc. and non-U.S. Caterpillar subsidiaries, dividend distributions of certain non-U.S. Caterpillar subsidiaries, and Caterpillar SARL (CSARL) and related structures. On March 2-3, 2017, federal agents with the Department of Commerce, the Federal Deposit Insurance Corporation and the Internal Revenue Service executed search and seizure warrants, which concerned both tax and export activities, at 3three facilities of the Company in the Peoria, Illinois area, including its former corporate headquarters.The warrants identify,Tax Division of the U.S. Department of Justice conducted a review of the grand jury investigation and agents seized,informed the Company on November 28, 2022 that it does not have a pending criminal tax matter involving the Company.In January 2023, the government began returning to the Company the documents and information related to, among other things,seized under the export of products from the United States, the movement of products between the United States and Switzerland, the relationship between Caterpillar Inc. and CSARL, and sales outside the United States. It is the Company’s understanding that thesearch warrants, which, concernas noted, related to both tax and export activities, are related toissues, as well as the ongoingdocuments and information the Company produced under the grand jury investigation. The Company is continuing to cooperate with this investigation. The Company is unable to predict the outcome or reasonably estimate any potential loss; however, we currently believe that this matter will not have a material adverse effect on the Company’s consolidated results of operations, financial position or liquidity.subpoenas.
In addition, we are involved in other unresolved legal actions that arise in the normal course of business. The most prevalent of these unresolved actions involve disputes related to product design, manufacture and performance liability (including claimed asbestos exposure), contracts, employment issues, environmental matters, intellectual property rights, taxes (other than income taxes) and securities laws. The aggregate range of reasonably possible losses in excess of accrued liabilities, if any, associated with these unresolved legal actions is not material. In some cases, we cannot reasonably estimate a range of loss because there is insufficient information regarding the matter. However, we believe there is no more than a remote chance that any liability arising from these matters would be material. Although it is not possible to predict with certainty the outcome of these unresolved legal actions, we believe that these actions will not individually or in the aggregate have a material adverse effect on our consolidated results of operations, financial position or liquidity.
23. Segment information
A. Basis for segment information
Our Executive Office is comprised of a Chief Executive Officer (CEO), 4Chief Operating Officer (COO), four Group Presidents, a Chief Financial Officer (CFO), a Chief Legal Officer and General Counsel and a Chief Human Resources Officer. The COO, Group Presidents and CFO are accountable for a related set of end-to-end businesses that they manage. The Chief Legal Officer and General Counsel leads the Law, Security and Public Policy Division. The Chief Human Resources Officer leads the Human Resources Organization. The CEO allocates resources and manages performance at the COO/Group President/CFO level. As such, the CEO serves as our Chief Operating Decision Maker, and operating segments are primarily based on the COO/Group President/CFO reporting structure.
NaNThree of our operating segments, Construction Industries, Resource Industries and Energy & Transportation are led by Group Presidents. NaNOne operating segment, Financial Products, is led by the CFO who also has responsibility for Corporate Services. Corporate Services is a cost center primarily responsible for the performance of certain support functions globally and to provide centralized services; it does not meet the definition of an operating segment. NaNOne Group President leads 1one smaller operating segment that is included in the All Other operating segment. The Law, Security and Public Policy Division and the Human Resources Organization are cost centers and do not meet the definition of an operating segment.
Segment information for 2021 has been recast due to a methodology change related to how we assign intersegment sales and segment profit from our technology products and services to Construction Industries, Resource Industries and Energy & Transportation. This methodology change did not have a material impact on our segment results.
B. Description of segments
We have 5five operating segments, of which 4four are reportable segments. Following is a brief description of our reportable segments and the business activities included in the All Other operating segment:
Construction Industries: A segment primarily responsible for supporting customers using machinery in infrastructure and building construction applications. Responsibilities include business strategy, product design, product management and development, manufacturing, marketing and sales and product support. The product portfolio includes asphalt pavers; backhoe loaders; compactors; cold planers; compactors; compact track and multi-terrain loaders; mini, small, medium and large track excavators;forestry machines; material handlers; motor graders; pipelayers; road reclaimers; skid steer loaders; telehandlers; small and medium track-type tractors; track-type loaders; utility vehicles;track-type tractors (small, medium); track excavators (mini, small, medium, large); wheel excavators; compact,wheel loaders (compact, small, and medium wheel loaders;medium); and related parts and work tools. Inter-segment sales are a source of revenue for this segment.
Resource Industries:A segment primarily responsible for supporting customers using machinery in mining, heavy construction and quarry and aggregates. Responsibilities include business strategy, product design, product management and development, manufacturing, marketing and sales and product support. The product portfolio includes large track-type tractors; large mining trucks; hard rock vehicles; longwall miners; electric rope shovels; draglines; hydraulic shovels; rotary drills; large wheel loaders; off-highway trucks; articulated trucks; wheel tractor scrapers; wheel dozers; landfill compactors; soil compactors; select work tools; machinery components; electronics and control systems and related parts. In addition to equipment, Resource Industries also develops and sells technology products and services to provide customers fleet management, equipment management analytics, autonomous machine capabilities, safety services and mining performance solutions. Resource Industries also manages areas that provide services to other parts of the company, including strategic procurement, lean center of excellence, integrated manufacturing, research and development for drivetrains, hydraulic systems, automation, electronics and software for Cat machines and engines. Inter-segment sales are a source of revenue for this segment.
Energy & Transportation: A segment primarily responsible for supporting customers using reciprocating engines, turbines, diesel-electric locomotives and related services across industries serving Oil and Gas, Power Generation, Industrial and Transportation applications, including marine- and rail-related businesses. Responsibilities include business strategy, product design, product management, development and development,testing manufacturing, marketing and sales and product support. The product and services portfolio includes turbines, centrifugal gas compressors, and turbine-related services; reciprocating engine-powered generator sets; integrated systems and solutions used in the electric power generation industry; reciprocating engines, drivetrain and integrated systems and solutions for the marine and oil and gas industries; reciprocating engines, drivetrain and integrated systems and solutions supplied to the industrial industry as well as Cat machinery;Caterpillar machines; electrified powertrain and zero-emission power sources and service solutions development; and
diesel-electric locomotives and components and other rail-related products and services, including remanufacturing and leasing.Responsibilities also include the remanufacturing of Caterpillar reciprocating engines and components and remanufacturing services for other companies; and product support of on-highway vocational trucks for North America. Inter-segment sales are a source of revenue for this segment.
Financial Products Segment: Provides financing alternatives to customers and dealers around the world for Caterpillar products and services, as well as financing for vehicles, power generation facilities and marine vessels that, in most cases, incorporate Caterpillar products. Financing plans include operating and finance leases, revolving charge accounts, installment sale contracts, repair/rebuild financing, working capital loans and wholesale financing plans. The segment also provides insurance and risk management products and services that help customers and dealers manage their business risk. Insurance and risk management products offered include physical damage insurance, inventory protection plans, extended service coverage and maintenance plans for machines and engines, and dealer property and casualty insurance. The various forms of financing, insurance and risk management products offered to customers and dealers help support the purchase and lease of Caterpillar equipment. The segment also earns revenues from ME&T, but the related costs are not allocated to operating segments. Financial Products’ segment profit is determined on a pretax basis and includes other income/expense items.
All Other operating segment: Primarily includes activities such as: business strategy; product management and development; manufacturing and sourcing of filters and fluids, undercarriage, ground-engaging tools, fluid transfer products, precision seals, rubber sealing and connecting components primarily for CaterpillarCat® products; parts distribution; integrated logistics solutions; distribution services responsible for dealer development and administration, including 1one wholly owned dealer in Japan; dealer portfolio management and ensuring the most efficient and effective distribution of machines, engines and parts; brand management and marketing strategy; and digital investments for new customer and dealer solutions that integrate data analytics with state-of-the-art digital technologies while transforming the buying experience. Results for the All Other operating segment are included as a reconciling item between reportable segments and consolidated external reporting.
C. Segment measurement and reconciliations
There are several methodology differences between our segment reporting and our external reporting. The following is a list of the more significant methodology differences:
•ME&T segment net assets generally include inventories, receivables, property, plant and equipment, goodwill, intangibles, accounts payable and customer advances. We generally manage at the corporate level liabilities other than accounts payable and customer advances, and we do not include these in segment operations. Financial Products Segment assets generally include all categories of assets.
•We value segment inventories and cost of sales using a current cost methodology.
•We amortize goodwill allocated to segments using a fixed amount based on a 20-year useful life. This methodology difference only impacts segment assets. We do not include goodwill amortization expense in segment profit. In addition, we have allocated to segments only a portion of goodwill for certain acquisitions made in 2011 or later.
•We generally manage currency exposures for ME&T at the corporate level and do not include in segment profit the effects of changes in exchange rates on results of operations within the year. We report the net difference created in the translation of revenues and costs between exchange rates used for U.S. GAAP reporting and exchange rates used for segment reporting as a methodology difference.
•We do not include stock-based compensation expense in segment profit.
•Postretirement benefit expenses are split; segments are generally responsible for service costs, with the remaining elements of net periodic benefit cost included as a methodology difference.
•We determine ME&T segment profit on a pretax basis and exclude interest expense and most other income/expense items. We determine Financial Products Segment profit on a pretax basis and include other income/expense items.
Reconciling items are created based on accounting differences between segment reporting and our consolidated external reporting. Please refer to pages 127115 to 129117 for financial information regarding significant reconciling items. Most of our reconciling items are self-explanatory given the above explanations. For the reconciliation of profit, we have grouped the reconciling items as follows:
•Corporate costs: These costs are related to corporate requirements primarily for compliance and legal functions for the benefit of the entire organization.
•Restructuring costs: May include costs for employee separation, long-lived asset impairments and contract terminations. These costs are included in Other operating (income) expenses except for defined-benefit plan curtailment losses and special termination benefits, which are included in Other income (expense). Restructuring costs also include other exit-related costs, which may consist of accelerated depreciation, inventory write-downs, building demolition, equipment relocation and project management costs and LIFO inventory decrement benefits from inventory liquidations at closed facilities, all of which are primarily included in Cost of goods sold. Only certain restructuring costs in 2020 and 2019 were excluded from segment profit. See Note 25 for more information.
•Methodology differences: See previous discussion of significant accounting differences between segment reporting and consolidated external reporting.
•Timing: Timing differences in the recognition of costs between segment reporting and consolidated external reporting. For example, we report certain costs on the cash basis for segment reporting and the accrual basis for consolidated external reporting.
For the years ended December 31, 2021, 20202023, 2022 and 2019,2021, sales and revenues by geographic region reconciled to consolidated sales and revenues were as follows:
| | Sales and Revenues by Geographic Region | Sales and Revenues by Geographic Region | |
| (Millions of dollars) | (Millions of dollars) | | North
America | | Latin
America | | EAME | | Asia/
Pacific | | External Sales and Revenues | | Intersegment Sales and Revenues | | Total Sales and Revenues |
| 2021 | | | | | | | | | | | | | | |
| (Millions of dollars) | |
| (Millions of dollars) | | | North
America | | Latin
America | | EAME | | Asia/
Pacific | | External Sales and Revenues | | Intersegment Sales and Revenues | | Total Sales and Revenues |
| 2023 | |
| Construction Industries | |
| Construction Industries | |
| Construction Industries | Construction Industries | | $ | 9,676 | | | $ | 1,913 | | | $ | 4,858 | | | $ | 5,547 | | | $ | 21,994 | | | $ | 112 | | | $ | 22,106 | |
| Resource Industries | Resource Industries | | 2,987 | | | 1,724 | | | 1,987 | | | 2,804 | | | $ | 9,502 | | | 461 | | | 9,963 | |
| Energy & Transportation | Energy & Transportation | | 7,611 | | | 1,233 | | | 4,908 | | | 2,918 | | | $ | 16,670 | | | 3,617 | | | 20,287 | |
| Financial Products Segment | Financial Products Segment | | 1,935 | | | 265 | | | 402 | | | 471 | | | $ | 3,073 | | 1 | — | | | 3,073 | |
| Total sales and revenues from reportable segments | Total sales and revenues from reportable segments | | 22,209 | | | 5,135 | | | 12,155 | | | 11,740 | | | 51,239 | | | 4,190 | | | 55,429 | |
| All Other operating segment | All Other operating segment | | 56 | | | 2 | | | 18 | | | 69 | | | 145 | | | 366 | | | 511 | |
| Corporate Items and Eliminations | Corporate Items and Eliminations | | (242) | | | (51) | | | (36) | | | (84) | | | (413) | | | (4,556) | | | (4,969) | |
| Total Sales and Revenues | Total Sales and Revenues | | $ | 22,023 | | | $ | 5,086 | | | $ | 12,137 | | | $ | 11,725 | | | $ | 50,971 | | | $ | — | | | $ | 50,971 | |
| | 2020 | |
| 2022 | |
| | 2022 | |
| | 2022 | |
| Construction Industries | |
| Construction Industries | |
| Construction Industries | Construction Industries | | $ | 7,365 | | | $ | 1,031 | | | $ | 3,466 | | | $ | 5,014 | | | $ | 16,876 | | | $ | 42 | | | $ | 16,918 | |
| Resource Industries | Resource Industries | | 2,286 | | | 1,253 | | | 1,570 | | | 2,337 | | | 7,446 | | | 460 | | | 7,906 | |
| Energy & Transportation | Energy & Transportation | | 6,843 | | | 932 | | | 4,448 | | | 2,441 | | | 14,664 | | | 2,806 | | | 17,470 | |
| Financial Products Segment | Financial Products Segment | | 1,930 | | | 257 | | | 392 | | | 465 | | | 3,044 | | 1 | — | | | 3,044 | |
| Total sales and revenues from reportable segments | Total sales and revenues from reportable segments | | 18,424 | | | 3,473 | | | 9,876 | | | 10,257 | | | 42,030 | | | 3,308 | | | 45,338 | |
| All Other operating segment | All Other operating segment | | 27 | | | 4�� | | | 26 | | | 56 | | | 113 | | | 354 | | | 467 | |
| Corporate Items and Eliminations | Corporate Items and Eliminations | | (237) | | | (45) | | | (44) | | | (69) | | | (395) | | | (3,662) | | | (4,057) | |
| Total Sales and Revenues | Total Sales and Revenues | | $ | 18,214 | | | $ | 3,432 | | | $ | 9,858 | | | $ | 10,244 | | | $ | 41,748 | | | $ | — | | | $ | 41,748 | |
| | 2019 | | | | | | | | | |
| 2021 | |
| 2021 | |
| 2021 | |
| Construction Industries | |
| Construction Industries | |
| Construction Industries | Construction Industries | | $ | 11,455 | | | $ | 1,533 | | | $ | 4,012 | | | $ | 5,556 | | | $ | 22,556 | | | $ | 93 | | | $ | 22,649 | |
| Resource Industries | Resource Industries | | 3,632 | | | 1,533 | | | 1,836 | | | 2,812 | | | 9,813 | | | 463 | | | 10,276 | |
| Energy & Transportation | Energy & Transportation | | 8,864 | | | 1,389 | | | 4,994 | | | 3,238 | | | 18,485 | | | 3,612 | | | 22,097 | |
| Financial Products Segment | Financial Products Segment | | 2,235 | | | 299 | | | 408 | | | 492 | | | 3,434 | | 1 | — | | | 3,434 | |
| Total sales and revenues from reportable segments | Total sales and revenues from reportable segments | | 26,186 | | | 4,754 | | | 11,250 | | | 12,098 | | | 54,288 | | | 4,168 | | | 58,456 | |
| All Other operating segment | All Other operating segment | | 25 | | | 7 | | | 28 | | | 67 | | | 127 | | | 373 | | | 500 | |
| Corporate Items and Eliminations | Corporate Items and Eliminations | | (426) | | | (51) | | | (55) | | | (83) | | | (615) | | | (4,541) | | | (5,156) | |
| Total Sales and Revenues | Total Sales and Revenues | | $ | 25,785 | | | $ | 4,710 | | | $ | 11,223 | | | $ | 12,082 | | | $ | 53,800 | | | $ | — | | | $ | 53,800 | |
|
1 Includes revenues from Construction Industries, Resource Industries, Energy & Transportation and All Other operating segment of $351$690 million, , $362$478 million and $524$351 million in the years ended December 31, 2021, 20202023, 2022 and 2019,2021, respectively.
For the years ended December 31, 2021, 20202023, 2022 and 2019,2021, Energy & Transportation segment sales by end user application were as follows: | | Energy & Transportation External Sales | Energy & Transportation External Sales | |
| | (Millions of dollars) | (Millions of dollars) | |
| | 2021 | | 2020 | | 2019 |
| (Millions of dollars) | |
| | (Millions of dollars) | |
| | 2023 | |
| | 2023 | |
| | 2023 | | | 2022 | | 2021 |
| Oil and gas | Oil and gas | | $ | 4,460 | | | $ | 3,701 | | | $ | 5,205 | |
| Power generation | Power generation | | 4,292 | | | 3,963 | | | 4,474 | |
| Industrial | Industrial | | 3,612 | | | 2,945 | | | 3,749 | |
| Transportation | Transportation | | 4,306 | | | 4,055 | | | 5,057 | |
| Energy & Transportation External Sales | Energy & Transportation External Sales | | $ | 16,670 | | | $ | 14,664 | | | $ | 18,485 | |
| |
| | Reconciliation of Consolidated profit before taxes: | Reconciliation of Consolidated profit before taxes: | | | | |
| (Millions of dollars) | (Millions of dollars) | |
| 2021 | | 2020 | | 2019 |
| (Millions of dollars) | |
| (Millions of dollars) | |
| 2023 | |
| 2023 | |
| 2023 | | | 2022 | | 2021 |
| Profit from reportable segments: | Profit from reportable segments: | | | | | |
| Construction Industries | |
| Construction Industries | |
| Construction Industries | Construction Industries | $ | 3,706 | | | $ | 2,373 | | | $ | 3,931 | |
| Resource Industries | Resource Industries | 1,291 | | | 896 | | | 1,629 | |
| Energy & Transportation | Energy & Transportation | 2,768 | | | 2,405 | | | 3,910 | |
| Financial Products Segment | Financial Products Segment | 908 | | | 590 | | | 832 | |
| Total profit from reportable segments | Total profit from reportable segments | 8,673 | | | 6,264 | | | 10,302 | |
| Profit from All Other operating segment | Profit from All Other operating segment | (14) | | | 28 | | | 4 | |
| Cost centers | Cost centers | (4) | | | (4) | | | (6) | |
| Corporate costs | Corporate costs | (699) | | | (517) | | | (607) | |
| Timing | Timing | (263) | | | (106) | | | (93) | |
| Restructuring costs | Restructuring costs | (90) | | | (241) | | | (207) | |
| Methodology differences: | Methodology differences: | |
| Inventory/cost of sales | Inventory/cost of sales | 122 | | | 4 | | | (19) | |
| Inventory/cost of sales | |
| Inventory/cost of sales | |
| Postretirement benefit income (expense) | Postretirement benefit income (expense) | 1,171 | | | (173) | | | (401) | |
| Stock-based compensation expense | Stock-based compensation expense | (199) | | | (202) | | | (205) | |
| Financing costs | Financing costs | (449) | | | (444) | | | (248) | |
| Currency | Currency | 258 | | | (266) | | | (175) | |
| Goodwill impairment charge | |
| Other income/expense methodology differences | Other income/expense methodology differences | (267) | | | (322) | | | (481) | |
| Other methodology differences | Other methodology differences | (35) | | | (26) | | | (52) | |
| Total consolidated profit before taxes | Total consolidated profit before taxes | $ | 8,204 | | | $ | 3,995 | | | $ | 7,812 | |
|
| | Reconciliation of Assets: | Reconciliation of Assets: | |
| (Millions of dollars) | (Millions of dollars) | December 31, |
| 2021 | | 2020 |
| (Millions of dollars) | |
| (Millions of dollars) | | December 31, |
| 2023 | | | 2023 | | 2022 |
| Assets from reportable segments: | Assets from reportable segments: | | | |
| Construction Industries | |
| Construction Industries | |
| Construction Industries | Construction Industries | $ | 4,547 | | | $ | 4,259 | |
| Resource Industries | Resource Industries | 5,962 | | | 6,035 | |
| Energy & Transportation | Energy & Transportation | 9,253 | | | 8,582 | |
| Financial Products Segment | Financial Products Segment | 34,860 | | | 34,278 | |
| Total assets from reportable segments | Total assets from reportable segments | 54,622 | | | 53,154 | |
| Assets from All Other operating segment | Assets from All Other operating segment | 1,678 | | | 1,717 | |
| Items not included in segment assets: | Items not included in segment assets: | |
| Cash and cash equivalents | Cash and cash equivalents | 8,428 | | | 8,822 | |
| Cash and cash equivalents | |
| Cash and cash equivalents | |
| | | Deferred income taxes | |
| | Deferred income taxes | |
| | Deferred income taxes | Deferred income taxes | 1,735 | | | 1,413 | |
| Goodwill and intangible assets | Goodwill and intangible assets | 4,859 | | | 4,847 | |
| Property, plant and equipment – net and other assets | Property, plant and equipment – net and other assets | 4,056 | | | 2,833 | |
| Inventory methodology differences | Inventory methodology differences | (2,656) | | | (2,536) | |
| Liabilities included in segment assets | Liabilities included in segment assets | 10,777 | | | 8,466 | |
| Other | Other | (706) | | | (392) | |
| Total assets | Total assets | $ | 82,793 | | | $ | 78,324 | |
|
| | Reconciliation of Depreciation and amortization: | Reconciliation of Depreciation and amortization: | |
| (Millions of dollars) | (Millions of dollars) | |
| 2021 | | 2020 | | 2019 |
| (Millions of dollars) | |
| (Millions of dollars) | |
| 2023 | |
| 2023 | |
| 2023 | | | 2022 | | 2021 |
| Depreciation and amortization from reportable segments: | Depreciation and amortization from reportable segments: | | | | | |
| Construction Industries | |
| Construction Industries | |
| Construction Industries | Construction Industries | $ | 237 | | | $ | 245 | | | $ | 302 | |
| Resource Industries | Resource Industries | 403 | | | 418 | | | 450 | |
| Energy & Transportation | Energy & Transportation | 571 | | | 593 | | | 624 | |
| Financial Products Segment | Financial Products Segment | 772 | | | 773 | | | 829 | |
| Total depreciation and amortization from reportable segments | Total depreciation and amortization from reportable segments | 1,983 | | | 2,029 | | | 2,205 | |
| Items not included in segment depreciation and amortization: | Items not included in segment depreciation and amortization: | |
| All Other operating segment | All Other operating segment | 243 | | | 267 | | | 210 | |
| All Other operating segment | |
| All Other operating segment | |
| Cost centers | Cost centers | 98 | | | 126 | | | 135 | |
| Other | Other | 28 | | | 10 | | | 27 | |
| Total depreciation and amortization | Total depreciation and amortization | $ | 2,352 | | | $ | 2,432 | | | $ | 2,577 | |
|
| | Reconciliation of Capital expenditures: | Reconciliation of Capital expenditures: | | | | | | Reconciliation of Capital expenditures: | | | |
| (Millions of dollars) | (Millions of dollars) | |
| 2021 | | 2020 | | 2019 |
| 2023 | |
| 2023 | |
| 2023 | | | 2022 | | 2021 |
| Capital expenditures from reportable segments: | Capital expenditures from reportable segments: | | | | | |
| Construction Industries | |
| Construction Industries | |
| Construction Industries | Construction Industries | $ | 255 | | | $ | 213 | | | $ | 201 | |
| Resource Industries | Resource Industries | 199 | | | 125 | | | 168 | |
| Energy & Transportation | Energy & Transportation | 627 | | | 495 | | | 613 | |
| Financial Products Segment | Financial Products Segment | 1,218 | | | 1,100 | | | 1,534 | |
| Total capital expenditures from reportable segments | Total capital expenditures from reportable segments | 2,299 | | | 1,933 | | | 2,516 | |
| Items not included in segment capital expenditures: | Items not included in segment capital expenditures: | |
| All Other operating segment | All Other operating segment | 182 | | | 156 | | | 131 | |
| All Other operating segment | |
| All Other operating segment | |
| Cost centers | Cost centers | 56 | | | 47 | | | 101 | |
| Timing | Timing | (74) | | | 19 | | | (11) | |
| Other | Other | 9 | | | (40) | | | (68) | |
| Total capital expenditures | Total capital expenditures | $ | 2,472 | | | $ | 2,115 | | | $ | 2,669 | |
|
| | Enterprise-wide Disclosures: | |
| Enterprise-wide Disclosures | |
| Information about Geographic Areas: | Information about Geographic Areas: | |
| Information about Geographic Areas: | |
| Information about Geographic Areas: | |
| | |
| | |
| | | | | | | | | | Property, plant and equipment - net | | | | Property, plant and equipment - net |
| | | | External sales and revenues 1 | | December 31, | | | External sales and revenues 1 | | December 31, |
| (Millions of dollars) | (Millions of dollars) | | 2021 | | 2020 | | 2019 | | 2021 | | 2020 | (Millions of dollars) | | 2023 | | 2022 | | 2021 | | 2023 | | 2022 |
| Inside United States | Inside United States | | $ | 19,298 | | | $ | 16,269 | | | $ | 22,806 | | | $ | 7,035 | | | $ | 7,242 | |
| Outside United States | Outside United States | | 31,673 | | | 25,479 | | | 30,994 | | | 5,055 | | | 5,159 | |
| Total | Total | | $ | 50,971 | | | $ | 41,748 | | | $ | 53,800 | | | $ | 12,090 | | | $ | 12,401 | |
| 1 Sales of ME&T are based on dealer or customer location. Revenues from services provided are based on where service is rendered. | 1 Sales of ME&T are based on dealer or customer location. Revenues from services provided are based on where service is rendered. | |
1 Sales of ME&T are based on dealer or customer location. Revenues from services provided are based on where service is rendered. | |
|
24. Acquisitions
SPM Oil & Gas
On February 1, 2021, Caterpillar completed the acquisition of varying equity interests and assets of the Weir Group PLC, collectively known as SPM Oil & Gas (SPM). Headquartered near Fort Worth, Texas, SPM Oil & Gas produces a full line of pumps, flow iron, consumable parts, wellhead and pressure control products that are offered via an extensive global network of service centers. This acquisition, included in the Energy & Transportation segment, is consistent with our strategy of providing our customers expanded offerings and services which will now be one of the broadest in the well service industry. The purchase price, net of $22 million of acquired cash, was approximately $359 million.
We financed the transaction with available cash. Tangible assets as of the acquisition date were $520 million, recorded at their fair values, and primarily included cash of $22 million, receivables of $106 million, inventories of $159 million, leased assets of $105 million, and property, plant, and equipment of $117 million. Finite-lived intangible assets acquired of $23 million included developed technology and trade names and will be amortized on a straight-line basis over a weighted-average amortization period of approximately 8 years. Liabilities assumed as of the acquisition date were $192 million, recorded at their fair values, and primarily included lease liabilities of $105 million and accounts payable of $33 million. Goodwill of $30 million represented the excess of the consideration transferred over the net assets acquired. Assuming this transaction had been made at the beginning of any period presented, the consolidated pro forma results would not be materially different from reported results.
25. Restructuring costs
Our accounting for employee separations is dependent upon how the particular program is designed. For voluntary programs, we recognize eligible separation costs at the time of employee acceptance unless the acceptance requires explicit approval by the company. For involuntary programs, we recognize eligible costs when management has approved the program, the affected employees have been properly notified and the costs are estimable.
Restructuring costs for 2021, 20202023, 2022 and 20192021 were as follows:
| | | | | | (Millions of dollars) | (Millions of dollars) | | 2021 | | 2020 | | 2019 |
| | (Millions of dollars) | |
| | (Millions of dollars) | | | 2023 | | 2022 | | 2021 |
Employee separations 1 | Employee separations 1 | | $ | 92 | | | $ | 271 | | | $ | 48 | |
Longwall divestiture 1 | |
Contract terminations 1 | Contract terminations 1 | | 2 | | | 2 | | | 1 | |
Long-lived asset impairments 1 | Long-lived asset impairments 1 | | (63) | | | 38 | | | 65 | |
| Other 2 | Other 2 | | 59 | | | 43 | | | 122 | |
Other 2 | |
Other 2 | |
| Total restructuring costs | Total restructuring costs | | $ | 90 | | | $ | 354 | | | $ | 236 | |
| 1 Recognized in Other operating (income) expenses. | 1 Recognized in Other operating (income) expenses. | |
1 Recognized in Other operating (income) expenses. | |
1 Recognized in Other operating (income) expenses. | |
| 2 Represents costs related to our restructuring programs, primarily for accelerated depreciation, inventory write-downs, project management, equipment relocation and building demolition, all of which are primarily included in Cost of goods sold. | 2 Represents costs related to our restructuring programs, primarily for inventory write-downs, accelerated depreciation, project management and equipment relocation, all of which are primarily included in Cost of goods sold. | |
| 2 Represents costs related to our restructuring programs, primarily for inventory write-downs, accelerated depreciation, project management and equipment relocation, all of which are primarily included in Cost of goods sold. | |
| 2 Represents costs related to our restructuring programs, primarily for inventory write-downs, accelerated depreciation, project management and equipment relocation, all of which are primarily included in Cost of goods sold. | |
|
The restructuring costs in 2023 were primarily related to the divestiture of the company's Longwall business within Resource Industries. The divestiture closed on February 1, 2023 and resulted in a pre-tax loss of approximately $586 million, primarily a non-cash item driven by the release of $494 million of accumulated foreign currency translation. The restructuring costs in 2022 were primarily related to actions across the company, including $193 million related to the Rail division that was primarily inventory write-downs, and other strategic actions to address a small number of products. The inventory write-downs were included in "Other" in the table above. The restructuring costs in 2021 were primarily related to actions across the company including strategic actions to address certaina small number of products, which were partially offset by a gain on the sale of a manufacturing facility that had been closed. The restructuring costs in 2020 were primarily related to various voluntary and involuntary employee separation programs implemented across the company and strategic actions to address certain products, which were partially offset by a gain on the sale of a manufacturing facility that had been closed. Both the gains in 2021 and 2020 werewas included in Long-lived asset impairments in the table above. The restructuring costs in 2019 were primarily related to restructuring actions across the company.
In 2023, 2022 and 2021, all restructuring costs are excluded from segment profit. In 2020 and 2019, only certain restructuring costs were excluded from segment profit. Restructuring costs included in segment profit were as follows:
| | | | | | | | | | | | | | | | | | | | |
| | | | | | |
| (Millions of dollars) | | 2021 | | 2020 | | 2019 |
| Construction Industries | | $ | — | | | $ | 13 | | | $ | 4 | |
| Resource Industries | | — | | | 19 | | | 5 | |
| Energy & Transportation | | — | | | 55 | | | 7 | |
| Financial Products Segment | | — | | | — | | | — | |
| | | | | | |
The following table summarizes the 20212023 and 20202022 employee separation activity:
| | | (Millions of dollars) | |
| (Millions of dollars) | |
| (Millions of dollars) | (Millions of dollars) | 2021 | | 2020 | 2023 | | 2022 |
| Liability balance, beginning of period | Liability balance, beginning of period | $ | 164 | | | $ | 48 | |
| Increase in liability (separation charges) | Increase in liability (separation charges) | 92 | | | 271 | |
| Reduction in liability (payments) | Reduction in liability (payments) | (195) | | | (155) | |
| Liability balance, end of period | Liability balance, end of period | $ | 61 | | | $ | 164 | |
|
Most of the remaining liability balance as of December 31, 20212023 is expected to be paid in 2022.
In September 2015, we announced a large scale restructuring plan (the Plan) including a voluntary retirement enhancement program for qualifying U.S. employees, several voluntary separation programs outside of the United States, additional involuntary programs throughout the company and manufacturing facility consolidations and closures. The largest action among those included in the Plan was related to our European manufacturing footprint which led to the Gosselies, Belgium facility closure. We incurred $43 million of restructuring costs associated with these actions in 2019. The Plan concluded in 2019, and total restructuring costs incurred since inception of the Plan were $1,831 million.2024.
Item 9.Changes in and Disagreements with Accountants on Accounting and Financial Disclosure.
Not Applicable.
Item 9A.Controls and Procedures.
Disclosure Controls and Procedures
An evaluation was performed under the supervision and with the participation of the company’s management, including the Chief Executive Officer (CEO) and Chief Financial Officer (CFO), of the effectiveness of the design and operation of the company's disclosure controls and procedures, as that term is defined in Rule 13a-15(e) under the Exchange Act, as of the end of the period covered by this annual report. Based on that evaluation, the CEO and CFO concluded that the company’s disclosure controls and procedures were effective as of the end of the period covered by this annual report.
Management’s Report on Internal Control Over Financial Reporting
Management’s report on the company’s internal control over financial reporting as of December 31, 20212023 is included on page 6053 of Part II, Item 8 “Financial Statements and Supplementary Data.” The effectiveness of the company’s internal control over financial reporting as of December 31, 20212023 has been audited by PricewaterhouseCoopers LLP, an independent registered public accounting firm. Their report appears on pages 61-6254-55 of Part II, Item 8 “Financial Statements and Supplementary Data.”
Changes in Internal Control over Financial Reporting
During the last fiscal quarter, there has been no significant change in the company’s internal control over financial reporting that has materially affected, or is reasonably likely to materially affect, the company’s internal control over financial reporting.
Item 9B.Other Information.
Disclosures Required Pursuant to Section 13(r)During the three months ended December 31, 2023, none of the company’s directors or officers (as defined in Rule 16a-1(f) of the Securities Exchange Act of 1934
During1934) adopted, terminated or modified a Rule 10b5-1 trading arrangement or non-Rule 10b5-1 trading arrangement (as such terms are defined in Item 408 of Regulation S-K of the six months ended June 30, 2021, Caterpillar Eurasia LLC, oneSecurities Act of our affiliates, engaged in limited transactions or dealings with the Federal Security Service of Russia (the “FSB”)1933). Specifically, Caterpillar Eurasia LLC, from time to time, directly or indirectly, made required submissions to and received regulatory authorizations from the FSB related to the importation of software used in the on-board telematics and control systems of Caterpillar machines that were imported into Russia. Caterpillar Eurasia LLC did not generate any net revenue or net profits from such approval activity and does not make any sales to or have other dealings with the FSB. Caterpillar Eurasia LLC plans to continue these activities as long as it remains lawful to do so.
Item 9C. Disclosure Regarding Foreign Jurisdictions that Prevent Inspections.
Not Applicable.
PART III
Item 10. Directors, Executive Officers and Corporate Governance.
Identification of Directors and Business Experience
Information required by this Item is incorporated by reference from the 20222024 Proxy Statement.
Identification of Executive Officers and Business Experience
Information required by this Item appears in Item 1C1D of this Form 10-K.
Family Relationships
There are no family relationships between the officers and directors of the company.
Legal Proceedings Involving Officers and Directors
If applicable, information required by this Item is incorporated by reference from the 20222024 Proxy Statement.
Audit Committee Financial Expert
Information required by this Item is incorporated by reference from the 20222024 Proxy Statement.
Identification of Audit Committee
Information required by this Item is incorporated by reference from the 20222024 Proxy Statement.
Shareholder Recommendation of Board Nominees
Information required by this Item is incorporated by reference from the 20222024 Proxy Statement.
Compliance with Section 16(a) of the Exchange Act
If applicable, information required by this Item relating to compliance with Section 16(a) of the Exchange Act is incorporated by reference from the 20222024 Proxy Statement.
Code of Ethics
Our Worldwide Code of Conduct (Code), first published in 1974 and most recently updated in 2019, sets a high standard for honesty and ethical behavior by every director and employee, including the principal executive officer, principal financial officer and principal accounting officer. The Code is posted on our website at www.Caterpillar.com/code. To obtain a copy of the Code at no charge, submit a written request to the Corporate Secretary at 510 Lake Cook Road,5205 N. O'Connor Boulevard, Suite 100, Deerfield, IL 60015-4971.Irving, TX 75039. We post on our website at www.Caterpillar.com/code any required amendments to or waivers granted under our Code pursuant to SEC or New York Stock Exchange disclosure rules.
Item 11. Executive Compensation.
Information required by this Item is incorporated by reference from the 20222024 Proxy Statement.
Item 12. Security Ownership of Certain Beneficial Owners and Management and Related Stockholder Matters.
Information required by this Item relating to security ownership of certain beneficial owners and management is incorporated by reference from the 20222024 Proxy Statement.
Information required by this Item relating to securities authorized for issuance under equity compensation plans is included in the following table:
Equity Compensation Plan Information
(as of December 31, 2021)2023)
| | Plan category | Plan category | | (a)
Number of securities to be issued upon exercise of outstanding options, warrants and rights | | (b)
Weighted-
average
exercise
price of outstanding options, warrants and rights | | (c)
Number of securities remaining available for future issuance under equity compensation plans (excluding securities reflected in column (a)) | Plan category | | (a)
Number of securities to be issued upon exercise of outstanding options, warrants and rights | | (b)
Weighted-
average
exercise
price of outstanding options, warrants and rights | | (c)
Number of securities remaining available for future issuance under equity compensation plans (excluding securities reflected in column (a)) |
| Equity compensation plans approved by security holders | Equity compensation plans approved by security holders | | 10,400,999 | | | $ | 127.52 | | | 33,880,674 | Equity compensation plans approved by security holders | | 7,210,783 | | | $ | | $ | 169.57 | | | 43,041,378 | | 43,041,378 |
| Equity compensation plans not approved by security holders | Equity compensation plans not approved by security holders | | N/A | | N/A | | N/A | Equity compensation plans not approved by security holders | | N/A |
| Total | Total | | 10,400,999 | | | $ | 127.52 | | | 33,880,674 | Total | | 7,210,783 | | | $ | | $ | 169.57 | | | 43,041,378 | | 43,041,378 |
Item 13. Certain Relationships and Related Transactions, and Director Independence.
Information required by this Item is incorporated by reference from the 20222024 Proxy Statement.
Item 14. Principal Accountant Fees and Services.
Our independent registered public accounting firm is PricewaterhouseCoopers LLP, Chicago, Illinois,Dallas, Texas, Auditor Firm ID: 238.
Information required by this Item is incorporated by reference from the 20222024 Proxy Statement.
PART IV
Item 15. Exhibits and Financial Statement Schedules.
| | | | | | | | | | | | |
| | Exhibits: | |
| | 3.1 | | |
| | 3.2 | | |
| | 4.1 | | |
| | 4.2 | | |
| | 4.3 | | |
| | 4.4 | | |
| | 4.5 | | |
| | 4.6 | | |
| | 4.7 | | |
| | 4.8 | | |
| | 4.94.8 | | |
| | 4.104.9 | | |
| | 4.114.10 | | |
| | 4.124.11 | | |
| | 4.134.12 | | |
| | 4.144.13 | | |
| | 4.154.14 | | |
| | 4.164.15 | | |
| | 4.174.16 | | |
| | 4.184.17 | | |
| | 4.194.18 | | |
| | 10.1 | | |
| | 10.2 | | |
| | 10.210.3 | | |
| | | | | | | | | | | | |
| | 10.3 | | |
| | 10.4 | | |
| | 10.5 | | |
| | 10.6 | | |
| | 10.7 | | |
| | 10.8 | | |
| | 10.9 | | |
| | 10.10 | | |
| | 10.11 | | |
| | 10.1210.5 | | |
| | 10.13 | | |
| | 10.1410.6 | | |
| | 10.15 | | |
| | 10.1610.7 | | |
| | 10.1710.8 | | |
| | 10.9 | | |
| | 10.1810.10 | | |
| | 10.1910.11 | | |
| | 10.2010.12 | | |
| | 10.2110.13 | | |
| | 10.14 | | |
| | 10.2210.15 | | |
| | 10.2310.16 | | |
| | | | | | | | | | | | |
| | 10.17 | | |
| | 10.2410.18 | | |
| | 10.2510.19 | | |
| | 10.2610.20 | | |
| | 10.2710.21 | | |
| | 10.2810.22 | | |
| | 10.23 | | |
| | | | | | | | | | | | |
| | 10.2910.24 | | |
| | 10.3010.25 | | |
| | 10.3110.26 | | |
| | 10.3210.27 | | |
| | 10.3310.28 | | |
| | 10.29 | | |
| | 10.3410.30 | | |
| | 10.3510.31 | | |
| | 10.3610.32 | | |
| | 10.3710.33 | | |
| | 10.3810.34 | | |
| | 10.3910.35 | | |
| | 10.40 | | |
| | 10.41 | | |
| | 10.42 | | |
| | 10.4310.36 | | |
| | 10.4410.37 | | |
| | 10.4510.38 | | |
| | | | | | | | | | | | |
| | 10.4610.39 | Credit Agreement (2021(2023 364-Day Facility), dated September 2, 2021,August 31, 2023, among Caterpillar Inc., Caterpillar Financial Services Corporation, Caterpillar International Finance Designated Activity Company, and Caterpillar Finance Kabushiki Kaisha, certain financial institutions named therein, Citibank, N.A., as agent, Citibank Europe PLC, UK Branch, as Local Currency Agent, and MUFG Bank, Ltd. as Japan Local Currency Agent (incorporated by reference from Exhibit 10.1 to the Company's Current Report on Form 8-K filed on September 8, 2021)1, 2023) | |
| | 10.4710.40 | Local Currency Addendum to the 20212023 364-Day Facility dated September 2, 2021,August 31, 2023, among Caterpillar Financial Services Corporation, Caterpillar International Finance Designated Activity Company, the Local Currency Banks named therein, Citibank, N.A., as Agent, and Citibank Europe plc, UK Branch, as Local Currency Agent (incorporated by reference from Exhibit 10.2 to the Company's Current Report on Form 8-K filed September 8, 2021,) 2023) | |
| | 10.4810.41 | | |
| | | | | | | | | | | | |
| | 10.4910.42 | Credit Agreement, Short-Term Facility, dated as of April 21, 2020, by and among Caterpillar Inc., and Caterpillar Financial Services Corporation, the financial institutions named therein, Citibank, N.A., BofA Securities, Inc., JP Morgan Chase Bank, and Société Générale (incorporated by reference from Exhibit 10.1 to the Company’s Current Report on Form 8-K filed on April 24, 2020) | |
| | 10.50 | SecondThird Amended and Restated Credit Agreement (3-Year Facility) dated September 5, 2019,1, 2022, among the Company, Caterpillar Financial Services Corporation, Caterpillar International Finance Designated Activity Company and Caterpillar Finance Kabushiki Kaisha, certain financial institutions named therein, Citibank, N.A., as Agent, Citibank Europe plc, UK Branch, as Local Currency Agent, and MUFG Bank, LTD., as Japan Local Currency Agent (incorporated by reference from Exhibit 10.4 to the Company’s Current Report on Form 8-K filed September 10, 2019)6, 2022) | |
| | 10.51 | Amendment No. 1toSecond Amended and Restated Credit Agreement (3-Year Facility), Amendment No. 1 to Local Currency Addendum and Amendment No. 1 to Japan Local Currency Addendum, dated September 2, 2021, among the Company, Caterpillar Financial Services Corporation, Caterpillar International Finance Designated Activity Company and Caterpillar Finance Kabushiki Kaisha, certain financial institutions named therein, Citibank, N.A., as Agent, Citibank Europe plc, UK Branch, as Local Currency Agent, and MUFG Bank, LTD., as Japan Local Currency Agent (incorporated by reference from Exhibit 10.4 to Company's Quarterly Report on Form 10-Q for the quarter ended September 30, 2021) | |
| | 10.5210.43 | Local Currency Addendum to the 3-Year Facility dated September 5, 2019,1, 2022, among Caterpillar Financial Services Corporation, Caterpillar International Finance Designated Activity Company, the Local Currency Banks named therein, Citibank, N.A., as Agent, and Citibank Europe plc, UK Branch, as Local Currency Agent (incorporated by reference from Exhibit 10.5 to the Company’s Current Report on Form 8-K filed September 10, 2019)6, 2022) | |
| | 10.5310.44 | Japan Local Currency Addendum to the 3-Year Facility dated September 5, 2019,1, 2022, among Caterpillar Financial Services Corporation, Caterpillar Finance Kabushiki Kaisha, the Japan Local Currency Banks named therein, Citibank, N.A., as Agent, and MUFG Bank, Ltd., as Japan Local Currency Agent (incorporated by reference from Exhibit 10.6 to the Company’s Current Report on Form 8-K filed September 10, 2019)6, 2022) | |
| | 10.5410.45 | | |
| | 10.46 | Third Amended and Restated Credit Agreement (5-Year Facility) dated September 5, 2019,1, 2022, among the Company, Caterpillar Financial Services Corporation, Caterpillar International Finance Designated Activity Company and Caterpillar Finance Kabushiki Kaisha, certain financial institutions named therein, Citibank, N.A., as Agent, Citibank Europe plc, UK Branch, as Local Currency Agent, and MUFG Bank, LTD., as Japan Local Currency Agent (incorporated by reference from Exhibit 10.7 to the Company’s Current Report on Form 8-K filed September 10, 2019)6, 2022) | |
| | 10.55 | Amendment No. 1 to Second Amended and Restated Credit Agreement (Five-Year Facility), Amendment No. 1 to Local Currency Addendum and Amendment No. 1 to Japan Local Currency Addendum, dated as of September 2, 2021, among Caterpillar Inc., Caterpillar Financial Services Corporation, Caterpillar International Finance Designated Activity Company, and Caterpillar Finance Kabushiki Kaisha, certain financial institutions named therein, Citibank, N.A., as agent, Citibank Europe PLC, UK Branch, as Local Currency Agent, and MUFG Bank, Ltd. as Japan Local Currency Agent (incorporated by reference from Exhibit 10.5 to the Company's Current Report on Form 8-K filed on September 8, 2021) | |
| | 10.5610.47 | Local Currency Addendum to the Five-Year Facility dated September 5, 2019,1, 2022, among Caterpillar Financial Services Corporation, Caterpillar International Finance Designated Activity Company, the Local Currency Banks named therein, Citibank, N.A., as Agent, and Citibank Europe plc, UK Branch, as Local Currency Agent (incorporated by reference from Exhibit 10.8 to the Company’s Current Report on Form 8-K, filed September 10, 2019)6, 2022) | |
| | 10.5710.48 | Japan Local Currency Addendum to the 5-Year Facility dated September 5, 2019,1, 2022, among Caterpillar Financial Services Corporation, Caterpillar Finance Kabushiki Kaisha, the Japan Local Currency Banks named therein, Citibank, N.A., as Agent, and MUFG Bank, Ltd., as Japan Local Currency Agent (incorporated by reference from Exhibit 10.9 to the Company’s Current Report on Form 8-K, filed September 10, 2019)6, 2022) | |
| | 10.5810.49 | | |
| | 10.50 | | |
| | 10.51 |
| |
| | 10.52 | | |
| | 10.53 | | |
| | 10.54 | | |
| | 10.55 | | |
| | 21 | | |
| | | | | | | | | | | | |
| | 31.2 | | |
| | 32 | | |
| | 97 | | |
| | 101.INS | Inline XBRL Instance Document (the instance document does not appear in the Interactive Data File because its XBRL tags are imbedded within the Inline XBRL document) | |
| | 101.SCH | Inline XBRL Taxonomy Extension Schema Document | |
| | 101.CAL | Inline XBRL Taxonomy Extension Calculation Linkbase Document | |
| | 101.DEF | Inline XBRL Taxonomy Extension Definition Linkbase Document | |
| | 101.LAB | Inline XBRL Taxonomy Extension Label Linkbase Document | |
| | 101.PRE | Inline XBRL Taxonomy Extension Presentation Linkbase Document | |
| | 104 | Cover Page Interactive File (embedded within the Inline XBRL document and included in Exhibit 101) | |
_________________________________________*Management contracts and compensatory plans and arrangements required to be filed as exhibits pursuant to Item 15(b) of this report.
The agreements and other documents filed as exhibits to this report are not intended to provide factual information or other disclosure other than with respect to the terms of the agreements or other documents themselves, and you should not rely on them for that purpose. In particular, any representations and warranties made by us in these agreements or other documents were made solely within the specific context of the relevant agreement or document and may not describe the actual state of affairs as of the date they were made or at any other time.
Item 16. Form 10-K Summary.
None.
Form 10-K
SIGNATURES
Pursuant to the requirements of Section 13 or 15(d) of the Securities Exchange Act of 1934, the registrant has duly caused this report to be signed on its behalf by the undersigned, thereunto duly authorized.
| | | | | | | | |
| | CATERPILLAR INC. |
| | Registrant |
| | |
February 16, 20222024 | By: | /s/ Suzette M. LongDerek Owens |
| | | Suzette M. LongDerek Owens |
| | Chief Legal Officer and General Counsel |
Pursuant to the requirements of the Securities Exchange Act of 1934, this report has been signed below by the following persons on behalf of the Registrant and in the capacities and on the dates indicated.
| | | | | | | | |
| | | Chairman of the Board
and Chief Executive Officer |
February 16, 20222024 | /s/ D. James Umpleby III |
| | D. James Umpleby III | |
| | | |
| | |
February 16, 20222024 | /s/ Andrew R.J. Bonfield | Chief Financial Officer |
| Andrew R.J. Bonfield
| |
| | |
| | | |
February 16, 20222024 | /s/ G. Michael MarvelWilliam E. Schaupp | Vice President and
Chief Accounting Officer |
| | G. Michael MarvelWilliam E. Schaupp | |
| | |
| | |
February 16, 2022 | /s/ Kelly A. Ayotte | Director |
| Kelly A. Ayotte | |
| | |
| | |
February 16, 20222024 | /s/ David L. Calhoun | Presiding Director |
| | David L. Calhoun | |
| | | |
| | | |
| | | | | | | | |
February 16, 20222024 | /s/ Daniel M. Dickinson | Director |
| | Daniel M. Dickinson | |
| | |
| | |
| | | | | | | | |
| February 16, 2024 | /s/ James C. Fish, Jr. | Director |
| James Fish | |
| | | |
| | |
February 16, 20222024 | /s/ Gerald Johnson | Director |
| | Gerald Johnson | |
| | |
| | |
| | |
| | | |
February 16, 20222024 | /s/ David W. MacLennan | Director |
| | David W. MacLennan | |
| | |
| | |
| | |
February 16, 20222024 | /s/ Judith F. Marks | Director |
| Judith Marks | |
| | |
| | |
| February 16, 2024 | /s/ Debra L. Reed-Klages | Presiding Director |
| Debra L. Reed-Klages | |
| | |
| | | |
February 16, 2022 | /s/ Edward B. Rust, Jr. | Director |
| Edward B. Rust, Jr. | |
| | |
| | |
February 16, 20222024 | /s/ Susan C. Schwab | Director |
| | Susan C. Schwab | |
| | | |
| | |
| | | |
February 16, 2022 | /s/ Miles D. White | Director |
| Miles D. White | |
| | |
| | |
February 16, 20222024 | /s/ Rayford Wilkins, Jr. | Director |
| Rayford Wilkins, Jr. | |
| | |
| | |