UNITED STATES
SECURITIES AND EXCHANGE COMMISSION
Washington, D.C. 20549
FORM 10-K
ANNUAL REPORT PURSUANT TO SECTION 13 OR 15 (d) OF THE
SECURITIES EXCHANGE ACT OF 1934
For the Fiscal Year Ended December 31, 20112012 — Commission File No. 0-2989
COMMERCE BANCSHARES, INC.
(Exact name of registrant as specified in its charter)
|
| | |
| Missouri | | 43-0889454 |
| (State of Incorporation) | | (IRS Employer Identification No.) |
1000 Walnut,
| | |
Kansas City, MO
| | 64106 (Zip Code) |
| (Address of principal executive offices) | | (Zip Code) |
| (816) 234-2000 | | |
| (Registrant’s telephone number, including area code) | | |
|
| | |
| Securities registered pursuant to Section 12(b) of the Act: |
| | | |
TItleTitle of class | | Name of exchange on which registered |
| $5 Par Value Common Stock | | NASDAQ Global Select Market |
| | | |
| Securities registered pursuant to Section 12(g) of the Act: |
NONE
Indicate by check mark if the Registrant is a well-known seasoned issuer, as defined in Rule 405 of the Securities Act. Yes þ No o
Indicate by check mark if the Registrant is not required to file reports pursuant to Section 13 or 15(d) of the Act. Yes o No þ
Indicate by check mark whether the Registrant (1) has filed all reports required to be filed by Section 13 or 15(d) of the Securities Exchange Act of 1934 during the preceding 12 months (or for such shorter period that the Registrant was required to file such reports), and (2) has been subject to such filing requirements for the past 90 days. Yes þ No o
Indicate by check mark whether the registrant has submitted electronically and posted on its corporate Web site, if any, every Interactive Data File required to be submitted and posted pursuant to Rule 405 of Regulation S-T (§232.405 of this chapter) during the preceding 12 months (or for such shorter period that the registrant was required to submit and post such files). Yes þ No o
Indicate by check mark if disclosure of delinquent filers pursuant to Item 405 of Regulation S-K (§229.405 of this chapter) is not contained herein, and will not be contained, to the best of Registrant’s knowledge, in definitive proxy or information statements incorporated by reference in Part III of this Form 10-K or any amendment to this Form 10-K. o
Indicate by checkmarkcheck mark whether the Registrant is a large accelerated filer, an accelerated filer, a non-accelerated filer, or a smaller reporting company. See the definitions of “large accelerated filer,” “accelerated filer” and “smaller reporting company” in Rule 12b-2 of the Act. (Check one):
|
| | | |
Large accelerated filer þ | Accelerated filer o | Non-accelerated filer o | Smaller reporting company o |
| | | (Do not check if a smaller reporting company) | |
Indicate by check mark whether the Registrant is a shell company (as defined in Rule 12b-2 of the Exchange Act). Yes o No þ
As of June 30, 20112012, the aggregate market value of the voting stock held by non-affiliates of the Registrant was approximately $3,322,000,0002,949,000,000.
As of February 6, 20128, 2013, there were 88,963,09190,689,096 shares of Registrant’s $5 Par Value Common Stock outstanding.
DOCUMENTS INCORPORATED BY REFERENCE
Portions of the Registrant’s definitive proxy statement for its 20122013 annual meeting of shareholders, which will be filed within 120 days of December 31, 2011,2012, are incorporated by reference into Part III of this Report.
|
| | | |
| Commerce Bancshares, Inc. | | |
| | | | |
| Form 10-K | | | |
| | | | |
| INDEX | | | Page |
| | | | |
| | | |
| | | | |
| | | | |
| | | | |
| | | | |
| | | | |
| | | | |
| | | | |
| | | | |
| | | | |
| | | | |
| | | | |
| | | | |
| | | |
| | | | |
| | | | |
| | | | |
| | | | |
| | | | |
| | | | |
| | | | |
| | | | |
| | | | |
| | | | |
| | | | |
| | | | |
| | | | |
| | | | |
| | | | |
| | | | |
| | | |
| | | | |
| | | | |
| | | | |
| | | | |
| | | | |
| | | | |
| | | | |
| | | | |
| | | | |
| | | | |
| | | |
| | | | |
| |
| | |
| |
PART I
General
Commerce Bancshares, Inc., a bank holding company as defined in the Bank Holding Company Act of 1956, as amended, was incorporated under the laws of Missouri on August 4, 1966. Through a second tier wholly-owned bank holding company, it owns all of the outstanding capital stock of Commerce Bank (the “Bank”), which is headquartered in Missouri. The Bank engages in general banking business, providing a broad range of retail, corporate, investment, trust, and asset management products and services to individuals and businesses. Commerce Bancshares, Inc. also owns, directly or through the Bank, various non-banking subsidiaries. Their activities include underwriting credit life and credit accident and health insurance, selling property and casualty insurance (relating to consumer loans made by the Bank), private equity investment, securities brokerage, mortgage banking, and leasing activities. A list of Commerce Bancshares, Inc.'s subsidiaries is included as Exhibit 21.
In June 2011, the Bank, which formerly was a national banking association, became a state chartered Federal Reserve member bank. The Bank’s main regulator was changed from the Office of the Comptroller of the Currency to supervision by both the Federal Reserve Bank of Kansas City and the Missouri Division of Finance. The Bank’s deposits continue to be fully insured by the FDIC in accordance with applicable laws and regulations.
Commerce Bancshares, Inc. and its subsidiaries, (collectively, the "Company") is one of the nation’s top 50 bank holding companies, based on asset size. At December 31, 20112012, the Company had consolidated assets of $20.622.2 billion, loans of $9.29.8 billion, deposits of $16.818.3 billion, and equity of $2.2 billion. All of the Company’s operations conducted by its subsidiaries are consolidated for purposes of preparing the Company’s consolidated financial statements. The Company does not utilize unconsolidated subsidiaries or special purpose entities to provide off-balance sheet borrowings or securitizations.
The Company’s goal is to be the preferred provider of targeted financial services in its communities, based on strong customer relationships. It believes in building long-term relationships based on top quality service, a strong risk management culture, and a strong balance sheet with industry-leading capital levels. The Company operates under a super-community banking format which incoporatesincorporates large bank product offerings coupled with deep local market knowledge, augmented by experienced, centralized support in select critical areas. The Company’s focus on local markets is supported by thean experienced team of managers assigned to each market and is also reflected in its financial centers and regional advisory boards, which are comprised of local business persons, professionals and other community representatives, who assist the Company in responding to local banking needs. In addition to this local market, community-based focus, the Company offers sophisticated financial products available at much larger financial institutions.
The Company's banking facilities are located throughout Missouri, Kansas, and central Illinois, as well as Tulsa, Oklahoma and Denver, Colorado. Its two largest markets include St. Louis and Kansas City, which serve as the central hubs for the entire company.Company.
The markets the Bank serves, being located in the lower Midwest, provide natural sites for production and distribution facilities and also serve as transportation hubs. The economy has been well-diversified in these markets with many major industries represented, including telecommunications, automobile, aircraft and general manufacturing, health care, numerous service industries, food production, and agricultural production and related industries. In addition, several of the Illinois markets are located in areas with some of the most productive farmland in the world. The real estate lending operations of the Bank are centered in its lower Midwestern markets. Historically, these markets have generally tended to be less volatile than in other parts of the country. While the decline in the national real estate market resulted in significantly higher real estate loan losses during 2009, 2010 and 2011recent years for the banking industry, management believes the diversity and nature of the Bank’s markets has resulted in lower real estate loan losses in these markets and is a key factor in the Bank’s relatively lower loan loss levels.levels during this period.
From time to time, the Company evaluates the potential acquisition of various financial institutions. In addition, the Company regularly considers the potential disposition of certain of its assets and branches. The Company seeks merger or acquisition partners that are culturally similar, have experienced management and possess either significant market presence or have potential for improved profitability through financial management, economies of scale and expanded services. The Company has not transacted any significant acquisitions or sales during the past several years.
The Company employed 4,270 persons on a full-time basis and 608 persons on a part-time basis at December 31, 2012. The Company provides a variety of benefit programs including a 401(k) plan as well as group life, health, accident, and other insurance. The Company also maintains training and educational programs designed to address the significant and changing regulations facing the financial services industry and prepare employees for positions of increasing responsibility.
Competition
The Company faces intense competition from hundreds of financial service providers. It competes with national and state banks for deposits, loans and trust accounts, and with savings and loan associations and credit unions for deposits and consumer lending products. In addition, the Company competes with other financial intermediaries such as securities brokers and dealers, personal loan companies, insurance companies, finance companies, and certain governmental agencies. With the passage of the
Gramm-Leach-Bliley Financial Modernization Act of 1999, competition has increased over time from institutions not subject to the same regulatory restrictions as domestic banks and bank holding companies. The Company generally competes on the basis of customer service and responsiveness to customer needs, reputation, interest rates on loans and deposits, lending limits, and customer convenience, such as location of offices. The Company has approximately 13% of the deposit market share in Kansas City and approximately 9% of the deposit market share in St. Louis.
Operating Segments
The Company is managed in three operating segments. The Consumer segment includes the retail branch network, consumer installment lending, personal mortgage banking, consumer debit and credit bank card activities. It provides services through a network of 201204 full-service branches, a widespread ATM network of 405403 machines, and the use of alternative delivery channels
such as extensive online banking and telephone banking services. In 2011,2012, this retail segment contributed 27%23% of total segment pre-tax income. The Commercial segment provides a full array of corporate lending, merchant and commercial bank card products, leasing, and international services, as well as business and government deposit and cash management services. Fixed income investments are sold to individuals and institutional investors through the Capital Markets Group, which is also included in this segment. In 2011,2012, the Commercial segment contributed 58%63% of total segment pre-tax income. The Wealth segment provides traditional trust and estate tax planning services, brokerage services, and advisory and discretionary investment portfolio management services to both personal and institutional corporate customers. This segment also manages the Company’s family of proprietary mutual funds, which are available for sale to both trust and general retail customers. At December 31, 20112012, the Wealth segment managed investments with a market value of $14.9$17.0 billion and administered an additional $12.4$13.3 billion in non-managed assets. Additional information relating to operating segments can be found on pages 4745 and 89.88.
Government Policies
The Company's operations are affected by federal and state legislative changes, by the United States government, and by policies of various regulatory authorities, including those of the numerous states in which they operate. These include, for example, the statutory minimum legal lending rates, domestic monetary policies of the Board of Governors of the Federal Reserve System, United States fiscal policy, international currency regulations and monetary policies, the U.S. Patriot Act, and capital adequacy and liquidity constraints imposed by federal and state bank regulatory agencies.
Supervision and Regulation
The following information summarizes existing laws and regulations that materially affect the Company's operations. It does not discuss all provisions of these laws and regulations and it does not include all laws and regulations that affect the Company presently or may affect the Company in the future.
General
The Company, as a bank holding company, is primarily regulated by the Board of Governors of the Federal Reserve System under the Bank Holding Company Act of 1956 (BHC Act). Under the BHC Act, the Federal Reserve Board’s prior approval is required in any case in which the Company proposes to acquire all or substantially all of the assets of any bank, acquire direct or indirect ownership or control of more than 5% of the voting shares of any bank, or merge or consolidate with any other bank holding company. With certain exceptions, the BHC Act also prohibits the Company from acquiring direct or indirect ownership or control of more than 5% of any class of voting shares of any non-banking company. Under the BHC Act, the Company may not engage in any business other than managing and controlling banks or furnishing certain specified services to subsidiaries and may not acquire voting control of non-banking companies unless the Federal Reserve Board determines such businesses and services to be closely related to banking. When reviewing bank acquisition applications for approval, the Federal Reserve Board considers, among other things, the Bank’s record in meeting the credit needs of the communities it serves in accordance with the Community Reinvestment Act of 1977, as amended (CRA). Under the terms of the CRA, banks have a continuing obligation, consistent with safe and sound operation, to help meet the credit needs of their communities, including providing credit to individuals residing in low- and moderate-income areas. The Bank has a current CRA rating of “outstanding”.
The Company is required to file with the Federal Reserve Board various reports and additional information the Federal Reserve Board may require. The Federal Reserve Board also makes regular examinations of the Company and its subsidiaries. The Company’s banking subsidiary is a state chartered Federal Reserve member bank and is subject to regulation, supervision and examination by the Federal Reserve Bank of Kansas City and the State of Missouri Division of Finance. The Bank is also subject to regulation by the Federal Deposit Insurance Corporation (FDIC). In addition, there are numerous other federal and state laws and regulations which control the activities of the Company and the Bank, including requirements and limitations relating to capital and reserve requirements, permissible investments and lines of business, transactions with affiliates, loan limits, mergers and acquisitions, issuance of securities, dividend payments, and extensions of credit. If the Company fails to comply with these or other applicable laws and regulations, it may be subject to civil monetary penalties, imposition of cease and desist orders or other
written directives, removal of management and, in certain circumstances, criminal penalties. This regulatory framework is intended primarily for the protection of depositors and the preservation of the federal deposit insurance funds, not for the protection of security holders. Statutory and regulatory controls increase a bank holding company’s cost of doing business and limit the options of its management to employ assets and maximize income.
In addition to its regulatory powers, the Federal Reserve Bank affects the conditions under which the Company operates by its influence over the national supply of bank credit. The Federal Reserve Board employs open market operations in U.S. government securities and oversees changes in the discount rate on bank borrowings, changes in the federal funds rate on overnight inter-bank borrowings, and changes in reserve requirements on bank deposits in implementing its monetary policy objectives. These methods are used in varying combinations to influence the overall level of the interest rates charged on loans and paid for deposits, the price of the dollar in foreign exchange markets, and the level of inflation. The monetary policies of the Federal Reserve have a significant effect on the operating results of financial institutions, most notably on the interest rate environment. In view of changing conditions in the national economy and in the money markets, as well as the effect of credit policies of monetary and fiscal authorities, no prediction can be made as to possible future changes in interest rates, deposit levels or loan demand, or their effect on the financial statements of the Company.
The financial industry operates under laws and regulations that are under constant review by various agencies and legislatures and are subject to sweeping change. The Company currently operates as a bank holding company, as defined by the Gramm-Leach-Bliley Financial Modernization Act of 1999 (GLB Act), and the Bank qualifies as a financial subsidiary under the Act, which allows it to engage in investment banking, insurance agency, brokerage, and underwriting activities that were not available to banks prior to the GLB Act. The GLB Act also included privacy provisions that limit banks’ abilities to disclose non-public information about customers to non-affiliated entities.
The Company must also comply with the requirements of the Bank Secrecy Act (BSA). The BSA is designed to help fight drug trafficking, money laundering, and other crimes. Compliance is monitored by the Federal Reserve. The BSA was enacted to prevent banks and other financial service providers from being used as intermediaries for, or to hide the transfer or deposit of money derived from, criminal activity. Since its passage, the BSA has been amended several times. These amendments include the Money Laundering Control Act of 1986. which made money laundering a criminal act, as well as the Money Laundering Suppression Act of 1994 which required regulators to develop enhanced examination procedures and increased examiner training to improve the identification of money laundering schemes in financial institutions.
The USA PATRIOT Act, established in 2001. substantially broadened the scope of U.S. anti-money laundering laws and regulations by imposing significant new compliance and due diligence obligations, creating new crimes and penalties and expanding the extra-territorial jurisdiction of the United States. The regulations impose obligations on financial institutions to maintain appropriate policies, procedures and controls to detect, prevent and report money laundering and terrorist financing, and the regulations include significant penalties for non-compliance.
Subsidiary Bank
Under Federal Reserve policy, the bank holding company, Commerce Bancshares, Inc. (the "Parent"), is expected to act as a source of financial strength to its bank subsidiary and to commit resources to support it in circumstances when it might not otherwise do so. In addition, any capital loans by a bank holding company to any of its subsidiary banks are subordinate in right of payment to deposits and to certain other indebtedness of such subsidiary banks. In the event of a bank holding company’s bankruptcy, any commitment by the bank holding company to a federal bank regulatory agency to maintain the capital of a subsidiary bank will be assumed by the bankruptcy trustee and entitled to a priority of payment.
Substantially all of the deposits of the Bank are insured up to the applicable limits by the Bank Insurance Fund of the FDIC, generally up to $250,000 per depositor, for each account ownership category. Through December 31, 2012, all non-interest bearing transaction accounts are fully guaranteed by the FDIC for the entire amount of the account. The Bank pays deposit insurance premiums to the FDIC based on an assessment rate established by the FDIC for Bank Insurance Fund member institutions. The FDIC has established a risk-based assessment system under which institutions are classified and pay premiums according to their perceived risk to the federal deposit insurance funds. In February 2011, under the provisions of the Dodd-Frank Wall Street Reform and Consumer Protection Act, (discussed further below), the FDIC issued a final rule changing its assessment base from total domestic deposits to average total assets minus average tangible equity. The rule altered other adjustments in the current assessment system for heavy use of unsecured liabilities, secured liabilities and brokered deposits, and added an adjustment for holdings of unsecured bank debt. For banks with more than $10 billion in assets, the FDIC 's new rule changed the assessment rate, abandoning the previous method for determining premiums, which were based on bank supervisory ratings, debt issuer ratings and financial ratios. Instead, the new rule reliesinstead relying on a scorecard designed to measure financial performance and ability to withstand stress, in addition to measuring the FDIC’s exposure should the bank fail. The new rule was effective for quarters beginning April 1, 2011. Because the Company has maintained a strong balance sheet with solid amounts of capital and has not offered many of the complex financial
products that were prevalent in the marketplace, the risk-based FDIC insurance assessments under the new methods were less than amounts calculated under the old assessment methods. Accordingly, the Company's FDIC insurance expense in 20112012 was $13.1$10.4 million, a decrease of $6.1$2.7 million as compared to 2010.FDIC expense in 2011. In late 2009, member institutions were required to prepay their quarterly FDIC premiums. The Bank made a prepayment of $68.7 million in 2009, and the current unused balance at December 31, 2012 was $25.4 million. A refund of the unused balance is expected to be received in the second quarter of 2013.
Payment of Dividends
The Federal Reserve Board may prohibit the payment of cash dividends to shareholders by bank holding companies if their actions constitute unsafe or unsound practices. The principal source of the Parent's cash revenues is cash dividends paid by the Bank. The amount of dividends paid by the Bank in any calendar year is limited to the net profit of the current year combined with the retained net profits of the preceding two years, and permission must be obtained from the Federal Reserve Board for dividends exceeding these amounts. The payment of dividends by the Bank may also be affected by factors such as the maintenance of adequate capital.
Capital Adequacy
The Company is required to comply with the capital adequacy standards established by the Federal Reserve. These capital adequacy guidelines generally require bank holding companies to maintain minimum total capital equal to 8% of total risk-adjusted assets and off-balance sheet items (the “Total Risk-Based Capital Ratio”), with at least one-half of that amount consisting of Tier I, or core capital, and the remaining amount consisting of Tier II, or supplementary capital. Tier I capital for bank holding companies generally consists of the sum of common shareholders’ equity, qualifying non-cumulative perpetual preferred stock, a limited amount of qualifying cumulative perpetual preferred stock and minority interests in the equity accounts of consolidated subsidiaries, less goodwill and other non-qualifying intangible assets. Tier II capital generally consists of hybrid capital instruments, term subordinated debt and, subject to limitations, general allowances for loan losses. Assets are adjusted under the risk-based guidelines to take into account different risk characteristics.
In addition, the Federal Reserve also requires bank holding companies to comply with minimum leverage ratio requirements. The leverage ratio is the ratio of a banking organization’s Tier I capital to its total consolidated quarterly average assets (as defined for regulatory purposes), net of the allowance for loan losses, goodwill and certain other intangible assets. The minimum leverage ratio for bank holding companies is 4%. At December 31, 20112012, the CompanyBank was “well-capitalized” under regulatory capital adequacy standards, as further discussed on page 93.91.
In December 2010,June 2012, the Federal Reserve released for comment a proposal to enact in the United States the international agreement referred to as Basel Committee on Banking Supervision ("the Basel Committee") presented to the public the Basel III rules text, which proposes new global regulatory standards on bank capital adequacy and liquidity. The Basel Committee continued to refine Basel III during 2011 and seeks to strengthen global capital and liquidity rules with the goal of promoting a more resilient banking sector. The framework sets out tougher capital requirements, the introduction of a new leverage ratio calculation, higher requirements for minimum capital ratios, and higher risk-weightings for assets, as they relate to capital calculations. Basel III also establishes two minimum standards for liquidity to promote short-term resilience, as well as resilience over a longer period of time through a stable maturity structure of assets and liabilities.
III. Capital and liquidity standards consistent with Basel III will be formally implemented in the United States through a series of rulemakings.rules. The U.S. bank agencies intendproposed rules include higher capital requirements and would raise minimum capital levels, redefine the significant inputs to issuethe capital ratio calculation, and be phased in over a noticeperiod of years from 2013 through 2019. The initial comment period for the proposed rulemaking during the first quarter ofrules ended in October 2012, and a final rule later in November 2012, the year thateffective date for initial Basel III implementation was delayed. A new implementation date has yet to be announced. The Company believes its current capital ratios would implementbe higher than those required in the Basel III capital reforms. While it continues to evaluate the impact of this framework on its operations and reporting, the Company's capital ratios as of December 31, 2011 are well in excess of those minimum ratios proposedproposal issued by both Basel III and the Federal Reserve.
Recent Significant Legislation
The financial industry operates under laws and regulations that are under constant review by various agencies and legislatures and are subject to sweeping change. The Gramm-Leach-Bliley Financial Modernization Act of 1999 (GLB Act) contained major changes in laws that previously kept Affecting the banking industry largely separate from the securities and insurance industries. The GLB Act authorized the creation of a new kind of financial institution, known as a “financial holding company”, and a new kind of bank subsidiary, called a “financial subsidiary”, which may engage in a broader range of investment banking, insurance agency, brokerage, and underwriting activities. The GLB Act also included privacy provisions that limit banks’ abilities to disclose non-public information about customers to non-affiliated entities. Banking organizations are not required to become financial holding companies, but instead may continue to operate as bank holding companies, providing the same services they were authorized to provide prior to the enactment of the GLB Act. The Company currently operates as a bank holding company.
The Company must also comply with the requirements of the Bank Secrecy Act (BSA). The BSA is designed to help fight drug trafficking, money laundering, and other crimes. Compliance is monitored by the Federal Reserve. The BSA was enacted to prevent banks and other financial service providers from being used as intermediaries for, or to hide the transfer or deposit of money derived from, criminal activity. Since its passage, the BSA has been amended several times. These amendments include the Money Laundering Control Act of 1986 which made money laundering a criminal act, as well as the Money Laundering Suppression Act of 1994 which required regulators to develop enhanced examination procedures and increased examiner training to improve the identification of money laundering schemes in financial institutions.
In 2001, the Uniting and Strengthening America by Providing Appropriate Tools Required to Intercept and Obstruct Terrorism Act of 2001 (USA PATRIOT Act) was signed into law. The USA PATRIOT Act substantially broadened the scope of U.S. anti-money laundering laws and regulations by imposing significant new compliance and due diligence obligations, creating new crimes and penalties and expanding the extra-territorial jurisdiction of the United States. The U.S. Treasury Department issued a number of regulations implementing the USA PATRIOT Act that apply certain of its requirements to financial institutions such as the Company’s broker-dealer subsidiary. The regulations impose obligations on financial institutions to maintain appropriate policies, procedures and controls to detect, prevent and report money laundering and terrorist financing.
The Credit Card Accountability, Responsibility, and Disclosure Act of 2009 (the Credit CARD Act) was signed into law in May 2009. It is comprehensive credit card legislation that aims to establish fair and transparent practices relating to open end consumer credit plans. Included in the Credit CARD Act was an extension of payment periods (with no late fees) from 14 days to 21 days, the advance warning period for significant changes to credit card accounts was extended from 15 days to 45 days, and opt-out provisions were made available to customers. Additionally, the Credit CARD Act included provisions governing when rate increases can be applied on late accounts, requirements for clearer disclosures of terms before opening an account, and prohibitions on charging over-limit fees and double-cycle billing, as well as new rules related to interest rate reinstatements on formerly overdue accounts and gift card expiration dates and inactivity fees.
The Federal Reserve issued new regulations, effective July 1, 2010, which prohibited financial institutions from assessing fees for paying ATM and one-time debit card transactions that overdraw consumer accounts unless the consumer affirmatively consents to the financial institution’s overdraft practices. The Company implemented new procedures to solicit and capture required customer consents and, effective July 1, 2010, prohibited such ATM and one-time debit card transactions causing overdrafts, unless an opt-in consent has been received. As not all customers provided such consent, these new regulations resulted in lower deposit fee income for subsequent periods. For 2011, overdraft fees were $40.9 million, as compared to $51.1 million in 2010.
In March 2010, legislation was passed which expanded Pell Grants and Perkins Loan programs and required all colleges and universities to convert to direct lending programs with the U.S. government as of July 1, 2010. Previously, colleges and universities had the choice of participating in either direct lending with the U.S. government or a program whereby loans were originated by banks but guaranteed by the U.S. government. The Company terminated its guaranteed student loan origination business effective July 1, 2010 and sold most of its student loan portfolios in 2010.
In July 2010, the Dodd-Frank Wall Street Reform and Consumer Protection Act (Dodd-Frank Act) was signed into law. The Dodd-Frank Act is sweeping legislation intended to overhaul regulation of the financial services industry. Its goals are to establishindustry and requires rulemaking and reports over the next several years. Among its many provisions, the Dodd-Frank Act established a new council of “systemic risk” regulators, createcreated a new consumer protection division within the Federal Reserve, empowerempowers the Federal Reserve to supervise the largest, most complex financial companies, allowallows the government to seize and liquidate failing financial companies, and givegives regulators new powers to oversee the derivatives market. The provisions of the Dodd-Frank Act are so extensive that full implementation may require several years, and an assessment of its full effect on the Company is not possible at this time.
In June 2011, the Federal Reserve, under the provisions of the Dodd-Frank Act, approved a final debit card interchange rule that significantly limits the amount of debit card interchange fees charged by banks. The new rule caps an issuer’s base fee at 21 cents per transaction and allows additional fees to help cover fraud losses. The new pricing is a reduction of approximately 45% when compared to previous market rates. The new rule also limits network exclusivity, requiring issuers to ensure that a debit card transaction can be carried on two unaffiliated networks: one signature-based and one PIN-based. The new rules apply to bank issuers with more than $10 billion in assets and taketook effect in phases, with the base fee cap effective October 1, 2011 and the network exclusivity rule effective on April 1, 2012. As a result of this rule, the Company's debit card revenues declined approximately $7.1 million in the fourth quarter of 2011 as compared to the third quarter of 2011.
The Dodd-Frank Act also established the Consumer Financial Protection Bureau (CFPB) and authorizes it to supervise certain consumer financial services companies and large depository institutions and their affiliates for consumer protection purposes.
Subject to the provisions of the Act, the CFPB has responsibility to implement, examine for compliance with, and enforce “Federal consumer financial law.” As a depository institution, the Company will be subject to examinations by the CFPB, which will focus on the Company’s ability to detect, prevent, and correct practices that present a significant risk of violating the law and causing consumer harm.
In December 2011,October 2012, the Federal Reserve, Board issued proposed rulesas required by the Dodd-Frank Act, approved new stress testing regulations applicable to strengthen regulation and supervision of large bank holdingcertain financial companies and systemically important nonbank financial firms. The proposal applies to all U.S. bank holding companies with total consolidated assets of $50 billion or more with some provisions affecting banks withthan $10 billion or morebut less than $50 billion. The rule requires that these financial companies, including Commerce Bancshares, conduct stress tests on an annual basis. The stress tests will have an as-of date of September 30, 2013 using scenarios provided by the Federal Reserve in assets. These rules are meant to implementNovember of the Dodd-Frank Act's sections 165same year, and 166. The proposed rules include a wide range of measures in areas such as capital, liquidity, credit exposure, stress testing, risk management, and early remediation requirements. As a bank holding company with $10 billion or more in assets, the rules would require that the Company create a risk committeeis required to submit regulatory reports to the Federal Reserve on its stress tests by March 31, 2014. During June 2015, the Company will be required to make public disclosures of the Boardresults of Directors and chief risk officer,tests performed as well as require that the Company conduct its own annual stress-tests and publish a summary of the results.September 30, 2014.
Competition
The Company’s locations in regional markets throughout Missouri, Kansas, central Illinois, Tulsa, Oklahoma, and Denver, Colorado face intense competition from hundreds of financial service providers. The Company competes with national and state banks for deposits, loans and trust accounts, and with savings and loan associations and credit unions for deposits and consumer lending products. In addition, the Company competes with other financial intermediaries such as securities brokers and dealers, personal loan companies, insurance companies, finance companies, and certain governmental agencies. The passage of the GLB Act, which removed barriers between banking and the securities and insurance industries, has resulted in greater competition among these industries. The Company generally competes on the basis of customer service and responsiveness to customer needs, interest rates on loans and deposits, lending limits, and customer convenience, such as location of offices. Within the St. Louis and Kansas City, Missouri markets, the Company has approximately 9% of deposit market share.
Employees
The Company and its subsidiaries employed 4,237 persons on a full-time basis and 623 persons on a part-time basis at December 31, 2011. The Company provides a variety of benefit programs including a 401K plan as well as group life, health, accident, and other insurance. The Company also maintains training and educational programs designed to prepare employees for positions of increasing responsibility.
Available Information
The Company’s principal offices are located at 1000 Walnut, Kansas City, Missouri (telephone number 816-234-2000). The Company makes available free of charge, through its Web site at www.commercebank.com, reports filed with the Securities and Exchange Commission as soon as reasonably practicable after the electronic filing. These filings include the annual report on Form 10-K, quarterly reports on Form 10-Q, current reports on Form 8-K, and all amendments to those reports.
Statistical Disclosure
The information required by Securities Act Guide 3 — “Statistical Disclosure by Bank Holding Companies” is located on the pages noted below.
|
| | | | |
| | | | Page |
| I. | | Distribution of Assets, Liabilities and Stockholders’ Equity; Interest Rates and Interest Differential | 21, 52-5520, 50-53 |
|
| II. | | Investment Portfolio | 36-38,35-37, 73-78 |
|
| III. | | Loan Portfolio | |
| | | Types of Loans | 25 |
|
| | | Maturities and Sensitivities of Loans to Changes in Interest Rates | 2625 |
|
| | | Risk Elements | 31-3630-35 |
|
| IV. | | Summary of Loan Loss Experience | 29-3128-30 |
|
| V. | | Deposits | 52,50, 79-80 |
|
| VI. | | Return on Equity and Assets | 1716 |
|
| VII. | | Short-Term Borrowings | 80 |
|
Making or continuing an investment in securities issued by Commerce Bancshares, Inc., including its common stock, involves certain risks that you should carefully consider. If any of the following risks actually occur, its business, financial condition or results of operations could be negatively affected, the market price for your securities could decline, and you could lose all or a part of your investment. Further, to the extent that any of the information contained in this Annual Report on Form 10-K constitutes forward-looking statements, the risk factors set forth below also are cautionary statements identifying important factors that could cause the Company’s actual results to differ materially from those expressed in any forward-looking statements made by or on behalf of Commerce Bancshares, Inc.
Difficult market conditions have adversely affected the Company’s industry and may continue to do so.
Given the concentration of the Company’s banking business in the United States, it is particularly exposed to downturns in the U.S. economy. The economic trends which began in 2008, such as declines in the housing market (e.g., falling home prices and increasing foreclosures), unemployment and under-employment, have negatively impacted the credit performance of mortgage loans and resulted in significant write-downs of asset values by financial institutions, including government-sponsored entities as well as major commercial and investment banks. These write-downs, initially of mortgage-backed securities and other complex financial instruments, but spreading to various classes of real estate, commercial and consumer loans in turn, have caused many financial institutions to seek additional capital, to merge with larger and stronger institutions and, in some cases, to fail. Reflecting concern about the stability of the financial markets generally and the strength of counterparties, many lenders and institutional investors have reduced or ceased providing funding to borrowers.institutions. The weak U.S. economy and tightening of credit during recent years led to a lack of consumer confidence, increased market volatility and widespread reduction of business activity generally. The resulting economic pressure on consumers and lack of confidence in the financial markets has adversely affected the Company’s business, financial condition and results of operations through higher levels of loan losses and lower loan demand. WhileMore recently, the economy has seen improvementbegun to stabilize. The housing market has improved over recent years, and asset write-downs have slowed. However, there remain risks that could undermine the more recent improvements in the past year, significant uncertainty remains and management does not expect significant economic growth in the near future.economy's stabilization.
In particular, the Company may face the following risks in connection with these market conditions:
Unemployment has improved over recent years but remains at historically high levels. Continued high unemployment levels and weak economic activity and other market developments may affect consumer confidence levels and may cause declines in consumer credit usage, adverse changes in payment patterns, and higher loan delinquencies and default rates. These could impact the Company’s future loan losses and provision for loan losses, as a significant part of the Company’s business includes consumer and credit card lending.
Reduced levels of economic activity may also cause declines in financial service transactions, including bank card, corporate cash management and other fee businesses, as well as the fees earned by the Company on such transactions.
The Company’s ability to assess the creditworthiness of its customers may be impaired if the models and approaches it uses to select, manage, and underwrite its customers become less predictive of future behaviors, causing higher future credit losses.
The process used to estimate losses inherent in the Company’s loan portfolio requires difficult, subjective, and complex judgments, including forecasts of economic conditions and how these economic predictions might impair the ability of
its borrowers to repay their loans. If an instance occurs that renders these predictions no longer capable of accurate estimation, this may in turn impact the reliability of the process.
Competition in the industry could intensify as a result of the increasing consolidation of financial services companies in connection with current market conditions, thereby reducing market prices for various products and services which could in turn reduce Company revenues.
Though bank failures slowed during 2011 and 2012 as compared to 2009 and 2010, failures during this period remained higher than historical levels. Due to higher bank failures in recent years and continued uncertainty about the future, the Company may be required to pay high levels of FDIC premiums for extended periods of time.
The U.S. economy is also affected by foreign economic events, such as the European debt crisis that developed during the past year. Although the Company does not hold foreign debt, global conditions affecting interest rates, business export activity, capital expenditures by businesses, and investor confidence may negatively affect the Company by means of reduced loan demand or reduced transaction volume with the Company.
The United States is faced with large debts outstanding and a significant debate by Congress on how to address this situation. Automatic spending cuts scheduled by law to go into effect in March2013, or revisions to this law by Congress, could result in lower government spending and thus slow economic growth in the short-term. Should this occur, unemployment could increase, demand for business and consumer loans and other financial products could decline, and credit losses could increase, thus reducing the Company's profitability.
Significant changes in banking laws and regulations could materially affect the Company’s business.
As a result of the recent banking crisis, a significant increase in bank regulation has occurred. A number of new laws and regulations have already been implemented, including those which reduce overdraft fees, credit card revenues, and revenues from student lending activities. These recently adopted regulations have resulted in lower revenues and higher operating costs. As discussed in Item 1, the Dodd-Frank Act passed in July 2010. The Act2010 contains significant new and complex regulations for all financial institutions. Among its many provisions are rules which establishestablished a new council of “systemic risk” regulators, createcreated a new consumer protection division within the Federal Reserve, empower the Federal Reserve to supervise the largest, most complex financial companies, allow the government to seize and liquidate failing financial companies, and give regulators new powers to oversee the derivatives market. The Dodd-Frank Act also mandated new rules on debit card interchange fees, as discussed previously.
Because the Company has maintained a strong balance sheet and has not offered many of the complex financial products that were prevalent in the marketplace, there are a number of provisions within the Dodd-Frank Act, including higher capital standards, improved lending transparency and risk-based FDIC insurance assessments, that management does not expect to negatively affect the Company’s future financial results. However, the Company has already been significantly affected by enacted regulation on debit cards, and a number of provisions within the law such as limitations on debit card fees andinclude the potential for higher costs due to increased regulatory and compliance burdens, which will result in lower revenues or raiseincreasing costs tofor the Company. In addition to these and other new regulations which are already in place and are discussed above, the Company will likely face increased regulation of the industry. Increased regulation, along with possible changes in tax laws and accounting rules, may have a significant impact on the way the Company conducts business, implements strategic initiatives, engages in tax planning and makes financial disclosures. Compliance with such regulation may divert resources from other areas of the business and limit the ability to pursue other opportunities.
The performance of the Company is dependent on the economic conditions of the markets in which the Company operates.
The Company’s success is heavily influenced by the general economic conditions of the specific markets in which it operates. Unlike larger national or other regional banks that are more geographically diversified, the Company provides financial services primarily throughout the states of Missouri, Kansas, and central Illinois, and has recently expanded into Oklahoma, Colorado and other surrounding states. As the Company does not have a significant presence in other parts of the country, a prolonged economic downtown in these markets could have a material adverse effect on the Company’s financial condition and results of operations.
Significant changes in federal monetary policy could materially affect the Company’s business.
The Federal Reserve System regulates the supply of money and credit in the United States. Its polices determine in large part the cost of funds for lending and investing by influencing the interest rate earned on loans and paid on borrowings and interest bearing deposits. Credit conditions are influenced by its open market operations in U.S. government securities, changes in the member bank discount rate, and bank reserve requirements. Changes in Federal Reserve Board policies are beyond the Company’s control and difficult to predict, and such changes may result in lower interest margins and a continued lack of demand for credit products.
The soundness of other financial institutions could adversely affect the Company.
The Company’s ability to engage in routine funding transactions could be adversely affected by the actions and commercial soundness of other financial institution counterparties. Financial services institutions are interrelated as a result of trading, clearing, counterparty or other relationships. The Company has exposure to many different industries and counterparties and routinely executes transactions with counterparties in the financial industry, including brokers and dealers, commercial banks, investment
banks, mutual funds, and other institutional clients. Transactions with these institutions include overnight and term borrowings, interest rate swap agreements, securities purchased and sold, short-term investments, and other such transactions. As a result of this exposure, defaults by, or rumors or questions about, one or more financial services institutions or the financial services industry generally, could lead to market-wide liquidity problems and defaults by other institutions. Many of these transactions expose the Company to credit risk in the event of default of its counterparty or client, while other transactions expose the Company to liquidity risks should funding sources quickly disappear. In addition, the Company’s credit risk may be exacerbated when the collateral held cannot be realized or is liquidated at prices not sufficient to recover the full amount of the exposure due to the Company. Any such losses could materially and adversely affect results of operations.
The Company’s asset valuation may include methodologies, estimations and assumptions which are subject to differing interpretations and could result in changes to asset valuations that may materially adversely affect its results of operations or financial condition.
The Company uses estimates, assumptions, and judgments when certain financial assets and liabilities are measured and reported at fair value. Assets and liabilities carried at fair value inherently result in a higher degree of financial statement volatility. Fair values and the information used to record valuation adjustments for certain assets and liabilities are based on quoted market prices and/or other observable inputs provided by independent third-party sources, when available. When such third-party information is not available, fair value is estimated primarily by using cash flow and other financial modeling techniques utilizing assumptions such as credit quality, liquidity, interest rates and other relevant inputs. Changes in underlying factors, assumptions, or estimates in any of these areas could materially impact the Company’s future financial condition and results of operations.
During periods of market disruption, including periods of significantly rising or high interest rates, rapidly widening credit spreads or illiquidity, it may be difficult to value certain assets if trading becomes less frequent and/or market data becomes less observable. There may be certain asset classes in active markets with significant observable data that become illiquid due to the current financial environment. In such cases, certain asset valuations may require more subjectivity and management judgment. As such, valuations may include inputs and assumptions that are less observable or require greater estimation. Further, rapidly changing and unprecedented credit and equity market conditions could materially impact the valuation of assets as reported within the Company’s consolidated financial statements, and the period-to-period changes in value could vary significantly. Decreases in value may have a material adverse effect on results of operations or financial condition.
The Company’s investment portfolio values may be adversely impacted by changing interest rates and deterioration in the credit quality of underlying collateral within the various categories of investment securities it owns.
The Company generally invests in securities issued by municipal entities, government-backed agencies or privately issued securities that are highly rated by credit rating agenciesand evaluated at the time of purchase, however, these securities are subject to changes in market value due to changing interest rates and implied credit spreads. Recently,Over the past several years, budget deficits and other financial problems in a number of states and political subdivisions have been reported in the media. While the Company maintains rigorous risk management practices over bonds issued by municipalities, further credit deterioration in these bonds could occur and result in losses. Certain mortgage and asset-backed securities represent beneficial interests which are collateralized by residential
mortgages, credit cards, automobiles, mobile homes or other assets. While these investment securities are highly rated at the time of initial investment, the value of these securities may decline significantly due to actual or expected deterioration in the underlying collateral, especially residential mortgage collateral. Market conditions have resulted in a deterioration in fair values for non-guaranteed mortgage-backed and other asset-backed securities. Under accounting rules, when the impairment is due to declining expected cash flows, some portion of the impairment, depending on the Company’s intent to sell and the likelihood of being required to sell before recovery, must be recognized in current earnings. This could result in significant non-cash losses.
The Company is subject to interest rate risk.
The Company’s net interest income is the largest source of overall revenue to the Company, representing 62% of total revenue. Interest rates are beyond the Company’s control, and they fluctuate in response to general economic conditions and the policies of various governmental and regulatory agencies, in particular, the Federal Reserve Board. Changes in monetary policy, including changes in interest rates, will influence the origination of loans, the purchase of investments, the generation of deposits, and the rates received on loans and investment securities and paid on deposits. Management believes it has implemented effective asset and liability management strategies to reduce the potential effects of changes in interest rates on the Company’s results of operations. However, any substantial, prolonged change in market interest rates could have a material adverse effect on the Company’s financial condition and results of operations.
Future loan losses could increase.
The Company maintains an allowance for loan losses that represents management’s best estimate of probable losses that have been incurred at the balance sheet date within the existing portfolio of loans. The level of the allowance reflects management’s continuing evaluation of industry concentrations, specific credit risks, loan loss experience, current loan portfolio quality, present economic, political and regulatory conditions and unidentified losses inherent in the current loan portfolio. Although the loan losses have declined significantly in 2011,2012, they continue to remainhad been at elevated levels byduring the period 2007 through 2011 when compared to historical standards,experience, particularly in residential construction, consumer, and credit card loans, due to the past deterioration in the housing industry and general economic conditions in recent years. UntilWhile the housing sector and overall economy beginhave begun to slowly recover, it is likely that these higher loan loss levels will continue. Whilebusiness activities across a range of industries continue to face difficulties due to the Company’slack of consumer spending and the lack of liquidity in the global credit loss ratios remain below industry averages, continued economic deterioration andmarkets. A continuation or worsening of current financial market conditions could result in further loan losses, which may negatively affect itsthe Company's results of operations and could further increase levels of its allowance. In addition, the Company’s allowance level is subject to review by regulatory agencies, and that review could result in adjustments to the allowance. See the section captioned “Allowance for Loan Losses” in Item 7, Management’s Discussion and Analysis of Financial Condition and Results of Operations, of this report for further discussion related to the Company’s process for determining the appropriate level of the allowance for possible loan loss.
The Company is subject to both interest rate and liquidity risk.
DueWith oversight from its Asset-Liability Management Committee, the Company devotes substantial resources to monitoring its liquidity and interest rate risk on a weak economymonthly basis. The Company's net interest income is the largest source of overall revenue to the Company, representing 62% of total revenue. The interest rate environment in which the Company operates fluctuates in response to general economic conditions and diminished risk appetite duringpolicies of various governmental and regulatory agencies, particularly the last several years, individuals and businesses have increased the Company's deposits significantly. During 2011, total deposits increased by approximately $1.7 billion. At the same time,Federal Reserve Board. Changes in monetary policy, including changes in interest rates, will influence loan originations, deposit generation, demand for loansinvestments and revenues and costs for earning assets and liabilities.
Additionally the Company manages its balance sheet in order to maximize its net interest income from its net earning assets while insuring that there is ample liquidity to meet fluctuating cash flows coming from either funding sources or its earning assets.
Since the end of 2008, a weakened U.S. economy has remained weak, and therefore,resulted in significant growth in deposits was utilizedfrom both consumers and businesses. From 2008 through 2012, total deposits grew by $5.5 billion. During the same period, the Federal Reserve reduced interest rates to increaseunprecedented low levels. Loan demand remained weak through this period, and the size of the Company'sCompany invested these new deposits in its investment securities portfolio, to $9.4which grew by $5.9 billion atfrom 2008 through 2012. At December 31, 2011. As a result2012 the Company's loan to deposit ratio at December 31, 2011rate was 55%56%, a sign of strong liquidity. Investment securities generally carry lower rates than loans, and was an indication of a strong balance sheet withas these securities have grown, interest margins have been pressured. Furthermore the Company attempts to diversify its investment portfolio while keeping duration short, in order to ensure it is always able to meet liquidity needs for future changes in loans or deposit balances.
While loans grew in 2012 by 7% as the economy strengthened somewhat, the low liquidity risk. However, shouldinterest rate environment in which all banks operate will continue to pressure the Company's interest margins. Should the demand for loans increase in the future while customer deposits begin todeposit balances decline significantly, the Company's liquidity risk could change, andas it is dependent on itsthe Company's ability to manage maturities within its investment portfolio which would be used to fund loan growth.
these changing cash flows.
The Company operates in a highly competitive industry and market area.
The Company operates in the financial services industry, which is facing a rapidly changing environment having numerous competitors including other banks and insurance companies, securities dealers, brokers, trust and investment companies and mortgage bankers. Consolidation among financial service providers is likely to occur, and there are many new changes in technology, product offerings and regulation. As consolidation occurs, larger regional banks may acquire smaller banks in our market and add to existing competition. These new banks may lower fees in an effort to grow market share, which could result in a loss of customers and lower fee revenue for the Company. The Company must continue to make investments in its products and delivery systems to stay competitive with the industry as a whole, or its financial performance may suffer.
The Company’s reputation and future growth prospects could be impaired if events occur which breach its customers’ privacy.
The Company relies heavily on communications and information systems to conduct its business, and as part of its business, the Company maintains significant amounts of data about its customers and the products they use. Additionally, customers rely on online bank products. While the Company has policies and procedures and safeguards designed to prevent or limit the effect of failure, interruption or security breach of its information systems, there can be no assurances that any such failures, interruptions or security breaches will not occur; or if they do occur, that they will be adequately addressed. In addition to unauthorized access, denial-of-service attacks could overwhelm Company Web sites and prevent the Company from adequately serving customers. Should any of the Company's systems become compromised, the reputation of the Company could be damaged, relationships with existing customers may be impaired, the compromise could result in lost business, and as a result, the Company could incur significant expenses trying to remedy the incident.
The Company may not attract and retain skilled employees.
The Company’s success depends, in large part, on its ability to attract and retain key people. Competition for the best people can be intense, and the Company spends considerable time and resources attracting and hiring qualified people for its various business lines and support units. The unexpected loss of the services of one or more of the Company’s key personnel could have a material adverse impact on the Company’s business because of their skills, knowledge of the Company’s market, and years of industry experience, as well as the difficulty of promptly finding qualified replacement personnel.
| |
| Item 1b. | UNRESOLVED STAFF COMMENTS |
None
The main offices of the Bank are located in the larger metropolitan areas of its markets in various multi-story office buildings. The Bank owns its main offices and leases unoccupied premises to the public. The larger offices include:
| | | Building | Net rentable square footage | % occupied in total | % occupied by bank | Net rentable square footage | % occupied in total | % occupied by bank |
922 Walnut Kansas City, MO | 256,000 |
| 95 | % | 93 | % | 256,000 |
| 95 | % | 93 | % |
1000 Walnut Kansas City, MO | 403,000 |
| 83 |
| 38 |
| 403,000 |
| 85 |
| 38 |
|
811 Main Kansas City, MO | 237,000 |
| 100 |
| 100 |
| 237,000 |
| 100 |
| 100 |
|
8000 Forsyth Clayton, MO | 178,000 |
| 95 |
| 92 |
| 178,000 |
| 97 |
| 97 |
|
1551 N. Waterfront Pkwy Wichita, KS | 120,000 |
| 99 |
| 32 |
| 120,000 |
| 97 |
| 32 |
|
Various installment loan, credit card, trust and safe deposit functions operate out of leased offices in downtown Kansas City, Missouri. Also, during 2011 the Company transferred its credit card operations from Omaha, Nebraska, to Kansas City. The Company has an additional 196199 branch locations in Missouri, Illinois, Kansas, Oklahoma and Colorado which are owned or leased, and 162158 off-site ATM locations.
The information required by this item is set forth in Item 8 under Note 18, Commitments, Contingencies and Guarantees on page 105.104.
| |
| Item 4. | MINE SAFETY DISCLOSURES |
NoneNot applicable
Executive Officers of the Registrant
The following are the executive officers of the Company as of February 22, 20122013, each of whom is designated annually. There are no arrangements or understandings between any of the persons so named and any other person pursuant to which such person was designated an executive officer.
|
| |
| Name and Age | Positions with Registrant |
Jeffery D. Aberdeen, 5859 | Controller of the Company since December 1995. He is also Controller of the Company’s subsidiary bank, Commerce Bank. |
| | |
Kevin G. Barth, 5152 | Executive Vice President of the Company since April 2005 and Executive Vice President of Commerce Bank since October 1998. Senior Vice President of the Company and Officer of Commerce Bank prior thereto. |
| | |
| Jeffrey M. Burik, 54 | Senior Vice President of the Company since February 2013. Executive Vice President of Commerce Bank since November 2007. |
| |
Daniel D. Callahan, 5456 | Executive Vice President and Chief Credit Officer of the Company since December 2010 and Senior Vice President of the Company since April 2005 and Vice President of the Company prior thereto. Executive Vice President of Commerce Bank since May 2003. |
| | |
Sara E. Foster, 5152 | Executive Vice President of the Company since February 10, 2012 and Senior Vice President of the Company since February 1998. |
| | |
David W. Kemper, 6162 | Chairman of the Board of Directors of the Company since November 1991, Chief Executive Officer of the Company since June 1986, and1986. He was President of the Company sincefrom April 1982.1982 until February 2013. He is Chairman of the Board, President and Chief Executive Officer of Commerce Bank. He is the son of James M. Kemper, Jr. (a former Director and former Chairman of the Board of the Company), the brother of Jonathan M. Kemper, Vice Chairman of the Company, and father of John W. Kemper.Kemper, President and Chief Operating Officer of the Company. |
| | |
John W. Kemper, 3335 | President and Chief Operating Officer of the Company since February 2013, and Executive Vice President and Chief Administrative Officer of the Company since February 10, 2012 and Senior Vice President of the Company prior thereto. Senior Vice President of Commerce Bank since January 2009. Prior to his employment with Commerce Bank in August 2007, he was employed as an engagement manager with a global management consulting firm, managing strategy and operations projects primarily focused in the financial service industry. He is the son of David W. Kemper, Chairman President, and Chief Executive Officer of the Company and nephew of Jonathan M. Kemper, Vice Chairman of the Company. |
| | |
Jonathan M. Kemper, 5859 | Vice Chairman of the Company since November 1991 and Vice Chairman of Commerce Bank since December 1997. Prior thereto, he was Chairman of the Board, Chief Executive Officer, and President of Commerce Bank. He is the son of James M. Kemper, Jr. (a former Director and former Chairman of the Board of the Company), the brother of David W. Kemper, Chairman President, and Chief Executive Officer of the Company, and uncle of John W. Kemper.Kemper, President and Chief Operating Officer of the Company. |
| | |
Charles G. Kim, 5152 | Chief Financial Officer of the Company since July 2009. Executive Vice President of the Company since April 1995 and Executive Vice President of Commerce Bank since January 2004. Prior thereto, he was Senior Vice President of Commerce Bank, N.A. (Clayton, MO), a former subsidiary of the Company.Bank. |
| | |
Seth M. Leadbeater, 6162 | Vice Chairman of the Company since January 2004. Prior thereto he was Executive Vice President of the Company. He has been Vice Chairman of Commerce Bank since September 2004. Prior thereto he was Executive Vice President of Commerce Bank and President of Commerce Bank, N.A. (Clayton, MO).Bank. |
| | |
Michael J. Petrie, 5556 | Senior Vice President of the Company since April 1995. Prior thereto, he was Vice President of the Company. |
| | |
Robert J. Rauscher, 5455 | Senior Vice President of the Company since October 1997. Senior Vice President of Commerce Bank prior thereto. |
| | |
V. Raymond Stranghoener, 6061 | Executive Vice President of the Company since July 2005 and Senior Vice President of the Company prior thereto. |
PART II
| |
| Item 5. | MARKET FOR REGISTRANT’S COMMON EQUITY, RELATED STOCKHOLDER MATTERS AND ISSUER PURCHASES OF EQUITY SECURITIES |
Commerce Bancshares, Inc.
Common Stock Data
The following table sets forth the high and low prices of actual transactions in the Company’s common stock and cash dividends paid for the periods indicated (restated for the 5% stock dividend distributed in December 20112012).
| | | | Quarter | High | Low | Cash Dividends |
| 2012 | | First | $ | 39.31 |
| $ | 35.78 |
| $ | .219 |
|
| | Second | 39.05 |
| 34.45 |
| .219 |
|
| | | | | | | | | Third | 40.70 |
| 35.91 |
| .219 |
|
| Quarter | High | Low | Cash Dividends | Fourth | 38.70 |
| 34.69 |
| 1.648 | * |
| 2011 | First | $ | 40.64 |
| $ | 36.70 |
| $ | .219 |
| First | $ | 38.70 |
| $ | 34.96 |
| $ | .209 |
|
| | Second | 41.81 |
| 38.14 |
| .219 |
| Second | 39.82 |
| 36.33 |
| .209 |
|
| | Third | 41.90 |
| 31.65 |
| .219 |
| Third | 39.91 |
| 30.14 |
| .209 |
|
| | Fourth | 38.67 |
| 31.49 |
| .219 |
| Fourth | 36.83 |
| 29.99 |
| .209 |
|
| 2010 | First | $ | 37.97 |
| $ | 34.06 |
| $ | .213 |
| First | $ | 36.16 |
| $ | 32.44 |
| $ | .203 |
|
| | Second | 39.20 |
| 32.22 |
| .213 |
| Second | 37.34 |
| 30.68 |
| .203 |
|
| | Third | 36.59 |
| 31.84 |
| .213 |
| Third | 34.85 |
| 30.32 |
| .203 |
|
| | Fourth | 38.66 |
| 32.71 |
| .213 |
| Fourth | 36.82 |
| 31.16 |
| .203 |
|
| 2009 | First | $ | 38.36 |
| $ | 24.01 |
| $ | .207 |
| |
| | Second | 33.91 |
| 25.68 |
| .207 |
| |
| | Third | 34.54 |
| 26.73 |
| .207 |
| |
| | Fourth | 36.63 |
| 31.01 |
| .207 |
| |
* Includes a special dividend of $1.429 per share
Commerce Bancshares, Inc. common shares are listed on the Nasdaq Global Select Market (NASDAQ) under the symbol CBSH. The Company had 4,2184,135 shareholders of record as of December 31, 20112012.
Performance Graph
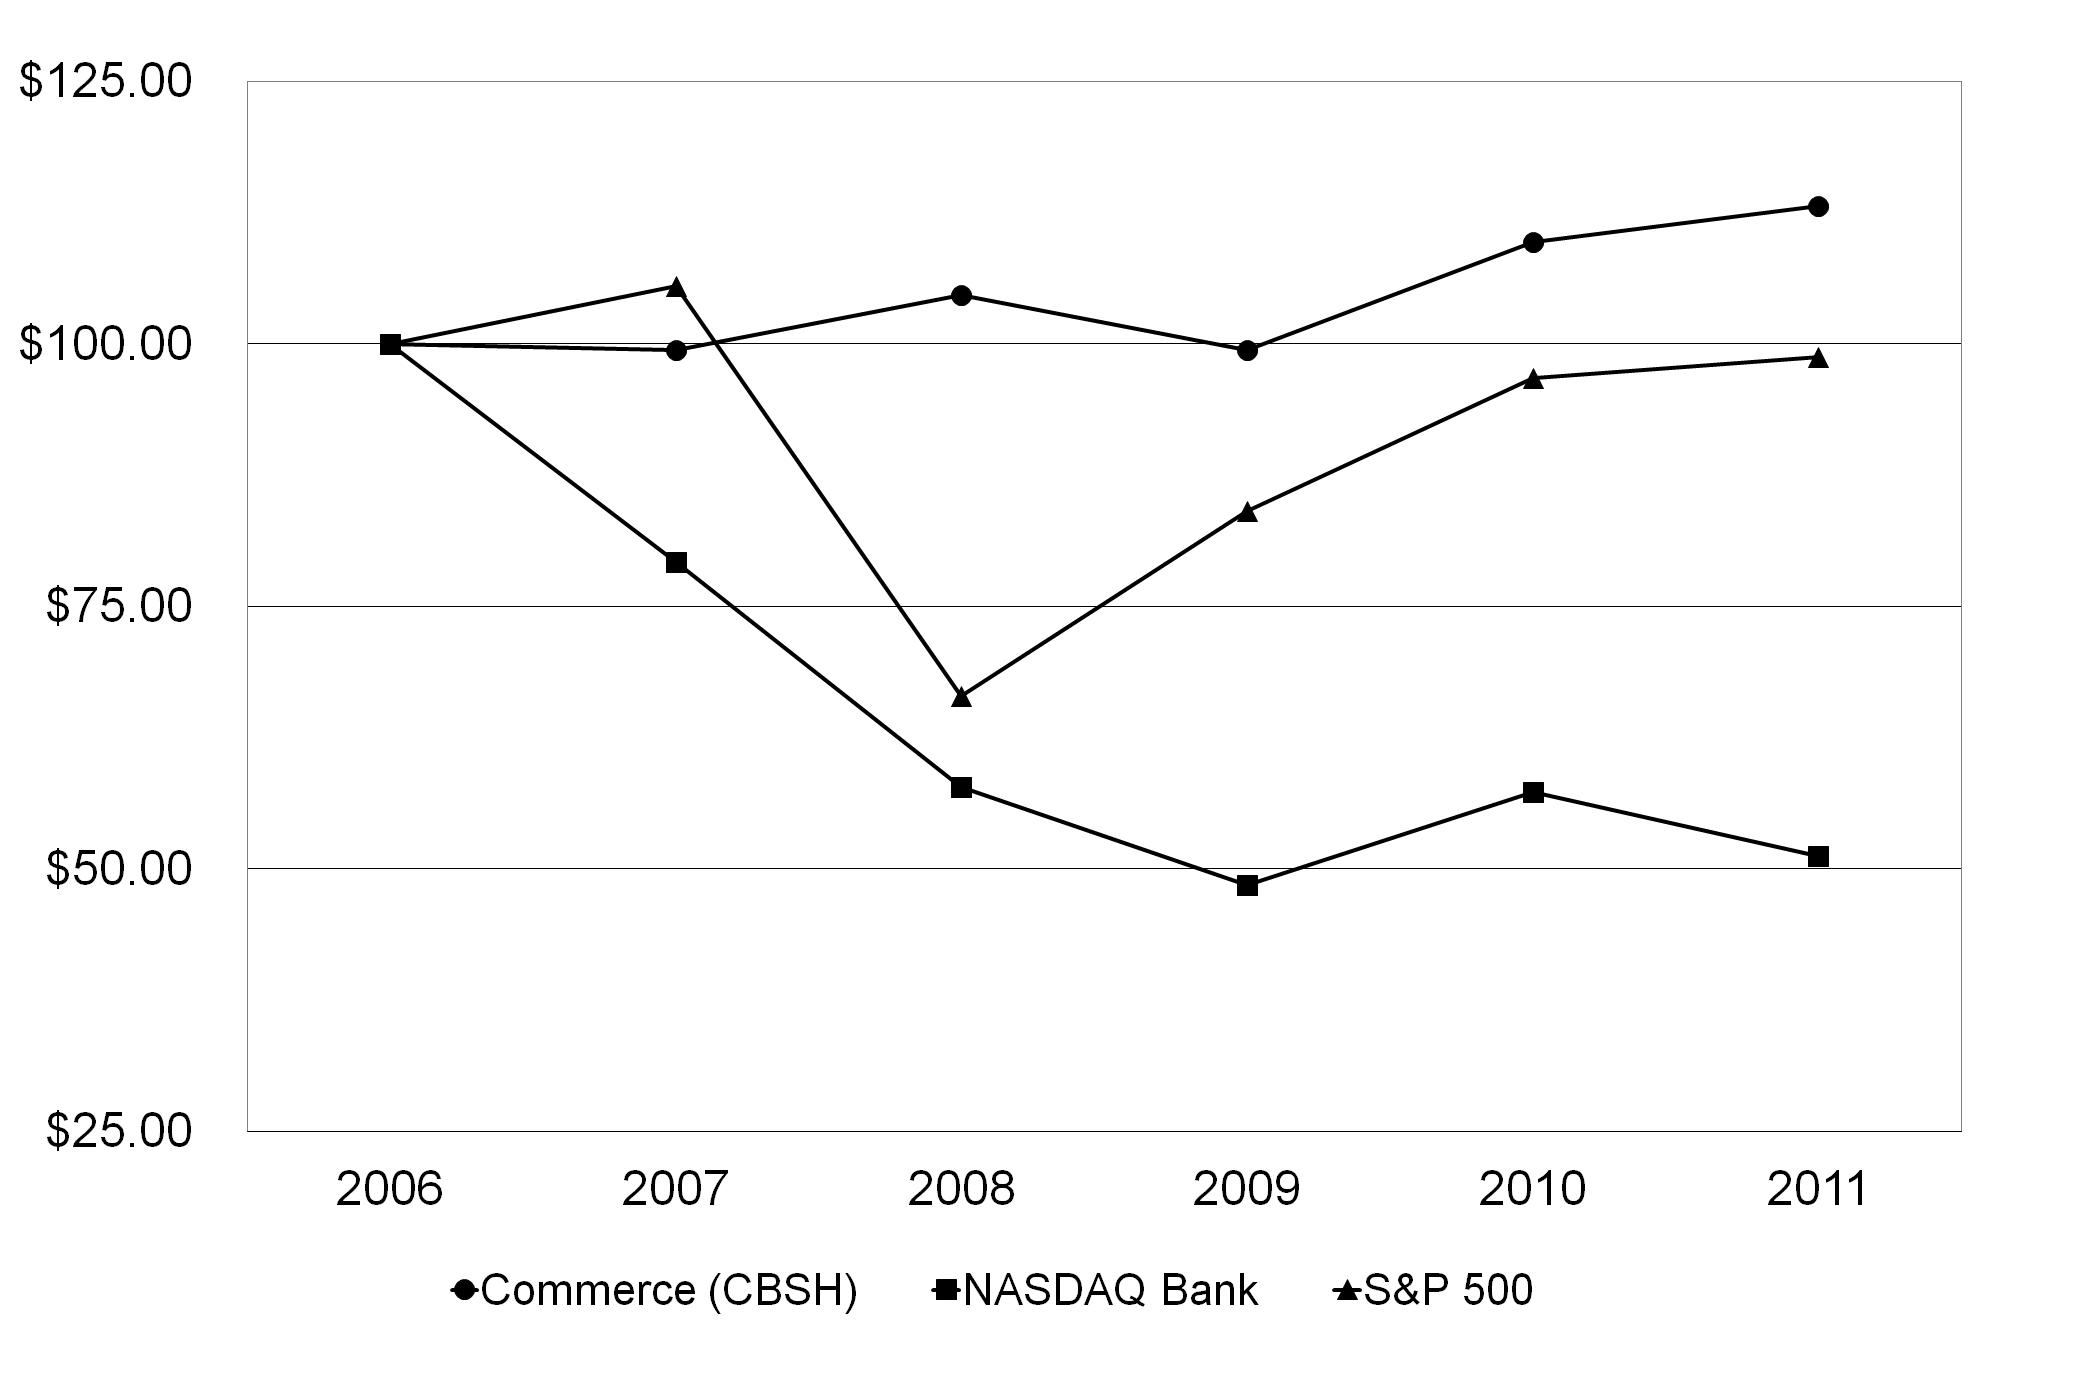
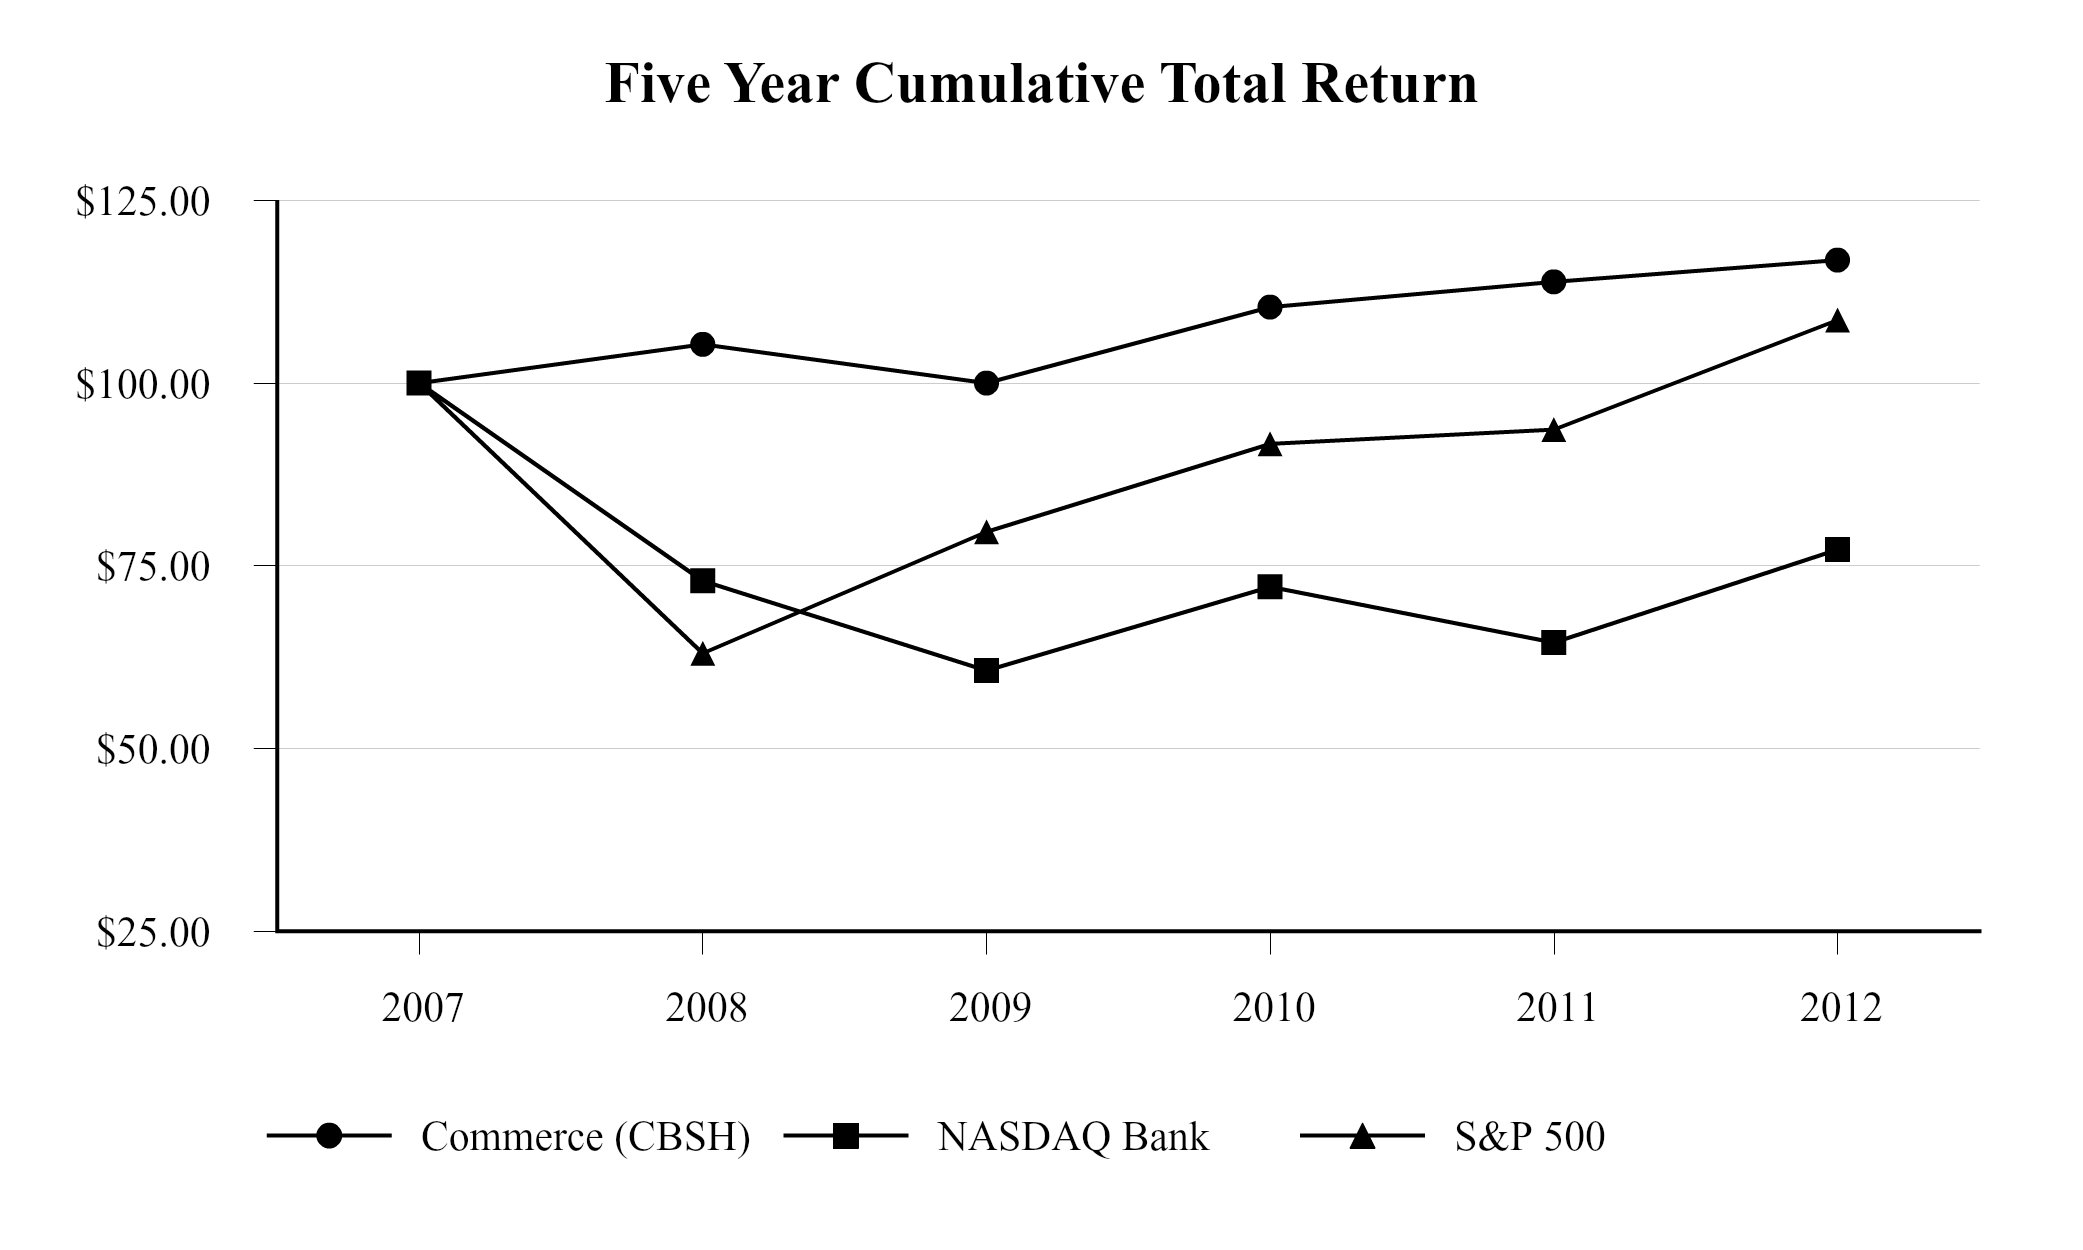
The following graph presents a comparison of Company (CBSH) performance to the indices named below. It assumes $100 invested on December 31, 20062007 with dividends invested on a Total Returncumulative total shareholder return basis.
Five Year Cumulative Total Return
| | | | 2006 | 2007 | 2008 | 2009 | 2010 | 2011 | 2007 | 2008 | 2009 | 2010 | 2011 | 2012 |
|
| Commerce (CBSH) | 100.00 |
| 99.38 |
| 104.66 |
| 99.39 |
| 109.66 |
| 113.11 |
| 100.00 |
| 105.31 |
| 100.00 |
| 110.34 |
| 113.81 |
| 116.78 |
|
| NASDAQ Bank | 100.00 |
| 79.26 |
| 57.79 |
| 48.42 |
| 57.29 |
| 51.19 |
| 100.00 |
| 72.91 |
| 60.66 |
| 72.13 |
| 64.51 |
| 77.18 |
|
| S&P 500 | 100.00 |
| 105.50 |
| 66.47 |
| 84.06 |
| 96.71 |
| 98.76 |
| 100.00 |
| 63.00 |
| 79.67 |
| 91.67 |
| 93.61 |
| 108.59 |
|
The following table sets forth information about the Company’s purchases of its $5 par value common stock, its only class of stock registered pursuant to Section 12 of the Exchange Act, during the fourth quarter of 2011.2012.
|
| | | | | | | | | |
| Period | Total Number of Shares Purchased | Average Price Paid per Share | Total Number of Shares Purchased as Part of Publicly Announced Program | Maximum Number that May Yet Be Purchased Under the Program |
| October 1—31, 2011 | 438 |
|
| $38.80 |
| 438 |
| 823,677 |
|
| November 1—30, 2011 | — |
| — |
| — |
| 3,000,000 |
|
| December 1—31, 2011 | 700 |
|
| $36.40 |
| 700 |
| 2,999,300 |
|
| Total | 1,138 |
|
| $37.32 |
| 1,138 |
| 2,999,300 |
|
|
| | | | | | | | | |
| Period | Total Number of Shares Purchased | Average Price Paid per Share | Total Number of Shares Purchased as Part of Publicly Announced Program | Maximum Number that May Yet Be Purchased Under the Program |
| October 1—31, 2012 | 329,095 |
|
| $37.83 |
| 329,095 |
| 2,572,965 |
|
| November 1—30, 2012 | 444,277 |
|
| $38.01 |
| 444,277 |
| 2,128,688 |
|
| December 1—31, 2012 | 1,070 |
|
| $35.06 |
| 1,070 |
| 2,127,618 |
|
| Total | 774,442 |
|
| $37.93 |
| 774,442 |
| 2,127,618 |
|
The Company’s stock purchases shown above were made under authorizations by the Board of Directors. Under the most recent authorization in November 2011, 2,999,300July 2012 of 3,000,000 shares, 2,127,618 shares remained available for purchase at December 31, 20112012.
| |
| Item 6. | SELECTED FINANCIAL DATA |
The required information is set forth below in Item 7.
| |
| Item 7. | MANAGEMENT’S DISCUSSION AND ANALYSIS OF FINANCIAL CONDITION AND RESULTS OF OPERATIONS |
Forward-Looking Statements
This report may contain “forward-looking statements” that are subject to risks and uncertainties and include information about possible or assumed future results of operations. Many possible events or factors could affect the future financial results and performance of the Company. This could cause results or performance to differ materially from those expressed in the forward-looking statements. Words such as “expects”, “anticipates”, “believes”, “estimates”, variations of such words and other similar expressions are intended to identify such forward-looking statements. These statements are not guarantees of future performance and involve certain risks, uncertainties and assumptions which are difficult to predict. Therefore, actual outcomes and results may differ materially from what is expressed or forecasted in, or implied by, such forward-looking statements. Readers should not rely solely on the forward-looking statements and should consider all uncertainties and risks discussed throughout this report. Forward-looking statements speak only as of the date they are made. The Company does not undertake to update forward-looking statements to reflect circumstances or events that occur after the date the forward-looking statements are made or to reflect the occurrence of unanticipated events. Such possible events or factors include the risk factors identified in Item 1a Risk Factors and the following: changes in economic conditions in the Company’s market area; changes in policies by regulatory agencies, governmental legislation and regulation; fluctuations in interest rates; changes in liquidity requirements; demand for loans in the Company’s market area; changes in accounting and tax principles; estimates made on income taxes; and competition with other entities that offer financial services.
Overview
Commerce Bancshares, Inc. and its subsidiaries (the "Company") operates as a super-community bank offering an array of sophisticated financial products delivered with high-quality, personal customer service. It is the largest bank holding company headquartered in Missouri, with its principal offices in Kansas City and St. Louis, Missouri. Customers are served from approximately 360 locations in Missouri, Kansas, Illinois, Oklahoma and Colorado using delivery platforms which include an extensive network of branches and ATM machines, full-featured online banking, and a central contact center.
The core of the Company’s competitive advantage is its focus on the local markets it services and its concentration on relationship banking and high touch service. In order to enhance shareholder value, the Company grows its core revenue by expanding new and existing customer relationships, utilizing improved technology, and enhancing customer satisfaction.
Various indicators are used by management in evaluating the Company’s financial condition and operating performance. Among these indicators are the following:
Net income and growth in earnings per share — Net income attributable to Commerce Bancshares, Inc. was $256.3$269.3 million, an increase of 15.6%5.1% compared to the previous year. The return on average assets was 1.32%1.30%. Diluted earnings per share increased 17.5%7.8% in 20112012 compared to 2010.2011.
Growth in total revenue — Total revenue is comprised of net interest income and non-interest income. Total revenue in 2012 increased slightly over 2011, declined $12.1as non-interest income grew $6.7 million or 1.1%, compared to 2010, which resulted from lower non-interest income.and net interest income fell $6.2 million. Non-interest income was primarily affectedsaw increases in trust and capital market fees, partly offset by regulationdeclines in bank card transaction fees, deposit fees, and loan fees and sales. However, past regulatory actions which have reduced fees from overdraft, debit card, and student lending activities. Net interest income rose slightly, although theactivities have been somewhat mitigated by growth in corporate card revenue, which increased $13.0 million in 2012, and growth in other types of deposit fees. The net interest margin declined to 3.41% in 2012, a 24 basis point decline from 3.89% in 20102011, as average rates continued to 3.65% in 2011. Total revenue has risen 3.7%, compounded annually, overfall and the last five years.lending environment remained challenging.
Expense control — Non-interestTotal non-interest expense decreased $13.9 million, or 2.2%,increased less than 1% this year but included litigation costs of $18.3 million.compared to 2011. Salaries and employee benefits, the largest expense component, declinedincreased by .4%$15.6 million, or 4.5% due to lower salary,higher salaries, incentives, medical and pension costs, but were partly offset by higher incentive compensation. Otherretirement costs. In addition, other operating expenses were also well-controlled and included a decline$5.7 million increase in FDIC costs. Includeddata processing costs and the accrual of $5.2 million in 2010 expense was $11.8 million related to early extinguishmentpotential losses arising from the preliminary settlement of debt.Visa, Inc. (Visa) credit card interchange litigation.
Asset quality — Net loan charge-offs in 20112012 decreased $32.4$25.2 million from those recorded in 2010,2011 and averaged .70%.42% of loans compared to 1.00%.70% in the previous year. Total non-performing assets, which include non-accrual loans and foreclosed real estate, amounted to $93.8$64.9 million at December 31, 2012, a decrease of $3.5$28.9 million from balances at the previous year end, and represented 1.02%.66% of loans outstanding.
Shareholder return — Total shareholder return, including the change in stock price and dividend reinvestment, was 3.1%2.6% over the past year and 7.0%6.5% over the past 10 years.
Record earnings over the last two years have strengthened capital
and liquidity and allowed the Company to pay a special fourth quarter cash dividend of $1.43* per share in advance of higher tax rates now in effect.
* Restated for the 5% stock dividend distributed in December 2012.
The following discussion and analysis should be read in conjunction with the consolidated financial statements and related notes. The historical trends reflected in the financial information presented below are not necessarily reflective of anticipated future results.
Key Ratios
| | | (Based on average balances) | 2011 | 2010 | 2009 | 2008 | 2007 | 2012 | 2011 | 2010 | 2009 | 2008 |
| Return on total assets | 1.32 | % | 1.22 | % | .96 | % | 1.15 | % | 1.33 | % | 1.30 | % | 1.32 | % | 1.22 | % | .96 | % | 1.15 | % |
| Return on total equity | 12.15 |
| 11.15 |
| 9.76 |
| 11.81 |
| 13.97 |
| 12.00 |
| 12.15 |
| 11.15 |
| 9.76 |
| 11.81 |
|
| Equity to total assets | 10.87 |
| 10.91 |
| 9.83 |
| 9.71 |
| 9.55 |
| 10.84 |
| 10.87 |
| 10.91 |
| 9.83 |
| 9.71 |
|
Loans to deposits (1) | 59.15 |
| 70.02 |
| 79.79 |
| 92.11 |
| 88.49 |
| 55.80 |
| 59.15 |
| 70.02 |
| 79.79 |
| 92.11 |
|
| Non-interest bearing deposits to total deposits | 30.26 |
| 28.65 |
| 26.48 |
| 24.05 |
| 24.00 |
| 32.82 |
| 30.26 |
| 28.65 |
| 26.48 |
| 24.05 |
|
| Net yield on interest earning assets (tax equivalent basis) | 3.65 |
| 3.89 |
| 3.93 |
| 3.96 |
| 3.85 |
| 3.41 |
| 3.65 |
| 3.89 |
| 3.93 |
| 3.96 |
|
| (Based on end of period data) | | |
Non-interest income to revenue (2) | 37.82 |
| 38.54 |
| 38.41 |
| 38.80 |
| 40.85 |
| 38.44 |
| 37.82 |
| 38.54 |
| 38.41 |
| 38.80 |
|
Efficiency ratio (3) | 59.10 |
| 59.71 |
| 59.88 |
| 63.08 |
| 62.65 |
| 59.26 |
| 59.10 |
| 59.71 |
| 59.88 |
| 63.08 |
|
| Tier I risk-based capital ratio | 14.71 |
| 14.38 |
| 13.04 |
| 10.92 |
| 10.31 |
| 13.60 |
| 14.71 |
| 14.38 |
| 13.04 |
| 10.92 |
|
| Total risk-based capital ratio | 16.04 |
| 15.75 |
| 14.39 |
| 12.31 |
| 11.49 |
| 14.93 |
| 16.04 |
| 15.75 |
| 14.39 |
| 12.31 |
|
| Tier I leverage ratio | 9.55 |
| 10.17 |
| 9.58 |
| 9.06 |
| 8.76 |
| 9.14 |
| 9.55 |
| 10.17 |
| 9.58 |
| 9.06 |
|
Tangible common equity to assets ratio (4) | 9.91 |
| 10.27 |
| 9.71 |
| 8.25 |
| 8.61 |
| 9.25 |
| 9.91 |
| 10.27 |
| 9.71 |
| 8.25 |
|
| Cash dividend payout ratio | 31.06 |
| 35.52 |
| 44.15 |
| 38.54 |
| 33.76 |
| 79.48 |
| 31.06 |
| 35.52 |
| 44.15 |
| 38.54 |
|
| |
| (1) | Includes loans held for sale. |
| |
| (2) | Revenue includes net interest income and non-interest income. |
| |
| (3) | The efficiency ratio is calculated as non-interest expense (excluding intangibles amortization) as a percent of revenue. |
| |
| (4) | The tangible common equity ratio is calculated as stockholders’ equity reduced by goodwill and other intangible assets (excluding mortgage servicing rights) divided by total assets reduced by goodwill and other intangible assets (excluding mortgage servicing rights). |
Selected Financial Data
| | | (In thousands, except per share data) | 2011 | 2010 | 2009 | 2008 | 2007 | 2012 | 2011 | 2010 | 2009 | 2008 |
| Net interest income | $ | 646,070 |
| $ | 645,932 |
| $ | 635,502 |
| $ | 592,739 |
| $ | 538,072 |
| $ | 639,906 |
| $ | 646,070 |
| $ | 645,932 |
| $ | 635,502 |
| $ | 592,739 |
|
| Provision for loan losses | 51,515 |
| 100,000 |
| 160,697 |
| 108,900 |
| 42,732 |
| 27,287 |
| 51,515 |
| 100,000 |
| 160,697 |
| 108,900 |
|
| Non-interest income | 392,917 |
| 405,111 |
| 396,259 |
| 375,712 |
| 371,581 |
| 399,630 |
| 392,917 |
| 405,111 |
| 396,259 |
| 375,712 |
|
| Investment securities gains (losses), net | 10,812 |
| (1,785 | ) | (7,195 | ) | 30,294 |
| 8,234 |
| 4,828 |
| 10,812 |
| (1,785 | ) | (7,195 | ) | 30,294 |
|
| Non-interest expense | 617,249 |
| 631,134 |
| 621,737 |
| 615,380 |
| 574,159 |
| 618,469 |
| 617,249 |
| 631,134 |
| 621,737 |
| 615,380 |
|
| Net income attributable to Commerce Bancshares, Inc. | 256,343 |
| 221,710 |
| 169,075 |
| 188,655 |
| 206,660 |
| 269,329 |
| 256,343 |
| 221,710 |
| 169,075 |
| 188,655 |
|
| Net income per common share-basic* | 2.83 |
| 2.41 |
| 1.88 |
| 2.15 |
| 2.34 |
| 2.91 |
| 2.70 |
| 2.30 |
| 1.79 |
| 2.05 |
|
| Net income per common share-diluted* | 2.82 |
| 2.40 |
| 1.87 |
| 2.14 |
| 2.32 |
| 2.90 |
| 2.69 |
| 2.29 |
| 1.78 |
| 2.04 |
|
| Cash dividends | 79,140 |
| 78,231 |
| 74,720 |
| 72,055 |
| 68,915 |
| 211,608 |
| 79,140 |
| 78,231 |
| 74,720 |
| 72,055 |
|
| Cash dividends per share* | .876 |
| .853 |
| .829 |
| .823 |
| .784 |
| 2.305 |
| .834 |
| .812 |
| .790 |
| .784 |
|
| Market price per share* | 38.12 |
| 37.84 |
| 35.12 |
| 37.97 |
| 36.91 |
| 35.06 |
| 36.30 |
| 36.04 |
| 33.45 |
| 36.16 |
|
| Book value per share* | 24.40 |
| 22.25 |
| 20.61 |
| 18.00 |
| 17.53 |
| 23.76 |
| 23.24 |
| 21.19 |
| 19.63 |
| 17.14 |
|
| Common shares outstanding* | 88,952 |
| 90,955 |
| 91,517 |
| 87,737 |
| 87,268 |
| 91,414 |
| 93,400 |
| 95,503 |
| 96,093 |
| 92,124 |
|
| Total assets | 20,649,367 |
| 18,502,339 |
| 18,120,189 |
| 17,532,447 |
| 16,204,831 |
| 22,159,589 |
| 20,649,367 |
| 18,502,339 |
| 18,120,189 |
| 17,532,447 |
|
| Loans, including held for sale | 9,208,554 |
| 9,474,733 |
| 10,490,327 |
| 11,644,544 |
| 10,841,264 |
| 9,840,211 |
| 9,208,554 |
| 9,474,733 |
| 10,490,327 |
| 11,644,544 |
|
| Investment securities | 9,358,387 |
| 7,409,534 |
| 6,473,388 |
| 3,780,116 |
| 3,297,015 |
| 9,669,735 |
| 9,358,387 |
| 7,409,534 |
| 6,473,388 |
| 3,780,116 |
|
| Deposits | 16,799,883 |
| 15,085,021 |
| 14,210,451 |
| 12,894,733 |
| 12,551,552 |
| 18,348,653 |
| 16,799,883 |
| 15,085,021 |
| 14,210,451 |
| 12,894,733 |
|
| Long-term debt | 511,817 |
| 512,273 |
| 1,236,062 |
| 1,447,781 |
| 1,083,636 |
| 503,710 |
| 511,817 |
| 512,273 |
| 1,236,062 |
| 1,447,781 |
|
| Equity | 2,170,361 |
| 2,023,464 |
| 1,885,905 |
| 1,579,467 |
| 1,530,156 |
| 2,171,574 |
| 2,170,361 |
| 2,023,464 |
| 1,885,905 |
| 1,579,467 |
|
| Non-performing assets | 93,803 |
| 97,320 |
| 116,670 |
| 79,077 |
| 33,417 |
| 64,863 |
| 93,803 |
| 97,320 |
| 116,670 |
| 79,077 |
|
| |
| * | Restated for the 5% stock dividend distributed in December 2011.2012. |
Results of Operations
| | | | | $ Change | | % Change | | $ Change | | % Change |
| (Dollars in thousands) | 2011 | 2010 | 2009 | ’11-’10 | ’10-’09 | | ’11-’10 | ’10-’09 | 2012 | 2011 | 2010 | '12-'11 | '11-'10 | | '12-'11 | '11-'10 |
| Net interest income | $ | 646,070 |
| $ | 645,932 |
| $ | 635,502 |
| $ | 138 |
| $ | 10,430 |
| | — | % | 1.6 | % | $ | 639,906 |
| $ | 646,070 |
| $ | 645,932 |
| $ | (6,164 | ) | $ | 138 |
| | (1.0 | )% | — | % |
| Provision for loan losses | (51,515 | ) | (100,000 | ) | (160,697 | ) | (48,485 | ) | (60,697 | ) | | (48.5 | ) | (37.8 | ) | (27,287 | ) | (51,515 | ) | (100,000 | ) | (24,228 | ) | (48,485 | ) | | (47.0 | ) | (48.5 | ) |
| Non-interest income | 392,917 |
| 405,111 |
| 396,259 |
| (12,194 | ) | 8,852 |
| | (3.0 | ) | 2.2 |
| 399,630 |
| 392,917 |
| 405,111 |
| 6,713 |
| (12,194 | ) | | 1.7 |
| (3.0 | ) |
| Investment securities gains (losses), net | 10,812 |
| (1,785 | ) | (7,195 | ) | 12,597 |
| 5,410 |
| | NM |
| 75.2 |
| 4,828 |
| 10,812 |
| (1,785 | ) | (5,984 | ) | 12,597 |
| | (55.3 | ) | NM |
|
| Non-interest expense | (617,249 | ) | (631,134 | ) | (621,737 | ) | (13,885 | ) | 9,397 |
| | (2.2 | ) | 1.5 |
| (618,469 | ) | (617,249 | ) | (631,134 | ) | 1,220 |
| (13,885 | ) | | .2 |
| (2.2 | ) |
| Income taxes | (121,412 | ) | (96,249 | ) | (73,757 | ) | 25,163 |
| 22,492 |
| | 26.1 |
| 30.5 |
| (127,169 | ) | (121,412 | ) | (96,249 | ) | 5,757 |
| 25,163 |
| | 4.7 |
| 26.1 |
|
| Non-controlling interest (expense) income | (3,280 | ) | (165 | ) | 700 | (3,115 | ) | (865 | ) | | NM |
| (123.6 | ) | |
| Non-controlling interest expense | | (2,110 | ) | (3,280 | ) | (165 | ) | (1,170 | ) | 3,115 |
| | (35.7 | ) | NM |
|
| Net income attributable to Commerce Bancshares, Inc. | $ | 256,343 |
| $ | 221,710 |
| $ | 169,075 |
| $ | 34,633 |
| $ | 52,635 |
| | 15.6 | % | 31.1 | % | $ | 269,329 |
| $ | 256,343 |
| $ | 221,710 |
| $ | 12,986 |
| $ | 34,633 |
| | 5.1 | % | 15.6 | % |
Net income attributable to Commerce Bancshares, Inc. for 2012 was $269.3 million, an increase of $13.0 million, or 5.1%, compared to $256.3 million in 2011. Diluted income per share was $2.90 in 2012 compared to $2.69 in 2011. The increase in net income largely resulted from a $24.2 million decrease in the provision for loan losses coupled with an increase of $6.7 million in non-interest income. These increases to net income were partly offset by a decline of $6.2 million in net interest income, $6.0 million in lower net securities gains, and subsidiaries (the "Company")a $5.8 million increase in income tax expense. The return on average assets was 1.30% in 2012 compared to 1.32% in 2011, and the return on average equity was 12.00% compared to 12.15% in 2011. At December 31, 2012, the ratio of tangible common equity to assets was 9.25% compared to 9.91% at year end 2011.
During 2012, net interest income decreased $6.2 million to $639.9 million, as compared to $646.1 million in 2011. This decline was due to lower rates earned on investment securities and loans, partly offset by higher balances in these assets and lower rates paid on deposits. The provision for loan losses totaled $27.3 million in 2012, a decrease of $24.2 million from the prior year. Net loan charge-offs declined by $25.2 million in 2012 compared to 2011, mainly in business, construction, consumer, and consumer credit card loans.
Non-interest income for 2012 was $399.6 million, an increase of $6.7 million, or 1.7%, compared to $392.9 million in 2011. This increase resulted mainly from higher trust fees and capital market fees, and a $13.0 million increase in corporate card revenue. Corporate card revenue has shown strong growth over the past several years, resulting from both new customer transactions and increased volumes from existing customers as the Company continues to expand this product on a national basis. Debit card interchange income, which was limited by rules adopted in Dodd-Frank legislation effective in the fourth quarter of 2011, declined $19.3 million. Deposit fees decreased $3.2 million, as declines in overdraft and return items fees were partly offset by increases in other types of deposit fees. Loan fees and sales declined $1.5 million, as sales of home mortgages in the secondary market were discontinued in late 2011.
Investment securities gains amounted to $4.8 million, a decrease of $6.0 million from $10.8 million in investment securities gains during 2011. The 2012 gains resulted mainly from fair value adjustments and sales of private equity investments.
Non-interest expense for 2012 was $618.5 million, an increase of $1.2 million over $617.2 million in 2011. This slight overall increase included a $15.6 million increase in salaries and benefits expense, as well as a $5.7 million increase in data processing and software expense. During 2012, non-interest expense included a $5.2 million loss contingency related to Visa interchange litigation, which is discussed further in Note 18 to the consolidated financial statements. Offsetting these increases in non-interest expense during 2012 was $18.3 million expensed during 2011 related to debit card overdraft litigation, also discussed further in Note 18. Income tax expense was $127.2 million in 2012 compared to $121.4 million in 2011, resulting in an effective tax rate of 32.1% in both years.
Net income attributable to Commerce Bancshares, Inc. for 2011 was $256.3 million, an increase of $34.6 million, or 15.6%, compared to $221.7 million in 2010. Diluted income per share was $2.82$2.69 in 2011 compared to $2.40$2.29 in 2010. The increase in net income resulted from a $48.5 million decrease in the provision for loan losses coupled with a decline of $13.9 million in non-interest expense and $12.6 million in higher net securities gains. These effects were partly offset by a $12.2 million decline in non-interest income and a $25.2 million increase in income tax expense. Non-interest expense included the accrual of $18.3 million for a lawsuit settlement regarding debit card overdrafts, which is discussed further in Note 18 to the consolidated financial statements.as mentioned above. In addition, an indemnification obligation liability related to Visa, Inc. (Visa), also discussed in Note 18, was reduced by $4.4 million, decreasing expense. The return on average assets was 1.32% in 2011 compared to 1.22% in 2010, and the return on average equity was 12.15% compared to 11.15%. in 2010. At December 31, 2011, the ratio of tangible common equity to assets was 9.91% compared to 10.27% at year end 2010.
During 2011, net interest income increased $138 thousand to $646.1 million, as compared to $645.9 million in 2010. This slight growth was due to lower rates incurred on deposits, higher average balances in investment securities, and lower average borrowing levels. These effects were partly offset by lower rates earned on both investment securities and loans, in addition to lower loan balances.
The provision for loan losses totaled $51.5 million in 2011, a decrease of $48.5 million from the prior year. Net loan charge-offs declined by $32.4 million in 2011 compared to 2010, mainly in construction, consumer, and consumer credit card loans.
Non-interest income for 2011 was $392.9 million, a decrease of $12.2 million, or 3.0%, compared to $405.1 million in 2010. This decrease iswas the result of a decline in overdraft fees of $10.2 million in 2011, due to the Company's implementation on July 1, 2010 of new overdraft regulations on debit card transactions, as well as a decline of $3.1 million in debit card interchange income resulting from new rules adopted inthe Dodd-Frank legislation which became effective during the fourth quarter of 2011.mentioned above. Also contributing to the decline in non-interest income in 2011 was a $14.6 million decrease in gains on sales of student loans. This occurred as new federal regulations over guaranteed student loans caused the Company to exit the guaranteed student loan business and the Company sold most of its student loans in 2010. Partially offsetting these decreases in non-interest income was a $9.5 million increase in corporate card revenue, resulting from both new customer transactions and increased volumes from existing customers as the Company continues to expand this product on a national basis.revenue. In addition, trust fees rose $7.4 million on strong new account sales.
Investment securities gains amounted to $10.8 million, an increase of $12.6 million over $1.8 million in investment securities losses during 2010. TheAs in 2012, the 2011 gains also resulted mainly from fair value adjustments and sales of private equity investments.
Non-interest expense for 2011 was $617.2 million, a decrease of $13.9 million, or 2.2%, compared to $631.1 million in 2010. This decline was partly due to slight decreases in salaries and benefits expense, as well as marketing and equipment expenses, but was mainly driven by reductions of $4.7 million in supplies and communication expense and $6.1 million in FDIC insurance expense. During 2010, non-interest expense included an $11.8 million debt pre-payment penalty on Federal Home Loan Bank (FHLB) advances. Offsetting these declines inThese effects on non-interest expense during 2011 waswere partly offset by an $18.3 million expensed during the current yearloss recorded in 2011 related to debit card overdraft litigation, as mentioned above. Income tax expense was $121.4 million in 2011 compared to $96.2 million in 2010, resulting in effective tax rates of 32.1% and 30.3%, respectively.
Net income attributable to Commerce Bancshares, Inc. for 2010 was $221.7 million, an increase of $52.6 million, or 31.1%, compared to $169.1 million in 2009. Diluted income per share was $2.40 in 2010 compared to $1.87 in 2009. The increase in net
income resulted from a $60.7 million decrease in the provision for loan losses coupled with growth of $10.4 million in net interest income and $8.9 million in non-interest income. The growth in income was partly offset by an increase of $9.4 million in non-interest expense. Several significant items of non-interest income and non-interest expense affected results for 2010. During 2010, the Company paid off $125.0 million in FHLB borrowings with high interest coupons prior to maturity and incurred a pre-payment penaltyspecial cash dividend of $11.8 million. The Company also sold its held to maturity portfolio of student loans, totaling $311.0 million, for a gain of $6.9 million. During 2010, the Visa indemnification obligation liability was reduced by $4.4 million. The combined effect of these items was a reduction in pre-tax net income of $465 thousand. The return on average assets was 1.22% in 2010 compared to .96% in 2009, and the return on average equity was 11.15% compared to 9.76%. At December 31, 2010, the ratio of tangible common equity to assets improved to 10.27% compared to 9.71% at year end 2009.
During 2010, net interest income increased $10.4 million, or 1.6%, compared to 2009. This growth was mainly the result of lower rates paid on deposits and higher average balances in investment securities, but partly offset by lower yields on loans and investment securities and declining loan balances. The provision for loan losses totaled $100.0 million in 2010, a decrease of $60.7 million from the prior year. The Company incurred lower loan losses in nearly all categories, notably construction, consumer and business.
Non-interest income in 2010 increased $8.9 million, or 2.2%, over amounts reported in the previous year, mainly due to growth in bank card and trust fees, which rose $26.8 million and $4.1 million, respectively. Bank card fees increased due to strong growth in corporate card revenues. Offsetting this growth was a decline in deposit account fees of $13.7 million, or 12.9%, due largely to the effect of the new overdraft regulations mentioned above,$1.43 per share, in addition to lower brokerage and bond trading revenue. Non-interest expense increased $9.4 million, or 1.5%, over 2009. The growth in expense included the debt pre-payment penalty, partly offset by an $8.2 million reduction in FDIC insurance expense. Reductions in the Visa indemnification obligation were recorded in both 2010 and 2009. Income tax expense amounted to $96.2 million in 2010 and $73.8 million in 2009. The effective tax rate was 30.3% in 2010 compared to 30.4% in the previous year.
The Companyits regular quarterly cash dividend of $.22 per share, on December 17, 2012. In addition, it distributed a 5% stock dividend for the eighteenthnineteenth consecutive year on December 19, 2011.year. All per share and average share data in this report has been restated to reflect the 20112012 stock dividend.
Critical Accounting Policies
The Company's consolidated financial statements are prepared based on the application of certain accounting policies, the most significant of which are described in Note 1 to the consolidated financial statements. Certain of these policies require numerous estimates and strategic or economic assumptions that may prove inaccurate or be subject to variations which may significantly affect the Company's reported results and financial position for the current period or future periods. The use of estimates, assumptions, and judgments are necessary when financial assets and liabilities are required to be recorded at, or adjusted to reflect, fair value. Current economic conditions may require the use of additional estimates, and some estimates may be subject to a greater degree of uncertainty due to the current instability of the economy. The Company has identified several policies as being critical because they require management to make particularly difficult, subjective and/or complex judgments about matters that are inherently uncertain and because of the likelihood that materially different amounts would be reported under different conditions or using different assumptions. These policies relate to the allowance for loan losses, the valuation of certain investment securities, and accounting for income taxes.
Allowance for Loan Losses
The Company performs periodic and systematic detailed reviews of its loan portfolio to assess overall collectability. The level of the allowance for loan losses reflects the Company's estimate of the losses inherent in the loan portfolio at any point in time. While these estimates are based on substantive methods for determining allowance requirements, actual outcomes may differ significantly from estimated results, especially when determining allowances for business, lease, construction and business real estate loans. These loans are normally larger and more complex, and their collection rates are harder to predict. Personal banking loans, including personal mortgage,real estate, credit card and consumer loans, are individually smaller and perform in a more homogenous manner, making loss estimates more predictable. Further discussion of the methodology used in establishing the allowance is provided in the Allowance for Loan Losses section of this discussionItem 7 and in Note 1.1 to the consolidated financial statements.
Valuation of Investment Securities
The Company carries its investment securities at fair value and employs valuation techniques which utilize observable inputs when those inputs are available. These observable inputs reflect assumptions market participants would use in pricing the security and are developed based on market data obtained from sources independent of the Company. When such information is not available, the Company employs valuation techniques which utilize unobservable inputs, or those which reflect the Company’s own assumptions about market participants, based on the best information available in the circumstances. These valuation methods
typically involve cash flow and other financial modeling techniques. Changes in underlying factors, assumptions, estimates, or other inputs to the valuation techniques could have a material impact on the Company's future financial condition and results of operations. Assets and liabilities carried at fair value inherently result in more financial statement volatility. Under the fair value measurement hierarchy, fair value measurements are classified as Level 1 (quoted prices), Level 2 (based on observable inputs) or Level 3 (based on unobservable, internally-derived inputs), as discussed in more detail in Note 15 on Fair Value Measurements. Most of the available for sale investment portfolio is priced utilizing industry-standard models that consider various assumptions observable in the marketplace or which can be derived from observable data. Such securities totaled approximately $$8.78.9 billion, or 94.4%93.9% of the available for sale portfolio at December 31, 20112012, and were classified as Level 2 measurements. The Company also holds $$135.6126.4 million in auction rate securities. These were classified as Level 3 measurements, as no liquid market currently exists for these securities, and fair values were derived from internally generated cash flow valuation models which used unobservable inputs significant to the overall measurement.
Changes in the fair value of available for sale securities, excluding credit losses relating to other-than-temporary impairment, are reported in other comprehensive income. The Company periodically evaluates the available for sale portfolio for other-than-temporary impairment. Evaluation for other-than-temporary impairment is based on the Company’s intent to sell the security and whether it is likely that it will be required to sell the security before the anticipated recovery of its amortized cost basis. If either of these conditions is met, the entire loss (the amount by which the amortized cost exceeds the fair value) must be recognized in current earnings. If neither condition is met, but the Company does not expect to recover the amortized cost basis, the Company must determine whether a credit loss has occurred. This credit loss is the amount by which the amortized cost basis exceeds the present value of cash flows expected to be collected from the security. The credit loss, if any, must be recognized in current earnings, while the remainder of the loss, related to all other factors, is recognized in other comprehensive income.
The estimation of whether a credit loss exists and the period over which the security is expected to recover requires significant judgment. The Company must consider available information about the collectability of the security, including information about past events, current conditions, and reasonable forecasts, which includes payment structure, prepayment speeds, expected defaults, and collateral values. Changes in these factors could result in additional impairment, recorded in current earnings, in future periods.
At December 31, 20112012, certain non-agency guaranteed mortgage-backed securities with a parfair value of $143.3101.7 million were identified as other-than-temporarily impaired. The cumulative credit-related impairment loss initially recorded on these securities amounted to $9.9$11.6 million, which was recorded in the consolidated income statement.statements of income.
The Company, through its direct holdings and its private equity subsidiaries, has numerous private equity investments, categorized as non-marketable securities in the accompanying consolidated balance sheets. These investments are reported at fair value and totaled $70.573.2 million at December 31, 20112012. Changes in fair value are reflected in current earnings and reported in investment securities gains (losses), net, in the consolidated income statements.statements of income. Because there is no observable market data for these securities, fair values are internally developed using available information and management’s judgment, and the securities are classified as Level 3 measurements. Although management believes its estimates of fair value reasonably reflect the fair value of these securities, key assumptions regarding the projected financial performance of these companies, the evaluation of the investee company’s management team, and other economic and market factors may affect the amounts that will ultimately be realized from these investments.
Accounting for Income Taxes
Accrued income taxes represent the net amount of current income taxes which are expected to be paid attributable to operations as of the balance sheet date. Deferred income taxes represent the expected future tax consequences of events that have been recognized in the financial statements or income tax returns. Current and deferred income taxes are reported as either a component of other assets or other liabilities in the consolidated balance sheets, depending on whether the balances are assets or liabilities. Judgment is required in applying generally accepted accounting principles in accounting for income taxes. The Company regularly monitors taxing authorities for changes in laws and regulations and their interpretations by the judicial systems. The aforementioned changes, as well as any changes that may result from the resolution of income tax examinations by federal and state taxing authorities, may impact the estimate of accrued income taxes and could materially impact the Company’s financial position and results of operations.
Net Interest Income
Net interest income, the largest source of revenue, results from the Company’s lending, investing, borrowing, and deposit gathering activities. It is affected by both changes in the level of interest rates and changes in the amounts and mix of interest earning assets and interest bearing liabilities. The following table summarizes the changes in net interest income on a fully taxable equivalent basis, by major category of interest earning assets and interest bearing liabilities, identifying changes related to volumes and rates. Changes not solely due to volume or rate changes are allocated to rate.
| | | | 2011 | 2010 | 2012 | 2011 |
| | Change due to | | Change due to | | Change due to | | Change due to | |
| (In thousands) | Average Volume | Average Rate | Total | Average Volume | Average Rate | Total | Average Volume | Average Rate | Total | Average Volume | Average Rate | Total |
| Interest income, fully taxable equivalent basis | | |
| Loans | $ | (18,171 | ) | $ | (25,066 | ) | $ | (43,237 | ) | $ | (40,397 | ) | $ | (7,643 | ) | $ | (48,040 | ) | $ | 7,898 |
| $ | (24,813 | ) | $ | (16,915 | ) | $ | (18,171 | ) | $ | (25,066 | ) | $ | (43,237 | ) |
| Loans held for sale | (5,292 | ) | 316 |
| (4,976 | ) | (809 | ) | (1,319 | ) | (2,128 | ) | (882 | ) | 128 |
| (754 | ) | (5,292 | ) | 316 |
| (4,976 | ) |
| Investment securities: | | |
| U.S. government and federal agency obligations | (1,787 | ) | 9,382 |
| 7,595 |
| 10,767 |
| (7,848 | ) | 2,919 |
| (1,231 | ) | (3,777 | ) | (5,008 | ) | (1,787 | ) | 9,382 |
| 7,595 |
|
| Government-sponsored enterprise obligations | 1,112 |
| 78 |
| 1,190 |
| 2,009 |
| (1,637 | ) | 372 |
| 1,223 |
| (1,351 | ) | (128 | ) | 1,112 |
| 78 |
| 1,190 |
|
| State and municipal obligations | 9,786 |
| (3,267 | ) | 6,519 |
| 4,676 |
| (3,089 | ) | 1,587 |
| 8,945 |
| (6,877 | ) | 2,068 |
| 9,786 |
| (3,267 | ) | 6,519 |
|
| Mortgage-backed securities | 29,458 |
| (28,275 | ) | 1,183 |
| 927 |
| (24,626 | ) | (23,699 | ) | 9,548 |
| (16,426 | ) | (6,878 | ) | 29,458 |
| (28,275 | ) | 1,183 |
|
| Asset-backed securities | 9,168 |
| (17,204 | ) | (8,036 | ) | 33,369 |
| (24,976 | ) | 8,393 |
| 6,017 |
| (4,600 | ) | 1,417 |
| 9,168 |
| (17,204 | ) | (8,036 | ) |
| Other securities | (1,007 | ) | 1,521 |
| 514 |
| (726 | ) | 805 |
| 79 |
| (555 | ) | 3,016 |
| 2,461 |
| (1,007 | ) | 1,521 |
| 514 |
|
Short-term federal funds sold and securities purchased under agreements to resell | 31 |
| (24 | ) | 7 |
| (206 | ) | 32 |
| (174 | ) | 30 |
| (3 | ) | 27 |
| 31 |
| (24 | ) | 7 |
|
Long-term securities purchased under agreements to resell | 10,495 |
| 411 |
| 10,906 |
| 2,549 |
| — |
| 2,549 |
| 2,165 |
| 3,554 |
| 5,719 |
| 10,495 |
| 411 |
| 10,906 |
|
| Interest earning deposits with banks | 56 |
| 4 |
| 60 |
| (385 | ) | 5 |
| (380 | ) | (147 | ) | (1 | ) | (148 | ) | 56 |
| 4 |
| 60 |
|
| Total interest income | 33,849 |
| (62,124 | ) | (28,275 | ) | 11,774 |
| (70,296 | ) | (58,522 | ) | 33,011 |
| (51,150 | ) | (18,139 | ) | 33,849 |
| (62,124 | ) | (28,275 | ) |
| Interest expense | | |
| Interest bearing deposits: | | |
| Savings | 61 |
| 169 |
| 230 |
| 60 |
| (80 | ) | (20 | ) | 78 |
| (128 | ) | (50 | ) | 61 |
| 169 |
| 230 |
|
| Interest checking and money market | 4,059 |
| (7,731 | ) | (3,672 | ) | 5,618 |
| (7,731 | ) | (2,113 | ) | 2,273 |
| (9,397 | ) | (7,124 | ) | 4,059 |
| (7,731 | ) | (3,672 | ) |
| Time open and C.D.’s of less than $100,000 | (4,722 | ) | (6,797 | ) | (11,519 | ) | (8,420 | ) | (20,691 | ) | (29,111 | ) | (1,445 | ) | (1,989 | ) | (3,434 | ) | (4,722 | ) | (6,797 | ) | (11,519 | ) |
| Time open and C.D.’s of $100,000 and over | 763 |
| (5,338 | ) | (4,575 | ) | (7,117 | ) | (14,407 | ) | (21,524 | ) | (766 | ) | (1,332 | ) | (2,098 | ) | 763 |
| (5,338 | ) | (4,575 | ) |
| Federal funds purchased and securities sold under agreements to repurchase | (90 | ) | (753 | ) | (843 | ) | 295 |
| (1,410 | ) | (1,115 | ) | 219 |
| (1,152 | ) | (933 | ) | (90) |
| (753 | ) | (843 | ) |
| Other borrowings | (11,258 | ) | (10 | ) | (11,268 | ) | (15,064 | ) | (1,515 | ) | (16,579 | ) | 7 |
| (206 | ) | (199 | ) | (11,258 | ) | (10 | ) | (11,268 | ) |
| Total interest expense | (11,187 | ) | (20,460 | ) | (31,647 | ) | (24,628 | ) | (45,834 | ) | (70,462 | ) | 366 |
| (14,204 | ) | (13,838 | ) | (11,187 | ) | (20,460 | ) | (31,647 | ) |
| Net interest income, fully taxable equivalent basis | $ | 45,036 |
| $ | (41,664 | ) | $ | 3,372 |
| $ | 36,402 |
| $ | (24,462 | ) | $ | 11,940 |
| $ | 32,645 |
| $ | (36,946 | ) | $ | (4,301 | ) | $ | 45,036 |
| $ | (41,664 | ) | $ | 3,372 |
|
Net interest income totaled $639.9 million in 2012 compared to $646.1 million in 2011 compared to $645.9 million in 2010.2011. On a tax equivalent basis, net interest income totaled $669.5$665.2 million and increased $3.4decreased $4.3 million overfrom the previous year. This slight increasedecrease was mainly the result of lower interest expense incurred on deposits and other borrowings coupled with higher interest income earned onaverage investment securities balances and securities purchased under agreements to resell,loan balances earning at a lower average rate than the previous year, partially offset by lower interest income earnedrates paid on loans.deposits and borrowings. The net yield on earning assets (tax equivalent) was 3.65%3.41% in 20112012 compared with 3.89%3.65% in the previous year.
During 2012, interest income on loans (tax equivalent, including loans held for sale) declined $17.7 million from 2011 due to a 25 basis point decrease in average rates earned, slightly offset by a $119.2 million increase in average loan balances. The average tax equivalent rate earned on the loan portfolio, including held for sale loans, was 4.82% compared to 5.07% in the previous year, reflecting the overall lower rate environment affecting the industry. Interest earned on business loans decreased $2.6 million as a result of a decline in rates of 15 basis points and was partially offset by a 1.8% increase in average balances. Interest on construction loans decreased $3.7 million due to a $63.5 million decline in average balances coupled with a 23 basis point decrease in average rates. Business real estate average loan balances increased $76.2 million, or 3.6%, while average rates earned decreased by 32 basis points, which together resulted in a net $3.3 million decrease in interest income. Interest income on personal real estate loans and consumer loans declined $3.4 million and $3.7 million, respectively, due to lower rates partially offset by higher average loan balances. Average consumer loan balances increased $61.8 million, which was mainly the result of increases of $123.8 million in auto loans and $33.7 million in fixed rate home equity loans. These increases were partially offset by a $103.9
million decrease in marine and recreational vehicle (RV) loans as that portfolio continues to pay down, as a result of the Company's exit from the marine/RV origination business in 2008. Interest earned on consumer credit card loans increased by $1.2 million due to a 41 basis point increase in the average rate earned, partly offset by the impact of a $16.0 million decrease in average balances.
Tax equivalent interest income on investment securities decreased by $6.1 million in 2012 due to a 38 basis point decrease in average rates earned on these investments, partially offset by a $992.7 million, or 12.3%, increase in average balances outstanding. The average rate earned on the total investment securities portfolio declined from 2.93% in 2011 to 2.55% in 2012. Interest income on mortgage-backed securities decreased $6.9 million in 2012 due to a 43 basis point decrease in rates earned on these securities, offset by an increase of 8.3%, or $296.5 million, in average balances. Interest on asset-backed securities increased slightly due to an increase in average balances of $481.3 million partially offset by a decline in rates of 16 basis points. Interest (tax exempt) on municipal securities increased $2.1 million due to higher average balances, which increased $202.1 million in 2012, partially offset by the impact of a 50 basis point decrease in average rates earned. Interest on U.S. government and federal agency securities decreased by $5.0 million in 2012, which was mostly due to a decrease in inflation income on inflation-protected securities. Interest on long-term resell agreements increased $5.7 million in 2012 compared to the prior year due to a $123.7 million increase in the average balances of these instruments, coupled with an increase in the average rate earned from 1.75% in the previous year to 2.15% in 2012.
During 2012, interest expense on deposits decreased $12.7 million compared to 2011. This was the result of lower rates on all deposit products coupled with a $402.2 million decline in average certificate of deposit balances, but partly offset by the effects of higher average balances of money market and interest checking accounts, which grew by $727.7 million. Average rates paid on deposit balances declined 13 basis points in 2012 to .30%. Interest expense on borrowings declined $1.1 million, mainly the result of average rates declining by 14 basis points to .33%, but partly offset by an increase of $151.0 million, or 14.6% in the average balances of federal funds purchased and securities sold under agreements to repurchase. The average rate paid on total interest bearing liabilities decreased to .30% compared to .43% in 2011.
During 2011, interest income on loans (tax equivalent, including loans held for sale) declined $48.2 million from 2010 due to a $787.4 million decrease in average loan balances, coupled with an 8 basis point decrease in average rates earned. The decrease in average loans compared to the previous year included a decrease of $554.0 million in average student loans, contributing to a decrease in interest income of $10.8 million. The majority of the student loan portfolio, including loans held for sale and held to maturity, was sold in the fourth quarter of 2010. Asas a result of new regulations, regardingeffective in mid 2010, which prohibit banks from originating federally guaranteed student loans, the Company is not originating new student loans. The average tax equivalent rate earned on the loan portfolio, including held for sale loans, was 5.07% compared to 5.15% in the previous year, reflecting the overall lower rate environment in the industry.year. Interest earned on business loans decreased $6.2 million as a result of a decline in rates of 25 basis points, which was offset by a slight increase in average balances. Interest on construction loans decreased $3.6 million due to a decline in average balances, but was offset by higher rates, while interest on personal real estate loans declined $7.5 million due to lower rates and balances. Demand for construction and personal real estate loans continues to be affected by the weak housing industry. Interest on consumer loans decreased $14.1 million from the previous year due to a decline of $131.4 million in average consumer loans coupled with a 47 basis point decrease in rates earned. Most of this decline in average balances was due to a decrease in marine and recreational
vehicle (RV) loans of $125.7 million, resulting from the Company's decision to exit the marine/RV origination business in 2008. Also, interestInterest earned on consumer credit card loans decreased by $4.7 million due to a combination of lower balances and rates earned on these loans.
Tax equivalent interest inincome on investment securities increased by $9.0 million in 2011 compared to 2010 due to a $1.4 billion increase in average balances outstanding, but was offset by lower rates earned on these investments. The average rate earned on the investment securities portfolio declined from 3.40% in 2010 to 2.93% in 2011. Interest income on mortgage-backed securities increased $1.2 million in 2011 due to growth in average balances of $734.6 million but was offset by a decline in rates earned on these securities. Interest on asset-backed securities declined $8.0 million due to a decline in rates of 70 basis points but was offset by higher average balances of $470.2 million. Interest (tax exempt) on municipal securities increased $6.5 million mainly due to higher average balances, which increased $208.1 million in 2011. Interest on U.S. government, agency and government sponsoredgovernment-sponsored enterprise securities grew by $8.8 million in 2011, which was mostly due to an increase of $7.0 million in inflation income on certain inflation-protected securities. Interest on long-term resell agreements also increased $10.9 million in 2011 compared to the prior year, due to a $618.7 million increase in the average balances of these instruments in 2011.
During 2011, interestInterest expense on deposits decreased $19.5 million in 2011 compared to 2010. This was mainly the result of lower rates on most deposit products coupled with a $283.5 million decline in average certificate of deposit balances, butand partly offset by the effects of higher average balances of money market and interest checking accounts, which grew by $917.6 million. Average rates paid on deposit balances declined 21 basis points to .43% in 2011 to .43%.from .64% in 2010. Interest expense on borrowings declined $12.1 million, mainly the result of lower average FHLB advances, which decreased $339.8 million, or 76.5%, due to scheduled maturities of advances and the early pay off of $125.0 million in the fourth quarter of 2010. The average rate paid on total interest bearing liabilities decreased to .43% compared to .71% in 2010.
During 2010, interest income on loans (tax equivalent) declined $48.0 million from 2009 due to lower average balances on most loan categories, coupled with lower rates earned on personal real estate and other personal banking loan products. The average tax equivalent rate earned on the loan portfolio was 5.28% compared to 5.27% in the previous year. Total average loan balances decreased $931.2 million, or 8.8%, reflecting declinesTable of $346.8 million in business and business real estate loans, $182.6 million in construction loans, $109.2 million in personal real estate loans and $214.1 million in consumer loans. The decrease in business, business real estate and personal real estate loans was the result of loan principal pay downs and lower line of credit usage, which exceeded new loan origination due to lower demand. The decline in construction loans was mainly due to the weak housing economy and the Company's efforts to reduce this portfolio. In October 2010, the Company sold its entire held to maturity student loan portfolio, which totaled approximately $311.0 million, to another loan servicer. In the second half of 2010, the Company sold most of the student loans held for sale, which were federally guaranteed, and new regulations prohibit the Company from originating new federally guaranteed student loans in the future. Tax equivalent interest earned on investment securities decreased by $10.3 million, or 4.3%, due to lower rates earned, partly offset by higher average balances of securities. The average rate earned on the investment securities portfolio declined from 4.54% in 2009 to 3.40% in 2010, resulting in a decline in interest income of approximately $61.4 million due to lower rates. The average balances of mortgage and other asset-backed securities, U.S. government and federal agency securities, and state and municipal obligations increased $1.1 billion, $269.9 million and $93.1 million, respectively. Average tax equivalent rates earned on total interest earning assets in 2010 decreased to 4.38% compared to 4.85% in the previous year, or a decline of 47 basis points.Contents Interest expense on deposits decreased $52.8 million in 2010 compared to 2009. The decline resulted from lower rates paid on all deposit products coupled with a $930.1 million decline in average certificates of deposit, but partly offset by the effects of higher average balances of money market and interest checking accounts, which grew by $1.4 billion. Average rates paid on deposit balances declined 43 basis points from .92% in 2009 to .49% in 2010. Interest expense on borrowings declined $17.7 million, mainly the result of lower rates paid on total debt and lower average balances outstanding of FHLB borrowings. The average balance of FHLB borrowings decreased $383.7 million, partly due to scheduled maturities of advances and partly due to the early pay off of $125.0 million in advances prior to maturity. The average rate paid on total interest bearing liabilities decreased to .56% compared to 1.04% in 2009.
Provision for Loan Losses
The provision for loan losses totaled $51.5$27.3 million in 2011,2012, which represented a decrease of $48.5$24.2 million from the 20102011 provision of $100.0$51.5 million. Net loan charge-offs for the year totaled $64.5$39.3 million compared with $96.9$64.5 million in 2010,2011, or a decrease of $32.4$25.2 million. The decrease in net loan charge-offs from the previous year was mainly the result of lower business, construction, consumer and consumer credit card and consumer losses, which declined $8.1$7.5 million, $8.3$7.2 million, $7.1 million and $16.1$4.0 million, respectively. The allowance for loan losses totaled $184.5$172.5 million at December 31, 2011,2012, a decrease of $13.0$12.0 million compared to the prior year, and represented 2.01%1.75% of outstanding loans. The provision for loan losses is recorded to bring the allowance for loan losses to a level deemed adequate by management based on the factors mentioned in the following “Allowance for Loan Losses” section of this discussion.
Non-Interest Income
| | | | | % Change | | % Change |
| (Dollars in thousands) | 2011 | 2010 | 2009 | '11-'10 | '10-'09 | 2012 | 2011 | 2010 | '12-'11 | '11-'10 |
| Bank card transaction fees | $ | 157,077 |
| $ | 148,888 |
| $ | 122,124 |
| 5.5 | % | 21.9 | % | $ | 154,197 |
| $ | 157,077 |
| $ | 148,888 |
| (1.8 | )% | 5.5 | % |
| Trust fees | 88,313 |
| 80,963 |
| 76,831 |
| 9.1 |
| 5.4 |
| 94,679 |
| 88,313 |
| 80,963 |
| 7.2 |
| 9.1 |
|
| Deposit account charges and other fees | 82,651 |
| 92,637 |
| 106,362 |
| (10.8 | ) | (12.9 | ) | 79,485 |
| 82,651 |
| 92,637 |
| (3.8 | ) | (10.8 | ) |
| Bond trading income | 19,846 |
| 21,098 |
| 22,432 |
| (5.9 | ) | (5.9 | ) | |
| Capital market fees | | 21,066 |
| 19,846 |
| 21,098 |
| 6.1 |
| (5.9 | ) |
| Consumer brokerage services | 10,018 |
| 9,190 |
| 10,831 |
| 9.0 |
| (15.2 | ) | 10,162 |
| 10,018 |
| 9,190 |
| 1.4 |
| 9.0 |
|
| Loan fees and sales | 7,580 |
| 23,116 |
| 21,273 |
| (67.2 | ) | 8.7 |
| 6,037 |
| 7,580 |
| 23,116 |
| (20.4 | ) | (67.2 | ) |
| Other | 27,432 |
| 29,219 |
| 36,406 |
| (6.1 | ) | (19.7 | ) | 34,004 |
| 27,432 |
| 29,219 |
| 24.0 |
| (6.1 | ) |
| Total non-interest income | $ | 392,917 |
| $ | 405,111 |
| $ | 396,259 |
| (3.0 | )% | 2.2 | % | $ | 399,630 |
| $ | 392,917 |
| $ | 405,111 |
| 1.7 | % | (3.0 | )% |
| Non-interest income as a % of total revenue* | 37.8 | % | 38.5 | % | 38.4 | % | | 38.4 | % | 37.8 | % | 38.5 | % | |
| Total revenue per full-time equivalent employee | $ | 219.0 |
| $ | 211.1 |
| $ | 201.3 |
| | $ | 220.8 |
| $ | 219.0 |
| $ | 211.1 |
| |
| |
| * | Total revenue is calculated as net interest income plus non-interest income. |
Non-interest income totaled $399.6 million, an increase of $6.7 million, or 1.7%, compared to $392.9 million in 2011. Bank card fees declined $2.9 million, or 1.8%, from last year, as a decreaseresult of a decline in debit card interchange fees of $19.3 million, or 35.7% (mainly the effect of new pricing regulations effective in the fourth quarter of 2011), which was partly offset by continued growth in corporate card fees of $13.0 million, or 22.4%. Corporate card and debit card fees for 2012 totaled $70.8 million and $34.6 million, respectively. Merchant fees grew by 8.9% due to higher transaction volumes and totaled $26.2 million for the year, while credit card fees grew 5.9% and totaled $22.6 million. Trust fee income increased $6.4 million, or 7.2%, resulting mainly from growth in personal and institutional trust fees. The market value of total customer trust assets (on which fees are charged) totaled $30.2 billion at year end 2012 and grew 10.7% over year end 2011. Deposit account fees decreased $3.2 million, or 3.8%, primarily due to a decline in overdraft and return item fees of $6.5 million, while various other deposit fees increased $3.4 million. Overdraft fees comprised 43.3% of total deposit account fees in 2012, down from 49.5% in 2011. Corporate cash management fees comprised 40.3% of total deposit account fees in 2012 and were flat compared to 2011. Capital market fees increased $1.2 million, or 6.1%, resulting from growth in sales of mainly fixed income securities to correspondent banks and other commercial customers. Consumer brokerage services revenue increased $144 thousand, or 1.4%, due to growth in advisory fees, mostly offset by lower life insurance revenue. Loan fees and sales revenue was down $1.5 million, or 20.4%, due to a decline in mortgage banking revenue (mainly because the Company retained all first mortgage loan originations in 2012). Other non-interest income increased by $6.6 million, or 24.0%, mainly due to higher tax credit sales income, leasing revenue and net gains related to banking properties in 2012.
During 2011, non-interest income decreased $12.2 million, or 3.0%, comparedfrom 2010 to $405.1 million in 2010.$392.9 million. Bank card fees increased $8.2 million, or 5.5%, over last year,2010, primarily due to continued growth in transaction fees earned on corporate card and merchant activity, which grew by 19.7% and 5.4%, respectively. The growth in corporate card fees resulted from continued expansion in transaction volumes from existing customers and activity from new customers, while merchant sales volumes were strong. Debit card fees declined $3.1 million, or 5.4%, as a result of new regulations for pricing debit card transactions, which were effective October 1, 2011. These fees declined $7.1 million in the fourth quarter of 2011 compared to the previous quarter. Debit card fees totaled $53.9 million in 2011 and comprised 34.3% of total bank card fees, while corporate card fees totaled $57.8 million and comprised 36.8% of total fees. Trust fee income increased $7.4 million, or 9.1%, as a result of growth in personal and institutional trust fees. Trust revenue continues to be negatively affected by waived fees on certain low earning money market investment accounts. The market value of total customer trust assets (on which fees are charged) totaled $27.3 billion at year end 2011 and grew 8.9% over year end 2010. Deposit account fees decreased $10.0 million, or 10.8%, due mainly to lower overdraft fees resulting in part from new regulations in 2010. Overdraft fees comprised 49.5% of total deposit account fee income in 2011, down from 55.2% in 2010. Bond trading incomeCapital market fees decreased $1.3 million, or 5.9%, due to lower securities sales to correspondent banks and other commercial customers, while consumer brokerage services revenue increased by $828 thousand, or 9.0%, due to growth in advisory fees. Compared with last year,2010, loan fees and sales declined $15.5 million in 2011 due to a decline in gains on student loan sales, as the Company exited from the student loan origination business in 2010. Other income decreased $1.8 million largely due to higher write-downs in 2011 on various banking properties held for sale.
During 2010, non-interest income increased $8.9 million, or 2.2%, over 2009 to $405.1 million. Bank card fees increased $26.8 million, or 21.9%, due to growthTable of 50.2%, 13.2%, and 15.6% in corporate card, debit card and merchant transactions, respectively. Trust fee income increased $4.1 million, or 5.4%, as a result of growth in personal and institutional trust fees, partly offset by lower corporate fees. While most of the growth in trust fees came from private client business, fees from institutional trust services also grew $1.5 million, or 10.2%, in 2010. The market value of total customer trust assets totaled $25.1 billion at year end 2010 and grew 13.5% over year end 2009. Deposit account fees declined $13.7 million, or 12.9%, from the prior year as a result of a $13.6 million decline in overdraft fee revenue due to the regulations mentioned above. Also, corporate cash management fees, which comprised 35.7% of total deposit account fees in 2010, declined 1.9% as compared to 2009, due to lower sales/activity. Bond trading income declined $1.3 million, or 5.9%, due to lower sales volume, while consumer brokerage services revenue declined $1.6 million, or 15.2%, mainly due to lower fees earned on mutual fund sales. Loan fees and sales increased by $1.8 million over 2009. This increase included a $6.9 million gain recorded on the sale of the Company’s held to maturity portfolio of student loans in late 2010, partly offset by a $5.3 million decline in gains on sales of loans held for sale and adjustments to related impairment reserves. Other non-interest income decreased by $7.2 million partly due to impairment charges of $2.0 million on certain bank premises, coupled with other fixed asset retirements. Also included were declines in cash sweep commissions and equipment rental income, partially offset by higher fees on letters of credit and foreign exchange transactions.Contents Investment Securities Gains (Losses), Net
Net gains and losses on investment securities during 2012, 2011 2010 and 20092010 are shown in the table below. Included in these amounts are gains and losses arising from sales of bonds from the Company’s available for sale portfolio, including credit-related losses on debt securities identified as other-than-temporarily impaired. Also shown below are gains and losses relating to non-marketable private equity investments, which are primarily held by the Parent’s majority-owned private equity subsidiaries. These include fair value adjustments, in addition to gains and losses realized upon disposition. Portions of the fair value adjustments attributable to minority interests are reported as non-controlling interest in the consolidated statements of income statement and resulted in expense of $1.3 million and $2.6 million in 2012 and 2011, respectively, and income of $108 thousand and $1.1 million in 2010 and 2009, respectively.2010.
Net securities gains of $10.8$4.8 million were recorded in 2011,2012, which include $13.2$6.0 million in gains resulting from sales and fair value adjustments related to private equity investments. Partly offsetting these gains were credit-related impairment losses of $2.5$1.5 million on certain non-agency guaranteed mortgage-backed securities which have been identified as other-than-temporarily impaired. These identified securities had a total parfair value of $143.3$101.7 million at December 31, 2011.2012. The cumulative credit-related impairment losslosses initially recorded on these securities recorded in earnings, amounted to $10.1totaled $11.6 million.
Net securities lossesgains of $1.8$10.8 million were recorded in 2010,2011, compared to net losses of $7.2$1.8 million in 2009.2010. Gains of $13.2 million in 2011 resulted from sales and fair value adjustments related to private equity investments. Partly offsetting these gains were credit-related other-than-temporary impairment (OTTI) losses of $2.5 million. Losses in 2010 were comprised of $5.1 million of credit-related other-than-temporary impairment (OTTI)in OTTI losses, partly offset by $3.5 million of net gains resulting from sales from the available for sale portfolio, mainly in municipal and mortgage-backed bonds. Losses in 2009 were comprised of $2.5 million in OTTI losses and $5.0 million in losses from sales and fair value adjustments on private equity investments, partly offset by $322 thousand of net gains on sales from the available for sale portfolio.
| | | (In thousands) | 2011 | 2010 | 2009 | 2012 | 2011 | 2010 |
Available for sale: | | |
| U.S. government bonds | $ | — |
| $ | — |
| $ | 5,342 |
| |
| Municipal bonds | 177 |
| 1,172 |
| (24 | ) | $ | 16 |
| $ | 177 |
| $ | 1,172 |
|
| Corporate bonds | — |
| 498 |
| 4,877 |
| — |
| — |
| 498 |
|
| Agency mortgage-backed bonds | — |
| 1,434 |
| — |
| 342 |
| — |
| 1,434 |
|
| Non-agency mortgage-backed bonds | — |
| 384 |
| (9,948 | ) | — |
| — |
| 384 |
|
| Asset-backed bonds | — |
| — |
| 75 |
| |
| OTTI losses on non-agency mortgage-backed bonds | (2,537 | ) | (5,069 | ) | (2,473 | ) | (1,490 | ) | (2,537 | ) | (5,069 | ) |
| Non-marketable: | | |
| Private equity investments | 13,172 |
| (204 | ) | (5,044 | ) | 5,960 |
| 13,172 |
| (204 | ) |
| Total investment securities gains (losses), net | $ | 10,812 |
| $ | (1,785 | ) | $ | (7,195 | ) | $ | 4,828 |
| $ | 10,812 |
| $ | (1,785 | ) |
Non-Interest Expense
| | | | | % Change | | % Change |
| (Dollars in thousands) | 2011 | 2010 | 2009 | '11-'10 | '10-'09 | 2012 | 2011 | 2010 | '12-'11 | '11-'10 |
| Salaries | $ | 293,318 |
| $ | 292,675 |
| $ | 290,289 |
| .2 | % | .8 | % | $ | 302,675 |
| $ | 293,318 |
| $ | 292,675 |
| 3.2 | % | .2 | % |
| Employee benefits | 52,007 |
| 53,875 |
| 55,490 |
| (3.5 | ) | (2.9 | ) | 58,224 |
| 52,007 |
| 53,875 |
| 12.0 |
| (3.5 | ) |
| Net occupancy | 46,434 |
| 46,987 |
| 45,925 |
| (1.2 | ) | 2.3 |
| 45,534 |
| 46,434 |
| 46,987 |
| (1.9 | ) | (1.2 | ) |
| Equipment | 22,252 |
| 23,324 |
| 25,472 |
| (4.6 | ) | (8.4 | ) | 20,147 |
| 22,252 |
| 23,324 |
| (9.5 | ) | (4.6 | ) |
| Supplies and communication | 22,448 |
| 27,113 |
| 32,156 |
| (17.2 | ) | (15.7 | ) | 22,321 |
| 22,448 |
| 27,113 |
| (.6 | ) | (17.2 | ) |
| Data processing and software | 68,103 |
| 67,935 |
| 61,789 |
| .2 |
| 9.9 |
| 73,798 |
| 68,103 |
| 67,935 |
| 8.4 |
| .2 |
|
| Marketing | 16,767 |
| 18,161 |
| 18,231 |
| (7.7 | ) | (.4 | ) | 15,106 |
| 16,767 |
| 18,161 |
| (9.9 | ) | (7.7 | ) |
| Deposit insurance | 13,123 |
| 19,246 |
| 27,373 |
| (31.8 | ) | (29.7 | ) | 10,438 |
| 13,123 |
| 19,246 |
| (20.5 | ) | (31.8 | ) |
| Debit overdraft litigation | 18,300 |
| — |
| — |
| 100.0 |
| — |
| — |
| 18,300 |
| — |
| (100.0 | ) | 100.0 |
|
| Debt extinguishment | — |
| 11,784 |
| — |
| (100.0 | ) | 100.0 |
| — |
| — |
| 11,784 |
| — |
| (100.0 | ) |
| Indemnification obligation | (4,432 | ) | (4,405 | ) | (2,496 | ) | .6 |
| 76.5 | % | |
| Other | 68,929 |
| 74,439 |
| 67,508 |
| (7.4 | ) | 10.3 |
| 70,226 |
| 64,497 |
| 70,034 |
| 8.9 |
| (7.9 | ) |
| Total non-interest expense | $ | 617,249 |
| $ | 631,134 |
| $ | 621,737 |
| (2.2 | )% | 1.5 | % | $ | 618,469 |
| $ | 617,249 |
| $ | 631,134 |
| .2 | % | (2.2 | )% |
| Efficiency ratio | 59.1 | % | 59.7 | % | 59.9 | % | | 59.3 | % | 59.1 | % | 59.7 | % | |
| Salaries and benefits as a % of total non-interest expense | 55.9 | % | 54.9 | % | 55.6 | % | | 58.4 | % | 55.9 | % | 54.9 | % | |
| Number of full-time equivalent employees | 4,745 |
| 4,979 |
| 5,125 |
| | 4,708 |
| 4,745 |
| 4,979 |
| |
Non-interest expense was $617.2$618.5 million in 2012, an increase of $1.2 million, or .2%, over the previous year. Salaries and benefits expense increased by $15.6 million, or 4.5%, largely due to higher salaries, incentive compensation, medical and retirement expense. Full-time equivalent employees totaled 4,708 at December 31, 2012, a decline of .8% from the prior year. Occupancy expense declined $900 thousand, or 1.9%, primarily resulting from lower depreciation and outside services expense, partly offset by a decline in rent income. Equipment expense decreased $2.1 million, or 9.5%, also due to lower depreciation expense. Supplies and communication expense decreased slightly, while marketing expense was lower by $1.7 million, or 9.9%. Data processing and software expense increased $5.7 million, or 8.4%, mainly due to higher bank card processing expense. Deposit insurance expense declined $2.7 million, or 20.5%, as a result of new FDIC assessment rules which became effective in the second quarter of 2011. Other non-interest expense increased $5.7 million, or 8.9%, mainly due to the accrual in 2012 of $5.2 million for anticipated costs resulting from the proposed settlement of certain Visa-related interchange litigation. Also, during 2011 the Company's indemnification obligation related to Visa litigation was reduced by $4.4 million, and a similar decrease to expense did not occur in 2012. Partly offsetting these increases to other non-interest expense in 2012 were reductions of $853 thousand in regulatory examination fees and $788 thousand in intangible asset amortization, in addition to an increase of $1.7 million in deferred loan origination costs.
In 2011, non-interest expense was $617.2 million, a decrease of $13.9 million, or 2.2%, from the previous year. In December 2011, the Company reached a class-wide settlement on a debit card overdraft lawsuit. The settlement providesprovided for a payment of $18.3 million, which was recorded as expense in 2011. Additionally, the Company's indemnification obligation related to Visa litigation was reduced by $4.4 million in both 2011 and 2010 due to funding actions by Visa. Salaries and benefits expense decreased by $1.2 million, or .4%, due to lower salary expense, medical insurance costs and pension plan expense, partly offset by higher incentive compensation. Total salaries expense was up $643 thousand, or .2%, over 2010, while the number of full-time equivalent employees declined 4.7% to 4,745 at December 31, 2011. Occupancy costs decreased $553 thousand, or 1.2%, primarily resulting
from lower depreciation expense and outside services expense. Equipment expense decreased $1.1 million, or 4.6%, due to lower equipment rental and service contract expense. Supplies and communication expense declined $4.7 million, or 17.2%, due to lower costs for customer checks, postage, paper supplies and telephone and network costs. Data processing and software costs increased slightly due to higher bank card processing costs, which were partly offset by lower student loan servicing costs. Marketing expense declined $1.4 million, or 7.7%, while deposit insurance was lower by $6.1 million, or 31.8%, mainly as a resultbecause of newthe FDIC assessment rules which became effective in the second quarter of 2011.rule change mentioned above. Other non-interest expense decreased $5.5 million, or 7.4%7.9%, largely due to a decline in foreclosed property costs of $6.7 million, which was due to lower write-downs to fair value, sale losses and other holding costs in 2011.
In 2010, non-interest expense Additionally, the Company's indemnification obligation related to Visa litigation was $631.1 million, an increase of $9.4 million, or 1.5%, over the previous year. Non-interest expense included a debt pre-payment penalty of $11.8reduced by $4.4 million in 2010, in addition to reductions in the Visa indemnification obligation of $4.4 millionboth 2011 and $2.5 million in 2010 and 2009, respectively. Excluding these items, non-interest expense would have amounted to $623.8 million in 2010, a decrease of $478 thousand from the prior year. Salaries and benefits grew $771 thousand, or .2%, in 2010 compared to 2009 mainly as a result of higher costs for incentives and 401K plan contributions, offset by lower costs for base salaries, pension and medical plans. Occupancy costs increased $1.1 million, or 2.3%, primarily resulting from higher real estate taxes and utilities expense. Equipment costs decreased $2.1 million in 2010 as compared to 2009 mainly due to lower depreciation on data processing equipment. Supplies and communication expense declined $5.0 million, or 15.7%, which reflected certain initiatives to reduce paper supplies, customer checks and courier costs. Data processing and software costs grew $6.1 million, primarily due to higher bank card processing costs, which increased in proportion to the growth in bank card revenues. Deposit insurance decreased $8.1 million in 2010 compared to 2009, mainly due to a special assessment leviedfunding actions by the FDIC in 2009 which did not reoccur in 2010. Other non-interest expense increased $6.9 million and included higher foreclosed property expense of $6.3 million, which increased due to higher write-downs to fair value and additional holding costs. Also included were higher costs for professional services, partially offset by lower operating losses.Visa.
Income Taxes
Income tax expense was $127.2 million in 2012, compared to $121.4 million in 2011 compared toand $96.2 million in 2010 and $73.8 million2010. The increase in 2009. Incomeincome tax expense inover 2011 increased 26.1% over 2010, comparedwas proportional to a 19.8%the increase in pre-tax income. The effective tax rate, including the effect of non-controlling interest, in 2012 and 2011 was 32.1%, compared to 30.3% and 30.4% in 2011, 2010 and 2009, respectively.2010. The Company's effective tax rate in 2012 and 2011 iswas higher than in 2010 and 2009 primarily due to increased state and local taxes. The Company’s effective tax rates in the years noted above were lower than the federal statutory rate of 35% mainly due to tax-exempt interest on state and local municipal obligations.
Financial Condition
Loan Portfolio Analysis
Classifications of consolidated loans by major category at December 31 for each of the past five years are shown in the table below. This portfolio consists of loans which were acquired or originated with the intent of holding to their maturity. Loans held for sale are separately discussed in a following section. A schedule of average balances invested in each loan category below appears on page 52.50.
| | | | Balance at December 31 | Balance at December 31 |
| (In thousands) | 2011 | 2010 | 2009 | 2008 | 2007 | 2012 | 2011 | 2010 | 2009 | 2008 |
| Commercial: | | |
| Business | $ | 2,808,265 |
| $ | 2,957,043 |
| $ | 2,877,936 |
| $ | 3,404,371 |
| $ | 3,257,047 |
| $ | 3,134,801 |
| $ | 2,808,265 |
| $ | 2,957,043 |
| $ | 2,877,936 |
| $ | 3,404,371 |
|
| Real estate — construction and land | 386,598 |
| 460,853 |
| 665,110 |
| 837,369 |
| 668,701 |
| 355,996 |
| 386,598 |
| 460,853 |
| 665,110 |
| 837,369 |
|
| Real estate — business | 2,180,100 |
| 2,065,837 |
| 2,104,030 |
| 2,137,822 |
| 2,239,846 |
| 2,214,975 |
| 2,180,100 |
| 2,065,837 |
| 2,104,030 |
| 2,137,822 |
|
| Personal banking: | | |
| Real estate — personal | 1,428,777 |
| 1,440,386 |
| 1,537,687 |
| 1,638,553 |
| 1,540,289 |
| 1,584,859 |
| 1,428,777 |
| 1,440,386 |
| 1,537,687 |
| 1,638,553 |
|
| Consumer | 1,114,889 |
| 1,164,327 |
| 1,333,763 |
| 1,615,455 |
| 1,648,072 |
| 1,289,650 |
| 1,114,889 |
| 1,164,327 |
| 1,333,763 |
| 1,615,455 |
|
| Revolving home equity | 463,587 |
| 477,518 |
| 489,517 |
| 504,069 |
| 460,200 |
| 437,567 |
| 463,587 |
| 477,518 |
| 489,517 |
| 504,069 |
|
| Student | — |
| — |
| 331,698 |
| 358,049 |
| — |
| — |
| — |
| — |
| 331,698 |
| 358,049 |
|
| Consumer credit card | 788,701 |
| 831,035 |
| 799,503 |
| 779,709 |
| 780,227 |
| 804,245 |
| 788,701 |
| 831,035 |
| 799,503 |
| 779,709 |
|
| Overdrafts | 6,561 |
| 13,983 |
| 6,080 |
| 7,849 |
| 10,986 |
| 9,291 |
| 6,561 |
| 13,983 |
| 6,080 |
| 7,849 |
|
| Total loans | $ | 9,177,478 |
| $ | 9,410,982 |
| $ | 10,145,324 |
| $ | 11,283,246 |
| $ | 10,605,368 |
| $ | 9,831,384 |
| $ | 9,177,478 |
| $ | 9,410,982 |
| $ | 10,145,324 |
| $ | 11,283,246 |
|
In December 2008, the Company elected to reclassify certain segments of its real estate, business, and consumer portfolios. The reclassifications were made to better align the loan reporting with its related collateral and purpose. Amounts reclassified to real estate construction and land pertained mainly to commercial or residential land and lots which were held by borrowers for future development. Amounts reclassified to personal real estate related mainly to one to four family rental property secured by residential mortgages. The table below shows the effect of the reclassifications on the various lending categories as of the transfer date. Because the information was not readily available and it was impracticable to do so, periods prior to 2008 were not restated.
|
| | | |
| (In thousands) | Effect of reclassification |
| Business | $ | (55,991 | ) |
| Real estate – construction and land | 158,268 |
|
| Real estate – business | (214,071 | ) |
| Real estate – personal | 142,093 |
|
| Consumer | (30,299 | ) |
| Net reclassification | $ | — |
|
The contractual maturities of loan categories at December 31, 2011,2012, and a breakdown of those loans between fixed rate and floating rate loans are as follows:
| | | | Principal Payments Due | | Principal Payments Due | |
| (In thousands) | In One Year or Less | After One Year Through Five Years | After Five Years | Total | In One Year or Less | After One Year Through Five Years | After Five Years | Total |
| Business | $ | 1,403,140 |
| $ | 1,217,035 |
| $ | 188,090 |
| $ | 2,808,265 |
| $ | 1,730,827 |
| $ | 1,127,318 |
| $ | 276,656 |
| $ | 3,134,801 |
|
| Real estate — construction and land | 242,161 |
| 135,515 |
| 8,922 |
| 386,598 |
| 221,623 |
| 129,882 |
| 4,491 |
| 355,996 |
|
| Real estate — business | 617,678 |
| 1,349,474 |
| 212,948 |
| 2,180,100 |
| 575,510 |
| 1,414,276 |
| 225,189 |
| 2,214,975 |
|
| Real estate — personal | 142,855 |
| 395,218 |
| 890,704 |
| 1,428,777 |
| 150,142 |
| 432,700 |
| 1,002,017 |
| 1,584,859 |
|
| Total business and real estate loans | $ | 2,405,834 |
| $ | 3,097,242 |
| $ | 1,300,664 |
| 6,803,740 |
| $ | 2,678,102 |
| $ | 3,104,176 |
| $ | 1,508,353 |
| 7,290,631 |
|
Consumer (1) | | 1,114,889 |
| | 1,289,650 |
|
Revolving home equity (2) | | 463,587 |
| | 437,567 |
|
Consumer credit card (3) | | 788,701 |
| | 804,245 |
|
| Overdrafts | | 6,561 |
| | 9,291 |
|
| Total loans | | $ | 9,177,478 |
| | $ | 9,831,384 |
|
| Loans with fixed rates | $ | 628,522 |
| $ | 1,616,857 |
| $ | 485,129 |
| $ | 2,730,508 |
| $ | 625,216 |
| $ | 1,810,282 |
| $ | 684,576 |
| $ | 3,120,074 |
|
| Loans with floating rates | 1,777,312 |
| 1,480,385 |
| 815,535 |
| 4,073,232 |
| 2,052,886 |
| 1,293,894 |
| 823,777 |
| 4,170,557 |
|
| Total business and real estate loans | $ | 2,405,834 |
| $ | 3,097,242 |
| $ | 1,300,664 |
| $ | 6,803,740 |
| $ | 2,678,102 |
| $ | 3,104,176 |
| $ | 1,508,353 |
| $ | 7,290,631 |
|
| |
| (1) | Consumer loans with floating rates totaled $144.7129.8 million. |
| |
| (2) | Revolving home equity loans with floating rates totaled $459.0431.4 million. |
(3) Consumer credit card loans with floating rates totaled $541.4621.7 million.
Total loans at December 31, 20112012 were $9.2$9.8 billion, a decreasean increase of $233.5$653.9 million, or 2.5%7.1%, fromover balances at December 31, 2010.2011. The declinegrowth in loans during 20112012 occurred principally in business, construction, consumer, business and personal real estate and credit card loans, partly offset by growthdeclines in business real estateconstruction and revolving home equity loans. Business loans decreased $148.8increased $326.5 million, or 5.0%11.6%, reflecting declinesgrowth in commercial, lease, tax-free and agribusiness loans, as demand remained weak and usage on lines of credit continued at low levels.wholesale auto floor plan loans. Business real estate loans were higher by $114.3 million, or 5.5%, due in part to growth in multi-family apartment lending.increased 1.6% as demand for new loans remained soft. Construction loans decreased $74.3$30.6 million, or 16.1%7.9%, which was reflective of continued uncertain economic conditions in the real estate markets and lower overall demand. Personal real estate loans declined $11.6 million and continued to be affected by low demand during most of the weakyear; however, modest growth occurred in the fourth quarter of the year as the housing industry.industry saw some improvement. Personal real estate loans increased $156.1 million, or 10.9%, as the Company retained all first mortgage loan originations in 2012. Consumer loans declined $49.4were higher by $174.8 million, or 15.7%, primarily because the Company ceased mostdue to strong demand for consumer automobile lending, while marine and recreational vehicle lending, from that portfolio several years ago, while consumer auto loans increased duewhich the Company ceased in 2008, continued to higher new loan originations.run off. Revolving home equity
loans decreased $13.9$26.0 million, or 5.6%, due to fewer new account activations. Consumer credit card loans decreasedincreased by $42.3$15.5 million, or 5.1%2.0%, partlymainly due to deleveraging of consumers and the competitiveness of customer promotions among financial institutions.greater usage by existing customers.
The Company currently generates approximately 31%33% of its loan portfolio in the St. Louis market, 29%28% in the Kansas City market, and 40%39% in various other regional markets. The portfolio is diversified from a business and retail standpoint, with 59%58% in loans to businesses and 41%42% in loans to consumers. A balanced approach to loan portfolio management and an historical aversion
toward credit concentrations, from an industry, geographic and product perspective, have contributed to low levels of problem loans and loan losses.
The Company participates in credits of large, publicly traded companies which are defined by regulation as shared national credits, or SNCs. Regulations define SNCs as loans exceeding $20 million that are shared by three or more financial institutions. The Company typically participates in these loans when business operations are maintained in the local communities or regional markets and opportunities to provide other banking services are present. The balance of SNC loans totaled approximately $483.1 million and $538.0 million at December 31, 2012 and 2011, respectively, with an additional $1.1 billion in unfunded commitments.commitments at each period end.
Commercial Loans
Business
Total business loans amounted to $2.8$3.1 billion at December 31, 20112012 and include loans used mainly to fund customer accounts receivable, inventories, and capital expenditures. The business loan portfolio includes tax advantaged financings which carry tax free interest rates. These loans totaled $401.0$435.2 million at December 31, 20112012 and increased 20.9%8.5% over December 31, 2010.2011. The portfolio also includes direct financing and sales type leases totaling $241.8$311.6 million, which are used by commercial customers to finance capital purchases ranging from computer equipment to office and transportation equipment. These leases increased $69.8 million, or 28.9%, over 2011 and comprise 2.6%3.2% of the Company’s total loan portfolio. Also included in this portfolio are corporate card loans, which totaled $166.9$209.3 million at December 31, 2011.2012. These loans, which decreasedincreased by 5.1%25.4% in 2011,2012, are made in conjunction with the Company’s corporate card business, which assists the increasing number of businesses that are shifting from paper checks to a credit card payment system in order to automate payment processes. These loans are generally short-term, with outstanding balances averaging between 7 to 13 days in duration, which helps to limit risk in these loans.
Business loans, excluding corporate card loans, are made primarily to customers in the regional trade area of the Company, generally the central Midwest, encompassing the states of Missouri, Kansas, Illinois, and nearby Midwestern markets, including Iowa, Oklahoma, Colorado and Ohio. TheThis portfolio is diversified from an industry standpoint and includes businesses engaged in manufacturing, wholesaling, retailing, agribusiness, insurance, financial services, public utilities, healthcare, and other service businesses. Emphasis is upon middle-market and community businesses with known local management and financial stability. Consistent with management’s strategy and emphasis upon relationship banking, most borrowing customers also maintain deposit accounts and utilize other banking services. Net loan charge-offsrecoveries in this category totaled $2.5 million in 2012, while net loan charge-offs of $5.0 million were recorded in 2011 (.2%2011. Net loan recoveries mainly resulted from the receipt of average$3.6 million on two non-accrual business loans) and $4.6 million in 2010, remaining low in both years.loans during the second quarter of 2012. Non-accrual business loans were $25.7$13.1 million (.9%(.4% of business loans) at December 31, 20112012 compared to $8.9$25.7 million at December 31, 2010.2011. The increasedecrease was largely due to two new loans, totaling $17.0 million, which were placed onthe payoff of one non-accrual status in 2011.loan of $8.0 million.
Real Estate-Construction and Land
The portfolio of loans in this category amounted to $386.6$356.0 million at December 31, 20112012 and comprised 4.2%3.6% of the Company’s total loan portfolio. These loans are predominantly made to businesses in the local markets of the Company’s banking subsidiary. Commercial construction and land development loans totaled $245.9$225.6 million, or 63.6%63.4% of total construction loans at December 31, 2011.2012. Commercial construction loans are made during the construction phase for small and medium-sized office and medical buildings, manufacturing and warehouse facilities, apartment complexes, shopping centers, hotels and motels, and other commercial properties. Exposure to larger, speculative commercial properties remains low. Commercial land development loans relate to land owned or developed for use in conjunction with business properties. Residential construction and land development loans at December 31, 20112012 totaled $140.7$130.4 million, or 36.4%36.6% of total construction loans. The largest percentage of residential construction and land development loans are for projects located in the Kansas City and St. Louis metropolitan areas. Credit risk in this sector has been high over the last few years, especially in residential land development lending, as a result of the weak housing industry. However, in 20112012, net loan charge-offs continued to fall, decreasing 53.7% to $7.0 million,recoveries of $283 thousand were recorded, compared to net charge-offs of $15.0$7.0 million in 2010. The net charge-offs in 2011, were mainly comprised of $4.7 million in charge-offs on loans to two specific borrowers.reflecting an improved housing environment. Construction and land development loans on non-accrual status declined to $13.7 million at year end 2012 compared to $22.8 million at year end 2011 compared to $52.8 million at year end 2010 with approximately 46%50% of the non-accrual balance at year end 20112012 comprised of loans to three individual borrowers. The Company’s watch list, which includes special
mention and substandard categories, included $20.4$13.8 million of residential land and construction loans which are being closely monitored.
Real Estate-Business
Total business real estate loans were $2.2 billion at December 31, 20112012 and comprised 23.8%22.5% of the Company’s total loan portfolio. This category includes mortgage loans for small and medium-sized office and medical buildings, manufacturing and warehouse facilities, shopping centers, hotels and motels, churches, and other commercial properties. Emphasis is placed on owner-occupied (48.5%(46.7% of this portfolio) and income producing commercial real estate properties, which present lower risk levels. The borrowers and/or the properties are generally located in local and regional markets. Additional information about loans by category is
presented on page 34.32. At December 31, 2011,2012, non-accrual balances amounted to $19.4$17.3 million, or .9%.8%, of the loans in this category, updown from $16.2$19.4 million at year end 2010.2011. The Company experienced net charge-offs of $3.6$5.1 million in 20112012 (.2% of average business real estate loans), compared to net charge-offs of $4.1$3.6 million in 2010.2011. The increase in charge-offs over the prior year was mainly due to a $1.5 million charge-off on a loan to one specific borrower.
Personal Banking Loans
Real Estate-Personal
At December 31, 2011,2012, there were $1.4$1.6 billion in outstanding personal real estate loans, which comprised 15.6%16.1% of the Company’s total loan portfolio. The mortgage loans in this category are mainly for owner-occupied residential properties. The Company originates both adjustable rate and fixed rate mortgage loans. The Company retains adjustable rate mortgage loans, and from time to time retainsin 2012 retained all fixed rate loans as directed by its Asset/Liability Management Committee.Committee, given historically low concentrations of these loans. The Company originates its loans and does not purchase any from outside parties or brokers. Further, it has never maintained or promoted subprime or reduced document products. At December 31, 2011, 48%2012, 40% of the portfolio was comprised of adjustable rate loans while 52%60% was comprised of fixed rate loans. Levels of mortgage loan origination activity increased in 20112012 compared to 2010,2011, with originations of $414 million in 2012 compared with $223 million in 2011 compared with $197 million in 2010.2011. Growth in mortgage loan originations continued to be constrained in 2011 as awas the result of the weakened economy, slower housing starts,improved demand for fixedhousing, in addition to low interest rates, and lower housing sales within the Company’s markets.which also generated greater loan demand. The Company has experienced lower loan losses in this category than many others in the industry and believes this is partly because of its conservative underwriting culture, stable markets, and the fact that it does not offer subprime lending products or purchase loans from brokers. Net loan charge-offs for 20112012 amounted to $2.8$1.4 million, compared to $2.1$2.8 million in the previous year. The non-accrual balances of loans in this category increaseddecreased to $6.9 million at December 31, 2012, compared to $7.6 million at December 31, 2011, compared to $7.3 million at year end 2010.2011.
Consumer
Consumer loans consist of auto, marine, tractor/trailer, recreational vehicle (RV), fixed rate home equity, and other consumer installment loans. These loans totaled $1.1$1.3 billion at year end 2011.2012. Approximately 62% of consumer loans outstanding were originated indirectly from auto and other dealers, while the remaining 38% were direct loans made to consumers. Approximately 32%44% of the consumer portfolio consists of automobile loans, 38%25% in marine and RV loans and 13%16% in fixed rate home equity lending. As mentioned above, total consumer loans declined $49.4increased by $174.8 million in 20112012 as a result of growth in auto lending of $212.0 million, or 59%, partly offset by the run-off of $115.0$92.3 million in marine and RV loans, partly offset by growth in auto lending of $27.4 million, or 8.3%.loans. Net charge-offs on consumer loans were $8.1 million in 2012 compared to $12.2 million in 2011 compared to $20.5 million in 2010.2011. Net charge-offs decreased to 1.1%.7% of average consumer loans in 20112012 compared to 1.6%1.1% in 2010.2011. Consumer loan net charge-offs included marine and RV loan net charge-offs of $9.8$6.6 million, which were 2.1%1.8% of average marine and RV loans in 2011,2012, compared to 2.5%2.1% in 2010.2011.
Revolving Home Equity
Revolving home equity loans, of which 99% are adjustable rate loans, totaled $463.6$437.6 million at year end 2011.2012. An additional $641.3$651.3 million was available in unused lines of credit, which can be drawn at the discretion of the borrower. Home equity loans are secured mainly by second mortgages (and less frequently, first mortgages) on residential property of the borrower. The underwriting terms for the home equity line product permit borrowing availability, in the aggregate, generally up to 80% or 90% of the appraised value of the collateral property at the time of origination. Net charge-offs totaled $1.8 million, or .4% of average revolving home equity loans, compared to $1.7 million in 2011.
Consumer Credit Card
Total consumer credit card loans amounted to $788.7$804.2 million at December 31, 20112012 and comprised 8.6%8.2% of the Company’s total loan portfolio. The credit card portfolio is concentrated within regional markets served by the Company. The Company offers a variety of credit card products, including affinity cards, rewards cards, and standard and premium credit cards, and emphasizes its credit card relationship product, Special Connections. Approximately 62%61% of the households in Missouri that own a Commerce credit card product also maintain a deposit relationship with the subsidiary bank. At December 31, 2011,2012, approximately 69%77% of
the outstanding credit card loan balances had a floating interest rate, compared to 56%69% in the prior year. Net charge-offs amounted to $24.5 million in 2012, a decline of $7.1 million from $31.6 million in 2011, a decline of $16.1 million from $47.7 million in 2010.2011. The ratio of credit card loan net charge-offs to total average credit card loans totaled 3.4% in 2012 compared to 4.2% in 2011 compared to 6.3% in 2010.2011. These ratios however, remain below national loss averages in those years.
Loans Held for Sale
Total loans held for sale at December 31, 20112012 were $31.1$8.8 million, a decrease of $32.7$22.2 million from $63.8$31.1 million at year end 2010. Loans classified as held for sale consist2011. These have historically consisted of federally guaranteed student loans, which the Company no longer originates, and residential mortgage loans.
Most offixed-rate personal real estate loans, which the portfolio is comprised of loansCompany no longer actively sells to students attending colleges and universities, which totaled $28.5 millionthird parties. The balance at December 31, 2011. These loans are normally sold to the secondary market when the2012 was comprised solely of student graduates and the loan enters into
repayment status. Nearly all of these loans are based on variable rates. Because of recent legislation, the Company was required to terminate its guaranteed student loan origination business effectively July 1, 2010, and the 2011 year end balance is largely comprised of loans which have not yet been sold under agreements with various student loan servicing agencies.
The remainder of the held for sale portfolio consists of fixed rate mortgage loans, which are sold in the secondary market, generally within three months of origination. The loans are sold primarily to other financial institutions and federal agencies under industry-standard contracts which require various representations by the Company as to ownership, tax status, document delivery, and compliance with selection criteria underwriting standards, and may obligate the Company to repurchase such loans if these representations cannot be satisfied. The Company did not receive any repurchase requests in 2011, and does not believe there are any significant risks or uncertainties associated with its sales. Mortgage loans held for sale totaled $2.5 million and $10.4 million at December 31, 2011 and 2010, respectively.loans.
Allowance for Loan Losses
The Company has an established process to determine the amount of the allowance for loan losses which assesses the risks and losses inherent in its portfolio. This process provides an allowance consisting of a specific allowance component based on certain individually evaluated loans and a general component based on estimates of reserves needed for pools of loans.
Loans subject to individual evaluation generally consist of business, construction, business real estate and personal real estate loans on non-accrual status, and include troubled debt restructurings that are on non-accrual status. These non-accrual loans are evaluated individually for impairment based on factors such as payment history, borrower financial condition, collateral, current economic conditions and loss experience. For collateral dependent loans, appraisals on collateral (including exit costs) are normally obtained annually but discounted based on date last received and market conditions, so values are conservative and reasonable.conditions. From these evaluations of expected cash flows and collateral values, specific allowances are determined.
Loans which are not individually evaluated are segregated by loan type and sub-type and are collectively evaluated. These loans include commercial loans (business, construction and business real estate) which have been graded pass, special mention or substandard and all personal banking loans, except personal real estate loans on non-accrual status. TheseCollectively-evaluated loans also include certain troubled debt restructurings which are collectively evaluated because they havewith similar risk characteristics. Allowances determined for personal banking loans, which are generally smaller balance homogeneous type loans, use consistent methodologies which consider historical and current loss trends, delinquencies and current economic conditions. Allowances for commercial type loans, which are generally larger and more complex in structure with more unpredictable loss characteristics, use methods which consider historical and current loss trends, current loan grades, delinquencies, industry concentrations, economic conditions throughout the Company's markets as monitored by Company credit officers, and general economic conditions.
The Company’s estimate of the allowance for loan losses and the corresponding provision for loan losses rests upon various judgments and assumptions made by management. Factors that influence these judgments include past loan loss experience, current loan portfolio composition and characteristics, trends in portfolio risk ratings, levels of non-performing assets, and prevailing regional and national economic conditions. The Company has internal credit administration and loan review staffs that continuously review loan quality and report the results of their reviews and examinations to the Company’s senior management and Board of Directors. Such reviews also assist management in establishing the level of the allowance. In using this process and the information available, management must consider various assumptions and exercise considerable judgment to determine the overall level of the allowance for loan losses. Because of these subjective factors, actual outcomes of inherent losses can differ from original estimates. The Company’s subsidiary bank continues to be subject to examination by several regulatory agencies, and examinations are conducted throughout the year, targeting various segments of the loan portfolio for review. Refer to Note 1 to the consolidated financial statements for additional discussion on the allowance and charge-off policies.
At December 31, 2011,2012, the allowance for loan losses was $184.5$172.5 million compared to a balance at year end 20102011 of $197.5$184.5 million. Total loans delinquent 90 days or more and still accruing were $15.0$15.3 million at December 31, 2011,2012, a decreasesmall increase of $5.5 million$389 thousand compared to year end 2010.2011. Non-accrual loans at December 31, 20112012 were $75.5$51.4 million, a decrease of $9.8$24.1 million from the prior year and were mainly comprised of $22.8$17.3 million of business real estate loans, $13.7 million of construction loans $25.7and $13.1 million of business loans and $19.4 million of business real estate loans. As the result of improving credit trends noted in the Company's analysis of the allowance, the provision for loan losses was $13.0$12.0 million less than net charge-offs for the year, thereby reducing the allowance for loan losses to $184.5$172.5 million. The percentage of allowance to loans, excluding loans held for sale, decreased to 2.01%1.75% at December 31, 20112012 compared to 2.10%2.01% at year end 20102011 as a result of the decrease in the allowance balance. The percentage of allowance to non-accrual loans was 244%336% at December 31, 2011.2012.
Net loan charge-offs totaled $64.5$39.3 million in 2011,2012, representing a $32.4$25.2 million decrease compared to net charge-offs of $96.9$64.5 million in 2010.2011. Net recoveries on business loans were $2.5 million in 2012, compared to net charge-offs incurredof $5.0 million in 2011. Net recoveries on construction and land loans were $283 thousand compared to net charge-offs of $7.0 million a decrease of $8.1 million compared to $15.0 million in 2010.2011. Net charge-offs related to consumer loans decreased $8.3 million to $12.2 million at December 31, 2011,
charge-offs related to consumer loans decreased $4.0 million to $8.1 million in 2012, which included net charge-offs of $9.8$6.6 million related to marine and RV loans. Additionally, net charge-offs related to consumer credit cards were $24.5 million in 2012 compared to $31.6 million in 2011 compared to $47.7 million in 2010.2011. Approximately 49.0%62.3% of total net loan charge-offs during 20112012 were related to consumer credit card loans compared to 49.2%49.0% during 2010.2011. Net consumer credit card charge-offs decreased to 4.2%3.4% of average consumer credit card loans in 20112012 compared to 6.3%4.2% in 2010.2011, as a result of an improving economy and lower delinquencies.
The ratio of net charge-offs to total average loans outstanding in 20112012 was .70%.42% compared to .70% in 2011 and 1.00% in 2010 and 1.31% in 2009.2010. The provision for loan losses in 20112012 was $51.5$27.3 million, compared to provisions of $51.5 million in 2011 and $100.0 million in 2010 and $160.7 million in 2009.2010.
The Company considers the allowance for loan losses of $184.5$172.5 million adequate to cover losses inherent in the loan portfolio at December 31, 2011.2012.
The schedules which follow summarize the relationship between loan balances and activity in the allowance for loan losses:
| | | | Years Ended December 31 | Years Ended December 31 |
| (Dollars in thousands) | 2011 | 2010 | 2009 | 2008 | 2007 | 2012 | 2011 | 2010 | 2009 | 2008 |
Loans outstanding at end of year(A) | $ | 9,177,478 |
| $ | 9,410,982 |
| $ | 10,145,324 |
| $ | 11,283,246 |
| $ | 10,605,368 |
| $ | 9,831,384 |
| $ | 9,177,478 |
| $ | 9,410,982 |
| $ | 10,145,324 |
| $ | 11,283,246 |
|
Average loans outstanding(A) | $ | 9,222,568 |
| $ | 9,698,670 |
| $ | 10,629,867 |
| $ | 10,935,858 |
| $ | 10,189,316 |
| $ | 9,379,316 |
| $ | 9,222,568 |
| $ | 9,698,670 |
| $ | 10,629,867 |
| $ | 10,935,858 |
|
| Allowance for loan losses: | | |
| Balance at beginning of year | $ | 197,538 |
| $ | 194,480 |
| $ | 172,619 |
| $ | 133,586 |
| $ | 131,730 |
| $ | 184,532 |
| $ | 197,538 |
| $ | 194,480 |
| $ | 172,619 |
| $ | 133,586 |
|
| Additions to allowance through charges to expense | 51,515 |
| 100,000 |
| 160,697 |
| 108,900 |
| 42,732 |
| 27,287 |
| 51,515 |
| 100,000 |
| 160,697 |
| 108,900 |
|
| Allowances of acquired companies | — |
| — |
| — |
| — |
| 1,857 |
| |
| Loans charged off: | | |
| Business | 6,749 |
| 8,550 |
| 15,762 |
| 7,820 |
| 5,822 |
| 2,809 |
| 6,749 |
| 8,550 |
| 15,762 |
| 7,820 |
|
| Real estate — construction and land | 7,893 |
| 15,199 |
| 34,812 |
| 6,215 |
| 2,049 |
| 1,244 |
| 7,893 |
| 15,199 |
| 34,812 |
| 6,215 |
|
| Real estate — business | 4,176 |
| 4,780 |
| 5,957 |
| 2,293 |
| 2,396 |
| 7,041 |
| 4,176 |
| 4,780 |
| 5,957 |
| 2,293 |
|
| Real estate — personal | 3,217 |
| 2,484 |
| 3,150 |
| 1,765 |
| 181 |
| 2,416 |
| 3,217 |
| 2,484 |
| 3,150 |
| 1,765 |
|
| Consumer | 16,052 |
| 24,587 |
| 35,979 |
| 26,229 |
| 14,842 |
| 12,288 |
| 16,052 |
| 24,587 |
| 35,979 |
| 26,229 |
|
| Revolving home equity | 1,802 |
| 2,014 |
| 1,197 |
| 447 |
| 451 |
| 2,044 |
| 1,802 |
| 2,014 |
| 1,197 |
| 447 |
|
| Consumer credit card | 39,242 |
| 54,287 |
| 54,060 |
| 35,825 |
| 28,218 |
| 33,098 |
| 39,242 |
| 54,287 |
| 54,060 |
| 35,825 |
|
| Overdrafts | 2,254 |
| 2,672 |
| 3,493 |
| 4,499 |
| 4,909 |
| 2,221 |
| 2,254 |
| 2,672 |
| 3,493 |
| 4,499 |
|
| Total loans charged off | 81,385 |
| 114,573 |
| 154,410 |
| 85,093 |
| 58,868 |
| 63,161 |
| 81,385 |
| 114,573 |
| 154,410 |
| 85,093 |
|
| Recoveries of loans previously charged off: | | |
| Business | 1,761 |
| 3,964 |
| 2,925 |
| 3,406 |
| 1,429 |
| 5,306 |
| 1,761 |
| 3,964 |
| 2,925 |
| 3,406 |
|
| Real estate — construction and land | 943 |
| 193 |
| 720 |
| — |
| 37 |
| 1,527 |
| 943 |
| 193 |
| 720 |
| — |
|
| Real estate — business | 613 |
| 722 |
| 709 |
| 117 |
| 1,321 |
| 1,933 |
| 613 |
| 722 |
| 709 |
| 117 |
|
| Real estate — personal | 445 |
| 428 |
| 363 |
| 51 |
| 42 |
| 990 |
| 445 |
| 428 |
| 363 |
| 51 |
|
| Consumer | 3,896 |
| 4,108 |
| 3,772 |
| 4,782 |
| 5,304 |
| 4,161 |
| 3,896 |
| 4,108 |
| 3,772 |
| 4,782 |
|
| Revolving home equity | 135 |
| 39 |
| 7 |
| 18 |
| 5 |
| 240 |
| 135 |
| 39 |
| 7 |
| 18 |
|
| Consumer credit card | 7,625 |
| 6,556 |
| 4,785 |
| 4,309 |
| 4,520 |
| 8,623 |
| 7,625 |
| 6,556 |
| 4,785 |
| 4,309 |
|
| Overdrafts | 1,446 |
| 1,621 |
| 2,293 |
| 2,543 |
| 3,477 |
| 1,094 |
| 1,446 |
| 1,621 |
| 2,293 |
| 2,543 |
|
| Total recoveries | 16,864 |
| 17,631 |
| 15,574 |
| 15,226 |
| 16,135 |
| 23,874 |
| 16,864 |
| 17,631 |
| 15,574 |
| 15,226 |
|
| Net loans charged off | 64,521 |
| 96,942 |
| 138,836 |
| 69,867 |
| 42,733 |
| 39,287 |
| 64,521 |
| 96,942 |
| 138,836 |
| 69,867 |
|
| Balance at end of year | $ | 184,532 |
| $ | 197,538 |
| $ | 194,480 |
| $ | 172,619 |
| $ | 133,586 |
| $ | 172,532 |
| $ | 184,532 |
| $ | 197,538 |
| $ | 194,480 |
| $ | 172,619 |
|
| Ratio of allowance to loans at end of year | 2.01 | % | 2.10 | % | 1.92 | % | 1.53 | % | 1.26 | % | 1.75 | % | 2.01 | % | 2.10 | % | 1.92 | % | 1.53 | % |
| Ratio of provision to average loans outstanding | .56 | % | 1.03 | % | 1.51 | % | 1.00 | % | .42 | % | .29 | % | .56 | % | 1.03 | % | 1.51 | % | 1.00 | % |
| |
| (A) | Net of unearned income, before deducting allowance for loan losses, excluding loans held for sale. |
| | | | Years Ended December 31 | Years Ended December 31 |
| | 2011 | 2010 | 2009 | 2008 | 2007 | 2012 | 2011 | 2010 | 2009 | 2008 |
| Ratio of net charge-offs to average loans outstanding, by loan category: | | |
| Ratio of net charge-offs (recoveries) to average loans outstanding, by loan category: | | |
| Business | .17 | % | .16 | % | .41 | % | .13 | % | .14 | % | (.08 | )% | .17 | % | .16 | % | .41 | % | .13 | % |
| Real estate — construction and land | 1.66 |
| 2.69 |
| 4.61 |
| .89 |
| .30 |
| (.08 | ) | 1.66 |
| 2.69 |
| 4.61 |
| .89 |
|
| Real estate — business | .17 |
| .20 |
| .24 |
| .10 |
| .05 |
| .23 |
| .17 |
| .20 |
| .24 |
| .10 |
|
| Real estate — personal | .19 |
| .14 |
| .18 |
| .11 |
| .01 |
| .09 |
| .19 |
| .14 |
| .18 |
| .11 |
|
| Consumer | 1.09 |
| 1.64 |
| 2.20 |
| 1.28 |
| .61 |
| .69 |
| 1.09 |
| 1.64 |
| 2.20 |
| 1.28 |
|
| Revolving home equity | .36 |
| .41 |
| .24 |
| .09 |
| .10 |
| .40 |
| .36 |
| .41 |
| .24 |
| .09 |
|
| Consumer credit card | 4.23 |
| 6.28 |
| 6.77 |
| 4.06 |
| 3.56 |
| 3.35 |
| 4.23 |
| 6.28 |
| 6.77 |
| 4.06 |
|
| Overdrafts | 11.62 |
| 14.42 |
| 12.27 |
| 16.40 |
| 10.36 |
| 18.40 |
| 11.62 |
| 14.42 |
| 12.27 |
| 16.40 |
|
| Ratio of total net charge-offs to total average loans outstanding | .70 | % | 1.00 | % | 1.31 | % | .64 | % | .42 | % | .42 | % | .70 | % | 1.00 | % | 1.31 | % | .64 | % |
The following schedule provides a breakdown of the allowance for loan losses by loan category and the percentage of each loan category to total loans outstanding at year end:
| | | (Dollars in thousands) | 2011 | 2010 | 2009 | 2008 | 2007 | 2012 | 2011 | 2010 | 2009 | 2008 |
| Loan Loss Allowance Allocation | % of Loans to Total Loans | Loan Loss Allowance Allocation | % of Loans to Total Loans | Loan Loss Allowance Allocation | % of Loans to Total Loans | Loan Loss Allowance Allocation | % of Loans to Total Loans | Loan Loss Allowance Allocation | % of Loans to Total Loans | Loan Loss Allowance Allocation | % of Loans to Total Loans | Loan Loss Allowance Allocation | % of Loans to Total Loans | Loan Loss Allowance Allocation | % of Loans to Total Loans | Loan Loss Allowance Allocation | % of Loans to Total Loans | Loan Loss Allowance Allocation | % of Loans to Total Loans |
| Business | $ | 49,217 |
| 30.5 | % | $ | 47,534 |
| 31.4 | % | $ | 40,455 |
| 28.4 | % | $ | 35,185 |
| 30.2 | % | $ | 29,392 |
| 30.7 | % | $ | 47,729 |
| 31.9 | % | $ | 49,217 |
| 30.5 | % | $ | 47,534 |
| 31.4 | % | $ | 40,455 |
| 28.4 | % | $ | 35,185 |
| 30.2 | % |
| RE — construction and land | 28,280 |
| 4.2 |
| 21,316 |
| 4.9 |
| 33,659 |
| 6.6 |
| 24,714 |
| 7.4 |
| 8,507 |
| 6.3 |
| 20,555 |
| 3.6 |
| 28,280 |
| 4.2 |
| 21,316 |
| 4.9 |
| 33,659 |
| 6.6 |
| 24,714 |
| 7.4 |
|
| RE — business | 45,000 |
| 23.8 |
| 51,096 |
| 22.0 |
| 31,515 |
| 20.7 |
| 26,081 |
| 19.0 |
| 14,842 |
| 21.1 |
| 37,441 |
| 22.5 |
| 45,000 |
| 23.8 |
| 51,096 |
| 22.0 |
| 31,515 |
| 20.7 |
| 26,081 |
| 19.0 |
|
| RE — personal | 3,701 |
| 15.6 |
| 4,016 |
| 15.3 |
| 5,435 |
| 15.2 |
| 4,985 |
| 14.5 |
| 2,389 |
| 14.5 |
| 3,937 |
| 16.1 |
| 3,701 |
| 15.6 |
| 4,016 |
| 15.3 |
| 5,435 |
| 15.2 |
| 4,985 |
| 14.5 |
|
| Consumer | 15,369 |
| 12.1 |
| 19,449 |
| 12.4 |
| 30,257 |
| 13.1 |
| 30,503 |
| 14.3 |
| 24,611 |
| 15.6 |
| 15,165 |
| 13.1 |
| 15,369 |
| 12.1 |
| 19,449 |
| 12.4 |
| 30,257 |
| 13.1 |
| 30,503 |
| 14.3 |
|
| Revolving home equity | 2,220 |
| 5.1 |
| 2,502 |
| 5.1 |
| 1,737 |
| 4.8 |
| 1,445 |
| 4.4 |
| 5,839 |
| 4.3 |
| 4,861 |
| 4.5 |
| 2,220 |
| 5.1 |
| 2,502 |
| 5.1 |
| 1,737 |
| 4.8 |
| 1,445 |
| 4.4 |
|
| Student | — |
| — |
| — |
| — |
| 229 |
| 3.3 |
| — |
| 3.2 |
| — |
| — |
| — |
| — |
| — |
| — |
| — |
| — |
| 229 |
| 3.3 |
| — |
| 3.2 |
|
| Consumer credit card | 39,703 |
| 8.6 |
| 50,532 |
| 8.8 |
| 49,923 |
| 7.9 |
| 47,993 |
| 6.9 |
| 44,307 |
| 7.4 |
| 41,926 |
| 8.2 |
| 39,703 |
| 8.6 |
| 50,532 |
| 8.8 |
| 49,923 |
| 7.9 |
| 47,993 |
| 6.9 |
|
| Overdrafts | 1,042 |
| .1 |
| 1,093 |
| .1 |
| 1,270 |
| — |
| 1,713 |
| .1 |
| 2,351 |
| .1 |
| 918 |
| .1 |
| 1,042 |
| .1 |
| 1,093 |
| .1 |
| 1,270 |
| — |
| 1,713 |
| .1 |
|
| Unallocated | — |
| — |
| — |
| — |
| — |
| — |
| — |
| — |
| 1,348 |
| — |
| |
| Total | $ | 184,532 |
| 100.0 | % | $ | 197,538 |
| 100.0 | % | $ | 194,480 |
| 100.0 | % | $ | 172,619 |
| 100.0 | % | $ | 133,586 |
| 100.0 | % | $ | 172,532 |
| 100.0 | % | $ | 184,532 |
| 100.0 | % | $ | 197,538 |
| 100.0 | % | $ | 194,480 |
| 100.0 | % | $ | 172,619 |
| 100.0 | % |
Risk Elements of Loan Portfolio
Management reviews the loan portfolio continuously for evidence of problem loans. During the ordinary course of business, management becomes aware of borrowers that may not be able to meet the contractual requirements of loan agreements. Such loans are placed under close supervision with consideration given to placing the loan on non-accrual status, the need for an additional allowance for loan loss, and (if appropriate) partial or full loan charge-off. Loans are placed on non-accrual status when management does not expect to collect payments consistent with acceptable and agreed upon terms of repayment. Loans that are 90 days past due as to principal and/or interest payments are generally placed on non-accrual, unless they are both well-secured and in the process of collection, or they are consumer loans that are exempt under regulatory rules from being classified as non-accrual. Consumer installment loans and related accrued interest are normally charged down to the fair value of related collateral (or are charged off in full if no collateral) once the loans are more than 120 days delinquent. Credit card loans and the related accrued interest are charged off when the receivable is more than 180 days past due. After a loan is placed on non-accrual status, any interest previously accrued but not yet collected is reversed against current income. Interest is included in income only as received and only after all previous loan charge-offs have been recovered, so long as management is satisfied there is no impairment of collateral values. The loan is returned to accrual status only when the borrower has brought all past due principal and interest payments current, and, in the opinion of management, the borrower has demonstrated the ability to make future payments of principal and interest as scheduled.
Loans that are 90 days past due as to principal and/or interest payments are generally placed on non-accrual, unless they are both well-secured and in the process of collection, or they are comprised of those personal banking loans that are exempt under regulatory rules from being classified as non-accrual. Consumer installment loans and related accrued interest are normally charged down to the fair value of related collateral (or are charged off in full if no collateral) once the loans are more than 120 days delinquent. Credit card loans and the related accrued interest are charged off when the receivable is more than 180 days past due.
The following schedule shows non-performing assets and loans past due 90 days and still accruing interest.
|
| | | | | | | | | | | | | | | |
| | December 31 |
| (Dollars in thousands) | 2011 | 2010 | 2009 | 2008 | 2007 |
| Non-performing assets: | | | | | |
| Non-accrual loans: | | | | | |
| Business | $ | 25,724 |
| $ | 8,933 |
| $ | 12,874 |
| $ | 4,007 |
| $ | 4,700 |
|
| Real estate — construction and land | 22,772 |
| 52,752 |
| 62,509 |
| 48,871 |
| 7,769 |
|
| Real estate — business | 19,374 |
| 16,242 |
| 21,756 |
| 13,137 |
| 5,628 |
|
| Real estate — personal | 7,612 |
| 7,348 |
| 9,384 |
| 6,794 |
| 1,095 |
|
| Consumer | — |
| — |
| 90 |
| 87 |
| 547 |
|
| Total non-accrual loans | 75,482 |
| 85,275 |
| 106,613 |
| 72,896 |
| 19,739 |
|
| Real estate acquired in foreclosure | 18,321 |
| 12,045 |
| 10,057 |
| 6,181 |
| 13,678 |
|
| Total non-performing assets | $ | 93,803 |
| $ | 97,320 |
| $ | 116,670 |
| $ | 79,077 |
| $ | 33,417 |
|
| Non-performing assets as a percentage of total loans | 1.02 | % | 1.03 | % | 1.15 | % | .70 | % | .32 | % |
| Non-performing assets as a percentage of total assets | .45 | % | .53 | % | .64 | % | .45 | % | .21 | % |
| Past due 90 days and still accruing interest: | | | | | |
| Business | $ | 595 |
| $ | 854 |
| $ | 3,672 |
| $ | 1,459 |
| $ | 1,427 |
|
| Real estate — construction and land | 121 |
| 217 |
| 1,184 |
| 466 |
| 768 |
|
| Real estate — business | 29 |
| — |
| 402 |
| 1,472 |
| 281 |
|
| Real estate — personal | 3,045 |
| 3,554 |
| 3,102 |
| 4,717 |
| 5,131 |
|
| Consumer | 2,230 |
| 2,867 |
| 3,042 |
| 4,346 |
| 2,676 |
|
| Revolving home equity | 643 |
| 825 |
| 878 |
| 440 |
| 700 |
|
| Student | — |
| — |
| 14,346 |
| 14,018 |
| 1 |
|
| Consumer credit card | 8,295 |
| 12,149 |
| 16,006 |
| 13,046 |
| 9,902 |
|
| Total past due 90 days and still accruing interest | $ | 14,958 |
| $ | 20,466 |
| $ | 42,632 |
| $ | 39,964 |
| $ | 20,886 |
|
|
| | | | | | | | | | | | | | | |
| | December 31 |
| (Dollars in thousands) | 2012 | 2011 | 2010 | 2009 | 2008 |
| Total non-accrual loans | $ | 51,410 |
| $ | 75,482 |
| $ | 85,275 |
| $ | 106,613 |
| $ | 72,896 |
|
| Real estate acquired in foreclosure | 13,453 |
| 18,321 |
| 12,045 |
| 10,057 |
| 6,181 |
|
| Total non-performing assets | $ | 64,863 |
| $ | 93,803 |
| $ | 97,320 |
| $ | 116,670 |
| $ | 79,077 |
|
| Non-performing assets as a percentage of total loans | .66 | % | 1.02 | % | 1.03 | % | 1.15 | % | .70 | % |
| Non-performing assets as a percentage of total assets | .29 | % | .45 | % | .53 | % | .64 | % | .45 | % |
| Total past due 90 days and still accruing interest | $ | 15,347 |
| $ | 14,958 |
| $ | 20,466 |
| $ | 42,632 |
| $ | 39,964 |
|
The table below shows the effect on interest income in 20112012 of loans on non-accrual status at year end.
| | | (In thousands) | | |
| Gross amount of interest that would have been recorded at original rate | $ | 7,058 |
| $ | 4,606 |
|
| Interest that was reflected in income | 1,471 |
| 561 |
|
| Interest income not recognized | $ | 5,587 |
| $ | 4,045 |
|
Non-accrual loans, which are also classified as impaired, totaled $75.5$51.4 million at year end 2011,2012, a decrease of $9.8$24.1 million from the balance at year end 2010.2011. The decrease in non-accrual loans primarily consisted of a decrease of $30.0 millionoccurred mainly in the business and real estate construction and land loans, partially offset by a $16.8loan categories, which decreased $12.7 million increase in business loans.and $9.1 million, respectively. The decline in real estate construction and land non-accrual loans werewas largely dueattributable to improved credit quality in the loan foreclosures of $9.3 million, in addition to pay downs and charge-offs. The increase in business non-accrual loans resulted mainly from two loans totaling $17.0 million, which were placed on non-accrual status in 2011.portfolio. At December 31, 2011,2012, non-accrual loans were comprised primarily of business real estate loans (34.1%(33.7%), construction and land real estate loans (30.2%(26.6%), and business real estate loans (25.7%(25.4%). Foreclosed real estate increased $6.3decreased $4.9 million to a total of $18.3$13.5 million at year end 2011.2012. The 2011 balance includesdecline was mainly due to a partial sale of a construction project valued at $9.9 million, of which $4.9 million represents the interests of several outside participating banks.project. Total non-performing assets remain low compared to the overall banking industry in 2011,2012, with the non-performing loans to total loans ratio at 1.02%.52% at December 31, 2011.2012. Loans past due 90 days and still accruing interest decreased $5.5 millionincreased $389 thousand at year end 20112012 compared to 2010, mainly2011. Balances by class for non-accrual loans and loans past due 90 days and still accruing interest are shown in the "Delinquent and non-accrual loans" section of Note 2 to a $3.9 million decrease in consumer credit card delinquencies.the consolidated financial statements.
In addition to the non-performing and past due loans mentioned above, the Company also has identified loans for which management has concerns about the ability of the borrowers to meet existing repayment terms. They are classified as substandard under the Company’s internal rating system. The loans are generally secured by either real estate or other borrower assets, reducing the potential for loss should they become non-performing. Although these loans are generally identified as potential problem loans, they may never become non-performing. Such loans totaled $141.9 million at December 31, 2012 compared with $250.7 million at December 31, 2011, compared with $233.5 million at December 31, 2010, resulting in an increasea decrease of $17.2$108.8 million, or 7.4%43.4%. The increasechange in potential problem loans was primarilylargely due to a $19.6decreases of $58.3 million increase in business real estate loans, which was partially offset by decreases$30.3 million in the other loan categories. While these substandard-classifiedbusiness loans, increased at year end 2011 compared to 2010, other loans classified as special mention declined $79.1and $20.9 million as shown in Note 2 to the consolidated financial statements.construction and land real estate loans.
| | | | December 31 | December 31 |
| (In thousands) | 2011 | 2010 | 2012 | 2011 |
| Potential problem loans: | | |
| Business | $ | 75,213 |
| $ | 79,640 |
| $ | 44,881 |
| $ | 75,213 |
|
| Real estate – construction and land | 54,696 |
| 51,589 |
| 33,762 |
| 54,696 |
|
| Real estate – business | 113,652 |
| 94,063 |
| 55,362 |
| 113,652 |
|
| Real estate – personal | 6,900 |
| 7,910 |
| 7,891 |
| 6,900 |
|
| Consumer | 208 |
| 284 |
| — |
| 208 |
|
| Total potential problem loans | $ | 250,669 |
| $ | 233,486 |
| $ | 141,896 |
| $ | 250,669 |
|
At December 31, 2011,2012, the Company had identified approximately $97.9$94.0 million of loans whose terms have been modified or restructured under a troubled debt restructuring. These loans have been extended to borrowers who are experiencing financial difficulty and who have been granted a concession, as defined by accounting guidance. Of this balance, $34.1$28.5 million have been placed on non-accrual status. Of the remaining $63.8$65.5 million, approximately $41.3$40.3 million were commercial loans (business, construction and business real estate) classified as substandard, which were renewed at interest rates that were not judged to be market rates for new debt with similar risk. These loans are performing under their modified terms, and the Company believes it probable that all amounts due under the modified terms of the agreements will be collected. However, because of their substandard classification, they are included as potential problem loans in the table above. An additional $22.4$14.7 million in troubled debt restructurings were
composed of certain credit card loans under various debt management and assistance programs. TheseOther restructured loans include $10.4 million of personal banking loans which were not reaffirmed in bankruptcy, on which the borrowers are considered impaired for purposes of determining the allowance for loan losses, as discussed in Note 1continuing to the consolidated financial statements.make payments.
Loans with Special Risk Characteristics
Management relies primarily on an internal risk rating system, in addition to delinquency status, to assess risk in the loan portfolio, and these statistics are presented in Note 2 to the consolidated financial statements. However, certain types of loans are considered at high risk of loss due to their terms, location, or special conditions. Construction and land loans and business real estate loans are subject to higher risk as a result of the current weak economic climate and issues in the housing industry. Certain personal real estate products (residential first mortgages and home equity loans) have contractual features that could increase credit exposure in a market of declining real estate prices, when interest rates are steadily increasing, or when a geographic area experiences an economic downturn. For these personal real estate loans, higher risks could exist when 1) loan terms require a minimum monthly payment that covers only interest, or 2) loan-to-collateral value (LTV) ratios at origination are above 80%, with no private mortgage insurance. Information presented below for personal real estate and home equity loans is based on LTV ratios which were calculated with valuations at loan origination date. The Company does not attempt to obtain updated appraisals or valuations unless the loans become significantly delinquent or are in the process of being foreclosed upon. For credit monitoring purposes, the Company relies on delinquency monitoring along with obtaining refreshed FICO scores, and in the case of home equity loans, reviewing line utilization and credit bureau information annually. This has remained an effective means of evaluating credit trends and identifying problem loans, partly because the Company offers standard, conservative lending products.
Real Estate - Construction and Land Loans
The Company’s portfolio of construction loans, as shown in the table below, amounted to 4.2%3.6% of total loans outstanding at December 31, 2011.2012.
| |
(Dollars in thousands) | December 31, 2011 | % of Total | % of Total Loans | December 31, 2010 | % of Total | % of Total Loans | December 31, 2012 | % of Total | % of Total Loans | December 31, 2011 | % of Total | % of Total Loans |
Residential land and land development | $ | 70,708 |
| 18.3 | % | .8 | % | $ | 112,963 |
| 24.5 | % | 1.2 | % | $ | 61,794 |
| 17.4 | % | .6 | % | $ | 70,708 |
| 18.3 | % | .8 | % |
| Residential construction | 70,009 |
| 18.1 |
| .7 |
| 80,516 |
| 17.5 |
| .9 |
| 68,590 |
| 19.2 |
| .7 |
| 70,009 |
| 18.1 |
| .7 |
|
Commercial land and land development | 97,379 |
| 25.2 |
| 1.1 |
| 115,106 |
| 25.0 |
| 1.2 |
| 83,491 |
| 23.5 |
| .9 |
| 97,379 |
| 25.2 |
| 1.1 |
|
| Commercial construction | 148,502 |
| 38.4 |
| 1.6 |
| 152,268 |
| 33.0 |
| 1.6 |
| 142,121 |
| 39.9 |
| 1.4 |
| 148,502 |
| 38.4 |
| 1.6 |
|
| Total real estate – construction and land loans | $ | 386,598 |
| 100.0 | % | 4.2 | % | $ | 460,853 |
| 100.0 | % | 4.9 | % | $ | 355,996 |
| 100.0 | % | 3.6 | % | $ | 386,598 |
| 100.0 | % | 4.2 | % |
Real Estate – Business Loans
Total business real estate loans were $2.2 billion at December 31, 20112012 and comprised 23.8%22.5% of the Company’s total loan portfolio. These loans include properties such as manufacturing and warehouse buildings, small office and medical buildings, churches, hotels and motels, shopping centers, and other commercial properties. Approximately 49%47% of these loans were for owner-occupied real estate properties, which present lower risk profiles.
| | | (Dollars in thousands) | December 31, 2011 | % of Total | % of Total Loans | December 31, 2010 | % of Total | % of Total Loans | December 31, 2012 | % of Total | % of Total Loans | December 31, 2011 | % of Total | % of Total Loans |
| Owner-occupied | $ | 1,057,652 |
| 48.5 | % | 11.5 | % | $ | 990,892 |
| 48.0 | % | 10.5 | % | $ | 1,035,407 |
| 46.7 | % | 10.5 | % | $ | 1,057,652 |
| 48.5 | % | 11.5 | % |
| Office | 270,200 |
| 12.3 |
| 3.0 |
| 254,882 |
| 12.4 |
| 2.7 |
| 269,756 |
| 12.2 |
| 2.7 |
| 270,200 |
| 12.3 |
| 3.0 |
|
| Retail | 226,447 |
| 10.4 |
| 2.5 |
| 226,418 |
| 11.0 |
| 2.4 |
| 245,021 |
| 11.1 |
| 2.5 |
| 226,447 |
| 10.4 |
| 2.5 |
|
| Multi-family | 174,285 |
| 8.0 |
| 1.9 |
| 143,051 |
| 6.9 |
| 1.5 |
| 184,208 |
| 8.3 |
| 1.9 |
| 174,285 |
| 8.0 |
| 1.9 |
|
| Hotels | | 155,392 |
| 7.0 |
| 1.6 |
| 119,039 |
| 5.5 |
| 1.3 |
|
| Farm | 121,966 |
| 5.6 |
| 1.3 |
| 120,388 |
| 5.8 |
| 1.3 |
| 123,613 |
| 5.6 |
| 1.3 |
| 121,966 |
| 5.6 |
| 1.3 |
|
| Hotels | 119,039 |
| 5.5 |
| 1.3 |
| 108,127 |
| 5.2 |
| 1.2 |
| |
| Industrial | 98,092 |
| 4.5 |
| 1.1 |
| 118,159 |
| 5.7 |
| 1.3 |
| 110,645 |
| 5.0 |
| 1.1 |
| 98,092 |
| 4.5 |
| 1.1 |
|
| Other | 112,419 |
| 5.2 |
| 1.2 |
| 103,920 |
| 5.0 |
| 1.1 |
| 90,933 |
| 4.1 |
| .9 |
| 112,419 |
| 5.2 |
| 1.2 |
|
| Total real estate - business loans | $ | 2,180,100 |
| 100.0 | % | 23.8 | % | $ | 2,065,837 |
| 100.0 | % | 22.0 | % | $ | 2,214,975 |
| 100.0 | % | 22.5 | % | $ | 2,180,100 |
| 100.0 | % | 23.8 | % |
Real Estate - Personal Loans
The Company’s $1.4$1.6 billion personal real estate loan portfolio is composed of loans collateralized withfirst mortgages on residential real estate. Approximately $1.2 billionThe majority of this portfolio is comprised of approximately $1.4 billion of loans made to the retail customer base and includes both adjustable rate mortgage loans and certain fixed rate loans, which are retained by the Company as directed by its Asset/Liability Management Committee.mortgage loans. As shown in Note 2 to the consolidated financial statements, 7.5%5.5% of the retail basedretail-based portfolio has FICO scores of less than 660, and delinquency levels have been low. Loans of approximately $15.2$12.7 million in this portfolio were structured with interest only payments. Interest only loans are typically made to high net-worth borrowers and generally have low LTV ratios or have additional collateral pledged to secure the loan, and, therefore, they are not perceived to represent above normal credit risk. Loans originated with interest only payments were not made to "qualify" the borrower for a lower payment amount.
Also included in thisA small portion of the total portfolio areis composed of personal real estate loans made to commercial customers, which totaled $225.8$224.5 million at December 31, 2011. This group of loans has an original weighted average term of approximately 6 years, with 70% of the balance in fixed rate loans and 30% in floating rate loans.2012.
The following table presents information about the retail basedretail-based personal real estate loan portfolio for 20112012 and 2010.2011.
| | | | 2011 | | 2010 | 2012 | | 2011 |
| (Dollars in thousands) | Principal Outstanding at December 31 | % of Loan Portfolio | | Principal Outstanding at December 31 | % of Loan Portfolio | Principal Outstanding at December 31 | % of Loan Portfolio | | Principal Outstanding at December 31 | % of Loan Portfolio |
| Loans with interest only payments | $ | 15,186 |
| 1.3 | % | | $ | 18,191 |
| 1.5 | % | $ | 12,730 |
| .9 | % | | $ | 15,186 |
| 1.3 | % |
| Loans with no insurance and LTV: | | | | | | | | | | |
| Between 80% and 90% | 78,446 |
| 6.5 |
| | 86,191 |
| 7.1 |
| 76,023 |
| 5.6 |
| | 78,446 |
| 6.5 |
|
| Between 90% and 95% | 25,131 |
| 2.1 |
| | 25,851 |
| 2.2 |
| 26,871 |
| 2.0 |
| | 25,131 |
| 2.1 |
|
| Over 95% | 38,995 |
| 3.2 |
| | 42,738 |
| 3.5 |
| 33,290 |
| 2.4 |
| | 38,995 |
| 3.2 |
|
| Over 80% LTV with no insurance | 142,572 |
| 11.8 |
| | 154,780 |
| 12.8 |
| 136,184 |
| 10.0 |
| | 142,572 |
| 11.8 |
|
| Total loan portfolio from which above loans were identified | 1,205,462 |
| | | 1,210,939 |
| | 1,360,194 |
| | | 1,205,462 |
| |
Revolving Home Equity Loans
The Company also has revolving home equity loans that are generally collateralized by residential real estate. Most of these loans (94.5%(93.6%) are written with terms requiring interest only monthly payments. These loans are offered in three main product lines: LTV up to 80%, 80% to 90%, and 90% to 100%. As shown in the tables below, the percentage of loans with LTV ratios greater than 80% has remained a small segment of this portfolio, and delinquencies have been low and stable. Over the next three years, as much as 40% of the Company's revolving home equity loans are expected to mature, which were originated in 2003 through 2007. At maturity, the accounts are re-underwritten and if they qualify under the Company's credit, collateral and capacity policies, the borrower is given the option to renew the line of credit, or to convert the outstanding balance to an amortizing loan. If criteria are not met, amortization is required, or the borrower may pay off the loan.
| | | (Dollars in thousands) | Principal Outstanding at December 31, 2011 | * | New Lines Originated During 2011 | * | Unused Portion of Available Lines at December 31, 2011 | * | Balances Over 30 Days Past Due | * | Principal Outstanding at December 31, 2012 | * | New Lines Originated During 2012 | * | Unused Portion of Available Lines at December 31, 2012 | * | Balances Over 30 Days Past Due | * |
| Loans with interest only payments | $ | 438,123 |
| 94.5 | % |
| $19,607 |
| 4.2 | % |
| $631,719 |
| 136.3 | % |
| $1,301 |
| .3 | % | $ | 409,593 |
| 93.6 | % |
| $60,673 |
| 13.9 | % |
| $637,677 |
| 145.7 | % |
| $4,011 |
| .9 | % |
| Loans with LTV: | | | | | | | | | | | | | | | | |
| Between 80% and 90% | 51,520 |
| 11.1 |
| 7,802 |
| 1.7 |
| 39,212 |
| 8.4 |
| 350 |
| .1 |
| 45,698 |
| 10.4 |
| 9,747 |
| 2.2 |
| 36,568 |
| 8.4 |
| 462 |
| .1 |
|
| Over 90% | 18,653 |
| 4.0 |
| 150 |
| — |
| 10,961 |
| 2.4 |
| 255 |
| — |
| 15,310 |
| 3.5 |
| 1,528 |
| .4 |
| 11,320 |
| 2.5 |
| 358 |
| .1 |
|
| Over 80% LTV | 70,173 |
| 15.1 |
| 7,952 |
| 1.7 |
| 50,173 |
| 10.8 | % | 605 |
| .1 |
| 61,008 |
| 13.9 |
| 11,275 |
| 2.6 |
| 47,888 |
| 10.9 |
| 820 |
| .2 |
|
| Total loan portfolio from which above loans were identified | 463,587 |
| | 121,149 |
| | 651,108 |
| | | | 437,567 |
| | 135,657 |
| | 649,963 |
| | | |
* Percentage of total principal outstanding of $437.6 million at December 31, 2012.
|
| | | | | | | | | | | | | | | | | | | | |
| (Dollars in thousands) | Principal Outstanding at December 31, 2011 |
* | New Lines Originated During 2011 | * | Unused Portion of Available Lines at December 31, 2011 | * | Balances Over 30 Days Past Due | * |
| Loans with interest only payments | $ | 438,123 |
| 94.5 | % |
| $19,607 |
| 4.2 | % |
| $631,719 |
| 136.3 | % |
| $1,301 |
| .3 | % |
| Loans with LTV: | | | | | | | | |
| Between 80% and 90% | 51,520 |
| 11.1 |
| 7,802 |
| 1.7 |
| 39,212 |
| 8.4 |
| 350 |
| .1 |
|
| Over 90% | 18,653 |
| 4.0 |
| 150 |
| — |
| 10,961 |
| 2.4 |
| 255 |
| — |
|
| Over 80% LTV | 70,173 |
| 15.1 |
| 7,952 |
| 1.7 |
| 50,173 |
| 10.8 |
| 605 |
| .1 |
|
| Total loan portfolio from which above loans were identified | 463,587 |
| | 121,149 |
| | 651,108 |
| | | |
* Percentage of total principal outstanding of $463.6 million at December 31, 2011.
|
| | | | | | | | | | | | | | | | | | | | |
| (Dollars in thousands) | Principal Outstanding at December 31, 2010 |
* | New Lines Originated During 2010 | * | Unused Portion of Available Lines at December 31, 2010 | * | Balances Over 30 Days Past Due | * |
| Loans with interest only payments | $ | 454,693 |
| 95.2 | % |
| $31,472 |
| 6.6 | % |
| $647,928 |
| 135.7 | % |
| $1,340 |
| .3 | % |
| Loans with LTV: | | | | | | | | |
| Between 80% and 90% | 57,553 |
| 12.0 |
| 7,019 |
| 1.5 |
| 39,949 |
| 8.4 |
| 364 |
| .1 |
|
| Over 90% | 21,301 |
| 4.5 |
| 865 |
| .2 |
| 13,384 |
| 2.8 |
| 327 |
| — |
|
| Over 80% LTV | 78,854 |
| 16.5 |
| 7,884 |
| 1.7 |
| 53,333 |
| 11.2 |
| 691 |
| .1 |
|
| Total loan portfolio from which above loans were identified | 477,518 |
| | 121,428 |
| | 665,701 |
| | | |
* Percentage of total principal outstanding of $477.5 million at December 31, 2010.
Fixed Rate Home Equity Loans
In addition to the residential real estate mortgage loans and the revolving floating rate line product discussed above, the Company offers a third choice to those consumers desiring a fixed rate loan and a fixed maturity date. This fixed rate home equity loan, typically for home repair or remodeling, is an alternative for individuals who want to finance a specific project or purchase and decide to lock in a specific monthly payment over a defined period. Outstanding balances for these loans were $142.0$210.1 million and $132.7$142.0 million at December 31, 20112012 and 2010,2011, respectively. At times, these loans are written with interest only monthly payments and a balloon payoff at maturity; however, less than 5% of the outstanding balance hashad interest only payments at December 31, 2012 and 2011. The delinquency history on this product has been low, as balances over 30 days past due totaled only $1.6$2.0 million, or 1.2%,.9% of the portfolio, and $1.7$1.6 million, or 1.3%1.2% of the portfolio, at year end 20112012 and 2010,2011, respectively.
| | | | 2011 | | 2010 | 2012 | | 2011 |
| (Dollars in thousands) | Principal Outstanding at December 31 | * | New Loans Originated | * | | Principal Outstanding at December 31 | * | New Loans Originated | * | Principal Outstanding at December 31 | * | New Loans Originated | * | | Principal Outstanding at December 31 | * | New Loans Originated | * |
| Loans with interest only payments | $ | 5,965 |
| 4.2 | % |
| $8,669 |
| 6.1 | % | | $ | 8,620 |
| 6.5 | % |
| $9,954 |
| 7.5 | % | $ | 4,128 |
| 2.0 | % |
| $5,464 |
| 2.6 | % | | $ | 5,965 |
| 4.2 | % |
| $8,669 |
| 6.1 | % |
| Loans with LTV: | | | | | | | | | | | | | | | | | | |
| Between 80% and 90% | 19,346 |
| 13.6 |
| 8,520 |
| 6.0 |
| | 17,597 |
| 13.3 |
| 5,540 |
| 4.2 |
| 36,427 |
| 17.3 |
| 26,438 |
| 12.6 |
| | 19,346 |
| 13.6 |
| 8,520 |
| 6.0 |
|
| Over 90% | 18,599 |
| 13.1 |
| 4,098 |
| 2.9 |
| | 21,653 |
| 16.3 |
| 4,677 |
| 3.5 |
| 17,561 |
| 8.4 |
| 6,628 |
| 3.1 |
| | 18,599 |
| 13.1 |
| 4,098 |
| 2.9 |
|
| Over 80% LTV | 37,945 |
| 26.7 |
| 12,618 |
| 8.9 |
| | 39,250 |
| 29.6 |
| 10,217 |
| 7.7 |
| 53,988 |
| 25.7 |
| 33,066 |
| 15.7 |
| | 37,945 |
| 26.7 |
| 12,618 |
| 8.9 |
|
| Total loan portfolio from which above loans were identified | 141,977 |
| | | | | 132,706 |
| | | | 210,064 |
| | | | | 141,977 |
| | | |
* Percentage of total principal outstanding of $142.0210.1 million and $132.7142.0 million at December 31, 20112012 and 20102011, respectively.
Management does not believe these loans collateralized by real estate (personal(revolving home equity, personal real estate, revolving home equity, and fixed rate home equity) represent any unusual concentrations of risk, as evidenced by net charge-offs in 20112012 of $2.8$1.8 million, $1.7$1.4 million and $782$466 thousand, respectively. The amount of any increased potential loss on high LTV agreements relates mainly to amounts advanced that are in excess of the 80% collateral calculation, not the entire approved line. The Company currently offers no subprime first mortgage or home equity loans. These are characterized as new loans to customers with FICO scores below 650 for home equity loans, 660 for government-insured first mortgages, and 680 for all other conventional first mortgages. The Company does not purchase brokered loans.
Other Consumer Loans
Within the consumer loan portfolio are several direct and indirect product lines comprised mainly of loans secured by automobiles and other passenger vehicles, marine, and RVs. During 2011, $222.32012, $440.2 million of new automobile loans were originated, compared to $162.2$222.3 million during 2010. The Company experienced rapid growth in2011. However, marine and RV loans in 2006 through 2008, and the majority of these loans were outside the Company’s basic five state branch network. However, due to continuing weak credit and economic conditions, this loan product wasproduction has been curtailed in midsince 2008. The loss ratios experienced for marine and RV loans have been higher than for other consumer loan products in recent years, at 1.8% and 2.1% in 2012 and 2.5% in 2011, and 2010, respectively, but year end balances over 30 days past due have decreased $1.4$3.0 million from 2010.2011. The table below provides the total outstanding principal and other data for this group of direct and indirect lending products at December 31, 20112012 and 2010.2011.
| | | | 2011 | | 2010 | 2012 | | 2011 |
| (In thousands) | Principal Outstanding at December 31 | New Loans Originated | Balances Over 30 Days Past Due | | Principal Outstanding at December 31 | New Loans Originated | Balances Over 30 Days Past Due | Principal Outstanding at December 31 | New Loans Originated | Balances Over 30 Days Past Due | | Principal Outstanding at December 31 | New Loans Originated | Balances Over 30 Days Past Due |
| Passenger vehicles | $ | 357,575 |
| $ | 222,268 |
| $ | 2,606 |
| | $ | 330,212 |
| $ | 162,212 |
| $ | 3,050 |
| $ | 569,616 |
| $ | 440,206 |
| $ | 4,454 |
| | $ | 357,575 |
| $ | 222,268 |
| $ | 2,606 |
|
| Marine | 113,770 |
| 1,488 |
| 3,703 |
| | 147,080 |
| 1,207 |
| 4,170 |
| 88,858 |
| 1,450 |
| 2,948 |
| | 113,770 |
| 1,488 |
| 3,703 |
|
| RV | 306,383 |
| — |
| 6,702 |
| | 388,082 |
| 60 | 7,661 |
| 238,991 |
| — |
| 4,443 |
| | 306,383 |
| — |
| 6,702 |
|
| Total | $ | 777,728 |
| $ | 223,756 |
| $ | 13,011 |
| | $ | 865,374 |
| $ | 163,479 |
| $ | 14,881 |
| $ | 897,465 |
| $ | 441,656 |
| $ | 11,845 |
| | $ | 777,728 |
| $ | 223,756 |
| $ | 13,011 |
|
Additionally, the Company offers low introductory rates on selected consumer credit card products. Out of a portfolio at December 31, 20112012 of $788.7$804.2 million in consumer credit card loans outstanding, approximately $119.0$129.5 million, or 15.1%16.1%, carried a low introductory rate. Within the next six months, $56.8$29.0 million of these loans are scheduled to convert to the ongoing higher contractual rate. To mitigate some of the risk involved with this credit card product, the Company performs credit checks and detailed analysis of the customer borrowing profile before approving the loan application. Management believes that the risks in the consumer loan portfolio are reasonable and the anticipated loss ratios are within acceptable parameters.
Investment Securities Analysis
Investment securities are comprised of securities which are classified as available for sale, non-marketable, and held foror trading. During 2011,2012, total investment securities increased $1.9 billion,$260.2 million, or 25.6%2.8%, to $9.1$9.4 billion (excluding unrealized gains/losses) compared to $7.3$9.1 billion at the previous year end. During 2011,2012, securities of $4.4$3.4 billion were purchased, which included $2.4 billion in agency mortgage-backed securities and $1.4$1.8 billion in asset-backed securities. Total sales, maturities and pay downs were $2.6$3.1 billion during 2011.2012. During 2012,2013, maturities and pay downs of approximately $1.6$2.2 billion are expected to occur. The average tax equivalent yield earned on total investment securities was 2.55% in 2012 and 2.93% in 2011 and 3.40% in 2010.2011.
At December 31, 2011,2012, the fair value of available for sale securities was $9.2$9.5 billion, including a net unrealized gain in fair value of $212.6$263.7 million, compared to a net unrealized gain of $129.5$212.6 million at December 31, 2010.2011. The overall unrealized gain in fair value at December 31, 20112012 included gains of $116.6$132.9 million in agency mortgage-backed securities, $36.1$38.8 million in U.S. government and federal agency obligations, $24.4$29.8 million in state and municipal obligations, and $23.3$27.4 million in marketable equity securities held by the Parent.
Available for sale investment securities at year end for the past two years are shown below:
| | | | December 31 | December 31 |
| (In thousands) | 2011 | 2010 | 2012 | 2011 |
| Amortized Cost | | |
| U.S. government and federal agency obligations | $ | 328,530 |
| $ | 434,878 |
| $ | 399,971 |
| $ | 328,530 |
|
| Government-sponsored enterprise obligations | 311,529 |
| 200,061 |
| 467,063 |
| 311,529 |
|
| State and municipal obligations | 1,220,840 |
| 1,117,020 |
| 1,585,926 |
| 1,220,840 |
|
| Agency mortgage-backed securities | 3,989,464 |
| 2,437,123 |
| 3,248,007 |
| 3,989,464 |
|
| Non-agency mortgage-backed securities | 315,752 |
| 459,363 |
| 224,223 |
| 315,752 |
|
| Asset-backed securities | 2,692,436 |
| 2,342,866 |
| 3,152,913 |
| 2,692,436 |
|
| Other debt securities | 135,190 |
| 165,883 |
| 174,727 |
| 135,190 |
|
| Equity securities | 18,354 |
| 7,569 |
| 5,695 |
| 18,354 |
|
| Total available for sale investment securities | $ | 9,012,095 |
| $ | 7,164,763 |
| $ | 9,258,525 |
| $ | 9,012,095 |
|
| Fair Value | | |
| U.S. government and federal agency obligations | $ | 364,665 |
| $ | 455,537 |
| $ | 438,759 |
| $ | 364,665 |
|
| Government-sponsored enterprise obligations | 315,698 |
| 201,895 |
| 471,574 |
| 315,698 |
|
| State and municipal obligations | 1,245,284 |
| 1,119,485 |
| 1,615,707 |
| 1,245,284 |
|
| Agency mortgage-backed securities | 4,106,059 |
| 2,491,199 |
| 3,380,955 |
| 4,106,059 |
|
| Non-agency mortgage-backed securities | 316,902 |
| 455,790 |
| 237,011 |
| 316,902 |
|
| Asset-backed securities | 2,693,143 |
| 2,354,260 |
| 3,167,394 |
| 2,693,143 |
|
| Other debt securities | 141,260 |
| 176,964 |
| 177,752 |
| 141,260 |
|
| Equity securities | 41,691 |
| 39,173 |
| 33,096 |
| 41,691 |
|
| Total available for sale investment securities | $ | 9,224,702 |
| $ | 7,294,303 |
| $ | 9,522,248 |
| $ | 9,224,702 |
|
The largest component of the available for sale portfolio consists of agency mortgage-backed securities, which are collateralized bonds issued by agencies, including FNMA, GNMA, FHLMC, FHLB, Federal Farm Credit Banks and FDIC. Non-agency mortgage-backed securities totaled $316.9$237.0 million, at fair value, at December 31, 2011,2012, and included Alt-A type mortgage-backed securities of $131.8$108.8 million and prime/jumbo loan type securities of $185.1$128.2 million. Certain of the non-agency mortgage-backed securities are other-than-temporarily impaired, and the processes for determining impairment and the related losses are discussed in Note 3 to the consolidated financial statements. The portfolio does not have exposure to subprime originated mortgage-backed or collateralized debt obligation instruments.
At December 31, 2011,2012, U.S. government obligations included $356.5$438.6 million in U.S. Treasury inflation-protected securities, and state and municipal obligations included $135.6$126.4 million in auction rate securities, at fair value. Other debt securities include corporate bonds, notes and commercial paper. Available for sale equity securities are mainly comprised of publicly tradedcommon stock held by the Parent which totaled $26.7$30.7 million at December 31, 2011.2012.
The types of debt securities in the available for sale security portfolio are presented in the table below. Additional detail by maturity category is provided in Note 3 on Investment Securities into the consolidated financial statements.
| | | | December 31, 2011 | December 31, 2012 |
| Percent of Total Debt Securities | Weighted Average Yield | Estimated Average Maturity* | Percent of Total Debt Securities | Weighted Average Yield | Estimated Average Maturity* |
| Available for sale debt securities: | | | | |
| U.S. government and federal agency obligations | 4.0 | % | 1.65 | % | 5.2 |
| years | 4.6 | % | 1.23 | % | 5.9 |
| years |
| Government-sponsored enterprise obligations | 3.4 |
| 1.99 |
| 6.7 |
| | 5.0 |
| 1.75 |
| 9.0 |
| |
| State and municipal obligations | 13.6 |
| 2.79 |
| 7.6 |
| | 17.0 |
| 2.47 |
| 7.0 |
| |
| Agency mortgage-backed securities | 44.7 |
| 3.07 |
| 4.1 |
| | 35.6 |
| 2.82 |
| 3.1 |
| |
| Non-agency mortgage-backed securities | 3.5 |
| 6.10 |
| 3.5 |
| | 2.5 |
| 6.08 |
| 4.1 |
| |
| Asset-backed securities | 29.3 |
| 1.12 |
| 1.7 |
| | 33.4 |
| .94 |
| 2.1 |
| |
| Other debt securities | 1.5 |
| 4.50 |
| 1.1 |
| | 1.9 |
| 3.47 |
| 5.2 |
| |
*Based on call provisions and estimated prepayment speeds.
Non-marketable securities, which totaled $115.8$118.7 million at December 31, 2011,2012, included $30.6$30.7 million in Federal Reserve Bank stock and $14.7$14.6 million in Federal Home Loan Bank (Des Moines) stock held by the bank subsidiary in accordance with debt and regulatory requirements. These are restricted securities which, lacking a market, are carried at cost. Other non-marketable securities also include private equity securities which are carried at estimated fair value.
The Company engages in private equity activities primarily through direct private equity investments and through threeseveral private equity subsidiaries. These subsidiaries hold investments in various business entities, which are carried at fair value and totaled $67.0$68.2 million at December 31, 2011. The Company expects to fund an additional $12.2 million to these subsidiaries for investment purposes over the next several years.2012. In addition to investments held by its private equity subsidiaries, the Parent directly holds investments in several private equity concerns, which totaled $2.7$4.3 million at year end 2011.2012. Most of the private equity investments are not readily marketable. While the nature of these investments carries a higher degree of risk than the normal lending portfolio, this risk is mitigated by the overall size of the investments and oversight provided by management, and management believes the potential for long-term gains in these investments outweighs the potential risks.
Non-marketable securities at year end for the past two years are shown below:
| | | | December 31 | December 31 |
| (In thousands) | 2011 | 2010 | 2012 | 2011 |
| Debt securities | $ | 31,683 |
| $ | 24,327 |
| $ | 32,068 |
| $ | 31,683 |
|
| Equity securities | 84,149 |
| 79,194 |
| 86,582 |
| 84,149 |
|
| Total non-marketable investment securities | $ | 115,832 |
| $ | 103,521 |
| $ | 118,650 |
| $ | 115,832 |
|
In addition to its holdings in the investment securities portfolio, the Company holds long-term securities purchased under agreements to resell, which totaled $1.2 billion and $850.0 million at December 31, 2012 and 2011, respectively. These investments mature in 2013 through 2016, and most have rates that fluctuate with published indices within a fixed range. The counterparties to these agreements are other financial institutions from whom the Company has accepted collateral of $1.3 billion in marketable investment securities at December 31, 2012. The average rate earned on these agreements during 2012 was 2.15%.
The Company also holds $300.0 million in offsetting repurchase and resell agreements at December 31, 2012, which are further discussed in Note 3 to the consolidated financial statements. These agreements involve the exchange of collateral under simultaneous repurchase and resell agreements with the same financial institution counterparty. These repurchase and resell agreements have been offset against each other in the balance sheet, as permitted under current accounting guidance.
Deposits and Borrowings
Deposits are the primary funding source for the Bank and are acquired from a broad base of local markets, including both individual and corporate customers. Total deposits were $16.8$18.3 billion at December 31, 2011,2012, compared to $15.1$16.8 billion last year, reflecting an increase of $1.7$1.5 billion, or 11.4%9.2%. This increase follows 11.4% growth was largely drivenin 2011 over 2010, and reflects a continuing sense of uncertainty about future economic stability by borrowerborrowers and investor caution in an uncertain economic climate. investors.
Average deposits grew by $1.3$1.2 billion, or 9.1%7.4%, in 20112012 compared to 20102011 with most of this growth centeredoccurring in business demand deposits, which grew $714.7 million, or 21.3%, and in interest checking and money market deposits, where the average balance grew $917.6which increased $727.7 million, or 13.5%, in 2011 compared to 2010.9.4%. Certificates of deposit with balances under $100,000 fell on average by $369.3$173.9 million, or 22.2%13.5%, whileand certificates of deposit over $100,000 increaseddecreased by $85.8$228.3 million, or 6.5%16.2%.
The following table shows year end deposits by type as a percentage of total deposits.
| | | | December 31 | December 31 |
| | 2011 | 2010 | 2012 | 2011 |
| Non-interest bearing | 32.0 | % | 29.8 | % | 34.3 | % | 32.0 | % |
| Savings, interest checking and money market | 53.2 |
| 52.0 |
| 53.5 |
| 53.2 |
|
| Time open and C.D.’s of less than $100,000 | 6.9 |
| 9.7 |
| 5.9 |
| 6.9 |
|
| Time open and C.D.’s of $100,000 and over | 7.9 |
| 8.5 |
| 6.3 |
| 7.9 |
|
| Total deposits | 100.0 | % | 100.0 | % | 100.0 | % | 100.0 | % |
Core deposits, which include non-interest bearing, interest checking, savings, and money market deposits, supported 71%74% of average earning assets in 20112012 and 67%71% in 2010.2011. Average balances by major deposit category for the last six years appear on page 52.50. A maturity schedule of time deposits outstanding at December 31, 20112012 is included in Note 6 on Deposits in the consolidated financial statements.
The Company’s primary sources of overnight borrowings are federal funds purchased and securities sold under agreements to repurchase (repurchase agreements). Balances in these accounts can fluctuate significantly on a day-to-day basis and generally have one day maturities. These short-term balances totaled $683.6 million at December 31, 2012. The Company also holds $400.0 million in long-term structured repurchase agreements that will mature inthroughout 2013 and 2014. Total balances of federal funds purchased and repurchase agreements outstanding at year end 20112012 were $1.3$1.1 billion, a $273.3$172.5 million increase overdecrease from the $982.8 million$1.3 billion balance outstanding at year end 2010.2011. On an average basis, these borrowings decreased $50.1increased $151.0 million, or 4.6%14.6%, during 2011,2012, with decreasesincreases of $44.1$77.1 million in federal funds purchased and $6.0$73.9 million in repurchase agreements. The average rate paid on total federal funds purchased and repurchase agreements was .07% during 2012 and .17% during 2011 and .24% during 2010.2011.
Most of the Company’s long-term debt is comprised of fixed rate advances from the FHLB. These borrowings declined from $104.7$104.3 million at December 31, 2010,2011, to $104.3$103.7 million outstanding at December 31, 2011.2012. The average rate paid on FHLB advances was 3.60% during 2011both 2012 and 3.30% during 2010.2011. Most of the remaining balance outstanding at December 31, 20112012 is due in 2017.
Liquidity and Capital Resources
Liquidity Management
Liquidity is managed within the Company in order to satisfy cash flow requirements of deposit and borrowing customers while at the same time meeting its own cash flow needs. The Company maintains its liquidity position through a variety of sources including:
A portfolio of liquid assets including marketable investment securities and overnight investments,
A large customer deposit base and limited exposure to large, volatile certificates of deposit,
Lower long-term borrowings that might place demands on Company cash flow,
Relatively low loan to deposit ratio promoting strong liquidity,
Excellent debt ratings from both Standard & Poor’s and Moody’s national rating services, and
Available borrowing capacity from outside sources.
Since 2008, when some of the major banking institutions experienced severe capital erosion, liquidity risk has been a concern affecting the general banking industry. The Company has taken numerous steps to address liquidity risk and over the past few years has developed a variety of liquidity sources which it believes will provide the necessary funds for future growth. Over the past several years, overall liquidity improved significantly throughout the banking industry and within the Company as a result of growth in deposits, a decline in loans outstanding and growth in marketable securities. As a result, the Company’s average loans to deposits ratio, one measure of liquidity, decreased from 70.0% in 2010 to 59.2% in 2011.
2011 to 55.8% in 2012.
The Company’s most liquid assets include available for sale marketable investment securities, federal funds sold, balances at the Federal Reserve Bank, and securities purchased under agreements to resell (resell agreements). At December 31, 20112012 and 20102011, such assets were as follows:
| | | (In thousands) | 2011 | 2010 | 2012 | 2011 |
| Available for sale investment securities | $ | 9,224,702 |
| $ | 7,294,303 |
| $ | 9,522,248 |
| $ | 9,224,702 |
|
| Federal funds sold | 11,870 |
| 10,135 |
| 27,595 |
| 11,870 |
|
| Long-term securities purchased under agreements to resell | 850,000 |
| 450,000 |
| 1,200,000 |
| 850,000 |
|
| Balances at the Federal Reserve Bank | 39,853 |
| 122,076 |
| 179,164 |
| 39,853 |
|
| Total | $ | 10,126,425 |
| $ | 7,876,514 |
| $ | 10,929,007 |
| $ | 10,126,425 |
|
Federal funds sold, which are sold to the Company’s correspondent bank customers and have overnight maturities, totaled $11.9$27.6 million at December 31, 2011. During 2010 and 2011,2012. At December 31, 2012, the Company purchased $850.0 millionheld $1.2 billion in long-term resell agreements, maturing in 2013 through 2016, from other large financial institutions, that mature between 2012 and 2014.institutions. Under these agreements, the Company holds marketable securities as collateral, which totaled $894.4 million$1.3 billion in fair value at December 31, 2011.2012. Interest earning balances at the Federal Reserve Bank, which have overnight maturities and are used for general liquidity purposes, totaled $39.9$179.2 million at December 31, 2011.2012. The Company’s available for sale investment portfolio hasincludes scheduled maturities and expected pay downs of approximately $1.6$2.2 billion which are scheduled to occur during 20122013, and offers substantial resources to meet either new loan demand or reductions in the Company’s deposit funding base. The Company pledges portions of its investment securities portfolio to secure public fund deposits, repurchase agreements, trust funds, letters of credit issued by the FHLB, and borrowing capacity at the Federal Reserve Bank. At December 31, 2012 and 2011, total investment securities pledged for these purposes were as follows:
| | | (In thousands) | 2011 | 2012 | 2011 |
| Investment securities pledged for the purpose of securing: | | |
| Federal Reserve Bank borrowings | $ | 642,306 |
| $ | 604,121 |
| $ | 642,306 |
|
| FHLB borrowings and letters of credit | 111,860 |
| 46,732 |
| 111,860 |
|
| Repurchase agreements | 2,048,074 |
| 2,105,867 |
| 2,048,074 |
|
| Other deposits | 1,537,414 |
| 1,550,114 |
| 1,564,105 |
|
| Total pledged securities | 4,339,654 |
| 4,306,834 |
| 4,366,345 |
|
| Unpledged and available for pledging | 4,374,898 |
| 3,428,781 |
| 3,260,695 |
|
| Ineligible for pledging | 510,150 |
| 1,786,633 |
| 1,597,662 |
|
| Total available for sale securities, at fair value | $ | 9,224,702 |
| $ | 9,522,248 |
| $ | 9,224,702 |
|
Liquidity is also available from the Company’s large base of core customer deposits, defined as non-interest bearing, interest checking, savings, and money market deposit accounts. At December 31, 2011,2012, such deposits totaled $14.3$16.1 billion and represented 85.2%87.8% of the Company’s total deposits. These core deposits are normally less volatile, often with customer relationships tied to other products offered by the Company promoting long lasting relationships and stable funding sources. During 2012, total core deposits increased $1.8 billion, with consumer core deposits growing $1.1 billion and corporate core deposits up $657.5 million. Much of this growth occurred in the fourth quarter of 2012, and reflected not only seasonal patterns but also an increased need for liquidity. Also, extremely low interest rates provide customers with fewer investment alternatives. Additionally in 2011, total core deposits increased $2.0 billion, mainlyreflecting similar trends as in non-interest bearing and money market accounts. This increase was comprised of growth in consumer deposits of $879.7 million and corporate and non-personal deposits of $1.1 billion. Some of the growth in corporate deposits was the result of a tendency by businesses to maintain higher levels of liquidity, in addition to low rate investment alternatives.current year. While the Company considers core consumer deposits less volatile, corporate deposits could decline if interest rates increase significantly or if corporate customers increase investing activities and move funds from the Company.reduce deposit balances. In order to address funding needs shouldif these corporate deposits decline, the Company maintains adequate levels of earning assets maturingtotaling $2.2 billion which mature in 2012,2013 as noted above. In addition, as shown on page 40, the Company has borrowing capacity of $3.2 billion through advances from the FHLB and the Federal Reserve.
|
| | | | | | |
| (In thousands) | 2012 | 2011 |
| Core deposit base: | | |
| Non-interest bearing | $ | 6,299,903 |
| $ | 5,377,549 |
|
| Interest checking | 976,144 |
| 968,430 |
|
| Savings and money market | 8,841,799 |
| 7,965,511 |
|
| Total | $ | 16,117,846 |
| $ | 14,311,490 |
|
Time open and certificates of deposit of $100,000 or greater totaled $1.3$1.2 billion at December 31, 2011.2012. These deposits are normally considered more volatile and higher costing and comprised 7.9%6.3% of total deposits at December 31, 2011.
|
| | | | | | |
| (In thousands) | 2011 | 2010 |
| Core deposit base: | | |
| Non-interest bearing | $ | 5,377,549 |
| $ | 4,494,028 |
|
| Interest checking | 968,430 |
| 818,359 |
|
| Savings and money market | 7,965,511 |
| 7,028,472 |
|
| Total | $ | 14,311,490 |
| $ | 12,340,859 |
|
Other important components of liquidity are the level of borrowings from third party sources and the availability of future credit. The Company’s outside borrowings are mainly comprised of federal funds purchased, repurchase agreements, and advances from the FHLB, as follows:
| | | (In thousands) | 2011 | 2010 | 2012 | 2011 |
| Borrowings: | | |
| Federal funds purchased | $ | 153,330 |
| $ | 4,910 |
| $ | 24,510 |
| $ | 153,330 |
|
| Repurchase agreements | 1,102,751 |
| 977,917 |
| 1,059,040 |
| 1,102,751 |
|
| FHLB advances | 104,302 |
| 104,675 |
| 103,710 |
| 104,302 |
|
| Other long-term debt | 7,515 |
| 7,598 |
| — |
| 7,515 |
|
| Total | $ | 1,367,898 |
| $ | 1,095,100 |
| $ | 1,187,260 |
| $ | 1,367,898 |
|
Federal funds purchased, which totaled $153.3$24.5 million at December 31, 2011,2012, are unsecured overnight borrowings obtained mainly from upstream correspondent banks with which the Company maintains approved lines of credit. Repurchase agreements are secured by a portion of the Company’s investment portfolio and are comprised of both non-insured customer funds, totaling $702.8$659.0 million at December 31, 2011,2012, and structured repurchase agreements of $400.0 million. Customer repurchase agreements are offered to customers wishing to earn interest in highly liquid balances and are used by the Company as a funding source considered to be stable, but short-term in nature. The structured repurchase agreements were borrowed from an upstream financial institution and are due in 2013 and 2014. The Company also borrows on a secured basis through advances from the FHLB, which totaled $104.3$103.7 million at December 31, 2011.2012. All of these advances have fixed interest rates, and maturewith the majority maturing in 2012 through 2017. The Company’s other borrowings are mainly comprised of debt related to the Company’s private equity business. The overall long-term debt position of the Company is small relative to the Company’s overall liability position.
The Company pledges certain assets, including loans and investment securities, to both the Federal Reserve Bank and the FHLB as security to establish lines of credit and borrow from these entities. Based on the amount and type of collateral pledged, the FHLB establishes a collateral value from which the Company may draw advances against the collateral. Also, this collateral is used to enable the FHLB to issue letters of credit in favor of public fund depositors of the Company. The Federal Reserve Bank also establishes a collateral value of assets pledged and permits borrowings from the discount window. The following table reflects the collateral value of assets pledged, borrowings, and letters of credit outstanding, in addition to the estimated future funding capacity available to the Company at December 31, 2011.2012.
| | | | December 31, 2011 | December 31, 2012 |
| (In thousands) | FHLB | Federal Reserve | Total | FHLB | Federal Reserve | Total |
| Total collateral value pledged | $ | 1,901,890 |
| $ | 1,403,421 |
| $ | 3,305,311 |
| $ | 2,039,676 |
| $ | 1,474,583 |
| $ | 3,514,259 |
|
| Advances outstanding | (104,302 | ) | — |
| (104,302 | ) | (103,710 | ) | — |
| (103,710 | ) |
| Letters of credit issued | (169,497 | ) | — |
| (169,497 | ) | (260,050 | ) | — |
| (260,050 | ) |
| Available for future advances | $ | 1,628,091 |
| $ | 1,403,421 |
| $ | 3,031,512 |
| $ | 1,675,916 |
| $ | 1,474,583 |
| $ | 3,150,499 |
|
The Company’s average loans to deposits ratio was 59.2%55.8% at December 31, 2011,2012, which is considered in the banking industry to be a conservative measure of goodstrong liquidity. Also, the Company receives outside ratings from both Standard & Poor’s and Moody’s on both the consolidated company and its subsidiary bank, Commerce Bank. These ratings are as follows:
|
| | |
| | Standard & Poor’s | Moody’s |
| Commerce Bancshares, Inc. | | |
| Issuer rating | A- | |
| Commercial paper rating |
| P-1 |
| Rating outlook | Stable | Stable |
| Commerce Bank | | |
| Issuer rating | A | Aa2Aa3 |
| Bank financial strength rating |
| B+B |
| Rating outlook | Stable | Stable |
The Company considers these ratings to be indications of a sound capital base and goodstrong liquidity and believes that these ratings would help ensure the ready marketability of its commercial paper, should the need arise. No commercial paper has been outstanding during the past ten years. The Company has no subordinated or hybrid debt instruments which would affect future borrowings
borrowing capacity. Because of its lack of significant long-term debt, the Company believes that, through its Capital Markets Group or in other public debt markets, it could generate additional liquidity from sources such as jumbo certificates of deposit, privately-placed corporate notes or other forms of debt. Future financing could also include the issuance of common or preferred stock.
The cash flows from the operating, investing and financing activities of the Company resulted in a net increase in cash and cash equivalents of $56.9$262.3 million in 2011,2012, as reported in the consolidated statements of cash flows on page 6059 of this report. Operating activities, consisting mainly of net income adjusted for certain non-cash items, provided cash flow of $407.4$383.1 million and has historically been a stable source of funds. Investing activities used total cash of $2.2$1.2 billion in 20112012 and consisted mainly of purchases and maturities of available for sale investment securities, changes in long-term securities purchased under agreements to resell, and changes in the level of the Company’s loan portfolio. Growth in the investment securitiesloan portfolio used cash of $1.9 billion, and net$693.2 million. Net purchases of long-term resell agreements used cash of $400.0 million. The decline$350.0 million, and growth in the loaninvestment securities portfolio providedused cash of $169.0$85.3 million. Investing activities are somewhat unique to financial institutions in that, while large sums of cash flow are normally used to fund growth in investment securities, loans, or other bank assets, they are normally dependent on the financing activities described below.
Financing activities provided total cash of $1.8$1.0 billion, primarily resulting from a $1.7$1.5 billion increase in deposits and adeposits. This increase to cash was partly offset by net increasedecrease of $273.3$172.5 million in borrowings of federal funds purchased and repurchase agreements. These increases to cash were partly offset byagreements, purchases of treasury stock of $101.2$104.9 million, and cash dividend payments of $79.1$211.6 million. Future short-term liquidity needs for daily operations are not expected to vary significantly, and the Company maintains adequate liquidity to meet these cash flows. The Company’s sound equity base, along with its low debt level, common and preferred stock availability, and excellent debt ratings, provide several alternatives for future financing. Future acquisitions may utilize partial funding through one or more of these options.
Cash flows resulting from the Company’s transactions in its common stock were as follows:
| | | (In millions) | 2011 | 2010 | 2009 | 2012 | 2011 | 2010 |
| Stock sale program | $ | — |
| $ | — |
| $ | 98.2 |
| |
| Exercise of stock-based awards and sales to affiliate non-employee directors | 15.3 |
| 11.3 |
| 5.5 |
| $ | 15.6 |
| $ | 15.3 |
| $ | 11.3 |
|
| Purchases of treasury stock | (101.2 | ) | (41.0 | ) | (.5 | ) | (104.9 | ) | (101.2 | ) | (41.0 | ) |
| Cash dividends paid | (79.1 | ) | (78.2 | ) | (74.7 | ) | (211.6 | ) | (79.1 | ) | (78.2 | ) |
| Cash provided (used) | $ | (165.0 | ) | $ | (107.9 | ) | $ | 28.5 |
| |
| Cash used | | $ | (300.9 | ) | $ | (165.0 | ) | $ | (107.9 | ) |
The Parent faces unique liquidity constraints due to legal limitations on its ability to borrow funds from its bank subsidiary. The Parent obtains funding to meet its obligations from two main sources: dividends received from bank and non-bank subsidiaries (within regulatory limitations) and from management fees charged to subsidiaries as reimbursement for services provided by the Parent, as presented below:
| | | (In millions) | 2011 | 2010 | 2009 | 2012 | 2011 | 2010 |
| Dividends received from subsidiaries | $ | 180.1 |
| $ | 105.1 |
| $ | 45.1 |
| $ | 235.0 |
| $ | 180.1 |
| $ | 105.1 |
|
| Management fees | 19.3 |
| 22.6 |
| 46.6 |
| 23.7 |
| 19.3 |
| 22.6 |
|
| Total | $ | 199.4 |
| $ | 127.7 |
| $ | 91.7 |
| $ | 258.7 |
| $ | 199.4 |
| $ | 127.7 |
|
These sources of funds are used mainly to pay cash dividends on outstanding common stock, pay general operating expenses, and purchase treasury stock when appropriate.stock. At December 31, 2011,2012, the Parent’s available for sale investment securities totaled $74.6$65.2 million at fair value, consisting mainly of publicly traded common stock and non-agency backed collateralized mortgage obligations. To support its various funding commitments, the Parent maintains a $20.0 million line of credit with its subsidiary bank. There were no borrowings outstanding under the line during 20112012 or 2010.2011.
Company senior management is responsible for measuring and monitoring the liquidity profile of the organization with oversight by the Company’s Asset/Liability Committee. This is done through a series of controls, including a written Contingency Funding Policy and risk monitoring procedures, which include daily, weekly and monthly reporting. In addition, the Company prepares forecasts to project changes in the balance sheet affecting liquidity and to allow the Company to better plan for forecasted changes.
Capital Management
The Company maintains strong regulatory capital ratios, including those of its banking subsidiary, in excess of the “well-capitalized” guidelines under federal banking regulations. The Company’s capital ratios at the end of the last three years are as follows:
| | | 2011 | 2010 | 2009 | Well-Capitalized Regulatory Guidelines | 2012 | 2011 | 2010 | Well-Capitalized Regulatory Guidelines |
| Regulatory risk-based capital ratios: | | |
| Tier I capital | 14.71 | % | 14.38 | % | 13.04 | % | 6.00 | % | 13.60 | % | 14.71 | % | 14.38 | % | 6.00 | % |
| Total capital | 16.04 |
| 15.75 |
| 14.39 |
| 10.00 |
| 14.93 |
| 16.04 |
| 15.75 |
| 10.00 |
|
| Leverage ratio | 9.55 |
| 10.17 |
| 9.58 |
| 5.00 |
| 9.14 |
| 9.55 |
| 10.17 |
| 5.00 |
|
| Tangible common equity to assets | 9.91 |
| 10.27 |
| 9.71 |
| | 9.25 |
| 9.91 |
| 10.27 |
| |
| Dividend payout ratio | 31.06 |
| 35.52 |
| 44.15 |
| | 79.48 |
| 31.06 |
| 35.52 |
| |
The Company’s regulatory risked-based capital amounts and risk-weighted assets at the end of the last three years are as follows:
| | | (In thousands) | 2011 | 2010 | 2009 | 2012 | 2011 | 2010 |
| Regulatory risk-based capital: | | |
| Tier I capital | $ | 1,928,690 |
| $ | 1,828,965 |
| $ | 1,708,901 |
| $ | 1,906,203 |
| $ | 1,928,690 |
| $ | 1,828,965 |
|
| Tier II capital | 174,711 |
| 173,681 |
| 177,077 |
| 185,938 |
| 174,711 |
| 173,681 |
|
| Total capital | 2,103,401 |
| 2,002,646 |
| 1,885,978 |
| 2,092,141 |
| 2,103,401 |
| 2,002,646 |
|
| Total risk-weighted assets | 13,115,261 |
| 12,717,868 |
| 13,105,948 |
| 14,015,648 |
| 13,115,261 |
| 12,717,868 |
|
The Company maintains a stock buyback program and purchases stock in the market under authorizations by its Board of Directors. During 20112012 the Company purchased 2,621,9182,716,368 shares of stock at an average cost of $38.58$38.62 per share. At December 31, 2011, 2,999,3002012, 2,127,618 shares remained available for purchase under the current Board authorization.
The Company’s common stock dividend policy reflects its earnings outlook, desired payout ratios, the need to maintain adequate capital levels and alternative investment options. PerThe regular per share cash dividends paid by the Company increased 2.7%5.0% in 20112012 compared with 2010.2011. In addition, the Company paid a special cash dividend of $1.429 per share in the fourth quarter of 2012. The Company also paid its eighteenthnineteenth consecutive annual stock dividend in December 2011.
Common Equity Offering
On February 27, 2009, the Company entered into an equity distribution agreement with a broker dealer, acting as the Company’s sales agent, relating to the offering of the Company’s common stock. Sales of these shares were made by means of brokers’ transactions on or through the Nasdaq Global Select Market, trading facilities of national securities associations or alternative trading systems, block transactions and such other transactions as agreed upon by the Company and the sales agent, at market prices prevailing at the time of the sale or at prices related to the prevailing market prices. On July 31, 2009, the Company terminated the offering.
Total shares sold under the offering amounted to 2,894,773. Total gross proceeds for the entire offering were $100.0 million, with an average sale price of $34.55 per share, and total commissions paid to the sales agent for the sale of these shares were $1.5 million. After payment of commissions and SEC, legal and accounting fees relating to the offering, net proceeds for the entire offering totaled $98.2 million, with average net sale proceeds of $33.91 per share.2012.
Commitments, Contractual Obligations, and Off-Balance Sheet Arrangements
In the normal course of business, various commitments and contingent liabilities arise which are not required to be recorded on the balance sheet. The most significant of these are loan commitments totaling $7.6$8.4 billion (including approximately $3.5$3.9 billion in unused approved credit card lines), and the contractual amount of standby letters of credit totaling $377.1$359.8 million at December 31, 2011.2012. As many commitments expire unused or only partially used, these totals do not necessarily reflect future cash requirements. Management does not anticipate any material losses arising from commitments or contingent liabilities and believes there are no material commitments to extend credit that represent risks of an unusual nature.
A table summarizing contractual cash obligations of the Company at December 31, 20112012 and the expected timing of these payments follows:
| | | | Payments Due by Period | | | Payments Due by Period | | |
| (In thousands) | In One Year or Less | After One Year Through Three Years | After Three Years Through Five Years | After Five Years | | Total | In One Year or Less | After One Year Through Three Years | After Three Years Through Five Years | After Five Years | | Total |
| Long-term debt obligations, including structured repurchase agreements* | $ | 7,975 |
| $ | 402,579 |
| $ | 1,263 |
| $ | 100,000 |
| | $ | 511,817 |
| $ | 51,510 |
| $ | 351,249 |
| $ | 100,951 |
| $ | — |
| | $ | 503,710 |
|
| Operating lease obligations | 5,346 |
| 8,704 |
| 5,335 |
| 17,978 |
| | 37,363 |
| 5,354 |
| 8,178 |
| 4,810 |
| 16,532 |
| | 34,874 |
|
| Purchase obligations | 51,520 |
| 98,259 |
| 71,623 |
| 3,050 |
| | 224,452 |
| 69,583 |
| 104,131 |
| 48,352 |
| 4,030 |
| | 226,096 |
|
| Time open and C.D.’s * | 1,873,682 |
| 445,547 |
| 169,085 |
| 79 |
| | 2,488,393 |
| 1,768,087 |
| 330,666 |
| 132,025 |
| 29 |
| | 2,230,807 |
|
| Total | $ | 1,938,523 |
| $ | 955,089 |
| $ | 247,306 |
| $ | 121,107 |
| | $ | 3,262,025 |
| $ | 1,894,534 |
| $ | 794,224 |
| $ | 286,138 |
| $ | 20,591 |
| | $ | 2,995,487 |
|
* Includes principal payments only.
As of December 31, 2011,2012, the Company has unrecognized tax benefits that, if recognized, would impact the effective tax rate in future periods. Due to the uncertainty of the amounts to be ultimately paid, as well as the timing of such payments, all uncertain tax liabilities that have not been paid have been excluded from the table above. Further detail on the impact of income taxes is located in Note 8 to the consolidated financial statements.
The Company funds a defined benefit pension plan for a portion of its employees. Under the funding policy for the plan, contributions are made as necessary to provide for current service and for any unfunded accrued actuarial liabilities over a reasonable period. During recent years,2012, the Company hasmade a discretionary contribution of $1.5 million to its defined benefit pension plan in order to reduce pension guarantee premiums. However, the Company is not been required nor does it expect to make cash contributions to the plan and does not expect to do soa contribution in 2012.2013.
The Company has investments in several low-income housing partnerships within the areaareas it serves. At December 31, 2011, these investments totaled $7.2 million and were recorded as other assets in the Company’s consolidated balance sheet. These partnerships supply funds for the construction and operation of apartment complexes that provide affordable housing to that segment of the population with lower family income. If these developments successfully attract a specified percentage of residents
falling in that lower income range, state and/or federal income tax credits are made available to the partners. The tax credits are normally recognized over ten years, and they play an important part in the anticipated yield from these investments. In order to continue receiving the tax credits each year over the life of the partnership, the low-income residency targets must be maintained. Under the terms of the partnership agreements, the Company has a commitment to fund a specified amount that will be due in installments over the life of the agreements, which ranges from 10 to 15 years. TheseAt December 31, 2012, the funded investments totaled $7.8 million and are recorded as other assets in the Company’s consolidated balance sheet. Additional unfunded commitments, which are recorded as liabilities, on the Company’s consolidated balance sheet and aggregatedamounted to $6.4$6.9 million at December 31, 2011.2012.
The Company regularly purchases various state tax credits arising from third-party property redevelopment. While most of the taxThese credits are either resold to third parties some are periodicallyor retained for use by the Company. During 2011,2012, purchases and sales of tax credits amounted to $46.0$56.9 million and $41.5$31.0 million, respectively. At December 31, 2011,2012, the Company had outstanding purchase commitments totaling $108.4$149.8 million.
The Parent has investments in several private equity concerns which are classified as non-marketable securities in the Company’s consolidated balance sheet. Under the terms of the agreements with two of these concerns, the Parent has unfunded commitments outstanding of $1.3 million at December 31, 2011. The Parent also expects to fund $12.2 million to private equity subsidiaries over the next several years.
Interest Rate Sensitivity
The Company’s Asset/Liability Management Committee (ALCO) measures and manages the Company’s interest rate risk on a monthly basis to identify trends and establish strategies to maintain stability in net interest income throughout various rate environments. Analytical modeling techniques provide management insight into the Company’s exposure to changing rates. These techniques include net interest income simulations and market value analyses.analysis. Management has set guidelines specifying acceptable limits within which net interest income and market value may change under various rate change scenarios. These measurement tools indicate that the Company is currently within acceptable risk guidelines as set by management.
The Company’s main interest rate measurement tool, income simulations, projects net interest income under various rate change scenarios in order to quantify the magnitude and timing of potential rate-related changes. Income simulations are able to capture option risks within the balance sheet where expected cash flows may be altered under various rate environments. Modeled rate movements include “shocks, ramps and twists”. Shocks are intended to capture interest rate risk under extreme conditions by immediately shifting rates up and down, while ramps measure the impact of gradual changes and twists measure yield curve risk. The size of the balance sheet is assumed to remain constant so that results are not influenced by growth predictions. The table below shows the expected effect that gradual basis point shifts in the LIBOR/swap curve over a twelve month period would have on the Company’s net interest income, given a static balance sheet.
| | | | December 31, 2011 | | September 30, 2011 | | December 31, 2010 | December 31, 2012 | | September 30, 2012 | | December 31, 2011 |
| (Dollars in millions) | $ Change in Net Interest Income | % Change in Net Interest Income | | $ Change in Net Interest Income | % Change in Net Interest Income | | $ Change in Net Interest Income | % Change in Net Interest Income | $ Change in Net Interest Income | % Change in Net Interest Income | | $ Change in Net Interest Income | % Change in Net Interest Income | | $ Change in Net Interest Income | % Change in Net Interest Income |
| 300 basis points rising |
| ($2.0 | ) | (.32 | )% | |
| ($4.0 | ) | (.64 | )% | |
| $10.4 |
| 1.70 | % |
| ($2.1 | ) | (.36 | )% | |
| $8.8 |
| 1.50 | % | |
| ($2.0 | ) | (.32 | )% |
| 200 basis points rising | 2.2 |
| .34 |
| | (1.5 | ) | (.24 | ) | | 7.6 |
| 1.25 |
| 3.1 |
| .51 |
| | 10.3 |
| 1.77 |
| | 2.2 |
| .34 |
|
| 100 basis points rising | 3.5 |
| .56 |
| | .1 |
| .02 |
| | 2.8 |
| .46 |
| 4.9 |
| .82 |
| | 8.3 |
| 1.41 |
| | 3.5 |
| .56 |
|
The Company also employs a sophisticated simulation technique known as a stochastic income simulation. This technique allows management to see a range of results from hundreds of income simulations. The stochastic simulation creates a vector of potential rate paths around the market’s best guess (forward rates) concerning the future path of interest rates and allows rates to randomly follow paths throughout the vector. This allows for the modeling of non-biased rate forecasts around the market consensus. Results give management insight into a likely range of rate-related risk as well as worst and best-case rate scenarios.
The Company also uses market value analysesanalysis to help identify longer-term risks that may reside on the balance sheet. This is considered a secondary risk measurement tool by management. The Company measures the market value of equity as the net present value of all asset and liability cash flows discounted along the current LIBOR/swap curve plus appropriate market risk spreads. It is the change in the market value of equity under different rate environments, or effective duration that gives insight into the magnitude of risk to future earnings due to rate changes. Market value analysesanalysis also help management understand the price sensitivity of non-marketable bank products under different rate environments.
The Company’s modeling of interest rate risk as ofUnder the above scenarios at December 31, 2011 shows that under the 200 and 300 basis point rising rate scenarios, the overall balance sheet became liability sensitive compared to year end 2010. At December 31, 2011, the Company calculated that2012, a gradual increase in interest rates of 100 basis points wouldis expected to increase net interest income from the base calculation by $4.9 million, or .82%, and a rise of 200 basis points is expected to increase net interest income by $3.5$3.1 million, or .6%, compared with an increase of $2.8 million projected at December 31, 2010. A 200.51%. Under a 300 basis point gradual rise in rates calculated at December 31, 2011 would increasepoints rising rate scenario, net interest income would decrease by $2.2$2.1 million, or .3%, down from an increase of $7.6 million last year. Also, a gradual increase of 300 basis points would lower net interest income by $2.0 million, or .3%, compared.36%. Due to a growth of $10.4 million at December 31, 2010. Falling rate scenarios were not modeled due the extremelyalready low interest rate environment.
Under risingenvironment, the Company did not model falling rate models, the potential increasescenarios. The change in net interest income was lowerfrom the base calculation at December 31, 2011 when compared to2012 for the prior yearthree scenarios shown was lower than projections made at September 30, 2012 and largely due to several factors.an increase in longer duration assets in the Company's portfolios of investment securities and resell agreements, which was funded primarily by shorter duration liabilities. These factors includedlonger duration assets were purchased to protect against the possible continuation of extremely low rates. As a decline of $787.4 million in average loan balances in 2011 compared to the previous year, which are mainly variable rate assets and more sensitive to changes in interest rates, and average growth of $1.4 billion in available for sale securities, most of which have fixed rates. In addition to the change in earning assets, average interest bearing deposits grew during 2011 by $680.9 million, mainly in money market deposit accounts. Deposits have lower rates and are modeled to re-price upwards more slowly, thus partially offsetting the effect of a larger fixed rate securities portfolio. Total borrowings (mainly FHLB advances) declined on average by $390.8 million, resulting in lower interest expense.
Thus, under rising rate scenarios, the Company benefits from the repricing of its loan portfolio, the majority of which is variable rate. However, higher levels of fixed rate securities will partly offset the effect of the loan portfolio on interest income. Additionally, deposit balances have a smaller impact onresult, while net interest income benefits less when rates arerise, a rising duerate environment suggests growth in economic activity and greater demand for higher rate lending products. Additionally, but to lower overalla lesser extent, higher long-term rates and fewer accountsat December 31, 2012 slowed prepayment projections on mortgage-backed securities, such that carry variable rates movingfurther rate increases result in sequence with market rates.less benefit.
Through review and oversight by the ALCO, the Company attempts to engage in strategies that neutralize interest rate risk as much as possible. The Company’s balance sheet remains well-diversified with moderate interest rate risk and is well-positioned for future growth. The use of derivative products is limited and the deposit base is strong and stable. The loan to deposit ratio is still at relatively low levels, which should present the Company with opportunities to fund future loan growth at reasonable costs. The Company believes that its approach to interest rate risk has appropriately considered its susceptibility to both rising and falling rates and has adopted strategies which minimize impacts of interest rate risk.
Derivative Financial Instruments
The Company maintains an overall interest rate risk management strategy that permits the use of derivative instruments to modify exposure to interest rate risk. The Company’s interest rate risk management strategy includes the ability to modify the re-pricing characteristics of certain assets and liabilities so that changes in interest rates do not adversely affect the net interest margin and cash flows. Interest rate swaps are used on a limited basis as part of this strategy. As of December 31, 2011,2012, the Company had entered into three interest rate swaps with a notional amount of $14.5$13.2 million which are designated as fair value hedges of certain fixed rate loans. The Company also sells swap contracts to customers who wish to modify their interest rate sensitivity. The Company offsets the interest rate risk of these swaps by purchasing matching contracts with offsetting pay/receive rates from other financial institutions. The notional amount of these types of swaps at December 31, 20112012 was $471.7$422.4 million.
Credit risk participation agreements arise when the Company contracts, with other financial institutions, as a guarantor or beneficiary, with other financial institutions to share credit risk associated with certain interest rate swaps. These agreements provide for reimbursement of losses resulting from a third party default on the underlying swap.
The Company enters into foreign exchange derivative instruments as an accommodation to customers and offsets the related foreign exchange risk by entering into offsetting third-party forward contracts with approved, reputable counterparties. In addition, the Company takes proprietary positions in such contracts based on market expectations. Hedge accounting has not been applied to these foreign exchange activities. This trading activity is managed within a policy of specific controls and limits. Most of the foreign exchange contracts outstanding at December 31, 20112012 mature within six months.
Additionally, interest rate lock commitments issued on residential mortgage loans held for resale are considered derivative instruments. The interest rate exposure on these commitments is economically hedged primarily with forward sale contracts in the secondary market. In late 2011, the Company curtailed the sales of these types of loans. At December 31, 2012, none were held for sale, and thus, no commitments or forward sale contracts were outstanding.
In all of these contracts, the Company is exposed to credit risk in the event of nonperformance by counterparties, who may be bank customers or other financial institutions. The Company controls the credit risk of its financial contracts through credit approvals, limits and monitoring procedures. Because the Company generally enters into transactions only with high quality counterparties, there have been no losses associated with counterparty nonperformance on derivative financial instruments.
The following table summarizes the notional amounts and estimated fair values of the Company’s derivative instruments at December 31, 20112012 and 2010.2011. Notional amount, along with the other terms of the derivative, is used to determine the amounts to be exchanged between the counterparties. Because the notional amount does not represent amounts exchanged by the parties, it is not a measure of loss exposure related to the use of derivatives nor of exposure to liquidity risk.
| | | | 2011 | | 2010 | 2012 | | 2011 |
| (In thousands) | Notional Amount | | Positive Fair Value | | Negative Fair Value | | Notional Amount | | Positive Fair Value | | Negative Fair Value | Notional Amount | | Positive Fair Value | | Negative Fair Value | | Notional Amount | | Positive Fair Value | | Negative Fair Value |
| Interest rate swaps | $ | 486,207 |
| | $ | 19,051 |
| | $ | (20,210 | ) | | $ | 498,071 |
| | $ | 17,712 |
| | $ | (18,958 | ) | $ | 435,542 |
| | $ | 16,334 |
| | $ | (17,060 | ) | | $ | 486,207 |
| | $ | 19,051 |
| | $ | (20,210 | ) |
| Interest rate caps | 29,736 |
| | 11 |
| | (11 | ) | | 31,736 |
| | 84 |
| | (84 | ) | 27,736 |
| | 1 |
| | (1 | ) | | 29,736 |
| | 11 |
| | (11 | ) |
| Credit risk participation agreements | 41,414 |
| | 9 |
| | (141 | ) | | 40,661 |
| | — |
| | (130 | ) | 43,243 |
| | 9 |
| | (196 | ) | | 41,414 |
| | 9 |
| | (141 | ) |
| Foreign exchange contracts | 80,535 |
| | 2,440 |
| | (2,343 | ) | | 25,867 |
| | 492 |
| | (359 | ) | 47,897 |
| | 396 |
| | (461 | ) | | 80,535 |
| | 2,440 |
| | (2,343 | ) |
| Mortgage loan commitments | 1,280 |
| | 20 |
| | — |
| | 12,125 |
| | 101 |
| | (30 | ) | — |
| | — |
| | — |
| | 1,280 |
| | 20 |
| | — |
|
| Mortgage loan forward sale contracts | 3,650 |
| | 6 |
| | (17 | ) | | 24,112 |
| | 434 |
| | (23 | ) | — |
| | — |
| | — |
| | 3,650 |
| | 6 |
| | (17 | ) |
| Total at December 31 | $ | 642,822 |
| | $ | 21,537 |
| | $ | (22,722 | ) | | $ | 632,572 |
| | $ | 18,823 |
| | $ | (19,584 | ) | $ | 554,418 |
| | $ | 16,740 |
| | $ | (17,718 | ) | | $ | 642,822 |
| | $ | 21,537 |
| | $ | (22,722 | ) |
Operating Segments
The Company segregates financial information for use in assessing its performance and allocating resources among three operating segments. The results are determined based on the Company’s management accounting process, which assigns balance sheet and income statement items to each responsible segment. These segments are defined by customer base and product type. The management process measures the performance of the operating segments based on the management structure of the Company and is not necessarily comparable with similar information for any other financial institution. Each segment is managed by executives who, in conjunction with the Chief Executive Officer, make strategic business decisions regarding that segment. The three reportable operating segments are Consumer, Commercial and Wealth. Additional information is presented in Note 12 on Segments in the consolidated financial statements.
The Company uses a funds transfer pricing method to value funds used (e.g., loans, fixed assets, cash, etc.) and funds provided (deposits, borrowings, and equity) by the business segments and their components. This process assigns a specific value to each new source or use of funds with a maturity, based on current LIBOR interestswap rates, thus determining an interest spread at the time of the transaction. Non-maturity assets and liabilities are assignedvalued using weighted average pools. The funds transfer pricing process attempts to LIBOR-based funding pools. This method helps to provide an accurate means of valuing fund sources and uses in a varyingremove interest rate environment.risk from valuation, allowing management to compare profitability under various rate environments. The Company also assigns loan charge-offs and recoveries (labeled in the table below as “provision for loan losses”) directly to each operating segment instead of allocating an estimated loan loss provision. The operating segments also include a number of allocations of income and expense from various support and overhead centers within the Company.
The table below is a summary of segment pre-tax income results for the past three years.
| | | (Dollars in thousands) | Consumer | Commercial | Wealth | Segment Totals | Other/Elimination | Consolidated Totals | Consumer | Commercial | Wealth | Segment Totals | Other/Elimination | Consolidated Totals |
| Year ended December 31, 2012: | | |
| Net interest income | | $ | 274,844 |
| $ | 291,393 |
| $ | 39,502 |
| $ | 605,739 |
| $ | 34,167 |
| $ | 639,906 |
|
| Provision for loan losses | | (35,496 | ) | (2,824 | ) | (695 | ) | (39,015 | ) | 11,728 |
| (27,287 | ) |
| Non-interest income | | 114,307 |
| 179,824 |
| 108,471 |
| 402,602 |
| (2,972 | ) | 399,630 |
|
| Investment securities gains, net | | — |
| — |
| — |
| — |
| 4,828 |
| 4,828 |
|
| Non-interest expense | | (266,892 | ) | (226,795 | ) | (90,643 | ) | (584,330 | ) | (34,139 | ) | (618,469 | ) |
| Income before income taxes | | $ | 86,763 |
| $ | 241,598 |
| $ | 56,635 |
| $ | 384,996 |
| $ | 13,612 |
| $ | 398,608 |
|
| Year ended December 31, 2011: | | |
| Net interest income | $ | 283,555 |
| $ | 283,790 |
| $ | 38,862 |
| $ | 606,207 |
| $ | 39,863 |
| $ | 646,070 |
| $ | 283,555 |
| $ | 283,790 |
| $ | 38,862 |
| $ | 606,207 |
| $ | 39,863 |
| $ | 646,070 |
|
| Provision for loan losses | (47,273 | ) | (16,195 | ) | (712 | ) | (64,180 | ) | 12,665 |
| (51,515 | ) | (47,273 | ) | (16,195 | ) | (712 | ) | (64,180 | ) | 12,665 |
| (51,515 | ) |
| Non-interest income | 131,253 |
| 162,533 |
| 101,836 |
| 395,622 |
| (2,705 | ) | 392,917 |
| 131,253 |
| 162,533 |
| 101,836 |
| 395,622 |
| (2,705 | ) | 392,917 |
|
| Investment securities gains, net | — |
| — |
| — |
| — |
| 10,812 |
| 10,812 |
| — |
| — |
| — |
| — |
| 10,812 |
| 10,812 |
|
| Non-interest expense | (269,435 | ) | (221,739 | ) | (89,108 | ) | (580,282 | ) | (36,967 | ) | (617,249 | ) | (269,435 | ) | (221,273 | ) | (89,108 | ) | (579,816 | ) | (37,433 | ) | (617,249 | ) |
| Income before income taxes | $ | 98,100 |
| $ | 208,389 |
| $ | 50,878 |
| $ | 357,367 |
| $ | 23,668 |
| $ | 381,035 |
| $ | 98,100 |
| $ | 208,855 |
| $ | 50,878 |
| $ | 357,833 |
| $ | 23,202 |
| $ | 381,035 |
|
| 2012 vs 2011 | | |
| Increase (decrease) in income before income taxes: | | |
| Amount | | $ | (11,337 | ) | $ | 32,743 |
| $ | 5,757 |
| $ | 27,163 |
| $ | (9,590 | ) | $ | 17,573 |
|
| Percent | | (11.6 | )% | 15.7 | % | 11.3 | % | 7.6 | % | (41.3 | )% | 4.6 | % |
| Year ended December 31, 2010: | | |
| Net interest income | $ | 308,719 |
| $ | 264,870 |
| $ | 37,988 |
| $ | 611,577 |
| $ | 34,355 |
| $ | 645,932 |
| $ | 308,719 |
| $ | 264,870 |
| $ | 37,988 |
| $ | 611,577 |
| $ | 34,355 |
| $ | 645,932 |
|
| Provision for loan losses | (70,635 | ) | (24,823 | ) | (1,263 | ) | (96,721 | ) | (3,279 | ) | (100,000 | ) | (70,635 | ) | (24,823 | ) | (1,263 | ) | (96,721 | ) | (3,279 | ) | (100,000 | ) |
| Non-interest income | 157,904 |
| 154,306 |
| 93,745 |
| 405,955 |
| (844 | ) | 405,111 |
| 157,904 |
| 154,306 |
| 93,745 |
| 405,955 |
| (844 | ) | 405,111 |
|
| Investment securities losses, net | — |
| — |
| — |
| — |
| (1,785 | ) | (1,785 | ) | — |
| — |
| — |
| — |
| (1,785 | ) | (1,785 | ) |
| Non-interest expense | (291,028 | ) | (221,553 | ) | (86,158 | ) | (598,739 | ) | (32,395 | ) | (631,134 | ) | (291,028 | ) | (221,553 | ) | (86,158 | ) | (598,739 | ) | (32,395 | ) | (631,134 | ) |
| Income (loss) before income taxes | $ | 104,960 |
| $ | 172,800 |
| $ | 44,312 |
| $ | 322,072 |
| $ | (3,948 | ) | $ | 318,124 |
| $ | 104,960 |
| $ | 172,800 |
| $ | 44,312 |
| $ | 322,072 |
| $ | (3,948 | ) | $ | 318,124 |
|
| 2011 vs 2010 | | |
| Increase (decrease) in income before income taxes: | | |
| Amount | $ | (6,860 | ) | $ | 35,589 |
| $ | 6,566 |
| $ | 35,295 |
| $ | 27,616 |
| $ | 62,911 |
| $ | (6,860 | ) | $ | 36,055 |
| $ | 6,566 |
| $ | 35,761 |
| $ | 27,150 |
| $ | 62,911 |
|
| Percent | (6.5 | )% | 20.6 | % | 14.8 | % | 11.0 | % | N.M. |
| 19.8 | % | (6.5 | )% | 20.9 | % | 14.8 | % | 11.1 | % | N.M. |
| 19.8 | % |
| Year ended December 31, 2009: | | |
| Net interest income | $ | 329,720 |
| $ | 251,085 |
| $ | 34,575 |
| $ | 615,380 |
| $ | 20,122 |
| $ | 635,502 |
| |
| Provision for loan losses | (84,001 | ) | (54,247 | ) | (520 | ) | (138,768 | ) | (21,929 | ) | (160,697 | ) | |
| Non-interest income | 163,150 |
| 140,390 |
| 88,692 |
| 392,232 |
| 4,027 |
| 396,259 |
| |
| Investment securities losses, net | — |
| — |
| — |
| — |
| (7,195 | ) | (7,195 | ) | |
| Non-interest expense | (302,002 | ) | (213,829 | ) | (84,673 | ) | (600,504 | ) | (21,233 | ) | (621,737 | ) | |
| Income (loss) before income taxes | $ | 106,867 |
| $ | 123,399 |
| $ | 38,074 |
| $ | 268,340 |
| $ | (26,208 | ) | $ | 242,132 |
| |
| 2010 vs 2009 | | |
| Increase (decrease) in income before income taxes: | | |
| Amount | $ | (1,907 | ) | $ | 49,401 |
| $ | 6,238 |
| $ | 53,732 |
| $ | 22,260 |
| $ | 75,992 |
| |
| Percent | (1.8 | )% | 40.0 | % | 16.4 | % | 20.0 | % | N.M. |
| 31.4 | % | |
Consumer
The Consumer segment includes consumer deposits, consumer finance, and consumer debit and credit cards. Pre-tax profitability for 2012 was $86.8 million, a decrease of $11.3 million, or 11.6%, from 2011. This decrease was mainly due to a decline of $8.7 million, or 3.1%, in net interest income, coupled with a decline of $16.9 million, or 12.9%, in non-interest income. These income reductions were partly offset by a decrease of $11.8 million in the provision for loan losses and a $2.5 million decrease in non-interest expense. Net interest income declined due to a $7.9 million decrease in loan interest income and a $9.8 million decrease in net allocated funding credits assigned to the Consumer segment's loan and deposit portfolios, partly offset by a decline of $9.0 million in deposit interest expense. Non-interest income decreased mainly due to declines in bank card fee income (primarily debit card fees) and deposit account fees (mainly overdraft charges). Non-interest expense declined from the same period in the previous year due to lower FDIC insurance expense and corporate management fees, partly offset by higher salaries expense. The provision for loan losses totaled $35.5 million, an $11.8 million decrease from 2011, which was due mainly to lower losses on consumer credit card loans and marine and RV loans. Total average loans in this segment during 2012 decreased 3.0% compared to the prior year due to a decline in held for sale student loans, which the Company no longer originates, and a decline in personal real estate loans. Consumer loans grew, however, due to higher auto loan originations, partly offset by repayments of marine and RV loans. Average deposits increased 4.2% over the prior period, resulting mainly from growth in money market and interest checking deposit accounts, partly offset by a decline in certificates of deposit under $100,000.
Pre-tax profitability for 2011 was $98.1 million, a decrease of $6.9 million, or 6.5%, from 2010. This decrease was mainly due to a decline of $25.2 million, or 8.2%, in net interest income, coupled with a decline of $26.7 million in non-interest income. These decreases were partly offset by a reduction in the provision for loan losses of $23.4 million and a decline of $21.6 million in non-interest expense. Net interest income declined due to a $34.0 million decrease in loan interest income and a $7.7 million reduction in net allocated funding credits, assigned to the Consumer segment's loan and deposit portfolios, partly offset by a decline of $16.5 million in deposit interest expense. The decline in loan interest included a $10.6 million decrease in student loan interest, resulting from the Company's sale of most of the student loan portfolios in 2010, and an $8.3 million decrease in interest on marine and RV loans. Non-interest income decreased mainly due to lower gains on the sales of student loans, in addition to declines in deposit account fees (mainly overdraft charges)charges and bank card fee income (primarily debit card fees).fees. Non-interest expense declined 7.4% from the previous year due mainly to lower FDIC insurance expense, deposit account processing expense and teller services expense, partly offset by higher building rental expense. The provision for loan losses totaled $47.3 million, a $23.4 million decrease from 2010, which was mainly due to lower losses on consumer credit card loans, marine and RV loans, and other consumer loans. Total average loans decreased 23.6% in 2011 compared to the prior year due to the sale of most of the student loan portfolios in 2010 and a decline in consumer loans. Average deposits increased 2.1% over the prior period, resulting mainly from growth in money market and interest checking deposit accounts, partly offset by a decline in certificates of deposit.
Pre-tax profitability for 2010 was $105.0 million, a decrease of $1.9 million, or 1.8%, from 2009. This decrease was mainly due to a decline of $21.0 million in net interest income, due to a $30.6 million decrease in net allocated funding credits assigned to the loan and deposit portfolios and a $31.0 million decrease in loan interest income, partly offset by a decline of $40.6 million in deposit interest expense. Also, non-interest income decreased $5.2 million, or 3.2%, from the prior year due to lower deposit account fees (mainly overdraft charges). This decline was partly offset by an increase in bank card fee income (primarily debit card fees) and higher gains on sales of student loans. Non-interest expense declined by $11.0 million, or 3.6%, largely due to lower FDIC insurance expense, salaries expense, supplies expense, and deposit account processing expense. The provision for loan losses totaled $70.6 million in 2010 compared to $84.0 million in the prior year. The $13.4 million decline in the provision was due to lower losses on marine and RV loans, consumer credit card loans and other consumer loans. Total average loans decreased 11.7% in 2010 compared to the prior year due to declines in consumer loans and the sale of the student loan portfolios. Average deposits increased only slightly over the prior period.
Commercial
The Commercial segment provides corporate lending (including the Small Business Banking product line within the branch network), leasing, international services, and business, government deposit, and related commercial cash management services, as well as merchant and commercial bank card products. The segment includes the Capital Markets Group, which sells fixed-income securities to individuals, corporations, correspondent banks, public institutions, and municipalities, and also provides investment safekeeping and bond accounting services. Pre-tax income for 20112012 increased $35.6$32.7 million, or 20.6%15.7%, compared to the prior year, mainly due to a lower provision for loan losses and growth in net interest income and non-interest income. Net interest income increased $7.6 million, or 2.7%, due to higher net allocated funding credits of $15.8 million (related to higher average deposit balances), partly offset by a $10.1 million decline in loan interest income. The provision for loan losses in the segment totaled $2.8 million in 2012, a decrease of $13.4 million from 2011. During 2012, net recoveries of $2.7 million were recorded on business loans, compared to net charge-offs of $4.0 million in 2011. This decline in net charge-offs was partly due to recoveries of $3.6 million on two non-performing loans in 2012. In addition, net charge-offs on construction loans decreased $7.2 million. Non-interest income increased by $17.3 million, or 10.6.%, over the previous year due to growth in bank card fees (mainly corporate card), capital market fees and tax credit sales revenue. Non-interest expense increased $5.5 million, or 2.5%, over 2011, mainly due to higher salaries expense and bank card related expenses, partly offset by lower corporate management fees. Average segment loans increased 1.0% compared to 2011 as a result of a growth in business real estate, lease and tax-free loans, partly offset by a decline in construction loans. Average deposits increased 11.5% due to growth in non-interest bearing accounts, money market deposit accounts and interest checking accounts, partly offset by a decline in certificates of deposit over $100,000.
In 2011, pre-tax profitability for the Commercial segment increased $36.1 million, or 20.9%, compared to the prior year. Net interest income increased $18.9 million, or 7.1%, due to higher net allocated funding credits of $29.1 million, partly offset by an $11.4 million decline in loan interest income. The provision for loan losses in this segment totaled $16.2 million in 2011, a decrease of $8.6 million from 2010, due mainly to lower net charge-offs on construction loans of $8.1 million. Non-interest income increased by $8.2 million, or 5.3%, over the previous year due to growth in bankcorporate card fees, (mainly corporate card), partly offset by lower deposit account fees and bond trading income. Non-interest expense increaseddecreased slightly overfrom the previous year and included higher bank card related expenses and deposit account cash management expense, partly offset by declines in foreclosed real estate and other repossessed property expense and FDIC insurance expense, partly offset by higher bank card related expenses and deposit account cash management expense. Average segment loans decreased .7% compared to 2010 as a result of a decline in construction loans, partly offset by growth in business real estate loans. Average deposits increased 20.7% due to growth in non-interest bearing accounts, certificates of deposit over $100,000 and money market deposit accounts.
In 2010, pre-tax profitability for the Commercial segment increased $49.4 million, or 40.0%, compared to the prior year. Net interest income increased $13.8 million, or 5.5%, due to higher net allocated funding credits of $20.5 million and a decline in deposit interest expense of $10.3 million, which was partly offset by a $17.1 million decline in loan interest income. The loan loss provision in this segment totaled $24.8 million in 2010, a decrease of $29.4 million from the prior year. During 2010, lower charge-offs occurred on construction and business loans. Non-interest income increased $13.9 million, or 9.9%, over the previous year due to higher bank card fees (mainly corporate card). Non-interest expense increased $7.7 million, or 3.6%, over the prior year, mainly due to an increase in bank card fee expense and higher write-downs and holding costs on foreclosed real estate and personal property. These increases were partly offset by lower costs for FDIC insurance and teller services expense. Average segment loans decreased 8.8% compared to 2009 as a result of declines in business, construction and business real estate loans, while average deposits increased 6.0% due to growth in non-interest bearing and money market deposit accounts, partly offset by a decline in short-term certificates of deposit.
Wealth
The Wealth segment provides traditional trust and estate planning, advisory and discretionary investment management services, brokerage services, and includes Private Banking accounts. At December 31, 2011,2012, the Trust group managed investments with a market value of $14.9$17.0 billion and administered an additional $12.4$13.3 billion in non-managed assets. It also provides investment management services to The Commerce Funds, a series of mutual funds with $1.7$1.8 billion in total assets at December 31, 2011.2012. Wealth segment pre-tax profitability for 2012 was $56.6 million compared to $50.9 million in 2011, an increase of $5.8 million, or 11.3%. Net interest income increased $640 thousand, or 1.6%, and was impacted by a $1.8 million decline in deposit interest expense, partly offset by a $1.0 million decrease in net allocated funding credits. Non-interest income increased $6.6 million, or 6.5%, over the prior year due to higher personal and institutional trust fees. Non-interest expense increased $1.5 million, or 1.7%, mainly due to higher salary and benefit costs, partly offset by lower fraud losses and legal and professional fees. Average assets increased $62.9 million, or 9.2%, during 2012 mainly due to higher loan balances originated in this segment. Average deposits also increased $158.5 million, or 10.3%, during 2012 due to growth in money market deposit accounts and interest checking accounts.
In 2011, pre-tax income for the Wealth segment was $50.9 million compared to $44.3 million in 2010, an increase of $6.6 million, or 14.8%. Net interest income increased $874 thousand, or 2.3%, and was impacted by a $2.2 million increase in assigned net funding credits and a $1.4 million decline in deposit interest expense, offset by a $2.7 million decrease in loan interest income. Non-interest income increased $8.1 million, or 8.6%, over the prior year due to higher trust and brokerage fees. Non-interest expense increased $3.0 million, or 3.4%, mainly due to higher salary expense and fraud losses. Average assets decreased $1.5 million during 2011 mainly due to lower cash balances and overnight investments, partly offset by loan growth. Average deposits increased $203.1 million, or 15.3%, during 2011 due to growth in money market deposit accounts and long-term certificates of deposit.
In 2010, pre-tax income for the Wealth segment was $44.3 million compared to $38.1 million in 2009, an increase of $6.2 million, or 16.4%. Net interest income increased $3.4 million and was impacted by a $2.5 million decline in deposit interest expense and higher net allocated funding credits of $3.0 million, partly offset by a $2.1 million decrease in loan interest income. Non-interest income increased $5.1 million, or 5.7%, due mainly to higher trust fee income. Non-interest expense increased $1.5 million, or 1.8%, due to higher salaries expense and corporate management fees, partly offset by lower marketing expense. Average assets decreased $12.7 million during 2010 mainly due to a decline in loans. Average deposits increased $221.8 million, or 20.0%, during 2010 due to growth in interest checking and money market accounts, partly offset by lower short-term certificates of deposit.
The segment activity, as shown above, includes both direct and allocated items. Amounts in the “Other/Elimination” column include activity not related to the segments, such as certain administrative functions, the investment securities portfolio, and the effect of certain expense allocations to the segments. Also included in this category is the difference between the Company’s provision for loan losses and net loan charge-offs, which are generally assigned directly to the segments. In 2011,2012, the pre-tax income in this category was $23.7$13.6 million, compared to expense of $3.9$23.2 million in 2010.2011. This increasedecrease occurred partly because 2011 net charge-offs exceeded the loan loss provision by $12.7 million. In addition,due to a $5.7 million decline in net interest income in this category, related to the earnings of the investment portfolio and interest expense on borrowings not allocated to a segment, increased $5.5 million andsegment. In addition, unallocated investment securities gains increased $12.6declined $6.0 million, while unallocated non-interest expense was lower by $3.3 million. Non-interest expense in this category increased $4.6 million due to an unallocated debit overdraft litigation charge of $18.3 million in 2011, partly offset by an unallocated debt prepayment penalty of $11.8 million in 2010.
Impact of Recently Issued Accounting Standards
Fair Value Measurements In January 2010,May 2011, the Financial Accounting Standards Board (FASB) issued Accounting Standards Update (ASU) 2010-06, “Improving Disclosures about Fair Value Measurements”, which requires additional disclosures related to transfers among fair value hierarchy levels and the activity of Level 3 assets and liabilities. This ASU also provides clarification for the disaggregation of fair value measurements of assets and liabilities and the discussion of inputs and valuation techniques used for fair value measurements. The new disclosures and clarification were effective January 1, 2010, except for the disclosures related to the activity of Level 3 financial instruments. Those disclosures were effective January 1, 2011, and did not have a significant effect on the Company’s consolidated financial statements.
In May 2011, the FASB issued ASU 2011-04, “Amendments to Achieve Common Fair Value Measurement and Disclosure Requirements in U.S. GAAP and IFRSs”. The ASU contains guidance on the application of the highest and best use and valuation premise concepts, the measurement of fair values of instruments classified in shareholders’ equity, the measurement of fair values of financial instruments that are managed within a portfolio, and the application of premiums and discounts in a fair value measurement. It also requires additional disclosures about fair value measurements, including information about the unobservable inputs used in fair value measurements within Level 3 of the fair value hierarchy, the sensitivity of recurring fair value measurements within Level 3 to changes in unobservable inputs and the interrelationships between those inputs, and the categorization by level of the fair value hierarchy for items that are not measured at fair value but for which the fair value is required to be disclosed. These amendments are to bewere applied prospectively, effective January 1, 2012, and their application isdid not expected to have a significant effect on the Company’s consolidated financial statements.
Credit Quality of Financing Receivables and the Allowance for Credit Losses In July 2010, the FASB issued ASU 2010-20, “Disclosures about the Credit Quality of Financing Receivables and the Allowance for Credit Losses”. This guidance is intended to facilitate the evaluation of the nature of credit risk inherent in an entity’s loan portfolio, how that risk influences the allowance for credit losses, and the changes and reasons for those changes in the allowance. The ASU requires disclosures about the activity in the allowance, non-accrual and impaired loan status, credit quality indicators, past due information, loan modifications, and
significant loan purchases and sales. Much of the disclosure is required on a disaggregated level by portfolio segment or class basis. The required disclosures are included in Note 2 to the accompanying consolidated financial statements and did not have a significant effect on the financial statements.
Troubled Debt Restructurings In April 2011, the FASB issued ASU 2011-02, “A Creditor’s Determination of Whether a Restructuring Is a Troubled Debt Restructuring”. The ASU seeks to create consistency in the application of U.S. GAAP for identifying and evaluating debt restructurings. It clarifies existing guidance on a creditor’s evaluation of whether it has granted a concession and whether a debtor is experiencing financial difficulties for purposes of determining whether a restructuring constitutes a troubled debt restructuring. The ASU specifically addresses how the debtor’s access to funds at a market interest rate, increases in the contractual interest rate, and payment delays should be considered when determining whether a concession has been granted. The ASU was effective July 1, 2011 and required disclosure of modifications occurring since January 1, 2011 which were newly identified as troubled debt restructurings under the new guidance. Because the Company had generally applied the ASU’s guidance in identifying troubled debt restructurings in the past, no new troubled debt restructurings were identified as a result of the adoption of the ASU.
Repurchase Agreements In April 2011, the FASB issued ASU 2011-03, “Reconsideration of Effective Control for Repurchase Agreements”. The guidance in the ASU is intended to improve the accounting for repurchase agreements and other similar agreements. Specifically, the ASU modifies the criteria for determining when these transactions would be recorded as a financing arrangement as opposed to a purchase or sale arrangement with a commitment to resell or repurchase. It removes from the assessment of effective control the criterion relating to the transferor’s ability to repurchase or redeem financial assets on substantially the agreed terms, even in the event of default by the transferee. This new guidance iswas effective January 1, 2012, and early adoption is not permitted. The Company does not expect the adoption of this guidance todid not have a significant effect on the Company’s consolidated financial statements.
Other Comprehensive Income In June 2011, the FASB issued ASU 2011-05, “Presentation of Comprehensive Income”. The ASU increases the prominence of other comprehensive income in financial statements by requiring comprehensive income to be reported in either a single statement or in two consecutive statements which report both net income and other comprehensive income. It eliminates the option to report other comprehensive income and its components in the statement of changes in equity. The ASU iswas effective for periods beginning January 1, 2012 and requiresrequired retrospective application. The ASU doesdid not change the components of other comprehensive income, the timing of items reclassified to net income, or the net income basis for income per share calculations. The Company has chosen to present net income and other comprehensive income in two consecutive statements in the accompanying consolidated financial statements,
In December 2011,February 2013, the FASB issued ASU 2011-12, "Deferral2013-02, "Reporting of the Effective Date for Amendments to the Presentation of Reclassifications of ItemsAmounts Reclassified Out of Accumulated Other Comprehensive Income in Accounting Standards Update No. 2011-05"Income". The amendments are being made to allow the Board time to consider whetherrequire an entity to present, oneither in the face ofincome statement or in the financial statements the effects of reclassificationsnotes, significant amounts reclassified out of accumulated other comprehensive income onby the componentsrespective line items of net income, andbut only if the amount reclassified is required under U.S. GAAP to be reclassified to net income in its entirety in the same reporting period. For other comprehensive income for all periods presented. Until the Board has reached a resolution, entitiesamounts that are not required under U.S. GAAP to be reclassified in their entirety, an entity is required to report reclassifications outcross-reference to other disclosures that provide additional detail about those amounts. This ASU is effective for annual and interim periods beginning January 1, 2013. Adoption of accumulated other comprehensive income consistent with the presentation requirements inASU is not expected to have a significant effect before Update 2011-05.on the Company's consolidated financial statements.
Goodwill In September 2011, the FASB issued ASU 2011-08, "Testing Goodwill for Impairment". The ASU allows an entity to first assess qualitative factors to determine whether it is necessary to perform the two-step quantitative goodwill impairment test. Previous guidance required, on an annual basis, testing goodwill for impairment by comparing the fair value of a reporting unit to its carrying amount (including goodwill). As a result of this amendment, an entity will not be required to calculate the fair value of a reporting unit unless the entity determines that it is more likely than not that its fair value is less than its carrying amount. The ASU iswas effective for annual and interim goodwill impairment tests performed for periods beginning January 1, 2012, and early adoption is permitted.2012. The adoption of this guidance isdid not expected to have a significant effect on the Company’s consolidated financial statements.
Balance Sheet In December 2011, the FASB issued ASU 2011-11, "Disclosures about Offsetting Assets and Liabilities". The ASU is a joint requirement by the FASB and International Accounting Standards Board to enhance current disclosures and increase comparability of GAAP and International Financial Reporting Standards (IFRS) financial statements. Under the ASU, an entity will be required to disclose both gross and net information about instruments and transactions eligible for offset in the balance sheet, as well as instruments and transactions subject to an agreement similar to a master netting agreement. The scopeASU 2013-01, "Clarifying the Scope of theDisclosures about Offsetting Assets and Liabilities" was issued in January 2013, and amended ASU includes2011-11 to specifically include only derivatives saleaccounted for under Topic 815, repurchase and repurchase agreements, reverse sale and repurchase agreements, and securities borrowing and securities lending arrangements. The ASU istransactions that are either offset or subject to an enforceable master netting arrangement. Both ASUs are effective for annual and interim periods beginning January 1, 2013. Adoption of the ASUTheir adoption is not expected to have a significant effect on the Company's consolidated financial statements.
Corporate Governance
The Company has adopted a number of corporate governance measures. These include corporate governance guidelines, a code of ethics that applies to its senior financial officers and the charters for its audit committee, its committee on compensation and human resources, and its committee on governance/directors. This information is available on the Company’s Web site www.commercebank.com under Investor Relations.
Forward-Looking Statements
This report may contain “forward-looking statements” that are subject to risks and uncertainties and include information about possible or assumed future results of operations. Many possible events or factors could affect the future financial results and performance of the Company. This could cause results or performance to differ materially from those expressed in the forward-looking statements. Words such as “expects”, “anticipates”, “believes”, “estimates”, variations of such words and other similar expressions are intended to identify such forward-looking statements. These statements are not guarantees of future performance and involve certain risks, uncertainties and assumptions which are difficult to predict. Therefore, actual outcomes and results may differ materially from what is expressed or forecasted in, or implied by, such forward-looking statements. Readers should not rely solely on the forward-looking statements and should consider all uncertainties and risks discussed throughout this report. Forward-looking statements speak only as of the date they are made. The Company does not undertake to update forward-looking statements to reflect circumstances or events that occur after the date the forward-looking statements are made or to reflect the occurrence of unanticipated events. Such possible events or factors include the risk factors identified in Item 1a Risk Factors and the following: changes in economic conditions in the Company’s market area; changes in policies by regulatory agencies, governmental legislation and regulation; fluctuations in interest rates; changes in liquidity requirements; demand for loans in the Company’s market area; changes in accounting and tax principles; estimates made on income taxes; and competition with other entities that offer financial services.
AVERAGE BALANCE SHEETS — AVERAGE RATES AND YIELDS
| | | | Years Ended December 31 | Years Ended December 31 |
| | 2011 | | 2010 | | 2009 | 2012 | | 2011 | | 2010 |
| (Dollars in thousands) | Average Balance | Interest Income/Expense | Average Rates Earned/Paid | | Average Balance | Interest Income/Expense | Average Rates Earned/Paid | | Average Balance | Interest Income/Expense | Average Rates Earned/Paid | Average Balance | Interest Income/Expense | Average Rates Earned/Paid | | Average Balance | Interest Income/Expense | Average Rates Earned/Paid | | Average Balance | Interest Income/Expense | Average Rates Earned/Paid |
| ASSETS | | | | | | | | | | | | | | | | |
Loans:(A) | | | | | | | | | | | | | | | | |
Business(B) | $ | 2,910,668 |
| $ | 104,624 |
| 3.59 | % | | $ | 2,887,427 |
| $ | 110,792 |
| 3.84 | % | | $ | 3,119,778 |
| $ | 116,686 |
| 3.74 | % | $ | 2,962,699 |
| $ | 102,013 |
| 3.44 | % | | $ | 2,910,668 |
| $ | 104,624 |
| 3.59 | % | | $ | 2,887,427 |
| $ | 110,792 |
| 3.84 | % |
| Real estate – construction and land | 419,905 |
| 18,831 |
| 4.48 |
| | 557,282 |
| 22,384 |
| 4.02 |
| | 739,896 |
| 26,746 |
| 3.61 |
| 356,425 |
| 15,146 |
| 4.25 |
| | 419,905 |
| 18,831 |
| 4.48 |
| | 557,282 |
| 22,384 |
| 4.02 |
|
| Real estate – business | 2,117,031 |
| 101,988 |
| 4.82 |
| | 2,029,214 |
| 102,451 |
| 5.05 |
| | 2,143,675 |
| 108,107 |
| 5.04 |
| 2,193,271 |
| 98,693 |
| 4.50 |
| | 2,117,031 |
| 101,988 |
| 4.82 |
| | 2,029,214 |
| 102,451 |
| 5.05 |
|
| Real estate – personal | 1,433,869 |
| 69,048 |
| 4.82 |
| | 1,476,031 |
| 76,531 |
| 5.18 |
| | 1,585,273 |
| 87,085 |
| 5.49 |
| 1,503,357 |
| 65,642 |
| 4.37 |
| | 1,433,869 |
| 69,048 |
| 4.82 |
| | 1,476,031 |
| 76,531 |
| 5.18 |
|
| Consumer | 1,118,700 |
| 70,127 |
| 6.27 |
| | 1,250,076 |
| 84,204 |
| 6.74 |
| | 1,464,170 |
| 101,761 |
| 6.95 |
| 1,180,538 |
| 66,402 |
| 5.62 |
| | 1,118,700 |
| 70,127 |
| 6.27 |
| | 1,250,076 |
| 84,204 |
| 6.74 |
|
| Revolving home equity | 468,718 |
| 19,952 |
| 4.26 |
| | 484,878 |
| 20,916 |
| 4.31 |
| | 495,629 |
| 21,456 |
| 4.33 |
| 446,204 |
| 18,586 |
| 4.17 |
| | 468,718 |
| 19,952 |
| 4.26 |
| | 484,878 |
| 20,916 |
| 4.31 |
|
Student(C) | — |
| — |
| — |
| | 246,395 |
| 5,783 |
| 2.35 |
| | 344,243 |
| 9,440 |
| 2.74 |
| — |
| — |
| — |
| | — |
| — |
| — |
| | 246,395 |
| 5,783 |
| 2.35 |
|
| Consumer credit card | 746,724 |
| 84,479 |
| 11.31 |
| | 760,079 |
| 89,225 |
| 11.74 |
| | 727,422 |
| 89,045 |
| 12.24 |
| 730,697 |
| 85,652 |
| 11.72 |
| | 746,724 |
| 84,479 |
| 11.31 |
| | 760,079 |
| 89,225 |
| 11.74 |
|
| Overdrafts | 6,953 |
| — |
| — |
| | 7,288 |
| — |
| — |
| | 9,781 |
| — |
| — |
| 6,125 |
| — |
| — |
| | 6,953 |
| — |
| — |
| | 7,288 |
| — |
| — |
|
| Total loans | 9,222,568 |
| 469,049 |
| 5.09 |
| | 9,698,670 |
| 512,286 |
| 5.28 |
| | 10,629,867 |
| 560,326 |
| 5.27 |
| 9,379,316 |
| 452,134 |
| 4.82 |
| | 9,222,568 |
| 469,049 |
| 5.09 |
| | 9,698,670 |
| 512,286 |
| 5.28 |
|
| Loans held for sale | 47,227 |
| 1,115 |
| 2.36 |
| | 358,492 |
| 6,091 |
| 1.70 |
| | 397,583 |
| 8,219 |
| 2.07 |
| 9,688 |
| 361 |
| 3.73 |
| | 47,227 |
| 1,115 |
| 2.36 |
| | 358,492 |
| 6,091 |
| 1.70 |
|
| Investment securities: | | | | | | | | | |
| | |
| | | | | | |
| U.S. government & federal agency obligations | 357,861 |
| 17,268 |
| 4.83 |
| | 439,073 |
| 9,673 |
| 2.20 |
| | 169,214 |
| 6,754 |
| 3.99 |
| 332,382 |
| 12,260 |
| 3.69 |
| | 357,861 |
| 17,268 |
| 4.83 |
| | 439,073 |
| 9,673 |
| 2.20 |
|
| Government-sponsored enterprise obligations | 253,020 |
| 5,781 |
| 2.28 |
| | 203,593 |
| 4,591 |
| 2.25 |
| | 137,928 |
| 4,219 |
| 3.06 |
| 306,676 |
| 5,653 |
| 1.84 |
| | 253,020 |
| 5,781 |
| 2.28 |
| | 203,593 |
| 4,591 |
| 2.25 |
|
State & municipal obligations(B) | 1,174,751 |
| 51,988 |
| 4.43 |
| | 966,694 |
| 45,469 |
| 4.70 |
| | 873,607 |
| 43,882 |
| 5.02 |
| 1,376,872 |
| 54,056 |
| 3.93 |
| | 1,174,751 |
| 51,988 |
| 4.43 |
| | 966,694 |
| 45,469 |
| 4.70 |
|
| Mortgage-backed securities | 3,556,106 |
| 114,405 |
| 3.22 |
| | 2,821,485 |
| 113,222 |
| 4.01 |
| | 2,802,532 |
| 136,921 |
| 4.89 |
| 3,852,616 |
| 107,527 |
| 2.79 |
| | 3,556,106 |
| 114,405 |
| 3.22 |
| | 2,821,485 |
| 113,222 |
| 4.01 |
|
| Asset-backed securities | 2,443,901 |
| 30,523 |
| 1.25 |
| | 1,973,734 |
| 38,559 |
| 1.95 |
| | 937,435 |
| 30,166 |
| 3.22 |
| 2,925,249 |
| 31,940 |
| 1.09 |
| | 2,443,901 |
| 30,523 |
| 1.25 |
| | 1,973,734 |
| 38,559 |
| 1.95 |
|
Other marketable securities(B) | 171,409 |
| 8,455 |
| 4.93 |
| | 183,328 |
| 8,889 |
| 4.85 |
| | 179,847 |
| 9,793 |
| 5.45 |
| 139,499 |
| 6,556 |
| 4.70 |
| | 171,409 |
| 8,455 |
| 4.93 |
| | 183,328 |
| 8,889 |
| 4.85 |
|
Trading securities(B) | 20,011 |
| 552 |
| 2.76 |
| | 21,899 |
| 671 |
| 3.06 |
| | 16,927 |
| 506 |
| 2.99 |
| 25,107 |
| 637 |
| 2.54 |
| | 20,011 |
| 552 |
| 2.76 |
| | 21,899 |
| 671 |
| 3.06 |
|
Non-marketable securities(B) | 107,501 |
| 8,283 |
| 7.71 |
| | 113,326 |
| 7,216 |
| 6.37 |
| | 136,911 |
| 6,398 |
| 4.67 |
| 118,879 |
| 12,558 |
| 10.56 |
| | 107,501 |
| 8,283 |
| 7.71 |
| | 113,326 |
| 7,216 |
| 6.37 |
|
| Total investment securities | 8,084,560 |
| 237,255 |
| 2.93 |
| | 6,723,132 |
| 228,290 |
| 3.40 |
| | 5,254,401 |
| 238,639 |
| 4.54 |
| 9,077,280 |
| 231,187 |
| 2.55 |
| | 8,084,560 |
| 237,255 |
| 2.93 |
| | 6,723,132 |
| 228,290 |
| 3.40 |
|
| Short-term federal funds sold and securities purchased under agreements to resell | 10,690 |
| 55 |
| .51 |
| | 6,542 |
| 48 |
| .73 |
| | 43,811 |
| 222 |
| .51 |
| 16,393 |
| 82 |
| .50 |
| | 10,690 |
| 55 |
| .51 |
| | 6,542 |
| 48 |
| .73 |
|
| Long-term securities purchased under agreements to resell | 768,904 |
| 13,455 |
| 1.75 |
| | 150,235 |
| 2,549 |
| 1.70 |
| | — |
| — |
| — |
| 892,624 |
| 19,174 |
| 2.15 |
| | 768,904 |
| 13,455 |
| 1.75 |
| | 150,235 |
| 2,549 |
| 1.70 |
|
| Interest earning deposits with banks | 194,176 |
| 487 |
| .25 |
| | 171,883 |
| 427 |
| .25 |
| | 325,744 |
| 807 |
| .25 |
| 135,319 |
| 339 |
| .25 |
| | 194,176 |
| 487 |
| .25 |
| | 171,883 |
| 427 |
| .25 |
|
| Total interest earning assets | 18,328,125 |
| 721,416 |
| 3.94 |
| | 17,108,954 |
| 749,691 |
| 4.38 |
| | 16,651,406 |
| 808,213 |
| 4.85 |
| 19,510,620 |
| 703,277 |
| 3.60 |
| | 18,328,125 |
| 721,416 |
| 3.94 |
| | 17,108,954 |
| 749,691 |
| 4.38 |
|
| Allowance for loan losses | (191,311 | ) | | | | (195,870 | ) | | | | (181,417 | ) | | | (178,934 | ) | | | | (191,311 | ) | | | | (195,870 | ) | | |
| Unrealized gain (loss) on investment securities | 162,984 |
| | | | 149,106 |
| | | | 24,105 |
| | | |
| Unrealized gain on investment securities | | 257,511 |
| | | | 162,984 |
| | | | 149,106 |
| | |
| Cash and due from banks | 348,875 |
| | | | 368,340 |
| | | | 364,579 |
| | | 369,020 |
| | | | 348,875 |
| | | | 368,340 |
| | |
| Land, buildings and equipment - net | 377,200 |
| | | | 395,108 |
| | | | 411,366 |
| | | 357,336 |
| | | | 377,200 |
| | | | 395,108 |
| | |
| Other assets | 378,642 |
| | | | 410,361 |
| | | | 349,164 |
| | | 385,125 |
| | | | 378,642 |
| | | | 410,361 |
| | |
| Total assets | $ | 19,404,515 |
| | | | $ | 18,235,999 |
| | | | $ | 17,619,203 |
| | | $ | 20,700,678 |
| | | | $ | 19,404,515 |
| | | | $ | 18,235,999 |
| | |
| LIABILITIES AND EQUITY | | | | | | | | | | | | | | | | | | | | | | |
| Interest bearing deposits: | | | | | | | | | | | | | | | | |
| Savings | $ | 525,371 |
| 852 |
| .16 |
| | $ | 478,592 |
| 622 |
| .13 |
| | $ | 438,748 |
| 642 |
| .15 |
| $ | 574,336 |
| 802 |
| .14 |
| | $ | 525,371 |
| 852 |
| .16 |
| | $ | 478,592 |
| 622 |
| .13 |
|
| Interest checking and money market | 7,702,901 |
| 25,004 |
| .32 |
| | 6,785,299 |
| 28,676 |
| .42 |
| | 5,807,753 |
| 30,789 |
| .53 |
| 8,430,559 |
| 17,880 |
| .21 |
| | 7,702,901 |
| 25,004 |
| .32 |
| | 6,785,299 |
| 28,676 |
| .42 |
|
| Time open & C.D.’s of less than $100,000 | 1,291,165 |
| 11,352 |
| .88 |
| | 1,660,462 |
| 22,871 |
| 1.38 |
| | 2,055,952 |
| 51,982 |
| 2.53 |
| 1,117,236 |
| 7,918 |
| .71 |
| | 1,291,165 |
| 11,352 |
| .88 |
| | 1,660,462 |
| 22,871 |
| 1.38 |
|
| Time open & C.D.’s of $100,000 and over | 1,409,740 |
| 9,272 |
| .66 |
| | 1,323,952 |
| 13,847 |
| 1.05 |
| | 1,858,543 |
| 35,371 |
| 1.90 |
| 1,181,426 |
| 7,174 |
| .61 |
| | 1,409,740 |
| 9,272 |
| .66 |
| | 1,323,952 |
| 13,847 |
| 1.05 |
|
| Total interest bearing deposits | 10,929,177 |
| 46,480 |
| .43 |
| | 10,248,305 |
| 66,016 |
| .64 |
| | 10,160,996 |
| 118,784 |
| 1.17 |
| 11,303,557 |
| 33,774 |
| .30 |
| | 10,929,177 |
| 46,480 |
| .43 |
| | 10,248,305 |
| 66,016 |
| .64 |
|
| Borrowings: | | | | | | | | | | | | | | | | |
| Federal funds purchased and securities sold under agreements to repurchase | 1,035,007 |
| 1,741 |
| .17 |
| | 1,085,121 |
| 2,584 |
| .24 |
| | 968,643 |
| 3,699 |
| .38 |
| 1,185,978 |
| 808 |
| .07 |
| | 1,035,007 |
| 1,741 |
| .17 |
| | 1,085,121 |
| 2,584 |
| .24 |
|
Other borrowings(D) | 112,107 |
| 3,680 |
| 3.28 |
| | 452,810 |
| 14,948 |
| 3.30 |
| | 920,467 |
| 31,527 |
| 3.43 |
| 108,916 |
| 3,481 |
| 3.20 |
| | 112,107 |
| 3,680 |
| 3.28 |
| | 452,810 |
| 14,948 |
| 3.30 |
|
| Total borrowings | 1,147,114 |
| 5,421 |
| .47 |
| | 1,537,931 |
| 17,532 |
| 1.14 |
| | 1,889,110 |
| 35,226 |
| 1.86 |
| 1,294,894 |
| 4,289 |
| .33 |
| | 1,147,114 |
| 5,421 |
| .47 |
| | 1,537,931 |
| 17,532 |
| 1.14 |
|
| Total interest bearing liabilities | 12,076,291 |
| 51,901 |
| .43 | % | | 11,786,236 |
| 83,548 |
| .71 | % | | 12,050,106 |
| 154,010 |
| 1.28 | % | 12,598,451 |
| 38,063 |
| .30 | % | | 12,076,291 |
| 51,901 |
| .43 | % | | 11,786,236 |
| 83,548 |
| .71 | % |
| Non-interest bearing deposits | 4,742,033 |
| | | | 4,114,664 |
| | | | 3,660,166 |
| | | 5,522,991 |
| | | | 4,742,033 |
| | | | 4,114,664 |
| | |
| Other liabilities | 476,249 |
| | | | 346,312 |
| | | | 176,676 |
| | | 334,684 |
| | | | 476,249 |
| | | | 346,312 |
| | |
| Equity | 2,109,942 |
| | | | 1,988,787 |
| | | | 1,732,255 |
| | | 2,244,552 |
| | | | 2,109,942 |
| | | | 1,988,787 |
| | |
| Total liabilities and equity | $ | 19,404,515 |
|
|
| | | $ | 18,235,999 |
| | | | $ | 17,619,203 |
| | | $ | 20,700,678 |
|
|
| | | $ | 19,404,515 |
| | | | $ | 18,235,999 |
| | |
| Net interest margin (T/E) | | $ | 669,515 |
| | | | $ | 666,143 |
| | | | $ | 654,203 |
| | | $ | 665,214 |
| | | | $ | 669,515 |
| | | | $ | 666,143 |
| |
| Net yield on interest earning assets | | 3.65 | % | | | 3.89 | % | | | 3.93 | % | | 3.41 | % | | | 3.65 | % | | | 3.89 | % |
| Percentage increase in net interest margin (T/E) compared to the prior year | | .51 | % | | | 1.83 | % | | | 7.48 | % | |
| Percentage increase (decrease) in net interest margin (T/E) compared to the prior year | | | (.64 | )% | | | .51 | % | | | 1.83 | % |
| |
| (A) | Loans on non-accrual status are included in the computation of average balances. Included in interest income above are loan fees and late charges, net of amortization of deferred loan origination fees and costs, which are immaterial. Credit card income from merchant discounts and net interchange fees are not included in loan income. |
| |
| (B) | Interest income and yields are presented on a fully-taxable equivalent basis using the Federal statutory income tax rate. Loan interest income includes tax free loan income (categorized as business loan income) which includes tax equivalent adjustments of $5,803,000 in 2012, $5,538,000 in 2011, $4,620,000 in 2010, $3,922,000 in 2009, $3,553,000 in 2008 and $2,895,000 in 2007, and $1,826,000 in 2006.2007. Investment securities interest income include tax equivalent adjustments of $19,505,000 in 2012, $17,907,000 in 2011, $15,593,000 in 2010, $14,779,000 in 2009, |
AVERAGE BALANCE SHEETS — AVERAGE RATES AND YIELDS
|
| | | | | | | | | | | | | | | | | | | | | | | | | | | | |
| Years Ended December 31 |
| 2008 | | 2007 | | 2006 | | |
| Average Balance | Interest Income/Expense | Average Rates Earned/Paid | | Average Balance | Interest Income/Expense | Average Rates Earned/Paid | | Average Balance | Interest Income/Expense | Average Rates Earned/Paid | | Average Balance Five Year Compound Growth Rate |
| | | | | | | | | | | | | |
| | | | | | | | | | | | | |
| $ | 3,478,927 |
| $ | 170,620 |
| 4.90 | % | | $ | 3,110,386 |
| $ | 209,523 |
| 6.74 | % | | $ | 2,688,722 |
| $ | 177,543 |
| 6.60 | % | | 1.60 | % |
| 701,519 |
| 34,445 |
| 4.91 |
| | 671,986 |
| 49,436 |
| 7.36 |
| | 540,574 |
| 40,477 |
| 7.49 |
| | (4.93 | ) |
| 2,281,664 |
| 136,955 |
| 6.00 |
| | 2,204,041 |
| 154,819 |
| 7.02 |
| | 2,053,455 |
| 140,659 |
| 6.85 |
| | .61 |
|
| 1,522,172 |
| 88,322 |
| 5.80 |
| | 1,521,066 |
| 90,537 |
| 5.95 |
| | 1,415,321 |
| 79,816 |
| 5.64 |
| | .26 |
|
| 1,674,497 |
| 119,837 |
| 7.16 |
| | 1,558,302 |
| 115,184 |
| 7.39 |
| | 1,352,047 |
| 95,074 |
| 7.03 |
| | (3.72 | ) |
| 474,635 |
| 23,960 |
| 5.05 |
| | 443,748 |
| 33,526 |
| 7.56 |
| | 445,376 |
| 33,849 |
| 7.60 |
| | 1.03 |
|
| 13,708 |
| 287 |
| 2.10 |
| | — |
| — |
| — |
| | — |
| — |
| — |
| | NM |
|
| 776,810 |
| 83,972 |
| 10.81 |
| | 665,964 |
| 84,856 |
| 12.74 |
| | 595,252 |
| 77,737 |
| 13.06 |
| | 4.64 |
|
| 11,926 |
| — |
| — |
| | 13,823 |
| — |
| — |
| | 14,685 |
| — |
| — |
| | (13.89 | ) |
| 10,935,858 |
| 658,398 |
| 6.02 |
| | 10,189,316 |
| 737,881 |
| 7.24 |
| | 9,105,432 |
| 645,155 |
| 7.09 |
| | .26 |
|
| 347,441 |
| 14,968 |
| 4.31 |
| | 321,916 |
| 21,940 |
| 6.82 |
| | 315,950 |
| 21,788 |
| 6.90 |
| | (31.62 | ) |
| | | | | | | | | | | | | |
| 7,065 |
| 364 |
| 5.15 |
| | 9,063 |
| 506 |
| 5.58 |
| | 49,735 |
| 2,160 |
| 4.34 |
| | 48.39 |
|
| 176,018 |
| 7,075 |
| 4.02 |
| | 401,107 |
| 15,999 |
| 3.99 |
| | 590,504 |
| 20,657 |
| 3.50 |
| | (15.59 | ) |
| 695,542 |
| 37,770 |
| 5.43 |
| | 594,154 |
| 33,416 |
| 5.62 |
| | 414,282 |
| 22,499 |
| 5.43 |
| | 23.18 |
|
| 2,203,921 |
| 112,184 |
| 5.09 |
| | 1,828,478 |
| 88,909 |
| 4.86 |
| | 1,647,875 |
| 73,571 |
| 4.46 |
| | 16.63 |
|
| 265,546 |
| 13,185 |
| 4.97 |
| | 292,043 |
| 13,334 |
| 4.57 |
| | 553,810 |
| 22,699 |
| 4.10 |
| | 34.57 |
|
| 98,650 |
| 4,243 |
| 4.30 |
| | 129,622 |
| 7,355 |
| 5.67 |
| | 200,013 |
| 10,695 |
| 5.35 |
| | (3.04 | ) |
| 28,840 |
| 1,355 |
| 4.70 |
| | 22,321 |
| 1,144 |
| 5.13 |
| | 17,444 |
| 884 |
| 5.07 |
| | 2.78 |
|
| 133,996 |
| 7,730 |
| 5.77 |
| | 92,251 |
| 5,710 |
| 6.19 |
| | 85,211 |
| 7,863 |
| 9.23 |
| | 4.76 |
|
| 3,609,578 |
| 183,906 |
| 5.09 |
| | 3,369,039 |
| 166,373 |
| 4.94 |
| | 3,558,874 |
| 161,028 |
| 4.52 |
| | 17.83 |
|
| 425,273 |
| 8,287 |
| 1.95 |
| | 527,304 |
| 25,881 |
| 4.91 |
| | 299,554 |
| 15,637 |
| 5.22 |
| | (48.65 | ) |
| — |
| — |
| — |
| | — |
| — |
| — |
| | — |
| — |
| — |
| | NM |
|
| 46,670 |
| 198 |
| .42 |
| | — |
| — |
| — |
| | — |
| — |
| — |
| | NM |
|
| 15,364,820 |
| 865,757 |
| 5.63 |
| | 14,407,575 |
| 952,075 |
| 6.61 |
| | 13,279,810 |
| 843,608 |
| 6.35 |
| | 6.66 |
|
| (145,176 | ) | | | | (132,234 | ) | | | | (129,224 | ) | | | | 8.16 |
|
| 27,068 |
| | | | 25,333 |
| | | | (9,443 | ) | | | | NM |
|
| 451,105 |
| | | | 463,970 |
| | | | 470,826 |
| | | | (5.82 | ) |
| 412,852 |
| | | | 400,161 |
| | | | 376,375 |
| | | | .04 |
|
| 343,664 |
| | | | 315,522 |
| | | | 250,260 |
| | | | 8.63 |
|
| $ | 16,454,333 |
| | | | $ | 15,480,327 |
| | | | $ | 14,238,604 |
| | | | 6.39 |
|
| | | | | | | | | | | | | |
| | | | | | | | | | | | | |
| $ | 400,948 |
| 1,186 |
| .30 |
| | $ | 392,942 |
| 2,067 |
| .53 |
| | $ | 393,870 |
| 2,204 |
| .56 |
| | 5.93 |
|
| 5,123,709 |
| 59,947 |
| 1.17 |
| | 4,793,849 |
| 114,027 |
| 2.38 |
| | 4,519,463 |
| 94,238 |
| 2.09 |
| | 11.25 |
|
| 2,149,119 |
| 77,322 |
| 3.60 |
| | 2,359,386 |
| 110,957 |
| 4.70 |
| | 2,077,257 |
| 85,424 |
| 4.11 |
| | (9.07 | ) |
| 1,629,500 |
| 55,665 |
| 3.42 |
| | 1,480,856 |
| 73,739 |
| 4.98 |
| | 1,288,845 |
| 58,381 |
| 4.53 |
| | 1.81 |
|
| 9,303,276 |
| 194,120 |
| 2.09 |
| | 9,027,033 |
| 300,790 |
| 3.33 |
| | 8,279,435 |
| 240,247 |
| 2.90 |
| | 5.71 |
|
| | | | | | | | | | | | | |
| 1,373,625 |
| 25,085 |
| 1.83 |
| | 1,696,613 |
| 83,464 |
| 4.92 |
| | 1,455,544 |
| 70,154 |
| 4.82 |
| | (6.59 | ) |
| 1,092,746 |
| 37,905 |
| 3.47 |
| | 292,446 |
| 13,775 |
| 4.71 |
| | 182,940 |
| 8,744 |
| 4.78 |
| | (9.33 | ) |
| 2,466,371 |
| 62,990 |
| 2.55 |
| | 1,989,059 |
| 97,239 |
| 4.89 |
| | 1,638,484 |
| 78,898 |
| 4.82 |
| | (6.88 | ) |
| 11,769,647 |
| 257,110 |
| 2.18 | % | | 11,016,092 |
| 398,029 |
| 3.61 | % | | 9,917,919 |
| 319,145 |
| 3.22 | % | | 4.02 |
|
| 2,946,534 |
| | | | 2,850,982 |
| | | | 2,840,362 |
| | | | 10.79 |
|
| 140,333 |
| | | | 134,278 |
| | | | 99,396 |
| | | | 36.80 |
|
| 1,597,819 |
| | | | 1,478,975 |
| | | | 1,380,927 |
| | | | 8.85 |
|
| $ | 16,454,333 |
| | | | $ | 15,480,327 |
| | | | $ | 14,238,604 |
| | | | 6.39 | % |
| | $ | 608,647 |
| | | | $ | 554,046 |
| | | | $ | 524,463 |
| | | |
| | | 3.96 | % | | | | 3.85 | % | | | | 3.95 | % | | |
| | | 9.85 | % | | | | 5.64 | % | | | | 3.60 | % | | |
|
| | | | | | | | | | | | | | | | | | | | | | | | | | | | |
| Years Ended December 31 |
| 2009 | | 2008 | | 2007 | | |
| Average Balance | Interest Income/Expense | Average Rates Earned/Paid | | Average Balance | Interest Income/Expense | Average Rates Earned/Paid | | Average Balance | Interest Income/Expense | Average Rates Earned/Paid | | Average Balance Five Year Compound Growth Rate |
| | | | | | | | | | | | | |
| | | | | | | | | | | | | |
| $ | 3,119,778 |
| $ | 116,686 |
| 3.74 | % | | $ | 3,478,927 |
| $ | 170,620 |
| 4.90 | % | | $ | 3,110,386 |
| $ | 209,523 |
| 6.74 | % | | (.97 | )% |
| 739,896 |
| 26,746 |
| 3.61 |
| | 701,519 |
| 34,445 |
| 4.91 |
| | 671,986 |
| 49,436 |
| 7.36 |
| | (11.91 | ) |
| 2,143,675 |
| 108,107 |
| 5.04 |
| | 2,281,664 |
| 136,955 |
| 6.00 |
| | 2,204,041 |
| 154,819 |
| 7.02 |
| | (.10 | ) |
| 1,585,273 |
| 87,085 |
| 5.49 |
| | 1,522,172 |
| 88,322 |
| 5.80 |
| | 1,521,066 |
| 90,537 |
| 5.95 |
| | (.23 | ) |
| 1,464,170 |
| 101,761 |
| 6.95 |
| | 1,674,497 |
| 119,837 |
| 7.16 |
| | 1,558,302 |
| 115,184 |
| 7.39 |
| | (5.40 | ) |
| 495,629 |
| 21,456 |
| 4.33 |
| | 474,635 |
| 23,960 |
| 5.05 |
| | 443,748 |
| 33,526 |
| 7.56 |
| | .11 |
|
| 344,243 |
| 9,440 |
| 2.74 |
| | 13,708 |
| 287 |
| 2.10 |
| | — |
| — |
| — |
| | NM |
|
| 727,422 |
| 89,045 |
| 12.24 |
| | 776,810 |
| 83,972 |
| 10.81 |
| | 665,964 |
| 84,856 |
| 12.74 |
| | 1.87 |
|
| 9,781 |
| — |
| — |
| | 11,926 |
| — |
| — |
| | 13,823 |
| — |
| — |
| | (15.02 | ) |
| 10,629,867 |
| 560,326 |
| 5.27 |
| | 10,935,858 |
| 658,398 |
| 6.02 |
| | 10,189,316 |
| 737,881 |
| 7.24 |
| | (1.64 | ) |
| 397,583 |
| 8,219 |
| 2.07 |
| | 347,441 |
| 14,968 |
| 4.31 |
| | 321,916 |
| 21,940 |
| 6.82 |
| | (50.38 | ) |
| | | | | | | | | | | | | |
| 169,214 |
| 6,754 |
| 3.99 |
| | 7,065 |
| 364 |
| 5.15 |
| | 9,063 |
| 506 |
| 5.58 |
| | 105.53 |
|
| 137,928 |
| 4,219 |
| 3.06 |
| | 176,018 |
| 7,075 |
| 4.02 |
| | 401,107 |
| 15,999 |
| 3.99 |
| | (5.23 | ) |
| 873,607 |
| 43,882 |
| 5.02 |
| | 695,542 |
| 37,770 |
| 5.43 |
| | 594,154 |
| 33,416 |
| 5.62 |
| | 18.30 |
|
| 2,802,532 |
| 136,921 |
| 4.89 |
| | 2,203,921 |
| 112,184 |
| 5.09 |
| | 1,828,478 |
| 88,909 |
| 4.86 |
| | 16.07 |
|
| 937,435 |
| 30,166 |
| 3.22 |
| | 265,546 |
| 13,185 |
| 4.97 |
| | 292,043 |
| 13,334 |
| 4.57 |
| | 58.54 |
|
| 179,847 |
| 9,793 |
| 5.45 |
| | 98,650 |
| 4,243 |
| 4.30 |
| | 129,622 |
| 7,355 |
| 5.67 |
| | 1.48 |
|
| 16,927 |
| 506 |
| 2.99 |
| | 28,840 |
| 1,355 |
| 4.70 |
| | 22,321 |
| 1,144 |
| 5.13 |
| | 2.38 |
|
| 136,911 |
| 6,398 |
| 4.67 |
| | 133,996 |
| 7,730 |
| 5.77 |
| | 92,251 |
| 5,710 |
| 6.19 |
| | 5.20 |
|
| 5,254,401 |
| 238,639 |
| 4.54 |
| | 3,609,578 |
| 183,906 |
| 5.09 |
| | 3,369,039 |
| 166,373 |
| 4.94 |
| | 21.92 |
|
| 43,811 |
| 222 |
| .51 |
| | 425,273 |
| 8,287 |
| 1.95 |
| | 527,304 |
| 25,881 |
| 4.91 |
| | (50.05 | ) |
| — |
| — |
| — |
| | — |
| — |
| — |
| | — |
| — |
| — |
| | NM |
|
| 325,744 |
| 807 |
| .25 |
| | 46,670 |
| 198 |
| .42 |
| | — |
| — |
| — |
| | NM |
|
| 16,651,406 |
| 808,213 |
| 4.85 |
| | 15,364,820 |
| 865,757 |
| 5.63 |
| | 14,407,575 |
| 952,075 |
| 6.61 |
| | 6.25 |
|
| (181,417 | ) | | | | (145,176 | ) | | | | (132,234 | ) | | | | 6.24 |
|
| 24,105 |
| | | | 27,068 |
| | | | 25,333 |
| | | | 59.01 |
|
| 364,579 |
| | | | 451,105 |
| | | | 463,970 |
| | | | (4.48 | ) |
| 411,366 |
| | | | 412,852 |
| | | | 400,161 |
| | | | (2.24 | ) |
| 349,164 |
| | | | 343,664 |
| | | | 315,522 |
| | | | 4.07 |
|
| $ | 17,619,203 |
| | | | $ | 16,454,333 |
| | | | $ | 15,480,327 |
| | | | 5.98 |
|
| | | | | | | | | | | | | |
| | | | | | | | | | | | | |
| $ | 438,748 |
| 642 |
| .15 |
| | $ | 400,948 |
| 1,186 |
| .30 |
| | $ | 392,942 |
| 2,067 |
| .53 |
| | 7.89 |
|
| 5,807,753 |
| 30,789 |
| .53 |
| | 5,123,709 |
| 59,947 |
| 1.17 |
| | 4,793,849 |
| 114,027 |
| 2.38 |
| | 11.95 |
|
| 2,055,952 |
| 51,982 |
| 2.53 |
| | 2,149,119 |
| 77,322 |
| 3.60 |
| | 2,359,386 |
| 110,957 |
| 4.70 |
| | (13.89 | ) |
| 1,858,543 |
| 35,371 |
| 1.90 |
| | 1,629,500 |
| 55,665 |
| 3.42 |
| | 1,480,856 |
| 73,739 |
| 4.98 |
| | (4.42 | ) |
| 10,160,996 |
| 118,784 |
| 1.17 |
| | 9,303,276 |
| 194,120 |
| 2.09 |
| | 9,027,033 |
| 300,790 |
| 3.33 |
| | 4.60 |
|
| | | | | | | | | | | | | |
| 968,643 |
| 3,699 |
| .38 |
| | 1,373,625 |
| 25,085 |
| 1.83 |
| | 1,696,613 |
| 83,464 |
| 4.92 |
| | (6.91 | ) |
| 920,467 |
| 31,527 |
| 3.43 |
| | 1,092,746 |
| 37,905 |
| 3.47 |
| | 292,446 |
| 13,775 |
| 4.71 |
| | (17.93 | ) |
| 1,889,110 |
| 35,226 |
| 1.86 |
| | 2,466,371 |
| 62,990 |
| 2.55 |
| | 1,989,059 |
| 97,239 |
| 4.89 |
| | (8.23 | ) |
| 12,050,106 |
| 154,010 |
| 1.28 | % | | 11,769,647 |
| 257,110 |
| 2.18 | % | | 11,016,092 |
| 398,029 |
| 3.61 | % | | 2.72 |
|
| 3,660,166 |
| | | | 2,946,534 |
| | | | 2,850,982 |
| | | | 14.14 |
|
| 176,676 |
| | | | 140,333 |
| | | | 134,278 |
| | | | 20.04 |
|
| 1,732,255 |
| | | | 1,597,819 |
| | | | 1,478,975 |
| | | | 8.70 |
|
| $ | 17,619,203 |
| | | | $ | 16,454,333 |
| | | | $ | 15,480,327 |
| | | | 5.98 | % |
| | $ | 654,203 |
| | | | $ | 608,647 |
| | | | $ | 554,046 |
| | | |
| | | 3.93 | % | | | | 3.96 | % | | | | 3.85 | % | | |
| | | 7.48 | % | | | | 9.85 | % | | | | 5.64 | % | | |
$12,355,000 in 2008 and $13,079,000 in 2007 and $9,476,000 in 2006.2007. These adjustments relate to state and municipal obligations, other marketable securities, trading securities, and non-marketable securities.
| |
| (C) | In December 2008, the Company purchased $358,451,000 of student loans with the intent to hold to maturity. In October 2010, the seller elected to repurchase the loans under the terms of the original agreement. |
| |
(D) | Interest expense of $2,000 and $38,000, which was capitalized on construction projects in 2010 and 2006, respectively, is not deducted from the interest expense shown above. |
QUARTERLY AVERAGE BALANCE SHEETS — AVERAGE RATES AND YIELDS
| | | | Year ended December 31, 2011 | Year ended December 31, 2012 |
| | Fourth Quarter | | Third Quarter | | Second Quarter | | First Quarter | Fourth Quarter | | Third Quarter | | Second Quarter | | First Quarter |
| (Dollars in millions) | Average Balance | Average Rates Earned/Paid | | Average Balance | Average Rates Earned/Paid | | Average Balance | Average Rates Earned/Paid | | Average Balance | Average Rates Earned/Paid | Average Balance | Average Rates Earned/Paid | | Average Balance | Average Rates Earned/Paid | | Average Balance | Average Rates Earned/Paid | | Average Balance | Average Rates Earned/Paid |
| ASSETS | | | | | | | | | | | | | | | | | | | | | | |
| Loans: | | | | | | | | | | | | | | | | | | | | | | |
Business(A) | $ | 2,819 |
| 3.53 | % | | $ | 2,815 |
| 3.56 | % | | $ | 2,959 |
| 3.64 | % | | $ | 3,053 |
| 3.65 | % | $ | 3,042 |
| 3.29 | % | | $ | 3,019 |
| 3.39 | % | | $ | 2,895 |
| 3.58 | % | | $ | 2,894 |
| 3.52 | % |
| Real estate – construction and land | 387 |
| 4.52 |
| | 412 |
| 4.42 |
| | 430 |
| 4.51 |
| | 452 |
| 4.49 |
| 346 |
| 4.11 |
| | 340 |
| 4.30 |
| | 360 |
| 4.24 |
| | 380 |
| 4.34 |
|
| Real estate – business | 2,162 |
| 4.67 |
| | 2,123 |
| 4.74 |
| | 2,101 |
| 4.94 |
| | 2,081 |
| 4.92 |
| 2,200 |
| 4.33 |
| | 2,183 |
| 4.39 |
| | 2,206 |
| 4.71 |
| | 2,185 |
| 4.57 |
|
| Real estate – personal | 1,421 |
| 4.64 |
| | 1,430 |
| 4.75 |
| | 1,441 |
| 4.87 |
| | 1,444 |
| 5.00 |
| 1,572 |
| 4.15 |
| | 1,523 |
| 4.31 |
| | 1,476 |
| 4.46 |
| | 1,441 |
| 4.58 |
|
| Consumer | 1,111 |
| 6.08 |
| | 1,105 |
| 6.20 |
| | 1,112 |
| 6.32 |
| | 1,147 |
| 6.47 |
| 1,273 |
| 5.35 |
| | 1,205 |
| 5.54 |
| | 1,135 |
| 5.73 |
| | 1,108 |
| 5.93 |
|
| Revolving home equity | 465 |
| 4.24 |
| | 467 |
| 4.27 |
| | 468 |
| 4.24 |
| | 475 |
| 4.28 |
| 436 |
| 4.13 |
| | 444 |
| 4.17 |
| | 449 |
| 4.17 |
| | 455 |
| 4.18 |
|
| Consumer credit card | 734 |
| 11.62 |
| | 735 |
| 11.59 |
| | 743 |
| 11.13 |
| | 775 |
| 10.92 |
| 749 |
| 11.42 |
| | 730 |
| 11.83 |
| | 713 |
| 11.87 |
| | 731 |
| 11.78 |
|
| Overdrafts | 7 |
| — |
| | 7 |
| — |
| | 7 |
| — |
| | 7 |
| — |
| 6 |
| — |
| | 5 |
| — |
| | 6 |
| — |
| | 8 |
| — |
|
| Total loans | 9,106 |
| 5.01 |
| | 9,094 |
| 5.07 |
| | 9,261 |
| 5.12 |
| | 9,434 |
| 5.15 |
| 9,624 |
| 4.64 |
| | 9,449 |
| 4.76 |
| | 9,240 |
| 4.95 |
| | 9,202 |
| 4.95 |
|
| Loans held for sale | 37 |
| 2.55 |
| | 42 |
| 2.57 |
| | 52 |
| 2.37 |
| | 58 |
| 2.08 |
| 9 |
| 3.74 |
| | 9 |
| 3.86 |
| | 9 |
| 3.91 |
| | 12 |
| 3.48 |
|
| Investment securities: | | | | | | | | | | | | |
| | | |
| |
| | |
| |
| | | |
| U.S. government & federal agency obligations | 329 |
| 2.49 |
| | 328 |
| 3.40 |
| | 342 |
| 9.72 |
| | 435 |
| 3.84 |
| 341 |
| 5.11 |
| | 329 |
| (.07 | ) | | 331 |
| 7.58 |
| | 328 |
| 2.08 |
|
| Government-sponsored enterprise obligations | 305 |
| 1.93 |
| | 262 |
| 2.92 |
| | 235 |
| 2.23 |
| | 209 |
| 2.07 |
| 400 |
| 1.72 |
| | 276 |
| 1.65 |
| | 265 |
| 2.06 |
| | 283 |
| 2.01 |
|
State & municipal obligations(A) | 1,239 |
| 4.16 |
| | 1,185 |
| 4.20 |
| | 1,160 |
| 4.75 |
| | 1,113 |
| 4.63 |
| 1,532 |
| 3.67 |
| | 1,388 |
| 3.89 |
| | 1,323 |
| 4.03 |
| | 1,263 |
| 4.17 |
|
| Mortgage-backed securities | 4,453 |
| 2.71 |
| | 3,765 |
| 2.95 |
| | 3,058 |
| 3.63 |
| | 2,929 |
| 3.93 |
| 3,448 |
| 2.79 |
| | 3,767 |
| 2.62 |
| | 4,010 |
| 2.89 |
| | 4,191 |
| 2.85 |
|
| Asset-backed securities | 2,646 |
| 1.12 |
| | 2,403 |
| 1.15 |
| | 2,403 |
| 1.31 |
| | 2,321 |
| 1.44 |
| 3,158 |
| .99 |
| | 2,879 |
| 1.10 |
| | 2,900 |
| 1.13 |
| | 2,762 |
| 1.16 |
|
Other marketable securities(A) | 165 |
| 5.39 |
| | 173 |
| 4.27 |
| | 173 |
| 4.18 |
| | 176 |
| 5.91 |
| 138 |
| 5.35 |
| | 122 |
| 4.50 |
| | 136 |
| 4.92 |
| | 163 |
| 4.11 |
|
Trading securities(A) | 20 |
| 2.87 |
| | 21 |
| 2.52 |
| | 20 |
| 2.78 |
| | 19 |
| 2.88 |
| 21 |
| 2.01 |
| | 24 |
| 2.34 |
| | 23 |
| 2.65 |
| | 33 |
| 2.95 |
|
Non-marketable securities(A) | 110 |
| 10.81 |
| | 110 |
| 6.59 |
| | 105 |
| 6.24 |
| | 104 |
| 7.04 |
| 119 |
| 17.51 |
| | 117 |
| 7.54 |
| | 123 |
| 8.60 |
| | 117 |
| 8.55 |
|
| Total investment securities | 9,267 |
| 2.56 |
| | 8,247 |
| 2.69 |
| | 7,496 |
| 3.34 |
| | 7,306 |
| 3.28 |
| 9,157 |
| 2.59 |
| | 8,902 |
| 2.29 |
| | 9,111 |
| 2.75 |
| | 9,140 |
| 2.56 |
|
| Short-term federal funds sold and securities purchased under agreements to resell | 10 |
| .39 |
| | 11 |
| .47 |
| | 16 |
| .53 |
| | 5 |
| .80 |
| 10 |
| .46 |
| | 19 |
| .49 |
| | 22 |
| .53 |
| | 14 |
| .50 |
|
| Long-term securities purchased under agreements to resell | 850 |
| 1.97 |
| | 850 |
| 1.83 |
| | 804 |
| 1.58 |
| | 568 |
| 1.54 |
| 1,022 |
| 2.10 |
| | 848 |
| 2.31 |
| | 850 |
| 2.17 |
| | 850 |
| 2.02 |
|
| Interest earning deposits with banks | 123 |
| .25 |
| | 326 |
| .26 |
| | 180 |
| .25 |
| | 146 |
| .25 |
| 209 |
| .25 |
| | 81 |
| .20 |
| | 163 |
| .28 |
| | 88 |
| .25 |
|
| Total interest earning assets | 19,393 |
| 3.67 |
| | 18,570 |
| 3.77 |
| | 17,809 |
| 4.15 |
| | 17,517 |
| 4.20 |
| 20,031 |
| 3.52 |
| | 19,308 |
| 3.49 |
| | 19,395 |
| 3.75 |
| | 19,306 |
| 3.66 |
|
| Allowance for loan losses | (186 | ) | | | (190 | ) | | | (193 | ) | | | (196 | ) | | (174 | ) | | | (177 | ) | | | (181 | ) | | | (184 | ) | |
| Unrealized gain on investment securities | 189 |
| | | 186 |
| | | 147 |
| | | 129 |
| | 282 |
| | | 275 |
| | | 243 |
| | | 230 |
| |
| Cash and due from banks | 367 |
| | | 347 |
| | | 334 |
| | | 346 |
| | 385 |
| | | 366 |
| | | 358 |
| | | 367 |
| |
| Land, buildings and equipment – net | 370 |
| | | 375 |
| | | 379 |
| | | 385 |
| | 359 |
| | | 353 |
| | | 356 |
| | | 361 |
| |
| Other assets | 382 |
| | | 376 |
| | | 387 |
| | | 370 |
| | 382 |
| | | 392 |
| | | 378 |
| | | 387 |
| |
| Total assets | $ | 20,515 |
| | | $ | 19,664 |
| | | $ | 18,863 |
| | | $ | 18,551 |
| | $ | 21,265 |
| | | $ | 20,517 |
| | | $ | 20,549 |
| | | $ | 20,467 |
| |
| LIABILITIES AND EQUITY | | | | | | | | | | | | | | | | | | | | | | |
| Interest bearing deposits: | | | | | | | | | | | | | | | | | | | | | | |
| Savings | $ | 529 |
| .17 |
| | $ | 534 |
| .19 |
| | $ | 538 |
| .14 |
| | $ | 500 |
| .14 |
| $ | 581 |
| .13 |
| | $ | 582 |
| .15 |
| | $ | 584 |
| .12 |
| | $ | 550 |
| .15 |
|
| Interest checking and money market | 8,068 |
| .29 |
| | 7,756 |
| .32 |
| | 7,581 |
| .33 |
| | 7,399 |
| .37 |
| 8,638 |
| .19 |
| | 8,401 |
| .21 |
| | 8,369 |
| .21 |
| | 8,312 |
| .24 |
|
| Time open & C.D.’s under $100,000 | 1,186 |
| .75 |
| | 1,231 |
| .78 |
| | 1,324 |
| .90 |
| | 1,426 |
| 1.06 |
| 1,084 |
| .68 |
| | 1,101 |
| .70 |
| | 1,129 |
| .71 |
| | 1,156 |
| .73 |
|
| Time open & C.D.’s $100,000 & over | 1,368 |
| .59 |
| | 1,373 |
| .62 |
| | 1,466 |
| .67 |
| | 1,434 |
| .76 |
| 1,030 |
| .65 |
| | 1,005 |
| .69 |
| | 1,250 |
| .59 |
| | 1,444 |
| .53 |
|
| Total interest bearing deposits | 11,151 |
| .37 |
| | 10,894 |
| .40 |
| | 10,909 |
| .43 |
| | 10,759 |
| .50 |
| 11,333 |
| .28 |
| | 11,089 |
| .30 |
| | 11,332 |
| .30 |
| | 11,462 |
| .32 |
|
| Borrowings: | | | | | | | | | | | | | | | | | | | | | | |
| Federal funds purchased and securities sold under agreements to repurchase | 1,147 |
| .05 |
| | 1,017 |
| .11 |
| | 952 |
| .29 |
| | 1,023 |
| .25 |
| 1,130 |
| .07 |
| | 1,217 |
| .07 |
| | 1,110 |
| .06 |
| | 1,287 |
| .07 |
|
| Other borrowings | 112 |
| 3.26 |
| | 112 |
| 3.28 |
| | 112 |
| 3.29 |
| | 112 |
| 3.30 |
| 104 |
| 3.25 |
| | 109 |
| 3.11 |
| | 111 |
| 3.16 |
| | 112 |
| 3.26 |
|
| Total borrowings | 1,259 |
| .33 |
| | 1,129 |
| .43 |
| | 1,064 |
| .61 |
| | 1,135 |
| .55 |
| 1,234 |
| .33 |
| | 1,326 |
| .32 |
| | 1,221 |
| .35 |
| | 1,399 |
| .33 |
|
| Total interest bearing liabilities | 12,410 |
| .37 | % | | 12,023 |
| .40 | % | | 11,973 |
| .45 | % | | 11,894 |
| .51 | % | 12,567 |
| .28 | % | | 12,415 |
| .30 | % | | 12,553 |
| .30 | % | | 12,861 |
| .32 | % |
| Non-interest bearing deposits | 5,173 |
| | | 4,779 |
| | | 4,571 |
| | | 4,437 |
| | 6,013 |
| | | 5,536 |
| | | 5,405 |
| | | 5,132 |
| |
| Other liabilities | 790 |
| | | 729 |
| | | 208 |
| | | 168 |
| | 399 |
| | | 296 |
| | | 368 |
| | | 276 |
| |
| Equity | 2,142 |
| | | 2,133 |
| | | 2,111 |
| | | 2,052 |
| | 2,286 |
| | | 2,270 |
| | | 2,223 |
| | | 2,198 |
| |
| Total liabilities and equity | $ | 20,515 |
| | | $ | 19,664 |
| | | $ | 18,863 |
| | | $ | 18,551 |
| | $ | 21,265 |
| | | $ | 20,517 |
| | | $ | 20,549 |
| | | $ | 20,467 |
| |
| Net interest margin (T/E) | $ | 168 |
| | | $ | 164 |
| | | $ | 171 |
| | | $ | 167 |
| | $ | 168 |
| | | $ | 160 |
| | | $ | 171 |
| | | $ | 166 |
| |
| Net yield on interest earning assets | | 3.44 | % | | | 3.51 | % | | | 3.85 | % | | | 3.85 | % | | 3.35 | % | | | 3.30 | % | | | 3.55 | % | | | 3.45 | % |
| |
| (A) | Includes tax equivalent calculations. |
| | | | Year ended December 31, 2010 | Year ended December 31, 2011 |
| | Fourth Quarter | | Third Quarter | | Second Quarter | | First Quarter | Fourth Quarter | | Third Quarter | | Second Quarter | | First Quarter |
| (Dollars in millions) | Average Balance | Average Rates Earned/Paid | | Average Balance | Average Rates Earned/Paid | | Average Balance | Average Rates Earned/Paid | | Average Balance | Average Rates Earned/Paid | Average Balance | Average Rates Earned/Paid | | Average Balance | Average Rates Earned/Paid | | Average Balance | Average Rates Earned/Paid | | Average Balance | Average Rates Earned/Paid |
| ASSETS | | | | | | | | | | | | | | | | | | | | | | |
| Loans: | | | | | | | | | | | | | | | | | | | | | | |
Business(A) | $ | 2,920 |
| 3.77 | % | | $ | 2,918 |
| 3.82 | % | | $ | 2,881 |
| 3.93 | % | | $ | 2,830 |
| 3.83 | % | $ | 2,819 |
| 3.53 | % | | $ | 2,815 |
| 3.56 | % | | $ | 2,959 |
| 3.64 | % | | $ | 3,053 |
| 3.65 | % |
| Real estate – construction and land | 498 |
| 4.17 |
| | 530 |
| 4.00 |
| | 568 |
| 3.90 |
| | 634 |
| 4.01 |
| 387 |
| 4.52 |
| | 412 |
| 4.42 |
| | 430 |
| 4.51 |
| | 452 |
| 4.49 |
|
| Real estate – business | 2,003 |
| 5.01 |
| | 1,999 |
| 5.10 |
| | 2,029 |
| 5.08 |
| | 2,088 |
| 5.00 |
| 2,162 |
| 4.67 |
| | 2,123 |
| 4.74 |
| | 2,101 |
| 4.94 |
| | 2,081 |
| 4.92 |
|
| Real estate – personal | 1,444 |
| 5.00 |
| | 1,451 |
| 5.13 |
| | 1,484 |
| 5.25 |
| | 1,526 |
| 5.35 |
| 1,421 |
| 4.64 |
| | 1,430 |
| 4.75 |
| | 1,441 |
| 4.87 |
| | 1,444 |
| 5.00 |
|
| Consumer | 1,191 |
| 6.61 |
| | 1,234 |
| 6.65 |
| | 1,270 |
| 6.72 |
| | 1,307 |
| 6.94 |
| 1,111 |
| 6.08 |
| | 1,105 |
| 6.20 |
| | 1,112 |
| 6.32 |
| | 1,147 |
| 6.47 |
|
| Revolving home equity | 483 |
| 4.31 |
| | 485 |
| 4.32 |
| | 483 |
| 4.32 |
| | 488 |
| 4.31 |
| 465 |
| 4.24 |
| | 467 |
| 4.27 |
| | 468 |
| 4.24 |
| | 475 |
| 4.28 |
|
| Student | 22 |
| 2.10 |
| | 315 |
| 2.40 |
| | 322 |
| 2.38 |
| | 329 |
| 2.28 |
| |
| Consumer credit card | 776 |
| 10.82 |
| | 763 |
| 11.29 |
| | 738 |
| 12.32 |
| | 763 |
| 12.58 |
| 734 |
| 11.62 |
| | 735 |
| 11.59 |
| | 743 |
| 11.13 |
| | 775 |
| 10.92 |
|
| Overdrafts | 8 |
| — |
| | 7 |
| — |
| | 7 |
| — |
| | 8 |
| — |
| 7 |
| — |
| | 7 |
| — |
| | 7 |
| — |
| | 7 |
| — |
|
| Total loans | 9,345 |
| 5.22 |
| | 9,702 |
| 5.21 |
| | 9,782 |
| 5.33 |
| | 9,973 |
| 5.37 |
| 9,106 |
| 5.01 |
| | 9,094 |
| 5.07 |
| | 9,261 |
| 5.12 |
| | 9,434 |
| 5.15 |
|
| Loans held for sale | 93 |
| 2.38 |
| | 305 |
| 1.78 |
| | 557 |
| 1.63 |
| | 484 |
| 1.60 |
| 37 |
| 2.55 |
| | 42 |
| 2.57 |
| | 52 |
| 2.37 |
| | 58 |
| 2.08 |
|
| Investment securities: | | | | | | | | | | | | |
| |
| | |
| |
| | |
| |
| | |
| |
| U.S. government & federal agency obligations | 436 |
| 2.32 |
| | 437 |
| 1.07 |
| | 443 |
| 3.43 |
| | 439 |
| 1.99 |
| 329 |
| 2.49 |
| | 328 |
| 3.40 |
| | 342 |
| 9.72 |
| | 435 |
| 3.84 |
|
| Government-sponsored enterprise obligations | 187 |
| 2.25 |
| | 235 |
| 2.12 |
| | 225 |
| 2.16 |
| | 167 |
| 2.59 |
| 305 |
| 1.93 |
| | 262 |
| 2.92 |
| | 235 |
| 2.23 |
| | 209 |
| 2.07 |
|
State & municipal obligations(A) | 1,091 |
| 4.45 |
| | 982 |
| 4.53 |
| | 893 |
| 4.87 |
| | 899 |
| 5.04 |
| 1,239 |
| 4.16 |
| | 1,185 |
| 4.20 |
| | 1,160 |
| 4.75 |
| | 1,113 |
| 4.63 |
|
| Mortgage-backed securities | 2,905 |
| 3.89 |
| | 2,998 |
| 3.44 |
| | 2,609 |
| 4.36 |
| | 2,771 |
| 4.45 |
| 4,453 |
| 2.71 |
| | 3,765 |
| 2.95 |
| | 3,058 |
| 3.63 |
| | 2,929 |
| 3.93 |
|
| Asset-backed securities | 2,316 |
| 1.56 |
| | 2,103 |
| 1.82 |
| | 1,781 |
| 2.17 |
| | 1,686 |
| 2.44 |
| 2,646 |
| 1.12 |
| | 2,403 |
| 1.15 |
| | 2,403 |
| 1.31 |
| | 2,321 |
| 1.44 |
|
Other marketable securities(A) | 177 |
| 5.01 |
| | 183 |
| 5.18 |
| | 193 |
| 4.55 |
| | 181 |
| 4.67 |
| 165 |
| 5.39 |
| | 173 |
| 4.27 |
| | 173 |
| 4.18 |
| | 176 |
| 5.91 |
|
Trading securities(A) | 32 |
| 3.35 |
| | 23 |
| 2.87 |
| | 19 |
| 2.93 |
| | 14 |
| 2.91 |
| 20 |
| 2.87 |
| | 21 |
| 2.52 |
| | 20 |
| 2.78 |
| | 19 |
| 2.88 |
|
Non-marketable securities(A) | 107 |
| 5.98 |
| | 109 |
| 9.43 |
| | 114 |
| 4.26 |
| | 123 |
| 5.91 |
| 110 |
| 10.81 |
| | 110 |
| 6.59 |
| | 105 |
| 6.24 |
| | 104 |
| 7.04 |
|
| Total investment securities | 7,251 |
| 3.15 |
| | 7,070 |
| 3.05 |
| | 6,277 |
| 3.67 |
| | 6,280 |
| 3.81 |
| 9,267 |
| 2.56 |
| | 8,247 |
| 2.69 |
| | 7,496 |
| 3.34 |
| | 7,306 |
| 3.28 |
|
| Short-term federal funds sold and securities purchased under agreements to resell | 5 |
| .61 |
| | 7 |
| .69 |
| | 7 |
| .76 |
| | 7 |
| .84 |
| 10 |
| .39 |
| | 11 |
| .47 |
| | 16 |
| .53 |
| | 5 |
| .80 |
|
| Long-term securities purchased under agreements to resell | 397 |
| 1.69 |
| | 199 |
| 1.72 |
| | — |
| — |
| | — |
| — |
| 850 |
| 1.97 |
| | 850 |
| 1.83 |
| | 804 |
| 1.58 |
| | 568 |
| 1.54 |
|
| Interest earning deposits with banks | 87 |
| .25 |
| | 171 |
| .25 |
| | 322 |
| .25 |
| | 108 |
| .24 |
| 123 |
| .25 |
| | 326 |
| .26 |
| | 180 |
| .25 |
| | 146 |
| .25 |
|
| Total interest earning assets | 17,178 |
| 4.22 |
| | 17,454 |
| 4.19 |
| | 16,945 |
| 4.49 |
| | 16,852 |
| 4.64 |
| 19,393 |
| 3.67 |
| | 18,570 |
| 3.77 |
| | 17,809 |
| 4.15 |
| | 17,517 |
| 4.20 |
|
| Allowance for loan losses | (195 | ) | | | (195 | ) | | | (196 | ) | | | (197 | ) | | (186 | ) | | | (190 | ) | | | (193 | ) | | | (196 | ) | |
| Unrealized gain on investment securities | 176 |
| | | 159 |
| | | 133 |
| | | 128 |
| | 189 |
| | | 186 |
| | | 147 |
| | | 129 |
| |
| Cash and due from banks | 365 |
| | | 367 |
| | | 378 |
| | | 364 |
| | 367 |
| | | 347 |
| | | 334 |
| | | 346 |
| |
| Land, buildings and equipment – net | 388 |
| | | 392 |
| | | 397 |
| | | 402 |
| | 370 |
| | | 375 |
| | | 379 |
| | | 385 |
| |
| Other assets | 383 |
| | | 444 |
| | | 401 |
| | | 413 |
| | 382 |
| | | 376 |
| | | 387 |
| | | 370 |
| |
| Total assets | $ | 18,295 |
| | | $ | 18,621 |
| | | $ | 18,058 |
| | | $ | 17,962 |
| | $ | 20,515 |
| | | $ | 19,664 |
| | | $ | 18,863 |
| | | $ | 18,551 |
| |
| LIABILITIES AND EQUITY | | | | | | | | | | | | | | | | | | | | | | |
| Interest bearing deposits: | | | | | | | | | | | | | | | | | | | | | | |
| Savings | $ | 480 |
| .14 |
| | $ | 482 |
| .16 |
| | $ | 490 |
| .11 |
| | $ | 461 |
| .10 |
| $ | 529 |
| .17 |
| | $ | 534 |
| .19 |
| | $ | 538 |
| .14 |
| | $ | 500 |
| .14 |
|
| Interest checking and money market | 7,011 |
| .40 |
| | 6,794 |
| .41 |
| | 6,810 |
| .45 |
| | 6,522 |
| .43 |
| 8,068 |
| .29 |
| | 7,756 |
| .32 |
| | 7,581 |
| .33 |
| | 7,399 |
| .37 |
|
| Time open & C.D.’s under $100,000 | 1,533 |
| 1.18 |
| | 1,642 |
| 1.32 |
| | 1,703 |
| 1.43 |
| | 1,766 |
| 1.56 |
| 1,186 |
| .75 |
| | 1,231 |
| .78 |
| | 1,324 |
| .90 |
| | 1,426 |
| 1.06 |
|
| Time open & C.D.’s $100,000 & over | 1,232 |
| .93 |
| | 1,417 |
| .97 |
| | 1,323 |
| 1.08 |
| | 1,324 |
| 1.20 |
| 1,368 |
| .59 |
| | 1,373 |
| .62 |
| | 1,466 |
| .67 |
| | 1,434 |
| .76 |
|
| Total interest bearing deposits | 10,256 |
| .57 |
| | 10,335 |
| .62 |
| | 10,326 |
| .67 |
| | 10,073 |
| .72 |
| 11,151 |
| .37 |
| | 10,894 |
| .40 |
| | 10,909 |
| .43 |
| | 10,759 |
| .50 |
|
| Borrowings: | | | | | | | | | | | | | | | | | | | | | | |
| Federal funds purchased and securities sold under agreements to repurchase | 1,125 |
| .12 |
| | 1,024 |
| .23 |
| | 1,027 |
| .32 |
| | 1,166 |
| .29 |
| 1,147 |
| .05 |
| | 1,017 |
| .11 |
| | 952 |
| .29 |
| | 1,023 |
| .25 |
|
| Other borrowings | 231 |
| 2.96 |
| | 350 |
| 3.09 |
| | 502 |
| 3.02 |
| | 735 |
| 3.70 |
| 112 |
| 3.26 |
| | 112 |
| 3.28 |
| | 112 |
| 3.29 |
| | 112 |
| 3.30 |
|
| Total borrowings | 1,356 |
| .61 |
| | 1,374 |
| .96 |
| | 1,529 |
| 1.21 |
| | 1,901 |
| 1.61 |
| 1,259 |
| .33 |
| | 1,129 |
| .43 |
| | 1,064 |
| .61 |
| | 1,135 |
| .55 |
|
| Total interest bearing liabilities | 11,612 |
| .57 | % | | 11,709 |
| .66 | % | | 11,855 |
| .74 | % | | 11,974 |
| .86 | % | 12,410 |
| .37 | % | | 12,023 |
| .40 | % | | 11,973 |
| .45 | % | | 11,894 |
| .51 | % |
| Non-interest bearing deposits | 4,346 |
| | | 4,192 |
| | | 4,042 |
| | | 3,872 |
| | 5,173 |
| | | 4,779 |
| | | 4,571 |
| | | 4,437 |
| |
| Other liabilities | 287 |
| | | 701 |
| | | 199 |
| | | 194 |
| | 790 |
| | | 729 |
| | | 208 |
| | | 168 |
| |
| Equity | 2,050 |
| | | 2,019 |
| | | 1,962 |
| | | 1,922 |
| | 2,142 |
| | | 2,133 |
| | | 2,111 |
| | | 2,052 |
| |
| Total liabilities and equity | $ | 18,295 |
| | | $ | 18,621 |
| | | $ | 18,058 |
| | | $ | 17,962 |
| | $ | 20,515 |
| | | $ | 19,664 |
| | | $ | 18,863 |
| | | $ | 18,551 |
| |
| Net interest margin (T/E) | $ | 166 |
| | | $ | 165 |
| | | $ | 168 |
| | | $ | 167 |
| | $ | 168 |
| | | $ | 164 |
| | | $ | 171 |
| | | $ | 167 |
| |
| Net yield on interest earning assets | | 3.83 | % | | | 3.75 | % | | | 3.97 | % | | | 4.03 | % | | 3.44 | % | | | 3.51 | % | | | 3.85 | % | | | 3.85 | % |
| |
| (A) | Includes tax equivalent calculations. |
SUMMARY OF QUARTERLY STATEMENTS OF INCOME
| | | Year ended December 31, 2011 | For the Quarter Ended | |
| Year ended December 31, 2012 | | For the Quarter Ended |
| (In thousands, except per share data) | 12/31/2011 | 9/30/2011 | 6/30/2011 | 3/31/2011 | 12/31/2012 | 9/30/2012 | 6/30/2012 | 3/31/2012 |
| Interest income | $ | 173,223 |
| $ | 170,835 |
| $ | 178,087 |
| $ | 175,826 |
| $ | 170,185 |
| $ | 163,194 |
| $ | 174,624 |
| $ | 169,966 |
|
| Interest expense | (11,466 | ) | (12,205 | ) | (13,377 | ) | (14,853 | ) | (8,932 | ) | (9,383 | ) | (9,519 | ) | (10,229 | ) |
| Net interest income | 161,757 |
| 158,630 |
| 164,710 |
| 160,973 |
| 161,253 |
| 153,811 |
| 165,105 |
| 159,737 |
|
| Non-interest income | 94,035 |
| 101,632 |
| 101,344 |
| 95,906 |
| 103,309 |
| 100,922 |
| 100,816 |
| 94,583 |
|
| Investment securities gains, net | 4,942 |
| 2,587 |
| 1,956 |
| 1,327 |
| |
| Investment securities gains (losses), net | | (3,728 | ) | 3,180 |
| 1,336 |
| 4,040 |
|
| Salaries and employee benefits | (88,010 | ) | (85,700 | ) | (84,223 | ) | (87,392 | ) | (94,553 | ) | (89,292 | ) | (87,511 | ) | (89,543 | ) |
| Other expense | (68,020 | ) | (68,046 | ) | (69,290 | ) | (66,568 | ) | (63,724 | ) | (64,099 | ) | (68,829 | ) | (60,918 | ) |
| Provision for loan losses | (12,143 | ) | (11,395 | ) | (12,188 | ) | (15,789 | ) | (8,326 | ) | (5,581 | ) | (5,215 | ) | (8,165 | ) |
| Income before income taxes | 92,561 |
| 97,708 |
| 102,309 |
| 88,457 |
| 94,231 |
| 98,941 |
| 105,702 |
| 99,734 |
|
| Income taxes | (29,514 | ) | (31,699 | ) | (32,692 | ) | (27,507 | ) | (27,628 | ) | (32,155 | ) | (34,466 | ) | (32,920 | ) |
| Non-controlling interest | (1,543 | ) | (657 | ) | (583 | ) | (497 | ) | 188 |
| (780 | ) | (503 | ) | (1,015 | ) |
| Net income attributable to Commerce Bancshares, Inc. | $ | 61,504 |
| $ | 65,352 |
| $ | 69,034 |
| $ | 60,453 |
| $ | 66,791 |
| $ | 66,006 |
| $ | 70,733 |
| $ | 65,799 |
|
| Net income per common share — basic* | $ | .69 |
| $ | .72 |
| $ | .76 |
| $ | .66 |
| $ | .73 |
| $ | .71 |
| $ | .77 |
| $ | .70 |
|
| Net income per common share — diluted* | $ | .69 |
| $ | .72 |
| $ | .75 |
| $ | .66 |
| $ | .72 |
| $ | .72 |
| $ | .76 |
| $ | .70 |
|
| Weighted average shares — basic* | 88,394 |
| 89,477 |
| 90,866 |
| 90,791 |
| 90,825 |
| 91,239 |
| 91,774 |
| 92,632 |
|
| Weighted average shares — diluted* | 88,653 |
| 89,737 |
| 91,274 |
| 91,178 |
| 90,999 |
| 91,552 |
| 92,056 |
| 92,984 |
|
| | | Year ended December 31, 2010 | For the Quarter Ended | |
| Year ended December 31, 2011 | | For the Quarter Ended |
| (In thousands, except per share data) | 12/31/2010 | 9/30/2010 | 6/30/2010 | 3/31/2010 | 12/31/2011 | 9/30/2011 | 6/30/2011 | 3/31/2011 |
| Interest income | $ | 177,436 |
| $ | 178,916 |
| $ | 185,057 |
| $ | 188,069 |
| $ | 173,223 |
| $ | 170,835 |
| $ | 178,087 |
| $ | 175,826 |
|
| Interest expense | (16,759 | ) | (19,479 | ) | (21,949 | ) | (25,359 | ) | (11,466 | ) | (12,205 | ) | (13,377 | ) | (14,853 | ) |
| Net interest income | 160,677 |
| 159,437 |
| 163,108 |
| 162,710 |
| 161,757 |
| 158,630 |
| 164,710 |
| 160,973 |
|
| Non-interest income | 110,454 |
| 100,010 |
| 101,458 |
| 93,189 |
| 94,035 |
| 101,632 |
| 101,344 |
| 95,906 |
|
| Investment securities gains (losses), net | 1,204 |
| 16 |
| 660 |
| (3,665 | ) | |
| Investment securities gains, net | | 4,942 |
| 2,587 |
| 1,956 |
| 1,327 |
|
| Salaries and employee benefits | (86,562 | ) | (85,442 | ) | (87,108 | ) | (87,438 | ) | (88,010 | ) | (85,700 | ) | (84,223 | ) | (87,392 | ) |
| Other expense | (77,469 | ) | (70,144 | ) | (68,685 | ) | (68,286 | ) | (68,020 | ) | (68,046 | ) | (69,290 | ) | (66,568 | ) |
| Provision for loan losses | (21,647 | ) | (21,844 | ) | (22,187 | ) | (34,322 | ) | (12,143 | ) | (11,395 | ) | (12,188 | ) | (15,789 | ) |
| Income before income taxes | 86,657 |
| 82,033 |
| 87,246 |
| 62,188 |
| 92,561 |
| 97,708 |
| 102,309 |
| 88,457 |
|
| Income taxes | (24,432 | ) | (26,012 | ) | (27,428 | ) | (18,377 | ) | (29,514 | ) | (31,699 | ) | (32,692 | ) | (27,507 | ) |
| Non-controlling interest | (304 | ) | (136 | ) | (84 | ) | 359 |
| (1,543 | ) | (657 | ) | (583 | ) | (497 | ) |
| Net income attributable to Commerce Bancshares, Inc. | $ | 61,921 |
| $ | 55,885 |
| $ | 59,734 |
| $ | 44,170 |
| $ | 61,504 |
| $ | 65,352 |
| $ | 69,034 |
| $ | 60,453 |
|
| Net income per common share — basic* | $ | .67 |
| $ | .61 |
| $ | .65 |
| $ | .48 |
| $ | .66 |
| $ | .69 |
| $ | .72 |
| $ | .63 |
|
| Net income per common share — diluted* | $ | .67 |
| $ | .61 |
| $ | .64 |
| $ | .48 |
| $ | .66 |
| $ | .69 |
| $ | .71 |
| $ | .63 |
|
| Weighted average shares — basic* | 90,892 |
| 91,552 |
| 91,496 |
| 91,368 |
| 92,814 |
| 93,951 |
| 95,410 |
| 95,330 |
|
| Weighted average shares — diluted* | 91,274 |
| 91,938 |
| 91,932 |
| 91,866 |
| 93,086 |
| 94,224 |
| 95,837 |
| 95,737 |
|
| | | Year ended December 31, 2009 | For the Quarter Ended | |
| Year ended December 31, 2010 | | For the Quarter Ended |
| (In thousands, except per share data) | 12/31/2009 | 9/30/2009 | 6/30/2009 | 3/31/2009 | 12/31/2010 | 9/30/2010 | 6/30/2010 | 3/31/2010 |
| Interest income | $ | 194,999 |
| $ | 201,647 |
| $ | 198,992 |
| $ | 193,874 |
| $ | 177,436 |
| $ | 178,916 |
| $ | 185,057 |
| $ | 188,069 |
|
| Interest expense | (30,496 | ) | (38,108 | ) | (41,547 | ) | (43,859 | ) | (16,759 | ) | (19,479 | ) | (21,949 | ) | (25,359 | ) |
| Net interest income | 164,503 |
| 163,539 |
| 157,445 |
| 150,015 |
| 160,677 |
| 159,437 |
| 163,108 |
| 162,710 |
|
| Non-interest income | 102,519 |
| 102,414 |
| 98,363 |
| 92,963 |
| 110,454 |
| 100,010 |
| 101,458 |
| 93,189 |
|
| Investment securities losses, net | (1,325 | ) | (945 | ) | (2,753 | ) | (2,172 | ) | |
| Investment securities gains (losses), net | | 1,204 |
| 16 |
| 660 |
| (3,665 | ) |
| Salaries and employee benefits | (85,480 | ) | (87,267 | ) | (86,279 | ) | (86,753 | ) | (86,562 | ) | (85,442 | ) | (87,108 | ) | (87,438 | ) |
| Other expense | (68,259 | ) | (67,501 | ) | (73,533 | ) | (66,665 | ) | (77,469 | ) | (70,144 | ) | (68,685 | ) | (68,286 | ) |
| Provision for loan losses | (41,002 | ) | (35,361 | ) | (41,166 | ) | (43,168 | ) | (21,647 | ) | (21,844 | ) | (22,187 | ) | (34,322 | ) |
| Income before income taxes | 70,956 |
| 74,879 |
| 52,077 |
| 44,220 |
| 86,657 |
| 82,033 |
| 87,246 |
| 62,188 |
|
| Income taxes | (21,493 | ) | (23,415 | ) | (15,257 | ) | (13,592 | ) | (24,432 | ) | (26,012 | ) | (27,428 | ) | (18,377 | ) |
| Non-controlling interest | 159 |
| 185 |
| 148 |
| 208 |
| (304 | ) | (136 | ) | (84 | ) | 359 |
|
| Net income attributable to Commerce Bancshares, Inc. | $ | 49,622 |
| $ | 51,649 |
| $ | 36,968 |
| $ | 30,836 |
| $ | 61,921 |
| $ | 55,885 |
| $ | 59,734 |
| $ | 44,170 |
|
| Net income per common share — basic* | $ | .54 |
| $ | .57 |
| $ | .42 |
| $ | .35 |
| $ | .65 |
| $ | .57 |
| $ | .62 |
| $ | .46 |
|
| Net income per common share — diluted* | $ | .54 |
| $ | .57 |
| $ | .41 |
| $ | .35 |
| $ | .64 |
| $ | .58 |
| $ | .61 |
| $ | .46 |
|
| Weighted average shares — basic* | 91,159 |
| 90,592 |
| 88,477 |
| 87,635 |
| 95,437 |
| 96,129 |
| 96,071 |
| 95,937 |
|
| Weighted average shares — diluted* | 91,551 |
| 90,946 |
| 88,778 |
| 87,987 |
| 95,837 |
| 96,535 |
| 96,528 |
| 96,460 |
|
* Restated for the 5% stock dividend distributed in 2011.
2012.
| |
| Item 7a. | QUANTITATIVE AND QUALITATIVE DISCLOSURES ABOUT MARKET RISK |
The information required by this item is set forth on pages 4543 through 4645 of Management’s Discussion and Analysis of Financial Condition and Results of Operations.
| |
| Item 8. | FINANCIAL STATEMENTS AND SUPPLEMENTARY DATA |
REPORT OF INDEPENDENT REGISTERED PUBLIC ACCOUNTING FIRM
The Board of Directors and Stockholders
Commerce Bancshares, Inc.:
We have audited the accompanying consolidated balance sheets of Commerce Bancshares, Inc. and subsidiaries (the Company) as of December 31, 20112012 and 2010,2011, and the related consolidated statements of income, comprehensive income, changes in equity, and cash flows for each of the years in the three-year period ended December 31, 2011.2012. These consolidated financial statements are the responsibility of the Company’s management. Our responsibility is to express an opinion on these consolidated financial statements based on our audits.
We conducted our audits in accordance with the standards of the Public Company Accounting Oversight Board (United States). Those standards require that we plan and perform the audit to obtain reasonable assurance about whether the financial statements are free of material misstatement. An audit includes examining, on a test basis, evidence supporting the amounts and disclosures in the financial statements. An audit also includes assessing the accounting principles used and significant estimates made by management, as well as evaluating the overall financial statement presentation. We believe that our audits provide a reasonable basis for our opinion.
In our opinion, the consolidated financial statements referred to above present fairly, in all material respects, the financial position of Commerce Bancshares, Inc. and subsidiaries as of December 31, 20112012 and 2010,2011, and the results of their operations and their cash flows for each of the years in the three-year period ended December 31, 2011,2012, in conformity with U.S. generally accepted accounting principles.
We also have audited, in accordance with the standards of the Public Company Accounting Oversight Board (United States), the Company’s internal control over financial reporting as of December 31, 2011,2012, based on criteria established in Internal Control - Integrated Framework issued by the Committee of Sponsoring Organizations of the Treadway Commission (COSO), and our report dated February 22, 20122013 expressed an unqualified opinion on the effectiveness of the Company’s internal control over financial reporting.
Kansas City, Missouri
February 22, 20122013
Commerce Bancshares, Inc. and Subsidiaries
CONSOLIDATED BALANCE SHEETS
| | | | December 31 | December 31 |
| | 2011 | 2010 | 2012 | 2011 |
| | (In thousands) | (In thousands) |
| ASSETS | | |
| Loans | $ | 9,177,478 |
| $ | 9,410,982 |
| $ | 9,831,384 |
| $ | 9,177,478 |
|
| Allowance for loan losses | (184,532 | ) | (197,538 | ) | (172,532 | ) | (184,532 | ) |
| Net loans | 8,992,946 |
| 9,213,444 |
| 9,658,852 |
| 8,992,946 |
|
| Loans held for sale | 31,076 |
| 63,751 |
| 8,827 |
| 31,076 |
|
| Investment securities: | | |
| Available for sale ($418,046,000 and $429,439,000 pledged in 2011 and | | |
| 2010, respectively, to secure structured repurchase agreements) | 9,224,702 |
| 7,294,303 |
| |
| Available for sale ($736,183,000 and $418,046,000 pledged in 2012 and | | |
| 2011, respectively, to secure repurchase agreements) | | 9,522,248 |
| 9,224,702 |
|
| Trading | 17,853 |
| 11,710 |
| 28,837 |
| 17,853 |
|
| Non-marketable | 115,832 |
| 103,521 |
| 118,650 |
| 115,832 |
|
| Total investment securities | 9,358,387 |
| 7,409,534 |
| 9,669,735 |
| 9,358,387 |
|
| Short-term federal funds sold and securities purchased under agreements to resell | 11,870 |
| 10,135 |
| 27,595 |
| 11,870 |
|
| Long-term securities purchased under agreements to resell | 850,000 |
| 450,000 |
| 1,200,000 |
| 850,000 |
|
| Interest earning deposits with banks | 39,853 |
| 122,076 |
| 179,164 |
| 39,853 |
|
| Cash and due from banks | 465,828 |
| 328,464 |
| 573,066 |
| 465,828 |
|
| Land, buildings and equipment – net | 360,146 |
| 383,397 |
| 357,612 |
| 360,146 |
|
| Goodwill | 125,585 |
| 125,585 |
| 125,585 |
| 125,585 |
|
| Other intangible assets – net | 7,714 |
| 10,937 |
| 5,300 |
| 7,714 |
|
| Other assets | 405,962 |
| 385,016 |
| 353,853 |
| 405,962 |
|
| Total assets | $ | 20,649,367 |
| $ | 18,502,339 |
| $ | 22,159,589 |
| $ | 20,649,367 |
|
| LIABILITIES AND STOCKHOLDERS’ EQUITY | | |
| Deposits: | | |
| Non-interest bearing | $ | 5,377,549 |
| $ | 4,494,028 |
| $ | 6,299,903 |
| $ | 5,377,549 |
|
| Savings, interest checking and money market | 8,933,941 |
| 7,846,831 |
| 9,817,943 |
| 8,933,941 |
|
| Time open and C.D.’s of less than $100,000 | 1,166,104 |
| 1,465,050 |
| 1,074,618 |
| 1,166,104 |
|
| Time open and C.D.’s of $100,000 and over | 1,322,289 |
| 1,279,112 |
| 1,156,189 |
| 1,322,289 |
|
| Total deposits | 16,799,883 |
| 15,085,021 |
| 18,348,653 |
| 16,799,883 |
|
| Federal funds purchased and securities sold under agreements to repurchase | 1,256,081 |
| 982,827 |
| 1,083,550 |
| 1,256,081 |
|
| Other borrowings | 111,817 |
| 112,273 |
| 103,710 |
| 111,817 |
|
| Other liabilities | 311,225 |
| 298,754 |
| 452,102 |
| 311,225 |
|
| Total liabilities | 18,479,006 |
| 16,478,875 |
| 19,988,015 |
| 18,479,006 |
|
| Commerce Bancshares, Inc. stockholders’ equity: | | |
Preferred stock, $1 par value Authorized and unissued 2,000,000 shares | — |
| — |
| — |
| — |
|
Common stock, $5 par value Authorized 100,000,000 shares; issued 89,277,398 and 86,788,322 shares in 2011 and 2010, respectively | 446,387 |
| 433,942 |
| |
Common stock, $5 par value Authorized 100,000,000 shares; issued 91,729,235 and 89,277,398 shares in 2012 and 2011, respectively | | 458,646 |
| 446,387 |
|
| Capital surplus | 1,042,065 |
| 971,293 |
| 1,102,507 |
| 1,042,065 |
|
| Retained earnings | 575,419 |
| 555,778 |
| 477,210 |
| 575,419 |
|
| Treasury stock of 217,755 and 61,839 shares in 2011 and 2010, respectively, at cost | (8,362 | ) | (2,371 | ) | |
| Treasury stock of 196,922 and 217,755 shares in 2012 and 2011, respectively, at cost | | (7,580 | ) | (8,362 | ) |
| Accumulated other comprehensive income | 110,538 |
| 63,345 |
| 136,344 |
| 110,538 |
|
| Total Commerce Bancshares, Inc. stockholders’ equity | 2,166,047 |
| 2,021,987 |
| 2,167,127 |
| 2,166,047 |
|
| Non-controlling interest | 4,314 |
| 1,477 |
| 4,447 |
| 4,314 |
|
| Total equity | 2,170,361 |
| 2,023,464 |
| 2,171,574 |
| 2,170,361 |
|
| Total liabilities and equity | $ | 20,649,367 |
| $ | 18,502,339 |
| $ | 22,159,589 |
| $ | 20,649,367 |
|
See accompanying notes to consolidated financial statements.
Commerce Bancshares, Inc. and Subsidiaries
CONSOLIDATED STATEMENTS OF INCOME | | | | For the Years Ended December 31 | For the Years Ended December 31 |
| (In thousands, except per share data) | 2011 | 2010 | 2009 | 2012 | 2011 | 2010 |
| INTEREST INCOME | | |
| Interest and fees on loans | $ | 463,511 |
| $ | 507,666 |
| $ | 556,404 |
| $ | 446,331 |
| $ | 463,511 |
| $ | 507,666 |
|
| Interest on loans held for sale | 1,115 |
| 6,091 |
| 8,219 |
| 361 |
| 1,115 |
| 6,091 |
|
| Interest on investment securities | 219,348 |
| 212,697 |
| 223,860 |
| 211,682 |
| 219,348 |
| 212,697 |
|
| Interest on short-term federal funds sold and securities purchased under agreements to resell | 55 |
| 48 |
| 222 | 82 |
| 55 |
| 48 |
| Interest on long-term securities purchased under agreements to resell | 13,455 |
| 2,549 |
| — |
| 19,174 |
| 13,455 |
| 2,549 |
|
| Interest on deposits with banks | 487 |
| 427 |
| 807 | 339 |
| 487 |
| 427 |
| Total interest income | 697,971 |
| 729,478 |
| 789,512 |
| 677,969 |
| 697,971 |
| 729,478 |
|
| INTEREST EXPENSE | | |
| Interest on deposits: | | |
| Savings, interest checking and money market | 25,856 |
| 29,298 |
| 31,431 |
| 18,682 |
| 25,856 |
| 29,298 |
|
| Time open and C.D.’s of less than $100,000 | 11,352 |
| 22,871 |
| 51,982 |
| 7,918 |
| 11,352 |
| 22,871 |
|
| Time open and C.D.’s of $100,000 and over | 9,272 |
| 13,847 |
| 35,371 |
| 7,174 |
| 9,272 |
| 13,847 |
|
| Interest on federal funds purchased and securities sold under agreements to repurchase | 1,741 |
| 2,584 |
| 3,699 |
| 808 |
| 1,741 |
| 2,584 |
|
| Interest on other borrowings | 3,680 |
| 14,946 |
| 31,527 |
| 3,481 |
| 3,680 |
| 14,946 |
|
| Total interest expense | 51,901 |
| 83,546 |
| 154,010 |
| 38,063 |
| 51,901 |
| 83,546 |
|
| Net interest income | 646,070 |
| 645,932 |
| 635,502 |
| 639,906 |
| 646,070 |
| 645,932 |
|
| Provision for loan losses | 51,515 |
| 100,000 |
| 160,697 |
| 27,287 |
| 51,515 |
| 100,000 |
|
| Net interest income after provision for loan losses | 594,555 |
| 545,932 |
| 474,805 |
| 612,619 |
| 594,555 |
| 545,932 |
|
| NON-INTEREST INCOME | | |
| Bank card transaction fees | 157,077 |
| 148,888 |
| 122,124 |
| 154,197 |
| 157,077 |
| 148,888 |
|
| Trust fees | 88,313 |
| 80,963 |
| 76,831 |
| 94,679 |
| 88,313 |
| 80,963 |
|
| Deposit account charges and other fees | 82,651 |
| 92,637 |
| 106,362 |
| 79,485 |
| 82,651 |
| 92,637 |
|
| Bond trading income | 19,846 |
| 21,098 |
| 22,432 |
| |
| Capital market fees | | 21,066 |
| 19,846 |
| 21,098 |
|
| Consumer brokerage services | 10,018 |
| 9,190 |
| 10,831 |
| 10,162 |
| 10,018 |
| 9,190 |
|
| Loan fees and sales | 7,580 |
| 23,116 |
| 21,273 |
| 6,037 |
| 7,580 |
| 23,116 |
|
| Other | 27,432 |
| 29,219 |
| 36,406 |
| 34,004 |
| 27,432 |
| 29,219 |
|
| Total non-interest income | 392,917 |
| 405,111 |
| 396,259 |
| 399,630 |
| 392,917 |
| 405,111 |
|
| INVESTMENT SECURITIES GAINS (LOSSES), NET | | |
| Impairment (losses) reversals on debt securities | 2,190 |
| 13,058 |
| (32,783 | ) | |
| Noncredit-related losses (reversals) on securities not expected to be sold | (4,727 | ) | (18,127 | ) | 30,310 |
| |
| Impairment reversals on securities | | 11,223 |
| 2,190 |
| 13,058 |
|
| Noncredit-related reversals on securities not expected to be sold | | (12,713 | ) | (4,727 | ) | (18,127 | ) |
| Net impairment losses | (2,537 | ) | (5,069 | ) | (2,473 | ) | (1,490 | ) | (2,537 | ) | (5,069 | ) |
| Realized gains (losses) on sales and fair value adjustments | 13,349 |
| 3,284 |
| (4,722 | ) | |
| Realized gains on sales and fair value adjustments | | 6,318 |
| 13,349 |
| 3,284 |
|
| Investment securities gains (losses), net | 10,812 |
| (1,785 | ) | (7,195 | ) | 4,828 |
| 10,812 |
| (1,785 | ) |
| NON-INTEREST EXPENSE | | |
| Salaries and employee benefits | 345,325 |
| 346,550 |
| 345,779 |
| 360,899 |
| 345,325 |
| 346,550 |
|
| Net occupancy | 46,434 |
| 46,987 |
| 45,925 |
| 45,534 |
| 46,434 |
| 46,987 |
|
| Equipment | 22,252 |
| 23,324 |
| 25,472 |
| 20,147 |
| 22,252 |
| 23,324 |
|
| Supplies and communication | 22,448 |
| 27,113 |
| 32,156 |
| 22,321 |
| 22,448 |
| 27,113 |
|
| Data processing and software | 68,103 |
| 67,935 |
| 61,789 |
| 73,798 |
| 68,103 |
| 67,935 |
|
| Marketing | 16,767 |
| 18,161 |
| 18,231 |
| 15,106 |
| 16,767 |
| 18,161 |
|
| Deposit insurance | 13,123 |
| 19,246 |
| 27,373 |
| 10,438 |
| 13,123 |
| 19,246 |
|
| Debit overdraft litigation | 18,300 |
| — |
| — |
| — |
| 18,300 |
| — |
|
| Debt extinguishment | — |
| 11,784 |
| — |
| — |
| — |
| 11,784 |
|
| Indemnification obligation | (4,432 | ) | (4,405 | ) | (2,496 | ) | |
| Other | 68,929 |
| 74,439 |
| 67,508 |
| 70,226 |
| 64,497 |
| 70,034 |
|
| Total non-interest expense | 617,249 |
| 631,134 |
| 621,737 |
| 618,469 |
| 617,249 |
| 631,134 |
|
| Income before income taxes | 381,035 |
| 318,124 |
| 242,132 |
| 398,608 |
| 381,035 |
| 318,124 |
|
| Less income taxes | 121,412 |
| 96,249 |
| 73,757 |
| 127,169 |
| 121,412 |
| 96,249 |
|
| Net income | 259,623 |
| 221,875 |
| 168,375 |
| 271,439 |
| 259,623 |
| 221,875 |
|
| Less non-controlling interest expense (income) | 3,280 |
| 165 |
| (700 | ) | |
| Less non-controlling interest expense | | 2,110 |
| 3,280 |
| 165 |
|
| NET INCOME ATTRIBUTABLE TO COMMERCE BANCSHARES, INC. | $ | 256,343 |
| $ | 221,710 |
| $ | 169,075 |
| $ | 269,329 |
| $ | 256,343 |
| $ | 221,710 |
|
Net income per common share - basic | $ | 2.83 |
| $ | 2.41 |
| $ | 1.88 |
| $ | 2.91 |
| $ | 2.70 |
| $ | 2.30 |
|
Net income per common share - diluted | $ | 2.82 |
| $ | 2.40 |
| $ | 1.87 |
| $ | 2.90 |
| $ | 2.69 |
| $ | 2.29 |
|
See accompanying notes to consolidated financial statements.
Commerce Bancshares, Inc. and Subsidiaries
CONSOLIDATED STATEMENTS OF COMPREHENSIVE INCOME
|
| | | | | | | | | | |
| | | For the Years Ended December 31 |
| (In thousands) | | 2012 | 2011 | 2010 |
| Net income | | $ | 271,439 |
| $ | 259,623 |
| $ | 221,875 |
|
| Other comprehensive income (loss): | | | | |
| Available for sale debt securities for which a portion of an other-than-temporary impairment (OTTI) has been recorded in earnings: | | | | |
| Unrealized holding gains subsequent to initial OTTI recognition | | 12,203 |
| 5,184 |
| 22,973 |
|
| Income tax expense | | (4,637 | ) | (1,970 | ) | (8,730 | ) |
| Net unrealized gains on OTTI securities | | 7,566 |
| 3,214 |
| 14,243 |
|
| Other available for sale investment securities: | | | | |
| Unrealized holding gains | | 39,271 |
| 78,059 |
| 6,412 |
|
| Income tax expense on unrealized gains | | (14,927 | ) | (29,663 | ) | (2,470 | ) |
| Reclassification adjustment for gains included in net income | | (357 | ) | (177 | ) | (3,488 | ) |
| Reclassification adjustment for tax expense on gains included in net income | | 139 |
| 68 |
| 1,359 |
|
| Net unrealized gains on other securities | | 24,126 |
| 48,287 |
| 1,813 |
|
| Prepaid pension cost: | | | | |
| Amortization of accumulated pension loss | | 2,953 |
| 1,949 |
| 2,208 |
|
| Net loss arising during period | | (12,447 | ) | (8,898 | ) | (786 | ) |
| Income tax (expense) benefit on change in pension loss | | 3,608 |
| 2,641 |
| (540 | ) |
| Change in pension loss | | (5,886 | ) | (4,308 | ) | 882 |
|
| Other comprehensive income | | 25,806 |
| 47,193 |
| 16,938 |
|
| Comprehensive income | | 297,245 |
| 306,816 |
| 238,813 |
|
| Non-controlling interest expense | | (2,110 | ) | (3,280 | ) | (165 | ) |
| Comprehensive income attributable to Commerce Bancshares, Inc. | | $ | 295,135 |
| $ | 303,536 |
| $ | 238,648 |
|
See accompanying notes to consolidated financial statements.
Commerce Bancshares, Inc. and Subsidiaries
CONSOLIDATED STATEMENTS OF CASH FLOWS
| | | | For the Years Ended December 31 | For the Years Ended December 31 |
| (In thousands) | 2011 | 2010 | 2009 | 2012 | 2011 | 2010 |
| OPERATING ACTIVITIES | | |
| Net income | $ | 259,623 |
| $ | 221,875 |
| $ | 168,375 |
| $ | 271,439 |
| $ | 259,623 |
| $ | 221,875 |
|
| Adjustments to reconcile net income to net cash provided by operating activities: | | |
| Provision for loan losses | 51,515 |
| 100,000 |
| 160,697 |
| 27,287 |
| 51,515 |
| 100,000 |
|
| Provision for depreciation and amortization | 46,743 |
| 48,924 |
| 51,514 |
| 43,448 |
| 46,743 |
| 48,924 |
|
| Amortization of investment security premiums, net | 18,972 |
| 21,635 |
| 2,348 |
| 36,238 |
| 18,972 |
| 21,635 |
|
| Deferred income tax benefit | (2,836 | ) | (9,085 | ) | (7,310 | ) | |
| Deferred income tax (benefit) expense | | 16,234 |
| (2,836 | ) | (9,085 | ) |
| Investment securities (gains) losses, net | (10,812 | ) | 1,785 |
| 7,195 |
| (4,828 | ) | (10,812 | ) | 1,785 |
|
| Gain on sale of held to maturity student loans | — |
| (6,914 | ) | — |
| — |
| — |
| (6,914 | ) |
| Net gains on sales of loans held for sale | (2,040 | ) | (10,402 | ) | (12,201 | ) | (376 | ) | (2,040 | ) | (10,402 | ) |
| Proceeds from sales of loans held for sale | 87,732 |
| 635,743 |
| 577,726 |
| 22,720 |
| 87,732 |
| 635,743 |
|
| Originations of loans held for sale | (52,995 | ) | (344,360 | ) | (545,380 | ) | — |
| (52,995 | ) | (344,360 | ) |
| Net (increase) decrease in trading securities | 2,354 |
| (928 | ) | (14,014 | ) | (9,645 | ) | 2,354 |
| (928 | ) |
| Stock-based compensation | 4,731 |
| 6,021 |
| 6,642 |
| 5,001 |
| 4,731 |
| 6,021 |
|
| (Increase) decrease in interest receivable | (2,010 | ) | 12,041 |
| 2,943 |
| 3,149 |
| (2,010 | ) | 12,041 |
|
| Decrease in interest payable | (4,598 | ) | (9,462 | ) | (18,574 | ) | (1,272 | ) | (4,598 | ) | (9,462 | ) |
| Increase (decrease) in income taxes payable | 14,519 |
| 2,714 |
| (3,067 | ) | (13,395 | ) | 14,519 |
| 2,714 |
|
| Net tax benefit related to equity compensation plans | (1,065 | ) | (1,178 | ) | (557 | ) | (2,094 | ) | (1,065 | ) | (1,178 | ) |
| Prepayment of FDIC insurance premiums | — |
| — |
| (63,739 | ) | |
| Other changes, net | (2,472 | ) | 2,768 |
| (17,310 | ) | (10,794 | ) | (2,472 | ) | 2,768 |
|
| Net cash provided by operating activities | 407,361 |
| 671,177 |
| 295,288 |
| 383,112 |
| 407,361 |
| 671,177 |
|
| INVESTING ACTIVITIES | | |
| Net cash and cash equivalents paid in dispositions | — |
| — |
| (3,494 | ) | |
| Proceeds from sales of available for sale securities | 19,833 |
| 78,640 |
| 207,852 |
| 16,875 |
| 19,833 |
| 78,640 |
|
| Proceeds from maturities/pay downs of available for sale securities | 2,562,551 |
| 2,308,323 |
| 1,332,347 |
| 3,080,664 |
| 2,562,551 |
| 2,308,323 |
|
| Purchases of available for sale securities | (4,517,463 | ) | (3,217,600 | ) | (4,078,962 | ) | (3,182,857 | ) | (4,517,463 | ) | (3,217,600 | ) |
| Net decrease in loans | 168,983 |
| 644,314 |
| 999,086 |
| |
| Net (increase) decrease in loans | | (693,193 | ) | 168,983 |
| 644,314 |
|
| Long-term securities purchased under agreements to resell | (500,000 | ) | (450,000 | ) | — |
| (575,000 | ) | (500,000 | ) | (450,000 | ) |
| Repayments of long-term securities purchased under agreements to resell | 100,000 |
| — |
| — |
| 225,000 |
| 100,000 |
| — |
|
| Purchases of land, buildings and equipment | (21,332 | ) | (18,528 | ) | (29,247 | ) | (34,969 | ) | (21,332 | ) | (18,528 | ) |
| Sales of land, buildings and equipment | 2,593 |
| 397 |
| 151 |
| 2,643 |
| 2,593 |
| 397 |
|
| Net cash used in investing activities | (2,184,835 | ) | (654,454 | ) | (1,572,267 | ) | (1,160,837 | ) | (2,184,835 | ) | (654,454 | ) |
| FINANCING ACTIVITIES | | |
| Net increase in non-interest bearing, savings, interest checking and money market deposits | 1,981,201 |
| 1,300,555 |
| 2,041,513 |
| 1,777,058 |
| 1,981,201 |
| 1,300,555 |
|
| Net decrease in time open and C.D.’s | (255,769 | ) | (469,557 | ) | (693,941 | ) | (257,586 | ) | (255,769 | ) | (469,557 | ) |
| Long-term securities sold under agreements to repurchase | — |
| 400,000 |
| — |
| — |
| — |
| 400,000 |
|
| Repayment of long-term securities sold under agreements to repurchase | — |
| (500,000 | ) | — |
| — |
| — |
| (500,000 | ) |
| Net increase (decrease) in short-term federal funds purchased and securities sold under agreements to repurchase | 273,254 |
| (20,364 | ) | 76,654 |
| (172,531 | ) | 273,254 |
| (20,364 | ) |
| Additional other long-term borrowings | — |
| — |
| 100,000 |
| |
| Repayment of other long-term borrowings | (456 | ) | (623,789 | ) | (311,719 | ) | (8,107 | ) | (456 | ) | (623,789 | ) |
| Net decrease in other short-term borrowings | — |
| — |
| (800,000 | ) | |
| Purchases of treasury stock | (101,154 | ) | (40,984 | ) | (528 | ) | (104,909 | ) | (101,154 | ) | (40,984 | ) |
| Issuance of stock under open market stock sale program, stock purchase and equity compensation plans | 15,349 |
| 11,310 |
| 103,641 |
| |
| Issuance of stock under stock purchase and equity compensation plans | | 15,588 |
| 15,349 |
| 11,310 |
|
| Net tax benefit related to equity compensation plans | 1,065 |
| 1,178 |
| 557 |
| 2,094 |
| 1,065 |
| 1,178 |
|
| Cash dividends paid on common stock | (79,140 | ) | (78,231 | ) | (74,720 | ) | (211,608 | ) | (79,140 | ) | (78,231 | ) |
| Net cash provided by (used in) financing activities | 1,834,350 |
| (19,882 | ) | 441,457 |
| 1,039,999 |
| 1,834,350 |
| (19,882 | ) |
| Increase (decrease) in cash and cash equivalents | 56,876 |
| (3,159 | ) | (835,522 | ) | 262,274 |
| 56,876 |
| (3,159 | ) |
| Cash and cash equivalents at beginning of year | 460,675 |
| 463,834 |
| 1,299,356 |
| 517,551 |
| 460,675 |
| 463,834 |
|
| Cash and cash equivalents at end of year | $ | 517,551 |
| $ | 460,675 |
| $ | 463,834 |
| $ | 779,825 |
| $ | 517,551 |
| $ | 460,675 |
|
| Income tax payments, net | $ | 106,653 |
| $ | 100,610 |
| $ | 82,900 |
| $ | 119,166 |
| $ | 106,653 |
| $ | 100,610 |
|
| Interest paid on deposits and borrowings | $ | 56,499 |
| $ | 93,008 |
| $ | 172,608 |
| $ | 39,335 |
| $ | 56,499 |
| $ | 93,008 |
|
| Loans transferred to foreclosed real estate | $ | 22,957 |
| $ | 16,440 |
| $ | 12,857 |
| $ | 8,167 |
| $ | 22,957 |
| $ | 16,440 |
|
Commerce Bancshares, Inc. and Subsidiaries
CONSOLIDATED STATEMENTS OF CHANGES IN EQUITY
| | | | Commerce Bancshares, Inc. Shareholders | | Commerce Bancshares, Inc. Shareholders | |
| (In thousands, except per share data) | Common Stock | Capital Surplus | Retained Earnings | Treasury Stock | Accumulated Other Comprehensive Income (Loss) | Non-Controlling Interest | Total | Common Stock | Capital Surplus | Retained Earnings | Treasury Stock | Accumulated Other Comprehensive Income (Loss) | Non-Controlling Interest | Total |
| Balance, December 31, 2008 | $ | 379,505 |
| $ | 621,458 |
| $ | 633,159 |
| $ | (761 | ) | $ | (56,729 | ) | $ | 2,835 |
| $ | 1,579,467 |
| |
| Balance, December 31, 2009 | | $ | 415,637 |
| $ | 854,490 |
| $ | 568,532 |
| $ | (838 | ) | $ | 46,407 |
| $ | 1,677 |
| $ | 1,885,905 |
|
| Net income |
|
|
|
| 169,075 |
|
|
|
|
| (700 | ) | 168,375 |
|
|
|
|
| 221,710 |
|
|
|
|
| 165 |
| 221,875 |
|
| Change in unrealized gain (loss) related to available for sale securities for which a portion of an other-than-temporary impairment has been recorded in earnings, net of tax |
|
|
|
|
|
|
|
| 7,596 |
|
|
| 7,596 |
| |
| Change in unrealized gain (loss) on all other available for sale securities, net of tax |
|
|
|
|
|
|
|
| 93,075 |
|
|
| 93,075 |
| |
| Change related to pension plan, net of tax |
|
|
|
|
|
|
|
| 2,465 |
|
|
| 2,465 |
| |
| Total comprehensive income | | 271,511 |
| |
| Other comprehensive income | | | 16,938 |
| | 16,938 |
|
| Distributions to non-controlling interest |
|
|
|
|
|
|
|
|
|
| (458 | ) | (458 | ) |
|
|
|
|
|
|
|
|
|
| (365 | ) | (365 | ) |
| Purchase of treasury stock |
|
|
|
|
|
| (528 | ) |
|
|
|
| (528 | ) |
|
|
|
|
|
| (40,984 | ) |
|
|
|
| (40,984 | ) |
| Cash dividends paid ($.829 per share) |
|
|
|
| (74,720 | ) |
|
|
|
|
|
| (74,720 | ) | |
| Net tax benefit related to equity compensation plans |
|
| 557 |
|
|
|
|
|
|
|
|
| 557 |
| |
| Stock-based compensation | | 6,642 |
|
|
|
|
|
|
|
|
| 6,642 |
| |
| Issuance under stock purchase and equity compensation plans, net | 1,910 |
| 3,127 |
|
|
| 451 |
|
|
|
|
| 5,488 |
| |
| Issuance of stock under open market sale program | 14,474 |
| 83,679 |
|
|
|
|
|
|
|
|
| 98,153 |
| |
| 5% stock dividend, net | 19,748 |
| 139,027 |
| (158,982 | ) |
|
|
|
|
|
| (207 | ) | |
| Balance, December 31, 2009 | 415,637 |
| 854,490 |
| 568,532 |
| (838 | ) | 46,407 |
| 1,677 |
| 1,885,905 |
| |
| Net income |
| 221,710 |
|
| 165 | 221,875 |
| |
| Change in unrealized gain (loss) related to available for sale securities for which a portion of an other-than-temporary impairment has been recorded in earnings, net of tax |
| 14,243 |
|
| 14,243 |
| |
| Change in unrealized gain (loss) on all other available for sale securities, net of tax |
| 1,813 |
|
| 1,813 |
| |
| Change related to pension plan, net of tax |
| 882 |
| 882 | |
| Total comprehensive income | | 238,813 |
| |
| Distributions to non-controlling interest |
| (365 | ) | (365 | ) | |
| Purchase of treasury stock |
| (40,984 | ) |
| (40,984 | ) | |
| Cash dividends paid ($.853 per share) |
| (78,231 | ) |
| (78,231 | ) | |
| Cash dividends paid ($.812 per share) | |
|
|
|
| (78,231 | ) |
|
|
|
|
|
| (78,231 | ) |
| Net tax benefit related to equity compensation plans |
| 1,178 |
|
| | 1,178 |
|
|
| 1,178 |
|
|
|
|
|
|
|
|
| 1,178 |
|
| Stock-based compensation |
| 6,021 |
|
| 6,021 |
|
|
| 6,021 |
|
|
|
|
|
|
|
|
| 6,021 |
|
| Issuance under stock purchase and equity compensation plans, net | 2,196 |
| 3,102 |
|
| 6,012 |
|
| 11,310 |
| 2,196 |
| 3,102 |
|
|
| 6,012 |
|
|
|
|
| 11,310 |
|
| 5% stock dividend, net | 16,109 |
| 106,502 |
| (156,233 | ) | 33,439 |
|
| (183 | ) | 16,109 |
| 106,502 |
| (156,233 | ) | 33,439 |
|
|
|
|
| (183 | ) |
| Balance, December 31, 2010 | 433,942 |
| 971,293 |
| 555,778 |
| (2,371 | ) | 63,345 |
| 1,477 |
| 2,023,464 |
| 433,942 |
| 971,293 |
| 555,778 |
| (2,371 | ) | 63,345 |
| 1,477 |
| 2,023,464 |
|
| Net income |
|
|
|
| 256,343 |
|
|
|
|
| 3,280 |
| 259,623 |
|
| 256,343 |
|
| 3,280 |
| 259,623 |
|
| Change in unrealized gain (loss) related to available for sale securities for which a portion of an other-than-temporary impairment has been recorded in earnings, net of tax |
|
|
|
|
|
|
|
| 3,214 |
|
|
| 3,214 |
| |
| Change in unrealized gain (loss) on all other available for sale securities, net of tax |
|
|
|
|
|
|
|
| 48,287 |
|
|
| 48,287 |
| |
| Change related to pension plan, net of tax |
|
|
|
|
|
|
|
| (4,308 | ) |
|
| (4,308 | ) | |
| Total comprehensive income |
|
|
|
|
|
|
|
|
|
|
|
| 306,816 |
| |
| Other comprehensive income | | | 47,193 |
| | 47,193 |
|
| Distributions to non-controlling interest |
|
|
|
|
|
|
|
|
|
| (443 | ) | (443 | ) |
| (443 | ) | (443 | ) |
| Purchase of treasury stock |
|
|
|
|
|
| (101,154 | ) |
|
|
|
| (101,154 | ) |
| (101,154 | ) |
| (101,154 | ) |
| Cash dividends paid ($.876 per share) |
|
|
|
| (79,140 | ) |
|
|
|
|
|
| (79,140 | ) | |
| Cash dividends paid ($.834 per share) | |
| (79,140 | ) |
| (79,140 | ) |
| Net tax benefit related to equity compensation plans |
|
| 1,065 |
|
|
| |
|
|
|
| 1,065 |
|
| 1,065 |
|
| 1,065 |
|
| Stock-based compensation |
|
| 4,731 |
|
|
|
|
|
|
|
|
| 4,731 |
|
| 4,731 |
|
| 4,731 |
|
| Issuance under stock purchase and equity compensation plans, net | 2,539 |
| 4,061 |
|
|
| 8,749 |
|
|
|
|
| 15,349 |
| 2,539 |
| 4,061 |
|
| 8,749 |
|
| 15,349 |
|
| 5% stock dividend, net | 9,906 |
| 60,915 |
| (157,562 | ) | 86,414 |
|
|
|
|
| (327 | ) | 9,906 |
| 60,915 |
| (157,562 | ) | 86,414 |
|
| (327 | ) |
| Balance, December 31, 2011 | $ | 446,387 |
| $ | 1,042,065 |
| $ | 575,419 |
| $ | (8,362 | ) | $ | 110,538 |
| $ | 4,314 |
| $ | 2,170,361 |
| 446,387 |
| 1,042,065 |
| 575,419 |
| (8,362 | ) | 110,538 |
| 4,314 |
| 2,170,361 |
|
| Net income | |
|
|
|
| 269,329 |
|
|
|
|
| 2,110 |
| 271,439 |
|
| Other comprehensive income | |
|
|
|
|
|
|
|
| 25,806 |
|
|
| 25,806 |
|
| Distributions to non-controlling interest | |
|
|
|
|
|
|
|
|
|
| (1,977 | ) | (1,977 | ) |
| Purchase of treasury stock | |
|
|
|
|
|
| (104,909 | ) |
|
|
|
| (104,909 | ) |
| Cash dividends paid ($2.305 per share) | |
|
|
|
| (211,608 | ) |
|
|
|
|
|
| (211,608 | ) |
| Net tax benefit related to equity compensation plans | |
|
| 2,094 |
|
|
|
|
|
|
|
|
| 2,094 |
|
| Stock-based compensation | |
|
| 5,001 |
|
|
|
|
|
|
|
|
| 5,001 |
|
| Issuance under stock purchase and equity compensation plans, net | |
|
| (16,905 | ) |
|
| 32,493 |
|
|
|
|
| 15,588 |
|
| 5% stock dividend, net | | 12,259 |
| 70,252 |
| (155,930 | ) | 73,198 |
|
|
|
|
| (221 | ) |
| Balance, December 31, 2012 | | $ | 458,646 |
| $ | 1,102,507 |
| $ | 477,210 |
| $ | (7,580 | ) | $ | 136,344 |
| $ | 4,447 |
| $ | 2,171,574 |
|
See accompanying notes to consolidated financial statements.
Commerce Bancshares, Inc. and Subsidiaries
NOTES TO CONSOLIDATED FINANCIAL STATEMENTS 1. Summary of Significant Accounting Policies
Nature of Operations
Commerce Bancshares, Inc. and its subsidiaries (the Company) conducts its principal activities from approximately 360 locations throughout Missouri, Illinois, Kansas, Oklahoma and Colorado. Principal activities include retail and commercial banking, investment management, securities brokerage, mortgage banking, credit related insurance and private equity investment activities.
Basis of Presentation
The Company follows accounting principles generally accepted in the United States of America (GAAP) and reporting practices applicable to the banking industry. The preparation of financial statements under GAAP requires management to make estimates and assumptions that affect the amounts reported in the financial statements and notes. These estimates are based on information available to management at the time the estimates are made. While the consolidated financial statements reflect management’s best estimates and judgments, actual results could differ from those estimates. The consolidated financial statements include the accounts of the Company and its majority-owned subsidiaries (after elimination of all material intercompany balances and transactions). Certain amounts for prior years have been reclassified to conform to the current year presentation. Such reclassifications had no effect on net income or total assets.
Cash and Cash Equivalents
In the accompanying consolidated statements of cash flows, cash and cash equivalents include “Cash and due from banks”, “Short-term federal funds sold and securities purchased under agreements to resell”, and “Interest earning deposits with banks” as segregated in the accompanying consolidated balance sheets.
Loans and Related Earnings
Loans that management has the intent and ability to hold for the foreseeable future or until maturity or pay-off are reported at their outstanding principal balances, net of undisbursed loan proceeds, the allowance for loan losses, and any deferred fees and costs on originated loans. Origination fee income received on loans and amounts representing the estimated direct costs of origination are deferred and amortized to interest income over the life of the loan using the interest method. Prepayment premium or yield maintenance agreements are generally required on all term commercial loans with fixed rate intervals of three3 years or more.
Interest on loans is accrued based upon the principal amount outstanding. Interest income is recognized primarily on the level yield method. Loan and commitment fees, net of costs, are deferred and recognized in income over the term of the loan or commitment as an adjustment of yield. Annual fees charged on credit card loans are capitalized to principal and amortized over 12 months to loan fees and sales in the accompanying consolidated income statements.sales. Other credit card fees, such as cash advance fees and late payment fees, are recognized in income as an adjustment of yield when charged to the cardholder’s account.
Non-Accrual Loans
Loans are placed on non-accrual status when management does not expect to collect payments consistent with acceptable and agreed upon terms of repayment. Business, construction real estate, business real estate, and personal real estate loans that are contractually 90 days past due as to principal and/or interest payments are generally placed on non-accrual, unless they are both well-secured and in the process of collection. Consumer, revolving home equity and credit card loans are exempt under regulatory rules from being classified as non-accrual. When a loan is placed on non-accrual status, any interest previously accrued but not collected is reversed against current income, and the loan is charged off to the extent uncollectible. Principal and interest payments received on non-accrual loans are generally applied to principal. Interest is included in income only after all previous loan charge-offs have been recovered and is recorded only as received. The loan is returned to accrual status only when the borrower has brought all past due principal and interest payments current, and, in the opinion of management, the borrower has demonstrated the ability to make future payments of principal and interest as scheduled. A six month history of sustained payment performance is generally required before reinstatement of accrual status.
Restructured Loans
A loan is accounted for as a troubled debt restructuring if the Company, for economic or legal reasons related to the borrowers’ financial difficulties, grants a concession to the borrower that it would not otherwise consider. A troubled debt restructuring typically involves a(1) modification of terms such as a reduction of the stated interest rate, or face amount of the loan a reduction ofprincipal, or accrued interest, or an extension of the maturity date(2) a loan renewal at a stated interest rate lower than the current market rate for a new loan with similar risk.risk, or (3) debt that was not reaffirmed in bankruptcy. Business, business real estate, construction real estate and personal real estate troubled debt restructurings with impairment charges are placed on non-accrual status. The Company measures the impairment loss of a troubled debt restructuring based onin the difference between the original loan’s carrying amount and the present value of expected future cash flows discounted at the original, contractual rate of the loan. Business, business real estate, construction real estate and personal real estate loans whose terms have been modified in a troubled debt restructuring with impairment charges are generally placed on non-accrual status. Other loans identifiedsame manner as troubleddescribed below. Troubled debt restructurings were so designated because they were renewed at interest rates that were not deemed to represent current market rates for debt of similar risk. These loanswhich are performing under their modifiedcontractual terms andcontinue to accrue interest continues to be accrued andwhich is recognized in income. Troubled debt restructurings also include certain credit card loans which have been modified under various debt management and assistance programs.current earnings.
Impaired Loans
Loans are evaluated regularly by management for impairment. Included in impaired loans are all non-accrual loans, as well as loans whose termsthat have been modified in aclassified as troubled debt restructuring, as discussed above.restructurings. Once a loan has been identified as impaired, impairment is measured based on either the present value of the expected future cash flows at the loan’s initial effective interest rate or the fair value of the collateral if collateral dependent. Factors considered in determining impairment include delinquency status, cash flow analysis, credit analysis, and collateral value and availability.
Loans Held for Sale
Loans held for sale include student loans and certain fixed rate residential mortgage loans. These loans are typically classified as held for sale upon origination based upon management’s intent to sell all the production of these loans. They are carried at the lower of aggregate cost or fair value. Fair value is determined based on prevailing market prices for loans with similar characteristics, sale contract prices, or, for those portfolios for which management has concerns about contractual performance, discounted cash flow analyses. Declines in fair value below cost (and subsequent recoveries) are recognized in loan fees and sales. Deferred fees and costs related to these loans are not amortized but are recognized as part of the cost basis of the loan at the time it is sold. Gains or losses on sales are recognized upon delivery and included in loan fees and sales.
Allowance/Provision for Loan Losses
The allowance for loan losses is maintained at a level believed to be appropriate by management to provide for probable loan losses inherent in the portfolio as of the balance sheet date, including losses on known or anticipated problem loans as well as for loans which are not currently known to require specific allowances. Management has established a process to determine the amount of the allowance for loan losses which assesses the risks and losses inherent in its portfolio. Business, construction real estate and business real estate loans are normally larger and more complex, and their collection rates are harder to predict. These loans are more likely to be collateral dependent and are allocated a larger reserve, due to their potential volatility. Personal real estate, credit card, consumer and revolving home equity loans are individually smaller and perform in a more homogenous manner, making loss estimates more predictable. Management’s process provides an allowance consisting of a specific allowance component based on certain individually evaluated loans and a general component based on estimates of reserves needed for pools of loans.
Loans subject to individual evaluation generally consist of business, construction real estate, business real estate and personal real estate loans on non-accrual status. These impaired loans are evaluated individually for the impairment of repayment potential and collateral adequacy, and in conjunction with current economic conditions and loss experience, allowances are estimated. Certain otherOther impaired loans identified as performing troubled debt restructurings are collectively evaluated because they have similar risk characteristics. Loans which have not been identified as impaired are segregated by loan type and sub-type and are collectively evaluated. Reserves calculated for these loan pools are estimated using a consistent methodology that considers historical loan loss experience by loan type, delinquencies, current economic factors, loan risk ratings and industry concentrations.
The Company’s estimate of the allowance for loan losses and the corresponding provision for loan losses is based on various judgments and assumptions made by management. The amount of the allowance for loan losses is highly dependent on management’s estimates affecting valuation, appraisal of collateral, evaluation of performance and status, and the amount and timing of future cash flows expected to be received on impaired loans. Factors that influence these judgments include past loan loss experience, current loan portfolio composition and characteristics, trends in portfolio risk ratings, levels of non-performing assets, prevailing regional and national economic conditions, and the Company’s ongoing loan review process.
The estimates, appraisals, evaluations, and cash flows utilized by management may be subject to frequent adjustments due to changing economic prospects of borrowers or properties. These estimates are reviewed periodically and adjustments, if necessary, are recorded in the provision for loan losses in the periods in which they become known.
Loans, or portions of loans, are charged off to the extent deemed uncollectible. Loan charge-offs reduce the allowance for loan losses, and recoveries of loans previously charged off are added back to the allowance. Business, business real estate, construction real estate and personal real estate loans are generally charged down to estimated collectible balances when they are placed on non-accrual status. Consumer loans and related accrued interest are normally charged down to the fair value of related collateral (or are charged off in full if no collateral) once the loans are more than 120 days delinquent. Credit card loans are charged off against the allowance for loan losses when the receivable is more than 180 days past due. The interest and fee income previously capitalized but not collected on credit card charge-offs is reversed against interest income.
Operating, Direct Financing and Sales Type Leases
The net investment in direct financing and sales type leases is included in loans on the Company’s consolidated balance sheets and consists of the present values of the sum of the future minimum lease payments and estimated residual value of the leased asset. Revenue consists of interest earned on the net investment and is recognized over the lease term as a constant percentage return thereon. The net investment in operating leases is included in other assets on the Company’s consolidated balance sheets. It is carried at cost, less the amount depreciated to date. Depreciation is recognized, on the straight-line basis, over the lease term to the estimated residual value. Operating lease revenue consists of the contractual lease payments and is recognized over the lease term in other non-interest income. Estimated residual values are established at lease inception utilizing contract terms, past customer experience, and general market data and are reviewed and adjusted, if necessary, on an annual basis.
Investments in Debt and Equity Securities
The Company has classified the majority of its investment portfolio as available for sale. From time to time, the Company sells securities and utilizes the proceeds to reduce borrowings, fund loan growth, or modify its interest rate profile. Securities classified as available for sale are carried at fair value. Changes in fair value, excluding certain losses associated with other-than-temporary impairment (OTTI), are reported in other comprehensive income (loss), a component of stockholders’ equity. Securities are periodically evaluated for OTTI in accordance with guidance provided in ASC 320-10-35. For securities with OTTI, the entire loss in fair value is required to be recognized in current earnings if the Company intends to sell the securities or believes it likely that it will be required to sell the security before the anticipated recovery. If neither condition is met, but the Company does not expect to recover the amortized cost basis, the Company determines whether a credit loss has occurred, and the loss is then recognized in current earnings. The noncredit-related portion of the overall loss is reported in other comprehensive income (loss). Mortgage and asset-backed securities whose credit ratings are below AA at their purchase date are evaluated for OTTI under ASC 325-40-35, which requires evaluations for OTTI at purchase date and in subsequent periods. Gains and losses realized upon sales of securities are calculated using the specific identification method and are included in Investment securities gains (losses), net, in the consolidated statements of income. Premiums and discounts are amortized to interest income over the estimated lives of the securities. Prepayment experience is continually evaluated to determine the appropriate estimate of the future rate of prepayment. When a change in a bond's estimated remaining life is necessary, a corresponding adjustment is made in the related amortization of premium or discount accretion.
Non-marketable securities include certain private equity investments, consisting of both debt and equity instruments. These securities are carried at fair value in accordance with ASC 946-10-15, with changes in fair value reported in current earnings. In the absence of readily ascertainable market values, fair value is estimated using internally developed models. Changes in fair value and gains and losses from sales are included in Investment securities gains (losses), net. Other non-marketable securities acquired for debt and regulatory purposes are accounted for at cost.
Trading account securities, which are bought and held principally for the purpose of resale in the near term, are carried at fair value. Gains and losses, both realized and unrealized, are recorded in non-interest income.
Purchases and sales of securities are recognized on a trade date basis. A receivable or payable is recognized for pending transaction settlements.
Securities Purchased under Agreements to Resell and Securities Sold under Agreements to Repurchase
The Company periodically enters into investments of securities under agreements to resell with large financial institutions. These agreements are accounted for as collateralized financing transactions. Securities pledged by the counterparties to secure these agreements are delivered to a third party custodian. Collateral is valued daily, and the Company may require counterparties to deposit additional collateral, or the Company may return collateral pledged when appropriate to maintain full collateralization
for these transactions. At December 31, 20112012, the Company had entered into $850.0 million$1.2 billion of long-term agreements to resell and had accepted securities valued at $894.4 million$1.3 billion as collateral.
Securities sold under agreements to repurchase are offered to cash management customers as an automated, collateralized investment account and totaled $702.8$659.0 million at December 31, 2011.2012. Securities sold are also used by the Bank to obtain additional borrowed funds at favorable rates, and at December 31, 20112012, such securities sold totaled $400.0$400.0 million of long-term structured repurchase agreements. As of December 31, 20112012, the Company had pledged $2.0$2.1 billion of available for sale securities as collateral for repurchase agreements.
As permitted by current accounting guidance, the Company offsets certain securities purchased under agreements to resell against securities sold under agreements to repurchase in its balance sheet presentation. These agreements, which are not included in the balance sheet amounts above, are further discussed in Note 3, Investment Securities.
Land, Buildings and Equipment
Land is stated at cost, and buildings and equipment are stated at cost, including capitalized interest when appropriate, less accumulated depreciation. Depreciation is computed using straight-line and accelerated methods. The Company generally assigns depreciable lives of 30 years for buildings, 10 years for building improvements, and 3 to 8 years for equipment. Leasehold improvements are amortized over the shorter of their estimated useful lives or remaining lease terms. Maintenance and repairs are charged to non-interest expense as incurred.
Foreclosed Assets
Foreclosed assets consist of property that has been repossessed and is comprised of commercial and residential real estate and other non-real estate property, including auto and recreational and marine vehicles. The assets are initially recorded at the lower of the loan balance or fair value less estimated selling costs, with anycosts. Initial valuation adjustments are charged to the allowance for loan losses. Fair values are estimated primarily based on appraisals, when availablethird-party price opinions, or quoted market prices of liquid assets.internally developed pricing models. After their initial recognition, foreclosed assets are valued at the lower of the amount recorded at acquisition date or the current fair value less estimated costs to sell. Any resultingestimates are updated periodically, and the assets may be marked down further, reflecting a new cost basis. These valuation adjustments, in addition to gains and losses realized on sales and net operating expenses, are recorded in other non-interest expense.
Intangible Assets
Goodwill and intangible assets that have indefinite useful lives are not amortized but are tested annually for impairment. Intangible assets that have finite useful lives, such as core deposit intangibles and mortgage servicing rights, are amortized over their estimated useful lives. Core deposit intangibles are amortized over periods of 8 to 14 years, representing their estimated lives, using accelerated methods. Mortgage servicing rights are amortized in proportion to and over the period of estimated net servicing income, considering appropriate prepayment assumptions.
When facts and circumstances indicate potential impairment of amortizable intangible assets, the Company evaluates the recoverability of the asset carrying value, using estimates of undiscounted future cash flows over the remaining asset life. Any impairment loss is measured by the excess of carrying value over fair value. Goodwill impairment tests are performed on an annual basis or when events or circumstances dictate. In these tests, the fair value of each reporting unit, or segment, is compared to the carrying amount of that reporting unit in order to determine if impairment is indicated. If so, the implied fair value of the reporting unit’s goodwill is compared to its carrying amount, and the impairment loss is measured by the excess of the carrying value over fair value. There has been no impairment resulting from goodwill impairment tests. However, adverse changes in the economic environment, operations of the reporting unit, or other factors could result in a decline in the implied fair value.
Income Taxes
Amounts provided for income tax expense are based on income reported for financial statement purposes and do not necessarily represent amounts currently payable under tax laws. Deferred income taxes are provided for temporary differences between the financial reporting bases and income tax bases of the Company’s assets and liabilities, net operating losses, and tax credit carryforwards. Deferred tax assets and liabilities are measured using the enacted tax rates that are expected to apply to taxable income when such assets and liabilities are anticipated to be settled or realized. The effect on deferred tax assets and liabilities of a change in tax rates is recognized as tax expense or benefit in the period that includes the enactment date of the change. In determining the amount of deferred tax assets to recognize in the financial statements, the Company evaluates the likelihood of realizing such benefits in future periods. A valuation allowance is established if it is more likely than not that all or some portion of the deferred tax asset will not be realized. The Company recognizes interest and penalties related to income taxes within income tax expense in the consolidated statements of income.
The Company and its eligible subsidiaries file a consolidated federal income tax return. State and local income tax returns are filed on a combined, consolidated or separate return basis based upon each jurisdiction’s laws and regulations.
Derivatives
The Company is exposed to market risk, including changes in interest rates and currency exchange rates. To manage the volatility relating to these exposures, the Company’s risk management policies permit its use of derivative products. The Company manages potential credit exposure through established credit approvals, risk control limits and other monitoring procedures. The Company uses derivatives on a limited basis mainly to stabilize interest rate margins and hedge against interest rate movements. The Company more often manages normal asset and liability positionsAs required by altering the products it offers and by selling portions of specific loan or investment portfolios as necessary.
Derivativecurrent accounting guidance, requires that all derivative financial instruments be recordedderivatives are carried at fair value on the balance sheet atsheet. Accounting for changes in the fair value withof derivatives (gains and losses) differs depending on whether a qualifying hedge relationship has been designated and on the adjustmenttype of hedge relationship. Derivatives used to hedge the exposure to change in the fair value recorded in current earnings. Derivatives thatof an asset, liability, or firm commitment attributable to a particular risk are part of a qualifying hedging relationship under ASC 815-20-25 can be designated, based on the exposure being hedged, asconsidered fair value or cash flow hedges. Under the fair value hedging model, gains or losses attributable to the change in fair value of the derivative, as well as gains and losses attributable to the change in fair value of the hedged item, are recognized in current earnings. Derivatives used to hedge the exposure to variability in expected future cash flows, or other types of forecasted transactions, are considered cash flow hedges. Under the cash flow hedging model, the effective portion of the gain or loss related to the derivative is recognized as a component of other comprehensive income.income and reclassified to earnings in the same period in which the hedged transaction affects earnings. The ineffective portion is recognized in current earnings. For derivatives that are not part of a hedging relationship, any gain or loss is recognized immediately in current earnings.
The Company formally documents all hedging relationships between hedging instruments and the hedged item, as well as its risk management objective. At December 31, 20112012, the Company had three interest rate swaps designated as fair value hedges. The Company performs quarterly assessments, using the regression method, to determine whether the hedging relationship has been highly effective in offsetting changes in fair values.
Derivative contractsOther derivatives held by the Company do not qualify for hedge accounting, and gains and losses on these derivatives, as mentioned above, are alsorecognized in current earnings. These include interest rate swaps and caps, which are offered to customers to assist in hedgingmanaging their risks of adverse changes in interest rates and foreign exchange rates. The Company serves as an intermediary between its customers and the markets. Each contract between the Company and its customersa customer is offset by a contract between the Company and various counterparties. These contracts do not qualify for hedge accounting. They are carried at fair value, with changes in fair value recorded in other non-interest income. As each customer contract is paired with an offsetting contract,institutional counterparty, thus minimizing the impactCompany's exposure to net income is minimized.
The Company enters into interest rate lock commitments on mortgage loans, which are commitments to originate loans whereby the interest rate on the loan is determined prior to funding.changes. The Company also has corresponding forward salesenters into certain contracts, relatedknown as credit risk participation agreements, to thesebuy or sell credit protection on specific interest rate lock commitments.swaps. It also purchases and sells forward foreign exchange contracts, either in connection with customer transactions, or for its own trading purposes. In addition, in previous years the Company's general practice was to sell fixed rate mortgage loans in the secondary market. Both the mortgage loan commitments and the related sales contracts arewere accounted for as derivatives and carried at fair value, with changes in fair value recorded in loan fees and sales. Fair values are based upon quoted prices, and fair value measurements of mortgage loan commitments include the value of loan servicing rights.derivatives.
The Company has master netting arrangements with various counterparties but does not offset derivative assets and liabilities under these arrangements in its consolidated balance sheet.
Additional information about derivatives held by the Company and valuation methods employed is provided in Note 15, Fair Value Measurements and Note 17, Derivative Instruments.
Pension Plan
The Company’s pension plan is described in Note 9, Employee Benefit Plans. The funded status of the plan is recognized as an asset or liability in the consolidated balance sheet, and changes in that funded status are recognized in the year in which the changes occur through other comprehensive income. Plan assets and benefit obligations are measured as of fiscal year end. The measurement of the projected benefit obligation and pension expense involve actuarial valuation methods and the use of various actuarial and economic assumptions. The Company monitors the assumptions and updates them periodically. Due to the long-term nature of the pension plan obligation, actual results may differ significantly from estimations. Such differences are adjusted over time as the assumptions are replaced by facts and values are recalculated.
Stock-Based Compensation
The Company’s stock-based employee compensation plan is described in Note 10, Stock-Based Compensation and Directors Stock Purchase Plan. In accordance with the requirements of ASC 718-10-30-3 and 35-2, the Company measures the cost of stock-based compensation based on the grant-date fair value of the award, recognizing the cost over the requisite service period. The fair value of an award is estimated using the Black-Scholes option-pricing model. The expense recognized is based on an estimation of the number of awards for which the requisite service is expected to be rendered and is included in salaries and employee benefits in the accompanying consolidated statements of income.
Treasury Stock
Purchases of the Company’s common stock are recorded at cost. Upon re-issuance for acquisitions, exercises of stock-based awards or other corporate purposes, treasury stock is reduced based upon the average cost basis of shares held.
Income per Share
Basic income per share is computed using the weighted average number of common shares outstanding during each year. Diluted income per share includes the effect of all dilutive potential common shares (primarily stock options and stock appreciation rights) outstanding during each year. The Company applies the two-class method of computing income per share. The two-class method is an earnings allocation formula that determines income per share for common stock and for participating securities, according to dividends declared and participation rights in undistributed earnings. The Company’s restricted share awards are considered to be a class of participating security. All per share data has been restated to reflect the 5% stock dividend distributed in December 20112012.
2. Loans and Allowance for Loan Losses
Major classifications within the Company’s held to maturity loan portfolio at December 31, 20112012 and 20102011 are as follows:
| | | (In thousands) | 2011 | 2010 | 2012 | 2011 |
| Commercial: | | |
| Business | $ | 2,808,265 |
| $ | 2,957,043 |
| $ | 3,134,801 |
| $ | 2,808,265 |
|
| Real estate — construction and land | 386,598 |
| 460,853 |
| 355,996 |
| 386,598 |
|
| Real estate — business | 2,180,100 |
| 2,065,837 |
| 2,214,975 |
| 2,180,100 |
|
| Personal Banking: | | |
| Real estate — personal | 1,428,777 |
| 1,440,386 |
| 1,584,859 |
| 1,428,777 |
|
| Consumer | 1,114,889 |
| 1,164,327 |
| 1,289,650 |
| 1,114,889 |
|
| Revolving home equity | 463,587 |
| 477,518 |
| 437,567 |
| 463,587 |
|
| Consumer credit card | 788,701 |
| 831,035 |
| 804,245 |
| 788,701 |
|
| Overdrafts | 6,561 |
| 13,983 |
| 9,291 |
| 6,561 |
|
| Total loans | $ | 9,177,478 |
| $ | 9,410,982 |
| $ | 9,831,384 |
| $ | 9,177,478 |
|
Loans to directors and executive officers of the Parent and its significant subsidiaries, and to their associates, are summarized as follows:
| | | (In thousands) | | |
| Balance at January 1, 2011 | $ | 66,974 |
| |
| Balance at January 1, 2012 | | $ | 62,788 |
|
| Additions | 263,047 |
| 289,843 |
|
| Amounts collected | (267,233 | ) | (291,094 | ) |
| Amounts written off | — |
| — |
|
| Balance, December 31, 2011 | $ | 62,788 |
| |
| Balance, December 31, 2012 | | $ | 61,537 |
|
Management believes all loans to directors and executive officers have been made in the ordinary course of business with normal credit terms, including interest rate and collateral considerations, and do not represent more than a normal risk of collection. There were no outstanding loans at December 31, 20112012 to principal holders (over 10% ownership) of the Company’s common stock.
The Company’s lending activity is generally centered in Missouri, Illinois, Kansas and other nearby states including Iowa, Oklahoma, Colorado, Iowa, Ohio, and others. The Company maintains a diversified portfolio with limited industry concentrations of credit risk. Loans and loan commitments are extended under the Company’s normal credit standards, controls, and monitoring features. Most loan commitments are short or intermediate term in nature. LoanCommercial loan maturities with the exception of residential mortgages, generally do not exceed fiverange from three to seven years. Collateral is commonly required and would include such assets as marketable securities and cash equivalent assets, accounts receivable and inventory, equipment, other forms of personal property, and real estate. At December 31, 20112012, unfunded loan commitments totaled $7.68.4 billion (which included $3.53.9 billion in unused approved lines of credit related to credit card loan agreements) which could be drawn by customers subject to certain review and terms of agreement. At December 31, 20112012, loans oftotaling $3.13.3 billion were pledged at the FHLB as collateral for borrowings and letters of credit obtained to secure public deposits. Additional loans of $1.2 billion were pledged at the Federal Reserve Bank as collateral for discount window borrowings.
The Company has a net investment in direct financing and sales type leases of $241.8311.6 million and $243.5241.8 million at December 31, 20112012 and 20102011, respectively, which is included in business loans on the Company’s consolidated balance sheets. This investment includes deferred income of $20.823.6 million and $25.420.8 million at December 31, 20112012 and 20102011, respectively. The net investment in operating leases amounted to $20.121.1 million and $10.820.1 million at December 31, 20112012 and 20102011, respectively, and is included in other assets on the Company’s consolidated balance sheets.
Allowance for loan losses
A summary of the activity in the allowance for losses during the yearyears ended December 31, 2012 and 2011 follows:
| | | | | | | | | | 2012 | | 2011 |
| (In thousands) | Commercial | Personal Banking | Total | Commercial | Personal Banking | Total | | Commercial | Personal Banking | Total |
| Balance at January 1, 2011 | $ | 119,946 |
| $ | 77,592 |
| $ | 197,538 |
| |
| Balance at January 1 | | $ | 122,497 |
| $ | 62,035 |
| $ | 184,532 |
| | $ | 119,946 |
| $ | 77,592 |
| $ | 197,538 |
|
| Provision for loan losses | 18,052 |
| 33,463 |
| 51,515 |
| (14,444 | ) | 41,731 |
| 27,287 |
| | 18,052 |
| 33,463 |
| 51,515 |
|
| Deductions: | | | | |
| Loans charged off | 18,818 |
| 62,567 |
| 81,385 |
| 11,094 |
| 52,067 |
| 63,161 |
| | 18,818 |
| 62,567 |
| 81,385 |
|
| Less recoveries | 3,317 |
| 13,547 |
| 16,864 |
| 8,766 |
| 15,108 |
| 23,874 |
| | 3,317 |
| 13,547 |
| 16,864 |
|
| Net loans charged off | 15,501 |
| 49,020 |
| 64,521 |
| 2,328 |
| 36,959 |
| 39,287 |
| | 15,501 |
| 49,020 |
| 64,521 |
|
| Balance at December 31, 2011 | $ | 122,497 |
| $ | 62,035 |
| $ | 184,532 |
| |
| Balance at December 31 | | $ | 105,725 |
| $ | 66,807 |
| $ | 172,532 |
| | $ | 122,497 |
| $ | 62,035 |
| $ | 184,532 |
|
A summary of the activity in the allowance for losses during the yearsyear ended December 31, 2010 and 2009follows:
| | | (In thousands) | 2010 | 2009 | 2010 |
| Balance at January 1 | $ | 194,480 |
| $ | 172,619 |
| $ | 194,480 |
|
| Provision for loan losses | 100,000 |
| 160,697 |
| 100,000 |
|
| Deductions: | | |
| Loan charged off | 114,573 |
| 154,410 |
| 114,573 |
|
| Less recoveries | 17,631 |
| 15,574 |
| 17,631 |
|
| Net loans charged off | 96,942 |
| 138,836 |
| 96,942 |
|
| Balance at December 31 | $ | 197,538 |
| $ | 194,480 |
| $ | 197,538 |
|
The following table shows the balance in the allowance for loan losses and the related loan balance at December 31, 20112012 and 20102011, disaggregated on the basis of impairment methodology. Impaired loans evaluated under ASC 310-10-35 include loans on non-accrual status which are individually evaluated for impairment and other impaired loans deemed to have similar risk characteristics, which are collectively evaluated. All other loans are collectively evaluated for impairment under ASC 450-20.
|
| | | | | | | | | |
| (In thousands) | Commercial | Personal Banking | Total |
| December 31, 2011 | | | |
| Allowance for loan losses: | | | |
| Impaired loans | $ | 6,668 |
| $ | 4,090 |
| $ | 10,758 |
|
| All other loans | 115,829 |
| 57,945 |
| 173,774 |
|
| Loans outstanding: | | | |
| Impaired loans | 108,167 |
| 31,088 |
| 139,255 |
|
| All other loans | 5,266,796 |
| 3,771,427 |
| 9,038,223 |
|
| December 31, 2010 | | | |
| Allowance for loan losses: | | | |
| Impaired loans | $ | 6,127 |
| $ | 3,243 |
| $ | 9,370 |
|
| All other loans | 113,819 |
| 74,349 |
| 188,168 |
|
| Loans outstanding: | | | |
| Impaired loans | 118,532 |
| 26,828 |
| 145,360 |
|
| All other loans | 5,365,201 |
| 3,900,421 |
| 9,265,622 |
|
|
| | | | | | | | | | | | | |
| | Impaired Loans | | All Other Loans |
(In thousands) | Allowance for Loan Losses | Loans Outstanding | | Allowance for Loan Losses | Loans Outstanding |
| December 31, 2012 | | | | | |
| Commercial | $ | 5,434 |
| $ | 80,807 |
| | $ | 100,291 |
| $ | 5,624,965 |
|
| Personal Banking | 2,051 |
| 36,111 |
| | 64,756 |
| 4,089,501 |
|
| Total | $ | 7,485 |
| $ | 116,918 |
| | $ | 165,047 |
| $ | 9,714,466 |
|
| December 31, 2011 | | | | | |
| Commercial | $ | 6,668 |
| $ | 108,167 |
| | $ | 115,829 |
| $ | 5,266,796 |
|
| Personal Banking | 4,090 |
| 31,088 |
| | 57,945 |
| 3,771,427 |
|
| Total | $ | 10,758 |
| $ | 139,255 |
| | $ | 173,774 |
| $ | 9,038,223 |
|
Impaired loans
The table below shows the Company’s investment in impaired loans at December 31, 20112012 and 20102011. These loans consist of all loans on non-accrual status and other restructured loans whose terms have been modified and classified as troubled debt restructurings under ASC 310-40. The restructured loans have been extended to borrowers who are experiencing financial difficulty and who have been granted a concession. They are largely comprised of certain business, construction and business real estate loans classified as substandard. Upon maturity, the loans renewed at interest rates judged not to be market rates for new debt with similar risk and as a result were classified as troubled debt restructurings. These loans totaled $41.3 million at both December 31, 2011 and 2010. These restructured loans are performing in accordance with their modified terms, and because the Company
believes it probable that all amounts due under the modified terms of the agreements will be collected, interest on these loans is being recognized on an accrual basis. TroubledThey are discussed further in the troubled debt restructurings also include certain credit card loans under various debt management and assistance programs, which totaled $22.4 million at December 31, 2011 and $18.8 million at December 31, 2010.section on page 71.
| | | (In thousands) | 2011 | 2010 | 2012 | 2011 |
| Non-accrual loans | $ | 75,482 |
| $ | 85,275 |
| $ | 51,410 |
| $ | 75,482 |
|
| Restructured loans (accruing) | 63,773 |
| 60,085 |
| 65,508 |
| 63,773 |
|
| Total impaired loans | $ | 139,255 |
| $ | 145,360 |
| $ | 116,918 |
| $ | 139,255 |
|
The following table provides additional information about impaired loans held by the Company at December 31, 20112012 and 20102011, segregated between loans for which an allowance for credit losses has been provided and loans for which no allowance has been provided.
|
| | | | | | | | | | | | |
| (In thousands) | Recorded Investment | Unpaid Principal Balance | Related Allowance | Interest Income Recognized * |
| December 31, 2011 | | | | |
| With no related allowance recorded: | | | | |
| Business | $ | 19,759 |
| $ | 22,497 |
| $ | — |
| $ | — |
|
| Real estate – construction and land | 8,391 |
| 22,746 |
| — |
| — |
|
| Real estate – business | 6,853 |
| 9,312 |
| — |
| — |
|
| Real estate – personal | 793 |
| 793 |
| — |
| — |
|
| | $ | 35,796 |
| $ | 55,348 |
| $ | — |
| $ | — |
|
| With an allowance recorded: | | | | |
| Business | $ | 15,604 |
| $ | 19,286 |
| $ | 1,500 |
| $ | 284 |
|
| Real estate – construction and land | 37,387 |
| 47,516 |
| 2,580 |
| 947 |
|
| Real estate – business | 20,173 |
| 24,799 |
| 2,588 |
| 327 |
|
| Real estate – personal | 7,867 |
| 10,671 |
| 795 |
| 37 |
|
| Consumer credit card | 22,428 |
| 22,428 |
| 3,295 |
| 2,016 |
|
| | $ | 103,459 |
| $ | 124,700 |
| $ | 10,758 |
| $ | 3,611 |
|
| Total | $ | 139,255 |
| $ | 180,048 |
| $ | 10,758 |
| $ | 3,611 |
|
| December 31, 2010 | | | | |
| With no related allowance recorded: | | | | |
| Business | $ | 3,544 |
| $ | 5,095 |
| $ | — |
| $ | — |
|
| Real estate – construction and land | 30,979 |
| 55,790 |
| — |
| — |
|
| Real estate – business | 4,245 |
| 5,295 |
| — |
| — |
|
| Real estate – personal | 755 |
| 755 |
| — |
| — |
|
| | $ | 39,523 |
| $ | 66,935 |
| $ | — |
| $ | — |
|
| With an allowance recorded: | | | | |
| Business | $ | 18,464 |
| $ | 21,106 |
| $ | 1,665 |
| $ | 395 |
|
| Real estate – construction and land | 39,719 |
| 52,587 |
| 2,538 |
| 756 |
|
| Real estate – business | 21,581 |
| 25,713 |
| 1,924 |
| 387 |
|
| Real estate – personal | 7,294 |
| 9,489 |
| 936 |
| 25 |
|
| Consumer credit card | 18,779 |
| 18,779 |
| 2,307 |
| 1,304 |
|
| | $ | 105,837 |
| $ | 127,674 |
| $ | 9,370 |
| $ | 2,867 |
|
| Total | $ | 145,360 |
| $ | 194,609 |
| $ | 9,370 |
| $ | 2,867 |
|
* Represents interest income recognized during the respective years on impaired loans held at December 31, 2011 and December 31, 2010. Interest shown is interest recognized on accruing restructured loans as noted above. |
| | | | | | | | | |
| (In thousands) | Recorded Investment | Unpaid Principal Balance | Related Allowance |
| December 31, 2012 | | | |
| With no related allowance recorded: | | | |
| Business | $ | 9,964 |
| $ | 12,697 |
| $ | — |
|
| Real estate – construction and land | 8,440 |
| 15,102 |
| — |
|
| Real estate – business | 5,484 |
| 8,200 |
| — |
|
| Real estate – personal | 1,166 |
| 1,380 |
| — |
|
| Revolving home equity | 510 |
| 843 |
| — |
|
| | $ | 25,564 |
| $ | 38,222 |
| $ | — |
|
| With an allowance recorded: | | | |
| Business | $ | 19,358 |
| $ | 22,513 |
| $ | 1,888 |
|
| Real estate – construction and land | 20,446 |
| 25,808 |
| 1,762 |
|
| Real estate – business | 17,115 |
| 23,888 |
| 1,784 |
|
| Real estate – personal | 14,157 |
| 17,304 |
| 857 |
|
| Consumer | 4,779 |
| 4,779 |
| 93 |
|
| Revolving home equity | 779 |
| 779 |
| 18 |
|
| Consumer credit card | 14,720 |
| 14,720 |
| 1,083 |
|
| | $ | 91,354 |
| $ | 109,791 |
| $ | 7,485 |
|
| Total | $ | 116,918 |
| $ | 148,013 |
| $ | 7,485 |
|
| December 31, 2011 | | | |
| With no related allowance recorded: | | | |
| Business | $ | 19,759 |
| $ | 22,497 |
| $ | — |
|
| Real estate – construction and land | 8,391 |
| 22,746 |
| — |
|
| Real estate – business | 6,853 |
| 9,312 |
| — |
|
| Real estate – personal | 793 |
| 793 |
| — |
|
| | $ | 35,796 |
| $ | 55,348 |
| $ | — |
|
| With an allowance recorded: | | | |
| Business | $ | 15,604 |
| $ | 19,286 |
| $ | 1,500 |
|
| Real estate – construction and land | 37,387 |
| 47,516 |
| 2,580 |
|
| Real estate – business | 20,173 |
| 24,799 |
| 2,588 |
|
| Real estate – personal | 7,867 |
| 10,671 |
| 795 |
|
| Consumer credit card | 22,428 |
| 22,428 |
| 3,295 |
|
| | $ | 103,459 |
| $ | 124,700 |
| $ | 10,758 |
|
| Total | $ | 139,255 |
| $ | 180,048 |
| $ | 10,758 |
|
Total average impaired loans during 2012 and 2011 are shown in the table below.
|
| | | | | | | | | | | | | | | | | | | |
| | 2012 | | 2011 |
| (In thousands) | Commercial | Personal Banking | Total | | Commercial | Personal Banking | Total |
| Average impaired loans: | | | | | | | |
| Non-accrual loans | $ | 55,994 |
| $ | 7,343 |
| $ | 63,337 |
| | $ | 70,053 |
| $ | 7,121 |
| $ | 77,174 |
|
| Restructured loans (accruing) | 43,181 | 22,520 |
| 65,701 |
| | 43,575 |
| 22,583 |
| 66,158 |
|
| Total | $ | 99,175 |
| $ | 29,863 |
| $ | 129,038 |
| | $ | 113,628 |
| $ | 29,704 |
| $ | 143,332 |
|
Total averageThe table below shows interest income recognized during the years ended December 31, 2012 and 2011 for impaired loans shown inheld at the table below, were $143.3 million during 2011, comparedend of each respective period. This interest relates to total average impairedaccruing restructured loans, of $as discussed previously.173.0 million during 2010 and $160.6 million during 2009.
|
| | | | | | | | | | |
| (In thousands) | | Commercial | Personal Banking | Total |
| Average impaired loans: | | | | |
| Non-accrual loans | | $ | 70,053 |
| $ | 7,121 |
| $ | 77,174 |
|
| Restructured loans (accruing) | | 43,575 |
| 22,583 |
| 66,158 |
|
| Average impaired loans during 2011 | | $ | 113,628 |
| $ | 29,704 |
| $ | 143,332 |
|
|
| | | | | | |
| | For the Year Ended December 31 |
| (In thousands) | 2012 | 2011 |
| Interest income recognized on impaired loans: | | |
| Business | $ | 1,184 |
| $ | 284 |
|
| Real estate – construction and land | 655 |
| 947 |
|
| Real estate – business | 246 |
| 327 |
|
| Real estate – personal | 376 |
| 37 |
|
| Consumer | 415 |
| — |
|
| Revolving home equity | 37 |
| — |
|
| Consumer credit card | 1,341 |
| 2,016 |
|
| Total | $ | 4,254 |
| $ | 3,611 |
|
Delinquent and non-accrual loans
The following table provides aging information on the Company’s past due and accruing loans, in addition to the balances of loans on non-accrual status, at December 31, 20112012 and 20102011.
| | | (In thousands) | Current or Less Than 30 Days Past Due | 30 – 89 Days Past Due | 90 Days Past Due and Still Accruing | Non-accrual | Total | Current or Less Than 30 Days Past Due | 30 – 89 Days Past Due | 90 Days Past Due and Still Accruing | Non-accrual | Total |
| December 31, 2012 | | |
| Commercial: | | |
| Business | | $ | 3,110,403 |
| $ | 10,054 |
| $ | 1,288 |
| $ | 13,056 |
| $ | 3,134,801 |
|
| Real estate – construction and land | | 325,541 |
| 16,721 |
| 56 |
| 13,678 |
| 355,996 |
|
| Real estate – business | | 2,194,395 |
| 3,276 |
| — |
| 17,304 |
| 2,214,975 |
|
| Personal Banking: | | |
| Real estate – personal | | 1,564,281 |
| 10,862 |
| 2,854 |
| 6,862 |
| 1,584,859 |
|
| Consumer | | 1,273,581 |
| 13,926 |
| 2,143 |
| — |
| 1,289,650 |
|
| Revolving home equity | | 433,437 |
| 2,121 |
| 1,499 |
| 510 |
| 437,567 |
|
| Consumer credit card | | 786,081 |
| 10,657 |
| 7,507 |
| — |
| 804,245 |
|
| Overdrafts | | 8,925 |
| 366 |
| — |
| — |
| 9,291 |
|
| Total | | $ | 9,696,644 |
| $ | 67,983 |
| $ | 15,347 |
| $ | 51,410 |
| $ | 9,831,384 |
|
| December 31, 2011 | | |
| Commercial: | | |
| Business | $ | 2,777,578 |
| $ | 4,368 |
| $ | 595 |
| $ | 25,724 |
| $ | 2,808,265 |
| $ | 2,777,578 |
| $ | 4,368 |
| $ | 595 |
| $ | 25,724 |
| $ | 2,808,265 |
|
| Real estate – construction and land | 362,592 |
| 1,113 |
| 121 |
| 22,772 |
| 386,598 |
| 362,592 |
| 1,113 |
| 121 |
| 22,772 |
| 386,598 |
|
| Real estate – business | 2,151,822 |
| 8,875 |
| 29 |
| 19,374 |
| 2,180,100 |
| 2,151,822 |
| 8,875 |
| 29 |
| 19,374 |
| 2,180,100 |
|
| Personal Banking: | | |
| Real estate – personal | 1,406,449 |
| 11,671 |
| 3,045 |
| 7,612 |
| 1,428,777 |
| 1,406,449 |
| 11,671 |
| 3,045 |
| 7,612 |
| 1,428,777 |
|
| Consumer | 1,096,742 |
| 15,917 |
| 2,230 |
| — |
| 1,114,889 |
| 1,096,742 |
| 15,917 |
| 2,230 |
| — |
| 1,114,889 |
|
| Revolving home equity | 461,941 |
| 1,003 |
| 643 |
| — |
| 463,587 |
| 461,941 |
| 1,003 |
| 643 |
| — |
| 463,587 |
|
| Consumer credit card | 769,922 |
| 10,484 |
| 8,295 |
| — |
| 788,701 |
| 769,922 |
| 10,484 |
| 8,295 |
| — |
| 788,701 |
|
| Overdrafts | 6,173 |
| 388 |
| — |
| — |
| 6,561 |
| 6,173 |
| 388 |
| — |
| — |
| 6,561 |
|
| Total | $ | 9,033,219 |
| $ | 53,819 |
| $ | 14,958 |
| $ | 75,482 |
| $ | 9,177,478 |
| $ | 9,033,219 |
| $ | 53,819 |
| $ | 14,958 |
| $ | 75,482 |
| $ | 9,177,478 |
|
| December 31, 2010 | | |
| Commercial: | | |
| Business | $ | 2,927,403 |
| $ | 19,853 |
| $ | 854 |
| $ | 8,933 |
| $ | 2,957,043 |
| |
| Real estate – construction and land | 400,420 |
| 7,464 |
| 217 |
| 52,752 |
| 460,853 |
| |
| Real estate – business | 2,040,794 |
| 8,801 |
| — |
| 16,242 |
| 2,065,837 |
| |
| Personal Banking: | | |
| Real estate – personal | 1,413,905 |
| 15,579 |
| 3,554 |
| 7,348 |
| 1,440,386 |
| |
| Consumer | 1,145,561 |
| 15,899 |
| 2,867 |
| — |
| 1,164,327 |
| |
| Revolving home equity | 475,764 |
| 929 |
| 825 |
| — |
| 477,518 |
| |
| Consumer credit card | 806,373 |
| 12,513 |
| 12,149 |
| — |
| 831,035 |
| |
| Overdrafts | 13,555 |
| 428 |
| — |
| — |
| 13,983 |
| |
| Total | $ | 9,223,775 |
| $ | 81,466 |
| $ | 20,466 |
| $ | 85,275 |
| $ | 9,410,982 |
| |
Credit quality
The following table provides information about the credit quality of the Commercial loan portfolio, using the Company’s internal rating system as an indicator. The information below was updated as of December 31, 2011 and 2010 for this indicator. The internal rating system is a series of grades reflecting management’s risk assessment, based on its analysis of the borrower’s financial condition. The “pass” category consists of a range of loan grades that reflect increasing, though still acceptable, risk. Movement of risk through the various grade levels in the “pass” category is monitored for early identification of credit deterioration. The “special mention” rating is attached to loans where the borrower exhibits material negative financial trends due to borrower specific or systemic conditions that, if left uncorrected, threaten its capacity to meet its debt obligations. The borrower is believed to have sufficient financial flexibility to react to and resolve its negative financial situation. It is a transitional grade that is closely monitored for improvement or deterioration. The “substandard” rating is applied to loans where the borrower exhibits well-defined weaknesses that jeopardize its continued performance and are of a severity that the distinct possibility of default exists. Loans are placed on “non-accrual” when management does not expect to collect payments consistent with acceptable and agreed upon terms of repayment, as discussed in Note 1.
|
| | | | | | | | | | | | |
| | Commercial Loans |
| (In thousands) | Business | Real Estate -Construction | Real Estate - Business | Total |
| December 31, 2012 | | | | |
| Pass | $ | 3,018,062 |
| $ | 297,156 |
| $ | 2,103,913 |
| $ | 5,419,131 |
|
| Special mention | 58,793 |
| 11,400 |
| 38,396 |
| 108,589 |
|
| Substandard | 44,890 |
| 33,762 |
| 55,362 |
| 134,014 |
|
| Non-accrual | 13,056 |
| 13,678 |
| 17,304 |
| 44,038 |
|
| Total | $ | 3,134,801 |
| $ | 355,996 |
| $ | 2,214,975 |
| $ | 5,705,772 |
|
| December 31, 2011 | | | | |
| Pass | $ | 2,669,868 |
| $ | 304,408 |
| $ | 1,994,391 |
| $ | 4,968,667 |
|
| Special mention | 37,460 |
| 4,722 |
| 52,683 |
| 94,865 |
|
| Substandard | 75,213 |
| 54,696 |
| 113,652 |
| 243,561 |
|
| Non-accrual | 25,724 |
| 22,772 |
| 19,374 |
| 67,870 |
|
| Total | $ | 2,808,265 |
| $ | 386,598 |
| $ | 2,180,100 |
| $ | 5,374,963 |
|
|
| | | | | | | | | | | | |
| | Commercial Loans |
| (In thousands) | Business | Real Estate -Construction | Real Estate - Business | Total |
| December 31, 2011 | | | | |
| Pass | $ | 2,669,868 |
| $ | 304,408 |
| $ | 1,994,391 |
| $ | 4,968,667 |
|
| Special mention | 37,460 |
| 4,722 |
| 52,683 |
| 94,865 |
|
| Substandard | 75,213 |
| 54,696 |
| 113,652 |
| 243,561 |
|
| Non-accrual | 25,724 |
| 22,772 |
| 19,374 |
| 67,870 |
|
| Total | $ | 2,808,265 |
| $ | 386,598 |
| $ | 2,180,100 |
| $ | 5,374,963 |
|
| December 31, 2010 | | | | |
| Pass | $ | 2,801,328 |
| $ | 327,167 |
| $ | 1,878,005 |
| $ | 5,006,500 |
|
| Special mention | 67,142 |
| 29,345 |
| 77,527 |
| 174,014 |
|
| Substandard | 79,640 |
| 51,589 |
| 94,063 |
| 225,292 |
|
| Non-accrual | 8,933 |
| 52,752 |
| 16,242 |
| 77,927 |
|
| Total | $ | 2,957,043 |
| $ | 460,853 |
| $ | 2,065,837 |
| $ | 5,483,733 |
|
The credit quality of Personal Banking loans is monitored primarily on the basis of aging/delinquency, and this information is provided in the table in the above Delinquency section. In addition, FICO scores are obtained and updated on a quarterly basis for most of the loans in the Personal Banking portfolio. This is a published credit score designed to measure the risk of default by taking into account various factors from a person's financial history. The bank normally obtains a FICO score at the loan's origination and renewal dates, and updates are obtained on a quarterly basis. Excluded from the table below are approximatelycertain loans for which FICO scores are not obtained because the loans are related to commercial activity. At December 31, 2012, these were comprised of $372224.5 million in personal real estate loans and $87.4 million in consumer andloans, or 7.6% of the Personal Banking portfolio. At December 31, 2011, these were comprised of $222.8 million in personal real estate loans and $148.7 million in consumer loans, or 9.8% of the Personal Banking portfolio, for which FICO scores are not obtained because they are related to commercial activity.portfolio. For the remainder of loans in the Personal Banking portfolio, the table below shows the percentage of balances outstanding at December 31, 2012 and 2011 by FICO score.
| | | | Personal Banking Loans | Personal Banking Loans |
| | % of Loan Category | % of Loan Category |
| Real Estate - Personal | Consumer | Revolving Home Equity | Consumer Credit Card | Real Estate - Personal | Consumer | Revolving Home Equity | Consumer Credit Card |
| December 31, 2012 | | |
| FICO score: | | |
| Under 600 | | 2.3 | % | 6.7 | % | 2.6 | % | 4.4 | % |
| 600 – 659 | | 3.2 |
| 11.3 |
| 5.3 |
| 11.7 |
|
| 660 – 719 | | 10.4 |
| 24.4 |
| 15.2 |
| 32.1 |
|
| 720 – 779 | | 26.6 |
| 26.4 |
| 30.0 |
| 28.2 |
|
| 780 and over | | 57.5 |
| 31.2 |
| 46.9 |
| 23.6 |
|
| Total | | 100.0 | % | 100.0 | % | 100.0 | % | 100.0 | % |
| December 31, 2011 | | |
| FICO score: | | |
| Under 600 | 3.4 | % | 8.4 | % | 2.6 | % | 4.9 | % | 3.4 | % | 8.4 | % | 2.6 | % | 4.9 | % |
| 600 – 659 | 4.1 |
| 11.0 |
| 4.9 |
| 11.2 |
| 4.1 |
| 11.0 |
| 4.9 |
| 11.2 |
|
| 660 – 719 | 12.2 |
| 23.2 |
| 15.1 |
| 31.0 |
| 12.2 |
| 23.2 |
| 15.1 |
| 31.0 |
|
| 720 – 780 | 29.2 |
| 26.0 |
| 26.3 |
| 29.0 |
| |
| Over 780 | 51.1 |
| 31.4 |
| 51.1 |
| 23.9 |
| |
| 720 – 779 | | 29.2 |
| 26.0 |
| 26.3 |
| 29.0 |
|
| 780 and over | | 51.1 |
| 31.4 |
| 51.1 |
| 23.9 |
|
| Total | 100.0 | % | 100.0 | % | 100.0 | % | 100.0 | % | 100.0 | % | 100.0 | % | 100.0 | % | 100.0 | % |
Troubled debt restructurings
As mentioned above,previously, the Company's impaired loans include loans which have been classified as troubled debt restructurings. The majority of troubled debt restructuringsTotal restructured loans amounted to $94.0 million at December 31, 2012. Restructured loans are classified as such upon renewal when the contractual interest rate of the new loan, which may be greater or less than the rate on the previous loan, was not judgedthose extended to beborrowers who are experiencing financial difficulty and who have been granted a market rate for debt with similar risk. As a result, the financial effects of the modifications cannot readily be quantified.concession. Restructured loans are placed on non-accrual status if the Company does not believe it probable that amounts due under the modifiedcontractual terms will be collected.collected, and those non-accrual loans totaled $28.5 million at December 31, 2012. Other performing restructured loans consist mainlytotaled $65.5 million at December 31, 2012. These are are partly comprised of performingcertain business, construction and business real estate loans classified as substandard. Upon maturity, the loans renewed at interest rates judged not to be market rates for new debt with similar risk and as a result were classified as troubled debt restructurings. These commercial loans totaled $40.3 million and $41.3 million at December 31, 2012 and 2011, respectively. These restructured loans are performing in accordance with their modified terms, and because the Company believes it probable that all amounts due under the modified terms of the agreements will be collected, interest on these loans is being recognized on an accrual basis. Troubled debt restructurings also include certain credit card loans under various debt management and assistance programs, which totaled $14.7 million at December 31, 2012 and $22.4 million at December 31, 2011. Modifications to credit card loans generally involve removing the available line of credit, placing loans on amortizing status, and lowering the contractual interest rate. During 2012, the Company classified additional loans as troubled debt restructurings because they had not been reaffirmed by the borrower in bankruptcy proceedings. These loans totaled $10.4 million in personal real estate, revolving home equity, and consumer creditloans. Interest on these loans under debt management programs,is being recognized on an accrual basis, as mentioned above. the borrowers are continuing to make payments.
The table below shows the outstanding balance of loans classified as troubled debt restructurings at December 31, 20112012, in addition to the period end balances of restructured loans which the Company considers to have been in default at any time during the previouspast twelve months. For purposes of this disclosure, the Company considers "default" to mean 90 days or more past due as to interest or principal.
| | | (In thousands) | December 31, 2011 | Balance 90 days past due at any time during previous 12 months | December 31, 2012 | Balance 90 days past due at any time during previous 12 months |
| Commercial: | | |
| Business | $ | 19,821 |
| $ | — |
| $ | 25,657 |
| $ | 724 |
|
| Real estate – construction and land | 39,677 |
| 9,736 |
| 27,289 |
| 6,484 |
|
| Real estate – business | 12,992 |
| 1,595 |
| 10,480 |
| 748 |
|
| Personal Banking: | | |
| Real estate – personal | 3,031 |
| — |
| 10,337 |
| 585 |
|
| Consumer | | 4,779 |
| 190 |
|
| Revolving home equity | | 779 |
| 84 |
|
| Consumer credit card | 22,428 |
| 6,333 |
| 14,720 |
| 778 |
|
| Total restructured loans | $ | 97,949 |
| $ | 17,664 |
| $ | 94,041 |
| $ | 9,593 |
|
For those loans on non-accrual status also classified as restructured, the modification did not create any further financial effect on the Company as those loans were already recorded at net realizable value. For those performing commercial loans classified as restructured, there were no concessions involving forgiveness of principal or interest and, therefore, there was no financial impact to the Company as a result of modification to these loans. No financial impact resulted from those performing loans where the debt was not reaffirmed in bankruptcy, as no changes to loan terms occurred in that process . However, the effects of modifications to consumer credit card loans were estimated to decrease interest income by approximately $1.9 million on an annual, pre-tax basis, compared to amounts contractually owed.
The determination of the allowance for loan losses related to troubled debt restructurings depends on the collectability of principal and interest, according to the repayment terms. As mentioned above, the majority of troubled debt restructurings were classified as such when the loans were renewed at an interest rate not judged to be market, and as such, the modified terms did not change estimated collectability under the terms of the contract. The allowance for loan losses for troubled debt restructurings on non-accrual status is determined by individual evaluation, including collateral adequacy, using the same process as loans on non-accrual status which are not classified as troubled debt restructurings. Those restructuredperforming loans classified as troubled debt restructurings are accruing loans which management expects to collect under contractual terms and which are maintained on accruing status, are generally risk-rated as substandard. The allowance for loan losses relatedterms. Performing commercial loans have had no other concessions granted other than being renewed at an interest rate judged not to accruing restructured loans is determined by collective evaluation because the loansbe market. As such, they have similar risk characteristics. Collective evaluation, which ischaracteristics as non-troubled debt commercial loans and are collectively evaluated based on internal risk rating, loan type, delinquency, historical experience and current economic factors. Performing personal banking loans classified as troubled debt restructurings resulted from the same process used forborrower not reaffirming the debt during bankruptcy and have had no other substandardconcession granted, other than the Bank's future limitations on collecting payment deficiencies or in pursuing foreclosure actions. As such, they have similar risk characteristics as non-troubled debt personal banking loans considersand are evaluated collectively based on loan type, delinquency, historical loss experience and current economic factors.
If a troubled debt restructuring defaults and is already on non-accrual status, the allowance for loan losslosses continues to be determined based on individual evaluation, using discounted expected cash flows or the fair value of collateral. If a substandard,an accruing, troubled debt restructuring defaults, the loan's risk rating is downgraded to non-accrual status and the loan's related allowance for loan losslosses is determined based on individual evaluation.evaluation, or if necessary, the loan is charged off and collection efforts begin.
The Company had commitments of $$10.316.5 million at December 31, 20112012 to lend additional funds to borrowers with restructured loans.
Loans held for sale
In addition to the portfolio of loans which are intended to be held to maturity, the Company historically originates loans which it intends to sell in secondary markets. Loans classified as held for sale primarily consist of loans originated to students while attending colleges and universities. Most of this portfolio was sold in 2010 under contracts with the Federal Department of Education and various student loan agencies. Significant future student loan originations are not anticipated, because under statutory requirements effective July 1, 2010, the Company is prohibited from making federally guaranteed student loans. Also included as held for sale are certain fixed rate residential mortgage loans which are sold in the secondary market, generally within three months of origination. The following table presents information about loans held for sale, including an impairment valuation allowance resulting from declines in fair value below cost, which is further discussed in Note 15 on Fair Value Measurements.
|
| | | | | | |
| (In thousands) | 2011 | 2010 |
| Balance outstanding at end of year: | | |
| Student loans, at cost | $ | 28,706 |
| $ | 53,901 |
|
| Residential mortgage loans, at cost | 2,545 |
| 10,419 |
|
| Valuation allowance on student loans | (175 | ) | (569 | ) |
| Total loans held for sale, at lower of cost or fair value | $ | 31,076 |
| $ | 63,751 |
|
| Net gains on sales: | | |
| Student loans | $ | 531 |
| $ | 8,398 |
|
| Residential mortgage loans | 1,509 |
| 2,004 |
|
| Total gains on sales of loans held for sale, net | $ | 2,040 |
| $ | 10,402 |
|
The Company’s holdings of foreclosed real estate totaled $$18.313.5 million and $$12.018.3 million at December 31, 20112012 and 20102011, respectively. Personal property acquired in repossession, generally autos and marine and recreational vehicles, totaled $$4.23.5 million and $$10.44.2 million at December 31, 20112012 and 20102011, respectively. These assets are carried at the lower of the amount recorded at acquisition date or the current fair value less estimated selling costs.
3. Investment Securities
Investment securities, at fair value, consisted of the following at December 31, 20112012 and 20102011.
| | | (In thousands) | 2011 | 2010 | 2012 | 2011 |
| Available for sale: | | |
| U.S. government and federal agency obligations | $ | 364,665 |
| $ | 455,537 |
| $ | 438,759 |
| $ | 364,665 |
|
| Government-sponsored enterprise obligations | 315,698 |
| 201,895 |
| 471,574 |
| 315,698 |
|
| State and municipal obligations | 1,245,284 |
| 1,119,485 |
| 1,615,707 |
| 1,245,284 |
|
| Agency mortgage-backed securities | 4,106,059 |
| 2,491,199 |
| 3,380,955 |
| 4,106,059 |
|
| Non-agency mortgage-backed securities | 316,902 |
| 455,790 |
| 237,011 |
| 316,902 |
|
| Asset-backed securities | 2,693,143 |
| 2,354,260 |
| 3,167,394 |
| 2,693,143 |
|
| Other debt securities | 141,260 |
| 176,964 |
| 177,752 |
| 141,260 |
|
| Equity securities | 41,691 |
| 39,173 |
| 33,096 |
| 41,691 |
|
| Total available for sale | 9,224,702 |
| 7,294,303 |
| 9,522,248 |
| 9,224,702 |
|
| Trading | 17,853 |
| 11,710 |
| 28,837 |
| 17,853 |
|
| Non-marketable | 115,832 |
| 103,521 |
| 118,650 |
| 115,832 |
|
| Total investment securities | $ | 9,358,387 |
| $ | 7,409,534 |
| $ | 9,669,735 |
| $ | 9,358,387 |
|
Most of the Company’s investment securities are classified as available for sale, and this portfolio is discussed in more detail below. Securities which are classified as non-marketable include Federal Home Loan Bank (FHLB) stock and Federal Reserve Bank stock held for borrowing and regulatory purposes, which totaled $45.3$45.4 million and $45.2$45.3 million at December 31, 20112012 and December 31, 20102011, respectively. Investment in Federal Reserve Bank stock is based on the capital structure of the investing bank, and investment in FHLB stock is mainly tied to the level of borrowings from the FHLB. These holdings are carried at cost. Non-marketable securities also include private equity investments, which amounted to $70.5$73.2 million and $58.2$70.5 million at December 31, 20112012 and December 31, 20102011, respectively. In the absence of readily ascertainable market values, these securities are carried at estimated fair value.
A summary of the available for sale investment securities by maturity groupings as of December 31, 20112012 is shown below.in the following table. The weighted average yield for each range of maturities was calculated using the yield on each security within that range weighted by the amortized cost of each security at December 31, 20112012. Yields on tax exempt securities have not been adjusted for tax exempt status. The investment portfolio includes agency mortgage-backed securities, which are guaranteed by agencies such as FHLMC, FNMA, GNMA and FDIC, in addition to non-agency mortgage-backed securities which have no guarantee, but are collateralized by residential mortgages. Also included are certain other asset-backed securities, primarily collateralized by credit cards, automobiles and commercial loans. The Company does not have exposure to subprime originated mortgage-backed or collateralized debt obligation instruments.
| | | (Dollars in thousands) | Amortized Cost | Fair Value | Weighted Average Yield | Amortized Cost | Fair Value | Weighted Average Yield |
| U.S. government and federal agency obligations: | | | | |
| Within 1 year | $ | 7,753 |
| $ | 8,010 |
| 5.42 | % | |
| After 1 but within 5 years | 158,173 |
| 173,356 |
| 1.64 |
| $ | 219,192 |
| $ | 241,964 |
| 1.70 | *% |
| After 5 but within 10 years | 162,604 |
| 183,299 |
| 1.49 |
| 107,708 |
| 125,331 |
| 1.30* |
|
| After 10 years | | 73,071 |
| 71,464 |
| (.30)* |
|
| Total U.S. government and federal agency obligations | 328,530 |
| 364,665 |
| 1.65 |
| 399,971 |
| 438,759 |
| 1.23* |
|
| Government-sponsored enterprise obligations: | | | | |
| Within 1 year | 56,255 |
| 56,683 |
| 2.62 |
| 7,473 |
| 7,543 |
| 1.13 |
|
| After 1 but within 5 years | 130,587 |
| 133,969 |
| 1.85 |
| 100,794 |
| 104,256 |
| 1.79 |
|
| After 5 but within 10 years | 37,274 |
| 37,435 |
| 1.66 |
| 171,805 |
| 171,861 |
| 1.59 |
|
| After 10 years | 87,413 |
| 87,611 |
| 1.94 |
| 186,991 |
| 187,914 |
| 1.90 |
|
| Total government-sponsored enterprise obligations | 311,529 |
| 315,698 |
| 1.99 |
| 467,063 |
| 471,574 |
| 1.75 |
|
| State and municipal obligations: | | | | |
| Within 1 year | 104,945 |
| 106,281 |
| 3.44 |
| 89,091 |
| 89,899 |
| 2.23 |
|
| After 1 but within 5 years | 513,033 |
| 529,531 |
| 2.75 |
| 681,954 |
| 708,271 |
| 2.71 |
|
| After 5 but within 10 years | 375,836 |
| 390,333 |
| 3.00 |
| 537,897 |
| 550,026 |
| 2.37 |
|
| After 10 years | 227,026 |
| 219,139 |
| 2.27 |
| 276,984 |
| 267,511 |
| 2.18 |
|
| Total state and municipal obligations | 1,220,840 |
| 1,245,284 |
| 2.79 |
| 1,585,926 |
| 1,615,707 |
| 2.47 |
|
| Mortgage and asset-backed securities: | | | | |
| Agency mortgage-backed securities | 3,989,464 |
| 4,106,059 |
| 3.07 |
| 3,248,007 |
| 3,380,955 |
| 2.82 |
|
| Non-agency mortgage-backed securities | 315,752 |
| 316,902 |
| 6.10 |
| 224,223 |
| 237,011 |
| 6.08 |
|
| Asset-backed securities | 2,692,436 |
| 2,693,143 |
| 1.12 |
| 3,152,913 |
| 3,167,394 |
| .94 |
|
| Total mortgage and asset-backed securities | 6,997,652 |
| 7,116,104 |
| 2.46 |
| 6,625,143 |
| 6,785,360 |
| 2.04 |
|
| Other debt securities: | | | | |
| Within 1 year | 63,547 |
| 64,266 |
| | 45,818 |
| 47,014 |
| |
| After 1 but within 5 years | 71,643 |
| 76,994 |
| | 41,499 |
| 43,121 |
| |
| After 5 but within 10 years | | 78,468 |
| 78,603 |
| |
| After 10 years | | 8,942 |
| 9,014 |
| |
| Total other debt securities | 135,190 |
| 141,260 |
| | 174,727 |
| 177,752 |
| |
| Equity securities | 18,354 |
| 41,691 |
| | 5,695 |
| 33,096 |
| |
| Total available for sale investment securities | $ | 9,012,095 |
| $ | 9,224,702 |
| | $ | 9,258,525 |
| $ | 9,522,248 |
| |
* Rate does not reflect inflation adjustment on inflation-protected securities
IncludedInvestments in U.S. government securities are comprised mainly of U.S. Treasury inflation-protected securities, which totaled $356.5$438.6 million, at fair value, at December 31, 20112012. Interest paid on these securities increases with inflation and decreases with deflation, as measured by the Consumer Price Index. At maturity, the principal paid is the greater of an inflation-adjusted principal or the original principal. Included in state and municipal obligations are $135.6$126.4 million, at fair value, of auction rate securities, which were purchased from bank customers in 2008. Interest on these bonds is currently being paid at the maximum failed auction rates. Equity securities are primarily comprised of investments in common stock held by the Parent, which totaled $26.7$30.7 million, at fair value, at December 31, 20112012.
For securities classified as available for sale, the following table shows the unrealized gains and losses (pre-tax) in accumulated other comprehensive income, by security type.
| | | (In thousands) | Amortized Cost | Gross Unrealized Gains | Gross Unrealized Losses | Fair Value | Amortized Cost | Gross Unrealized Gains | Gross Unrealized Losses | Fair Value |
| December 31, 2012 | | |
| U.S. government and federal agency obligations | | $ | 399,971 |
| $ | 40,395 |
| $ | (1,607 | ) | $ | 438,759 |
|
| Government-sponsored enterprise obligations | | 467,063 |
| 5,188 |
| (677 | ) | 471,574 |
|
| State and municipal obligations | | 1,585,926 |
| 46,076 |
| (16,295 | ) | 1,615,707 |
|
| Mortgage and asset-backed securities: | | |
| Agency mortgage-backed securities | | 3,248,007 |
| 132,953 |
| (5 | ) | 3,380,955 |
|
| Non-agency mortgage-backed securities | | 224,223 |
| 12,906 |
| (118 | ) | 237,011 |
|
| Asset-backed securities | | 3,152,913 |
| 15,848 |
| (1,367 | ) | 3,167,394 |
|
| Total mortgage and asset-backed securities | | 6,625,143 |
| 161,707 |
| (1,490 | ) | 6,785,360 |
|
| Other debt securities | | 174,727 |
| 3,127 |
| (102 | ) | 177,752 |
|
| Equity securities | | 5,695 |
| 27,401 |
| — |
| 33,096 |
|
| Total | | $ | 9,258,525 |
| $ | 283,894 |
| $ | (20,171 | ) | $ | 9,522,248 |
|
| December 31, 2011 | | |
| U.S. government and federal agency obligations | $ | 328,530 |
| $ | 36,135 |
| $ | — |
| $ | 364,665 |
| $ | 328,530 |
| $ | 36,135 |
| $ | — |
| $ | 364,665 |
|
| Government-sponsored enterprise obligations | 311,529 |
| 4,169 |
| — |
| 315,698 |
| 311,529 |
| 4,169 |
| — |
| 315,698 |
|
| State and municipal obligations | 1,220,840 |
| 35,663 |
| (11,219 | ) | 1,245,284 |
| 1,220,840 |
| 35,663 |
| (11,219 | ) | 1,245,284 |
|
| Mortgage and asset-backed securities: | | |
| Agency mortgage-backed securities | 3,989,464 |
| 117,088 |
| (493 | ) | 4,106,059 |
| 3,989,464 |
| 117,088 |
| (493 | ) | 4,106,059 |
|
| Non-agency mortgage-backed securities | 315,752 |
| 8,962 |
| (7,812 | ) | 316,902 |
| 315,752 |
| 8,962 |
| (7,812 | ) | 316,902 |
|
| Asset-backed securities | 2,692,436 |
| 7,083 |
| (6,376 | ) | 2,693,143 |
| 2,692,436 |
| 7,083 |
| (6,376 | ) | 2,693,143 |
|
| Total mortgage and asset-backed securities | 6,997,652 |
| 133,133 |
| (14,681 | ) | 7,116,104 |
| 6,997,652 |
| 133,133 |
| (14,681 | ) | 7,116,104 |
|
| Other debt securities | 135,190 |
| 6,070 |
| — |
| 141,260 |
| 135,190 |
| 6,070 |
| — |
| 141,260 |
|
| Equity securities | 18,354 |
| 23,337 |
| — |
| 41,691 |
| 18,354 |
| 23,337 |
| — |
| 41,691 |
|
| Total | $ | 9,012,095 |
| $ | 238,507 |
| $ | (25,900 | ) | $ | 9,224,702 |
| $ | 9,012,095 |
| $ | 238,507 |
| $ | (25,900 | ) | $ | 9,224,702 |
|
| December 31, 2010 | | |
| U.S. government and federal agency obligations | $ | 434,878 |
| $ | 20,659 |
| $ | — |
| $ | 455,537 |
| |
| Government-sponsored enterprise obligations | 200,061 |
| 2,364 |
| (530 | ) | 201,895 |
| |
| State and municipal obligations | 1,117,020 |
| 19,108 |
| (16,643 | ) | 1,119,485 |
| |
| Mortgage and asset-backed securities: | | |
| Agency mortgage-backed securities | 2,437,123 |
| 57,516 |
| (3,440 | ) | 2,491,199 |
| |
| Non-agency mortgage-backed securities | 459,363 |
| 10,940 |
| (14,513 | ) | 455,790 |
| |
| Asset-backed securities | 2,342,866 |
| 12,445 |
| (1,051 | ) | 2,354,260 |
| |
| Total mortgage and asset-backed securities | 5,239,352 |
| 80,901 |
| (19,004 | ) | 5,301,249 |
| |
| Other debt securities | 165,883 |
| 11,081 |
| — |
| 176,964 |
| |
| Equity securities | 7,569 |
| 31,604 |
| — |
| 39,173 |
| |
| Total | $ | 7,164,763 |
| $ | 165,717 |
| $ | (36,177 | ) | $ | 7,294,303 |
| |
The Company’s impairment policy requires a review of all securities for which fair value is less than amortized cost. Special emphasis and analysis is placed on securities whose credit rating has fallen below A3/A3 (Moody's) or A- (Standard & Poor's), whose fair values have fallen more than 20% below purchase price for an extended period of time, or have been identified based on management’s judgment. These securities are placed on a watch list, and for all such securities, detailed cash flow models are prepared which use inputs specific to each security. Inputs to these models include factors such as cash flow received, contractual payments required, and various other information related to the underlying collateral (including current delinquencies), collateral loss severity rates (including loan to values), expected delinquency rates, credit support from other tranches, and prepayment speeds. Stress tests are performed at varying levels of delinquency rates, prepayment speeds and loss severities in order to gauge probable ranges of credit loss. At December 31, 20112012, the fair value of securities on this watch list was $$220.7 million compared to $220.9 million. at December 31, 2011.
As of December 31, 20112012, the Company had recorded OTTI on certain non-agency mortgage-backed securities, part of the watch list mentioned above, which had an aggregate fair value of $124.8$101.7 million. The creditcredit-related portion of the impairment initially recorded on these securities totaled $10.1$11.6 million and was recorded in earnings. The noncredit-related portion of the impairment totaled $7.0 million on a pre-tax basis, and has been recognized in accumulated other comprehensive income. The Company does not intend to sell these securities and believes it is not more likely than not that it will be required to sell the securities before the recovery of their amortized cost.
The creditcredit-related portion of the loss on these securities was based on the cash flows projected to be received over the estimated life of the securities, discounted to present value, and compared to the current amortized cost bases of the securities. Significant inputs to the cash flow models used to calculate the credit losses on these securities included the following:
|
| |
Significant Inputs | Range |
Prepayment CPR | 1% - 25% |
Projected cumulative default | 11% - 56% |
Credit support | 0% - 18% |
Loss severity | 33% - 57% |
|
| | | |
| Significant Inputs | Range |
| Prepayment CPR | 0% | - | 25% |
| Projected cumulative default | 17% | - | 58% |
| Credit support | 0% | - | 16% |
| Loss severity | 33% | - | 70% |
The following table shows changes in the credit losses recorded in current earnings, for which a portion of an OTTI was recognized in other comprehensive income.
| | | (In thousands) | 2011 | 2010 | 2009 | 2012 | 2011 | 2010 |
| Balance at January 1 | $ | 7,542 |
| $ | 2,473 |
| $ | — |
| $ | 9,931 |
| $ | 7,542 |
| $ | 2,473 |
|
| Credit losses on debt securities for which impairment was not previously recognized | 170 |
| 353 |
| 3,619 |
| — |
| 170 |
| 353 |
|
| Credit losses on debt securities for which impairment was previously recognized | 2,368 |
| 4,716 |
| — |
| 1,490 |
| 2,368 |
| 4,716 |
|
| Credit losses reversed on securities sold | — |
| — |
| (1,146 | ) | |
| Increase in expected cash flows that are recognized over remaining life of security | (149 | ) | — |
| — |
| (115 | ) | (149 | ) | — |
|
| Balance at December 31 | $ | 9,931 |
| $ | 7,542 |
| $ | 2,473 |
| $ | 11,306 |
| $ | 9,931 |
| $ | 7,542 |
|
Securities with unrealized losses recorded in accumulated other comprehensive income are shown in the table below, along with the length of the impairment period. The table includes securities for which a portion of an OTTI has been recognized in other comprehensive income.
| | | | Less than 12 months | | 12 months or longer | | Total | Less than 12 months | | 12 months or longer | | Total |
(In thousands) | Fair Value | Unrealized Losses | | Fair Value | Unrealized Losses | | Fair Value | Unrealized Losses | Fair Value | Unrealized Losses | | Fair Value | Unrealized Losses | | Fair Value | Unrealized Losses |
| December 31, 2012 | | | | | | |
| U.S. government and federal agency obligations | | $ | 71,464 |
| $ | 1,607 |
| | $ | — |
| $ | — |
| | $ | 71,464 |
| $ | 1,607 |
|
| Government-sponsored enterprise obligations | | 102,082 |
| 677 |
| | — |
| — |
| | 102,082 |
| 677 |
|
| State and municipal obligations | | 173,600 |
| 2,107 |
| | 80,530 |
| 14,188 |
| | 254,130 |
| 16,295 |
|
| Mortgage and asset-backed securities: | | | | | | |
| Agency mortgage-backed securities | | 5,874 |
| 5 |
| | — |
| — |
| | 5,874 |
| 5 |
|
| Non-agency mortgage-backed securities | | — |
| — |
| | 12,609 |
| 118 |
| | 12,609 |
| 118 |
|
| Asset-backed securities | | 338,007 |
| 976 |
| | 78,684 |
| 391 |
| | 416,691 |
| 1,367 |
|
| Total mortgage and asset-backed securities | | 343,881 |
| 981 |
| | 91,293 |
| 509 |
| | 435,174 |
| 1,490 |
|
| Other debt securities | | 39,032 |
| 102 |
| | — |
| — |
| | 39,032 |
| 102 |
|
| Total | | $ | 730,059 |
| $ | 5,474 |
| | $ | 171,823 |
| $ | 14,697 |
| | $ | 901,882 |
| $ | 20,171 |
|
| December 31, 2011 | | | | | | | | | | |
| State and municipal obligations | $ | 65,962 |
| $ | 712 |
| | $ | 110,807 |
| $ | 10,507 |
| | $ | 176,769 |
| $ | 11,219 |
| $ | 65,962 |
| $ | 712 |
| | $ | 110,807 |
| $ | 10,507 |
| | $ | 176,769 |
| $ | 11,219 |
|
| Mortgage and asset-backed securities: | | | | | | | | | | |
| Agency mortgage-backed securities | 72,019 |
| 493 |
| | — |
| — |
| | 72,019 |
| 493 |
| 72,019 |
| 493 |
| | — |
| — |
| | 72,019 |
| 493 |
|
| Non-agency mortgage-backed securities | 23,672 |
| 784 |
| | 118,972 |
| 7,028 |
| | 142,644 |
| 7,812 |
| 23,672 |
| 784 |
| | 118,972 |
| 7,028 |
| | 142,644 |
| 7,812 |
|
| Asset-backed securities | 1,236,526 |
| 4,982 |
| | 87,224 |
| 1,394 |
| | 1,323,750 |
| 6,376 |
| 1,236,526 |
| 4,982 |
| | 87,224 |
| 1,394 |
| | 1,323,750 |
| 6,376 |
|
| Total mortgage and asset-backed securities | 1,332,217 |
| 6,259 |
| | 206,196 |
| 8,422 |
| | 1,538,413 |
| 14,681 |
| 1,332,217 |
| 6,259 |
| | 206,196 |
| 8,422 |
| | 1,538,413 |
| 14,681 |
|
| Total | $ | 1,398,179 |
| $ | 6,971 |
| | $ | 317,003 |
| $ | 18,929 |
| | $ | 1,715,182 |
| $ | 25,900 |
| $ | 1,398,179 |
| $ | 6,971 |
| | $ | 317,003 |
| $ | 18,929 |
| | $ | 1,715,182 |
| $ | 25,900 |
|
| December 31, 2010 | | | | | | |
| Government-sponsored enterprise obligations | $ | 10,850 |
| $ | 530 |
| | $ | — |
| $ | — |
| | $ | 10,850 |
| $ | 530 |
| |
| State and municipal obligations | 345,775 |
| 7,470 |
| | 82,269 |
| 9,173 |
| | 428,044 |
| 16,643 |
| |
| Mortgage and asset-backed securities: | | | | | | |
| Agency mortgage-backed securities | 660,326 |
| 3,440 |
| | — |
| — |
| | 660,326 |
| 3,440 |
| |
| Non-agency mortgage-backed securities | 15,893 |
| 36 |
| | 170,545 |
| 14,477 |
| | 186,438 |
| 14,513 |
| |
| Asset-backed securities | 487,822 |
| 1,029 |
| | 24,928 |
| 22 |
| | 512,750 |
| 1,051 |
| |
| Total mortgage and asset-backed securities | 1,164,041 |
| 4,505 |
| | 195,473 |
| 14,499 |
| | 1,359,514 |
| 19,004 |
| |
| Total | $ | 1,520,666 |
| $ | 12,505 |
| | $ | 277,742 |
| $ | 23,672 |
| | $ | 1,798,408 |
| $ | 36,177 |
| |
The total available for sale portfolio consisted of approximately 1,5001,700 individual securities at December 31, 20112012. The portfolio included 213144 securities, having an aggregate fair value of $1.7 billion901.9 million, that were in a loss position at December 31, 20112012. Securities identified as other-than-temporarily impaired which have been in a loss position for 12 months or longer totaled $105.4 million at fair value, or 1.1% of the total available for sale portfolio value. Securitiesincluded those with temporary impairment which have been in a loss position for 12 months or longer totaledtotaling $211.6166.3 million, or 2.3%1.7% of the total portfolio value.value, and other securities identified as other-than-temporarily impaired totaling $
5.5 million.
The Company’s holdings of state and municipal obligations included gross unrealized losses of $11.216.3 million at December 31, 20112012. Of these losses, $11.014.2 million related to auction rate securities, which are discussed above, and $206 thousand2.1 million related to other state and municipal obligations. This portfolio, excluding auction rate securities, totaled $1.11.5 billion at fair value, or 12.0%15.6% of total available for sale securities. The average credit quality of the portfolio, excluding auction rate securities, is Aa2 as rated by Moody’s. The portfolio is diversified in order to reduce risk, and information about the top five largest holdings, by state and economic sector, is shown in the table below.
| | | | % of Portfolio | Average Life (in years) | Average Rating (Moody��s) | % of Portfolio | Average Life (in years) | Average Rating (Moody’s) |
| At December 31, 2011 | | | |
| At December 31, 2012 | | | |
| Texas | 11.3 | % | 5.2 | Aa1 | 9.9 | % | 5.8 | Aa1 |
| Florida | 8.6 |
| 4.7 | Aa3 | 9.4 |
| 5.1 | Aa2 |
| Ohio | | 6.0 |
| 5.8 | Aa2 |
| Washington | 6.4 |
| 3.9 | Aa2 | 5.7 |
| 5.3 | Aa2 |
| Ohio | 4.8 |
| 5.2 | Aa2 | |
| Illinois | 4.8 |
| 5.6 | Aa3 | |
| New York | | 5.2 |
| 7.2 | Aa2 |
| General obligation | 24.8 | % | 4.3 | Aa2 | 31.7 | % | 5.2 | Aa2 |
| Housing | 20.5 |
| 4.6 | Aa1 | 18.2 |
| 7.2 | Aa1 |
| Lease | | 15.4 |
| 5.1 | Aa2 |
| Transportation | 15.8 |
| 3.9 | Aa3 | 13.3 |
| 4.8 | Aa3 |
| Lease | 13.4 |
| 3.7 | Aa3 | |
| Limited Tax | 5.9 |
| 5.1 | Aa1 | |
| Limited tax | | 5.0 |
| 5.9 | Aa1 |
The credit ratings (Moody’s rating or equivalent) at December 31, 20112012 in the state and municipal bond portfolio (excluding auction rate securities) are shown in the following table. The average credit quality of the portfolio is Aa2 as rated by Moody’s.
|
| | |
| | % of Portfolio |
| Aaa | 14.911.5 | % |
| Aa | 67.270.0 |
|
| A | 14.916.1 |
|
| Baa | 1.3.7 |
|
| Not rated | 1.7 |
|
| | 100.0 | % |
The remaining unrealized losses on the Company’s investments, as shown in the preceding tables, are largely contained in the portfolio of non-agency mortgage-backed and other asset-backed securities. These securities are not guaranteed by an outside agency and are dependent on payments received from the underlying collateral. While virtually all of these securities, at purchase date, were comprised of senior tranches and were highly rated by various rating agencies, changes in interest rates, the adverse housing market, liquidity pressures and overall economic climate has resulted in a decline in fair values for certain of these securities. Also, as mentioned above, the Company maintains a watch list comprised mainly of these securities and has recorded OTTI losses on certain securities.
The following table presents proceeds from sales of securities and the components of investment securities gains and losses which have been recognized in earnings.
| | | (In thousands) | 2011 | 2010 | 2009 | 2012 | 2011 | 2010 |
| Proceeds from sales of available for sale securities | $ | 11,202 |
| $ | 78,448 |
| $ | 202,544 |
| $ | 5,231 |
| $ | 11,202 |
| $ | 78,448 |
|
| Proceeds from sales of non-marketable securities | 8,631 |
| 192 |
| 5,308 |
| 11,644 |
| 8,631 |
| 192 |
|
| Total proceeds | $ | 19,833 |
| $ | 78,640 |
| $ | 207,852 |
| $ | 16,875 |
| $ | 19,833 |
| $ | 78,640 |
|
| Available for sale: | | |
| Gains realized on sales | $ | 177 |
| $ | 3,639 |
| $ | 10,311 |
| $ | 358 |
| $ | 177 |
| $ | 3,639 |
|
| Losses realized on sales | — |
| (151 | ) | (9,989 | ) | — |
| — |
| (151 | ) |
| Other-than-temporary impairment recognized on debt securities | (2,537 | ) | (5,069 | ) | (2,473 | ) | (1,490 | ) | (2,537 | ) | (5,069 | ) |
| Non-marketable: | | |
| Gains realized on sales | 2,388 |
| 52 |
| 1,087 |
| 1,655 |
| 2,388 |
| 52 |
|
| Losses realized on sales | — |
| — |
| (170 | ) | (200 | ) | — |
| — |
|
| Fair value adjustments, net | 10,784 |
| (256 | ) | (5,961 | ) | 4,505 |
| 10,784 |
| (256 | ) |
| Investment securities gains (losses), net | $ | 10,812 |
| $ | (1,785 | ) | $ | (7,195 | ) | $ | 4,828 |
| $ | 10,812 |
| $ | (1,785 | ) |
Investment securities with a fair value oftotaling $4.3 billion and $3.6 billionin fair value were pledged at both December 31, 20112012 and 20102011, respectively, to secure public deposits, securities sold under repurchase agreements, trust funds, and borrowings at the Federal Reserve Bank. Securities pledged under agreements pursuant to which the collateral may be sold or re-pledged by the secured parties approximated $418.0736.2 million, while the remaining securities were pledged under agreements pursuant to which the secured parties may not sell or re-pledge the
collateral. Except for obligations of various government-sponsored enterprises such as FNMA, FHLB and FHLMC, no investment in a single issuer exceeds 10% of stockholders’ equity.
During 2012, the Company entered into several agreements commonly known as collateral swaps. These agreements involve the exchange of collateral under simultaneous repurchase and resell agreements with the same financial institution counterparty. These repurchase and resell agreements have the same principal amounts, inception dates, and maturity dates and have been offset against each other in the balance sheet, as permitted under the netting provisions of ASC 210-20-45. At December 31, 2012, the Company had posted collateral consisting of $314.0 million in agency mortgage-backed securities and accepted $345.5 million in investment grade asset-backed, commercial mortgage-backed, and corporate bonds on collateral swaps of $300.0 million. The agreements mature in 2013 through 2015, and the Company will earn an average interest rate of approximately 86 basis points during their term.
4. Land, Buildings and Equipment
Land, buildings and equipment consist of the following at December 31, 20112012 and 20102011:
| | | (In thousands) | 2011 | 2010 | 2012 | 2011 |
| Land | $ | 100,748 |
| $ | 107,906 |
| $ | 107,540 |
| $ | 100,748 |
|
| Buildings and improvements | 517,691 |
| 512,826 |
| 523,662 |
| 517,691 |
|
| Equipment | 223,548 |
| 222,606 |
| 229,370 |
| 223,548 |
|
| Total | 841,987 |
| 843,338 |
| 860,572 |
| 841,987 |
|
| Less accumulated depreciation and amortization | 481,841 |
| 459,941 |
| 502,960 |
| 481,841 |
|
| Net land, buildings and equipment | $ | 360,146 |
| $ | 383,397 |
| $ | 357,612 |
| $ | 360,146 |
|
Depreciation expense of $34.532.2 million, $35.134.5 million and $37.035.1 million for 20112012, 20102011 and 20092010, respectively, was included in occupancy expense and equipment expense in the consolidated income statements. Repairs and maintenance expense of $17.717.3 million, $18.517.7 million and $18.618.5 million for 20112012, 20102011 and 20092010, respectively, was included in occupancy expense and equipment expense. Interest expense capitalized on construction projects in the past three years has not been significant.
5. Goodwill and Other Intangible Assets
The following table presents information about the Company's intangible assets which have estimable useful lives.
| | | | | December 31, 2011 | | December 31, 2010 | | December 31, 2012 | | December 31, 2011 |
(In thousands) | | Gross Carrying Amount | | Accumulated Amortization | | Valuation Allowance | | Net Amount | | Gross Carrying Amount | | Accumulated Amortization | | Valuation Allowance | | Net Amount | | Gross Carrying Amount | | Accumulated Amortization | | Valuation Allowance | | Net Amount | | Gross Carrying Amount | | Accumulated Amortization | | Valuation Allowance | | Net Amount |
| Amortizable intangible assets: | | | | | | | | | | | | | | | | | | | | | | | | | | | | | | | | |
| Core deposit premium | | $ | 25,720 |
| | $ | (18,750 | ) | | $ | — |
| | $ | 6,970 |
| | $ | 25,720 |
| | $ | (16,108 | ) | | $ | — |
| | $ | 9,612 |
| | $ | 25,720 |
| | $ | (20,892 | ) | | $ | — |
| | $ | 4,828 |
| | $ | 25,720 |
| | $ | (18,750 | ) | | $ | — |
| | $ | 6,970 |
|
| Mortgage servicing rights | | 3,097 |
| | (1,926 | ) | | (427 | ) | | 744 |
| | 3,082 |
| | (1,572 | ) | | (185 | ) | | 1,325 |
| | 3,132 |
| | (2,267 | ) | | (393 | ) | | 472 |
| | 3,097 |
| | (1,926 | ) | | (427 | ) | | 744 |
|
| Total | | $ | 28,817 |
| | $ | (20,676 | ) | | $ | (427 | ) | | $ | 7,714 |
| | $ | 28,802 |
| | $ | (17,680 | ) | | $ | (185 | ) | | $ | 10,937 |
| | $ | 28,852 |
| | $ | (23,159 | ) | | $ | (393 | ) | | $ | 5,300 |
| | $ | 28,817 |
| | $ | (20,676 | ) | | $ | (427 | ) | | $ | 7,714 |
|
The carrying amount of goodwill and its allocation among segments at year end is shown in the table below. As a result of ongoing assessments, no impairment of goodwill was recorded in 20112012, 20102011 or 20092010. Further, the regular annual review on January 1, 20122013 revealed no impairment as of that date.
| | | (In thousands) | Consumer Segment | | Commercial Segment | | Wealth Segment | | Total Goodwill | Consumer Segment | | Commercial Segment | | Wealth Segment | | Total Goodwill |
| Balance at December 31, 2011 | $ | 67,765 |
| | $ | 57,074 |
| | $ | 746 |
| | $ | 125,585 |
| |
| Balance at December 31, 2012 | | $ | 67,765 |
| | $ | 57,074 |
| | $ | 746 |
| | $ | 125,585 |
|
Changes in the net carrying amount of goodwill and other net intangible assets for the years ended December 31, 20112012 and 20102011 are shown in the following table.
| | | (In thousands) | Goodwill | Core Deposit Premium | Mortgage Servicing Rights | Goodwill | Core Deposit Premium | Mortgage Servicing Rights |
| Balance at December 31, 2009 | $ | 125,585 |
| $ | 12,754 |
| $ | 1,579 |
| |
| Originations | — |
| — |
| 184 |
| |
| Amortization | — |
| (3,142 | ) | (366 | ) | |
| Impairment | — |
| — |
| (72 | ) | |
| Balance at December 31, 2010 | 125,585 |
| 9,612 |
| 1,325 |
| $ | 125,585 |
| $ | 9,612 |
| $ | 1,325 |
|
| Originations | — |
| — |
| 15 |
| — |
| — |
| 15 |
|
| Amortization | — |
| (2,642 | ) | (354 | ) | — |
| (2,642 | ) | (354 | ) |
| Impairment | — |
| — |
| (242 | ) | — |
| — |
| (242 | ) |
| Balance at December 31, 2011 | $ | 125,585 |
| $ | 6,970 |
| $ | 744 |
| 125,585 |
| 6,970 |
| 744 |
|
| Originations | | — |
| — |
| 35 |
|
| Amortization | | — |
| (2,142 | ) | (341 | ) |
| Impairment reversal | | — |
| — |
| 34 |
|
| Balance at December 31, 2012 | | $ | 125,585 |
| $ | 4,828 |
| $ | 472 |
|
Mortgage servicing rights (MSRs) are initially recorded at fair value and subsequently amortized over the period of estimated servicing income. They are periodically reviewed for impairment and if impairment is indicated, recorded at fair value. At December 31, 20112012, temporary impairment of $427393 thousand had been recognized. Temporary impairment, including impairment recovery, is effected through a change in a valuation allowance. The fair value of the MSRs is based on the present value of expected future cash flows, as further discussed in Note 15 on Fair Value Measurements.
Aggregate amortization expense on intangible assets for the years ended December 31, 20112012, 20102011 and 20092010 was $3.02.5 million, $3.53.0 million and $4.03.5 million, respectively. The following table shows the estimated future amortization expense based on existing asset balances and the interest rate environment as of December 31, 20112012. The Company’s actual amortization expense in any given period may be different from the estimated amounts depending upon the acquisition of intangible assets, changes in mortgage interest rates, prepayment rates and other market conditions.
| | | (In thousands) | | |
| 2012 | $ | 2,322 |
| |
| 2013 | 1,772 |
| $ | 1,751 |
|
| 2014 | 1,289 |
| 1,270 |
|
| 2015 | 942 |
| 928 |
|
| 2016 | 628 | 617 |
|
| 2017 | | 345 |
6. Deposits
At December 31, 2011,2012, the scheduled maturities of total time open and certificates of deposit were as follows:
| | | (In thousands) | | |
| Due in 2012 | $ | 1,873,682 |
| |
| Due in 2013 | 364,343 |
| $ | 1,768,087 |
|
| Due in 2014 | 81,204 |
| 242,439 |
|
| Due in 2015 | 71,225 |
| 88,227 |
|
| Due in 2016 | 97,860 |
| 86,876 |
|
| Due in 2017 | | 45,149 |
|
| Thereafter | 79 |
| 29 |
|
| Total | $ | 2,488,393 |
| $ | 2,230,807 |
|
The following table shows a detailed breakdown of the maturities of time open and certificates of deposit, by size category, at December 31, 20112012.
| | | (In thousands) | Certificates of Deposit under $100,000 | Other Time Deposits under $100,000 | Certificates of Deposit over $100,000 | Other Time Deposits over $100,000 | Total | Certificates of Deposit under $100,000 | Other Time Deposits under $100,000 | Certificates of Deposit over $100,000 | Other Time Deposits over $100,000 | Total |
| Due in 3 months or less | $ | 199,626 |
| $ | 56,576 |
| $ | 396,840 |
| $ | 42,332 |
| $ | 695,374 |
| $ | 175,548 |
| $ | 33,383 |
| $ | 351,136 |
| $ | 24,735 |
| $ | 584,802 |
|
| Due in over 3 through 6 months | 221,933 |
| 36,415 |
| 253,528 |
| 34,992 |
| 546,868 |
| 210,490 |
| 41,118 |
| 195,824 |
| 35,488 |
| 482,920 |
|
| Due in over 6 through 12 months | 273,537 |
| 51,541 |
| 227,782 |
| 78,580 |
| 631,440 |
| 335,213 |
| 54,523 |
| 228,622 |
| 82,007 |
| 700,365 |
|
| Due in over 12 months | 241,879 |
| 84,597 |
| 269,811 |
| 18,424 |
| 614,711 |
| 139,625 |
| 84,718 |
| 216,623 |
| 21,754 |
| 462,720 |
|
| Total | $ | 936,975 |
| $ | 229,129 |
| $ | 1,147,961 |
| $ | 174,328 |
| $ | 2,488,393 |
| $ | 860,876 |
| $ | 213,742 |
| $ | 992,205 |
| $ | 163,984 |
| $ | 2,230,807 |
|
Regulations of the Federal Reserve System require cash balances to be maintained at the Federal Reserve Bank, based on certain deposit levels. The minimum reserve requirement for the Bank at December 31, 20112012 totaled $47.361.1 million.
7. Borrowings
The following table sets forth selected information for short-term borrowings (borrowings with an original maturity of less than one year).
| | | (Dollars in thousands) | Year End Weighted Rate | Average Weighted Rate | Average Balance Outstanding | Maximum Outstanding at any Month End | Balance at December 31 | Year End Weighted Rate | Average Weighted Rate | Average Balance Outstanding | Maximum Outstanding at any Month End | Balance at December 31 |
| Federal funds purchased and repurchase agreements: | | | | |
| 2012 | | .1 | % | .1 | % | $ | 785,978 |
| $ | 1,149,156 |
| $ | 683,550 |
|
| 2011 | .1 | % | .1 | % | $ | 635,009 |
| $ | 1,002,092 |
| $ | 856,081 |
| .1 |
| .1 |
| 635,009 |
| 1,002,092 |
| 856,081 |
|
| 2010 | .1 |
| .1 |
| 624,847 |
| 1,130,555 |
| 582,827 |
| .1 |
| .1 |
| 624,847 |
| 1,130,555 |
| 582,827 |
|
| 2009 | .1 |
| .1 |
| 468,643 |
| 674,121 |
| 603,191 |
| |
Short-term borrowings consist primarily of federal funds purchased and securities sold under agreements to repurchase (repurchase agreements), which generally mature within 90 days. Short-term repurchase agreements at December 31, 20112012 were comprised of non-insured customer funds totaling $702.8659.0 million, which were secured by a portion of the Company’s investment portfolio.
Long-term borrowings of the Company consisted of the following at December 31, 20112012:
| | | (Dollars in thousands) | Borrower | Maturity Date | Year End Weighted Rate | | Year End Balance | Borrower | Maturity Date | Year End Weighted Rate | | Year End Balance |
| FHLB advances | Subsidiary bank | 2012 | 4.6 | % | $ | 460 |
| Subsidiary bank | 2013 | 4.7 | % | $ | 1,510 |
|
| | | 2013-16 | 4.9 | | 3,842 |
| | 2014-17 | 3.5 | | 102,200 |
|
| | | 2017 | 3.5 | | 100,000 |
| |
| Structured repurchase agreements | Subsidiary bank | 2013-14 | .0 | | 400,000 |
| Subsidiary bank | 2013-14 | .0 | | 400,000 |
|
| Structured note payable | Private equity subsidiary | 2012 | .0 | | 7,515 |
| |
| Total | | $ | 511,817 |
| | $ | 503,710 |
|
The Bank is a member of the Des Moines FHLB and has access to term financing from the FHLB. These borrowings are secured under a blanket collateral agreement including primarily residential mortgages as well as all unencumbered assets and stock of the borrowing bank. Total outstanding advances at December 31, 20112012 were $104.3103.7 million. All of the outstanding advances have fixed interest rates and contain prepayment penalties. The FHLB has also issued letters of credit, totaling $169.5260.1 million at December 31, 20112012, to secure the Company’s obligations to certain depositors of public funds.
Structured repurchase agreements totaled $400.0 million at December 31, 20112012. These borrowings have floating interest rates based upon various published constant maturity swap (CMS) rates and will mature in 2013 and 2014. They are secured by agency mortgage-backed and U.S. government securities in the Company's investment portfolio.portfolio, which totaled $422.2 million at December 31, 2012. As of year end, the majority of thethese agreements did not bear interest because of low CMS rates.
Other long-term debt includes $7.5 million borrowed from third-party insurance companies by a private equity subsidiary, a Missouri Certified Capital Company, to support its investment activities. Because the insurance companies receive tax credits, the borrowings do not bear interest. This debt is secured by assets of the subsidiary and guaranteed by the Parent, evidenced by letters of credit from the Bank.
8. Income Taxes
The components of income tax expense (benefit) from operations for the years ended December 31, 20112012, 20102011 and 20092010 were as follows:
| | | (In thousands) | Current | Deferred | Total | Current | Deferred | Total |
| Year ended December 31, 2012: | | |
| U.S. federal | | $ | 100,210 |
| $ | 15,125 |
| $ | 115,335 |
|
| State and local | | 10,725 |
| 1,109 |
| 11,834 |
|
| Total | | $ | 110,935 |
| $ | 16,234 |
| $ | 127,169 |
|
| Year ended December 31, 2011: | | |
| U.S. federal | $ | 113,920 |
| $ | (2,720 | ) | $ | 111,200 |
| $ | 113,920 |
| $ | (2,720 | ) | $ | 111,200 |
|
| State and local | 10,328 |
| (116 | ) | 10,212 |
| 10,328 |
| (116 | ) | 10,212 |
|
| | $ | 124,248 |
| $ | (2,836 | ) | $ | 121,412 |
| |
| Total | | $ | 124,248 |
| $ | (2,836 | ) | $ | 121,412 |
|
| Year ended December 31, 2010: | | |
| U.S. federal | $ | 98,592 |
| $ | (6,612 | ) | $ | 91,980 |
| $ | 98,592 |
| $ | (6,612 | ) | $ | 91,980 |
|
| State and local | 6,742 |
| (2,473 | ) | 4,269 |
| 6,742 |
| (2,473 | ) | 4,269 |
|
| | $ | 105,334 |
| $ | (9,085 | ) | $ | 96,249 |
| |
| Year ended December 31, 2009: | | |
| U.S. federal | $ | 77,753 |
| $ | (6,719 | ) | $ | 71,034 |
| |
| State and local | 3,314 |
| (591 | ) | 2,723 |
| |
| | $ | 81,067 |
| $ | (7,310 | ) | $ | 73,757 |
| |
| Total | | $ | 105,334 |
| $ | (9,085 | ) | $ | 96,249 |
|
The components of income tax expense recorded directly to stockholders’ equity for the years ended December 31, 20112012, 20102011 and 20092010 were as follows:
| | | (In thousands) | 2011 | 2010 | 2009 | 2012 | 2011 | 2010 |
| Unrealized gain on securities available for sale | $ | 31,565 |
| $ | 9,841 |
| $ | 61,701 |
| $ | 19,425 |
| $ | 31,565 |
| $ | 9,841 |
|
| Accumulated pension (benefit) loss | | (3,608 | ) | (2,641 | ) | 327 |
|
| Compensation expense for tax purposes in excess of amounts recognized for financial reporting purposes | (1,065 | ) | (1,201 | ) | (557 | ) | (2,094 | ) | (1,065 | ) | (1,201 | ) |
| Accumulated pension (benefit) loss | (2,641 | ) | 327 |
| 1,476 |
| |
| Income tax expense allocated to stockholders’ equity | $ | 27,859 |
| $ | 8,967 |
| $ | 62,620 |
| $ | 13,723 |
| $ | 27,859 |
| $ | 8,967 |
|
Significant components of the Company’s deferred tax assets and liabilities at December 31, 20112012 and 20102011 were as follows:
| | | (In thousands) | 2011 | 2010 | 2012 | 2011 |
| Deferred tax assets: | | |
| Loans, principally due to allowance for loan losses | $ | 86,677 |
| $ | 90,875 |
| $ | 75,710 |
| $ | 86,677 |
|
| Accrued expenses | | 15,528 |
| 17,652 |
|
| Equity-based compensation | 13,218 |
| 13,707 |
| 12,469 |
| 13,218 |
|
| Accrued expenses | 17,652 |
| 8,886 |
| |
| Pension | | 7,840 |
| 3,645 |
|
| Deferred compensation | 5,739 |
| 5,374 |
| 6,280 |
| 5,739 |
|
| Other | 14,445 |
| 9,135 |
| 11,799 |
| 10,800 |
|
| Total deferred tax assets | 137,731 |
| 127,977 |
| 129,626 |
| 137,731 |
|
| Deferred tax liabilities: | | |
| Unrealized gain on securities available for sale | 80,790 |
| 49,225 |
| 100,215 |
| 80,790 |
|
| Equipment lease financing | 48,451 |
| 47,976 |
| 54,980 |
| 48,451 |
|
| Land, buildings and equipment | 19,116 |
| 20,579 |
| 16,433 |
| 19,116 |
|
| Accretion on investment securities | | 6,613 |
| 6,877 |
|
| Intangibles | 4,642 |
| 4,700 |
| 4,867 |
| 4,642 |
|
| Accretion on investment securities | 6,877 |
| 3,922 |
| |
| Prepaid expenses | 2,861 |
| 2,775 |
| 3,119 |
| 2,861 |
|
| Other | 4,823 |
| 2,541 |
| 5,280 |
| 4,823 |
|
| Total deferred tax liabilities | 167,560 |
| 131,718 |
| 191,507 |
| 167,560 |
|
| Net deferred tax asset (liability) | $ | (29,829 | ) | $ | (3,741 | ) | |
| Net deferred tax liabilities | | $ | (61,881 | ) | $ | (29,829 | ) |
The Company acquired a federal net operating loss (NOL) carryforward of approximately $$4.3 million in connection with a 2003 acquisition.acquisition, and the remaining unused NOL carryforward totaled $121 thousand at December 31, 2012. The NOL carryforward will begin to expire in 20212022 if it cannot be utilized. At December 31, 2011, the tax benefit related to the remaining NOL carryforward was $269 thousand. Management believes it is more likely than not that the results of future operations will generate sufficient taxable income to realize the total deferred tax assets.
A reconciliation between the expected federal income tax expense using the federal statutory tax rate of 3535% percent and the Company’s actual income tax expense for 20112012, 20102011 and 20092010 is as follows:provided in the table below. The effective tax rate is calculated by dividing income taxes by income before income taxes less the non-controlling interest expense.
| | | (In thousands) | 2011 | 2010 | 2009 | 2012 | 2011 | 2010 |
| Computed “expected” tax expense | $ | 132,214 |
| $ | 111,286 |
| $ | 84,991 |
| $ | 138,774 |
| $ | 132,214 |
| $ | 111,286 |
|
| Increase (decrease) in income taxes resulting from: | | |
| Tax-exempt interest, net of cost to carry | (14,815 | ) | (12,745 | ) | (11,813 | ) | (15,516 | ) | (14,815 | ) | (12,745 | ) |
| State and local income taxes, net of federal tax benefit | | 7,692 |
| 6,638 |
| 2,775 |
|
| Tax deductible dividends on allocated shares held by the Company’s ESOP | (1,058 | ) | (1,096 | ) | (1,087 | ) | (2,991 | ) | (1,058 | ) | (1,096 | ) |
| State and local income taxes, net of federal tax benefit | 6,638 |
| 2,775 |
| 1,770 |
| |
| Other | (1,567 | ) | (3,971 | ) | (104 | ) | (790 | ) | (1,567 | ) | (3,971 | ) |
| Total income tax expense | $ | 121,412 |
| $ | 96,249 |
| $ | 73,757 |
| $ | 127,169 |
| $ | 121,412 |
| $ | 96,249 |
|
It is the Company’s policy to recognize interest and penalties related to income tax matters in income tax expense. The Company recorded tax benefits related to interest and penalties of $1$81 thousand, $68$1 thousand and $156$68 thousand in 20112012, 20102011 and 20092010, respectively. At December 31, 20112012 and 20102011, liabilities for interest and penalties were $258$176 thousand and $268$258 thousand, respectively.
As of December 31, 20112012 and 20102011, the gross amount of unrecognized tax benefits was $$1.6 million, and the total amount of unrecognized tax benefits that would impact the effective tax rate, if recognized, was $1.0$1.1 million and $1.1$1.0 million, respectively. While it is expected that the amount of unrecognized tax benefits will change in the next twelve months, the Company does not expect this change to have a material impact on the results of operations or the financial position of the Company.
The Company and its subsidiaries are subject to income tax by federal, state and local government taxing authorities. Tax years 20082009 through 20112012 remain open to examination for U.S. federal income tax. Tax years 2008 through 2011 remain open to examinationtax as well as income tax in major state taxing jurisdictions.
The activity in the accrued liability for unrecognized tax benefits for the years ended December 31, 20112012 and 20102011 was as follows:
| | | (In thousands) | 2011 | 2010 | 2012 | 2011 |
| Unrecognized tax benefits at beginning of year | $ | 1,613 |
| $ | 2,714 |
| $ | 1,584 |
| $ | 1,613 |
|
| Gross increases – tax positions in prior period | 12 |
| 166 |
| 417 |
| 12 |
|
| Gross decreases – tax positions in prior period | (8 | ) | (1,044 | ) | (25 | ) | (8 | ) |
| Gross increases – current-period tax positions | 292 |
| 328 |
| 219 |
| 292 |
|
| Settlements | — |
| (251 | ) | |
| Lapse of statute of limitations | (325 | ) | (300 | ) | (614 | ) | (325 | ) |
| Unrecognized tax benefits at end of year | $ | 1,584 |
| $ | 1,613 |
| $ | 1,581 |
| $ | 1,584 |
|
9. Employee Benefit Plans
Employee benefits charged to operating expenses are summarized in the table below. Substantially all of the Company’s employees are covered by a defined contribution (401K)(401(k)) plan, under which the Company makes matching contributions.
| | | (In thousands) | 2011 | 2010 | 2009 | 2012 | 2011 | 2010 |
| Payroll taxes | $ | 20,703 |
| $ | 20,226 |
| $ | 20,587 |
| $ | 21,247 |
| $ | 20,703 |
| $ | 20,226 |
|
| Medical plans | 16,350 |
| 18,248 |
| 20,164 |
| 19,861 |
| 16,350 |
| 18,248 |
|
| 401K plan | 11,728 |
| 11,448 |
| 9,771 |
| |
| 401(k) plan | | 12,613 |
| 11,728 |
| 11,448 |
|
| Pension plans | 994 |
| 1,815 |
| 3,023 |
| 2,441 |
| 994 |
| 1,815 |
|
| Other | 2,232 |
| 2,138 |
| 1,945 |
| 2,062 |
| 2,232 |
| 2,138 |
|
| Total employee benefits | $ | 52,007 |
| $ | 53,875 |
| $ | 55,490 |
| $ | 58,224 |
| $ | 52,007 |
| $ | 53,875 |
|
A large portion of the Company’s current employees are covered by a noncontributory defined benefit pension plan, however, participation in the pension plan is not available to employees hired after June 30, 2003. All participants are fully vested in their benefit payable upon normal retirement date, which is based on years of participation and compensation. Certain key executives also participate in a supplemental executive retirement plan (the CERP) that the Company funds only as retirement benefits are disbursed. The CERP carries no segregated assets.
Effective January 1, 2005, substantially all benefits accrued under the pension plan were frozen. With this change, certain annual salary credits to pension accounts were discontinued, however, the accounts continue to accrue interest at a stated annual rate. Enhancements were then made to the 401K401(k) plan, which have increased employer contributions to the 401K401(k) plan.
Enhancements were also made to the CERP, providing credits based on hypothetical contributions in excess of those permitted under the 401K401(k) plan. Effective January 1, 2011, all remaining benefits accrued under the pension plan were frozen.
Under the Company’s funding policy for the defined benefit pension plan, contributions are made to a trust as necessary to satisfy the statutory minimum required contribution as defined by the Pension Protection Act, which is intended to provide for current service accruals and for any unfunded accrued actuarial liabilities over a reasonable period. To the extent that these requirements are fully covered by assets in the trust, a contribution might not be made in a particular year. The Company made no contributionsa discretionary contribution of $1.5 million to theits defined benefit pension plan in 2011 and the2012 in order to reduce pension guarantee premiums. The minimum required contribution for 20122013 is expected to be zero.zero. The Company does not expect to make any further contributions other than the necessary funding contributions to the CERP. Contributions to the CERP were $1865 thousand, $1018 thousand and $10 thousand during fiscal 20112012, 20102011 and 20092010, respectively.
Benefit obligations of the CERP at the December 31, 20112012 and 20102011 valuation dates are shown in the table immediately below. In all other tables presented, the pension plan and the CERP are presented on a combined basis.
| | | (In thousands) | 2011 | 2010 | 2012 | 2011 |
| Projected benefit obligation | $ | 3,263 |
| $ | 2,829 |
| $ | 3,811 |
| $ | 3,263 |
|
| Accumulated benefit obligation | $ | 3,263 |
| $ | 2,829 |
| $ | 3,811 |
| $ | 3,263 |
|
The following items are components of the net pension cost for the years ended December 31, 20112012, 20102011 and 20092010.
| | | (In thousands) | 2011 | 2010 | 2009 | 2012 | 2011 | 2010 |
| Service cost-benefits earned during the year | $ | 406 |
| $ | 716 |
| $ | 683 |
| $ | 504 |
| $ | 406 |
| $ | 716 |
|
| Interest cost on projected benefit obligation | 5,366 |
| 5,505 |
| 5,473 |
| 5,162 |
| 5,366 |
| 5,505 |
|
| Expected return on plan assets | (6,727 | ) | (6,614 | ) | (6,123 | ) | (6,178 | ) | (6,727 | ) | (6,614 | ) |
| Amortization of unrecognized net loss | 1,949 |
| 2,208 |
| 2,990 |
| 2,953 |
| 1,949 |
| 2,208 |
|
| Net periodic pension cost | $ | 994 |
| $ | 1,815 |
| $ | 3,023 |
| $ | 2,441 |
| $ | 994 |
| $ | 1,815 |
|
The following table sets forth the pension plans’ funded status, using valuation dates of December 31, 20112012 and 20102011.
| | (In thousands) | 2011 | 2010 | 2012 | 2011 |
| Change in projected benefit obligation | | |
| Projected benefit obligation at prior valuation date | $ | 103,857 |
| $ | 98,148 |
| $ | 110,186 |
| $ | 103,857 |
|
| Service cost | 406 |
| 716 |
| 504 |
| 406 |
|
| Interest cost | 5,366 |
| 5,505 |
| 5,162 |
| 5,366 |
|
| Benefits paid | (4,766 | ) | (4,768 | ) | (5,248 | ) | (4,766 | ) |
| Actuarial (gain) loss | 5,323 |
| 4,256 |
| |
| Actuarial loss | | 14,543 |
| 5,323 |
|
| Projected benefit obligation at valuation date | 110,186 |
| 103,857 |
| 125,147 |
| 110,186 |
|
| Change in plan assets | | |
| Fair value of plan assets at prior valuation date | 98,824 |
| 93,498 |
| 97,228 |
| 98,824 |
|
| Actual return (loss) on plan assets | 3,152 |
| 10,084 |
| |
| Actual return on plan assets | | 8,274 |
| 3,152 |
|
| Employer contributions | 18 |
| 10 |
| 1,580 |
| 18 |
|
| Benefits paid | (4,766 | ) | (4,768 | ) | (5,248 | ) | (4,766 | ) |
| Fair value of plan assets at valuation date | 97,228 |
| 98,824 |
| 101,834 |
| 97,228 |
|
| Funded status and net amount recognized at valuation date | $ | (12,958 | ) | $ | (5,033 | ) | $ | (23,313 | ) | $ | (12,958 | ) |
The accumulated benefit obligation, which represents the liability of a plan using only benefits as of the measurement date, was $110.2125.1 million and $103.9110.2 million for the combined plans on December 31, 20112012 and 20102011, respectively.
Amounts not yet reflected in net periodic benefit cost and included in accumulated other comprehensive income (loss) at December 31, 20112012 and 20102011 are shown below, including amounts recognized in other comprehensive income during the periods. All amounts are shown on a pre-tax basis.
| | | (In thousands) | 2011 | 2010 | 2012 | 2011 |
| Prior service credit (cost) | $ | — |
| $ | — |
| $ | — |
| $ | — |
|
| Accumulated loss | (34,355 | ) | (27,406 | ) | (43,849 | ) | (34,355 | ) |
| Accumulated other comprehensive loss | (34,355 | ) | (27,406 | ) | (43,849 | ) | (34,355 | ) |
| Cumulative employer contributions in excess of net periodic benefit cost | 21,397 |
| 22,373 |
| 20,536 |
| 21,397 |
|
| Net amount recognized as an accrued benefit liability on the December 31 balance sheet | $ | (12,958 | ) | $ | (5,033 | ) | $ | (23,313 | ) | $ | (12,958 | ) |
| Net gain (loss) arising during period | $ | (8,898 | ) | $ | (786 | ) | |
| Net loss arising during period | | $ | (12,447 | ) | $ | (8,898 | ) |
| Amortization of net loss | 1,949 |
| 2,208 |
| 2,953 |
| 1,949 |
|
| Total recognized in other comprehensive income | $ | (6,949 | ) | $ | 1,422 |
| $ | (9,494 | ) | $ | (6,949 | ) |
| Total expense recognized in net periodic pension cost and other comprehensive income | $ | (7,943 | ) | $ | (393 | ) | $ | (11,935 | ) | $ | (7,943 | ) |
The estimated net loss to be amortized from accumulated other comprehensive income into net periodic pension cost in 20122013 is $2.93.1 million.
The following assumptions, on a weighted average basis, were used in accounting for the plans.
|
| | | | | | |
| | 2011 | 2010 | 2009 |
| Determination of benefit obligation at year end: | | | |
| Discount rate | 4.80 | % | 5.40 | % | 5.75 | % |
| Assumed credit on cash balance accounts | 5.00 | % | 5.00 | % | 5.00 | % |
| Determination of net periodic benefit cost for year ended: | | | |
| Discount rate | 5.40 | % | 5.75 | % | 6.00 | % |
| Long-term rate of return on assets | 7.00 | % | 7.25 | % | 7.25 | % |
| Assumed credit on cash balance accounts | 5.00 | % | 5.00 | % | 5.00 | % |
|
| | | | | | |
| | 2012 | 2011 | 2010 |
| Determination of benefit obligation at year end: | | | |
| Discount rate | 3.65 | % | 4.80 | % | 5.40 | % |
| Assumed credit on cash balance accounts | 5.00 | % | 5.00 | % | 5.00 | % |
| Determination of net periodic benefit cost for year ended: | | | |
| Discount rate | 4.80 | % | 5.40 | % | 5.75 | % |
| Long-term rate of return on assets | 6.50 | % | 7.00 | % | 7.25 | % |
| Assumed credit on cash balance accounts | 5.00 | % | 5.00 | % | 5.00 | % |
The following table shows the fair values of the Company’s pension plan assets by asset category at December 31, 20112012 and 20102011. Information about the valuation techniques and inputs used to measure fair value are provided in Note 15 on Fair Value Measurements.
| | | | | Fair Value Measurements | | Fair Value Measurements |
| (In thousands) | Total Fair Value | Quoted Prices in Active Markets for Identical Assets (Level 1) | Significant Other Observable Inputs (Level 2) | Significant Unobservable Inputs (Level 3) | Total Fair Value | Quoted Prices in Active Markets for Identical Assets (Level 1) | Significant Other Observable Inputs (Level 2) | Significant Unobservable Inputs (Level 3) |
| December 31, 2012 | | |
| Assets: | | |
| Cash | | $ | 31 |
| $ | 31 |
| $ | — |
| $ | — |
|
| U.S. government obligations | | 343 |
| 343 |
| — |
| — |
|
Government-sponsored enterprise obligations (a) | | 6,930 |
| — |
| 6,930 |
| — |
|
| State and municipal obligations | | 5,700 |
| — |
| 5,700 |
| — |
|
Agency mortgage-backed securities (b) | | 3,000 |
| — |
| 3,000 |
| — |
|
| Non-agency mortgage-backed securities | | 6,936 |
| — |
| 6,936 |
| — |
|
| Asset-backed securities | | 7,125 |
| — |
| 7,125 |
| — |
|
Corporate bonds (c) | | 23,962 |
| — |
| 23,962 |
| — |
|
| International bonds | | 3,691 |
| — |
| 3,691 |
| — |
|
Equity securities and mutual funds: (d) | | |
| U.S. large-cap | | 22,400 |
| 22,400 |
| — |
| — |
|
| U.S. mid-cap | | 12,600 |
| 12,600 |
| — |
| — |
|
| U.S. small-cap | | 3,792 |
| 3,792 |
| — |
| — |
|
| International developed markets | | 908 |
| 908 |
| — |
| — |
|
| Emerging markets | | 916 |
| 916 |
| — |
| — |
|
| Money market funds | | 3,500 |
| 3,500 |
| — |
| — |
|
| Total | | $ | 101,834 |
| $ | 44,490 |
| $ | 57,344 |
| $ | — |
|
| December 31, 2011 | | |
| Assets: | | |
| Cash | $ | 164 |
| $ | 164 |
| $ | — |
| $ | — |
| $ | 164 |
| $ | 164 |
| $ | — |
| $ | — |
|
| U.S. government obligations | 4,863 |
| 4,863 |
| — |
| — |
| 4,863 |
| 4,863 |
| — |
| — |
|
Government-sponsored enterprise obligations (a) | 9,749 |
| — |
| 9,749 |
| — |
| 9,749 |
| — |
| 9,749 |
| — |
|
| State and municipal obligations | 5,005 |
| — |
| 5,005 |
| — |
| 5,005 |
| — |
| 5,005 |
| — |
|
Agency mortgage-backed securities (b) | 4,480 |
| — |
| 4,480 |
| | 4,480 |
| — |
| 4,480 |
| — |
|
| Non-agency mortgage-backed securities | 6,908 |
| — |
| 6,908 |
| — |
| 6,908 |
| — |
| 6,908 |
| — |
|
| Asset-backed securities | 8,085 |
| — |
| 8,085 |
| — |
| 8,085 |
| — |
| 8,085 |
| — |
|
Corporate bonds (c) | 22,700 |
| — |
| 22,700 |
| — |
| 22,700 |
| — |
| 22,700 |
| — |
|
| International bonds | 3,169 |
| — |
| 3,169 |
| — |
| 3,169 |
| — |
| 3,169 |
| — |
|
Equity securities and mutual funds: (d) | | |
| U.S. large-cap | 13,928 |
| 13,928 |
| — |
| — |
| 13,928 |
| 13,928 |
| — |
| — |
|
| U.S. mid-cap | 8,250 |
| 8,250 |
| — |
| — |
| 8,250 |
| 8,250 |
| — |
| — |
|
| U.S. small-cap | 3,348 |
| 3,348 |
| — |
| — |
| 3,348 |
| 3,348 |
| — |
| — |
|
| International developed markets | 1,184 |
| 1,184 |
| — |
| — |
| 1,184 |
| 1,184 |
| — |
| — |
|
| Emerging markets | 1,569 |
| 1,569 |
| — |
| — |
| 1,569 |
| 1,569 |
| — |
| — |
|
| Money market funds | 3,826 |
| 3,826 |
| — |
| — |
| 3,826 |
| 3,826 |
| — |
| — |
|
| Total | $ | 97,228 |
| $ | 37,132 |
| $ | 60,096 |
| $ | — |
| $ | 97,228 |
| $ | 37,132 |
| $ | 60,096 |
| $ | — |
|
| December 31, 2010 | | |
| Assets: | | |
| Cash | $ | 22 |
| $ | 22 |
| $ | — |
| $ | — |
| |
| U.S. government obligations | 3,964 |
| 3,964 |
| — |
| — |
| |
Government-sponsored enterprise obligations (a) | 9,771 |
| — |
| 9,771 |
| — |
| |
| State and municipal obligations | 3,644 |
| — |
| 3,644 |
| — |
| |
Agency mortgage-backed securities (b) | 5,848 |
| — |
| 5,848 |
| | |
| Non-agency mortgage-backed securities | 7,802 |
| — |
| 7,802 |
| — |
| |
| Asset-backed securities | 6,060 |
| — |
| 6,060 |
| — |
| |
Corporate bonds (c) | 19,676 |
| — |
| 19,676 |
| — |
| |
| International bonds | 2,274 |
| — |
| 2,274 |
| — |
| |
Equity securities and mutual funds: (d) | | |
| U.S. large-cap | 17,806 |
| 17,806 |
| — |
| — |
| |
| U.S. mid-cap | 8,849 |
| 8,849 |
| — |
| — |
| |
| U.S. small-cap | 3,344 |
| 3,344 |
| — |
| — |
| |
| International developed markets | 1,951 |
| 1,951 |
| — |
| — |
| |
| Emerging markets | 2,771 |
| 2,771 |
| — |
| — |
| |
| Money market funds | 5,042 |
| 5,042 |
| — |
| — |
| |
| Total | $ | 98,824 |
| $ | 43,749 |
| $ | 55,075 |
| $ | — |
| |
| |
| (a) | This category represents bonds (excluding mortgage-backed securities) issued by agencies such as the Federal Home Loan Bank, the Federal Home Loan Mortgage Corp and the Federal National Mortgage Association. |
| |
| (b) | This category represents mortgage-backed securities issued by the agencies mentioned in (a). |
| |
| (c) | This category represents investment grade bonds of U.S. issuers from diverse industries. |
| |
| (d) | This category represents investments in individual common stocks and equity funds. The majority of these investmentsThese holdings are in equity mutual funds, which have diversified, investment holdings as of December 31, 2011largely across the financial services, industrial materials, technology, consumer goods, healthcare, technology, and energy sectors. |
The investment policy of the pension plan is designed for growth in value within limits designed to safeguard against significant losses within the portfolio. The policy sets guidelines regarding the types of investments held that may change from time to time, currently including items such as holding bonds rated investment grade or better and prohibiting investment in Company stock. The plan does not utilize derivatives. Management believes there are no significant concentrations of risk within the plan asset portfolio at December 31, 20112012. Under the current policy, the long-term investment target mix for the plan is 35% equity securities and 65% fixed income securities. The Company regularly reviews its policies on investment mix and may make changes depending on economic conditions and perceived investment risk.
The discount rate selected at December 31, 2011 and 2010 wasis based on matching the Company's estimated plan cash flows to a yield curve derived from a portfolio of corporate bonds rated AA by Moody's. This method is more specific to the Company's plan compared to the method used to select the rate in 2009 and previous years, which was based on a review of various published bond indices.
The assumed overall expected long-term rate of return on pension plan assets used in calculating 20112012 pension plan expense was 7.00%6.5%. Determination of the plan’s expected rate of return is based upon historical and anticipated returns of the asset classes invested in by the pension plan and the allocation strategy currently in place among those classes. The rate used in plan calculations may be adjusted by management for current trends in the economic environment. The average 10-year annualized return for the Company’s pension plan was 6.1%8.0%. During 20112012, the plan’s rate of return was 3.8%8.4%, compared to 11.0%3.8% in 20102011. Because a portion of the plan’s investments are equity securities, the actual return for any one plan year is affected by changes in the stock market. Due to positive investment returns that were higher anticipated amortization of investment losses andthan expected during 2012, along with the effectimpact of a lower discount rate in 2012,on interest cost, the Company expects to incur pension expense of $1.9$1.6 million in 20122013, compared to $994 thousand$2.4 million in 20112012.
The following future benefit payments are expected to be paid:
| | | (In thousands) | | |
| 2012 | $ | 6,018 |
| |
| 2013 | 6,278 |
| $ | 5,731 |
|
| 2014 | 6,529 |
| 5,967 |
|
| 2015 | 6,753 |
| 6,215 |
|
| 2016 | 6,968 |
| 6,521 |
|
| 2017-2021 | 36,019 |
| |
| 2017 | | 6,689 |
|
| 2018 - 2022 | | 35,468 |
|
10. Stock-Based Compensation and Directors Stock Purchase Plan*
The Company’s stock-based compensation is provided under a stockholder-approved plan which allows for issuance of various types of awards, including stock options, stock appreciation rights, restricted stock and restricted stock units, performance awards and stock-based awards. At December 31, 20112012, 3,119,2813,022,503 shares remained available for issuance under the plan. The stock-based compensation expense that was charged against income was $4.75.0 million, $6.04.7 million and $6.66.0 million for the years ended December 31, 20112012, 20102011 and 20092010, respectively. The total income tax benefit recognized in the income statement for share-based compensation arrangements was $1.81.9 million, $2.21.8 million and $2.52.2 million for the years ended December 31, 20112012, 20102011 and 20092010, respectively.
During 20112012 and 20102011, stock-based compensation was issued solely in the form of nonvested stock awards. Nonvested stock is awarded to key employees, by action of the Company's Compensation and Human Resources Committee and Board of Directors. These awards generally vest after 5 to 7 years of continued employment, but vesting terms may vary according to the specifics of the individual grant agreement. There are restrictions as to transferability, sale, pledging, or assigning, among others, prior to the end of the vesting period. Dividend and voting rights are conferred upon grant. A summary of the status of the Company’s nonvested share awards as of December 31, 20112012 and changes during the year then ended is presented below.
| |
| Shares | Weighted Average Grant Date Fair Value | Shares | Weighted Average Grant Date Fair Value |
| Nonvested at January 1, 2011 | 493,847 |
| $ | 34.29 |
| |
| Nonvested at January 1, 2012 | | 686,359 |
| 33.71 |
|
| Granted | 218,631 |
| 38.50 |
| 262,920 |
| 36.72 |
|
| Vested | (42,412 | ) | 37.47 |
| (56,793 | ) | 34.86 |
|
| Forfeited | (16,284 | ) | 33.87 |
| (9,683 | ) | 25.73 |
|
| Nonvested at December 31, 2011 | 653,782 |
| $ | 35.48 |
| |
| Nonvested at December 31, 2012 | | 882,803 |
| 34.62 |
|
The total fair value (at vest date) of shares vested during 20112012, 20102011 and 20092010 was $1.62.1 million, $2.11.6 million and $1.72.1 million, respectively.
In previous years, stock appreciation rights (SARs) and stock options have also been granted, and were granted with exercise prices equal to the market price of the Company’s stock at the date of grant. SARs, which the Company granted in 2006 through 2009, vest on a graded basis over 4four years of continuous service and have 10-year10-year contractual terms. All SARs must be settled in stock under provisions of the plan. Stock options, which were granted in 2005 and previous years, vested on a graded basis over 3three years of continuous service, and also have 10-year10-year contractual terms.
In determining compensation cost, the Black-Scholes option-pricing model is used to estimate the fair value of options and SARs on date of grant. The Black-Scholes model is a closed-end model that uses various assumptions as shown in the following table. Expected volatility is based on historical volatility of the Company’s stock. The Company uses historical exercise behavior and other factors to estimate the expected term of the options and SARs, which represents the period of time that the options and SARs granted are expected to be outstanding. The risk-free rate for the expected term is based on the U.S. Treasury zero coupon spot rates in effect at the time of grant. Below is the weighted average fair value of SARs granted during 2009.
|
| | | |
| | 2009 |
| Weighted per share average fair value at grant date | $ | 6.46 |
|
| Assumptions: | |
| Dividend yield | 2.7 | % |
| Volatility | 20.8 | % |
| Risk-free interest rate | 3.2 | % |
| Expected term | 7.3 years |
|
A summary of option activity during 20112012 is presented below.
| | | (Dollars in thousands, except per share data) | Shares | Weighted Average Exercise Price | Weighted Average Remaining Contractual Term | Aggregate Intrinsic Value | Shares | Weighted Average Exercise Price | Weighted Average Remaining Contractual Term | Aggregate Intrinsic Value |
| Outstanding at January 1, 2011 | 1,896,178 |
| $ | 29.48 |
| | | |
| Outstanding at January 1, 2012 | | 1,420,130 |
| $ | 28.82 |
| | |
| Granted | — |
| — |
| | | — |
| — |
| | |
| Forfeited | — |
| — |
| | | — |
| — |
| | |
| Expired | — |
| — |
| | | (891 | ) | 18.68 |
| | |
| Exercised | (543,534 | ) | 27.55 |
| | | (650,466 | ) | 25.65 |
| | |
| Outstanding at December 31, 2011 | 1,352,644 |
| $ | 30.26 |
| 1.9 years | $ | 10,631 |
| |
| Exercisable at December 31, 2011 | 1,352,644 |
| $ | 30.26 |
| 1.9 years | $ | 10,631 |
| |
| Vested and expected to vest at December 31, 2011 | 1,352,644 |
| $ | 30.26 |
| 1.9 years | $ | 10,631 |
| |
| Outstanding, exercisable and vested at December 31, 2012 | | 768,773 |
| $ | 31.51 |
| 1.6 | years | $ | 2,728 |
|
A summary of SAR activity during 20112012 is presented below.
| | (Dollars in thousands, except per share data) | Shares | Weighted Average Exercise Price | Weighted Average Remaining Contractual Term | Aggregate Intrinsic Value | Shares | Weighted Average Exercise Price | Weighted Average Remaining Contractual Term | Aggregate Intrinsic Value |
| Outstanding at January 1, 2011 | 1,795,348 |
| $ | 37.82 |
| | | |
| Outstanding at January 1, 2012 | | 1,825,783 |
| $ | 36.03 |
| | |
| Granted | — |
| — |
| | | — |
| — |
| | |
| Forfeited | (4,375 | ) | 35.80 |
| | | — |
| — |
| | |
| Expired | (13,258 | ) | 38.48 |
| | | — |
| — |
| | |
| Exercised | (38,589 | ) | 36.79 |
| | | (39,774 | ) | 34.03 |
| | |
| Outstanding at December 31, 2011 | 1,739,126 |
| $ | 37.83 |
| 5.2 years | $ | 1,160 |
| |
| Exercisable at December 31, 2011 | 1,586,186 |
| $ | 37.97 |
| 5.1 years | $ | 885 |
| |
| Vested and expected to vest at December 31, 2011 | 1,717,505 |
| $ | 37.85 |
| 5.2 years | $ | 1,121 |
| |
| Outstanding at December 31, 2012 | | 1,786,009 |
| $ | 36.07 |
| 4.1 | years | $ | 440 |
|
| Exercisable at December 31, 2012 | | 1,783,880 |
| $ | 36.07 |
| 4.1 | years | $ | 434 |
|
| Vested and expected to vest at December 31, 2012 | | 1,785,707 |
| $ | 36.07 |
| 4.1 | years | $ | 439 |
|
Additional information about stock options and SARs exercises is presented below.
| | | (In thousands) | 2011 | 2010 | 2009 | 2012 | 2011 | 2010 |
| Intrinsic value of options and SARs exercised | $ | 6,722 |
| $ | 7,005 |
| $ | 3,249 |
| $ | 7,769 |
| $ | 6,722 |
| $ | 7,005 |
|
| Cash received from options and SARs exercised | $ | 14,604 |
| $ | 10,563 |
| $ | 4,729 |
| $ | 14,820 |
| $ | 14,604 |
| $ | 10,563 |
|
| Tax benefit realized from options and SARs exercised | $ | 847 |
| $ | 1,042 |
| $ | 636 |
| $ | 1,269 |
| $ | 847 |
| $ | 1,042 |
|
As of December 31, 20112012, there was $12.315.8 million of unrecognized compensation cost (net of estimated forfeitures) related to unvested options, SARs and stock awards. That cost is expected to be recognized over a weighted average period of 4.14.0 years.
The Company has a directors stock purchase plan whereby outside directors of the Company and its subsidiaries may elect to use their directors’ fees to purchase Company stock at market value each month end. Remaining shares available for issuance under this plan were 48,35530,057 at December 31, 20112012. In 20112012, 19,13520,715 shares were purchased at an average price of $38.6737.08 and in 20102011, 21,18420,092 shares were purchased at an average price of $35.2736.83.
* All share and per share amounts in this note have been restated for the 5% stock dividend distributed in 20112012.
11. Accumulated Other Comprehensive Income
Comprehensive income isThe table below shows the total of net income and all other non-owner changes in equity. Items recognized under accounting standards as components of comprehensive income are displayed in the consolidated statements of changes in equity, and additional information is presented below about the Company’saccumulated balances for components of other comprehensive income.
income, net of tax. The firstlargest component of other comprehensive income is the unrealized holding gains and losses on available for sale securities. TheseUnrealized gains and losses have been separated into two groups in the table below, as required by current accounting guidance on other-than-temporary impairment on debt securities. Under this guidance, credit-related losses on debt securities withfor which an other-than-temporary impairment are(OTTI) has been recorded in current earnings while the noncredit-related portion of the overall gain or loss in fair value is recorded in other comprehensive income (loss). Changes in the noncredit-related gain or loss in fair value of these securities, after other-than-temporary impairment (OTTI) was initially recognized, are shown separately in the table below. The remaining unrealized holding gains and losses shown in the table apply to available for sale investment securities for which OTTI has not been recorded (and include holding gains and losses on certain securities prior to the recognition of OTTI).
The secondother component of other comprehensive income is pension gains and losses that arise during the period but are not recognized as components ofon net periodic benefit cost, and corresponding adjustments when these gains and losses are subsequently amortized to net periodic benefit cost.
In the calculation of other comprehensive income, certain reclassification adjustments are made to avoid double counting gains and losses that are included as part of net income for a period that also had been included as part of other comprehensive income in that period or earlier periods. The reclassification amounts and the related income tax expense or benefit are shown in the table below.
|
| | | | | | | | | |
| (In thousands) | 2011 | 2010 | 2009 |
| Available for sale debt securities for which OTTI has been recognized: | | | |
Unrealized holding gains subsequent to initial OTTI recognition | $ | 5,184 |
| $ | 22,973 |
| $ | 12,251 |
|
| Income tax expense | (1,970 | ) | (8,730 | ) | (4,655 | ) |
| Net unrealized gains on OTTI securities | 3,214 |
| 14,243 |
| 7,596 |
|
| Other available for sale investment securities: | | | |
| Unrealized holding gains | 78,059 |
| 6,412 |
| 150,443 |
|
| Income tax expense on unrealized gains | (29,663 | ) | (2,470 | ) | (57,152 | ) |
Reclassification adjustment for gains realized and included in net income | (177 | ) | (3,488 | ) | (322 | ) |
Reclassification adjustment for tax expense on realized gains | 68 |
| 1,359 |
| 106 |
|
| Net unrealized gains on other securities | 48,287 |
| 1,813 |
| 93,075 |
|
| Prepaid pension cost: | | | |
| Amortization of accumulated pension loss | 1,949 |
| 2,208 |
| 2,990 |
|
| Net gain (loss) arising during period | (8,898 | ) | (786 | ) | 951 |
|
| Income tax (expense) benefit on change in pension loss | 2,641 |
| (540 | ) | (1,476 | ) |
| Change in pension loss | (4,308 | ) | 882 |
| 2,465 |
|
| Other comprehensive income | $ | 47,193 |
| $ | 16,938 |
| $ | 103,136 |
|
The end of period components of accumulated other comprehensive income (loss) are shown in the table below. At December 31, 2011, accumulated other comprehensive income was $110.5 million, net of tax. It was comprised of $4.3 million in unrealized holding losses on available for sale debt securities for which OTTI has been recorded, $136.1 million in unrealized holding gains on other available for sale securities, and $21.3 million in accumulated pension loss.
| | | (In thousands) | Unrealized Gains (Losses) on Securities | Pension Loss | Accumulated Other Comprehensive Income (Loss) | Unrealized Gains (Losses) on Securities | Pension Loss | Accumulated Other Comprehensive Income (Loss) |
| Balance at December 31, 2009 | $ | 64,259 |
| $ | (17,852 | ) | $ | 46,407 |
| |
| Current period other comprehensive income | 16,056 |
| 882 |
| 16,938 |
| |
| (In thousands) | | OTTI | Other | Pension Loss | Accumulated Other Comprehensive Income (Loss) |
| 80,315 |
| (16,970 | ) | 63,345 |
| $ | (7,469 | ) | $ | 87,784 |
|
| Current period other comprehensive income | 51,501 |
| (4,308 | ) | 47,193 |
| 3,214 |
| 48,287 |
| (4,308 | ) | 47,193 |
|
| Reclassification for securities for which impairment was not previously recognized | | (66 | ) | 66 |
| — |
| — |
|
| Balance at December 31, 2011 | $ | 131,816 |
| (21,278 | ) | $ | 110,538 |
| (4,321 | ) | 136,137 |
| (21,278 | ) | 110,538 |
|
| Current period other comprehensive income | | 7,566 |
| 24,126 |
| (5,886 | ) | 25,806 |
|
| Balance at December 31, 2012 | | $ | 3,245 |
| $ | 160,263 |
| $ | (27,164 | ) | $ | 136,344 |
|
12. Segments
The Company segregates financial information for use in assessing its performance and allocating resources among three operating segments. The Consumer segment includes the consumer portion of the retail branch network (loans, deposits and other personal banking services), indirect and other consumer financing, and consumer debit and credit bank cards. The Commercial segment provides corporate lending (including the Small Business Banking product line within the branch network), leasing, international services, and business, government deposit, and related commercial cash management services, as well as merchant and commercial bank card products. The Commercial segment also includes the Capital Markets Group, which sells fixed income securities and provides investment safekeeping and bond accounting services. The Wealth segment provides traditional trust and estate tax planning, advisory and discretionary investment management, and brokerage services, and includes the Private Banking product portfolio. The Capital Markets Group was transferred from the Wealth segment to the Commercial segment effective January 1, 2011, and the information for 2010 and 2009 in the tables below has been revised to reflect this transfer.
The Company’s business line reporting system derives segment information from the internal profitability reporting system used by management to monitor and manage the financial performance of the Company. This information is based on internal management accounting policies, which have been developed to reflect the underlying economics of the businesses. The policies address the methodologies applied in connection with funds transfer pricing and assignment of overhead costs among segments. Funds transfer pricing was used in the determination of net interest income by assigning a standard cost (credit) for funds used
(provided) by assets and liabilities based on their maturity, prepayment and/or repricing characteristics. Income and expense that directly relate to segment operations are recorded in the segment when incurred. Expenses that indirectly support the segments are allocated based on the most appropriate method available.
The Company uses a funds transfer pricing method to value funds used (e.g., loans, fixed assets, and cash) and funds provided (e.g., deposits, borrowings, and equity) by the business segments and their components. This process assigns a specific value to each new source or use of funds with a maturity, based on current LIBOR interestswap rates, thus determining an interest spread at the time of the transaction. Non-maturity assets and liabilities are assignedvalued using weighted average pools. The funds transfer pricing process attempts to LIBOR based funding pools. This provides an accurate means of valuing fund sources and uses in a varyingremove interest rate environment.risk from valuation, allowing management to compare profitability under various rate environments.
The following tables present selected financial information by segment and reconciliations of combined segment totals to consolidated totals. There were no material intersegment revenues between the three segments.
Segment Income Statement Data
| | | (In thousands) | Consumer | Commercial | Wealth | Segment Totals | Other/Elimination | Consolidated Totals | Consumer | Commercial | Wealth | Segment Totals | Other/Elimination | Consolidated Totals |
| Year ended December 31, 2012: | | |
| Net interest income | | $ | 274,844 |
| $ | 291,393 |
| $ | 39,502 |
| $ | 605,739 |
| $ | 34,167 |
| $ | 639,906 |
|
| Provision for loan losses | | (35,496 | ) | (2,824 | ) | (695 | ) | (39,015 | ) | 11,728 |
| (27,287 | ) |
| Non-interest income | | 114,307 |
| 179,824 |
| 108,471 |
| 402,602 |
| (2,972 | ) | 399,630 |
|
| Investment securities gains, net | | — |
| — |
| — |
| — |
| 4,828 |
| 4,828 |
|
| Non-interest expense | | (266,892 | ) | (226,795 | ) | (90,643 | ) | (584,330 | ) | (34,139 | ) | (618,469 | ) |
| Income before income taxes | | $ | 86,763 |
| $ | 241,598 |
| $ | 56,635 |
| $ | 384,996 |
| $ | 13,612 |
| $ | 398,608 |
|
| Year ended December 31, 2011: | | |
| Net interest income | $ | 283,555 |
| $ | 283,790 |
| $ | 38,862 |
| $ | 606,207 |
| $ | 39,863 |
| $ | 646,070 |
| $ | 283,555 |
| $ | 283,790 |
| $ | 38,862 |
| $ | 606,207 |
| $ | 39,863 |
| $ | 646,070 |
|
| Provision for loan losses | (47,273 | ) | (16,195 | ) | (712 | ) | (64,180 | ) | 12,665 |
| (51,515 | ) | (47,273 | ) | (16,195 | ) | (712 | ) | (64,180 | ) | 12,665 |
| (51,515 | ) |
| Non-interest income | 131,253 |
| 162,533 |
| 101,836 |
| 395,622 |
| (2,705 | ) | 392,917 |
| 131,253 |
| 162,533 |
| 101,836 |
| 395,622 |
| (2,705 | ) | 392,917 |
|
| Investment securities gains, net | — |
| — |
| — |
| — |
| 10,812 |
| 10,812 |
| — |
| — |
| — |
| — |
| 10,812 |
| 10,812 |
|
| Non-interest expense | (269,435 | ) | (221,739 | ) | (89,108 | ) | (580,282 | ) | (36,967 | ) | (617,249 | ) | (269,435 | ) | (221,273 | ) | (89,108 | ) | (579,816 | ) | (37,433 | ) | (617,249 | ) |
| Income before income taxes | $ | 98,100 |
| $ | 208,389 |
| $ | 50,878 |
| $ | 357,367 |
| $ | 23,668 |
| $ | 381,035 |
| $ | 98,100 |
| $ | 208,855 |
| $ | 50,878 |
| $ | 357,833 |
| $ | 23,202 |
| $ | 381,035 |
|
| Year ended December 31, 2010: | | |
| Net interest income | $ | 308,719 |
| $ | 264,870 |
| $ | 37,988 |
| $ | 611,577 |
| $ | 34,355 |
| $ | 645,932 |
| $ | 308,719 |
| $ | 264,870 |
| $ | 37,988 |
| $ | 611,577 |
| $ | 34,355 |
| $ | 645,932 |
|
| Provision for loan losses | (70,635 | ) | (24,823 | ) | (1,263 | ) | (96,721 | ) | (3,279 | ) | (100,000 | ) | (70,635 | ) | (24,823 | ) | (1,263 | ) | (96,721 | ) | (3,279 | ) | (100,000 | ) |
| Non-interest income | 157,904 |
| 154,306 |
| 93,745 |
| 405,955 |
| (844 | ) | 405,111 |
| 157,904 |
| 154,306 |
| 93,745 |
| 405,955 |
| (844 | ) | 405,111 |
|
| Investment securities losses, net | — |
| — |
| — |
| — |
| (1,785 | ) | (1,785 | ) | — |
| — |
| — |
| — |
| (1,785 | ) | (1,785 | ) |
| Non-interest expense | (291,028 | ) | (221,553 | ) | (86,158 | ) | (598,739 | ) | (32,395 | ) | (631,134 | ) | (291,028 | ) | (221,553 | ) | (86,158 | ) | (598,739 | ) | (32,395 | ) | (631,134 | ) |
| Income (loss) before income taxes | $ | 104,960 |
| $ | 172,800 |
| $ | 44,312 |
| $ | 322,072 |
| $ | (3,948 | ) | $ | 318,124 |
| $ | 104,960 |
| $ | 172,800 |
| $ | 44,312 |
| $ | 322,072 |
| $ | (3,948 | ) | $ | 318,124 |
|
| Year ended December 31, 2009: | | |
| Net interest income | $ | 329,720 |
| $ | 251,085 |
| $ | 34,575 |
| $ | 615,380 |
| $ | 20,122 |
| $ | 635,502 |
| |
| Provision for loan losses | (84,001 | ) | (54,247 | ) | (520 | ) | (138,768 | ) | (21,929 | ) | (160,697 | ) | |
| Non-interest income | 163,150 |
| 140,390 |
| 88,692 |
| 392,232 |
| 4,027 |
| 396,259 |
| |
| Investment securities losses, net | — |
| — |
| — |
| — |
| (7,195 | ) | (7,195 | ) | |
| Non-interest expense | (302,002 | ) | (213,829 | ) | (84,673 | ) | (600,504 | ) | (21,233 | ) | (621,737 | ) | |
| Income (loss) before income taxes | $ | 106,867 |
| $ | 123,399 |
| $ | 38,074 |
| $ | 268,340 |
| $ | (26,208 | ) | $ | 242,132 |
| |
The segment activity, as shown above, includes both direct and allocated items. Amounts in the “Other/Elimination” column include activity not related to the segments, such as that relating to administrative functions, the investment securities portfolio, and the effect of certain expense allocations to the segments. The provision for loan losses in this category contains the difference between net loan charge-offs assigned directly to the segments and the recorded provision for loan loss expense. Included in this category’s net interest income are earnings of the investment portfolio, which are not allocated to a segment.
Segment Balance Sheet Data
| | | (In thousands) | Consumer | Commercial | Wealth | Segment Totals | Other/Elimination | Consolidated Totals | Consumer | Commercial | Wealth | Segment Totals | Other/Elimination | Consolidated Totals |
| Average balances for 2012: | | |
| Assets | | $ | 2,503,503 |
| $ | 5,834,512 |
| $ | 743,312 |
| $ | 9,081,327 |
| $ | 11,619,351 |
| $ | 20,700,678 |
|
| Loans, including held for sale | | 2,418,428 |
| 5,648,923 |
| 735,153 |
| 8,802,504 |
| 586,500 |
| 9,389,004 |
|
| Goodwill and other intangible assets | | 72,765 |
| 58,573 |
| 746 |
| 132,084 |
| — |
| 132,084 |
|
| Deposits | | 8,816,905 |
| 6,266,569 |
| 1,689,937 |
| 16,773,411 |
| 53,137 |
| 16,826,548 |
|
| Average balances for 2011: | | |
| Assets | $ | 2,584,920 |
| $ | 5,770,552 |
| $ | 680,413 |
| $ | 9,035,885 |
| $ | 10,368,630 |
| $ | 19,404,515 |
| $ | 2,584,920 |
| $ | 5,770,552 |
| $ | 680,413 |
| $ | 9,035,885 |
| $ | 10,368,630 |
| $ | 19,404,515 |
|
| Loans, including held for sale | 2,492,324 |
| 5,594,202 |
| 673,737 |
| 8,760,263 |
| 509,532 |
| 9,269,795 |
| 2,492,324 |
| 5,594,202 |
| 673,737 |
| 8,760,263 |
| 509,532 |
| 9,269,795 |
|
| Goodwill and other intangible assets | 75,134 |
| 59,139 |
| 746 |
| 135,019 |
| — |
| 135,019 |
| 75,134 |
| 59,139 |
| 746 |
| 135,019 |
| — |
| 135,019 |
|
| Deposits | 8,465,488 |
| 5,619,008 |
| 1,531,475 |
| 15,615,971 |
| 55,239 |
| 15,671,210 |
| 8,465,488 |
| 5,619,008 |
| 1,531,475 |
| 15,615,971 |
| 55,239 |
| 15,671,210 |
|
| Average balances for 2010: | | |
| Assets | $ | 3,368,337 |
| $ | 5,818,717 |
| $ | 681,938 |
| $ | 9,868,992 |
| $ | 8,367,007 |
| $ | 18,235,999 |
| |
| Loans, including held for sale | 3,261,833 |
| 5,635,142 |
| 671,163 |
| 9,568,138 |
| 489,024 |
| 10,057,162 |
| |
| Goodwill and other intangible assets | 77,515 |
| 59,816 |
| 746 |
| 138,077 |
| — |
| 138,077 |
| |
| Deposits | 8,290,834 |
| 4,655,801 |
| 1,328,349 |
| 14,274,984 |
| 87,985 |
| 14,362,969 |
| |
The above segment balances include only those items directly associated with the segment. The “Other/Elimination” column includes unallocated bank balances not associated with a segment (such as investment securities and federal funds sold), balances relating to certain other administrative and corporate functions, and eliminations between segment and non-segment balances. This column also includes the resulting effect of allocating such items as float, deposit reserve and capital for the purpose of computing the cost or credit for funds used/provided.
The Company’s reportable segments are strategic lines of business that offer different products and services. They are managed separately because each line services a specific customer need, requiring different performance measurement analyses and marketing strategies. The performance measurement of the segments is based on the management structure of the Company and is not necessarily comparable with similar information for any other financial institution. The information is also not necessarily indicative of the segments’ financial condition and results of operations if they were independent entities.
13. Common Stock
On December 19, 2011,17, 2012, the Company distributed a 5% stock dividend on its $5$5 par common stock for the eighteenthnineteenth consecutive year. All per share data in this report has been restated to reflect the stock dividend. On the same date, the Company paid a special cash dividend of $1.429 per share, in addition to its regular quarterly cash dividend of $.219 per share.
Basic income per share is computed by dividing income available to common shareholders by the weighted average number of common shares outstanding during the year. Diluted income per share gives effect to all dilutive potential common shares that were outstanding during the year. Presented below is a summary of the components used to calculate basic and diluted income per share, which have been restated for all stock dividends.
The Company applies the two-class method of computing income per share. Under current guidance, nonvested share-based awards that contain nonforfeitable rights to dividends are considered securities which participate in undistributed earnings with common stock. The two-class method requires the calculation of separate income per share amounts for the nonvested share-based awards and for common stock. Income per share attributable to common stock is shown in the table below. Nonvested share-based awards are further discussed in Note 10 on Stock-Based Compensation.
| | | (In thousands, except per share data) | 2011 | 2010 | 2009 | 2012 | 2011 | 2010 |
| Basic income per common share: | | |
| Net income attributable to Commerce Bancshares, Inc. | $ | 256,343 |
| $ | 221,710 |
| $ | 169,075 |
| $ | 269,329 |
| $ | 256,343 |
| $ | 221,710 |
|
| Less income allocated to nonvested restricted stockholders | 1,846 |
| 1,208 |
| 741 |
| 2,563 |
| 1,846 |
| 1,208 |
|
| Net income available to common stockholders | $ | 254,497 |
| $ | 220,502 |
| $ | 168,334 |
| $ | 266,766 |
| $ | 254,497 |
| $ | 220,502 |
|
| Distributed income | $ | 78,556 |
| $ | 77,796 |
| $ | 74,384 |
| |
| Undistributed income | $ | 175,941 |
| $ | 142,706 |
| $ | 93,950 |
| |
| Weighted average common shares outstanding | 89,874 |
| 91,326 |
| 89,478 |
| 91,614 |
| 94,368 |
| 95,893 |
|
| Distributed income per share | $ | .87 |
| $ | .85 |
| $ | .83 |
| |
| Undistributed income per share | 1.96 |
| 1.56 |
| 1.05 |
| |
| Basic income per common share | $ | 2.83 |
| $ | 2.41 |
| $ | 1.88 |
| $ | 2.91 |
| $ | 2.70 |
| $ | 2.30 |
|
| Diluted income per common share: | | |
| Net income attributable to Commerce Bancshares, Inc. | $ | 256,343 |
| $ | 221,710 |
| $ | 169,075 |
| $ | 269,329 |
| $ | 256,343 |
| $ | 221,710 |
|
| Less income allocated to nonvested restricted stockholders | 1,842 |
| 1,204 |
| 740 |
| 2,562 |
| 1,842 |
| 1,204 |
|
| Net income available to common stockholders | $ | 254,501 |
| $ | 220,506 |
| $ | 168,335 |
| $ | 266,767 |
| $ | 254,501 |
| $ | 220,506 |
|
| Distributed income | $ | 78,556 |
| $ | 77,796 |
| $ | 74,384 |
| |
| Undistributed income | $ | 175,945 |
| $ | 142,710 |
| $ | 93,951 |
| |
| Weighted average common shares outstanding | 89,874 |
| 91,326 |
| 89,478 |
| 91,614 |
| 94,368 |
| 95,893 |
|
| Net effect of the assumed exercise of stock-based awards -- based on the treasury stock method using the average market price for the respective periods | 328 |
| 425 |
| 351 |
| 280 |
| 344 |
| 446 |
|
| Weighted average diluted common shares outstanding | 90,202 |
| 91,751 |
| 89,829 |
| 91,894 |
| 94,712 |
| 96,339 |
|
| Distributed income per share | $ | .87 |
| $ | .85 |
| $ | .83 |
| |
| Undistributed income per share | 1.95 |
| 1.55 |
| 1.04 |
| |
| Diluted income per common share | $ | 2.82 |
| $ | 2.40 |
| $ | 1.87 |
| $ | 2.90 |
| $ | 2.69 |
| $ | 2.29 |
|
The diluted income per common share computation for the years ended December 31, 2011, 2010 and 2009 excludes 1.1 million, 1.8 million and 3.0 million, respectively, inNearly all unexercised stock options and stock appreciation rights were included in the computation of diluted income per share for the year ended December 31, 2012. Unexercised options and rights of 1.2 million and 1.9 million, respectively, were excluded from the computations for 2011 and 2010because their inclusion would have been anti-dilutive to income per share.anti-dilutive.
The table below shows activity in the outstanding shares of the Company’s common stock during the past three years. Shares in the table below are presented on an historical basis and have not been restated for the annual 5% stock dividends.
| | | | Years Ended December 31 | Years Ended December 31 |
| (In thousands) | 2011 | 2010 | 2009 | 2012 | 2011 | 2010 |
| Shares outstanding at January 1 | 86,624 |
| 83,008 |
| 75,791 |
| 88,952 |
| 86,624 |
| 83,008 |
|
| Issuance of stock: | | |
| Awards and sales under employee and director plans | 724 |
| 603 |
| 394 |
| 837 |
| 724 |
| 603 |
|
| Stock offering | — |
| — |
| 2,895 |
| |
| 5% stock dividend | 4,231 |
| 4,122 |
| 3,949 |
| 4,352 |
| 4,231 |
| 4,122 |
|
| Purchases of treasury stock | (2,622 | ) | (1,103 | ) | (16 | ) | (2,716 | ) | (2,622 | ) | (1,103 | ) |
| Other | (5 | ) | (6 | ) | (5 | ) | (11 | ) | (5 | ) | (6 | ) |
| Shares outstanding at December 31 | 88,952 |
| 86,624 |
| 83,008 |
| 91,414 |
| 88,952 |
| 86,624 |
|
The Company maintains a treasury stock buyback program authorized by its Board of Directors. At December 31, 20112012, 2,999,3002,127,618 shares were available for purchase under the current Board authorization.
14. Regulatory Capital Requirements
The Company is subject to various regulatory capital requirements administered by the federal banking agencies. Failure to meet minimum capital requirements can initiate certain mandatory and additional discretionary actions by regulators that could have a direct material effect on the Company’s financial statements. The regulations require the Company to meet specific capital adequacy guidelines that involve quantitative measures of the Company’s assets, liabilities and certain off-balance sheet items as calculated under regulatory accounting practices. The Company’s capital classification is also subject to qualitative judgments by the regulators about components, risk weightings and other factors.
Quantitative measures established by regulation to ensure capital adequacy require the Company and the Bank to maintain minimum amounts and ratios of Tier I capital to total average assets (leverage ratio), and minimum ratios of Tier I and Total capital to risk-weighted assets (as defined). To meet minimum, adequately capitalized regulatory requirements, an institution must maintain a Tier I capital ratio of 4.00%, a Total capital ratio of 8.00% and a leverage ratio of 4.00%. The minimum required ratios for well-capitalized banks (under prompt corrective action provisions) are 6.00% for Tier I capital, 10.00% for Total capital and 5.00% for the leverage ratio.
The following tables show the capital amounts and ratios for the Company (on a consolidated basis) and the Bank, together with the minimum and well-capitalized capital requirements, at the last two year ends.
| | | | Actual | | Minimum Capital Requirement | | Well-Capitalized Capital Requirement | Actual | | Minimum Capital Requirement | | Well-Capitalized Capital Requirement |
| (Dollars in thousands) | Amount | Ratio | | Amount | Ratio | | Amount | Ratio | Amount | Ratio | | Amount | Ratio | | Amount | Ratio |
| December 31, 2012 | | | | | | | | | |
Total Capital (to risk-weighted assets): | | | | | | | | | |
| Commerce Bancshares, Inc. (consolidated) | | $ | 2,092,141 |
| 14.93 | % | | $ | 1,121,252 |
| 8.00 | % | | N.A. |
| N.A. |
|
| Commerce Bank | | 1,887,251 |
| 13.60 |
| | 1,110,330 |
| 8.00 |
| | $ | 1,387,912 |
| 10.00 | % |
Tier I Capital (to risk-weighted assets): | | | | | | | | | |
| Commerce Bancshares, Inc. (consolidated) | | $ | 1,906,203 |
| 13.60 | % | | $ | 560,626 |
| 4.00 | % | | N.A. |
| N.A. |
|
| Commerce Bank | | 1,713,752 |
| 12.35 |
| | 555,165 |
| 4.00 |
| | $ | 832,747 |
| 6.00 | % |
| Tier I Capital (to adjusted quarterly average assets): | | | | | | | | | |
| (Leverage Ratio) | | | | | | | | | |
| Commerce Bancshares, Inc. (consolidated) | | $ | 1,906,203 |
| 9.14 | % | | $ | 834,171 |
| 4.00 | % | | N.A. |
| N.A. |
|
| Commerce Bank | | 1,713,752 |
| 8.26 |
| | 829,711 |
| 4.00 |
| | $ | 1,037,139 |
| 5.00 | % |
| December 31, 2011 | | | | | | | | | | | | | | | | |
Total Capital (to risk-weighted assets): | | | | | | | | | | | | | | | | |
| Commerce Bancshares, Inc. (consolidated) | $ | 2,103,401 |
| 16.04 | % | | $ | 1,049,221 |
| 8.00 | % | | N.A. |
| N.A. |
| $ | 2,103,401 |
| 16.04 | % | | $ | 1,049,221 |
| 8.00 | % | | N.A. |
| N.A. |
|
| Commerce Bank | 1,840,952 |
| 14.19 |
| | 1,037,636 |
| 8.00 |
| | $ | 1,297,045 |
| 10.00 | % | 1,840,952 |
| 14.19 |
| | 1,037,636 |
| 8.00 |
| | $ | 1,297,045 |
| 10.00 | % |
Tier I Capital (to risk-weighted assets): | | | | | | | | | | | | | | | | |
| Commerce Bancshares, Inc. (consolidated) | $ | 1,928,690 |
| 14.71 | % | | $ | 524,610 |
| 4.00 | % | | N.A. |
| N.A. |
| $ | 1,928,690 |
| 14.71 | % | | $ | 524,610 |
| 4.00 | % | | N.A. |
| N.A. |
|
| Commerce Bank | 1,678,530 |
| 12.94 |
| | 518,818 |
| 4.00 |
| | $ | 778,227 |
| 6.00 | % | 1,678,530 |
| 12.94 |
| | 518,818 |
| 4.00 |
| | $ | 778,227 |
| 6.00 | % |
| Tier I Capital (to adjusted quarterly average assets): | | | | | | | | | | | | | | | | |
| (Leverage Ratio) | | | | | | | | | | | | | | | | |
| Commerce Bancshares, Inc. (consolidated) | $ | 1,928,690 |
| 9.55 | % | | $ | 807,839 |
| 4.00 | % | | N.A. |
| N.A. |
| $ | 1,928,690 |
| 9.55 | % | | $ | 807,839 |
| 4.00 | % | | N.A. |
| N.A. |
|
| Commerce Bank | 1,678,530 |
| 8.36 |
| | 802,709 |
| 4.00 |
| | $ | 1,003,386 |
| 5.00 | % | 1,678,530 |
| 8.36 |
| | 802,709 |
| 4.00 |
| | $ | 1,003,386 |
| 5.00 | % |
| December 31, 2010 | | | | | | | | | |
Total Capital (to risk-weighted assets): | | | | | | | | | |
| Commerce Bancshares, Inc. (consolidated) | $ | 2,002,646 |
| 15.75 | % | | $ | 1,017,429 |
| 8.00 | % | | N.A. |
| N.A. |
| |
| Commerce Bank | 1,762,382 |
| 14.03 |
| | 1,004,781 |
| 8.00 |
| | $ | 1,255,977 |
| 10.00 | % | |
Tier I Capital (to risk-weighted assets): | | | | | | | | | |
| Commerce Bancshares, Inc. (consolidated) | $ | 1,828,965 |
| 14.38 | % | | $ | 508,715 |
| 4.00 | % | | N.A. |
| N.A. |
| |
| Commerce Bank | 1,604,873 |
| 12.78 |
| | 502,391 |
| 4.00 |
| | $ | 753,586 |
| 6.00 | % | |
| Tier I Capital (to adjusted quarterly average assets): | | | | | | | | | |
| (Leverage Ratio) | | | | | | | | | |
| Commerce Bancshares, Inc. (consolidated) | $ | 1,828,965 |
| 10.17 | % | | $ | 719,411 |
| 4.00 | % | | N.A. |
| N.A. |
| |
| Commerce Bank | 1,604,873 |
| 9.00 |
| | 713,230 |
| 4.00 |
| | $ | 891,538 |
| 5.00 | % | |
At December 31, 20112012, the Company met all capital requirements to which it is subject, and the Bank’s capital position exceeded the regulatory definition of well-capitalized.
15. Fair Value Measurements
The Company uses fair value measurements to record fair value adjustments to certain financial and nonfinancial assets and liabilities and to determine fair value disclosures. Various financial instruments such as available for sale and trading securities, certain non-marketable securities relating to private equity activities, and derivatives are recorded at fair value on a recurring basis. Additionally, from time to time, the Company may be required to record at fair value other assets and liabilities on a nonrecurring basis, such as loans held for sale, mortgage servicing rights and certain other investment securities. These nonrecurring fair value adjustments typically involve lower of cost or fair value accounting, or write-downs of individual assets.
Fair value is the price that would be received to sell an asset or paid to transfer a liability in an orderly transaction between market participants at the measurement date. Depending on the nature of the asset or liability, the Company uses various valuation techniques and assumptions when estimating fair value. For accounting disclosure purposes, a three-level valuation hierarchy of fair value measurements has been established. The valuation hierarchy is based upon the transparency of inputs to the valuation of an asset or liability as of the measurement date. The three levels are defined as follows:
Level 1 – inputs to the valuation methodology are quoted prices for identical assets or liabilities in active markets.
Level 2 – inputs to the valuation methodology include quoted prices for similar assets and liabilities in active markets, quoted prices for identical or similar assets and liabilities in markets that are not active, and inputs that are observable for the assets or liabilities, either directly or indirectly (such as interest rates, yield curves, and prepayment speeds).
Level 3 – inputs to the valuation methodology are unobservable and significant to the fair value. These may be internally developed, using the Company’s best information and assumptions that a market participant would consider.
When determining the fair value measurements for assets and liabilities required or permitted to be recorded or disclosed at fair value, the Company considers the principal or most advantageous market in which it would transact and considers assumptions that market participants would use when pricing the asset or liability. When possible, the Company looks to active and observable markets to price identical assets or liabilities. When identical assets and liabilities are not traded in active markets, the Company looks to observable market data for similar assets and liabilities. Nevertheless, certain assets and liabilities are not actively traded in observable markets, and the Company must use alternative valuation techniques to derive an estimated fair value measurement.
Instruments Measured at Fair Value on a Recurring Basis
The table below presents the carrying values of assets and liabilities measured at fair value on a recurring basis at December 31, 2012 and 2011. There were no transfers among levels during these years.
|
| | | | | | | | | | | | |
| | | Fair Value Measurements Using |
| (In thousands) | Total Fair Value | Quoted Prices in Active Markets for Identical Assets (Level 1) | Significant Other Observable Inputs (Level 2) | Significant Unobservable Inputs (Level 3) |
| December 31, 2012 | | | | |
| Assets: | | | | |
| Available for sale securities: | | | | |
| U.S. government and federal agency obligations | $ | 438,759 |
| $ | 438,759 |
| $ | — |
| $ | — |
|
| Government-sponsored enterprise obligations | 471,574 |
| — |
| 471,574 |
| — |
|
| State and municipal obligations | 1,615,707 |
| — |
| 1,489,293 |
| 126,414 |
|
| Agency mortgage-backed securities | 3,380,955 |
| — |
| 3,380,955 |
| — |
|
| Non-agency mortgage-backed securities | 237,011 |
| — |
| 237,011 |
| — |
|
| Asset-backed securities | 3,167,394 |
| — |
| 3,167,394 |
| — |
|
| Other debt securities | 177,752 |
| — |
| 177,752 |
| — |
|
| Equity securities | 33,096 |
| 17,835 |
| 15,261 |
| — |
|
| Trading securities | 28,837 |
| — |
| 28,837 |
| — |
|
| Private equity investments | 68,167 |
| — |
| — |
| 68,167 |
|
| Derivatives * | 16,740 |
| — |
| 16,731 |
| 9 |
|
| Assets held in trust | 5,440 |
| 5,440 |
| — |
| — |
|
| Total assets | 9,641,432 |
| 462,034 |
| 8,984,808 |
| 194,590 |
|
| Liabilities: | | | | |
| Derivatives * | 17,718 |
| — |
| 17,522 |
| 196 |
|
| Total liabilities | $ | 17,718 |
| $ | — |
| $ | 17,522 |
| $ | 196 |
|
| December 31, 2011 | | | | |
| Assets: | | | | |
| Available for sale securities: | | | | |
| U.S. government and federal agency obligations | $ | 364,665 |
| $ | 357,155 |
| $ | 7,510 |
| $ | — |
|
| Government-sponsored enterprise obligations | 315,698 |
| — |
| 315,698 |
| — |
|
| State and municipal obligations | 1,245,284 |
| — |
| 1,109,663 |
| 135,621 |
|
| Agency mortgage-backed securities | 4,106,059 |
| — |
| 4,106,059 |
| — |
|
| Non-agency mortgage-backed securities | 316,902 |
| — |
| 316,902 |
| — |
|
| Asset-backed securities | 2,693,143 |
| — |
| 2,693,143 |
| — |
|
| Other debt securities | 141,260 |
| — |
| 141,260 |
| — |
|
| Equity securities | 41,691 |
| 27,808 |
| 13,883 |
| — |
|
| Trading securities | 17,853 |
| — |
| 17,853 |
| — |
|
| Private equity investments | 66,978 |
| — |
| — |
| 66,978 |
|
| Derivatives * | 21,537 |
| — |
| 21,502 |
| 35 |
|
| Assets held in trust | 4,506 |
| 4,506 |
| — |
| — |
|
| Total assets | 9,335,576 |
| 389,469 |
| 8,743,473 |
| 202,634 |
|
| Liabilities: | | | | |
| Derivatives * | 22,722 |
| — |
| 22,564 |
| 158 |
|
| Total liabilities | $ | 22,722 |
| $ | — |
| $ | 22,564 |
| $ | 158 |
|
| |
| * | The fair value of each class of derivative is shown in Note 17. |
Valuation methods for instruments measured at fair value on a recurring basis
Following is a description of the Company’s valuation methodologies used for instruments measured at fair value on a recurring basis:
Available for sale investment securities
For available for sale securities, changes in fair value, including that portion of other-than-temporary impairment unrelated to credit loss, are recorded in other comprehensive income. As mentioned in Note 3 on Investment Securities, the Company records the credit-related portion of other-than-temporary impairment in current earnings. This portfolio comprises the majority of the assets which the Company records at fair value. Most of the portfolio, which includes government-sponsored enterprise, mortgage-backed and asset-backed securities, are priced utilizing industry-standard models that consider various assumptions, including time value, yield curves, volatility factors, prepayment speeds, default rates, loss severity, current market and contractual prices for the underlying financial instruments, as well as other relevant economic measures. Substantially all of these assumptions are observable in the marketplace, can be derived from observable data, or are supported by observable levels at which transactions are executed in the marketplace. These measurements are classified as Level 2 in the fair value hierarchy. Where quoted prices are available in an active market, the measurements are classified as Level 1. Most of the Level 1 measurements apply to common stockequity securities and U.S. Treasury obligations.
The fair values of Level 1 and 2 securities (excluding equity securities) in the available for sale portfolio are prices provided by a third-party pricing service. The prices provided by the third-party pricing service are based on observable market inputs, as described in the sections below. On a quarterly basis, the Company compares a sample of these prices to other independent sources for the same and similar securities. Variances are analyzed, and, if appropriate, additional research is conducted with the third-party pricing service. Based on this research, the pricing service may affirm or revise its quoted price. No significant adjustments have been made to the prices provided by the pricing service. The pricing service also provides documentation on an ongoing basis that includes reference data, inputs and methodology by asset class, which is reviewed to ensure that security placement within the fair value hierarchy is appropriate.
Valuation methods and inputs, by class of security:
U.S. government and federal agency obligations
U.S. treasury bills, bonds and notes, including inflation-protected securities, are valued using live data from active market makers and inter-dealer brokers. Valuations for stripped coupon and principal issues are derived from yield curves generated from various dealer contacts and live data sources.
Government-sponsored enterprise obligations
Government-sponsored enterprise obligations are evaluated using cash flow valuation models. Inputs used are live market data, cash settlements, Treasury market yields, and floating rate indices such as LIBOR, CMT, and Prime.
State and municipal obligations, excluding auction rate securities
A yield curve is generated and applied to bond sectors, and individual bond valuations are extrapolated. Inputs used to generate the yield curve are bellwether issue levels, established trading spreads between similar issuers or credits, historical trading spreads over widely accepted market benchmarks, new issue scales, and verified bid information. Bid information is verified by corroborating the data against external sources such as broker-dealers, trustees/paying agents, issuers, or non-affiliated bondholders.
Mortgage and asset-backed securities
Collateralized mortgage obligations and other asset-backed securities are valued at the tranche level. For each tranche valuation, the process generates predicted cash flows for the tranche, applies a market based (or benchmark) yield/spread for each tranche, and incorporates deal collateral performance and tranche level attributes to determine tranche-specific spreads to adjust the benchmark yield. Tranche cash flows are generated from new deal files and prepayment/default assumptions. Tranche spreads are based on tranche characteristics such as average life, type, volatility, ratings, underlying collateral and performance, and prevailing market conditions. The appropriate tranche spread is applied to the corresponding benchmark, and the resulting value is used to discount the cash flows to generate an evaluated price.
Valuation of agency pass-through securities, typically issued under GNMA, FNMA, FHLMC, and SBA programs, are primarily derived from information from the To Be Announced (TBA) market. This market consists of generic mortgage pools which have not been received for settlement. Snapshots of the TBA market, using live data feeds distributed by multiple electronic platforms, andare used in conjunction with other indices are used to compute a price based on discounted cash flow models.
Other debt securities
Other debt securities are valued using active markets and inter-dealer brokers as well as bullet spread scales and option adjusted spreads. The spreads and models use yield curves, terms and conditions of the bonds, and any special features (e.g., call or put options and redemption features).
Equity securities
Equity securities are priced using the market prices for each security from the major stock exchanges or other electronic quotation systems. These are generally classified as Level 1 measurements. Stocks which trade infrequently are classified as Level 2.
At December 31, 2011, the Company held certain auction rate securities in itsThe available for sale portfolio totaling $135.6 million at fair value.includes certain auction rate securities. The auction process by which the auction rate securities are normally priced has not functioned since 2008, and due to the illiquidity in the market, the fair value of these securities cannot be based on observable market prices due to the illiquidity in the market.prices. The fair values of the auction ratethese securities are estimated using a discounted cash flows analysis. Estimated cash flows are based on mandatory interest rates paid under failing auctions and projected over an estimated market recovery period. The cash flows are discounted at an estimated market rate reflecting adjustments for liquidity premium and nonperformance risk.analysis which is discussed more fully in the Level 3 Inputs section of this note. Because many of the inputs significant to the measurement are not observable, these measurements are classified as Level 3 measurements.
Trading securities
The securities in the Company’s trading portfolio are priced by averaging several broker quotes for similar instruments and are classified as Level 2 measurements.
Private equity investments
These securities are held by the Company’s private equity subsidiaries and are included in non-marketable investment securities in the consolidated balance sheets. ValuationDue to the absence of quoted market prices, valuation of these nonpublic investments requires significant management judgment due to the absence of quoted market prices. Each quarter, valuations are performed utilizing available market data and other factors. Market data includes published trading multiples for private equity investments of similar size. The multiples are considered in conjunction with current operating performance, future expectations, financing and sales transactions, and other investment-specific issues. The Company applies its valuation methodology consistently from period to period, and believes that its methodology is similar to that used by other market participants.judgment. These fair value measurements, which are discussed in the Level 3 Inputs section of this note, are classified as Level 3.
Derivatives
The Company’s derivative instruments include interest rate swaps, foreign exchange forward contracts, commitments and sales contracts related to personal mortgage loan origination activity, and certain credit risk guarantee agreements. When appropriate, the impact of credit standing as well as any potential credit enhancements, such as collateral, has been considered in the fair value measurement.
Valuations for interest rate swaps are derived from a proprietary model whose significant inputs are readily observable market parameters, primarily yield curves.curves used to calculate current exposure. Counterparty credit risk is incorporated into the model and calculated by applying a net credit spread over LIBOR to the swap's total expected exposure over time. The net credit spread is comprised of spreads for both the Company and its counterparty, derived from probability of default and other loss estimate information obtained from a third party credit data provider or from the Company's Credit Department when not otherwise available. The credit risk component is not significant compared to the overall fair value of the swaps. The results of the model are constantly validated through comparison to active trading in the marketplace. These fair value measurements are classified as Level 2.
Fair value measurements for foreign exchange contracts are derived from a model whose primary inputs are quotations from global market makers and are classified as Level 2.
The fair values of mortgage loan commitments and forward sales contracts on the associated loans are based on quoted prices for similar loans in the secondary market. These prices include the value of loan servicing rights. However, these prices are adjusted by a factor which considers the likelihood that a commitment will ultimately result in a closed loan. This estimate is based on the Company’s historical data and its judgment about future economic trends. Based on the unobservable nature of this adjustment, these measurements are classified as Level 3.
The Company’s contracts related to credit risk guarantees are valued under a proprietary model which uses significant unobservable inputs and assumptions about the creditworthiness of the counterparty (generally a Bank customer). Customer credit spreads, which are based on probability of default and other loss estimates, are calculated internally by the Company's Credit Department, as mentioned above, and are based on the Company's internal risk rating for each customer. Because these inputs are significant to the guaranteed interest rate swap contract. Consequently, these measurements, they are classified as Level 3.
Assets held in trust
Assets held in an outside trust for the Company’s deferred compensation plan consist of investments in mutual funds. The fair value measurements are based on quoted prices in active markets and classified as Level 1. The Company has recorded an asset representing the total investment amount. The Company has also recorded a corresponding nonfinancial liability, representing the Company’s liability to the plan participants.
The table below presents the carrying values of assets and liabilities measured at fair value on a recurring basis at December 31, 2011 and 2010. There were no transfers among levels during these years.
|
| | | | | | | | | | | | |
| | | Fair Value Measurements Using |
| (In thousands) | Total Fair Value | Quoted Prices in Active Markets for Identical Assets (Level 1) | Significant Other Observable Inputs (Level 2) | Significant Unobservable Inputs (Level 3) |
| December 31, 2011 | | | | |
| Assets: | | | | |
| Available for sale securities: | | | | |
| U.S. government and federal agency obligations | $ | 364,665 |
| $ | 357,155 |
| $ | 7,510 |
| $ | — |
|
| Government-sponsored enterprise obligations | 315,698 |
| — |
| 315,698 |
| — |
|
| State and municipal obligations | 1,245,284 |
| — |
| 1,109,663 |
| 135,621 |
|
| Agency mortgage-backed securities | 4,106,059 |
| — |
| 4,106,059 |
| — |
|
| Non-agency mortgage-backed securities | 316,902 |
| — |
| 316,902 |
| — |
|
| Asset-backed securities | 2,693,143 |
| — |
| 2,693,143 |
| — |
|
| Other debt securities | 141,260 |
| — |
| 141,260 |
| — |
|
| Equity securities | 41,691 |
| 27,808 |
| 13,883 |
| — |
|
| Trading securities | 17,853 |
| — |
| 17,853 |
| — |
|
| Private equity investments | 66,978 |
| — |
| — |
| 66,978 |
|
| Derivatives * | 21,537 |
| — |
| 21,502 |
| 35 |
|
| Assets held in trust | 4,506 |
| 4,506 |
| — |
| — |
|
| Total assets | 9,335,576 |
| 389,469 |
| 8,743,473 |
| 202,634 |
|
| Liabilities: | | | | |
| Derivatives * | 22,722 |
| — |
| 22,564 |
| 158 |
|
| Total liabilities | $ | 22,722 |
| $ | — |
| $ | 22,564 |
| $ | 158 |
|
| December 31, 2010 | | | | |
| Assets: | | | | |
| Available for sale securities: | | | | |
| U.S. government and federal agency obligations | $ | 455,537 |
| $ | 448,087 |
| $ | 7,450 |
| $ | — |
|
| Government-sponsored enterprise obligations | 201,895 |
| — |
| 201,895 |
| — |
|
| State and municipal obligations | 1,119,485 |
| — |
| 969,396 |
| 150,089 |
|
| Agency mortgage-backed securities | 2,491,199 |
| — |
| 2,491,199 |
| — |
|
| Non-agency mortgage-backed securities | 455,790 |
| — |
| 455,790 |
| — |
|
| Asset-backed securities | 2,354,260 |
| — |
| 2,354,260 |
| — |
|
| Other debt securities | 176,964 |
| — |
| 176,964 |
| — |
|
| Equity securities | 39,173 |
| 22,900 |
| 16,273 |
| — |
|
| Trading securities | 11,710 |
| — |
| 11,710 |
| — |
|
| Private equity investments | 53,860 |
| — |
| — |
| 53,860 |
|
| Derivatives * | 18,823 |
| — |
| 18,288 |
| 535 |
|
| Assets held in trust | 4,213 |
| 4,213 |
| — |
| — |
|
| Total assets | 7,382,909 |
| 475,200 |
| 6,703,225 |
| 204,484 |
|
| Liabilities: | | | | |
| Derivatives * | 19,584 |
| — |
| 19,401 |
| 183 |
|
| Total liabilities | $ | 19,584 |
| $ | — |
| $ | 19,401 |
| $ | 183 |
|
| |
* | The fair value of each class of derivative is shown in Note 17. |
The changes in Level 3 assets and liabilities measured at fair value on a recurring basis are summarized as follows:
| |
| Fair Value Measurements Using Significant Unobservable Inputs (Level 3) | Fair Value Measurements Using Significant Unobservable Inputs (Level 3) |
| (In thousands) | State and Municipal Obligations | Private Equity Investments | Derivatives | Total | State and Municipal Obligations | Private Equity Investments | Derivatives | Total |
| Year ended December 31, 2012: | | |
| Balance at January 1, 2012 | | $ | 135,621 |
| $ | 66,978 |
| $ | (123 | ) | $ | 202,476 |
|
| Total gains or losses (realized/unrealized): | | |
| Included in earnings | | — |
| 4,505 |
| 16 |
| 4,521 |
|
| Included in other comprehensive income | | (1,368 | ) | — |
| — |
| (1,368 | ) |
| Investment securities called | | (8,275 | ) | — |
| — |
| (8,275 | ) |
| Discount accretion | | 436 |
| — |
| — |
| 436 |
|
| Purchases of private equity securities | | — |
| 8,910 |
| — |
| 8,910 |
|
| Sale / paydown of private equity securities | | — |
| (12,751 | ) | — |
| (12,751 | ) |
| Capitalized interest/dividends | | — |
| 525 |
| — |
| 525 |
|
| Purchase of risk participation agreement | | — |
| — |
| 28 |
| 28 |
|
| Sale of risk participation agreement | | — |
| — |
| (108 | ) | (108 | ) |
| Balance at December 31, 2012 | | $ | 126,414 |
| $ | 68,167 |
| $ | (187 | ) | $ | 194,394 |
|
| Total gains or losses for the annual period included in earnings attributable to the change in unrealized gains or losses relating to assets still held at December 31, 2012 | | $ | — |
| $ | 3,080 |
| $ | (21 | ) | $ | 3,059 |
|
| Year ended December 31, 2011: | | |
| Balance at January 1, 2011 | $ | 150,089 |
| $ | 53,860 |
| $ | 352 |
| $ | 204,301 |
| $ | 150,089 |
| $ | 53,860 |
| $ | 352 |
| $ | 204,301 |
|
| Total gains or losses (realized/unrealized): | | |
| Included in earnings | — |
| 10,784 |
| (203 | ) | 10,581 |
| — |
| 10,784 |
| (203 | ) | 10,581 |
|
| Included in other comprehensive income | (2,493 | ) | — |
| — |
| (2,493 | ) | (2,493 | ) | — |
| — |
| (2,493 | ) |
| Investment securities called | (12,593 | ) | — |
| — |
| (12,593 | ) | (12,593 | ) | — |
| — |
| (12,593 | ) |
| Discount accretion | 618 |
| — |
| — |
| 618 |
| 618 |
| — |
| — |
| 618 |
|
| Purchases of private equity securities | — |
| 9,905 |
| — |
| 9,905 |
| — |
| 9,905 |
| — |
| 9,905 |
|
| Sale / paydown of private equity securities | — |
| (7,847 | ) | — |
| (7,847 | ) | — |
| (7,847 | ) | — |
| (7,847 | ) |
| Capitalized interest/dividends | — |
| 276 |
| — |
| 276 |
| — |
| 276 |
| — |
| 276 |
|
| Purchase of risk participation agreement | — |
| — |
| 79 |
| 79 |
| — |
| — |
| 79 |
| 79 |
|
| Sale of risk participation agreement | — |
| — |
| (351 | ) | (351 | ) | — |
| — |
| (351 | ) | (351 | ) |
| Balance at December 31, 2011 | $ | 135,621 |
| $ | 66,978 |
| $ | (123 | ) | $ | 202,476 |
| $ | 135,621 |
| $ | 66,978 |
| $ | (123 | ) | $ | 202,476 |
|
| Total gains or losses for the annual period included in earnings attributable to the change in unrealized gains or losses relating to assets still held at December 31, 2011 | $ | — |
| $ | 8,084 |
| $ | 4 |
| $ | 8,088 |
| $ | — |
| $ | 8,084 |
| $ | 4 |
| $ | 8,088 |
|
| Year ended December 31, 2010: | | |
| Balance at January 1, 2010 | $ | 167,836 |
| $ | 44,827 |
| $ | 108 |
| $ | 212,771 |
| |
| Total gains or losses (realized/unrealized): | | |
| Included in earnings | — |
| (156 | ) | 375 |
| 219 |
| |
| Included in other comprehensive income | (9,460 | ) | — |
| — |
| (9,460 | ) | |
| Investment securities called | (9,000 | ) | — |
| — |
| (9,000 | ) | |
| Discount accretion | 713 |
| — |
| — |
| 713 |
| |
| Purchases of private equity securities | — |
| 9,832 |
| — |
| 9,832 |
| |
| Sale / paydown of private equity securities | — |
| (818 | ) | — |
| (818 | ) | |
| Capitalized interest/dividends | — |
| 175 |
| — |
| 175 |
| |
| Sale of risk participation agreement | — |
| — |
| (131 | ) | (131 | ) | |
| Balance at December 31, 2010 | $ | 150,089 |
| $ | 53,860 |
| $ | 352 |
| $ | 204,301 |
| |
| Total gains or losses for the annual period included in earnings attributable to the change in unrealized gains or losses relating to assets still held at December 31, 2010 | $ | — |
| $ | (44 | ) | $ | 702 |
| $ | 658 |
| |
Gains and losses on the Level 3 assets and liabilities in the table above are reported in the following income categories:
| | | (In thousands) | Loan Fees and Sales | Other Non-Interest Income | Investment Securities Gains (Losses), Net | Total | Loan Fees and Sales | Other Non-Interest Income | Investment Securities Gains (Losses), Net | Total |
| Year ended December 31, 2012: | | |
| Total gains or losses included in earnings | | $ | (9 | ) | $ | 25 |
| $ | 4,505 |
| $ | 4,521 |
|
| Change in unrealized gains or losses relating to assets still held at December 31, 2012 | | $ | — |
| $ | (21 | ) | $ | 3,080 |
| $ | 3,059 |
|
| Year ended December 31, 2011: | | |
| Total gains or losses included in earnings | $ | (473 | ) | $ | 270 |
| $ | 10,784 |
| $ | 10,581 |
| $ | (473 | ) | $ | 270 |
| $ | 10,784 |
| $ | 10,581 |
|
| Change in unrealized gains or losses relating to assets still held at December 31, 2011 | $ | 9 |
| $ | (5 | ) | $ | 8,084 |
| $ | 8,088 |
| $ | 9 |
| $ | (5 | ) | $ | 8,084 |
| $ | 8,088 |
|
| Year ended December 31, 2010: | | |
| Total gains or losses included in earnings | $ | 274 |
| $ | 101 |
| $ | (156 | ) | $ | 219 |
| |
| Change in unrealized gains or losses relating to assets still held at December 31, 2010 | $ | 482 |
| $ | 220 |
| $ | (44 | ) | $ | 658 |
| |
Level 3 Inputs
As shown above, the Company's significant Level 3 measurements which employ unobservable inputs that are readily quantifiable pertain to auction rate securities (ARS) held by the Bank and investments in portfolio concerns held by the Company's private equity subsidiaries. ARS are included in state and municipal securities and totaled $126.4 million at December 31, 2012, while private equity investments, included in non-marketable securities, totaled $68.2 million.
Information about these inputs is presented in the table and discussions below.
|
| | | | | |
| Quantitative Information about Level 3 Fair Value Measurements | | |
| | Valuation Technique | Unobservable Input | Range |
| Auction rate securities | Discounted cash flow | Estimated market recovery period | 5 years |
| | | Estimated market rate | 2.3% | - | 4.0% |
| Private equity investments | Market comparable companies | EBITDA multiple | 4.0 | - | 5.4 |
The fair values of ARS are estimated using a discounted cash flows analysis in which estimated cash flows are based on mandatory interest rates paid under failing auctions and projected over an estimated market recovery period. Under normal conditions, ARS traded in weekly auctions and were considered liquid investments. The Company's estimate of when these auctions might resume is highly judgmental and subject to variation depending on current and projected market conditions. Few auctions of these securities have been held since 2008, and most sales have been privately arranged. Estimated cash flows during the period over which the Company expects to hold the securities are discounted at an estimated market rate. These securities are comprised of bonds issued by various states and municipalities for healthcare and student lending purposes, and market rates are derived for each type. Market rates are calculated at each valuation date using a LIBOR or Treasury based rate plus spreads representing adjustments for liquidity premium and nonperformance risk. The spreads are developed internally by employees in the Company's bond department. An increase in the holding period alone would result in a higher fair value measurement, while an increase in the estimated market rate (the discount rate) alone would result in a lower fair value measurement. The valuation of ARS is reviewed at least quarterly by members of the Company's Asset/Liability Committee.
The fair values of the Company's private equity investments are based on a determination of fair value of the investee company less exit costs and preference payments assuming the sale of the investee company. Investee companies are normally non-public entities. The fair value of the investee company is determined by reference to the investee's total earnings before interest, depreciation/amortization, and income taxes (EBITDA) multiplied by an EBITDA factor. EBITDA is normally determined based on a trailing prior period adjusted for specific factors including current economic outlook, investee management, and specific unique circumstances such as sales order information, major customer status, regulatory changes, etc. The EBITDA multiple is based on management's review of published trading multiples for recent private equity transactions and other judgments and is derived for each individual investee. The value of the investee company is then reduced to reflect appropriate assumed selling and liquidation costs. The fair value of the Company's investment (which is usually a partial interest in the investee company) is then calculated based on its ownership percentage in the investee company. On a quarterly basis, these fair value analyses are reviewed by a valuation committee consisting of investment managers and senior Company management.
Instruments Measured at Fair Value on a Nonrecurring Basis
For assets measured at fair value on a nonrecurring basis during 2012 and 2011, and still held as of December 31, 2012 and 2011, the following table provides the adjustments to fair value recognized during the respective periods, the level of valuation assumptions used to determine each adjustment, and the carrying value of the related individual assets or portfolios at December 31, 2012 and 2011.
|
| | | | | | | | | | | | | | | |
| | | Fair Value Measurements Using | |
| (In thousands) | Fair Value | Quoted Prices in Active Markets for Identical Assets (Level 1) | Significant Other Observable Inputs (Level 2) | Significant Unobservable Inputs (Level 3) | Total Gains (Losses) |
| Balance at December 31, 2012 | | | | | |
| Collateral dependent impaired loans | $ | 24,572 |
| $ | — |
| $ | — |
| $ | 24,572 |
| $ | (8,411 | ) |
| Mortgage servicing rights | 472 |
| — |
| — |
| 472 |
| 34 |
|
| Foreclosed assets | 297 |
| — |
| — |
| 297 |
| (170 | ) |
| Long-lived assets | 5,617 |
| — |
| — |
| 5,617 |
| (3,428 | ) |
| Balance at December 31, 2011 | | | | | |
| Collateral dependent impaired loans | $ | 42,262 |
| $ | — |
| $ | — |
| $ | 42,262 |
| $ | (15,336 | ) |
| Mortgage servicing rights | 744 |
| — |
| — |
| 744 |
| (242 | ) |
| Foreclosed assets | 2,178 |
| — |
| — |
| 2,178 |
| (1,308 | ) |
| Long-lived assets | 8,266 |
| — |
| — |
| 8,266 |
| (4,042 | ) |
Valuation methods for instruments measured at fair value on a nonrecurring basis
Following is a description of the Company’s valuation methodologies used for other financial and nonfinancial instruments measured at fair value on a nonrecurring basis.
Collateral dependent impaired loans
While the overall loan portfolio is not carried at fair value, the Company periodically records nonrecurring adjustments to the carrying value of loans based on fair value measurements for partial charge-offs of the uncollectible portions of those loans. Nonrecurring adjustments also include certain impairment amounts for collateral dependent loans when establishing the allowance for loan losses. Such amounts are generally based on the fair value of the underlying collateral supporting the loan. In determining the value of real estate collateral, the Company relies on external appraisals and assessmentinternal appraisals of property values by its internal staff.depending on the size and complexity of the real estate collateral. The Company maintains a staff of qualified appraisers who also review third party appraisal reports for reasonableness. In the case of non-real estate collateral, reliance is placed on a variety of sources, including external estimates of value and judgments based on the experience and expertise of internal specialists. Because manyValues of all loan collateral are regularly reviewed by credit administration. Unobservable inputs to these inputsmeasurements, which include estimates and judgments often used in conjunction with appraisals, are not observable, thereadily quantifiable. These measurements are classified as Level 3. Changes in fair value recognized for partial charge-offs of loans and loan impairment reserves on loans held by the Company at December 31, 20112012 and 20102011 are shown in the table below.above.
Loans held for sale
Loans held for sale are carried at the lower of cost or fair value. The portfolio consists of student loans and, in prior years, residential real estate loans which the Company intends to sell in secondary markets. A portion of the student loan portfolio is under contract to agenciesan agency which havehas been unable to consistently purchase loans under existing contractual terms. These loans have been evaluated using a fair value measurement method based on a discounted cash flows analysis, which is classified as Level 3. The fair value of these loans was $6.7$5.8 million at December 31, 20112012, net of an impairment reserve of $175 thousand.$148 thousand. The measurement of fair value for other student loans is based on the specific prices mandated in the underlying sale contracts and the estimated exit price and is classified as Level 2. Fair value measurements on mortgage loans held for sale are based on quoted market prices for similar loans in the secondary market and are classified as Level 2.
Private equity investments and restricted stock
These assets are included in non-marketable investment securities in the consolidated balance sheets. They include certain investments in private equity concerns held by the Parent company which are carried at cost, reduced by other-than-temporary impairment. These investments are periodically evaluated for impairment based on their estimated fair value as determined by review of available information, most of which is provided as monthly or quarterly internal financial statements, annual audited financial statements, investee tax returns, and in certain situations, through research into and analysis of the assets and investments held by those private equity concerns. Restricted stock consists of stock issued by the Federal Reserve Bank and FHLB which is held by the bank subsidiary as required for regulatory purposes. Generally, there are restrictions on the sale and/or liquidation of these investments, and they are carried at cost, reduced by other-than-temporary impairment. Fair value measurements for these securities are classified as Level 3.
Mortgage servicing rights
The Company initially measures its mortgage servicing rights at fair value and amortizes them over the period of estimated net servicing income. They are periodically assessed for impairment based on fair value at the reporting date. Mortgage servicing rights do not trade in an active market with readily observable prices. Accordingly, the fair value is estimated based on a valuation model which calculates the present value of estimated future net servicing income. The model incorporates assumptions that market participants use in estimating future net servicing income, including estimates of prepayment speeds, market discount rates, cost to service, float earnings rates, and other ancillary income, including late fees. The fair value measurements are classified as Level 3.
Goodwill and core deposit premium
Valuation of goodwill to determine impairment is performed on an annual basis, or more frequently if there is an event or circumstance that would indicate impairment may have occurred. The process involves calculations to determine the fair value of each reporting unit on a stand-alone basis. A combination of formulas using current market multiples, based on recent sales of financial institutions within the Company’s geographic marketplace, is used to estimate the fair value of each reporting unit. That fair value is compared to the carrying amount of the reporting unit, including its recorded goodwill. Impairment is considered to have occurred if the fair value of the reporting unit is lower than the carrying amount of the reporting unit. The fair value of the Company’s common stock relative to its computed book value per share is also considered as part of the overall evaluation. These measurements are classified as Level 3.
Core deposit premiums are recognized at the time a portfolio of deposits is acquired, using valuation techniques which calculate the present value of the estimated net cost savings attributable to the core deposit base, relative to alternative costs of funds and tax benefits, if applicable, over the expected remaining economic life of the depositors. Subsequent evaluations are made when facts or circumstances indicate potential impairment may have occurred. The Company uses estimates of discounted future cash flows, comparisons with alternative sources for deposits, consideration of income potential generated in other product lines by current customers, geographic parameters, and other demographics to estimate a current fair value of a specific deposit base. If the calculated fair value is less than the carrying value, impairment is considered to have occurred. This measurement is classified as Level 3.
Foreclosed assets
Foreclosed assets consist of loan collateral which has been repossessed through foreclosure. This collateral is comprised of commercial and residential real estate and other non-real estate property, including auto, marine and recreational vehicles. Foreclosed assets are recorded as held for sale initially at the lower of the loan balance or fair value of the collateral less estimated selling costs. After their initial recognition, foreclosedSubsequent to foreclosure, valuations are updated periodically, and the assets are valued at the lower of the amount recorded at acquisition date or the current fair value less estimated costs to sell.may be marked down further, reflecting a new cost basis. Fair value measurements may be based upon appraisals, third-party price opinions, or internally developed pricing methods. These measurements are classified as Level 3.
Long-lived assets
In accordance with ASC 360-10-35, investments in branch facilities and various office buildings are written down to estimated fair value, or estimated fair value less cost to sell if the property is held for sale. Fair value is estimated in a process which considers current local commercial real estate market conditions and the judgment of the sales agent on pricing and sales strategy.often involves obtaining third party appraisals from certified real estate appraisers. The carrying amounts of these real estate holdings are regularly monitored by real estate professionals employed by the Company. These fair value measurements are classified as Level 3.
Unobservable inputs to these measurements, which include estimates and judgments often used in conjunction with appraisals, are not readily quantifiable. The loss recognized in For assets measured at fair value on2012 resulted primarily from the Company's decision to market certain property adjacent to a nonrecurring basis during 2011 and 2010, and stilldowntown Kansas City office building, also held as of December 31, 2011 and 2010, the following table provides the adjustmentsfor sale, which required a write-down to fair value recognized during the respective periods, the level of valuation assumptions used to determine each adjustment, and the carrying value of the related individual assets or portfolios at December 31, less selling costs.2011 and 2010.
|
| | | | | | | | | | | | | | | |
| | | Fair Value Measurements Using | |
| (In thousands) | Fair Value | Quoted Prices in Active Markets for Identical Assets (Level 1) | Significant Other Observable Inputs (Level 2) | Significant Unobservable Inputs (Level 3) | Total Gains (Losses) |
| Balance at December 31, 2011 | | | | | |
| Loans | $ | 42,262 |
| $ | — |
| $ | — |
| $ | 42,262 |
| $ | (15,336 | ) |
| Mortgage servicing rights | 744 |
| — |
| — |
| 744 |
| (242 | ) |
| Foreclosed assets | 2,178 |
| — |
| — |
| 2,178 |
| (1,308 | ) |
| Long-lived assets | 8,266 |
| — |
| — |
| 8,266 |
| (4,042 | ) |
| Balance at December 31, 2010 | | | | | |
| Loans | $ | 51,157 |
| $ | — |
| $ | — |
| $ | 51,157 |
| $ | (17,134 | ) |
| Loans held for sale | 5,125 |
| | | 5,125 |
| (191 | ) |
| Private equity investments | 960 |
| — |
| — |
| 960 |
| (100 | ) |
| Mortgage servicing rights | 1,325 |
| — |
| — |
| 1,325 |
| (72 | ) |
| Foreclosed assets | 8,484 |
| — |
| — |
| 8,484 |
| (4,004 | ) |
| Long-lived assets | 6,372 |
| — |
| — |
| 6,372 |
| (2,018 | ) |
16. Fair Value of Financial Instruments
The carrying amounts and estimated fair values of financial instruments held by the Company, in addition to a discussion of the methods used and assumptions made in computing those estimates, are set forth below.
Loans
The fair values of loans are estimated by discounting the expected future cash flows using the current rates at which similar loans would be made to borrowers with similar credit ratings and for the same remaining maturities. This method of estimating fair value does not incorporate the exit-price concept of fair value prescribed by ASC 820 “Fair Value Measurements and Disclosures”. Expected future cash flows for each individual loan are based on contractual features, and for loans with optionality, such as variable rates and prepayment features, are based on a multi-rate path process. Each loan's expected future cash flows are discounted using the LIBOR/swap curve plus an appropriate spread. For business, construction and business real estate loans, internally-developed pricing spreads are developed which are based on loan type, term and credit score. The spread for personal real estate loans is generally based on newly originated loans with similar characteristics. For consumer loans, the spread is calculated at loan origination as part of the Bank's funds transfer pricing process, which is indicative of individual borrower credit worthiness. All consumer credit card loans are discounted at the same spread, depending on whether the rate is variable or fixed.
Loans Held for Sale, Investment Securities and Derivative Instruments
A detailed descriptionDetailed descriptions of the fair value measurementmeasurements of the debt and equitythese instruments in the available for sale and trading sections of the investment security portfolio isare provided in Note 15 on Fair Value Measurements. A schedule of available for sale investment securities by category and maturity is provided in Note 3 on Investment Securities.
Federal Funds SoldPurchased and Securities Purchased under Agreements to Resell,Sold, Interest Earning Deposits With Banks and Cash and Due From Banks
The carrying amounts of short-term federal funds soldpurchased and securities purchased under agreements to resell,sold, interest earning deposits with banks, and cash and due from banks approximateapproximates fair value. Federal funds sold and securities purchasedvalue, as these instruments are payable on demand or mature overnight.
Securities Purchased/Sold under agreementsAgreements to resell classified as short-term generally mature in 90 days or less. Resell/Repurchase
The fair valuevalues of long-term securities purchased under agreements to resell isthese investments and borrowings are estimated by discounting contractual maturities using an estimate of the current market rate for similar instruments.
Accrued Interest Receivable/Payable
The carrying amounts of accrued interest receivable and accrued interest payable approximate their fair values because of the relatively short time period between the accrual period and the expected receipt or payment due date.
Derivative Instruments
A detailed description of the fair value measurement of derivative instruments is provided in the preceding note on Fair Value Measurements. Fair values are generally estimated using observable market prices or pricing models.
Deposits
The fair value of deposits with no stated maturity is equal to the amount payable on demand. Such deposits include savings and interest and non-interest bearing demand deposits. These fair value estimates do not recognize any benefit the Company receives as a result of being able to administer, or control, the pricing of these accounts. Because they are payable on demand, they are classified as Level 1 in the fair value hierarchy. The fair value of time open and certificates of deposit is based on the discounted value of cash flows, taking early withdrawal optionality into account. Discount rates are based on the Company’s approximate cost of obtaining similar maturity funding in the market. Their fair value measurement is classified as Level 3.
Other Borrowings
The fair value of short-termother borrowings, such as federal funds purchased and securities sold under agreements to repurchase, which generally mature or reprice within 90 days, approximates their carrying value. The fair valueconsists of long-term structured repurchase agreements and other long-term debt, is estimated by discounting contractual maturities using an estimate of the current market rate for similar instruments.
The estimated fair values of the Company’s financial instruments are as follows:
| | | | 2011 | | 2010 | Fair Value Hierarchy Level | 2012 | | 2011 |
| (In thousands) | Carrying Amount | Estimated Fair Value | | Carrying Amount | Estimated Fair Value | Carrying Amount | Estimated Fair Value | | Carrying Amount | Estimated Fair Value |
| Financial Assets | | | | | | | |
| Loans, including held for sale | $ | 9,208,554 |
| $ | 9,319,823 |
| | $ | 9,474,733 |
| $ | 9,482,631 |
| |
| Available for sale investment securities | 9,224,702 |
| 9,224,702 |
| | 7,294,303 |
| 7,294,303 |
| |
| Trading securities | 17,853 |
| 17,853 |
| | 11,710 |
| 11,710 |
| |
| Non-marketable securities | 115,832 |
| 115,832 |
| | 103,521 |
| 103,521 |
| |
| Short-term federal funds sold and securities purchased under agreements to resell | 11,870 |
| 11,870 |
| | 10,135 |
| 10,135 |
| |
| Long-term securities purchased under agreements to resell | 850,000 |
| 864,089 |
| | 450,000 |
| 454,783 |
| |
| Loans: | | | | | |
| Business | | Level 3 | $ | 3,134,801 |
| $ | 3,144,989 |
| | $ | 2,808,265 |
| $ | 2,820,005 |
|
| Real estate - construction and land | | Level 3 | 355,996 |
| 352,547 |
| | 386,598 |
| 388,723 |
|
| Real estate - business | | Level 3 | 2,214,975 |
| 2,240,796 |
| | 2,180,100 |
| 2,197,535 |
|
| Real estate - personal | | Level 3 | 1,584,859 |
| 1,642,820 |
| | 1,428,777 |
| 1,485,028 |
|
| Consumer | | Level 3 | 1,289,650 |
| 1,309,403 |
| | 1,114,889 |
| 1,136,798 |
|
| Revolving home equity | | Level 3 | 437,567 |
| 441,651 |
| | 463,587 |
| 471,086 |
|
| Consumer credit card | | Level 3 | 804,245 |
| 823,560 |
| | 788,701 |
| 780,808 |
|
| Overdrafts | | Level 3 | 9,291 |
| 9,291 |
| | 6,561 |
| 6,561 |
|
| Loans held for sale | | Level 2 | 3,017 |
| 3,030 |
| | 24,394 |
| 26,597 |
|
| Loans held for sale | | Level 3 | 5,810 |
| 5,810 |
| | 6,682 |
| 6,682 |
|
| Investment securities: | | | | | |
| Available for sale | | Level 1 | 456,594 |
| 456,594 |
| | 384,963 |
| 384,963 |
|
| Available for sale | | Level 2 | 8,939,240 |
| 8,939,240 |
| | 8,704,118 |
| 8,704,118 |
|
| Available for sale | | Level 3 | 126,414 |
| 126,414 |
| | 135,621 |
| 135,621 |
|
| Trading | | Level 2 | 28,837 |
| 28,837 |
| | 17,853 |
| 17,853 |
|
| Non-marketable | | Level 3 | 118,650 |
| 118,650 |
| | 115,832 |
| 115,832 |
|
| Federal funds sold | | Level 1 | 27,595 |
| 27,595 |
| | 11,870 |
| 11,870 |
|
| Securities purchased under agreements to resell | | Level 3 | 1,200,000 |
| 1,215,234 |
| | 850,000 |
| 864,089 |
|
| Interest earning deposits with banks | 39,853 |
| 39,853 |
| | 122,076 |
| 122,076 |
| Level 1 | 179,164 |
| 179,164 |
| | 39,853 |
| 39,853 |
|
| Cash and due from banks | 465,828 |
| 465,828 |
| | 328,464 |
| 328,464 |
| Level 1 | 573,066 |
| 573,066 |
| | 465,828 |
| 465,828 |
|
| Accrued interest receivable | 64,522 |
| 64,522 |
| | 62,512 |
| 62,512 |
| |
| Derivative instruments | | Level 2 | 16,731 |
| 16,731 |
| | 21,502 |
| 21,502 |
|
| Derivative instruments | 21,537 |
| 21,537 |
| | 18,823 |
| 18,823 |
| Level 3 | 9 |
| 9 |
| | 35 |
| 35 |
|
| Financial Liabilities | | | | | | | |
| Non-interest bearing deposits | $ | 5,377,549 |
| $ | 5,377,549 |
| | $ | 4,494,028 |
| $ | 4,494,028 |
| Level 1 | $ | 6,299,903 |
| $ | 6,299,903 |
| | $ | 5,377,549 |
| $ | 5,377,549 |
|
| Savings, interest checking and money market deposits | 8,933,941 |
| 8,933,941 |
| | 7,846,831 |
| 7,846,831 |
| Level 1 | 9,817,943 |
| 9,817,943 |
| | 8,933,941 |
| 8,933,941 |
|
| Time open and C.D.’s | 2,488,393 |
| 2,493,727 |
| | 2,744,162 |
| 2,761,796 |
| |
| Federal funds purchased and securities sold under agreements to repurchase | 1,256,081 |
| 1,253,213 |
| | 982,827 |
| 987,472 |
| |
| Time open and certificates of deposit | | Level 3 | 2,230,807 |
| 2,239,595 |
| | 2,488,393 |
| 2,493,727 |
|
| Federal funds purchased | | Level 1 | 24,510 |
| 24,510 |
| | 153,330 |
| 153,330 |
|
| Securities sold under agreements to repurchase | | Level 3 | 1,059,040 |
| 1,057,462 |
| | 1,102,751 |
| 1,099,883 |
|
| Other borrowings | 111,817 |
| 126,397 |
| | 112,273 |
| 122,514 |
| Level 3 | 103,710 |
| 117,527 |
| | 111,817 |
| 126,397 |
|
| Accrued interest payable | 7,510 |
| 7,510 |
| | 12,108 |
| 12,108 |
| |
| Derivative instruments | 22,722 |
| 22,722 |
| | 19,584 |
| 19,584 |
| Level 2 | 17,522 |
| 17,522 |
| | 22,564 |
| 22,564 |
|
| Derivative instruments | | Level 3 | 196 |
| 196 |
| | 158 |
| 158 |
|
Off-Balance Sheet Financial Instruments
The fair value of letters of credit and commitments to extend credit is based on the fees currently charged to enter into similar agreements. The aggregate of these fees is not material. These instruments are also referenced in Note 18 on Commitments, Contingencies and Guarantees.
Limitations
Fair value estimates are made at a specific point in time based on relevant market information. They do not reflect any premium or discount that could result from offering for sale at one time the Company’s entire holdings of a particular financial instrument. Because no market exists for many of the Company’s financial instruments, fair value estimates are based on judgments regarding future expected loss experience, risk characteristics and economic conditions. These estimates are subjective, involve uncertainties and cannot be determined with precision. Changes in assumptions could significantly affect the estimates.
17. Derivative Instruments
The notional amounts of the Company’s derivative instruments are shown in the table below. These contractual amounts, along with other terms of the derivative, are used to determine amounts to be exchanged between counterparties and are not a measure of loss exposure. The largest group of notional amounts relate to interest rate swaps, which are discussed in more detail below.
| | | | December 31 | December 31 |
| (In thousands) | 2011 | | 2010 | 2012 | | 2011 |
| Interest rate swaps | $ | 486,207 |
| | $ | 498,071 |
| $ | 435,542 |
| | $ | 486,207 |
|
| Interest rate caps | 29,736 |
| | 31,736 |
| 27,736 |
| | 29,736 |
|
| Credit risk participation agreements | 41,414 |
| | 40,661 |
| 43,243 |
| | 41,414 |
|
| Foreign exchange contracts | 80,535 |
| | 25,867 |
| 47,897 |
| | 80,535 |
|
| Mortgage loan commitments | 1,280 |
| | 12,125 |
| — |
| | 1,280 |
|
| Mortgage loan forward sale contracts | 3,650 |
| | 24,112 |
| — |
| | 3,650 |
|
| Total notional amount | $ | 642,822 |
| | $ | 632,572 |
| $ | 554,418 |
| | $ | 642,822 |
|
The Company’s foreign exchange activity involves the purchase and sale of forward foreign exchange contracts, which are commitments to purchase or deliver a specified amount of foreign currency at a specific future date. This activity enables customers involved in international business to hedge their exposure to foreign currency exchange rate fluctuations. The Company minimizes its related exposure arising from these customer transactions with offsetting contracts for the same currency and time frame. In addition, the Company uses foreign exchange contracts, to a limited extent, for trading purposes, including taking proprietary positions. Risk arises from changes in the currency exchange rate and from the potential for counterparty nonperformance. These risks are controlled by adherence to a foreign exchange trading policy which contains control limits on currency amounts, open positions, maturities and losses, and procedures for approvals, record-keeping, monitoring and reporting. Hedge accounting has not been applied to these foreign exchange activities. The increasedecline in these contracts over 2010from 2011 was driven by higherlargely due to lower customer demand from customers as a result of theand lower volatility in the currency markets during 2011.2012.
The Company’s mortgage banking operation makes commitments to extend fixed rate loans secured by 1-41-4 family residential properties. The Company’s general practice has beenin previous years was to sell such loans in the secondary market, and themarket. The related commitments arewere considered to be derivative instruments. These commitments arewere recognized on the balance sheet at fair value from their inception through their expiration or funding and havehad an average term of 60 to 90 days. The Company obtainsobtained forward sale contracts with investors in the secondary market in order to manage these risk positions. Most of the contracts arewere matched to a specific loan on a “best efforts” basis, in which the Company iswas obligated to deliver the loan only if the loan closes.closed. The sale contracts arewere also accounted for as derivatives. Hedge accounting haswas not been applied to these activities. In mid-2011,late 2011, the Company curtailed the sales of these types of loans, and the level of commitments and sales contracts recorded as derivatives declined significantly during the fourth quarter of 2011.at December 31, 2012, did not hold any such loans for sale.
Credit risk participation agreements arise when the Company contracts, with other financial institutions, as a guarantor or beneficiary, with other financial institutions to share credit risk associated with certain interest rate swaps. The Company’s risks and responsibilities as guarantor are further discussed in Note 18 on Commitments, Contingencies and Guarantees.
The Company’s interest rate risk management strategy includes the ability to modify the repricing characteristics of certain assets and liabilities so that changes in interest rates do not adversely affect the net interest margin and cash flows. Interest rate swaps are used on a limited basis as part of this strategy. At December 31, 20112012, the Company had entered into three interest rate swaps with a notional amount of $14.5$13.2 million, which are designated as fair value hedges of certain fixed rate loans. Gains and losses on these derivative instruments, as well as the offsetting loss or gain on the hedged loans attributable to the hedged risk, are recognized in current earnings. These gains and losses are reported in interest and fees on loans in the accompanying consolidated statements of income. The table below shows gains and losses related to fair value hedges.
| |
| | For the Years Ended December 31 | | For the Years Ended December 31 |
| (In thousands) | | 2011 | | 2010 | | 2009 | | 2012 | | 2011 | | 2010 |
| Gain (loss) on interest rate swaps | | $ | 106 |
| | $ | (305 | ) | | $ | 573 |
| | $ | 331 |
| | $ | 106 |
| | $ | (305 | ) |
| Gain (loss) on loans | | (95 | ) | | 291 |
| | (571 | ) | | (324 | ) | | (95 | ) | | 291 |
|
| Amount of hedge ineffectiveness | | $ | 11 |
| | $ | (14 | ) | | $ | 2 |
| | $ | 7 |
| | $ | 11 |
| | $ | (14 | ) |
The Company’s other derivative instruments are accounted for as free-standing derivatives, and changes in their fair value are recorded in current earnings. These instruments include interest rate swap contracts sold to customers who wish to modify their interest rate sensitivity. These swaps are offset by matching contracts purchased by the Company from other financial institutions. Because of the matching terms of the offsetting contracts, in addition to collateral provisions which mitigate the impact of non-performance risk, changes in fair value subsequent to initial recognition have a minimal effect on earnings. The notional amount of these types of swaps at December 31, 20112012 was $471.7$422.4 million. The Company is party to master netting arrangements with its institutional counterparties; however, the Company does not offset assets and liabilities under these arrangements. Collateral, usually in the form of marketable securities, is posted by the counterparty with liability positions, in accordance with contract thresholds. At December 31, 20112012, the Company had net liability positions with its financial institution counterparties totaling $19.1$16.6 million and had posted $17.4$17.2 million in collateral.
Many of the Company’s interest rate swap arrangements with large financial institutions contain contingent features relating to debt ratings or capitalization levels. Under these provisions, if the Company’s debt rating falls below investment grade or if the Company ceases to be “well-capitalized” under risk-based capital guidelines, certain counterparties can require immediate and ongoing collateralization on interest rate swaps in net liability positions, or can require instant settlement of the contracts. The Company maintains debt ratings and capital well above these minimum requirements.
The banking customer counterparties are engaged in a variety of businesses, including real estate, building materials, communications, consumer products, education, and manufacturing. At December 31, 2011,2012, the largest loss exposures were in the groups related to education, real estate educationand building materials, and manufacturing. If the counterparties in these groups failed to perform, and if the underlying collateral proved to be of no value, the Company would incur a losses of $4.0$3.7 million (education), $3.2 million (real estate and building materials), $3.7and $2.4 million (education) and $3.0 million (manufacturing), based on estimated amounts at December 31, 20112012.
The fair values of the Company’s derivative instruments are shown in the table below. Information about the valuation methods used to measure fair value is provided in Note 15 on Fair Value Measurements.
| | | | Asset Derivatives | | Liability Derivatives | Asset Derivatives | | Liability Derivatives |
| | | December 31 | | December 31 | | December 31 | | December 31 |
| | | 2011 | | 2010 | | 2011 | | 2010 | | 2012 | | 2011 | | 2012 | | 2011 |
(In thousands) | Balance Sheet Location | Fair Value | | Balance Sheet Location | Fair Value | Balance Sheet Location | Fair Value | | Balance Sheet Location | Fair Value |
| Derivatives designated as hedging instruments: | | | | | | | | | | | | | | | | | | |
| Interest rate swaps | Other assets | $ | — |
| | $ | — |
| | Other liabilities | $ | (1,053 | ) | | $ | (1,159 | ) | Other assets | $ | — |
| | $ | — |
| | Other liabilities | $ | (723 | ) | | $ | (1,053 | ) |
| Total derivatives designated as hedging instruments | | $ | — |
| | $ | — |
| | $ | (1,053 | ) | | $ | (1,159 | ) | | $ | — |
| | $ | — |
| | $ | (723 | ) | | $ | (1,053 | ) |
| Derivatives not designated as hedging instruments: | | | | | | | | | | | | | | | | |
| Interest rate swaps | Other assets | $ | 19,051 |
| | $ | 17,712 |
| | Other liabilities | $ | (19,157 | ) | | $ | (17,799 | ) | Other assets | $ | 16,334 |
| | $ | 19,051 |
| | Other liabilities | $ | (16,337 | ) | | $ | (19,157 | ) |
| Interest rate caps | Other assets | 11 |
| | 84 |
| | Other liabilities | (11 | ) | | (84 | ) | Other assets | 1 |
| | 11 |
| | Other liabilities | (1 | ) | | (11 | ) |
| Credit risk participation agreements | Other assets | 9 |
| | — |
| | Other liabilities | (141 | ) | | (130 | ) | Other assets | 9 |
| | 9 |
| | Other liabilities | (196 | ) | | (141 | ) |
| Foreign exchange contracts | Other assets | 2,440 |
| | 492 |
| | Other liabilities | (2,343 | ) | | (359 | ) | Other assets | 396 |
| | 2,440 |
| | Other liabilities | (461 | ) | | (2,343 | ) |
| Mortgage loan commitments | Other assets | 20 |
| | 101 |
| | Other liabilities | — |
| | (30 | ) | Other assets | — |
| | 20 |
| | Other liabilities | — |
| | — |
|
| Mortgage loan forward sale contracts | Other assets | 6 |
| | 434 |
| | Other liabilities | (17 | ) | | (23 | ) | Other assets | — |
| | 6 |
| | Other liabilities | — |
| | (17 | ) |
| Total derivatives not designated as hedging instruments | | $ | 21,537 |
| | $ | 18,823 |
| | $ | (21,669 | ) | | $ | (18,425 | ) | | $ | 16,740 |
| | $ | 21,537 |
| | $ | (16,995 | ) | | $ | (21,669 | ) |
| Total derivatives | | $ | 21,537 |
| | $ | 18,823 |
| | $ | (22,722 | ) | | $ | (19,584 | ) | | $ | 16,740 |
| | $ | 21,537 |
| | $ | (17,718 | ) | | $ | (22,722 | ) |
The effects of derivative instruments on the consolidated statements of income are shown in the table below.
| |
| Location of Gain or (Loss) Recognized in Income on Derivative | Amount of Gain or (Loss) Recognized in Income on Derivative | Location of Gain or (Loss) Recognized in Income on Derivative | Amount of Gain or (Loss) Recognized in Income on Derivative |
| | For the Years Ended December 31 | | For the Years Ended December 31 |
| (In thousands) | | 2011 | | 2010 | | 2009 | | 2012 | | 2011 | | 2010 |
| Derivatives in fair value hedging relationships: | | | | | | | | | | | | |
| Interest rate swaps | Interest and fees on loans | $ | 106 |
| | $ | (305 | ) | | $ | 573 |
| Interest and fees on loans | $ | 331 |
| | $ | 106 |
| | $ | (305 | ) |
| Total | | $ | 106 |
| | $ | (305 | ) | | $ | 573 |
| | $ | 331 |
| | $ | 106 |
| | $ | (305 | ) |
| Derivatives not designated as hedging instruments: | | | | | | | | | | | | |
| Interest rate swaps | Other non-interest income | $ | 797 |
| | $ | 1,202 |
| | $ | 360 |
| Other non-interest income | $ | 743 |
| | $ | 797 |
| | $ | 1,202 |
|
| Interest rate caps | Other non-interest income | — |
| | 32 |
| | 11 |
| Other non-interest income | — |
| | — |
| | 32 |
|
| Credit risk participation agreements | Other non-interest income | 270 |
| | 101 |
| | 16 |
| Other non-interest income | 25 |
| | 270 |
| | 101 |
|
| Foreign exchange contracts | Other non-interest income | (36 | ) | | 12 |
| | 130 |
| Other non-interest income | (161 | ) | | (36 | ) | | 12 |
|
| Mortgage loan commitments | Loan fees and sales | (51 | ) | | 43 |
| | (164 | ) | Loan fees and sales | (20 | ) | | (51 | ) | | 43 |
|
| Mortgage loan forward sale contracts | Loan fees and sales | (422 | ) | | 231 |
| | 247 |
| Loan fees and sales | 11 |
| | (422 | ) | | 231 |
|
| Total | | $ | 558 |
| | $ | 1,621 |
| | $ | 600 |
| | $ | 598 |
| | $ | 558 |
| | $ | 1,621 |
|
18. Commitments, Contingencies and Guarantees
The Company leases certain premises and equipment, all of which were classified as operating leases. The rent expense under such arrangements amounted to $6.16.9 million, $6.27.4 million and $6.37.6 million in 20112012, 20102011 and 20092010, respectively. A summary of minimum lease commitments follows:
| | | (In thousands) | Type of Property | | Type of Property | |
| Year Ended December 31 | Real Property | Equipment | Total | Real Property | Equipment | Total |
| 2012 | $ | 5,124 |
| $ | 222 |
| $ | 5,346 |
| |
| 2013 | 4,700 |
| 96 |
| 4,796 |
| $ | 5,247 |
| $ | 107 |
| $ | 5,354 |
|
| 2014 | 3,884 |
| 24 |
| 3,908 |
| 4,753 |
| 34 |
| 4,787 |
|
| 2015 | 2,942 |
| 22 |
| 2,964 |
| 3,366 |
| 25 |
| 3,391 |
|
| 2016 | 2,349 |
| 22 |
| 2,371 |
| 2,577 |
| 22 |
| 2,599 |
|
| 2017 | | 2,209 |
| 2 |
| 2,211 |
|
| After | 17,976 |
| 2 |
| 17,978 |
| 16,532 |
| — |
| 16,532 |
|
| Total minimum lease payments | | $ | 37,363 |
| | $ | 34,874 |
|
All leases expire prior to 2055. It is expected that in the normal course of business, leases that expire will be renewed or replaced by leases on other properties; thus, the future minimum lease commitments are not expected to be less than the amounts shown for 20122013.
The Company engages in various transactions and commitments with off-balance sheet risk in the normal course of business to meet customer financing needs. The Company uses the same credit policies in making the commitments and conditional obligations described below as it does for on-balance sheet instruments. The following table summarizes these commitments at December 31:
| | | (In thousands) | 2011 | 2010 | 2012 | 2011 |
| Commitments to extend credit: | | |
| Credit card | $ | 3,497,036 |
| $ | 3,395,261 |
| $ | 3,878,468 |
| $ | 3,497,036 |
|
| Other | 4,070,434 |
| 3,977,542 |
| 4,500,352 |
| 4,070,434 |
|
| Standby letters of credit, net of participations | 377,103 |
| 338,724 |
| 359,765 |
| 377,103 |
|
| Commercial letters of credit | 13,626 |
| 14,258 |
| 12,582 |
| 13,626 |
|
Commitments to extend credit are legally binding agreements to lend to a borrower providing there are no violations of any conditions established in the contract. As many of the commitments are expected to expire without being drawn upon, the total commitment does not necessarily represent future cash requirements. Refer to Note 2 on Loans and Allowance for Loan Losses for further discussion.
Commercial letters of credit act as a means of ensuring payment to a seller upon shipment of goods to a buyer. The majority of commercial letters of credit issued are used to settle payments in international trade. Typically, letters of credit require presentation of documents which describe the commercial transaction, evidence shipment, and transfer title.
The Company, as a provider of financial services, routinely issues financial guarantees in the form of financial and performance standby letters of credit. Standby letters of credit are contingent commitments issued by the Company generally to guarantee the payment or performance obligation of a customer to a third party. While these represent a potential outlay by the Company, a significant amount of the commitments may expire without being drawn upon. The Company has recourse against the customer for any amount it is required to pay to a third party under a standby letter of credit. The letters of credit are subject to the same credit policies, underwriting standards and approval process as loans made by the Company. Most of the standby letters of credit are secured, and in the event of nonperformance by the customer, the Company has rights to the underlying collateral, which could include commercial real estate, physical plant and property, inventory, receivables, cash and marketable securities.
At December 31, 20112012, the Company had recorded a liability in the amount of $5.85.3 million, representing the carrying value of the guarantee obligations associated with the standby letters of credit. This amount will be amortized into income over the life of the commitment. Commitments outstanding under these letters of credit, which represent the maximum potential future payments guaranteed by the Company, were $377.1359.8 million at December 31, 20112012.
The Company regularly purchases various state tax credits arising from third-party property redevelopment. While most of the taxThese credits are either resold to third parties some are periodicallyor retained for use by the Company. During 20112012, purchases and
sales of tax credits amounted to $46.056.9 million and $41.531.0 million, respectively. At December 31, 20112012, the Company had outstanding purchase commitments totaling $108.4149.8 million. The commitments are expected to be funded in 20122013 through 20152016.
The Company periodically enters into risk participation agreements (RPAs) as a guarantor to other financial institutions, in order to mitigate those institutions’ credit risk associated with interest rate swaps with third parties. The RPA stipulates that, in the event of default by the third party on the interest rate swap, the Company will reimburse a portion of the loss borne by the financial institution. These interest rate swaps are normally collateralized (generally with real property, inventories and equipment) by the third party, which limits the credit risk associated with the Company’s RPAs. The third parties usually have other borrowing relationships with the Company. The Company monitors overall borrower collateral, and at December 31, 20112012, believes sufficient collateral is available to cover potential swap losses. The RPAs are carried at fair value throughout their term, with all changes in fair value, including those due to a change in the third party’s creditworthiness, recorded in current earnings. The terms of the RPAs, which correspond to the terms of the underlying swaps, range from 54 to 10 years. At December 31, 20112012, the liability recorded for guarantor RPAs was $141196 thousand, and the notional amount of the underlying swaps was $38.540.0 million. The maximum potential future payment guaranteed by the Company cannot be readily estimated butand is dependent upon the fair value of the interest rate swaps at the time of default. If an event of default on all contracts had occurred at December 31, 2011, the Company would have been required to make payments of approximately $3.7 million.
During the past several years, the Company has carried a liability representing its obligation to share certain estimated litigation costs of Visa, Inc. (Visa). An escrow account has beenwas established by Visa and is being used to fund actual litigation settlements as they occur. The escrow account was funded initially with proceeds from an initial public offering in 2008 and subsequently with contributions by Visa. The Company’s indemnification obligation has been periodically adjusted to reflect changes in estimates of litigation costs and has been reduced as funding occurs in the escrow account. As a result of additional funding, in 2011, the liability has beenwas reduced to zero in 2011, as the Company believes that its proportional share of escrow funding to date has more than offset its liability related to the Visa litigation. The Company does have a liability recorded resulting from a preliminary settlement in 2012 related to Visa and MasterCard credit card interchange, which is discussed below.
On July 13, 2012, Visa and MasterCard each announced a preliminary settlement to resolve the plaintiffs' claims in the multi-district interchange litigation and also announced an agreement in principle to resolve the claims brought against them by certain individual retailers in that same litigation. The proposed settlement includes a cash payment to certain merchants of $6.6 billion, of which Visa is responsible for $4.4 billion, and a provision which would reduce credit card interchange income by 10 basis points over an 8 month period likely to begin in mid-2013, 60 days after a court-ordered period. Other provisions include the ability for merchants to surcharge customers for credit card usage, the ability for merchant buying groups to negotiate together with Visa and MasterCard, and the ability to cancel this proposed agreement if more than 25% of all affected merchants opt out of the agreement. The Company estimates that the pre-tax cost of the future reduction of 10 basis points in interchange income for an 8 month period, which is part of the above settlement, would amount to approximately $5.2 million. Accordingly, the Company has established a liability for these anticipated costs.
In December 2011, the Bank reached a class-wide settlement in a class action lawsuit captioned Wolfgeher v. Commerce Bank, Case No. 1:10-cv-22017 (MDL 2036) which alleged that the Bank had improperly charged overdraft fees on certain debit card transactions and claimed refunds for the plaintiff individually and on behalf of other customers as a class. A formal Settlement Agreement and Release related to this lawsuit was signed by the Bank on July 26, 2012. The Bank, while admitting no wrongdoing, agreed to the settlement in order to resolve the litigation and avoid further expense. The settlement subject to documentation and court approval, providesprovided for a payment of $18.3$18.3 million into a class settlement fund, the proceeds of which will be used to issue refunds to class members and to pay attorneys' fees, administrative and other costs, in exchange for a complete release of all claims asserted against the Bank. The Wolfgeher law suit was originally filed onBank also agreed to post debit card transactions in chronological order, beginning no later than April 6, 20102013. As a result of the change in the U.S. District Court forposting order of debit card transactions, the Western District of Missouri, and was transferredCompany currently estimates that overdraft income will be reduced on an annual basis by $6 million to the U.S. District Court for the Southern District of Florida as part of the multi-district litigation referred to as In re Checking Account Overdraft Litigation. The Bank, while admitting no wrongdoing, agreed to the settlement in order to resolve the litigation and avoid further expense.$8 million. A second suit alleging the same facts and also seeking class-action status was filed on June 4, 2010 in Missouri state court. The second suit continues to bewas stayed in deference to the earlier filed suit, and it is expected that resolution of the Wolfgeher suit will also dispose ofplaintiff in the Missouri state court suit.suit will opt out of the class-action settlement and pursue his claims as an individual plaintiff. In the opinion of management, the Missouri state court suit is not expected to have a material effect on the financial condition and results of operations of the Company.
On January 4, 2013, the Company was named in a petition by Patrick J. Malloy III, Bankruptcy Trustee for the Bankruptcy Estate of George David Gordon Jr. (“Gordon”). The petition was filed in the District Court in and for Tulsa County, State of Oklahoma and removed to the United States District Court for the Northern District of Oklahoma, and alleges that Gordon was involved in securities fraud and that Bank South, an Oklahoma bank that was subsequently acquired by the Company, together with a lending officer employed by Bank South, are jointly and severally liable, as aiders and abettors of the fraudulent scheme, for losses suffered by defrauded investors. The losses suffered by investors who have assigned their claims to the Trustee are alleged to be in excess of $8 million. The claim alleges that Commerce Bank is liable as a successor by merger to Bank South. Based on facts available to the Company and after discussion with outside counsel handling the matter, it is not possible to determine at this time whether this litigation presents a loss contingency that is probable or estimable. The Company believes it has substantial defenses to this matter and anticipates the matter will be resolved without material loss. No liability has been recorded at this time, in accordance with accounting guidance at ASC 450-20. This matter will continue to be evaluated on an ongoing basis and if further developments result in a loss contingency related to this claim being both probable and estimable, the Company will establish an accrued liability with respect to such loss contingency and record it accordingly.
The Company has various other lawsuits pending at December 31, 20112012, arising in the normal course of business. While some matters pending against the Company specify damages claimed by plaintiffs, others do not seek a specified amount of damages or are at very early stages of the legal process. The Company records a loss accrual for all legal matters for which it deems a loss is probable and can be reasonably estimated. InSome legal matters, which are at early stages in the opinion of management, after consultation with legal counsel, none of these suits willprocess, have not yet progressed to the point where a significant effect on the financial conditionloss amount can be determined to be probable and results of operations of the Company and the range of possible additional loss in excess of amounts accrued is not material.estimable.
19. Related Parties
The Company’s Chief Executive Officer, its Vice Chairman, and its Chief Administrative OfficerPresident are directors of Tower Properties Company (Tower) and, together with members of their immediate families, beneficially own approximately 74% of the outstanding stock of Tower. At December 31, 20112012, Tower owned 201,962212,060 shares of Company stock. Tower is primarily engaged in the business of owning, developing, leasing and managing real property.
Payments from the Company and its affiliates to Tower are summarized below. TheDuring these periods, the Company leasesleased several surface parking lots owned by Tower for employee use. Other payments, with the exception of dividend payments, relate to property management services, including construction oversight, on four Company-owned office buildings and related parking garages in downtown Kansas City.
| | | (In thousands) | 2011 | 2010 | 2009 | 2012 | 2011 | 2010 |
| Rent on leased parking lots | $ | 353 |
| $ | 353 |
| $ | 353 |
| $ | 294 |
| $ | 353 |
| $ | 353 |
|
| Leasing agent fees | 57 |
| 3 |
| 14 |
| 63 |
| 57 |
| 3 |
|
| Operation of parking garages | 83 |
| 107 |
| 115 |
| 75 |
| 83 |
| 107 |
|
| Building management fees | 1,615 |
| 1,769 |
| 1,704 |
| 1,774 |
| 1,615 |
| 1,769 |
|
| Property construction management fees | 118 |
| 24 |
| 61 |
| 231 |
| 118 |
| 24 |
|
| Dividends paid on Company stock held by Tower | 177 |
| 172 |
| 167 |
| 489 |
| 177 |
| 172 |
|
| Total | $ | 2,403 |
| $ | 2,428 |
| $ | 2,414 |
| $ | 2,926 |
| $ | 2,403 |
| $ | 2,428 |
|
Tower has a $13.5 million line of credit with the Bank which is subject to normal credit terms and has a variable interest rate. During 2011, Tower borrowed and repaid $4.5 millionThe maximum borrowings outstanding under this line during 2012 was $5.0 millionand the balance outstanding at December 31,
2012 was $2.0 million. The maximum borrowings outstanding during 2011 was $3.0 million and the balance outstanding at December 31, 2011 was zero. Interest of $51 thousand and $22 thousand was paid $22 thousand in interest.during 2012 and 2011, respectively. No loans were outstanding during 2010 and 2009 under this line of credit. Letters of credit may be collateralized under this line of credit; however, there were no letters of credit outstanding during 2012, 2011 2010, or 2009,2010, and thus, no fees were received during these periods. From time to time, the Bank extends additional credit to Tower for construction and development projects. No construction loans were outstanding during 20112012, 20102011 and 20092010.
Tower leases office space in the Kansas City bank headquarters building owned by the Company. Rent paid to the Company totaled $66 thousand in 2012, $75 thousand in 2011, and $69 thousand in 2010 and $45 thousand in 2009, at $15.6715.08, $15.5015.67 and $15.2515.50 per square foot, respectively.
In the fourth quarter of 2012, the Company purchased various surface parking lots from Tower for $7.1 million. The lots are located in downtown Kansas City and to be used for employee parking.
Directors of the Company and their beneficial interests have deposit accounts with the Bank and may be provided with cash management and other banking services, including loans, in the ordinary course of business. Such loans were made on substantially the same terms, including interest rates and collateral, as those prevailing at the time for comparable transactions with other unrelated persons and did not involve more than the normal risk of collectability.
As discussed in Note 18 on Commitments, Contingencies, and Guarantees, the Company regularly purchases various state tax credits arising from third-party property redevelopment and resells the credits to third parties. During 2011, theThe Company sold state tax credits to the Company'sits Chief Executive Officer for the price of $465 thousandand$1.0 million in 2012 and 2011, respectively, for personal tax planning. During 2011, state tax credits were sold to his father, a former Chief Executive Officer, for $920 thousand. The terms of the Company, forsales and the price of $1.0 million and $920 thousand, respectively, for their personal tax planning. The amounts paid were the same as the terms and amounts paid for similar tax credits by persons not related to the Company.
In December 2008 and at various times during 2009, the Company purchased, through market transactions, corporate bonds issued by Enterprise Rent-A-Car Company, whose Chairman and CEO is a director of the Company. The bonds, totaling $12.9 million at book value, were sold in the public market during December 2009.
20. Parent Company Condensed Financial Statements
Following are the condensed financial statements of Commerce Bancshares, Inc. (Parent only) for the periods indicated:
| | | Condensed Balance Sheets | | |
| | December 31 | December 31 |
| (In thousands) | 2011 | 2010 | 2012 | 2011 |
| Assets | | |
| Investment in consolidated subsidiaries: | | |
| Banks | $ | 1,923,498 |
| $ | 1,797,853 |
| $ | 1,983,751 |
| $ | 1,923,498 |
|
| Non-banks | 54,477 |
| 45,143 |
| 61,217 |
| 54,477 |
|
| Cash | 61 |
| 55 |
| 58 |
| 61 |
|
| Securities purchased under agreements to resell | 118,075 |
| 77,700 |
| 67,675 |
| 118,075 |
|
| Investment securities: | | |
| Available for sale | 74,635 |
| 101,534 |
| 65,189 |
| 74,635 |
|
| Non-marketable | 2,677 |
| 3,664 |
| 4,272 |
| 2,677 |
|
| Advances to subsidiaries, net of borrowings | 9,640 |
| 11,298 |
| 5,504 |
| 9,640 |
|
| Income tax benefits | 2,593 |
| — |
| 10,236 |
| 2,593 |
|
| Other assets | 12,381 |
| 11,966 |
| 13,051 |
| 12,381 |
|
| Total assets | $ | 2,198,037 |
| $ | 2,049,213 |
| $ | 2,210,953 |
| $ | 2,198,037 |
|
| Liabilities and stockholders’ equity | | |
| Indemnification obligation | $ | — |
| $ | 4,432 |
| |
| Pension obligation | 12,958 |
| 5,033 |
| $ | 23,313 |
| $ | 12,958 |
|
| Income taxes payable | — |
| 2,456 |
| |
| Other liabilities | 19,032 |
| 15,305 |
| 20,513 |
| 19,032 |
|
| Total liabilities | 31,990 |
| 27,226 |
| 43,826 |
| 31,990 |
|
| Stockholders’ equity | 2,166,047 |
| 2,021,987 |
| 2,167,127 |
| 2,166,047 |
|
| Total liabilities and stockholders’ equity | $ | 2,198,037 |
| $ | 2,049,213 |
| $ | 2,210,953 |
| $ | 2,198,037 |
|
| | | Condensed Statements of Income | | |
| | For the Years Ended December 31 | For the Years Ended December 31 |
| (In thousands) | 2011 | 2010 | 2009 | 2012 | 2011 | 2010 |
| Income | | |
| Dividends received from consolidated subsidiaries: | | |
| Banks | $ | 180,001 |
| $ | 105,000 |
| $ | 45,001 |
| $ | 235,000 |
| $ | 180,001 |
| $ | 105,000 |
|
| Non-banks | 115 |
| 105 |
| 129 |
| — |
| 115 |
| 105 |
|
| Earnings of consolidated subsidiaries, net of dividends | 74,260 |
| 110,809 |
| 128,536 |
| 34,467 |
| 74,260 |
| 110,809 |
|
| Interest and dividends on investment securities | 7,997 |
| 12,842 |
| 1,406 |
| 5,074 |
| 7,997 |
| 12,842 |
|
| Management fees charged subsidiaries | 19,318 |
| 22,621 |
| 46,613 |
| 23,658 |
| 19,318 |
| 22,621 |
|
| Investment securities gains (losses) | — |
| (56 | ) | 1,804 |
| 346 |
| — |
| (56 | ) |
| Other | 1,560 |
| 2,092 |
| 2,538 |
| 2,067 |
| 1,560 |
| 2,092 |
|
| Total income | 283,251 |
| 253,413 |
| 226,027 |
| 300,612 |
| 283,251 |
| 253,413 |
|
| Expense | | |
| Salaries and employee benefits | 21,572 |
| 21,293 |
| 39,528 |
| 24,188 |
| 21,572 |
| 21,293 |
|
| Professional fees | 1,826 |
| 2,322 |
| 3,080 |
| 1,950 |
| 1,826 |
| 2,322 |
|
| Data processing fees paid to affiliates | 3,351 |
| 3,180 |
| 11,337 |
| 2,664 |
| 3,351 |
| 3,180 |
|
| Indemnification obligation | (4,432 | ) | (4,405 | ) | (2,495 | ) | — |
| (4,432 | ) | (4,405 | ) |
| Other | 5,975 |
| 7,451 |
| 10,941 |
| 7,582 |
| 5,975 |
| 7,451 |
|
| Total expense | 28,292 |
| 29,841 |
| 62,391 |
| 36,384 |
| 28,292 |
| 29,841 |
|
| Income tax expense (benefit) | (1,384 | ) | 1,862 |
| (5,439 | ) | (5,101 | ) | (1,384 | ) | 1,862 |
|
| Net income | $ | 256,343 |
| $ | 221,710 |
| $ | 169,075 |
| $ | 269,329 |
| $ | 256,343 |
| $ | 221,710 |
|
| | | Condensed Statements of Cash Flows | | |
| | For the Years Ended December 31 | For the Years Ended December 31 |
(In thousands) | 2011 | 2010 | 2009 | 2012 | 2011 | 2010 |
| Operating Activities | | |
| Net income | $ | 256,343 |
| $ | 221,710 |
| $ | 169,075 |
| $ | 269,329 |
| $ | 256,343 |
| $ | 221,710 |
|
| Adjustments to reconcile net income to net cash provided by operating activities: | | |
| Earnings of consolidated subsidiaries, net of dividends | (74,260 | ) | (110,809 | ) | (128,536 | ) | (34,467 | ) | (74,260 | ) | (110,809 | ) |
| Other adjustments, net | (1,144 | ) | (4,787 | ) | (1,093 | ) | (7,078 | ) | (1,144 | ) | (4,787 | ) |
| Net cash provided by operating activities | 180,939 |
| 106,114 |
| 39,446 |
| 227,784 |
| 180,939 |
| 106,114 |
|
| Investing Activities | | |
| (Increase) decrease in securities purchased under agreements to resell | (40,375 | ) | (30,175 | ) | 18,900 |
| 50,400 |
| (40,375 | ) | (30,175 | ) |
| Decrease in investment in subsidiaries, net | 116 | 101 |
| 353 |
| 1,195 |
| 116 |
| 101 |
|
| Proceeds from sales of investment securities | — |
| 185 |
| 11,812 |
| 346 |
| — |
| 185 |
|
| Proceeds from maturities/pay downs of investment securities | 22,233 |
| 26,487 |
| 105,944 |
| 17,063 |
| 22,233 |
| 26,487 |
|
| Purchases of investment securities | — |
| (110 | ) | (195,935 | ) | (2,000 | ) | — |
| (110 | ) |
| (Increase) decrease in advances to subsidiaries, net | 1,658 |
| 2,499 |
| (9,080 | ) | |
| Decrease in advances to subsidiaries, net | | 4,136 |
| 1,658 |
| 2,499 |
|
| Net (purchases) sales of equipment | (685 | ) | 1,629 |
| (409 | ) | (92 | ) | (685 | ) | 1,629 |
|
| Net cash provided by (used in) investing activities | (17,053 | ) | 616 |
| (68,415 | ) | 71,048 |
| (17,053 | ) | 616 |
|
| Financing Activities | | |
| Purchases of treasury stock | (101,154 | ) | (40,984 | ) | (528 | ) | (104,909 | ) | (101,154 | ) | (40,984 | ) |
| Issuance under open market stock sale program, stock purchase and equity compensation plans | 15,349 |
| 11,310 |
| 103,641 |
| |
| Issuance under stock purchase and equity compensation plans | | 15,588 |
| 15,349 |
| 11,310 |
|
| Net tax benefit related to equity compensation plans | 1,065 |
| 1,178 |
| 557 |
| 2,094 |
| 1,065 |
| 1,178 |
|
| Cash dividends paid on common stock | (79,140 | ) | (78,231 | ) | (74,720 | ) | (211,608 | ) | (79,140 | ) | (78,231 | ) |
| Net cash provided by (used in) financing activities | (163,880 | ) | (106,727 | ) | 28,950 |
| |
| Net cash used in financing activities | | (298,835 | ) | (163,880 | ) | (106,727 | ) |
| Increase (decrease) in cash | 6 |
| 3 |
| (19 | ) | (3 | ) | 6 |
| 3 |
|
| Cash at beginning of year | 55 |
| 52 |
| 71 |
| 61 |
| 55 |
| 52 |
|
| Cash at end of year | $ | 61 |
| $ | 55 |
| $ | 52 |
| $ | 58 |
| $ | 61 |
| $ | 55 |
|
| Income tax payments (receipts), net | $ | (2,700 | ) | $ | 2,000 |
| $ | (4,900 | ) | $ | 523 |
| $ | (2,700 | ) | $ | 2,000 |
|
Dividends paid by the Parent to its shareholders were substantially provided from Bank dividends. The Bank may distribute dividends without prior regulatory approval, provided that the dividends do not exceed the sum of net income for the current year and retained net income for the preceding two years, subject to maintenance of minimum capital requirements. The Parent charges fees to its subsidiaries for management services provided, which are allocated to the subsidiaries based primarily on total average assets. The Parent makes advances to non-banking subsidiaries and its subsidiary bank holding company. Advances are made to the Parent by its subsidiary bank holding company for investment in temporary liquid securities. Interest on such advances is based on market rates.
For the past several years, the Parent has maintained a $20.0 million line of credit for general corporate purposes with the Bank. The line of credit is secured by marketable investment securities. The Parent has not borrowed under this line during the past three years.
In January 2010, several administrative functions formerly reported by the Parent were transferred to the Bank in order to present a more accurate organizational structure within the Company. Certain employee payrolls and fixed assets were transferred, and various expense allocations relating to these functions, formerly reported by the Parent, were lower in 2010 and 2011.
The Parent carries the Visa indemnification obligation, discussed in Note 18, which has been adjusted periodically over the past few years as covered suits are settled or additional funding is made to Visa’s litigation escrow account. The indemnification obligation was reduced to zero during the past year, resulting from several additional contributions by Visa to its escrow account during 2011.
At December 31, 20112012, the fair value of available for sale investment securities held by the Parent consisted of investments of $26.730.7 million in marketable common stock and $47.934.5 million in non-agency mortgage-backed securities. The Parent’s unrealized net gain in fair value on its investments was $25.430.7 million at December 31, 20112012. The corresponding net of tax unrealized gain included in stockholders’ equity was $15.819.1 million. Also included in stockholders’ equity was an unrealized net of tax gain in fair value of investment securities held by subsidiaries, which amounted to $116.0144.4 million at December 31, 20112012.
The Parent plans to fund an additional $13.5 million relating to private equity investments over the next several years. The investments are made directly by the Parent and through non-bank subsidiaries.109
| |
| Item 9. | CHANGES IN AND DISAGREEMENTS WITH ACCOUNTANTS ON ACCOUNTING AND FINANCIAL DISCLOSURE |
There were no changes in or disagreements with accountants on accounting and financial disclosure.
| |
| Item 9a. | CONTROLS AND PROCEDURES |
Conclusion Regarding the Effectiveness of Disclosure Controls and Procedures
Under the supervision and with the participation of our management, including our principal executive officer and principal financial officer, we conducted an evaluation of our disclosure controls and procedures, as such term is defined in Rules 13a-15(e) and 15d-15(e) under the Securities Exchange Act of 1934. Based on this evaluation, our principal executive officer and our principal financial officer concluded that our disclosure controls and procedures were effective as of the end of the period covered by this annual report.
Management’s Report on Internal Control Over Financial Reporting
Our management is responsible for establishing and maintaining adequate internal control over financial reporting, as such term is defined in Exchange Act Rules 13a-15(f) and 15d-15(f). Under the supervision and with the participation of our management, including our principal executive officer and principal financial officer, we conducted an evaluation of the effectiveness of our internal control over financial reporting based on the framework in Internal Control — Integrated Framework issued by the Committee of Sponsoring Organizations of the Treadway Commission. Based on our evaluation under the framework in Internal Control — Integrated Framework, our management concluded that our internal control over financial reporting was effective as of December 31, 2011.2012.
The Company’s internal control over financial reporting as of December 31, 20112012 has been audited by KPMG LLP, an independent registered public accounting firm, as stated in their report which follows.
Changes in Internal Control Over Financial Reporting
No change in the Company’s internal control over financial reporting occurred that has materially affected, or is reasonably likely to materially affect, such controls during the last quarter of the period covered by this report.
REPORT OF INDEPENDENT REGISTERED PUBLIC ACCOUNTING FIRM
The Board of Directors and ShareholdersStockholders
Commerce Bancshares, Inc.:
We have audited Commerce Bancshares, Inc. and subsidiaries (the Company) internal control over financial reporting as of December 31, 2011,2012, based on criteria established in Internal Control ‑ Integrated Framework issued by the Committee of Sponsoring Organizations of the Treadway Commission (COSO). The Company's management is responsible for maintaining effective internal control over financial reporting and for its assessment of the effectiveness of internal control over financial reporting, included in the accompanying Management’s Report on Internal Control Over Financial Reporting. Our responsibility is to express an opinion on the Company’s internal control over financial reporting based on our audit.
We conducted our audit in accordance with the standards of the Public Company Accounting Oversight Board (United States). Those standards require that we plan and perform the audit to obtain reasonable assurance about whether effective internal control over financial reporting was maintained in all material respects. Our audit included obtaining an understanding of internal control over financial reporting, assessing the risk that a material weakness exists, and testing and evaluating the design and operating effectiveness of internal control based on the assessed risk. Our audit also included performing such other procedures as we considered necessary in the circumstances. We believe that our audit provides a reasonable basis for our opinion.
A company's internal control over financial reporting is a process designed to provide reasonable assurance regarding the reliability of financial reporting and the preparation of financial statements for external purposes in accordance with generally accepted accounting principles. A company's internal control over financial reporting includes those policies and procedures that (1) pertain to the maintenance of records that, in reasonable detail, accurately and fairly reflect the transactions and dispositions of the assets of the company; (2) provide reasonable assurance that transactions are recorded as necessary to permit preparation of financial statements in accordance with generally accepted accounting principles, and that receipts and expenditures of the company are being made only in accordance with authorizations of management and directors of the company; and (3) provide reasonable assurance regarding prevention or timely detection of unauthorized acquisition, use, or disposition of the company’s assets that could have a material effect on the financial statements.
Because of its inherent limitations, internal control over financial reporting may not prevent or detect misstatements. Also, projections of any evaluation of effectiveness to future periods are subject to the risk that controls may become inadequate because of changes in conditions, or that the degree of compliance with the policies or procedures may deteriorate.
In our opinion, Commerce Bancshares, Inc. and subsidiaries maintained, in all material respects, effective internal control over financial reporting as of December 31, 2011,2012, based on COSO.criteria established in Internal Control ‑ Integrated Framework issued by the Committee of Sponsoring Organizations of the Treadway Commission.
We also have audited, in accordance with the standards of the Public Company Accounting Oversight Board (United States), the consolidated balance sheets of the CompanyCommerce Bancshares, Inc. and subsidiaries as of December 31, 20112012 and 2010,2011, and the related consolidated statements of income, comprehensive income, changes in equity, and cash flows for each of the years in the three-year period ended December 31, 2011,2012, and our report dated February 22, 20122013 expressed an unqualified opinion on those consolidated financial statements.
Kansas City, Missouri
February 22, 20122013
| |
| Item 9b. | OTHER INFORMATION |
None
PART III
| |
| Item 10. | DIRECTORS, EXECUTIVE OFFICERS AND CORPORATE GOVERNANCE |
The information required by Items 401, 405 and 407(c)(3), (d)(4) and (d)(5) of Regulation S-K regarding executive officers is included at the end of Part I of this Form 10-K under the caption “Executive Officers of the Registrant” and under the captions “Election“Proposal One - Election of the 20152016 Class of Directors”, “Section 16(a) Beneficial Ownership Reporting Compliance”, “Audit Committee Report”, “Committees of the Board - Audit Committee and Committee on Governance/Directors” in the definitive proxy statement, which is incorporated herein by reference.
The Company’s financial officer code of ethics for the chief executive officer and senior financial officers of the Company, including the chief financial officer, principal accounting officer or controller, or persons performing similar functions, is available at www.commercebank.com. Amendments to, and waivers of, the code of ethics are posted on this Web site.
| |
| Item 11. | EXECUTIVE COMPENSATION |
The information required by Items 402 and 407(e)(4) and (e)(5) of Regulation S-K regarding executive compensation is included under the captions “Compensation Discussion and Analysis”, “Executive Compensation”, “Director Compensation”, “Compensation and Human Resources Committee Report”, and “Compensation and Human Resources Committee Interlocks and Insider Participation” in the definitive proxy statement, which is incorporated herein by reference.
| |
| Item 12. | SECURITY OWNERSHIP OF CERTAIN BENEFICIAL OWNERS AND MANAGEMENT AND RELATED STOCKHOLDER MATTERS |
The information required by Items 201(d) and 403 of Regulation S-K is coveredincluded under the captions “Equity Compensation Plan Information” and “Security Ownership of Certain Beneficial Owners and Management” in the definitive proxy statement, which is incorporated herein by reference.
| |
| Item 13. | CERTAIN RELATIONSHIPS AND RELATED TRANSACTIONS, AND DIRECTOR INDEPENDENCE |
The information required by Items 404 and 407(a) of Regulation S-K is covered under the captions “Election“Proposal One - Election of the 20152016 Class of Directors” and “Corporate Governance” in the definitive proxy statement, which is incorporated herein by reference.
| |
| Item 14. | PRINCIPAL ACCOUNTING FEES AND SERVICES |
The information required by Item 9(c)9(e) of Schedule 14A is included under the captions “Pre-approval of Services by the External Auditor” and “Fees Paid to KPMG LLP” in the definitive proxy statement, which is incorporated herein by reference.
PART IV
| |
| Item 15. | EXHIBITS AND FINANCIAL STATEMENT SCHEDULES |
|
| | | | |
| | (a) The following documents are filed as a part of this report: |
| | | | | Page |
| | | (1) | Financial Statements: | |
| | | | | |
| | | | | |
| | | | |
| | | | | |
| | | | | |
| | | | | |
| | | | Summary of Quarterly Statements of Income | 5654 |
| | | (2) | Financial Statement Schedules: | |
| | | | All schedules are omitted as such information is inapplicable or is included in the financial statements. | |
| | | | | |
| | (b) The exhibits filed as part of this report and exhibits incorporated herein by reference to other documents are listed in the Index to Exhibits (pages E-1 through E-2). |
SIGNATURES
Pursuant to the requirements of Section 13 or 15(d) of the Securities Exchange Act of 1934, the Registrant has duly caused this report to be signed on its behalf by the undersigned thereunto duly authorized this 22nd day of February 20122013.
|
| | |
| | COMMERCE BANCSHARES, INC. |
| | | |
| | By: | /s/ JAMES L. SWARTS |
| | | James L. Swarts |
| | | Vice President and Secretary |
Pursuant to the requirements of the Securities Exchange Act of 1934, this report has been signed below by the following persons on behalf of the Registrant and in the capacities indicated on the 22nd day of February 20122013.
|
| | |
| | By: | /s/ CHARLES G. KIM |
| | | Charles G. Kim |
| | | Chief Financial Officer |
| | | |
| | By: | /s/ JEFFERY D. ABERDEEN |
| | | Jeffery D. Aberdeen |
| | | Controller |
| | | (Chief Accounting Officer) |
|
| | |
| | |
| David W. Kemper | | |
| (Chief Executive Officer) | |
| Terry D. Bassham | |
| John R. Capps | |
| Earl H. Devanny, III | |
W. Thomas Grant, II | |
| James B. Hebenstreit | |
Jonathan M. Kemper | A majority of the Board of Directors* |
| Terry O. Meek | |
| Benjamin F. Rassieur, III | |
| Todd R. Schnuck | |
Dan C. Simons | |
| Andrew C. Taylor | |
| Kimberly G. Walker | |
| |
____________
| |
| * | David W. Kemper, Director and Chief Executive Officer, and the other Directors of Registrant listed, executed a power of attorney authorizing James L. Swarts, their attorney-in-fact, to sign this report on their behalf. |
|
| | |
| | By: | /s/ JAMES L. SWARTS |
| | | James L. Swarts |
| | | Attorney-in-Fact |
INDEX TO EXHIBITS
|
| |
| 3 —Articles of Incorporation and By-Laws: |
| | |
| | (a) Restated Articles of Incorporation, as amended, were filed in quarterly report on Form 10-Q (Commission file number 0-2989) dated August 10, 1999, and the same are hereby incorporated by reference. |
| | |
| | (b)(1) Restated By-Laws, as amended, were filed in current report on Form 8-K dated February 3, 2011,14, 2013, and the same are hereby incorporated by reference. |
| |
| (b)(2) An amendment to the Restated By-Laws was filed in current report on Form 8-K dated February 16, 2012, and the same is hereby incorporated by reference. |
| | |
| 4 — Instruments defining the rights of security holders, including indentures: |
| | |
| | (a) Pursuant to paragraph (b)(4)(iii) of Item 601 Regulation S-K, Registrant will furnish to the Commission upon request copies of long-term debt instruments. |
| | |
| 10 — Material Contracts (Each of the following is a management contract or compensatory plan arrangement): |
| | |
| | (a) Commerce Bancshares, Inc. Executive Incentive Compensation Plan amended and restated as of January 1, 2009 was filed in quarterly report on Form 10-Q dated August 7, 2009, and the same is hereby incorporated by reference. |
| | |
| | (b)(1) Commerce Bancshares, Inc. 1987 Non-Qualified Stock Option Plan amended and restated as of July 24, 2009 was filed in quarterly report on Form 10-Q dated August 7, 2009, and the same is hereby incorporated by reference. |
| | |
| | (b)(2) An amendment to the Commerce Bancshares, Inc. 1987 Non-Qualified Stock Option Plan was filed in current report on Form 8-K dated February 16, 2012, and the same is hereby incorporated by reference. |
| | |
| | (c) Commerce Bancshares, Inc. Stock Purchase Plan for Non-Employee Directors amended and restated as of October 4, 1996 was filed in quarterly report on Form 10-Q (Commission file number 0-2989) dated November 8, 1996, and the same is hereby incorporated by reference. |
| | |
| | (d)(1) Commerce Bancshares, Inc. 1996 Incentive Stock Option Plan amended and restated as of April 2001 was filed in quarterly report on Form 10-Q (Commission file number 0-2989) dated May 8, 2001, and the same is hereby incorporated by reference. |
| | |
| | (d)(2) An amendment to the Commerce Bancshares, Inc. 1996 Incentive Stock Option Plan was filed in current report on Form 8-K dated February 16, 2012, and the same is hereby incorporated by reference. |
| | |
| | (e) Commerce Executive Retirement Plan amended and restated as of January 28, 2011 was filed in annual report on Form 10-K dated February 25, 2011, and the same is hereby incorporated by reference. |
| | |
| | (f) Commerce Bancshares, Inc. Restricted Stock Plan amended and restated as of July 24, 2009 was filed in quarterly report on Form 10-Q dated August 7, 2009, and the same is hereby incorporated by reference. |
| | |
| | (g) Form of Severance Agreement between Commerce Bancshares, Inc. and certain of its executive officers entered into as of October 4, 1996 was filed in quarterly report on Form 10-Q (Commission file number 0-2989) dated November 8, 1996, and the same is hereby incorporated by reference. |
| | |
| | (h) Trust Agreement for the Commerce Bancshares, Inc. Executive Incentive Compensation Plan amended and restated as of January 1, 2001 was filed in quarterly report on Form 10-Q (Commission file number 0-2989) dated May 8, 2001, and the same is hereby incorporated by reference. |
| | |
| | (i) Commerce Bancshares, Inc. 20122013 Compensatory ArrangementArrangements with CEO and Named Executive Officers waswere filed in two current reportreports on Form 8-K dated February 16, 2012,5, 2013 and February 14, 2013, respectively, and the same isare hereby incorporated by reference. |
| | |
| | (j)(1) Commerce Bancshares, Inc. 2005 Equity Incentive Plan amended and restated as of July 24, 2009 was filed in quarterly report on Form 10-Q dated August 7, 2009, and the same is hereby incorporated by reference. |
| | |
| | (j)(2) An amendment to the Commerce Bancshares, Inc. 2005 Equity Incentive Plan was filed in current report on Form 8-K dated February 16, 2012, and the same is hereby incorporated by reference. |
| | |
| | (k) Commerce Bancshares, Inc. Notice of Grant of Stock Options and Option Agreement was filed in quarterly report on Form 10-Q (Commission file number 0-2989) dated August 5, 2005, and the same is hereby incorporated by reference. |
| | |
| | (l) Commerce Bancshares, Inc. Restricted Stock Award Agreement, pursuant to the Restricted Stock Plan, was filed in quarterly report on Form 10-Q (Commission file number 0-2989) dated August 5, 2005, and the same is hereby incorporated by reference. |
| | |
|
| |
| | (m) Commerce Bancshares, Inc. Stock Appreciation Rights Agreement and Commerce Bancshares, Inc. Restricted Stock Award Agreement, pursuant to the 2005 Equity Incentive Plan, were filed in current report on Form 8-K (Commission file number 0-2989) dated February 23, 2006, and the same are hereby incorporated by reference. |
| | |
| 21 — Subsidiaries of the Registrant |
| |
| 23 — Consent of Independent Registered Public Accounting Firm |
| |
| 24 — Power of Attorney |
| |
| 31.1 — Certification of CEO pursuant to Section 302 of the Sarbanes-Oxley Act of 2002 |
| |
| 31.2 — Certification of CFO pursuant to Section 302 of the Sarbanes-Oxley Act of 2002 |
| |
| 32 — Certifications of CEO and CFO pursuant to 18 U.S.C. Section 1350, as adopted pursuant to Section 906 of the Sarbanes-Oxley Act of 2002 |
| |
101 — Interactive data files pursuant to Rule 405 of Regulation S-T: (i) the Consolidated Balance Sheets, (ii) the Consolidated Statements of Income, (iii) the Consolidated Statements of Comprehensive Income, (iv) the Consolidated Statements of Changes in Equity, (iv)(v) the Consolidated Statements of Cash Flows and (v)(vi) the Notes to Consolidated Financial Statements, tagged as blocks of text and in detail*detail |
| |
*As provided in Rule 406T of Regulation S-T, this information is furnished and not filed for purposes of Sections 11 and 12 of the Securities Act of 1933, as amended, and Section 18 of the Securities Exchange Act of 1934, as amended. |