UNITED STATES
SECURITIES AND EXCHANGE COMMISSION
Washington, D.C. 20549
FORM 10-K
| | | | | |
| (Mark One) |
| ☒ | ANNUAL REPORT PURSUANT TO SECTION 13 OR 15(d) OF THE SECURITIES EXCHANGE ACT OF 1934 |
For the fiscal year ended December 31, 20212023
| | | | | |
| OR |
| ☐ | TRANSITION REPORT PURSUANT TO SECTION 13 OR 15(d) OF THE SECURITIES EXCHANGE ACT OF 1934 |
| For the transition period from ______ to ______ . |
Commission File Number: 1-14829
Molson Coors Beverage Company
(Exact name of registrant as specified in its charter)
Delaware
(State or other jurisdiction of incorporation or organization)
P.O. Box 4030, NH353,BC555, Golden, Colorado, USA
111 Boulevard Robert-Bourassa, 9th Floor, Montréal, Québec, Canada
(Address of principal executive offices)
84-0178360
(I.R.S. Employer Identification No.)
80401
H3C 2M1
(Zip Code)
303-279-6565 (Colorado)
514-521-1786 (Québec)
(Registrant's telephone number, including area code)
Securities registered pursuant to Section 12(b) of the Act:
| | | | | | | | | | | | | | |
| Title of each class | | Trading symbols | | Name of each exchange on which registered |
| Class A Common Stock, $0.01 par value | | TAP.A | | New York Stock Exchange |
| Class B Common Stock, $0.01 par value | | TAP | | New York Stock Exchange |
| 1.25% Senior Notes due 2024 | | TAP 24 | | New York Stock Exchange |
Securities registered pursuant to Section 12(g) of the Act: NoneIndicate by check mark if the registrant is a well-known seasoned issuer, as defined in Rule 405 of the Securities Act. Yes ☒ No ☐
Indicate by check mark if the registrant is not required to file reports pursuant to Section 13 or Section 15(d) of the Act. Yes ☐ No ☒
Indicate by check mark whether the registrant (1) has filed all reports required to be filed by Section 13 or 15(d) of the Securities Exchange Act of 1934 during the preceding 12 months (or for such shorter period that the registrant was required to file such reports), and (2) has been subject to such filing requirements for the past 90 days. Yes ☒ No ☐
Indicate by check mark whether the registrant has submitted electronically every Interactive Data File required to be submitted pursuant to Rule 405 of Regulation S-T (§232.405 of this chapter) during the preceding 12 months (or for such shorter period that the registrant was required to submit such files). Yes ☒ No ☐
Indicate by check mark whether the registrant is a large accelerated filer, an accelerated filer, a non-accelerated filer, a smaller reporting company, or an emerging growth company. See the definitions of "large accelerated filer," "accelerated filer," "smaller reporting company" and "emerging growth company" in Rule 12b-2 of the Exchange Act.
Large accelerated filer ☒ Accelerated filer ☐ Non-accelerated filer ☐ Smaller reporting company ☐ Emerging growth company ☐
If an emerging growth company, indicate by check mark if the registrant has elected not to use the extended transition period for complying with any new or revised financial accounting standards provided pursuant to Section 13(a) of the Exchange Act. o
Indicate by check mark whether the registrant has filed a report on and attestation to its management's assessment of the effectiveness of its internal control over financial reporting under Section 404(b) of the Sarbanes-Oxley Act (15 U.S.C. 7262(b)) by the registered public accounting firm that prepared or issued its audit report. ☒
If securities are registered pursuant to Section 12(b) of the Act, indicate by check mark whether the financial statements of the registrant included in the filing reflect the correction of an error to previously issued financial statements. ☐
Indicate by check mark whether any of those error corrections are restatements that required a recovery analysis of incentive-based compensation received by any of the registrant's executive officers during the relevant recovery period pursuant to §240.10D-1(b). ☐
Indicate by check mark whether the registrant is a shell company (as defined in Rule 12b-2 of the Act). YESYes ☐ NONo ☒
The aggregate market value of the registrant's voting and non-voting common stock held by non-affiliates of the registrant at the close of business on the last trading day of the registrant's most recently completed second fiscal quarter, June 30, 2021,2023, was approximately $9.8$12.0 billion based upon the last sales price reported for such date on the New York Stock Exchange and the Toronto Stock Exchange. For purposes of this disclosure, shares of common and exchangeable stock held by officers and directors of the registrant (and their respective affiliates) as of June 30, 2021,2023, are excluded in that such persons may be deemed to be affiliates. This determination is not necessarily conclusive of affiliate status for other purposes.
The number of shares outstanding of each of the registrant's classes of common stock, as of February 16, 2022.13, 2024.
Class A Common Stock—2,562,5062,563,034 shares
Class B Common Stock—200,598,966198,001,985 shares
Exchangeable shares:
As of February 16, 2022,13, 2024, the following number of exchangeable shares was outstanding for Molson Coors Canada, Inc.:
Class A Exchangeable Shares—2,717,3672,678,963 shares
Class B Exchangeable Shares—11,104,5659,362,866 shares
The Class A exchangeable shares and Class B exchangeable shares are shares of the share capital in Molson Coors Canada Inc., a wholly-owned subsidiary of the registrant. They are publicly traded on the Toronto Stock Exchange under the symbols TPX.A and TPX.B, respectively. These shares are intended to provide substantially the same economic and voting rights as the corresponding class of Molson Coors common stock in which they may be exchanged. In addition to the registered Class A common stock and the Class B common stock, the registrant has also issued and outstanding one share each of a Special Class A voting stock and Special Class B voting stock. The Special Class A voting stock and the Special Class B voting stock provide the mechanism for holders of Class A exchangeable shares and Class B exchangeable shares to be provided instructions to vote with the holders of the Class A common stock and the Class B common stock, respectively. The holders of the Special Class A voting stock and Special Class B voting stock are entitled to one vote for each outstanding Class A exchangeable share and Class B exchangeable share, respectively, excluding shares held by the registrant or its subsidiaries, and generally vote together with the Class A common stock and Class B common stock, respectively, on all matters on which the Class A common stock and Class B common stock are entitled to vote. The Special Class A voting stock and Special Class B voting stock are subject to a voting trust arrangement. The trustee which holds the Special Class A voting stock and the Special Class B voting stock is required to cast a number of votes equal to the number of then-outstanding Class A exchangeable shares and Class B exchangeable shares, respectively, but will only cast a number of votes equal to the number of Class A exchangeable shares and Class B exchangeable shares as to which it has received voting instructions from the owners of record of those Class A exchangeable shares and Class B exchangeable shares, other than the registrant or its subsidiaries, respectively, on the record date, and will cast the votes in accordance with such instructions so received.
Documents Incorporated by Reference: Portions of the registrant's definitive proxy statement for the registrant's 20222024 annual meeting of stockholders, which will be filed no later than 120 days after the close of the registrant's fiscal year ended December 31, 2021,2023, are incorporated by reference under Part III of this Annual Report on Form 10-K.
MOLSON COORS BEVERAGE COMPANY AND SUBSIDIARIES
Glossary of Terms and Abbreviations
| | | | | |
AOCI | Accumulated other comprehensive income (loss) |
CAD | Canadian dollar |
| CAD Prime | The base interest rate utilized by Canadian commercial banks |
| COGS | Cost of goods sold |
| CZK | Czech Koruna |
| DBRS | AMorningstar DBRS, a global credit rating agency in Toronto |
| DSUs | Deferred stock units |
| EBITDA | Earnings before interest, tax, depreciation and amortization |
EPS | Earnings per share |
| EROA | Assumed long-term expected return on assets |
| EUR | Euro |
| EURIBOR | Euro Interbank Offered Rate |
FASB | Financial Accounting Standards Board |
GBP | British Pound |
HRKGBP Base Rate | Croatian Kuna |
JPY
| Japanese YenThe base interest rate set by the Bank of England |
LIBOR | London Interbank Offered Rate |
| MG&A | Marketing, general and administrative |
| Moody’s | Moody’s Investors Service Limited, a nationally recognized statistical rating organization designated by the SEC |
| NAV | Net asset value |
| OCI | Other comprehensive income (loss) |
OPEB | Other postretirement benefit plans |
| PBO | Projected benefit obligation |
| PSUs | Performance share units |
| RON | Romanian leu |
RSD | Serbian Dinar |
| RSUs | Restricted stock units |
| S&P 500 | Standard & Poor’s 500 Index® |
| SEC | U.S. Securities and Exchange Commission |
| SOFR | Secured Overnight Financing Rate |
| SONIA | Sterling Overnight Index Average |
| SKU | Stock-keeping unit |
| Standard & Poor’s | Standard and Poor’s Ratings Services, a nationally recognized statistical rating organization designated by the SEC |
STRs | Sales-to-retailers |
| STWs | Sales-to-wholesalers |
2017 Tax Act | U.S. Tax Cuts and Jobs Act |
| U.K. | United Kingdom |
U.S. | United States |
| U.S. GAAP | Accounting principles generally accepted in the U.S. |
| USD or $ | U.S. dollar |
| USD Prime | The base interest rate utilized by U.S. commercial banks |
| VIEs | Variable interest entities |
Cautionary Statement Pursuant to Safe Harbor Provisions of the Private Securities Litigation Reform Act of 1995
This Annual Report on Form 10-K ("this report") contains forward-looking statements within the meaning of Section 27A of the Securities Act of 1933, as amended, and Section 21E of the Securities Exchange Act of 1934, as amended, (the "Exchange Act"). From time to time, we may also provide oral or written forward-looking statements in other materials we release to the public. Such forward-looking statements are subject to the safe harbor created by the Private Securities Litigation Reform Act of 1995.
Statements that refer to projections of our future financial performance, our anticipated growth and trends in our businesses, and other characterizations of future events or circumstances are forward-looking statements, and include, but are not limited to, statements in Part II—Item 77. Management's Discussion and Analysis of Financial Condition and Results of Operations in this report, and under the heading "Items Affecting Reported Results", with respect to expectations regarding the impact of the coronavirus pandemic on our operations, liquidity, financial condition and financial results, expectations regarding future dividends,cost inflation, limited consumer disposable income, consumer preferences, overall volume and market share trends, consumer preferences, pricing trends, industry forces, cost reduction strategies, including our revitalization plan, expectationsshipment levels and profitability, the sufficiency of cost inflation,capital resources, anticipated results, expectations for funding future capital expenditures and operations, effective tax rate, debt service capabilities, timing and amounts of debt and leverage levels, shipment levelsPreserving the Planet and profitability, marketrelated environmental initiatives and expectations regarding future dividends and share and the sufficiency of capital resources.repurchases. In addition, statements that we make in this report that are not statements of historical fact may also be forward-looking statements. Words such as "expects," "intend," "goals," "plans," "believes," "continues," "may," "anticipate," "seek," "estimate," "outlook," "trends," "future benefits," "potential," "projects," "strategies,""strategies" and variations of such words and similar expressions are intended to identify forward-looking statements. Forward-looking statements are subject to risks and uncertainties that could cause actual results to be materially different from those indicated (both favorably and unfavorably). These risks and uncertainties include, but are not limited to, those described in Part I—Item 1A "Risk Factors"1A. Risk Factors, elsewhere throughout this report and those described from time to time in our past and future reports filed with the SEC. Caution should be taken not to place undue reliance on any such forward-looking statements. Forward-looking statements speak only as of the date when made and we undertake no obligation to update any forward-looking statement, whether as a result of new information, future events or otherwise, except as required by applicable law. Market and Industry Data
The market and industry data used in this report are based on independent industry publications, customers, trade or business organizations, reports by market research firms and other published statistical information from third parties (collectively, the “Third Party Information”), as well as information based on management’s good faith estimates, which we derive from our review of internal information and independent sources. Such Third Party Information generally states that the information contained therein or provided by such sources has been obtained from sources believed to be reliable.
Risks Factors Summary
OurThe following is a summary of the principal risks that could materially adversely affect our business, is subject to a numberfinancial condition or results of risks and uncertainties, including thoseoperations in future periods. The summary should be read together with the more detailed description of each risk factor described in Part I, Item 1A. Risk Factors of this report. These risks include, but are not limited to, the following:•deterioration of general economic, political, credit and/or capital market conditions, including those caused by the coronavirus pandemic, effortsongoing conflict between Russia and Ukraine (which we refer to mitigate or disrupt the pandemic and related weak, or weakening of, economicas "Russia-Ukraine conflict") or other negative conditions;
•the constant evolution of the global beer industry and the broader alcohol industry, and our position within the global beer industry and our markets in which we operate;
•competition in our markets, which could require us to reduce prices or increase capital and other expenditures or cause us to lose sales volume;geopolitical tensions;
•our dependence on the success of relatively few products in several mature markets specificglobal supply chain and significant exposure to the beer industry;
•our brand image, reputation, product quality and protection of intellectual property;
•changes in the social acceptability, perceptionscommodity and other input prices, and the political viewimpacts of the beverage categories in which we operate, including alcohol;supply chain constraints and inflationary pressures;
•weak, or weakening of, economic, social or other negative conditions in the markets in which we do business, including cost inflation and reductions in discretionary consumer spending;
•environmental, social and governance (“ESG”) issues, climate change and other weather events;
•inadequate supply or availability of quality water;
•loss, operational disruptions or closure of a major brewery or other key facility, including those of our suppliers, due to unforeseen or catastrophic events or otherwise;
•cybersecurity incidents impacting our information systems, and violations of data privacy laws and regulations;
•our reliance on brand image, reputation, product quality and protection of intellectual property;
•constant evolution of the global beer industry and the broader alcohol industry, and our position within the global beer industry and success of our products in our markets;
•competition in our markets;
•our ability to successfully and timely innovate beyond beer;
•changes in the social acceptability, perceptions and the political view of the beverage categories in which we operate, including alcohol;
•artificial intelligence and machine learning risks and challenges;
•labor strikes, work stoppages or other employee-related issues;
•environmental, social and governance ("ESG") issues and regulations;
•potential adverse impacts of climate change and other weather events;
•inadequate supply or availability of quality water;
•our dependence on key personnel;
•our reliance on third-party service providers and internal and outsourced systems for our information technology and certain other administrative functions;
•a breach of our information systems;
•investment performance of pension plan holdings and other factors impacting related pension plan costs;costs and contributions;
•our dependence on key personnel;
•our significant debt level and the agreements governing such debt, which subject us to financialrisks and operating covenants and restrictions;
•a deterioration in our credit rating;
•default by, or failure of, our significant exposure to changes in commodity prices;
•our dependence on the global supply chain and impacts of supply chain constraints and inflationary pressure;counterparty financial institutions;
•impairments of the carrying value of our goodwill and other intangible assets;
•the estimates and assumptions on which our financial projections are based which may prove to be inaccurate;
•our reliance on a small number of suppliers to obtain the packaginginput materials we need to operate our business;
•termination or changes of one or more manufacturer, distribution, or production agreements, or issues caused by our dependence on the parties to these agreements;
•unfavorable outcomes of legal or regulatory matters may adversely affect our business and financial condition and damage our reputation;matters;
•our operations in developing and emerging markets;
•changes to the regulation of the distribution systems for our products;
•our consolidated financial statements are subject to fluctuations in foreign exchange rates;
•changes in tax, environmental, trade or other regulations or failure to comply with existing licensing, trade and other regulations;
•our ability to effectively operaterisks associated with operating our joint ventures andventures;
•failure to successfully identify, complete or integrate attractive acquisitions and joint ventures into our existing operations;
•the dependence of our U.S. business on independent distributors to sell our products, with no assurance that these distributors will effectively sell our products;products, and distributor consolidation in the U.S.;
•the effect of government mandated changes to the retail distribution model resulting from new regulations on our Canada business;
•indemnities provided to the purchaser of our Americas business joint venturesprevious interest in the Canadian cannabis industry and the U.S. CBD beverage industry;Cervejarias Kaiser Brasil S.A. business in Brazil;
•ifeconomic trends and intense competition in European markets;
•the potential for Pentland and the Coors Trust do not agreeto disagree on a matter submitted to our stockholders or if athe super-majority of our boardthe Board of directors do not agreeDirectors to disagree on certain actions; and
•the interests of the controlling stockholders may differ from those of other stockholders.stockholders; and
•shareholder activism efforts or unsolicited offers from a third-party.
PART I
ITEM 1. BUSINESS
Business Overview
Unless otherwise noted in this report, any description of "we," "us" or "our" includes Molson Coors Beverage Company ("MCBC" or the "Company"), principally a holding company, and its operating and non-operating subsidiaries included within our reporting segments. As of December 31, 2021, we changed the names of our reporting segments to theits Americas and EMEA&APAC segments (formerly named the North America segment and Europe segment, respectively) to better reflect the geographic locations encompassed within the reportablereporting segments. This change to our segment names had no impact on the composition of our segments, our financial position, results of operations, cash flow or segment level results previously reported. Our Americas segment operates in the U.S., Canada and various countries in the Caribbean, Latin and South America and our EMEA&APAC segment operates in Bulgaria, Croatia, Czech Republic, Hungary, Montenegro, the Republic of Ireland, Romania, Serbia, the U.K., various other European countries, and certain countries within the Middle East, Africa and Asia Pacific. Certain figures and certain discussions of markets throughout this section focus on the largest regions of our Americas segment and excludes discussion of Latin America and the Caribbean due to data not being readily available. Certain figures and certain discussions of markets throughout this section focus on the largest region of our EMEA&APAC segment and excludes discussions of the Middle East, Africa and APAC due to data not being readily available.
Unless otherwise indicated, information in this report is presented in USD and comparisons are to comparable prior periods. Our primary operating currencies, other than the USD, include the CAD, the GBP and our Central European operating currencies such as the EUR, CZK, HRKRON and RSD.
Background
For more thanover two centuries, we have been brewing beverages that unite people to celebrate all life’s moments. From our core power brands Coors Light, Miller Lite, Coors Banquet, Molson Canadian, Carling and StaropramenOžujsko to our above premium brands including Coors Banquet,Madri, Staropramen, Blue Moon Belgian White Blue Moon LightSky, Vizzy, Coors Seltzer,and Leinenkugel’s Summer Shandy, Creemore Springs, Hop Valleyto our economy and value brands like Miller High Life and more,Keystone, we produce many beloved and iconic beer brands. While our Company’s history is rooted in beer, we offer a modern portfolio that expands beyond the beer aisle as well.well, including flavored beverages like Vizzy Hard Seltzer,spirits like Five Trail whiskey as well as non-alcoholic beverages. As a business, our ambition is to be the first choice for our people, our consumers and our customers, and our success depends on our ability to make our products available to meet a wide range of consumer segments and occasions.
Our primary founders, the Molson, Coors and Coors were founded in 1786 and 1873, respectively.Miller families date back to over two centuries ago. Our commitment to producing the highest quality beers is a key part of our heritage and remains so to this day. Our brands are designed to appeal to a wide range of consumer tastes, styles and price preferences. Coors Brewing Company was incorporated in June 1913 under the laws of the state of Colorado. In October 2003, Coors Brewing Company merged with and into Adolph Coors Company, a Delaware corporation. In February 2005, Adolph Coors Company merged with Molson Inc. ("the Merger"). Upon completion of the Merger, Adolph Coors Company changed its name to Molson Coors Brewing Company. On October 11,In 2008, Molson Coors Brewing Company and the former SABMiller plc formed the MillerCoors joint venture that combined their respective operations in the U.S. and Puerto Rico. In 2016, we entered into a purchase agreement with Anheuser-Busch InBev SA/NV to acquireacquired 100% of the outstanding equity and voting interests of MillerCoors, previously a joint venture between MCBC and the formerfrom SABMiller plc. In January 2020, we changed our name from Molson Coors Brewing Company to Molson Coors Beverage Company in connection with our expansion beyond the beer aisle.
Our revitalization plan,In October 2023, we announced on October 28, 2019,our Acceleration Plan, building off the successes achieved under the Revitalization Plan. The Acceleration Plan focuses on the execution of the following principal strategies: building on the strength ofconsistently grow our iconic core brands, growingpower brand net sales, aggressively premiumize our above premium portfolio, expandingscale and expand in beyond the beer, aisle and investinginvest in our capabilities and supportingsupport our people, communities and communities. Throughplanet.
Our Segments
Our reporting segments include the executionAmericas and EMEA&APAC. Our Americas segment operates in the U.S., Canada and various countries in the Caribbean, Latin and South America. Our EMEA&APAC segment operates in Bulgaria, Croatia, Czech Republic, Hungary, Montenegro, the Republic of Ireland, Romania, Serbia, the U.K., various other European countries and certain countries within the Middle East, Africa and Asia Pacific regions. A separate operating team manages each segment and each segment manufactures, markets, distributes and sells beer as well as offers a modern and growing portfolio that expands beyond the beer aisle. No single customer accounted for more than 10% of our consolidated net sales for the years ended December 31, 2023, 2022 or 2021.
Americas Segment
Our Americas segment consists of the revitalization plan, we broadened our range of productsproduction, importing, marketing, distribution and offerings within our portfolio to also include, among others, hard seltzers, ready to drink beverages and a variety of non-alcoholic beverage offerings. In order to support the overall premiumizationsales of our portfolio,brands as well as other owned and licensed brands in the U.S., Canada and various countries in the Caribbean, Latin and South America. We currently operate nine primary breweries, nine craft breweries and two container operations. We are North America's oldest beer company and the second largest brewer by volume in North America, representing approximately 23% of the total 2023 North America beer market, which is the largest region of our Americas segment. The Americas segment also includes partnership arrangements with Brewers' Retail Inc. ("BRI") for the distribution of beer in Ontario, Canada, and Brewers' Distributor Ltd. ("BDL") for the distribution of beer in the western provinces of Canada. In addition, we have strategically de-prioritizedan agreement with Heineken that grants us the right to produce, import, market, distribute and sell certain non-core economy SKUs.Heineken products in Canada. We also have authorizations from The revitalization plan is intendedCoca-Cola Company that grant us the right to drive sustainable net salesproduce, market, sell and earnings growth, despite potential volume declines asdistribute Topo Chico Hard Seltzer and Simply Spiked branded products in the portfolio mix shifts towards a higher composition of above premium products.U.S. and Canada, and Peace Hard Tea branded products in the U.S.
Coronavirus Global PandemicWe have agreements to brew, package and ship products for Pabst Brewing Company, LLC ("Pabst"), The Yuengling Company ("TYC") in the U.S. and an agreement with Labatt USA Operating Co, LLC to brew and package certain Labatt brands in Canada for export. The agreement with Pabst ends on December 31, 2024 and is expected to wind down through that time period.
Starting at the endEMEA&APAC Segment
The EMEA&APAC segment consists of the first quarterproduction, marketing and sales of 2020,our primary brands as well as other owned and licensed brands in Bulgaria, Croatia, Czech Republic, Hungary, Montenegro, the coronavirus pandemic hadRepublic of Ireland, Romania, Serbia, the U.K., various other European countries and certain countries within the Middle East, Africa and Asia Pacific regions. We currently operate eleven primary breweries, four craft breweries and one cidery. Our EMEA&APAC segment is Europe's second largest brewer by volume, on a material adverse effect oncombined basis, within the countries in which we operate, with an approximate aggregate 18% market share (excluding factored products which are beverage brands owned by other companies but sold and delivered to retail by us) in 2023. The majority of our operations, liquidity, financial condition and results of operations. In 2021, we saw improvementsEMEA&APAC segment sales are in the marketplace related toU.K., Croatia, Czech Republic and Romania with the coronavirus global pandemic as on-premise locations began to re-open around the world at varying degrees, despite setbacks in certain markets related to the outbreak of new variants. The extent to which our operations will continue to be impacted by the coronavirus pandemic will depend largely on future developments, which are highly uncertain and cannot be accurately predicted, including the level of governmental or societal orders or restrictions on public gatherings and on-premise venues, including any vaccine mandates or testing requirements, the severity and durationU.K. representing over 55% of the coronavirus pandemic bysegment's net sales in 2023.
Our portfolio includes beers that have the largest share in their respective countries, such as Carling in the U.K., Ožujsko in Croatia and Niksicko in Montenegro. We have beers that rank in the top five in market including outbreaksshare in their respective segments throughout the region, such as Staropramen in the Czech Republic, Bergenbier in Romania, Jelen in Serbia, Borsodi in Hungary and Kamenitza in Bulgaria.Additionally, we sell Staropramen, Coors, Madri and Miller Genuine Draft in various countries. Our EMEA&APAC segment includes the sale of variants, changesfactored brands and our consolidated joint venture arrangement for the production and distribution of Cobra brands in consumer behavior, inflationary pressures resulting from the coronavirus pandemic, the rate of vaccination and the efficacy of vaccines against the coronavirus and related variants. U.K.
Unallocated
We continue to actively monitor the ongoing evolution of the coronavirus pandemic and resulting impacts to our business.
See further discussion of the status of the coronavirus pandemic and its impacts on our Company, including the on- and off-premise impactshave certain activity that is not allocated to our segments, and primarily includes financing-related costs such as interest expense and income, foreign exchange gains and losses on intercompany balances, realized and unrealized changes in Part II. Item 7. Management's Discussionfair value on instruments not designated in hedging relationships related to financing and Analysis.other treasury-related activities and the unrealized changes in fair value on our commodity swaps not designated in hedging relationships recorded within cost of goods sold, which are later reclassified when realized to the segment in which the underlying exposure resides. Additionally, only the service cost component of net periodic pension and OPEB cost is reported within each operating segment and all other components remain unallocated.Industry OverviewOur Segments
The brewing industry has significantly evolved overOur reporting segments include the years to become an increasingly global beer market. The industry was previously founded on local presence with modest international expansion achieved through export, licenseAmericas and partnership arrangements. Over time the market has become increasingly complex as the consolidation of brewers has occurred globally, resulting in a small number of large global brewers representing the majority of the worldwide beer market. In addition to the consolidation and the acquisitive nature of the industry, exports, licensing and partnership arrangements continued to be used and these transactions typically occurred between the same global competitors that make up the majority of the market. At the same time, smaller local brewers within certain established markets have experienced accelerated growth as consumers increasingly place value on locally-produced, regionally-sourced products. In addition to the growth of smaller local craft breweries, changing consumer trends are pushing the industry toward above premium, including flavored malt beverages, craft beer and beyond beer altogether. In recent years, the hard seltzer market has emerged and has experienced significant growth, particularlyEMEA&APAC. Our Americas segment operates in the U.S. While we do not believe that, Canada and various countries in the rapid growth will continue asCaribbean, Latin and South America. Our EMEA&APAC segment operates in Bulgaria, Croatia, Czech Republic, Hungary, Montenegro, the market has matured, we do believeRepublic of Ireland, Romania, Serbia, the hard seltzer market will continue to be of importance. AsU.K., various other European countries and certain countries within the beer industry continues its evolution of consolidationMiddle East, Africa and diversification of its products to meet consumer demand with broadening preferences, we believe large global brewers are uniquely positioned to leverage the scale, depth of product portfolioAsia Pacific regions. A separate operating team manages each segment and industry knowledge to continue to lead the market forward. We believe we are well positioned to compete in this continually evolving market, particularly ineach segment manufactures, markets, distributes and sells beer hard seltzer and beyond.
Global Competitors' Market Capitalization
We evaluate ourselves in relation to other global brewers using various metrics, including overall market capitalization, volume, net sales, gross margins and net profits, as well as our position within each of our core markets, with the goal to be the first choice for our people, consumers and customers. To provideoffers a perspective of the relative size of the major participants in the global brewing market, the market capitalization of our primary global competitors, based on foreign exchange rates as of December 31, 2021, were as follows:
| | | | | |
| Market Capitalization |
| (In billions) |
Anheuser-Busch InBev SA/NV ("ABI") | $ | 122.1 | |
Heineken N.V. ("Heineken") | $ | 64.7 | |
Carlsberg Group ("Carlsberg") | $ | 25.5 | |
Asahi Group Holdings, Ltd. ("Asahi") | $ | 19.7 | |
MCBC | $ | 10.2 | |
Our Products
We have a diverse portfolio of beloved and iconic owned and partner brands including Blue Moon, Carling, Coors Banquet, Coors Light, Miller High Life, Miller Genuine Draft, Miller Lite and Staropramen. We continue to invest in and focus on growing these brands. In addition to these iconic brands, we offer products in the above premium, including flavored malt beverages (which includes hard seltzers), craft and ready to drink beverages, premium (which includes premium lights) and economy segments. Further, our modern and growing portfolio that expands beyond the beer aisleaisle. No single customer accounted for more than 10% of our consolidated net sales for the years ended December 31, 2023, 2022 or 2021.
Americas Segment
Our Americas segment consists of the production, importing, marketing, distribution and sales of our brands as well.well as other owned and licensed brands in the U.S., Canada and various countries in the Caribbean, Latin and South America. We currently operate nine primary breweries, nine craft breweries and two container operations. We are North America's oldest beer company and the second largest brewer by volume in North America, representing approximately 23% of the total 2023 North America beer market, which is the largest region of our Americas segment. The Americas segment also includes partnership arrangements with Brewers' Retail Inc. ("BRI") for the distribution of beer in Ontario, Canada, and Brewers' Distributor Ltd. ("BDL") for the distribution of beer in the western provinces of Canada. In addition, we have an agreement with Heineken that grants us the right to produce, import, market, distribute and sell certain Heineken products in Canada. We also have authorizations from The Coca-Cola Company that grant us the right to produce, market, sell and distribute high-quality, innovative beverages withTopo Chico Hard Seltzer and Simply Spiked branded products in the purpose of uniting people to celebrate all life’s moments. The following includesU.S. and Canada, and Peace Hard Tea branded products in the primary brands sold in each of our segments. U.S.
Brands soldWe have agreements to brew, package and ship products for Pabst Brewing Company, LLC ("Pabst"), The Yuengling Company ("TYC") in the Americas SegmentU.S. and an agreement with Labatt USA Operating Co, LLC to brew and package certain Labatt brands in Canada for export. The agreement with Pabst ends on December 31, 2024 and is expected to wind down through that time period.
| | | | | | | | | | | | | | |
Arizona Hard Green Tea(3)
| | Hop Valley brands
| | Redd's(4)
|
Arnold Palmer Spiked(3)
| | Icehouse | | Revolver brands
|
Atwater Brewing brands
| | Keystone | | Rickard's |
Belgian Moon | | La Colombe(5)
| | Staropramen |
Belgian Moon LightSky | | Le Trou du Diable | | Steel Reserve |
Blue Moon | | Leinenkugel's
| | Terrapin brands
|
Blue Moon LightSky | | Mad Jack | | Topo Chico Hard Seltzer(6)
|
Brasseurs de Montréal brands
| | Mickey's | | Vizzy Hard Seltzer |
Carling | | Miller64 | | ZOA(7)
|
Carling Black Label | | Miller Genuine Draft | | |
Coors Banquet | | Miller High Life | | Licensed premium import brands(2)
|
Coors Edge | | Miller Lite | | Dos Equis |
Coors Light | | Milwaukee's Best | | Heineken |
Coors Original | | Molson Canadian | | Heineken 0.0 |
Coors Seltzer | | Molson Dry | | Moretti |
Coors Slice | | Molson Export | | Sol |
Creemore Springs | | Molson Ultra | | Strongbow cider |
Exel | | Old Style Pilsner | | |
Granville Island | | Olde English | | |
Hamm's | | Peroni Nastro Azurro(1)
| | |
Henry's Hard Soda | | Pilsner Urquell(1)
| | |
| | | | |
(1) Under perpetual royalty-free license from Asahi. | | |
(2) Under license from Heineken. The brand Heineken is under license in Canada only. The brand Sol is under license in the U.S. and Canada. |
(3) In partnership with Hornell Brewing, an affiliate of Arizona Beverages. |
(4) Under perpetual royalty-free license from ABI. |
(5) Under a distribution agreement with La Colombe Torrefaction, Inc. |
(6) Under brand authorization agreements with The Coca Cola Company. |
(7) Under a distribution agreement with Zoa Energy, LLC. |
Brands sold in the EMEA&APAC Segment
| | | | | | | | | | | | | | |
Aspall Cider | | Cobra(1)
| | Niksicko |
Bavaria(1)
| | Coors | | Ozujsko |
Beck's(1)
| | Corona Extra(1)
| | Rekorderling Cider(1)
|
Bergenbier | | Jelen | | Sharp's Doom Bar |
Blue Moon | | Kamenitza | | Staropramen |
Borsodi | | Lowenbrau(1)
| | Stella Artois(1)
|
Branik | | Madri | | Three Fold Hard Seltzer |
Carling | | Miller Genuine Draft | | |
(1) The European business has licensing and distribution agreements with various other brewers through which it also brews and distributes Beck's, Lowenbrau and Stella Artois, as well as a distribution agreement for the exclusive distribution of the Corona brand, throughout the Central European countries in which we operate. We have an agreement with Dutch brewer, Bavaria, for the exclusive on-premise and off-premise rights to the sales, distribution and customer marketing of Bavaria and its portfolio of brands in the U.K. We have an agreement for licensed brewing and distribution of the Bavaria portfolio in Croatia, Bosnia and Herzegovina, Serbia and Montenegro. We also distribute the Rekorderlig cider brand in the U.K. and the Republic of Ireland. In the U.K., we also sell the Cobra brands through the Cobra Beer Partnership Ltd. joint venture. Additionally, in order to be able to provide a full line of beer and other beverages to our U.K. on-premise customers, we sell "factored" brands, which are third-party beverage brands for which we provide distribution to retail, typically on a non-exclusive basis.
|
The EMEA&APAC segment consists of the production, marketing and sales of our primary brands as well as other owned and licensed brands in Bulgaria, Croatia, Czech Republic, Hungary, Montenegro, the Republic of Ireland, Romania, Serbia, the U.K., various other European countries and certain countries within the Middle East, Africa and Asia Pacific regions. We currently operate eleven primary breweries, four craft breweries and one cidery. Our EMEA&APAC segment is Europe's second largest brewer by volume, on a combined basis, within the countries in which we operate, with an approximate aggregate 18% market share (excluding factored products which are beverage brands owned by other companies but sold and delivered to retail by us) in 2023. The majority of our EMEA&APAC segment sales are in the U.K., Croatia, Czech Republic and Romania with the U.K. representing over 55% of the segment's net sales in 2023.
Unallocated
Our Segments
In 2021, we operatedOur reporting segments include the following segments: Americas and EMEA&APAC. Our Americas segment operates in the U.S., Canada and various countries in the Caribbean, Latin and South America. Our EMEA&APAC segment operates in Bulgaria, Croatia, Czech Republic, Hungary, Montenegro, the Republic of Ireland, Romania, Serbia, the U.K., various other European countries and certain countries within the Middle East, Africa and Asia Pacific regions. A separate operating team manages each segment and each segment manufactures, markets, distributes and sells beer as well as offers a modern and growing portfolio that expands beyond the beer aisle. No single customer accounted for more than 10% of our consolidated net sales in 2021, 2020for the years ended December 31, 2023, 2022 or 2019.
2021.
Americas Segment
•Headquarters: Chicago, Illinois
•Approximately 9,800 employeesOur Americas segment consists of the production, importing, marketing, distribution and sales of our brands as of December 31, 2021
•well as other owned and licensed brands in the U.S., Canada and various countries in the Caribbean, Latin and South America. We currently operate nine primary breweries, nine craft breweries and two container operations. We are North America's oldest beer company and the second largest brewer by volume in North America, representing approximately 20%23% of the total 20212023 North America beer market, which is the largest region of our Americas segment.
•Currently operating nine primary breweries, ten craft breweries and two container operations.
The Americas segment also includes a partnership arrangement related toarrangements with Brewers' Retail Inc. ("BRI") for the distribution of beer in Ontario, Canada, and Brewers' Retail Inc.Distributor Ltd. ("BRI"BDL"), and for the distribution of beer in the western provinces of Canada, Brewers' Distributor Ltd. ("BDL"). BRI and BDL are accounted for under the equity method of accounting. The majority of ownership in BRI resides with Molson Canada 2005 (a wholly-owned subsidiary of our Company), Labatt Breweries of Canada LP (a subsidiary of ABI) and Sleeman Breweries Ltd. (a subsidiary of Sapporo International). BDL is jointly owned by Molson Canada 2005 and ABI.Canada. In addition, we have an agreement with Heineken that grants us the right to produce, import, market, distribute and sell certain Heineken products in Canada. We also have authorizations from The Americas segment also includes Truss, our joint venture with HEXO Corp. ("HEXO") in Canada which producesCoca-Cola Company that grant us the right to produce, market, sell and markets non-alcoholic, cannabis-infused beverages in Canada.
Additionally,distribute Topo Chico Hard Seltzer and Simply Spiked branded products in the third quarterU.S. and Canada, and Peace Hard Tea branded products in the U.S.
We have agreements to brew, package and ship products for Pabst Brewing Company, LLC ("Yuengling"Pabst"), we formed The Yuengling Company LLC ("TYC") in the U.S. and an agreement with Labatt USA Operating Co, LLC to brew and package certain Labatt brands in Canada for export. The agreement with Pabst ends on December 31, 2024 and is expected to wind down through that time period.
EMEA&APAC Segment
The EMEA&APAC segment consists of the production, marketing and sales of our primary brands as well as other owned and licensed brands in Bulgaria, Croatia, Czech Republic, Hungary, Montenegro, the Republic of Ireland, Romania, Serbia, the U.K., various other European countries and certain countries within the Middle East, Africa and Asia Pacific regions. We currently operate eleven primary breweries, four craft breweries and one cidery. Our EMEA&APAC segment is Europe's second largest brewer by volume, on a combined basis, within the countries in which we operate, with an approximate aggregate 18% market share (excluding factored products which are beverage brands owned by other companies but sold and delivered to retail by us) in 2023. The majority of our EMEA&APAC segment sales are in the U.K., Croatia, Czech Republic and Romania with the U.K. representing over 55% of the segment's net sales in 2023.
Our portfolio includes beers that have the largest share in their respective countries, such as Carling in the U.K., Ožujsko in Croatia and Niksicko in Montenegro. We have beers that rank in the top five in market share in their respective segments throughout the region, such as Staropramen in the Czech Republic, Bergenbier in Romania, Jelen in Serbia, Borsodi in Hungary and Kamenitza in Bulgaria.Additionally, we sell Staropramen, Coors, Madri and Miller Genuine Draft in various countries. Our EMEA&APAC segment includes the sale of factored brands and our consolidated joint venture equally owned by MCBCarrangement for the production and DGY West Holdings, LP ("DGY West") that, pursuant to an operating agreement, was formed to expand commercializationdistribution of Yuengling's Cobra brands for any new market expansion outside of Yuengling's then 22-state footprint and New England. During the third quarter of 2021, TYC commenced retail operations with its first product sales in the stateU.K.
Unallocated
We have certain activity that is not allocated to our segments, and primarily includes financing-related costs such as interest expense and income, foreign exchange gains and losses on intercompany balances, realized and unrealized changes in fair value on instruments not designated in hedging relationships related to financing and other treasury-related activities and the unrealized changes in fair value on our commodity swaps not designated in hedging relationships recorded within cost of Texas.goods sold, which are later reclassified when realized to the segment in which the underlying exposure resides. Additionally, only the service cost component of net periodic pension and OPEB cost is reported within each operating segment and all other components remain unallocated.
Industry Overview
The brewing industry has significantly evolved over the years to become an increasingly global and complex market as the consolidation of brewers globally has resulted in a small number of large global brewers representing the majority of the worldwide beer market. In addition to the consolidation of brewers and the acquisitive nature of the industry, exports, licensing and partnership arrangements continue to be used and these transactions typically occur between the same global competitors that make up the majority of the market. While the market is dominated by a small number of large global brewers, smaller local brewers continue to inhabit the market as consumers place value on locally-produced, regionally-sourced products from time to time.
Consumer trends and preferences continue to evolve. During 2023, in the U.S., we saw a shift in consumer purchasing behavior largely within the premium segment that drove an increase in our core power brands' net sales. In addition, consumers continue to push the industry toward above premium products, including flavored beverages, imports and beyond beer altogether. As the beer industry continues its diversification of its products to meet consumer demand with broadening preferences, we believe large global brewers are uniquely positioned to leverage the scale, depth of product portfolio and industry knowledge to continue to lead the market forward. We believe we are well positioned to compete in this continually evolving market, particularly in beer, flavor and beyond.
Our Products
We craft and distribute high-quality, innovative beverages with the purpose of uniting people to celebrate all life's moments. We have a diverse portfolio of beloved and iconic owned and partner brands including our core power brands of Coors Light, Miller Lite, Coors Banquet, Molson Canadian, Carling and Ožujsko. We continue to invest in and focus on growing these brands. In addition to these brands, we offer products in various categories like flavored malt beverages (which includes hard seltzers), craft, ready to drink beverages, spirits and energy beverages as well as beers in various price segments. We categorize our brands globally for consistency of reporting based on the following price segments: Above Premium, Premium and Economy. For example, our Above Premium classification includes brands that are sold at a price point higher than the market average. Price segment classifications may vary between the Americas and EMEA&APAC segments and the naming conventions and classifications may be different in the various countries that we operate based on local terminology.
For example, in our EMEA&APAC segment, brands categorized in the Premium classification such as Carling would be described as core brands in the local market.
The following presents the primary brands sold:
Owned Brands
Above Premium Brands- Aspall Cider, Blue Moon, Coors Original, Five Trail,Hop Valley brands, Leinenkugel's brands, Madri, Miller Genuine Draft, Molson Ultra, Sharp's, Staropramen, Vizzy Hard Seltzer
Premium- Bergenbier, Borsodi, Carling, Coors Banquet, Coors Light, Jelen, Kamenitza, Miller Lite, Molson Canadian brands, Niksicko, Ožujsko
Economy - Branik, Icehouse, Keystone, Miller High Life, Milwaukee's Best, Steel Reserve
Partner Brands
Our partner brands are licensed through various agreements with third parties, such as license, distribution, partnership and joint venture agreements and include:
Arnold Palmer Spiked, Beck's, Blue Run, Cobra, Corona Extra, Heineken, Lowenbrau, Peroni Nastro Azurro, Pilsner Urquell, Redd's brands, Simply Spiked, Sol, Stella Artois, Topo Chico Hard Seltzer, ZOA
Competition
The beer industry is highly competitive and our portfolio of beers competes with numerous brands in all segments which are produced by international, national, regional and local brewers. Competitive factors impacting our business include, but are not limited to, brand recognition and loyalty, pricing, quality, advertising, marketing and promotional activity, packaging, product variety, and the ability to anticipate and respond to consumer tastes and preferences. We believe our brand portfolio gives us strong representation in all major beer categories. In the U.S. and Canada, we compete most directly with Anheuser-Busch InBev SA/NV ("ABI") brands, but we also compete with imports and other providers of craft beer and flavored malt beverages. In the European countries where we currently operate, our primary competitors are ABI, Asahi, Carlsberg and Heineken.
Our products also compete with other alcohol beverages, including wine and spirits, and thus their competitive position is affected by consumer preferences between and among these other categories. Sales of spirits have grown faster than sales of beer in recent years, driven by, among other things, increased spirits advertising, a narrowing price gap with spirits and the growth of spirits-based ready to drink products. This has resulted in a reduction in the beer segment's lead in the overall alcohol beverage market.
In addition, consumer preferences have continued to shift within the industry to above premium products, with volume growth in recent years seen in flavored malt beverages, imports and super premium portfolios. We believe accelerating our growth and increasing or maintaining our market share will require us to build on the strength of our core power brands, aggressively premiumize our portfolio and scale and expand in the fast-growing areas of the industry and beyond the beer aisle.
Sales and Distribution
Our go to market strategy differs slightly between the geographic regions of the Americas segment due to the differences in regulations among those geographic areas.
In the U.S., beer is generally distributed through a three-tier system consisting of manufacturers, distributors and retailers. A national network of approximately 350 independent distributors and one Company-owned distributor, Coors Distributing Company, purchases our products and distributes them to on- and off-premise retail accounts. No single customer accounted for more than 10% of our consolidated net sales for the years ended December 31, 2023, 2022 or 2021. Coors Distributing Company distributed approximately 2%5% of our total owned and non-owned Americas segment volume in 2021.net sales for the year ended December 31, 2023. Transportation of our productproducts to distributors in the U.S. is primarily contracted through third-party logistics providers and shipped by truckload. We have long-term contracts in place with third-party logistics providers to mitigate price fluctuations in freight costs. In instances where transportation needs cannot be met byTransportation costs for shipping product throughout our network is related to contracted freight carriers we utilizeor, if needed, through the spot bidding freight market. OverIn the years,Americas, we have taken steps to diversify transportation modes to reduce the trucking industry has experienced an aging driver demographic which has led to a decreased supplyimpact of truck drivers. Additionally, since the onset of the coronavirus pandemic, this trend accelerated as the trucking industry has seen an increased shortage in truck drivers which has resulted in inflation across certain supply chains. In response to trends seen within the transportation industry, we have begun to transport more productsmarket volatility including shipping via railway, through insulated boxcars orrailcar and intermodal shipping containers, as an action taken to mitigate the levelcontainers.
In Canada, because provincial governments regulate the beer industry and provincial liquor boards control the distribution and retail sale of alcohol products, distribution strategies and transportation of products vary by province. The transportation of our products in Canada varies by the go to market strategy in each province.
In Ontario, beer is primarily purchasedsold at retail outlets operated by BRI, at government-regulated retail outlets operated by the Liquor Control Board of Ontario ("LCBO"), at approved agents of the LCBO, at certain licensed grocery stores, or at any bar, restaurant, or tavern licensed by the LCBO to sell alcohol for on-premise consumption. The BRI retail outlets operate under The Beer Store name. Brewers may deliver directly to BRI's outlets or may choose to use BRI's distribution centers to access retail stores in Ontario, the LCBO system, the grocery channel and licensed establishments. We primarily distribute our products to The Beer Store by truckload. In June 2019, the Ontario government adopted a bill that, if enacted, would terminate a 10-year Master Framework Agreement that was originally signed between the previous government administration and Molson Coors, Labatt Brewing Company Limited, Sleeman Breweries Ltd., and BRI in 2015 and governs the terms of the beer distribution and retail systems in Ontario through 2025. See Part I, Item 1A. Risk Factors, Part II, Item 7. Management's
In Québec, the distribution and sale of beer is governed by the Société des Alcools du Québec Alcohol Corporation ("SAQ"). Beer is distributed to retail outlets primarily by truckload, directly by each brewer or through approved independent agents. We are the agent for the licensed brands we distribute. The brewer or agent distributes the products to permit holders for retail sales for on-premise consumption. Québec retailRetail sales for off-premise consumption are made through grocery and convenience stores, as well as government operated outlets.
BDL manages the distribution of our products throughout British Columbia, Alberta, Manitoba and Saskatchewan. Our products can be purchased by consumers at the government's Liquor Distribution Branch retail outlet, at any independently owned and licensed retail store or at any licensed establishment for on-premise consumption in British Columbia and, in Alberta, at retail outlets licensed by the Alberta Gaming and Liquor Commission or licensees such as bars, hotels and restaurants. BDL primarily distributes products to customers by truckload. Our products are distributed and sold by local liquor boards in the Maritime Provinces, except Newfoundland, independent distributors in Newfoundland and government liquor commissioners in Yukon, Northwest territories and Nunavut.
In the Caribbean, Latin and South America, we use a combination of export models and license agreements to sell Blue Moon, Coors Light, Miller Genuine Draft, Miller High Life, Miller Lite and other brands. In our export model markets, we import beer from the U.S. and sell it through agreements with independent distributors. In license markets, we have established exclusive licensing agreements with brewers and distributors for the manufacturing and distribution of our products. In certain of our markets, we rely on a combination of these agreements.
In the European countries in which we operate, beer is generally distributed through either a two-tier system consisting of manufacturers and retailers, or a three-tier system consisting of manufacturers, distributors and retailers. Distribution activities for both the on- and off-premise channels are conducted primarily by third-party logistics providers. Most of our beer in the U.K. is sold directly to retailers. We have an agreement with Tradeteam Ltd. ("Tradeteam," a subsidiary of DHL) to provide the distribution of our products throughout the U.K. until April 2029. We utilize several hundred third-party logistics providers across our Central European operations. We also conduct a small amount of secondary distribution in several Central European countries utilizing our own fleet of vehicles. It is also common in the U.K. for brewers to distribute beer, wine, spirits and other products owned and produced by other companies, which we refer to as factored brands, to the on-premise channel (bars and restaurants). Approximately 17% of our EMEA&APAC segment net sales in 2023 represented factored brands.
In addition, we have an agreement with Heineken whereby they sell, market and distribute Coors in the Republic of Ireland, as well as agreements with ABI to brew and distribute Beck's, Stella Artois and Lowenbrau, and to distribute Hoegaarden, Leffe, and Corona in Central Europe.
Our operations in Africa, the Middle East and Asia Pacific include markets such as Australia, South Africa and South Korea, with the sale and distribution completed under local license agreements, through the export of our brands from our sites or contract manufacturing with sale through local distributors.
Channels
References to on- and off-premise sales volumes are sales to retailers, which we believe is a useful data point relative to consumer trends.
In the Americas segment, the The on-premise channel includes sales to bars, pubs and restaurants while the off-premise channel includes sales into convenience stores, grocery stores, liquor stores and other retail outlets including The Beer Store in Ontario, Canada which is Canada's largest beer retailer. Industry channel trends vary by segment.
The following table reflectsWith the industry channel share trends overonset of the last five years in the largest regions of our Americas segment, the U.S. and Canada. Percentages reflect estimates based on market data currently available.
| | | | | | | | | | | | | | | | | | | | | | | | | | | | | |
| Industry channel trend |
| 2021 | | 2020 | | 2019 | | 2018 | | 2017 |
| On-premise | 13 | % | | 9 | % | | 16 | % | | 16 | % | | 16 | % |
| Off-premise | 87 | % | | 91 | % | | 84 | % | | 84 | % | | 84 | % |
Prior to the year ended December 31, 2020, the split between on-premise and off-premise remained relatively stable. Duringcoronavirus pandemic during the year ended December 31, 2020, we experienced a significant adverse impact on the operating results of our Company resulting from the closure of the on-premise channel and increased restrictions as a result of the on-set of the coronavirus pandemic which effectively shut down the on-premise channel for various portions of time across the geographies in which we operate. We began to see a progressive return to the on-premise channel at varying degrees across geographies throughout the years ended December 31, 2021 and 2022 and observed a more normalized level of on-premise volume during the year ended December 31, 2023. A more normalized level of STR volume from the on-premise channel, as observed during the year ended December 31, 2019 consisted of approximately 16% in the U.S. and Canada which began in March 2020 and continued into June 2020. During the second half of 2020, we saw a limited on-premise channel reopeningapproximately 61% in the U.S. and Canada as the on-premise channel was restricted at varying degrees. During the year ended December 31, 2021, we began to see a return to the on-premise channel in the U.S. and Canada as a result of the on-premise channel progressively reopening. However, business and consumer uncertainty in this channel persisted and, as a result, we did not see a full return to pre-pandemic levels. While improvement has occurred in many provinces in Canada in 2021, the level of restrictions continues to evolve, frequently moving along a spectrum between full lock down and the easing of restrictions based on the evolution of the coronavirus pandemic and related variants.
As we continue to recover from the coronavirus pandemic, any governmental or societal impositions of restrictions on public gatherings, including any vaccine mandates or testing requirements, especially if prolonged in nature will continue to impact on-premise traffic and, in turn, our business. See Part II. Item 7. Management's Discussion and Analysis, "Items Affecting Reported Results" & "Segment Results of Operations—Americas", for further details.U.K.Manufacturing, Production and Packaging
Brewing Raw Materials
We use high quality ingredients to brew our products. products, including hops, water and barley, among others.
Hops used to brew our products are purchased under various contracts from suppliers in the U.S. and Europe.Europe primarily sourced from Germany, the U.K., Czech Republic and Slovenia. These contracts vary in length based on market conditions and cover our supply requirements through 2022.conditions.
WeIn the Americas segment, we malt a majority of our production requirements in the U.S. and Canada, using barley purchased primarily under annual contracts from independent farmers located predominately in the western U.S. and Canadian Prairies. In addition, we source barley malt from three other commercial providers, from which we have a committed supply until at least 2022.through 2025. Other brewing adjuncts are sourced from three main suppliers, all in the U.S. and Canada, with a portion of our supply committed supply through 2022.2024 and a portion committed through 2025. Other malt and cereal grains are purchased primarily from suppliers in the U.S. and Canada.
In EMEA&APAC, during the year ended December 31, 2023, our malt requirements were sourced from third-party suppliers, with the majority of our brewing materials provided by suppliers based in Europe. We have multiple agreements with various suppliers that cover almost all of our total required malt, with terms ending in 2024 through 2027. Adjuncts are purchased under various contracts with local producers, which are typically crop year contracts commencing in October of each year.
In the U.S. and Canada, we both own and lease water rights, as well as purchase water through local municipalities and communities, to provide for and sustain brewing operations in case of a prolonged droughtoperations. In EMEA&APAC, water used in the regions where we have operations.brewing process is sourced through water rights for water wells, river water use or supply contracts with water suppliers.
We do not currently anticipate future difficulties in accessing water or agricultural products used in our brewing process in the near term.
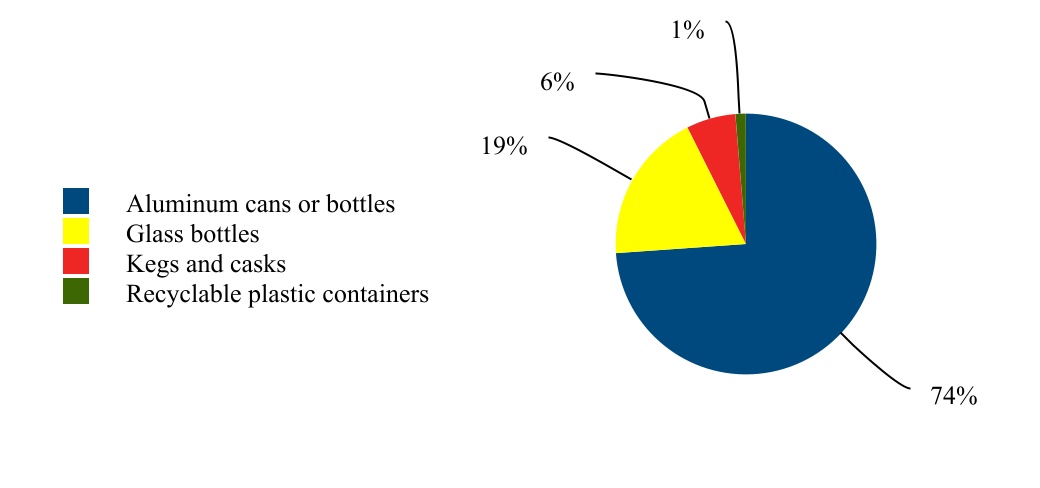
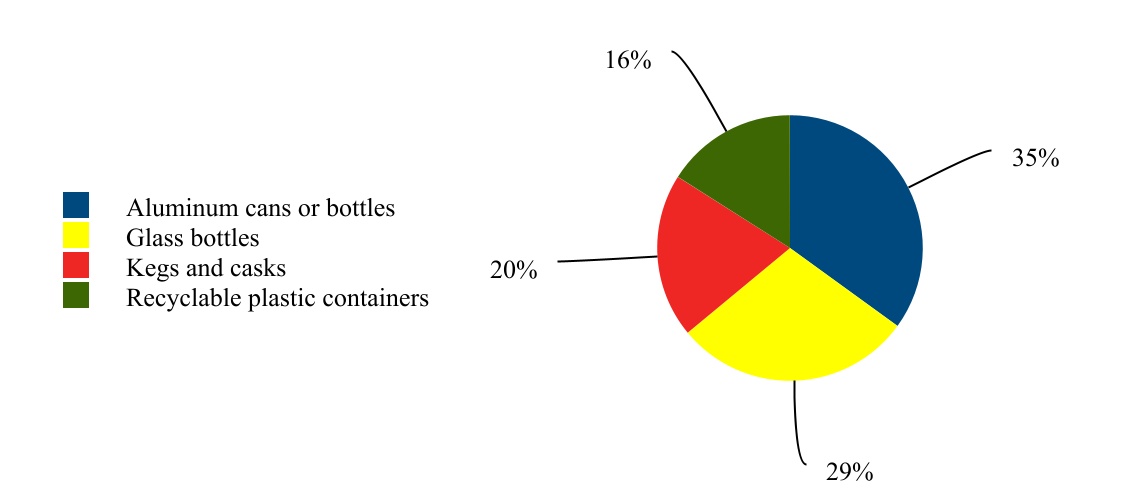
Packaging Materials
The following summarizes the percentage ofOur primary packaging materials by type for the largest regions of our Americas segment, the U.S. and Canada, for the year ended December 31, 2021. In recent years, we saw a shift toinclude aluminum, cans from glass bottles, reusable kegs and this trend accelerated during the year ended December 31, 2020 as a result of the on-premise channel closing at various degrees from March 2020 into June 2020. While wecasks, and recyclable plastic containers. We saw a shift back from aluminum cans to kegs during the year ended December 31, 2021 and 2022 as a result of the on-premise progressively reopening, aluminum cans continue to represent a greater percentage of packaging materials as compared to the years prior toreopened after being shut down during the coronavirus pandemic.
Aluminum cans or bottles
•AIn our Americas segment, a portion of the aluminum cans and ends wasare purchased from Rocky Mountain Metal Container ("RMMC"), our joint venture with Ball Corporation ("Ball"), whose production facilities, which are leased from us, are located near our brewery in Golden, Colorado.
•In addition to the supply agreement with RMMC, we have a supply agreementagreements with Ball and other vendors to purchase aluminum containers in addition to what is supplied throughfrom RMMC. The supply agreement with Ball expires on December 31, 2023. Additionally,In EMEA&APAC, we have commercial arrangementslong-term agreements with other canvarious suppliers to provide sleekthat cover all of our required supply of cans. We are currently in negotiations with these sleek can suppliers and do not anticipate an issue in finalizing these contracts.
•The RMMC joint venture agreement along withIn the cans and ends purchase agreement are in process of being renegotiated and we do not anticipate an issue in finalizing these contracts.
•In Canada, we source cans and ends from two primary providers with the related contracts ending December 31, 2023.
Glass bottles
•AAmericas segment, a portion of the glass bottles was provided byare purchased from Rocky Mountain Bottle Company ("RMBC"), our joint venture with Owens-Brockway Glass Container, Inc. ("Owens"), whose production facilities, which are leased from us, are located in Wheat Ridge, Colorado. The RMBC joint venture agreement expires on July 31, 2025.
•In addition to the supply agreement with RMBC, we have a supply agreementagreements with Owens and other vendors for requirements in excess of RMBC's production, which expires on March 31, 2022. We are currently renegotiating the agreement and do not anticipate an issue in extending these contracts.production.
•In Canada, we single source glass bottles and have a committed supply through March 2022. We are currently in negotiations and do not anticipate an issue in renegotiating and extending the contract.
•The standard bottle for beer brewed in Canada is the 341 ml341ml returnable bottle and represents the vast majoritymore than half of our bottle sales.
•The distribution systems in each Canadian province generally provide the collection network for returnable glass bottles and aluminum cans.
Kegs and casks
•Kegs are packaged in half, quarter and one-sixth barrel stainless steel kegs in the U.S. and packaged in 58.67 liter, 50 liter, 30 liter and 20 liter kegssales in Canada.
•A limited number of kegs are purchased each year, and we have no long-term supply agreement.
Across the Americas segment, crowns, labels, corrugate and paperboard are purchased from a small number of sources unique to each product. In Canada, the standard returnable bottle requires significant investment behind our returnable bottle inventory and bottling equipment.
While we have experienced some challenges in obtaining supplies required for certain packaging materials in 2021 and 2022 as a result of the global supply chain disruption, partially due to the impact of the coronavirus pandemic and the Russia-Ukraine conflict, these more severe supply constraints were short term in nature and, overall, did not materially impact our ability to produce product and meet production forecasts.
Contract ManufacturingWe do not currently foresee future difficulties in accessing packaging materials in the near term. In addition, we do not foresee any issues in maintaining and renegotiating the various long-term agreements we have in place for supply of key materials.
We haveMany of our ingredients, raw materials and commodities for both brewing and packaging are purchased in the open market. The prices we pay for such items are subject to fluctuation, and we manage this risk through the use of fixed-price contracts and purchase orders, pricing agreements and derivative instruments, including commodity swaps and options. In addition, risk to brew, packageour supply of certain raw materials is mitigated through purchases from multiple geographies and ship productssuppliers. When prices increase for Pabst Brewing Company, LLC ("Pabst")materials, we may or may not be able to pass on such increases to our customers. In addition, we continue to make investments to improve the sustainability and TYC, and an agreement with Labatt USA Operating Co, LLCresources of our agricultural supply chain, including the development of our initiative to brew and package certain Labatt brands for export.advance sustainable farming practices by our suppliers.
Seasonality ofSales and Distribution
Our go to market strategy differs between geographic regions due to the Businessdifferences in regulations among those areas.
Total industry volumeIn the U.S., beer is sensitive to factors such as weather, changes in demographics, consumer preferences and drinking occasions. Weather conditionsgenerally distributed through a three-tier system consisting of high temperaturesmanufacturers, distributors and extended periodsretailers. A national network of warmindependent distributors and dry weather favor increased consumptionone Company-owned distributor, Coors Distributing Company, purchases our products and distributes them to on- and off-premise retail accounts. No single customer accounted for more than 10% of our consolidated net sales for the years ended December 31, 2023, 2022 or 2021. Coors Distributing Company distributed approximately 5% of our total owned and non-owned Americas segment net sales for the year ended December 31, 2023. Transportation of our products while unseasonably cool or wet weather, especially during the summer months, adversely affects our sales volumes and net sales. Accordingly, consumption of beerto distributors in the U.S. is primarily contracted through third-party logistics providers and shipped by truckload. We have long-term contracts in place with third-party logistics providers to mitigate price fluctuations in freight costs. Transportation costs for shipping product throughout our network is related to contracted freight carriers or, if needed, through the spot bidding freight market. In the Americas, segment is seasonal, with nearly 37%we have taken steps to diversify transportation modes to reduce the impact of sales volume occurring during the months from May through August.truck market volatility including shipping via railcar and intermodal shipping containers.
Known Trends and Competitive Conditions
2021 Beer Industry Overview
The beer industry in the largest regions of our Americas segment, the U.S. and Canada, is highly competitive, and the two largest brewers, ABI and MCBC together represented the majority of the market in 2021. However, the two largest brewers lost share in 2021 due to volume growth in the flavored malt beverage (including hard seltzers), import and super premium portfolios as consumer preferences continue to shift within the industry to above premium. We believe growing or even maintaining our market share will require building on the strength of our core brands, premiumizing our portfolio and continuing to increase our presence in the fast-growing areas of the industry and beyond the beer aisle.
The following table summarizes the estimated percentage market share by volume of beer (including flavored malt beverages) and other alcohol beverages, including wine and spirits, as a component of the overall U.S. and Canada alcohol market over the last five years. We anticipate that the 2021 data, when available, will reflect a continuation of the recent consumer trends. Percentages reflect estimates based on market data currently available.
| | | | | | | | | | | | | | | | | | | | | | | | | | | | | |
| 2020 | | 2019 | | 2018 | | 2017 | | 2016 |
| Beer | 47 | % | | 48 | % | | 49 | % | | 49 | % | | 50 | % |
| Other alcohol beverages | 53 | % | | 52 | % | | 51 | % | | 51 | % | | 50 | % |
Our Competitive Position
Our portfolio of beers competes with numerous above premium, premium and economy brands. These competing brands are produced by international, national, regional and local brewers. We compete most directly with ABI brands, but also compete with imports and other providers of craft beer and flavored malt beverages. Our products also compete with other alcohol beverages, including wine and spirits, and thus their competitive position is affected by consumer preferences between and among these other categories. Driven by, among other things, increased spirits advertising, a narrowing price gap with wine and spirits, along with increased wine and spirits sales execution, sales of wine and spirits have grown faster than sales of beer in recent years, resulting in a reduction in the beer segment's lead in the overall alcohol beverage market.
The following table summarizes the estimated percentage share of the largest regions of our Americas segment, U.S. andIn Canada, represented by MCBC, ABI and all other brewers over the last five years. Current year percentages reflect estimates based on market data currently available.
| | | | | | | | | | | | | | | | | | | | | | | | | | | | | |
| 2021 | | 2020 | | 2019 | | 2018 | | 2017 |
| MCBC's share | 21 | % | | 22 | % | | 23 | % | | 24 | % | | 25 | % |
| ABI's share | 40 | % | | 41 | % | | 41 | % | | 42 | % | | 42 | % |
| Others' share | 39 | % | | 37 | % | | 36 | % | | 34 | % | | 33 | % |
Regulation
The U.S. beer business is regulated by federal, state and local governments. These regulations govern many parts of our operations, including brewing, marketing and advertising, transportation, distributor relationships, sales and environmental issues. To operate our facilities, we must obtain and maintain numerous permits, licenses and approvals from various governmental agencies, including the U.S. Department of Treasury, Alcohol and Tobacco Tax and Trade Bureau, the U.S. Department of Agriculture, the U.S. Food and Drug Administration, state alcohol regulatory agencies and state and federal environmental agencies.
U.S. governmental entities also levy taxes and may require bonds to ensure compliance with applicable laws and regulations. In 2021, our U.S. business excise taxes on malt beverages were approximately $15 per hectoliter sold on a reported basis. This included the impact of the U.S. Craft Beverage Modernization and Tax Reform Act, which took effect on January 1, 2018 for all qualified large domestic brewers and importers, and was made permanent by the U.S. Consolidated Appropriations Act 2021 on December 27, 2020. This law resulted in reduced U.S. federal excise taxes by $2 per barrel on the first six million barrels, which equated to $1.70 per hectoliter on this portion of our 2021 volume sold. Our practice is to transfer a portion of these savings to distributors consistent with the revenue splitting approach of our U.S. business' economic model. Excise taxes are levied in specific state and local jurisdictions at varying rates. Refer to Part I—Item 1A. Risk Factors for risks associated with the regulatory environment in the U.S.In Canada,because provincial governments regulate the production, marketing,beer industry and provincial liquor boards control the distribution selling and pricingretail sale of alcohol products, distribution strategies and transportation of products vary by province. In Ontario, beer is primarily sold at retail outlets operated by BRI, at government-regulated retail outlets operated by the Liquor Control Board of Ontario ("LCBO"), at approved agents of the LCBO, at certain licensed grocery stores, or at any bar, restaurant, or tavern licensed by the LCBO to sell alcohol for on-premise consumption. In Québec, the distribution and sale of beer (includingis governed by the establishmentSociété des Alcools du Québec ("SAQ"). Beer is distributed to retail outlets directly by each brewer or through approved independent agents. Retail sales for off-premise consumption are made through grocery and convenience stores, as well as government operated outlets. BDL manages the distribution of minimum prices),our products throughout British Columbia, Alberta, Manitoba and impose commodity taxes, mark-upsSaskatchewan.
In the Caribbean, Latin and South America, we use a combination of export models and license fees in relationagreements to its production,sell Blue Moon, Coors Light, Miller Genuine Draft, Miller High Life, Miller Lite and other brands. In our export model markets, we import beer from the U.S. and sell it through agreements with independent distributors. In license markets, we have established exclusive licensing agreements with brewers and distributors for the manufacturing and distribution and sale.of our products. In addition, the Canadian federal government regulates the advertising, labeling, quality control, and international tradecertain of beer, and also imposes commodity taxes on both domestically produced and imported beer. Both levels of government are also similarly involved in other categories of alcoholic beverages produced or imported into Canada. In 2021, our Canadian business excise taxes, federal and provincial, were approximately $59 per hectoliter soldmarkets, we rely on a reported basis. Further, certain bilateral and multilateral treaties entered into bycombination of these agreements.
In the federal government, provincial governments and certain foreign governments, especially with the U.S., affect the Canadian beer industry.
EMEA&APAC Segment
•Headquarters: Burton-on-Trent, U.K.
•Approximately 6,500 employees as of December 31, 2021
•Europe's second largest brewer by volume, on a combined basis, within theEuropean countries in which we operate, beer is generally distributed through either a two-tier system consisting of manufacturers and retailers, or a three-tier system consisting of manufacturers, distributors and retailers. Distribution activities for both the on- and off-premise channels are conducted primarily by third-party logistics providers. Most of our beer in the U.K. is sold directly to retailers. We have an agreement with an approximate aggregate 18% market share (excludingTradeteam Ltd. ("Tradeteam," a subsidiary of DHL) to provide the distribution of our products throughout the U.K. until April 2029. We utilize several hundred third-party logistics providers across our Central European operations. We also conduct a small amount of secondary distribution in several Central European countries utilizing our own fleet of vehicles. It is also common in the U.K. for brewers to distribute beer, wine, spirits and other products owned and produced by other companies, which we refer to as factored products) in 2021.
•Currently operating eleven primary breweries, seven craft breweriesbrands, to the on-premise channel (bars and one cidery.
•Therestaurants). Approximately 17% of our EMEA&APAC segment operatesnet sales in Bulgaria, Croatia, Czech Republic, Hungary, Montenegro,2023 represented factored brands.
In addition, we have an agreement with Heineken whereby they sell, market and distribute Coors in the Republic of Ireland, Romania, Serbia,as well as agreements with ABI to brew and distribute Beck's, Stella Artois and Lowenbrau, and to distribute Hoegaarden, Leffe, and Corona in Central Europe.
Our operations in Africa, the Middle East and Asia Pacific include markets such as Australia, South Africa and South Korea, with the sale and distribution completed under local license agreements, through the export of our brands from our sites or contract manufacturing with sale through local distributors.
Channels
References to on- and off-premise sales volumes are sales to retailers, which we believe is a useful data point relative to consumer trends. The on-premise channel includes sales to bars, pubs and restaurants while the off-premise channel includes sales to convenience stores, grocery stores, liquor stores and other retail outlets including The Beer Store in Ontario, which is Canada's largest beer retailer. Industry channel trends vary by segment.
With the onset of the coronavirus pandemic during the year ended December 31, 2020, we experienced a significant adverse impact on the operating results of our Company resulting from the closure of the on-premise channel and increased restrictions which effectively shut down the on-premise channel for various portions of time across the geographies in which we operate. We began to see a progressive return to the on-premise channel at varying degrees across geographies throughout the years ended December 31, 2021 and 2022 and observed a more normalized level of on-premise volume during the year ended December 31, 2023. A more normalized level of STR volume from the on-premise channel, as observed during the year ended December 31, 2019 consisted of approximately 16% in the U.S. and Canada and approximately 61% in the U.K.
Manufacturing, Production and Packaging
Brewing Raw Materials
We use high quality ingredients to brew our products, including hops, water and barley, among others.
Hops used to brew our products are purchased under various contracts from suppliers in the U.S. and Europe primarily sourced from Germany, the U.K., various other European countries,Czech Republic and certain countries within the Middle East, Africa and Asia Pacific.Slovenia. These contracts vary in length based on market conditions.
The
In the Americas segment, we malt a majority of our EMEA&APAC segment sales areproduction requirements in the U.K., Croatia, Czech RepublicU.S. and Romania. Our portfolio includes beers that have the largest share in their respective countries, such as CarlingCanada, using barley purchased primarily under annual contracts from independent farmers located predominately in the U.K., Ozujskowestern U.S. and Canadian Prairies. In addition, we source barley malt from three other commercial providers, from which we have a committed supply through 2025. Other brewing adjuncts are sourced from three main suppliers, all in Croatia,the U.S. and NiksickoCanada, with a portion of our supply committed through 2024 and a portion committed through 2025. Other malt and cereal grains are purchased primarily from suppliers in Montenegro.the U.S. and Canada.
In EMEA&APAC, during the year ended December 31, 2023, our malt requirements were sourced from third-party suppliers, with the majority of our brewing materials provided by suppliers based in Europe. We have beersmultiple agreements with various suppliers that rankcover almost all of our total required malt, with terms ending in 2024 through 2027. Adjuncts are purchased under various contracts with local producers, which are typically crop year contracts commencing in October of each year.
In the U.S. and Canada, we both own and lease water rights, as well as purchase water through local municipalities and communities, to provide for and sustain brewing operations. In EMEA&APAC, water used in the top threebrewing process is sourced through water rights for water wells, river water use or supply contracts with water suppliers.
We do not currently anticipate future difficulties in market shareaccessing water or agricultural products used in their respective segments throughoutour brewing process in the region, suchnear term.
Packaging Materials
Our primary packaging materials include aluminum, glass bottles, reusable kegs and casks, and recyclable plastic containers. We saw a shift back from aluminum cans to kegs during 2021 and 2022 as Bergenbier in Romania, Jelen in Serbia the on-premise progressively reopened after being shut down during the coronavirus pandemic.
In our Americas segment, a portion of the aluminum cans and Borsodi in Hungary. Additionally, we sell Staropramen and Miller Genuine Draft in various countries. Our EMEA&APAC segment includesends are purchased from Rocky Mountain Metal Container ("RMMC"), our consolidated joint venture arrangementwith Ball Corporation ("Ball"), whose production facilities, which are leased from us, are located near our brewery in Golden, Colorado. In addition to the supply agreement with RMMC, we have supply agreements with Ball and other vendors to purchase aluminum containers in addition to what is supplied from RMMC. In EMEA&APAC, we have long-term agreements with various suppliers that cover all of our required supply of cans.
In the Americas segment, a portion of the glass bottles are purchased from Rocky Mountain Bottle Company ("RMBC"), our joint venture with Owens-Brockway Glass Container, Inc. ("Owens"), whose production facilities, which are leased from us, are located in Wheat Ridge, Colorado. In addition to the supply agreement with RMBC, we have supply agreements with Owens and other vendors for requirements in excess of RMBC's production.
The standard bottle for beer brewed in Canada is the 341ml returnable bottle and represents more than half of bottle sales in Canada.
While we experienced some challenges in obtaining supplies required for certain packaging materials in 2021 and 2022 as a result of the global supply chain disruption, partially due to the impact of the coronavirus pandemic and the Russia-Ukraine conflict, these more severe supply constraints were short term in nature and, overall, did not materially impact our ability to produce product and meet production and distribution of Cobra brandsforecasts.
We do not currently foresee future difficulties in accessing packaging materials in the U.K.near term. In addition, we do not foresee any issues in maintaining and factored brand sales (beverage brands ownedrenegotiating the various long-term agreements we have in place for supply of key materials.
Many of our ingredients, raw materials and commodities for both brewing and packaging are purchased in the open market. The prices we pay for such items are subject to fluctuation, and we manage this risk through the use of fixed-price contracts and purchase orders, pricing agreements and derivative instruments, including commodity swaps and options. In addition, risk to our supply of certain raw materials is mitigated through purchases from multiple geographies and suppliers. When prices increase for materials, we may or may not be able to pass on such increases to our customers. In addition, we continue to make investments to improve the sustainability and resources of our agricultural supply chain, including the development of our initiative to advance sustainable farming practices by other companies but sold and delivered to retail by us).our suppliers.
Sales and Distribution
Our go to market strategy differs between geographic regions due to the differences in regulations among those areas.
In the U.S., beer is generally distributed through a three-tier system consisting of manufacturers, distributors and retailers. A national network of independent distributors and one Company-owned distributor, Coors Distributing Company, purchases our products and distributes them to on- and off-premise retail accounts. No single customer accounted for more than 10% of our consolidated net sales for the years ended December 31, 2023, 2022 or 2021. Coors Distributing Company distributed approximately 5% of our total owned and non-owned Americas segment net sales for the year ended December 31, 2023. Transportation of our products to distributors in the U.S. is primarily contracted through third-party logistics providers and shipped by truckload. We have long-term contracts in place with third-party logistics providers to mitigate price fluctuations in freight costs. Transportation costs for shipping product throughout our network is related to contracted freight carriers or, if needed, through the spot bidding freight market. In the Americas, we have taken steps to diversify transportation modes to reduce the impact of truck market volatility including shipping via railcar and intermodal shipping containers.
In Canada, because provincial governments regulate the beer industry and provincial liquor boards control the distribution and retail sale of alcohol products, distribution strategies and transportation of products vary by province. In Ontario, beer is primarily sold at retail outlets operated by BRI, at government-regulated retail outlets operated by the Liquor Control Board of Ontario ("LCBO"), at approved agents of the LCBO, at certain licensed grocery stores, or at any bar, restaurant, or tavern licensed by the LCBO to sell alcohol for on-premise consumption. In Québec, the distribution and sale of beer is governed by the Société des Alcools du Québec ("SAQ"). Beer is distributed to retail outlets directly by each brewer or through approved independent agents. Retail sales for off-premise consumption are made through grocery and convenience stores, as well as government operated outlets. BDL manages the distribution of our products throughout British Columbia, Alberta, Manitoba and Saskatchewan.
In the Caribbean, Latin and South America, we use a combination of export models and license agreements to sell Blue Moon, Coors Light, Miller Genuine Draft, Miller High Life, Miller Lite and other brands. In our export model markets, we import beer from the U.S. and sell it through agreements with independent distributors. In license markets, we have established exclusive licensing agreements with brewers and distributors for the manufacturing and distribution of our products. In certain of our markets, we rely on a combination of these agreements.
In the European countries in which we operate, beer is generally distributed through either a two-tier system consisting of manufacturers and retailers, or a three-tier system consisting of manufacturers, distributors and retailers. Distribution activities for both the on-premiseon- and off-premise channels are conducted primarily by third-party logistics providers. Most of our beer in the U.K. is sold directly to retailers. We have an agreement with Tradeteam Ltd. ("Tradeteam," a subsidiary of DHL) to provide the distribution of our products throughout the U.K. until April 2029. We utilize several hundred third-party logistics providers across our Central European operations. We also conduct a small amount of secondary distribution in Czech Republicseveral Central European countries utilizing our own fleet of vehicles. It is also common in the U.K. for brewers to distribute beer, wine, spirits and other products owned and produced by other companies, which we refer to as factored brands, to the on-premise channel (bars and restaurants). Approximately 14%17% of our EMEA&APAC segment net sales in 20212023 represented factored brands.
In addition, we have an agreement with Heineken whereby they sell, market and distribute Coors in the Republic of Ireland, as well as agreements with ABI to brew and distribute Beck's, Stella Artois and Lowenbrau, and to distribute Hoegaarden, Leffe, and Corona in Central Europe.
Our operations in Africa, the Middle East and Asia Pacific include markets such as Australia, South Africa and South Korea, with the sale and distribution completed under local license agreements, or through the importexport of our brands from our sites or contract manufacturing with sale through local distributors.
Channels
In the EMEA&APAC segment, excluding the Middle East, AfricaReferences to on- and Asia-Pacific, theoff-premise sales volumes are sales to retailers, which we believe is a useful data point relative to consumer trends. The on-premise channel includes sales to bars, pubs and restaurants. The installation and maintenance of draught beer dispensing equipment inrestaurants while the on-premise channel is generally the responsibility of the brewer. Accordingly, we own refrigeration units and other equipment used to dispense beer from kegs to consumers that are used in on-premise outlets. This includes beer lines, cooling equipment, taps and counter mounts. The off-premise channel includes sales to supermarkets, convenience stores, grocery stores, liquor stores distributors and wholesalers. Overother retail outlets including The Beer Store in Ontario, which is Canada's largest beer retailer. Industry channel trends vary by segment.
With the last few years, throughout the EMEA&APAC segment the off-premise channel has become increasingly concentrated among a small numberonset of super-store chains.
Generally, over the years, industry volumes across countries in which we operate in have shifted from the higher-margin on-premise channel, where products are consumed in pubs and restaurants, to the lower-margin off-premise channel, also referred to as the "take-home" market. The years ended December 31, 2020 and 2021 proved unique as both years were impacted significantly by the coronavirus pandemic. As perspective, we estimate that in 2019 pre-pandemic levels, approximately 60% and 75% of our U.K. financial volumes and net sales, respectively, were from the on-premise channel. The U.K. comprised approximately 55% of our EMEA&APAC net sales, which were $1,986.4 million for the year ended December 31, 2019.
Duringpandemic during the year ended December 31, 2020, we experienced a significant adverse impact on the operating results of our Company resulting from the closure of or increased restrictions to, the on-premise channel as a result of the on-set of the coronavirus pandemicand increased restrictions which effectively shut down the on-premise channel from March 2020 into July 2020for various portions of time across the geographies in which we operate. We began to see a progressive return to the U.K., and was mostly closed again as a result of a second lockdown duringon-premise channel at varying degrees across geographies throughout the fourth quarter of 2020. For the year-endedyears ended December 31, 2020, we estimate approximately 40%2021 and 50%
of our U.K. financial volumes and net sales, respectively, was from the on-premise channel. The U.K. comprised approximately 45% of our EMEA&APAC segment net sales, which were $1,431.9 million forvolume during the year ended December 31, 2020.
While on-premise volumes progressively improved throughout 2021 as bars and restaurants reopened with restrictions, due to implications2023. A more normalized level of the new coronavirus variant, consumer behavior in the U.K. and across Central Europe became more uncertain as individuals were encouraged to work from home and reduce other personal interactions during the fourth quarter of 2021. For the year-ended December 31, 2021, we estimate that approximately 50% and 65% of our U.K. financial volumes and net sales, respectively, wasSTR volume from the on-premise channel. The U.K. comprised approximately 55% of our EMEA&APAC segment net sales, which were $1,802.3 million forchannel, as observed during the year ended December 31, 2021. Although we experienced improvements within the on-premise channel in 2021, business and consumer uncertainty2019 consisted of approximately 16% in the channel has persisted,U.S. and as a result, we did not see a full return to pre-pandemic levels. In addition, enhanced restrictions returnedCanada and approximately 61% in the fourth quarter of 2021 as a result of the risk of coronavirus variants. See Part II. Item 7. Management's Discussion and Analysis,"Items Affective Reported Results" & Segment Results of Operations—"EMEA&APAC", for further details of the impact of the coronavirus pandemic on the EMEA&APAC segment.U.K.Manufacturing, Production and Packaging
Brewing Raw Materials
We use high quality ingredients to brew our products. During 2021,products, including hops, water and barley, among others.
Hops used to brew our products are purchased under various contracts from suppliers in the U.S. and Europe primarily sourced from Germany, the U.K., Czech Republic and Slovenia. These contracts vary in length based on market conditions.
In the Americas segment, we malt a majority of our production requirements in the U.S. and Canada, using barley purchased primarily under annual contracts from independent farmers located predominately in the western U.S. and Canadian Prairies. In addition, we source barley malt from three other commercial providers, from which we have a committed supply through 2025. Other brewing adjuncts are sourced from three main suppliers, all in the U.S. and Canada, with a portion of our supply committed through 2024 and a portion committed through 2025. Other malt and cereal grains are purchased primarily from suppliers in the U.S. and Canada.
In EMEA&APAC, during the year ended December 31, 2023, our malt requirements were sourced from third-party suppliers.suppliers, with the majority of our brewing materials provided by suppliers based in Europe. We have multiple agreements with various suppliers that cover almost all of our total required malt, with terms ending in 20222024 through 2027. Hops are purchased under various contracts with suppliers in Germany, Czech Republic and Slovenia, which contribute to our anticipated requirements through 2026 in line with our planned supply coverage strategy. Adjuncts are purchased under various contracts with local producers, which are typically crop year contracts commencing in October of each year. Water
In the U.S. and Canada, we both own and lease water rights, as well as purchase water through local municipalities and communities, to provide for and sustain brewing operations. In EMEA&APAC, water used in the brewing process is sourced from various wells and through water rights andfor water wells, river water use or supply contracts. contracts with water suppliers.
We do not currently anticipate future difficulties in accessing required water or agricultural products used in our brewing process in the near term.
Packaging Materials
The following summarizes the percentage ofOur primary packaging materials by type for the largest region of our EMEA&APAC segment for the year ended December 31, 2021. In recent years, we have seen a shift toinclude aluminum, cans fromglass bottles, reusable kegs as industry volumes in Europe have shifted from on-premise to off-premise and this trend accelerated during the year ended December 31, 2020 as a result of the on-premise channel closing at various degrees for most of the secondcasks, and fourth quarters. While we have seenrecyclable plastic containers. We saw a shift back from aluminum cans to kegs during the year ended December 31, 2021 and 2022 as a result of the on-premise progressively reopening, aluminum cans continue to represent a greater percentage of packaging materials in the EMEA&APAC segment as compared to years prior toreopened after being shut down during the coronavirus pandemic.
AluminumIn our Americas segment, a portion of the aluminum cans or bottles
•Weand ends are purchased from Rocky Mountain Metal Container ("RMMC"), our joint venture with Ball Corporation ("Ball"), whose production facilities, which are leased from us, are located near our brewery in Golden, Colorado. In addition to the supply agreement with RMMC, we have supply agreements with Ball and other vendors to purchase aluminum containers in addition to what is supplied from RMMC. In EMEA&APAC, we have long-term agreements with various suppliers that cover all of our required supply of cans, with terms ending in 2023 through 2026.cans.
Glassthe glass bottles
•Our glass returnable bottles are sourced under various agreements with third-party suppliers.
Kegs and casks
•A limited number of kegs are purchased each year from various suppliers, and we have no long-term supply commitment. We are currently in the process of signing new agreements which would cover all of our requirements for kegs in 2022.
Recyclable plastic containers
•We have multiple agreements with various manufacturers in the region, covering 100% of our requirements, which expire in 2024. We signed a new agreement that expires in 2025 and the rest of our agreements are in renegotiations. We do not currently anticipate an issue in renegotiating and extending the remaining contracts or otherwise being able to access recyclable plastic containers.
Crowns, labels and corrugate are purchased from sources uniqueRocky Mountain Bottle Company ("RMBC"), our joint venture with Owens-Brockway Glass Container, Inc. ("Owens"), whose production facilities, which are leased from us, are located in Wheat Ridge, Colorado. In addition to each category. the supply agreement with RMBC, we have supply agreements with Owens and other vendors for requirements in excess of RMBC's production.
The standard bottle for beer brewed in Canada is the 341ml returnable bottle and represents more than half of bottle sales in Canada.
While we experienced some challenges in obtaining supplies required for certain packaging materials in 2021 and 2022 as a result of the global supply chain disruption, partially due to the impact of the coronavirus pandemic and the Russia-Ukraine conflict, these more severe supply constraints were short term in nature and, overall, did not materially impact our ability to produce product and meet production forecasts.
We do not currently foresee future difficulties in accessing these or other packaging materials in the near term. In addition, we do not foresee any issues in maintaining and renegotiating the various long-term agreements we have in place for supply of key materials.
Many of our ingredients, raw materials and commodities for both brewing and packaging are purchased in the open market. The prices we pay for such items are subject to fluctuation, and we manage this risk through the use of fixed-price contracts and purchase orders, pricing agreements and derivative instruments, including commodity swaps and options. In addition, risk to our supply of certain raw materials is mitigated through purchases from multiple geographies and suppliers. When prices increase for materials, we may or may not be able to pass on such increases to our customers. In addition, we continue to make investments to improve the sustainability and resources of our agricultural supply chain, including the development of our initiative to advance sustainable farming practices by our suppliers.
Seasonality of the Business
In our EMEA&APAC segment, the beerTotal industry volume is subjectsensitive to seasonal sales fluctuations primarily influenced byfactors such as weather, holidays, weatherchanges in demographics, consumer preferences and by certaindrinking occasions including major televised sporting events. Weather conditions consisting of high temperatures and extended periods of warm and dry weather favor increased consumption of our products, while unseasonably cool or wet weather, especially during the summer months, adversely affects our sales volumes. Accordingly,volumes and net sales. Consumption of beer in the Americas segment is seasonal, with nearly 39% of financial volume occurring during the months from May through August. In EMEA&APAC, the peak selling seasons typically occur during the summer months and during the Christmas and New Year holiday season.
Known Trends and Competitive Conditions
2021 Beer Industry OverviewRegulation
Our beers compete not only with similar products from competitors, but also with other alcohol beverages, including winesbusiness is subject to various laws and spirits. As the global economy continues to recover from the impacts of the coronavirus pandemic, continued restrictions to the on-premise channel, if prolonged in nature, will continue to impact the beer industryregulations in the EMEA&APAC regions. jurisdictions around the world in which we operate. These regulations govern many parts of our operations, including brewing, marketing and advertising, transportation, distributor relationships, sales and environmental issues. Excise taxes remitted to tax authorities are government-imposed excise taxes on beer. Excise taxes on beer are shown in a separate line item in the consolidated statements of operations as a reduction of sales.
The following table summarizesU.S. beer business is regulated by federal, state and local governments. To operate our facilities, we must obtain and maintain numerous permits, licenses and approvals from various governmental agencies, including the estimated percentage market share by volumeU.S. Department of Treasury, Alcohol and Tobacco Tax and Trade Bureau, the U.S. Department of Agriculture, the U.S. Food and Drug Administration, state alcohol regulatory agencies and state and federal environmental agencies. U.S. governmental entities also levy taxes and may require bonds to ensure compliance with applicable laws and regulations. In 2023, our U.S. business excise taxes on malt beverages were approximately $15 per hectoliter sold on a reported basis. Excise taxes are also levied in specific state and local jurisdictions at varying rates.
In Canada, provincial governments regulate the production, marketing, distribution, selling and pricing of beer and other alcoholalcoholic beverages including wineproduced or imported into Canada (including the establishment of minimum prices), and spirits, asimpose commodity taxes, mark-ups and license fees in relation to its production, distribution and sale. In addition, the Canadian federal government regulates the advertising, labeling, quality control, and international trade of beer, and also imposes commodity taxes on both domestically produced and imported beer. In 2023, our Canadian business excise taxes, federal and provincial, were approximately $56 per hectoliter sold on a component ofreported basis. Further, certain bilateral and multilateral treaties entered into by the overall alcohol market,federal government, provincial governments and certain foreign governments, especially within the U.S., affect the Canadian beer industry.
Most countries included in which we have production facilities, over the last five years, for which data is currently available. We anticipate that 2021 data, when available, will reflect a continuation of the recent consumer trends. Percentages reflect estimates based on market data currently available.
| | | | | | | | | | | | | | | | | | | | | | | | | | | | | |
| 2020 | | 2019 | | 2018 | | 2017 | | 2016 |
| Beer | 29 | % | | 29 | % | | 30 | % | | 30 | % | | 30 | % |
| Other alcohol beverages | 71 | % | | 71 | % | | 70 | % | | 70 | % | | 70 | % |
Our Competitive Position
In the European countries where we currently operate, our primary competitors are ABI, Asahi, Carlsberg and Heineken. We believe our brand portfolio gives us strong representation in all major beer categories. The following table summarizes our estimated percentage share of the beer market within the countries where we operate and our primary competitors over the last five years. Current year percentages reflect estimates based on market data currently available. Prior year percentages reflect the market data available subsequent to the filing of the prior year annual report.
| | | | | | | | | | | | | | | | | | | | | | | | | | | | | |
| 2021 | | 2020 | | 2019 | | 2018 | | 2017 |
| MCBC's share | 18 | % | | 18 | % | | 19 | % | | 20 | % | | 20 | % |
| Primary competitors' share | 64 | % | | 63 | % | | 60 | % | | 57 | % | | 56 | % |
| Others' share | 18 | % | | 19 | % | | 21 | % | | 23 | % | | 24 | % |
Regulation
Each country that is part of our EMEA&APAC segment where we carry out significant brewing or distribution activities isare either a member of the European Union ("EU") or a current candidate to join with the exception of theEU. The U.K., which left the EU during 2020, and Bosnia, Montenegro and Serbia which are potential EU candidates.2020. As such, there are similarities in the
regulations that apply to many parts of our EMEA&APAC segment's operations and products, including brewing, food safety, labeling and packaging, marketing and advertising, environmental, health and safety, employment, and data protection and regulations. To operate breweries and conduct our business in these countries, we must obtain and maintain numerous permits and licenses from various governmental agencies.
The government(s) of each country in which we sell our products levieslevy excise taxes on alcohol beverages. All countries which are members of the EU member countries'apply laws on excise taxes that are consistent with the EU Directives and use the same measurements based on either alcohol by volume or Plato degrees. Non-EU countries use various taxation methods, including a flat excise rate per volume or methods that may be similar to those used in the EU. In the year ended December 31, 2021,2023 the excise taxes for our EMEA&APAC segment were approximately $45$46 per hectoliter on a reported basis. Refer
People and Planet
Through Our Imprint Strategy, we have established goals and supporting initiatives for our People and Planet pillars to ensure we are good stewards of the assets and resources most important to our business. More information about our strategy and progress can be found in Our Imprint Report, available at www.molsoncoors.com/goals-and-reporting. The information provided on our website (or any other website referred to in this report) is not part of this report and is not incorporated by reference as part of this report.
Governance of Our People and Planet Strategy
Our Board of Directors ("Board") is responsible for risks associatedoverseeing and monitoring Our Imprint Strategy, with specific areas of oversight delegated to the committees of the Board. The Board receives regular reports and recommendations from management and the Board committees to help guide our strategy, from Planet goals related to water, packaging and climate change, to People initiatives focused on retaining and developing a diverse and talented workforce. At the management level, our ESG Leadership Steering Committee ("ESG Steering Committee") is composed of senior executives and is responsible for the evolution of Our Imprint Strategy. Our Vice President of Sustainability & EHS works closely with the regulatory environment inESG Steering Committee on strategy development and initiative implementation and progress for our People and Planet focus areas.
Our executive leadership team and the chief people and diversity officers for the Americas and EMEA&APAC.&APAC segments are tasked with managing all employment-related matters including recruitment, retention, leadership and development, compensation planning, succession planning, performance management, and diversity, equity and inclusion ("DEI"). The Compensation and Human Resource Committee ("CHR Committee") of the Board is responsible for establishing and reviewing the overall compensation philosophy of our Company and providing oversight on certain human capital matters, including our talent retention and development, leadership development, talent pipeline, programs and systems for performance management and DEI initiatives. Further, the CHR Committee is responsible for overseeing our progress against our social initiatives related to human capital management.
Putting People First
UnallocatedWe believe that people are the heart of our Company and strive to create a culture where people are encouraged to and feel comfortable to bring their diverse perspectives and experiences to the table. As a global company, we believe we have a responsibility to nurture a workforce that reflects our local communities, which we believe makes us a better employer, partner and company of choice for our consumers and customers.
We have a global and varied workforce, with major employee centers in the U.S., Canada, the U.K. and Romania. As of December 31, 2023, we employed approximately 16,500 employees within our business globally with approximately 10,100 within our Americas segment and 6,400 within our EMEA&APAC segment. Approximately 750 of our employees are in our Global Business Services Centers based in Milwaukee, Wisconsin and Bucharest, Romania. As of December 31, 2023, approximately 30% and 24% of our Americas segment and EMEA&APAC segment workforces, respectively, are represented by trade unions or councils, which are subject to collective bargaining agreements that come due for renegotiation from time to time.
Diversity, Equity & Inclusion
We believe DEI should be deeply embedded in our corporate culture and how we operate, from how we work together to how we grow as a company. We have created roadmaps and action plans for the Americas and EMEA&APAC segments based on an assessment of our existing culture, programs and talent management processes.
Our 2023 initiatives and progress include:
•Month of Inclusion - In order to further increase awareness around DEI issues, we launched the Month of Inclusion in 2021, which built on the Week of Inclusion we introduced in 2020. The Month of Inclusion continued in 2023 and brought together our U.S., Latin America and Canada employees, and our EMEA&APAC employees, respectively, to focus on prioritizing inclusion, equity and workplace respect. The theme for the 2023 Month of Inclusion focused on Belonging and included a variety of presentations, discussions and external speakers. In the Americas, we promoted and supported our Employee Resource Groups ("ERGs") in their work to represent a number of different communities within our employee population – by race/ethnicity, gender, sexual orientation, early professionals, young families, and veterans, amongst others. The ERGs are aimed to help foster a diverse, inclusive workplace aligned with our values and culture. In 2022, we launched our 12th ERG, Disabilities United, to increase inclusion and awareness of visible and invisible disabilities and caretakers of members of the disabled community. In Western Europe, we created ERGs for gender, sexual orientation, disability and ethnicity and these groups are expected to play a key role in development of our strategy, initiatives and in encouraging and supporting all employees to bring their whole self to work.
•EMEA&APAC Governance Structure - In EMEA&APAC, we have implemented a governance structure that strives to (i) link DEI to business strategy, (ii) demonstrate senior level accountability, (iii) provide a voice to diverse talent at all levels of our organization and (iv) allow for regional autonomy to attempt to assure relevancy. A Divisional DEI Council leads, advocates, and is accountable for DEI progress in EMEA&APAC and aims to provide a common, coordinated approach across the regions. Further, Regional DEI Councils, with representatives sitting on the Divisional DEI Council, attempt to ensure divisional connectivity while recognizing the need for flexibility. Membership of these councils includes senior leaders and employee representatives. Key topics for the DEI Councils have included pay equity, inclusive hiring, external partnerships, representation goals and building DEI into our brands.
•Empathy Experience - Our Empathy Experience in the Americas is an immersive and interactive learning experience focused on building empathy between colleagues, within teams, and across our organization. As part of the experience, employees are guided through various spaces to build their awareness and understanding of the lived experience of certain activitydiverse groups and communities. In the U.S., the Empathy Experience explores relationships and perceptions across five communities: Latino, Black, Women, LGBTQ and Asian Pacific. In 2023, we launched an "In Canada, For Canada" Empathy Experience based in Toronto. Through education, stories and activities, the participants in these empathy experiences explore how biases, microaggressions and stereotypes affect others in hopes of fostering a better connection through empathy.
Employee Wellbeing
We strive to be a provider of meaningful experiences and a safe and healthy workplace for all employees.
•Wellness - We promote healthy lifestyles across our global enterprise by offering health and insurance benefits and wellness and work/life balance programs that are tailored to employees' needs and culture by work location. In the Americas, employees can participate in our wellness programs that incentivize healthy habits and lifestyles. These resources include connections to virtual healthcare, remote fitness and wellness support, and a free employee assistance program for coping with stress, feelings of isolation, and anxiety. In the EMEA&APAC regions, we drive our employee wellbeing culture through a team made up of regional representatives who coordinate activities focused on the topics based on employee feedback. In 2023, these activities included certain wellness programs, as well as flexible work hours, wellness webinars and challenges, to further emphasize our wellbeing culture.
•Health & Safety - Our commitment to Health & Safety is not allocatedfocused on preventing workplace incidents and building a strong behavior-based safety culture across our entire workforce through training, our World Class Supply Chain operating system, and our values-based leadership development approach.
•Compensation and Benefits- We offer affordable and comprehensive benefits, which we routinely benchmark to try to ensure they are competitive, inclusive, aligned with our segments,company culture and primarily includes financing-related costslocal practices, and allow our employees to meet their individual needs and the needs of their families. Our Total Rewards program in general provides a competitive base salary, incentive plans, health and insurance benefits, a deferred compensation option in certain regions with a potential employer match, paid time off plans, enhanced parental leave policies in many locations, an engaging Wellness Program and an Employee Assistance Program. Our business units comply with applicable parental leave laws and in many cases go further to provide flexible work schedules and extended leave for new parents. We believe our compensation and incentive programs motivate us to ignite growth and help to hold ourselves accountable for living out our values to achieve our short- and long-term goals.
•Talent Development - Our aim is to help employees unlock their full potential so they can thrive in their current job and realize new, potential growth opportunities. At Molson Coors, First Choice Learning serves as the global home for development resources to support the unique needs of our employees around the world. First Choice Learning invests in our people through in-person and online training programs, and experiential training opportunities to support employee health and safety, assist in building core competencies, share best practices and develop leadership capabilities. In 2023, we continued to invest in targeted development programs, including one aimed to accelerate the readiness of high potential employees to move into roles of greater scope and complexity. These programs include a blend of classroom training, coaching and mentoring and experiential action learning projects.
•Employee Engagement - We believe that engaging our employees through surveys during the onboarding process and throughout the employee journey provides us with valuable insight into how we can develop our company culture to help ensure that our people feel supported and are able to thrive at our company. We gauge our employees’ sentiments through Employee Experience surveys three times a year in the Americas and yearly in EMEA&APAC. In addition, our Chief Executive Officer regularly hosts live online question and answer sessions available to all employees. We believe these sessions also help create a company culture where open, honest dialogue is supported and encouraged, and where people are empowered to raise questions and concerns about our business and our culture.
Preserving the Planet
We have a long legacy of commitment to environmental sustainability, dating back to Bill Coors’ pioneering efforts to bring the two-piece aluminum can to market in the late 1950s and implementation of some of the first recycling programs in the U.S. In 2017, we launched Our Imprint goals for climate and water and, in 2019, incorporated our ambition to make our packaging more sustainable. As further detailed in the annual Our Imprint Report, we have several key Planet focus areas:
•Reduce greenhouse gas ("GHG") emissions – Against our 2016 baseline, our goal is to reduce Scope 1 & 2 GHG emissions by 50% for 2025 and 65% for 2030 along with a 40% reduction in Scope 3 emissions for 2030 and to achieve net zero emissions (Scope 1, 2 & 3) by at least 2050.
•Improve water resilience – We targeted an overall 22% improvement (versus 2016 baseline) in the water-to-product ratio of our breweries producing more than 150,000 hectoliters annually, and we collaborate with key partners on watershed management programs to improve the health of the Trinity River Basin watershed in Texas (home of our Fort Worth brewery) and the Upper South Platte River watershed in Colorado (home of our Golden brewery), collectively restoring more than three billion gallons of water to these watersheds since 2014.
•Responsibly manage packaging and waste – We aim to use widely recyclable packaging materials such as interest expensealuminum cans, glass bottles and income, foreign exchange gainsfiberboard cartons, and losses on intercompany balances relatedwe are working to financingeliminate polyethylene terephthalate ("PET") bottles and other treasury-related activities,single-use plastic rings for our beer brands in the U.S., Canada and the unrealized changesU.K. while our Central & Eastern European operations are on pace to ensuring the PET bottles in fair value onthose markets contain at least 25% recycled content by 2025 and 30% by 2030. By weight, approximately 4.3% of our commodity swaps not designatedpackaging was plastic as of December 31, 2022.
•Implement more sustainable agricultural practices – We work closely with our barley farmers to test and learn with different growing practices across multiple regions and collect a broad range of data including water consumption. Against our 2016 baseline, by 2025, our goal is to produce annual barley crop with 10% less water per ton yielded.
As detailed in hedging relationships recorded within costthe annual Our Imprint Report, we continued the implementation of goods sold, which are later reclassified when realized toenergy and water efficiency improvements across our facilities, including a multi-year renovation project of our Golden, Colorado brewery, a renewables contract for our Fort Worth, Texas brewery, and a wind-power based power purchase agreement in the segment in which the underlying exposure resides. Additionally, only the service cost component of net periodic pension and OPEB cost is reported within each operating segment, and all other components remain unallocated.
Other InformationU.K.
Environmental Compliance Matters
Our operations are subject to a variety of extensive and changing federal, state and local environmental laws, regulations and ordinances that govern activities or operations that may have an impact on human health or the environment. Such laws, regulations or ordinances may impose liability for the cost of remediation, and for certain damages resulting from sites of past releases of hazardous materials. Our policy is to comply with all such legal requirements. While we cannot predict our eventual aggregate cost for the environmental and related matters in which we may be or are currently involved, we believe that any payments, if required, for these matters would be made over a period of time in amounts that would not be material in any one year to our operating results, cash flows, or our financial or competitive position. We believe adequate reserves have been provided for losses that are probable and estimable. However, there can be no assurance that environmental laws will not become more stringent in the future or that we will not incur material costs in the future in order to comply with such laws. See Part II—Item 8 Financial Statements and Supplementary Data, Note 18,13, "Commitments and Contingencies" under the caption "Environmental" for additional information regarding environmental matters. Global Intellectual Property
We own trademarks on the majority of the brands we produce and have licenses for the remainder. We also hold several patent and design registrations with expiration dates through 20382043 relating to brewing methods, beer dispensing systems, packaging and certain other innovations. We are not reliant on patent royalties for our financial success. Therefore, these expirations are not expected to have a significant impact on our business.
Sustainability
We believe in producing beverages we can be proud of, from grain to glass. Our Imprint is MCBC's approach to sustainability and the right way to grow our business for a better tomorrow. Our Imprintis integral to how we will build long-term value for society and our shareholders, while leaving a positive imprint on our communities, on our people and planet.
We have a long legacy of commitment to sustainability.
In 2012, MCBC became a charter member of the International Alliance for Responsible Drinking ("IARD"). This collaborative industry body represents the 13 leading beer, wine and spirits companies, and partners with public sector, civil society and private stakeholders. IARD works with governments globally to support the WHO NCD Global Monitoring Framework target of 10% reduction in harmful use of alcohol by 2025.
In 2017, we launched Our Imprint 2025 agenda, which included a set of ambitious goals across a range of matters relating to environmental sustainability and community and people. We further added to these goals in 2019, incorporating our ambition to make our packaging more sustainable. These goals include our commitment to use more recycled materials in our plastic packaging, improve recycling solutions in our key markets and make 100% of our packaging reusable, recyclable or compostable by 2025.
In 2021, we added a new target to increase diverse representation in our company by 2023 and streamlined Our Imprint 2025 strategy to reflect our four priority focus areas. The four areas where we believe we can make the greatest contribution and demonstrate leadership include: diversity, equity and inclusion ("DEI"), water, climate and packaging. The enhanced focus areas aim to address the expectations of our consumers and stakeholders, while we continue to make our operations even more resource efficient and resilient.
More information about Our Imprint 2025 goals can be found on our sustainability website, www.MolsonCoorsOurImprint.com, which includes:
•Environmental, Social and Governance Report 2021, which presents the most recent progress made against our certain goals and includes more details on the underlying data, processes and policies that support ESG topics; and
•Sustainable Development Goals Impact Report 2021, which shows how MCBC is taking action to contribute to the 17 global goals set forth by the United Nations by 2030.
The information provided on our website (or any other website referred to in this report) is not part of this report and is not incorporated by reference as part of this report.
Human Capital Management
We have a global and varied workforce, with major employee centers in the U.S., Canada, the U.K. and Romania. As of the end of 2021, we employed approximately 16,300 employees within our business globally with approximately 9,800 within our Americas segment and 6,500 within our EMEA&APAC segment. Of the approximately 16,300 employees, approximately 600 of our employees are in our Global Business Services Centers based in Milwaukee, Wisconsin and Bucharest, Romania. As of the end of 2021, approximately 32% and 26% of our Americas segment and EMEA&APAC segment workforces, respectively, are represented by trade unions or councils, which are subject to collective bargaining agreements, which come due for renegotiation from time to time.
Our People-First Culture
We believe that people are the heart of our Company. We strive to create a culture where people are encouraged to and feel comfortable about bringing their diverse perspectives and experiences to the table. As a global company, we believe we have a responsibility to nurture a workforce that reflects our local communities. We believe this makes us a better employer, partner and company of choice for our consumers and customers, and it is why we are committed to championing DEI.
We strive to be a provider of meaningful experiences for our employees and a safe and healthy workplace for all employees. We believe that building a diverse and inclusive workforce is a significant contributor to our success as a business and to deliver on our purpose, and that we value and respect our differences. We believe that diversity and equity with inclusion is the key to collaboration and a winning team culture. A significant component of the revitalization plan announced in October 2019 was the launch of a refreshed purpose (uniting people to celebrate all life’s moments), ambition (first choice for our people, consumers and customers) and shared company values (the first of which is Putting People First), all designed with a purpose of shifting the culture of the organization to drive stronger employee and business engagement. In addition, we refreshed and stream-lined our ESG strategy in 2021 to further focus on areas in which we believe we can have the biggest impact, including a focus on people. More information about our ESG strategy can be found in our ESG Report, located on our sustainability website, www.MolsonCoorsOurImprint.com. The information provided on our website (or any other website referred to in this report) is not part of this report and is not incorporated by reference as part of this report.
Board and Management Oversight
With the overarching goals described in the preceding paragraph as guides, the leadership team and the chief people and diversity officers for the Americas and EMEA&APAC segments are tasked with managing all employment-related matters including recruitment, retention, leadership and development, compensation planning, succession planning, performance management, and DEI. The Compensation and Human Resource Committee ("CHR Committee") of the Board of Directors is responsible for establishing and reviewing the overall compensation philosophy of our Company and providing oversight on certain human capital matters, including our talent retention and development, leadership development, talent pipeline, programs and systems for performance management and DEI initiatives. Further, the CHR Committee is responsible for overseeing our progress against our social initiatives related to human capital management. The Audit Committee oversees our ESG and sustainability programs and reporting, as well as its enterprise risk management program to identify and mitigate potential risks, including human capital issues. The Board of Directors receives regular reports and recommendations from management and the board committees to help guide our strategy on retaining and developing a diverse and talented workforce.
Diversity, Equity and Inclusion
We believe DEI should be deeply embedded in our corporate culture and how we operate, from how we work together to how we grow as a company. In 2020, we created a new position of Vice President of Diversity, Equity & Inclusion to help ensure we have a robust DEI strategy. We accelerated our DEI efforts by creating a three-year DEI roadmap and action plan for the U.S. and Canada as a result of an assessment of our existing culture, programs and talent management processes. We identified the strengths and opportunities for improvement in our corporate culture through discussions with Company executives and senior leaders, our focus groups and our employees.
In order to further increase awareness around DEI issues, we launched a Month of Inclusion in 2021, which builds on the Week of Inclusion we introduced in 2020. The Month of Inclusion brings together our U.S. and Canada employees, and our Western Europe employees, respectively, to focus on prioritizing inclusion, equity and workplace respect. This year’s Month of Inclusion included a variety of presentations, interactive sessions and fireside chats with leaders and external experts that were centered around our five corporate values and designed to be conversation starters to help facilitate potentially difficult discussions.
We promote and maintain employee resource groups ("ERGs") for a number of different communities in our employee population - by race/ethnicity, by gender, LGBTQ+, early professionals, young families, and veterans, amongst others. These ERGs are aimed to help foster a diverse, inclusive workplace aligned with our values and culture. We encourage participation in these groups as we believe it provides an open forum for individual employees who may share similar concerns or experiences. We also rely on these ERGs to help activate our DEI strategy through community building and creating a culture of allyship. In the U.S. and Canada, the ERGs host monthly Inclusion in Action events on different topics helping employees build knowledge, broaden perspective and develop meaningful understanding of various viewpoints.
In addition, as part of our wider DEI strategy, an Inclusion & Diversity Director, EMEA&APAC, was appointed in 2021. In EMEA&APAC, over 5,500 employees completed a Respect at Work learning module and over 500 leaders completed an Inclusive Leader training program. We believe these actions underline our commitment to accelerating our DEI efforts to help build an inclusive culture where our people feel accepted and valued.
As we work to a more diverse workforce and management team, we developed programs to encourage the recruitment, retention and training of diverse leaders and working to ensure we have a highly skilled and diverse workforce.
Talent Development
We encourage our employees to develop their careers and learn every day and have embedded that belief in our core company values as “Learn Every Day.” Our aim is to help employees unlock their full potential so they can thrive in their current job and also realize new, potential growth opportunities. In 2021, we launched a new talent planning experience, which is designed to help us understand our employee’s ambitions and identify growth opportunities that fit their needs, as well as the needs of our Company.
We also promote and emphasize leadership and development opportunities for our employees which includes our First Choice Learning Center, in-person and online training programs, and experiential training opportunities to encourage and promote employee health and safety, assist in building core competencies, learning best practices and developing leadership capabilities. In addition, employee performance is assessed at year-end based on achievement of individual goals and the degree to which our values are modeled to achieve them.
Compensation and Benefits
We offer competitive, affordable and comprehensive benefits. We recognize excellence and differentiate rewards based on both what we do and how we do it – which we intend to be equally weighted to help strengthen our culture and promote our Company as a great place to work while at the same achieving our business results. We believe these compensation rewards motivate us to be bold and decisive and ignite growth. Our incentive programs hold us accountable for living out our values to achieve our short- and long-term goals.
Our employees are able to participate in our Total Rewards program that in general provides a competitive base salary, incentive plans, health, dental, and vision insurance plans, a 401(k) option in certain regions with a potential employer match, paid time off plans, including parental leave policies in many locations, an engaging Wellness Program and an Employee Assistance Program. Our business units comply with applicable maternity leave laws and, in many countries, we go further to provide flexible work schedules and extended leave for new parents. We routinely benchmark our global compensation and benefits programs to ensure they are competitive, inclusive, aligned with our company culture and allow our employees to meet their individual needs and the needs of their families.
Engaging Our Employees
We believe that engaging our employees, through surveys during the onboarding process and throughout the employee journey, provides us with valuable insight into how we can develop our company culture to help ensure that our people feel supported and able to thrive at our company. We use a “continuous listening” model to try to ensure that we understand how our employees are feeling and what they are thinking throughout the year. We gauge our employees’ sentiments through a quarterly Employee Experience survey in the U.S. and Canada and bi-annual surveys in EMEA&APAC. These surveys focus on topics such as our culture, values, DEI efforts, well-being and leadership. In addition, our CEO regularly hosts live online question and answer sessions available to all employees. We believe these sessions also help create a company culture where open, honest dialogue is supported and encouraged, and where people are empowered to raise questions and concerns about our business and our culture.
Employee Health and Safety
We aim to ensure that our employees have a healthy and safe work environment. Our supply chain has adopted and implemented a framework we call world class supply chain 2.0 at many of our brewery and other locations. As part of that framework, our environment, health and safety ("EHS") policy guides our efforts in maintaining safe and healthy workplaces where we take a proactive approach to the identification and control of environment, health and safety risks. We develop our safety programs to promote a sense of ownership for personal safety and safety of colleagues at all levels of the business. We work to improve our EHS performance through training and other methodologies that aim to prevent workplace injuries and illness, and reduce environmental impacts of our operations.
Our safety focus was further evident during our response to the coronavirus pandemic where we implemented additional health and safety measures in the breweries and our distribution centers, ensuring these federally designated essential operations could continue to operate and we could protect our employees. We enhanced our cleaning protocols at the majority of our facilities including enhanced sanitization, social distancing, cloth facemasks and hand sanitizers, and for a period of time, instituted paid and unpaid coronavirus specific leave programs.
Promoting Employee Well-Being
We promote healthy lifestyles across our global enterprise by offering health benefits, wellness and work/life balance programs that are tailored to employees' needs and culture by work location. In the U.S. and Canada, employees can participate in our wellness programs through a mobile phone application that incentivizes healthy habits and lifestyles. The need for remote work and social distancing has changed the dynamics of the workplace so we have responded by providing resources to help support not only the physical health of our employees, but also their mental health and well-being. These resources include connections to virtual healthcare, remote fitness and wellness support, and a free employee assistance program for coping with stress, feelings of isolation and anxiety.
Available Information
We file with, or furnish to, the SEC reports, including our annual report on Form 10-K, quarterly reports on Form 10-Q, current reports on Form 8-K and amendments to those reports pursuant to Section 13(a) or 15(d) of the Exchange Act. These reports are available free of charge via EDGAR through the SEC website (www.sec.gov) and are also available free of charge on our corporate website (www.molsoncoors.com) as soon as reasonably practicable after they are electronically filed with or furnished to the SEC. The foregoing website addresses are provided as inactive textual references only. The information provided on our website (or any other website referred to in this report) is not part of this report and is not incorporated by reference as part of this report.
Information About Our Executive Officers
The following table sets forth certain information regarding our executive officers as of February 23, 2022:20, 2024:
| | | | | | | | | | | | | | |
| Name | | Age | | Position |
| Gavin D.K. Hattersley | | 5961 | | President and Chief Executive Officer |
| Tracey I. Joubert | | 5557 | | Chief Financial Officer |
| Sergey Yeskov | | 4547 | | President and Chief Executive Officer, of Molson Coors EMEA&APAC |
Peter J. MarinoNatalie Maciolek | | 49 | | President, Emerging Growth |
Anne-Marie Wieland D'Angelo | | 45 | | Chief Legal and& Government Affairs Officer and Secretary |
| Michelle E. St. Jacques | | 4446 | | Chief MarketingCommercial Officer |
ITEM 1A. RISK FACTORS
Investing in our Company involves risk. Investors should carefully consider the following risk factors and the other information contained within this report. The risks set forth below are those that management believes are most likely to have a material adverse effect on us. Investors are encouraged to read each risk factor as related and interconnected to the other risk factors set forth in this section. However, the risks set forth below are not a comprehensive description of the risks facing our Company. We may also be subject to other risks or uncertainties not presently known to us or that we currently deem to be immaterial but may materially adversely affect our business, financial condition or results of operations in future periods. Investors should not interpret the disclosure of any risk factor to imply that the risk has not already materialized. If the following risks or uncertainties, individually or in combination, actually occur, they may have a material adverse effect on our business, financial conditions, results of operations or prospects. See also "Cautionary Statement Pursuant to Safe Harbor Provisions of the Private Securities Litigation Reform Act of 1995."
Risks Related to our Company and Operations
The coronavirus pandemic, effortsDeterioration of general economic, political, credit and/or capital market conditions, including those caused by the ongoing Russia-Ukraine conflict, or other geopolitical tensions, could adversely affect our financial performance, our ability to mitigategrow or disruptsustain our business, financial condition and results of operations, and our ability to access the coronavirus pandemiccapital markets. We compete around the world in various geographic regions and product markets. Global economic and political conditions affect our business and the businesses of our customers, suppliers and consumers. Recessions, economic downturns, price instability, inflation, slowing economic growth, social and political instability, and violent crime and related weak,matters in the markets where we compete could negatively affect our revenues and financial performance, and adversely impact our ability to grow or weakening of, economic or other negative conditions,sustain our business. For example, current macroeconomic and political instability caused by the Russia-Ukraine conflict, global supply chain disruptions and inflation have disrupted,adversely impacted and maycould continue to disruptadversely impact our business whichand financial results.
Specifically, the ongoing Russia-Ukraine conflict, has adversely affected the global economy, and the geopolitical tensions and conflicts it has generated and continues to generate negatively impact our operations. It has resulted in heightened economic sanctions from the U.S., the U.K., the European Union and the international community. As a result of the Russia-Ukraine conflict, in 2022 we suspended all exports of all our brands to Russia and subsequently terminated the license to produce any of our brands in Russia. Even though our sales in Russia have historically been limited, representing less than 0.2% of our 2021 consolidated net sales and less than 1% of our 2021 EMEA&APAC net sales, and we have no physical assets in Russia, the effect of the Russia-Ukraine conflict due to the widespread impact, particularly in Eastern Europe, has had and could continue to have a material adverse effectoutcome on our operations, liquidity,business, financial condition, results of operations, supply chain, availability of critical supplies, intellectual property, partners, customers or employees. Further escalation of geopolitical tensions related to the Russia-Ukraine conflict, including increased trade barriers or restrictions on global trade, could result in, among other things, broader impacts that expand into other markets, cyberattacks, energy supply availability shortages, supply chain and logistics disruptions, lower consumer demand, and volatility in foreign exchange rates, interest rates and financial results.
Our business has been, and we currently expect will continue to be, materially andmarkets, any of which may adversely affected by the ongoing coronavirus pandemic and related weak, or weakening of, economic or other negative conditions, particularly in regions where we derive a significant amount of our revenue or profit or where our suppliers and business partners are located, including those in regions of our Americas segment and EMEA&APAC segment. Therefore, unfavorable macroeconomic conditions, including as a result of the coronavirus pandemic and any resulting recession or slowed economic growth, have had, and could continue to have, an outsized negative impact on us. Specifically, the coronavirus pandemic has disrupted, and we currently expect it to continue to disrupt,affect our business and we also continue to expect certain associatedsupply chain. Similar geopolitical tensions and political conflicts could adversely impact our employees, financial impacts. Those impacts include, but are not limited to, lower net sales in markets affectedperformance and global operations, including by, among other things, jeopardizing the coronavirus pandemic, including potential material shifts in,safety of our employees and facilities, disrupting our and our partners’ production, supply chain and logistics and communications, and causing market volatility, which could adversely impact consumer demand and our sales. More broadly, there could be additional negative impacts to demand,our financial results if the inabilityRussia-Ukraine conflict worsens, including, among other potential impacts, economic recessions in certain neighboring countries or globally due to sell our productsinflationary pressures, including with respect to on-premise consumersfood, energy and further disruptionsupply chain cost increases or shortages, or the geographic proximity of the conflict relative to the on-premise channel, including staged on premise re-openings and subsequent closurerest of on-premise accounts, our ability to pay a dividend, the delay of, and potential increased costs related to, inflation in the overall macro economy, our supply chain, inventory production and fulfillment including packaging availability impacted by package mix shifts based on the prevalence of different packaging types for on-premise and off-premise channels, and lower return rates of our returnable packaging in certain markets, potentially impacting net sales and cost of goods globally and increased incremental costs associated with mitigatingEurope. In addition, the effects of the coronavirus pandemic, including increased raw materials, freightongoing Russia-Ukraine conflict could amplify or affect many of our other risks described elsewhere in Part I, Item 1A, "Risk Factors" in this Annual Report on Form 10-K.
In addition, the capital and logisticscredit markets provide us with liquidity to operate and grow our business beyond the liquidity that operating cash flows provide, which can vary from period to period. A global or regional economic downturn or disruption of the credit markets could increase our future borrowing costs and other expensesimpair our ability to access capital and disruptions. Continuedcredit markets necessary for our operations and to execute our strategic plan. If our access to capital on terms commercially acceptable to us were to become significantly constrained, or if costs of capital increased significantly, then our financial condition, results of operations and cash flows could be adversely affected. Further, continued disruption and declines in the global economy have impacted and could continue to impact our customers’customers' liquidity and capital resources and therefore our ability to collect, or the timeliness of collection of our accounts receivable from them, which may have a material adverse impact on our performance, cash flows and capital resources. The coronavirus pandemic is ongoing,
Our operations are dependent on the global supply chain and its dynamic nature, including uncertainties relatingface significant exposure to the continued spreadchanges in commodity and other input prices, and impacts of the virus, newer variants, the severity of the disease, which cansupply chain constraints and inflationary pressures could adversely impact our operating results. We depend on the particular variant,effectiveness of our supply chain management to assure reliable and sufficient supply of quality products. Our business has been, and may continue to be, impacted by supply chain constraints, including longer lead times, in part, by the durationRussia-Ukraine conflict and the uncertain economic environment worldwide. These supply chain constraints could put significant inflationary pressures on commodity and other input prices. In addition, current proposed or future governmental policies may increase the risk of inflation, which could further increase the coronavirus pandemic, the efficacycosts of the vaccinesraw materials and vaccine boosters against the coronavirusother components for our business. We use a large volume of agricultural and related variantsother raw materials, some of which are purchased through supply contracts with third parties, to produce our products, including barley, malted barley, hops, corn, other various starches, water and related vaccination effortspackaging materials, including aluminum cans and associated prolonged weakeningbottles, glass and polyethylene terephthalate containers as well as cardboard and other paper products. We also use a significant amount of economic or other negative conditions,diesel fuel, natural gas, electricity and carbon dioxide in our operations.The supply and price of these raw materials and commodities can be affected by a number of factors beyond our control, including market demand, inflation, alternative sources for suppliers, global geopolitical events, such as a recessionthe Russia-Ukraine conflict (especially as to their impact on energy supply prices in general, including crude oil prices and the resulting impact on diesel fuel prices), global or slowedregional disease outbreaks or pandemics, trade agreements among producing and consuming nations, governmental regulations (including tariffs), frosts, droughts and other weather conditions, changes in precipitation patterns, the frequency of extreme weather events, economic factors affecting growth indecisions, plant diseases, theft and industry surcharges and other practices.
Similarly, if the costs of goods continue to increase, our markets, and actions thatsuppliers may be taken by governmental authorities to attemptseek price increases from us. If we are unable to mitigate the impact of the coronavirus pandemic, makes it difficultthese matters through customer price increases, cost savings to forecast any effects onoffset cost increases, hedging arrangements, or other measures, our results of operations and financial condition could be adversely impacted. If our competitors maintain or substantially lower their prices, we may lose customers or mark down prices. Our profitability may be impacted by prices that do not offset the inflationary pressures, which may impact our gross margins. Even if we are able to raise the prices of our products, we may not be able to sustain such price increases and consumers might react negatively to such price increases, which could have a material adverse effect on, among other things, our brand, reputation and sales. Temporary or sustained price increases may also lead to a decrease in demand for 2022our products as competitors may not adjust their prices or consumers may decide not to pay higher prices for our products, which could lead to a decline in sales volume and in subsequent years. However,loss of market share. Our projections may not accurately predict the volume impact of price increases, which could adversely affect our business, financial condition and results of operationsoperations.
Geopolitical tensions may cause delays in 2020shipments of our products and 2021 were negatively affectedsupplies. Failure to adequately produce and timely ship our products to customers could lead to lost potential revenue, failure to meet customer demand, strained relationships with customers, including wholesalers, and diminished brand loyalty.
Weak, or weakening of, economic, social or other conditions in the markets in which we currently expectdo business, including cost inflation and reductions in discretionary consumer spending, could adversely impact demand for our resultsproducts or cause consumers to suffer financial hardship, which could have a material adverse effect on our business and financial results. Beer consumption in some of operations for 2022our markets could be closely tied to general economic conditions and a significant portion of our portfolio consists of premium and above premium brands. Difficult macroeconomic conditions in our markets, such as further decreases in per capita income and level of disposable income driven by increases in inflation, energy costs, income (and other) taxes and the cost of living, increased and prolonged unemployment or a further decline in consumer confidence, as well as limited or significantly adversely affected.
In addition, the coronavirus pandemic and related efforts to mitigate its spread, have impacted, and mayreduced points of access of our product, political or economic instability or other country-specific factors, could continue to impacthave a material adverse effect on the demand for our products.
For example, under difficult or deteriorating economic conditions, consumers may seek to reduce discretionary spending by forgoing purchases of our products by shifting away from our premium and above premium products to lower-priced products offered by us or other companies or by shifting to off-premise from on-premise consumption, negatively impacting our net sales and margins. A significant portion of our consolidated net sales are concentrated in the foreseeable future, customer traffic toU.S., Canada and countries in Europe, which represent the on-premise channel, which includes bars, restaurants and sporting events, festivals and other large venues. Many governmental authorities across the geographic regions inmajority of net sales within our Americas and EMEA&APAC segments have required that bars and restaurants limit, closesegments. Therefore, unfavorable
macroeconomic conditions, such as inflationary pressures, a recession or cease sit-down service at points during 2020, 2021 and to-datecontinued slowed economic growth in 2022,the U.S., Canada or countries in Europe, could negatively affect consumer demand for our products in these important markets, which hasconsequently, may negatively impactedaffect the results of operations in our Americas and EMEA&APAC segments, and we expect will continue to negatively impact on-premise sales of our beverages and previously led to the incurrence of costs to repurchase products that on-premise accounts or distributors were unable or prohibited from selling as a result of the governmental regulations. Despite the reopening of on-premise accounts in certain of our markets during 2021, sales to restaurants and bars have not returned to pre-coronavirus pandemic levels and in many instances, the reopened on-premise accounts have been subsequently forced to close at various times in certain of our markets as a result of an increase in the spread of the coronavirus or the outbreak of new variants. We currently expect that closures and reduced on-premise consumption may continuesegments. Softer consumer demand for an unknown period, negatively impacting our net sales and margins. We also expect some on-premise accounts will again see a decrease in demand in certain markets in our Americas segment and our EMEA&APAC segment in the winter months, which may again reduce or eliminate their outdoor seating capacity and affect the results of our operations in our Americas and EMEA&APAC segments. In addition, sporting events, festivals and other large public
gatherings where our products are served have been canceled or permitted to take place only with limited attendance by the public throughout the geographies included incould reduce our Americasprofitability and EMEA&APAC segments. Additionally, these and other governmental or societal impositions of restrictions on public gatherings, especially if prolonged in nature, will have adverse effects on on-premise traffic and, in turn, our business. Even if such measures are relaxed at certain points in time and the coronavirus does not continue to spread as rapidly as in recent months, or if after the coronavirus pandemic has subsided, fear of re-occurrence or the perceived risk of infection or health risk may adversely affect traffic to the on-premise channel and, in turn, maywould have a material adverse effect on our business liquidity,and financial conditionresults.
Loss, operational disruptions or closure of a major brewery or other key facility, including those of our suppliers, due to unforeseen or catastrophic events or otherwise, could have a material adverse effect on our business and financial results. Our business could be interrupted and our financial results could be materially adversely impacted by physical risks such as earthquakes, fires, hurricanes, floods, acts of war, terrorist attacks, cyberattacks and other disruptions in information systems, such as the March 2021 cybersecurity incident, disease outbreaks or pandemics and other natural disasters or catastrophic events that damage, disrupt or destroy one of our breweries or key facilities or the key facilities of our significant suppliers. If any of our breweries or key facilities or the key facilities of our significant suppliers experience a significant operational disruption or catastrophic loss, it could delay, disrupt or reduce production, shipments and revenue, and result in potentially significant expenses to repair or replace these properties. Such significant disruptions could be due to, among other things:
•the loss or disruption of the timely availability of adequate supplies of essential raw materials for us and our suppliers, including single-source suppliers;
•our ability to effectively integrate new suppliers into our operations;
•material financial issues facing our suppliers, such as bankruptcy or similar proceedings;
•transportation and logistics challenges, including as a result of governmental restrictions and the availability and capacity of shipping channels as customers may shift to increased online shopping;
•the loss or disruption of other manufacturing, distribution and supply capabilities;
•labor shortages, strikes or work stoppages;
•the loss or disruption of the supply of carbon dioxide gas;
•acts of war and terrorism; or
•natural disasters, pandemics, public health crises, or other catastrophic events and the associated impacts of such events, including impacts on our employees, their families, or our suppliers.
We experienced certain of the foregoing risks and losses in connection with the March 2021 cybersecurity incident and the coronavirus pandemic. Additionally, certain catastrophes are not covered by our general insurance policies, which could result in significant unrecoverable losses. Our business and results of operations particularly if any self-imposedcould also be adversely impacted by under-investment in physical assets or governmental changes are in place for a significant amount of time.
Moreover, our operations could be disrupted by our employees or employeesproduction capacity, including contract brewing and effect on the priority of our business partners, includingbrands if production capacity is limited. Further, significant excess capacity at any of our breweries as a result of increased efficiencies in our supply chain partners, being diagnosedprocess or continued volume declines could result in under-utilization of our assets, which could lead to excess overhead expenses or additional costs incurred associated with coronavirusthe closure of one or being suspectedmore of having coronavirusour facilities. For example, as part of a strategic review of our supply chain network, certain breweries and bottling lines were closed in recent years, and we have incurred brewery closure costs, including charges associated with the closure of the Irwindale brewery in 2020, which was subsequently sold to Pabst Brewing Company, LLC in the fourth quarter of 2020. We regularly review our supply chain network to ensure that our supply chain capacity is aligned with the needs of the business. Such reviews could potentially result in further closures and the related costs could be material.
Cybersecurity incidents impacting our information systems, and violations of data privacy laws and regulations could disrupt our business operations and adversely impact our reputation and results of operations. Our information systems may be the target of cyberattacks or other illnesses since thissecurity breaches, which, if successful, could, requireamong other things, disrupt our operations, applications and services, cause the loss of key business, employee, customer or vendor information, cause us to breach our legal, regulatory or contractual obligations, prevent us from accessing or relying upon critical business records, cause reputational damage, or impact the costs or ability to obtain adequate insurance coverage. These incidents may result from human errors, equipment failure, or fraud or malice on the part of employees or third parties. The risk of cyber threats or cyberattacks increases as we rely more on digital partners, including supply-chain partners integrated into our business, partners to quarantine somewho may also be the target of cyberattacks or all such employeesother security breaches. If our information systems suffer severe disruption, damage, or closeshutdown we could experience delays and disinfect our or their facilities. In late 2021, our U.S. and Canada corporate office and certain field sales employees who were working remotely returned to their respective work offices on a part-time basis. If a significant percentage of our workforce or the workforce ofdisruptions in our business, partners are unable to work or ifincluding brewery operations, production and shipments and delays in reporting our financial results, such as those we or our business partners are required to close our or their office or production facilities, including because of illness, the risks of which may be increased due to employees returning to work, or travel or government restrictions in connectionexperienced with the coronavirus pandemic,March 2021 cybersecurity incident, which could adversely affect our operations, including manufacturing and distribution capabilities, may be negatively impacted, potentially materially adversely affecting our business, liquidity,cash flows, competitive position, reputation, financial condition or results of operations. A breach of our information systems, such as the March 2021 cybersecurity incident, could subject us to litigation,
including class action or derivative lawsuits, regulatory fines, and penalties, any of which could have a material adverse effect on our financial results or reputation. We have seen an increase in the number of cyberattacks due, in part, to the large number of our employees and contractors that are working and accessing our technology infrastructure remotely because of shifts in working arrangements. In addition, the March 2021 cybersecurity incident may embolden other individuals or groups to target our information systems and impact the costs or ability for us to obtain adequate insurance coverages moving forward. Furthermore, continued geopolitical turmoil, including the Russia-Ukraine conflict, has heightened the risk of cyberattacks. As discussed further below, the rapid evolution and increased adoption of artificial intelligence and machine learning technologies may intensify our cybersecurity risks.
We expend significant financial resources to protect against cyber threats and cyberattacks. We may be required to incur further costs to alleviate problems and remedy damage caused by physical, electronic and cybersecurity breaches and to address possible increased information system attacks as a result of the incident, which could have a material adverse effect on our business and financial results. These events may not be insured against or may not be fully covered by any insurance maintained by us. Additionally, there is no assurance that the limitations of liability in any of our contracts would be enforceable or adequate to protect us from liabilities or damages as a result of a cyberattack or other cybersecurity incident. As techniques used to breach security are growing in frequency and sophistication and are generally not recognized until launched against a target, we may not be able to implement security measures in a timely manner or, if governments electand when implemented, these measures could be circumvented regardless of our expenditures and protection efforts. We could also be required to mandatespend significant financial and other resources to remedy the vaccinedamage caused by a security breach or regular testingto repair or replace networks and information systems, which could have a material adverse effect on our business and financial results. For example, we incurred certain incremental one-time costs of employees, such impositions$2.4 million in the year ended December 31, 2021 related to consultants, experts and data recovery efforts, net of insurance recoveries. Although we attempt to vigorously monitor and mitigate against cyber risks, including through leveraging multi-sourced threat intelligence and investing in new technologies, we may cause workforce shortages, particularlyincur significant costs in protecting against or remediating cyberattacks or other cybersecurity incidents.
Misuse, leakage or falsification of information could result in a violation of data privacy laws and regulations, including but not limited to, the European Union's General Data Protection Regulation, California Privacy Rights Act, the Virginia Consumer Data Protection Act, or the Colorado Privacy Act, may damage our reputation and credibility or expose us to increased risk of lawsuits, loss of existing or potential future customers and/or increases in our supply chainsecurity costs and with our supply chain partners,compliance burden, any of which could similarly have a negative impactmaterial adverse effect on our business and financial results. Other jurisdictions in which we operate have enacted or are proposing similar laws and regulations related to data privacy. In addition, we may suffer financial and reputational damage because of lost or misappropriated confidential information and may become subject to legal action and increased regulatory oversight or consumers may avoid our brands due to negative publicity. In the event of a breach resulting in loss of data, such as personally identifiable information or other such data protected by data privacy or other laws, even if encrypted, we may be liable for damages, fines and penalties for such losses under applicable regulatory frameworks despite not handling the data. Further, the regulatory framework around data custody, data privacy and breaches may be inconsistent from one jurisdiction to another and is an evolving area of law. We may not be able to limit our liability or damages in the event of such a loss.
Finally, the SEC has adopted new rules that require us to provide greater disclosures around cybersecurity risk management, strategy and governance, as well as disclose the occurrence of material cybersecurity incidents. We cannot predict or estimate the amount of additional costs we will incur in order to comply with these rules or the timing of such costs. These rules and regulations may also require us to report a cybersecurity incident before we have been able to fully assess its impact or remediate the underlying issue. Efforts to comply with such reporting requirements could divert management's attention from our incident response and could potentially reveal system vulnerabilities to threat actors. Failure to timely report incidents under these or other similar rules could also result in monetary fines, sanctions or subject us to other forms of liability. This regulatory environment is increasingly challenging, and may present material obligations and risks to our business, including significantly expanded compliance burdens, costs and enforcement risks.
The success of our business relies heavily on brand image, reputation, product quality and protection of intellectual property. It is important that we maintain and enhance the image and reputation of our existing brands and products, including our corporate purpose, mission and values. Concerns about product quality, even when unsubstantiated, could be harmful to our image and the reputation of our brands and products. While we have quality control programs in place, in the event we or our third-party manufacturers experience an issue with product quality or if any of our products become unsafe or unfit for consumption, are misbranded or cause injury, we may experience recalls or liability in addition to business disruption which could further negatively impact our brand image and reputation, negatively affect our sales and cause us to incur additional costs. A widespread product recall, multiple product recalls or a significant product liability judgment could cause our products to be unavailable for a period of time, which could further reduce consumer demand and brand equity. We also could be exposed to lawsuits relating to product liability, marketing or sales practices or intellectual property infringement. Our brand image and reputation may also be difficult to protect due to less oversight and control as a result of outsourcing some of our
operations internationally or entering new or different product lines. If we are unable to address and uphold our plans with respect to our ESG initiatives or actions by and attitudes of regulators and the public health community, our image and brand equity may deteriorate, which may be difficult to combat or reverse and could have a material adverse effect on our business and financial results.
In addition, because our brands carry family names or we may partner with celebrities or other famous sponsors, personal activities by certain members of the Molson or Coors families, our promotional partners or business partners that harm their public image or reputation could also have an adverse effect on our brands or our reputation. Our brand image, reputation and financial results may be negatively impacted by our ability to navigate social media campaigns and trends in pursuit of various dynamic issues facing society on regional and global levels across the markets in which we operate.
Further, our success is dependent on our ability to protect our intellectual property rights, including increased coststrademarks, patents, domain names, trade secrets and know-how.We cannot be certain that the steps we have taken to implement such mandates.protect our intellectual property rights will be sufficient or that third parties will not infringe upon or misappropriate these rights or that other parties may claim that our brands infringe on their intellectual property rights. If we are unable to protect our intellectual property rights, it could have a material adverse effect on our business and financial results.
The global beer industry and the broader alcohol industry are constantly evolving, and our position within the global beer industry and the success of our products in our markets in which we operate may fundamentally change. If we do not successfully transform along with the evolving industry, and market dynamics then the result could have a material adverse effect onand consumer preferences, our business and financial results.results could be materially adversely affected. The brewing industry has significantly evolved over the years becoming an increasingly consolidated global beer market. For many years, the industry operated primarily on local presence with modest international expansion achieved through export, license and partnership arrangements. In contrast, it has now become increasingly complex and competitive as the global consolidation of brewers has resulted in fewer major market participants. At the same time, smaller local brewers within certain geographies are seeing accelerated growth as consumers increasingly place value on locally-produced and/or regionally-sourced products. As a result of the increased global consolidation of brewers and the dynamic of an expanding new segment within the industry with new market entrants, the markets in which we operate, particularly the more mature markets, may evolve at a disadvantage to our current market position andposition. In addition, local governments may intervene, which may fundamentally accelerate transformational changes to such markets. For example, the beer markets in the U.S. and Canada beer markets have long consisted of a select number of significant market participants with government-regulated routes to market. However, evolution in these markets and our other beer markets, together with emerging changes to consumer preferences, have introduced a significant increase in market entrants and resulted in increased consumer choice and market competition, as well as increased government scrutiny. Specifically, the markets in which we operate have experienced vast expansion in above premium, specifically in craft beer, cider, flavored malt beverages (including hard seltzers), ready to drink beverages, spirit-based beverages, CBD and other cannabis beverages and other similar beverages. If our competitors are able to respond more quickly to the evolving trends within the craft beer, hard seltzer, flavored malt beverages, ready to drink malt-based, sugar-based and spirits-based beverages, CBD and other cannabis beverages and other similar beverages categories, or if our new products in these categories are not successful, our business and financial results may be adversely impacted. In addition, certain states in the U.S. have passed or are considering passing, and Canada has passed, laws and regulations that allow the sale and distribution of cannabis. Currently, it is not possible to predict the impact of this on sales of alcoholic beverages but it is possible that legal cannabis usage could adversely impact the demand for our products. Furthermore, imported beers also continue to compete aggressively in the U.S. In Canada, changes to interprovincial trade rules, regulations, distribution models and packaging requirements, such as government-owned retail outlets and industry standard returnable bottles, may be disadvantageous to us. Currently,As discussed further below, in December 2023 the Province of Ontario announced a set of non-binding key principles ("Key Principles") concerning the intended features of the future marketplace for beer distribution and retail systems in the Province of Ontario. Evolution in certain of our beer markets, together with emerging changes to consumer preferences, have resulted in a significant increase in market entrants, consumer choices and market competition, as well as increased government scrutiny.
Our Coors Light and Miller Lite brands in the Americas, and Carling, Staropramen, Coors, Madri, Ožujsko, and Bergenbier brands in EMEA&APAC represented more than half of each respective segment's sales volumes in 2023. Additionally, several of our brands represent a significant share of their respective market and, therefore, continued volatility in these markets could disproportionately impact the performance of these brands. Consequently, any material shift in consumer preferences away from these brands, or from the categories in which they compete, could have a material adverse effect on our business and financial results.
Furthermore, the broader alcohol industry is experiencing a shift in drinking preferences and behaviors of consumers due to, among others, changing taste preferences, changing demographics, downturns in economic conditions or perceived value, as well as changes in consumers' perception of our brands and the brands of our competitors due to negative publicity, regulatory actions or litigation. There has been more attention focused on health concerns and the harmful consumption of alcoholic beverages, which could result in a change in the social acceptability of beer and other provinces, provincial governmentsalcoholic beverages, which could materially impact the consumption of beer, other alcoholic beverages and, consequently, our sales. If we are reviewing and/or changing this historical foundation as a result of this market evolutionunsuccessful in evolving with, and increased demand by some for government's intervention to remove distribution regulations, including potentialnavigating through, these changes to the markets in which we operate, there could be a material adverse effect on our business and financial results. Specifically, the markets in which we operate have experienced vast expansion in above premium products, specifically in flavored malt beverages (including hard seltzers), ready-to-drink beverages, spirit-based beverages, craft beer, distributioncider, and other similar beverages. If our competitors are able to respond more quickly to the retail systemsevolving trends within those and similar beverage categories, or if our new products in Ontario as discussed below. these categories are not successful, our business and financial results may be adversely impacted.
WeOur products also generally compete generally with other alcoholic beverages. We compete with other beer and alcoholic beverage companies not only for legal age drinker acceptance and loyalty, but also for shelf, cold box and tap space in retail establishments and for marketing focus by our distributors and their customers, all of which also distribute and sell other beers and alcoholic beverage products.
In addition, the broader alcohol industry is experiencing a rapid shift in drinking preferences and behaviors. We believe this has been driven by a generational demographic shift away from beer in particular towards other alcoholic and non-alcoholic beverages. As discussed above, even within the beer industry If we have seen a shift away from the traditionally most popular beer brands and segments and a corresponding expansion in above premium beers, including craft and import beersdo not successfully transform along with the evolving industry and market dynamics and consumer preferences, our business and financial results could be materially adversely affected.
the expansion of hard seltzers, flavored malt beverages, ready to drink malt-based, sugar-based and spirits-based beverages, CBD and other cannabis beverages and other similar beverages. Accordingly, under the revitalization plan we announced in 2019, we are striving to achieve more consistent topline growth by growing our above premium beer offerings, expanding beyond beer and into adjacent alcohol and non-alcohol beverage categories. However, if we are unsuccessful in evolving with, and navigating through, the changes to the markets in which we operate, there could be a material adverse effect on our business and financial results.
Competition in our markets could require us to reduce prices or increase capital and other expenditures or cause us to lose sales volume, any of which could have a material adverse effect on our business and financial results. In many of our markets, our primary competitors may have greater financial, marketing, production and distribution resources than we do, and may be more diverse in terms of their geographies and brand portfolios. Furthermore, our competitors may respond to industry and economic conditions and shifts in consumer behaviors more rapidly or effectively than us. In order for us to remain competitive, we will need to quickly and correctly continue to adopt digital technologies, build analytical capabilities and scale brand expense investment levels, particularly following the coronavirus pandemic, which our competitors may be able to achieve faster and with more resources. In all of the markets in which we operate, aggressive marketing strategies, such as reduced pricing, brand positioning, and increased capital or other investments by these competitors could have a material adverse effect on our business and financial results. In addition, continuing consolidation among major global brewers and between brewers and other beverage companies and convergence of beverage categories may lead to stronger or new competitors, loss of partner brands, negative impacts on our distributor networks, alternate distribution networks and pressures from marketing and pricing tactics by competitors. Further consolidation of distributors in our industry could reduce our ability to promote our brands in the markets in a manner that enhances rather than diminishes our brands' value, as well as reduce our ability to manage our pricing effectively and efficiently. Additionally, due to competition with brewers and other beverage companies, an increase in the purchasing power of our large competitors may cause further pricing pressures which could prevent us from increasing prices to recover higher costs necessary to compete. Such pressures could have a material adverse impact on our business and our financial results and market share. Failure to generate significant cost savings and margin improvement through our ongoing initiatives could adversely affect our profitability. Increased pressures for reduced pricing or difficulties in increasing prices while remaining competitive within our markets, as well as the need for increased capital investment, marketing and other expenditures could result in lower marginsprofitability or loss of market share and volumes. We may also face inflationary pressures that may negatively influence our or our competitors' prices and reduce margins on our products. Moreover, most of our major markets are mature, so growth opportunities may be more limited to us than to our global competitors.competitors who may already be in such markets. For example, net sales in our Americas segment accounted for approximately 83%81% of our total 20212023 net sales. As a result, to the extent that we are unable to maintain or grow our market share in our mature markets, our sales and, in turn, business and financial results could be materially and adversely affected.
Our success as an enterprise currently depends largely on the success of relatively few products in several mature markets specific to the beer industry; if consumer preferences shift away from our products, consumption of our products decline or we are unableability to successfully and timely innovate beyond beer, our business and financial results could be materially adversely affected. Our Coors Light and Miller Lite brands in the U.S., Coors Light, Molson Canadian, Coors Original and Carling brands in Canada, collectively, our brands in the Americas, and Carling, Staropramen, Jelen, Bergenbierand Coors brands in EMEA&APAC represented more than half of each respective segment's sales volumes in 2021. Additionally, several of our brands represent a significant share of their respective market, therefore continued volatility in these markets could disproportionately impact the performance of these brands. Consequently, any material shift in consumer preferences away from these brands, or from the categories in which they compete,inability to deliver new products could have a material adverse effect on our business and financial results. Consumer preferences and tastes may shift away from our brands or beer generally due to, among others, changing taste preferences, demographics, downturn in economic conditions or perceived value, as well as changes in consumers' perception of our brands due to negative publicity, regulatory actions or litigation. Recently, there has been more attention focused on health concerns and the harmful consumption of alcoholic beverages which could result in a change in the social acceptability of beer and other alcoholic beverages which could materially impact the consumption of beer, other alcohol beverages and our sales. Additionally, there has been a shift in consumer preferences within the total beer market away from premium brands to above premium beers, including "craft beer" produced by smaller, regional microbreweries, as well as a shift within the total alcohol beverage market from beer to wine and spirits and continued shifts away from premium brands could impact our future results of operations in the Americas and EMEA&APAC segments. More recently, the rapid growth of hard seltzers in the U.S. may have shifted some consumers away from our brands and premium beer generally. Moreover, several of our major markets are mature and we have a significant share in such markets, therefore, small movements in consumer preference, such as consumer shifts away from premium light brands, can also disproportionately impact our results. Although the ultimate impact is currently unknown, the emergence of legal cannabis in certain states in the U.S. and in Canada may result in a shift of discretionary income away from our products or a change in consumer preferences
away from beer or our other products. As a result, a shift in consumer preferences away from our products or beer or a decline in the consumption of our products could result in a material adverse effect on our business and financial results.
Furthermore, as part of our revitalization plan,Acceleration Plan, our future topline growth will depend, in part, on our ability to timely innovate and develop new products beyond traditional beer. In connection with our revitalization plan,Acceleration Plan, we plan to continue to innovate, test and scale products. In addition, we also rely on certain arrangements with partner brands for innovation, development and growth in new products faster than we have before.beyond beer. However, the launch and ongoing success of new products are inherently uncertain, especially with respect to consumer appeal. The launch of a new product can give rise to a variety of incremental or one-time costs and an unsuccessful launch or short-lived popularity of our product innovations could, among other things, affect consumer perception of our existing brands and our reputation as well as result in inventory write-offs and other costs. In addition, the coronavirus pandemic has altered, and in some cases, delayed product innovation efforts. We were making progress against these ambitions before the impact of the coronavirus pandemic became widespread throughout the markets in our Americas and EMEA&APAC segments. Our inability to attract consumers to our product innovations relative to our competitors’ products, especially over time, could negatively affect our growth, business, and financial results.
The success of our business relies heavily on brand image, reputation, product quality and protection of intellectual property. It is important that we maintain and increase the image and reputation of our existing brands and products. Concerns about product quality, even when unsubstantiated, could be harmful to our image and the reputation of our brands and products. While we have quality control programs in place, in the event we or our third-party manufacturers experience an issue with product quality or if any of our products become unsafe or unfit for consumption, are misbranded or cause injury, we may experience recalls or liability in addition to business disruption which could further negatively impact brand image and reputation, negatively affect our sales and cause us to incur additional costs. A widespread product recall, multiple product recalls or a significant product liability judgment could cause our products to be unavailable for a period, which could further reduce consumer demand and brand equity. Our brand image and reputation may also be more difficult to protect due to less oversight and control as a result of the outsourcing of some of our operations. We also could be exposed to lawsuits relating to product liability, marketing or sales practices or intellectual property infringement. Deterioration to our brand equity may be difficult to combat or reverse and could have a material effect on our business and financial results. In addition, because our brands carry family names or we may partner with celebrities or other famous sponsors, personal activities by certain members of the Molson or Coors families or our promotional partners that harm their public image or reputation could also have an adverse effect on our brands or our Company. Further, our success is dependent on our ability to protect our intellectual property rights, including trademarks, patents, domain names, trade secrets and know-how.We cannot be certain that the steps we have taken to protect our intellectual property rights will be sufficient or that third parties will not infringe upon or misappropriate these rights or that other parties may claim that our brands infringe on their intellectual property rights. If we are unable to protect our intellectual property rights, it could have a material adverse effect on our growth, business and financial results.
Changes in the social acceptability, perceptions and the political view of the beverage categories in which we operate, including alcohol, and cannabis, could adversely affect our business. In recent years, there has been an increase in public and political attention on health and well-being as it relatesthey relate to alcoholic beverages and the alcohol beverage and other categories in which we operate due in part to public concern over alcohol-related social problems, including cannabis. In addition,driving under the alcoholic beverage industry is regularly the subject of anti-alcohol activist activity related to the health concerns from the harmful use of alcohol and concerns regardinginfluence, underage drinking and exposure to alcohol advertisements.advertisements, and health consequences from the harmful use and misuse of alcohol. Negative publicity regarding beeralcoholic beverages and changes in consumer perceptions in relation to beer other alcoholic, CBD, or other cannabinoidalcoholic beverages could adversely affect the sale and consumption of our products, which could in turn, adversely affect our business and financial conditions. The changing legal landscape with respect to cannabis and the lack of consumer market data makes it difficult to predict the pace at which the cannabis market may grow, if at all, and the products that consumers will purchase in the cannabis marketplace.results. Additionally, the concerns around alcohol, CBD and cannabis as well as health and well-being, could result in unfavorable regulations or other legal requirements in certain of our markets in which we operate, such as advertising, selling and other restrictions, increased taxes associated with our sales, or the establishment of minimum unit pricing. Any such regulations or requirements could change consumer and customer purchasing patterns and may require us to incur significant compliance costs, which could negatively impact our business results of operations, cash flows orand financial condition.results. In particular, advocates of prohibition and other severe restrictions on the marketing and sales of alcohol are becoming increasingly organized and coordinated on a global basis, seeking to impose laws or regulations or to bring actions against us, to substantially curtail substantially the consumption of alcohol, including beer, in developed and developing markets. Further, the alcohol industry may be criticized and experience an increase in the number of publications and studies, as well as lobbying efforts, arguing there is no safe level of alcohol consumption. To the extent such views gain traction in regulations of jurisdictions in which we do or plan to do business, they could have a material adverse effect on our business and financial results. For example, in February 2021, the European Union published its Europe Beating Cancer Plan. As part of the plan, by the end of 2023, the European Union willhas indicated it may issue a proposal for mandatory health warnings on alcohol beverage product labels. In addition, Ireland passed a law requiring new health warning labels on our products.
Artificial intelligence presents challenges that can impact our business by posing security risks to confidential or proprietary information and personal data. The use of artificial intelligence, combined with an uncertain regulatory environment, may result in reputational harm, liability, or other adverse consequences to our business operations. Molson Coors may adopt and integrate artificial intelligence tools into our systems for specific use cases after review by legal and information security. Our vendors and third-party partners may incorporate artificial intelligence tools into their offerings with or without disclosing this use to us. The providers of these artificial intelligence tools may not meet existing or rapidly evolving regulatory or industry standards concerning privacy and data protection, which may result in a loss of intellectual property or confidential information and/or cause harm to our reputation and the public perception of the effectiveness of our security measures. Further, bad actors around the world use increasingly sophisticated methods, including the use of artificial intelligence, to engage in illegal activities involving the theft and misuse of personal information, confidential information and intellectual property. Any of these outcomes could damage our reputation, result in the loss of valuable property and information and adversely impact our business.
Weak,Due to a high concentration of workers represented by unions or weakening of, economictrade councils, we could be significantly affected by labor strikes, work stoppages or other negative conditionsemployee-related issues. As of December 31, 2023, approximately 30% and 24% of our Americas and EMEA&APAC workforces, respectively, are represented by trade unions or councils. Stringent labor laws in certain of our key markets expose us to a greater risk of loss should we experience labor disruptions in those markets. From time to time, our collective bargaining agreements come due for renegotiation, and, if we are unable to timely complete negotiations, affected employees may strike, which could have an adverse effect on our business and financial results. Furthermore, there may be additional work stoppages, unionization efforts or other employee-related issues, either prior to or following the markets inexpiration of these agreements, each of which we docould significantly affect our business including reductions in discretionary consumer spending,and financial results. A prolonged labor strike, work stoppage, unionization efforts or other employee-related issues could have a material adverse effect on our business and financial results. Beer consumption For example, in manythe first few months of 2021, we experienced a labor disruption with our markets is closely tied to general economic conditions and a significant portionToronto brewery unionized employees resulting from on going negotiations of our portfolio consiststhe collective bargaining agreement which resulted in slightly slower than expected production at the Toronto brewery in the first few months of premium and above premium brands. Difficult macroeconomic conditions2021. In addition, at the end of March through mid-June 2022, approximately 400 unionized employees in our markets, such as further decreases in per capita incomeMontreal/Longueuil, Québec brewery and level of disposable income driven by increases to inflation, income (and other) taxes, the
cost of living, increased and prolonged continued unemployment or a further decline in consumer confidence, in each case, as a result of the coronavirus pandemic or otherwise, as well as limited or significantly reduced points of access of our product, political or economic instability or other country-specific factors could continue to have a material adverse effectdistribution centers went on the demand for our products. For example, a trend towards value brands in certain of our markets or deterioration of the current economic conditions could result in a material adverse effect onstrike, which adversely affected our business, operations and financial results. A significant portionresults during the second and third quarters of 2022. Furthermore, on February 17, 2024, the Teamsters Local 997 initiated a strike at our consolidated net sales are concentratedFort Worth, Texas brewery in the U.S., Canada We have contingency plans in place designed to mitigate the potential financial impact and countries in Europe,we remain committed to reaching an agreement that is fair to both our employees and accordingly representto the majority of net sales within our Americas and EMEA&APAC segments, respectively. Therefore, unfavorable macroeconomic conditions, such as a recession or continued slowed economic growth, in the U.S., Canada or countries in Europe could negatively affect consumer demand for our product in these important markets, which consequently, may negatively affect the results of operations in our Americas and EMEA&APAC segments. Under difficult economic conditions, consumers may seek to reduce discretionary spending by forgoing purchases of our products, by shifting away from our above premium products to lower-priced products offered by us or other companies or by shifting to off-premise from on-premise consumption, negatively impacting our net sales and margins. Softer consumer demand for our products could reduce our profitability and could negatively affect our overall financial performance.
In addition, global markets continue to face threats and uncertainty. Future changes to U.S. or foreign tax and trade, policies, impositions of new or increased tariffs, other trade restrictions or other government actions, including any government shutdown, foreign currency fluctuations, including devaluations and fear of exposure to or actual impacts of a widespread disease outbreak, such as the coronavirus pandemic, may lead to continuation of such risks and uncertainty. Uncertain economic and financial market conditions may also adversely affect the financial condition of our customers, suppliers and other business partners. Any significant decrease in consumers' purchases of our products or our inability to collect accounts receivable, resulting from an adverse impact of the global markets on consumers' financial condition could have a material adverse effect on our business, financial condition and results of operations.Fort Worth brewery.
ESG issues and regulations, including those related to climate change and sustainability, and stakeholder response thereto may have an adverse effect on our business, financial condition and results of operations and damage our reputation. Companies across all industries are facing increasing scrutiny relating to their ESG practices and policies. The landscape related to ESG regulation, compliance, and reporting is constantly evolving, including expanding in scope and complexity. For example, the SEC, the State of California, and the European Commission have published proposed or final rules, including the European Commission's Corporate Sustainability Reporting Directive, that would require significantly increased disclosures related to climate change and other issues. We may experience significant future cost increases associated with regulatory compliance for ESG matters, including fees, licenses, reporting, and the cost of capital improvements for our operating facilities to meet environmental regulatory requirements. Increased focus and activism related to ESG may hinder our access to capital or negatively impact our stock price, as investors may reconsider their capital investment as a result ofbased on their assessment of our ESG practices.practices and policies. In particular, investor advocacy groups, institutional investors, other market participants, stockholders, employees, consumers, customers, regulators, proxy advisory services and customersother market participants have increasingly focused on ESG practices and policies of companies, including sustainability performance and risk mitigation efforts.companies. These stakeholders have placed increased importance on ESG practices and their effect on companies from an investor, consumer, customer or employee perspective. If our ESG practices do not meet investor or other stakeholder expectations and standards which continue to evolve,or evolving regulatory requirements, our stock price, brand, sales, ability to access capital markets, reputation and employee retention, among other things, may be negatively affected.
In addition, as part of our Company's Our Imprint 2025 strategy, we have published goals across a range of ESG areas, including alcohol responsibility, environmental sustainability, greenhouse gas emissions, and DEIdiversity, equity and inclusion ("DEI") matters. If we do not adapt to or comply with, new ESG regulations, including climate change and related ESG disclosure requirements, or fail to meet the ESG goals under Our Imprint 2025 strategy or evolving investor, industry or stakeholder expectations and standards, or if we are perceived (whether or not valid) to have not responded appropriately to the growing concern for ESG issues, customers and consumers may choose to stop purchasing our products or purchase products from another company or a competitor, and our reputation, business or financial condition may be adversely affected. Although we intend to meet these goals, we may be required to expend significant resources to do so, which could increase our operational costs. In addition, we could be criticized for the scope or nature of these goals, or for any revisions to our goals. Moreover, we may determine that it is in the best interest of our Company and our stockholders to prioritize other business, social, governance or sustainable investments over the achievement of our current goals based on economic, technological developments, regulatory and social factors, business strategy or pressure from investors, activist groups or other stakeholders. If we are unabledo not adapt to or comply with new ESG regulations, such as those related to climate change, carbon emissions and related ESG disclosure requirements, or fail to meet these commitments, thenthe ESG goals under Our Imprint 2025 strategy or evolving investor, industry or stakeholder expectations and standards, or if we couldare perceived (whether or not valid) to have not responded appropriately to the growing and various concerns for ESG issues, customers and consumers may choose to stop purchasing our products or purchase products from a competitor, and our reputation, business or financial results may be adversely affected. Further, if we incur adverse publicity and reaction from investors, activist groups or other
stakeholders which could adversely impactrelated to our ESG efforts and goals, the perception of us and our products and services by current and potential customers, as well as investors, could be adversely impacted which could in turn adversely impact our results of operations.business and financial results.
Climate change and other weather events may negatively affect our business and financial results. There is concern that a gradualthe continuing increase in global average temperatures could cause significant changes in global weather patterns and an increase in the frequency and severity of natural disasters. Global climate change is expected tocould have various impacts on our operations, ranging from more frequent extreme weather events to extensive governmental policy developments, and shifts in consumer preferences, which have the potential individually or collectively to significantly disrupt our business as well as negatively affect our suppliers, supply chain and customers. Changing weather patterns and more volatile weather conditions could result in decreased agricultural productivity in certain regions that may impact quality, limit availability or increase the cost of key agricultural commodities, such as hops, barley and other cereal grains, which are important ingredients for our products. Increased frequency or duration of extreme weather conditions, including power disruptions and/or water availability implications due to the foregoing,
could also impair production capabilities, disrupt our supply chain, distribution networks and routes to market, or impact demand for our products, any of which may cause us to experience additional costs to maintain or resume operations.
Public concern over climate change has resulted in, and may continue to result in, new or increased regional, federal and global legal and regulatory requirements, including taxation, to reduce or mitigate carbon emissions and to limit or impose additional costs on carbon and water usage or other climate-related objectives. In the event that such regulation is more stringent than current regulatory obligations, or the measures that we are currently undertaking to monitor and improve our resource efficiency, we may experience disruptions in, or increases in our costs of, operation and delivery to comply with new regulatory requirements due to investments in facilities and equipment or the relocation of our facilities. If we or our suppliers are required to comply with these laws and regulations, or if we choose to take additional voluntary steps to reduce or mitigate our impact on the climate, we may experience increased costs for energy, production, transportation, and raw materials, increased capital expenditures, or increased insurance premiums and deductibles, each of which could adversely impact our operations. In particular, proposed, new or inconsistent regulation and taxation of fuel and energy could increase the cost of complying with such laws and regulations as well as the cost of operation, including fuel required to operate our facilities or transport and distribute our products, thereby increasing the distribution and supply chain costs associated with our products.
There Any assessment of the potential impact of future climate change legislation, regulations or industry standards, as well as any international treaties and accords, is also increased focus, including by governmental and non-governmental organizations, investors, customers and consumers on environmental sustainability matters, such as packaging waste, climate impact and water use. Our reputation could be damaged ifuncertain given the wide scope of potential regulatory change in the countries in which we or others in our industry do not act, or are perceived not to act, responsibly with respect to our impact on the environment. Any failure to achieve our enterprise-wide sustainability goals, or perception (whether or not valid) of our failure to act responsibly, or to effectively respond to new, or changes in, environmental, legal or regulatory requirements could adversely affect our business, reputation or financial condition.operate.
Beyond the commercial pressures implicated by climate change concerns, our operations may face potential adverse physical effects. For example, we have a major brewery in the state of Colorado, which has recently experienced several majorsignificant wildfires in 2022, and we have another major brewery in Texas, which experienced a severe winter weather event in 2021. If any of these or other of our properties and production facilities were to experience a significant operational disruption or catastrophic loss due to natural disasters or severe weather events, it could delay or disrupt production, shipments, and revenue, and result in potentially significant expenses to repair or replace these properties.properties, which may negatively affect our business and financial results.
An inadequate supply or availability of quality water could have a material adverse effect on, among other things, our sales, production processes, other costs and, in turn, profitability. Quality water is a key ingredient in our brewing process. Clean water is a limited resource in many parts of the world and climate change may increase water scarcity and cause a deterioration of water quality in areas where we maintain brewing operations. The competition for water among domestic, agricultural and manufacturing users is increasing in some of our brewing communities and communities in which we or our suppliers manufacture our other products. Even where water is widely available, water purification, regulatory requirements, and waste treatment infrastructure limitations could increase costs or constrain our operations. Further, unavailability of clean water at our breweries or our other facilities or the facilities of our suppliers could limit our ability to brew, which could cause a decrease in production.
We have substantial brewery operations in the states of Colorado and Texas, which have been areas vulnerable to water scarcity conditions. Certain western states in the U.S. states are experiencing an extended period of drought, which can impact the quality and quantity of agricultural ingredients such as barley and hops, and ahops. The continuation or recurrence of such conditions could have an adverse effect upon our agricultural supply chain. We and our suppliers are dependent on sufficient amounts of quality water for operation of our breweries and key facilities and the key facilities of our significant suppliers. The suppliers of the agricultural raw materials we purchase are also dependent upon sufficient supplies of quality water for their fields. A substantial reduction in water in certain agricultural areas could result in material losses of crops, such as barley or hops, which could lead to a shortage of our product supply. If water available to our operations or the operations of our suppliers becomes scarce or the quality of that water deteriorates, we may incur increased production costs that we are unable or choose not to pass along to distributors through increased prices, or face production constraints.
Loss, operational disruptions or closure of a major brewery or other key facility, including those of our suppliers, due to unforeseen or catastrophic events or otherwise,constraints, which could have a material adverse effect onadversely affect our business and financial results.
We depend on key personnel, the loss of whom could harm our business, and labor shortages, employee turnover and wage increases could significantly impact our operations. The loss of the services and expertise of any key employee, or multiple members of senior management at the same time, could harm our business. Our business could be interruptedfuture success depends on our ability to identify, attract and our financial results could be materially adversely impacted by physical risks such as earthquakes, fires, hurricanes, floods, acts of war, terror attacks, cyber-attacks and other disruptions in information technology systems, including the March 2021 cybersecurity incident discussed in more detail below, disease outbreaks or pandemics, such as the ongoing coronavirus pandemic, and other natural disasters or catastrophic events that damage, disrupt or destroy one of our breweries or key facilities or the key facilities of our significant suppliers. Climate change and warmer global temperatures may also increase the intensity and frequency of these extreme weather events.retain qualified personnel on a timely basis. If any of our breweries or key facilities or the key facilities of our significant supplierswe were to experience turnover of any key employee or multiple members of senior management at the same time, or if a significant operational disruptionmember or catastrophic loss, it could delaymembers of our senior management were to become ill or disrupt production, shipments and revenue, and result in potentially significant expenses to repair or replace these properties. Such significant disruptions could be due to, among other things, the loss or disruption of the timely availability of adequate supplies of essential raw materials, including as a result of cyber-attacks and other disruptions in information technology systems; illness toincapacitated, our respective employees or their families or governmental restrictions on such employees' ability to travel or perform necessary business functions or as a result of the need for us orstock price, our suppliers to operate our respective businesses with substantial modifications to employee travel and employee work locations; transportation and logistics challenges, including as a result of port and border closures and other governmental restrictions and the availability and capacity of shipping channels as customers may shift to increased online shopping; and the loss or disruption of other manufacturing, distribution and supply capabilities. Recently, we experienced certain of the foregoing risks and losses in connection with the March 2021 cybersecurity incident. Additionally, certain catastrophes are not covered by our general insurance policies, which could result in significant unrecoverable losses. Furthermore, our business and results of operations, our commercial and supply chain operations and our vendor or customer relationships could each be adversely impacted by under-investment in physical assets or production capacity, including contract brewing and effect on prioritysuch events may make recruiting for future management positions more difficult. The labor market for many of our brands if production capacityemployees is limited. Further, significant excess capacity at anyvery competitive, and wages and compensation costs continue to increase. Our ability to attract and retain key talent has been, and may continue to be, impacted by challenges in the labor market, which has recently been experiencing wage inflation, labor shortages, and a continued shift toward remote work. In addition, labor costs are rising and our industry is experiencing a shortage of our breweriesqualified workers. If we face labor shortages and/or increased labor costs as a result of increased efficienciescompetition for employees, higher employee turnover rates, or increases in employee benefits costs, our operating expenses could increase, which could negatively impact our growth and results of operations. Labor shortages, higher employee turnover rates and labor union organizing efforts could also lead to disruptions in our supply chain process or continued volume declines, could result in under-utilization of our assets, which could lead to excess overhead expenses or additional costs incurred associated with the closure of one or more of our facilities. For example,business, as part of a strategic review of our supply chain network, certain breweries and bottling lines were closed in recent years, and we have incurred brewery closure costs, including charges associated with the planned closure of the Irwindale brewery in 2020, which was subsequently sold to Pabst Brewing Company, LLC, in the fourth quarter of 2020. We regularly review our supply chain network to ensure that our supply chain capacity is aligned with the needs of the business. Such reviews could potentially result in further closures and the related costs could be material.
discussed above. In addition, we have experienced minor temporary workforce disruptions inmust successfully integrate any new management personnel that we hire within our supply chainorganization, or who join our organization as a result of the coronavirus pandemic. We have implemented employee safety measures, based on guidance from the Centers for Disease Controlan acquisition, in order to achieve our operating objectives, and Prevention, the Occupational Safety and Health Administration and World Health Organization, across all our supply chain facilities, including proper hygiene, social distancing and mask use. These measureschanges in other key management positions may not be sufficient to prevent the spread of the coronavirus among our employees and illness, travel restrictions, absenteeism or other workforce disruptions could negativelytemporarily affect our supply chain, manufacturing, distribution or other business processes. We may face additional production disruptions in the future which may place constraints on our ability to produce products in a timely manner or may increase our costs. For instance, if a government or other regulatory authority were to impose mandatory vaccination or testing requirements, this could significantly increase our costsfinancial performance and could cause significant workforce disruptions and negatively impact our hiring and retentionresults of employees, all of which could negatively affect our supply chain, manufacturing, distribution or other business processes.
Due to a high concentration of workers represented by unions or trade councils in our Americas and EMEA&APAC segments, we could be significantly affected by labor strikes, work stoppages or other employee-related issues. As of December 31, 2021, approximately 32% and 26% of our Americas and EMEA&APAC workforces, respectively, are represented by trade unions or councils. Stringent labor laws in certain of our key markets expose us to a greater risk of loss should we experience labor disruptions in those markets. A prolonged labor strike, work stoppage or other employee-related issue, could have a material adverse effect on our business and financial results. For example, in the first few months of 2021, we experienced a labor disruptionoperations as new management becomes familiar with our Toronto brewery unionized employees resulting from on-going negotiations of the collective bargaining agreement. This labor disruption resulted in slightly slower than expected production at the Toronto brewery in the first few months of 2021. From time to time, our collective bargaining agreements come due for renegotiation, and, if we are unable to timely complete negotiations, affected employees may strike, which could have an adverse effect on our business and financial results. For example, in late 2021 and 2022 we have been negotiating collective bargaining agreements with our Québec unionized sales, distribution and brewery employees. Although we believe that our relations with the labor unions that represent our Québec employees are generally good, no assurance can be made that we will successfully negotiate those agreements and unsuccessful negotiations may affect our business and operations. If a strike or lockout were to occur, it could have an adverse effect on our business and financial results.business.
Because of our reliance on third-party service providers and internal and outsourced systems for our information technology and certain other administrative functions, we could experience a disruption to our business. We rely
extensively on information services providers worldwide for our information technology functions including network, help desk, hardware and software configuration. Additionally, we rely on internal networks and information systems and other technology, including the internet and third-party hosted services, to support a variety of business processes and activities, including procurement and supply chain, manufacturing, distribution, invoicing and collection of payments. We use information systems for certain human resource activities and to process our employee benefits, as well as to process financial information for internal and external reporting purposes and to comply with various reporting, legal and tax requirements. As information systems are critical to many of our operating activities, our business may be impacted by system shutdowns, service disruptions, obsolescence, or security threats or breaches. Furthermore, the importance of such information technology systems and networks and systems has increased due to many of our employees working remotely as a result of the coronavirus pandemic.our changing workplace dynamics. Additionally, if oneany of our significant service providers were to fail and we were unable to find a suitable replacement in a timely manner, we could be unable to properly administer our outsourced functions.
A breach of our information systems could cause material financial or reputational harm. Our information systems may be the target of cyber-attacks or other security breaches, which, if successful, could, among other things, cause a disruption to our operations, expose us to the loss of key business, employee, customer or vendor information, cause us to breach our legal, regulatory or contractual obligations, generate a disruption in the continuity of our business applications and services, create an inability to access or rely upon critical business records, cause reputational damage, or impact the costs or ability to obtain adequate insurance coverage. These breaches may result from human errors, equipment failure, or fraud or malice on the part of employees or third parties. A breach of our information systems, including the March 2021 cybersecurity incident disclosed in Part II - Item 7. Management's Discussion and Analysis of Financial Condition and Results of Operation in this report, could subject us to litigation, including class action or derivative lawsuits regulatory fines, and penalties, any offunctions, which could have a significant negative impact on our cash flows, competitive position, reputation, financial condition or results of operation. If our information systems suffer outages we could experience delays and disruptions in our business, including brewery operations, production and shipments, such as those we experienced with the March 2021 cybersecurity incident. In addition, if our information systems suffer severe damage, disruption or shutdown, such as those we experienced with the March 2021 cybersecurity incident, we could experience delays in reporting our financial results, and we may lose revenue and profits as a result of our inability to timely invoice and collect payments from customers. We have seen an increase in the number of such attacks recently as a large number of our employees are working remotely and accessing our technology infrastructure remotely as a result of the coronavirus pandemic. In addition, the March 2021 cybersecurity incident may embolden other individuals or groups to target our information systems and impact the costs or ability for us to obtain adequate insurance coverages moving forward. Further, such attacks may originate from nation states or attempts by outside parties, hackers, criminal organizations or other threat actors.We expend significant financial resources to protect against threats and cyber-attacks and may be required to further expend financial resources to alleviate problems caused by physical, electronic and cyber security breaches, including the potential for increased ongoing expense related to the March 2021 cybersecurity incident and to address possible increased information system attacks as a result of the incident. As techniques used to breach security are growing in frequency and sophistication and are generally not recognized until launched against a target, regardless of our expenditures and protection efforts, we may not be able to implement security measures in a timely manner or, if and when implemented, these measures could be circumvented. We could also be required to spend significant financial and other resources to remedy the damage caused by a security breach or to repair or replace networks and information systems, which could have a material adverse effect ondisrupt our business and adversely affect our financial results. For example, we incurred certain incremental one-time costs of $2.4 million in the year ended December 31, 2021 related to consultants, experts and data recovery efforts, net of insurance recoveries.
Misuse, leakage or falsification of information could result in a violation of data privacy laws and regulations, including but not limited to, the European Union's General Data Protection Regulation, California Privacy Rights Act, which will take effect on January 1, 2023, or the Virginia Consumer Data Protection Act, which will take effect on January 1, 2023, damage our reputation and credibility or expose us to increased risk of lawsuits, loss of existing or potential future customers and/or increases in our security costs, any of which could have a material adverse effect on our business and financial results. In addition, we may suffer financial and reputational damage because of lost or misappropriated confidential information and may become subject to legal action and increased regulatory oversight or consumers may avoid our brands due to negative publicity. In the event of a breach resulting in loss of data, such as personally identifiable information or other such data protected by data privacy or other laws, we may be liable for damages, fines and penalties for such losses under applicable regulatory frameworks despite not handling the data. Further, the regulatory framework around data custody, data privacy and breaches varies by jurisdiction and is an evolving area of law. We may not be able to limit our liability or damages in the event of such a loss.
Poor investment performance of pension plan holdings and other factors impacting pension plan costs and contributions could unfavorably affect our business, liquidity and our financial results. Our costs of providing defined benefit pension plans are dependent upon a number of factors, such as the rates of return on the plans' assets, discount rates, the level of interest rates used to measure the required minimum funding levels of the plans, exchange rate fluctuations, government regulation, court
rulings or other changes in legal requirements, global equity prices, and our required and/or voluntary contributions to the plans. WhileAlthough we comply with the minimum funding requirements, we have certain qualified pension plans with obligations which exceed the value of the plans' assets. These funding requirements also may require contributions even when there is no reported deficit. Without sustained growth in the pension investments over time to increase the value of the plans' assets, and depending upon the other factors as listed above, we could be required to fund the plans with significant amounts of cash. Such cash funding obligations (or the timing of such contributions) could have a material adverse effect on our cash flows, credit rating, cost of borrowing, financial position and/or results of operations.
We depend on key personnel, the loss of whom could harm our business. The loss of the services and expertise of any key employee could harm our business. Our future success depends on our ability to identify, attract and retain qualified personnel on a timely basis. If we were to experience turnover of senior management or if a member of our senior management were to become ill or incapacitated, our stock price, our results of operations, our commercial and supply chain operations and our vendor or customer relationships could each be adversely impacted and such events may make recruiting for future management positions more difficult. In addition, we must successfully integrate any new management personnel that we hire within our organization, or who join our organization as a result of an acquisition, in order to achieve our operating objectives, and changes in other key management positions may temporarily affect our financial performance and results of operations as new management becomes familiar with our business.
Risks Related to Our Indebtedness, Capital Structure and Financial Condition
Our significant debt level subjects us to financial and operating risks, and the agreements governing such debt subject us to financial and operating covenants and restrictions. Our indebtedness subjects us to various financial and operating covenants, including, but not limited to, restrictions on priority indebtedness, leverage thresholds, liens, certain types of secured debt and certain types of sale lease-back transactions and transfers of assets, each of which may limit our flexibility in responding to our business needs. If we are not able to maintain compliance with stated financial covenants or if we breach other covenants in any debt agreement, we could be in default under such agreement or trigger a cross-default of other debt instruments. Such a default would adversely affect our credit ratings, may allow our creditors to accelerate the related indebtedness, and may result in the acceleration of any other indebtedness to which a cross-acceleration or cross-default provision applies.
Our significantcurrent and future debt levellevels and the terms of such debt could, among other things:
•make it more difficult to satisfy our obligations under the terms of our indebtedness;
•limit our ability to refinance our indebtedness on terms acceptable to us, or at all;all, or obtain additional financing for working capital, capital expenditures, strategic opportunities, including acquisitions or other investments, to fund growth or for general corporate purposes, even when necessary to maintain adequate liquidity;
•limit our flexibility to plan for and adjust to changing business and market conditions, including successfully execute our revitalization plan,Acceleration Plan, and increase our vulnerability to general adverse economic and industry conditions, such as the current economic climate caused by the coronavirus pandemic;conditions;
•require us to make unfavorable changes to our current financing structure;
•structure or require us to dedicate a substantial portion of our cash flow to make interest and principal payments on our debt, thereby limiting the availability of our cash flow to fund futurestrategic opportunities, including acquisitions or other investments, working capital, business activities, and other general corporate requirements;
•limit our ability to obtain additional financing for working capital, capital expenditures, strategic opportunities, including acquisitions or other investments, to fund growth or for general corporate purposes, even when necessary to maintain adequate liquidity, particularly if any ratings assigned to our debt securities by rating organizations were revised downward; and
•adversely impact our competitive position in the industry.
In addition, certain of our current and future debt and derivative financial instruments have or, in the future, could have interest rates that are tied to reference interest rates. The volatility and availability of such reference rates are out of our control. Accordingly, changes to orcontrol and the unavailability of such rates, could result in increases to the cost of debt which would negatively affect our profitability. For example, in March 2021, the U.K.’s Financial Conduct Authority announced that after 2021 it would no longer persuade or compel panel banks to submit the rates required to calculate LIBOR with the exception of the majority of U.S. dollar LIBOR tenors ceasing at the end of June 2023. Regulators, industry groups and certain committees such as the Alternative Reference Rates Committee ("ARRC") have, among other things, published recommended fallback language for LIBOR-linked financial instruments and identified recommended alternatives for certain LIBOR rates, such as the Secured Overnight Financing Rate ("SOFR") as a more robust reference rate alternative to USD LIBOR. SOFR is calculated based on short-term repurchase agreements, backed by Treasury securities. SOFR is observed and backward looking, which stands in contrast with LIBOR under the current methodology, which is an estimated forward-looking rate and relies, to some degree, on
the expert judgment of submitting panel members. Given that SOFR is a secured rate backed by government securities, it is a rate that does not take into account bank credit risk, as is the case with LIBOR. SOFR is therefore likely to be lower than LIBOR and is less likely to correlate with the funding costs of financial institutions. Because of these and other differences, there is no assurance that SOFR will perform the same way as LIBOR would have performed at any time, and there is no guarantee that it is a comparable substitute for LIBOR. Whether or not SOFR attains market traction as a LIBOR replacement tool remains in question.
However, the consequences of the adoption of any such alternative reference rates such as SOFR cannot be predicted andrisks related thereto could have ana material adverse impacteffect on the amount of interest and commitment fees that we pay under our credit facility. Likewise, the unavailability of LIBOR may have an adverse impact on interest rates and other financing costs under other debt instruments and other financial obligations of ours, as well as the market value of and the payments we receive under any LIBOR-linked securities or investments that we may own from time to time. In addition, financial markets generally may be adversely affected by the discontinuation of LIBOR, the uncertainties regarding its discontinuation, the alternative reference rates that are being or may be used in place of LIBOR and other issues related to LIBOR. Any of the foregoing could adversely affect our results of operations and financial condition. Any such discontinuance, modification, alternative reference rates or other reforms may cause our borrowing costs to increase, which would negatively affect our profitability, and the attractiveness of borrowings under our current credit facility or future debt issuances could diminish, thereby limiting our access to capital.us.
A deterioration in our credit rating could increase our borrowing rates or have an adverse effect on our ability to obtain future financing or refinance current debt. Ratings agencies may downgrade our credit ratings below their current investment grade levels if we are, or are at risk of being, unable to meet our deleveraging commitments. WhileAlthough we have publicly expressed our intention to maintain an investment grade debt rating, ratings are determined by third-party rating agencies and in some cases the events that may cause us to suffer a ratings downgrade are unpredictable and outside of our control, such as the economicmacroeconomic climate caused by the coronavirus pandemic and its impact on our business.or political instability. A credit ratings downgrade, particularly a downgrade below investment grade, could increase our costs of future borrowing, negatively impact our hedging instruments or sources of short-term liquidity and harm our ability to refinance our debt in the future on acceptable terms or access the capital markets. Deterioration of our credit rating may also raise governance issues within the Company and with external regulators.
Default by, or failure of, one or more of our counterparty financial institutions could cause us to incur significant losses. As part of our risk management activities, we enter into transactions involving derivative financial instruments, including, among others, forward contracts, commodity swap contracts and option contracts, with various financial institutions. In addition, we have significant amounts of cash and cash equivalents on deposit or in accounts with banks or other financial institutions in the U.S. and abroad. As a result, we are exposed to the risk of default by, or failure of, counterparty financial institutions. The risk of counterparty default or failure may be heightened during economic downturns and periods of uncertainty in the financial markets, including as a result of the coronavirus pandemic.markets. If one of our counterparties were to become insolvent or file for bankruptcy, our ability to recover losses incurred as a result of default or to retrieve our assets that are deposited or held in accounts with such counterparty may be limited by the counterparty's liquidity or the applicable laws governing the insolvency or bankruptcy proceedings.
Our operations face significant exposure to changes in commodity and other input prices, which could materially and adversely affect our business and financial results. We use a large volume of agricultural and other raw materials, some of which are purchased through supply contracts with third parties, to produce our products, including barley, malted barley, hops, corn, other various starches, water and packaging materials, including aluminum cans and bottles, glass and polyethylene terephthalate containers, as well as, cardboard and other paper products. We also use a significant amount of diesel fuel, natural gas and electricity in our operations. The supply and price of these raw materials and commodities can be affected by a number of factors beyond our control, including market demand, alternative sources for suppliers, global geopolitical events (especially as to their impact on crude oil prices and the resulting impact on diesel fuel prices), global disease outbreaks or pandemics, such as the coronavirus pandemic, trade agreements among producing and consuming nations, governmental regulations, including tariffs, frosts, droughts and other weather conditions, changes in precipitation patterns, the frequency of extreme weather events, economic factors affecting growth decisions, inflation, plant diseases, theft and industry surcharges and other practices. For example, in June 2018, U.S. tariffs on aluminum imports from Canada, Mexico and EU went into effect (though the U.S. lifted the aluminum tariffs on Canada and Mexico in May 2019), which has created volatility in the price of aluminum in the U.S. and increased the price of aluminum used in some of our product packaging. In addition, in the U.S., we are exposed to variability in the market price of a regional premium differential (referred to as “Midwest Premium”) charged by industry participants to deliver aluminum from the smelter to the manufacturing facility. This premium differential also fluctuates in relation to several conditions, including based on the supply of and demand for aluminum in a particular region, associated transportation costs and warehouse financing transactions, which limit the amount of physical aluminum available to consumers and increases the price differential as a result. During times of greater volatility in the Midwest Premium, the variability in our cost of goods sold can also increase. In addition to impacting the price we pay for the raw materials we purchase, changing premium differentials impact our end consumers as we must either pass on the increased cost to those consumers or experience
a decrease in our profit margins as a result of the Midwest Premium differential. Increases in the Midwest Premium, or the inability to pass through any fluctuation in aluminum prices or regional premiums to our end consumers, could have a material adverse effect on our business, financial condition, results of operations and cash flow.
Further, despite our ability to source raw materials necessary to meet demand for our products, certain raw materials such as barely, malted barley, hops, corn, other various starches, water and packaging materials, including aluminum cans and, bottles, glass and polyethylene terephthalate containers, as well as cardboard and other paper products, have been adversely impacted by the coronavirus pandemic. In 2020, we experienced a shift in the allocation among different packaging types toward aluminum cans and bottles and away from glass bottles. This accelerated in 2020 and continued in 2021 due to the coronavirus pandemic where we observed a shift in volume to off-premise channels and aluminum cans and away from on-premise channels and glass bottles. In 2021, with the reopening of the on-premise channels, we have seen a shift in volume back to the on-premise channels and glass bottles, which led to tightness in glass bottles supplies. The shifting consumption patterns between off-premise and on-premise, and the corresponding shift between aluminum and glass bottle packaging could result in supply shortages, higher costs and out-of-stocks, which could adversely impact sales and profitability. In Canada, the standard returnable bottle requires significant investment behind our returnable bottle inventory and bottling equipment. We distribute our products and receive raw materials primarily by rail or truck. Reduced availability of rail or trucking capacity has caused, and could continue to cause, us to incur unanticipated expenses. In particular, reduced trucking capacity due to shortages of drivers, as a result of the coronavirus pandemic in general and in Europe specifically due to the U.K.'s departure from the European Union, and a federal regulation requiring drivers to electronically log their driving hours, among other reasons, have caused an increase in the cost of transportation for us and our suppliers. We believe commodity and other cost increases and volatility especially due to the coronavirus pandemic, and inflationary pressures could continue in the future. If such increases occur or exceed our estimates or projections and we are not able to increase the prices of our products or achieve cost savings to offset such cost increases, our business, financial condition and results of operations would be harmed. In addition, even if we increase the prices of our products in response to increases in the cost of commodities or other cost increases, we may not be able to sustain our price increases. Sustained price increases may lead to declines in volume as competitors may not adjust their prices or consumers may decide not to pay the higher prices, which could lead to sales declines and loss of market share, and our projections may not accurately predict the volume impact of price increases, which could adversely affect our business, financial condition and results of operations. Furthermore, to the extent any of the foregoing factors affect the availability or prices of ingredients or packaging or our hedging arrangements do not effectively or completely hedge changes in commodity price risks, including cost inflation, and we are not able to pass these increased costs along to customers, our business and financial results could also be materially adversely impacted.
Our operations are dependent on the global supply chain and impacts of supply chain constraints and inflationary pressure could adversely impact our operating results. Our businesses have been, and may continue to be, impacted by supply chain constraints, raw materials and ingredient shortages, resulting in inflationary pressure on material costs, longer lead times, port congestion and increased freight costs caused, in part, by the coronavirus pandemic and the uncertain economic environment. In addition, current or future governmental policies may increase the risk of inflation, which could further increase the costs of raw materials and other components for our businesses. Similarly, if costs of goods continue to increase, our suppliers may seek price increases from us. If we are unable to mitigate the impact of supply chain constraints and inflationary pressure through price increases or other measures, our results of operations and financial condition could be negatively impacted. Even if we are able to raise the prices of our products, consumers might react negatively to such price increases, which could have a material adverse effect on, among other things, our brand, reputation and sales. If our competitors maintain or substantially lower their prices, we may lose customers and mark down prices. Our profitability may be impacted by prices that do not offset the inflationary pressures, which may impact gross margins. Even though our businesses are working to alleviate supply chain constraints through various measures, such as sourcing from additional suppliers and using alternative delivery methods or materials, we are unable to predict the impact of these constraints on the timing of revenue and operating costs of our business in the near future. Packaging material supply shortages and supply chain constraints, including cost inflation, have impacted and could continue to negatively impact our ability to meet increased demand in off-premise channels or particular packages, particularly aluminum cans, which in turn could impact our net sales and market share. In addition, in 2021, shortages of raw materials and disruption to the global supply chain negatively impacted sales, costs and inventory availability and may continue to have a negative impact on future results and profitability.
For example, we are experiencing higher transportation costs and input costs. Higher transportation costs are a result of increased fuel prices, a short supply of truckers worldwide and increased freight costs. Driver shortages are forcing us to use the spot market and to pay spot market prices which are higher than they have been in many years. We are also taking steps to reduce the impact of driver shortages by shipping more beverages on rail. Besides impacting our outbound shipments, our suppliers are facing difficulty in timely delivering the materials we need and we are also experiencing increased supply costs due to overall cost inflation. The volatility of aluminum prices, inclusive of Midwest Premium and tariffs, continued to significantly impact our results during the year ended December 31, 2021. To the extent these prices continue to fluctuate, our business and financial results could be materially adversely impacted.
We may incur impairments of the carrying value of our goodwill and other intangible assets which could have a material adverse effect on our business and financial results. In connection with various business combinations, we have historically allocated material amounts of the related purchase prices to goodwill and other intangible assets that are considered to have indefinite useful lives. For example, as a result of theour acquisition in October 2016 of the remaining portion of MillerCoors LLC ("MillerCoors") which occurred on October 11, 2016 (the "Acquisition"(which we refer to as the "MillerCoors Acquisition"), we allocated approximately $6.3 billion and $7.6 billion to goodwill and indefinite-lived intangible assets, respectively. These assets are tested for impairment at least annually, using estimates and assumptions affected by factors such as economic and industry conditions and changes in operating performance. Additionally, in conjunction with the brand impairment tests, we also reassess each brand's indefinite-life classification. Potential resulting charges from an impairment of goodwill or brand intangible, as well as reclassification of an indefinite-lived to a definite-lived brand intangible, could have a material adverse effect on our results of operations. For example, the results of our 20202022 annual goodwill impairment testing completed as of October 1, 2020, indicated that the fair value of our EMEA&APACAmericas reporting unit was below its carrying value. As a result, we recorded ana partial impairment charge of approximately $1.5 billion recorded$845.0 million within special items, net,goodwill impairment, in our consolidated statements of operations during the fourth quarter of 2020.2022. As of the year ended December 31, 2020,2023, the EMEA&APAC reporting unit was fully impaired. Additionally, we identified a triggering event requiring an interim impairment assessment ofimpaired while the goodwill within our historical CanadaAmericas reporting unit at the endhad $5.3 billion of the third quarter of 2019, which resulted in a goodwill impairment loss of $668.3 million recorded within special items, net, in our consolidated statements of operations during the third quarter of 2019.remaining.
Additionally, ourOur most recent impairment analysis, conducted as of October 1, 2021,2023, the first day of our fiscal fourth quarter, indicated that the faircarrying value of the Americas reporting unit Staropramen family of brands indefinite-lived intangible asset was estimated at less than 10%determined to be in excess of its carrying value.fair value such that a partial impairment charge of $160.7 million was recorded. In addition, as a result of the current year testing, it was determined that the fair value of the Americas reporting unit is considered to beand the Staropramen family of brands indefinite-lived intangible asset are at a heightened risk of future impairment in the event of significant unfavorable changes in the forecasted cash flows (including Company-specific risks like the performance of our above-premium transformation efforts, expansion in products beyond beer and overall market performance, including execution of new innovations like hard seltzers, and our expansion in products beyond-the-beer aisle,strategic initiatives for the Staropramen family of brands, along with macro-economicmacroeconomic risks like the continued prolonged weakening of economic conditions and cost inflation, or
significant unfavorable changes in income tax rates, environmental or other regulations, including interpretations thereof), terminal growth rates, market multiples and/or weighted-average cost of capital utilized in the discounted cash flow analyses. Although theThe fair values of our Americas reporting unit and indefinite-lived intangible assets are either equal to or in excess of their carrying values, the fair values are sensitive to the aforementioned potential unfavorable changes that could have an adverse impact on future analyses. Any future impairment of the Americas reporting unit or our indefinite-lived intangible assets, or reclassification of indefinite-lived intangible assets to definite-lived, may result in material charges that could have a material adverse effect on our business and financial results, as evidenced by the charges incurred during the fourth quarterquarters of 20202023 and third quarter of 2019,2022, as previously noted above. The testing of our goodwill for impairment is also predicated upon our determination of our reporting units. Any change to the conclusion of our reporting units or the aggregation of components within our reporting units could result in a different outcome to our annual impairment test. See Part II—Item 7 Management's Discussion and Analysis of Financial Condition and Results of Operations, "Critical"Critical Accounting Estimates"Estimates" and PartPart II—Item 8 Financial Statements and Supplementary Data, Note 10,6, "Goodwill and Intangible Assets" for additional information related to the results of our annual impairment testing. The estimates and assumptions on which our financial projections are based may prove to be inaccurate, which may cause our actual results to materially differ from such projections, which may adversely affect our future profitability, cash flows and stock price. Our financial projections, including any sales or earnings guidance or outlook we may provide from time to time, are dependent on certain estimates and assumptions related to, among other things, our revitalization plan,Acceleration Plan, category growth, development and launch of innovative new products, market share projections, product pricing, sales, volume and product mix, foreign exchange rates and volatility, tax rates, interest rates, commodity prices, distribution through truck versus railcar, cost savings, accruals for estimated liabilities, including litigation reserves, measurement of benefit obligations for pension and other postretirement benefit plans, and our ability to generate sufficient cash flow to reinvest in our existing business, fund internal growth, repurchase our stock, make acquisitions, invest in joint ventures, pay dividends and meet debt obligations. In addition, our ability to achieve our revitalization planAcceleration Plan goals, and the anticipated cost savings and other benefits, of our restructuring activities, are subject to various assumptions and uncertainties. There is no assurance that we will fully realize the anticipated costs and other benefits of our restructuring activitiesfinancial impacts or execute successfully on our revitalization plan,Acceleration Plan in the time frames we desire or at all. Our financial projections are based on historical experience and on various other estimates and assumptions that we believe to be reasonable under the circumstances and at the time they are made, and our actual results may differ materially from our financial projections, especially in light of the increased difficulty in making such estimates and assumptions as a result of the coronavirus pandemic.projections. Any material variation between our financial projections and our actual results may adversely affect our future profitability, cash flows and stock price.
Risks Related to Our Dependence on Third Parties
Termination of one or more manufacturer/distribution/production agreements, or issues caused by our dependence on the parties to these agreements, could have a material adverse effect on our business and financial results. We
manufacture and/or distribute products of other beverage companies through various joint venture, licensing, distribution, contract brewing or other similar arrangements, such as our agreement to import, market, distribute and sell certain Heineken brands in Canada, our arrangements with ABI to brew and distribute Beck's, Stella Artois, and Lowenbrau and to distribute Hoegaarden, Leffe, and Corona in Central Europe. We also have agreements with Asahi for the production and import of Pilsner Urquell and Peroni Nastro Azurro into the U.S. under perpetual royalty-free license. These agreements have varying expiration dates and performance criteria, with several agreements approaching expiration in the near future. Non-renewal of these agreements or loss of one or more of these arrangements, because of failure of performance, failure to come to terms on a negotiated extension, as a result of industry consolidation or otherwise, could have a material adverse effect on our business and financial results. As part of our efforts to streamline operations and to manage costs, we outsource aspects of our manufacturing processes and other functions and continue to evaluate additional outsourcing. If our contract manufacturers or other outsourcers fail to perform their obligations in a timely manner or at satisfactory quality levels, our ability to bring products to market and our reputation could suffer. For example, during a market upturn, our contract manufacturers may be unable to meet our demand requirements, which may preclude us from fulfilling our customers' orders on a timely basis. The ability of these parties to perform is largely outside of our control. If one or more of these parties experiences a significant disruption in services or institutes a significant price increase, we may have to seek alternative providers, our costs could increase, and the delivery of our products could be prevented or delayed.
Changes in various supply chain standards or agreements could have a material adverse effect on our business and financial results. Our business includes various joint venture and industry agreements which standardize parts of the supply chain system. An example includes our warehousing and customer delivery systems in Canada organized under joint venture agreements with other brewers. Any negative change in these agreements or material terms within these agreements could have a material adverse effect on our business and financial results.
We rely on a small number of suppliers to obtain the input materials, in particular the packaging materials, we need to operate our business. The inability to obtain materials or disruptions at the facilities of our suppliers could unfavorably affect our ability to produce our products, which could have a material adverse effect on our business and financial results. We purchase certain types of input and other packaging materials, including aluminum cans and bottles, glass bottles, paperboard and paperboardcarbon dioxide from a small number of suppliers. ConsolidationThe demand for such input materials in the beverage industry has significantly increased, and there has been a shortage of capacity and increases in costs. In addition, consolidation of packaging materials suppliers has reduced local supply alternatives and increased risks of supply disruptions. The inability of any of these suppliers to meet our production requirements without sufficient time to develop an alternative source could have a material adverse effect on our business and financial results. Additionally, if the financial condition of these suppliers deteriorates, our business and financial results could be adversely impacted. Our suppliers’ financial condition is affected in large part by conditions and events that are beyond our and their control, including:
•competitive and general market conditions in the locations in which they operate;
•the availability of capital and other financing resources on reasonable terms;
•loss of major customers;
•disruptions of bottling operations that may be caused by strikes, work stoppages, labor unrest or natural disasters;
•the increase in price of certain ingredients and raw materials used in our products; or
•any of the foregoing, among other things, as a result of the coronavirus pandemicRussia-Ukraine conflict or otherwise. A deterioration
Termination or changes of one or more manufacturer, distribution or production agreements, or issues caused by our dependence on the parties to these agreements, could have a material adverse effect on our business and financial conditionresults. We manufacture and distribute products of other beverage companies through various joint venture, licensing, distribution, contract brewing or resultsother similar arrangements, such as our agreement to produce, import, market, distribute and sell certain Heineken brands in Canada, and our arrangements with ABI to brew and distribute Beck's, Stella Artois, and Lowenbrau and to distribute Hoegaarden, Leffe, and Corona in Central Europe. We also have agreements with Asahi for the production and import of operationsPilsner Urquell and Peroni Nastro Azurro into the U.S. under a perpetual royalty-free license. In
addition, we also have authorizations from The Coca-Cola Company that grant us the right to produce, market, sell and distribute Topo Chico Hard Seltzer and Simply Spiked branded products in the U.S. and Canada, and Peace Hard Tea branded products in the U.S. These agreements have varying expiration dates and performance criteria, with several agreements approaching expiration in the near future. The non-renewal or loss of one or more of our major suppliersthese arrangements, because of failure to perform or failure to agree to terms of an extension, or as a result of industry consolidation or otherwise, could adversely affecthave a material adverse effect on our business and financial results.
In addition, As part of our efforts to streamline operations and to manage capital investments, we are continuingoutsource aspects of our manufacturing processes and other functions and continue to actively manageevaluate additional outsourcing. If our contract manufacturers or other outsourcers fail to perform their obligations in a timely manner or at satisfactory quality levels, our ability to bring products to market and our reputation could suffer. For example, during a market upturn, our contract manufacturers may be unable to meet our demand requirements, which may preclude us from fulfilling our customers’ orders on a timely basis. The ability of these third parties to perform is largely outside of our control. If one or more of these parties experiences a significant disruption in services or institutes a significant price increase, we may have to seek alternative providers, which could increase our costs or prevent or delay the coronavirus pandemic's impactdelivery of our products. Further, our business includes various joint venture and industry agreements which standardize parts of the supply chain system. An example includes our warehousing and customer delivery systems in Canada organized under joint venture agreements with other brewers. Any negative change in these agreements or material terms within these agreements could have a material adverse effect on our supply chainbusiness and our consolidated results of operations. The demand for packaging materials in the beverage industry has significantly increased and there has been a shortage of capacity and increases in costs, as manufacturers attempt to adjust their supply chains to keep up with the increased demand, which has further increased due to the coronavirus pandemic. Due to restrictions resulting from the coronavirus pandemic, global supply may continue to be constrained, which has caused, and may continue to cause, the price of certain ingredients and raw materials used in our products to increase and/or we may experience disruptions to our operations.financial results.
Risks Related to Legal Matters, Governmental Regulations and our International Operations
Unfavorable outcomes of legal or regulatory matters may adversely affect our business and financial condition and damage our reputation. We are from time to time involved in or subject to a variety of litigation, claims, legal or regulatory proceedings or matters related to our business, the alcohol industry in general, our advertising and marketing practices, product claims, product labeling and ingredients, our intellectual property rights, alleged infringement or misappropriation by us of intellectual property rights of others, tax, environmental, privacy, insurance, ERISA and employment matters. Such matters, even those that are ultimately non-meritorious, can be complex, costly, and highly disruptive to business operations by diverting the attention and energies of management and other key personnel, and may generate adverse publicity that damages our reputation or brand image. The assessment of the outcome of such matters, including our potential liability, if any, is a highly subjective process that requires judgments about future events that are not within our control and are based on the information available to management at that time. The outcome of such matters, including amounts ultimately received or paid upon judgment or settlement, may differ materially from management’s outlook or estimates, including any amounts accrued in the financial statements. Actual outcomes, including judgments, awards, settlements or orders, could have a material adverse effect on our business, financial condition, operating results, or cash flows and damage our corporate reputation and our brands.
Our operations in developing and emerging markets expose us to additional risks, which could harm our business and financial results. We continue to operate in developing and emerging markets. In certain of these markets, we have limited operating experience and may not succeed. In addition to risks described elsewhere in this report, our operations in these markets expose us to additional heightened risks, including:
•changes in local political, economic, social and labor conditions;
•restrictions on foreign ownership and investments;
•repatriation of cash earned in countries outside the U.S.;
•import and export requirements;
•increased costs to ensure compliance with complex foreign laws and regulations;
•currency exchange rate fluctuations;
•a less developed and less certain legal and regulatory environment, which among other things can create uncertainty with regard to liability issues;
•longer payment cycles, increased credit risk and higher levels of payment fraud;
•increased exposure to global disease outbreaks or pandemics, such as the coronavirus pandemic;pandemics; and
•other challenges caused by distance, language, and cultural differences.
In addition, as a global company, we are subject to foreign and U.S. laws and regulations designed to combat governmental corruption, including the U.S. Foreign Corrupt Practices Act, the U.K. Bribery Act and the U.K. Proceeds of Crime Act. Violations of these laws and regulations could result in fines and penalties, criminal sanctions against us, our officers, or our employees, prohibitions on the conduct of our business and prohibitions on our ability to offer our products and services in one or more countries, each of which could have a materially negative effect on our reputation, brands and our operating results. Although we have implemented policies and procedures designed to ensure compliance with these foreign and U.S. laws and regulations, including the U.S. Foreign Corrupt Practices Act and the U.K. Bribery Act, there can be no assurance that our employees, business partners or agents will not violate our policies.policies and procedures.
Changes to the regulation of the distribution systems for our products could adversely affect our business and financial results. Many countries in which we operate regulate the distribution of alcohol products and if those regulations were changed, it could alter our business practices and have a material adverse effect on our business and financial results. For example, in the U.S. market, there is a three-tier distribution system that governs the sale of malt beverage products. That system, consisting of requiredrequiring separation of manufacturers, distributors and retailers, dates back to the repeal of prohibition and is periodically subject to legal challenges. To the extent that such challenges are successful and allow changes tochange the three-tier system, including through the expansion of e-commerce and direct-to-consumer offerings, such changes could have a material adverse effect on our Americas segment results of operations. Further, in Canada, our products are required to be distributed through each province's respective provincial liquor board. Additionally, in certain Canadian provinces, we rely on our joint venture arrangements with BRI and BDL to distribute our products via retail outlets that are mandated and regulated by provincial government regulators. BRI owns and operates commercial retail outlets, known as The Beer Store, in Ontario, and BDL facilitates the distribution of our products in the western Canadian provinces. If provincial regulation should change, the costs to adjust our distribution methods could have a material adverse effect on our business and financial results.
Our consolidated financial statements are subject to fluctuations in foreign exchange rates, most significantly the Canadian dollar and the European operating currencies such as, Euro, British Pound, Czech Koruna, Croatian Kuna, Serbian Dinar, New Romanian Leu, Bulgarian Lev and Hungarian Forint. We hold assets and incur liabilities, earn revenues and pay expenses in different currencies, most significantly in Canada and throughout Europe. Because our financial statements are presented in USD, we must translate our assets, liabilities, income and expenses into USD. Increases and decreases in the value of the USD will affect, perhaps adversely, the value of these items in our financial statements, even if their local currency value has not changed. Additionally, we are exposed to currency transaction risks related to transactions denominated in currencies other than one of the functional currencies of our operating entities, such as the purchase of certain raw material inputs or capital expenditures, as well as sales transactions and debt issuances or other incurred obligations. Further, certain actions by the government of any of the jurisdictions in which we operate could adversely affect our results and financial position. To the extent that we fail to adequately manage these risks through our risk management policies intended to protect our exposure to currency movements, which may affect our operations, including if our hedging arrangements do not effectively or completely hedge changes in foreign currency rates, our results of operations may be materially and adversely affected. For instance, the strengthening of the USD against the Canadian dollar, European currencies and various other global currencies would adversely impact our USD reported results due to the impact on foreign currency translation.
Changes in tax, environmental, trade or other regulations or failure to comply with existing licensing, trade and other regulations could cause volatility or have a material adverse effect on our business and financial results. Our business is highly regulated by national, state, provincial and local laws and regulations in various jurisdictions regarding such matters as tariffs, licensing requirements, trade and pricing practices, taxation, labeling, advertising, promotion and marketing practices, relationships with distributors, environmental matters, packaging material regulations, ingredient regulations, unclaimed property and other matters. These laws and regulations are subject to frequent re-evaluation, varying interpretations and political debate and inquiries from government regulators charged with their enforcement, which could have a material adverse effect on our business and financial results.
Future changes to U.S. or foreign trade policies, impositions of new or increased tariffs, other trade restrictions or other government actions, including any government shutdown, foreign currency fluctuations, including devaluations and fear of exposure to or actual impacts of a widespread disease outbreak, may lead to the continuation or escalation of such risks and uncertainty.
In addition,Furthermore, changes to existing tax laws or the adoption of new tax policies, regulations, guidance or laws, particularly in the U.S., U.K. and Canada, could have a material adverse impact to our effective tax rate, and future cash tax liabilities. Theliabilities and our financial results in general. In addition, the current economic and political environment, including the focus on corporate tax reform, anti-base erosion rules and tax transparency, may result in significant tax law changes in the numerous jurisdictions in which we operate. More specifically, recent proposals to reform tax laws in the U.S.operate and foreign jurisdictions could significantly impact how U.S. multinational business are taxed on their foreign earnings. The U.S. Congress has proposed several pieces of tax legislation, which if ultimately enacted, could have a material effect on our effective tax rate. In addition,adverse impact to our effective tax rate, could be materially affected by certainfuture cash tax proposals developed byliabilities and our financial results in general. In August 2022, the U.S. government enacted the Inflation Reduction Act of 2022 ("IRA"), which included among other provisions, a 15% minimum tax on "adjusted financial statement income" and became effective for the Company beginning January 1, 2023. Recently, intergovernmental organizations such as the Organization for Economic CooperationCo-operation and Development ("OECD") and European Commission regardingUnion ("EU") have proposed changes to the taxationexisting tax laws of multinational businesses.member countries. For instance, the OECD has introduced model rules for a new 15% global minimum tax framework, as well as a proposal on the allocation of profit among tax jurisdictions in which companies operate. In December 2022, the EU member states agreed to incorporate the 15% global minimum tax into their respective domestic laws effective for fiscal years beginning on or after December 31, 2023. Additionally, several non-EU countries, including the U.K., have recently proposed and/or adopted legislation consistent with the OECD global minimum tax framework. These tax laws and regulations could adversely impact our financial results beyond fiscal year 2024.
Continued economic and political pressures to increase tax revenues in jurisdictions in which we operate, or the adoption of new or reformed tax legislation or regulation, may make resolving tax disputes more difficult.difficult, and prior decisions by tax authorities regarding treatments and positions of corporate income taxes could be subject to enforcement activities, as well as legislative investigation and inquiry, which could also result in changes in tax policies or prior tax rulings. The final resolution of tax audits and any related litigation can differ from our historical provisions and accruals, resulting in an adverse effect on our financial performance.
Additionally, modifications of laws and policies governing foreign trade and investment, including trade agreements and tariffs such as the United States-Mexico-Canada Agreement, the European Union-United Kingdom Trade and Cooperating Agreement, or aluminum tariffs, could adversely affect our supply chain, business and results of operations. For example, in June 2018, U.S. tariffs on aluminum imports from Canada, Mexico and EU went into effect (though the U.S. lifted the aluminum tariffs on Canada and Mexico in May 2019), which has created volatility in the price of aluminum in the U.S. and increased the price of aluminum used in some of our product packaging. Continued imposition of U.S. aluminum tariffs, the implementation of additional tariffs and retaliatory tariffs from trade partners or related uncertainties could further increase the cost of certain of our imported materials, thereby adversely affecting our profitability. In addition, the European Union-United Kingdom Trade and Cooperating Agreement became effective in May 2021 and resulted in certain disruptions in trade and the movement of goods, including prolonged transportation delays, which affected our ability to source raw materials and packaging for our products as well as our ability to import and export products.
Furthermore, various jurisdictions have adopted, or may seek to adopt, additional product labeling or warning requirements or limitations on the availability of our beverages relating to perceived adverse health consequences of some of our beverages. If additional or more severe requirements of this type are imposed on one or more of our beverages under current or future laws or regulations, they could inhibit sales of such beverages in such jurisdictions. In addition, we cannot predict whether our beverages will become subject to increased rules and regulations regarding labeling or warnings which, if enacted, could increase our costs or adversely impact sales.
In addition, a number of governmental authorities, both in the U.S. and abroad, have considered, and are expected to consider, legislation aimed at packaging reducing the amount of plastic waste. Programs have included recommendations for extended producer responsibility, banning certain types of products, mandating certain rates of recycling and/or the use of recycled materials, imposing deposits or excise taxes on packaging material, and requiring retailers or manufacturers to take back packaging used for their products. Such legislation, as well as voluntary initiatives, aimed at reducing the level of plastic wastes, could reduce the demand for certain of our products that contain plastic packaging, result in greater costs for manufacturers of plastic products or otherwise impact our business, financial condition and results of operations. Similarly, changes in applicable environmental regulations, including increased or additional regulations to discourage the use of plasticparticular materials (or encourage or mandate the use of other materials) may result in increased compliance costs, increased costs, capital expenditures, incremental investments and other financial obligations for us and our business partners, which could affect our profitability. In addition, weWe may not be able to implement price increases for our products to cover any increased costs, and any price increases we do implement may result in lower sales volumes.
Finally,The government(s) of each country in which we sell our products, including state and local jurisdictions in the U.S., levies excise taxes at varying rates. Additionally, U.S. governmental entities also levy taxes and may require bonds to ensure compliance with applicable laws and regulations. In 2021, our U.S. businessIncreases in excise taxes, on malt beverages were approximately $15 per hectoliter sold on a reported basis. This included the impact of the U.S. Craft Beverage Modernization and Tax Reform Act, which took effect on January 1, 2018 for all qualified large domestic brewerssuch compliance taxes and importers and was made permanent by the U.S. Consolidated Appropriations Act, 2021 on December 27, 2020. This law resulted in reduced U.S. federal excise taxes by $2 per barrel on the first six million barrels, which equated to $1.70 per hectoliter on this portion of our 2021 volume sold. Our practice is to transfer a portion of these savings to distributors consistent with the revenue splitting approach of our U.S. business' economic model. Excise taxes are levied in specific state and local jurisdictions at varying rates. Increased excise taxesbonds, could have a material adverse effect on our profitability.
Failure to comply with existing laws and regulations or changes in these laws, regulations, or interpretations thereof, specifically tax and environmental laws or any other laws or regulations could result in the loss, revocation or suspension of our licenses, permits or approvals and could have a material adverse effect on our business, financial condition and results of operations. Additionally, uncertainties exist with respect to the interpretation of, and potential future developments in, complex domestic and international tax laws and regulations, the amount and timing of future taxable income and the interaction of such laws and regulations among jurisdictions. Given the wide range of international business relationships and the long-term nature
and complexity of existing contractual agreements, differences arising between the actual results and assumptions made, or future changes to such assumptions, could necessitate future adjustments to tax income and expense already recorded.
Coronavirus pandemic vaccination mandates adopted by federal, state and local governments, as well as by certain healthcare systems, could have a material adverse impact on our business and results of operations. In addition to government-imposed shutdowns or restrictions on our business activities due to the coronavirus pandemic, governments may impose vaccine or testing requirements on some or all of our employees. Additionally, many state and local governments in which our business operates have implemented or announced COVID-19 vaccination requirements applicable to certain of our employees, and additional vaccination mandates may be announced in the future. It is currently not possible to predict with certainty the impact these vaccination mandates will have on our business, especially on our workforce. Our implementation of these requirements may result in costs to us in the form of vaccinations or testing of employees. These requirements may also result in attrition in our workforce, including attrition of critically skilled labor, and difficulty securing future labor needs, which could have a material adverse effect on our business, financial condition, and results of operations.
We also have modified our business practices for the continued health and safety of our employees, including the requirements of vaccines, subject to certain medical and religious exemptions, for all non-union office-based employees in the U.S. We may take further actions, or be required to take further actions, that are in the best interests of our employees. Our suppliers and customers have also implemented such measures, which has resulted in, and we expect it will continue to result in, disruptions or delays and higher costs. The implementation of health and safety practices by us, our suppliers or our customers could impact customer demand, supplier deliveries, our productivity and costs, which could have a material adverse impact on our business, financial condition or results of operations.
Risks Related to Acquisitions and Joint Ventures
Risks associated with operating our joint ventures may materially adversely affect our business and financial results. We have entered into several joint ventures, including our joint ventures with Ball Corporation (i.e., Rocky Mountain Metal Container), and with Owens-Brockway Glass Container Inc. (i.e., Rocky Mountain Bottle Company), for a portion of our aluminum and glass packaging supply in the U.S., respectively. In addition, we have entered into joint ventures with HEXO to pursue opportunities to develop, produce and market non-alcoholic, cannabis-infused beverages in Canada and CBD beverages in certain U.S. markets. We have also entered into a joint venture with The Yuengling Company LLC to expand the distribution of Yuengling beer in the western U.S. We also have a joint venture in the U.K. regarding the production and distribution of Cobra beer. Additionally, in certain Canadian provinces, we rely on joint venture agreements with BRI and BDL to distribute our products via retail outlets that are mandated and regulated by provincial government regulators. As previously referenced, BRI owns and operates commercial retail outlets, known as The Beer Store, in Ontario, and BDL facilitates the distribution of our products in the western Canadian provinces. We may enter into additional joint ventures in the future. Our joint venture partners may at any time have economic, business or legal interests or goals that are inconsistent with our goals or with the goals of the joint venture. In addition, we compete against our joint venture partners in certain of our other markets. Disagreements with our business partners may impede our ability to maximize the benefits of our partnerships. Our joint venture arrangements may require us, among other matters, to pay certain costs or to make certain capital investments or to seek our joint venture partner's consent to take certain actions. In addition, our joint venture partners may be unable or unwilling to meet their economic or other obligations under the operative documents, or may become insolvent or file for bankruptcy protection and we may be required to either fulfill those obligations alone to ensure the ongoing success of a joint venture or to dissolve and liquidate a joint venture.
Failure to successfully identify, complete or integrate attractive acquisitions and joint ventures into our existing operations could have an adverse effect on our business and financial results. We have made a number of acquisitions and entered into several strategic joint ventures. In order to compete in the consolidating global brewing and beverage industry, we anticipate that we may, from time to time, in the future acquire additional businesses like the Blue Run Spirits, Inc ("Blue Run") acquisition in the third quarter of 2023 or enter into additional joint ventures that we believe would provide a strategic fit with our business such as the Acquisition and our joint ventures with HEXO and Yuengling and various other craft acquisitions we have made recently.business. Potential risks associated with acquisitions and joint ventures could include, among other things:
•our ability to identify attractive acquisitions and joint ventures;
•our ability to offer potential acquisition targets and joint venture partners' competitive transaction terms;
•our ability to raise capital on reasonable terms to finance attractive acquisitions and joint ventures;
•our ability to realize the benefits or cost savings that we expect to realize as a result of the acquisition or joint venture;
•diversion of management's attention;
•our ability to successfully integrate our businesses with the business of the acquired company;
•motivating, recruiting and retaining key employees;
•conforming standards, controls, procedures and policies, business cultures and compensation structures among our company and the acquired company;
•consolidating and streamlining sales, marketing and corporate operations;
•potential exposure to unknown liabilities of acquired companies;
•potential exposure to unknown or future liabilities or costs that affect the markets in which acquired companies or joint ventures operate;
•reputational or other damage due to the conduct of a joint venture partner; partner or the prior conduct of an acquired company;
•loss of key employees and customers of thean acquired business;company; and
•managing tax costs or inefficiencies associated with integrating our operations following completion of an acquisition or entry into a joint venture.
Additional Risks Related to our Americas Segment
Our U.S. business is highly dependent on independent distributors to sell our products, with no assurance that these distributors will effectively sell our products, and distributor consolidation in the U.S. could harm our business performance.and financial results. We sell nearly all of our products, including all of our imported products, in the U.S. to independent distributors for resale to retail outlets. These independent distributors are entitled to exclusive territories and protected from termination by state statutes and regulations. Consequently, if we are not allowed, or are unable under acceptable terms or at all, to replace unproductive or inefficient distributors, our business, financial position and results of operation may be adversely affected, which could have a material adverse effect on our business and financial results.
Further, in recent years, there has been a consolidation of independent distributors, resulting in distributors with increased leverage over suppliers due to the distributor's share of the supplier business, exclusive territorial appointments and regulatory protection of distribution agreements. In addition,We have limited ability to influence decisions regarding distributor consolidation, which, regardless of size, carries a risk of decreased investment in service and local marketing in the interest of paying down the leverage required to fund a transaction. Consolidation among distributors could create a more challenging competitive landscape for our products and could hinder the distribution and sale of our products. There is a risk that consolidation of distributors could further increase due to potential changes in tax laws in the markets in which we operate. This could negatively impact sales of certain growth driver products, such as hard seltzers and ready to drink beverages, and increase prices. Our unique portfolio may require more brand building than our competitors, which could be adversely affected in the event of distributor consolidation. Changes in distributors' strategies, including a reduction in the number of brands they carry, may adversely affect our growth, business, financial results and market share.
Government mandated changes to the retail distribution model resulting from new regulations may have a material adverse effect on our Canada business. In June 2019, theThe Province of Ontario government adoptedand Molson Canada 2005, a bill that, if enacted, would terminate a 10-year Master Framework Agreement that was originally signed between the previous government administration and MCBC,wholly owned indirect subsidiary of our Company, Labatt Brewing Company Limited, Sleeman Breweries Ltd. (collectively, the "Representative Owners"), and Brewers Retail Inc. in 2015 and governs, operating under the name "The Beer Store" ("TBS"), are parties to a Master Framework Agreement ("MFA") that dictates the terms of the beer distribution and retail systems in Ontario through 2025.Ontario. The government has not yet proclaimed the bill as law. Even if the legislation is proclaimed into law, the Master Framework Agreement is set to expire in 2025 unless renewed. While we have engaged, and continue to plan to engage in discussions with the government to renew the agreement or otherwise reach a mutually agreeable alternative to the enactment of the law, we and the other Master Framework Agreement signatories are prepared to vigorously defend our rights and pursue legal recourse, should the Master Framework Agreement be unilaterally terminated by the enactment of the legislation. Unilateral termination or expirationinitial term of the Master Framework Agreement does not expire until December 31, 2025, and the MFA contains a provision requiring two-year advance notice of the government's intention to not renew the MFA. In December 2023, the Province of Ontario notified the Representative Owners and TBS that it would not be renewing the MFA after the initial term of the MFA expires on December 31, 2025. The Province of Ontario simultaneously announced a set of non-binding Key Principles agreed upon between the Province of Ontario, the Representative Owners, and TBS, concerning the intended features of the future marketplace for beer distribution and retail systems in the Province of Ontario to be introduced no later than January 1, 2026. Under the Key Principles, TBS will continue its retail operations and will continue to be the primary distributor of beer in the Province of Ontario at least through 2031. The Key Principles also state grocery stores, convenience stores, gas stations, and big-box retailers in the Province of Ontario will be able to apply for licenses to sell beer, wine, cider, and ready-to-drink cocktails starting in 2026. The impacts of the Key Principles are still being analyzed and could have material impacts toa negative impact on the results of operations, cash flows and financial position of theour Americas segment.
Our Americas business faces numerous risks relating to its joint ventures in the Canadian cannabis industry and the U.S. CBD beverage industry. In 2018, a wholly-owned subsidiary within our Canadian business completed the formation of an independent Canadian joint venture with HEXO, a Canadian entity listed on the New York Stock Exchange and the Toronto Stock Exchange that serves the Canadian cannabis market. The joint venture, Truss LP ("Truss"), is producing and marketing developing non-alcoholic, cannabis-infused beverages for the Canadian market. In 2020, Truss launched its first cannabis infused product, Verywell Drops, as well as its ready to drink beverage portfolio across the Canadian market. The success and consumer acceptance of any products produced by the joint venture cannot be assured. Further, our Canadian subsidiary’s involvement in the Canadian cannabis industries and our involvement in the U.S. CBD market may negatively impact: consumer, business partner, investor or public sentiment regarding our brands, Americas' beer business or our company. The emerging cannabis industry in Canada and the U.S. and in other jurisdictions is evolving rapidly and subjects us to a high degree of political, legal and regulatory uncertainty. The occurrence of any of the above risks could have a material adverse effect on our business. In addition, there is regulatory uncertainty in the U.S. regarding the status of food and beverage products that contain U.S. hemp-derived ingredients, including CBD. While our involvement in the U.S. CBD market consists of operations and sales of such products in states where the sale and distribution of hemp-derived CBD beverages is permitted, U.S. federal law enforcement officials may still elect to take enforcement action against companies under the Controlled Substances Act or the Food and Drug Administration may send a cease and desist letter, either of which action could have an impact on our involvement in the U.S. CBD market.
If we are required to move away from the industry standard returnable bottle we use today in Canada, we may incur unexpected losses. Along with other brewers in Canada, we currently use an industry standard returnable bottle which represents approximately 21% of total volume sales (excluding imports) in Canada. Changes to the Industry Standard Bottle Agreement could impact our use of the industry standard returnable bottle. If we cease to use the industry standard returnable bottle, our current bottle inventory and a portion of our bottle packaging equipment could become obsolete and could result in a material write-off of these assets.Segment.
Indemnities provided to the purchaser of our previous interest in the Cervejarias Kaiser Brasil S.A. ("Kaiser") business in Brazil could result in future cash outflows and statement of operations charges. In 2006, we sold our previous ownership interest in Kaiser, which was held by our Canadian business, to FEMSA Cerveza S.A. de C.V. ("FEMSA"). The terms of the sale agreement require us to indemnify FEMSA for exposures related to certain tax, civil and labor contingencies and certain purchased tax credits. The ultimate resolution of these claims is not under our control. These indemnity obligations are recorded as liabilities on our consolidated balance sheets,sheets; however, we could incur future statement of operations charges as
facts further develop resulting indue to changes to our estimates or changes in our assessment of probability of loss on these items as well as due to fluctuations in foreign exchange rates. Due to the uncertainty involved in the ultimate outcome and timing of these contingencies, significant adjustments to the carrying value of our indemnity liabilities and corresponding statement of operations charges/credits could result in the future.
Additional Risks Related to our EMEA&APAC Segment
Economic trends and intense competition in European markets could unfavorably affect our profitability. Our European businesses have been, and, in the future may be, adversely affected by conditions in the global financial markets and general economic and political conditions, as well as a weakening of their respective currencies versus the U.S. dollar, in each case, in addition to the other impacts of the coronavirus pandemic.Russia-Ukraine conflict. Additionally, we face intense competition in certain of our European markets, particularly with respect to pricing, which could lead to reduced sales or profitability. In particular, the on-going focus by large competitors in Europe to drive increased market share through aggressive pricing strategies could
adversely affect our sales and results of operations. We may also face pressures resulting from a reduction in disposable incomes of consumers to spend on our products due to inflation, recessionary conditions and an increase in the cost of energy, primarily in countries located in central and eastern Europe, which could unfavorably affect our profitability. In addition, in recent years, beer volume sales in Europe have been shifting from on-premise, such as pubs and restaurants, (on-premise) to off-premise, such as retail stores, (off-premise) for the industry as a whole. Margins in general. Salessales to off-premise customers tend to be lower than margins onfrom sales to on-premise customers, and, as a result, continuation or acceleration of this trend wouldcould further adversely affect our profitability.
Risks Related to Ownership of our Class B Common Stock
If Pentland and the Coors Trust do not agree on a matter submitted to our stockholders or if a super-majority of our board of directorsthe Board do not agree on certain actions, generally the matter will not be approved, even if beneficial to us or favored by other stockholders or a majority of our board of directors.the Board. Pentland Securities (1981) Inc. ("Pentland") (a company controlled by the Molson family and related parties) and the Adolph Coors, Jr. Trust (the "Coors Trust") (a trust controlled by the Coors family and related parties), which together control more than 90% of our Class A common stock and Class A exchangeable shares, have a voting trust agreement through which they have combined their voting power over the shares of our Class A common stock and the Class A exchangeable shares that they own. If these two stockholders do not agree to vote in favor of a matter submitted to a stockholder vote (other than the election of directors), the voting trustees are required to vote all of the Class A common stock and Class A exchangeable shares deposited in the voting trust against the matter. There is no other mechanism in the voting trust agreement to resolve a potential deadlock between these stockholders. Therefore, if either Pentland or the Coors Trust is unwilling to vote in favor of a proposal that is subject to a stockholder vote, we would be unable to implement the proposal even if our board of directors,the Board, management or other stockholders believe the proposal is beneficial to us. Similarly, our bylaws require the authorization of a super-majority (two-thirds) of the board of directorsBoard to take certain transformational actions. Thus, it is possible that our Company will not be authorized to take action even if it is supported by a simple majority of the board of directors.Board.
The interests of the controlling stockholders may differ from those of other stockholders and could prevent our Company from making certain decisions or taking certain actions that would be in the best interest of the other stockholders. Our Class B common stock has fewer voting rights than our Class A common stock and holders of our Class A common stock have the ability to effectively control or have a significant influence over certain of our actions requiring stockholder approval, which could have a material adverse effect on Class B stockholders. See Part II—Item 8 Financial Statements and Supplementary Data, Note 8,14, "Stockholders' Equity" in this Annual Report on Form 10-K for additional information regarding voting rights of Class A and Class B stockholders. Shareholder activism efforts or unsolicited offers from a third-party could cause a material disruption to our business and financial results. We may be subject to various legal and business challenges due to actions instituted by shareholder activists or unsolicited third-party offers. Perceived uncertainties as to our future direction as a result of shareholder activism may lead to the perception of a change in the direction of the business or other instability and may affect our relationships with vendors, customers, prospective and current employees and others. Proposed or future laws and regulations may increase the chance we become the target of shareholder activist campaigns, including ESG-related actions. If shareholder activist campaigns are initiated against us, our response to such actions could be costly and time-consuming, which could divert the attention and resources of the Board, Chief Executive Officer and senior management from the pursuit of our business strategies, which could harm our business, negatively impact our stock price, and have an adverse effect on our business and financial results.
ITEM 1B. UNRESOLVED STAFF COMMENTS
None.
ITEM 1C. CYBERSECURITY
Our cybersecurity program is managed by a dedicated Global Chief Information Officer whose team, including the head of Information Technology Security, is responsible for leading enterprise-wide cybersecurity strategy, policy, standards, architecture and processes. Our Global Chief Information Officer has over 35 years of relevant industry experience, including over 29 years at our Company. Our Senior Director of Information Security functions as our Chief Information Security Officer and has over 20 years of relevant industry experience. Further, team members who support our cybersecurity program have relevant educational and industry experience through various roles involving information technology, security, auditing, compliance, systems and programming, as well as cybersecurity certifications such as a Certified Information Systems Security Professional or Certified Information Security Manager. Our Board, Audit Committee and senior management receive periodic briefings from the Global Chief Information Officer and the Senior Director of Information Security, concerning cybersecurity, information security and technology risks, and our related risk mitigation programs. In general, the Board is responsible for overseeing our enterprise risk management program ("ERM Program").
The ERM Program is a proactive and ongoing process led by our legal and risk professionals and senior management, to identify, assess and manage risks and to build out and track mitigation and reduction efforts. The Board has tasked the Audit Committee with overseeing, reviewing and discussing with management, the internal audit team and the independent auditors, our ERM Program, policies and procedures with respect to, among other things, the assessment and management of risks related to our cybersecurity and information security and the steps management has taken to monitor and control such risks.
The Audit Committee is also responsible for overseeing risks related to our cybersecurity, technology and information security programs and reviewing emerging cybersecurity, technology and information security developments and threats and our strategy to mitigate such risks. The Audit Committee provides another level of cybersecurity oversight through engagements at each Audit Committee meeting with senior management, including our Global Chief Information Officer and the Senior Director of Information Security. These reports include updates on our cybersecurity risks, threats, and incidents; our efforts to monitor, prevent, detect, mitigate and remediate the same; regulatory updates; the status of our cybersecurity projects, programs, and assessments; and periodic updates on our cybersecurity staffing and related matters. The Audit Committee regularly reports to the Board regarding these matters.
We engage in the ERM Program process semi-annually, which addresses, among other matters, emerging cybersecurity threats and models our exposure to the threat landscape against the overall strategic objectives of our Company. We regularly engage cybersecurity industry experts to assess, audit and consult on our cybersecurity practices. Further, we engage Managed Security Service Providers to monitor our information technology ("IT") environment, help identify attacks, forensically investigate and remediate breaches, and assess and test our IT system security. We also operate a cyber controls assessment program to monitor our internal program in between external assessments. We have also implemented a cybersecurity awareness training program to facilitate initial and continuing education for employees on cybersecurity and related matters. Regular reviews are conducted to assess our information security programs and practices, including incident management, service continuity, information security compliance programs and related achievements.
In addition, we operate a third-party cyber risk management capability which monitors the exposure of significant IT suppliers, significant software as a service suppliers and major vendors with access to our IT systems. We also monitor for significant changes in our cybersecurity risk posture and attempt to remediate the risk through collaboration with that partner. We also monitor for known breaches of the IT supplier landscape.
As previously disclosed, during March 2021, we experienced a systems outage that was caused by a cybersecurity incident. We engaged leading forensic information technology firms and legal counsel to assist our investigation into the incident and we restored our systems. Despite these actions, we experienced delays and disruptions to our business, including brewery operations, production and shipments. This incident caused a shift in production and shipments from the first quarter of 2021 to the balance of fiscal year 2021. In addition, we incurred certain incremental one-time costs of $2.4 million for the year ended December 31, 2021, related to consultants, experts and data recovery efforts, net of insurance recoveries. See also Part I—Item 1A Risk Factors for the following risk: Cybersecurity incidents impacting our information systems, and violations of data privacy laws and regulations could disrupt our business operations and adversely impact our reputation and results of operations.
ITEM 2. PROPERTIES
As of February 23, 2022,20, 2024, our major facilities were owned (unless otherwise indicated) and are as follows:
| | | | | | | | | | | | | | |
| Facility | | Location | | Character |
| Administrative Offices |
| | Bucharest, Romania(1) | | Americas and EMEA&APAC globalGlobal business services center |
| | Burton-on-Trent, U.K.(2) | | EMEA&APAC segment operational headquarters |
| | Chicago, Illinois(1) | | Americas segment operational headquarters |
| | Golden, Colorado | | Corporate principal executive office and Americas segment administrative office |
| | Milwaukee, Wisconsin | | Americas segment administrative office |
| | Montréal, Québec(1) | | Corporate principal executive office and Americas segment administrative office |
| | Prague, Czech Republic | | EMEA&APAC segment administrative office |
| | Toronto, Ontario | | Americas segment administrative office |
| Americas Segment |
| Brewery/packaging plants | | Albany, Georgia(2)(3) | | Brewing and packaging |
| | Chilliwack, British Columbia | | Brewing and packaging |
| | Elkton, Virginia(2)(3) | | Brewing and packaging |
| | Fort Worth, Texas(2)(3) | | Brewing and packaging |
| | Golden, Colorado(2)(3) | | Brewing and packaging |
| | Longueuil, Québec | | Brewing and packaging |
| | Milwaukee, Wisconsin | | Brewing and packaging |
| | Toronto, Ontario | | Brewing and packaging |
| | Trenton, Ohio(2)(3) | | Brewing and packaging |
| Beer distributorship | | Denver, Colorado | | Distribution |
| Container operations | | Golden, Colorado(3)(4) | | Can and end manufacturing facilities |
| | Wheat Ridge, Colorado(3)(4) | | Bottling manufacturing facility |
| Malting operations | | Golden, Colorado | | Malting |
| EMEA&APAC Segment |
| Brewery/packaging plants | | Apatin, Serbia(4)(5) | | Brewing and packaging |
| | Bőcs, Hungary | | Brewing and packaging |
| | Burton-on-Trent, U.K.(4)(5) | | Brewing and packaging |
| | Haskovo, Bulgaria | | Brewing and packaging |
| | Niksic, Montenegro | | Brewing and packaging |
| | Ostrava, Czech Republic | | Brewing and packaging |
| | Ploiesti, Romania(4)(5) | | Brewing and packaging |
| | Prague, Czech Republic(4)(5) | | Brewing and packaging |
| | Tadcaster Brewery, Yorkshire, U.K.(4) | | Brewing and packaging |
| | Zagreb, Croatia(5) | | Brewing and packaging |
(1)We lease the office space for our Americas segment operational headquarters in Chicago, Illinois, as well as the office space for our global business services center in Bucharest, Romania.Romania as well as our corporate principal executive office and Americas segment administrative office in Montréal, Québec.
(2)As of December 31, 2022, we signed a sale and leaseback agreement for the EMEA&APAC segment operational headquarters facility located in Burton-on-Trent. The sale and leaseback agreement is in effect until we relocate to an owned facility location that will serve as the new EMEA&APAC segment operational headquarters.
(3)The Golden, Trenton, Elkton, Albany and Fort Worth breweries collectively accountaccounted for approximately 76%78% of our Americas segment production for the year ended December 31, 2021.2023.
(4)The Wheat Ridge and Golden, Colorado facilities are leased from us by RMBC and RMMC, respectively.
(4)(5)The Burton-on-Trent, Prague, Ploiesti, Apatin and TadcasterZagreb breweries collectively accountaccounted for approximately 72%74% of our EMEA&APAC segment production for the year ended December 31, 2021.2023.
In addition to the properties listed above, we have smaller capacity facilities, including craft breweries, and cideries, in each of our segments. We own and lease various warehouses, distribution centers and office spaces throughout the Americas segment and EMEA&APAC segment countries in which we operate. Additionally, our Truss joint venture in Canada subleases its production facility in Belleville, Ontario from our joint venture partner, HEXO.
We believe our facilities are well maintained and suitable for their respective operations. In 2021,During the year ended December 31, 2023, our operating facilities were not capacity constrained.
ITEM 3. LEGAL PROCEEDINGS
Litigation and other disputes
ITEM 4. MINE SAFETY DISCLOSURES
Not applicable.
PART II
ITEM 5. MARKET FOR REGISTRANT'S COMMON EQUITY, RELATED STOCKHOLDER MATTERS AND ISSUER PURCHASES OF EQUITY SECURITIES
Overview
Our Class A common stock and Class B common stock trade on the New York Stock Exchange under the symbols "TAP.A" and "TAP," respectively. In addition, the Class A exchangeable shares and Class B exchangeable shares of our indirect subsidiary, Molson Coors Canada Inc., trade on the Toronto Stock Exchange under the symbols "TPX.A" and "TPX.B," respectively. The Class A and B exchangeable shares are a means for shareholders to potentially defer Canadian income tax and have substantially the same economic and voting rights as the respective common shares. The exchangeable shares can be exchanged for our Class A or B common stock at any time and at the exchange ratios described in the Merger documents and receive the same dividends. At the time of an exchange, a shareholder's Canadian tax liability, if any, would become due. The exchangeable shares have voting rights through special voting shares held by a trustee.
The approximate number of record security holders by class of stock at February 16, 2022,13, 2024, is as follows:
| | | | | | | | |
| Title of class | | Number of record
security holders |
| Class A common stock, $0.01 par value | | 2322 |
| Class B common stock, $0.01 par value | | 2,9122,880 |
| Class A exchangeable shares, no par value | | 211205 |
| Class B exchangeable shares, no par value | | 2,2692,214 |
PERFORMANCE GRAPHPerformance Graph
The following graph compares our cumulative total stockholder return over the last five fiscal years with the S&P 500 and a customized peer index including MCBC, ABI, Carlsberg, Heineken and Asahi (the "Peer Group"). We have used a weighted-average based on market capitalization to determine the return for the Peer Group. The graph assumes $100 was invested on December 31, 2016,2018, in our Class B common stock, the S&P 500 and the Peer Group, and assumes reinvestment of all dividends.
The below is provided for informational purposes and is not indicative of future performance.
| | | | 2016 | | 2017 | | 2018 | | 2019 | | 2020 | | 2021 | | 2018 | | 2019 | | 2020 | | 2021 | | 2022 | | 2023 |
| Molson Coors | Molson Coors | $ | 100.00 | | | $ | 85.89 | | | $ | 60.22 | | | $ | 59.94 | | | $ | 50.85 | | | $ | 52.93 | |
| S&P 500 | S&P 500 | $ | 100.00 | | | $ | 121.82 | | | $ | 116.47 | | | $ | 153.14 | | | $ | 181.30 | | | $ | 233.29 | |
| Peer Group | Peer Group | $ | 100.00 | | | $ | 105.80 | | | $ | 77.79 | | | $ | 99.65 | | | $ | 86.29 | | | $ | 88.27 | |
Dividends
We do not have any restrictions that prevent or limit our ability to declare or pay dividends. A quarterly dividend of $0.34 per share was paid during the third and fourth quarters of 2021.2021 following the reinstatement of the quarterly dividend on July 15, 2021 by the Board after the quarterly dividend's suspension as a result of the coronavirus pandemic, for a total of $0.68 per share or a CAD equivalent of CAD 0.84 per share. A quarterly dividend of $0.38 per share was declared and paid to eligible shareholders of record on the respective record dates throughout 2022 for a total of $1.52 per share or a CAD equivalent of CAD 1.95 per share. A quarterly dividend of $0.41 per share was declared and paid to eligible shareholders of record on the respective record dates throughout 2023 for a total of $1.64 per share or a CAD equivalent of CAD 2.19 per share.
Issuer Purchases of Equity Securities
The following table presents information with respect to Class B common stock purchases made by our Company during the three months ended December 31, 2023:
| | | | | | | | | | | | | | | | | | | | | | | | | | |
| Issuer Purchases of Equity Securities |
| | Total number of shares purchased | | Average price paid per share | | Total number of shares purchased as part of publicly announced plans or programs | | Maximum number (or approximate dollar value) of shares that may yet be purchased under the plans or programs(1) |
| October 1, 2023 through October 31, 2023 | | — | | | $ | — | | | — | | | $ | 2,000,000,000 | |
| November 1, 2023 through November 30, 2023 | | 1,371,697 | | | $ | 59.29 | | | 1,371,697 | | | $ | 1,918,670,260 | |
| December 1, 2023 through December 31, 2023 | | 1,102,997 | | | $ | 62.30 | | | 1,102,997 | | | $ | 1,849,958,156 | |
| Total | | 2,474,694 | | | $ | 60.63 | | | 2,474,694 | | | $ | 1,849,958,156 | |
(1)On September 29, 2023, the Board approved a share repurchase program to repurchase up to an aggregate of $2.0 billion of our Company's Class B common stock, excluding brokerage commissions and excise taxes, with an expected program term of five years.
The number, price, structure and timing of the repurchases under the program, if any, will be at our sole discretion and future repurchases will be evaluated by us depending on market conditions, liquidity needs, restrictions under our debt arrangements and other factors. Share repurchases may be made in the open market, in structured transactions, or in privately negotiated transactions. The repurchase authorization does not oblige us to acquire any particular amount of our Company's Class B common stock. The Board may suspend, modify or terminate the repurchase program at any time without prior notice.
ITEM 6. [Reserved]
ITEM 7. MANAGEMENT'S DISCUSSION AND ANALYSIS OF FINANCIAL CONDITION AND RESULTS OF OPERATIONS
Overview
For more thanover two centuries, we have been brewing beverages that unite people forto celebrate all life’s moments. From our core power brands Coors Light, Miller Lite, Coors Banquet, Molson Canadian, Carling and StaropramenOžujsko to Coors Banquet,our above premium brands including Madri, Staropramen, Blue Moon Belgian White Blue Moon LightSky, Vizzy, Coors Seltzer, and Leinenkugel’s Summer Shandy, Creemore Springs, Hop Valleyto our economy and value brands like Miller High Life and more, Keystone, we produce many beloved and iconic beer brands. While our Company’s history is rooted in beer, we offer a modern portfolio that expands beyond the beer aisle as well.well, including flavored beverages like Vizzy Hard Seltzer, spirits like Five Trail whiskey as well as non-alcoholic beverages. As a business, our ambition is to be the first choice for our people, our consumers and our customers, and our success depends on our ability to make our products available to meet a wide range of consumer segments and occasions.
Management's Discussion and Analysis of Financial Condition and Results of Operations ("MD&A") in this Annual Report on Form 10-K is provided to assist in understanding our Company, operations and current business environment and should be considered a supplement to, and read in conjunction with, the accompanying audited consolidated financial statements and notes included within Part II—Item 8 Financial Statements and Supplementary Data, as well as the discussion of our business and related risk factors in Part I—Item 1 Business and Part I—Item 1A Risk Factors, respectively. See also "Cautionary Statement Pursuant to Safe Harbor Provisions of the Private Securities Litigation Reform Act of 1995." A discussion related to the results of operations and changes in financial condition for 20202022 compared to 20192021 has been omitted from this report, but may be found in Part II, Item 7. Management's Discussion and Analysis of Financial Condition and Results of Operations in our fiscal 20202022 Form 10-K, filed with the SEC on February 11, 2021,21, 2023, which is available free of charge on the SEC's website at www.sec.gov and our corporate website at www.molsoncoors.com.
Our Fiscal Year
Unless otherwise indicated, (a) all $ amounts are in USD, (b) comparisons are to comparable prior periods and (c) 2021, 20202023, 2022 and 20192021 refers to the 12 months ended December 31, 2021,2023, December 31, 20202022 and December 31, 2019,2021, respectively.
We have certain operational measures, such as STWs and STRs, which we believe are important metrics. STW is a metric that we use in our business to reflect the sales from our operations to our direct customers, generally wholesalers. We believe the STW metric is important because it gives an indication
Items Affecting Reported Results
Items Affecting Consolidated Results of Operations
Cybersecurity Incident
During March 2021, we experienced a systems outage that was caused by a cybersecurity incident. We engaged leading forensic information technology firms and legal counsel to assist our investigation into the incident and we restored our systems after working to get the systems back up as quickly as possible. Despite these actions, we experienced delays and disruptions to our business, including brewery operations, production and shipments. This incident caused us to not produce or ship as much as we otherwise would have in the first quarter of 2021. Subsequently, in the balance of 2021, we made progress recovering from the incident with increased shipments and have operationally recovered as of December 31, 2021. In addition, we incurred certain incremental one-time costs of $2.4 million for the year ended December 31, 2021 related to consultants, experts and data recovery efforts, net of insurance recoveries.
Coronavirus Global Pandemic
We have been actively monitoring the impact of the coronavirus pandemic which has had a material adverse effect on our operations, liquidity, financial condition and results of operations in 2020 and 2021. In 2021, while we saw improvements in the marketplace related to the coronavirus global pandemic as on-premise locations began to re-open across the world, including in the U.S. and Europe, which led to a shift in revenue from off-premise to on-premise starting in the second quarter and continuing through the third quarter of 2021, during the fourth quarter of 2021, a new variant of coronavirus, Omicron, created additional uncertainty and negatively impacted our on-premise business. While on-premise volumes in our EMEA&APAC segment progressively improved throughout 2021 as bars and restaurants reopened with restrictions, due to implications of the new coronavirus variant, consumer behavior in the U.K. and across Central Europe became more uncertain as individuals were encouraged to work from home and reduce other personal interactions during the fourth quarter of 2021. With a shift in consumer behavior and surge in coronavirus cases not only in Europe but also in the U.S. and Canada at the end of the year, sales to the on-premise during the fourth quarter of 2021 were negatively impacted. The extent to which our operations will continue to be impacted by the coronavirus pandemic will depend largely on future developments, which are highly uncertain and cannot be accurately predicted, including the level of governmental or societal orders or restrictions on public gatherings and on-premise venues, including any vaccine mandates or testing requirements, the severity and duration of the coronavirus pandemic by market, including continued or prolonged outbreaks of variants, changes in consumer behavior, the rate of vaccination and the efficacy of vaccines against the coronavirus and related variants. We continue to actively monitor the ongoing evolution of the coronavirus pandemic and resulting impacts to our business.
Despite the improvements in re-openings of on-premise locations from 2020, closures and openings with restrictions continued to impact our financial results during 2021. Specifically, beginning in the first quarter of 2020 and continuing into the first half of 2021, we experienced a significant decline in on-premise demand in the Americas and EMEA&APAC segments resulting from lockdowns and other government-imposed restrictions to the on-premise. See further discussion in Part I. Item 1. Business regarding the historical percentage of on-premise channel versus off-premise within our Americas and EMEA&APAC segments and resulting implications to expected profitability as a result of the effective closures of the on-premise in the markets in which we operate. While certain countries in Europe lifted lockdown restrictions, particularly in the U.K. which resulted in the reopening of certain on-premise locations early in the second quarter of 2021 with measures removed early in the third quarter of 2021, the on-premise did not return to pre-pandemic levels in the EMEA&APAC segment. In addition, during the first half of 2021, certain provinces of Canada, including the most populous provinces, endured lockdowns pursuant to which bars and restaurants were required to close. During the third quarter of 2021, these venues began to reopen with varying degrees of restrictions; however, during the fourth quarter of 2021 as a result of implications from the new coronavirus variant, restrictions in certain provinces were implemented and consumer behavior in the on-premise became more uncertain and as a result sales to the on-premise channel in the fourth quarter of 2021 were negatively impacted. Throughout 2021, the U.S. progressively reopened, and sales to restaurants and bars returned to near pre-coronavirus pandemic levels within the Americas segment but pulled back towards the end of the year as a result of the spread of the Omicron coronavirus variant. Certain sporting events, festivals and other large public gatherings where our products are served have started to return with restrictions including proof of vaccination or negative coronavirus testing requirements. While the U.S., Canada, and Western European countries have seen an increase in vaccination levels throughout 2021, certain Eastern European countries have lagged, and therefore, the risk of further coronavirus pandemic restrictions and governmental imposed lockdowns remains throughout Europe. Throughout the world, any governmental or societal impositions of restrictions on public gatherings, especially if prolonged in nature, will continue to impact on-premise traffic and, in turn, our business.In addition, where we have seen shifts in demand to the off-premise, and shifts back to the on-premise and the related shifts between certain package types, this has strained our supply chain and package availability, requiring that we strategically prioritize certain brands and package types and expand the number of suppliers we work with to ensure we can meet production requirements. Our supply chain continues to work diligently to ensure sufficient supply of these high-demand brand and packages as we adjust to these changing consumer dynamics.
Further, during 2020, we recorded charges of $15.5 million within cost of goods sold related to temporary "thank you" pay for certain essential Americas segment brewery employees. Additionally, in order to support and demonstrate our commitment to the continued viability of the many bars and restaurants which were negatively impacted by the coronavirus pandemic, during the first quarter of 2020, we initiated temporary keg relief programs in many of our markets. We committed to provide customers with reimbursements for untapped kegs that met certain established return requirements in conjunction with the voluntary programs. As a result, during 2020, we recognized a reduction to net sales of $30.3 million ($13.2 million for the Americas segment and $17.1 million for the EMEA&APAC segment) for reimbursements through these keg relief programs, substantially all of which was recognized in the first quarter of 2020 other than immaterial adjustments for changes in estimates during the remainder of 2020, reflecting estimated sales returns and reimbursements through these keg relief programs.
Further, during 2020, we recognized charges of $12.1 million ($9.2 million for the Americas segment and $2.9 million for the EMEA&APAC segment), substantially all of which were recognized in the first quarter of 2020 other than immaterial adjustments for changes in estimates during the remainder of 2020, within cost of goods sold related to obsolete finished goods keg inventories that were not expected to be sold within our freshness specifications, as well as the estimated costs to facilitate the above mentioned keg returns. See Part II—Item 8 Financial Statements and Supplementary Data, Note 1, "Basis of Presentation and Summary of Significant Accounting Policies" for additional details.As a result of the ongoing impacts of the coronavirus pandemic, we continue to take various mitigating actions to offset some of the implications to our employees and communities, as well as the challenges to performance, while also ensuring liquidity and deleveraging remain key priorities. We continue to monitor the coronavirus pandemic and will take additional actions as necessary if the global coronavirus pandemic takes a further negative turn. Such potential actions may include, but are not limited to, drawing on our revolving line of credit facility, issuing additional commercial paper under our U.S. commercial paper program (see Part II—Item 8 Financial Statements and Supplementary Data, Note 11, "Debt" for further discussion of the facilities and our remaining capacity), further accessing the capital markets, reducing discretionary spending including capital expenditures and asset monetization.In response to the global economic uncertainty created by the coronavirus pandemic, our board of directors suspended our regular quarterly dividends on our Class A and Class B common and exchangeable shares in May 2020. In the third quarter of 2021, a quarterly dividend was reinstated. See "Liquidity and Capital Resources" and Item 1A. "Risk Factors" in this report for additional information regarding the impact of the global coronavirus pandemic on our liquidity. We also continue to monitor the impacts of the coronavirus pandemic on the recoverability of our assets, including goodwill and indefinite-lived intangible assets. Given the length and severity of the impacts of the global coronavirus pandemic on our EMEA&APAC segment, as well as the protracted recovery expected in certain on-premise markets, we recorded a goodwill impairment loss of $1,484.3 million in the fourth quarter of 2020. If the duration of the coronavirus pandemic is further prolonged and the severity of its impact continues or worsens, it could result in additional significant impairment losses. See Part II—Item 8 Financial Statements and Supplementary Data, Note 10, "Goodwill andIntangibleAssets" for further details.Revitalization Plan
On October 28, 2019, we initiated a revitalization plan designed to allow us to invest across our portfolio to drive long-term, sustainable growth. The revitalization plan established Chicago, Illinois as our Americas segment operational headquarters. We closed our office in Denver, Colorado and consolidated certain administrative functions into our other existing office locations. As of January 1, 2020, we changed our name to Molson Coors Beverage Company and changed our management structure to two segments - Americas and EMEA&APAC. We began to incur charges related to these restructuring activities during the fourth quarter of 2019 and we recognized severance and retention charges of $4.0 million, $35.6 million and $41.2 million during the years ended December 31, 2021, December 31, 2020 and December 31, 2019, respectively. As of the year ended December 31, 2021, the revitalization plan restructuring charges were substantially complete.
Cost Inflation
We are experiencinghave continued to incur significant cost inflation, including higher transportationmaterials and input costsmanufacturing expenses, which negatively impacted our results of operations duringfor the year ended December 31, 2021. We expect2023, although we experienced moderation in the second half of the year. While cost inflation to continue to have a negative impacthas been high in 2022. Higher transportation costs are a resultall of increased fuel prices, a short supply of truck drivers worldwide and increased freight costs. Driver shortages are forcing us to use the spot market and to pay spot market prices which are higher than they have been in many years. We are taking steps to reduceour markets, the impact of driver shortages by shipping more beverages via rail. Besides impactingto COGS on a percentage basis was higher for our outbound shipments,EMEA&APAC segment than our suppliers are facing difficultyAmericas segment. In addition, consumers in timely delivering the materials we need, and we are also experiencing increased supply costs due to overall cost inflation. The volatility of aluminum prices, inclusive of Midwest Premium and tariffs,certain markets in our EMEA&APAC segment continued to significantly impact our results duringbe impacted by local inflation leading to a reduction in their discretionary purchases. In 2024, we expect inflationary pressures to moderate and improve from those experienced over the year ended December 31, 2021. last year.
To the extent thesematerials and manufacturing prices continue to fluctuate, our business and financial results could continue to be materially adversely impacted. We continue to monitor these risks and rely on our risk management hedging program, increased pricing to our customers, our premiumization strategy and cost savings programs to help mitigate some of the inflationary pressure.pressures. Even if we are able to raise the prices of our products, consumers might react negatively to such price increases, which could have a material adverse effect on, among other things, our brands, reputation and sales. If our competitors maintain or substantially lower their prices, we may lose customers or be forced to lower prices to remain competitive. Our profitability may be impacted by prices that do not offset the inflationary pressures, which would negatively impact gross margins. In addition, even if we increase the prices of our products in response to increases in the cost of commodities or other cost increases, we may not be able to sustain our price increases or customers may trade down to cheaper alternatives.
Premiumization of our Portfolio
In 2021, in order to support continued premiumization of our portfolio, we strategically de-prioritized and rationalized certain non-core SKUs predominantly in the economy segment. While we rationalized certain non-core economy SKUs, we retained key economy brands allowing us to maintain a portfolio for all socio-economic demographics. We believe the continued premiumization of our portfolio will drive sustainable net sales and earnings growth but result in potential volume declines due to the rationalization of certain SKUs and as the portfolio mix shifts towards a higher composition of above premium products.
Items Affecting Americas Segment Results of Operations
Texas Storm
In February 2021, a winter ice storm severely impacted the southern U.S. In particular, local government authorities in Texas were forced to impose energy restrictions, causing the Fort Worth brewery to be offline which resulted in our inability to produce or ship product during the downtime.
Irwindale, California BreweryTruss Impairment and Sale
Following management approval in December 2019, in January 2020,During the first quarter of 2022, we announced plans to cease production at our Irwindale, California brewery and entered intorecognized an option agreement with Pabst, granting Pabst an option to purchase our Irwindale, California brewery, including plant equipment and machinery and the underlying land for $150impairment loss of $28.6 million subject to adjustment as further specified in the option agreement. Pursuantrelated to the option agreement, on May 4, 2020, Pabst exercised its optionTruss joint venture asset group of which $12.1 million was attributable to purchase the Irwindale brewery and the purchase was completed in the fourth quarter of 2020. Production at the Irwindale brewery ceasednoncontrolling interest. Additionally, during the third quarter of 2020. We2023, we sold our controlling interest in Truss and recognized a loss of $11.1 million. These losses were recorded special items charges related to the Irwindale brewery closure as further discussed inwithin other operating income (expense), net. See Part II—Item 8 Financial Statements and Supplementary Data, Note 7, "Special Items"17, "Other Operating Income (Expense), net". and Part II—Item 8 Financial Statements and Supplementary Data, Note 3, "Investments" for further information.Montreal Brewery SaleGoodwill Impairment
In further efforts to optimize the Canada and U.S. brewery network, in the third quarter of 2017, we announced a plan to build a more efficient and flexible brewery in Longueuil, Québec. During the second quarter of 2019, we completed the sale of our Montreal brewery for $96.2 million, resulting in a $61.3 million gain, which was recorded as special items, net in the consolidated statement of operations. In conjunction with the sale, we agreed to lease back the existing property to continue operations on an uninterrupted basis until the new brewery became operational. Completion of the Longueuil, Québec brewery occurred during the fourth quarter of 2021.
Items Affecting EMEA&APAC Segment Results of Operations
Fiscal Year 2020 Goodwill Impairment
ImpairmentMontreal/Longueuil, Québec Brewery and Distribution Centers Labor Strike
From late March 2022 until June 2022, approximately 400 unionized employees in our Montreal/Longueuil, Québec brewery and distribution centers went on strike which adversely affected our business and operations. Over the course of a Disposal Group
During the third quarter of 2020,2022, we recognized an impairment loss of $30.0 million recorded within special items, net related torecovered from the held for sale classification of a disposal group withinstrike by rebuilding inventory and replenishing our India business, representing an insignificant part of our EMEA&APAC segment. The saleretailers' shelves. As the brewery had not yet fully recovered until the end of the India business disposal group was completed duringthird quarter, results for the second and third quarters of 2022 were adversely impacted by this strike.
Keystone Litigation
Items Affecting EMEA&APAC Segment Results of Operations
Staropramen Brands Impairment
Russia-Ukraine Conflict
In February 2022, Russia invaded Ukraine and the conflict remains ongoing. As a result, we suspended exports of all our brands to Russia and subsequently terminated the license to produce any of our brands in Russia. While not material to our consolidated net sales, the Russia-Ukraine conflict negatively impacted our EMEA&APAC segment net sales for the years ended December 31, 2023 and December 31, 2022. In addition, the Russia-Ukraine conflict has caused a negative impact to the global economy which has impacted our Company, driving further increases to materials and manufacturing expenses as discussed in more detail above. See risk factors related to this conflict at Part I.—Item 1A. "Risk Factors". Consolidated Results of Operations
| | | | | | | | | | | | | | | | | | | | | | | | | | | | | |
| | For the years ended |
| December 31, 2023 | | Change | | December 31, 2022 | | Change | | December 31, 2021 |
| (In millions, except percentages and per share data) |
| Net sales | $ | 11,702.1 | | | 9.4 | % | | $ | 10,701.0 | | | 4.1 | % | | $ | 10,279.7 | |
| Cost of goods sold | (7,333.3) | | | 4.1 | % | | (7,045.8) | | | 13.2 | % | | (6,226.3) | |
| Gross profit | 4,368.8 | | | 19.5 | % | | 3,655.2 | | | (9.8) | % | | 4,053.4 | |
| Marketing, general and administrative expenses | (2,779.9) | | | 6.2 | % | | (2,618.8) | | | 2.5 | % | | (2,554.5) | |
| Goodwill impairment | — | | | N/M | | (845.0) | | | N/M | | — | |
| Other operating income (expense), net | (162.7) | | | 321.5 | % | | (38.6) | | | (13.3) | % | | (44.5) | |
| Equity income (loss) | 12.0 | | | 155.3 | % | | 4.7 | | | N/M | | — | |
| Operating income (loss) | 1,438.2 | | | 813.1 | % | | 157.5 | | | (89.2) | % | | 1,454.4 | |
| Total non-operating income (expense), net | (185.7) | | | (15.6) | % | | (220.0) | | | 2.1 | % | | (215.4) | |
| Income (loss) before income taxes | 1,252.5 | | | N/M | | (62.5) | | | N/M | | 1,239.0 | |
| Income tax benefit (expense) | (296.1) | | | 138.8 | % | | (124.0) | | | (46.2) | % | | (230.5) | |
| Net income (loss) | 956.4 | | | N/M | | (186.5) | | | N/M | | 1,008.5 | |
| Net (income) loss attributable to noncontrolling interests | (7.5) | | | N/M | | 11.2 | | | N/M | | (2.8) | |
| Net income (loss) attributable to MCBC | $ | 948.9 | | | N/M | | $ | (175.3) | | | N/M | | $ | 1,005.7 | |
| Net income (loss) attributable to MCBC per diluted share | $ | 4.37 | | | N/M | | $ | (0.81) | | | N/M | | $ | 4.62 | |
| | | | | | | | | |
| Financial volume in hectoliters | 83.772 | | | 1.8 | % | | 82.272 | | | (2.1) | % | | 84.028 | |
N/M = Not meaningful
| | | | | | | | | | | | | | | | | | | | | | | | | | | | | |
| | For the years ended |
| December 31, 2021 | | Change | | December 31, 2020 | | Change | | December 31, 2019 |
| (In millions, except percentages and per share data) |
| Net sales | $ | 10,279.7 | | | 6.5 | % | | $ | 9,654.0 | | | (8.7) | % | | $ | 10,579.4 | |
| Cost of goods sold | (6,226.3) | | | 5.8 | % | | (5,885.7) | | | (7.7) | % | | (6,378.2) | |
| Gross profit | 4,053.4 | | | 7.6 | % | | 3,768.3 | | | (10.3) | % | | 4,201.2 | |
| Marketing, general and administrative expenses | (2,554.5) | | | 4.8 | % | | (2,437.0) | | | (10.7) | % | | (2,728.0) | |
| Special items, net | (44.5) | | | (97.4) | % | | (1,740.2) | | | 145.5 | % | | (708.8) | |
| Operating income (loss) | 1,454.4 | | | N/M | | (408.9) | | | N/M | | 764.4 | |
| Total other income (expense), net | (215.4) | | | (8.3) | % | | (235.0) | | | (17.4) | % | | (284.5) | |
| Income (loss) before income taxes | 1,239.0 | | | N/M | | (643.9) | | | N/M | | 479.9 | |
| Income tax benefit (expense) | (230.5) | | | (23.6) | % | | (301.8) | | | 29.1 | % | | (233.7) | |
| Net income (loss) | 1,008.5 | | | N/M | | (945.7) | | | N/M | | 246.2 | |
| Net (income) loss attributable to noncontrolling interests | (2.8) | | | (15.2) | % | | (3.3) | | | (26.7) | % | | (4.5) | |
| Net income (loss) attributable to MCBC | $ | 1,005.7 | | | N/M | | $ | (949.0) | | | N/M | | $ | 241.7 | |
| Net income (loss) attributable to MCBC per diluted share | $ | 4.62 | | | N/M | | $ | (4.38) | | | N/M | | $ | 1.11 | |
| | | | | | | | | |
| Financial volume in hectoliters | 84.028 | | | (0.5) | % | | 84.479 | | | (8.9) | % | | 92.722 | |
| Brand volume in hectoliters | 80.673 | | | (1.7) | % | | 82.033 | | | (7.8) | % | | 88.946 | |
N/M = Not meaningfulForeign currency impacts on results
During 2021,For the year ended December 31, 2023, foreign currency movements favorably impactedhad the following impacts on our USD consolidated results:
•Net sales - Favorable impact of $9.5 million (favorable impact for EMEA&APAC of $56.0 million, partially offset by the unfavorable impact for Americas of $46.5 million).
•Cost of goods sold - Favorable impact of $1.0 million (favorable impact for Americas and Unallocated of $34.9 million and $1.8 million, respectively, partially offset by the unfavorable impact for EMEA&APAC of $35.7 million).
•MG&A - Favorable impact of $1.3 million (favorable impact for Americas of $14.2 million, partially offset by the unfavorable impact for EMEA&APAC of $12.9 million).
•Income (loss) before income taxes - Favorable impact of $9.1 million (favorable impact for Unallocated of $15.9 million, partially offset by the unfavorable impact for EMEA&APAC and Americas of $5.3 million and $1.5 million, respectively).
The impacts of foreign currency movements on our consolidated USD income before income taxesresults described above for the year ended December 31, 2023 were primarily due to the strength of the USD as compared to the CAD partially offset by $4.5 million (favorably impacting income before income taxesthe weakening of our Americas segment by $2.1 million, our EMEA&APAC segment by $0.3 million and unallocated by $2.1 million). the USD as compared to all currencies throughout Europe in which we operate.
Included in this amountthese amounts are both translational and transactional impacts of changes in foreign exchange rates. We calculate the impact of foreign exchange by translating our current period local currency results at the average exchange rates used to translate the financial statements in the comparable prior year period during the respective period throughout the year and comparing that amount with the reported amount for the period. The impact of transactional foreign currency gains and losses, including the impact of undesignated foreign currency forwards, is recorded within other non-operating income (expense), net in our consolidated statements of operations.
Volume
Worldwide brandFinancial volume (or "brand volume" when discussed by segment) reflectsrepresents owned or actively managed brands sold to unrelated external customers within our geographic markets (net of returns and allowances), royalty volume and our proportionate share of equity investment worldwide brand volume calculated consistently with MCBC owned volume. Financial volume represents owned brands sold to unrelated external customers within our geographical markets, net of returns and allowances as well as contract brewing, wholesalewholesale/factored non-owned brand volume and company-owned distribution volume. Contract brewingThis metric is presented on an STW basis to reflect the sales from our operations to our direct customers, generally distributors. We believe this metric is important and wholesaleruseful for investors and management because it gives an indication of the amount of beer and adjacent products that we have produced and shipped to customers. This metric excludes royalty volume, is included within financial volume, but is removed from worldwide brand volume, as this is non-owned volume for which we do not directly control performance. Royalty volume consists of our brands produced and sold by third parties under various license and contract-brewing agreementscontract brewing agreements. Factored volume in our EMEA&APAC segment is the distribution of beer, wine, spirits and because thisother products owned and produced by other companies to the on-premise channel, which is owneda common arrangement in the U.K.
We also utilize net sales per hectoliter and cost of goods sold per hectoliter, as well as the year over year changes in such metrics, as key metrics for analyzing our results. These metrics are calculated as net sales and cost of goods sold, respectively, per our consolidated statements of operations divided by financial volume it is included in worldwide brand volume. Our worldwide brand volume definition also includes an adjustment from Sales-to-Wholesaler (STW) volume to Sales-to-Retailer (STR) volume.for the respective period. We believe the brand volume metric isthese metrics are important and useful tofor investors and management because unlike financial volume and STWs, it provides the closestthey provide an indication of the performancetrends in pricing and sales mix on our net sales and the trends of sales mix and other cost impacts such as inflation on our brandscost of goods sold.
In late 2021 we de-prioritized and rationalized certain non-core SKUs, predominantly in relationthe economy segment, in order to market and competitor sales trends.
As part of the revitalization planfocus our strategy to growon growing our above premium portfolio and expandexpanding beyond the beer aisle, we have de-prioritized certain non-core economy SKUs.aisle. This strategy iswas intended to drive sustainable net sales growth and earnings growth, despite potential volume declines due to the rationalization of certain SKUs and as the portfolio mix shifts towardsshifted toward a higher composition of above premium products.
Table The strategy of Contentspremiumization, growing our above premium portfolio and expanding beyond the beer aisle continues to be a focus under the Acceleration Plan that was announced in the fourth quarter of 2023. | | | | | | | | | | | | | | | | | | | | | | | | | | | | | |
| | For the years ended |
| | December 31, 2021 | | Change | | December 31, 2020 | | Change | | December 31, 2019 |
| | (In millions, except percentages) |
| Volume in hectoliters | | | | | | | | | |
| Financial volume | 84.028 | | | (0.5) | % | | 84.479 | | | (8.9) | % | | 92.722 | |
| Less: Contract brewing and wholesaler volume | (6.730) | | | 5.9 | % | | (6.355) | | | (17.6) | % | | (7.715) | |
| Add: Royalty volume | 4.475 | | | 18.3 | % | | 3.783 | | | (10.5) | % | | 4.226 | |
| Add: STW to STR adjustment | (1.100) | | | N/M | | 0.126 | | | N/M | | (0.287) | |
| Total worldwide brand volume | 80.673 | | | (1.7) | % | | 82.033 | | | (7.8) | % | | 88.946 | |
N/M = Not meaningful
Net sales
The following table highlights the drivers of the change in net sales and net sales per hectoliter for the year ended December 31, 2021 versus2023 compared to December 31, 2020, by segment2022 (in percentages).:
| | | | | | | | | | | | | | | | | | | | | | | |
| Financial Volume | | Price and Sales Mix | | Currency | | Total |
| Consolidated | (0.5) | % | | 5.2 | % | | 1.8 | % | | 6.5 | % |
| Americas | (2.0) | % | | 4.0 | % | | 1.0 | % | | 3.0 | % |
| EMEA&APAC | 3.9 | % | | 15.7 | % | | 6.3 | % | | 25.9 | % |
| | | | | | | | | | | | | | | | | | | | | | | |
| Financial Volume | | Price and Sales Mix | | Currency | | Total |
| Consolidated net sales | 1.8 | % | | 7.5 | % | | 0.1 | % | | 9.4 | % |
| Consolidated net sales per hectoliter | N/A | | 7.3 | % | | 0.1 | % | | 7.4 | % |
The following table highlights the drivers
Net sales increased 9.4% for the year ended December 31, 2020 versus 2023, compared to prior year driven by favorable price and sales mix, higher financial volumes and favorable foreign currency impacts.
Financial volumes increased 1.8% for the year ended December 31, 2019,2023, compared to prior year, primarily due to higher financial volumes in the Americas segment, partially offset by segment (in percentages).lower EMEA&APAC financial volumes.
| | | | | | | | | | | | | | | | | | | | | | | |
| Financial Volume | | Price and Sales Mix | | Currency | | Total |
| Consolidated | (8.9) | % | | 0.1 | % | | 0.1 | % | | (8.7) | % |
| Americas | (6.0) | % | | 1.7 | % | | (0.1) | % | | (4.4) | % |
| EMEA&APAC | (17.3) | % | | (11.1) | % | | 0.5 | % | | (27.9) | % |
NetPrice and sales mix favorably impacted net sales and net sales per hectoliter on a brand volume basis in local currency increased 3.8% for the year ended December 31, 2021 compared to prior year. The increase for the year ended December 31, 2021 was2023, by 7.5% and 7.3%, respectively, primarily due to positiveincreased net pricing including the rollover benefit in both the Americas and EMEA&APAC segments,first three quarters due to taking several price increases in the prior year, as well as favorable sales mix. Favorable sales mix resulting from portfolio premiumization and fewer on-premise channel restrictions. Net sales per hectoliter on a financial volume basis in local currency increased 5.2% for the year ended December 31, 2021, compared to prior year.
Worldwide brand volume decreased 1.7% for the year ended December 31, 2021, compared to prior year, while financial volume decreased 0.5% compared to prior year. The decline in brand volumes for the year ended December 31, 2021 was primarilydriven by geographic mix due to lower economy portfoliohigher volumes including the de-prioritization of certain non-core SKUs in the U.S., partially offsetAmericas segment and lower contract brewing volume related to the wind down of a contract brewing arrangement leading up to the termination by growththe end of 2024.
A discussion of currency impacts on net sales is included in the above premium portfolio volumes due to the increased premiumization efforts and favorable U.S. domestic shipments as we worked to rebuild distributor inventory levels.
"Foreign currency impact on results" section above. Cost of goods sold
Cost of goods sold per hectoliter in local currency increased 4.4%4.1% for the year ended December 31, 2021,2023, compared to prior year. The increaseyear, primarily due to higher cost of goods sold per hectoliter and higher financial volumes. Cost of goods sold per hectoliter increased 2.2% for the year ended December 31, 2021 was2023, compared to prior year, primarily due to cost inflation mainly on inputrelated to materials and transportation costs and the mix impacts of the portfolio premiumizationmanufacturing expenses and unfavorable foreign exchange movements,mix, partially offset by changes toin our unrealized mark-to-market commodity derivative positions lower depreciationof $126.9 million, cost savings and cost savings.volume leverage.
Marketing, general and administrative expenses
Marketing, general and administrativeMG&A expenses increased 4.8%6.2% for the year ended December 31, 2021,2023, compared to prior year. The increase for the year, ended December 31, 2021 was primarily due to higher incentive compensation expense and increased marketing spend in both the Americasinvestment on core and EMEA&APAC segments to support new innovations and coreinnovation brands, as well as the cycling of lower spend in areas impacted by the coronavirus pandemic, partially offset by lower depreciation expense, cost savingscycling the recording of a $56.0 million accrued liability in the prior year related to potential losses as a result of the ongoing Keystone litigation case.
Goodwill Impairment
Special items,Other operating income (expense), net
Total othernon-operating income (expense), net
Total other income (expense),non-operating expense, net improved 8.3%decreased 15.6% for the year ended December 31, 2021,2023, compared to prior year primarily due to lower pension and OPEB non-service costs and lowernet interest expense driven by higher interest income as well as the repayment of debt as a result of our continued deleveraging actions.actions and the favorable impact of transactional foreign currency impacts, partially offset by lower pension and OPEB non-service net benefit.
Income taxes benefit (expense) | | | | | | | | | | | | | | | | | |
| For the years ended |
| December 31, 2021 | | December 31, 2020 | | December 31, 2019 |
| Effective tax rate | 19 | % | | (47) | % | | 49 | % |
| | | | | | | | | | | | | | | | | |
| For the years ended |
| December 31, 2023 | | December 31, 2022 | | December 31, 2021 |
| Effective tax rate | 24 | % | | (198) | % | | 19 | % |
The increase in our effective tax rate for the year ended December 31, 2021 as2023 compared to the prior year ended December 31, 2020 was primarily due to (i) the approximate $1.5 billionimpact of the $845 million partial goodwill impairment, charge inrecorded within our EMEA&APACAmericas segment recognized in the fourth quarter of 2020, and (ii) $18 million of tax expense recognized in the second quarter of 2021,2022, which related to the remeasurement of our deferredgoodwill not deductible for tax liabilities following an announced corporate income tax rate increase in the U.K. from 19% to 25%. These increases to the effective tax rate were partially offset by $135 million of tax expense recognized in the second quarter of 2020 related to the hybrid regulations enacted in the U.S., and the release of $73 million of reserves for unrecognized tax positions as a result of an effective settlement reached on a tax audit during the third quarter of 2021. As a result of the effective settlement reached, which included resolution of the impact of the final U.S. tax hybrid regulations, we paid cash tax and associated interest of approximately $125 million in the fourth quarter of 2021.purposes.
Our tax rate can be more or less volatile and may change with, among other things, the amount and source of pre-taxpretax income or loss, our ability to utilize foreign tax credits, excess tax benefits or deficiencies from share-based compensation, changes in tax laws and the movement of liabilities established pursuant to accounting guidance for uncertain tax positions as statutes of limitations expire, positions are effectively settled or when additional information becomes available. There are proposed or pending tax law changes in various jurisdictions and other changes to regulatory environments in countries in which we do business that, if enacted, maycould have an impact on our effective tax rate.
The OECD and EU have proposed changes to the existing tax laws of member countries. For instance, the OECD has introduced model rules for a new 15% global minimum tax framework, as well as a proposal on the allocation of profit among tax jurisdictions in which companies operate. In December 2022, the EU member states agreed to incorporate the 15% global minimum tax into their respective domestic laws effective for fiscal years beginning on or after December 31, 2023. Additionally, several non-EU countries, including the U.K., have recently proposed and/or adopted legislation consistent with the OECD global minimum tax framework. We are continuing to evaluate the potential impact on future periods which could affect our effective tax rate.
Cost Savings Initiatives
Our next generation cost savings program, which began in 2020, is expected to deliver approximately $600delivered $605 million of cost savings over the three year program, through 2022which ended December 31 2022. The program was focused on building our capabilities and is focused around many of the same functions of the business as the 2017reorganizing to 2019 program. These cost savings include approximately $150 million related to thesupport our commercial revitalization plan.strategy. Total cost savings delivered in 20212022 and 20202021 totaled approximately $115 million and $220 million, and $270 million, respectively. While we have not announced a formal cost savings program after the completion of this program in 2022, we continue to generate cost savings through initiatives in the normal course of business.
Depreciation and Amortization
Depreciation and amortization expense of $786.1 million for the year ended December 31, 2021 decreased by $135.9 million compared to $922.0 million for the year ended December 31, 2020, primarily due to the decrease in accelerated depreciation expense recorded as a result of certain facility closures as well as assets becoming fully depreciated during the year. See Part II—Item 8 Financial Statements and Supplementary Data, Note 7, "Special Items" for further discussion.
Segment Results of Operations
Americas Segment
| | For the years ended |
| December 31, 2021 | | Change | | December 31, 2020 | | Change | | December 31, 2019 |
| (In millions, except percentages) |
| For the years ended | | | For the years ended |
| December 31, 2023 | | | December 31, 2023 | | Change | | December 31, 2022 | | Change | | December 31, 2021 |
| (In millions, except percentages) | | | (In millions, except percentages) |
Net sales(1) | Net sales(1) | $ | 8,485.0 | | | 3.0 | % | | $ | 8,237.0 | | | (4.4) | % | | $ | 8,618.2 | |
| Income (loss) before income taxes | Income (loss) before income taxes | $ | 1,176.5 | | | 8.9 | % | | $ | 1,080.5 | | | 67.5 | % | | $ | 645.0 | |
| Financial volume in hectoliters(2) | Financial volume in hectoliters(2) | 63.737 | | | (2.0) | % | | 65.010 | | | (6.0) | % | | 69.180 | |
| Brand volume in hectoliters | 59.334 | | | (3.2) | % | | 61.313 | | | (5.1) | % | | 64.640 | |
Financial volume in hectoliters(2) | |
Financial volume in hectoliters(2) | |
(1)Includes gross inter-segment sales and volumes which are eliminated in the consolidated totals.
(2)Excludes royalty volume of 2.683 million hectoliters, 2.719 million hectoliters and 2.507 million hectoliters 2.052 million hectolitersfor the years ended December 31, 2023, 2022 and 2.258 million hectoliters for 2021, 2020 and 2019, respectively. The results for 2019 were recasted to reflect the segment changes as part of the revitalization plan.
Net sales
The following table highlights the drivers of the change in net sales and volume
Netnet sales per hectoliter on a brand volume basis in local currency increased 3.2% for the year ended December 31, 2021,2023 compared to December 31, 2022 (in percentages):
| | | | | | | | | | | | | | | | | | | | | | | |
| Financial Volume | | Price and Sales Mix | | Currency | | Total |
| Americas net sales | 3.6 | % | | 5.1 | % | | (0.5) | % | | 8.2 | % |
| Americas net sales per hectoliter | N/A | | 5.0 | % | | (0.6) | % | | 4.4 | % |
Net sales increased 8.2% for the year ended December 31, 2023, compared to prior year.year, driven by favorable price and sales mix as well as higher financial volumes, partially offset by unfavorable foreign currency impacts.
Financial volumes increased 3.6% for the year ended December 31, 2023, compared to prior year, primarily due to an increase in U.S. domestic shipments driven by volume growth in our core brands and higher shipments in Canada mainly attributed to cycling the prior year impacts of the Québec labor strike, partially offset by lower Latin America volumes. The increase in U.S. volume was driven in part by the continued shifts in consumer purchasing behavior largely within the premium beer segment.
Price and sales mix favorably impacted net sales and net sales per hectoliter for the year ended December 31, 2023, by 5.1% and 5.0%, respectively, primarily due to increased net pricing including the rollover benefit in the first three quarters of the year of several price increases taken in the previous year and favorable sales mix as a result of lower contract brewing volume related to the wind down of a contract brewing arrangement leading up to the termination by the end of 2024.
A discussion of currency impacts on net sales is included in the "Foreign currency impact on results" section above.
Income (loss) before income taxes
Income before income taxes improved 400.7% for the year ended December 31, 2021 was primarily due to positive net pricing and favorable brand mix, partially offset by unfavorable geographic mix attributed to growing license volume in Latin America. Net sales per hectoliter on a financial volume basis in local currency increased 4.0% for the year ended December 31, 2021, compared to the prior year.
Brand volume decreased 3.2% for the year ended December 31, 2021, compared to prior year. The decrease for the year ended December 31, 2021 was primarily due to a decline in the U.S. economy portfolio, including the de-prioritization and rationalization of non-core SKUs, partially offset by growth in Latin America and the U.S. above premium portfolio. Financial volumes decreased 2.0% for the year ended December 31, 2021,2023, compared to prior year, due to lower brand volume, partially offset by favorable U.S. domestic shipment trends as we worked to rebuild distributor inventory levels.
Income (loss) before income taxes
Income (loss) before income taxes increased 8.9% for the year ended December 31, 2021, compared to prior year. The increase for the year ended December 31, 2021 was primarily due to positivecycling a non-cash partial goodwill impairment charge of $845.0 million, increased net pricing, and favorable brand mix,higher financial volumes, lower net special items charges, lower depreciation expense, and cost savingslogistics expenses, partially offset by cost inflation mainly on inputrelated to materials and transportation costs, lower financial volumesmanufacturing expenses and higher MG&A spend. The higherexpense. Higher MG&A spend was driven by higherprimarily due to increased marketing spend to support new innovationsinvestment behind our core and coreinnovation brands and the cycling of lower spend in areas impacted by the coronavirus pandemic,higher incentive compensation expense, partially offset by lower incentive compensation expense, cost savings and equity income fromcycling the TYC joint venture which started distribution in Texas inrecording of a $56.0 million accrued liability related to potential losses as a result of the third quarter of 2021.ongoing Keystone litigation case.
EMEA&APAC Segment | | For the years ended |
| December 31, 2021 | | Change | | December 31, 2020 | | Change | | December 31, 2019 |
| (In millions, except percentages) |
| For the years ended | | | For the years ended |
| December 31, 2023 | | | December 31, 2023 | | Change | | December 31, 2022 | | Change | | December 31, 2021 |
| (In millions, except percentages) | | | (In millions, except percentages) |
Net sales(1) | Net sales(1) | $ | 1,802.3 | | | 25.9 | % | | $ | 1,431.9 | | | (27.9) | % | | $ | 1,986.4 | |
| Income (loss) before income taxes | Income (loss) before income taxes | $ | 32.9 | | | N/M | | $ | (1,603.7) | | | N/M | | $ | 102.4 | |
| Financial volume in hectoliters(2) | Financial volume in hectoliters(2) | 20.315 | | | 3.9 | % | | 19.560 | | | (17.3) | % | | 23.660 | |
| Brand volume in hectoliters | 21.339 | | | 3.0 | % | | 20.720 | | | (14.8) | % | | 24.306 | |
Financial volume in hectoliters(2) | |
Financial volume in hectoliters(2) | |
N/M = Not meaningful
(1)Includes gross inter-segment sales and volumes which are eliminated in the consolidated totals.
(2)Excludes royalty volume of 1.9680.935 million hectoliters, 1.7311.012 million hectoliters and 1.968 million hectoliters for the years ended December 31, 2023, 2022 and 2021, 2020 and 2019, respectively. The results for 2019 were recasted to reflect the segment changes as part of the revitalization plan.
Net sales
The following table highlights the drivers of the change in net sales and volume
Netnet sales per hectoliter on a brand volume basis in local currency increased 10.1% for the year ended December 31, 2021,2023 compared to prior year. The increaseDecember 31, 2022 (in percentages):
| | | | | | | | | | | | | | | | | | | | | | | |
| Financial Volume | | Price and Sales Mix | | Currency | | Total |
| EMEA&APAC net sales | (3.0) | % | | 14.7 | % | | 2.8 | % | | 14.5 | % |
| EMEA&APAC net sales per hectoliter | N/A | | 15.2 | % | | 2.9 | % | | 18.1 | % |
Net sales increased 14.5% for the year ended December 31, 2021 was primarily due2023, compared to prior year driven by favorable geographic, channelprice and brandsales mix and positive net pricing. Net sales per hectoliter onas well as favorable foreign currency impacts, partially offset by a decline in financial volumes.
Financial volume basis in local currency increased 15.1%s decreased 3.0% for the year ended December 31, 2021, compared to prior year.
Brand volume increased 3.0% for the year ended December 31, 2021, compared to prior year. The increase for the year ended December 31, 2021 was primarily due to the benefit of fewer on-premise restrictions and growth in the above premium portfolio. Financial volumes increased 3.9% for the year ended December 31, 2021,2023, compared to prior year, primarily due to higher branddeclines in Central and Eastern Europe due to industry softness given the inflationary pressures on the consumer, partially offset by resilient demand and growth in above premium volumes in the U.K.
Price and factored sales.sales mix favorably impacted net sales and net sales per hectoliter for the year ended December 31, 2023, by 14.7% and 15.2%, respectively, primarily due to increased net pricing including the rollover benefits from price increases taken in the previous year and favorable sales mix driven by geographic mix and premiumization.
A discussion of currency impacts on net sales is included in the "Foreign currency impact on results" section above.
Income (loss) before income taxes
Income (loss)Loss before income taxes was income of $32.9$41.1 million for the year ended December 31, 20212023, compared to a lossincome before income taxes of $1,603.7$61.0 million in the prior year. The improvement of income (loss) before income taxes of $1,636.6 million for the year ended December 31, 2021decline was primarily due to the cyclingimpairment charge of special items in the prior year$160.7 million to our indefinite-lived intangible asset related to the $1.5 billion goodwill impairmentStaropramen family of the EMEA&APAC segment, favorable sales mix, positive net pricing and higher financial volumes, partially offset bybrands, as well as cost inflation on materials, logistics and manufacturing expenses, higher MG&A spend, mainly duelower financial volumes as well as the unfavorable impact of foreign currency partially offset by increased net pricing to the cyclingcustomers and favorable sales mix.
Unallocated Segment
We have certain activity that is not allocated to our segments, andwhich has been reflected as "Unallocated" below. Specifically, "Unallocated" activity primarily includes financing-related costs such as interest expense and income, foreign exchange gains and losses on intercompany balances and realized and unrealized changes in fair value on instruments not designated in hedging relationships related to financing and other treasury-related activities and the unrealized changes in fair value on our commodity swaps not designated in hedging relationships.relationships recorded within cost of goods sold, which are later reclassified when realized to the segment in which the underlying exposure resides. Additionally, only the service cost component of net periodic pension and OPEB cost is reported within each operating segment, and all other components remain unallocated.
| | | | For the years ended | | For the years ended |
| | | December 31, 2021 | | Change | | December 31, 2020 | | Change | | December 31, 2019 | | December 31, 2023 | | Change | | December 31, 2022 | | Change | | December 31, 2021 |
| | | (In millions, except percentages) | | (In millions, except percentages) |
| Cost of goods sold | Cost of goods sold | $ | 236.6 | | | 119.9 | % | | $ | 107.6 | | | N/M | | $ | (0.8) | |
| Gross profit | Gross profit | 236.6 | | | 119.9 | % | | 107.6 | | | N/M | | (0.8) | |
| Operating income (loss) | Operating income (loss) | 236.6 | | | 119.9 | % | | 107.6 | | | N/M | | (0.8) | |
| | Total other income (expense), net | (207.0) | | | (9.3) | % | | (228.3) | | | (14.4) | % | | (266.7) | |
| Total non-operating income (expense), net | |
| Total non-operating income (expense), net | |
| Total non-operating income (expense), net | |
| Income (loss) before income taxes | Income (loss) before income taxes | $ | 29.6 | | | N/M | | $ | (120.7) | | | (54.9) | % | | $ | (267.5) | |
N/M = Not meaningful
Cost of goods sold
The unrealized changes in fair value on our commodity derivatives, which are economic hedges, are recorded as cost of goods sold within unallocated and make up the entiretysubstantially all of the activity presented withwithin cost of goods sold in the table above for 2021, 2020the years ended December 31, 2023, 2022 and 2019.2021. As the exposure we are managing is realized, we reclassify the gain or loss on our commodity derivatives to the segment in which the underlying exposure resides, allowing our segments to realize the economic effects of the derivative without the resulting unrealized mark-to-market volatility. See Part II—Item 8 Financial Statements and Supplementary Data, Note 16,10, "Derivative Instruments and Hedging Activities" for further information. Total othernon-operating income (expense), net
Total othernon-operating expense, net decreased 9.3%13.0% for the year ended December 31, 20212023 compared to the prior year primarily due to lower net interest expense and the favorable impact of transactional foreign currency, partially offset by lower pension and OPEB non-service costs and lower interest expense driven by the repayment of debt as a result of our continued deleveraging actions. net benefit.
Liquidity and Capital Resources
Liquidity
Overview
Our primary sources of liquidity have includedinclude cash provided by operating activities and access to external capital. However, the ongoing worldwide disruption caused by the coronavirus pandemicWe continue to monitor world events which may create credit or economic challenges that could materially affectadversely impact our future access to our sources of liquidity. In the event of a sustained market deterioration and declines in net sales, profit andor operating cash flow, we may needflows and our ability to obtain additional liquidity, which would require us to evaluate available alternatives and take appropriate actions. liquidity. We currently believe that our cash and cash equivalents, cash flows from operations and cash provided by short-term and long-term borrowings, when necessary, will be adequate to meet our ongoing operating requirements, scheduled principal and interest payments on debt, anticipated dividend payments, capital expenditures and other obligations for the twelve months subsequent to the date of the issuance of this annual report and our long-term liquidity requirements.
We continue to focus on navigating the ongoing challenges presented by the coronavirus pandemic by preserving our liquidity and managing our cash flow through taking preemptive actions to enhance our ability to meet our short-term liquidity needs. Specifically, we have taken several actions and considered various potential actions that may be needed to meet short-term and mid-term liquidity needs and have resources in place should we need to act on any of these quickly. Such potential actions include, but are not limited to, drawing on our $1.5 billion revolving credit facility, including issuing commercial paper under our U.S. commercial paper program (see Part II—Item 8. Financial Statements and Supplementary Data, Note 11, "Debt" regarding details of our current borrowings and remaining capacities under these programs), further accessing the capital markets, reducing discretionary spending including marketing, general and administrative as well as capital expenditures, asset monetization, and taking advantage of certain government-sponsored legislation and programs. We intend to maintain our investment grade debt rating as demonstrated by our continued deleveraging actions which included the repayment of our $1.0 billion 2.1% notes that were due July 2021.We do not have any restrictions that prevent or limit our ability to declare or pay dividends. On July 15, 2021, our Company's Board of Directors reinstated a quarterly dividend after it was suspended during the second quarter of 2020 to preserve our liquidity position as a result of the coronavirus pandemic.
While we currently expect to have the necessary cash on hand to repay obligations when due, declines in net sales and profit could have a material adverse effect on our financial operations, cash flow and our ability to raise capital. The coronavirus pandemic is ongoing, and because of its dynamic nature, including uncertainties relating to the spread of variants, the rate of vaccinations and the efficacy of vaccines, the duration of the coronavirus pandemic, the duration of on-premise restrictions and closures and related prolonged weakening of economic or other negative conditions, including the impacts on the global supply chain and governmental reactions, we cannot fully anticipate future conditions given the substantial uncertainties in the economy in general. We may have unexpected costs and liabilities; revenue and cash provided by operations may decline; macroeconomic conditions may weaken; and competitive pressures may increase. These factors may result in difficulty maintaining liquidity, meeting our deleverage commitments and complying with our revolving credit facility covenants. As a result, our credit ratings could be downgraded, which would increase our costs of future borrowing and harm our ability to refinance our debt in the future on acceptable terms or at all. However, in anticipation of these uncertainties, we entered into Amendment No. 2 to our revolving credit facility on June 19, 2020. While the amendment did not increase our borrowing capacity or extend the term of the facility, it, among other things, revised the leverage ratios under the financial maintenance covenant for each fiscal quarter ending on or after June 30, 2020 through the maturity of the Credit Agreement.
There can be no assurance that we will be able to secure additional liquidity if our revolving credit facility is fully drawn, the capital markets become inaccessible or if our credit rating is adversely impacted, which may result in difficulties in accessing debt markets or increase our debt costs. Even if we have access to the capital markets, we may not be able to raise capital on acceptable terms or at all. If we are unable to maintain or access adequate liquidity, our ability to timely pay our obligations when due could be adversely affected.
Continued disruption and declines in the global economy could also impact our customers' liquidity and capital resources and therefore our ability to collect, or the timeliness of collection of our accounts receivable from them, which may have a material adverse impact on our performance, cash flows and capital resources. We continue to monitor our accounts receivable aging and have recorded reserves as appropriate. In addition, measures taken by governmental agencies to provide relief to businesses could further impact our ability to collect from customers. See Part II—Item 8 Financial Statements and Supplementary Data, Note 1, “Basis of Presentation and Summary of Significant Accounting Policies” for additional discussion related to our accounts receivable and associated reserves.
Additionally, in response to the coronavirus pandemic, various governmental authorities globally implemented relief programs which we continue to monitor and evaluate, such as the CARES Act in the U.S. Certain of these relief programs
provide temporary deferrals of non-income based tax payments, which positively impacted our operating cash flows in 2020. Of the $130 million of temporary net tax payment deferrals as of December 31, 2020, approximately $105 million was repaid during the year ended December 31, 2021, with approximately $25 million outstanding as of December 31, 2021. The majority of the remaining balance is expected to be paid during the year ended December 31, 2022.
While a significant portion of our cash flows from operating activities isare generated within the U.S., our cash balances may be comprised ofinclude cash held outside the U.S. and in currencies other than the USD. As of December 31, 2021,2023, approximately 76%61% of our cash and cash equivalents were located outside the U.S., largely denominated in foreign currencies. The recent fluctuationsFluctuations in foreign currency exchange rates have had and may continue to have a material impact on these foreign cash balances. When the earningsCash balances in foreign countries are considered indefinitely reinvestedoften subject to additional restrictions. We may, therefore, have difficulties timely repatriating cash held outside of the U.S., we do not accrue taxes.and such repatriation may be subject to tax. These limitations may affect our ability to fully utilize our cash resources for needs in the U.S. and other countries and may adversely affect our liquidity. To the extent necessary, we accrue for tax consequences on the earnings of our foreign subsidiaries upon repatriation.as they are earned. We may utilize tax planning and financing strategies in an effort to ensure that our worldwide cash is available in the locations in which it is needed. We periodically review and evaluate these plans and strategies, including externally committed and non-committed credit agreements accessible by theour Company and each of itsour operating subsidiaries. We believe these financing arrangements, along with the cash generated from the operations of our U.S. business, and other liquidity measures resulting from considerations of the ongoing coronavirus global pandemic, as discussed above, are sufficient to fund our current cash needs in the U.S.
Additionally, our cash balances in foreign countries are often subject to additional restrictions and covenants. We may therefore have difficulties repatriating cash held outside of the U.S., and such repatriation may be subject to tax. In some countries, repatriation of certain foreign balances is restricted by local laws and could have adverse tax consequences if we were to move the cash to another country. These limitations may affect our ability to fully utilize our cash resources for needs in the U.S. or other countries and may adversely affect our liquidity.
Separately, as discussed in See Part II—Item 8 Financial Statements and Supplementary Data, Note 6, "Income Tax", during third quarter 2021, an income tax audit settlement, which included resolution of the impact of the final U.S. tax hybrid regulations recorded in the second quarter of 2020, was reached with taxing authorities. The settlement resulted in the cash payment of approximately $125 million in the fourth quarter of 2021, including incremental tax liability and related interest.Guarantor Information
SEC Registered Securities
For purposes of this disclosure, including the tables, "Parent Issuer" shall mean MCBC.MCBC in its capacity as the issuer of the senior notes under the May 2012 Indenture and the July 2016 Indenture. "Subsidiary Guarantors" shall mean certain Canadian and U.S. subsidiaries reflecting the substantial operations of our Americas segment.
Pursuant to the indenture dated May 3, 2012 (as amended, the "May 2012 Indenture"), MCBC issued its outstanding 3.5% senior notes due 2022 and 5.0% senior notes due 2042. Additionally, pursuant to the indenture dated July 7, 2016 ("July 2016 Indenture"), MCBC issued its outstanding 2.1% senior notes due 2021, 3.0% senior notes due 2026, 4.2% senior notes due 2046 and 1.25% senior notes due 2024. The 2.1% senior notes and its associated cross currency swap were subsequently repaid in July 2021 upon maturity using a combinationissuances of commercial paper borrowings and cash on hand. Thethe senior notes issued under the May 2012 Indenture and the July 2016 Indenture were registered under the Securities Act of 1933, as amended. These senior notes are guaranteed on a senior unsecured basis by certain subsidiaries of MCBC, which are listed onin Exhibit 22 of this Annual Report on Form 10-K (the "Subsidiary Guarantors",Subsidiary Guarantors, and together with the Parent Issuer, the "Obligor Group"). "Parent Issuer" in this section is specifically referring to MCBC in its capacity as the issuer of the senior notes under the May 2012 Indenture and the July 2016 Indenture. Each of the Subsidiary Guarantors is 100% owned by the Parent Issuer. The guarantees are full and unconditional and joint and several.
None of our other outstanding debt was issued in a transaction that was registered with the SEC, and such other outstanding debt is issued or otherwise generally guaranteed on a senior unsecured basis by the Obligor Group or other consolidated subsidiaries of MCBC. These other guarantees are also full and unconditional and joint and several.
The senior notes and related guarantees rank pari-passu with all other unsubordinated debt of the Obligor Group and senior to all future subordinated debt of the Obligor Group. The guarantees can be released upon the sale or transfer of a Subsidiary Guarantors' capital stock or substantially all of its assets, or if such Subsidiary Guarantor ceases to be a guarantor under our other outstanding debt.
The following summarized financial information relates to the Obligor Group as of December 31, 20212023 on a combined basis, after elimination of intercompany transactions and balances between the Obligor Group, and excluding the investments in
and equity in the earnings of any non-guarantor subsidiaries. The balances and transactions with non-guarantor subsidiaries have been separately presented.
Summarized Financial Information of Obligor Group
| | | | | |
| Year ended December 31, 20212023 |
| (In millions) |
| Net sales, out of which: | $ | 8,402.59,234.4 | |
| Intercompany sales to non-guarantor subsidiaries | $ | 29.9117.1 | |
| Gross profit, out of which: | $ | 3,394.13,563.0 | |
| Intercompany net costs from non-guarantor subsidiaries | $ | (421.0)(360.4) | |
| |
Net interest expense, third partiesout of which: | $ | (252.4)(208.7) | |
Intercompany net interest incomeexpense from non-guarantor subsidiaries | $ | 121.7 (2.6) | |
| |
| Income before income taxes | $ | 1,321.51,311.1 | |
| Net income | $ | 1,052.9988.1 | |
| | | | | |
| As of December 31, 20212023 |
| (In millions) |
| Total current assets, out of which: | $ | 1,834.41,814.3 | |
| Intercompany receivables from non-guarantor subsidiaries | $ | 155.5255.7 | |
| Total noncurrent assets, out of which: | $ | 25,349.424,641.0 | |
| Noncurrent intercompany notes receivable from non-guarantor subsidiaries | $ | 3,977.14,178.6 | |
| |
| Total current liabilities, out of which: | $ | 2,725.83,048.4 | |
| Current portion of long-term debt and short-term borrowings | $ | 502.9885.6 | |
| Intercompany payables due to non-guarantor subsidiaries | $ | 87.0117.7 | |
| Total noncurrent liabilities, out of which: | $ | 13,714.98,094.7 | |
| Long-term debt | $ | 6,573.55,257.6 | |
Noncurrent intercompany notes payable due to non-guarantor subsidiaries | $ | 4,352.9 | |
Cash Flows and Use of Cash
Our business historically generates positive operating cash flowflows each year and our debt maturities are generally of a longer-term nature. However, our liquidity could be impacted significantly by the risk factors described in Part I, Item 1A. "Risk"Risk Factors". Cash Flows from Operating Activities
Net cash provided by operating activities of $1,573.5$2,079.0 million for the year ended December 31, 2021 decreased by $122.22023 increased $577.0 million compared to $1,695.7$1,502.0 million for the year ended December 31, 2020, 2022. The increase in net cash provided by operating activities was primarily due to higher net income and the unfavorablefavorable timing of working capital and higher cash paid for income taxes,in the Americas across all categories, partially offset by higher net income adjusted for non-cash add-backs and lower interesttaxes paid. The unfavorable timing of working capital included $230 million of an unfavorable impact related to prior year net tax payment deferrals, partially offset by the timing of receipts and payments related to higher financial volumes in the fourth quarter of 2021 compared to the fourth quarter of 2020. Prior year working capital benefited from approximately $130 million of net tax payment deferrals related to various government-sponsored payment deferral programs associated with the coronavirus pandemic, while in 2021 we made over $100 million of net repayments against the net tax payment deferrals.
Cash Flows from Investing Activities
Net cash used in investing activities of $509.9$841.7 million for the year ended December 31, 20212023 increased by $96.3$216.6 million compared to $413.6$625.1 million for the year ended December 31, 2020,2022. The increase in net cash used in investing activities was primarily due to higher acquisitions, lower proceeds from the salesales of properties and other assets, including $150 million from the sale of the Irwindale Brewery completed in the fourth quarter of fiscal 2020, andas well as higher net cash outflows from other investing activities, partially offset by lower capital expenditures.
Cash Flows from Financing Activities
Net cash used in financing activities of approximately $1,172.2$981.4 million for the year ended December 31, 20212023 increased by $101.8$91.9 million compared to $1,070.4$889.5 million for the year ended December 31, 2020,2022. The increase in net cash used in financing activities was primarily due to higher net debt repayments andClass B common stock share repurchases, higher dividend payments, partially offset by lower net cash outflows from other financing activities.debt repayments.
Capital Resources, including Material Cash Requirements
Cash and Cash Equivalents
We had total cash and cash equivalents of $637.4$868.9 million as of December 31, 2021,2023, compared to $770.1$600.0 million as of December 31, 2020.2022. The decreaseincrease in cash and cash equivalents from December 31, 20202022 to December 31, 20212023 was primarily due to the net cash provided by operating activities, partially offset by capital expenditures, net debt repayments, including the repayment of our $1.0 billion 2.1% senior notesCAD 500 million 2.84% note which matured in July 2021, capital expenditures and2023, dividend payments, partially offset by netClass B common stock share repurchases, as well as cash provided by operating activities and proceeds frompaid for the saleacquisition of properties and other assets.
The majority of our cash and cash equivalents are invested in a variety of highly liquid investments with original maturities of 90 days or less. These investments are viewed by management as low-risk investments on which there are little to no restrictions regarding our ability to access the underlying cash to fund our operations as necessary. While we have some investments in prime money market funds at times, these are classified as cash and cash equivalents; however, we continually monitor the need for reclassification under the SEC requirements for money market funds, and the potential that the shares of such funds could have a net asset value of less than one dollar. We also utilize cash pooling arrangements to facilitate the access to cash across our geographies.
Working Capital
We actively manage our working capital through inventory management as well as management of accounts payable and accounts receivable to ensure we are able to meet our short-term obligations and we are effectively using assets to increaseprovide more favorable timing of cash inflows.
These efforts include optimizing our inventory levels and managing our payment terms on accounts payable and accounts receivable. Borrowings


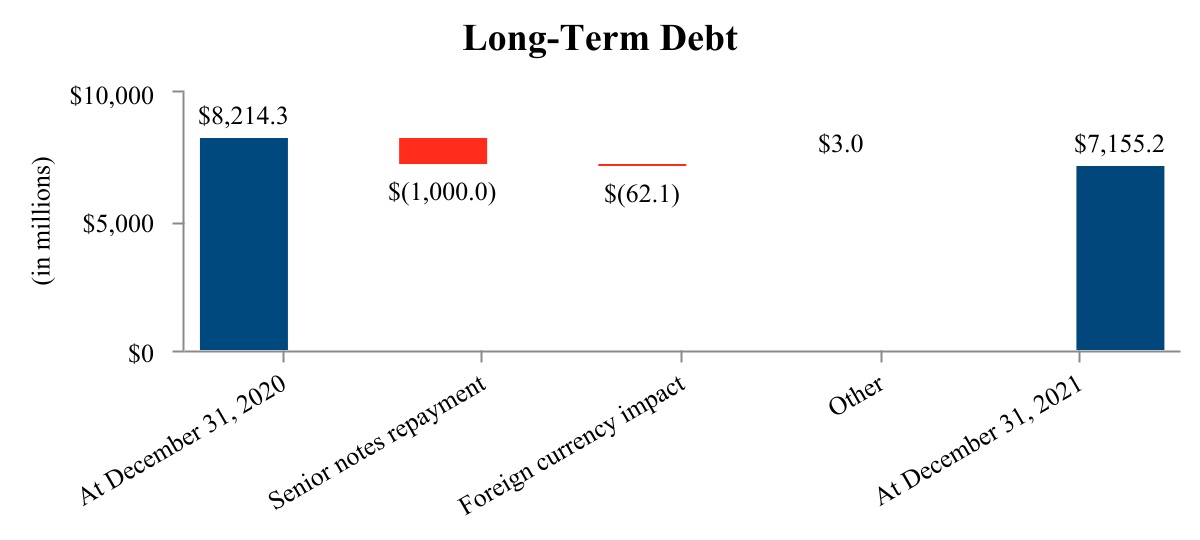

Based on the credit profile of our lenders that are party to our credit facilities, we are confident in our ability to continue to draw on our revolving credit facility if the need arises. As of December 31, 2021On June 26, 2023, we amended and December 31, 2020, we had $1.5restated our multi-currency revolving credit facility. Among other things, the term was extended through June 26, 2028, and the borrowing capacity was increased to $2.0 billion. This $2.0 billion available to draw underrevolving credit facility amended our pre-existing $1.5 billion revolving credit facility, as there were no outstandingwhich would have matured on July 7, 2024. On September 28, 2023, we amended our commercial paper program, which reduces borrowing capacity under the revolving credit facility, orto a maximum borrowing capacity of $2.0 billion to borrow at any time at variable interest rates. The $150.0 million sub-facility available for the issuance of letters of credit remains unchanged. As of December 31, 2023, we had $2.0 billion available to draw on our $2.0 billion revolving credit facility. As of December 31, 2023, we had no borrowings drawn on this revolving credit facility and no commercial paper borrowings.
We intend to further utilize our cross-border, cross currency cash pool as well as our commercial paper programs for liquidity as needed. We also have a JPY line of credit as well as JPY, CAD, GBP and USD overdraft facilities across several banks should we need additional short-term liquidity.
Under the terms of each of our debt facilities, we must comply with certain restrictions. These include customary events of default and specified representations, warranties and covenants, as well as covenants that restrict our ability to incur certain additional priority indebtedness (certain thresholds of secured consolidated net tangible assets), certain leverage threshold percentages, create or permit liens on assets and restrictions on mergers, acquisitions and certain types of sale lease-back transactions.
The maximum net debt to EBITDA leverage ratio, as defined by the amended and restated revolving credit facility agreement, was 4.00x as of the last day of the fiscal year ended December 31, 2021 is 4.00x net debt to EBITDA, through maturity2023 which remained unchanged from the requirement as of the credit facility.December 31, 2022. As of December 31, 20212023 and December 31, 2020,2022, we were in compliance with all of these restrictions and covenants, have met such financial ratios and have met all debt payment obligations. All of our outstanding senior notes as of December 31, 20212023 rank pari-passu.
In October 2021, we further amended our existing revolving credit facility agreement to replace LIBOR with designated replacement rates for any future borrowings denominated in EUR or GBP to ensure continued, uninterrupted access to these markets should we need it.
Guarantees
Material Cash Requirements from Contractual and Other Obligations
A summary of our material cash requirements from our contractual and other obligations as of December 31, 2021,2023, based on foreign exchange rates as of December 31, 2021,2023, is as follows.
| | | | Payments due by period | | Payments due by period |
| | | Total | | Less than 1 year | | 1 - 3 years | | 3 - 5 years | | More than 5 years | | Total | | 2024 | | 2025-2026 | | 2027-2028 | | 2029 and thereafter |
| | | (In millions) | | (In millions) |
| Debt obligations | Debt obligations | $ | 7,138.6 | | | $ | 512.3 | | | $ | 1,314.7 | | | $ | 2,416.3 | | | $ | 2,895.3 | |
| Interest payments on debt obligations | Interest payments on debt obligations | 3,450.9 | | | 235.6 | | | 442.4 | | | 408.4 | | | 2,364.5 | |
Retirement plan expenditures(1) | Retirement plan expenditures(1) | 407.4 | | | 45.5 | | | 82.4 | | | 81.4 | | | 198.1 | |
| Operating leases | Operating leases | 143.9 | | | 49.8 | | | 59.2 | | | 25.3 | | | 9.6 | |
| Finance leases | Finance leases | 98.5 | | | 8.4 | | | 16.3 | | | 19.4 | | | 54.4 | |
Other long-term obligations(2) | Other long-term obligations(2) | 2,703.3 | | | 676.7 | | | 877.8 | | | 612.2 | | | 536.6 | |
| Total obligations | Total obligations | $ | 13,942.6 | | | $ | 1,528.3 | | | $ | 2,792.8 | | | $ | 3,563.0 | | | $ | 6,058.5 | |
See Part II—Item 8 Financial Statements and Supplementary Data, Note 11,9, "Debt", Note 15,11, "Employee Retirement Plans and Postretirement Benefits," Note 16,10, "Derivative Instruments and Hedging Activities," Note 18,13, "Commitments and Contingencies" and Note 19,8, "Leases" for additional information. (1)Represents expected contributions of $4.1$3.6 million under our defined benefit pension plans in the next twelve months and our benefit payments under postretirement benefit plans for all periods presented.through 2033. The net underfunded liability as of December 31, 20212023 of our defined benefit pension plans (excluding our overfunded plans) and postretirement benefit plans is $51.2$38.1 million and $648.7$470.6 million, respectively. Defined benefit pension plan contributions in future years will vary based on a number of factors, including actual plan asset returns and interest rates, and thus, have been excluded from the above table.
Other Commercial Commitments
Based on foreign exchange rates as of December 31, 2021,2023, future commercial commitments are as follows:
| | | | | | | | | | | | | | | | | | | | | | | | | | | | | |
| | Amount of commitment expiration per period |
| | Total amounts
committed | | Less than 1 year | | 1 - 3 years | | 3 - 5 years | | More than 5 years |
| | (In millions) |
| Standby letters of credit | $ | 62.2 | | | $ | 59.1 | | | $ | 3.0 | | | $ | — | | | $ | 0.1 | |
| | | | | | | | | | | | | | | | | | | | | | | | | | | | | |
| | Amount of commitment expiration per period |
| | Total amounts
committed | | 2024 | | 2025-2026 | | 2027-2028 | | 2029 and thereafter |
| | (In millions) |
| Standby letters of credit | $ | 54.3 | | | $ | 52.6 | | | $ | 1.6 | | | $ | 0.1 | | | $ | — | |
Credit Rating
Our current long-term credit ratings are BBB-/BBB/Stable Outlook, Baa3/StableBaa2/Positive Outlook and BBB(Low)/NegativeBBB/Stable Outlook with Standard & Poor's, Moody's and DBRS, respectively. Our short-term credit ratings are A-3, Prime-3A-2, Prime-2 and R-2(low),R-2, respectively. A securities rating is not a recommendation to buy, sell or hold securities, and it may be revised or withdrawn at any time by the applicable rating agency.
Capital Expenditures
We incurred $558.6$688.6 million, and paid $522.6$671.5 million, for capital improvement projects worldwide for the year ended December 31, 2021,2023, excluding capital spending by equity method joint ventures, representing an increasea decrease of $28.6$6.1 million from the $530.0$694.7 million of capital expenditures incurred infor the year ended December 31, 2020. This increase was primarily due to the timing of expenditures for capital projects.2022. We continue to focus on where and how we employ our planned capital expenditures, with an emphasis on strengthening our focus on required returns on invested capital as we determine how to best allocate cash within the business.
Contingencies
Off-Balance Sheet Arrangements
Critical Accounting Estimates
Our consolidated financial statements are prepared in accordance with U.S. GAAP. In connection with the preparation of our consolidated financial statements, we are required to make judgments and estimates that significantly affect the reported amounts of assets, liabilities, revenues and expenses and related disclosures. Our estimates are based on historical experience, current trends and various other assumptions we believe to be relevant under the circumstances. We review the underlying factors used in our estimates regularly, including reviewing the significant accounting policies impacting the estimates, to ensure compliance with U.S. GAAP. However, due to the uncertainty inherent in our estimates, actual results may be materially different. We have identified the accounting estimates below as critical to understanding and evaluating the financial results reported in our consolidated financial statements.
Pension and Other Postretirement Benefits
Our defined benefit pension plans cover certain current and former employees in the U.S., Canada and the U.K. Benefit accruals for the majority of employees in our U.S. and U.K. plans have been frozen and the plans are closed to new entrants. In the U.S., we also participate in, and make contributions to, multi-employer pension plans. Our OPEB plans provide medical benefits for retirees and their eligible dependents as well as life insurance and, in some cases, dental and vision coverage, for certain retirees in the U.S., Canada and Europe. The U.S., Canada and U.K. defined benefit pension plans are primarily funded, but all OPEB plans are unfunded. We also offer defined contribution plans in each of our segments.
Accounting for pension and OPEB plans requires that we make assumptions that involve considerable judgment which are significant inputs in the actuarial models that measure our net pension and OPEB obligations and ultimately impact our earnings. These include the discount rate, long-term expected rate of return on assets, compensation trends, inflation considerations, health care cost trends and other assumptions, as well as determining the fair value of assets in our funded plans. Specifically, the discount rates, as well as the expected rates of return on assets and plan asset fair value determination, which are important assumptions used in determining the plans' funded status and annual net periodic pension and OPEB costs. Further assumptions include inflation considerations and health care cost trends. We evaluate these critical assumptions at least annually on a plan and country-specific basis. We also, with the help of actuaries, periodically evaluate other assumptions involving demographic factors, such as retirement age, mortality and turnover, and update them to reflect our experience and expectations for the future. While we believe that our assumptions are appropriate, significant differences in our actual experience or significant changes in our assumptions may materially affect our net pension and postretirement benefit obligations and related expense. The following discussion focuses on assumptions that are deemed to have the most material impact on our pension and OPEB liabilities and net periodic benefit cost.
Discount Rates
The assumed discount rates are used to present-valuepresent value future benefit obligations based on each plan's respective estimated duration. Our pension and postretirementOPEB discount rates are based on our annual evaluation of high quality corporate bonds in various markets based on appropriate indices and actuarial guidance. We believe that our discount rate assumptions are appropriate; however, significant changes in our assumptions may materially affect our pension and OPEB obligations and related expense.
As of December 31, 2021,2023, on a weighted-average basis, the discount rates used were 2.27%4.74% for our defined benefit pension plans and 2.59%4.64% for our OPEB plans. The change from the weighted-average discount rates of 1.84%5.01% for our defined benefit pension plans and 2.10%4.90% for our postretirementOPEB plans as of December 31, 2020 is2022 was primarily due to increasinga decrease in interest rates in 2021.at the end of 2023 across all plans.
A 50 basis point change in our discount rate assumptions would have had the following effects on the projected benefit obligation balances as of December 31, 20212023 for our pension and OPEB plans:
| | Impact to projected benefit obligation as of
December 31, 2021
- 50 basis points |
| Decrease | | Increase |
| (In millions) |
| Projected benefit obligation - unfavorable (favorable) | |
| Decrease in discount rate | | | Decrease in discount rate | | Increase in discount rate |
| (In millions) | | | (In millions) |
| Unfavorable (favorable) impact to projected benefit obligation as of December 31, 2023 | |
| Pension obligation | |
| Pension obligation | |
| Pension obligation | Pension obligation | $ | 373.1 | | | $ | (333.4) | |
| OPEB obligation | OPEB obligation | 34.0 | | | (32.0) | |
| Total impact to the projected benefit obligation | Total impact to the projected benefit obligation | $ | 407.1 | | | $ | (365.4) | |
Our U.K. pension plan includes benefits linked to inflation. The above sensitivity analysis does not consider the implications to inflation resulting from the above contemplated discount rate changes. This sensitivity holds all other assumptions constant.
Long-Term Expected RatesRate of Return on Assets
The assumed long-term expected return on assets is used to estimate the actual return that will occur on each individual funded plan's respective plan assets in the upcoming year. We determine each plan's EROA with substantial input from independent investment specialists, including our actuaries and other consultants.our outsourced investment consultant. In developing each plan's EROA, we consider current and expected asset allocations, historical market rates as well as historical and expected returns on each plan's individual asset classes. In developing future return expectations for each of our plan's assets, we evaluate general market trends as well as key elements of asset class returns such as expected earnings growth, yields and spreads. The calculation includes inputs for interest, inflation, credit and risk premium (active investment management) rates and fees paid to service providers. Based on the above factors and expected asset allocations, we have assumed, on a weighted-average basis, an EROA of 3.11%5.47% for our defined benefit pension plan assets for cost recognition in 2022.2024. This is an increase from the weighted-average rate of 3.03%4.91% we assumed for 2021.2023, primarily due to the increases seen in interest rates throughout the majority of 2023 causing higher expected future fixed income returns. We believe that our EROA assumptions are appropriate; however, significant changes in our assumptions or actual returns that differ significantly from estimated returns may materially affect our net periodic pension costs.
To compute the expected return on plan assets, we apply the EROA to the market-related value of the pension plan assets adjusted for projected benefit payments to be made from the plan assets and projected contributions to the plan assets. We use the fair value approach to calculate the market-related value of pension plan assets used to determine net periodic pension cost, which includes measuring the market-related value of plan assets at fair value for purposes of determining the expected return on plan assets and amount of gain or loss subject to amortization.
A 50 basis point change in our discount rate and expected return on assets assumptions made at the beginning of 20212023 would have had the following effects on 20212023 net periodic pension and postretirement benefit costs:costs.
| | | | | | | | | | | |
| | Impact to 2021 pension and postretirement benefit costs - 50
basis points (unfavorable) favorable |
| | Decrease | | Increase |
| | (In millions) |
| Description of pension and postretirement plan sensitivity item | | | |
| Expected return on pension plan assets | $ | (25.4) | | | $ | 25.4 | |
| Discount rate on pension plans | $ | 5.6 | | | $ | (9.0) | |
| Discount rate on postretirement plans | $ | 2.3 | | | $ | (2.0) | |
| | | | | | | | | | | |
| | Decrease in expected rate of return | | Increase in expected rate of return |
| | (In millions) |
| (Unfavorable) favorable impact to the 2023 net periodic pension and postretirement benefit cost | | | |
| Net periodic pension and postretirement benefit cost | $ | (14.1) | | | $ | 14.1 | |
Fair Value of Plan Assets
We recognize our defined benefit pension plans as assets or liabilities in the consolidated balance sheets based on their underfunded or overfunded status as of our year end and recognize changes in the funded status due to changes in actuarial assumptions in the year in which the changes occur within other comprehensive income. Our funded status of our defined benefit pension plans is measured as the difference between each plan's projected benefit obligation and its assets' fair values. The fair value of plan assets is determined by us using available market information and appropriate valuation methodologies. However, considerable judgment is required in selecting an appropriate methodology and interpreting market data to develop the estimates of fair value, especially in the absence of quoted market values in an active market. Changes in these assumptions or the use of different market inputs may have a material impact on the estimated fair values or the ultimate amount at which the plan assets are available to satisfy our plan obligations.
Health Care Cost Trend Rates Other Considerations
Our net periodic pension and postretirement benefit costs are also influenced by the potential amortization (or non-amortization) from accumulated other comprehensive income (loss) of deferred gains and losses, which occur when actual experience differs from estimates. We employ the corridor approach for determining each plan's amortization. This approach defines the “corridor” as the greater of 10% of the PBO or 10% of the market-related value of plan assets (as discussed above) and requires amortization of the excess net gain or loss that exceeds the corridor over the average remaining service periods of active plan participants. For our closed plans or plans that are primarily inactive, the average remaining life expectancy of all plan participants (including retirees) is used. If our actuarial losses significantly exceed this corridor in the future, significant incremental pension and postretirement costs could result. As of year-end 2021, the deferred losses of several of our Canadian plans, as well as those in our U.K. plans, and the deferred gains of our U.S. plan, exceeded the 10% corridor.
The assumed health care cost trend rates represent the rates at which health care costs are assumed to increase and are based on actuarial input and consideration of historical and expected experience. We use these trends as a significant assumption in determining our postretirement benefit obligation and related costs. Changes in our projections of future health care costs due to general economic conditions and those specific to health care will impact this trend rate. An increase in the trend rate would increase our obligation and expense of our postretirement health care plan. We believe that our health care cost trend rate assumptions are appropriate; however, significant changes in our assumptions may materially affect our postretirement benefit obligations and related costs. As of December 31, 2021,2023, the health care trend rates used were ranging ratably from 6.0%6.75% in 20222024 to 3.57% in 2040, consistentwhich are in line with our assumed health care trend rates ranging ratably from 6.0%
Contingencies, Environmental and Litigation Reserves
Contingencies, environmental and litigation reserves are recorded when probable, using our best estimate of loss. This estimate, involving significant judgment, is based on an evaluation of the range of loss related to such matters and where the amount and range can be reasonably estimated. These matters are generally resolved over a number of years and only when one or more future events occur or fail to occur. Following our initial determination, we regularly reassess and revise the potential liability related to any pending matters as new information becomes available. Unless capitalization is allowed or required by U.S. GAAP, environmental and legal costs are expensed when incurred. We disclose pending loss contingencies when the loss is deemed reasonably possible, which requires significant judgment. As a result of the inherent uncertainty of these matters, the ultimate conclusion and actual cost of settlement may materially differ from our estimates. We recognize contingent gains upon the determination that realization is assured beyond a reasonable doubt, regardless of the perceived probability of a favorable outcome prior to achieving that assurance. In the instance of gain contingencies resulting from favorable litigation, due to the numerous uncertainties inherent in a legal proceeding, gain contingencies resulting from legal settlements are not recognized in income until cash or other forms of payment are received. If significant and probable, we disclose as appropriate.
Goodwill and Intangible Asset Valuation
Goodwill is allocated to the reporting unit in which the business that created the goodwill resides. A reporting unit is an operating segment, or a business unit one level below that operating segment, for which discrete financial information is prepared and regularly reviewed by segment management.
We evaluate the carrying value of our goodwill and indefinite-lived intangible assets for impairment at least annually or when an interim triggering event occurs that wouldmay indicate that impairment may have taken place.potential impairment. Our annual impairment test of goodwill and indefinite-lived intangible assets wasis performed as of October 1, the first day of the last fiscal quarter. We evaluate our other definite-lived intangible assets for impairment when evidence exists that certain events or changes in circumstances indicate that the carrying amount of these assets may not be recoverable. Significant judgments and assumptions are required in such impairment evaluations.
Our annual evaluation involves comparing each reporting unit's fair value to its respective As of December 31, 2023, the carrying value, including goodwill. Ifvalues of goodwill and intangible assets were approximately $5.3 billion and $12.6 billion, respectively, with the fair value exceeds carrying value, then we conclude that no goodwill impairment has occurred. If a reporting
unit's carrying value exceeds its fair value, we would recognize an impairment loss in an amount equalbalance entirely attributed to the excess up to the total amount of goodwill allocated to thatAmericas reporting unit.
We use a combination of discounted cash flow analyses and market approaches to determine the fair value of each of our reporting units and an excess earnings approach to determine the fair values of our indefinite-lived brand intangible assets. We utilized a qualitative assessment for our water rights in the U.S. in order to determine whether the fair value of those indefinite-lived intangible assets was in excess of their carrying value. Our discounted cash flow projections include assumptions for growth rates for sales, costs and profits, which are based on various long-range financial and operational plans of each reporting unit or each indefinite-lived intangible asset. Additionally, discount rates used in our goodwill analysis are based on weighted-average cost of capital, driven by the prevailing interest rates in geographies where these businesses operate, as well as the credit ratings, financing abilities and opportunities of each reporting unit, among other factors. Discount rates for the indefinite-lived intangible analysis by brand largely reflect the rates supporting the overall reporting unit valuation but may differ slightly to adjust for country or market specific risk associated with a particular brand, among other factors. Our market-based valuations utilize earnings multiples of comparable public companies, which are reflective of the market in which each respective reporting unit operates.
Changes in the factors used in our fair value estimates, including the impacts of the coronavirus pandemic, declines in industry or company-specific beer volume sales, cost inflation or other margin erosion, termination of brewing and/or distribution agreements with other brewers, and discount rates used, could have a significant impact on the fair values of the reporting units and indefinite-lived intangible assets.
Reporting Units and Goodwill
As of the October 1, 2021 testing date, the fair value of our Americas reporting unit was estimated at approximately 6% in excess of its carrying amount and therefore no goodwill impairment charge was required for the Americas reporting unit. However, the Americas reporting unit is considered to be at risk for future impairments consistent with the 2020 testing results. The fair value in the current year is still largely impacted by the continued perceived risk of realizing management’s revitalization efforts and the ongoing impacts from the coronavirus pandemic. In addition, the fair value as of the 2021 test was impacted by assumptions related to increased cost inflation pressures in the medium term. The fair value of the Americas reporting unit is heavily dependent upon transforming our company including strengthening our iconic core brands, growing our above premium portfolio and expanding beyond beer. Despite successful launches of Blue Moon LightSky and Vizzy, and early success around products like Topo Chico Hard Seltzer and our joint venture expansion of Yuengling, there is not enough historical data yet to comfortably predict future impacts. Additionally, the fact that these products were launched in the midst of a global pandemic makes understanding and predicting their market positions and potential in a normal economy even more challenging. While the Americas reporting unit appears to be weathering the ongoing impacts of the pandemic and cost inflation, there is still inherent risk in achieving our goals. The fair value determinations are sensitive to further unfavorable changes in forecasted cash flows, macroeconomic conditions, market multiples or discount rates that could negatively impact future analyses, including the further extent, duration and impact of the ongoing coronavirus pandemic on our reporting units. The key assumptions used to derive the estimated fair values of our reporting units and indefinite-lived intangible assets represent Level 3 measurements. Goodwill allocated to the Americas reporting unit as of December 31, 2021 was $6.2 billion.
As of the October 1, 2020 testing date, the carrying value of the EMEA&APAC reporting unit was determined to be in excess of its fair value such that an impairment loss of $1,484.3 million, the full value of goodwill as of October 1, 2020, was recorded.
Indefinite-Lived Intangible Assets
The fair values of the Coors indefinite-lived brands in the Americas, the Miller indefinite-lived brands in the U.S. and the Carling brands in the U.K. continue to be sufficiently in excess of their respective carrying values as of the annual testing date.
The fair value of the Staropramen brand increased versus the prior year and is sufficiently in excess of its carrying value as of the annual testing date. The increase in the fair value of the Staropramen brand was a result of the progressive reopening of the on-premise business throughout Europe, but more impactfully Western Europe, during the year and the related improvement to expected future cash flows based on our long-range plan for this brand.
We utilize Level 3 fair value measurements in our impairment analysis of certain indefinite-lived intangible assets, including the Coors brands in the Americas, Miller brands in the U.S. and the Staropramen and Carling brands in EMEA&APAC. An excess earnings approach is used to determine the fair values of these assets as of the testing date. The future cash flows used in the analysis are based on internal cash flow projections based on our long-range plans and include significant assumptions by management as noted below. Separately, we performed a qualitative assessment of our water rights indefinite-lived intangible assets in the U.S. to determine whether it was more likely than not that the fair values of these assets
were greater than their respective carrying amounts. Based on this qualitative assessment, we determined that a full quantitative analysis was not necessary.
Key Assumptions
As of the date of our annual impairment test, performed as of October 1, the Americas reporting unit goodwill balance is at risk of future impairment in the event of significant unfavorable changes in the forecasted cash flows (including company-specific risks like the performance of our above premium transformation efforts and overall market performance of new innovations like hard seltzers, along with macro-economic risks like the continued prolonged weakening of economic conditions and cost inflation, or significant unfavorable changes in tax rates, environmental or other regulations, including interpretations thereof), terminal growth rates, market multiples and/or weighted-average cost of capital utilized in the discounted cash flow analyses. For testing purposes of our reporting units, management's best estimates of the expected future results are the primary driver in determining the fair value. Current projections used for the Americas reporting unit testing reflect growth assumptions associated with our revitalization plan to build on the strength of our iconic core brands, aggressively grow our above premium portfolio, expand beyond the beer aisle, invest in our capabilities and support our people and our communities, all of which are intended to benefit the projected cash flows of the business. These cash flow assumptions are tempered somewhat by the impacts the coronavirus pandemic has had on our overall business and specifically our more profitable on-premise segment.
Fair value determinations require considerable judgment and are sensitive to changes in underlying assumptions and factors. As a result, there can be no assurance that the estimates and assumptions made for purposes of the annual goodwill and indefinite-lived intangible asset impairment tests will prove to be an accurate prediction of the future. Examples of events or circumstances that could reasonably be expected to negatively affect the underlying key assumptions and ultimately impact the estimated fair value of our reporting units and indefinite-lived intangible assets may include such items as: (i) a decrease in expected future cash flows, specifically, an inability to execute on our strategic initiatives, including our anticipated innovations or an increase in costs driven by inflation or other factors that could significantly impact our immediate and long-range results by a prolonged weakness in consumer demand or other competitive pressures adversely affecting our long-term volume trends, a continuation of the trend away from core brands in certain of our markets, especially in markets where our core brands represent a significant portion of the market, unfavorable working capital changes and an inability to successfully achieve our cost savings targets, (ii) adverse changes in macroeconomic conditions or an economic recovery that significantly differs from our assumptions in timing and/or degree (such as a global pandemic or recession), (iii) significant unfavorable changes in tax rates, such as increased corporate income tax rates, (iv) volatility in the equity and debt markets or other country specific factors which could result in a higher weighted-average cost of capital, (v) sensitivity to market multiples; and (vi) regulation limiting or banning the manufacturing, distribution or sale of alcoholic beverages.
Based on known facts and circumstances, we evaluate and consider recent events and uncertain items, as well as related potential implications, as part of our annual assessment and incorporate into the analyses as appropriate. These facts and circumstances are subject to change and may impact future analyses. For example, we continue to monitor the challenges within the beer industry for further weakening or additional systemic structural declines, as well as for adverse changes in macroeconomic conditions such as the coronavirus pandemic and cost inflation that could significantly impact our immediate and long-range results. The related weakening of economic conditions either as a result of resurgences in the coronavirus pandemic or cost inflation could lead to a material impairment. Additionally, we are monitoring the impacts that the coronavirus pandemic and cost inflation have on the market inputs used in calculating our discount rates, including risk-free rates, equity premiums and our cost of debt, which could result in a meaningful change to our weighted-average cost of capital calculation, as well as the market multiples used in our impairment assessment. Furthermore, increased volatility in the equity and debt markets or other country specific factors, including, but not limited to, extended or future government intervention in response to the coronavirus pandemic, could also result in a meaningful change to our weighted-average cost of capital calculation and other inputs used in our impairment assessment. Separately, the Ontario provincial government in Canada adopted a bill that, if enacted, could adversely impact the existing terms of the beer distribution and retail systems in the province, as further described in Part II—Item 8 Financial Statements and Supplementary Data, Note 18, "Commitments and Contingencies".In 2021, the discount rate used in developing our annual fair value estimates for the Americas reporting unit was 8.25%, based on market-specific factors, as compared to 8.00% as of the October 1, 2020 annual testing date. The recent interest rate environment has resulted in an increase to the risk-free rate used in the current year discount rate calculations, which is reflected in the Americas higher discount rate. This discount rate also continues to be reflective of an unsystematic risk premium related to projected results of various new and unproven brands and innovations. The adverse effect of a higher discount rate driven by the recent interest rate environment is offset by improved cash flow projections for the Americas reporting unit. As we continue to recover from the coronavirus pandemic's impacts to the on-premise channel, the current year along with future projections have improved. The discount rates for the Miller brands in the U.S., and Coors brands in the Americas decreased compared to
the discount rates used in the prior year analysis. For the Coors brands, this is primarily due to a reduction in the discount rate due to a lower risk premium, which was elevated in the prior year related to assumptions surrounding the launch of Coors Seltzer. Both brands also benefited from decreased perceived risk in meeting management’s cash flow projections as they did not rely on new and unproven brands and innovations included in our current year discount rate calculations for the Americas reporting unit. The discount rate for the Staropramen brands in EMEA&APAC increased compared to the discount rate used in the prior year analysis, primarily due to increases in the unsystematic risk premium related to risks associated with achieving the forecasted results while still in a global pandemic, particularly in Eastern Europe. Conversely, the discount rate for the Carling brands in the U.K. decreased compared to the discount rate used in the prior year analysis, primarily due to a decrease in the unsystematic risk premium as a result of the progressive reopening of the on-premise business throughout Western Europe, and specifically the U.K.
Current expectations driving our annual impairment testing as of October 1, 2021 have resulted in fair values of our Americas reporting unit and indefinite-lived intangible assets in excess of carrying values. However, if our assumptions are not realized, it is possible that further impairment charges may need to be recorded in the future. For example, a 50 basis point increase in our discount rate assumptions, which is within a reasonable range of historical discount rate fluctuations between test dates, would have had the following effects on the fair value cushion in excess of carrying value for the Americas reporting unit as of the October 1, 2021 test date:
| | | | | | | | | | | |
| Impact to the fair value cushion as of October 1, 2021
- 50 basis points increase |
| Cushion (as reported) | | Cushion (post-sensitivity) |
| % of fair value in excess of carrying value |
| Americas Reporting Unit | 6% | | 1% |
| | | |
| | | |
Post sensitivity, the fair value of the Americas reporting unit remains in excess of its carrying values. The discount rate sensitivity holds all other assumptions and inputs constant.
Regarding definite-lived intangible assets, we continuously monitor the performance of the underlying assets for potential triggering events suggesting an impairment review should be performed. In the current year, consistent with our revitalization plan, management made the decision to discontinue select economy SKUs and brands. It was determined that although these specific brand family line extensions had been discontinued, the brand family itself was still being used and produced. Additional evaluation was performed on these specific definite-lived brand intangible assets with no triggering events noted at the asset group level and no changes in useful life of the brand intangible assets deemed necessary. In 2020, we recognized impairment losses on some of our definite-lived intangible assets related to a few of our regional craft breweries in the Americas and EMEA&APAC segments, which were recorded in special items, net in the consolidated statement of operations. The impairment losses on the Grolsch brand and distribution agreement definite-lived intangible assets and the brand intangible asset related to our India business were recognized in 2019, and recorded in special items, net. See Part II—Item 8 Financial Statements and Supplementary Data Note 7, "Special Items" for further details on these impairment losses.
Annual Goodwill Impairment Test
As of the October 1, 2023 testing date, the fair value of the Americas reporting unit was determined to be in excess of its carrying amount and therefore no goodwill impairment charge was recorded. The Americas reporting unit continues to be at a heightened risk of future impairment as the carrying value exceeds its respective fair value by slightly less than 15%. The fair value of the Americas reporting unit increased during the current year, primarily due to higher forecasted cash flow projections, with the increases largely impacted by shifts in consumer preferences in the U.S. market towards our core brands leading to increased volumes, paired with pricing increases put in place starting in late 2022 as well as lower inflation rates than previously expected. This is partially offset by an increase to the discount rate as a result of the recent rising interest rate environment. Specifically, the discount rate used in developing our annual fair value estimates for the Americas reporting unit in the current year was 9.00% based on market-specific factors, as compared to 8.75% used as of the October 1, 2022 annual testing date. A 50 basis point increase in our discount rate assumption, holding all other assumptions and inputs constant, would not have resulted in an impairment of the Americas reporting unit.
Current projections used for the Americas reporting unit testing reflected growth assumptions associated with our continued plan to consistently grow our core power brand revenue, aggressively premiumize our portfolio, scale and expand beyond beer, invest in our capabilities and invest in our people, communities and planet, all of which are intended to benefit the projected cash flows of the business. While progress has been made on this strategy, including the strengthening of our core brands, there is not enough historical data yet to adequately predict future impacts and forecasted future cash flows are inherently at risk given that the strategies are still in progress. In addition, while we have included in our forecasted future cash flows estimates for expected cost inflation and adjusted our volumes to be reflective of the current beer industry trends, there is still inherent risk in achieving our goals. If our assumptions are not realized, it is possible that further impairment charges may be recorded in the future.
As of the October 1, 2022 testing date, an impairment loss of $845.0 million was recorded as the carrying value of the Americas reporting unit was determined to be in excess of its fair value. The decline in the fair value of the Americas reporting unit was largely impacted by macroeconomic factors including an increase to the discount rate as a result of the rising interest rate environment as well as reductions in management forecasts and expectations due primarily to cost inflation pressures and a softening beer industry in certain markets in which we operate.
Indefinite-Lived Intangible Assets
As of the October 1, 2023 testing date, the carrying value of the Staropramen family ofbrands in EMEA&APAC was determined to be in excess of its fair value such that an impairment loss of $160.7 million was recorded. As this is a partial impairment, the intangible asset is considered to be at a heightened risk of future impairment, and the carrying value of the brand was $426.9 million as of December 31, 2023. The decline in the fair value in the current year was impacted by reductions in management forecasts due to delays and changes in strategic priorities for expansion and distribution of the brand in certain export and license markets, increased optionality for consumers in the premium sector in key markets, and reduced demand in Central and Eastern Europe due to cost inflation pressures on consumers as well as macroeconomic factors including an increase to the discount rate as a result of the recent rising interest rate environment. The discount rate used in developing our annual fair value estimates for the Staropramen family of brands in the current year was 13.25% based on company specific and market-specific factors, as compared to 11.25% used as of the October 1, 2022 annual testing date. The current year rate includes elevated risk premiums to account for execution risk of strategic initiatives for the brands, including the launch of brand extensions and geographic expansion of the brands in certain markets, in addition to continued economic uncertainty in Central and Eastern Europe due to the effects of cost inflation and the associated impacts on consumer demand and discretionary spending.
The fair values of the Coors brands in the Americas, the Miller brands in the U.S, and the Carling brands in EMEA&APAC continue to be sufficiently in excess of their respective carrying values as of the annual testing date, with each having over 15% cushion of fair value over book value.
We utilize Level 3 fair value measurements in our impairment analysis of our indefinite-lived intangible assets. The future cash flows used in the analyses are based on internal cash flow projections based on our long range plans and include significant assumptions by management. A 50 basis point increase in our discount rate assumptions would not have resulted in an impairment of the Coors, Miller or Carling brand indefinite-lived intangible assets.
Definite-Lived Intangible Assets and Other Long-Lived Assets
Regarding definite-lived intangible assets, we continuously monitor the performance of the underlying assets for potential triggering events suggesting an impairment review should be performed or useful lives should be re-assessed.
No other material triggering events were identified in either 2023 or 2022 related to the definite-lived intangible assets or other definite-lived assets.
Income Taxes
Income taxes are accounted for in accordance with U.S. GAAP. Judgment is required in determining our consolidated provision for income taxes. In the ordinary course of our global business, there are many transactions for which the ultimate tax outcome is uncertain. Additionally, our income tax provision is based on calculations and assumptions that are subject to examination by many different tax authorities.
We are periodically subject to income tax controversiesaudits in various foreign and domestic jurisdictions, which can involve questions regarding our tax positions and result in additional income tax liabilities assessed against us. Settlement of any challenge resulting from these tax controversies can result in a variety of resolutions including no change, a complete disallowance, or some partial adjustment reached through negotiations or litigation. We recognize the tax benefit from an uncertain tax position only if it is more likely than not that the tax position will be sustained based on its technical merits. We measure and record the tax benefits from such a position based on the largest benefit that has a greater than 50% likelihood of being realized upon ultimate settlement. Our estimated liabilities related to these matters are adjusted in the period in which the uncertain tax position is effectively settled, the statute of limitations for examination expires or when additional information becomes available. Our liability for unrecognized tax benefits requires the use of assumptions and significant judgment to estimate the exposures associated with
our various filing positions. Although we believe that the judgments and estimates made are reasonable, actual results could differ and resulting adjustments could materially affect our effective tax rate and tax provision.
When cash is available after satisfying working capital needs and all other business obligations, we may distribute current earnings and the associated cash from a foreign subsidiary to its U.S. parent, and record the tax impact associated with the distribution. However, to the extent current earnings of our foreign operations exist and are not otherwise distributed or planned to be distributed, such earnings accumulate. These accumulated earnings are not considered permanently reinvested in our foreign operations. We currently would not expect the aggregateThe taxes associated with any future repatriation of these permanently reinvestedundistributed earnings which are largely in deficit positions for U.S. tax purposes,anticipated to result in any material U.S. taxes, if distributed.be insignificant.
We record a valuation allowance to reduce our deferred tax assets to the amount that is more likely than not to be realized. We evaluate our ability to realize the tax benefits associated with deferred tax assets by assessing the adequacy of future expected taxable income, including the reversal of existing temporary differences, historical and projected operating results, and the availability of prudent and feasible tax planning strategies. The realization of tax benefits is evaluated by jurisdiction and the realizability of these assets can vary based on the character of the tax attribute and the carryforward periods specific to each jurisdiction. In the event we were to determine that we would be able to realize our deferred tax assets in the future in excess of its net recorded amount, an adjustment to the deferred tax asset would decrease income tax expense in the period a determination was made. Likewise, should we determine that we would not be able to realize all or part of our net deferred tax asset in the future, an adjustment to the deferred tax asset would increase income tax expense in the period such determination was made.
There are proposed or pending tax law changes in various jurisdictions in which we do business. As discussed in Part II—Item 8 Financial Statements and Supplementary Data, Note 6, 12, "Income Tax", we recognize the impacts of changes in tax law upon enactment, and therefore, proposed changes in tax law, regulations and rules are not reflected within our tax provision. As a result, such changes may, upon ultimate enactment, result in material impacts to our financial statements. ITEM 7A. QUANTITATIVE AND QUALITATIVE DISCLOSURES ABOUT MARKET RISK
In the normal course of our global operations, we are exposed to market risks associated with foreign currency exchange fluctuations, volatile interest rates and commodity price risks. To manage our exposure to these market risks, we enter into certain supplier-based and market-based hedging transactions. Such transactions are allowed under our risk management policy and are monitored closely with clear controls around the activities. Our market-based transactions include a variety of derivative financial instruments, none of which are used for trading or speculative purposes. The counterparties to these market-based transactions are generally highly rated institutions. Our objective is to manage our exposures and to decrease the volatility of our earnings and cash flows as a result of changes in underlying rates and costs.
Interest Rate Risk
We are exposed to volatility in interest rates with regard to our current and future debt offerings. Specifically, we are exposed to U.S. Department of Treasury rates, Canadian government rates and SOFR, or any such alternatives like SONIA or EURIBOR, for example. We may from time to time enter into interest rate swaps on our current debt obligations as our hedging strategy is to achieve our desired fixed-to-floating rate debt profile such that we manage the volatility in earnings as well as the cost of funding our operations. Further, we may enter into forward starting interest rate swaps to manage our exposure to the volatility of interest rates associated with future interest payments on a forecasted debt issuance.
In May 2023, we amended our 2026 forward starting interest rate swaps to replace LIBOR with SOFR. Subsequent to this transition, we are no longer exposed to LIBOR. As of December 31, 2023, the following table presents our fixed rate debt and forward starting interest rate swaps as well as the impact of an absolute 1% adverse change in interest rates on their respective fair values. As of December 31, 2022, the following table presents our fixed rate debt and forward starting interest rate swaps and the impact of an absolute 1% adverse change in interest rates on our forward starting interest rate swaps and a 10% adverse change in the yield on our fixed rate debt. Notional amounts and fair values are presented in USD based on the applicable exchange rates as of December 31, 2023 and December 31, 2022, respectively. See Part II - Item 8. Financial Statements and Supplementary Data, Note 9. "Debt" for the maturity dates of our outstanding debt instruments. | | | | | | | | | | | | | | | | | | | | | | | | | | | | | | | | | | | | | | |
| | Notional amounts | | Fair Value Asset/(Liability) | | Effect of Adverse Change |
| (in millions) | | As of December 31, 2023 | | As of December 31, 2022 | | As of December 31, 2023 | | As of December 31, 2022 | | As of December 31, 2023 | | As of December 31, 2022 |
| USD denominated fixed rate debt | | $ | 4,900.0 | | | $ | 4,900.0 | | | $ | (4,608.2) | | | $ | (4,295.9) | | | $ | (414.4) | | | $ | (223.4) | |
| Foreign currency denominated fixed rate debt | | $ | 1,260.7 | | | $ | 1,594.2 | | | $ | (1,248.6) | | | $ | (1,557.4) | | | $ | (13.5) | | | $ | (11.1) | |
| Forward starting interest rate swaps | | $ | 1,000.0 | | | $ | 1,000.0 | | | $ | 41.6 | | | $ | 40.0 | | | $ | (78.9) | | | $ | (73.8) | |
Foreign Exchange Risk
Foreign currency exchange risk is inherent in our operations primarily due to operating results that are denominated in currencies other than the USD. We closely monitor our operations in each country and seek to adopt appropriate strategies that are responsive to foreign currency fluctuations. Our financial risk management policy is intended to mitigate a portion of the potentially unfavorable impact of exchange rates on our earnings and cash flows.
Approximately $3.6 billion, or 30%, of our net sales were denominated in functional currencies other than the USD for the year ended December 31, 2023. As a result, fluctuations in foreign currency exchange rates, particularly the CAD and the GBP, may have a material impact on our reported results. For the year ended December 31, 2023, net sales denominated in CAD and GBP both approximated $1.3 billion, for each respective currency.
We manage our foreign currency exposures through foreign currency forward contracts and net investment hedges. Our EUR foreign-denominated debt is a net investment hedge against our investment in our Europe business in order to hedge a portion of the foreign currency translational impacts. The changes in fair value of the net investment hedge due to the fluctuations in the spot rate are recorded to AOCI. Our foreign currency forward contracts manage our exposure related to certain royalty agreements, the purchase of production inputs and imports that are denominated in currencies other than the entity's functional local currency and other foreign currency exchange exposure.
The following table includes details of our foreign currency forwards used to hedge our foreign exchange rate risk as well as the impact of a hypothetical 10% adverse change in the related foreign currency exchange rates on the fair value of the foreign currency forwards. Notional amounts and fair values are presented in USD based on the applicable exchange rate as of December 31, 2023 and December 31, 2022. Approximately 62% of our outstanding foreign currency forwards mature in 2024, 33% mature in 2025 and 5% mature thereafter.
| | | | | | | | | | | | | | | | | | | | | | | | | | | | | | | | | | | | | | |
| | Notional amounts | | Fair Value
Asset/(Liability) | | Effect of Adverse Change |
| (in millions) | | As of December 31, 2023 | | As of December 31, 2022 | | As of December 31, 2023 | | As of December 31, 2022 | | As of December 31, 2023 | | As of December 31, 2022 |
| Foreign currency denominated fixed rate debt | | $ | 1,260.7 | | | $ | 1,594.2 | | | $ | (1,248.6) | | | $ | (1,557.4) | | | $ | (124.8) | | | $ | (142.6) | |
| Foreign currency forwards | | $ | 219.4 | | | $ | 176.6 | | | $ | (1.4) | | | $ | 7.6 | | | $ | (23.6) | | | $ | (18.3) | |
Commodity Price Risk
We are exposed to volatility in commodity prices as we use commodities in the production and distribution of our products. We specifically hedge our exposure to fluctuations in the price of natural gas, aluminum, including surcharges relating to our aluminum exposures, corn, sweeteners, barley and diesel. We utilize market-based derivatives and long-term supplier-based contracts, specifically a combination of purchase orders, long-term supply contracts and over-the-counter financial instruments to mitigate our commodity price risk by reducing price volatility for select commodities that are used in our supply chain.
The following table includes details of our commodity swaps used to hedge commodity price risk as well as the impact of a hypothetical 10% adverse change in the related commodity prices on the fair value of the derivatives. The following table excludes our commodity options because we have offsetting buy and sell positions. Notional amounts and fair values are presented in USD based on the applicable exchange rate as of December 31, 2023 and December 31, 2022. Approximately 68% of commodity swaps mature in 2024, 29% mature in 2025 and 3% mature thereafter.
| | | | | | | | | | | | | | | | | | | | | | | | | | | | | | | | | | | | | | |
| | Notional amounts | | Fair Value Asset/(Liability) | | Effect of Adverse Change |
| (in millions) | | As of December 31, 2023 | | As of December 31, 2022 | | As of December 31, 2023 | | As of December 31, 2022 | | As of December 31, 2023 | | As of December 31, 2022 |
| Swaps | | $ | 653.5 | | | $ | 525.2 | | | $ | (30.4) | | | $ | 69.0 | | | $ | (58.1) | | | $ | (55.8) | |
| | | | | | | | | | | | |
ITEM 8. FINANCIAL STATEMENTS AND SUPPLEMENTARY DATA
| | | | | |
| |
| Index to Financial Statements | Page |
| |
| |
| |
| |
| |
| |
| |
| |
| |
| |
| |
| |
| |
| |
| |
| |
| |
| |
| |
| |
| |
| |
| |
| |
| |
| |
| |
| |
| |
| |
| |
| |
| |
| |
| |
| |
| |
MANAGEMENT'S REPORT
The preparation, integrity and objectivity of the financial statements and all other financial information included in this annual report are the responsibility of the management of Molson Coors Beverage Company. The financial statements have been prepared in accordance with generally accepted accounting principles in the United States, applying estimates based on management's best judgment where necessary. Management believes that all material uncertainties have been appropriately accounted for and disclosed.
Our management, under the supervision and with the participation of our Chief Executive Officer and Chief Financial Officer, assessed the effectiveness of our internal control over financial reporting as of December 31, 2023, based on the framework and criteria established in Internal Control—Integrated Framework (2013 Framework), issued by the Committee of Sponsoring Organizations of the Treadway Commission. Based upon its assessment, management concluded that, as of December 31, 2023, the Company's internal control over financial reporting was effective.
PricewaterhouseCoopers LLP, the Company's independent registered public accounting firm, provides an objective, independent audit of the consolidated financial statements and internal control over financial reporting. Their accompanying report is based upon an examination conducted in accordance with standards of the Public Company Accounting Oversight Board (United States), including tests of accounting procedures, records and internal control.
The Board of Directors, operating through its Audit Committee composed of independent, outside directors, monitors the Company's accounting control systems and reviews the results of the Company's auditing activities. The Audit Committee meets at least quarterly, either separately or jointly, with representatives of management, PricewaterhouseCoopers LLP and internal auditors. To ensure complete independence, PricewaterhouseCoopers LLP and the Company's internal auditors have full and free access to the Audit Committee and may meet with or without the presence of management.
| | | | | | | | |
/s/ GAVIN D.K. HATTERSLEY | | /s/ TRACEY I. JOUBERT |
| Gavin D.K. Hattersley | | Tracey I. Joubert |
| President & Chief Executive Officer | | Chief Financial Officer |
| Molson Coors Beverage Company | | Molson Coors Beverage Company |
| February 20, 2024 | | February 20, 2024 |
Report of Independent Registered Public Accounting Firm
To the Board of Directors and Stockholders of Molson Coors Beverage Company
Opinions on the Financial Statements and Internal Control over Financial Reporting
We have audited the accompanying consolidated balance sheets of Molson Coors Beverage Company and its subsidiaries (the “Company”) as of December 31, 2023 and 2022, and the related consolidated statements of operations, of comprehensive income (loss), of stockholders’ equity and noncontrolling interests and of cash flows for each of the three years in the period ended December 31, 2023, including the related notes and schedule of valuation and qualifying accounts for each of the three years in the period ended December 31, 2023 appearing under item 15(c) (collectively referred to as the “consolidated financial statements”). We also have audited the Company's internal control over financial reporting as of December 31, 2023, based on criteria established in Internal Control - Integrated Framework (2013) issued by the Committee of Sponsoring Organizations of the Treadway Commission (COSO).
In our opinion, the consolidated financial statements referred to above present fairly, in all material respects, the financial position of the Company as of December 31, 2023 and 2022, and the results of its operations and its cash flows for each of the three years in the period ended December 31, 2023 in conformity with accounting principles generally accepted in the United States of America. Also in our opinion, the Company maintained, in all material respects, effective internal control over financial reporting as of December 31, 2023, based on criteria established in Internal Control - Integrated Framework (2013) issued by the COSO.
Basis for Opinions
The Company's management is responsible for these consolidated financial statements, for maintaining effective internal control over financial reporting, and for its assessment of the effectiveness of internal control over financial reporting, included in Management's Annual Report on Internal Control over Financial Reporting appearing under Item 9A. Our responsibility is to express opinions on the Company’s consolidated financial statements and on the Company's internal control over financial reporting based on our audits. We are a public accounting firm registered with the Public Company Accounting Oversight Board (United States) (PCAOB) and are required to be independent with respect to the Company in accordance with the U.S. federal securities laws and the applicable rules and regulations of the Securities and Exchange Commission and the PCAOB.
We conducted our audits in accordance with the standards of the PCAOB. Those standards require that we plan and perform the audits to obtain reasonable assurance about whether the consolidated financial statements are free of material misstatement, whether due to error or fraud, and whether effective internal control over financial reporting was maintained in all material respects.
Our audits of the consolidated financial statements included performing procedures to assess the risks of material misstatement of the consolidated financial statements, whether due to error or fraud, and performing procedures that respond to those risks. Such procedures included examining, on a test basis, evidence regarding the amounts and disclosures in the consolidated financial statements. Our audits also included evaluating the accounting principles used and significant estimates made by management, as well as evaluating the overall presentation of the consolidated financial statements. Our audit of internal control over financial reporting included obtaining an understanding of internal control over financial reporting, assessing the risk that a material weakness exists, and testing and evaluating the design and operating effectiveness of internal control based on the assessed risk. Our audits also included performing such other procedures as we considered necessary in the circumstances. We believe that our audits provide a reasonable basis for our opinions.
Definition and Limitations of Internal Control over Financial Reporting
A company’s internal control over financial reporting is a process designed to provide reasonable assurance regarding the reliability of financial reporting and the preparation of financial statements for external purposes in accordance with generally accepted accounting principles. A company’s internal control over financial reporting includes those policies and procedures that (i) pertain to the maintenance of records that, in reasonable detail, accurately and fairly reflect the transactions and dispositions of the assets of the company; (ii) provide reasonable assurance that transactions are recorded as necessary to permit preparation of financial statements in accordance with generally accepted accounting principles, and that receipts and expenditures of the company are being made only in accordance with authorizations of management and directors of the company; and (iii) provide reasonable assurance regarding prevention or timely detection of unauthorized acquisition, use, or disposition of the company’s assets that could have a material effect on the financial statements.
Because of its inherent limitations, internal control over financial reporting may not prevent or detect misstatements. Also, projections of any evaluation of effectiveness to future periods are subject to the risk that controls may become inadequate because of changes in conditions, or that the degree of compliance with the policies or procedures may deteriorate.
Critical Audit Matters
The critical audit matters communicated below are matters arising from the current period audit of the consolidated financial statements that were communicated or required to be communicated to the audit committee and that (i) relate to accounts or disclosures that are material to the consolidated financial statements and (ii) involved our especially challenging, subjective, or complex judgments. The communication of critical audit matters does not alter in any way our opinion on the consolidated financial statements, taken as a whole, and we are not, by communicating the critical audit matters below, providing separate opinions on the critical audit matters or on the accounts or disclosures to which they relate.
Goodwill Impairment Assessment - Americas Reporting Unit
As described in Notes 1 and 6 to the consolidated financial statements, the Company’s goodwill balance related to the Americas reporting unit was $5,325 million as of December 31, 2023. The carrying value of goodwill is evaluated for impairment at the reporting unit level at least annually or when an interim triggering event occurs that may indicate potential impairment. The Company’s annual impairment test is performed as of the first day of the fiscal fourth quarter. The evaluation involves comparing the reporting unit’s fair value to its carrying value. If the fair value exceeds its respective carrying value, then management would conclude that no impairment has occurred. If the carrying value exceeds its fair value, the Company would recognize an impairment loss in an amount equal to the excess up to the total amount of goodwill allocated to the reporting unit. A combination of a discounted cash flow analysis and market approach is used by management to determine the fair value of the reporting unit. Fair value determinations require considerable judgment and are sensitive to changes in underlying assumptions and factors. Examples of events or circumstances that could reasonably be expected to negatively affect the underlying key assumptions and ultimately impact the estimated fair value of our reporting unit may include the following, as disclosed by management, (i) growth rates for sales, costs and profits, which are based on various long-range financial and operational plans; (ii) prolonged weakening of economic conditions; or (iii) significant unfavorable changes in income tax rates, environmental or other regulations, including interpretations thereof, terminal growth rate, market multiples and / or weighted- average cost of capital. Management concluded that the fair value of the Americas reporting unit was in excess of its carrying value and therefore no goodwill impairment charge was recorded.
The principal considerations for our determination that performing procedures relating to the goodwill impairment assessment for the Americas reporting unit is a critical audit matter are (i) the significant judgment by management when developing the fair value estimate of the Americas reporting unit; (ii) a high degree of auditor judgment, subjectivity, and effort in performing procedures and evaluating management’s significant assumptions related to the weighted average cost of capital and growth rates for sales; and (iii) the audit effort involved the use of professionals with specialized skill and knowledge.
Addressing the matter involved performing procedures and evaluating audit evidence in connection with forming our overall opinion on the consolidated financial statements. These procedures included testing the effectiveness of controls relating to management’s goodwill impairment assessment, including controls over the valuation of the Americas reporting unit. These procedures also included, among others (i) testing management’s process for developing the fair value estimate of the Americas reporting unit; (ii) evaluating the appropriateness of the discounted cash flow analysis and market approach used by management; (iii) testing the completeness and accuracy of underlying data used in the discounted cash flow analysis and market approach; and (iv) evaluating the reasonableness of significant assumptions used by management related to the weighted average cost of capital and growth rates for sales. Evaluating management's assumptions related to growth rates for sales involved evaluating whether the significant assumptions used were reasonable considering (i) the current and past performance of the Americas reporting unit; (ii) the consistency with external market and industry data; and (iii) whether these assumptions were consistent with evidence obtained in other areas of the audit. Professionals with specialized skill and knowledge were used to assist in evaluating (i) the appropriateness of the Company’s discounted cash flow analysis and market approach and (ii) the reasonableness of the weighted average cost of capital assumption.
Indefinite-Lived Intangible Asset Impairment Assessment - Staropramen Family of Brands (EMEA&APAC)
As described in Notes 1 and 6 to the consolidated financial statements, the Company’s indefinite-lived intangible asset brands balance was $8,002 million as of December 31, 2023, of which a portion relates to the Staropramen family of brands in the EMEA&APAC segment. The carrying value of the indefinite-lived intangible asset is evaluated for impairment at least annually or when an interim triggering event occurs that may indicate potential impairment. The Company’s annual impairment test is performed as of the first day of the fiscal fourth quarter. The evaluation involves comparing the indefinite-lived intangible asset’s fair value to its carrying value. If the fair value exceeds its respective carrying value, then management would conclude that no impairment has occurred. If the carrying value exceeds its fair value, the Company would recognize an impairment loss in an amount equal to the excess up to the total balance of the respective indefinite-lived intangible asset. As of the October 1, 2023 testing date, the carrying value of the Staropramen family of brands in EMEA&APAC was determined to be in excess of its fair value such that an impairment loss of $160.7 million was recorded by management. An excess earnings approach is used to determine the fair value of the indefinite-lived intangible asset. Fair value determinations require
considerable judgment and are sensitive to changes in underlying assumptions and factors. Examples of events or circumstances that could reasonably be expected to negatively affect the underlying key assumptions and ultimately impact the estimated fair value of the Company’s indefinite-lived intangible may include the following, as disclosed by management, (i) growth rates for sales, costs and profits, which are based on various long-range financial and operational plans, (ii) prolonged weakening of economic conditions, or (iii) significant unfavorable changes in income tax rates, environmental or other regulations, including interpretations thereof, terminal growth rates, and / or weighted average cost of capital.
The principal considerations for our determination that performing procedures relating to the indefinite-lived intangible asset impairment assessment for the Staropramen family of brands in EMEA&APAC is a critical audit matter are (i) the significant judgment by management when developing the fair value estimate of the indefinite-lived intangible asset for the Staropramen family of brands; (ii) a high degree of auditor judgment, subjectivity and effort in performing procedures and evaluating management’s significant assumptions related to the weighted average cost of capital, growth rates for sales, and growth rates for costs associated with marketing, general, and administrative (MG&A) expenses; and (iii) the audit effort involved the use of professionals with specialized skill and knowledge.
Addressing the matter involved performing procedures and evaluating audit evidence in connection with forming our overall opinion on the consolidated financial statements. These procedures included testing the effectiveness of controls relating to management’s indefinite-lived intangible asset impairment assessments, including controls over the valuation of the Staropramen family of brands. These procedures also included, among others (i) testing management’s process for developing the fair value estimate of the indefinite-lived intangible asset for the Staropramen family of brands; (ii) evaluating the appropriateness of the excess earnings approach used by management; (iii) testing the completeness and accuracy of underlying data used in the excess earnings approach; and (iv) evaluating the reasonableness of the significant assumptions used by management related to the weighted average cost of capital, growth rates for sales, and growth rates for MG&A expenses. Evaluating management’s assumptions related to growth rates for sales and growth rates for MG&A expenses involved evaluating whether the assumptions used by management were reasonable considering (i) the current and past performance of the Staropramen family of brands; (ii) whether these assumptions were consistent with evidence obtained in other areas of the audit, and (iii) for growth rates for sales assumption, whether the assumption was consistent with external market and industry data. Professionals with specialized skill and knowledge were used to assist in evaluating (i) the appropriateness of Company’s excess earnings approach and (ii) the reasonableness of weighted average cost of capital assumption.
/s/ PricewaterhouseCoopers LLP
Milwaukee, Wisconsin
February 20, 2024
We have served as the Company’s auditor since 1974.
MOLSON COORS BEVERAGE COMPANY AND SUBSIDIARIES
CONSOLIDATED STATEMENTS OF OPERATIONS
(IN MILLIONS, EXCEPT PER SHARE DATA) | | | | | | | | | | | | | | | | | |
| | For the Years Ended |
| | December 31, 2023 | | December 31, 2022 | | December 31, 2021 |
| Sales | $ | 13,884.6 | | | $ | 12,807.5 | | | $ | 12,449.9 | |
| Excise taxes | (2,182.5) | | | (2,106.5) | | | (2,170.2) | |
| Net sales | 11,702.1 | | | 10,701.0 | | | 10,279.7 | |
| Cost of goods sold | (7,333.3) | | | (7,045.8) | | | (6,226.3) | |
| Gross profit | 4,368.8 | | | 3,655.2 | | | 4,053.4 | |
| Marketing, general and administrative expenses | (2,779.9) | | | (2,618.8) | | | (2,554.5) | |
| Goodwill impairment | — | | | (845.0) | | | — | |
| Other operating income (expense), net | (162.7) | | | (38.6) | | | (44.5) | |
| Equity income (loss) | 12.0 | | | 4.7 | | | — | |
| Operating income (loss) | 1,438.2 | | | 157.5 | | | 1,454.4 | |
| Interest expense | (234.0) | | | (250.6) | | | (260.3) | |
| Interest income | 25.4 | | | 4.3 | | | 2.0 | |
| Other pension and postretirement benefit (cost), net | 10.2 | | | 36.6 | | | 46.4 | |
| Other non-operating income (expense), net | 12.7 | | | (10.3) | | | (3.5) | |
| Total non-operating income (expense), net | (185.7) | | | (220.0) | | | (215.4) | |
| Income (loss) before income taxes | 1,252.5 | | | (62.5) | | | 1,239.0 | |
| Income tax benefit (expense) | (296.1) | | | (124.0) | | | (230.5) | |
| Net income (loss) | 956.4 | | | (186.5) | | | 1,008.5 | |
| Net (income) loss attributable to noncontrolling interests | (7.5) | | | 11.2 | | | (2.8) | |
| Net income (loss) attributable to Molson Coors Beverage Company | $ | 948.9 | | | $ | (175.3) | | | $ | 1,005.7 | |
| | | | | |
| Net income (loss) attributable to Molson Coors Beverage Company per share | | | | | |
| Basic | $ | 4.39 | | | $ | (0.81) | | | $ | 4.63 | |
| Diluted | $ | 4.37 | | | $ | (0.81) | | | $ | 4.62 | |
| | | | | |
| Weighted-average shares outstanding | | | | | |
| Basic | 216.0 | | | 216.9 | | | 217.1 | |
| Dilutive effect of share-based awards | 1.3 | | | — | | | 0.5 | |
| Diluted | 217.3 | | | 216.9 | | | 217.6 | |
See notes to consolidated financial statements.
MOLSON COORS BEVERAGE COMPANY AND SUBSIDIARIES
CONSOLIDATED STATEMENTS OF COMPREHENSIVE INCOME (LOSS)
(IN MILLIONS) | | | | | | | | | | | | | | | | | |
| For the Years Ended |
| December 31, 2023 | | December 31, 2022 | | December 31, 2021 |
| Net income (loss) including noncontrolling interests | $ | 956.4 | | | $ | (186.5) | | | $ | 1,008.5 | |
| Other comprehensive income (loss), net of tax | | | | | |
| Foreign currency translation adjustments | 98.7 | | | (329.8) | | | (28.4) | |
| Cumulative translation adjustment reclassified from other comprehensive income (loss) | (0.6) | | | 12.1 | | | 7.5 | |
| Unrealized gain (loss) recognized on derivative instruments | (2.5) | | | 153.8 | | | 37.4 | |
| Derivative instrument activity reclassified from other comprehensive income (loss) | 0.9 | | | 9.4 | | | 5.5 | |
| Net change in pension and other postretirement benefit assets and liabilities recognized in other comprehensive income (loss) | (6.4) | | | (59.6) | | | 118.4 | |
| Pension and other postretirement activity reclassified from other comprehensive income (loss) | (11.2) | | | (1.6) | | | 5.4 | |
| | | | | |
| Ownership share of unconsolidated subsidiaries' other comprehensive income (loss) | 11.2 | | | 13.8 | | | 15.5 | |
| Total other comprehensive income (loss), net of tax | 90.1 | | | (201.9) | | | 161.3 | |
| Comprehensive income (loss) | 1,046.5 | | | (388.4) | | | 1,169.8 | |
| Comprehensive (income) loss attributable to noncontrolling interests | (8.4) | | | 13.6 | | | (2.3) | |
| Comprehensive income (loss) attributable to Molson Coors Beverage Company | $ | 1,038.1 | | | $ | (374.8) | | | $ | 1,167.5 | |
See notes to consolidated financial statements.
MOLSON COORS BEVERAGE COMPANY AND SUBSIDIARIES
CONSOLIDATED BALANCE SHEETS
(IN MILLIONS, EXCEPT PAR VALUE)
| | | | | | | | | | | |
| | As of |
| | December 31, 2023 | | December 31, 2022 |
| Assets | | | |
| Current assets | | | |
| Cash and cash equivalents | $ | 868.9 | | | $ | 600.0 | |
| Trade receivables, net | 757.8 | | | 739.8 | |
| Other receivables, net | 121.6 | | | 126.4 | |
| Inventories, net | 802.3 | | | 792.9 | |
| Other current assets, net | 297.9 | | | 378.9 | |
| Total current assets | 2,848.5 | | | 2,638.0 | |
| Property, plant and equipment, net | 4,444.5 | | | 4,222.8 | |
| Goodwill | 5,325.3 | | | 5,291.9 | |
| Other intangibles, net | 12,614.6 | | | 12,800.1 | |
| Other assets | 1,142.2 | | | 915.5 | |
| Total assets | $ | 26,375.1 | | | $ | 25,868.3 | |
| Liabilities and equity | | | |
| Current liabilities | | | |
| Accounts payable and other current liabilities | $ | 3,180.8 | | | $ | 2,978.3 | |
| Current portion of long-term debt and short-term borrowings | 911.8 | | | 397.1 | |
| Total current liabilities | 4,092.6 | | | 3,375.4 | |
| Long-term debt | 5,312.1 | | | 6,165.2 | |
| Pension and postretirement benefits | 465.8 | | | 473.3 | |
| Deferred tax liabilities | 2,697.2 | | | 2,646.4 | |
| Other liabilities | 372.3 | | | 292.8 | |
| Total liabilities | 12,940.0 | | | 12,953.1 | |
Commitments and contingencies (Note 13) | | | |
| Redeemable noncontrolling interest | 27.9 | | | — | |
| Molson Coors Beverage Company stockholders' equity | | | |
| Capital stock | | | |
| Preferred stock, $0.01 par value (authorized: 25.0 shares; none issued) | — | | | — | |
| Class A common stock, $0.01 par value (authorized: 500.0 shares; issued: 2.6 shares and 2.6 shares, respectively) | — | | | — | |
| Class B common stock, $0.01 par value (authorized: 500.0 shares; issued: 212.5 shares and 210.5 shares, respectively) | 2.1 | | | 2.1 | |
| Class A exchangeable shares, no par value (issued: 2.7 shares and 2.7 shares, respectively) | 100.8 | | | 102.2 | |
| Class B exchangeable shares, no par value (issued: 9.4 shares and 11.0 shares, respectively) | 352.3 | | | 413.3 | |
| Paid-in capital | 7,108.4 | | | 7,006.4 | |
| Retained earnings | 7,484.3 | | | 6,894.1 | |
| Accumulated other comprehensive income (loss) | (1,116.3) | | | (1,205.5) | |
| Class B common stock held in treasury at cost (13.9 shares and 10.5 shares, respectively) | (735.6) | | | (522.9) | |
| Total Molson Coors Beverage Company stockholders' equity | 13,196.0 | | | 12,689.7 | |
| Noncontrolling interests | 211.2 | | | 225.5 | |
| Total equity | 13,407.2 | | | 12,915.2 | |
| Total liabilities and equity | $ | 26,375.1 | | | $ | 25,868.3 | |
See notes to consolidated financial statements.
MOLSON COORS BEVERAGE COMPANY AND SUBSIDIARIES
CONSOLIDATED STATEMENTS OF CASH FLOWS
(IN MILLIONS) | | | | | | | | | | | | | | | | | |
| | For the Years Ended |
| | December 31, 2023 | | December 31, 2022 | | December 31, 2021 |
| Cash flows from operating activities | | | | | |
| Net income (loss) including noncontrolling interests | $ | 956.4 | | | $ | (186.5) | | | $ | 1,008.5 | |
| Adjustments to reconcile net income (loss) to net cash provided by (used in) operating activities | | | | | |
| Depreciation and amortization | 682.8 | | | 684.8 | | | 786.1 | |
| Amortization of debt issuance costs and discounts | 5.7 | | | 7.7 | | | 6.7 | |
| Share-based compensation | 44.9 | | | 33.6 | | | 32.1 | |
| Goodwill impairment | — | | | 845.0 | | | — | |
| (Gain) loss on sale or impairment of property, plant, equipment and other assets, net | 181.9 | | | 18.6 | | | 9.1 | |
| Unrealized (gain) loss on foreign currency fluctuations and derivative instruments, net | 88.3 | | | 236.4 | | | (233.8) | |
| Equity (income) loss | (12.0) | | | (4.7) | | | — | |
| Income tax (benefit) expense | 296.1 | | | 124.0 | | | 230.5 | |
| Income tax (paid) received | (244.8) | | | (76.6) | | | (227.0) | |
| Interest expense, excluding amortization of debt issuance costs and discounts | 228.3 | | | 242.9 | | | 253.6 | |
| Interest paid | (229.0) | | | (240.0) | | | (256.2) | |
| Change in current assets and liabilities (net of impact of business combinations) and other | | | | | |
| Receivables | (0.7) | | | (108.5) | | | (137.6) | |
| Inventories | 21.7 | | | (64.6) | | | (143.9) | |
| Payables and other current liabilities | 50.2 | | | (16.1) | | | 285.5 | |
| Other assets and other liabilities | 9.2 | | | 6.0 | | | (40.1) | |
| Net cash provided by (used in) operating activities | 2,079.0 | | | 1,502.0 | | | 1,573.5 | |
| Cash flows from investing activities | | | | | |
| Additions to property, plant and equipment | (671.5) | | | (661.4) | | | (522.6) | |
| Proceeds from sales of property, plant, equipment and other assets | 10.9 | | | 32.2 | | | 26.0 | |
| Acquisition of business, net of cash acquired | (63.7) | | | — | | | — | |
| Other | (117.4) | | | 4.1 | | | (13.3) | |
| Net cash provided by (used in) investing activities | (841.7) | | | (625.1) | | | (509.9) | |
| Cash flows from financing activities | | | | | |
| | | | | |
| Exercise of stock options under equity compensation plans | 7.9 | | | 3.1 | | | 4.6 | |
| Dividends paid | (354.7) | | | (329.3) | | | (147.8) | |
| Payments for purchases of treasury stock | (205.8) | | | (51.5) | | | — | |
| Payments on debt and borrowings | (404.8) | | | (509.1) | | | (1,006.6) | |
| Proceeds on debt and borrowings | 7.0 | | | 7.0 | | | — | |
| | | | | |
| Net proceeds from (payments on) revolving credit facilities and commercial paper | — | | | (3.7) | | | 1.4 | |
| Other | (31.0) | | | (6.0) | | | (23.8) | |
| Net cash provided by (used in) financing activities | (981.4) | | | (889.5) | | | (1,172.2) | |
| Effect of foreign exchange rate changes on cash and cash equivalents | 13.0 | | | (24.8) | | | (24.1) | |
| Net increase (decrease) in cash and cash equivalents | 268.9 | | | (37.4) | | | (132.7) | |
| Balance at beginning of year | 600.0 | | | 637.4 | | | 770.1 | |
| Balance at end of year | $ | 868.9 | | | $ | 600.0 | | | $ | 637.4 | |
| | | | | |
| | | | | |
| | | | | |
MOLSON COORS BEVERAGE COMPANY AND SUBSIDIARIES
CONSOLIDATED STATEMENTS OF STOCKHOLDERS' EQUITY
AND NONCONTROLLING INTERESTS
(IN MILLIONS)
| | | | | | | | | | | | | | | | | | | | | | | | | | | | | | | | | | | | | | | | | | | | | | | | | | | | | | | | | | | |
| | | Molson Coors Beverage Company Stockholders' Equity | | |
| | | | Common stock | | Exchangeable | | | | | | Accumulated
other | | Common Stock
held in | | Non |
| | | | issued | | shares issued | | Paid-in- | | Retained | | comprehensive | | treasury | | controlling |
| | Total | | Class A | | Class B | | Class A | | Class B | | capital | | earnings | | income (loss) | | Class B | | interests(1) |
| Balance as of December 31, 2020 | $ | 12,621.3 | | | $ | — | | | $ | 2.1 | | | $ | 102.3 | | | $ | 417.8 | | | $ | 6,937.8 | | | $ | 6,544.2 | | | $ | (1,167.8) | | | $ | (471.4) | | | $ | 256.3 | |
| Exchange of shares | — | | | — | | | — | | | (0.1) | | | — | | | 0.1 | | | — | | | — | | | — | | | — | |
| Shares issued under equity compensation plan | 0.6 | | | — | | | — | | | — | | | — | | | 0.6 | | | — | | | — | | | — | | | — | |
| Amortization of share-based compensation | 32.1 | | | — | | | — | | | — | | | — | | | 32.1 | | | — | | | — | | | — | | | — | |
| Purchase of noncontrolling interest | (0.2) | | | — | | | — | | | — | | | — | | | 0.3 | | | — | | | — | | | — | | | (0.5) | |
| Net income (loss) including noncontrolling interests | 1,008.5 | | | — | | | — | | | — | | | — | | | — | | | 1,005.7 | | | — | | | — | | | 2.8 | |
| Other comprehensive income (loss), net of tax | 161.3 | | | — | | | — | | | — | | | — | | | — | | | — | | | 161.8 | | | — | | | (0.5) | |
| Contributions from noncontrolling interests | 3.2 | | | — | | | — | | | — | | | — | | | — | | | — | | | — | | | — | | | 3.2 | |
| Distributions and dividends to noncontrolling interests | (14.3) | | | — | | | — | | | — | | | — | | | — | | | — | | | — | | | — | | | (14.3) | |
| Dividends declared | (148.4) | | | — | | | — | | | — | | | — | | | — | | | (148.4) | | | — | | | — | | | — | |
| Balance as of December 31, 2021 | $ | 13,664.1 | | | $ | — | | | $ | 2.1 | | | $ | 102.2 | | | $ | 417.8 | | | $ | 6,970.9 | | | $ | 7,401.5 | | | $ | (1,006.0) | | | $ | (471.4) | | | $ | 247.0 | |
| Exchange of shares | — | | | — | | | — | | | — | | | (4.5) | | | 4.5 | | | — | | | — | | | — | | | — | |
| Shares issued under equity compensation plan | (2.9) | | | — | | | — | | | — | | | — | | | (2.9) | | | — | | | — | | | — | | | — | |
| Amortization of share-based compensation | 33.6 | | | — | | | — | | | — | | | — | | | 33.6 | | | — | | | — | | | — | | | — | |
| Purchase of noncontrolling interest | (1.4) | | | — | | | — | | | — | | | — | | | 0.3 | | | — | | | — | | | — | | | (1.7) | |
| Net income (loss) including noncontrolling interests | (186.5) | | | — | | | — | | | — | | | — | | | — | | | (175.3) | | | — | | | — | | | (11.2) | |
| Other comprehensive income (loss), net of tax | (201.9) | | | — | | | — | | | — | | | — | | | — | | | — | | | (199.5) | | | — | | | (2.4) | |
| Share repurchase program | (51.5) | | | — | | | — | | | — | | | — | | | — | | | — | | | — | | | (51.5) | | | — | |
| Contributions from noncontrolling interests | 8.1 | | | — | | | — | | | — | | | — | | | — | | | — | | | — | | | — | | | 8.1 | |
| | | | | | | | | | | | | | | | | | | | | | | | | | | | | | | | | | | | | | | | | | | | | | | | | | | | | | | | | | | |
| | | Molson Coors Beverage Company Stockholders' Equity | | |
| | | | Common stock | | Exchangeable | | | | | | Accumulated
other | | Common Stock
held in | | Non |
| | | | issued | | shares issued | | Paid-in- | | Retained | | comprehensive | | treasury | | controlling |
| | Total | | Class A | | Class B | | Class A | | Class B | | capital | | earnings | | income (loss) | | Class B | | interests(1) |
| Distributions and dividends to noncontrolling interests | (14.3) | | | — | | | — | | | — | | | — | | | — | | | — | | | — | | | — | | | (14.3) | |
| Dividends declared | (332.1) | | | — | | | — | | | — | | | — | | | — | | | (332.1) | | | — | | | — | | | — | |
| Balance as of December 31, 2022 | $ | 12,915.2 | | | $ | — | | | $ | 2.1 | | | $ | 102.2 | | | $ | 413.3 | | | $ | 7,006.4 | | | $ | 6,894.1 | | | $ | (1,205.5) | | | $ | (522.9) | | | $ | 225.5 | |
| Exchange of shares | — | | | — | | | — | | | (1.4) | | | (61.0) | | | 62.4 | | | — | | | — | | | — | | | — | |
| Shares issued under equity compensation plan | 0.2 | | | — | | | — | | | — | | | — | | | 0.2 | | | — | | | — | | | — | | | — | |
| Amortization of share-based compensation | 44.9 | | | — | | | — | | | — | | | — | | | 44.9 | | | — | | | — | | | — | | | — | |
| Purchase of noncontrolling interest | (8.5) | | | — | | | — | | | — | | | — | | | (5.5) | | | — | | | — | | | — | | | (3.0) | |
| Deconsolidation of VIE | (8.8) | | | — | | | — | | | — | | | — | | | — | | | — | | | — | | | — | | | (8.8) | |
| Net income (loss) including noncontrolling interests | 957.1 | | | — | | | — | | | — | | | — | | | — | | | 948.9 | | | — | | | — | | | 8.2 | |
| Other comprehensive income (loss), net of tax | 90.1 | | | — | | | — | | | — | | | — | | | — | | | — | | | 89.2 | | | — | | | 0.9 | |
| Share repurchase program | (212.7) | | | — | | | — | | | — | | | — | | | — | | | — | | | — | | | (212.7) | | | — | |
| Contributions from noncontrolling interests | 2.4 | | | — | | | — | | | — | | | — | | | — | | | — | | | — | | | — | | | 2.4 | |
| Distributions and dividends to noncontrolling interests | (14.0) | | | — | | | — | | | — | | | — | | | — | | | — | | | — | | | — | | | (14.0) | |
| Dividends declared | (358.7) | | | — | | | — | | | — | | | — | | | — | | | (358.7) | | | — | | | — | | | — | |
| Balance as of December 31, 2023 | $ | 13,407.2 | | | $ | — | | | $ | 2.1 | | | $ | 100.8 | | | $ | 352.3 | | | $ | 7,108.4 | | | $ | 7,484.3 | | | $ | (1,116.3) | | | $ | (735.6) | | | $ | 211.2 | |
(1) All activity included in the noncontrolling interests column of the consolidated statements of stockholders' equity and noncontrolling interests excludes activity from our redeemable noncontrolling interests.
See notes to consolidated financial statements.
MOLSON COORS BEVERAGE COMPANY AND SUBSIDIARIES
NOTES TO CONSOLIDATED FINANCIAL STATEMENTS
1. Basis of Presentation and Summary of Significant Accounting Policies
Unless otherwise noted in this report, any description of "we," "us" or "our" includes Molson Coors Beverage Company ("MCBC" or the "Company"), principally a holding company, and its operating and non-operating subsidiaries included within our reporting segments. Our reporting segments include Americas and EMEA&APAC. Our Americas segment operates in the U.S., Canada and various countries in the Caribbean, Latin and South America, and our EMEA&APAC segment operates in Bulgaria, Croatia, Czech Republic, Hungary, Montenegro, the Republic of Ireland, Romania, Serbia, the U.K., various other European countries and certain countries within the Middle East, Africa and Asia Pacific.
Unless otherwise indicated, information in this report is presented in USD and comparisons are to comparable prior periods, and 2023, 2022 and 2021 refers to the twelve months ended December 31, 2023, December 31, 2022 and December 31, 2021, respectively. Our primary operating currencies, other than USD, include the CAD, the GBP and our Central European operating currencies such as the EUR, CZK, RON and RSD.
Principles of Consolidation
Our consolidated financial statements include our accounts and our majority-owned and controlled domestic and foreign subsidiaries, as well as certain VIEs for which we are the primary beneficiary. All intercompany accounts and transactions have been eliminated in consolidation.
Use of Estimates
Our consolidated financial statements are prepared in accordance with U.S. GAAP. These accounting principles require us to make certain estimates, judgments and assumptions. We believe that the estimates, judgments and assumptions used to determine certain amounts that affect the financial statements are reasonable, based on information available at the time they are made. To the extent there are differences between these estimates and actual results, our consolidated financial statements may be materially affected.
Acquisition
On August 7, 2023, we acquired a 75% equity interest in Blue Run, a U.S. based high end whiskey business, for a purchase price of $77 million, which included cash paid of $64 million. The acquisition is aligned with our strategy to expand beyond the beer aisle and enhance our presence in the spirits category.
The acquisition was accounted for as a business combination, with $88 million allocated to a definite-lived brand intangible asset to be amortized over a 15-year period and the remainder primarily allocated to other working capital balances and goodwill for the amount in excess of the net identifiable assets acquired. A noncontrolling interest was recognized at fair value based on a Monte Carlo simulation model and is recorded as redeemable noncontrolling interest in the consolidated balance sheets based on the contractual terms of the agreement. Pro forma results of operations have not been presented as the impact is not material to our results of operation or financial position.
Supplier Financing
We are the buyer under a supplier finance program with Citibank N.A. ("Citi" or "the bank"), with $147.5 million and $135.2 million confirmed as valid and outstanding for the years ended December 31, 2023 and December 31, 2022, respectively. We recognize these unpaid balances in accounts payable and other current liabilities on our consolidated balance sheets. Under the program, we agree to pay the bank the stated amount of confirmed invoices from our designated suppliers on the original maturity dates of the invoices. We have no involvement in establishing the terms or conditions of the arrangement between the suppliers and the bank and do not participate in such transactions. Either Citi or us may terminate the agreement upon at least 30 days written notice. We do not provide secured legal assets or other forms of guarantees under the arrangement. Our current payment terms with the majority of the suppliers participating in the supplier finance program generally range from 60 to 120 days, which we deem to be commercially reasonable.
Government Assistance
We receive government assistance in the form of tax credits and grants, including tax credits from government agencies in certain jurisdictions around job creation and retention, as well as capital investment initiatives. This includes, but is not limited to, refundable and non-refundable property and income tax credits in various state and other local jurisdictions. We recognize amounts received from government assistance programs, including non income tax credits and grants, as a reduction to MG&A expenses in our consolidated financial statements, when it is probable we will receive the funds and have met the conditions, if any, required by the government assistance program. If we receive the government assistance at a point in time for services to be completed over time, the cash received is initially recorded in our consolidated balance sheets as other liabilities, and amortized as an offset to MG&A expenses over the service period of the agreement. No programs are individually material nor are the programs material in the aggregate.
Revenue Recognition
Our net sales represent the sale of beer, malt beverages and other adjacencies, net of excise tax. Sales are stated net of incentives, discounts and returns. Sales of products are for cash or otherwise agreed upon credit terms. Our payment terms vary by location and customer, however, the time period between when revenue is recognized and when payment is due is not significant. Our revenue generating activities have a single performance obligation and are recognized at the point in time when control transfers and our obligation has been fulfilled, which is when the related goods are shipped or delivered to the customer, depending upon the method of distribution and shipping terms. Where our products are sold under consignment arrangements, revenue is not recognized until control has transferred, which is when the product is sold to the end customer. Revenue is measured as the amount of consideration we expect to receive in exchange for the sale of our product. The cost of various programs, such as price promotions, rebates and coupons, are treated as a reduction of sales. In certain of our markets where legally permitted, we make cash payments to customers such as slotting or listing fees, or payments for other marketing or promotional activities. These cash payments are recorded as a reduction of revenue unless we receive a distinct good or service. Specifically, a good or service is considered distinct when it is separately identifiable from other promises in the contract, we receive a benefit from the good or service and the benefit is separable from the sale of our product to the customer.
Certain payments made to customers are conditional on the achievement of volume targets, marketing commitments or both. If paid in advance, we record such payments as prepayments and amortize them over the relevant period to which the customer commitment is made (generally up to five years). When the payment is not for a distinct good or service, or fair value cannot be reasonably estimated, the amortization of the prepayment or the cost as incurred is recorded as a reduction of revenue. Where a distinct good or service is received and fair value can be reasonably estimated, the cost is included as MG&A expenses. The amounts deferred are reassessed regularly for recoverability over the contract period and are impaired where there is objective evidence that the benefits will not be realized or the asset is otherwise not recoverable. Separately, as discussed below, we analyze whether these advance payments contain a significant financing component for potential adjustment to the transaction price.
Our primary revenue generating activity represents the sale of beer and other beverages to customers, including both domestic and exported product sales. Our customer could be a distributor, retail or on-premise outlet, depending on the market. The majority of our revenues are generated from brands that we own and brew ourselves; however, we also import or brew and sell certain non-owned partner brands under licensing and related arrangements. In addition, primarily in the U.K., we sell other beverage companies' products to on-premise customers to provide them with a full range of products for their retail outlets. We refer to this as the "factored brand business." Sales from this business are included in our net sales and cost of goods sold when ultimately sold. In the factored brand business, we normally purchase inventory, which includes excise taxes charged by the vendor, take orders from customers for such brands, negotiate with the customers on pricing and invoice customers for the product and related costs of delivery. In addition, we incur the risk of loss when we are in possession of the inventory and for the receivables due from the customers. Revenues for owned brands, partner and imported brands, as well as factored brands are recognized at the point in time when control is transferred to the customer as discussed above.
Other Revenue Generating Activities
We contract manufacture for other brewers in some of our markets. These contractual agreements require us to brew, package and ship certain brands for these brewers, who then sell the products to their own customers in their respective markets. Revenues under contract brewing arrangements are recognized when our obligation related to the finished product is fulfilled and control of the product transfers to these other brewers.
We also have licensing agreements with third party partners who brew and distribute our products in various markets across our segments. Under these agreements, we are compensated based on the amount of products sold by our partners in these markets at an agreed upon royalty rate or profit percentage. We apply the sales-based royalty practical expedient to these licensing arrangements and recognize revenue as product is sold by our partners at the agreed upon rate.
Disaggregation of Revenue
We have evaluated our primary revenue generating activities under the disaggregation disclosure criteria outlined within the guidance and concluded that disclosure at the geographical segment level depicts how the nature, amount, timing and uncertainty of revenues and cash flows are affected by economic factors. We have also evaluated our other revenue generating activities and concluded that these activities are not material for separate disclosure. See Note 18, "Segment Reporting," for disclosure of revenues by geographic segment. Variable Consideration
Our revenue generating activities include variable consideration which is recorded as a reduction of the transaction price based upon expected amounts at the time revenue for the corresponding product sale is recognized. For example, customer promotional discount programs are entered into with certain distributors for certain periods of time. The amount ultimately reimbursed to distributors is determined based upon agreed-upon promotional discounts which are applied to distributors' sales to retailers. Other common forms of variable consideration include volume rebates for meeting established sales targets, and coupons and mail-in rebates offered to the end consumer. The determination of the reduction of the transaction price for variable consideration requires that we make certain estimates and assumptions that affect the timing and amounts of revenue and liabilities recorded. We estimate this variable consideration, including analyzing for a potential constraint on variable consideration, by taking into account factors such as the nature of the promotional activity, historical information and current trends, availability of actual results and expectations of customer and consumer behavior.
We do not have standard terms that permit return of product; however, in certain markets where returns occur we estimate the amount of returns as variable consideration based on factors including historical return experience and adjust our revenue accordingly. Products that do not meet our high quality standards are returned by the customer or recalled and destroyed and are recorded as a reduction of revenue. The reversal of revenue is recorded upon determination that the product will be recalled and destroyed. We estimate the costs required to facilitate product returns and record them in cost of goods sold as required.
For the years ended December 31, 2023, 2022 and 2021, adjustments to revenue from performance obligations satisfied in the prior period due to changes in estimates in variable consideration were immaterial.
Significant Financing Component and Costs to Obtain Contracts
In certain of our businesses where such practices are legally permitted, we make loans or advanced payments to retail outlets that sell our brands. For arrangements that do not span greater than one year, we apply the practical expedient available under ASC 606 and do not adjust the transaction price for the effects of a potential significant financing component. We further analyze arrangements that span greater than one year on an ongoing basis to determine whether a significant financing component exists. During the years ended December 31, 2023, 2022 and 2021 no arrangements were individually material nor material in the aggregate.
Advance payments to customers, where legally permitted, are deferred and amortized as a reduction to revenue over the expected period of benefit and tested for recoverability as appropriate. All other costs to obtain and fulfill contracts are expensed as incurred based on the nature, significance and expected benefit of these costs relative to the contract.
Contract Assets and Liabilities
We continually evaluate whether our revenue generating activities and advanced payment arrangements with customers result in the recognition of contract assets or liabilities. No such assets or liabilities existed as of December 31, 2023 or December 31, 2022. Separately, trade receivables, net including affiliate receivables, approximates receivables from contracts with customers.
Shipping and Handling
Freight costs billed to customers for shipping and handling are recorded as revenue. Shipping and handling expense related to costs incurred to deliver product are recognized within cost of goods sold. We account for shipping and handling activities that occur after control has transferred as a fulfillment cost as opposed to a separate performance obligation, and the costs of shipping and handling are recognized concurrently with the related revenue.
Excise Taxes
Excise taxes remitted to tax authorities are government-imposed excise taxes on beer. Excise taxes are shown in a separate line item in the consolidated statements of operations as a reduction of sales. In the consolidated balance sheets, excise taxes are generally recognized as a current liability within accounts payable and other current liabilities, with the liability subsequently reduced when the taxes are remitted to the tax authority. In cases where excise taxes are prepaid, they are recorded within other current assets, net.
Cost of Goods Sold
Our cost of goods sold includes costs we incur to make and ship beer and other beverages. These costs include brewing materials, such as barley, hops and various grains. Packaging materials, including aluminum, glass bottles, aluminum cans, cardboard and paperboard are also included in our cost of goods sold. Additionally, our cost of goods sold contains manufacturing expenses including both direct and indirect labor, shipping and handling including freight costs, utilities, maintenance costs, warehousing costs, purchasing and receiving costs, depreciation, promotional packaging, other manufacturing overheads and costs to purchase factored and other non-owned brands from suppliers, as well as the cost to facilitate product returns.
Marketing, General and Administrative Expenses
Our MG&A expenses include marketing expenses, including the direct costs related to the selling of a product or brand, media advertising (television, radio, digital, print), tactical advertising (signs, banners, point-of-sale materials) and promotion costs on both local and national levels. The creative portion of our advertising activities is expensed as incurred. Production costs of advertising and promotional materials are recorded as a prepaid asset and expensed when the advertising is first run. Included in MG&A is total marketing and advertising expenses which were approximately $1.1 billion, $1.0 billion and $1.1 billion for the years ended December 31, 2023, 2022 and 2021, respectively.
This classification also includes general and administrative costs for functions such as finance, legal, human resources and information technology. These costs primarily consist of compensation, benefits and outside services, as well as bad debt expense related to our allowance for doubtful accounts. Unless capitalization is allowed or required by U.S. GAAP, legal costs are expensed when incurred. These costs also include our marketing and sales organizations, including compensation, benefits and other overheads, including travel and entertainment expenses. This line item additionally includes amortization costs associated with definite-lived intangible assets, as well as certain depreciation costs related to non-production equipment and share-based compensation.
Share-based compensation is recognized using a straight-line method over the vesting period of the awards. We include estimated forfeitures expected to occur when calculating share-based compensation expense. Our share-based compensation plan and the awards within it contain provisions that accelerate vesting of awards upon change in control, retirement, disability or death of eligible employees and directors. Our share-based awards are considered vested when the employee's retention of the award is no longer contingent on providing service, which for certain awards can result in immediate recognition for awards granted to retirement-eligible individuals or accelerated recognition for awards granted to individuals that will become retirement eligible within the stated vesting period. Also, if less than the stated vesting period, we recognize these costs over the period from the grant date to the date retirement eligibility is achieved.
Other Operating Income (Expense), net
Our other operating income (expense), net items represent charges incurred or benefits realized that we believe are significant to our current operating results warranting separate classification; specifically, such items are considered to be one of the following:
•restructuring charges, including certain employee-related charges, asset abandonment-related losses, fees on termination of significant operating agreements and other related exit or disposal charges;
•intangible and tangible asset impairments, excluding goodwill;
•gains and (losses) on disposal of investments; and
•other significant items deemed to warrant separate classification within operating income
These items classified as other operating income (expense) are not necessarily non-recurring, however, they are generally deemed to be incremental to income earned or costs incurred by us in conducting normal operations.
Interest Expense, net
Our interest costs are associated with borrowings to finance our operations and acquisitions. Interest earned on our cash and cash equivalents across our business is recorded as interest income.
We capitalize interest cost as a part of the original cost of acquiring certain fixed assets if the cost of the capital expenditure and the expected time to complete the project are considered significant.
Other Non-Operating Income (Expense), net
Our other non-operating income (expense), net classification primarily includes gains and losses associated with activities not directly related to our operations. For instance, aggregate unrealized and realized foreign exchange gains and losses resulting from the remeasurement and settlement of foreign-denominated monetary assets and liabilities, as well as certain gains or losses on sales of non-operating assets and the mark-to-market activity associated with certain equity securities and other investments are classified in this line item. These gains and losses are reported in the operating segment in which they occur; however, foreign exchange gains and losses on intercompany balances and realized and unrealized changes in fair value on instruments not designated in hedging relationships related to financing and other treasury-related activities remain unallocated. The initial recording of foreign-denominated transactions are classified based on the nature of the transaction, with the unrealized or realized foreign exchange gains or losses resulting from the subsequent remeasurement of the monetary asset or liability, and its ultimate settlement, classified in other non-operating income (expense), net.
Income Taxes
Deferred income taxes are provided for the temporary differences between the financial reporting basis and the tax basis of our assets, liabilities and certain unrecognized gains and losses recorded in AOCI. We apply the intraperiod tax allocation rules to allocate our provision for income taxes between continuing operations and other categories of earnings, such as OCI, when we meet the criteria prescribed by U.S. GAAP.
The tax benefit from an uncertain tax position is recognized only if it is determined that the tax position will more likely than not be sustained based on its technical merits. We measure and record the tax benefits from such a position based on the largest benefit that has a greater than 50% likelihood of being realized upon ultimate settlement. Interest, penalties and offsetting positions related to unrecognized tax benefits are recognized as a component of income tax expense with interest and penalties being recorded to income tax benefit (expense) in our consolidated statement of operations. We record a valuation allowance to reduce our deferred tax assets to the amount that is more likely than not to be realized.
Other Comprehensive Income (Loss)
OCI represents income and losses for the reporting period, including the related tax impacts, which are excluded from net income (loss) and recognized directly within AOCI as a component of equity. OCI also includes amounts reclassified to the consolidated statement of operations during the reporting period that were previously recognized within AOCI. Amounts remaining within AOCI are expected to be reclassified out of AOCI in the future, at which point they will be recognized within the consolidated statement of operations as a component of net income (loss). We recognize OCI related to the translation of assets and liabilities of our foreign subsidiaries which are denominated in currencies other than the USD, unrealized gains and losses on the effective portion of our derivatives designated in cash flow hedging relationships and derivative and non-derivative instruments designated in net investment hedging relationships, actuarial gains and losses and prior service costs related to our pension and other post-retirement benefit plans, as well as our proportionate share of our equity method investments' OCI. Additionally, when we do not have the expectation or intent to cash settle certain of our intercompany note receivable and note payable positions in the foreseeable future, the remeasurement of these instruments is recorded as a component of foreign currency translation adjustments within OCI. We release stranded tax effects from AOCI using either a specific identification approach or portfolio approach based on the nature of the underlying item.
Earnings Per Share
Basic EPS is computed using the weighted-average number of shares of common stock outstanding during the period. Diluted EPS includes the additional dilutive effect of our potentially dilutive securities, which include RSUs, DSUs, PSUs and stock options. The dilutive effects of our potentially dilutive securities are calculated using the treasury stock method. Our calculation of weighted-average shares includes Class A common stock and Class B common stock and Class A exchangeable shares and Class B exchangeable shares. All classes of stock have in effect the same dividend rights and share equitably in undistributed earnings. Holders of Class A common stock receive dividends only to the extent dividends are declared and paid to holders of Class B common stock. See Note 14, "Stockholders' Equity" for further discussion of the Class A common stock and Class B common stock and Class A exchangeable shares and Class B exchangeable shares. We have no unvested outstanding equity share awards that contain non-forfeitable rights to dividends.
Anti-dilutive securities excluded from the computation of diluted EPS for the years ended December 31, 2023, December 31, 2022 and December 31, 2021 were 0.6 million, 3.1 million and 1.8 million shares, respectively.
Cash and Cash Equivalents
Cash consists of cash on hand and bank deposits. Cash equivalents represent highly liquid investments with original maturities of three months or less. Our cash deposits are maintained with multiple, reputable financial institutions.
Dividends
On November 9, 2023, the Board declared a cash dividend of $0.41 per share, paid on December 15, 2023, to shareholders of Class A and Class B common stock of record on December 1, 2023. Shareholders of exchangeable shares received the CAD equivalent of dividends declared on Class A and Class B common stock, equal to CAD 0.56 per share.
During the year ended December 31, 2023, dividends declared to eligible shareholders totaled $1.64 per share, with the CAD equivalent totaling CAD 2.19 per share. During the year ended December 31, 2022, dividends declared to eligible shareholders totaled $1.52 per share, with the CAD equivalent totaling CAD 1.95 per share.
In response to the global economic uncertainty created by the coronavirus pandemic, the Board suspended our regular quarterly dividend on our Class A and Class B common and exchangeable shares in May 2020. A quarterly dividend was reinstated during the third quarter of 2021. During the year ended December 31, 2021, dividends declared to eligible shareholders totaled $0.68 per share, with the CAD equivalent totaling CAD 0.84 per share.
Non-Cash Activity
Non-cash investing activities includes movements in our guarantee of indebtedness of certain equity method investments.. See Note 3, "Investments" for further discussion. We also had other non-cash activities related to capital expenditures incurred but not yet paid of $254.9 million, $234.3 million and $206.6 million during the years ended December 31, 2023, 2022 and 2021, respectively. In addition, we had non-cash activities related to our non-cash issuances of share-based awards. See Note 16, "Share-Based Payments" for further details. In June 2021, we rolled forward our July 2021 $250.0 million forward starting interest rate swap to May 2022 through a cashless settlement. The unrealized loss on the 2021 forward starting interest rate swap at the time of the transaction was factored into the effective interest rate assigned to the new May 2022 forward starting interest rate swap. See Note 10, "Derivative Instruments and Hedging Activities" for further details. During the first quarter of 2022, we recorded a non-cash transaction related to the establishment of an accrued liability of $56.0 million as the best estimate of the probable loss in the Keystone litigation case based on the jury verdict. During the years ended December 31, 2023 and 2022, we recorded non-cash transactions of $1.9 million and $0.6 million, respectively, in accrued interest associated with this accrued liability. See Note 13, "Commitments and Contingencies" for further details. Other than the activity mentioned above and the supplemental non-cash activity related to the recognition of leases discussed in Note 8, "Leases," there was no other significant non-cash activity for the years ended December 31, 2023, 2022 and 2021. Trade Receivables
We record trade receivables at net realizable value. This carrying value includes an appropriate allowance for estimated uncollectible amounts to reflect any loss anticipated on the trade receivable balances. We calculate this allowance based on our country-specific history of write-offs, level of past-due accounts based on the contractual terms of the receivables and our relationships with and the economic status of our customers, which may be impacted by current macroeconomic and regulatory factors specific to the country of origin. This methodology takes into consideration historical loss experience and current and forecasted changes in cash flows based on internal and external information. The allowance for doubtful accounts was $12.7 million and $13.2 million as of December 31, 2023, and December 31, 2022, respectively.
Inventories
Inventories are stated at the lower of cost or net realizable value. Cost is determined by the first-in, first-out ("FIFO") method. We regularly assess the shelf-life of our inventories and reserve for those inventories when it becomes probable the product will not be sold within our freshness specifications. In addition, we reserve for those inventories associated with discontinued SKUs or seasonal or other packaging material changes.
Other Current Assets
Other current assets include prepaid assets, maintenance and operating supplies, promotion materials and derivative assets that are expected to be recognized or realized within the next 12 months. Maintenance and operating supplies include our inventories of spare parts, which are kept on hand for repairs and maintenance of machinery and equipment. The majority of spare parts within our business include motors, fillers and other components that are required to maintain a normal level of production in the event that expected maintenance and/or repairs are required. These parts are inventoried within current assets as they are reasonably expected to be used during the normal operating cycle of the business and are reserved for excess and obsolescence, as appropriate.
Property, Plant and Equipment
Property, plant and equipment is stated at original cost less accumulated depreciation. Depreciation is recorded using the straight-line method over the estimated useful lives of the assets, which are reviewed periodically and have the following ranges: buildings and improvements: 20-40 years; production and office equipment 3-25 years; and software: 3-5 years. Land is not depreciated and construction in progress is not depreciated until ready for service. Costs of enhancements or modifications that substantially extend the capacity or useful life of an asset are capitalized and depreciated accordingly. Ordinary repairs and maintenance are expensed as incurred. When property, plant and equipment is sold or otherwise disposed of, the cost and accumulated depreciation are removed from our consolidated balance sheets and the resulting gain or loss, if any, is reflected in our consolidated statements of operations. Long-lived assets are evaluated for impairment whenever events or changes in circumstances indicate the carrying value of an asset (or asset group) may not be recoverable. Our asset groups are generally identified at the segment level with the exception of certain craft breweries or other locations which may operate on a more stand-alone basis.
Returnable containers are recorded at acquisition cost and consist of returnable bottles, kegs, pallets and crates that are both in our direct control within our breweries, warehouses and distribution facilities and those that we indirectly control in the market through our agreements with our customers and other brewers and for which a deposit is received. The deposits received on our returnable containers in the market are recorded as deposit liabilities, included within accounts payable and other current liabilities in the consolidated balance sheets. We estimate that the loss, breakage and deterioration of our returnable containers is comparable to the depreciation calculated on an estimated useful life of up to 4 years for bottles, 5 years for pallets, 7 years for crates and 15 years for returnable kegs. We also own and maintain other equipment in the market related to delivery of our products to end consumers, for example on-premise dispense equipment and refrigeration units. This equipment is recorded at acquisition cost and depreciated over lives of up to 7 years, depending on the market, reflecting the use of the equipment, as well as the loss and deterioration of the asset.
The costs of acquiring or developing internal-use computer software, including directly-related payroll costs for internal resources, are capitalized and classified within property, plant and equipment. Software maintenance and training costs are expensed in the period incurred.
Property, plant and equipment held under finance lease are depreciated using the straight-line method over the estimated useful life or the lease term, whichever is shorter. Finance lease assets for which ownership is transferred at the end of the lease, or there is a purchase option that we are reasonably certain to exercise, are depreciated over the useful life that would be assigned if the asset were owned.
Cloud Computing Arrangements
Cloud computing arrangement implementation costs incurred in hosting arrangements that are service contracts are recorded within other assets in the consolidated balance sheets. Capitalized cloud computing arrangement implementation costs are amortized using the straight-line method over the remaining term of the contract. Amortization expense was $7.9 million, $6.2 million and $5.2 million for the years ended December 31, 2023, December 31, 2022 and December 31, 2021, respectively.
The following table presents the gross and net value of capitalized cloud computing implementation costs associated with active hosting arrangements.
| | | | | | | | | | | |
| As of |
| December 31, 2023 | | December 31, 2022 |
| (In millions) |
| Cloud computing implementation costs | $ | 56.5 | | | $ | 38.5 | |
| Less: accumulated amortization | (20.8) | | | (12.9) | |
| Cloud computing implementation costs, net | $ | 35.7 | | | $ | 25.6 | |
| | | |
| | | |
| | | |
| | | |
Goodwill and Other Intangible Assets
Goodwill is allocated to the reporting unit in which the business that created the goodwill resides. A reporting unit is an operating segment, or a business unit one level below that operating segment, for which discrete financial information is prepared and regularly reviewed by segment management. As of the date of the completion of our 2023 impairment testing, we have concluded that we have two reporting units, Americas and EMEA&APAC. See further discussion in Note 6, "Goodwill and Intangibles." As required, we evaluate the carrying value of our goodwill at the reporting unit level and indefinite-lived intangible assets for impairment at least annually or when an interim triggering event occurs that may indicate potential impairment. Our annual test is performed as of the first day of our fiscal fourth quarter, October 1. The testing of goodwill and indefinite-lived intangible assets uses estimates and assumptions affected by factors such as economic and industry conditions along with changes in operating performance. The evaluation involves comparing the reporting unit or indefinite-lived intangible asset's fair value to its carrying value. If the fair value exceeds its respective carrying value, then we conclude that no impairment has occurred. If the carrying value exceeds its fair value, we would recognize an impairment loss in an amount equal to the excess up to the total amount of goodwill allocated to that reporting unit or balance of the respective indefinite-lived intangible asset.
We continuously monitor the performance of our other definite-lived intangible assets and evaluate for impairment when evidence exists that certain triggering events or changes in circumstances indicate that the carrying amount of these assets may not be recoverable. Significant judgments and assumptions are required in such impairment evaluations. Definite-lived intangible assets are stated at cost less accumulated amortization. Amortization is recorded using the straight-line method over the estimated lives of the assets as this approximates the pattern in which the assets economic benefits are consumed.
Goodwill impairments are recorded to the Goodwill impairment line item on the consolidated statement of operations whereas impairments of intangible assets are recorded in the "Other operating income (expense), net" line item.
Equity Method Investments
We apply the equity method of accounting to investments that we do not control but where we exercise significant influence or VIEs for which we are not the primary beneficiary. We use the cumulative earnings approach for determining cash flow presentation of cash distributions received from equity method investments. Distributions received are included in our consolidated statements of cash flows as operating activities, unless the cumulative distributions exceed our portion of the cumulative equity in the net earnings of the equity method investment, in which case the excess distributions are deemed to be returns of the investment and are classified as investing activities in our consolidated statements of cash flows. See Note 3, "Investments" for further information regarding our equity method investments. There are no related parties that own interests in our equity method investments as of December 31, 2023. Derivative Hedging Instruments
We use derivatives as part of our normal business operations to manage our exposure to fluctuations in interest rates, foreign currency exchange, commodity prices, production and packaging material costs and for other strategic purposes related to our core business. We enter into derivatives for risk management purposes only, including derivatives designated in hedge accounting relationships as well as those derivatives utilized as economic hedges. We do not enter into derivatives for trading or speculative purposes. We recognize our derivatives on the consolidated balance sheets as assets or liabilities at fair value and classify them in either current or non-current assets or liabilities based on each contract's respective unrealized gain or loss position and each contract's respective maturity. Consistent with our policy, our current derivative agreements do not allow us to net positions with the same counterparty and therefore, we present our derivative positions gross in our consolidated balance sheets.
Changes in fair values of outstanding cash flow and net investment hedges are recorded in OCI, until earnings are affected by the variability of cash flows of the underlying hedged item or the sale of the underlying net investment, respectively. Effective cash flow hedges offset the gains or losses recognized on the underlying exposure in the consolidated statements of operations, or for net investment hedges, the foreign exchange translation gain or loss recognized in AOCI. Changes in fair value of outstanding fair value hedges and the offsetting changes in fair value of the hedged item are recognized in earnings. Changes in fair value of the derivative attributable to components allowed to be excluded from the assessment of hedge effectiveness are deferred in AOCI and recognized in earnings over the life of the hedge.
We record realized gains and losses from derivative instruments in the same financial statement line item as the hedged item/forecasted transaction. Changes in unrealized gains and losses for derivatives not designated in a hedge accounting relationship are recorded directly in earnings each period and are also recorded in the same financial statement line item as the hedged item/forecasted transaction. Cash flows from the settlement of derivatives, including both economic hedges and those designated in hedge accounting relationships, appear in the consolidated statements of cash flows in the same categories as the cash flows of the hedged item unless the instruments are deemed to contain an other-than-insignificant financing element, in which case the cash flows related to this instrument will be classified as financing activities.
In accordance with authoritative accounting guidance, we do not record the fair value of derivatives for which we have elected the Normal Purchase Normal Sale ("NPNS") exemption. We account for these contracts on an accrual basis, recording realized settlements related to these contracts in the same financial statement line items as the corresponding transaction.
Leases
We enter into contractual arrangements for the utilization of certain non-owned assets, primarily real estate and equipment, which are evaluated as finance or operating leases upon commencement and are accounted for accordingly. We assess whether an arrangement is or contains a lease at inception of the contract. For all contractual arrangements deemed to be leases (other than short-term leases, which have a duration of one year or less), as of the lease commencement date, we recognize on the consolidated balance sheets a liability for our obligation related to the lease and a corresponding asset representing our right to use the underlying asset over the period of use.
For leases that qualify as short-term leases, we have elected, for all classes of underlying assets, to not apply the balance sheet recognition requirements of ASC 842, and instead, we recognize the lease payments in the consolidated statements of operations on a straight-line basis over the lease term. We have also made the election, for our existing real estate and equipment classes of underlying assets, to account for lease and non-lease components as a single lease component.
Our leases have remaining lease terms of up to approximately 16 years. Certain of our lease agreements contain options to extend or early terminate the agreement. The lease term used to calculate the right-of-use ("ROU") asset and lease liability at commencement includes the impacts of options to extend or terminate the lease when it is reasonably certain that we will exercise that option. When determining whether it is reasonably certain that we will exercise an option at commencement, we consider various existing economic factors, including real estate strategies, the nature, length and terms of the agreement, as well as the uncertainty of the condition of leased equipment at the end of the lease term. Assumptions made at the commencement date are re-evaluated upon occurrence of certain events requiring a lease modification. Additionally, for certain equipment leases involving groups of similar leased assets with similar lease terms, we apply a portfolio approach to effectively account for the operating lease right-of-use assets and liabilities.
The discount rate used to calculate the present value of the future minimum lease payments is the rate implicit in the lease, when readily determinable. As the rate implicit in the lease is rarely readily determinable, we use our incremental borrowing rate relative to the leased asset in all other cases.
Certain of our leases include variable payments, primarily for items such as property taxes, insurance, maintenance and other operating expenses associated with leased assets. These variable payments are excluded from the measurement of our lease assets and liabilities and are recognized in the period in which the obligation for those payments is incurred. Our lease agreements do not contain any material residual value guarantees or material restrictive covenants.
Lease-related expense is recorded within either COGS or MG&A expenses on the consolidated statements of operations, depending on the function of the underlying leased asset, with the exception of interest on finance lease liabilities, which is recorded within interest expense on the consolidated statements of operations.
Pension and Postretirement Benefits
We maintain retirement plans for the majority of our employees. We offer different types of plans within each segment, including defined benefit plans, defined contribution plans and OPEB plans. Each plan is managed locally and in accordance with respective local laws and regulations. BRI and BDL, two of our equity method investments, maintain defined benefit, defined contribution and OPEB plans as well.
We recognize the underfunded or overfunded status of a defined benefit pension and OPEB plan as an asset or liability in the consolidated balance sheets. The funded status of a plan, measured as the difference between the fair value of plan assets and the projected benefit obligation, and the related net periodic pension cost are calculated using a number of significant actuarial assumptions. Changes in net periodic pension cost and funding status may occur in the future due to changes in these assumptions.
We use the fair value approach to calculate the market-related value of pension plan assets used to determine net periodic pension cost, which includes measuring the market-related value of plan assets at fair value for purposes of determining the expected return on plan assets and amount of gain or loss subject to amortization.
Projected benefit obligation is the actuarial present value as of the measurement date of all benefits attributed by the plan benefit formula to employee service rendered before the measurement date using assumptions as to future compensation levels and years of service if the plan benefit formula is based on those future compensation levels and years of service. Accumulated benefit obligation is the actuarial present value of benefits (whether vested or unvested) attributed by the plan benefit formula to employee service rendered before the measurement date and based on employee service and compensation, if applicable, prior to that date. Accumulated benefit obligation differs from projected benefit obligation in that it includes no assumption about future compensation levels and years of service.
We employ the corridor approach for determining each plan's potential amortization from AOCI of deferred gains and losses, which occur when actual experience differs from estimates, into other pension and postretirement (benefit) cost, net. This approach defines the "corridor" as the greater of 10% of the projected benefit obligation or 10% of the market-related value of plan assets and requires amortization of the excess net gain or loss that exceeds the corridor over the average remaining service periods of active plan participants. For plans closed to new entrants and the future accrual of benefits, the average remaining life expectancy of all plan participants (including retirees) is used.
Fair Value Measurements
The carrying amounts of our cash and cash equivalents, accounts receivable, accounts payable and other current liabilities approximate fair value as recorded due to the short-term nature of these instruments. The fair value of derivatives is estimated by discounting the estimated future cash flows utilizing observable market interest, foreign exchange and commodity rates adjusted for non-performance credit risk associated with our counterparties (assets) or with MCBC (liabilities), as appropriate. See Note 10, "Derivative Instruments and Hedging Activities" for additional information. Based on current market rates for similar instruments, the fair value of long-term debt is presented in Note 9, "Debt." U.S. GAAP guidance for fair value includes a hierarchy that prioritizes fair value measurements based on the types of inputs used for the various valuation techniques (market approach, income approach and cost approach). Our financial assets and liabilities are measured using inputs from the three levels of the fair value hierarchy.
The three levels of the hierarchy are as follows:
Level 1—Inputs are unadjusted quoted prices in active markets for identical assets or liabilities that we have the ability to access at the measurement date.
Level 2—Inputs include quoted prices for similar assets and liabilities in active markets, quoted prices for identical or similar assets or liabilities in markets that are less active, inputs other than quoted prices that are observable for the asset or liability (i.e., interest rates, yield curves, etc.), and inputs that are derived principally from, or corroborated by, observable market data by correlation or other means (market corroborated inputs).
Level 3—Unobservable inputs that reflect the assumptions that we believe market participants would use in pricing the asset or liability. We develop these inputs based on the best information available, including our own data.
Foreign Currency
Assets and liabilities recorded in foreign currencies that are the functional currencies for the respective operations are translated at the prevailing exchange rate at the balance sheet date. Translation adjustments resulting from this process are reported as a separate component of OCI. Gains and losses from foreign currency transactions are included in earnings for the period. Revenue and expenses are translated at the average exchange rates during the respective period throughout the year.
Subsequent Events
On February 13, 2024, our Company's Board of Directors declared a quarterly dividend of $0.44 per share, to be paid on March 15, 2024, to shareholders of Class A and Class B common stock of record on March 1, 2024. Shareholders of exchangeable shares will receive the CAD equivalent of dividends declared on Class A and Class B common stock.
2. New Accounting Pronouncements
New Accounting Pronouncements Recently Adopted
In March 2020, the FASB issued authoritative guidance which provides optional expedients and exceptions for applying U.S. GAAP to contracts, hedging relationships and other transactions affected by reference rate reform if certain criteria are met. The amendments apply only to contracts, hedging relationships and other transactions that reference LIBOR or another reference rate expected to be discontinued because of reference rate reform and was effective for all entities upon issuance on March 12, 2020 and remains effective through December 31, 2024. The guidance permits a company to elect certain optional expedients and exceptions when affected by the changes in reference rate reform. We have adopted this guidance and elected to apply certain optional expedients related to our derivative instruments with maturity dates extending beyond the discontinuance date of LIBOR. Specifically, in May 2023, we amended our 2026 forward starting interest rate swaps to replace LIBOR with SOFR and applied the optional expedients to account for the transition. None of the changes made as a result of reference rate reform had a material impact on our financial statements.
In September 2022, the FASB issued authoritative guidance intended to provide consistent and transparent disclosures for a buyer in a supplier finance program by requiring disclosures of key program terms, the amount of obligations that have been confirmed as valid with the finance provider that are deemed outstanding as of the end of the period, a description of the financial line item in which this unpaid balance resides and a rollforward of the obligations including the amount of obligations confirmed and paid. We adopted this guidance, with the exception of the rollforward disclosure requirement, starting with our quarterly report for the three months ended March 31, 2023. See Note 1, "Basis of Presentation and Summary of Significant Accounting Policies" for additional information on our supplier finance programs. The rollforward disclosure requirement is effective for us in our annual report for the year ending December 31, 2024 and is required to be applied prospectively. New Accounting Pronouncements Not Yet Adopted
ITEM 7A. QUANTITATIVE AND QUALITATIVE DISCLOSURES ABOUT MARKET RISK
In the normal course of our global operations, we are exposed to market risks associated with foreign currency exchange fluctuations, volatile interest rates and commodity price risks. To manage our exposure to these market risks, we enter into certain supplier-based and market-based hedging transactions. Such transactions are allowed under our risk management policy and are monitored closely with clear controls around the activities. Our market-based transactions include a variety of derivative financial instruments, none of which are used for trading or speculative purposes. The counterparties to these market-based transactions are generally highly rated institutions. Our objective is to manage our exposures and to decrease the volatility of our earnings and cash flows as a result of changes in underlying rates and costs.
Interest RateCommodity Price Risk
We are exposed to volatility in interest rates with regard tocommodity prices as we use commodities in the production and distribution of our current and future debt offerings. Specifically, we are exposed to U.S. Department of Treasury rates, Canadian government rates and LIBOR, or any such LIBOR alternative like SONIA, SOFR or EURIBOR, for example.products. We may from time to time enter into interest rate swaps on our current debt obligations as our hedging strategy is to achieve our desired fixed-to-floating rate debt profile such that we manage the volatility in earnings as well as the cost of funding our operations. Further, we may enter into forward starting interest rate swaps to managespecifically hedge our exposure to fluctuations in the price of natural gas, aluminum, including surcharges relating to our aluminum exposures, corn, sweeteners, barley and diesel. We utilize market-based derivatives and long-term supplier-based contracts, specifically a combination of purchase orders, long-term supply contracts and over-the-counter financial instruments to mitigate our commodity price risk by reducing price volatility of interest rates associated with future interest payments on a forecasted debt issuance.
The following table presentsincludes details of our fixed rate debt and forward starting interest ratecommodity swaps used to hedge commodity price risk as well as the impact of an absolute 1%a hypothetical 10% adverse change in interest ratesthe related commodity prices on their respectivethe fair values.value of the derivatives. The following table excludes our commodity options because we have offsetting buy and sell positions. Notional amounts and fair values are presented in USD based on the applicable exchange rate as of December 31, 20212023 and December 31, 2020, respectively.2022. Approximately 68% of commodity swaps mature in 2024, 29% mature in 2025 and 3% mature thereafter.
| | | | | | | | | | | | | | | | | | | | | | | | | | | | | | | | | | | | | | |
| | Notional amounts | | Fair Value Asset/(Liability) | | Effect of Adverse Change |
| (in millions) | | As of December 31, 2023 | | As of December 31, 2022 | | As of December 31, 2023 | | As of December 31, 2022 | | As of December 31, 2023 | | As of December 31, 2022 |
| Swaps | | $ | 653.5 | | | $ | 525.2 | | | $ | (30.4) | | | $ | 69.0 | | | $ | (58.1) | | | $ | (55.8) | |
| | | | | | | | | | | | |
ITEM 8. FINANCIAL STATEMENTS AND SUPPLEMENTARY DATA
| | | | | |
| |
| Index to Financial Statements | | | | | | | | | | | | | | | | | | | | | | | | | | | | | | | | | | | | | | Page |
| |
| |
| |
| |
| |
| |
| |
| |
| |
| |
| |
| |
| |
| |
| |
| |
| |
| |
| |
| |
| |
| |
| |
| |
| |
| |
| |
| |
| |
| |
| |
| |
| |
| |
| |
| |
| |
MANAGEMENT'S REPORT
The preparation, integrity and objectivity of the financial statements and all other financial information included in this annual report are the responsibility of the management of Molson Coors Beverage Company. The financial statements have been prepared in accordance with generally accepted accounting principles in the United States, applying estimates based on management's best judgment where necessary. Management believes that all material uncertainties have been appropriately accounted for and disclosed.
Our management, under the supervision and with the participation of our Chief Executive Officer and Chief Financial Officer, assessed the effectiveness of our internal control over financial reporting as of December 31, 2023, based on the framework and criteria established in Internal Control—Integrated Framework (2013 Framework), issued by the Committee of Sponsoring Organizations of the Treadway Commission. Based upon its assessment, management concluded that, as of December 31, 2023, the Company's internal control over financial reporting was effective.
PricewaterhouseCoopers LLP, the Company's independent registered public accounting firm, provides an objective, independent audit of the consolidated financial statements and internal control over financial reporting. Their accompanying report is based upon an examination conducted in accordance with standards of the Public Company Accounting Oversight Board (United States), including tests of accounting procedures, records and internal control.
The Board of Directors, operating through its Audit Committee composed of independent, outside directors, monitors the Company's accounting control systems and reviews the results of the Company's auditing activities. The Audit Committee meets at least quarterly, either separately or jointly, with representatives of management, PricewaterhouseCoopers LLP and internal auditors. To ensure complete independence, PricewaterhouseCoopers LLP and the Company's internal auditors have full and free access to the Audit Committee and may meet with or without the presence of management.
| | | | | | | | |
/s/ GAVIN D.K. HATTERSLEY | | /s/ TRACEY I. JOUBERT |
| Gavin D.K. Hattersley | | Fair Value Asset/(Liability)Tracey I. Joubert |
| President & Chief Executive Officer | | Chief Financial Officer |
| Molson Coors Beverage Company | | Effect of 1% Adverse ChangeMolson Coors Beverage Company |
| February 20, 2024 | | February 20, 2024 |
Report of Independent Registered Public Accounting Firm
To the Board of Directors and Stockholders of Molson Coors Beverage Company
Opinions on the Financial Statements and Internal Control over Financial Reporting
We have audited the accompanying consolidated balance sheets of Molson Coors Beverage Company and its subsidiaries (the “Company”) as of December 31, 2023 and 2022, and the related consolidated statements of operations, of comprehensive income (loss), of stockholders’ equity and noncontrolling interests and of cash flows for each of the three years in the period ended December 31, 2023, including the related notes and schedule of valuation and qualifying accounts for each of the three years in the period ended December 31, 2023 appearing under item 15(c) (collectively referred to as the “consolidated financial statements”). We also have audited the Company's internal control over financial reporting as of December 31, 2023, based on criteria established in Internal Control - Integrated Framework (2013) issued by the Committee of Sponsoring Organizations of the Treadway Commission (COSO).
In our opinion, the consolidated financial statements referred to above present fairly, in all material respects, the financial position of the Company as of December 31, 2023 and 2022, and the results of its operations and its cash flows for each of the three years in the period ended December 31, 2023 in conformity with accounting principles generally accepted in the United States of America. Also in our opinion, the Company maintained, in all material respects, effective internal control over financial reporting as of December 31, 2023, based on criteria established in Internal Control - Integrated Framework (2013) issued by the COSO.
Basis for Opinions
The Company's management is responsible for these consolidated financial statements, for maintaining effective internal control over financial reporting, and for its assessment of the effectiveness of internal control over financial reporting, included in Management's Annual Report on Internal Control over Financial Reporting appearing under Item 9A. Our responsibility is to express opinions on the Company’s consolidated financial statements and on the Company's internal control over financial reporting based on our audits. We are a public accounting firm registered with the Public Company Accounting Oversight Board (United States) (PCAOB) and are required to be independent with respect to the Company in accordance with the U.S. federal securities laws and the applicable rules and regulations of the Securities and Exchange Commission and the PCAOB.
We conducted our audits in accordance with the standards of the PCAOB. Those standards require that we plan and perform the audits to obtain reasonable assurance about whether the consolidated financial statements are free of material misstatement, whether due to error or fraud, and whether effective internal control over financial reporting was maintained in all material respects.
Our audits of the consolidated financial statements included performing procedures to assess the risks of material misstatement of the consolidated financial statements, whether due to error or fraud, and performing procedures that respond to those risks. Such procedures included examining, on a test basis, evidence regarding the amounts and disclosures in the consolidated financial statements. Our audits also included evaluating the accounting principles used and significant estimates made by management, as well as evaluating the overall presentation of the consolidated financial statements. Our audit of internal control over financial reporting included obtaining an understanding of internal control over financial reporting, assessing the risk that a material weakness exists, and testing and evaluating the design and operating effectiveness of internal control based on the assessed risk. Our audits also included performing such other procedures as we considered necessary in the circumstances. We believe that our audits provide a reasonable basis for our opinions.
Definition and Limitations of Internal Control over Financial Reporting
A company’s internal control over financial reporting is a process designed to provide reasonable assurance regarding the reliability of financial reporting and the preparation of financial statements for external purposes in accordance with generally accepted accounting principles. A company’s internal control over financial reporting includes those policies and procedures that (i) pertain to the maintenance of records that, in reasonable detail, accurately and fairly reflect the transactions and dispositions of the assets of the company; (ii) provide reasonable assurance that transactions are recorded as necessary to permit preparation of financial statements in accordance with generally accepted accounting principles, and that receipts and expenditures of the company are being made only in accordance with authorizations of management and directors of the company; and (iii) provide reasonable assurance regarding prevention or timely detection of unauthorized acquisition, use, or disposition of the company’s assets that could have a material effect on the financial statements.
Because of its inherent limitations, internal control over financial reporting may not prevent or detect misstatements. Also, projections of any evaluation of effectiveness to future periods are subject to the risk that controls may become inadequate because of changes in conditions, or that the degree of compliance with the policies or procedures may deteriorate.
| | | | | | | | | | | | | | | | | | | | | | | | | | | | | | | | | | | | | | |
| (in millions) | | As of December 31, 2021 | | As of December 31, 2020 | | As of December 31, 2021 | | As of December 31, 2020 | | As of December 31, 2021 | | As of December 31, 2020 |
| USD denominated fixed rate debt | | $ | 5,400.0 | | | $ | 6,400.0 | | | $ | (5,952.7) | | | $ | (7,211.4) | | | $ | (200.0) | | | $ | (213.2) | |
| Foreign currency denominated fixed rate debt | | $ | 1,701.0 | | | $ | 1,763.1 | | | $ | (1,763.1) | | | $ | (1,861.3) | | | $ | (10.5) | | | $ | (6.5) | |
| Forward starting interest rate swaps | | $ | 1,500.0 | | | $ | 1,500.0 | | | $ | (170.8) | | | $ | (221.5) | | | $ | (160.5) | | | $ | (177.1) | |
Foreign Exchange RiskThe critical audit matters communicated below are matters arising from the current period audit of the consolidated financial statements that were communicated or required to be communicated to the audit committee and that (i) relate to accounts or disclosures that are material to the consolidated financial statements and (ii) involved our especially challenging, subjective, or complex judgments. The communication of critical audit matters does not alter in any way our opinion on the consolidated financial statements, taken as a whole, and we are not, by communicating the critical audit matters below, providing separate opinions on the critical audit matters or on the accounts or disclosures to which they relate.
Foreign currency exchange riskGoodwill Impairment Assessment - Americas Reporting Unit
As described in Notes 1 and 6 to the consolidated financial statements, the Company’s goodwill balance related to the Americas reporting unit was $5,325 million as of December 31, 2023. The carrying value of goodwill is inherentevaluated for impairment at the reporting unit level at least annually or when an interim triggering event occurs that may indicate potential impairment. The Company’s annual impairment test is performed as of the first day of the fiscal fourth quarter. The evaluation involves comparing the reporting unit’s fair value to its carrying value. If the fair value exceeds its respective carrying value, then management would conclude that no impairment has occurred. If the carrying value exceeds its fair value, the Company would recognize an impairment loss in an amount equal to the excess up to the total amount of goodwill allocated to the reporting unit. A combination of a discounted cash flow analysis and market approach is used by management to determine the fair value of the reporting unit. Fair value determinations require considerable judgment and are sensitive to changes in underlying assumptions and factors. Examples of events or circumstances that could reasonably be expected to negatively affect the underlying key assumptions and ultimately impact the estimated fair value of our reporting unit may include the following, as disclosed by management, (i) growth rates for sales, costs and profits, which are based on various long-range financial and operational plans; (ii) prolonged weakening of economic conditions; or (iii) significant unfavorable changes in income tax rates, environmental or other regulations, including interpretations thereof, terminal growth rate, market multiples and / or weighted- average cost of capital. Management concluded that the fair value of the Americas reporting unit was in excess of its carrying value and therefore no goodwill impairment charge was recorded.
The principal considerations for our determination that performing procedures relating to the goodwill impairment assessment for the Americas reporting unit is a critical audit matter are (i) the significant judgment by management when developing the fair value estimate of the Americas reporting unit; (ii) a high degree of auditor judgment, subjectivity, and effort in performing procedures and evaluating management’s significant assumptions related to the weighted average cost of capital and growth rates for sales; and (iii) the audit effort involved the use of professionals with specialized skill and knowledge.
Addressing the matter involved performing procedures and evaluating audit evidence in connection with forming our overall opinion on the consolidated financial statements. These procedures included testing the effectiveness of controls relating to management’s goodwill impairment assessment, including controls over the valuation of the Americas reporting unit. These procedures also included, among others (i) testing management’s process for developing the fair value estimate of the Americas reporting unit; (ii) evaluating the appropriateness of the discounted cash flow analysis and market approach used by management; (iii) testing the completeness and accuracy of underlying data used in the discounted cash flow analysis and market approach; and (iv) evaluating the reasonableness of significant assumptions used by management related to the weighted average cost of capital and growth rates for sales. Evaluating management's assumptions related to growth rates for sales involved evaluating whether the significant assumptions used were reasonable considering (i) the current and past performance of the Americas reporting unit; (ii) the consistency with external market and industry data; and (iii) whether these assumptions were consistent with evidence obtained in other areas of the audit. Professionals with specialized skill and knowledge were used to assist in evaluating (i) the appropriateness of the Company’s discounted cash flow analysis and market approach and (ii) the reasonableness of the weighted average cost of capital assumption.
Indefinite-Lived Intangible Asset Impairment Assessment - Staropramen Family of Brands (EMEA&APAC)
As described in Notes 1 and 6 to the consolidated financial statements, the Company’s indefinite-lived intangible asset brands balance was $8,002 million as of December 31, 2023, of which a portion relates to the Staropramen family of brands in the EMEA&APAC segment. The carrying value of the indefinite-lived intangible asset is evaluated for impairment at least annually or when an interim triggering event occurs that may indicate potential impairment. The Company’s annual impairment test is performed as of the first day of the fiscal fourth quarter. The evaluation involves comparing the indefinite-lived intangible asset’s fair value to its carrying value. If the fair value exceeds its respective carrying value, then management would conclude that no impairment has occurred. If the carrying value exceeds its fair value, the Company would recognize an impairment loss in an amount equal to the excess up to the total balance of the respective indefinite-lived intangible asset. As of the October 1, 2023 testing date, the carrying value of the Staropramen family of brands in EMEA&APAC was determined to be in excess of its fair value such that an impairment loss of $160.7 million was recorded by management. An excess earnings approach is used to determine the fair value of the indefinite-lived intangible asset. Fair value determinations require
considerable judgment and are sensitive to changes in underlying assumptions and factors. Examples of events or circumstances that could reasonably be expected to negatively affect the underlying key assumptions and ultimately impact the estimated fair value of the Company’s indefinite-lived intangible may include the following, as disclosed by management, (i) growth rates for sales, costs and profits, which are based on various long-range financial and operational plans, (ii) prolonged weakening of economic conditions, or (iii) significant unfavorable changes in income tax rates, environmental or other regulations, including interpretations thereof, terminal growth rates, and / or weighted average cost of capital.
The principal considerations for our determination that performing procedures relating to the indefinite-lived intangible asset impairment assessment for the Staropramen family of brands in EMEA&APAC is a critical audit matter are (i) the significant judgment by management when developing the fair value estimate of the indefinite-lived intangible asset for the Staropramen family of brands; (ii) a high degree of auditor judgment, subjectivity and effort in performing procedures and evaluating management’s significant assumptions related to the weighted average cost of capital, growth rates for sales, and growth rates for costs associated with marketing, general, and administrative (MG&A) expenses; and (iii) the audit effort involved the use of professionals with specialized skill and knowledge.
Addressing the matter involved performing procedures and evaluating audit evidence in connection with forming our overall opinion on the consolidated financial statements. These procedures included testing the effectiveness of controls relating to management’s indefinite-lived intangible asset impairment assessments, including controls over the valuation of the Staropramen family of brands. These procedures also included, among others (i) testing management’s process for developing the fair value estimate of the indefinite-lived intangible asset for the Staropramen family of brands; (ii) evaluating the appropriateness of the excess earnings approach used by management; (iii) testing the completeness and accuracy of underlying data used in the excess earnings approach; and (iv) evaluating the reasonableness of the significant assumptions used by management related to the weighted average cost of capital, growth rates for sales, and growth rates for MG&A expenses. Evaluating management’s assumptions related to growth rates for sales and growth rates for MG&A expenses involved evaluating whether the assumptions used by management were reasonable considering (i) the current and past performance of the Staropramen family of brands; (ii) whether these assumptions were consistent with evidence obtained in other areas of the audit, and (iii) for growth rates for sales assumption, whether the assumption was consistent with external market and industry data. Professionals with specialized skill and knowledge were used to assist in evaluating (i) the appropriateness of Company’s excess earnings approach and (ii) the reasonableness of weighted average cost of capital assumption.
/s/ PricewaterhouseCoopers LLP
Milwaukee, Wisconsin
February 20, 2024
We have served as the Company’s auditor since 1974.
MOLSON COORS BEVERAGE COMPANY AND SUBSIDIARIES
CONSOLIDATED STATEMENTS OF OPERATIONS
(IN MILLIONS, EXCEPT PER SHARE DATA) | | | | | | | | | | | | | | | | | |
| | For the Years Ended |
| | December 31, 2023 | | December 31, 2022 | | December 31, 2021 |
| Sales | $ | 13,884.6 | | | $ | 12,807.5 | | | $ | 12,449.9 | |
| Excise taxes | (2,182.5) | | | (2,106.5) | | | (2,170.2) | |
| Net sales | 11,702.1 | | | 10,701.0 | | | 10,279.7 | |
| Cost of goods sold | (7,333.3) | | | (7,045.8) | | | (6,226.3) | |
| Gross profit | 4,368.8 | | | 3,655.2 | | | 4,053.4 | |
| Marketing, general and administrative expenses | (2,779.9) | | | (2,618.8) | | | (2,554.5) | |
| Goodwill impairment | — | | | (845.0) | | | — | |
| Other operating income (expense), net | (162.7) | | | (38.6) | | | (44.5) | |
| Equity income (loss) | 12.0 | | | 4.7 | | | — | |
| Operating income (loss) | 1,438.2 | | | 157.5 | | | 1,454.4 | |
| Interest expense | (234.0) | | | (250.6) | | | (260.3) | |
| Interest income | 25.4 | | | 4.3 | | | 2.0 | |
| Other pension and postretirement benefit (cost), net | 10.2 | | | 36.6 | | | 46.4 | |
| Other non-operating income (expense), net | 12.7 | | | (10.3) | | | (3.5) | |
| Total non-operating income (expense), net | (185.7) | | | (220.0) | | | (215.4) | |
| Income (loss) before income taxes | 1,252.5 | | | (62.5) | | | 1,239.0 | |
| Income tax benefit (expense) | (296.1) | | | (124.0) | | | (230.5) | |
| Net income (loss) | 956.4 | | | (186.5) | | | 1,008.5 | |
| Net (income) loss attributable to noncontrolling interests | (7.5) | | | 11.2 | | | (2.8) | |
| Net income (loss) attributable to Molson Coors Beverage Company | $ | 948.9 | | | $ | (175.3) | | | $ | 1,005.7 | |
| | | | | |
| Net income (loss) attributable to Molson Coors Beverage Company per share | | | | | |
| Basic | $ | 4.39 | | | $ | (0.81) | | | $ | 4.63 | |
| Diluted | $ | 4.37 | | | $ | (0.81) | | | $ | 4.62 | |
| | | | | |
| Weighted-average shares outstanding | | | | | |
| Basic | 216.0 | | | 216.9 | | | 217.1 | |
| Dilutive effect of share-based awards | 1.3 | | | — | | | 0.5 | |
| Diluted | 217.3 | | | 216.9 | | | 217.6 | |
See notes to consolidated financial statements.
MOLSON COORS BEVERAGE COMPANY AND SUBSIDIARIES
CONSOLIDATED STATEMENTS OF COMPREHENSIVE INCOME (LOSS)
(IN MILLIONS) | | | | | | | | | | | | | | | | | |
| For the Years Ended |
| December 31, 2023 | | December 31, 2022 | | December 31, 2021 |
| Net income (loss) including noncontrolling interests | $ | 956.4 | | | $ | (186.5) | | | $ | 1,008.5 | |
| Other comprehensive income (loss), net of tax | | | | | |
| Foreign currency translation adjustments | 98.7 | | | (329.8) | | | (28.4) | |
| Cumulative translation adjustment reclassified from other comprehensive income (loss) | (0.6) | | | 12.1 | | | 7.5 | |
| Unrealized gain (loss) recognized on derivative instruments | (2.5) | | | 153.8 | | | 37.4 | |
| Derivative instrument activity reclassified from other comprehensive income (loss) | 0.9 | | | 9.4 | | | 5.5 | |
| Net change in pension and other postretirement benefit assets and liabilities recognized in other comprehensive income (loss) | (6.4) | | | (59.6) | | | 118.4 | |
| Pension and other postretirement activity reclassified from other comprehensive income (loss) | (11.2) | | | (1.6) | | | 5.4 | |
| | | | | |
| Ownership share of unconsolidated subsidiaries' other comprehensive income (loss) | 11.2 | | | 13.8 | | | 15.5 | |
| Total other comprehensive income (loss), net of tax | 90.1 | | | (201.9) | | | 161.3 | |
| Comprehensive income (loss) | 1,046.5 | | | (388.4) | | | 1,169.8 | |
| Comprehensive (income) loss attributable to noncontrolling interests | (8.4) | | | 13.6 | | | (2.3) | |
| Comprehensive income (loss) attributable to Molson Coors Beverage Company | $ | 1,038.1 | | | $ | (374.8) | | | $ | 1,167.5 | |
See notes to consolidated financial statements.
MOLSON COORS BEVERAGE COMPANY AND SUBSIDIARIES
CONSOLIDATED BALANCE SHEETS
(IN MILLIONS, EXCEPT PAR VALUE)
| | | | | | | | | | | |
| | As of |
| | December 31, 2023 | | December 31, 2022 |
| Assets | | | |
| Current assets | | | |
| Cash and cash equivalents | $ | 868.9 | | | $ | 600.0 | |
| Trade receivables, net | 757.8 | | | 739.8 | |
| Other receivables, net | 121.6 | | | 126.4 | |
| Inventories, net | 802.3 | | | 792.9 | |
| Other current assets, net | 297.9 | | | 378.9 | |
| Total current assets | 2,848.5 | | | 2,638.0 | |
| Property, plant and equipment, net | 4,444.5 | | | 4,222.8 | |
| Goodwill | 5,325.3 | | | 5,291.9 | |
| Other intangibles, net | 12,614.6 | | | 12,800.1 | |
| Other assets | 1,142.2 | | | 915.5 | |
| Total assets | $ | 26,375.1 | | | $ | 25,868.3 | |
| Liabilities and equity | | | |
| Current liabilities | | | |
| Accounts payable and other current liabilities | $ | 3,180.8 | | | $ | 2,978.3 | |
| Current portion of long-term debt and short-term borrowings | 911.8 | | | 397.1 | |
| Total current liabilities | 4,092.6 | | | 3,375.4 | |
| Long-term debt | 5,312.1 | | | 6,165.2 | |
| Pension and postretirement benefits | 465.8 | | | 473.3 | |
| Deferred tax liabilities | 2,697.2 | | | 2,646.4 | |
| Other liabilities | 372.3 | | | 292.8 | |
| Total liabilities | 12,940.0 | | | 12,953.1 | |
Commitments and contingencies (Note 13) | | | |
| Redeemable noncontrolling interest | 27.9 | | | — | |
| Molson Coors Beverage Company stockholders' equity | | | |
| Capital stock | | | |
| Preferred stock, $0.01 par value (authorized: 25.0 shares; none issued) | — | | | — | |
| Class A common stock, $0.01 par value (authorized: 500.0 shares; issued: 2.6 shares and 2.6 shares, respectively) | — | | | — | |
| Class B common stock, $0.01 par value (authorized: 500.0 shares; issued: 212.5 shares and 210.5 shares, respectively) | 2.1 | | | 2.1 | |
| Class A exchangeable shares, no par value (issued: 2.7 shares and 2.7 shares, respectively) | 100.8 | | | 102.2 | |
| Class B exchangeable shares, no par value (issued: 9.4 shares and 11.0 shares, respectively) | 352.3 | | | 413.3 | |
| Paid-in capital | 7,108.4 | | | 7,006.4 | |
| Retained earnings | 7,484.3 | | | 6,894.1 | |
| Accumulated other comprehensive income (loss) | (1,116.3) | | | (1,205.5) | |
| Class B common stock held in treasury at cost (13.9 shares and 10.5 shares, respectively) | (735.6) | | | (522.9) | |
| Total Molson Coors Beverage Company stockholders' equity | 13,196.0 | | | 12,689.7 | |
| Noncontrolling interests | 211.2 | | | 225.5 | |
| Total equity | 13,407.2 | | | 12,915.2 | |
| Total liabilities and equity | $ | 26,375.1 | | | $ | 25,868.3 | |
See notes to consolidated financial statements.
MOLSON COORS BEVERAGE COMPANY AND SUBSIDIARIES
CONSOLIDATED STATEMENTS OF CASH FLOWS
(IN MILLIONS) | | | | | | | | | | | | | | | | | |
| | For the Years Ended |
| | December 31, 2023 | | December 31, 2022 | | December 31, 2021 |
| Cash flows from operating activities | | | | | |
| Net income (loss) including noncontrolling interests | $ | 956.4 | | | $ | (186.5) | | | $ | 1,008.5 | |
| Adjustments to reconcile net income (loss) to net cash provided by (used in) operating activities | | | | | |
| Depreciation and amortization | 682.8 | | | 684.8 | | | 786.1 | |
| Amortization of debt issuance costs and discounts | 5.7 | | | 7.7 | | | 6.7 | |
| Share-based compensation | 44.9 | | | 33.6 | | | 32.1 | |
| Goodwill impairment | — | | | 845.0 | | | — | |
| (Gain) loss on sale or impairment of property, plant, equipment and other assets, net | 181.9 | | | 18.6 | | | 9.1 | |
| Unrealized (gain) loss on foreign currency fluctuations and derivative instruments, net | 88.3 | | | 236.4 | | | (233.8) | |
| Equity (income) loss | (12.0) | | | (4.7) | | | — | |
| Income tax (benefit) expense | 296.1 | | | 124.0 | | | 230.5 | |
| Income tax (paid) received | (244.8) | | | (76.6) | | | (227.0) | |
| Interest expense, excluding amortization of debt issuance costs and discounts | 228.3 | | | 242.9 | | | 253.6 | |
| Interest paid | (229.0) | | | (240.0) | | | (256.2) | |
| Change in current assets and liabilities (net of impact of business combinations) and other | | | | | |
| Receivables | (0.7) | | | (108.5) | | | (137.6) | |
| Inventories | 21.7 | | | (64.6) | | | (143.9) | |
| Payables and other current liabilities | 50.2 | | | (16.1) | | | 285.5 | |
| Other assets and other liabilities | 9.2 | | | 6.0 | | | (40.1) | |
| Net cash provided by (used in) operating activities | 2,079.0 | | | 1,502.0 | | | 1,573.5 | |
| Cash flows from investing activities | | | | | |
| Additions to property, plant and equipment | (671.5) | | | (661.4) | | | (522.6) | |
| Proceeds from sales of property, plant, equipment and other assets | 10.9 | | | 32.2 | | | 26.0 | |
| Acquisition of business, net of cash acquired | (63.7) | | | — | | | — | |
| Other | (117.4) | | | 4.1 | | | (13.3) | |
| Net cash provided by (used in) investing activities | (841.7) | | | (625.1) | | | (509.9) | |
| Cash flows from financing activities | | | | | |
| | | | | |
| Exercise of stock options under equity compensation plans | 7.9 | | | 3.1 | | | 4.6 | |
| Dividends paid | (354.7) | | | (329.3) | | | (147.8) | |
| Payments for purchases of treasury stock | (205.8) | | | (51.5) | | | — | |
| Payments on debt and borrowings | (404.8) | | | (509.1) | | | (1,006.6) | |
| Proceeds on debt and borrowings | 7.0 | | | 7.0 | | | — | |
| | | | | |
| Net proceeds from (payments on) revolving credit facilities and commercial paper | — | | | (3.7) | | | 1.4 | |
| Other | (31.0) | | | (6.0) | | | (23.8) | |
| Net cash provided by (used in) financing activities | (981.4) | | | (889.5) | | | (1,172.2) | |
| Effect of foreign exchange rate changes on cash and cash equivalents | 13.0 | | | (24.8) | | | (24.1) | |
| Net increase (decrease) in cash and cash equivalents | 268.9 | | | (37.4) | | | (132.7) | |
| Balance at beginning of year | 600.0 | | | 637.4 | | | 770.1 | |
| Balance at end of year | $ | 868.9 | | | $ | 600.0 | | | $ | 637.4 | |
| | | | | |
| | | | | |
| | | | | |
MOLSON COORS BEVERAGE COMPANY AND SUBSIDIARIES
CONSOLIDATED STATEMENTS OF STOCKHOLDERS' EQUITY
AND NONCONTROLLING INTERESTS
(IN MILLIONS)
| | | | | | | | | | | | | | | | | | | | | | | | | | | | | | | | | | | | | | | | | | | | | | | | | | | | | | | | | | | |
| | | Molson Coors Beverage Company Stockholders' Equity | | |
| | | | Common stock | | Exchangeable | | | | | | Accumulated
other | | Common Stock
held in | | Non |
| | | | issued | | shares issued | | Paid-in- | | Retained | | comprehensive | | treasury | | controlling |
| | Total | | Class A | | Class B | | Class A | | Class B | | capital | | earnings | | income (loss) | | Class B | | interests(1) |
| Balance as of December 31, 2020 | $ | 12,621.3 | | | $ | — | | | $ | 2.1 | | | $ | 102.3 | | | $ | 417.8 | | | $ | 6,937.8 | | | $ | 6,544.2 | | | $ | (1,167.8) | | | $ | (471.4) | | | $ | 256.3 | |
| Exchange of shares | — | | | — | | | — | | | (0.1) | | | — | | | 0.1 | | | — | | | — | | | — | | | — | |
| Shares issued under equity compensation plan | 0.6 | | | — | | | — | | | — | | | — | | | 0.6 | | | — | | | — | | | — | | | — | |
| Amortization of share-based compensation | 32.1 | | | — | | | — | | | — | | | — | | | 32.1 | | | — | | | — | | | — | | | — | |
| Purchase of noncontrolling interest | (0.2) | | | — | | | — | | | — | | | — | | | 0.3 | | | — | | | — | | | — | | | (0.5) | |
| Net income (loss) including noncontrolling interests | 1,008.5 | | | — | | | — | | | — | | | — | | | — | | | 1,005.7 | | | — | | | — | | | 2.8 | |
| Other comprehensive income (loss), net of tax | 161.3 | | | — | | | — | | | — | | | — | | | — | | | — | | | 161.8 | | | — | | | (0.5) | |
| Contributions from noncontrolling interests | 3.2 | | | — | | | — | | | — | | | — | | | — | | | — | | | — | | | — | | | 3.2 | |
| Distributions and dividends to noncontrolling interests | (14.3) | | | — | | | — | | | — | | | — | | | — | | | — | | | — | | | — | | | (14.3) | |
| Dividends declared | (148.4) | | | — | | | — | | | — | | | — | | | — | | | (148.4) | | | — | | | — | | | — | |
| Balance as of December 31, 2021 | $ | 13,664.1 | | | $ | — | | | $ | 2.1 | | | $ | 102.2 | | | $ | 417.8 | | | $ | 6,970.9 | | | $ | 7,401.5 | | | $ | (1,006.0) | | | $ | (471.4) | | | $ | 247.0 | |
| Exchange of shares | — | | | — | | | — | | | — | | | (4.5) | | | 4.5 | | | — | | | — | | | — | | | — | |
| Shares issued under equity compensation plan | (2.9) | | | — | | | — | | | — | | | — | | | (2.9) | | | — | | | — | | | — | | | — | |
| Amortization of share-based compensation | 33.6 | | | — | | | — | | | — | | | — | | | 33.6 | | | — | | | — | | | — | | | — | |
| Purchase of noncontrolling interest | (1.4) | | | — | | | — | | | — | | | — | | | 0.3 | | | — | | | — | | | — | | | (1.7) | |
| Net income (loss) including noncontrolling interests | (186.5) | | | — | | | — | | | — | | | — | | | — | | | (175.3) | | | — | | | — | | | (11.2) | |
| Other comprehensive income (loss), net of tax | (201.9) | | | — | | | — | | | — | | | — | | | — | | | — | | | (199.5) | | | — | | | (2.4) | |
| Share repurchase program | (51.5) | | | — | | | — | | | — | | | — | | | — | | | — | | | — | | | (51.5) | | | — | |
| Contributions from noncontrolling interests | 8.1 | | | — | | | — | | | — | | | — | | | — | | | — | | | — | | | — | | | 8.1 | |
| | | | | | | | | | | | | | | | | | | | | | | | | | | | | | | | | | | | | | | | | | | | | | | | | | | | | | | | | | | |
| | | Molson Coors Beverage Company Stockholders' Equity | | |
| | | | Common stock | | Exchangeable | | | | | | Accumulated
other | | Common Stock
held in | | Non |
| | | | issued | | shares issued | | Paid-in- | | Retained | | comprehensive | | treasury | | controlling |
| | Total | | Class A | | Class B | | Class A | | Class B | | capital | | earnings | | income (loss) | | Class B | | interests(1) |
| Distributions and dividends to noncontrolling interests | (14.3) | | | — | | | — | | | — | | | — | | | — | | | — | | | — | | | — | | | (14.3) | |
| Dividends declared | (332.1) | | | — | | | — | | | — | | | — | | | — | | | (332.1) | | | — | | | — | | | — | |
| Balance as of December 31, 2022 | $ | 12,915.2 | | | $ | — | | | $ | 2.1 | | | $ | 102.2 | | | $ | 413.3 | | | $ | 7,006.4 | | | $ | 6,894.1 | | | $ | (1,205.5) | | | $ | (522.9) | | | $ | 225.5 | |
| Exchange of shares | — | | | — | | | — | | | (1.4) | | | (61.0) | | | 62.4 | | | — | | | — | | | — | | | — | |
| Shares issued under equity compensation plan | 0.2 | | | — | | | — | | | — | | | — | | | 0.2 | | | — | | | — | | | — | | | — | |
| Amortization of share-based compensation | 44.9 | | | — | | | — | | | — | | | — | | | 44.9 | | | — | | | — | | | — | | | — | |
| Purchase of noncontrolling interest | (8.5) | | | — | | | — | | | — | | | — | | | (5.5) | | | — | | | — | | | — | | | (3.0) | |
| Deconsolidation of VIE | (8.8) | | | — | | | — | | | — | | | — | | | — | | | — | | | — | | | — | | | (8.8) | |
| Net income (loss) including noncontrolling interests | 957.1 | | | — | | | — | | | — | | | — | | | — | | | 948.9 | | | — | | | — | | | 8.2 | |
| Other comprehensive income (loss), net of tax | 90.1 | | | — | | | — | | | — | | | — | | | — | | | — | | | 89.2 | | | — | | | 0.9 | |
| Share repurchase program | (212.7) | | | — | | | — | | | — | | | — | | | — | | | — | | | — | | | (212.7) | | | — | |
| Contributions from noncontrolling interests | 2.4 | | | — | | | — | | | — | | | — | | | — | | | — | | | — | | | — | | | 2.4 | |
| Distributions and dividends to noncontrolling interests | (14.0) | | | — | | | — | | | — | | | — | | | — | | | — | | | — | | | — | | | (14.0) | |
| Dividends declared | (358.7) | | | — | | | — | | | — | | | — | | | — | | | (358.7) | | | — | | | — | | | — | |
| Balance as of December 31, 2023 | $ | 13,407.2 | | | $ | — | | | $ | 2.1 | | | $ | 100.8 | | | $ | 352.3 | | | $ | 7,108.4 | | | $ | 7,484.3 | | | $ | (1,116.3) | | | $ | (735.6) | | | $ | 211.2 | |
(1) All activity included in the noncontrolling interests column of the consolidated statements of stockholders' equity and noncontrolling interests excludes activity from our redeemable noncontrolling interests.
See notes to consolidated financial statements.
MOLSON COORS BEVERAGE COMPANY AND SUBSIDIARIES
NOTES TO CONSOLIDATED FINANCIAL STATEMENTS
1. Basis of Presentation and Summary of Significant Accounting Policies
Unless otherwise noted in this report, any description of "we," "us" or "our" includes Molson Coors Beverage Company ("MCBC" or the "Company"), principally a holding company, and its operating and non-operating subsidiaries included within our reporting segments. Our reporting segments include Americas and EMEA&APAC. Our Americas segment operates in the U.S., Canada and various countries in the Caribbean, Latin and South America, and our EMEA&APAC segment operates in Bulgaria, Croatia, Czech Republic, Hungary, Montenegro, the Republic of Ireland, Romania, Serbia, the U.K., various other European countries and certain countries within the Middle East, Africa and Asia Pacific.
Unless otherwise indicated, information in this report is presented in USD and comparisons are to comparable prior periods, and 2023, 2022 and 2021 refers to the twelve months ended December 31, 2023, December 31, 2022 and December 31, 2021, respectively. Our primary operating currencies, other than USD, include the CAD, the GBP and our Central European operating currencies such as the EUR, CZK, RON and RSD.
Principles of Consolidation
Our consolidated financial statements include our accounts and our majority-owned and controlled domestic and foreign subsidiaries, as well as certain VIEs for which we are the primary beneficiary. All intercompany accounts and transactions have been eliminated in consolidation.
Use of Estimates
Our consolidated financial statements are prepared in accordance with U.S. GAAP. These accounting principles require us to make certain estimates, judgments and assumptions. We believe that the estimates, judgments and assumptions used to determine certain amounts that affect the financial statements are reasonable, based on information available at the time they are made. To the extent there are differences between these estimates and actual results, our consolidated financial statements may be materially affected.
Acquisition
On August 7, 2023, we acquired a 75% equity interest in Blue Run, a U.S. based high end whiskey business, for a purchase price of $77 million, which included cash paid of $64 million. The acquisition is aligned with our strategy to expand beyond the beer aisle and enhance our presence in the spirits category.
The acquisition was accounted for as a business combination, with $88 million allocated to a definite-lived brand intangible asset to be amortized over a 15-year period and the remainder primarily allocated to other working capital balances and goodwill for the amount in excess of the net identifiable assets acquired. A noncontrolling interest was recognized at fair value based on a Monte Carlo simulation model and is recorded as redeemable noncontrolling interest in the consolidated balance sheets based on the contractual terms of the agreement. Pro forma results of operations have not been presented as the impact is not material to our results of operation or financial position.
Supplier Financing
We are the buyer under a supplier finance program with Citibank N.A. ("Citi" or "the bank"), with $147.5 million and $135.2 million confirmed as valid and outstanding for the years ended December 31, 2023 and December 31, 2022, respectively. We recognize these unpaid balances in accounts payable and other current liabilities on our consolidated balance sheets. Under the program, we agree to pay the bank the stated amount of confirmed invoices from our designated suppliers on the original maturity dates of the invoices. We have no involvement in establishing the terms or conditions of the arrangement between the suppliers and the bank and do not participate in such transactions. Either Citi or us may terminate the agreement upon at least 30 days written notice. We do not provide secured legal assets or other forms of guarantees under the arrangement. Our current payment terms with the majority of the suppliers participating in the supplier finance program generally range from 60 to 120 days, which we deem to be commercially reasonable.
Government Assistance
We receive government assistance in the form of tax credits and grants, including tax credits from government agencies in certain jurisdictions around job creation and retention, as well as capital investment initiatives. This includes, but is not limited to, refundable and non-refundable property and income tax credits in various state and other local jurisdictions. We recognize amounts received from government assistance programs, including non income tax credits and grants, as a reduction to MG&A expenses in our operationsconsolidated financial statements, when it is probable we will receive the funds and have met the conditions, if any, required by the government assistance program. If we receive the government assistance at a point in time for services to be completed over time, the cash received is initially recorded in our consolidated balance sheets as other liabilities, and amortized as an offset to MG&A expenses over the service period of the agreement. No programs are individually material nor are the programs material in the aggregate.
Revenue Recognition
Our net sales represent the sale of beer, malt beverages and other adjacencies, net of excise tax. Sales are stated net of incentives, discounts and returns. Sales of products are for cash or otherwise agreed upon credit terms. Our payment terms vary by location and customer, however, the time period between when revenue is recognized and when payment is due is not significant. Our revenue generating activities have a single performance obligation and are recognized at the point in time when control transfers and our obligation has been fulfilled, which is when the related goods are shipped or delivered to the customer, depending upon the method of distribution and shipping terms. Where our products are sold under consignment arrangements, revenue is not recognized until control has transferred, which is when the product is sold to the end customer. Revenue is measured as the amount of consideration we expect to receive in exchange for the sale of our product. The cost of various programs, such as price promotions, rebates and coupons, are treated as a reduction of sales. In certain of our markets where legally permitted, we make cash payments to customers such as slotting or listing fees, or payments for other marketing or promotional activities. These cash payments are recorded as a reduction of revenue unless we receive a distinct good or service. Specifically, a good or service is considered distinct when it is separately identifiable from other promises in the contract, we receive a benefit from the good or service and the benefit is separable from the sale of our product to the customer.
Certain payments made to customers are conditional on the achievement of volume targets, marketing commitments or both. If paid in advance, we record such payments as prepayments and amortize them over the relevant period to which the customer commitment is made (generally up to five years). When the payment is not for a distinct good or service, or fair value cannot be reasonably estimated, the amortization of the prepayment or the cost as incurred is recorded as a reduction of revenue. Where a distinct good or service is received and fair value can be reasonably estimated, the cost is included as MG&A expenses. The amounts deferred are reassessed regularly for recoverability over the contract period and are impaired where there is objective evidence that the benefits will not be realized or the asset is otherwise not recoverable. Separately, as discussed below, we analyze whether these advance payments contain a significant financing component for potential adjustment to the transaction price.
Our primary revenue generating activity represents the sale of beer and other beverages to customers, including both domestic and exported product sales. Our customer could be a distributor, retail or on-premise outlet, depending on the market. The majority of our revenues are generated from brands that we own and brew ourselves; however, we also import or brew and sell certain non-owned partner brands under licensing and related arrangements. In addition, primarily in the U.K., we sell other beverage companies' products to on-premise customers to provide them with a full range of products for their retail outlets. We refer to this as the "factored brand business." Sales from this business are included in our net sales and cost of goods sold when ultimately sold. In the factored brand business, we normally purchase inventory, which includes excise taxes charged by the vendor, take orders from customers for such brands, negotiate with the customers on pricing and invoice customers for the product and related costs of delivery. In addition, we incur the risk of loss when we are in possession of the inventory and for the receivables due from the customers. Revenues for owned brands, partner and imported brands, as well as factored brands are recognized at the point in time when control is transferred to the customer as discussed above.
Other Revenue Generating Activities
We contract manufacture for other brewers in some of our markets. These contractual agreements require us to brew, package and ship certain brands for these brewers, who then sell the products to their own customers in their respective markets. Revenues under contract brewing arrangements are recognized when our obligation related to the finished product is fulfilled and control of the product transfers to these other brewers.
We also have licensing agreements with third party partners who brew and distribute our products in various markets across our segments. Under these agreements, we are compensated based on the amount of products sold by our partners in these markets at an agreed upon royalty rate or profit percentage. We apply the sales-based royalty practical expedient to these licensing arrangements and recognize revenue as product is sold by our partners at the agreed upon rate.
Disaggregation of Revenue
We have evaluated our primary revenue generating activities under the disaggregation disclosure criteria outlined within the guidance and concluded that disclosure at the geographical segment level depicts how the nature, amount, timing and uncertainty of revenues and cash flows are affected by economic factors. We have also evaluated our other revenue generating activities and concluded that these activities are not material for separate disclosure. See Note 18, "Segment Reporting," for disclosure of revenues by geographic segment. Variable Consideration
Our revenue generating activities include variable consideration which is recorded as a reduction of the transaction price based upon expected amounts at the time revenue for the corresponding product sale is recognized. For example, customer promotional discount programs are entered into with certain distributors for certain periods of time. The amount ultimately reimbursed to distributors is determined based upon agreed-upon promotional discounts which are applied to distributors' sales to retailers. Other common forms of variable consideration include volume rebates for meeting established sales targets, and coupons and mail-in rebates offered to the end consumer. The determination of the reduction of the transaction price for variable consideration requires that we make certain estimates and assumptions that affect the timing and amounts of revenue and liabilities recorded. We estimate this variable consideration, including analyzing for a potential constraint on variable consideration, by taking into account factors such as the nature of the promotional activity, historical information and current trends, availability of actual results and expectations of customer and consumer behavior.
We do not have standard terms that permit return of product; however, in certain markets where returns occur we estimate the amount of returns as variable consideration based on factors including historical return experience and adjust our revenue accordingly. Products that do not meet our high quality standards are returned by the customer or recalled and destroyed and are recorded as a reduction of revenue. The reversal of revenue is recorded upon determination that the product will be recalled and destroyed. We estimate the costs required to facilitate product returns and record them in cost of goods sold as required.
For the years ended December 31, 2023, 2022 and 2021, adjustments to revenue from performance obligations satisfied in the prior period due to changes in estimates in variable consideration were immaterial.
Significant Financing Component and Costs to Obtain Contracts
In certain of our businesses where such practices are legally permitted, we make loans or advanced payments to retail outlets that sell our brands. For arrangements that do not span greater than one year, we apply the practical expedient available under ASC 606 and do not adjust the transaction price for the effects of a potential significant financing component. We further analyze arrangements that span greater than one year on an ongoing basis to determine whether a significant financing component exists. During the years ended December 31, 2023, 2022 and 2021 no arrangements were individually material nor material in the aggregate.
Advance payments to customers, where legally permitted, are deferred and amortized as a reduction to revenue over the expected period of benefit and tested for recoverability as appropriate. All other costs to obtain and fulfill contracts are expensed as incurred based on the nature, significance and expected benefit of these costs relative to the contract.
Contract Assets and Liabilities
We continually evaluate whether our revenue generating activities and advanced payment arrangements with customers result in the recognition of contract assets or liabilities. No such assets or liabilities existed as of December 31, 2023 or December 31, 2022. Separately, trade receivables, net including affiliate receivables, approximates receivables from contracts with customers.
Shipping and Handling
Freight costs billed to customers for shipping and handling are recorded as revenue. Shipping and handling expense related to costs incurred to deliver product are recognized within cost of goods sold. We account for shipping and handling activities that occur after control has transferred as a fulfillment cost as opposed to a separate performance obligation, and the costs of shipping and handling are recognized concurrently with the related revenue.
Excise Taxes
Excise taxes remitted to tax authorities are government-imposed excise taxes on beer. Excise taxes are shown in a separate line item in the consolidated statements of operations as a reduction of sales. In the consolidated balance sheets, excise taxes are generally recognized as a current liability within accounts payable and other current liabilities, with the liability subsequently reduced when the taxes are remitted to the tax authority. In cases where excise taxes are prepaid, they are recorded within other current assets, net.
Cost of Goods Sold
Our cost of goods sold includes costs we incur to make and ship beer and other beverages. These costs include brewing materials, such as barley, hops and various grains. Packaging materials, including aluminum, glass bottles, aluminum cans, cardboard and paperboard are also included in our cost of goods sold. Additionally, our cost of goods sold contains manufacturing expenses including both direct and indirect labor, shipping and handling including freight costs, utilities, maintenance costs, warehousing costs, purchasing and receiving costs, depreciation, promotional packaging, other manufacturing overheads and costs to purchase factored and other non-owned brands from suppliers, as well as the cost to facilitate product returns.
Marketing, General and Administrative Expenses
Our MG&A expenses include marketing expenses, including the direct costs related to the selling of a product or brand, media advertising (television, radio, digital, print), tactical advertising (signs, banners, point-of-sale materials) and promotion costs on both local and national levels. The creative portion of our advertising activities is expensed as incurred. Production costs of advertising and promotional materials are recorded as a prepaid asset and expensed when the advertising is first run. Included in MG&A is total marketing and advertising expenses which were approximately $1.1 billion, $1.0 billion and $1.1 billion for the years ended December 31, 2023, 2022 and 2021, respectively.
This classification also includes general and administrative costs for functions such as finance, legal, human resources and information technology. These costs primarily consist of compensation, benefits and outside services, as well as bad debt expense related to our allowance for doubtful accounts. Unless capitalization is allowed or required by U.S. GAAP, legal costs are expensed when incurred. These costs also include our marketing and sales organizations, including compensation, benefits and other overheads, including travel and entertainment expenses. This line item additionally includes amortization costs associated with definite-lived intangible assets, as well as certain depreciation costs related to non-production equipment and share-based compensation.
Share-based compensation is recognized using a straight-line method over the vesting period of the awards. We include estimated forfeitures expected to occur when calculating share-based compensation expense. Our share-based compensation plan and the awards within it contain provisions that accelerate vesting of awards upon change in control, retirement, disability or death of eligible employees and directors. Our share-based awards are considered vested when the employee's retention of the award is no longer contingent on providing service, which for certain awards can result in immediate recognition for awards granted to retirement-eligible individuals or accelerated recognition for awards granted to individuals that will become retirement eligible within the stated vesting period. Also, if less than the stated vesting period, we recognize these costs over the period from the grant date to the date retirement eligibility is achieved.
Other Operating Income (Expense), net
Our other operating income (expense), net items represent charges incurred or benefits realized that we believe are significant to our current operating results warranting separate classification; specifically, such items are considered to be one of the following:
•restructuring charges, including certain employee-related charges, asset abandonment-related losses, fees on termination of significant operating agreements and other related exit or disposal charges;
•intangible and tangible asset impairments, excluding goodwill;
•gains and (losses) on disposal of investments; and
•other significant items deemed to warrant separate classification within operating income
These items classified as other operating income (expense) are not necessarily non-recurring, however, they are generally deemed to be incremental to income earned or costs incurred by us in conducting normal operations.
Interest Expense, net
Our interest costs are associated with borrowings to finance our operations and acquisitions. Interest earned on our cash and cash equivalents across our business is recorded as interest income.
We capitalize interest cost as a part of the original cost of acquiring certain fixed assets if the cost of the capital expenditure and the expected time to complete the project are considered significant.
Other Non-Operating Income (Expense), net
Our other non-operating income (expense), net classification primarily includes gains and losses associated with activities not directly related to our operations. For instance, aggregate unrealized and realized foreign exchange gains and losses resulting from the remeasurement and settlement of foreign-denominated monetary assets and liabilities, as well as certain gains or losses on sales of non-operating assets and the mark-to-market activity associated with certain equity securities and other investments are classified in this line item. These gains and losses are reported in the operating segment in which they occur; however, foreign exchange gains and losses on intercompany balances and realized and unrealized changes in fair value on instruments not designated in hedging relationships related to financing and other treasury-related activities remain unallocated. The initial recording of foreign-denominated transactions are classified based on the nature of the transaction, with the unrealized or realized foreign exchange gains or losses resulting from the subsequent remeasurement of the monetary asset or liability, and its ultimate settlement, classified in other non-operating income (expense), net.
Income Taxes
Deferred income taxes are provided for the temporary differences between the financial reporting basis and the tax basis of our assets, liabilities and certain unrecognized gains and losses recorded in AOCI. We apply the intraperiod tax allocation rules to allocate our provision for income taxes between continuing operations and other categories of earnings, such as OCI, when we meet the criteria prescribed by U.S. GAAP.
The tax benefit from an uncertain tax position is recognized only if it is determined that the tax position will more likely than not be sustained based on its technical merits. We measure and record the tax benefits from such a position based on the largest benefit that has a greater than 50% likelihood of being realized upon ultimate settlement. Interest, penalties and offsetting positions related to unrecognized tax benefits are recognized as a component of income tax expense with interest and penalties being recorded to income tax benefit (expense) in our consolidated statement of operations. We record a valuation allowance to reduce our deferred tax assets to the amount that is more likely than not to be realized.
Other Comprehensive Income (Loss)
OCI represents income and losses for the reporting period, including the related tax impacts, which are excluded from net income (loss) and recognized directly within AOCI as a component of equity. OCI also includes amounts reclassified to the consolidated statement of operations during the reporting period that were previously recognized within AOCI. Amounts remaining within AOCI are expected to be reclassified out of AOCI in the future, at which point they will be recognized within the consolidated statement of operations as a component of net income (loss). We recognize OCI related to the translation of assets and liabilities of our foreign subsidiaries which are denominated in currencies other than the USD. We closely monitor our operations in each country and seek to adopt appropriate strategies that are responsive to foreign currency fluctuations. Our financial risk management policy is intended to offset a portion of the potentially unfavorable impact of exchange rates on our earnings and cash flows.
Changes in foreign currency exchange rates affect the translation of local currency balances of foreign subsidiaries, transactionUSD, unrealized gains and losses associated with intercompany loans with foreign subsidiaries, royalty agreementson the effective portion of our derivatives designated in cash flow hedging relationships and transactions denominatedderivative and non-derivative instruments designated in currencies other than the USD,net investment hedging relationships, actuarial gains and their related cash flows, specificallylosses and prior service costs related to the purchase of production inputsour pension and imports,other post-retirement benefit plans, as well as our proportionate share of our equity method investments' OCI. Additionally, when we do not have the expectation or intent to cash settle certain of our intercompany note receivable and note payable positions in the foreseeable future, the remeasurement of these instruments is recorded as a component of foreign currency-denominated debt.currency translation adjustments within OCI. We release stranded tax effects from AOCI using either a specific identification approach or portfolio approach based on the nature of the underlying item.
Earnings Per Share
Basic EPS is computed using the weighted-average number of shares of common stock outstanding during the period. Diluted EPS includes the additional dilutive effect of our potentially dilutive securities, which include RSUs, DSUs, PSUs and stock options. The dilutive effects of our potentially dilutive securities are calculated using the treasury stock method. Our calculation of weighted-average shares includes Class A common stock and Class B common stock and Class A exchangeable shares and Class B exchangeable shares. All classes of stock have in effect the same dividend rights and share equitably in undistributed earnings. Holders of Class A common stock receive dividends only to the extent dividends are declared and paid to holders of Class B common stock. See Part II - Item, 8. Financial Statements and Supplementary Data, Note 1. "Basis of Presentation and Summary of Significant Accounting Policies"14, "Stockholders' Equity" for our accounting policy overfurther discussion of the accountingClass A common stock and Class B common stock and Class A exchangeable shares and Class B exchangeable shares. We have no unvested outstanding equity share awards that contain non-forfeitable rights to dividends.
Anti-dilutive securities excluded from the computation of diluted EPS for translation adjustmentsthe years ended December 31, 2023, December 31, 2022 and foreign currency transactions.December 31, 2021 were 0.6 million, 3.1 million and 1.8 million shares, respectively.
Approximately $3.0 billion,Cash and Cash Equivalents
Cash consists of cash on hand and bank deposits. Cash equivalents represent highly liquid investments with original maturities of three months or 30%,less. Our cash deposits are maintained with multiple, reputable financial institutions.
Dividends
On November 9, 2023, the Board declared a cash dividend of our net sales was denominated in functional currencies other than$0.41 per share, paid on December 15, 2023, to shareholders of Class A and Class B common stock of record on December 1, 2023. Shareholders of exchangeable shares received the USD forCAD equivalent of dividends declared on Class A and Class B common stock, equal to CAD 0.56 per share.
During the year ended December 31, 2021. As a result, fluctuations in foreign currency exchange rates other than the USD, particularly2023, dividends declared to eligible shareholders totaled $1.64 per share, with the CAD andequivalent totaling CAD 2.19 per share. During the GBP, may have a material impactyear ended December 31, 2022, dividends declared to eligible shareholders totaled $1.52 per share, with the CAD equivalent totaling CAD 1.95 per share.
In response to the global economic uncertainty created by the coronavirus pandemic, the Board suspended our regular quarterly dividend on our reported results. ForClass A and Class B common and exchangeable shares in May 2020. A quarterly dividend was reinstated during the third quarter of 2021. During the year ended December 31, 2021, dividends declared to eligible shareholders totaled $0.68 per share, with the CAD equivalent totaling CAD 0.84 per share.
Non-Cash Activity
Non-cash investing activities includes movements in our guarantee of indebtedness of certain equity method investments.. See Note 3, "Investments" for further discussion. We also had other non-cash activities related to capital expenditures incurred but not yet paid of $254.9 million, $234.3 million and $206.6 million during the years ended December 31, 2023, 2022 and 2021, respectively. In addition, we had non-cash activities related to our non-cash issuances of share-based awards. See Note 16, "Share-Based Payments" for further details. In June 2021, we rolled forward our July 2021 $250.0 million forward starting interest rate swap to May 2022 through a cashless settlement. The unrealized loss on the 2021 forward starting interest rate swap at the time of the transaction was factored into the effective interest rate assigned to the new May 2022 forward starting interest rate swap. See Note 10, "Derivative Instruments and Hedging Activities" for further details. During the first quarter of 2022, we recorded a non-cash transaction related to the establishment of an accrued liability of $56.0 million as the best estimate of the probable loss in the Keystone litigation case based on the jury verdict. During the years ended December 31, 2023 and 2022, we recorded non-cash transactions of $1.9 million and $0.6 million, respectively, in accrued interest associated with this accrued liability. See Note 13, "Commitments and Contingencies" for further details. Other than the activity mentioned above and the supplemental non-cash activity related to the recognition of leases discussed in Note 8, "Leases," there was no other significant non-cash activity for the years ended December 31, 2023, 2022 and 2021. Trade Receivables
We record trade receivables at net sales denominatedrealizable value. This carrying value includes an appropriate allowance for estimated uncollectible amounts to reflect any loss anticipated on the trade receivable balances. We calculate this allowance based on our country-specific history of write-offs, level of past-due accounts based on the contractual terms of the receivables and our relationships with and the economic status of our customers, which may be impacted by current macroeconomic and regulatory factors specific to the country of origin. This methodology takes into consideration historical loss experience and current and forecasted changes in CADcash flows based on internal and GBPexternal information. The allowance for doubtful accounts was approximately $1.3 billion$12.7 million and $1.0 billion,$13.2 million as of December 31, 2023, and December 31, 2022, respectively.
Inventories
Inventories are stated at the lower of cost or net realizable value. Cost is determined by the first-in, first-out ("FIFO") method. We regularly assess the shelf-life of our inventories and reserve for those inventories when it becomes probable the product will not be sold within our freshness specifications. In addition, we reserve for those inventories associated with discontinued SKUs or seasonal or other packaging material changes.
Other Current Assets
Other current assets include prepaid assets, maintenance and operating supplies, promotion materials and derivative assets that are expected to be recognized or realized within the next 12 months. Maintenance and operating supplies include our inventories of spare parts, which are kept on hand for repairs and maintenance of machinery and equipment. The majority of spare parts within our business include motors, fillers and other components that are required to maintain a normal level of production in the event that expected maintenance and/or repairs are required. These parts are inventoried within current assets as they are reasonably expected to be used during the normal operating cycle of the business and are reserved for excess and obsolescence, as appropriate.
Property, Plant and Equipment
Property, plant and equipment is stated at original cost less accumulated depreciation. Depreciation is recorded using the straight-line method over the estimated useful lives of the assets, which are reviewed periodically and have the following ranges: buildings and improvements: 20-40 years; production and office equipment 3-25 years; and software: 3-5 years. Land is not depreciated and construction in progress is not depreciated until ready for service. Costs of enhancements or modifications that substantially extend the capacity or useful life of an asset are capitalized and depreciated accordingly. Ordinary repairs and maintenance are expensed as incurred. When property, plant and equipment is sold or otherwise disposed of, the cost and accumulated depreciation are removed from our consolidated balance sheets and the resulting gain or loss, if any, is reflected in our consolidated statements of operations. Long-lived assets are evaluated for impairment whenever events or changes in circumstances indicate the carrying value of an asset (or asset group) may not be recoverable. Our asset groups are generally identified at the segment level with the exception of certain craft breweries or other locations which may operate on a more stand-alone basis.
Returnable containers are recorded at acquisition cost and consist of returnable bottles, kegs, pallets and crates that are both in our direct control within our breweries, warehouses and distribution facilities and those that we indirectly control in the market through our agreements with our customers and other brewers and for which a deposit is received. The deposits received on our returnable containers in the market are recorded as deposit liabilities, included within accounts payable and other current liabilities in the consolidated balance sheets. We estimate that the loss, breakage and deterioration of our returnable containers is comparable to the depreciation calculated on an estimated useful life of up to 4 years for bottles, 5 years for pallets, 7 years for crates and 15 years for returnable kegs. We also own and maintain other equipment in the market related to delivery of our products to end consumers, for example on-premise dispense equipment and refrigeration units. This equipment is recorded at acquisition cost and depreciated over lives of up to 7 years, depending on the market, reflecting the use of the equipment, as well as the loss and deterioration of the asset.
The costs of acquiring or developing internal-use computer software, including directly-related payroll costs for internal resources, are capitalized and classified within property, plant and equipment. Software maintenance and training costs are expensed in the period incurred.
Property, plant and equipment held under finance lease are depreciated using the straight-line method over the estimated useful life or the lease term, whichever is shorter. Finance lease assets for which ownership is transferred at the end of the lease, or there is a purchase option that we are reasonably certain to exercise, are depreciated over the useful life that would be assigned if the asset were owned.
Cloud Computing Arrangements
Cloud computing arrangement implementation costs incurred in hosting arrangements that are service contracts are recorded within other assets in the consolidated balance sheets. Capitalized cloud computing arrangement implementation costs are amortized using the straight-line method over the remaining term of the contract. Amortization expense was $7.9 million, $6.2 million and $5.2 million for the years ended December 31, 2023, December 31, 2022 and December 31, 2021, respectively.
The following table presents the gross and net value of capitalized cloud computing implementation costs associated with active hosting arrangements.
| | | | | | | | | | | |
| As of |
| December 31, 2023 | | December 31, 2022 |
| (In millions) |
| Cloud computing implementation costs | $ | 56.5 | | | $ | 38.5 | |
| Less: accumulated amortization | (20.8) | | | (12.9) | |
| Cloud computing implementation costs, net | $ | 35.7 | | | $ | 25.6 | |
| | | |
| | | |
| | | |
| | | |
Goodwill and Other Intangible Assets
Goodwill is allocated to the reporting unit in which the business that created the goodwill resides. A reporting unit is an operating segment, or a business unit one level below that operating segment, for which discrete financial information is prepared and regularly reviewed by segment management. As of the date of the completion of our 2023 impairment testing, we have concluded that we have two reporting units, Americas and EMEA&APAC. See further discussion in Note 6, "Goodwill and Intangibles." As required, we evaluate the carrying value of our goodwill at the reporting unit level and indefinite-lived intangible assets for impairment at least annually or when an interim triggering event occurs that may indicate potential impairment. Our annual test is performed as of the first day of our fiscal fourth quarter, October 1. The testing of goodwill and indefinite-lived intangible assets uses estimates and assumptions affected by factors such as economic and industry conditions along with changes in operating performance. The evaluation involves comparing the reporting unit or indefinite-lived intangible asset's fair value to its carrying value. If the fair value exceeds its respective carrying value, then we conclude that no impairment has occurred. If the carrying value exceeds its fair value, we would recognize an impairment loss in an amount equal to the excess up to the total amount of goodwill allocated to that reporting unit or balance of the respective indefinite-lived intangible asset.
We continuously monitor the performance of our other definite-lived intangible assets and evaluate for impairment when evidence exists that certain triggering events or changes in circumstances indicate that the carrying amount of these assets may not be recoverable. Significant judgments and assumptions are required in such impairment evaluations. Definite-lived intangible assets are stated at cost less accumulated amortization. Amortization is recorded using the straight-line method over the estimated lives of the assets as this approximates the pattern in which the assets economic benefits are consumed.
Goodwill impairments are recorded to the Goodwill impairment line item on the consolidated statement of operations whereas impairments of intangible assets are recorded in the "Other operating income (expense), net" line item.
Equity Method Investments
We apply the equity method of accounting to investments that we do not control but where we exercise significant influence or VIEs for which we are not the primary beneficiary. We use the cumulative earnings approach for determining cash flow presentation of cash distributions received from equity method investments. Distributions received are included in our consolidated statements of cash flows as operating activities, unless the cumulative distributions exceed our portion of the cumulative equity in the net earnings of the equity method investment, in which case the excess distributions are deemed to be returns of the investment and are classified as investing activities in our consolidated statements of cash flows. See Note 3, "Investments" for further information regarding our equity method investments. There are no related parties that own interests in our equity method investments as of December 31, 2023. Derivative Hedging Instruments
We use derivatives as part of our normal business operations to manage our exposure to fluctuations in interest rates, foreign currency exposures through foreign currency forward contractsexchange, commodity prices, production and packaging material costs and for other strategic purposes related to our core business. We enter into derivatives for risk management purposes only, including derivatives designated in hedge accounting relationships as well as those derivatives utilized as economic hedges. We do not enter into derivatives for trading or speculative purposes. We recognize our derivatives on the consolidated balance sheets as assets or liabilities at fair value and classify them in either current or non-current assets or liabilities based on each contract's respective unrealized gain or loss position and each contract's respective maturity. Consistent with our policy, our current derivative agreements do not allow us to net positions with the same counterparty and therefore, we present our derivative positions gross in our consolidated balance sheets.
Changes in fair values of outstanding cash flow and net investment hedges. Our EUR foreign-denominated debt is ahedges are recorded in OCI, until earnings are affected by the variability of cash flows of the underlying hedged item or the sale of the underlying net investment, hedge against ourrespectively. Effective cash flow hedges offset the gains or losses recognized on the underlying exposure in the consolidated statements of operations, or for net investment in our Europe business in order to hedge a portion ofhedges, the foreign currency translational impacts. Theexchange translation gain or loss recognized in AOCI. Changes in fair value of outstanding fair value hedges and the offsetting changes in fair value of the net investmenthedged item are recognized in earnings. Changes in fair value of the derivative attributable to components allowed to be excluded from the assessment of hedge dueeffectiveness are deferred in AOCI and recognized in earnings over the life of the hedge.
We record realized gains and losses from derivative instruments in the same financial statement line item as the hedged item/forecasted transaction. Changes in unrealized gains and losses for derivatives not designated in a hedge accounting relationship are recorded directly in earnings each period and are also recorded in the same financial statement line item as the hedged item/forecasted transaction. Cash flows from the settlement of derivatives, including both economic hedges and those designated in hedge accounting relationships, appear in the consolidated statements of cash flows in the same categories as the cash flows of the hedged item unless the instruments are deemed to contain an other-than-insignificant financing element, in which case the cash flows related to this instrument will be classified as financing activities.
In accordance with authoritative accounting guidance, we do not record the fair value of derivatives for which we have elected the Normal Purchase Normal Sale ("NPNS") exemption. We account for these contracts on an accrual basis, recording realized settlements related to these contracts in the same financial statement line items as the corresponding transaction.
Leases
We enter into contractual arrangements for the utilization of certain non-owned assets, primarily real estate and equipment, which are evaluated as finance or operating leases upon commencement and are accounted for accordingly. We assess whether an arrangement is or contains a lease at inception of the contract. For all contractual arrangements deemed to be leases (other than short-term leases, which have a duration of one year or less), as of the lease commencement date, we recognize on the consolidated balance sheets a liability for our obligation related to the fluctuationslease and a corresponding asset representing our right to use the underlying asset over the period of use.
For leases that qualify as short-term leases, we have elected, for all classes of underlying assets, to not apply the balance sheet recognition requirements of ASC 842, and instead, we recognize the lease payments in the spot rate is recordedconsolidated statements of operations on a straight-line basis over the lease term. We have also made the election, for our existing real estate and equipment classes of underlying assets, to AOCI. account for lease and non-lease components as a single lease component.
Our foreign currency forward contracts manage our exposure relatedleases have remaining lease terms of up to certain royalty agreements, the purchase of production inputs and imports that are denominated in currencies other than the functional entity's local currency and other foreign currency exchange exposure.
From time to time, we may enter into cross currency swaps. We settled the cross currency swaps associated with the $1.0 billion notes when they were repaid on July 15, 2021 and had no cross currency swaps outstanding as of December 31, 2021.
The following table includes detailsapproximately 16 years. Certain of our foreign currency forwardslease agreements contain options to extend or early terminate the agreement. The lease term used to hedge our foreign exchange rate riskcalculate the right-of-use ("ROU") asset and lease liability at commencement includes the impacts of options to extend or terminate the lease when it is reasonably certain that we will exercise that option. When determining whether it is reasonably certain that we will exercise an option at commencement, we consider various existing economic factors, including real estate strategies, the nature, length and terms of the agreement, as well as the impactuncertainty of the condition of leased equipment at the end of the lease term. Assumptions made at the commencement date are re-evaluated upon occurrence of certain events requiring a lease modification. Additionally, for certain equipment leases involving groups of similar leased assets with similar lease terms, we apply a portfolio approach to effectively account for the operating lease right-of-use assets and liabilities.
The discount rate used to calculate the present value of the future minimum lease payments is the rate implicit in the lease, when readily determinable. As the rate implicit in the lease is rarely readily determinable, we use our incremental borrowing rate relative to the leased asset in all other cases.
Certain of our leases include variable payments, primarily for items such as property taxes, insurance, maintenance and other operating expenses associated with leased assets. These variable payments are excluded from the measurement of our lease assets and liabilities and are recognized in the period in which the obligation for those payments is incurred. Our lease agreements do not contain any material residual value guarantees or material restrictive covenants.
Lease-related expense is recorded within either COGS or MG&A expenses on the consolidated statements of operations, depending on the function of the underlying leased asset, with the exception of interest on finance lease liabilities, which is recorded within interest expense on the consolidated statements of operations.
Pension and Postretirement Benefits
We maintain retirement plans for the majority of our employees. We offer different types of plans within each segment, including defined benefit plans, defined contribution plans and OPEB plans. Each plan is managed locally and in accordance with respective local laws and regulations. BRI and BDL, two of our equity method investments, maintain defined benefit, defined contribution and OPEB plans as well.
We recognize the underfunded or overfunded status of a hypothetical 10% adverse changedefined benefit pension and OPEB plan as an asset or liability in the related foreign currency exchange rates onconsolidated balance sheets. The funded status of a plan, measured as the difference between the fair value of plan assets and the projected benefit obligation, and the related net periodic pension cost are calculated using a number of significant actuarial assumptions. Changes in net periodic pension cost and funding status may occur in the future due to changes in these assumptions.
We use the fair value approach to calculate the market-related value of pension plan assets used to determine net periodic pension cost, which includes measuring the market-related value of plan assets at fair value for purposes of determining the expected return on plan assets and amount of gain or loss subject to amortization.
Projected benefit obligation is the actuarial present value as of the measurement date of all benefits attributed by the plan benefit formula to employee service rendered before the measurement date using assumptions as to future compensation levels and years of service if the plan benefit formula is based on those future compensation levels and years of service. Accumulated benefit obligation is the actuarial present value of benefits (whether vested or unvested) attributed by the plan benefit formula to employee service rendered before the measurement date and based on employee service and compensation, if applicable, prior to that date. Accumulated benefit obligation differs from projected benefit obligation in that it includes no assumption about future compensation levels and years of service.
We employ the corridor approach for determining each plan's potential amortization from AOCI of deferred gains and losses, which occur when actual experience differs from estimates, into other pension and postretirement (benefit) cost, net. This approach defines the "corridor" as the greater of 10% of the projected benefit obligation or 10% of the market-related value of plan assets and requires amortization of the excess net gain or loss that exceeds the corridor over the average remaining service periods of active plan participants. For plans closed to new entrants and the future accrual of benefits, the average remaining life expectancy of all plan participants (including retirees) is used.
Fair Value Measurements
The carrying amounts of our cash and cash equivalents, accounts receivable, accounts payable and other current liabilities approximate fair value as recorded due to the short-term nature of these instruments. The fair value of derivatives is estimated by discounting the estimated future cash flows utilizing observable market interest, foreign currency forwards. Notional amountsexchange and commodity rates adjusted for non-performance credit risk associated with our counterparties (assets) or with MCBC (liabilities), as appropriate. See Note 10, "Derivative Instruments and Hedging Activities" for additional information. Based on current market rates for similar instruments, the fair values arevalue of long-term debt is presented in USDNote 9, "Debt." U.S. GAAP guidance for fair value includes a hierarchy that prioritizes fair value measurements based on the applicable exchange ratetypes of inputs used for the various valuation techniques (market approach, income approach and cost approach). Our financial assets and liabilities are measured using inputs from the three levels of the fair value hierarchy.
The three levels of the hierarchy are as of December 31, 2021follows:
Level 1—Inputs are unadjusted quoted prices in active markets for identical assets or liabilities that we have the ability to access at the measurement date.
Level 2—Inputs include quoted prices for similar assets and December 31, 2020. The majority ofliabilities in active markets, quoted prices for identical or similar assets or liabilities in markets that are less active, inputs other than quoted prices that are observable for the asset or liability (i.e., interest rates, yield curves, etc.), and inputs that are derived principally from, or corroborated by, observable market data by correlation or other means (market corroborated inputs).
Level 3—Unobservable inputs that reflect the assumptions that we believe market participants would use in pricing the asset or liability. We develop these inputs based on the best information available, including our outstanding foreign currency forwards will mature in fiscal 2022.own data.
| | | | | | | | | | | | | | | | | | | | | | | | | | | | | | | | | | | | | | |
| | Notional amounts | | Fair Value
Asset/(Liability) | | Effect of 10% Adverse Change |
| (in millions) | | As of December 31, 2021 | | As of December 31, 2020 | | As of December 31, 2021 | | As of December 31, 2020 | | As of December 31, 2021 | | As of December 31, 2020 |
| Foreign currency denominated fixed rate debt | | $ | 1,701.0 | | | $ | 1,763.1 | | | $ | (1,763.1) | | | $ | (1,861.3) | | | $ | (171.9) | | | $ | (190.4) | |
| Foreign currency Forwards | | $ | 170.8 | | | $ | 181.2 | | | $ | (1.5) | | | $ | (4.9) | | | $ | (19.0) | | | $ | (20.5) | |
Foreign Currency
Assets and liabilities recorded in foreign currencies that are the functional currencies for the respective operations are translated at the prevailing exchange rate at the balance sheet date. Translation adjustments resulting from this process are reported as a separate component of OCI. Gains and losses from foreign currency transactions are included in earnings for the period. Revenue and expenses are translated at the average exchange rates during the respective period throughout the year.
Subsequent Events
On February 13, 2024, our Company's Board of Directors declared a quarterly dividend of $0.44 per share, to be paid on March 15, 2024, to shareholders of Class A and Class B common stock of record on March 1, 2024. Shareholders of exchangeable shares will receive the CAD equivalent of dividends declared on Class A and Class B common stock.
2. New Accounting Pronouncements
New Accounting Pronouncements Recently Adopted
In March 2020, the FASB issued authoritative guidance which provides optional expedients and exceptions for applying U.S. GAAP to contracts, hedging relationships and other transactions affected by reference rate reform if certain criteria are met. The amendments apply only to contracts, hedging relationships and other transactions that reference LIBOR or another reference rate expected to be discontinued because of reference rate reform and was effective for all entities upon issuance on March 12, 2020 and remains effective through December 31, 2024. The guidance permits a company to elect certain optional expedients and exceptions when affected by the changes in reference rate reform. We have adopted this guidance and elected to apply certain optional expedients related to our derivative instruments with maturity dates extending beyond the discontinuance date of LIBOR. Specifically, in May 2023, we amended our 2026 forward starting interest rate swaps to replace LIBOR with SOFR and applied the optional expedients to account for the transition. None of the changes made as a result of reference rate reform had a material impact on our financial statements.
In September 2022, the FASB issued authoritative guidance intended to provide consistent and transparent disclosures for a buyer in a supplier finance program by requiring disclosures of key program terms, the amount of obligations that have been confirmed as valid with the finance provider that are deemed outstanding as of the end of the period, a description of the financial line item in which this unpaid balance resides and a rollforward of the obligations including the amount of obligations confirmed and paid. We adopted this guidance, with the exception of the rollforward disclosure requirement, starting with our quarterly report for the three months ended March 31, 2023. See Note 1, "Basis of Presentation and Summary of Significant Accounting Policies" for additional information on our supplier finance programs. The rollforward disclosure requirement is effective for us in our annual report for the year ending December 31, 2024 and is required to be applied prospectively. Commodity Price Risk
We are exposed to the volatility in commodity prices as we use commodities in the production and distribution of our products. We specifically hedge our exposure to fluctuations in the price of natural gas, aluminum, including surcharges relating to our aluminum exposures, corn, sweeteners, barley and wheat.diesel. We utilize market-based derivatives and long-term supplier-based contracts, specifically a combination of purchase orders, long-term supply contracts and over-the-counter financial instruments to mitigate our commodity price risk by establishingreducing price certaintyvolatility for select commodities that are used in our supply chain.
The following table includes details of our commodity swaps and options used to hedge commodity price risk as well as the impact of a hypothetical 10% adverse change in the related commodity prices on the fair value of the derivatives. The following table excludes our commodity options because we have offsetting buy and sell positions. Notional amounts and fair values are presented in USD based on the applicable exchange rate as of December 31, 20212023 and December 31, 2020.2022. Approximately 62%68% of commodity swaps mature in 2022, 33%2024, 29% mature in 2023,2025 and 5%3% mature in 2024 and thereafter.
| | | | | | | | | | | | | | | | | | | | | | | | | | | | | | | | | | | | | | |
| | Notional amounts | | Fair Value Asset/(Liability) | | Effect of 10% Adverse Change |
| (in millions) | | As of December 31, 2021 | | As of December 31, 2020 | | As of December 31, 2021 | | As of December 31, 2020 | | As of December 31, 2021 | | As of December 31, 2020 |
| Swaps | | $ | 722.1 | | | $ | 918.9 | | | $ | 300.8 | | | $ | 65.2 | | | $ | (95.7) | | | $ | (96.0) | |
| Options | | $ | 68.2 | | | $ | 16.8 | | | $ | 0.1 | | | $ | — | | | $ | — | | | $ | — | |
| | | | | | | | | | | | | | | | | | | | | | | | | | | | | | | | | | | | | | |
| | Notional amounts | | Fair Value Asset/(Liability) | | Effect of Adverse Change |
| (in millions) | | As of December 31, 2023 | | As of December 31, 2022 | | As of December 31, 2023 | | As of December 31, 2022 | | As of December 31, 2023 | | As of December 31, 2022 |
| Swaps | | $ | 653.5 | | | $ | 525.2 | | | $ | (30.4) | | | $ | 69.0 | | | $ | (58.1) | | | $ | (55.8) | |
| | | | | | | | | | | | |
ITEM 8. FINANCIAL STATEMENTS AND SUPPLEMENTARY DATA
| | | | | |
| |
| Index to Financial Statements | Page |
Consolidated Financial Statements: | |
| |
| |
| |
| |
| |
| |
| |
| |
| |
| |
| |
| |
| |
| |
| |
| |
| |
| |
| |
| |
| |
| |
| |
| |
| |
| |
| |
| |
| |
| |
| |
| |
| |
| |
| |
| |
| |
| |
| |
| |
| |
| |
MANAGEMENT'S REPORT
The preparation, integrity and objectivity of the financial statements and all other financial information included in this annual report are the responsibility of the management of Molson Coors Beverage Company. The financial statements have been prepared in accordance with generally accepted accounting principles in the United States, applying estimates based on management's best judgment where necessary. Management believes that all material uncertainties have been appropriately accounted for and disclosed.
Our management, under the supervision and with the participation of our Chief Executive Officer and Chief Financial Officer, assessed the effectiveness of our internal control over financial reporting as of December 31, 2021,2023, based on the framework and criteria established in Internal Control—Integrated Framework (2013 Framework), issued by the Committee of Sponsoring Organizations of the Treadway Commission. Based upon its assessment, management concluded that, as of December 31, 2021,2023, the Company's internal control over financial reporting was effective.
PricewaterhouseCoopers LLP, the Company's independent registered public accounting firm, provides an objective, independent audit of the consolidated financial statements and internal control over financial reporting. Their accompanying report is based upon an examination conducted in accordance with standards of the Public Company Accounting Oversight Board (United States), including tests of accounting procedures, records and internal control.
The Board of Directors, operating through its Audit Committee composed of independent, outside directors, monitors the Company's accounting control systems and reviews the results of the Company's auditing activities. The Audit Committee meets at least quarterly, either separately or jointly, with representatives of management, PricewaterhouseCoopers LLP and internal auditors. To ensure complete independence, PricewaterhouseCoopers LLP and the Company's internal auditors have full and free access to the Audit Committee and may meet with or without the presence of management.
| | | | | | | | |
/s/ GAVIN D.K. HATTERSLEY | | /s/ TRACEY I. JOUBERT |
| Gavin D.K. Hattersley | | Tracey I. Joubert |
| President & Chief Executive Officer | | Chief Financial Officer |
| Molson Coors Beverage Company | | Molson Coors Beverage Company |
February 23, 202220, 2024 | | February 23, 202220, 2024 |
Report of Independent Registered Public Accounting Firm
To the Board of Directors and Stockholders of Molson Coors Beverage Company
Opinions on the Financial Statements and Internal Control over Financial Reporting
We have audited the accompanying consolidated balance sheets of Molson Coors Beverage Company and its subsidiaries (the “Company”) as of December 31, 20212023 and 2020,2022, and the related consolidated statements of operations, of comprehensive income (loss), of stockholders’ equity and noncontrolling interests and of cash flows for each of the three years in the period ended December 31, 2021,2023, including the related notes and schedule of valuation and qualifying accounts for each of the three years in the period ended December 31, 20212023 appearing under Itemitem 15(c) (collectively referred to as the “consolidated financial statements”). We also have audited the Company's internal control over financial reporting as of December 31, 2021,2023, based on criteria established in Internal Control - Integrated Framework (2013) issued by the Committee of Sponsoring Organizations of the Treadway Commission (COSO).
In our opinion, the consolidated financial statements referred to above present fairly, in all material respects, the financial position of the Company as of December 31, 20212023 and 2020,2022, and the results of its operations and its cash flows for each of the three years in the period ended December 31, 20212023 in conformity with accounting principles generally accepted in the United States of America. Also in our opinion, the Company maintained, in all material respects, effective internal control over financial reporting as of December 31, 2021,2023, based on criteria established in Internal Control - Integrated Framework (2013) issued by the COSO.
Basis for Opinions
The Company's management is responsible for these consolidated financial statements, for maintaining effective internal control over financial reporting, and for its assessment of the effectiveness of internal control over financial reporting, included in Management’sManagement's Annual Report on Internal Control over Financial Reporting appearing under Item 9A. Our responsibility is to express opinions on the Company’s consolidated financial statements and on the Company's internal control over financial reporting based on our audits. We are a public accounting firm registered with the Public Company Accounting Oversight Board (United States) (PCAOB) and are required to be independent with respect to the Company in accordance with the U.S. federal securities laws and the applicable rules and regulations of the Securities and Exchange Commission and the PCAOB.
We conducted our audits in accordance with the standards of the PCAOB. Those standards require that we plan and perform the audits to obtain reasonable assurance about whether the consolidated financial statements are free of material misstatement, whether due to error or fraud, and whether effective internal control over financial reporting was maintained in all material respects.
Our audits of the consolidated financial statements included performing procedures to assess the risks of material misstatement of the consolidated financial statements, whether due to error or fraud, and performing procedures that respond to those risks. Such procedures included examining, on a test basis, evidence regarding the amounts and disclosures in the consolidated financial statements. Our audits also included evaluating the accounting principles used and significant estimates made by management, as well as evaluating the overall presentation of the consolidated financial statements. Our audit of internal control over financial reporting included obtaining an understanding of internal control over financial reporting, assessing the risk that a material weakness exists, and testing and evaluating the design and operating effectiveness of internal control based on the assessed risk. Our audits also included performing such other procedures as we considered necessary in the circumstances. We believe that our audits provide a reasonable basis for our opinions.
Definition and Limitations of Internal Control over Financial Reporting
A company’s internal control over financial reporting is a process designed to provide reasonable assurance regarding the reliability of financial reporting and the preparation of financial statements for external purposes in accordance with generally accepted accounting principles. A company’s internal control over financial reporting includes those policies and procedures that (i) pertain to the maintenance of records that, in reasonable detail, accurately and fairly reflect the transactions and dispositions of the assets of the company; (ii) provide reasonable assurance that transactions are recorded as necessary to permit preparation of financial statements in accordance with generally accepted accounting principles, and that receipts and expenditures of the company are being made only in accordance with authorizations of management and directors of the company; and (iii) provide reasonable assurance regarding prevention or timely detection of unauthorized acquisition, use, or disposition of the company’s assets that could have a material effect on the financial statements.
Because of its inherent limitations, internal control over financial reporting may not prevent or detect misstatements. Also, projections of any evaluation of effectiveness to future periods are subject to the risk that controls may become inadequate because of changes in conditions, or that the degree of compliance with the policies or procedures may deteriorate.
Critical Audit Matters
The critical audit mattermatters communicated below is a matterare matters arising from the current period audit of the consolidated financial statements that waswere communicated or required to be communicated to the audit committee and that (i) relatesrelate to accounts or disclosures that are material to the consolidated financial statements and (ii) involved our especially challenging, subjective, or complex judgments. The communication of critical audit matters does not alter in any way our opinion on the consolidated financial statements, taken as a whole, and we are not, by communicating the critical audit mattermatters below, providing a separate opinionopinions on the critical audit mattermatters or on the accounts or disclosures to which it relates.they relate.
Goodwill Impairment Assessment - Americas Reporting Unit
As described in Notes 1 and 106 to the consolidated financial statements, the Company’s goodwill balance related to the Americas reporting unit was $5,325 million as of December 31, 2021 is $6,153 million.2023. The carrying value of goodwill is evaluated for impairment at the reporting unit level at least annually or when an interim triggering event occurs that wouldmay indicate that impairment may have taken place.potential impairment. The Company’s annual impairment test is performed as of the first day of the fiscal fourth quarter. As disclosed by management, theThe evaluation involves comparing the reporting unit’s fair value to its carrying value. If the reporting unit’sfair value exceeds its respective carrying value, then management would conclude that no impairment has occurred. If the carrying value exceeds its fair value, the Company would recognize an impairment loss in an amount equal to the excess up to the total amount of goodwill allocated to the reporting unit. A combination of a discounted cash flow analysis and market approach is used by management to determine the fair value of the reporting unit. Fair value determinations require considerable judgment and are sensitive to changes in underlying assumptions and factors. Examples of events or circumstances that could reasonably be expected to negatively affect the underlying key assumptions and ultimately impact the estimated fair value of the Company’sour reporting unit may include (i)the following, as disclosed by management, (i) growth rates for sales, costs and profits, which are based on various long-range financial and operational plans; (ii) prolonged weakening of economic conditions; or (iii) significant unfavorable changes in income tax rates, environmental or other regulations, including interpretations thereof, terminal growth rates,rate, market multiples and / or weightedweighted- average cost of capital utilizedcapital. Management concluded that the fair value of the Americas reporting unit was in the discounted cash flow analysis.excess of its carrying value and therefore no goodwill impairment charge was recorded.
The principal considerations for our determination that performing procedures relating to the goodwill impairment assessment for the Americas reporting unit is a critical audit matter are (i) the significant judgment by management when determiningdeveloping the fair value estimate of the Americas reporting unit; (ii) a high degree of auditor judgment, subjectivity, and effort in performing procedures and evaluating management’s significant assumptions related to the weighted average cost of capital and growth rates for sales, and market multiples;sales; and (iii) the audit effort involved the use of professionals with specialized skill and knowledge.
Addressing the matter involved performing procedures and evaluating audit evidence in connection with forming our overall opinion on the consolidated financial statements. These procedures included testing the effectiveness of controls relating to management’s goodwill impairment assessment, including controls over the valuation of the Americas reporting unit. These procedures also included, among others (i) testing management’s process for determiningdeveloping the fair value estimate of the Americas reporting unit; (ii) evaluating the appropriateness of the discounted cash flow analysis and market approach;approach used by management; (iii) testing the completeness and accuracy of underlying data used in the discounted cash flow analysis and market approach; and (iv) evaluating the reasonableness of significant assumptions used by management related to the weighted average cost of capital and growth rates for sales, and market multiples.sales. Evaluating the significantmanagement's assumptions related to growth rates for sales involved evaluating whether the significant assumptions used were reasonable considering (i) the current and past performance of the Americas reporting unit; (ii) the consistency with external market and industry data; and (iii) whether these assumptions were consistent with evidence obtained in other areas of the audit. Professionals with specialized skill and knowledge were used to assist in the evaluation ofevaluating (i) the appropriateness of the Company’s discounted cash flow analysis and market approach and (ii) the reasonableness of the weighted average cost of capital assumption.
Indefinite-Lived Intangible Asset Impairment Assessment - Staropramen Family of Brands (EMEA&APAC)
As described in Notes 1 and 6 to the consolidated financial statements, the Company’s indefinite-lived intangible asset brands balance was $8,002 million as of December 31, 2023, of which a portion relates to the Staropramen family of brands in the EMEA&APAC segment. The carrying value of the indefinite-lived intangible asset is evaluated for impairment at least annually or when an interim triggering event occurs that may indicate potential impairment. The Company’s annual impairment test is performed as of the first day of the fiscal fourth quarter. The evaluation involves comparing the indefinite-lived intangible asset’s fair value to its carrying value. If the fair value exceeds its respective carrying value, then management would conclude that no impairment has occurred. If the carrying value exceeds its fair value, the Company would recognize an impairment loss in an amount equal to the excess up to the total balance of the respective indefinite-lived intangible asset. As of the October 1, 2023 testing date, the carrying value of the Staropramen family of brands in EMEA&APAC was determined to be in excess of its fair value such that an impairment loss of $160.7 million was recorded by management. An excess earnings approach is used to determine the fair value of the indefinite-lived intangible asset. Fair value determinations require
considerable judgment and are sensitive to changes in underlying assumptions and factors. Examples of events or circumstances that could reasonably be expected to negatively affect the underlying key assumptions and ultimately impact the estimated fair value of the Company’s indefinite-lived intangible may include the following, as disclosed by management, (i) growth rates for sales, costs and profits, which are based on various long-range financial and operational plans, (ii) prolonged weakening of economic conditions, or (iii) significant unfavorable changes in income tax rates, environmental or other regulations, including interpretations thereof, terminal growth rates, and / or weighted average cost of capital.
The principal considerations for our determination that performing procedures relating to the indefinite-lived intangible asset impairment assessment for the Staropramen family of brands in EMEA&APAC is a critical audit matter are (i) the significant judgment by management when developing the fair value estimate of the indefinite-lived intangible asset for the Staropramen family of brands; (ii) a high degree of auditor judgment, subjectivity and effort in performing procedures and evaluating management’s significant assumptions related to the weighted average cost of capital, growth rates for sales, and growth rates for costs associated with marketing, general, and administrative (MG&A) expenses; and (iii) the audit effort involved the use of professionals with specialized skill and knowledge.
Addressing the matter involved performing procedures and evaluating audit evidence in connection with forming our overall opinion on the consolidated financial statements. These procedures included testing the effectiveness of controls relating to management’s indefinite-lived intangible asset impairment assessments, including controls over the valuation of the Staropramen family of brands. These procedures also included, among others (i) testing management’s process for developing the fair value estimate of the indefinite-lived intangible asset for the Staropramen family of brands; (ii) evaluating the appropriateness of the excess earnings approach used by management; (iii) testing the completeness and accuracy of underlying data used in the excess earnings approach; and (iv) evaluating the reasonableness of the significant assumptions used by management related to the weighted average cost of capital, growth rates for sales, and growth rates for MG&A expenses. Evaluating management’s assumptions related to growth rates for sales and growth rates for MG&A expenses involved evaluating whether the assumptions used by management were reasonable considering (i) the current and past performance of the Staropramen family of brands; (ii) whether these assumptions were consistent with evidence obtained in other areas of the audit, and (iii) for growth rates for sales assumption, whether the assumption was consistent with external market multiple significant assumptions.
/s/ PricewaterhouseCoopers LLP
Milwaukee, Wisconsin
February 23, 202220, 2024
We have served as the Company’s auditor since 1974.
MOLSON COORS BEVERAGE COMPANY AND SUBSIDIARIES
CONSOLIDATED STATEMENTS OF OPERATIONS
(IN MILLIONS, EXCEPT PER SHARE DATA) | | | | For the Years Ended | | For the Years Ended |
| | | December 31, 2021 | | December 31, 2020 | | December 31, 2019 | | December 31, 2023 | | December 31, 2022 | | December 31, 2021 |
| Sales | Sales | $ | 12,449.9 | | | $ | 11,723.8 | | | $ | 13,009.1 | |
| Excise taxes | Excise taxes | (2,170.2) | | | (2,069.8) | | | (2,429.7) | |
| Net sales | Net sales | 10,279.7 | | | 9,654.0 | | | 10,579.4 | |
| Cost of goods sold | Cost of goods sold | (6,226.3) | | | (5,885.7) | | | (6,378.2) | |
| Gross profit | Gross profit | 4,053.4 | | | 3,768.3 | | | 4,201.2 | |
| Marketing, general and administrative expenses | Marketing, general and administrative expenses | (2,554.5) | | | (2,437.0) | | | (2,728.0) | |
| Special items, net | (44.5) | | | (1,740.2) | | | (708.8) | |
| Goodwill impairment | |
| Other operating income (expense), net | |
| Equity income (loss) | |
| Operating income (loss) | Operating income (loss) | 1,454.4 | | | (408.9) | | | 764.4 | |
| Other income (expense), net | |
| Interest expense | Interest expense | (260.3) | | | (274.6) | | | (280.9) | |
| Interest income | Interest income | 2.0 | | | 3.3 | | | 8.2 | |
| Other pension and postretirement benefits (costs), net | 46.4 | | | 30.3 | | | 2.9 | |
| Other income (expense), net | (3.5) | | | 6.0 | | | (14.7) | |
| Total other income (expense), net | (215.4) | | | (235.0) | | | (284.5) | |
| Other pension and postretirement benefit (cost), net | |
| Other non-operating income (expense), net | |
| Total non-operating income (expense), net | |
| Income (loss) before income taxes | Income (loss) before income taxes | 1,239.0 | | | (643.9) | | | 479.9 | |
| Income tax benefit (expense) | Income tax benefit (expense) | (230.5) | | | (301.8) | | | (233.7) | |
| Net income (loss) | Net income (loss) | 1,008.5 | | | (945.7) | | | 246.2 | |
| Net (income) loss attributable to noncontrolling interests | Net (income) loss attributable to noncontrolling interests | (2.8) | | | (3.3) | | | (4.5) | |
| Net income (loss) attributable to Molson Coors Beverage Company | Net income (loss) attributable to Molson Coors Beverage Company | $ | 1,005.7 | | | $ | (949.0) | | | $ | 241.7 | |
| | | | | | | | | | |
| Net income (loss) attributable to Molson Coors Beverage Company per share: | |
| Net income (loss) attributable to Molson Coors Beverage Company per share | |
| Basic | |
| Basic | |
| Basic | Basic | $ | 4.63 | | | $ | (4.38) | | | $ | 1.12 | |
| Diluted | Diluted | $ | 4.62 | | | $ | (4.38) | | | $ | 1.11 | |
| | Weighted-average shares outstanding: | |
| Weighted-average shares outstanding | |
| Weighted-average shares outstanding | |
| Weighted-average shares outstanding | |
| Basic | |
| Basic | |
| Basic | Basic | 217.1 | | | 216.8 | | | 216.6 | |
| Dilutive effect of share-based awards | Dilutive effect of share-based awards | 0.5 | | | — | | | 0.3 | |
| Diluted | Diluted | 217.6 | | | 216.8 | | | 216.9 | |
| | Anti-dilutive securities excluded from computation of diluted EPS | 1.8 | | | 2.7 | | | 1.3 |
See notes to consolidated financial statements.
MOLSON COORS BEVERAGE COMPANY AND SUBSIDIARIES
CONSOLIDATED STATEMENTS OF COMPREHENSIVE INCOME (LOSS)
(IN MILLIONS) | | For the Years Ended | | | For the Years Ended |
| December 31, 2023 | | | December 31, 2023 | | December 31, 2022 | | December 31, 2021 |
| Net income (loss) including noncontrolling interests | |
| Other comprehensive income (loss), net of tax | | Other comprehensive income (loss), net of tax | | | |
| Foreign currency translation adjustments | |
| Cumulative translation adjustment reclassified from other comprehensive income (loss) | |
| Unrealized gain (loss) recognized on derivative instruments | |
| Derivative instrument activity reclassified from other comprehensive income (loss) | |
| Net change in pension and other postretirement benefit assets and liabilities recognized in other comprehensive income (loss) | |
| Pension and other postretirement activity reclassified from other comprehensive income (loss) | |
| | For the Years Ended |
| December 31, 2021 | | December 31, 2020 | | December 31, 2019 |
| Net income (loss) including noncontrolling interests | $ | 1,008.5 | | | $ | (945.7) | | | $ | 246.2 | |
| Other comprehensive income (loss), net of tax: | | | | | |
| Foreign currency translation adjustments | (28.4) | | | 113.6 | | | 177.6 | |
| Reclassification of cumulative translation adjustment to income (loss) | 7.5 | | | — | | | — | |
| Unrealized gain (loss) on derivative instruments | 37.4 | | | (85.7) | | | (84.2) | |
| Reclassification of derivative (gain) loss to income | 5.5 | | | (0.4) | | | 0.5 | |
| Pension and other postretirement benefit adjustments | 118.4 | | | (39.9) | | | (39.8) | |
| Amortization of net prior service (benefit) cost and net actuarial (gain) loss to income and settlement | 5.4 | | | (5.2) | | | 19.7 | |
| | Ownership share of unconsolidated subsidiaries' other comprehensive income (loss) | |
| Ownership share of unconsolidated subsidiaries' other comprehensive income (loss) | |
| Ownership share of unconsolidated subsidiaries' other comprehensive income (loss) | Ownership share of unconsolidated subsidiaries' other comprehensive income (loss) | 15.5 | | | 14.2 | | | (10.6) | |
| Total other comprehensive income (loss), net of tax | Total other comprehensive income (loss), net of tax | 161.3 | | | (3.4) | | | 63.2 | |
| Comprehensive income (loss) | Comprehensive income (loss) | 1,169.8 | | | (949.1) | | | 309.4 | |
| Comprehensive (income) loss attributable to noncontrolling interests | Comprehensive (income) loss attributable to noncontrolling interests | (2.3) | | | (5.5) | | | (5.1) | |
| Comprehensive income (loss) attributable to Molson Coors Beverage Company | Comprehensive income (loss) attributable to Molson Coors Beverage Company | $ | 1,167.5 | | | $ | (954.6) | | | $ | 304.3 | |
See notes to consolidated financial statements.
MOLSON COORS BEVERAGE COMPANY AND SUBSIDIARIES
CONSOLIDATED BALANCE SHEETS
(IN MILLIONS, EXCEPT PAR VALUE)
| | | | As of | | As of |
| | | December 31, 2021 | | December 31, 2020 | | December 31, 2023 | | December 31, 2022 |
| Assets | Assets | | | | Assets | | | |
| Current assets: | | | |
| Current assets | | Current assets | | | |
| Cash and cash equivalents | Cash and cash equivalents | $ | 637.4 | | | $ | 770.1 | |
| Accounts and other receivables: | | | |
| Trade, less allowance for doubtful accounts of $19.0 and $18.1, respectively | 662.7 | | | 549.6 | |
| Affiliate receivables | 16.2 | | | 8.4 | |
| Other receivables, less allowance for doubtful accounts of $2.5 and $2.4, respectively | 200.5 | | | 129.1 | |
| Inventories, less allowance for obsolete inventories of $25.8 and $22.0, respectively | 804.7 | | | 664.3 | |
| Trade receivables, net | |
| Other receivables, net | |
| Inventories, net | |
| Other current assets, net | Other current assets, net | 457.2 | | | 297.3 | |
| Total current assets | Total current assets | 2,778.7 | | | 2,418.8 | |
| Properties, less accumulated depreciation of $3,507.2 and $3,416.4, respectively | 4,192.4 | | | 4,250.3 | |
| Property, plant and equipment, net | |
| Goodwill | Goodwill | 6,152.6 | | | 6,151.0 | |
| Other intangibles, less accumulated amortization of $1,406.3 and $1,206.5, respectively | 13,286.8 | | | 13,556.1 | |
| Other intangibles, net | |
| Other assets | Other assets | 1,208.5 | | | 954.9 | |
| Total assets | Total assets | $ | 27,619.0 | | | $ | 27,331.1 | |
| Liabilities and equity | Liabilities and equity | | | | Liabilities and equity | | | |
| Current liabilities: | | | |
| Accounts payable and other current liabilities (includes affiliate payables of $4.1 and $0.5, respectively) | $ | 3,107.3 | | | $ | 2,889.5 | |
| Current liabilities | | Current liabilities | | | |
| Accounts payable and other current liabilities | |
| Current portion of long-term debt and short-term borrowings | Current portion of long-term debt and short-term borrowings | 514.9 | | | 1,020.1 | |
| Total current liabilities | Total current liabilities | 3,622.2 | | | 3,909.6 | |
| Long-term debt | Long-term debt | 6,647.2 | | | 7,208.2 | |
| Pension and postretirement benefits | Pension and postretirement benefits | 654.4 | | | 763.2 | |
| Deferred tax liabilities | Deferred tax liabilities | 2,704.6 | | | 2,381.6 | |
| Other liabilities | Other liabilities | 326.5 | | | 447.2 | |
| Total liabilities | Total liabilities | 13,954.9 | | | 14,709.8 | |
Commitments and contingencies (Note 18) | 0 | | 0 |
Commitments and contingencies (Note 13) | | Commitments and contingencies (Note 13) | | | |
| Redeemable noncontrolling interest | |
| Molson Coors Beverage Company stockholders' equity | Molson Coors Beverage Company stockholders' equity | | | | Molson Coors Beverage Company stockholders' equity | | | |
| Capital stock: | | | |
| Capital stock | | Capital stock | | | |
| Preferred stock, $0.01 par value (authorized: 25.0 shares; none issued) | Preferred stock, $0.01 par value (authorized: 25.0 shares; none issued) | — | | | — | |
| Class A common stock, $0.01 par value (authorized: 500.0 shares; issued and outstanding: 2.6 shares and 2.6 shares, respectively) | — | | | — | |
| Class B common stock, $0.01 par value (authorized: 500.0 shares; issued: 210.1 shares and 209.8 shares, respectively) | 2.1 | | | 2.1 | |
| Class A exchangeable shares, no par value (issued and outstanding: 2.7 shares and 2.7 shares, respectively) | 102.2 | | | 102.3 | |
| Class B exchangeable shares, no par value (issued and outstanding: 11.1 shares and 11.1 shares, respectively) | 417.8 | | | 417.8 | |
| Class A common stock, $0.01 par value (authorized: 500.0 shares; issued: 2.6 shares and 2.6 shares, respectively) | |
| Class B common stock, $0.01 par value (authorized: 500.0 shares; issued: 212.5 shares and 210.5 shares, respectively) | |
| Class A exchangeable shares, no par value (issued: 2.7 shares and 2.7 shares, respectively) | |
| Class B exchangeable shares, no par value (issued: 9.4 shares and 11.0 shares, respectively) | |
| Paid-in capital | Paid-in capital | 6,970.9 | | | 6,937.8 | |
| Retained earnings | Retained earnings | 7,401.5 | | | 6,544.2 | |
| Accumulated other comprehensive income (loss) | Accumulated other comprehensive income (loss) | (1,006.0) | | | (1,167.8) | |
| Class B common stock held in treasury at cost (9.5 shares and 9.5 shares, respectively) | (471.4) | | | (471.4) | |
| Class B common stock held in treasury at cost (13.9 shares and 10.5 shares, respectively) | |
| Total Molson Coors Beverage Company stockholders' equity | Total Molson Coors Beverage Company stockholders' equity | 13,417.1 | | | 12,365.0 | |
| Noncontrolling interests | Noncontrolling interests | 247.0 | | | 256.3 | |
| Total equity | Total equity | 13,664.1 | | | 12,621.3 | |
| Total liabilities and equity | Total liabilities and equity | $ | 27,619.0 | | | $ | 27,331.1 | |
MOLSON COORS BEVERAGE COMPANY AND SUBSIDIARIES
CONSOLIDATED STATEMENTS OF CASH FLOWS
(IN MILLIONS)MILLIONS | | | | | | | | | | | | | | | | | |
| | For the Years Ended |
| | December 31, 2021 | | December 31, 2020 | | December 31, 2019 |
| Cash flows from operating activities: | | | | | |
| Net income (loss) including noncontrolling interests | $ | 1,008.5 | | | $ | (945.7) | | | $ | 246.2 | |
| Adjustments to reconcile net income (loss) to net cash provided by (used in) operating activities: | | | | | |
| Depreciation and amortization | 786.1 | | | 922.0 | | | 859.0 | |
| Amortization of debt issuance costs and discounts | 6.7 | | | 8.1 | | | 13.6 | |
| Share-based compensation | 32.1 | | | 24.2 | | | 8.5 | |
| (Gain) loss on sale or impairment of properties and other assets, net | 9.1 | | | 1,553.5 | | | 614.7 | |
| Unrealized (gain) loss on foreign currency fluctuations and derivative instruments, net | (233.8) | | | (111.4) | | | 18.9 | |
| Income tax (benefit) expense | 230.5 | | | 301.8 | | | 233.7 | |
| Income tax (paid) received | (227.0) | | | (127.0) | | | (57.0) | |
| Interest expense, excluding amortization of debt issuance costs and discounts | 253.6 | | | 266.0 | | | 272.4 | |
| Interest paid | (256.2) | | | (271.9) | | | (285.0) | |
| Change in current assets and liabilities (net of impact of business combinations) and other: | | | | | |
| Receivables | (137.6) | | | 160.8 | | | 38.5 | |
| Inventories | (143.9) | | | (46.2) | | | (17.7) | |
| Payables and other current liabilities | 285.5 | | | (50.1) | | | (53.0) | |
| Other assets and other liabilities | (40.1) | | | 11.6 | | | 4.5 | |
| Net cash provided by (used in) operating activities | 1,573.5 | | | 1,695.7 | | | 1,897.3 | |
| Cash flows from investing activities: | | | | | |
| Additions to properties | (522.6) | | | (574.8) | | | (593.8) | |
| Proceeds from sales of properties and other assets | 26.0 | | | 158.8 | | | 115.9 | |
| | | | | |
| | | | | |
| | | | | |
| Other | (13.3) | | | 2.4 | | | 44.6 | |
| Net cash provided by (used in) investing activities | (509.9) | | | (413.6) | | | (433.3) | |
| Cash flows from financing activities: | | | | | |
| | | | | |
| Exercise of stock options under equity compensation plans | 4.6 | | | 4.1 | | | 1.6 | |
| Dividends paid | (147.8) | | | (125.3) | | | (424.4) | |
| | | | | |
| Payments on debt and borrowings | (1,006.6) | | | (918.9) | | | (1,586.2) | |
| Proceeds on debt and borrowings | — | | | 1.5 | | | 3.0 | |
| Net proceeds from (payments on) revolving credit facilities and commercial paper | 1.4 | | | — | | | (4.7) | |
| Other | (23.8) | | | (31.8) | | | 3.7 | |
| Net cash provided by (used in) financing activities | (1,172.2) | | | (1,070.4) | | | (2,007.0) | |
| Cash and cash equivalents: | | | | | |
| Net increase (decrease) in cash and cash equivalents | (108.6) | | | 211.7 | | | (543.0) | |
| Effect of foreign exchange rate changes on cash and cash equivalents | (24.1) | | | 35.0 | | | 8.5 | |
| Balance at beginning of year | 770.1 | | | 523.4 | | | 1,057.9 | |
| Balance at end of year | $ | 637.4 | | | $ | 770.1 | | | $ | 523.4 | |
| | | | | | | | | | | | | | | | | |
| | For the Years Ended |
| | December 31, 2023 | | December 31, 2022 | | December 31, 2021 |
| Cash flows from operating activities | | | | | |
| Net income (loss) including noncontrolling interests | $ | 956.4 | | | $ | (186.5) | | | $ | 1,008.5 | |
| Adjustments to reconcile net income (loss) to net cash provided by (used in) operating activities | | | | | |
| Depreciation and amortization | 682.8 | | | 684.8 | | | 786.1 | |
| Amortization of debt issuance costs and discounts | 5.7 | | | 7.7 | | | 6.7 | |
| Share-based compensation | 44.9 | | | 33.6 | | | 32.1 | |
| Goodwill impairment | — | | | 845.0 | | | — | |
| (Gain) loss on sale or impairment of property, plant, equipment and other assets, net | 181.9 | | | 18.6 | | | 9.1 | |
| Unrealized (gain) loss on foreign currency fluctuations and derivative instruments, net | 88.3 | | | 236.4 | | | (233.8) | |
| Equity (income) loss | (12.0) | | | (4.7) | | | — | |
| Income tax (benefit) expense | 296.1 | | | 124.0 | | | 230.5 | |
| Income tax (paid) received | (244.8) | | | (76.6) | | | (227.0) | |
| Interest expense, excluding amortization of debt issuance costs and discounts | 228.3 | | | 242.9 | | | 253.6 | |
| Interest paid | (229.0) | | | (240.0) | | | (256.2) | |
| Change in current assets and liabilities (net of impact of business combinations) and other | | | | | |
| Receivables | (0.7) | | | (108.5) | | | (137.6) | |
| Inventories | 21.7 | | | (64.6) | | | (143.9) | |
| Payables and other current liabilities | 50.2 | | | (16.1) | | | 285.5 | |
| Other assets and other liabilities | 9.2 | | | 6.0 | | | (40.1) | |
| Net cash provided by (used in) operating activities | 2,079.0 | | | 1,502.0 | | | 1,573.5 | |
| Cash flows from investing activities | | | | | |
| Additions to property, plant and equipment | (671.5) | | | (661.4) | | | (522.6) | |
| Proceeds from sales of property, plant, equipment and other assets | 10.9 | | | 32.2 | | | 26.0 | |
| Acquisition of business, net of cash acquired | (63.7) | | | — | | | — | |
| Other | (117.4) | | | 4.1 | | | (13.3) | |
| Net cash provided by (used in) investing activities | (841.7) | | | (625.1) | | | (509.9) | |
| Cash flows from financing activities | | | | | |
| | | | | |
| Exercise of stock options under equity compensation plans | 7.9 | | | 3.1 | | | 4.6 | |
| Dividends paid | (354.7) | | | (329.3) | | | (147.8) | |
| Payments for purchases of treasury stock | (205.8) | | | (51.5) | | | — | |
| Payments on debt and borrowings | (404.8) | | | (509.1) | | | (1,006.6) | |
| Proceeds on debt and borrowings | 7.0 | | | 7.0 | | | — | |
| | | | | |
| Net proceeds from (payments on) revolving credit facilities and commercial paper | — | | | (3.7) | | | 1.4 | |
| Other | (31.0) | | | (6.0) | | | (23.8) | |
| Net cash provided by (used in) financing activities | (981.4) | | | (889.5) | | | (1,172.2) | |
| Effect of foreign exchange rate changes on cash and cash equivalents | 13.0 | | | (24.8) | | | (24.1) | |
| Net increase (decrease) in cash and cash equivalents | 268.9 | | | (37.4) | | | (132.7) | |
| Balance at beginning of year | 600.0 | | | 637.4 | | | 770.1 | |
| Balance at end of year | $ | 868.9 | | | $ | 600.0 | | | $ | 637.4 | |
| | | | | |
| | | | | |
| | | | | |
MOLSON COORS BEVERAGE COMPANY AND SUBSIDIARIES
CONSOLIDATED STATEMENTS OF STOCKHOLDERS' EQUITY
AND NONCONTROLLING INTERESTS
(IN MILLIONS)
| | | | | Molson Coors Beverage Company Stockholders' Equity | | | | | Molson Coors Beverage Company Stockholders' Equity | | |
| | | | | Common stock | | Exchangeable | | Accumulated
other | | Common Stock
held in | | Non | | | | Common stock | | Exchangeable | | | | | | Accumulated
other | | Common Stock
held in | | Non |
| | | | | issued | | shares issued | | Paid-in- | | Retained | | comprehensive | | treasury | | controlling | | | | issued | | shares issued | | Paid-in- | | Retained | | comprehensive | | treasury | | controlling |
| | | Total | | Class A | | Class B | | Class A | | Class B | | capital | | earnings | | income (loss) | | Class B | | interests | | Total | | Class A | | Class B | | Class A | | Class B | | capital | | earnings | | income (loss) | | Class B | | interests(1) |
| Balance as of December 31, 2018 | $ | 13,735.8 | | | $ | — | | | $ | 2.0 | | | $ | 103.2 | | | $ | 557.6 | | | $ | 6,773.1 | | | $ | 7,692.9 | | | $ | (1,150.0) | | | $ | (471.4) | | | $ | 228.4 | |
| Exchange of shares | — | | | — | | | — | | | (0.7) | | | 0.2 | | | 0.5 | | | — | | | — | | | — | | | — | |
| Shares issued under equity compensation plan | (8.3) | | | — | | | 0.1 | | | — | | | — | | | (8.4) | | | — | | | — | | | — | | | — | |
| Amortization of share-based compensation | 8.3 | | | — | | | — | | | — | | | — | | | 8.3 | | | — | | | — | | | — | | | — | |
| | Purchase of noncontrolling interest | 0.6 | | | — | | | — | | | — | | | — | | | 0.1 | | | — | | | — | | | — | | | 0.5 | |
| Deconsolidation of VIE | (1.7) | | | — | | | — | | | — | | | — | | | — | | | — | | | — | | | — | | | (1.7) | |
| Net income (loss) including noncontrolling interests | 246.2 | | | — | | | — | | | — | | | — | | | — | | | 241.7 | | | — | | | — | | | 4.5 | |
| Other comprehensive income (loss), net of tax | 63.2 | | | — | | | — | | | — | | | — | | | — | | | — | | | 62.6 | | | — | | | 0.6 | |
| Adoption of lease accounting standard | 32.0 | | | — | | | — | | | — | | | — | | | — | | | 32.0 | | | — | | | — | | | — | |
| Reclassification of stranded tax effects | — | | | — | | | — | | | — | | | — | | | — | | | 74.8 | | | (74.8) | | | — | | | — | |
| Contributions from noncontrolling interests | 34.1 | | | — | | | — | | | — | | | — | | | — | | | — | | | — | | | — | | | 34.1 | |
| Distributions and dividends to noncontrolling interests | (12.7) | | | — | | | — | | | — | | | — | | | — | | | — | | | — | | | — | | | (12.7) | |
| Dividends declared | (424.4) | | | — | | | — | | | — | | | — | | | — | | | (424.4) | | | — | | | — | | | — | |
| Balance as of December 31, 2019 | $ | 13,673.1 | | | $ | — | | | $ | 2.1 | | | $ | 102.5 | | | $ | 557.8 | | | $ | 6,773.6 | | | $ | 7,617.0 | | | $ | (1,162.2) | | | $ | (471.4) | | | $ | 253.7 | |
| Exchange of shares | — | | | — | | | — | | | (0.2) | | | (140.0) | | | 140.2 | | | — | | | — | | | — | | | — | |
| Shares issued under equity compensation plan | (0.5) | | | — | | | — | | | — | | | — | | | (0.5) | | | — | | | — | | | — | | | — | |
| Amortization of share-based compensation | 24.2 | | | — | | | — | | | — | | | — | | | 24.2 | | | — | | | — | | | — | | | — | |
| Acquisition of business and purchase of noncontrolling interest | (0.2) | | | — | | | — | | | — | | | — | | | 0.3 | | | — | | | — | | | — | | | (0.5) | |
| | Net income (loss) including noncontrolling interests | (945.7) | | | — | | | — | | | — | | | — | | | — | | | (949.0) | | | — | | | — | | | 3.3 | |
| Other comprehensive income (loss), net of tax | (3.4) | | | — | | | — | | | — | | | — | | | — | | | — | | | (5.6) | | | — | | | 2.2 | |
| | Contributions from noncontrolling interests | 16.3 | | | — | | | — | | | — | | | — | | | — | | | — | | | — | | | — | | | 16.3 | |
| Distributions and dividends to noncontrolling interests | (18.7) | | | — | | | — | | | — | | | — | | | — | | | — | | | — | | | — | | | (18.7) | |
| Dividends declared | (123.8) | | | — | | | — | | | — | | | — | | | — | | | (123.8) | | | — | | | — | | | — | |
| Balance as of December 31, 2020 | Balance as of December 31, 2020 | $ | 12,621.3 | | | $ | — | | | $ | 2.1 | | | $ | 102.3 | | | $ | 417.8 | | | $ | 6,937.8 | | | $ | 6,544.2 | | | $ | (1,167.8) | | | $ | (471.4) | | | $ | 256.3 | |
| Exchange of shares | Exchange of shares | — | | | — | | | — | | | (0.1) | | | — | | | 0.1 | | | — | | | — | | | — | | | — | |
| Shares issued under equity compensation plan | Shares issued under equity compensation plan | 0.6 | | | — | | | — | | | — | | | — | | | 0.6 | | | — | | | — | | | — | | | — | |
| Amortization of share-based compensation | Amortization of share-based compensation | 32.1 | | | — | | | — | | | — | | | — | | | 32.1 | | | — | | | — | | | — | | | — | |
| Purchase of noncontrolling interest | |
| Net income (loss) including noncontrolling interests | |
| Other comprehensive income (loss), net of tax | |
| Contributions from noncontrolling interests | |
| Distributions and dividends to noncontrolling interests | |
| Dividends declared | |
| Balance as of December 31, 2021 | |
| Exchange of shares | |
| Shares issued under equity compensation plan | |
| Amortization of share-based compensation | |
| Purchase of noncontrolling interest | |
| Net income (loss) including noncontrolling interests | |
| Other comprehensive income (loss), net of tax | |
| Share repurchase program | |
| Contributions from noncontrolling interests | |
| | | | | Molson Coors Beverage Company Stockholders' Equity | | | | | Molson Coors Beverage Company Stockholders' Equity | | |
| | | | | Common stock | | Exchangeable | | Accumulated
other | | Common Stock
held in | | Non | | | | Common stock | | Exchangeable | | | | | | Accumulated
other | | Common Stock
held in | | Non |
| | | | | issued | | shares issued | | Paid-in- | | Retained | | comprehensive | | treasury | | controlling | | | | issued | | shares issued | | Paid-in- | | Retained | | comprehensive | | treasury | | controlling |
| | | Total | | Class A | | Class B | | Class A | | Class B | | capital | | earnings | | income (loss) | | Class B | | interests | | Total | | Class A | | Class B | | Class A | | Class B | | capital | | earnings | | income (loss) | | Class B | | interests(1) |
| Distributions and dividends to noncontrolling interests | |
| Dividends declared | |
| Balance as of December 31, 2022 | |
| Exchange of shares | |
| Shares issued under equity compensation plan | |
| Amortization of share-based compensation | |
| Purchase of noncontrolling interest | Purchase of noncontrolling interest | (0.2) | | | — | | | — | | | — | | | — | | | 0.3 | | | — | | | — | | | — | | | (0.5) | |
| Deconsolidation of VIE | |
| Net income (loss) including noncontrolling interests | Net income (loss) including noncontrolling interests | 1,008.5 | | | — | | | — | | | — | | | — | | | — | | | 1,005.7 | | | — | | | — | | | 2.8 | |
| Other comprehensive income (loss), net of tax | Other comprehensive income (loss), net of tax | 161.3 | | | — | | | — | | | — | | | — | | | — | | | — | | | 161.8 | | | — | | | (0.5) | |
| Share repurchase program | |
| Contributions from noncontrolling interests | Contributions from noncontrolling interests | 3.2 | | | — | | | — | | | — | | | — | | | — | | | — | | | — | | | — | | | 3.2 | |
| Distributions and dividends to noncontrolling interests | Distributions and dividends to noncontrolling interests | (14.3) | | | — | | | — | | | — | | | — | | | — | | | — | | | — | | | — | | | (14.3) | |
| Dividends declared | Dividends declared | (148.4) | | | — | | | — | | | — | | | — | | | — | | | (148.4) | | | — | | | — | | | — | |
| Balance as of December 31, 2021 | $ | 13,664.1 | | | $ | — | | | $ | 2.1 | | | $ | 102.2 | | | $ | 417.8 | | | $ | 6,970.9 | | | $ | 7,401.5 | | | $ | (1,006.0) | | | $ | (471.4) | | | $ | 247.0 | |
| Balance as of December 31, 2023 | |
(1) All activity included in the noncontrolling interests column of the consolidated statements of stockholders' equity and noncontrolling interests excludes activity from our redeemable noncontrolling interests.
See notes to consolidated financial statements.
MOLSON COORS BEVERAGE COMPANY AND SUBSIDIARIES
NOTES TO CONSOLIDATED FINANCIAL STATEMENTS
1. Basis of Presentation and Summary of Significant Accounting Policies
Unless otherwise noted in this report, any description of "we," "us" or "our" includes Molson Coors Beverage Company ("MCBC" or the "Company"), principally a holding company, and its operating and non-operating subsidiaries included within our reporting segments. As of December 31, 2021, we changed the names of ourOur reporting segments to theinclude Americas and EMEA&APAC segments (formerly named the North America segment and Europe segment, respectively) to better reflect the geographic locations encompassed within the reportable segments. This change to our segment names had no impact on the composition of our segments, our financial position, results of operations, cash flow or segment level results previously reported.&APAC. Our Americas segment operates in the U.S., Canada and various countries in the Caribbean, Latin and South America, and our EMEA&APAC segment operates in Bulgaria, Croatia, Czech Republic, Hungary, Montenegro, the Republic of Ireland, Romania, Serbia, the U.K., various other European countries and certain countries within the Middle East, Africa and Asia Pacific.
Unless otherwise indicated, information in this report is presented in USD and comparisons are to comparable prior periods, and 2021, 20202023, 2022 and 20192021 refers to the twelve months ended December 31, 2021,2023, December 31, 20202022 and December 31, 2019,2021, respectively. Our primary operating currencies, other than USD, include the CAD, the GBP and our Central European operating currencies such as the EUR, CZK, RON and RSD.
Unless otherwise indicated, information in this report is presented in USD and comparisons are to comparable prior periods. Our primary operating currencies, other than USD, include the CAD, the GBP, and our Central European operating currencies such as the EUR, CZK, HRK and RSD.
Cybersecurity Incident
During March 2021, we experienced a systems outage that was caused by a cybersecurity incident. We engaged leading forensic information technology firms and legal counsel to assist our investigation into the incident and we restored our systems after working to get the systems back up as quickly as possible. Despite these actions, we experienced delays and disruptions to our business, including brewery operations, production and shipments. This incident caused us to not produce or ship as much as we otherwise would have in the first quarter of 2021. Subsequently, in the balance of 2021, we made progress recovering from the incident with increased shipments and have operationally recovered as of December 31, 2021. In addition, we incurred certain incremental one-time costs of $2.4 million for the year ended December 31, 2021 related to consultants, experts and data recovery efforts, net of insurance recoveries.
Coronavirus Global Pandemic
Starting at the end of the first quarter of 2020, the coronavirus pandemic has had a material adverse effect on our operations, liquidity, financial condition and results of operations. In 2021, we saw improvements in the marketplace related to the coronavirus global pandemic as on-premise locations began to re-open around the world at varying degrees, despite setbacks in certain markets related to the outbreak of new variants. The extent to which our operations will continue to be impacted by the coronavirus pandemic will depend largely on future developments, which are highly uncertain and cannot be accurately predicted, including the level of governmental or societal orders or restrictions on public gatherings and on-premise venues, including any vaccine mandates or testing requirements, the severity and duration of the coronavirus pandemic by market, including outbreaks of variants, changes in consumer behavior, the rate of vaccination and the efficacy of vaccines against the coronavirus and related variants. We continue to actively monitor the ongoing evolution of the coronavirus pandemic and resulting impacts to our business.
During 2020, we recorded charges of $15.5 million within cost of goods sold related to temporary "thank you" pay for certain essential Americas segment brewery employees. Additionally, in order to support and demonstrate our commitment to the continued viability of the many bars and restaurants which were negatively impacted by the coronavirus pandemic, during the first quarter of 2020, we initiated temporary keg relief programs in many of our markets. We committed to provide customers with reimbursements for untapped kegs that met certain established return requirements in conjunction with the voluntary programs. As a result, during 2020, we recognized a reduction to net sales of $30.3 million reflecting estimated sales returns and reimbursements through these keg relief programs.
Further, during 2020, we recognized charges of $12.1 million within cost of goods sold related to obsolete finished goods keg inventories that were not expected to be sold within our freshness specifications, as well as the costs to facilitate the above mentioned keg returns.
We continue to monitor the impacts on our customers’ liquidity and capital resources and therefore our ability to collect, or the timeliness of collection of our accounts receivable. While these receivables are not concentrated in any specific customer and our allowance on these receivables factors in expected credit loss, continued disruption and declines in the global economy could result in difficulties in our ability to collect and require increases to our allowance for doubtful accounts. As of December 31, 2021 and December 31, 2020, our allowance for trade receivables was approximately $19 million and $18 million, respectively, and allowance activity was immaterial during the year ended December 31, 2021.
In response to the ongoing impacts of the coronavirus pandemic, various governmental authorities globally announced relief programs, which among other items, provided temporary deferrals of non-income based tax payments, which positively impacted our operating cash flows in 2020. These temporary net tax payment deferrals of approximately $25 million and $130 million as of December 31, 2021 and December 31, 2020, respectively, were primarily included within accounts payable and other current liabilities on our audited consolidated balance sheets. Of the $130 million of temporary net tax payment deferrals as of December 31, 2020, approximately $105 million was repaid during the year ended December 31, 2021, with approximately $25 million outstanding as of December 31, 2021. The majority of the remaining balance is expected to be paid during the year ended December 31, 2022.
We protected and supported our liquidity position in response to the global economic uncertainty created by the coronavirus pandemic. Beginning with the second quarter of 2020 through the second quarter of 2021, our board of directors suspended our regular quarterly dividends on our Class A and Class B common and exchangeable shares. A quarterly dividend was reinstated in the third quarter of 2021.
Revitalization Plan
On October 28, 2019, we initiated a revitalization plan designed to allow us to invest across our portfolio to drive long-term, sustainable success. The revitalization plan established Chicago, Illinois as our Americas segment operational headquarters. We closed our office in Denver, Colorado and consolidated certain administrative functions into our other existing office locations. As of January 1, 2020, we changed our name to Molson Coors Beverage Company and changed our management structure to 2 segments - Americas and EMEA&APAC. We began to incur charges related to these restructuring activities during the fourth quarter of 2019 and we recognized severance and retention charges of $4.0 million, $35.6 million and $41.2 million during the years ended December 31, 2021, December 31, 2020 and December 31, 2019, respectively. As of December 31, 2021, the revitalization plan restructuring charges were substantially complete.
Principles of Consolidation
Our consolidated financial statements include our accounts and our majority-owned and controlled domestic and foreign subsidiaries, as well as certain VIEs for which we are the primary beneficiary. All intercompany accounts and transactions have been eliminated in consolidation.
Use of Estimates
Our consolidated financial statements are prepared in accordance with U.S. GAAP. These accounting principles require us to make certain estimates, judgments and assumptions. We believe that the estimates, judgments and assumptions used to determine certain amounts that affect the financial statements are reasonable, based on information available at the time they are made. To the extent there are differences between these estimates and actual results, our consolidated financial statements may be materially affected.
Acquisition
On August 7, 2023, we acquired a 75% equity interest in Blue Run, a U.S. based high end whiskey business, for a purchase price of $77 million, which included cash paid of $64 million. The acquisition is aligned with our strategy to expand beyond the beer aisle and enhance our presence in the spirits category.
The acquisition was accounted for as a business combination, with $88 million allocated to a definite-lived brand intangible asset to be amortized over a 15-year period and the remainder primarily allocated to other working capital balances and goodwill for the amount in excess of the net identifiable assets acquired. A noncontrolling interest was recognized at fair value based on a Monte Carlo simulation model and is recorded as redeemable noncontrolling interest in the consolidated balance sheets based on the contractual terms of the agreement. Pro forma results of operations have not been presented as the impact is not material to our results of operation or financial position.
Supplier Financing
We are the buyer under a supplier finance program with Citibank N.A. ("Citi" or "the bank"), with $147.5 million and $135.2 million confirmed as valid and outstanding for the years ended December 31, 2023 and December 31, 2022, respectively. We recognize these unpaid balances in accounts payable and other current liabilities on our consolidated balance sheets. Under the program, we agree to pay the bank the stated amount of confirmed invoices from our designated suppliers on the original maturity dates of the invoices. We have no involvement in establishing the terms or conditions of the arrangement between the suppliers and the bank and do not participate in such transactions. Either Citi or us may terminate the agreement upon at least 30 days written notice. We do not provide secured legal assets or other forms of guarantees under the arrangement. Our current payment terms with the majority of the suppliers participating in the supplier finance program generally range from 60 to 120 days, which we deem to be commercially reasonable.
Government Assistance
We receive government assistance in the form of tax credits and grants, including tax credits from government agencies in certain jurisdictions around job creation and retention, as well as capital investment initiatives. This includes, but is not limited to, refundable and non-refundable property and income tax credits in various state and other local jurisdictions. We recognize amounts received from government assistance programs, including non income tax credits and grants, as a reduction to MG&A expenses in our consolidated financial statements, when it is probable we will receive the funds and have met the conditions, if any, required by the government assistance program. If we receive the government assistance at a point in time for services to be completed over time, the cash received is initially recorded in our consolidated balance sheets as other liabilities, and amortized as an offset to MG&A expenses over the service period of the agreement. No programs are individually material nor are the programs material in the aggregate.
Revenue Recognition
Our net sales represent the sale of beer, malt beverages and other adjacencies, net of excise tax. Sales are stated net of incentives, discounts and returns. Sales of products are for cash or otherwise agreed upon credit terms. Our payment terms vary by location and customer, however, the time period between when revenue is recognized and when payment is due is not significant. Our revenue generating activities have a single performance obligation and are recognized at the point in time when control transfers and our obligation has been fulfilled, which is when the related goods are shipped or delivered to the customer, depending upon the method of distribution and shipping terms. Where our products are sold under consignment arrangements, revenue is not recognized until control has transferred, which is when the product is sold to the end customer. Revenue is measured as the amount of consideration we expect to receive in exchange for the sale of our product. The cost of various programs, such as price promotions, rebates and coupons, are treated as a reduction of sales. In certain of our markets where
legally permitted, we make cash payments to customers such as slotting or listing fees, or payments for other marketing or promotional activities. These cash payments are recorded as a reduction of revenue unless we receive a distinct good or service. Specifically, a good or service is considered distinct when it is separately identifiable from other promises in the contract, we receive a benefit from the good or service and the benefit is separable from the sale of our product to the customer.
Certain payments made to customers are conditional on the achievement of volume targets, marketing commitments or both. If paid in advance, we record such payments as prepayments and amortize them over the relevant period to which the customer commitment is made (generally up to five years). When the payment is not for a distinct good or service, or fair value cannot be reasonably estimated, the amortization of the prepayment or the cost as incurred is recorded as a reduction of revenue. Where a distinct good or service is received and fair value can be reasonably estimated, the cost is included as marketing, general and administrativeMG&A expenses. The amounts deferred are reassessed regularly for recoverability over the contract period and are impaired where there is objective evidence that the benefits will not be realized or the asset is otherwise not recoverable. Separately, as discussed below, we analyze whether these advance payments contain a significant financing component for potential adjustment to the transaction price.
Our primary revenue generating activity represents the sale of beer and other malt beverages to customers, including both domestic and exported product sales. Our customer could be a distributor, retail or on-premise outlet, depending on the market. The majority of our revenues are generated from brands that we own and brew ourselves,ourselves; however, we also import or brew and sell certain non-owned partner brands under licensing and related arrangements. In addition, primarily in the U.K., we sell other beverage companies' products to on-premise customers to provide them with a full range of products for their retail outlets. We refer to this as the "factored brand business." Sales from this business are included in our net sales and cost of goods sold when ultimately sold. In the factored brand business, we normally purchase inventory, which includes excise taxes charged by the vendor, take orders from customers for such brands, negotiate with the customers on pricing and invoice customers for the product and related costs of delivery. In addition, we incur the risk of loss at timeswhen we are in possession of the inventory and for the receivables due from the customers. Revenues for owned brands, partner and imported brands, as well as factored brands are recognized at the point in time when control is transferred to the customer as discussed above.
Other Revenue Generating Activities
We contract manufacture for other brewers in some of our markets. These contractual agreements require us to brew, package and ship certain brands tofor these brewers, who then sell the products to their own customers in their respective markets. Revenues under contract brewing arrangements are recognized when our obligation related to the finished product is fulfilled and control of the product transfers to these other brewers.
We also have licensing agreements with third party partners who brew and distribute our products in various markets across our segments. Under these agreements, we are compensated based on the amount of products sold by our partners in these markets at an agreed upon royalty rate or profit percentage. We apply the sales-based royalty practical expedient to these licensing arrangements and recognize revenue as product is sold by our partners at the agreed upon rate.
Disaggregation of Revenue
We have evaluated our primary revenue generating activities under the disaggregation disclosure criteria outlined within the guidance and concluded that disclosure at the geographical segment level depicts how the nature, amount, timing and uncertainty of revenues and cash flows are affected by economic factors. We have also evaluated our other revenue generating activities and concluded that these activities are immaterialnot material for separate disclosure. See Note 3,18, "Segment Reporting," for disclosure of revenues by geographic segment. Variable Consideration
Our revenue generating activities include variable consideration which is recorded as a reduction of the transaction price based upon expected amounts at the time revenue for the corresponding product sale is recognized. For example, customer promotional discount programs are entered into with certain distributors for certain periods of time. The amount ultimately reimbursed to distributors is determined based upon agreed-upon promotional discounts which are applied to distributors' sales to retailers. Other common forms of variable consideration include volume rebates for meeting established sales targets, and coupons and mail-in rebates offered to the end consumer. The determination of the reduction of the transaction price for variable consideration requires that we make certain estimates and assumptions that affect the timing and amounts of revenue and liabilities recorded. We estimate this variable consideration, including analyzing for a potential constraint on variable consideration, by taking into account factors such as the nature of the promotional activity, historical information and current trends, availability of actual results and expectations of customer and consumer behavior.
We do not have standard terms that permit return of product; however, in certain markets where returns occur we estimate the amount of returns as variable consideration based on factors including historical return experience and adjust our revenue
accordingly. Products that do not meet our high quality standards are returned by the customer or recalled and destroyed and are recorded as a reduction of revenue. The reversal of revenue is recorded upon determination that the product will be recalled and destroyed. We estimate the costs required to facilitate product returns and record them in cost of goods sold as required.
For the years ended December 31, 20212023, 2022 and December 31, 2020,2021, adjustments to revenue from performance obligations satisfied in the prior period due to changes in estimates in variable consideration were immaterial.
Significant Financing Component and Costs to Obtain Contracts
In certain of our businesses where such practices are legally permitted, we make loans or advanced payments to retail outlets that sell our brands. For arrangements that do not span greater than one year, we apply the practical expedient available under ASC 606 and do not adjust the transaction price for the effects of a potential significant financing component. We further analyze arrangements that span greater than one year on an ongoing basis to determine whether a significant financing component exists. No such arrangements existed duringDuring the years ended December 31, 2023, 2022 and 2021 or December 31, 2020.no arrangements were individually material nor material in the aggregate.
Advance payments to customers, where legally permitted, are deferred and amortized as a reduction to revenue over the expected period of benefit and tested for recoverability as appropriate. All other costs to obtain and fulfill contracts are expensed as incurred based on the nature, significance and expected benefit of these costs relative to the contract.
Contract Assets and Liabilities
We continually evaluate whether our revenue generating activities and advanced payment arrangements with customers result in the recognition of contract assets or liabilities. No such assets or liabilities existed as of December 31, 20212023 or December 31, 2020.2022. Separately, trade accounts receivable,receivables, net including affiliate receivables, approximates receivables from contracts with customers.
Shipping and Handling
Freight costs billed to customers for shipping and handling are recorded as revenue. Shipping and handling expense related to costs incurred to deliver product are recognized within cost of goods sold. We account for shipping and handling activities that occur after control has transferred as a fulfillment cost as opposed to a separate performance obligation, and the costs of shipping and handling are recognized concurrently with the related revenue.
Excise Taxes
Excise taxes remitted to tax authorities are government-imposed excise taxes on beer. Excise taxes are shown in a separate line item in the consolidated statements of operations as a reduction of sales. ExciseIn the consolidated balance sheets, excise taxes are generally recognized as a current liability within accounts payable and other current liabilities, on the consolidated balance sheets, with the liability subsequently reduced when the taxes are remitted to the tax authority. In cases where excise taxes are prepaid, they are recorded within other current assets, net.
Cost of Goods Sold
Our cost of goods sold includes costs we incur to make and ship beer and other malt beverages. These costs include brewing materials, such as barley, hops and various grains. Packaging materials, such asincluding aluminum, glass bottles, aluminum cans, cardboard and paperboard are also included in our cost of goods sold. Additionally, our cost of goods sold includecontains manufacturing expenses including both direct and indirect labor, shipping and handling including freight costs, utilities, maintenance costs, warehousing costs, purchasing and receiving costs, depreciation, promotional packaging, other manufacturing overheads and costs to purchase factored and other non-owned brands from suppliers, as well as the estimated cost to facilitate product returns.
Marketing, General and Administrative Expenses
Our marketing, general and administrativeMG&A expenses include marketing expenses, including the direct costs related to the selling of a product or brand, media advertising (television, radio, digital, print), tactical advertising (signs, banners, point-of-sale materials) and promotion costs on both local and national levels within our operating segments.levels. The creative portion of our advertising activities is expensed as incurred. Production costs of advertising and promotional materials are recorded as a prepaid asset and expensed when the advertising is first run. Included in marketing, general and administrative expensesMG&A is total marketing and advertising expenses which were approximately $1.1 billion, $0.9$1.0 billion and $1.2$1.1 billion infor the years ended December 31, 2023, 2022 and 2021, 2020 and 2019, respectively. Marketing, general and administrative expenses also included integration costs of $25 million in 2019. There were no integration costs recorded in 2021 or 2020 as the activity related to the acquisition of the remaining portion of MillerCoors, which occurred on October 11, 2016 (the "Acquisition"), was completed by the end of 2019.
This classification also includes general and administrative costs for functions such as finance, legal, human resources and information technology, along with integration costs as noted above.technology. These costs primarily consist of laborcompensation, benefits and outside services, as well as bad debt expense related to our allowance for doubtful accounts. Unless capitalization is allowed or required
by U.S. GAAP, legal costs are expensed when incurred. These costs also include our marketing and sales organizations, including laborcompensation, benefits and other overheads.overheads, including travel and entertainment expenses. This line item additionally includes amortization costs associated with definite-lived intangible assets, as well as certain depreciation costs related to non-production equipment and share-based compensation.
Share-based compensation is recognized using a straight-line method over the vesting period of the awards. We include estimated forfeitures expected to occur when calculating share-based compensation expense. Our share-based compensation plan and the awards within it contain provisions that accelerate vesting of awards upon change in control, retirement, disability or death of eligible employees and directors. Our share-based awards are considered vested when the employee's retention of the award is no longer contingent on providing service, which for certain awards can result in immediate recognition for awards granted to retirement-eligible individuals or accelerated recognition for awards granted to individuals that will become retirement eligible within the stated vesting period. Also, if less than the stated vesting period, we recognize these costs over the period from the grant date to the date retirement eligibility is achieved.
Special Items,Other Operating Income (Expense), net
Our specialother operating income (expense), net items represent charges incurred or benefits realized that either we do not believe to be indicative of our core operations, or we believe are significant to our current operating results warranting separate classification; specifically, such items are considered to be one of the following:
•infrequent or unusual items,
•impairment orrestructuring charges, including certain employee-related charges, asset abandonment-related losses,
•restructuring charges and other atypical employee-related costs, or
•fees on termination of significant operating agreements and other related exit or disposal charges;
•intangible and tangible asset impairments, excluding goodwill;
•gains and (losses) on disposal of investments.investments; and
The•other significant items deemed to warrant separate classification within operating income
These items classified as special itemsother operating income (expense) are not necessarily non-recurring, however, they are generally deemed to be incremental to income earned or costs incurred by us in conducting normal operations, and therefore are presented separately from other componentsoperations.
Interest Expense, net
Our interest costs are associated with borrowings to finance our operations and acquisitions. Interest earned on our cash and cash equivalents across our business is recorded as interest income.
We capitalize interest cost as a part of the original cost of acquiring certain fixed assets if the cost of the capital expenditure and the expected time to complete the project are considered significant.
Other Non-Operating Income (Expense), net
Our other non-operating income (expense), net classification primarily includes gains and losses associated with activities not directly related to our operations. For instance, aggregate unrealized and realized foreign exchange gains and losses resulting from the remeasurement and settlement of foreign-denominated monetary assets and liabilities, as well as certain gains or losses on sales of non-operating assets and the mark-to-market activity associated with warrantscertain equity securities and other equity securitiesinvestments are classified in this line item. These gains and losses are reported in the operating segment in which they occur; however, foreign exchange gains and losses on intercompany balances and realized and unrealized changes in fair value on instruments not designated in hedging relationships related to financing and other treasury-related activities remain unallocated. The initial recording of foreign-denominated transactions are classified based on the nature of the transaction, with the unrealized or realized foreign exchange gains or losses resulting from the subsequent remeasurement of the monetary asset or liability, and its ultimate settlement, classified in other non-operating income (expense)., net.
Income Taxes
Deferred income taxes are provided for the temporary differences between the financial reporting basis and the tax basis of our assets, liabilities and certain unrecognized gains and losses recorded in accumulated other comprehensive income (loss).AOCI. We apply the intraperiod tax allocation rules to allocate our provision for income taxes between continuing operations and other categories of earnings, such as other comprehensive income (loss),OCI, when we meet the criteria prescribed by U.S. GAAP.
When cash is available after satisfying working capital needs and all other business obligations, we may distribute such cash from a foreign subsidiary to its U.S. parent and record the tax impact associated with the distribution. However, to the extent current earnings of our foreign operations exist and are not otherwise distributed or planned to be distributed, such earnings accumulate. These accumulated earnings are considered permanently reinvested in our foreign operations. We currently would not expect the aggregate of these permanently reinvested earnings, which are largely in deficit positions for U.S. tax purposes, to result in any material U.S. taxes, if distributed.
The tax benefit from an uncertain tax position is recognized only if it is determined that the tax position will more likely than not be sustained based on its technical merits. We measure and record the tax benefits from such a position based on the largest benefit that has a greater than 50% likelihood of being realized upon ultimate settlement. Interest, penalties and offsetting positions related to unrecognized tax benefits are recognized as a component of income tax expense.expense with interest and penalties being recorded to income tax benefit (expense) in our consolidated statement of operations. We record a valuation allowance to reduce our deferred tax assets to the amount that is more likely than not to be realized.
Other Comprehensive Income (Loss)
OCI represents income and losses for the reporting period, including the related tax impacts, which are excluded from net income (loss) and recognized directly within AOCI as a component of equity. OCI also includes amounts reclassified to incomethe consolidated statement of operations during the reporting period that were previously recognized within AOCI. Amounts remaining within AOCI are expected to be reclassified out of AOCI in the future, at which point they will be recognized within the consolidated statement of operations as a component of net income (loss). We recognize OCI related to the translation of assets and liabilities of our foreign subsidiaries which are denominated in currencies other than the USD, unrealized gains and losses on the effective portion of our derivatives designated in cash flow hedging relationships and derivative and non-derivative instruments designated in net investment hedging relationships, actuarial gains and losses and prior service costs related to our pension and other post-retirement benefit plans, as well as our proportionate share of our equity method investments' OCI. Additionally, when we do not have the expectation or intent to cash settle certain of our intercompany note receivable and note payable positions in the foreseeable future, the remeasurement of these instruments is recorded as a component of foreign currency translation adjustments within OCI. We release stranded tax effects from AOCI using either a specific identification approach or portfolio approach based on the nature of the underlying item.
Earnings Per Share
Basic EPS wasis computed using the weighted-average number of shares of common stock outstanding during the period. Diluted EPS includes the additional dilutive effect of our potentially dilutive securities, which include RSUs, DSUs, PSUs and stock options. The dilutive effects of our potentially dilutive securities are calculated using the treasury stock method. Our calculation of weighted-average shares includes Class A common stock and Class B common stock and Class A exchangeable shares and Class B exchangeable shares. All classes of stock have in effect the same dividend rights and share equitably in undistributed earnings. Holders of Class A common stock receive dividends only to the extent dividends are declared and paid to holders of Class B common stock. See Note 8,14, "Stockholders' Equity" for further discussion of the Class A common stock and Class B common stock and Class A exchangeable shares and Class B exchangeable shares. We have no unvested outstanding equity share awards that contain non-forfeitable rights to dividends.
Dividends per share paid to shareholders were $0.68, $0.57 and $1.96 duringAnti-dilutive securities excluded from the computation of diluted EPS for the years ended December 31, 2023, December 31, 2022 and December 31, 2021 2020were 0.6 million, 3.1 million and 2019,1.8 million shares, respectively. In response to the global economic uncertainty created by the coronavirus pandemic, our Board of Directors suspended our regular quarterly dividend on our Class A and Class B common and exchangeable shares in May 2020. A quarterly dividend was reinstated during the third quarter of 2021.
Cash and Cash Equivalents
Cash consists of cash on hand and bank deposits. Cash equivalents represent highly liquid investments with original maturities of three months or less. Our cash deposits are maintained with multiple, reputable financial institutions.
Dividends
On November 9, 2023, the Board declared a cash dividend of $0.41 per share, paid on December 15, 2023, to shareholders of Class A and Class B common stock of record on December 1, 2023. Shareholders of exchangeable shares received the CAD equivalent of dividends declared on Class A and Class B common stock, equal to CAD 0.56 per share.
During the year ended December 31, 2023, dividends declared to eligible shareholders totaled $1.64 per share, with the CAD equivalent totaling CAD 2.19 per share. During the year ended December 31, 2022, dividends declared to eligible shareholders totaled $1.52 per share, with the CAD equivalent totaling CAD 1.95 per share.
In response to the global economic uncertainty created by the coronavirus pandemic, the Board suspended our regular quarterly dividend on our Class A and Class B common and exchangeable shares in May 2020. A quarterly dividend was reinstated during the third quarter of 2021. During the year ended December 31, 2021, dividends declared to eligible shareholders totaled $0.68 per share, with the CAD equivalent totaling CAD 0.84 per share.
Non-Cash Activity
Non-cash activity includes non-cash issuances of share-based awards, as well as non-cash investing activities related toincludes movements in our guarantee of indebtedness of certain equity method investments.investments.. See Note 4,3, "Investments" and Note 13, "Share-Based Payments" for further discussion. We also had other non-cash activities related to capital expenditures incurred but not yet paid of $254.9 million, $234.3 million and $206.6 million $171.9 millionduring the years ended December 31, 2023, 2022 and $214.9 million during 2021, 2020 and 2019, respectively. In addition, we had non-cash activities related to our non-cash issuances of share-based awards. See Note 16, "Share-Based Payments" for further details. In June 2021, we rolled forward our July 2021 $250.0 million forward starting interest rate swap to May 2022 through a cashless settlement. The unrealized loss on the 2021 forward starting interest rate swap at the time of the transaction was factored into the effective interest rate assigned to the new May 2022 forward starting interest rate swap. See Note 16,10, "Derivative Instruments and Hedging Activities" for further details. During the first quarter of 2022, we recorded a non-cash transaction related to the establishment of an accrued liability of $56.0 million as the best estimate of the probable loss in the Keystone litigation case based on the jury verdict. During the years ended December 31, 2023 and 2022, we recorded non-cash transactions of $1.9 million and $0.6 million, respectively, in accrued interest associated with this accrued liability. See Note 13, "Commitments and Contingencies" for further details. Other than the activity mentioned above and the supplemental non-cash activity related to the recognition of leases discussed in Note 19,8, "Leases," there was no other significant non-cash activity in 2021, 2020for the years ended December 31, 2023, 2022 and 2019.2021.
Accounts Receivable and Notes ReceivableTrade Receivables
We record accounts and notes receivabletrade receivables at net realizable value. This carrying value includes an appropriate allowance for estimated uncollectible amounts to reflect any loss anticipated on the accounts and notestrade receivable balances. We calculate this allowance based on our country-specific history of write-offs, level of past-due accounts based on the contractual terms of the receivables and our relationships with and the economic status of our customers, which may be impacted by current macroeconomic and regulatory factors specific to the country of origin. This methodology takes into consideration historical loss experience and current and forecasted changes in cash flows based on internal and external information.
In the U.K., loans are extended to a portion of the retail outlets that sell our brands. We establish an allowance through a provision for loan losses charged against earnings and recorded in marketing, general and administrative expenses. Loan balances that are written off are recorded against the allowance as a write-off. Activity within the The allowance for credit lossesdoubtful accounts was immaterial for fiscal years 2021, 2020$12.7 million and 2019.$13.2 million as of December 31, 2023, and December 31, 2022, respectively.
Inventories
Inventories are stated at the lower of cost or net realizable value. Cost is determined by the first-in, first-out ("FIFO") method. We regularly assess the shelf-life of our inventories and reserve for those inventories when it becomes apparentprobable the product will not be sold within our freshness specifications. In addition, we reserve for those inventories associated with discontinued SKUs or seasonal or other packaging material changes.
Other current assetsCurrent Assets
Other current assets include prepaid assets, maintenance and operating supplies, promotion materials and derivative assets that are expected to be recognized or realized within the next 12 months. Maintenance and operating supplies include our inventories of spare parts, which are kept on hand for repairs and maintenance of machinery and equipment. The majority of spare parts within our business include motors, fillers and other components that are required to maintain a normal level of production in the event that expected maintenance and/or repairs are required. These parts are inventoried within current assets as they are reasonably expected to be used during the normal operating cycle of the business and are reserved for excess and obsolescence, as appropriate. The allowance for obsolete supplies was $18.3 million
Property, Plant and $16.4 million as of December 31, 2021,Equipment
Property, plant and December 31, 2020, respectively.
Properties
Properties areequipment is stated at original cost less accumulated depreciation. Depreciation is recorded using the straight-line method over the estimated useful lives of the assets, which are reviewed periodically and have the following ranges: buildings and improvements: 20-40 years; machineryproduction and equipment:office equipment 3-25 years; furniture and fixtures: 3-10 years; returnable containers: 2-15 years; and software: 3-5 years. Land is not depreciated and construction in progress is not depreciated until ready for service. Costs of enhancements or modifications that substantially extend the capacity or useful life of an asset are capitalized and depreciated accordingly. Ordinary repairs and maintenance are expensed as incurred. When property, plant and equipment is sold or otherwise disposed of, the cost and accumulated depreciation are removed from our consolidated balance sheets and the resulting gain or loss, if any, is reflected in our consolidated statements of operations. Long-lived assets are evaluated for impairment whenever events or changes in circumstances indicate the carrying value of an asset (or asset group) may not be recoverable. Our asset groups are generally identified at the segment level with the exception of certain craft breweries or other locations which may operate on a more stand-alone basis, such as our Truss LP joint venture. During the year ended December 31, 2021, we did not identify any triggering events related to our asset groups which required performance of an impairment test.basis.
Returnable containers are recorded at acquisition cost and consist of returnable bottles, kegs, pallets and crates that are both in our direct control within our breweries, warehouses and distribution facilities and those that we indirectly control in the market through our agreements with our customers and other brewers and for which a deposit is received. The deposits received on our returnable containers in the market are recorded as deposit liabilities, included as current liabilities within accounts payable and other current liabilities in the consolidated balance sheets. We estimate that the loss, breakage and deterioration of our returnable containers is comparable to the depreciation calculated on an estimated useful life of up to 4 years for bottles, 5 years for pallets, 7 years for crates and 15 years for returnable kegs. We also own and maintain other equipment in the market related to delivery of our products to end consumers, for example on-premise dispense equipment and refrigeration units. This equipment is recorded at acquisition cost and depreciated over lives of up to 7 years, depending on the market, reflecting the use of the equipment, as well as the loss and deterioration of the asset.
The costs of acquiring or developing internal-use computer software, including directly-related payroll costs for internal resources, are capitalized and classified within properties.property, plant and equipment. Software maintenance and training costs are expensed in the period incurred. Implementation costs incurred in hosting arrangements that are service contracts are capitalized within other assets
Property, plant and are immaterial.
Propertiesequipment held under finance lease are depreciated using the straight-line method over the estimated useful life or the lease term, whichever is shorter, and the related depreciation is included in depreciation expense.shorter. Finance lease assets for which ownership is transferred at the end of the lease, or there is a purchase option that we are reasonably certain to exercise, are amortizeddepreciated over the useful life that would be assigned if the asset were owned.
Cloud Computing Arrangements
Cloud computing arrangement implementation costs incurred in hosting arrangements that are service contracts are recorded within other assets in the consolidated balance sheets. Capitalized cloud computing arrangement implementation costs are amortized using the straight-line method over the remaining term of the contract. Amortization expense was $7.9 million, $6.2 million and $5.2 million for the years ended December 31, 2023, December 31, 2022 and December 31, 2021, respectively.
The following table presents the gross and net value of capitalized cloud computing implementation costs associated with active hosting arrangements.
| | | | | | | | | | | |
| As of |
| December 31, 2023 | | December 31, 2022 |
| (In millions) |
| Cloud computing implementation costs | $ | 56.5 | | | $ | 38.5 | |
| Less: accumulated amortization | (20.8) | | | (12.9) | |
| Cloud computing implementation costs, net | $ | 35.7 | | | $ | 25.6 | |
| | | |
| | | |
| | | |
| | | |
Goodwill and Other Intangible Assets
Goodwill is allocated to the reporting unit in which the business that created the goodwill resides. A reporting unit is an operating segment, or a business unit one level below that operating segment, for which discrete financial information is prepared and regularly reviewed by segment management. As of the date of the completion of our 20212023 impairment testing, we have concluded that we have 2two reporting units, Americas and EMEA&APAC. See further discussion in Note 10,6, "Goodwill and Intangibles." As required, we evaluate the carrying value of our goodwill at the reporting unit level and indefinite-lived intangible assets for impairment at the reporting unit level at least annually or when an interim triggering event occurs that wouldmay indicate that impairment may have taken place.potential impairment. Our annual test is performed as of the first day of our fiscal fourth quarter. quarter, October 1. The testing of goodwill and indefinite-lived intangible assets uses estimates and assumptions affected by factors such as economic and industry conditions along with changes in operating performance. The evaluation involves comparing the reporting unit or indefinite-lived intangible asset's fair value to its carrying value. If the fair value exceeds its respective carrying value, then we conclude that no impairment has occurred. If the carrying value exceeds its fair value, we would recognize an impairment loss in an amount equal to the excess up to the total amount of goodwill allocated to that reporting unit or balance of the respective indefinite-lived intangible asset.
We continuously monitor the performance of our other definite-lived intangible assets and evaluate for impairment when evidence exists that certain triggering events or changes in circumstances indicate that the carrying amount of these assets may not be recoverable. Significant judgments and assumptions are required in such impairment evaluations. Definite-lived intangible assets are stated at cost less accumulated amortization. Amortization is recorded using the straight-line method over the estimated lives of the assets as this approximates the pattern in which the assets economic benefits are consumed.
Goodwill impairments are recorded to the Goodwill impairment line item on the consolidated statement of operations whereas impairments of intangible assets are recorded in the "Other operating income (expense), net" line item.
Equity Method Investments
We apply the equity method of accounting to 20% to 50% owned investments that we do not control but where we exercise significant influence or VIEs for which we are not the primary beneficiary. We use the cumulative earnings approach for determining cash flow presentation of cash distributions received from equity method investments. Distributions received are included in our consolidated statements of cash flows as operating activities, unless the cumulative distributions exceed our portion of the cumulative equity in the net earnings of the equity method investment, in which case the excess distributions are deemed to be returns of the investment and are classified as investing activities in our consolidated statements of cash flows. See Note 4,3, "Investments" for further information regarding our equity method investments. There are no related parties that own interests in our equity method investments as of December 31, 2021.2023.
Derivative Hedging Instruments
We use derivatives as part of our normal business operations to manage our exposure to fluctuations in interest rates, foreign currency exchange, commodity prices, production and packaging material costs and for other strategic purposes related to our core business. We enter into derivatives for risk management purposes only, including derivatives designated in hedge accounting relationships as well as those derivatives utilized as economic hedges. We do not enter into derivatives for trading or speculative purposes. We recognize our derivatives on the consolidated balance sheets as assets or liabilities at fair value and are classifiedclassify them in either current or non-current assets or liabilities based on each contract's respective unrealized gain or loss position and each contract's respective maturity. OurConsistent with our policy, is to present all derivative balances on a gross basis, without regard to counterparty master netting agreements or similar arrangements. Further, our current derivative agreements do not allow us to net positions with the same counterparty and therefore, we present our derivative positions gross in our consolidated balance sheets.
Changes in fair values of outstanding cash flow and net investment hedges are recorded in OCI, until earnings are affected by the variability of cash flows of the underlying hedged item or the sale of the underlying net investment, respectively. Effective cash flow hedges offset the gains or losses recognized on the underlying exposure in the consolidated statements of operations, or for net investment hedges, the foreign exchange translation gain or loss recognized in AOCI. Changes in fair value of outstanding fair value hedges and the offsetting changes in fair value of the hedged item are recognized in earnings. Changes in fair value of the derivative attributable to components allowed to be excluded from the assessment of hedge effectiveness are deferred in AOCI and recognized in earnings over the life of the hedge.
We record realized gains and losses from derivative instruments in the same financial statement line item as the hedged item/forecasted transaction. Changes in unrealized gains and losses for derivatives not designated in a hedge accounting relationship are recorded directly in earnings each period and are also recorded in the same financial statement line item as the hedged item/forecasted transaction. Cash flows from the settlement of derivatives, including both economic hedges and those designated in hedge accounting relationships, appear in the consolidated statements of cash flows in the same categories as the cash flows of the hedged item unless the instruments are deemed to contain an other-than-insignificant financing element, in which case the cash flows related to this instrument will be classified as financing activities.
In accordance with authoritative accounting guidance, we do not record the fair value of derivatives for which we have elected the Normal Purchase Normal Sale ("NPNS") exemption. We account for these contracts on an accrual basis, recording realized settlements related to these contracts in the same financial statement line items as the corresponding transaction.
Leases
We account for leases in accordance with Accounting Standards Codification (“ASC”) Topic 842, Leases, which we adopted on January 1, 2019, electing not to adjust comparative periods presented and applying a modified retrospective transition approach as of the effective date of adoption.
We enter into contractual arrangements for the utilization of certain non-owned assets, primarily real estate and equipment, which are evaluated as finance or operating leases upon commencement and are accounted for accordingly. Specifically, under ASC 842, a contract is or contains a lease when, (1) the contract contains an explicitly or implicitly identified asset and (2) the customer obtains substantially all of the economic benefits from the use of that underlying asset and directs how and for what purpose the asset is used during the term of the contract in exchange for consideration. We assess whether an arrangement is or contains a lease at inception of the contract. For all contractual arrangements deemed to be leases (other than short-term leases)leases, which have a duration of one year or less), as of the lease commencement date, we recognize on the consolidated balance sheetsheets a liability for our obligation related to the lease and a corresponding asset representing our right to use the underlying asset over the period of use.
For leases that qualify as short-term leases, we have elected, for all classes of underlying assets, to not apply the balance sheet recognition requirements of ASC 842, and instead, we recognize the lease payments in the consolidated statements of operations on a straight-line basis over the lease term. We have also made the election, for our existing real estate and equipment classes of underlying assets, to account for lease and non-lease components as a single lease component.
Our leases have remaining lease terms of up to approximately 1716 years. Certain of our lease agreements contain options to extend or early terminate the agreement. The lease term used to calculate the right-of-use ("ROU") asset and lease liability at commencement includes the impacts of options to extend or terminate the lease when it is reasonably certain that we will exercise that option. When determining whether it is reasonably certain that we will exercise an option at commencement, we consider various existing economic factors, including real estate strategies, the nature, length and terms of the agreement, as well as the uncertainty of the condition of leased equipment at the end of the lease term. Based on these determinations, we generally conclude that the exercise of renewal options would not be reasonably certain in determining the lease term at commencement. Assumptions made at the commencement date are re-evaluated upon occurrence of certain events requiring a lease modification. Additionally, for certain equipment leases involving groups of similar leased assets with similar lease terms, we apply a portfolio approach to effectively account for the operating lease right-of-use assets and liabilities.
The discount rate used to calculate the present value of the future minimum lease payments is the rate implicit in the lease, when readily determinable. As the rate implicit in the lease is rarely readily determinable, we use our incremental borrowing rate relative to the leased asset in all other cases.
Certain of our leases include variable payments, primarily for items such as property taxes, insurance, maintenance and other operating expenses associated with leased assets. These variable payments are excluded from the measurement of our lease assets and liabilities and are recognized in the period in which the obligation for those payments is incurred. Our lease agreements do not contain any material residual value guarantees or material restrictive covenants.
Lease-related expense is recorded within either cost of goods soldCOGS or marketing, general and administrativeMG&A expenses on the consolidated statements of operations, depending on the function of the underlying leased asset, with the exception of interest on finance lease liabilities, which is recorded within interest expense on the consolidated statements of operations.
Pension and Postretirement Benefits
We maintain retirement plans for the majority of our employees. We offer different types of plans within each segment, including defined benefit plans, defined contribution plans and OPEB plans. Each plan is managed locally and in accordance with respective local laws and regulations. Our equity investments, BRI and BDL, two of our equity method investments, maintain defined benefit, defined contribution and OPEB plans as well.
We recognize the underfunded or overfunded status of a defined benefit postretirementpension and OPEB plan as an asset or liability in the consolidated balance sheets. The funded status of a plan, measured as the difference between the fair value of plan assets and the projected benefit obligation, and the related net periodic pension cost are calculated using a number of significant actuarial assumptions. Changes in net periodic pension cost and funding status may occur in the future due to changes in these assumptions.
We use the fair value approach to calculate the market-related value of pension plan assets used to determine net periodic pension cost, which includes measuring the market-related value of plan assets at fair value for purposes of determining the expected return on plan assets and amount of gain or loss subject to amortization.
Projected benefit obligation is the actuarial present value as of the measurement date of all benefits attributed by the plan benefit formula to employee service rendered before the measurement date using assumptions as to future compensation levels and years of service if the plan benefit formula is based on those future compensation levels and years of service. Accumulated benefit obligation is the actuarial present value of benefits (whether vested or unvested) attributed by the plan benefit formula to employee service rendered before the measurement date and based on employee service and compensation, if applicable, prior to that date. Accumulated benefit obligation differs from projected benefit obligation in that it includes no assumption about future compensation levels and years of service.
We employ the corridor approach for determining each plan's potential amortization from AOCI of deferred gains and losses, which occur when actual experience differs from estimates, into our net periodicother pension and postretirement benefit cost.(benefit) cost, net. This approach defines the "corridor" as the greater of 10% of the projected benefit obligation or 10% of the market-related value of plan assets and requires amortization of the excess net gain or loss that exceeds the corridor over the average remaining service periods of active plan participants. For plans closed to new entrants and the future accrual of benefits, the average remaining life expectancy of all plan participants (including retirees) is used.
Fair Value Measurements
The carrying amounts of our cash and cash equivalents, accounts receivable, accounts payable and other current liabilities approximate fair value as recorded due to the short-term nature of these instruments. In addition, the carrying amounts of our trade loan receivables, net of allowances, approximate fair value. The fair value of derivatives is estimated by discounting the estimated future cash flows utilizing observable market interest, foreign exchange and commodity rates adjusted for non-performance credit risk associated with our counterparties (assets) or with MCBC (liabilities), as appropriate. Additionally, the fair value of warrants is estimated using the Black-Scholes valuation model. See Note 16,10, "Derivative Instruments and Hedging Activities" for additional information. Based on current market rates for similar instruments, the fair value of long-term debt is presented in Note 11,9, "Debt." U.S. GAAP guidance for fair value includes a hierarchy that prioritizes fair value measurements based on the types of inputs used for the various valuation techniques (market approach, income approach and cost approach). Our financial assets and liabilities are measured using inputs from the three levels of the fair value hierarchy.
The three levels of the hierarchy are as follows:
Level 1—Inputs are unadjusted quoted prices in active markets for identical assets or liabilities that we have the ability to access at the measurement date.
Level 2—Inputs include quoted prices for similar assets and liabilities in active markets, quoted prices for identical or similar assets or liabilities in markets that are less active, inputs other than quoted prices that are observable for the asset or liability (i.e., interest rates, yield curves, etc.), and inputs that are derived principally from, or corroborated by, observable market data by correlation or other means (market corroborated inputs).
Level 3—Unobservable inputs that reflect the assumptions that we believe market participants would use in pricing the asset or liability. We develop these inputs based on the best information available, including our own data.
Foreign Currency
Assets and liabilities recorded in foreign currencies that are the functional currencies for the respective operations are translated at the prevailing exchange rate at the balance sheet date. Translation adjustments resulting from this process are reported as a separate component of OCI. Gains and losses from foreign currency transactions are included in earnings for the period. Revenue and expenses are translated at the average exchange rates during the respective period throughout the year.
Subsequent Events
On February 22, 2022, the13, 2024, our Company's Board of Directors declared a quarterly dividend of $0.38$0.44 per share.
On February 17, 2022, the Boardshare, to be paid on March 15, 2024, to shareholders of Directors approved a share repurchase program up to an aggregate of $200 million of our Company'sClass A and Class B common stock throughof record on March 31, 2026, with repurchases primarily intended to offset annual employee equity award grants.1, 2024. Shareholders of exchangeable shares will receive the CAD equivalent of dividends declared on Class A and Class B common stock.
2. New Accounting Pronouncements
New Accounting Pronouncements Recently Adopted
In December 2019, the FASB issued authoritative guidance intended to simplify the accounting for income taxes. This guidance eliminated certain exceptions to the general approach to the income tax accounting model and added new guidance to reduce the complexity in accounting for income taxes. We adopted this guidance in the first quarter of 2021, which did not have a material impact on our financial statements.
In March 2020, the FASB issued authoritative guidance which provides optional expedients and exceptions for applying U.S. GAAP to contracts, hedging relationships and other transactions affected by reference rate reform if certain criteria are met. The amendments apply only to contracts, hedging relationships and other transactions that reference LIBOR or another reference rate expected to be discontinued because of reference rate reform and arewas effective for all entities upon issuance on March 12, 2020 and remains effective through December 31, 2022.2024. The guidance permits a company to elect certain optional expedients and exceptions when affected by the changes in reference rate reform. We have adopted this guidance and elected to adoptapply certain optional expedients impactingrelated to our derivative instruments with maturity dates extending beyond the expected discontinuance date of LIBOR. In addition,Specifically, in October 2021,May 2023, we amended our revolving credit facility2026 forward starting interest rate swaps to replace LIBOR with designated replacement ratesSOFR and applied the optional expedients to account for any future borrowings denominated in EUR or GBP. The adoption of, and future elections under Accounting Standard Update ("ASU") 2020-04, Reference Rate Reform (Topic 848): Facilitationthe transition. None of the Effectschanges made as a result of Reference Rate Reform on Financial Reporting, and ASU 2021-01, Reference Rate Reform (Topic 848): Scope, did not and are not expected to havereference rate reform had a material impact on our accounting policies or consolidated financial statements. We will continue to evaluate the impact of reference rate reform on our other contracts and assess the impacts of adopting incremental portions of this guidance on our financial statements.
New Accounting Pronouncements Not Yet Adopted
In November 2021,September 2022, the FASB issued authoritative guidance intended to provide consistent and transparent disclosures around government assistancefor a buyer in a supplier finance program by requiring disclosures of key program terms, the typeamount of government assistance,obligations that have been confirmed as valid with the finance provider that are deemed outstanding as of the end of the period, a description of the financial line item in which this unpaid balance resides and a rollforward of the obligations including the amount of obligations confirmed and paid. We adopted this guidance, with the exception of the rollforward disclosure requirement, starting with our accountingquarterly report for the government assistancethree months ended March 31, 2023. See Note 1, "Basis of Presentation and the effectSummary of Significant Accounting Policies" for additional information on our financial statements. This guidancesupplier finance programs. The rollforward disclosure requirement is effective for us in our annual report for the year endedending December 31, 2022.2024 and is required to be applied prospectively. New Accounting Pronouncements Not Yet Adopted
In December 2023, the FASB issued authoritative guidance intended to enhance transparency and decision usefulness of income tax disclosures. The amendments are focused on two specific disclosure areas: the rate reconciliation and income taxes paid. More disaggregated income tax information, particularly at an individual jurisdiction level (country, state or local territory), is required in both disclosures if certain quantitative thresholds are met. The amendments to the rate reconciliation require the use of specific categories, with disclosure of percentages and reporting currency amounts. If not already evident, further explanation of the nature, effect and underlying causes of the reconciling items must be included. The amendments to the income taxes paid disclosure require reporting of net income taxes paid disaggregated by federal (national), state and foreign. This guidance is effective for us starting with our annual report for the year ending December 31, 2025 and the guidance should be applied prospectively. We are permitted to early adopt and can either adoptchoose to apply the guidance retrospectively. When adopted, we expect the guidance to have an impact on disclosures only and to not have a material effect on our financial position or results of operations.
In November 2023, the FASB issued authoritative guidance intended to improve reportable segment disclosures and to enhance disclosures about significant reportable segment expenses. The amendments require additional disclosures for both annual and interim periods including disclosures of significant segment expenses that are regularly provided to the chief operating decision maker ("CODM") and included within each reported measure of segment profit or loss as well as other segment items by reportable segment, among other disclosures. This guidance is effective for us starting with our annual report for the year ending December 31, 2024 and the subsequent interim periods and is required to be applied retrospectively to all prior periods presented. Because the amendments in this guidance prospectivelydo not change the methodology for the identification of operating segments, the aggregation of those operating segments or retrospectively. We are currently evaluating the impactapplication of this guidance andthe quantitative thresholds to determine reportable segments, we do not expect it willthe guidance to have a material impacteffect on our financial statements as the guidance impacts disclosures only.position or results of operations.
Other than the items noted above, there have been no new accounting pronouncements not yet effective or adopted in the current year that we believe have a significant impact, or potential significant impact, to our consolidated financial statements.
3. Segment Reporting
Our reporting segments are based on the key geographic regions in which we operate and include the Americas and EMEA&APAC segments. Our Americas segment operates in the U.S., Canada and various countries in Latin and South America and our EMEA&APAC segment operates in Bulgaria, Croatia, Czech Republic, Hungary, Montenegro, the Republic of Ireland, Romania, Serbia, the U.K., various other European countries and certain countries within the Middle East, Africa and Asia Pacific. We also have certain activity that is not allocated to our segments, which has been reflected as “Unallocated” below.
Reporting Segments
Americas
The Americas segment consists of our production, marketing and sales of our brands and other owned and licensed brands in the U.S., Canada and various countries in Latin and South America. We have contract brewing agreements to brew, package and ship products for Pabst and TYC, and a contract brewing agreement with Labatt USA Operating Co, LLC to brew and package certain Labatt brands for export. We have an agreement with Heineken that grants us the right to import, market, distribute and sell certain Heineken products in Canada.
The Americas segment also includes BRI, our joint venture arrangement related to the distribution and retail sale of beer in Ontario, and BDL, our joint venture arrangement related to the distribution of beer in the western provinces. Additionally, in the third quarter of 2020, we formed TYC, a joint venture equally owned by MCBC and DGY West that, pursuant to an operating agreement, was formed to expand commercialization of Yuengling's brands for any new market expansion outside of Yuengling's then 22-state footprint and New England in the U.S. During the third quarter of 2021, TYC commenced retail operations with its first product sales in the state of Texas. BRI, BDL and TYC are all accounted for as equity method investments.
EMEA&APAC
The EMEA&APAC segment consists of our production, marketing and sales of our brands as well as a number of smaller regional brands in the U.K., Central Europe and various other European countries, along with certain countries within the Middle East, Africa and Asia Pacific. In our EMEA&APAC segment, we also have licensing agreements and distribution agreements with various other brewers.
Unallocated
"Unallocated" activity primarily includes financing-related costs such as interest expense and income, foreign exchange gains and losses on intercompany balances related to financing and other treasury-related activities, and the unrealized changes in fair value on our commodity swaps not designated in hedging relationships recorded within cost of goods sold, which are later reclassified when realized to the segment in which the underlying exposure resides. Additionally, only the service cost component of net periodic pension and OPEB cost is reported within each operating segment and all other components remain unallocated.
Summarized Financial Information
No single customer accounted for more than 10% of our consolidated sales in 2021, 2020 or 2019. Consolidated net sales represent sales to third-party external customers less excise taxes. Inter-segment transactions impacting net sales and income (loss) before income taxes eliminate upon consolidation and are primarily related to the Americas segment sales to, and royalties received from, the EMEA&APAC segment.
The following tables represent consolidated net sales, interest expense, interest income and reconciliations of amounts shown as income (loss) before income taxes to income (loss) attributable to MCBC. Income (loss) before income taxes includes the impact of special items; refer to Note 7, "Special Items" for further discussion. Additionally, integration costs of $25 million were recorded within marketing, general and administrative expenses for 2019, primarily within our Americas segment. No integration costs were recorded in the years ended December 31, 2021 or 2020. | | | | | | | | | | | | | | | | | | | | | | | | | | | | | |
| Year ended December 31, 2021 |
| | Americas | | EMEA&APAC | | Unallocated | | Inter-segment net sales eliminations | | Consolidated |
| | (In millions) |
| Net sales | $ | 8,485.0 | | | $ | 1,802.3 | | | $ | — | | | $ | (7.6) | | | $ | 10,279.7 | |
| Interest expense | (1.4) | | | (5.8) | | | (253.1) | | | — | | | (260.3) | |
| Interest income | — | | | 0.2 | | | 1.8 | | | — | | | 2.0 | |
| Income (loss) before income taxes | $ | 1,176.5 | | | $ | 32.9 | | | $ | 29.6 | | | $ | — | | | $ | 1,239.0 | |
| Income tax benefit (expense) | | | | | | | | | (230.5) | |
| Net income (loss) | | | | | | | | | 1,008.5 | |
| Net (income) loss attributable to noncontrolling interests | | | | | | | | | (2.8) | |
| Net income (loss) attributable to MCBC | | | | | | | | | $ | 1,005.7 | |
| | | | | | | | | | | | | | | | | | | | | | | | | | | | | |
| | Year ended December 31, 2020 |
| | Americas | | EMEA&APAC | | Unallocated | | Inter-segment net sales eliminations | | Consolidated |
| | (In millions) |
| Net sales | $ | 8,237.0 | | | $ | 1,431.9 | | | $ | — | | | $ | (14.9) | | | $ | 9,654.0 | |
| Interest expense | (2.6) | | | (5.7) | | | (266.3) | | | — | | | (274.6) | |
| Interest income | 0.2 | | | 0.3 | | | 2.8 | | | — | | | 3.3 | |
| Income (loss) before income taxes | $ | 1,080.5 | | | $ | (1,603.7) | | | $ | (120.7) | | | $ | — | | | $ | (643.9) | |
| Income tax benefit (expense) | | | | | | | | | (301.8) | |
| Net income (loss) | | | | | | | | | (945.7) | |
| Net (income) loss attributable to noncontrolling interests | | | | | | | | | (3.3) | |
| Net income (loss) attributable to MCBC | | | | | | | | | $ | (949.0) | |
| | | | | | | | | | | | | | | | | | | | | | | | | | | | | |
| | Year ended December 31, 2019 |
| | Americas | | EMEA&APAC | | Unallocated | | Inter-segment net sales eliminations | | Consolidated |
| | (In millions) |
| Net sales | $ | 8,618.2 | | | $ | 1,986.4 | | | $ | — | | | $ | (25.2) | | | $ | 10,579.4 | |
| Interest expense | 2.8 | | | (6.2) | | | (277.5) | | | — | | | (280.9) | |
| Interest income | — | | | 0.5 | | | 7.7 | | | — | | | 8.2 | |
| Income (loss) before income taxes | $ | 645.0 | | | $ | 102.4 | | | $ | (267.5) | | | $ | — | | | $ | 479.9 | |
| Income tax benefit (expense) | | | | | | | | | (233.7) | |
| Net income (loss) | | | | | | | | | 246.2 | |
| Net (income) loss attributable to noncontrolling interests | | | | | | | | | (4.5) | |
| Net income (loss) attributable to MCBC | | | | | | | | | $ | 241.7 | |
The following table presents total assets and select cash flow information by segment.
| | | | | | | | | | | | | | | | | | | | | | | | | | | | | | | | | | | | | | | | | | | | | | | |
| Assets | | Depreciation and amortization | | Capital expenditures |
| | As of December 31, | | For the years ended December 31, | | For the years ended December 31, |
| | 2021 | | 2020 | | 2021 | | 2020 | | 2019 | | 2021 | | 2020 | | 2019 |
| | (In millions) |
| Americas | $ | 23,653.5 | | | $ | 23,375.6 | | | $ | 601.4 | | | $ | 743.0 | | | $ | 676.9 | | | $ | 405.0 | | | $ | 461.4 | | | $ | 450.7 | |
| EMEA&APAC | 3,965.5 | | | 3,955.5 | | | 184.7 | | | 179.0 | | | 182.1 | | | 117.6 | | | 113.4 | | | 143.1 | |
| Consolidated | $ | 27,619.0 | | | $ | 27,331.1 | | | $ | 786.1 | | | $ | 922.0 | | | $ | 859.0 | | | $ | 522.6 | | | $ | 574.8 | | | $ | 593.8 | |
The following table presents net sales by geography, based on the location of the customer.
| | | | | | | | | | | | | | | | | |
| | For the years ended |
| | December 31, 2021 | | December 31, 2020 | | December 31, 2019 |
| | (In millions) |
| Net sales to unaffiliated customers | | | | | |
| United States and its territories | $ | 7,168.7 | | | $ | 7,016.1 | | | $ | 7,244.9 | |
| Canada | 1,188.4 | | | 1,111.6 | | | 1,231.3 | |
| United Kingdom | 959.1 | | | 663.7 | | | 1,119.1 | |
Other foreign countries(1) | 963.5 | | | 862.6 | | | 984.1 | |
| Consolidated net sales | $ | 10,279.7 | | | $ | 9,654.0 | | | $ | 10,579.4 | |
(1)Reflects net sales within certain countries in Europe, Latin America, South America, the Middle East, Africa and Asia. No individual country has total net sales exceeding 10% of the total consolidated net sales.
The following table presents net properties and operating ROU assets by geographic location. See Note 19, "Lease" for further information on our operating ROU assets and Note 9, "Properties" for further information on our net properties. | | | | | | | | | | | |
| | As of |
| | December 31, 2021 | | December 31, 2020 |
| | (In millions) |
| Net properties and operating ROU assets | | | |
| United States and its territories | $ | 2,294.1 | | | $ | 2,457.1 | |
| Canada | 1,114.6 | | | 974.8 | |
| United Kingdom | 383.2 | | | 398.9 | |
Other foreign countries(1) | 519.6 | | | 555.7 | |
| Consolidated net properties and operating ROU assets | $ | 4,311.5 | | | $ | 4,386.5 | |
(1)Reflects net properties and operating ROU assets within certain countries in Europe, Latin America, South America, Africa and Asia. No individual country has total net properties or operating ROU assets exceeding 10% of the total consolidated net properties or operating ROU assets, respectively.
4. Investments
Our investments include both equity method and consolidated investments. Those entities identified as VIEs have been evaluated to determine whether we are the primary beneficiary. The VIEs included under "Consolidated VIEs" below are those for which we have concluded that we are the primary beneficiary and accordingly, we have consolidated these entities. None of our consolidated VIEs held debt as of December 31, 2021 or December 31, 2020. We have not provided any financial support to any of our VIEs during 2021the year ended December 31, 2023 that we were not previously contractually obligated to provide. Amounts due to and due from our equity method investments are recorded as affiliate accounts payable and affiliate accounts receivable.receivable which are presented within accounts payable and other current liabilities and trade receivables, net respectively on the consolidated balance sheets. See below under "Affiliate Transactions" for further details.
Authoritative guidance related to the consolidation of VIEs requires that we continually reassess whether we are the primary beneficiary of VIEs in which we have an interest. As such, the conclusion regarding the primary beneficiary status is subject to change and we continually evaluate circumstances that could require consolidation or deconsolidation. Our consolidated VIEs are Cobra Beer Partnership, Ltd. ("Cobra U.K."), RMMC RMBC and Truss,RMBC, as well as other immaterial entities. Our unconsolidated VIEs are BRI, BDL and TYC, as well as other immaterial investments.
Both BRI and BDL have outstanding third-partythird party debt which is guaranteed by their respective shareholders. As a result, we have a guarantee liability of $38.1$35.4 million and $38.2$33.3 million recorded as of December 31, 20212023 and December 31, 2020,2022, respectively, which is presented within accounts payable and other current liabilities on the consolidated balance sheets and represents our proportionate share of the outstanding balance of these debt instruments. The carrying value of the guarantee liability equals fair value, which considers an adjustment for our own non-performance risk and is considered a Level 2 measurement. The offset to the guarantee liability was recorded as an adjustment to our respective equity method investment within the consolidated balance sheets. The resulting change in our equity method investments during the year due to movements in the guarantee represents a non-cash investing activity.
Equity Method Investments
BRI
BRI is a beer distribution and retail network for the Ontario region of Canada, with majority of the ownership residing with Molson Canada 2005, Labatt Breweries of Canada LP (a subsidiary of ABI) and Sleeman Breweries Ltd. (a subsidiary of Sapporo International). We hold a 50.9% ownership interest in BRI. BRI charges its owners administrativethe brewers service fees that are designed so the entity operates on a cash neutral basis. This administrativeservice fee is based on costs incurred, net of other revenues earned, and is allocated in accordance with the operating agreement to its owners based on volume of products. Contractual provisions cause participationproducts sold in governance and other interests to fluctuate based on this calculated market share requiring frequent primary beneficiary evaluations. However, basedthe Ontario market. Based on the existing structure, control is shared, and remains shared through such changes, and therefore we do not anticipate becoming the primary beneficiary in the foreseeable future. We consider BRI an affiliate.
We have an obligation to proportionately fund BRI's operations. As a result of this obligation, we continue to record our proportional share of BRI's net income or loss and OCI activity, including when we have a negative equity method balance. As of December 31, 2021 and December 31, 2020, we had a positive equity method investment balance of $43.9 million and $31.9 million, respectively. See "Affiliate Transactions" below for BRI affiliate due to and due from balances as of December 31, 20212023 and December 31, 2020,2022, respectively, related to trade receivables and payables for sales to external customers and costs incurred by BRI offset by administrative fees charged and paid by MCBC (which may be in a payable or receivable position depending on the amount under or over charged).
BDL
BDL is a distribution operation owned by Molson Canada 2005 and Labatt Breweries of Canada LP (a subsidiary of ABI) that, pursuant to an operating agreement, acts as an agent for the distribution of their products in the western provinces of Canada. The 2two owners share equal voting control of this business. We consider BDL an affiliate.hold a 34.0% ownership interest in BDL.
BDL charges the owners administrativeservice fees that are designed so the entity operates at break-even profit levels.levels and annually, operates on a cash neutral basis. This administrativeservice fee is based on costs incurred, net of other revenues earned, and is allocated in accordance with the operating agreement to the owners based on volume of products. Our investmentproducts sold in BDL was $33.2 million and $27.0 million as of December 31, 2021 and December 31, 2020, respectively.these provinces. See "Affiliate Transactions" section below for BDL affiliate due to and due from balances as of December 31, 20212023 and December 31, 2020,2022, respectively, related to trade receivables and payables for sales to external customers and costs incurred by BDL offset by administrative fees charged and paid by MCBC (which may be in a payable or receivable position depending on the amount under or over charged).
Other
In
ZOA
During the third quarter of 2020,2023, we formed increased our investment in ZOA Energy, LLC (“ZOA”), an energy drink company operating in the U.S. and Canada, bringing our ownership interest to 40%, on a fully diluted basis. This increase in ownership resulted in the transition of accounting for our investment from the fair value method under ASC 321 to equity method investment accounting under ASC 323 on a prospective basis and the cash outflow associated with the investment is reflected within Other in the Investing activities section of the consolidated statements of cash flows. Subsequent to the increase in our investment, the carrying value of our recorded ownership investment exceeded our ratable portion of underlying equity in the net assets of ZOA, and this basis difference was fully allocated to equity method goodwill. In addition, under our agreement, we hold an option to purchase incremental shares to increase our ownership to over 50% starting September 2024 for a 90-day period thereafter. Furthermore, we have an agreement to distribute ZOA’s products in certain channels in the U.S.
Other
TYC, a joint venture equally owned by MCBC and DGY West that, pursuant to an operating agreement, was formed to expand the commercialization of Yuengling's brands for any new market expansion outside of Yuengling's thenoriginal 22-state footprint and New England in the U.S. During the third quarter of 2021, TYC commenced retail operations with its first product sales in the state of Texas.Texas and in 2023, TYC expanded into three new markets consisting of Kansas, Oklahoma and Missouri. We have concluded that TYC is a VIE for which we are not the primary beneficiary and therefore is accounted for as an equity method investment.
We have certain other immaterial equity investments we enter into from time to time that align with our organizational strategies and growth initiatives.
The total balance of our equity method investments was $222.7 million and $96.9 million as of December 31, 2023 and December 31, 2022, respectively. Our equity method investments are all within the Americas segment and are included in other assets on the consolidated balance sheets. These investments are not considered significant for disclosure of financial information on either an individual or aggregated basis and there were no significant undistributed earnings as of December 31, 20212023 or December 31, 2020,2022, for any of these companies. We consider each of our equity method investments to be affiliates.
Affiliate Transactions
Amounts due from and due to affiliates as of December 31, 20212023 and December 31, 2020,2022, respectively, are as follows:
| | | | | | | | | | | | | | | | | | | | | | | |
| Amounts due from affiliates | | Amounts due to affiliates |
| December 31, 2021 | | December 31, 2020 | | December 31, 2021 | | December 31, 2020 |
| (In millions) |
| BRI | $ | 3.3 | | | $ | 6.0 | | | $ | 0.4 | | | $ | — | |
| BDL | 6.2 | | | 2.1 | | | 3.1 | | | — | |
| Other | 6.7 | | | 0.3 | | | 0.6 | | | 0.5 | |
| Total | $ | 16.2 | | | $ | 8.4 | | | $ | 4.1 | | | $ | 0.5 | |
| | | | | | | | | | | | | | | | | | | | | | | |
| Amounts due from affiliates | | Amounts due to affiliates |
| December 31, 2023 | | December 31, 2022 | | December 31, 2023 | | December 31, 2022 |
| (In millions) |
| BRI | $ | — | | | $ | 4.7 | | | $ | 1.6 | | | $ | (0.3) | |
| BDL | 3.2 | | | 0.2 | | | — | | | — | |
| Other | 4.2 | | | 5.4 | | | 5.2 | | | 1.3 | |
| Total | $ | 7.4 | | | $ | 10.3 | | | $ | 6.8 | | | $ | 1.0 | |
Consolidated VIEs
Rocky Mountain Metal Container
RMMC, a Colorado limited liability company, is a joint venture with Ball Corporation in which we hold a 50% interest. Our U.S. business has a can and end supply agreement with RMMC. Under this agreement, we purchase substantially all of the output of RMMC. RMMC manufactures cans and ends at our facilities, which RMMC is operating under a use and license agreement. As RMMC is a limited liability company (“LLC”("LLC"), the tax consequences flow to the joint venture partners.
Rocky Mountain Bottle Company
RMBC, a Colorado limited liability company, is a joint venture with Owens-Brockway Glass Container, Inc.Inc in which we hold a 50% interest. Our U.S. business has a supply agreement with RMBC under which we agree to purchase output approximating the agreed upon annual plant capacity of RMBC. RMBC manufactures bottles at our facilities, which RMBC is operating under a lease agreement. As RMBC is an LLC, the tax consequences flow to the joint venture partners.
Cobra U.K.
We hold a 50.1% interest in Cobra U.K., which owns the worldwide rights to the Cobra beer brand (with the exception of the Indian sub-continent, owned by Cobra India). The noncontrolling interest is held by the founder of the Cobra beer brand. We consolidate the results and financial position of Cobra U.K., and it is reported within our EMEA&APAC segment.
Truss
On October 4, 2018, a wholly-owned subsidiary withinAugust 3, 2023, we sold our Canadian business completed the formation of Truss LP, an independent Canadian joint venture with HEXO to pursue opportunities to develop, produce and market non-alcoholic, cannabis-infused beverages in Canada. Truss is structured as a standalone company with its own board of directors and an independent management team. We maintain a 57.5% controlling interest in Truss which isLP ("Truss") to Tilray Brands for an immaterial amount and recognized a loss of $11.1 million within other operating income (expense), net in our consolidated statement of operations upon deconsolidation of the business. Earlier in the year, on June 22, 2023, HEXO Corp, our joint venture partner in Truss, was acquired by Tilray Brands and this transaction had no impact on Molson Coors' ownership in the joint venture or on our consolidated results. Prior to the sale of our controlling interest, Truss was recorded as a consolidated VIE that is consolidated. Truss subleasesin the location of its production facility in Belleville, Ontario from HEXO.comparative periods presented.
The following summarizes the assets and liabilities of our consolidated VIEs (including noncontrolling interests):
| | | | As of | | As of |
| | | December 31, 2021 | | December 31, 2020 | | December 31, 2023 | | December 31, 2022 |
| | | Total Assets | | Total Liabilities | | Total Assets | | Total Liabilities | | Total Assets | | Total Liabilities | | Total Assets | | Total Liabilities |
| | | (In millions) | | (In millions) |
| RMMC/RMBC | RMMC/RMBC | $ | 204.9 | | | $ | 19.1 | | | $ | 239.3 | | | $ | 17.9 | |
| Other | Other | $ | 70.8 | | | $ | 14.8 | | | $ | 93.4 | | | $ | 18.0 | |
Grolsch DeconsolidationAs of December 31, 2023, for RMMC/RMBC, $108.2 million and $120.7 million were recorded in inventories, net and property, plant and equipment, net, respectively, on the consolidated balance sheets. As of December 31, 2022, for RMMC/RMBC, $81.1 million and $128.6 million were recorded in inventories, net and property, plant and equipment, net, respectively on the consolidated balance sheets.
4. Inventories
| | | | | | | | | | | |
| | As of |
| | December 31, 2023 | | December 31, 2022 |
| (In millions) |
| Finished goods | $ | 245.7 | | | $ | 269.1 | |
| Work in process | 97.4 | | | 71.9 | |
| Raw materials | 275.1 | | | 290.4 | |
| Packaging materials | 184.1 | | | 161.5 | |
| Inventories, net | $ | 802.3 | | | $ | 792.9 | |
5. Property, Plant and Equipment
| | | | | | | | | | | |
| | As of |
| | December 31, 2023 | | December 31, 2022 |
| | (In millions) |
| Land and improvements | $ | 365.1 | | | $ | 355.9 | |
| Buildings and improvements | 1,283.4 | | | 1,205.5 | |
| Production and office equipment | 5,156.0 | | | 4,897.3 | |
| Software | 543.8 | | | 533.3 | |
| Construction in progress | 783.7 | | | 497.4 | |
| Other | 414.1 | | | 395.3 | |
| Total property, plant and equipment cost | 8,546.1 | | | 7,884.7 | |
| Less: accumulated depreciation | (4,101.6) | | | (3,661.9) | |
| Property, plant and equipment, net | $ | 4,444.5 | | | $ | 4,222.8 | |
Depreciation expense was $475.5 million, $476.7 million and $568.1 million in the years ended December 31, 2023, December 31, 2022 and December 31, 2021, respectively.
6. Goodwill and Intangible Assets
The changes in the carrying value of goodwill is presented in the table below by segment.
| | | | | | | | | | | | | | | | | |
| | Americas | | EMEA&APAC | | Consolidated(1) |
| (In millions) |
| Balance as of December 31, 2021 | $ | 6,152.6 | | | $ | — | | | $ | 6,152.6 | |
| | | | | |
| Impairments | (845.0) | | | — | | | (845.0) | |
| Foreign currency translation, net | (15.7) | | | — | | | (15.7) | |
| Balance as of December 31, 2022 | $ | 5,291.9 | | | $ | — | | | $ | 5,291.9 | |
| | | | | |
Acquisition(2) | 29.2 | | | — | | | 29.2 | |
| Foreign currency translation, net | 4.2 | | | — | | | 4.2 | |
| Balance as of December 31, 2023 | $ | 5,325.3 | | | $ | — | | | $ | 5,325.3 | |
(1)Accumulated impairment losses for the Americas segment was $1,513.3 million as of December 31, 2023 and December 31, 2022. The EMEA&APAC goodwill balance was fully impaired during the year ended December 31, 2020 with an accumulated impairment loss of $1,484.3 million.
The following table presents details of our intangible assets, other than goodwill, as of December 31, 2023:
| | | | | | | | | | | | | | | | | | | | | | | |
| Useful life | | Gross | | Accumulated
amortization | | Net |
| | (Years) | | (In millions) |
| Intangible assets subject to amortization | | | | | | | |
| Brands | 10 - 50 | | $ | 5,029.2 | | | $ | (1,634.4) | | | $ | 3,394.8 | |
| License agreements and distribution rights | 10 - 20 | | 204.9 | | | (117.6) | | | 87.3 | |
| Other | 5 - 40 | | 84.8 | | | (25.8) | | | 59.0 | |
| Intangible assets not subject to amortization | | | | | | | |
| Brands | Indefinite | | 8,002.0 | | | — | | | 8,002.0 | |
| Distribution networks | Indefinite | | 763.9 | | | — | | | 763.9 | |
| Other | Indefinite | | 307.6 | | | — | | | 307.6 | |
| Total | | | $ | 14,392.4 | | | $ | (1,777.8) | | | $ | 12,614.6 | |
The following table presents details of our intangible assets, other than goodwill, as of December 31, 2022:
| | | | | | | | | | | | | | | | | | | | | | | |
| Useful life | | Gross | | Accumulated
amortization | | Net |
| | (Years) | | (In millions) |
| Intangible assets subject to amortization | | | | | | | |
| Brands | 10 - 50 | | $ | 4,861.1 | | | $ | (1,416.7) | | | $ | 3,444.4 | |
| License agreements and distribution rights | 15 - 20 | | 200.0 | | | (108.0) | | | 92.0 | |
| Other | 5 - 40 | | 88.8 | | | (27.7) | | | 61.1 | |
| Intangible assets not subject to amortization | | | | | | | |
| Brands | Indefinite | | 8,148.6 | | | — | | | 8,148.6 | |
| Distribution networks | Indefinite | | 746.4 | | | — | | | 746.4 | |
| Other | Indefinite | | 307.6 | | | — | | | 307.6 | |
| Total | | | $ | 14,352.5 | | | $ | (1,552.4) | | | $ | 12,800.1 | |
The increase in the gross carrying amounts of intangible assets from December 31, 2022 to December 31, 2023 was primarily driven by the acquired brand intangible asset related to Blue Run as well as the impact of foreign currency exchange rates as a significant amount of intangible assets are denominated in foreign currencies, partially offset by the impairment of the Staropramen family of brands during the fourth quarter of 2023.
Based on foreign exchange rates as of December 31, 2023, the estimated future amortization expense of intangible assets for the next five years is as follows:
| | | | | | | | |
| Year | | Amount |
| | | (In millions) |
| 2024 | | $ | 210.8 | |
| 2025 | | $ | 210.8 | |
| 2026 | | $ | 192.3 | |
| 2027 | | $ | 127.8 | |
| 2028 | | $ | 126.2 | |
Amortization expense of intangible assets was $207.3 million, $208.1 million and $218.0 million for the years ended December 31, 2023, December 31, 2022 and December 31, 2021, respectively. This expense was primarily presented within MG&A in our consolidated statements of operations.
Annual 2023 Impairment Assessment
We completed our required annual goodwill and indefinite-lived intangible asset impairment testing as of October 1, 2023, the first day of our fourth quarter, using a combination of a discounted cash flow analysis and market approach in the determination of fair value and concluded that the fair value of the Americas reporting unit was in excess of its carrying value by slightly less than 15% and therefore no goodwill impairment charge was recorded.
The fair value of the Americas reporting unit increased during the current year and was largely impacted by shifts in consumer preferences in the U.S. market towards our core brands leading to increased volume and share, paired with pricing increases put in place starting in late 2022 as well as lower than previously expected inflation rates. This is partially offset by an increase to the discount rate as a result of the recent rising interest rate environment. Specifically, the discount rate used in developing our annual fair value estimates for the Americas reporting unit in the current year was 9.00% based on market-specific factors, primarily the recent interest rate environment, as compared to 8.75% used as of the October 1, 2022 annual testing date.
Due to the current amount by which the Americas reporting unit fair value exceeds its carrying value, the reporting unit continues to be at a heightened risk of future impairment. We continue to focus on growing our core power brand net sales, aggressively premiumizing our portfolio and scaling and expanding beyond beer. While progress has been made on these strategies over recent years, including the strengthening of our core brands, the growth targets included in management’s forecasted future cash flows are inherently at risk given that the strategies are still in progress. These growth targets have been aligned with current expectations of the beer industry environment and broader macroeconomic conditions such as cost inflation for certain inputs, which could continue to put pressure on achieving key margin and cash flow projections into the future. Additionally, the fair value determinations are sensitive to changes in forecasted cash flows, macroeconomic conditions, market multiples or discount rates that could negatively impact future analyses, including the ongoing impacts of cost inflation, further increases to interest rates, and other external industry factors impacting our business. The key assumptions used to derive the estimated fair values of our reporting units represent Level 3 measurements.
Indefinite-Lived Intangible Assets
As of the October 1, 2023 testing date, the carrying value of the Staropramen family of brands in EMEA&APAC was determined to be in excess of its fair value such that an impairment loss of $160.7 million was recorded within other non-operating income (expense), net. As this is a partial impairment, the intangible asset is considered to be at a heightened risk of future impairment, and the carrying value of the brand was $426.9 million as of December 31, 2023. The decline in the fair value in the current year was impacted by reductions in management forecasts due to delays and changes in strategic priorities for expansion and distribution of the brand in certain export and license markets, increased optionality for consumers in the premium sector in key markets, and reduced demand in Central and Eastern Europe due to cost inflation pressures on consumers as well as macroeconomic factors including an increase to the discount rate as a result of the recent rising interest rate environment. The discount rate used in developing our annual fair value estimates for the Staropramen family of brands in the current year was 13.25% based on company-specific and market-specific factors, as compared to 11.25% used as of the October 1, 2022 annual testing date.
The fair value of the Coors brands in the Americas, the Miller brands in the U.S. and the Carling brands in EMEA&APAC all exceeded their respective carrying values by over 15.0% as of the annual testing date.
We utilized Level 3 fair value measurements in our impairment analysis of our indefinite-lived intangible assets. An excess earnings approach is used to determine the fair values of these assets as of the testing date. The future cash flows used in the analysis are based on internal cash flow projections based on our long range plans and include significant assumptions by management as noted below.
Separately, we performed a qualitative assessment of our water rights indefinite-lived intangible assets in the U.S. to determine whether it was more likely than not that the fair values of these assets were greater than their respective carrying amounts. Based on this qualitative assessment, we determined that a full quantitative analysis was not necessary.
Key Assumptions
Fair value determinations require considerable judgment and are sensitive to changes in underlying assumptions and factors. As a result, there can be no assurance that the estimates and assumptions made for purposes of the goodwill and indefinite-lived intangible asset impairment tests will prove to be an accurate prediction of the future. If our assumptions are not realized, it is possible that impairment charges may need to be recorded in the future. Examples of events or circumstances that could reasonably be expected to negatively affect the underlying key assumptions and ultimately impact the estimated fair value of our reporting units and indefinite-lived intangible assets may include such items as: (i) a decrease in expected future cash flows, specifically, an inability to execute on our strategic initiatives or increase in costs driven by inflation or other factors that could significantly impact our immediate and long range results, a prolonged weakness in consumer demand or other competitive pressures adversely affecting our long-term volume trends, changes in trends and consumer preferences within the industry towards other brands or product categories, unfavorable working capital changes and an inability to successfully achieve our cost savings targets, (ii) adverse changes in macroeconomic conditions or an economic recovery that significantly differs from our assumptions in timing and/or degree (such as a global pandemic or recession), (iii) significant unfavorable changes in tax rates, (iv) volatility in the equity and debt markets or other country specific factors which could result in a higher weighted-average cost of capital, (v) sensitivity to market multiples and (vi) regulation limiting or banning the manufacturing, distribution or sale of alcoholic beverages.
Based on known facts and circumstances, we evaluate and consider recent events and uncertain items, as well as related potential implications, as part of our annual assessment and incorporate them into the analyses as appropriate. These facts and circumstances are subject to change and may impact future analyses. For example, we continue to monitor the challenges within the beer industry for further weakening or additional systemic structural declines, as well as for adverse changes in macroeconomic conditions such as cost inflation and the potential impacts this may have on our immediate or long range results. We also continuously monitor the market inputs used in calculating our discount rates, including risk-free rates, equity premiums and our cost of debt, which could result in a meaningful change to our weighted-average cost of capital calculation, as well as the market multiples used in our impairment assessment. Substantial changes in any of these inputs could lead to a material impairment. Furthermore, increased volatility in the equity and debt markets or other country specific factors, including, but not limited to, extended or future government intervention in response to inflation, could also result in a meaningful change to our weighted-average cost of capital calculation and other inputs used in our impairment assessment.
Annual 2022 Impairment Assessment
We completed our required annual goodwill and indefinite-lived intangible asset impairment analysis as of October 1, 2022 and concluded that the carrying value of the Americas reporting unit was in excess of its fair value amount such that an impairment loss of $845.0 million was recorded to the "Goodwill impairment" line item on the consolidated statements of operations. The decline in the fair value of the Americas reporting unit was largely impacted by macroeconomic factors including an increase to the discount rate as a result of the recent rising interest rate environment as well as reductions in management forecasts and expectations due primarily to cost inflation pressures and a softening beer market in certain markets in which we operate.
In conjunction with the annual 2022 goodwill impairment analysis, we also evaluated the indefinite-lived and definite-lived intangible assets within our Americas and EMEA&APAC reporting units and concluded no impairments were required for our indefinite-lived assets or definite-lived intangible assets.
Definite-Lived Intangible Assets and Other Long-Lived Assets
Regarding definite-lived assets, we continuously monitor the performance of the underlying assets for potential triggering events suggesting an impairment review should be performed.
During the first quarter of 2022, we identified a triggering event related to the Truss joint venture asset group within our Americas segment and recognized an impairment loss of $28.6 million, of which $12.1 million was attributable to the noncontrolling interest. The asset group was measured at fair value primarily using a market approach with Level 3 inputs. See Note 17, "Other Operating Income (Expense), net" for further details on impairment losses recorded. No other material triggering events were identified in either the year ended December 31, 2023 or 2022 related to definite-lived intangible assets or other long-lived assets.
7. Accounts Payable and Other Current Liabilities
| | | | | | | | | | | |
| | As of |
| | December 31, 2023 | | December 31, 2022 |
| | (In millions) |
| Accounts payable and accrued trade payables | $ | 2,149.8 | | | $ | 2,068.2 | |
| Accrued compensation | 316.8 | | | 249.2 | |
| Accrued excise and other non-income related taxes | 255.1 | | | 239.9 | |
| Accrued interest | 82.8 | | | 87.6 | |
| Returnable container deposit liabilities | 113.2 | | | 116.8 | |
| Operating lease liabilities | 46.9 | | | 44.7 | |
Other(1) | 216.2 | | | 171.9 | |
| Accounts payable and other current liabilities | $ | 3,180.8 | | | $ | 2,978.3 | |
(1)Includes current liabilities related to derivatives, income taxes, pensions and other postretirement benefits, guarantee liabilities for some of our equity method investments and various other accrued expenses.
8. Leases
For the years ended December 31, 2023, December 31, 2022 and December 31, 2021, lease expense (including immaterial short-term and variable lease costs) was as follows.
| | | | | | | | | | | | | | | | | |
| For the years ended |
| December 31, 2023 | | December 31, 2022 | | December 31, 2021 |
| (In millions) |
| Operating lease expense | $ | 81.3 | | | $ | 72.5 | | | $ | 73.2 | |
| Finance lease expense | 9.5 | | | 9.5 | | | 10.4 | |
| Total lease expense | $ | 90.8 | | | $ | 82.0 | | | $ | 83.6 | |
Supplemental cash flow information related to leases for the years ended December 31, 2023, December 31, 2022 and December 31, 2021 was as follows. | | | | | | | | | | | | | | | | | |
| For the years ended |
| December 31, 2023 | | December 31, 2022 | | December 31, 2021 |
| (In millions) |
| Cash paid for amounts included in the measurements of lease liabilities | | | | | |
| Operating cash flows for operating leases | $ | 58.7 | | | $ | 52.5 | | | $ | 56.8 | |
| Operating cash flows for finance leases | $ | 3.3 | | | $ | 3.6 | | | $ | 4.5 | |
| Financing cash flows for finance leases | $ | 5.1 | | | $ | 4.4 | | | $ | 3.6 | |
| Supplemental non-cash information on right-of-use assets obtained in exchange for new lease liabilities | | | | | |
| Operating leases | $ | 115.7 | | | $ | 63.9 | | | $ | 34.0 | |
| Finance leases | $ | 1.7 | | | $ | 3.8 | | | $ | 7.5 | |
Supplemental balance sheet information related to leases as of December 31, 2023 and December 31, 2022 was as follows: | | | | | | | | | | | | | | |
| | As of |
| | December 31, 2023 | | December 31, 2022 |
| Balance Sheet Classification | (In millions) |
| Operating Leases | | | | |
| Operating lease right-of-use assets | Other assets | $ | 200.7 | | | $ | 132.7 | |
| Current operating lease liabilities | Accounts payable and other current liabilities | $ | 46.9 | | | $ | 44.7 | |
| Non-current operating lease liabilities | Other liabilities | 163.9 | | | 99.3 | |
| Total operating lease liabilities | | $ | 210.8 | | | $ | 144.0 | |
| | | | |
| Finance Leases | | | | |
| Finance lease right-of-use assets | Property, plant and equipment, net | $ | 46.4 | | | $ | 50.2 | |
| Current finance lease liabilities | Current portion of long-term debt and short-term borrowings | $ | 5.2 | | | $ | 5.3 | |
| Non-current finance lease liabilities | Long-term debt | 48.5 | | | 56.2 | |
| Total finance lease liabilities | | $ | 53.7 | | | $ | 61.5 | |
The weighted-average remaining lease term and discount rate as of December 31, 2023 were as follows: | | | | | | | | | | | |
| Weighted-Average Remaining Lease Term (Years) | | Weighted-Average Discount Rate |
| Operating leases | 7.5 | | 5.1% |
| Finance leases | 9.6 | | 6.4% |
Based on foreign exchange rates as of December 31, 2023, maturities of lease liabilities were as follows:
| | | | | | | | | | | |
| Operating Leases | | Finance Leases |
| (In millions) |
| 2024 | $ | 53.6 | | | $ | 8.5 | |
| 2025 | 46.4 | | | 8.1 | |
| 2026 | 37.1 | | | 11.5 | |
| 2027 | 24.6 | | | 5.0 | |
| 2028 | 18.7 | | | 4.7 | |
| Thereafter | 90.3 | | | 36.5 | |
| Total lease payments | $ | 270.7 | | | $ | 74.3 | |
| Less: interest | (59.9) | | | (20.6) | |
| Present value of lease liabilities | $ | 210.8 | | | $ | 53.7 | |
As of December 31, 2023, we entered into leases that have not yet commenced with estimated aggregated future lease payments of approximately $23 million. The leases are expected to commence in 2024.
9. Debt
Debt Obligations
| | | | | | | | | | | |
| | As of |
| | December 31, 2023 | | December 31, 2022 |
| | (In millions) |
| Long-term debt | | | |
CAD 500 million 2.84% notes due July 2023(1)(2)(3) | — | | | 368.9 | |
EUR 800 million 1.25% notes due July 2024(1) | 883.1 | | | 856.4 | |
CAD 500 million 3.44% notes due July 2026(1)(2) | 377.6 | | | 368.9 | |
$2.0 billion 3.0% notes due July 2026(1) | 2,000.0 | | | 2,000.0 | |
$1.1 billion 5.0% notes due May 2042(4) | 1,100.0 | | | 1,100.0 | |
$1.8 billion 4.2% notes due July 2046(1) | 1,800.0 | | | 1,800.0 | |
| Finance leases | 53.7 | | | 61.5 | |
| Other | 23.5 | | | 25.4 | |
| Less: unamortized debt discounts and debt issuance costs | (35.5) | | | (39.7) | |
| Total long-term debt (including current portion) | 6,202.4 | | | 6,541.4 | |
| Less: current portion of long-term debt | (890.3) | | | (376.2) | |
| Total long-term debt | $ | 5,312.1 | | | $ | 6,165.2 | |
| | | |
| | | |
| | | |
Short-term borrowings(5) | 21.5 | | | 20.9 | |
| Current portion of long-term debt | 890.3 | | | 376.2 | |
| Current portion of long-term debt and short-term borrowings | $ | 911.8 | | | $ | 397.1 | |
(1)These senior notes were issued in 2016 in order to partially fund the financing of the MillerCoors Acquisition (USD Notes, EUR Notes and CAD Notes). Total remaining debt issuance costs capitalized in connection with these notes including underwriting fees, discounts and other financing related costs, were $27.2 million as of December 31, 2023 and are being amortized over the respective and remaining terms.
(2)We entered into forward starting interest rate swap agreements to hedge interest rate volatility for a 10-year period until the swaps were settled on September 18, 2015. We are amortizing a portion of the resulting loss from AOCI to interest expense over the remaining term of the CAD 500 million 3.44% notes maturing July 2026 ("2026 CAD notes"), up to the full 10-year term of the interest rate swaps. The amortizing loss resulted in an increase in our effective cost of borrowing compared to the stated coupon rates by 0.4% on the 2026 CAD notes. See Note 10, "Derivative Instruments and Hedging Activities" for further details on the forward starting interest rate swaps. (3)We repaid our CAD 500 million 2.84% notes upon maturity on July 15, 2023 using cash on hand.
(4)On May 3, 2012, we issued approximately $1.9 billion of senior notes with $1.1 billion remaining due in 2042. The total remaining debt issuance costs capitalized in connection with these notes, including the underwriting fees and discounts, were $8.3 million as of December 31, 2023 and are being amortized over the remaining term of the 2042 notes.
(5)Our short-term borrowings include bank overdrafts, borrowings on our overdraft facilities and other items.
As of December 31, 2023, we had $16.5 million in bank overdrafts and $75.5 million in bank cash related to our cross-border, cross-currency cash pool for a net positive position of $59.0 million. As of December 31, 2022, we had $15.9 million in bank overdrafts and $49.7 million in bank cash related to our cross-border, cross-currency cash pool for a net positive position of $33.8 million.
In addition, we have CAD, GBP and USD overdraft facilities under which we had no outstanding borrowings as of December 31, 2023 or December 31, 2022.
•CAD unlimited overdraft facility at CAD Prime plus 0.50%
•GBP 10 million overdraft facility at GBP Base Rate plus 2.25%
•USD 10 million overdraft facility at USD Prime plus 5%
Debt Fair Value Measurements
We utilize market approaches to estimate the fair value of certain outstanding borrowings by discounting anticipated future cash flows derived from the contractual terms of the obligations and observable market interest and foreign exchange rates. As of December 31, 2023 and December 31, 2022, the fair value of our outstanding long-term debt (including current portion of long-term debt) was approximately $5.9 billion. All senior notes are valued based on significant observable inputs and classified as Level 2 in the fair value hierarchy. The carrying values of all other outstanding long-term borrowings and our short-term borrowings approximate their fair values and are also classified as Level 2 in the fair value hierarchy.
Revolving Credit Facility and Commercial Paper
On June 26, 2023, we amended and restated our multi-currency revolving credit facility to, among other things, extend the term through June 26, 2028, and to increase the borrowing capacity to $2.0 billion. This $2.0 billion revolving credit facility amended our pre-existing $1.5 billion revolving credit facility, which was scheduled to mature on July 7, 2024. On September 28, 2023, we amended our commercial paper program, which reduces borrowing capacity under the revolving credit facility, to a maximum borrowing capacity of $2.0 billion to borrow at any time at variable interest rates. The $150 million sub-facility available for the issuance of letters of credit remains unchanged.
Concurrent with the amended and restated multi-currency revolving credit facility, in the second quarter of 2023, we incurred incremental issuance costs of $5.2 million related to the $2.0 billion revolving credit facility, which are recorded within other current assets, net, and other assets on the consolidated balance sheets and are being amortized over the term of the facility. We use this facility from time to time to fund the repayment of debt upon maturity and for working capital or general purposes. We had no borrowings drawn on this revolving credit facility and no commercial paper borrowings as of December 31, 2023 and December 31, 2022.
Debt Covenants
Under the terms of each of our debt facilities, we must comply with certain restrictions. These include customary events of default and specified representations, warranties and covenants, as well as covenants that restrict our ability to incur certain additional priority indebtedness (certain thresholds of secured consolidated net tangible assets), certain leverage threshold percentages, create or permit liens on assets, and restrictions on mergers, acquisitions, and certain types of sale lease-back transactions.
Under the amended and restated $2.0 billion revolving credit facility, we are required to maintain a maximum leverage ratio, calculated as net debt to EBITDA (as defined in the revolving credit facility agreement) of 4.00x, measured as of the last day of each fiscal quarter through maturity of the credit facility. As of December 31, 2023 and December 31, 2022, we were in compliance with all of these restrictions and covenants, have met such financial ratios, and have met all debt payment obligations. All of our outstanding senior notes as of December 31, 2023 rank pari-passu.
As of December 31, 2023, the aggregate principal debt maturities of long-term debt and short-term borrowings, based on foreign exchange rates as of December 31, 2023, were as follows:
| | | | | | | | |
| Year | | Amount |
| | | (In millions) |
| 2024 | | $ | 904.6 | |
| 2025 | | — | |
| 2026 | | 2,377.6 | |
| 2027 | | — | |
| 2028 | | — | |
| Thereafter | | 2,900.0 | |
| Total | | $ | 6,182.2 | |
The aggregate principal debt maturities in the table above excludes Other and Finance leases. The future maturities of finance leases are disclosed in Note 8, "Leases."
Interest
| | | | | | | | | | | | | | | | | |
| | For the years ended |
| | December 31, 2023 | | December 31, 2022 | | December 31, 2021 |
| | (In millions) |
| Interest incurred | $ | 243.4 | | | $ | 257.4 | | | $ | 269.1 | |
| Interest capitalized | (9.4) | | | (6.8) | | | (8.8) | |
| Interest expensed | $ | 234.0 | | | $ | 250.6 | | | $ | 260.3 | |
10. Derivative Instruments and Hedging Activities
Overview and Risk Management Policies
We use derivatives as part of our normal business operations to manage our exposure to fluctuations in interest rates, foreign currency, commodity price risk and for other strategic purposes related to our core business. We have established policies and procedures that govern the risk management of these exposures. Our primary objective in managing these exposures is to decrease the volatility of cash flows affected by changes in the underlying rates and prices.
To achieve our objectives, we enter into a variety of financial derivatives, including foreign currency exchange, commodity, interest rate, cross currency swaps as well as options. We also enter into physical hedging agreements directly with our suppliers to manage our exposure to certain commodities.
Counterparty Risk
While, by policy, the counterparties to any of the financial derivatives we enter into are major institutions with minimum investment grade credit ratings of BBB- by Standard & Poor's (or the equivalent) or Baa3 by Moody's, we are exposed to credit-related losses in the event of non-performance by counterparties. This credit risk is generally limited to the unrealized gains in such contracts, should any of these counterparties fail to perform as contracted.
We have established a counterparty credit policy and guidelines that are monitored and reported to management to assist in managing this risk. As an additional measure, we utilize a portfolio of institutions either headquartered or operating in the same countries that we conduct our business. In calculating the fair value of our derivative balances, we also record an adjustment to recognize the risk of counterparty credit and our own non-performance risk, as appropriate.
Price and Liquidity Risks
We base the fair value of our derivative instruments upon market rates and prices. The volatility of these rates and prices are dependent on many factors that cannot be forecasted with reliable accuracy. The current fair values of our contracts could differ significantly from the cash settled values with our counterparties. As such, we are exposed to price risk related to unfavorable changes in the fair value of our derivative contracts.
We may be forced to cash settle all or a portion of our derivative contracts before the expected settlement date upon the occurrence of certain contractual triggers including a change of control, termination event or other breach of agreement. This could have a negative impact on our liquidity. For derivative contracts that we have designated as hedging instruments, early cash settlement would result in the timing of our hedge settlement not being matched to the cash settlement of the forecasted transaction or firm commitment. We may also decide to cash settle all or a portion of our derivative contracts before the expected settlement date through negotiations with our counterparties, which could also impact our cash position.
Due to the nature of our counterparty agreements, we are not able to net positions with the same counterparty across business units. Thus, in the event of default, we may be required to early settle all out-of-the-money contracts, without the benefit of netting the fair value of any in-the-money positions against this exposure.
Collateral
We do not receive and are not required to post collateral unless a change of control event occurs. This termination event would give either party the right to early terminate all outstanding swap transactions in the event that the other party consolidates, merges with, or transfers all or substantially all of its assets to, another entity, and the creditworthiness of the surviving entity that has assumed such party's obligations is materially weaker than that of such party. As of December 31, 2023, we did not have any collateral posted with any of our counterparties.
Derivative Accounting Policies
Overview
Our forward starting interest rate swaps and most of our foreign currency forwards are designated in hedging relationships as cash flow hedges. Prior to settlements discussed below, our interest rate swaps were designated as fair value hedges and our cross currency swaps were designated as net investment hedges. In certain situations, we may execute derivatives that do not qualify for, or we do not otherwise seek, hedge accounting but are determined to be important for managing risk. For example, our commodity swaps and commodity options are not designated in hedge accounting relationships. These outstanding economic hedges are measured at fair value on our consolidated balance sheets with changes in fair value recorded in earnings. We have historically elected to apply the NPNS exemption to certain contracts, as applicable. These contracts are typically transacted with our suppliers and include risk management features that allow us to fix the price on specific volumes of purchases for specified delivery periods. We also consider whether any provisions in our contracts represent embedded derivative instruments as defined in authoritative accounting guidance and apply the appropriate accounting.
Hedge Accounting Policies
We formally document all relationships receiving hedge accounting treatment between hedging instruments and hedged items, as well as the risk-management objective and strategy for undertaking hedge transactions pursuant to prescribed guidance. We also formally assess effectiveness both at the hedge's inception and on an ongoing basis, specifically whether the derivatives that are used in hedging transactions have been highly effective in mitigating the risk designated as being hedged and whether those hedges may be expected to remain highly effective in future periods. Specific to net investment hedges, we have elected to use the spot-to-spot methodology to assess effectiveness.
We discontinue hedge accounting prospectively when (1) the derivative is no longer highly effective in offsetting changes in the cash flows of a forecasted future transaction; (2) the derivative expires or is sold, terminated, or exercised; (3) it is no longer probable that the forecasted transaction will occur; (4) management determines that designating the derivative as a hedging instrument is no longer appropriate; or (5) management decides to cease hedge accounting.
When we discontinue hedge accounting prospectively, but it continues to be probable that the forecasted transaction will occur in the originally expected period, the existing gain or loss on the derivative remains in AOCI for cash flow hedges and net investment hedges or in the carrying value of the hedged item for fair value hedges and is reclassified into earnings when the forecasted transaction affects earnings. However, if it is probable that a forecasted transaction will no longer occur by the end of the originally specified time period or within an additional two-month period of time thereafter, the gains and losses in AOCI are recognized immediately in earnings. In all situations in which hedge accounting is discontinued and the derivative remains outstanding, we carry the derivative at its fair value on the consolidated balance sheets until maturity, recognizing future changes in the fair value in current period earnings.
Significant Derivative/Hedge Positions
Net Investment Hedges
Foreign Denominated Debt
In 2016, we issued EUR 800 million senior notes maturing July 15, 2024 to partially fund the MillerCoors Acquisition. Concurrent with the issuance of these notes, we simultaneously designated the principals as net investment hedges of our investment in our Europe business in order to hedge a portion of the foreign currency translational impacts and, accordingly, record the changes in the carrying value due to fluctuations in the spot rate to AOCI.
Cross Currency Swaps
In 2019, we received termination noticesentered into cross currency swap agreements having a total notional value of approximately EUR 353 million ($400 million upon execution) in order to hedge a portion of the foreign currency translational impacts of our Grolsch U.K. Ltd. ("Grolsch") joint venture arrangement,European investment. Upon repayment of the $1.0 billion 2.1% senior notes at maturity in July 2021, we settled the associated cross currency swap resulting in a net cash payment of $12.7 million, consisting of the final loss on the cross currency swap of $17.6 million partially offset by the final interest received. The settlement of these cross currency swaps were classified as wellinvesting activities in our consolidated statement of cash flows.
We had designated each of these cross currency swaps as net investment hedges and accordingly, recorded changes in fair value due to fluctuations in the spot rate to AOCI. The changes in fair value of the swaps attributable to changes other than those due to fluctuations in the spot rate were excluded from the assessment of hedge effectiveness and recorded to interest expense over the life of the hedge.
Forward Starting Interest Rate Swaps
During 2018, we entered into forward starting interest rate swaps with a notional amount totaling $1.5 billion with termination dates of July 2021, May 2022 and July 2026. The swaps had effective dates mirroring the terms of the forecasted debt issuances. Under the agreements, we are required to early terminate these swaps at the time we expect to issue the related brewing and distribution agreements for the Grolsch brands in the U.K. and Ireland.forecasted debt. We therefore reassessed our statusdesignated these contracts as the primary beneficiary of the joint venture and concluded that we were no longer able to exert control over the operations or direction of the joint venture or otherwise influence the activities that most significantly impact the economics of the entity.cash flow hedges. As a result, the unrealized mark-to-market gains or losses are recorded to AOCI until termination at which point the realized gain or loss of these swaps at issuance of the hedged debt are reclassified from AOCI and amortized to interest expense over the term of the hedged debt.
In June 2021, we deconsolidatedearly terminated our $250.0 million forward starting interest rate swap that was originally set to terminate in July 2021. This forward starting interest rate swap was rolled forward to May 2022 through a cashless settlement. The new May 2022 forward starting interest rate swap was incremental to our existing May 2022 forward starting interest rate swap that was executed in 2018, both of which were hedging our forecasted debt issuance expected to occur during 2022. In late April 2022, the joint ventureforward starting interest rate swaps associated with the $500 million 3.5% notes that we repaid upon maturity on May 1, 2022 were terminated and recorded an aggregatesettled. The immaterial loss on the deconsolidation and terminationsettlement of the Grolsch businessswaps was recorded through interest expense during the second quarter of 2022.
In 2015, we entered into forward starting interest rate swaps with a notional of CAD 600 million in special items,order to manage our exposure to the volatility of the interest rates associated with the future interest payments on the forecasted CAD debt issuances. The swaps had a termination date of September 2025 mirroring the terms of initially forecasted CAD debt issuances. Under these agreements we were required to early terminate these swaps at the approximate time we issued the previously forecasted debt. We had designated these swaps as cash flow hedges and accordingly, a portion of the CAD 39.2 million ($29.5 million at settlement) loss on the swaps is being reclassified from AOCI and amortized to interest expense over the remaining term of the 2026 CAD notes up to the full 10-year term of the swaps. Additionally, in 2023 we repaid our CAD 500 million 2.84% notes upon maturity which resulted in an acceleration of amortization of the loss for an immaterial amount. The remaining unamortized portion of the loss in AOCI as of December 31, 2023 was $5.7 million.
Foreign Currency Forwards
We have financial foreign exchange forward contracts in place to manage our exposure to foreign currency fluctuations. We hedge foreign currency exposure related to certain royalty agreements, exposure associated with the purchase of production inputs and imports that are denominated in currencies other than the entity's functional currency and most other foreign exchanges exposures. These contracts have been designated as cash flow hedges of forecasted foreign currency transactions. We use foreign currency forward contracts to hedge these future forecasted transactions up to a 60 month horizon.
In the second quarter of 2023, we entered into approximately CAD 260 million (approximately $195 million USD) of foreign exchange forward contracts to manage our exposure to foreign currency fluctuations related to the repayment of our CAD 500 million 2.84% notes that matured on July 15, 2023. These contracts were not designated in hedge accounting relationships; as such, changes in the fair value were recorded in other non-operating income (expense), net in the consolidated statements of operationsoperations. These contracts settled on July 12, 2023 in 2019.advance of the notes repayment for an immaterial amount.
Commodity Swaps and Options
We have financial commodity swap and option contracts in place to hedge changes in the prices of natural gas, aluminum, including surcharges relating to our aluminum exposures, corn, sweeteners, barley and diesel. These contracts allow us to swap our floating exposure to changes in these commodity prices for a fixed rate. These contracts are not designated in hedge accounting relationships. As such, changes in fair value of these derivatives are recorded in cost of goods sold in the consolidated statements of operations. We hedge forecasted purchases of natural gas, aluminum, corn, sweeteners and diesel each up to 60 months out in the future for use in our supply chain, in line with our risk management policy. Further, we hedge forecasted purchases of barley based on crop year and physical inventory management. For purposes of measuring segment operating performance, the unrealized changes in fair value of the swaps not designated in hedge accounting relationships are reported in Unallocated outside of the segment specific operating results until such time that the exposure we are managing is realized. At that time, we reclassify the gain or loss from Unallocated to the respective operating segment, allowing our operating segments to realize the economic effects of the derivative without the resulting unrealized mark-to-market volatility.
5. Other Income
Warrants
In the fourth quarter of 2018, in connection with the formation of our former Truss joint venture, as discussed further in Note 3, "Investments," our joint venture partner, HEXO, issued to our Canadian subsidiary warrants to purchase common shares of HEXO at any time during the three year period following the formation of the joint venture. The warrants to acquire common shares of HEXO expired unexercised on October 4, 2021. All changes in the fair value of the warrants subsequent to issuance and Expenseuntil expiration were recorded in other non-operating income (expense), net on the consolidated statements of operations. | | | | | | | | | | | | | | | | | |
| | For the years ended |
| | December 31, 2021 | | December 31, 2020 | | December 31, 2019 |
| | (In millions) |
| | | | | |
| Gain (loss) from other foreign exchange and derivative activity, net | $ | (7.4) | | | $ | 2.8 | | | $ | (20.4) | |
Other, net(1) | 3.9 | | | 3.2 | | | 5.7 | |
| Other income (expense), net | $ | (3.5) | | | $ | 6.0 | | | $ | (14.7) | |
Derivative Fair Value Measurements
We utilize market approaches to estimate the fair value of our derivative instruments by discounting anticipated future cash flows derived from the derivative's contractual terms and observable market interest, foreign exchange and commodity rates. The fair values of our derivatives also include credit risk adjustments to account for our counterparties' credit risk, as well as our own non-performance risk, as appropriate.
The table below summarizes our derivative assets and (liabilities) that were measured at fair value as of December 31, 2023 and December 31, 2022. See Note 1, "Basis of Presentation and Summary of Significant Accounting Policies" for further discussion related to measuring the fair value of derivative instruments. Fair value for all derivative contracts as of December 31, 2023 and 2022 were valued using significant other observable inputs, also known as Level 2 inputs. | | | | | | | | | | | |
| As of |
| | December 31, 2023 | | December 31, 2022 |
| | (In millions) |
| Forward starting interest rate swaps | $ | 41.6 | | | 40.0 | |
| Foreign currency forwards | (1.4) | | | 7.6 | |
| Commodity swaps and options | (30.4) | | | 69.0 | |
| Total | $ | 9.8 | | | $ | 116.6 | |
As of December 31, 2023 and December 31, 2022, we had no significant transfers between Level 1 and Level 2. New derivative contracts transacted during 2023 were all included in Level 2.
Results of Period Derivative Activity
The following tables include the year-to-date results of our derivative activity in our consolidated balance sheets as of December 31, 2023 and December 31, 2022, and our consolidated statements of operations for the years ended December 31, 2023, December 31, 2022 and December 31, 2021.
Fair Value of Derivative Instruments in the Consolidated Balance Sheets (in millions) | | | | | | | | | | | | | | | | | | | | | | | | | | | | | |
| | December 31, 2023 |
| | | | Asset derivatives | | Liability derivatives |
| | Notional amount | | Balance sheet location | | Fair value | | Balance sheet location | | Fair value |
| Derivatives designated as hedging instruments: | | | | | | |
| | | | | | | | | |
| Forward starting interest rate swaps | $ | 1,000.0 | | | Other non-current assets | | $ | 41.6 | | | Other liabilities | | $ | — | |
| Foreign currency forwards | $ | 219.4 | | | Other current assets | | 1.1 | | | Accounts payable and other current liabilities | | (1.2) | |
| | | Other non-current assets | | — | | | Other liabilities | | (1.3) | |
| Total derivatives designated as hedging instruments | | | | $ | 42.7 | | | | | $ | (2.5) | |
| Derivatives not designated as hedging instruments: | | | | | | |
Commodity swaps(1) | $ | 653.5 | | | Other current assets | | $ | 11.1 | | | Accounts payable and other current liabilities | | $ | (42.0) | |
| | | Other non-current assets | | 6.6 | | | Other liabilities | | (6.1) | |
Commodity options(1) | $ | 21.7 | | | Other current assets | | 0.2 | | | Accounts payable and other current liabilities | | (0.2) | |
| | | | | | | | | |
| | | | | | | | | |
| Total derivatives not designated as hedging instruments | | $ | 17.9 | | | | | $ | (48.3) | |
| | | | | | | | | | | | | | | | | | | | | | | | | | | | | |
| | December 31, 2022 |
| | | | Asset derivatives | | Liability derivatives |
| | Notional amount | | Balance sheet location | | Fair value | | Balance sheet location | | Fair value |
| Derivatives designated as hedging instruments: | | | | | | |
| | | | | | | | | |
| Forward starting interest rate swaps | $ | 1,000.0 | | | Other non-current assets | | $ | 40.0 | | | Other liabilities | | $ | — | |
| Foreign currency forwards | $ | 176.6 | | | Other current assets | | 6.2 | | | Accounts payable and other current liabilities | | (0.1) | |
| | | Other non-current assets | | 1.6 | | | Other liabilities | | (0.1) | |
| Total derivatives designated as hedging instruments | | | | $ | 47.8 | | | | | $ | (0.2) | |
| Derivatives not designated as hedging instruments: | | | | | | |
Commodity swaps(1) | $ | 525.2 | | | Other current assets | | $ | 86.1 | | | Accounts payable and other current liabilities | | $ | (14.1) | |
| | | Other non-current assets | | 7.4 | | | Other liabilities | | (10.4) | |
Commodity options(1) | $ | 19.7 | | | Other current assets | | 0.8 | | | Accounts payable and other current liabilities | | (0.8) | |
| Total derivatives not designated as hedging instruments | | $ | 94.3 | | | | | $ | (25.3) | |
(1)During 2019, we received a paymentNotional includes offsetting buy and recorded a gainsell positions, shown in terms of CAD 2.0 million, or $1.5 million, resulting from a purchase price agreement related to the historical sale of Molson Inc.'s ownership interestabsolute value. Buy and sell positions are shown gross in the Montreal Canadiens, which is considered an affiliateasset and/or liability position, as appropriate.
The Pretax Effect of MCBC. Cash Flow Hedge Accounting on Other Comprehensive Income (Loss), Accumulated Other Comprehensive Income (Loss), and Income (Loss) (in millions): | | | | | | | | | | | | | | | | | | | | |
| Derivatives in cash flow hedge relationships | | Amount of gain
(loss) recognized
in OCI on derivatives | | Location of gain (loss)
reclassified from AOCI into
income | | Amount of gain
(loss) recognized
from AOCI into income on
derivative |
| For the year ended December 31, 2023 | | | | | | |
| Forward starting interest rate swaps | | $ | 1.6 | | | Interest income (expense), net | | $ | (5.2) | |
| Foreign currency forwards | | (5.2) | | | Cost of goods sold | | 4.9 | |
| | | | Other non-operating income (expense), net | | (1.0) | |
| Total | | $ | (3.6) | | | | | $ | (1.3) | |
| For the year ended December 31, 2022 | | | | | | |
| Forward starting interest rate swaps | | $ | 198.9 | | | Interest income (expense), net | | $ | (14.3) | |
| Foreign currency forwards | | 10.8 | | | Cost of goods sold | | 1.8 | |
| | | | Other non-operating income (expense), net | | (0.4) | |
| Total | | $ | 209.7 | | | | | $ | (12.9) | |
| For the year ended December 31, 2021 | | | | | | |
| Forward starting interest rate swaps | | $ | 50.7 | | | Interest income (expense), net | | $ | (4.8) | |
| Foreign currency forwards | | 0.4 | | | Cost of goods sold | | (3.5) | |
| | | | Other non-operating income (expense), net | | 0.8 | |
| Total | | $ | 51.1 | | | | | $ | (7.5) | |
The Pretax Effect of Net Investment Hedge Accounting on Other Comprehensive Income (Loss), Accumulated Other Comprehensive Income (Loss) and Income (Loss) (in millions)
| | | | | | | | | | | | | | | | | | | | |
| Net investment hedge relationships | | Amount of gain
(loss) recognized
in OCI | | Location of gain (loss) recognized in income (amount excluded from effectiveness testing) | | Amount of gain (loss) recognized in income (amount excluded from effectiveness testing)(1) |
| For the year ended December 31, 2023 | | | | | | |
| | | | | | |
| EUR 800 million notes due 2024 | | $ | (26.5) | | | Other non-operating income (expense), net | | $ | — | |
| Total | | $ | (26.5) | | | | | $ | — | |
| For the year ended December 31, 2022 | | | | | | |
| | | | | | |
| EUR 800 million notes due 2024 | | $ | 53.2 | | | Other non-operating income (expense), net | | $ | — | |
| Total | | $ | 53.2 | | | | | $ | — | |
| For the year ended December 31, 2021 | | | | | | |
| Cross currency swaps | | $ | 8.8 | | | Interest income (expense), net | | $ | 6.1 | |
| EUR 800 million notes due 2024 | | 67.7 | | | Other non-operating income (expense), net | | — | |
| Total | | $ | 76.5 | | | | | $ | 6.1 | |
(1)Represents amounts excluded from the assessment of effectiveness for which the difference between changes in fair value and period amortization is recorded in OCI.
The cumulative translation adjustments related to our net investment hedges remain in AOCI until the respective underlying net investment is sold or liquidated. During the years ended December 31, 2023, December 31, 2022 and December 31, 2021, respectively, we did not reclassify any amounts related to net investment hedges from AOCI into earnings.
We expect net losses of approximately $3 million (pretax) recorded in AOCI as of December 31, 2023 will be reclassified into earnings within the next 12 months. For derivatives designated in cash flow hedge relationships, the maximum length of time over which forecasted transactions are hedged as of December 31, 2023 is approximately 3 years, including those related to our forecasted debt issuances in 2026.
The Effect of Derivatives Not Designated as Hedging Instruments on the Consolidated Statements of Operations (in millions):
| | | | | | | | | | | | | | |
| Derivatives not in hedging relationship | | Location of gain (loss) recognized
in income on derivative | | Amount of gain (loss) recognized
in income on derivative |
| For the year ended December 31, 2023 | | | | |
| Commodity swaps | | Cost of goods sold | | $ | (61.7) | |
| | | | |
| Foreign currency swaps | | Other non-operating income (expense), net | | 2.7 | |
| | | | |
| | | | |
| Total | | | | $ | (59.0) | |
| For the year ended December 31, 2022 | | | | |
| Commodity swaps | | Cost of goods sold | | $ | 42.6 | |
| | | | |
| | | | |
| | | | |
| | | | |
| Total | | | | $ | 42.6 | |
| For the year ended December 31, 2021 | | | | |
| Commodity swaps | | Cost of goods sold | | $ | 403.4 | |
| Commodity options | | Cost of goods sold | | 0.1 | |
| | | | |
| Warrants | | Other non-operating income (expense), net | | (0.3) | |
| | | | |
| Total | | | | $ | 403.2 | |
11. Employee Retirement Plans and Postretirement Benefits
We maintain retirement plans for the majority of our employees. Depending on the location and benefit program, we provide either defined benefit pension or defined contribution plans to our employees. Each plan is managed locally and in accordance with respective local laws and regulations. We have defined benefit pension plans in the U.S., U.K. and Canada. Additionally, we offer OPEB plans to a portion of our Canadian, U.S. and Central European employees which are unfunded plans. BRI and BDL maintain defined benefit, defined contribution and postretirement benefit plans as well; however, those plans are excluded from this disclosure as BRI and BDL are equity method investments and not consolidated.
6.In the U.S., we participate in and make contributions to multi-employer pension plans. Contributions to multi-employer pension plans were $4.1 million, $3.6 million and $7.1 million for the years ended December 31, 2023, 2022 and 2021, respectively. Additionally, the U.S. postretirement health plan qualifies for the federal subsidy under the Medicare Prescription Drug Improvement and Modernization Act of 2003 (“the Act”) because the prescription drug benefits provided under our postretirement health plan for Medicare eligible retirees generally require lower premiums from covered retirees and have lower co-payments and deductibles than the benefits provided in Medicare Part D and, accordingly, are actuarially equivalent to or better than the benefits provided under the Act. The benefits paid, including prescription drugs, were $31.2 million, $33.0 million and $33.8 million for the years ended December 31, 2023, 2022 and 2021, respectively. There were no subsidies received for the years ended December 31, 2023, 2022 and 2021.
Defined Benefit and OPEB Plans
Net Periodic Pension and OPEB (Benefit) Cost
| | | | | | | | | | | | | | | | | | | | | | | | | | | | | | | | | | | | | | | | | | | | | | | | | | | | | |
| For the years ended |
| | December 31, 2023 | | December 31, 2022 | | December 31, 2021 |
| | Pension | | OPEB | | Consolidated | | Pension | | OPEB | | Consolidated | | Pension | | OPEB | | Consolidated |
| | (In millions) |
| Service cost | | | | | | | | | | | | | | | | | |
| Service cost | $ | 0.9 | | | $ | 3.3 | | | $ | 4.2 | | | $ | 1.3 | | | $ | 5.5 | | | $ | 6.8 | | | $ | 2.7 | | | $ | 6.0 | | | $ | 8.7 | |
| Other pension and postretirement (benefit) cost, net | | | | | | | | | | | | | | | | | |
| Interest cost | 140.4 | | | 22.5 | | | 162.9 | | | 103.9 | | | 16.1 | | | 120.0 | | | 93.9 | | | 14.6 | | | 108.5 | |
| Expected return on plan assets, net of expenses | (157.8) | | | — | | | (157.8) | | | (154.2) | | | — | | | (154.2) | | | (161.6) | | | — | | | (161.6) | |
| Amortization of prior service (benefit) cost | 0.3 | | | (0.7) | | | (0.4) | | | 0.3 | | | (0.7) | | | (0.4) | | | 0.4 | | | (0.7) | | | (0.3) | |
| Amortization of net actuarial (gain) loss | 17.1 | | | (31.7) | | | (14.6) | | | 5.6 | | | (10.2) | | | (4.6) | | | 8.7 | | | (6.7) | | | 2.0 | |
Curtailment, settlement or special termination benefit (gain) loss(1) | — | | | — | | | — | | | 2.9 | | | — | | | 2.9 | | | 5.4 | | | — | | | 5.4 | |
| Expected participant contributions | (0.3) | | | — | | | (0.3) | | | (0.3) | | | — | | | (0.3) | | | (0.4) | | | — | | | (0.4) | |
| Total other pension and postretirement (benefit) cost, net | (0.3) | | | (9.9) | | | (10.2) | | | (41.8) | | | 5.2 | | | (36.6) | | | (53.6) | | | 7.2 | | | (46.4) | |
| | | | | | | | | | | | | | | | | |
| Net periodic pension and OPEB (benefit) cost | $ | 0.6 | | | $ | (6.6) | | | $ | (6.0) | | | $ | (40.5) | | | $ | 10.7 | | | $ | (29.8) | | | $ | (50.9) | | | $ | 13.2 | | | $ | (37.7) | |
(1)The pension settlement charge recognized for the year ended December 31, 2022 primarily consisted of a settlement loss of $8.0 million that was recorded as a result of the annuity purchase for a certain Canadian pension plan, partially offset by a settlement gain of $5.3 million that was recorded as a result of the annuity purchase for a portion of our U.S. qualified pension plan.
The pension settlement charge recognized for the year ended December 31, 2021 was due to lump sum distributions allowed for under the U.K. pension plan being in excess of interest cost for the year ended December 31, 2021. Lower interest cost for the year ended December 31, 2021 was primarily a result of lower interest rates as of December 31, 2020, which were used to establish the 2021 periodic pension cost.
Obligations and Changes in Funded Status
| | | | | | | | | | | | | | | | | | | | | | | | | | | | | | | | | | | |
| For the year ended December 31, 2023 | | For the year ended December 31, 2022 |
| Pension | | OPEB | | Total | | Pension | | OPEB | | Total |
| (In millions) |
| Change in benefit obligation | | | | | | | | | | | |
| Prior year benefit obligation | $ | 2,978.0 | | | $ | 478.3 | | | $ | 3,456.3 | | | $ | 5,095.8 | | | $ | 648.7 | | | $ | 5,744.5 | |
| Service cost, net of expected employee contributions | 0.6 | | | 3.3 | | | 3.9 | | | 1.0 | | | 5.5 | | | 6.5 | |
| Interest cost | 140.4 | | | 22.5 | | | 162.9 | | | 103.9 | | | 16.1 | | | 120.0 | |
| Actual employee contributions | 0.3 | | | — | | | 0.3 | | | 0.3 | | | — | | | 0.3 | |
| Actuarial (gain) loss | 38.0 | | | 1.3 | | | 39.3 | | | (1,181.0) | | | (144.6) | | | (1,325.6) | |
| Plan amendments | — | | | — | | | — | | | — | | | (0.1) | | | (0.1) | |
| Benefits paid | (226.2) | | | (37.0) | | | (263.2) | | | (263.8) | | | (38.7) | | | (302.5) | |
| Curtailment, settlement and special termination | — | | | — | | | — | | | (460.6) | | | 0.2 | | | (460.4) | |
| Foreign currency exchange rate change | 87.0 | | | 2.2 | | | 89.2 | | | (317.6) | | | (8.8) | | | (326.4) | |
| Benefit obligation at end of year | $ | 3,018.1 | | | $ | 470.6 | | | $ | 3,488.7 | | | $ | 2,978.0 | | | $ | 478.3 | | | $ | 3,456.3 | |
| Change in plan assets | | | | | | | | | | | |
| Prior year fair value of assets | $ | 3,336.8 | | | $ | — | | | $ | 3,336.8 | | | $ | 5,667.5 | | | $ | — | | | $ | 5,667.5 | |
| Actual return on plan assets | 188.7 | | | — | | | 188.7 | | | (1,272.9) | | | — | | | (1,272.9) | |
| Employer contributions | (1.7) | | | 37.0 | | | 35.3 | | | (0.5) | | | 38.7 | | | 38.2 | |
| Actual employee contributions | 0.3 | | | — | | | 0.3 | | | 0.3 | | | — | | | 0.3 | |
| Curtailment, settlement and special termination | — | | | — | | | — | | | (460.6) | | | — | | | (460.6) | |
| Benefits and plan expenses paid | (226.2) | | | (37.0) | | | (263.2) | | | (263.8) | | | (38.7) | | | (302.5) | |
| Foreign currency exchange rate change | 99.0 | | | — | | | 99.0 | | | (333.2) | | | — | | | (333.2) | |
| Fair value of plan assets at end of year | $ | 3,396.9 | | | $ | — | | | $ | 3,396.9 | | | $ | 3,336.8 | | | $ | — | | | $ | 3,336.8 | |
| Funded status | $ | 378.8 | | | $ | (470.6) | | | $ | (91.8) | | | $ | 358.8 | | | $ | (478.3) | | | $ | (119.5) | |
| Amounts recognized in the Consolidated Balance Sheets | | | | | | | | | | | |
| Other non-current assets | $ | 416.9 | | | $ | — | | | $ | 416.9 | | | $ | 397.2 | | | $ | — | | | $ | 397.2 | |
| Accounts payable and other current liabilities | (3.6) | | | (39.3) | | | (42.9) | | | (3.9) | | | (39.5) | | | (43.4) | |
| Pension and postretirement benefits | (34.5) | | | (431.3) | | | (465.8) | | | (34.5) | | | (438.8) | | | (473.3) | |
| Net amounts recognized | $ | 378.8 | | | $ | (470.6) | | | $ | (91.8) | | | $ | 358.8 | | | $ | (478.3) | | | $ | (119.5) | |
The accumulated benefit obligation for our defined benefit pension plans was approximately $3.0 billion as of December 31, 2023 and December 31, 2022, respectively.
As of December 31, 2023 and December 31, 2022, certain defined benefit pension plans in the U.S., Canada and the U.K. were overfunded as a result of our ongoing de-risking strategy. Information for our defined benefit pension plans that had aggregate accumulated benefit obligations and projected benefit obligations in excess of plan assets was as follows:
| | | | | | | | | | | |
| As of |
| December 31, 2023 | | December 31, 2022 |
| (In millions) |
| Accumulated benefit obligation | $ | 38.1 | | | $ | 38.4 | |
| Projected benefit obligation | $ | 38.1 | | | $ | 38.4 | |
| Fair value of plan assets | $ | — | | | $ | — | |
Information for OPEB plans with an accumulated postretirement benefit obligation in excess of plan assets has been disclosed above in "Obligations and Changes in Funded Status" as all of our OPEB plans are unfunded.
Accumulated Other Comprehensive Income (Loss)
Amounts recognized in AOCI not yet recognized as components of net periodic pension and OPEB cost, pretax, were as follows:
| | | | | | | | | | | | | | | | | | | | | | | | | | | | | | | | | | | |
| As of December 31, 2023 | | As of December 31, 2022 |
| Pension | | OPEB | | Total | | Pension | | OPEB | | Total |
| (In millions) |
| Net actuarial (gain) loss | $ | 773.3 | | | $ | (260.4) | | | $ | 512.9 | | | $ | 766.4 | | | $ | (278.2) | | | $ | 488.2 | |
| Net prior service (benefit) cost | 9.4 | | | (1.7) | | | 7.7 | | | 9.7 | | | (0.8) | | | 8.9 | |
| Total not yet recognized | $ | 782.7 | | | $ | (262.1) | | | $ | 520.6 | | | $ | 776.1 | | | $ | (279.0) | | | $ | 497.1 | |
Assumptions
Periodic pension and OPEB cost is actuarially calculated annually for each individual plan based on data available and assumptions made at the beginning of each year. Assumptions used in the calculation include the discount rate selected and disclosed at the end of the previous year as well as other assumptions detailed in the table below. The weighted-average rates used in determining the periodic pension and OPEB cost for the years ended December 31, 2023, 2022 and 2021 were as follows:
| | | | | | | | | | | | | | | | | | | | | | | | | | | | | | | | | | | |
| | For the years ended |
| | December 31, 2023 | | December 31, 2022 | | December 31, 2021 |
| | Pension | | OPEB | | Pension | | OPEB | | Pension | | OPEB |
| Weighted-average assumptions: | | | | | | | | | | | |
| Discount rate | 5.01% | | 4.90% | | 2.27% | | 2.59% | | 1.84% | | 2.10% |
| Rate of compensation increase | 2.00% | | N/A | | 2.00% | | N/A | | 2.00% | | N/A |
| Expected return on plan assets | 4.91% | | N/A | | 3.11% | | N/A | | 3.03% | | N/A |
| Health care cost trend rate | N/A | | Ranging ratably from 6.50% in 2023 to 3.57% in 2040 | | N/A | | Ranging ratably from 6.00% in 2022 to 3.57% in 2040 | | N/A | | Ranging ratably from 6.00% in 2021 to 3.57% in 2040 |
Benefit obligations are actuarially calculated annually at the end of each year based on the assumptions detailed in the table below. Obligations under the OPEB plans are determined by the application of the terms of medical, dental, vision and life insurance plans, together with relevant actuarial assumptions and health care cost trend rates. The weighted-average rates used in determining the projected benefit obligation for defined pension plans and the accumulated postretirement benefit obligation for OPEB plans, as of December 31, 2023 and December 31, 2022, were as follows: | | | | | | | | | | | | | | | | | | | | | | | |
| As of December 31, 2023 | | As of December 31, 2022 |
| Pension | | OPEB | | Pension | | OPEB |
| Weighted-average assumptions | | | | | | | |
| Discount rate | 4.74% | | 4.64% | | 5.01% | | 4.90% |
| Rate of compensation increase | 2.00% | | N/A | | 2.00% | | N/A |
| Health care cost trend rate | N/A | | Ranging ratably from 6.75% in 2024 to 3.57% in 2040 | | N/A | | Ranging ratably from 6.50% in 2023 to 3.57% in 2040 |
The change to the weighted-average discount rates used for our defined benefit pension plans and postretirement plans as of December 31, 2023 from December 31, 2022, was primarily due to a decrease in interest rates at the end of 2023 across all plans.
Investment Strategy
The obligations of our defined benefit pension plans in the U.S., Canada and the U.K. are supported by assets held in trusts for the payment of future benefits. The business segments are obligated to adequately fund these asset trusts. The underlying investments within our defined benefit pension plans include: cash and short-term instruments, debt securities, equity securities, investment funds, and other investments including derivatives, hedge fund of funds and real estate. Investment allocations reflect the customized strategies of the respective plans.
The plans use liability driven investment strategies in managing defined pension benefits. For all defined benefit pension plan assets, the plans have the following primary investment objectives:
(1)optimize the long-term return on plan assets at an acceptable level of risk and manage projected future cash contributions;
(2)maintain a broad diversification across asset classes and among investment managers; and
(3)manage the risk level of the plans' assets in relation to the plans' liabilities.
Each plan's respective allocation targets promote optimal expected return and volatility characteristics given a focus on a long-term time horizon for fulfilling the plans' obligations. All assets are managed by external investment managers with an intent to either match or outperform their benchmark. The plans use different asset managers in the U.S., U.K. and Canada and each plan's respective asset allocation could be impacted by a change in asset managers.
Our investment strategies for our defined benefit pension plans also consider the funded status for each plan. For defined benefit pension plans that are highly funded, assets are invested primarily in fixed income holdings that have a similar duration to the associated liabilities. For plans with lower funding levels, the fixed income component is managed in a similar manner to the highly funded plans. In addition to this liability-matching fixed income allocation, these plans also contain exposure to return generating assets including: equities, real estate, debt and other investments held with the goal of producing higher returns, which may also have a higher risk profile. These investments are diversified by investing globally with limitations placed on issuer concentration.
Both our U.K. and Canadian plans hedge a portion of the foreign exchange exposure between plan assets that are not denominated in the local plan currency and the local currency as the Canadian and U.K. pension liabilities will be settled in CAD and GBP, respectively.
Target Allocations
The following compares target asset allocation percentages with actual asset allocations on a weighted-average asset basis as of December 31, 2023.
| | | | | | | | | | | |
| | Target
allocations | | Actual
allocations |
| Equities | 7.2% | | 7.8% |
| Fixed income | 74.2% | | 72.2% |
| | | |
| Real estate | 4.7% | | 4.8% |
| Annuities and longevity swap | 13.4% | | 13.4% |
| Other | 0.5% | | 1.8% |
Significant Concentration Risks
We periodically evaluate our defined benefit pension plan assets for concentration risks. As of December 31, 2023, we did not have any individual underlying asset position that composed a significant concentration of each plan's overall assets. However, we currently have significant plan assets invested in U.K., U.S. and Canadian government fixed income holdings. A provisional credit rating downgrade for any of these governments could negatively impact the asset values.
Further, as our benefit plans maintain exposure to non-government investments, a significant system-wide increase in credit spreads would also negatively impact the reported plan asset values. In general, equity and fixed income risks have been mitigated by company-specific concentration limits and by utilizing multiple equity managers. We do have significant amounts of assets invested with individual fixed income and hedge fund managers, therefore, the plans use outside investment consultants to aid in the oversight of these managers and fund performance.
Valuation Techniques
We use a variety of industry accepted valuation techniques to value our plan assets. The techniques vary depending upon instrument type. Whenever possible, we prioritize the use of observable market data in our valuation processes. We use market, income and cost approaches to value our plan assets as of period end. See Note 1, "Basis of Presentation and Summary of Significant Accounting Policies" for additional information on our fair value methodologies and accounting policies. We have not changed our fair value techniques used to value plan assets this year. Major Categories of Plan Assets
As of December 31, 2023, our major categories of plan assets included the following:
•Cash and short-term instruments—Includes cash, trades awaiting settlement, bank deposits, short-term bills and short-term notes. Our "trades awaiting settlement" category includes payables and receivables associated with asset purchases and sales that are awaiting final cash settlement as of year end due to the use of trade date accounting for our pension plans assets. These payables normally settle within a few business days of the purchase or sale of the respective asset. We include these items in Level 1 of this hierarchy, as the values are derived from quoted prices in active markets. Short-term instruments are included in Level 2 of the fair value hierarchy as these are highly liquid instruments that are valued using observable inputs, but their asset values are not publicly quoted.
•Debt securities—Includes various government and corporate fixed income securities, interest and inflation-linked assets such as bonds and swaps, collateralized securities and other debt securities. The majority of the plans' fixed income assets trade on "over the counter" exchanges, which provides observable inputs that are the primary data used to determine each individual investment's fair value. We also use independent pricing vendors, as well as matrix pricing techniques. Matrix pricing uses observable data from other similar investments as the primary input to determine the individual security's fair value. Government and corporate fixed income securities are generally classified as Level 2 in the fair value hierarchy as they are valued using observable inputs. Assets included in our collateralized securities include mortgage backed securities and collateralized mortgage obligations, which are considered Level 3 due to the use of the significant unobservable inputs in deriving these assets' fair values.
•Annuities and longevity swap—Includes assets to mitigate risks of certain plans including buy-in annuities and longevity swap insurance contracts. Non-participating annuity buy-in insurance policies are purchased to mitigate volatility in cash flows associated with a portion of covered plan members. The fair value of non-participating contracts fluctuate based on changes in the obligation associated with covered plan members. The longevity swap insurance contract alleviates risk from fluctuations in estimated life expectancy of covered participants. The fair value of the longevity swap insurance contract is calculated by taking the present value of the expected cash flows from the floating leg on a prevailing market best estimate of mortality, including market views of fees, less the present value of the fixed leg payments that the plan is required to make under the contract including the contractual fees. The prevailing market best estimate of mortality is determined based on the effect of actual plan mortality experience of covered participants, a revised view on future improvements in mortality rates and a view on how risk fees have changed for this type of contract since inception. These values are considered Level 3 due to the use of the significant unobservable inputs used in deriving the asset's fair value.
•Other—Includes repurchase agreements, recoverable taxes for taxes paid and awaiting reclaim due to the tax exempt nature of the pension plan and private equity. Repurchase agreements are agreements where our plan has created an asset exposure using borrowed assets, creating a repurchase agreement liability, to facilitate the trade. The assets associated with the repurchase agreement are included in the other category in the fair value hierarchy, and the corresponding repurchase agreement liability is classified as Level 1 in the hierarchy, as the liability is valued using quoted prices in active markets. When determining the presentation of our target and asset allocations for repurchase agreements, we are viewing the asset type, as opposed to the investment vehicle, and accordingly include the associated assets within fixed income, specifically interest and inflation linked assets. We include recoverable tax items in Level 1 of this hierarchy, as these are cash receivables and the values are derived from quoted prices in active markets. Private equity is included in Level 3 as the values are based upon the use of unobservable inputs.
•NAV per share practical expedient—Includes our debt funds, equity funds, hedge funds, real estate fund holdings and private equity funds. The market values for these funds are based on the net asset values multiplied by the number of shares owned.
Fair Value Hierarchy
The following presents our fair value hierarchy for our defined benefit pension plan assets excluding investments using the NAV per share practical expedient (in millions):
| | | | | | | | | | | | | | | | | | | | | | | |
| | | | Fair value measurements as of December 31, 2023 |
| | Total as of December 31, 2023 | | Quoted prices
in active
markets
(Level 1) | | Significant
observable
inputs
(Level 2) | | Significant
unobservable
inputs
(Level 3) |
| Cash and cash equivalents | | | | | | | |
| Cash | $ | 39.5 | | | $ | 39.5 | | | $ | — | | | $ | — | |
| Trades awaiting settlement | — | | | — | | | — | | | — | |
| Bank deposits, short-term bills and notes | 26.4 | | | — | | | 26.4 | | | — | |
| Debt | | | | | | | |
| Government debt securities | 452.3 | | | — | | | 452.3 | | | — | |
| Corporate debt securities | 119.3 | | | — | | | 119.3 | | | — | |
| Interest and inflation linked assets | 629.9 | | | — | | | 616.0 | | | 13.9 | |
| Collateralized debt securities | 0.3 | | | — | | | — | | | 0.3 | |
| | | | | | | |
| | | | | | | |
| | | | | | | |
| | | | | | | |
| Annuities and longevity swap | | | | | | | |
| Buy-in annuities and longevity swap | 449.8 | | | — | | | — | | | 449.8 | |
| Other | | | | | | | |
| | | | | | | |
| Repurchase agreements | (285.8) | | | (285.8) | | | — | | | — | |
| Recoverable taxes | 0.2 | | | 0.2 | | | — | | | — | |
| | | | | | | |
| Private equity | 10.6 | | | — | | | — | | | 10.6 | |
| Total fair value of investments excluding NAV per share practical expedient | $ | 1,442.5 | | | $ | (246.1) | | | $ | 1,214.0 | | | $ | 474.6 | |
The following presents our total fair value of plan assets including the NAV per share practical expedient for our defined benefit pension plan assets:
| | | | | |
| Total as of December 31, 2023 |
| (In millions) |
| Fair value of investments excluding NAV per share practical expedient | $ | 1,442.5 | |
| Fair value of investments using NAV per share practical expedient | |
| Debt funds | 1,263.9 | |
| Equity funds | 260.7 | |
| Real estate funds | 126.3 | |
| |
| Private equity funds | 37.8 | |
| Hedge funds | 265.7 | |
| Total fair value of plan assets | $ | 3,396.9 | |
The following presents our fair value hierarchy for our defined benefit pension plan assets excluding investments using the NAV per share practical expedient (in millions):
| | | | | | | | | | | | | | | | | | | | | | | |
| | | | Fair value measurements as of December 31, 2022 |
| | Total as of December 31, 2022 | | Quoted prices
in active
markets
(Level 1) | | Significant
observable
inputs
(Level 2) | | Significant
unobservable
inputs
(Level 3) |
| Cash and cash equivalents | | | | | | | |
| Cash | $ | 99.3 | | | $ | 99.3 | | | $ | — | | | $ | — | |
| Trades awaiting settlement | 32.7 | | | 32.7 | | | — | | | — | |
| Bank deposits, short-term bills and notes | 7.0 | | | — | | | 7.0 | | | — | |
| Debt | | | | | | | |
| Government debt securities | 422.6 | | | — | | | 422.6 | | | — | |
| Corporate debt securities | 89.1 | | | — | | | 89.1 | | | — | |
| Interest and inflation linked assets | 420.6 | | | — | | | 408.0 | | | 12.6 | |
| Collateralized debt securities | 0.2 | | | — | | | — | | | 0.2 | |
| Annuities and longevity swap | | | | | | | |
| Buy-in annuities and longevity swap | 461.8 | | | — | | | — | | | 461.8 | |
| Other | | | | | | | |
| | | | | | | |
| Repurchase agreements | (281.2) | | | (281.2) | | | — | | | — | |
| Recoverable taxes | 0.1 | | | 0.1 | | | — | | | — | |
| Private equity | 12.4 | | | — | | | — | | | 12.4 | |
| | | | | | | |
| Total fair value of investments excluding NAV per share practical expedient | $ | 1,264.6 | | | $ | (149.1) | | | $ | 926.7 | | | $ | 487.0 | |
The following presents our fair value hierarchy including the NAV per share practical expedient for our defined benefit pension plan assets:
| | | | | |
| Total as of December 31, 2022 |
| (In millions) |
| Fair value of investments excluding NAV per share practical expedient | $ | 1,264.6 | |
| Fair value of investments using NAV per share practical expedient | |
| Debt funds | 1,355.7 | |
| Equity funds | 417.4 | |
| Real estate funds | 130.9 | |
| Private equity funds | 44.7 | |
| Hedge funds | 123.5 | |
| Total fair value of plan assets | $ | 3,336.8 | |
Fair Value: Level Three Rollforward
The following presents our Level 3 Rollforward for our defined pension plan assets excluding investments using the NAV per share practical expedient:
| | | | | |
| Amount |
| (In millions) |
| Balance as of December 31, 2021 | $ | 754.5 | |
| Total gain or loss (realized/unrealized) | |
| Realized gain (loss) | (1.9) | |
| Unrealized gain (loss) included in AOCI | (183.5) | |
| Purchases, issuances, settlements | (6.6) | |
| Foreign exchange translation (loss) gain | (75.5) | |
| Balance as of December 31, 2022 | $ | 487.0 | |
| Total gain or loss (realized/unrealized) | |
| Realized gain (loss) | — | |
| Unrealized gain (loss) included in AOCI | (34.2) | |
| Purchases, issuances, settlements | (2.7) | |
| |
| Foreign exchange translation (loss) gain | 24.5 | |
| Balance as of December 31, 2023 | $ | 474.6 | |
Expected Cash Flows
Defined benefit pension plan contributions in future years will vary based on a number of factors, including actual plan asset returns and interest rates. We fund pension plans to meet the requirements set forth in applicable employee benefits laws. We took and continue to take steps to reduce our exposure to our pension obligations. Such steps include the closure of the U.K. and U.S. pension plans to future earnings of service credit, benefit modifications in certain Canada plans and the entering into of buy-in and buy-out contracts for certain plans. We may also voluntarily increase funding levels to meet financial goals. Our U.K. pension plan is subject to a statutory valuation for funding purposes every three years. The most recent valuation as of June 30, 2022 indicated that the plan does not have a funding deficit relative to the plan's statutory funding objective, and therefore, no MCBC contributions are currently required.
For the year ended December 31, 2024, we expect to make contributions to our defined benefit pension plans of approximately $4 million and benefit payments under our OPEB plans of approximately $39 million based on foreign exchange rates as of December 31, 2023. Additionally, we anticipate utilizing approximately $6 million of surplus from certain Canadian defined benefit pension plans to fund employer contributions to certain Canadian defined contribution plans. BRI and BDL contributions to their respective defined benefit pension plans are excluded here, as they are not consolidated in our financial statements. Plan funding strategies are influenced by employee benefits, tax laws and plan governance documents.
Expected future benefit payments for defined benefit pension and OPEB plans for the next ten years, based on foreign exchange rates as of December 31, 2023, are as follows:
| | | | | | | | | | | | | | |
| Expected benefit payments | | Pension | | OPEB |
| | | (In millions) |
| 2024 | | $ | 233.1 | | | $ | 39.3 | |
| 2025 | | $ | 227.9 | | | $ | 39.1 | |
| 2026 | | $ | 229.0 | | | $ | 38.8 | |
| 2027 | | $ | 229.9 | | | $ | 38.6 | |
| 2028 | | $ | 231.0 | | | $ | 38.5 | |
| 2029-2033 | | $ | 1,170.0 | | | $ | 186.4 | |
Defined Contribution Plans
We offer defined contribution plans for the majority of our U.S., Canadian and U.K. employees. The investment strategy for defined contribution plans are determined by each individual participant from the options we have made available as the plan sponsor. U.S. non-union employees are eligible to participate in qualified defined contribution plans which provide for employer contributions ranging from 5% to 11% of eligible compensation (certain employees were also eligible for additional employer contributions). In addition, U.S. union employees are eligible to participate in a qualified defined contribution plan which provides for employer contributions based on factors associated with various collective bargaining agreements. The employer contributions to the U.K. plans can range up to 10% of employee compensation and in Canada plans range from 4% to 10%. Both employee and employer contributions are made in cash in accordance with participant investment elections.
We recognized costs associated with defined contribution plans of $76.8 million, $73.0 million and $77.8 million for the years ended December 31, 2023, 2022 and 2021, respectively.
In addition, we have other deferred compensation and nonqualified defined contribution plans. We have voluntarily funded these liabilities through rabbi trusts. These assets are invested in publicly traded mutual funds whose performance is expected to closely match changes in the plan liabilities. As of December 31, 2023, and December 31, 2022, the plan liabilities were equal to the plan assets and were included in other liabilities and other assets on our consolidated balance sheets, respectively.
12. Income Tax
Our income (loss) before income taxes on which the provision for income taxes was computed iswas as follows:
| | | | For the years ended | | For the years ended |
| | | December 31, 2021 | | December 31, 2020 | | December 31, 2019 | | December 31, 2023 | | December 31, 2022 | | December 31, 2021 |
| | | (In millions) | | (In millions) |
| Domestic | Domestic | $ | 1,307.5 | | | $ | 1,151.7 | | | $ | 1,136.1 | |
| Foreign | Foreign | (68.5) | | | (1,795.6) | | | (656.2) | |
| Total | Total | $ | 1,239.0 | | | $ | (643.9) | | | $ | 479.9 | |
The components of the provision for income taxes arewere as follows: | | | | For the years ended | | For the years ended |
| | | December 31, 2021 | | December 31, 2020 | | December 31, 2019 | | December 31, 2023 | | December 31, 2022 | | December 31, 2021 |
| | | (In millions) | | (In millions) |
| Current | Current | | | | | | Current | | | |
| Federal | Federal | $ | 43.5 | | | $ | 79.0 | | | $ | 69.1 | |
| State | State | 7.1 | | | 5.2 | | | 9.4 | |
| Foreign | Foreign | (1.0) | | | 111.4 | | | 46.7 | |
| Total current tax (benefit) expense | Total current tax (benefit) expense | $ | 49.6 | | | $ | 195.6 | | | $ | 125.2 | |
| Deferred | Deferred | | | | | | Deferred | | | |
| Federal | Federal | $ | 163.5 | | | $ | 101.9 | | | $ | 128.3 | |
| State | State | 70.4 | | | 19.5 | | | 22.2 | |
| Foreign | Foreign | (53.0) | | | (15.2) | | | (42.0) | |
| Total deferred tax (benefit) expense | Total deferred tax (benefit) expense | $ | 180.9 | | | $ | 106.2 | | | $ | 108.5 | |
| Total income tax (benefit) expense | Total income tax (benefit) expense | $ | 230.5 | | | $ | 301.8 | | | $ | 233.7 | |
A reconciliation from the U.S. statutory federal income tax rate to the effective income tax rate iswas as follows: | | | | For the years ended | | For the years ended |
| | | December 31, 2021 | | December 31, 2020 | | December 31, 2019 | | December 31, 2023 | | December 31, 2022 | | December 31, 2021 |
| ($ in millions) |
| ($ in millions) | | | ($ in millions) |
| Statutory federal income tax rate | Statutory federal income tax rate | 21.0 | % | | $ | 260.2 | | | 21.0 | % | | $ | (135.2) | | | 21.0 | % | | $ | 100.8 | |
| State income taxes, net of federal benefits | State income taxes, net of federal benefits | 4.7 | % | | 57.8 | | | (1.7) | % | | 11.0 | | | 3.4 | % | | 16.4 | |
| Effect of foreign tax rates | Effect of foreign tax rates | (5.5) | % | | (68.3) | | | 3.5 | % | | (22.3) | | | (21.2) | % | | (101.8) | |
| Effect of foreign tax law and rate changes | Effect of foreign tax law and rate changes | 1.6 | % | | 19.6 | | | (0.9) | % | | 6.0 | | | — | % | | — | |
| Effect of unrecognized tax benefits | Effect of unrecognized tax benefits | (6.2) | % | | (76.3) | | | (26.1) | % | | 167.9 | | | 3.7 | % | | 18.0 | |
| Change in valuation allowance | Change in valuation allowance | (0.1) | % | | (1.1) | | | 1.3 | % | | (8.4) | | | 6.0 | % | | 28.8 | |
| Goodwill impairment | Goodwill impairment | (0.2) | % | | (2.9) | | | (41.4) | % | | 266.8 | | | 36.5 | % | | 175.3 | |
| Other, net | Other, net | 3.3 | % | | 41.5 | | | (2.6) | % | | 16.0 | | | (0.7) | % | | (3.8) | |
| Effective tax rate / Tax (benefit) expense | Effective tax rate / Tax (benefit) expense | 18.6 | % | | $ | 230.5 | | | (46.9) | % | | $ | 301.8 | | | 48.7 | % | | $ | 233.7 | |
The increase in the effective tax rate for the year ended December 31, 2023 when compared to the federal statutory rate was not significant and was due to the impacts of state income taxes, foreign tax rates and the impact of a foreign statutory tax rate change enacted in the fourth quarter of 2023.
The decrease in the effective tax rate for the year ended December 31, 2022 when compared to the federal statutory rate was primarily due to the impact of the $845 million partial goodwill impairment, recorded within our Americas segment in the fourth quarter of 2022, which related to goodwill not deductible for tax purposes.
The decrease to the effective tax rate for fiscalthe year ended December 31, 2021 when compared to the federal statutory rate iswas primarily due to the release of $73 million of reserves for unrecognized tax benefit positions recognized in the third quarter of 2021. The reserve release included amounts for an income tax audit settlement, net of changes in estimates associated with prior period uncertain tax positions, as well as amounts for the expiration of statutes of limitations. Additionally, during the second quarter of 2021, the U.K. government enacted, and royal assent was received for, legislation to increase the corporate income tax rate from 19% to 25%. Remeasurement of our deferred tax liabilities under the higher income tax rate resulted in the recognition of additional discrete tax expense of approximately $18 million in the second quarter of 2021.
On August 16, 2022, the Inflation Reduction Act of 2022 ("IRA") was signed into U.S. law. The decrease toIRA includes a new corporate alternative minimum tax of 15% on the adjusted financial statement income ("AFSI") of corporations with average AFSI exceeding $1.0 billion over a three-year period, effective for tax rateyears beginning after December 31, 2022. The alternative minimum tax did not impact our financial or cash tax position in 2023. Additionally, the IRA imposes an excise tax of 1% on stock repurchases, effective January 1, 2023. The excise tax is recorded as an incremental cost in treasury stock on our consolidated balance sheets and was immaterial for fiscalthe year 2020 when compared to the statutory rate was primarily due to the impact of the $1,484.3 million goodwill impairment, recorded within our EMEA&APAC segment in the fourth quarter of 2020,
of which a majority related to nondeductible goodwill. Additionally, during the second quarter of 2020 we recognized approximately $135 million of tax expense following the enactment of the final U.S. tax hybrid regulations.
The increase in the effective tax rate for fiscal year 2019 when compared to the statutory rate was primarily due to the $668.3 million goodwill impairment recorded within our Americas segment in 2019, increased valuation allowances, and the recognition of other one-time tax expenses.ended December 31, 2023.
Additionally, our foreign businesses operate in jurisdictions with statutory income tax rates that differ from the U.S. Federal statutory rate. Specifically, the statutory income tax rates in the countries in Europe in which we operate range from 9% to 25.8%, and Canada has a combined federal and provincial statutory income tax rate of approximately 26%.
| | | | | | | | | | | |
| | As of |
| | December 31, 2021 | | December 31, 2020 |
| | (In millions) |
| Non-current deferred tax assets | | | |
| Compensation-related obligations | $ | 54.8 | | | $ | 60.9 | |
| Pension and postretirement benefits | 24.5 | | | 102.4 | |
| | | |
| | | |
| Derivative instruments | — | | | 76.5 | |
| Tax credit carryforwards | 38.3 | | | 56.2 | |
| Tax loss carryforwards | 359.0 | | | 331.6 | |
| | | |
| | | |
| Accrued liabilities and other | 97.7 | | | 75.5 | |
| | | |
| Valuation allowance | (60.7) | | | (62.2) | |
| Total non-current deferred tax assets | $ | 513.6 | | | $ | 640.9 | |
| Non-current deferred tax liabilities: | | | |
| Fixed assets | 422.4 | | | 358.3 | |
| Partnerships and investments | 29.7 | | | 19.6 | |
| | | |
| Intangible assets | 2,539.7 | | | 2,396.9 | |
| Derivative instruments | 19.5 | | | — | |
| | | |
| Total non-current deferred tax liabilities | $ | 3,011.3 | | | $ | 2,774.8 | |
| | | |
| Net non-current deferred tax liabilities | $ | 2,497.7 | | | $ | 2,133.9 | |
The overall increase in net deferred tax liabilities of $363.8 million in 2021 was due to the $236.5 million increase in deferred tax liabilities and the decrease in deferred tax assets of $127.3 million. The increase in deferred tax liabilities was primarily due to the amortization of goodwill and indefinite-lived intangible assets for U.S. tax purposes due to the Acquisition. The decrease in the deferred tax assets was due to changes in our unrealized commodity mark to market and pension temporary differences and decreases in our tax credit carryforwards, partially offset by increases in our tax loss carryforwards and future deductible temporary differences generated in 2021. Additionally, our deferred tax balances are impacted by foreign exchange rates, as a significant amount of our deferred tax assets and liabilities are denominated in foreign currency. | | | | | | | | | | | |
| | As of |
| | December 31, 2023 | | December 31, 2022 |
| | (In millions) |
| Deferred tax assets | | | |
| Compensation-related obligations | $ | 43.2 | | | $ | 44.7 | |
| Pension and postretirement benefits | 23.7 | | | 33.7 | |
| | | |
| | | |
| | | |
| Tax credit carryforwards | 36.0 | | | 39.0 | |
| Tax loss carryforwards | 312.8 | | | 291.1 | |
| | | |
| | | |
| Accrued liabilities and other | 202.5 | | | 149.0 | |
| | | |
| Valuation allowance | (61.9) | | | (57.2) | |
| Deferred tax assets | $ | 556.3 | | | $ | 500.3 | |
| Deferred tax liabilities | | | |
| Fixed assets | 354.9 | | | 358.9 | |
| Partnerships and investments | 38.7 | | | 33.2 | |
| | | |
| Intangible assets | 2,679.9 | | | 2,563.2 | |
| Derivative instruments | 12.2 | | | 31.5 | |
| Deferred tax liabilities | $ | 3,085.7 | | | $ | 2,986.8 | |
| | | |
| Net deferred tax liabilities | $ | 2,529.4 | | | $ | 2,486.5 | |
Our deferred tax valuation allowances are primarily the result of uncertainties regarding the future realization of recorded tax benefits on tax loss carryforwards from operations in various jurisdictions. The measurement of deferred tax assets is reduced by a valuation allowance if, based upon available evidence, it is more likely than not that the deferred tax assets will not be realized. We have evaluated the realizability of our deferred tax assets in each jurisdiction by assessing the adequacy of expected taxable income, including the reversal of existing temporary differences, historical and projected operating results and the availability of prudent and feasible tax planning strategies. Based on this analysis, we have determined that the valuation allowances recorded in each period presented are appropriate.
WeAs of December 31, 2023, we have deferred tax assets for U.S. tax loss and credit carryforwards that expire between 20222024 and 20412043 of $71.4$69.5 million as of December 31, 2021, and that expired between 2021 and 2040 of $62.4 million as of December 31, 2020. We have U.S. tax losses that may be carried forward indefinitely of $14.0 million and $19.9 million as of December 31, 2021 and December 31, 2020, respectively.$10.0 million. We have foreign tax loss and credit carryforwards that expire between 20222024 and 20412042 of $286.5$219.1 million as of December 31, 2021, and that expired between 2021 and 2040 of $283.5 million as of December 31, 2020. We have foreign tax losses that may be carried forward indefinitely of $25.4 million and $22.0 million$43.0 million.
The following table presents our net deferred tax liabilities as of December 31,
20212023 and December 31,
2020, respectively. | | | | | | | | | | | |
| | As of |
| | December 31, 2021 | | December 31, 2020 |
| | (In millions) |
| Domestic net non-current deferred tax liabilities | $ | 1,825.9 | | | $ | 1,542.8 | |
| Foreign net non-current deferred tax assets | 180.2 | | | 105.7 | |
| Foreign net non-current deferred tax liabilities | 852.0 | | | 696.8 | |
| Net non-current deferred tax liabilities | $ | 2,497.7 | | | $ | 2,133.9 | |
| | | | | | | | | | | |
| | As of |
| | December 31, 2023 | | December 31, 2022 |
| | (In millions) |
| Domestic deferred tax liabilities | $ | 2,029.7 | | | $ | 1,927.7 | |
| Foreign deferred tax assets | 123.7 | | | 125.8 | |
| Foreign deferred tax liabilities | 623.4 | | | 684.6 | |
| Net deferred tax liabilities | $ | 2,529.4 | | | $ | 2,486.5 | |
The total foreign non-current deferred tax assets above are presented within other assets on the consolidated balance sheets. The totalsheets and domestic and foreign non-current deferred tax liabilities above are presented separatelywithin deferred tax liabilities on the consolidated balance sheets. In addition, theThe deferred tax liability amounts above as of December 31, 20212023 and December 31, 2020, exclude $26.72022 excluded $44.1 million and $142.1$34.0 million, respectively, of unrecognized tax benefits that have been recorded as a reduction of non-current deferred tax assets, which iswas presented within non-current deferred tax liabilities due to jurisdictional netting on the consolidated balance sheets.
A reconciliation of the beginning and ending amounts of unrecognized tax benefits, excluding interest and penalties, iswas as follows:
| | | | For the years ended | | For the years ended |
| | | December 31, 2021 | | December 31, 2020 | | December 31, 2019 | | December 31, 2023 | | December 31, 2022 | | December 31, 2021 |
| | | (In millions) | | (In millions) |
| Balance at beginning of year | Balance at beginning of year | $ | 235.7 | | | $ | 72.4 | | | $ | 51.6 | |
| Additions for tax positions related to the current year | Additions for tax positions related to the current year | 28.6 | | | 22.8 | | | 18.1 | |
| Additions for tax positions of prior years | Additions for tax positions of prior years | — | | | 132.1 | | | — | |
| Reductions for tax positions related to the current year | Reductions for tax positions related to the current year | (24.1) | | | — | | | — | |
| Reductions for tax positions of prior years | Reductions for tax positions of prior years | (48.9) | | | (1.6) | | | — | |
| Settlements | Settlements | (161.8) | | | (0.4) | | | — | |
| Release due to statute expirations | Release due to statute expirations | (3.4) | | | — | | | (0.8) | |
| Foreign currency adjustment | Foreign currency adjustment | 1.9 | | | 10.4 | | | 3.5 | |
| Balance at end of year | Balance at end of year | $ | 28.0 | | | $ | 235.7 | | | $ | 72.4 | |
Our remaining unrecognized tax benefits as of December 31, 2021, relate2023, related to tax years that are currentlywere open to examination. As of December 31, 2023 and December 31, 2022, we had remaining unrecognized tax benefits recorded within other liabilities in our consolidated balance sheets of $5.0 million and $5.4 million, respectively. The remaining balance of our unrecognized tax benefits was recorded within deferred tax liabilities in our consolidated balance sheets. Annual tax provisions includeincluded amounts considered sufficient to pay assessments that may result from examination of prior year tax returns; however, the amount ultimately paid upon resolution of issues may differ materially from the amount accrued.
We recognized interest and penalties related to unrecognized tax benefits as part of income taxes on our consolidated statements of operations. Expense (benefit) recognized on interest and penalties related to unrecognized tax benefits as of December 31, 2023, December 31, 2022, and December 31, 2021 was $0.2 million, $(5.9) million and $1.4 million, respectively. If we were to prevail on all uncertain tax positions, the reversal of this accrual, inclusive of interest and penalties, would result in a benefit of $40.9 million.
During the third quarter of 2021, an income tax audit settlement, which included the resolution of the impact of the final hybrid regulations recorded in the second quarter of 2020, was reached with taxing authorities. The settlement, along with changes to other unrecognized positions resulted in the net reduction of our unrecognized tax benefit position by approximately $250 million, including interest, in the third quarter of 2021. The cash tax payment associated with the settlement, after application of available net operating losses, was made in the fourth quarter of 2021 which totaled approximately $125 million. As of the fourth quarter of 2021,2023, we do not anticipate material changes to our remaining unrecognized tax benefit position within the next 12 months.
| | | | | | | | | | | | | | | | | |
| | For the years ended |
| | December 31, 2021 | | December 31, 2020 | | December 31, 2019 |
| (In millions) |
| Reconciliation of unrecognized tax benefits balance | | | | | |
| Estimated interest and penalties | $ | 0.1 | | | $ | 11.4 | | | $ | 2.9 | |
| | | | | |
| Unrecognized tax positions | 28.0 | | | 235.7 | | | 72.4 | |
| Total unrecognized tax benefits | $ | 28.1 | | | $ | 247.1 | | | $ | 75.3 | |
| | | | | |
| Presented net against non-current deferred tax assets | $ | 26.7 | | | $ | 142.1 | | | $ | 68.4 | |
| Current (included in accounts payable and other current liabilities) | — | | | 98.0 | | | — | |
| Non-current (included within other liabilities) | 1.4 | | | 7.0 | | | 6.9 | |
| Total unrecognized tax benefits | $ | 28.1 | | | $ | 247.1 | | | $ | 75.3 | |
| | | | | |
Amount of unrecognized tax benefits that would impact the effective tax rate, if recognized(1) | $ | 18.6 | | | $ | 87.7 | | | $ | 72.4 | |
(1)Amounts exclude the potential effects of valuation allowances, which may fully or partially offset the impact to the effective tax rate.
We file income tax returns in most of the federal, state and provincial jurisdictions in the U.S., Canada and various countries in Europe. Tax years through 2013 are closed in the U.S. In Canada, tax years through 20162018 are closed or have been effectively settled through examination except for issues relating to intercompany cross-border transactions. The statute of limitations for intercompany cross-border transactions is closed through tax year 2012.2015. Tax years through 20132014 are closed for most European jurisdictions in which we operate, with statutes of limitations varying from 3 to 7 years for most jurisdictions.
When cash is available after satisfying working capital needs and all other business obligations, we may distribute suchcurrent earnings and the associated cash from a foreign subsidiary to its U.S. parent, and record the tax impact associated with the distribution. However, to the extent current earnings of our foreign operations exist and are not otherwise distributed or planned to be distributed, such earnings accumulate. These accumulated earnings are not considered permanently reinvested in our foreign operations. The taxes associated with any future repatriation of undistributed earnings are anticipated to be insignificant.
13. Commitments and Contingencies
Letters of Credit
As of December 31, 2023, we had $54 million outstanding in letters of credit with financial institutions. These letters primarily expire throughout 2024 and $15 million of the letters contain a feature that automatically renews the letter for an additional year if no cancellation notice is submitted. These letters of credit are being maintained as security for deferred compensation payments, reimbursements to insurance companies, reimbursements to the trustee for pension payments, deductibles or retention payments made on our behalf, various payments due to governmental agencies, operations of underground storage tanks and other general business purposes and are not included on our consolidated balance sheets.
Guarantees and Indemnities
We guarantee indebtedness and other obligations to banks and other third parties for some of our equity method investments and consolidated subsidiaries. As of December 31, 2023 and December 31, 2022, the consolidated balance sheets include liabilities related to these guarantees of $36.9 million and $33.3 million, respectively. See Note 3, "Investments" for further detail. Kaiser
In 2006, we sold our entire equity interest in our Brazilian unit, Kaiser, to FEMSA. The terms of the sale agreement require us to indemnify FEMSA for certain exposures related to tax, civil and labor contingencies arising prior to FEMSA's purchase of Kaiser. In addition, we provided an indemnity to FEMSA for losses Kaiser may incur with respect to tax claims associated with certain previously utilized purchased tax credits. We settled a portion of our tax credit indemnity obligation during 2010. The maximum potential claims amount for the remainder of the purchased tax credits was $72.1 million as of December 31, 2023. Our estimate of the indemnity liability for these purchased tax credits as of December 31, 2023 was $8.3 million which is classified as non-current.
Our estimates consider a number of scenarios for the ultimate resolution of these issues, the probabilities of which are influenced not only by legal developments in Brazil but also by management's intentions with regard to various alternatives that could present themselves leading to the ultimate resolution of these issues. The liabilities are impacted by changes in estimates regarding amounts that could be paid, the timing of such payments, adjustments to the probabilities assigned to various scenarios and foreign currency exchange rates. Our indemnity may cover certain fees and expenses that Kaiser incurs to manage any cases finally determined to be unsuccessful through the administrative and judicial systems.
Additionally, we also provided FEMSA with indemnity related to all other tax, civil and labor contingencies existing as of the date of sale. In this regard, however, FEMSA assumed their full share of all of these contingent liabilities that had been previously recorded and disclosed by us prior to the sale on January 13, 2006. However, we may have to provide indemnity to FEMSA if those contingencies settle at amounts greater than those amounts previously recorded or disclosed by us. We will be able to offset any indemnity exposures in these circumstances with amounts that settle favorably to amounts previously recorded. Our exposure related to these indemnity claims is capped at the amount of the sales price of the 68% equity interest of Kaiser, which was $68 million. As a result of these contract provisions, our estimates include not only probability-weighted potential cash outflows associated with indemnity provisions, but also probability-weighted cash inflows that could result from favorable settlements, which could occur through negotiation or settlement programs arising from the federal or any of the various state governments in Brazil. The recorded value of the tax, civil and labor indemnity liability was $3.5 million as of December 31, 2023, which was classified as non-current. For the remaining portion of our indemnity obligations, not deemed probable, we continue to utilize probability-weighted scenarios in determining the value of the indemnity obligations.
Future settlement procedures and related negotiation activities associated with these contingencies are largely outside of our control. The sale agreement requires annual cash settlements relating to the tax, civil and labor indemnities. Due to the uncertainty involved with the ultimate outcome and timing of these contingencies, significant adjustments to the carrying values of the indemnity obligations have been recorded to date and additional future adjustments may be required. These liabilities are denominated in Brazilian Reais and are therefore, subject to foreign exchange gains or losses. As a result, these foreign exchange gains and losses are the only impacts recorded within other non-operating income (expense), net.
Purchase Obligations
We have various long-term supply contracts and distribution agreements with unaffiliated third parties and our joint venture partners to purchase materials used in production and packaging and to provide distribution services. Certain supply contracts provide that we purchase certain minimum levels of materials throughout the terms of the contracts. Additionally, we have various long-term non-cancelable commitments for advertising, sponsorships and promotions, including marketing at sports arenas, stadiums and other venues and events. The future aggregate minimum required commitments under these purchase obligations are shown in the table below based on foreign exchange rates as of December 31, 2023. The amounts in the table do not represent all anticipated payments under long-term contracts. Rather, they represent unconditional, non-cancelable purchase commitments under contracts with remaining terms greater than one year.
| | | | | | | | | | | | | | |
| Year | | Supply and Distribution | | Advertising and Promotions |
| | | (Amounts in millions) |
| 2024 | | $ | 371.9 | | | $ | 150.6 | |
| 2025 | | 232.0 | | | 151.3 | |
| 2026 | | 208.1 | | | 106.4 | |
| 2027 | | 185.2 | | | 80.5 | |
| 2028 | | 194.2 | | | 61.6 | |
| Thereafter | | 182.0 | | | 122.7 | |
| Total | | $ | 1,373.4 | | | $ | 673.1 | |
Total purchases under our long-term unconditional, non-cancellable supply and distribution contracts were approximately $0.4 billion, during each of the years ended December 31, 2023, 2022 and 2021.
Litigation, Other Disputes and Environmental
Related to litigation, other disputes and environmental issues, we had an aggregate accrued contingent liability of $70.2 million and $77.0 million as of December 31, 2023 and December 31, 2022, respectively. While we cannot predict the eventual aggregate cost for litigation, other disputes and environmental matters in which we are currently involved, we believe adequate reserves have been provided for losses that are probable and estimable. Additionally, as noted below, there are certain loss contingencies that we deem reasonably possible for which a range of loss is not estimable at this time; for all other matters, we believe that any reasonably possible losses in excess of the amounts accrued are immaterial to our consolidated financial statements.
We are involved in other disputes and legal actions arising in the ordinary course of our business. While it is not feasible to predict or determine the outcome of these proceedings, in our opinion, based on a review with legal counsel, other than as noted, none of these disputes or legal actions are expected to have a material impact on our business, consolidated financial position, results of operations or cash flows. However, litigation is subject to inherent uncertainties and an adverse result in these or other matters may arise from time to time that may harm our business.
On February 12, 2018, Stone Brewing Company filed a trademark infringement lawsuit in federal court in the Southern District of California against Molson Coors Beverage Company USA LLC ("MCBC USA"), a wholly owned subsidiary of our Company, alleging that the Keystone brand had “rebranded” itself as “Stone” and was marketing itself in a manner confusingly similar to Stone Brewing Company's registered Stone trademark. Stone Brewing Company sought treble damages and disgorgement of MCBC USA's profit from Keystone sales. MCBC USA subsequently filed an answer and counterclaims against Stone Brewing Company. On May 31, 2018, Stone Brewing Company filed a motion to dismiss MCBC USA's counterclaims and for a preliminary injunction seeking to bar MCBC USA from continuing to use “STONE” on Keystone Light cans and related marketing materials. In March 2019, the court denied Stone Brewing Company’s motion for preliminary injunction and its motion to dismiss MCBC USA's counterclaims. The jury trial began on March 7, 2022. The jury returned a verdict in which it concluded that trademark infringement had occurred and awarded Stone Brewing Company $56.0 million in damages. The jury also found that no "willful" trademark infringement had occurred. The trial court subsequently denied Stone Brewing Company’s motion for permanent injunction, motion for disgorgement of profits and motion for treble damages. Judgment was entered on September 8, 2022. Both parties filed post-trial motions, including MCBC USA’s renewed motion for judgment as a matter of law or, in the alternative, a new trial and/or remittitur and Stone Brewing Company’s motion for partial new trial of equitable issues. The court denied both parties' post-trial motions on September 25, 2023. On October 24, 2023, MCBC USA filed a notice of appeal in the 9th Circuit Court of Appeals. As of December 31, 2023 and December 31, 2022, the Company had a recorded accrued liability of $58.5 million and $56.6 million, respectively, within other liabilities on our consolidated balance sheets reflecting the best estimate of probable loss in this case based on the judgment plus associated post-judgment interest. However, it is reasonably possible that the estimate of the loss could change in the near term based on the progression of the case, including the appeals process. We will continue to monitor the status of the case and will adjust the accrual in the period in which any significant change occurs which could impact the estimate of the loss for this matter.
Regulatory Contingencies
The Representative Owners and TBS are parties to an MFA that dictates the terms of the beer distribution and retail systems in Ontario. The initial term of the MFA does not expire until December 31, 2025, and the MFA contains a provision requiring two-year advance notice of the government's intention to not renew the MFA. In December 2023, the Province of Ontario notified the Representative Owners and TBS that it would not expectbe renewing the aggregateMFA after the initial term of these permanently reinvested earnings, which are largelythe MFA expires on December 31, 2025. The Province of Ontario simultaneously announced a set of Key Principles agreed upon between the Province of Ontario, the Representative Owners, and TBS, concerning the intended features of the future marketplace for beer distribution and retail systems in deficit positions for U.S. tax purposes, to result in any material U.S. taxes, if distributed.
7. Special Items
We have incurred charges or realized benefits that either we do not believethe Province of Ontario to be indicativeintroduced no later than January 1, 2026. Under the Key Principles, TBS will continue its retail operations and will continue to be the primary distributor of beer in the Province of Ontario at least through 2031. The Key Principles also state grocery stores, convenience stores, gas stations and big-box retailers in the Province of Ontario will be able to apply for licenses to sell beer, wine, cider and ready-to-drink cocktails starting in 2026. We continue to evaluate the impacts of the Key Principles on our results of operations.
Environmental
When we determine it is probable that a liability for environmental matters or other legal actions exists and the amount of the loss is reasonably estimable, an estimate of the future costs is recorded as a liability in the financial statements. Costs that extend the life, increase the capacity or improve the safety or efficiency of our
core operations,assets or
we believe are
significantincurred to
our current operating results warranting separate classification. As such, we have separately classified these charges (benefits) as special items. | | | | | | | | | | | | | | | | | |
| | For the years ended |
| | December 31, 2021 | | December 31, 2020 | | December 31, 2019 |
| | (In millions) |
| Employee-related charges | | | | | |
| Restructuring | $ | 11.7 | | | $ | 67.6 | | | $ | 52.4 | |
| Impairments or asset abandonment charges | | | | | |
Americas - Asset abandonment(1) | 14.6 | | | 115.8 | | | 38.8 | |
Americas - Impairment losses(2) | — | | | 39.6 | | | 671.7 | |
EMEA&APAC - Asset abandonment(3) | 10.6 | | | 3.7 | | | 1.2 | |
EMEA&APAC - Impairment losses(4) | 13.5 | | | 1,516.2 | | | 12.2 | |
| Termination fees and other (gains) losses | | | | | |
Americas(5) | 0.4 | | | (2.0) | | | (68.3) | |
EMEA&APAC(6) | (6.3) | | | (0.7) | | | 0.8 | |
| Total Special items, net | $ | 44.5 | | | $ | 1,740.2 | | | $ | 708.8 | |
(1)In January 2020, we announced plans to cease production at our Irwindale, California brewery and entered into an option agreement with Pabst, granting Pabst an option to purchase our Irwindale, California brewery, including plant, equipment and machinery and the underlying land for $150 million, subject to adjustment as further specified in the option agreement. Pursuant to the option agreement on May 4, 2020, Pabst exercised its option to purchase the Irwindale brewery and the purchase was completed in the fourth quarter of 2020. Production at the Irwindale brewery ceased during the third quarter of 2020.
Charges associated with the brewery closuremitigate or prevent future environmental contamination may be capitalized. Other environmental costs are expensed when incurred. Total environmental expenditures recognized for the years ended December 31, 20202023, 2022 and 2019 totaled $117.7 million2021 were immaterial to our consolidated statements of operations.
Americas
Our Canada brewing operations are subject to provincial environmental regulations and $15.8 million, respectively, excludinglocal permit requirements. Our Longueuil, Chilliwack and Toronto breweries have water treatment facilities to pre-treat wastewater before it goes to the fourth quarterrespective local governmental facility for final treatment. We have environmental programs in Canada including organization, monitoring and verification, regulatory compliance, reporting, education and training and corrective action.
In Canada, we sold a chemical specialties business in 1996. We are still responsible for certain aspects of 2020 gain on saleenvironmental remediation, undertaken or planned, at those chemical specialties business locations. We have established provisions for the costs of these remediation programs.
In January 2023, MCBC USA received a Notice of Violation / Cease and Desist Order ("Order") from the Colorado Department of Public Health & Environment’s Water Quality Control Division, alleging certain violations of the Colorado Water Quality Control Act (the “Act”) and the Colorado Discharge Permit related to our Company’s brewery of $2.1 million.and facilities in Golden, Colorado. The chargesOrder alleged MCBC USA failed to comply with permit effluent limitations, failed to properly monitor and report sampling results and failed to adhere to the permit compliance schedule.
In the U.S., we were previously notified that we are or may be a potentially responsible party ("PRP") under the Comprehensive Environmental Response, Compensation and Liability Act or similar state laws for the year ended December 31, 2020 primarily consistedcleanup of accelerated depreciationsites where hazardous substances have allegedly been released into the environment. We cannot predict with certainty the total costs of cleanup, our share of the total cost, the extent to which contributions will be available from other parties, the amount of time necessary to complete the cleanups or insurance coverage.
Lowry
We are one of a number of entities named by the Environmental Protection Agency ("EPA") as a PRP at the Lowry Superfund site in Colorado. This landfill is owned by the City and County of Denver ("Denver") and is managed by Waste Management of Colorado, Inc. ("Waste Management"). In 1990, we recorded a pretax charge of $30 million, a portion of which was put into a trust in 1993 as part of a settlement with Denver and Waste Management regarding the then-outstanding litigation. Our settlement was based on an assumed remediation cost of $120 million (in 1992 adjusted dollars). We are obligated to pay a portion of future costs in excess of normal depreciation of $96.0 million and employee related costs of retention and severance of $16.5 million. The employee related costs of retention and severance are includedthat amount.
Waste Management provides us with updated annual cost estimates through 2032. We review these cost estimates in the restructuring line above. The charges for fiscal year 2019 primarily consistedassessment of accelerated depreciation in excess of normal depreciation of $8.0 million and employee related costs of retention and severance of $1.1 million.
We incurred asset abandonment charges,our accrual related to this issue. Our expected liability is based on our best estimates available.
Based on the accelerated depreciation in excess of normal depreciation forassumptions utilized, the year ended December 31, 2019 as a resultpresent value and gross amount of the Vancouver brewery closure which occurred in the third quarter of 2019. In addition, during the years ended December 31, 2021, 2020 and 2019, we incurred accelerated depreciation in excess of normal depreciation related to the Montreal brewery closure which occurred during the fourth quarter of 2021.
(2)Of the $39.6 million of impairment losses recognized in the Americas segment for the year ended December 31, 2020, we recorded aggregate impairment losses of $17.0 million related to certain regional craft brand definite-lived intangible assets during the fourth quarter of 2020. The estimates and assumptions used to determine the fair value represent Level 3 measurements and additional impairment losses may be recognized in the future. The remaining $22.6 million of impairments recognized in 2020 were related to definite-lived tangible assets associated with these regional craft brands.
Of the $671.7 million of impairment losses recognized in the Americas segment in fiscal year 2019, we recorded $668.3 million of goodwill impairment losses related to the Americas reporting unit. See Note 10, "Goodwill and Intangible Assets" for further discussion.(3)We incurred asset abandonment charges in our EMEA&APAC segment in fiscal year 2021 primarily related to accelerated depreciation in excess of normal depreciation for our Burtonwood and Japan locations. Asset abandonment charges in our EMEA&APAC segment in fiscal year 2020 primarily related to the closure of a small brewery in Europe as a result of the ongoing impacts of the coronavirus pandemic. Further, as a result of our continued strategic review of our European supply chain network, during 2020 and 2019, we incurred charges related to the closure of our Burton South brewery and Alton brewery.
(4)During the fourth quarter of 2021, we recognized an impairment loss of $13.5 million related to the held for sale classification of the remaining portion of our India business. During the third quarter of 2020, we recognized an impairment loss of $30.0 million related to the held for sale classification of a disposal group within our India business, representing an insignificant part of our EMEA&APAC segment. The held for sale disposal group was measured at fair value on a nonrecurring basis using Level 3 inputs. The estimated fair value less cost to sell was determined using a market approach, based upon the expected net sales proceeds of the disposal group.
During the fourth quarter of 2020, we recognized goodwill impairment losses on the EMEA&APAC reporting unit of $1,484.3 million. See Note 10, "Goodwill and Intangible Assets" for further discussion. In addition, during the fourth quarter of 2020, we incurred impairment losses as a result of small brewery closures in Europe as a result of the ongoing impact of the coronavirus pandemic.During the third quarter of 2019, we recorded goodwill impairment losses within the former India reporting unit of $6.1 million. We also recorded impairment losses related to definite-lived intangible assets in India of $6.1 million. See Note 10, "Goodwill and Intangible Assets" for further discussion.(5)During the second quarter of 2019, we completed the sale of the existing Montreal brewery property for $96.2 million, and recognized a gain of $61.3 million. See Note 19, "Leases" for further discussion.(6)During 2021, we recognized a gain of $11.4 million related to the sale of land of the former Alton brewery site in the U.K. In addition, we recognized a loss of $2.7 million on the sale of a disposal group within our India business. The loss included the reclassification of the associated cumulative foreign currency translation adjustment losses from AOCI into special items, net at the time of sale. See Note 14, "Accumulated Other Comprehensive Income (Loss)" for further details.Restructuring Activities
On October 28, 2019, as part of our revitalization plan, we made the determination to establish Chicago, Illinois as our Americas segment operational headquarters, close our office in Denver, Colorado and consolidate certain administrative functions into our other existing office locations. In connection with these consolidation activities, certain impacted employees were extended an opportunity to continue their employment with MCBC in the new organization and locations and, for those not continuing with MCBC, certain of such employees were asked to provide transition assistance and offered severance and retention packages in connection with their termination of service. The restructuring actions related to the revitalization plan were substantially completecosts as of December 31, 2021. After taking into account all changes2023 are approximately $5 million and $6 million, respectively. Cost estimates were discounted using a 3.88% risk-free rate of return. We did not assume any future recoveries from insurance companies in the estimate of our liability and none are expected.
Considering the estimates extend through the year 2032 and the related uncertainties at the site, including what additional remedial actions may be required by the EPA, new technologies and what costs we are required to cover, the estimate of our liability may change as further facts develop. We cannot predict the amount of any such change, but additional accruals in the future are possible.
Other
In prior years, we were notified by the EPA and certain state environmental divisions that we are a PRP, along with other parties, at the East Rutherford and Berry's Creek sites in New Jersey and the Chamblee site in Georgia. Certain former non-beer business operations, which we discontinued use of and subsequently sold, were involved at these sites. Potential losses associated with these sites could increase as remediation planning progresses.
We are aware of groundwater contamination at some of our properties in Colorado resulting from historical, ongoing, or nearby activities. There may also be other contamination of which we are currently unaware.
EMEA&APAC
We are subject to the requirements of governmental and local environmental and occupational health and safety laws and regulations within each of the business units, including the EMEA&APAC segment, the revitalization plan has reduced employment levels,countries in aggregate, by approximately 600 employees globally.
In connectionwhich we operate. Compliance with these consolidation activities,laws and regulations did not materially affect our 2023capital expenditures, results of operations or our financial or competitive position, and we incurred cash and non-cash restructuring charges related to severance, retention and transition costs, employee relocation, non-cash asset related costs, lease impairment and exit costsdo not currently anticipate that they will do so in connection with our office lease in Denver, Colorado, and other transition activities, the majority of which were cash charges that we began recognizing in the fourth quarter of 2019. During 2021, 2020 and 2019, we recognized severance and retention cash charges of $4.0 million, $35.6 million and $41.2 million, respectively, bringing the aggregate of such charges to approximately $81 million in total since the plan was initiated. Employee relocation charges were recognized in the period incurred and totaled $3.4 million and $11.0 million in 2021 and 2020, respectively. Additionally, during 2020 and 2019, we recognized aggregate impairment losses of $7.6 million and $2.1 million, respectively, related to the closure of the office facility in Denver, Colorado, including our lease right-of-use asset, in light of the sublease market outlook during such periods as a result of the coronavirus pandemic. No further impairment was recorded in 2021 due to the signing of sublease agreements during the second quarter of 2021.
In addition to our revitalization plan, our restructuring also includes other strategic exit activities such as the disposal or wind down of certain brewery locations. We continually evaluate our cost structure and seek opportunities for further efficiencies and cost savings as part of ongoing and new initiatives. As such, we may incur additional restructuring related charges or adjustments to previously recorded charges in the future; however, we are unable to estimate the amount of charges at this time.
The accrued restructuring balances as of December 31, 2021 represent expected future cash payments required to satisfy our remaining obligations, the majority of which we expect to be paid in the next 12 months. | | | | | | | | | | | | | | | | | |
| Americas | | EMEA&APAC | | Total |
| (In millions) |
| Balance as of December 31, 2018 | $ | 24.5 | | | $ | 1.1 | | | $ | 25.6 | |
| Charges incurred and changes in estimates | 43.4 | | | 9.0 | | | 52.4 | |
| Payments made | (25.5) | | | (5.6) | | | (31.1) | |
| Foreign currency and other adjustments | 0.2 | | | — | | | 0.2 | |
| Balance as of December 31, 2019 | $ | 42.6 | | | $ | 4.5 | | | $ | 47.1 | |
| Charges incurred and changes in estimates | 59.1 | | | 8.5 | | | 67.6 | |
| Payments made | (77.3) | | | (11.1) | | | (88.4) | |
| | | | | |
| Foreign currency and other adjustments | 0.1 | | | 0.1 | | | 0.2 | |
| Balance as of December 31, 2020 | $ | 24.5 | | | $ | 2.0 | | | $ | 26.5 | |
| Charges incurred and changes in estimates | 10.1 | | | 1.6 | | | 11.7 | |
| Payments made | (23.7) | | | (2.0) | | | (25.7) | |
| | | | | |
| Foreign currency and other adjustments | — | | | (0.1) | | | (0.1) | |
| Balance as of December 31, 2021 | $ | 10.9 | | | $ | 1.5 | | | $ | 12.4 | |
8.14. Stockholders' Equity
Changes to the number of shares of capital stock issuedoutstanding were as follows: | | | | Common stock
issued | | Exchangeable
shares issued | | Common stock
outstanding | | Exchangeable
shares outstanding |
| | | Class A | | Class B | | Class A | | Class B | | Class A | | Class B | | Class A | | Class B |
| | (Share amounts in millions) |
| Balance as of December 31, 2018 | 2.6 | | | 205.4 | | | 2.8 | | | 14.8 | |
| Shares issued under equity compensation plans | — | | | 0.2 | | | — | | | — | |
| Shares exchanged for common stock | — | | | 0.1 | | | — | | | (0.1) | |
| Shares exchanged for Class B exchangeable shares | — | | | — | | | (0.1) | | | 0.1 | |
| Balance as of December 31, 2019 | 2.6 | | | 205.7 | | | 2.7 | | | 14.8 | |
| Shares issued under equity compensation plans | — | | | 0.4 | | | — | | | — | |
| Shares exchanged for common stock | — | | | 3.7 | | | — | | | (3.7) | |
| | | (Share amounts in millions) |
| Balance as of December 31, 2020 | Balance as of December 31, 2020 | 2.6 | | | 209.8 | | | 2.7 | | | 11.1 | |
| Shares issued under equity compensation plans | Shares issued under equity compensation plans | — | | | 0.3 | | | — | | | — | |
| | Balance as of December 31, 2021 | Balance as of December 31, 2021 | 2.6 | | | 210.1 | | | 2.7 | | | 11.1 | |
| | Balance as of December 31, 2021 | |
| | Balance as of December 31, 2021 | |
| Shares issued under equity compensation plans | |
| Purchase of treasury shares | |
| Shares exchanged for common stock | |
| | Balance as of December 31, 2022 | |
| Balance as of December 31, 2022 | |
| Balance as of December 31, 2022 | |
| Shares issued under equity compensation plans | |
| Purchase of treasury shares | |
| Shares exchanged for common stock | |
| | Balance as of December 31, 2023 | |
| Balance as of December 31, 2023 | |
| Balance as of December 31, 2023 | |
Exchangeable Shares
The Class A exchangeable shares and Class B exchangeable shares were issued by Molson Coors Canada Inc. ("MCCI"), a wholly-owned subsidiary of our Company. The exchangeable shares are substantially the economic equivalent of the corresponding shares of Class A and Class B common stock that a Molson Inc. shareholder would have received in the merger of Adolph Coors Company with Molson Inc. in February 2005, if the holder had elected to receive shares of Molson Coors common stock. Exchangeable shareholders receive the CAD equivalent of dividends declared on Class A and B common stock on the date of declaration. Holders of exchangeable shares also receive, through a voting trust, the benefit of Molson Coors voting rights, entitling the holder to 1one vote on the same basis and in the same circumstances as one corresponding share of Molson Coors common stock.
Voting RightsDebt Obligations
| | | | | | | | | | | |
| | As of |
| | December 31, 2023 | | December 31, 2022 |
| | (In millions) |
| Long-term debt | | | |
CAD 500 million 2.84% notes due July 2023(1)(2)(3) | — | | | 368.9 | |
EUR 800 million 1.25% notes due July 2024(1) | 883.1 | | | 856.4 | |
CAD 500 million 3.44% notes due July 2026(1)(2) | 377.6 | | | 368.9 | |
$2.0 billion 3.0% notes due July 2026(1) | 2,000.0 | | | 2,000.0 | |
$1.1 billion 5.0% notes due May 2042(4) | 1,100.0 | | | 1,100.0 | |
$1.8 billion 4.2% notes due July 2046(1) | 1,800.0 | | | 1,800.0 | |
| Finance leases | 53.7 | | | 61.5 | |
| Other | 23.5 | | | 25.4 | |
| Less: unamortized debt discounts and debt issuance costs | (35.5) | | | (39.7) | |
| Total long-term debt (including current portion) | 6,202.4 | | | 6,541.4 | |
| Less: current portion of long-term debt | (890.3) | | | (376.2) | |
| Total long-term debt | $ | 5,312.1 | | | $ | 6,165.2 | |
| | | |
| | | |
| | | |
Short-term borrowings(5) | 21.5 | | | 20.9 | |
| Current portion of long-term debt | 890.3 | | | 376.2 | |
| Current portion of long-term debt and short-term borrowings | $ | 911.8 | | | $ | 397.1 | |
(1)These senior notes were issued in 2016 in order to partially fund the financing of the MillerCoors Acquisition (USD Notes, EUR Notes and CAD Notes). Total remaining debt issuance costs capitalized in connection with these notes including underwriting fees, discounts and other financing related costs, were $27.2 million as of December 31, 2023 and are being amortized over the respective and remaining terms.
(2)We entered into forward starting interest rate swap agreements to hedge interest rate volatility for a 10-year period until the swaps were settled on September 18, 2015. We are amortizing a portion of the resulting loss from AOCI to interest expense over the remaining term of the CAD 500 million 3.44% notes maturing July 2026 ("2026 CAD notes"), up to the full 10-year term of the interest rate swaps. The amortizing loss resulted in an increase in our effective cost of borrowing compared to the stated coupon rates by 0.4% on the 2026 CAD notes. See Note 10, "Derivative Instruments and Hedging Activities" for further details on the forward starting interest rate swaps. (3)We repaid our CAD 500 million 2.84% notes upon maturity on July 15, 2023 using cash on hand.
(4)On May 3, 2012, we issued approximately $1.9 billion of senior notes with $1.1 billion remaining due in 2042. The total remaining debt issuance costs capitalized in connection with these notes, including the underwriting fees and discounts, were $8.3 million as of December 31, 2023 and are being amortized over the remaining term of the 2042 notes.
(5)Our short-term borrowings include bank overdrafts, borrowings on our overdraft facilities and other items.
As of December 31, 2023, we had $16.5 million in bank overdrafts and $75.5 million in bank cash related to our cross-border, cross-currency cash pool for a net positive position of $59.0 million. As of December 31, 2022, we had $15.9 million in bank overdrafts and $49.7 million in bank cash related to our cross-border, cross-currency cash pool for a net positive position of $33.8 million.
In addition, we have CAD, GBP and USD overdraft facilities under which we had no outstanding borrowings as of December 31, 2023 or December 31, 2022.
•CAD unlimited overdraft facility at CAD Prime plus 0.50%
•GBP 10 million overdraft facility at GBP Base Rate plus 2.25%
•USD 10 million overdraft facility at USD Prime plus 5%
Debt Fair Value Measurements
We utilize market approaches to estimate the fair value of certain outstanding borrowings by discounting anticipated future cash flows derived from the contractual terms of the obligations and observable market interest and foreign exchange rates. As of December 31, 2023 and December 31, 2022, the fair value of our outstanding long-term debt (including current portion of long-term debt) was approximately $5.9 billion. All senior notes are valued based on significant observable inputs and classified as Level 2 in the fair value hierarchy. The carrying values of all other outstanding long-term borrowings and our short-term borrowings approximate their fair values and are also classified as Level 2 in the fair value hierarchy.
Revolving Credit Facility and Commercial Paper
On June 26, 2023, we amended and restated our multi-currency revolving credit facility to, among other things, extend the term through June 26, 2028, and to increase the borrowing capacity to $2.0 billion. This $2.0 billion revolving credit facility amended our pre-existing $1.5 billion revolving credit facility, which was scheduled to mature on July 7, 2024. On September 28, 2023, we amended our commercial paper program, which reduces borrowing capacity under the revolving credit facility, to a maximum borrowing capacity of $2.0 billion to borrow at any time at variable interest rates. The $150 million sub-facility available for the issuance of letters of credit remains unchanged.
Concurrent with the amended and restated multi-currency revolving credit facility, in the second quarter of 2023, we incurred incremental issuance costs of $5.2 million related to the $2.0 billion revolving credit facility, which are recorded within other current assets, net, and other assets on the consolidated balance sheets and are being amortized over the term of the facility. We use this facility from time to time to fund the repayment of debt upon maturity and for working capital or general purposes. We had no borrowings drawn on this revolving credit facility and no commercial paper borrowings as of December 31, 2023 and December 31, 2022.
Debt Covenants
Under the terms of each of our debt facilities, we must comply with certain restrictions. These include customary events of default and specified representations, warranties and covenants, as well as covenants that restrict our ability to incur certain additional priority indebtedness (certain thresholds of secured consolidated net tangible assets), certain leverage threshold percentages, create or permit liens on assets, and restrictions on mergers, acquisitions, and certain types of sale lease-back transactions.
Under the amended and restated $2.0 billion revolving credit facility, we are required to maintain a maximum leverage ratio, calculated as net debt to EBITDA (as defined in the revolving credit facility agreement) of 4.00x, measured as of the last day of each fiscal quarter through maturity of the credit facility. As of December 31, 2023 and December 31, 2022, we were in compliance with all of these restrictions and covenants, have met such financial ratios, and have met all debt payment obligations. All of our outstanding senior notes as of December 31, 2023 rank pari-passu.
As of December 31, 2023, the aggregate principal debt maturities of long-term debt and short-term borrowings, based on foreign exchange rates as of December 31, 2023, were as follows:
| | | | | | | | |
| Year | | Amount |
| | | (In millions) |
| 2024 | | $ | 904.6 | |
| 2025 | | — | |
| 2026 | | 2,377.6 | |
| 2027 | | — | |
| 2028 | | — | |
| Thereafter | | 2,900.0 | |
| Total | | $ | 6,182.2 | |
The aggregate principal debt maturities in the table above excludes Other and Finance leases. The future maturities of finance leases are disclosed in Note 8, "Leases."
Interest
| | | | | | | | | | | | | | | | | |
| | For the years ended |
| | December 31, 2023 | | December 31, 2022 | | December 31, 2021 |
| | (In millions) |
| Interest incurred | $ | 243.4 | | | $ | 257.4 | | | $ | 269.1 | |
| Interest capitalized | (9.4) | | | (6.8) | | | (8.8) | |
| Interest expensed | $ | 234.0 | | | $ | 250.6 | | | $ | 260.3 | |
10. Derivative Instruments and Hedging Activities
Overview and Risk Management Policies
We use derivatives as part of our normal business operations to manage our exposure to fluctuations in interest rates, foreign currency, commodity price risk and for other strategic purposes related to our core business. We have established policies and procedures that govern the risk management of these exposures. Our primary objective in managing these exposures is to decrease the volatility of cash flows affected by changes in the underlying rates and prices.
To achieve our objectives, we enter into a variety of financial derivatives, including foreign currency exchange, commodity, interest rate, cross currency swaps as well as options. We also enter into physical hedging agreements directly with our suppliers to manage our exposure to certain commodities.
Counterparty Risk
While, by policy, the counterparties to any of the financial derivatives we enter into are major institutions with minimum investment grade credit ratings of BBB- by Standard & Poor's (or the equivalent) or Baa3 by Moody's, we are exposed to credit-related losses in the event of non-performance by counterparties. This credit risk is generally limited to the unrealized gains in such contracts, should any of these counterparties fail to perform as contracted.
We have established a counterparty credit policy and guidelines that are monitored and reported to management to assist in managing this risk. As an additional measure, we utilize a portfolio of institutions either headquartered or operating in the same countries that we conduct our business. In calculating the fair value of our derivative balances, we also record an adjustment to recognize the risk of counterparty credit and our own non-performance risk, as appropriate.
Price and Liquidity Risks
We base the fair value of our derivative instruments upon market rates and prices. The volatility of these rates and prices are dependent on many factors that cannot be forecasted with reliable accuracy. The current fair values of our contracts could differ significantly from the cash settled values with our counterparties. As such, we are exposed to price risk related to unfavorable changes in the fair value of our derivative contracts.
We may be forced to cash settle all or a portion of our derivative contracts before the expected settlement date upon the occurrence of certain contractual triggers including a change of control, termination event or other breach of agreement. This could have a negative impact on our liquidity. For derivative contracts that we have designated as hedging instruments, early cash settlement would result in the timing of our hedge settlement not being matched to the cash settlement of the forecasted transaction or firm commitment. We may also decide to cash settle all or a portion of our derivative contracts before the expected settlement date through negotiations with our counterparties, which could also impact our cash position.
Due to the nature of our counterparty agreements, we are not able to net positions with the same counterparty across business units. Thus, in the event of default, we may be required to early settle all out-of-the-money contracts, without the benefit of netting the fair value of any in-the-money positions against this exposure.
Collateral
We do not receive and are not required to post collateral unless a change of control event occurs. This termination event would give either party the right to early terminate all outstanding swap transactions in the event that the other party consolidates, merges with, or transfers all or substantially all of its assets to, another entity, and the creditworthiness of the surviving entity that has assumed such party's obligations is materially weaker than that of such party. As of December 31, 2023, we did not have any collateral posted with any of our counterparties.
Derivative Accounting Policies
Overview
Our forward starting interest rate swaps and most of our foreign currency forwards are designated in hedging relationships as cash flow hedges. Prior to settlements discussed below, our interest rate swaps were designated as fair value hedges and our cross currency swaps were designated as net investment hedges. In certain situations, we may execute derivatives that do not qualify for, or we do not otherwise seek, hedge accounting but are determined to be important for managing risk. For example, our commodity swaps and commodity options are not designated in hedge accounting relationships. These outstanding economic hedges are measured at fair value on our consolidated balance sheets with changes in fair value recorded in earnings. We have historically elected to apply the NPNS exemption to certain contracts, as applicable. These contracts are typically transacted with our suppliers and include risk management features that allow us to fix the price on specific volumes of purchases for specified delivery periods. We also consider whether any provisions in our contracts represent embedded derivative instruments as defined in authoritative accounting guidance and apply the appropriate accounting.
Hedge Accounting Policies
We formally document all relationships receiving hedge accounting treatment between hedging instruments and hedged items, as well as the risk-management objective and strategy for undertaking hedge transactions pursuant to prescribed guidance. We also formally assess effectiveness both at the hedge's inception and on an ongoing basis, specifically whether the derivatives that are used in hedging transactions have been highly effective in mitigating the risk designated as being hedged and whether those hedges may be expected to remain highly effective in future periods. Specific to net investment hedges, we have elected to use the spot-to-spot methodology to assess effectiveness.
We discontinue hedge accounting prospectively when (1) the derivative is no longer highly effective in offsetting changes in the cash flows of a forecasted future transaction; (2) the derivative expires or is sold, terminated, or exercised; (3) it is no longer probable that the forecasted transaction will occur; (4) management determines that designating the derivative as a hedging instrument is no longer appropriate; or (5) management decides to cease hedge accounting.
When we discontinue hedge accounting prospectively, but it continues to be probable that the forecasted transaction will occur in the originally expected period, the existing gain or loss on the derivative remains in AOCI for cash flow hedges and net investment hedges or in the carrying value of the hedged item for fair value hedges and is reclassified into earnings when the forecasted transaction affects earnings. However, if it is probable that a forecasted transaction will no longer occur by the end of the originally specified time period or within an additional two-month period of time thereafter, the gains and losses in AOCI are recognized immediately in earnings. In all situations in which hedge accounting is discontinued and the derivative remains outstanding, we carry the derivative at its fair value on the consolidated balance sheets until maturity, recognizing future changes in the fair value in current period earnings.
Significant Derivative/Hedge Positions
Net Investment Hedges
Foreign Denominated Debt
In 2016, we issued EUR 800 million senior notes maturing July 15, 2024 to partially fund the MillerCoors Acquisition. Concurrent with the issuance of these notes, we simultaneously designated the principals as net investment hedges of our investment in our Europe business in order to hedge a portion of the foreign currency translational impacts and, accordingly, record the changes in the carrying value due to fluctuations in the spot rate to AOCI.
Cross Currency Swaps
In 2019, we entered into cross currency swap agreements having a total notional value of approximately EUR 353 million ($400 million upon execution) in order to hedge a portion of the foreign currency translational impacts of our European investment. Upon repayment of the $1.0 billion 2.1% senior notes at maturity in July 2021, we settled the associated cross currency swap resulting in a net cash payment of $12.7 million, consisting of the final loss on the cross currency swap of $17.6 million partially offset by the final interest received. The settlement of these cross currency swaps were classified as investing activities in our consolidated statement of cash flows.
We had designated each of these cross currency swaps as net investment hedges and accordingly, recorded changes in fair value due to fluctuations in the spot rate to AOCI. The changes in fair value of the swaps attributable to changes other than those due to fluctuations in the spot rate were excluded from the assessment of hedge effectiveness and recorded to interest expense over the life of the hedge.
Forward Starting Interest Rate Swaps
During 2018, we entered into forward starting interest rate swaps with a notional amount totaling $1.5 billion with termination dates of July 2021, May 2022 and July 2026. The swaps had effective dates mirroring the terms of the forecasted debt issuances. Under the agreements, we are required to early terminate these swaps at the time we expect to issue the related forecasted debt. We designated these contracts as cash flow hedges. As a result, the unrealized mark-to-market gains or losses are recorded to AOCI until termination at which point the realized gain or loss of these swaps at issuance of the hedged debt are reclassified from AOCI and amortized to interest expense over the term of the hedged debt.
In June 2021, we early terminated our $250.0 million forward starting interest rate swap that was originally set to terminate in July 2021. This forward starting interest rate swap was rolled forward to May 2022 through a cashless settlement. The new May 2022 forward starting interest rate swap was incremental to our existing May 2022 forward starting interest rate swap that was executed in 2018, both of which were hedging our forecasted debt issuance expected to occur during 2022. In late April 2022, the forward starting interest rate swaps associated with the $500 million 3.5% notes that we repaid upon maturity on May 1, 2022 were terminated and settled. The immaterial loss on settlement of the swaps was recorded through interest expense during the second quarter of 2022.
In 2015, we entered into forward starting interest rate swaps with a notional of CAD 600 million in order to manage our exposure to the volatility of the interest rates associated with the future interest payments on the forecasted CAD debt issuances. The swaps had a termination date of September 2025 mirroring the terms of initially forecasted CAD debt issuances. Under these agreements we were required to early terminate these swaps at the approximate time we issued the previously forecasted debt. We had designated these swaps as cash flow hedges and accordingly, a portion of the CAD 39.2 million ($29.5 million at settlement) loss on the swaps is being reclassified from AOCI and amortized to interest expense over the remaining term of the 2026 CAD notes up to the full 10-year term of the swaps. Additionally, in 2023 we repaid our CAD 500 million 2.84% notes upon maturity which resulted in an acceleration of amortization of the loss for an immaterial amount. The remaining unamortized portion of the loss in AOCI as of December 31, 2023 was $5.7 million.
Foreign Currency Forwards
We have financial foreign exchange forward contracts in place to manage our exposure to foreign currency fluctuations. We hedge foreign currency exposure related to certain royalty agreements, exposure associated with the purchase of production inputs and imports that are denominated in currencies other than the entity's functional currency and most other foreign exchanges exposures. These contracts have been designated as cash flow hedges of forecasted foreign currency transactions. We use foreign currency forward contracts to hedge these future forecasted transactions up to a 60 month horizon.
In the second quarter of 2023, we entered into approximately CAD 260 million (approximately $195 million USD) of foreign exchange forward contracts to manage our exposure to foreign currency fluctuations related to the repayment of our CAD 500 million 2.84% notes that matured on July 15, 2023. These contracts were not designated in hedge accounting relationships; as such, changes in the fair value were recorded in other non-operating income (expense), net in the consolidated statements of operations. These contracts settled on July 12, 2023 in advance of the notes repayment for an immaterial amount.
Commodity Swaps and Options
We have financial commodity swap and option contracts in place to hedge changes in the prices of natural gas, aluminum, including surcharges relating to our aluminum exposures, corn, sweeteners, barley and diesel. These contracts allow us to swap our floating exposure to changes in these commodity prices for a fixed rate. These contracts are not designated in hedge accounting relationships. As such, changes in fair value of these derivatives are recorded in cost of goods sold in the consolidated statements of operations. We hedge forecasted purchases of natural gas, aluminum, corn, sweeteners and diesel each up to 60 months out in the future for use in our supply chain, in line with our risk management policy. Further, we hedge forecasted purchases of barley based on crop year and physical inventory management. For purposes of measuring segment operating performance, the unrealized changes in fair value of the swaps not designated in hedge accounting relationships are reported in Unallocated outside of the segment specific operating results until such time that the exposure we are managing is realized. At that time, we reclassify the gain or loss from Unallocated to the respective operating segment, allowing our operating segments to realize the economic effects of the derivative without the resulting unrealized mark-to-market volatility.
Warrants
In the fourth quarter of 2018, in connection with the formation of our former Truss joint venture, as discussed further in Note 3, "Investments," our joint venture partner, HEXO, issued to our Canadian subsidiary warrants to purchase common shares of HEXO at any time during the three year period following the formation of the joint venture. The warrants to acquire common shares of HEXO expired unexercised on October 4, 2021. All changes in the fair value of the warrants subsequent to issuance and until expiration were recorded in other non-operating income (expense), net on the consolidated statements of operations. Derivative Fair Value Measurements
We utilize market approaches to estimate the fair value of our derivative instruments by discounting anticipated future cash flows derived from the derivative's contractual terms and observable market interest, foreign exchange and commodity rates. The fair values of our derivatives also include credit risk adjustments to account for our counterparties' credit risk, as well as our own non-performance risk, as appropriate.
The table below summarizes our derivative assets and (liabilities) that were measured at fair value as of December 31, 2023 and December 31, 2022. See Note 1, "Basis of Presentation and Summary of Significant Accounting Policies" for further discussion related to measuring the fair value of derivative instruments. Fair value for all derivative contracts as of December 31, 2023 and 2022 were valued using significant other observable inputs, also known as Level 2 inputs. | | | | | | | | | | | |
| As of |
| | December 31, 2023 | | December 31, 2022 |
| | (In millions) |
| Forward starting interest rate swaps | $ | 41.6 | | | 40.0 | |
| Foreign currency forwards | (1.4) | | | 7.6 | |
| Commodity swaps and options | (30.4) | | | 69.0 | |
| Total | $ | 9.8 | | | $ | 116.6 | |
As of December 31, 2023 and December 31, 2022, we had no significant transfers between Level 1 and Level 2. New derivative contracts transacted during 2023 were all included in Level 2.
Results of Period Derivative Activity
The following tables include the year-to-date results of our derivative activity in our consolidated balance sheets as of December 31, 2023 and December 31, 2022, and our consolidated statements of operations for the years ended December 31, 2023, December 31, 2022 and December 31, 2021.
Fair Value of Derivative Instruments in the Consolidated Balance Sheets (in millions) | | | | | | | | | | | | | | | | | | | | | | | | | | | | | |
| | December 31, 2023 |
| | | | Asset derivatives | | Liability derivatives |
| | Notional amount | | Balance sheet location | | Fair value | | Balance sheet location | | Fair value |
| Derivatives designated as hedging instruments: | | | | | | |
| | | | | | | | | |
| Forward starting interest rate swaps | $ | 1,000.0 | | | Other non-current assets | | $ | 41.6 | | | Other liabilities | | $ | — | |
| Foreign currency forwards | $ | 219.4 | | | Other current assets | | 1.1 | | | Accounts payable and other current liabilities | | (1.2) | |
| | | Other non-current assets | | — | | | Other liabilities | | (1.3) | |
| Total derivatives designated as hedging instruments | | | | $ | 42.7 | | | | | $ | (2.5) | |
| Derivatives not designated as hedging instruments: | | | | | | |
Commodity swaps(1) | $ | 653.5 | | | Other current assets | | $ | 11.1 | | | Accounts payable and other current liabilities | | $ | (42.0) | |
| | | Other non-current assets | | 6.6 | | | Other liabilities | | (6.1) | |
Commodity options(1) | $ | 21.7 | | | Other current assets | | 0.2 | | | Accounts payable and other current liabilities | | (0.2) | |
| | | | | | | | | |
| | | | | | | | | |
| Total derivatives not designated as hedging instruments | | $ | 17.9 | | | | | $ | (48.3) | |
| | | | | | | | | | | | | | | | | | | | | | | | | | | | | |
| | December 31, 2022 |
| | | | Asset derivatives | | Liability derivatives |
| | Notional amount | | Balance sheet location | | Fair value | | Balance sheet location | | Fair value |
| Derivatives designated as hedging instruments: | | | | | | |
| | | | | | | | | |
| Forward starting interest rate swaps | $ | 1,000.0 | | | Other non-current assets | | $ | 40.0 | | | Other liabilities | | $ | — | |
| Foreign currency forwards | $ | 176.6 | | | Other current assets | | 6.2 | | | Accounts payable and other current liabilities | | (0.1) | |
| | | Other non-current assets | | 1.6 | | | Other liabilities | | (0.1) | |
| Total derivatives designated as hedging instruments | | | | $ | 47.8 | | | | | $ | (0.2) | |
| Derivatives not designated as hedging instruments: | | | | | | |
Commodity swaps(1) | $ | 525.2 | | | Other current assets | | $ | 86.1 | | | Accounts payable and other current liabilities | | $ | (14.1) | |
| | | Other non-current assets | | 7.4 | | | Other liabilities | | (10.4) | |
Commodity options(1) | $ | 19.7 | | | Other current assets | | 0.8 | | | Accounts payable and other current liabilities | | (0.8) | |
| Total derivatives not designated as hedging instruments | | $ | 94.3 | | | | | $ | (25.3) | |
(1)Notional includes offsetting buy and sell positions, shown in terms of absolute value. Buy and sell positions are shown gross in the asset and/or liability position, as appropriate.
The Pretax Effect of Cash Flow Hedge Accounting on Other Comprehensive Income (Loss), Accumulated Other Comprehensive Income (Loss), and Income (Loss) (in millions): | | | | | | | | | | | | | | | | | | | | |
| Derivatives in cash flow hedge relationships | | Amount of gain
(loss) recognized
in OCI on derivatives | | Location of gain (loss)
reclassified from AOCI into
income | | Amount of gain
(loss) recognized
from AOCI into income on
derivative |
| For the year ended December 31, 2023 | | | | | | |
| Forward starting interest rate swaps | | $ | 1.6 | | | Interest income (expense), net | | $ | (5.2) | |
| Foreign currency forwards | | (5.2) | | | Cost of goods sold | | 4.9 | |
| | | | Other non-operating income (expense), net | | (1.0) | |
| Total | | $ | (3.6) | | | | | $ | (1.3) | |
| For the year ended December 31, 2022 | | | | | | |
| Forward starting interest rate swaps | | $ | 198.9 | | | Interest income (expense), net | | $ | (14.3) | |
| Foreign currency forwards | | 10.8 | | | Cost of goods sold | | 1.8 | |
| | | | Other non-operating income (expense), net | | (0.4) | |
| Total | | $ | 209.7 | | | | | $ | (12.9) | |
| For the year ended December 31, 2021 | | | | | | |
| Forward starting interest rate swaps | | $ | 50.7 | | | Interest income (expense), net | | $ | (4.8) | |
| Foreign currency forwards | | 0.4 | | | Cost of goods sold | | (3.5) | |
| | | | Other non-operating income (expense), net | | 0.8 | |
| Total | | $ | 51.1 | | | | | $ | (7.5) | |
The Pretax Effect of Net Investment Hedge Accounting on Other Comprehensive Income (Loss), Accumulated Other Comprehensive Income (Loss) and Income (Loss) (in millions)
| | | | | | | | | | | | | | | | | | | | |
| Net investment hedge relationships | | Amount of gain
(loss) recognized
in OCI | | Location of gain (loss) recognized in income (amount excluded from effectiveness testing) | | Amount of gain (loss) recognized in income (amount excluded from effectiveness testing)(1) |
| For the year ended December 31, 2023 | | | | | | |
| | | | | | |
| EUR 800 million notes due 2024 | | $ | (26.5) | | | Other non-operating income (expense), net | | $ | — | |
| Total | | $ | (26.5) | | | | | $ | — | |
| For the year ended December 31, 2022 | | | | | | |
| | | | | | |
| EUR 800 million notes due 2024 | | $ | 53.2 | | | Other non-operating income (expense), net | | $ | — | |
| Total | | $ | 53.2 | | | | | $ | — | |
| For the year ended December 31, 2021 | | | | | | |
| Cross currency swaps | | $ | 8.8 | | | Interest income (expense), net | | $ | 6.1 | |
| EUR 800 million notes due 2024 | | 67.7 | | | Other non-operating income (expense), net | | — | |
| Total | | $ | 76.5 | | | | | $ | 6.1 | |
(1)Represents amounts excluded from the assessment of effectiveness for which the difference between changes in fair value and period amortization is recorded in OCI.
The cumulative translation adjustments related to our net investment hedges remain in AOCI until the respective underlying net investment is sold or liquidated. During the years ended December 31, 2023, December 31, 2022 and December 31, 2021, respectively, we did not reclassify any amounts related to net investment hedges from AOCI into earnings.
We expect net losses of approximately $3 million (pretax) recorded in AOCI as of December 31, 2023 will be reclassified into earnings within the next 12 months. For derivatives designated in cash flow hedge relationships, the maximum length of time over which forecasted transactions are hedged as of December 31, 2023 is approximately 3 years, including those related to our forecasted debt issuances in 2026.
The Effect of Derivatives Not Designated as Hedging Instruments on the Consolidated Statements of Operations (in millions):
| | | | | | | | | | | | | | |
| Derivatives not in hedging relationship | | Location of gain (loss) recognized
in income on derivative | | Amount of gain (loss) recognized
in income on derivative |
| For the year ended December 31, 2023 | | | | |
| Commodity swaps | | Cost of goods sold | | $ | (61.7) | |
| | | | |
| Foreign currency swaps | | Other non-operating income (expense), net | | 2.7 | |
| | | | |
| | | | |
| Total | | | | $ | (59.0) | |
| For the year ended December 31, 2022 | | | | |
| Commodity swaps | | Cost of goods sold | | $ | 42.6 | |
| | | | |
| | | | |
| | | | |
| | | | |
| Total | | | | $ | 42.6 | |
| For the year ended December 31, 2021 | | | | |
| Commodity swaps | | Cost of goods sold | | $ | 403.4 | |
| Commodity options | | Cost of goods sold | | 0.1 | |
| | | | |
| Warrants | | Other non-operating income (expense), net | | (0.3) | |
| | | | |
| Total | | | | $ | 403.2 | |
11. Employee Retirement Plans and Postretirement Benefits
We maintain retirement plans for the majority of our employees. Depending on the location and benefit program, we provide either defined benefit pension or defined contribution plans to our employees. Each plan is managed locally and in accordance with respective local laws and regulations. We have defined benefit pension plans in the U.S., U.K. and Canada. Additionally, we offer OPEB plans to a portion of our Canadian, U.S. and Central European employees which are unfunded plans. BRI and BDL maintain defined benefit, defined contribution and postretirement benefit plans as well; however, those plans are excluded from this disclosure as BRI and BDL are equity method investments and not consolidated.
In the U.S., we participate in and make contributions to multi-employer pension plans. Contributions to multi-employer pension plans were $4.1 million, $3.6 million and $7.1 million for the years ended December 31, 2023, 2022 and 2021, respectively. Additionally, the U.S. postretirement health plan qualifies for the federal subsidy under the Medicare Prescription Drug Improvement and Modernization Act of 2003 (“the Act”) because the prescription drug benefits provided under our postretirement health plan for Medicare eligible retirees generally require lower premiums from covered retirees and have lower co-payments and deductibles than the benefits provided in Medicare Part D and, accordingly, are actuarially equivalent to or better than the benefits provided under the Act. The benefits paid, including prescription drugs, were $31.2 million, $33.0 million and $33.8 million for the years ended December 31, 2023, 2022 and 2021, respectively. There were no subsidies received for the years ended December 31, 2023, 2022 and 2021.
Defined Benefit and OPEB Plans
Net Periodic Pension and OPEB (Benefit) Cost
| | | | | | | | | | | | | | | | | | | | | | | | | | | | | | | | | | | | | | | | | | | | | | | | | | | | | |
| For the years ended |
| | December 31, 2023 | | December 31, 2022 | | December 31, 2021 |
| | Pension | | OPEB | | Consolidated | | Pension | | OPEB | | Consolidated | | Pension | | OPEB | | Consolidated |
| | (In millions) |
| Service cost | | | | | | | | | | | | | | | | | |
| Service cost | $ | 0.9 | | | $ | 3.3 | | | $ | 4.2 | | | $ | 1.3 | | | $ | 5.5 | | | $ | 6.8 | | | $ | 2.7 | | | $ | 6.0 | | | $ | 8.7 | |
| Other pension and postretirement (benefit) cost, net | | | | | | | | | | | | | | | | | |
| Interest cost | 140.4 | | | 22.5 | | | 162.9 | | | 103.9 | | | 16.1 | | | 120.0 | | | 93.9 | | | 14.6 | | | 108.5 | |
| Expected return on plan assets, net of expenses | (157.8) | | | — | | | (157.8) | | | (154.2) | | | — | | | (154.2) | | | (161.6) | | | — | | | (161.6) | |
| Amortization of prior service (benefit) cost | 0.3 | | | (0.7) | | | (0.4) | | | 0.3 | | | (0.7) | | | (0.4) | | | 0.4 | | | (0.7) | | | (0.3) | |
| Amortization of net actuarial (gain) loss | 17.1 | | | (31.7) | | | (14.6) | | | 5.6 | | | (10.2) | | | (4.6) | | | 8.7 | | | (6.7) | | | 2.0 | |
Curtailment, settlement or special termination benefit (gain) loss(1) | — | | | — | | | — | | | 2.9 | | | — | | | 2.9 | | | 5.4 | | | — | | | 5.4 | |
| Expected participant contributions | (0.3) | | | — | | | (0.3) | | | (0.3) | | | — | | | (0.3) | | | (0.4) | | | — | | | (0.4) | |
| Total other pension and postretirement (benefit) cost, net | (0.3) | | | (9.9) | | | (10.2) | | | (41.8) | | | 5.2 | | | (36.6) | | | (53.6) | | | 7.2 | | | (46.4) | |
| | | | | | | | | | | | | | | | | |
| Net periodic pension and OPEB (benefit) cost | $ | 0.6 | | | $ | (6.6) | | | $ | (6.0) | | | $ | (40.5) | | | $ | 10.7 | | | $ | (29.8) | | | $ | (50.9) | | | $ | 13.2 | | | $ | (37.7) | |
(1)The pension settlement charge recognized for the year ended December 31, 2022 primarily consisted of a settlement loss of $8.0 million that was recorded as a result of the annuity purchase for a certain Canadian pension plan, partially offset by a settlement gain of $5.3 million that was recorded as a result of the annuity purchase for a portion of our U.S. qualified pension plan.
The pension settlement charge recognized for the year ended December 31, 2021 was due to lump sum distributions allowed for under the U.K. pension plan being in excess of interest cost for the year ended December 31, 2021. Lower interest cost for the year ended December 31, 2021 was primarily a result of lower interest rates as of December 31, 2020, which were used to establish the 2021 periodic pension cost.
Obligations and Changes in Funded Status
| | | | | | | | | | | | | | | | | | | | | | | | | | | | | | | | | | | |
| For the year ended December 31, 2023 | | For the year ended December 31, 2022 |
| Pension | | OPEB | | Total | | Pension | | OPEB | | Total |
| (In millions) |
| Change in benefit obligation | | | | | | | | | | | |
| Prior year benefit obligation | $ | 2,978.0 | | | $ | 478.3 | | | $ | 3,456.3 | | | $ | 5,095.8 | | | $ | 648.7 | | | $ | 5,744.5 | |
| Service cost, net of expected employee contributions | 0.6 | | | 3.3 | | | 3.9 | | | 1.0 | | | 5.5 | | | 6.5 | |
| Interest cost | 140.4 | | | 22.5 | | | 162.9 | | | 103.9 | | | 16.1 | | | 120.0 | |
| Actual employee contributions | 0.3 | | | — | | | 0.3 | | | 0.3 | | | — | | | 0.3 | |
| Actuarial (gain) loss | 38.0 | | | 1.3 | | | 39.3 | | | (1,181.0) | | | (144.6) | | | (1,325.6) | |
| Plan amendments | — | | | — | | | — | | | — | | | (0.1) | | | (0.1) | |
| Benefits paid | (226.2) | | | (37.0) | | | (263.2) | | | (263.8) | | | (38.7) | | | (302.5) | |
| Curtailment, settlement and special termination | — | | | — | | | — | | | (460.6) | | | 0.2 | | | (460.4) | |
| Foreign currency exchange rate change | 87.0 | | | 2.2 | | | 89.2 | | | (317.6) | | | (8.8) | | | (326.4) | |
| Benefit obligation at end of year | $ | 3,018.1 | | | $ | 470.6 | | | $ | 3,488.7 | | | $ | 2,978.0 | | | $ | 478.3 | | | $ | 3,456.3 | |
| Change in plan assets | | | | | | | | | | | |
| Prior year fair value of assets | $ | 3,336.8 | | | $ | — | | | $ | 3,336.8 | | | $ | 5,667.5 | | | $ | — | | | $ | 5,667.5 | |
| Actual return on plan assets | 188.7 | | | — | | | 188.7 | | | (1,272.9) | | | — | | | (1,272.9) | |
| Employer contributions | (1.7) | | | 37.0 | | | 35.3 | | | (0.5) | | | 38.7 | | | 38.2 | |
| Actual employee contributions | 0.3 | | | — | | | 0.3 | | | 0.3 | | | — | | | 0.3 | |
| Curtailment, settlement and special termination | — | | | — | | | — | | | (460.6) | | | — | | | (460.6) | |
| Benefits and plan expenses paid | (226.2) | | | (37.0) | | | (263.2) | | | (263.8) | | | (38.7) | | | (302.5) | |
| Foreign currency exchange rate change | 99.0 | | | — | | | 99.0 | | | (333.2) | | | — | | | (333.2) | |
| Fair value of plan assets at end of year | $ | 3,396.9 | | | $ | — | | | $ | 3,396.9 | | | $ | 3,336.8 | | | $ | — | | | $ | 3,336.8 | |
| Funded status | $ | 378.8 | | | $ | (470.6) | | | $ | (91.8) | | | $ | 358.8 | | | $ | (478.3) | | | $ | (119.5) | |
| Amounts recognized in the Consolidated Balance Sheets | | | | | | | | | | | |
| Other non-current assets | $ | 416.9 | | | $ | — | | | $ | 416.9 | | | $ | 397.2 | | | $ | — | | | $ | 397.2 | |
| Accounts payable and other current liabilities | (3.6) | | | (39.3) | | | (42.9) | | | (3.9) | | | (39.5) | | | (43.4) | |
| Pension and postretirement benefits | (34.5) | | | (431.3) | | | (465.8) | | | (34.5) | | | (438.8) | | | (473.3) | |
| Net amounts recognized | $ | 378.8 | | | $ | (470.6) | | | $ | (91.8) | | | $ | 358.8 | | | $ | (478.3) | | | $ | (119.5) | |
The accumulated benefit obligation for our defined benefit pension plans was approximately $3.0 billion as of December 31, 2023 and December 31, 2022, respectively.
As of December 31, 2023 and December 31, 2022, certain defined benefit pension plans in the U.S., Canada and the U.K. were overfunded as a result of our ongoing de-risking strategy. Information for our defined benefit pension plans that had aggregate accumulated benefit obligations and projected benefit obligations in excess of plan assets was as follows:
| | | | | | | | | | | |
| As of |
| December 31, 2023 | | December 31, 2022 |
| (In millions) |
| Accumulated benefit obligation | $ | 38.1 | | | $ | 38.4 | |
| Projected benefit obligation | $ | 38.1 | | | $ | 38.4 | |
| Fair value of plan assets | $ | — | | | $ | — | |
Information for OPEB plans with an accumulated postretirement benefit obligation in excess of plan assets has been disclosed above in "Obligations and Changes in Funded Status" as all of our OPEB plans are unfunded.
Accumulated Other Comprehensive Income (Loss)
Amounts recognized in AOCI not yet recognized as components of net periodic pension and OPEB cost, pretax, were as follows:
| | | | | | | | | | | | | | | | | | | | | | | | | | | | | | | | | | | |
| As of December 31, 2023 | | As of December 31, 2022 |
| Pension | | OPEB | | Total | | Pension | | OPEB | | Total |
| (In millions) |
| Net actuarial (gain) loss | $ | 773.3 | | | $ | (260.4) | | | $ | 512.9 | | | $ | 766.4 | | | $ | (278.2) | | | $ | 488.2 | |
| Net prior service (benefit) cost | 9.4 | | | (1.7) | | | 7.7 | | | 9.7 | | | (0.8) | | | 8.9 | |
| Total not yet recognized | $ | 782.7 | | | $ | (262.1) | | | $ | 520.6 | | | $ | 776.1 | | | $ | (279.0) | | | $ | 497.1 | |
Assumptions
Periodic pension and OPEB cost is actuarially calculated annually for each individual plan based on data available and assumptions made at the beginning of each year. Assumptions used in the calculation include the discount rate selected and disclosed at the end of the previous year as well as other assumptions detailed in the table below. The weighted-average rates used in determining the periodic pension and OPEB cost for the years ended December 31, 2023, 2022 and 2021 were as follows:
| | | | | | | | | | | | | | | | | | | | | | | | | | | | | | | | | | | |
| | For the years ended |
| | December 31, 2023 | | December 31, 2022 | | December 31, 2021 |
| | Pension | | OPEB | | Pension | | OPEB | | Pension | | OPEB |
| Weighted-average assumptions: | | | | | | | | | | | |
| Discount rate | 5.01% | | 4.90% | | 2.27% | | 2.59% | | 1.84% | | 2.10% |
| Rate of compensation increase | 2.00% | | N/A | | 2.00% | | N/A | | 2.00% | | N/A |
| Expected return on plan assets | 4.91% | | N/A | | 3.11% | | N/A | | 3.03% | | N/A |
| Health care cost trend rate | N/A | | Ranging ratably from 6.50% in 2023 to 3.57% in 2040 | | N/A | | Ranging ratably from 6.00% in 2022 to 3.57% in 2040 | | N/A | | Ranging ratably from 6.00% in 2021 to 3.57% in 2040 |
Benefit obligations are actuarially calculated annually at the end of each year based on the assumptions detailed in the table below. Obligations under the OPEB plans are determined by the application of the terms of medical, dental, vision and life insurance plans, together with relevant actuarial assumptions and health care cost trend rates. The weighted-average rates used in determining the projected benefit obligation for defined pension plans and the accumulated postretirement benefit obligation for OPEB plans, as of December 31, 2023 and December 31, 2022, were as follows: | | | | | | | | | | | | | | | | | | | | | | | |
| As of December 31, 2023 | | As of December 31, 2022 |
| Pension | | OPEB | | Pension | | OPEB |
| Weighted-average assumptions | | | | | | | |
| Discount rate | 4.74% | | 4.64% | | 5.01% | | 4.90% |
| Rate of compensation increase | 2.00% | | N/A | | 2.00% | | N/A |
| Health care cost trend rate | N/A | | Ranging ratably from 6.75% in 2024 to 3.57% in 2040 | | N/A | | Ranging ratably from 6.50% in 2023 to 3.57% in 2040 |
The change to the weighted-average discount rates used for our defined benefit pension plans and postretirement plans as of December 31, 2023 from December 31, 2022, was primarily due to a decrease in interest rates at the end of 2023 across all plans.
Investment Strategy
The obligations of our defined benefit pension plans in the U.S., Canada and the U.K. are supported by assets held in trusts for the payment of future benefits. The business segments are obligated to adequately fund these asset trusts. The underlying investments within our defined benefit pension plans include: cash and short-term instruments, debt securities, equity securities, investment funds, and other investments including derivatives, hedge fund of funds and real estate. Investment allocations reflect the customized strategies of the respective plans.
The plans use liability driven investment strategies in managing defined pension benefits. For all defined benefit pension plan assets, the plans have the following primary investment objectives:
(1)optimize the long-term return on plan assets at an acceptable level of risk and manage projected future cash contributions;
(2)maintain a broad diversification across asset classes and among investment managers; and
(3)manage the risk level of the plans' assets in relation to the plans' liabilities.
Each holderplan's respective allocation targets promote optimal expected return and volatility characteristics given a focus on a long-term time horizon for fulfilling the plans' obligations. All assets are managed by external investment managers with an intent to either match or outperform their benchmark. The plans use different asset managers in the U.S., U.K. and Canada and each plan's respective asset allocation could be impacted by a change in asset managers.
Our investment strategies for our defined benefit pension plans also consider the funded status for each plan. For defined benefit pension plans that are highly funded, assets are invested primarily in fixed income holdings that have a similar duration to the associated liabilities. For plans with lower funding levels, the fixed income component is managed in a similar manner to the highly funded plans. In addition to this liability-matching fixed income allocation, these plans also contain exposure to return generating assets including: equities, real estate, debt and other investments held with the goal of producing higher returns, which may also have a higher risk profile. These investments are diversified by investing globally with limitations placed on issuer concentration.
Both our U.K. and Canadian plans hedge a portion of the foreign exchange exposure between plan assets that are not denominated in the local plan currency and the local currency as the Canadian and U.K. pension liabilities will be settled in CAD and GBP, respectively.
Target Allocations
The following compares target asset allocation percentages with actual asset allocations on a weighted-average asset basis as of December 31, 2023.
| | | | | | | | | | | |
| | Target
allocations | | Actual
allocations |
| Equities | 7.2% | | 7.8% |
| Fixed income | 74.2% | | 72.2% |
| | | |
| Real estate | 4.7% | | 4.8% |
| Annuities and longevity swap | 13.4% | | 13.4% |
| Other | 0.5% | | 1.8% |
Significant Concentration Risks
We periodically evaluate our defined benefit pension plan assets for concentration risks. As of December 31, 2023, we did not have any individual underlying asset position that composed a significant concentration of each plan's overall assets. However, we currently have significant plan assets invested in U.K., U.S. and Canadian government fixed income holdings. A provisional credit rating downgrade for any of these governments could negatively impact the asset values.
Further, as our benefit plans maintain exposure to non-government investments, a significant system-wide increase in credit spreads would also negatively impact the reported plan asset values. In general, equity and fixed income risks have been mitigated by company-specific concentration limits and by utilizing multiple equity managers. We do have significant amounts of assets invested with individual fixed income and hedge fund managers, therefore, the plans use outside investment consultants to aid in the oversight of these managers and fund performance.
Valuation Techniques
We use a variety of industry accepted valuation techniques to value our plan assets. The techniques vary depending upon instrument type. Whenever possible, we prioritize the use of observable market data in our valuation processes. We use market, income and cost approaches to value our plan assets as of period end. See Note 1, "Basis of Presentation and Summary of Significant Accounting Policies" for additional information on our fair value methodologies and accounting policies. We have not changed our fair value techniques used to value plan assets this year. Major Categories of Plan Assets
As of December 31, 2023, our major categories of plan assets included the following:
•Cash and short-term instruments—Includes cash, trades awaiting settlement, bank deposits, short-term bills and short-term notes. Our "trades awaiting settlement" category includes payables and receivables associated with asset purchases and sales that are awaiting final cash settlement as of year end due to the use of trade date accounting for our pension plans assets. These payables normally settle within a few business days of the purchase or sale of the respective asset. We include these items in Level 1 of this hierarchy, as the values are derived from quoted prices in active markets. Short-term instruments are included in Level 2 of the fair value hierarchy as these are highly liquid instruments that are valued using observable inputs, but their asset values are not publicly quoted.
•Debt securities—Includes various government and corporate fixed income securities, interest and inflation-linked assets such as bonds and swaps, collateralized securities and other debt securities. The majority of the plans' fixed income assets trade on "over the counter" exchanges, which provides observable inputs that are the primary data used to determine each individual investment's fair value. We also use independent pricing vendors, as well as matrix pricing techniques. Matrix pricing uses observable data from other similar investments as the primary input to determine the individual security's fair value. Government and corporate fixed income securities are generally classified as Level 2 in the fair value hierarchy as they are valued using observable inputs. Assets included in our collateralized securities include mortgage backed securities and collateralized mortgage obligations, which are considered Level 3 due to the use of the significant unobservable inputs in deriving these assets' fair values.
•Annuities and longevity swap—Includes assets to mitigate risks of certain plans including buy-in annuities and longevity swap insurance contracts. Non-participating annuity buy-in insurance policies are purchased to mitigate volatility in cash flows associated with a portion of covered plan members. The fair value of non-participating contracts fluctuate based on changes in the obligation associated with covered plan members. The longevity swap insurance contract alleviates risk from fluctuations in estimated life expectancy of covered participants. The fair value of the longevity swap insurance contract is calculated by taking the present value of the expected cash flows from the floating leg on a prevailing market best estimate of mortality, including market views of fees, less the present value of the fixed leg payments that the plan is required to make under the contract including the contractual fees. The prevailing market best estimate of mortality is determined based on the effect of actual plan mortality experience of covered participants, a revised view on future improvements in mortality rates and a view on how risk fees have changed for this type of contract since inception. These values are considered Level 3 due to the use of the significant unobservable inputs used in deriving the asset's fair value.
•Other—Includes repurchase agreements, recoverable taxes for taxes paid and awaiting reclaim due to the tax exempt nature of the pension plan and private equity. Repurchase agreements are agreements where our plan has created an asset exposure using borrowed assets, creating a repurchase agreement liability, to facilitate the trade. The assets associated with the repurchase agreement are included in the other category in the fair value hierarchy, and the corresponding repurchase agreement liability is classified as Level 1 in the hierarchy, as the liability is valued using quoted prices in active markets. When determining the presentation of our target and asset allocations for repurchase agreements, we are viewing the asset type, as opposed to the investment vehicle, and accordingly include the associated assets within fixed income, specifically interest and inflation linked assets. We include recoverable tax items in Level 1 of this hierarchy, as these are cash receivables and the values are derived from quoted prices in active markets. Private equity is included in Level 3 as the values are based upon the use of unobservable inputs.
•NAV per share practical expedient—Includes our debt funds, equity funds, hedge funds, real estate fund holdings and private equity funds. The market values for these funds are based on the net asset values multiplied by the number of shares owned.
Fair Value Hierarchy
The following presents our fair value hierarchy for our defined benefit pension plan assets excluding investments using the NAV per share practical expedient (in millions):
| | | | | | | | | | | | | | | | | | | | | | | |
| | | | Fair value measurements as of December 31, 2023 |
| | Total as of December 31, 2023 | | Quoted prices
in active
markets
(Level 1) | | Significant
observable
inputs
(Level 2) | | Significant
unobservable
inputs
(Level 3) |
| Cash and cash equivalents | | | | | | | |
| Cash | $ | 39.5 | | | $ | 39.5 | | | $ | — | | | $ | — | |
| Trades awaiting settlement | — | | | — | | | — | | | — | |
| Bank deposits, short-term bills and notes | 26.4 | | | — | | | 26.4 | | | — | |
| Debt | | | | | | | |
| Government debt securities | 452.3 | | | — | | | 452.3 | | | — | |
| Corporate debt securities | 119.3 | | | — | | | 119.3 | | | — | |
| Interest and inflation linked assets | 629.9 | | | — | | | 616.0 | | | 13.9 | |
| Collateralized debt securities | 0.3 | | | — | | | — | | | 0.3 | |
| | | | | | | |
| | | | | | | |
| | | | | | | |
| | | | | | | |
| Annuities and longevity swap | | | | | | | |
| Buy-in annuities and longevity swap | 449.8 | | | — | | | — | | | 449.8 | |
| Other | | | | | | | |
| | | | | | | |
| Repurchase agreements | (285.8) | | | (285.8) | | | — | | | — | |
| Recoverable taxes | 0.2 | | | 0.2 | | | — | | | — | |
| | | | | | | |
| Private equity | 10.6 | | | — | | | — | | | 10.6 | |
| Total fair value of investments excluding NAV per share practical expedient | $ | 1,442.5 | | | $ | (246.1) | | | $ | 1,214.0 | | | $ | 474.6 | |
The following presents our total fair value of plan assets including the NAV per share practical expedient for our defined benefit pension plan assets:
| | | | | |
| Total as of December 31, 2023 |
| (In millions) |
| Fair value of investments excluding NAV per share practical expedient | $ | 1,442.5 | |
| Fair value of investments using NAV per share practical expedient | |
| Debt funds | 1,263.9 | |
| Equity funds | 260.7 | |
| Real estate funds | 126.3 | |
| |
| Private equity funds | 37.8 | |
| Hedge funds | 265.7 | |
| Total fair value of plan assets | $ | 3,396.9 | |
The following presents our fair value hierarchy for our defined benefit pension plan assets excluding investments using the NAV per share practical expedient (in millions):
| | | | | | | | | | | | | | | | | | | | | | | |
| | | | Fair value measurements as of December 31, 2022 |
| | Total as of December 31, 2022 | | Quoted prices
in active
markets
(Level 1) | | Significant
observable
inputs
(Level 2) | | Significant
unobservable
inputs
(Level 3) |
| Cash and cash equivalents | | | | | | | |
| Cash | $ | 99.3 | | | $ | 99.3 | | | $ | — | | | $ | — | |
| Trades awaiting settlement | 32.7 | | | 32.7 | | | — | | | — | |
| Bank deposits, short-term bills and notes | 7.0 | | | — | | | 7.0 | | | — | |
| Debt | | | | | | | |
| Government debt securities | 422.6 | | | — | | | 422.6 | | | — | |
| Corporate debt securities | 89.1 | | | — | | | 89.1 | | | — | |
| Interest and inflation linked assets | 420.6 | | | — | | | 408.0 | | | 12.6 | |
| Collateralized debt securities | 0.2 | | | — | | | — | | | 0.2 | |
| Annuities and longevity swap | | | | | | | |
| Buy-in annuities and longevity swap | 461.8 | | | — | | | — | | | 461.8 | |
| Other | | | | | | | |
| | | | | | | |
| Repurchase agreements | (281.2) | | | (281.2) | | | — | | | — | |
| Recoverable taxes | 0.1 | | | 0.1 | | | — | | | — | |
| Private equity | 12.4 | | | — | | | — | | | 12.4 | |
| | | | | | | |
| Total fair value of investments excluding NAV per share practical expedient | $ | 1,264.6 | | | $ | (149.1) | | | $ | 926.7 | | | $ | 487.0 | |
The following presents our fair value hierarchy including the NAV per share practical expedient for our defined benefit pension plan assets:
| | | | | |
| Total as of December 31, 2022 |
| (In millions) |
| Fair value of investments excluding NAV per share practical expedient | $ | 1,264.6 | |
| Fair value of investments using NAV per share practical expedient | |
| Debt funds | 1,355.7 | |
| Equity funds | 417.4 | |
| Real estate funds | 130.9 | |
| Private equity funds | 44.7 | |
| Hedge funds | 123.5 | |
| Total fair value of plan assets | $ | 3,336.8 | |
Fair Value: Level Three Rollforward
The following presents our Level 3 Rollforward for our defined pension plan assets excluding investments using the NAV per share practical expedient:
| | | | | |
| Amount |
| (In millions) |
| Balance as of December 31, 2021 | $ | 754.5 | |
| Total gain or loss (realized/unrealized) | |
| Realized gain (loss) | (1.9) | |
| Unrealized gain (loss) included in AOCI | (183.5) | |
| Purchases, issuances, settlements | (6.6) | |
| Foreign exchange translation (loss) gain | (75.5) | |
| Balance as of December 31, 2022 | $ | 487.0 | |
| Total gain or loss (realized/unrealized) | |
| Realized gain (loss) | — | |
| Unrealized gain (loss) included in AOCI | (34.2) | |
| Purchases, issuances, settlements | (2.7) | |
| |
| Foreign exchange translation (loss) gain | 24.5 | |
| Balance as of December 31, 2023 | $ | 474.6 | |
Expected Cash Flows
Defined benefit pension plan contributions in future years will vary based on a number of factors, including actual plan asset returns and interest rates. We fund pension plans to meet the requirements set forth in applicable employee benefits laws. We took and continue to take steps to reduce our exposure to our pension obligations. Such steps include the closure of the U.K. and U.S. pension plans to future earnings of service credit, benefit modifications in certain Canada plans and the entering into of buy-in and buy-out contracts for certain plans. We may also voluntarily increase funding levels to meet financial goals. Our U.K. pension plan is subject to a statutory valuation for funding purposes every three years. The most recent valuation as of June 30, 2022 indicated that the plan does not have a funding deficit relative to the plan's statutory funding objective, and therefore, no MCBC contributions are currently required.
For the year ended December 31, 2024, we expect to make contributions to our defined benefit pension plans of approximately $4 million and benefit payments under our OPEB plans of approximately $39 million based on foreign exchange rates as of December 31, 2023. Additionally, we anticipate utilizing approximately $6 million of surplus from certain Canadian defined benefit pension plans to fund employer contributions to certain Canadian defined contribution plans. BRI and BDL contributions to their respective defined benefit pension plans are excluded here, as they are not consolidated in our financial statements. Plan funding strategies are influenced by employee benefits, tax laws and plan governance documents.
Expected future benefit payments for defined benefit pension and OPEB plans for the next ten years, based on foreign exchange rates as of December 31, 2023, are as follows:
| | | | | | | | | | | | | | |
| Expected benefit payments | | Pension | | OPEB |
| | | (In millions) |
| 2024 | | $ | 233.1 | | | $ | 39.3 | |
| 2025 | | $ | 227.9 | | | $ | 39.1 | |
| 2026 | | $ | 229.0 | | | $ | 38.8 | |
| 2027 | | $ | 229.9 | | | $ | 38.6 | |
| 2028 | | $ | 231.0 | | | $ | 38.5 | |
| 2029-2033 | | $ | 1,170.0 | | | $ | 186.4 | |
Defined Contribution Plans
We offer defined contribution plans for the majority of our U.S., Canadian and U.K. employees. The investment strategy for defined contribution plans are determined by each individual participant from the options we have made available as the plan sponsor. U.S. non-union employees are eligible to participate in qualified defined contribution plans which provide for employer contributions ranging from 5% to 11% of eligible compensation (certain employees were also eligible for additional employer contributions). In addition, U.S. union employees are eligible to participate in a qualified defined contribution plan which provides for employer contributions based on factors associated with various collective bargaining agreements. The employer contributions to the U.K. plans can range up to 10% of employee compensation and in Canada plans range from 4% to 10%. Both employee and employer contributions are made in cash in accordance with participant investment elections.
We recognized costs associated with defined contribution plans of $76.8 million, $73.0 million and $77.8 million for the years ended December 31, 2023, 2022 and 2021, respectively.
In addition, we have other deferred compensation and nonqualified defined contribution plans. We have voluntarily funded these liabilities through rabbi trusts. These assets are invested in publicly traded mutual funds whose performance is expected to closely match changes in the plan liabilities. As of December 31, 2023, and December 31, 2022, the plan liabilities were equal to the plan assets and were included in other liabilities and other assets on our consolidated balance sheets, respectively.
12. Income Tax
Our income (loss) before income taxes on which the provision for income taxes was computed was as follows:
| | | | | | | | | | | | | | | | | |
| | For the years ended |
| | December 31, 2023 | | December 31, 2022 | | December 31, 2021 |
| | (In millions) |
| Domestic | $ | 1,486.0 | | | $ | 228.4 | | | $ | 1,307.5 | |
| Foreign | (233.5) | | | (290.9) | | | (68.5) | |
| Total | $ | 1,252.5 | | | $ | (62.5) | | | $ | 1,239.0 | |
The components of the provision for income taxes were as follows: | | | | | | | | | | | | | | | | | |
| | For the years ended |
| | December 31, 2023 | | December 31, 2022 | | December 31, 2021 |
| | (In millions) |
| Current | | | | | |
| Federal | $ | 200.7 | | | $ | 146.1 | | | $ | 43.5 | |
| State | 22.1 | | | 22.3 | | | 7.1 | |
| Foreign | 37.3 | | | (17.2) | | | (1.0) | |
| Total current tax (benefit) expense | $ | 260.1 | | | $ | 151.2 | | | $ | 49.6 | |
| Deferred | | | | | |
| Federal | $ | 75.0 | | | $ | 56.4 | | | $ | 163.5 | |
| State | 27.8 | | | (26.2) | | | 70.4 | |
| Foreign | (66.8) | | | (57.4) | | | (53.0) | |
| Total deferred tax (benefit) expense | $ | 36.0 | | | $ | (27.2) | | | $ | 180.9 | |
| Total income tax (benefit) expense | $ | 296.1 | | | $ | 124.0 | | | $ | 230.5 | |
A reconciliation from the U.S. statutory federal income tax rate to the effective income tax rate was as follows: | | | | | | | | | | | | | | | | | | | | | | | | | | | | | | | | | | | |
| | For the years ended |
| | December 31, 2023 | | December 31, 2022 | | December 31, 2021 |
| ($ in millions) |
| Statutory federal income tax rate | 21.0 | % | | $ | 263.0 | | | 21.0 | % | | $ | (13.1) | | | 21.0 | % | | $ | 260.2 | |
| State income taxes, net of federal benefits | 2.4 | % | | 30.6 | | | 6.1 | % | | (3.8) | | | 4.7 | % | | 57.8 | |
| Effect of foreign tax rates | (2.4) | % | | (30.5) | | | 92.6 | % | | (57.9) | | | (5.5) | % | | (68.3) | |
| Effect of foreign tax law and rate changes | 0.9 | % | | 11.5 | | | (0.8) | % | | 0.5 | | | 1.6 | % | | 19.6 | |
| Effect of unrecognized tax benefits | 0.8 | % | | 9.5 | | | (20.5) | % | | 12.8 | | | (6.2) | % | | (76.3) | |
| Change in valuation allowance | 0.2 | % | | 2.5 | | | 1.1 | % | | (0.7) | | | (0.1) | % | | (1.1) | |
| Goodwill impairment | — | | | — | | | (287.0) | % | | 179.3 | | | (0.2) | % | | (2.9) | |
| Other, net | 0.7 | % | | 9.5 | | | (10.9) | % | | 6.9 | | | 3.3 | % | | 41.5 | |
| Effective tax rate / Tax (benefit) expense | 23.6 | % | | $ | 296.1 | | | (198.4) | % | | $ | 124.0 | | | 18.6 | % | | $ | 230.5 | |
The increase in the effective tax rate for the year ended December 31, 2023 when compared to the federal statutory rate was not significant and was due to the impacts of state income taxes, foreign tax rates and the impact of a foreign statutory tax rate change enacted in the fourth quarter of 2023.
The decrease in the effective tax rate for the year ended December 31, 2022 when compared to the federal statutory rate was primarily due to the impact of the $845 million partial goodwill impairment, recorded within our Americas segment in the fourth quarter of 2022, which related to goodwill not deductible for tax purposes.
The decrease to the effective tax rate for the year ended December 31, 2021 when compared to the federal statutory rate was primarily due to the release of $73 million of reserves for unrecognized tax benefit positions recognized in the third quarter of 2021. The reserve release included amounts for an income tax audit settlement, net of changes in estimates associated with prior period uncertain tax positions, as well as amounts for the expiration of statutes of limitations. Additionally, during the second quarter of 2021, the U.K. government enacted, and royal assent was received for, legislation to increase the corporate income tax rate from 19% to 25%. Remeasurement of our deferred tax liabilities under the higher income tax rate resulted in the recognition of additional discrete tax expense of approximately $18 million in the second quarter of 2021.
On August 16, 2022, the Inflation Reduction Act of 2022 ("IRA") was signed into U.S. law. The IRA includes a new corporate alternative minimum tax of 15% on the adjusted financial statement income ("AFSI") of corporations with average AFSI exceeding $1.0 billion over a three-year period, effective for tax years beginning after December 31, 2022. The alternative minimum tax did not impact our financial or cash tax position in 2023. Additionally, the IRA imposes an excise tax of 1% on stock repurchases, effective January 1, 2023. The excise tax is recorded as an incremental cost in treasury stock on our consolidated balance sheets and was immaterial for the year ended December 31, 2023.
Additionally, our foreign businesses operate in jurisdictions with statutory income tax rates that differ from the U.S. Federal statutory rate. Specifically, the statutory income tax rates in the countries in Europe in which we operate range from 9% to 25.8%, and Canada has a combined federal and provincial statutory income tax rate of approximately 26%.
| | | | | | | | | | | |
| | As of |
| | December 31, 2023 | | December 31, 2022 |
| | (In millions) |
| Deferred tax assets | | | |
| Compensation-related obligations | $ | 43.2 | | | $ | 44.7 | |
| Pension and postretirement benefits | 23.7 | | | 33.7 | |
| | | |
| | | |
| | | |
| Tax credit carryforwards | 36.0 | | | 39.0 | |
| Tax loss carryforwards | 312.8 | | | 291.1 | |
| | | |
| | | |
| Accrued liabilities and other | 202.5 | | | 149.0 | |
| | | |
| Valuation allowance | (61.9) | | | (57.2) | |
| Deferred tax assets | $ | 556.3 | | | $ | 500.3 | |
| Deferred tax liabilities | | | |
| Fixed assets | 354.9 | | | 358.9 | |
| Partnerships and investments | 38.7 | | | 33.2 | |
| | | |
| Intangible assets | 2,679.9 | | | 2,563.2 | |
| Derivative instruments | 12.2 | | | 31.5 | |
| Deferred tax liabilities | $ | 3,085.7 | | | $ | 2,986.8 | |
| | | |
| Net deferred tax liabilities | $ | 2,529.4 | | | $ | 2,486.5 | |
Our deferred tax valuation allowances are primarily the result of uncertainties regarding the future realization of recorded tax benefits on tax loss carryforwards from operations in various jurisdictions. The measurement of deferred tax assets is reduced by a valuation allowance if, based upon available evidence, it is more likely than not that the deferred tax assets will not be realized. We have evaluated the realizability of our deferred tax assets in each jurisdiction by assessing the adequacy of expected taxable income, including the reversal of existing temporary differences, historical and projected operating results and the availability of prudent and feasible tax planning strategies. Based on this analysis, we have determined that the valuation allowances recorded in each period presented are appropriate.
As of December 31, 2023, we have deferred tax assets for U.S. tax loss and credit carryforwards that expire between 2024 and 2043 of $69.5 million and U.S. tax losses that may be carried forward indefinitely of $10.0 million. We have foreign tax loss and credit carryforwards that expire between 2024 and 2042 of $219.1 million and foreign tax losses that may be carried forward indefinitely of $43.0 million.
The following table presents our net deferred tax liabilities as of December 31, 2023 and December 31, 2022.
| | | | | | | | | | | |
| | As of |
| | December 31, 2023 | | December 31, 2022 |
| | (In millions) |
| Domestic deferred tax liabilities | $ | 2,029.7 | | | $ | 1,927.7 | |
| Foreign deferred tax assets | 123.7 | | | 125.8 | |
| Foreign deferred tax liabilities | 623.4 | | | 684.6 | |
| Net deferred tax liabilities | $ | 2,529.4 | | | $ | 2,486.5 | |
The total foreign deferred tax assets above are presented within other assets on the consolidated balance sheets and domestic and foreign deferred tax liabilities above are presented within deferred tax liabilities on the consolidated balance sheets. The deferred tax liability amounts as of December 31, 2023 and December 31, 2022 excluded $44.1 million and $34.0 million, respectively, of unrecognized tax benefits that have been recorded as a reduction of deferred tax assets, which was presented within deferred tax liabilities due to jurisdictional netting on the consolidated balance sheets.
A reconciliation of the beginning and ending amounts of unrecognized tax benefits, excluding interest and penalties, was as follows:
| | | | | | | | | | | | | | | | | |
| | For the years ended |
| | December 31, 2023 | | December 31, 2022 | | December 31, 2021 |
| | (In millions) |
| Balance at beginning of year | $ | 39.3 | | | $ | 28.0 | | | $ | 235.7 | |
| Additions for tax positions related to the current year | 12.9 | | | 15.9 | | | 28.6 | |
| Additions for tax positions of prior years | 0.8 | | | 1.9 | | | — | |
| Reductions for tax positions related to the current year | (2.0) | | | — | | | (24.1) | |
| Reductions for tax positions of prior years | (1.7) | | | — | | | (48.9) | |
| Settlements | — | | | (3.7) | | | (161.8) | |
| Release due to statute expirations | (0.7) | | | (1.3) | | | (3.4) | |
| Foreign currency adjustment | 0.3 | | | (1.5) | | | 1.9 | |
| Balance at end of year | $ | 48.9 | | | $ | 39.3 | | | $ | 28.0 | |
Our remaining unrecognized tax benefits as of December 31, 2023, related to tax years that were open to examination. As of December 31, 2023 and December 31, 2022, we had remaining unrecognized tax benefits recorded within other liabilities in our consolidated balance sheets of $5.0 million and $5.4 million, respectively. The remaining balance of our unrecognized tax benefits was recorded within deferred tax liabilities in our consolidated balance sheets. Annual tax provisions included amounts considered sufficient to pay assessments that may result from examination of prior year tax returns; however, the amount ultimately paid upon resolution of issues may differ materially from the amount accrued.
We recognized interest and penalties related to unrecognized tax benefits as part of income taxes on our consolidated statements of operations. Expense (benefit) recognized on interest and penalties related to unrecognized tax benefits as of December 31, 2023, December 31, 2022, and December 31, 2021 was $0.2 million, $(5.9) million and $1.4 million, respectively. If we were to prevail on all uncertain tax positions, the reversal of this accrual, inclusive of interest and penalties, would result in a benefit of $40.9 million.
During the third quarter of 2021, an income tax audit settlement, which included the resolution of the impact of the final hybrid regulations recorded in the second quarter of 2020, was reached with taxing authorities. The settlement, along with changes to other unrecognized positions resulted in the net reduction of our unrecognized tax benefit position by approximately $250 million, including interest, in the third quarter of 2021. The cash tax payment associated with the settlement, after application of available net operating losses, was made in the fourth quarter of 2021 which totaled approximately $125 million. As of the fourth quarter of 2023, we do not anticipate material changes to our remaining unrecognized tax benefit position within the next 12 months.
We file income tax returns in most of the federal, state and provincial jurisdictions in the U.S., Canada and various countries in Europe. Tax years through 2013 are closed in the U.S. In Canada, tax years through 2018 are closed or have been settled through examination except for issues relating to intercompany cross-border transactions. The statute of limitations for intercompany cross-border transactions is closed through tax year 2015. Tax years through 2014 are closed for most European jurisdictions in which we operate, with statutes of limitations varying from 3 to 7 years for most jurisdictions.
When cash is available after satisfying working capital needs and all other business obligations, we may distribute current earnings and the associated cash from a foreign subsidiary to its U.S. parent, and record the tax impact associated with the distribution. However, to the extent current earnings of Class A commonour foreign operations exist and are not otherwise distributed or planned to be distributed, such earnings accumulate. These accumulated earnings are not considered permanently reinvested in our foreign operations. The taxes associated with any future repatriation of undistributed earnings are anticipated to be insignificant.
13. Commitments and Contingencies
Letters of Credit
As of December 31, 2023, we had $54 million outstanding in letters of credit with financial institutions. These letters primarily expire throughout 2024 and $15 million of the letters contain a feature that automatically renews the letter for an additional year if no cancellation notice is submitted. These letters of credit are being maintained as security for deferred compensation payments, reimbursements to insurance companies, reimbursements to the trustee for pension payments, deductibles or retention payments made on our behalf, various payments due to governmental agencies, operations of underground storage tanks and other general business purposes and are not included on our consolidated balance sheets.
Guarantees and Indemnities
We guarantee indebtedness and other obligations to banks and other third parties for some of our equity method investments and consolidated subsidiaries. As of December 31, 2023 and December 31, 2022, the consolidated balance sheets include liabilities related to these guarantees of $36.9 million and $33.3 million, respectively. See Note 3, "Investments" for further detail. Kaiser
In 2006, we sold our entire equity interest in our Brazilian unit, Kaiser, to FEMSA. The terms of the sale agreement require us to indemnify FEMSA for certain exposures related to tax, civil and labor contingencies arising prior to FEMSA's purchase of Kaiser. In addition, we provided an indemnity to FEMSA for losses Kaiser may incur with respect to tax claims associated with certain previously utilized purchased tax credits. We settled a portion of our tax credit indemnity obligation during 2010. The maximum potential claims amount for the remainder of the purchased tax credits was $72.1 million as of December 31, 2023. Our estimate of the indemnity liability for these purchased tax credits as of December 31, 2023 was $8.3 million which is classified as non-current.
Our estimates consider a number of scenarios for the ultimate resolution of these issues, the probabilities of which are influenced not only by legal developments in Brazil but also by management's intentions with regard to various alternatives that could present themselves leading to the ultimate resolution of these issues. The liabilities are impacted by changes in estimates regarding amounts that could be paid, the timing of such payments, adjustments to the probabilities assigned to various scenarios and foreign currency exchange rates. Our indemnity may cover certain fees and expenses that Kaiser incurs to manage any cases finally determined to be unsuccessful through the administrative and judicial systems.
Additionally, we also provided FEMSA with indemnity related to all other tax, civil and labor contingencies existing as of the date of sale. In this regard, however, FEMSA assumed their full share of all of these contingent liabilities that had been previously recorded and disclosed by us prior to the sale on January 13, 2006. However, we may have to provide indemnity to FEMSA if those contingencies settle at amounts greater than those amounts previously recorded or disclosed by us. We will be able to offset any indemnity exposures in these circumstances with amounts that settle favorably to amounts previously recorded. Our exposure related to these indemnity claims is capped at the amount of the sales price of the 68% equity interest of Kaiser, which was $68 million. As a result of these contract provisions, our estimates include not only probability-weighted potential cash outflows associated with indemnity provisions, but also probability-weighted cash inflows that could result from favorable settlements, which could occur through negotiation or settlement programs arising from the federal or any of the various state governments in Brazil. The recorded value of the tax, civil and labor indemnity liability was $3.5 million as of December 31, 2023, which was classified as non-current. For the remaining portion of our indemnity obligations, not deemed probable, we continue to utilize probability-weighted scenarios in determining the value of the indemnity obligations.
Future settlement procedures and related negotiation activities associated with these contingencies are largely outside of our control. The sale agreement requires annual cash settlements relating to the tax, civil and labor indemnities. Due to the uncertainty involved with the ultimate outcome and timing of these contingencies, significant adjustments to the carrying values of the indemnity obligations have been recorded to date and additional future adjustments may be required. These liabilities are denominated in Brazilian Reais and are therefore, subject to foreign exchange gains or losses. As a result, these foreign exchange gains and losses are the only impacts recorded within other non-operating income (expense), net.
Purchase Obligations
We have various long-term supply contracts and distribution agreements with unaffiliated third parties and our joint venture partners to purchase materials used in production and packaging and to provide distribution services. Certain supply contracts provide that we purchase certain minimum levels of materials throughout the terms of the contracts. Additionally, we have various long-term non-cancelable commitments for advertising, sponsorships and promotions, including marketing at sports arenas, stadiums and other venues and events. The future aggregate minimum required commitments under these purchase obligations are shown in the table below based on foreign exchange rates as of December 31, 2023. The amounts in the table do not represent all anticipated payments under long-term contracts. Rather, they represent unconditional, non-cancelable purchase commitments under contracts with remaining terms greater than one year.
| | | | | | | | | | | | | | |
| Year | | Supply and Distribution | | Advertising and Promotions |
| | | (Amounts in millions) |
| 2024 | | $ | 371.9 | | | $ | 150.6 | |
| 2025 | | 232.0 | | | 151.3 | |
| 2026 | | 208.1 | | | 106.4 | |
| 2027 | | 185.2 | | | 80.5 | |
| 2028 | | 194.2 | | | 61.6 | |
| Thereafter | | 182.0 | | | 122.7 | |
| Total | | $ | 1,373.4 | | | $ | 673.1 | |
Total purchases under our long-term unconditional, non-cancellable supply and distribution contracts were approximately $0.4 billion, during each of the years ended December 31, 2023, 2022 and 2021.
Litigation, Other Disputes and Environmental
Related to litigation, other disputes and environmental issues, we had an aggregate accrued contingent liability of $70.2 million and $77.0 million as of December 31, 2023 and December 31, 2022, respectively. While we cannot predict the eventual aggregate cost for litigation, other disputes and environmental matters in which we are currently involved, we believe adequate reserves have been provided for losses that are probable and estimable. Additionally, as noted below, there are certain loss contingencies that we deem reasonably possible for which a range of loss is not estimable at this time; for all other matters, we believe that any reasonably possible losses in excess of the amounts accrued are immaterial to our consolidated financial statements.
We are involved in other disputes and legal actions arising in the ordinary course of our business. While it is not feasible to predict or determine the outcome of these proceedings, in our opinion, based on a review with legal counsel, other than as noted, none of these disputes or legal actions are expected to have a material impact on our business, consolidated financial position, results of operations or cash flows. However, litigation is subject to inherent uncertainties and an adverse result in these or other matters may arise from time to time that may harm our business.
On February 12, 2018, Stone Brewing Company filed a trademark infringement lawsuit in federal court in the Southern District of California against Molson Coors Beverage Company USA LLC ("MCBC USA"), a wholly owned subsidiary of our Company, alleging that the Keystone brand had “rebranded” itself as “Stone” and was marketing itself in a manner confusingly similar to Stone Brewing Company's registered Stone trademark. Stone Brewing Company sought treble damages and disgorgement of MCBC USA's profit from Keystone sales. MCBC USA subsequently filed an answer and counterclaims against Stone Brewing Company. On May 31, 2018, Stone Brewing Company filed a motion to dismiss MCBC USA's counterclaims and for a preliminary injunction seeking to bar MCBC USA from continuing to use “STONE” on Keystone Light cans and related marketing materials. In March 2019, the court denied Stone Brewing Company’s motion for preliminary injunction and its motion to dismiss MCBC USA's counterclaims. The jury trial began on March 7, 2022. The jury returned a verdict in which it concluded that trademark infringement had occurred and awarded Stone Brewing Company $56.0 million in damages. The jury also found that no "willful" trademark infringement had occurred. The trial court subsequently denied Stone Brewing Company’s motion for permanent injunction, motion for disgorgement of profits and motion for treble damages. Judgment was entered on September 8, 2022. Both parties filed post-trial motions, including MCBC USA’s renewed motion for judgment as a matter of law or, in the alternative, a new trial and/or remittitur and Stone Brewing Company’s motion for partial new trial of equitable issues. The court denied both parties' post-trial motions on September 25, 2023. On October 24, 2023, MCBC USA filed a notice of appeal in the 9th Circuit Court of Appeals. As of December 31, 2023 and December 31, 2022, the Company had a recorded accrued liability of $58.5 million and $56.6 million, respectively, within other liabilities on our consolidated balance sheets reflecting the best estimate of probable loss in this case based on the judgment plus associated post-judgment interest. However, it is reasonably possible that the estimate of the loss could change in the near term based on the progression of the case, including the appeals process. We will continue to monitor the status of the case and will adjust the accrual in the period in which any significant change occurs which could impact the estimate of the loss for this matter.
Regulatory Contingencies
The Representative Owners and TBS are parties to an MFA that dictates the terms of the beer distribution and retail systems in Ontario. The initial term of the MFA does not expire until December 31, 2025, and the MFA contains a provision requiring two-year advance notice of the government's intention to not renew the MFA. In December 2023, the Province of Ontario notified the Representative Owners and TBS that it would not be renewing the MFA after the initial term of the MFA expires on December 31, 2025. The Province of Ontario simultaneously announced a set of Key Principles agreed upon between the Province of Ontario, the Representative Owners, and TBS, concerning the intended features of the future marketplace for beer distribution and retail systems in the Province of Ontario to be introduced no later than January 1, 2026. Under the Key Principles, TBS will continue its retail operations and will continue to be the primary distributor of beer in the Province of Ontario at least through 2031. The Key Principles also state grocery stores, convenience stores, gas stations and big-box retailers in the Province of Ontario will be able to apply for licenses to sell beer, wine, cider and ready-to-drink cocktails starting in 2026. We continue to evaluate the impacts of the Key Principles on our results of operations.
Environmental
When we determine it is probable that a liability for environmental matters or other legal actions exists and the amount of the loss is reasonably estimable, an estimate of the future costs is recorded as a liability in the financial statements. Costs that extend the life, increase the capacity or improve the safety or efficiency of our assets or are incurred to mitigate or prevent future environmental contamination may be capitalized. Other environmental costs are expensed when incurred. Total environmental expenditures recognized for the years ended December 31, 2023, 2022 and 2021 were immaterial to our consolidated statements of operations.
Americas
Our Canada brewing operations are subject to provincial environmental regulations and local permit requirements. Our Longueuil, Chilliwack and Toronto breweries have water treatment facilities to pre-treat wastewater before it goes to the respective local governmental facility for final treatment. We have environmental programs in Canada including organization, monitoring and verification, regulatory compliance, reporting, education and training and corrective action.
In Canada, we sold a chemical specialties business in 1996. We are still responsible for certain aspects of environmental remediation, undertaken or planned, at those chemical specialties business locations. We have established provisions for the costs of these remediation programs.
In January 2023, MCBC USA received a Notice of Violation / Cease and Desist Order ("Order") from the Colorado Department of Public Health & Environment’s Water Quality Control Division, alleging certain violations of the Colorado Water Quality Control Act (the “Act”) and the Colorado Discharge Permit related to our Company’s brewery and facilities in Golden, Colorado. The Order alleged MCBC USA failed to comply with permit effluent limitations, failed to properly monitor and report sampling results and failed to adhere to the permit compliance schedule.
In the U.S., we were previously notified that we are or may be a potentially responsible party ("PRP") under the Comprehensive Environmental Response, Compensation and Liability Act or similar state laws for the cleanup of sites where hazardous substances have allegedly been released into the environment. We cannot predict with certainty the total costs of cleanup, our share of the total cost, the extent to which contributions will be available from other parties, the amount of time necessary to complete the cleanups or insurance coverage.
Lowry
We are one of a number of entities named by the Environmental Protection Agency ("EPA") as a PRP at the Lowry Superfund site in Colorado. This landfill is owned by the City and County of Denver ("Denver") and is managed by Waste Management of Colorado, Inc. ("Waste Management"). In 1990, we recorded a pretax charge of $30 million, a portion of which was put into a trust in 1993 as part of a settlement with Denver and Waste Management regarding the then-outstanding litigation. Our settlement was based on an assumed remediation cost of $120 million (in 1992 adjusted dollars). We are obligated to pay a portion of future costs in excess of that amount.
Waste Management provides us with updated annual cost estimates through 2032. We review these cost estimates in the assessment of our accrual related to this issue. Our expected liability is based on our best estimates available.
Based on the assumptions utilized, the present value and gross amount of the costs as of December 31, 2023 are approximately $5 million and $6 million, respectively. Cost estimates were discounted using a 3.88% risk-free rate of return. We did not assume any future recoveries from insurance companies in the estimate of our liability and none are expected.
Considering the estimates extend through the year 2032 and the related uncertainties at the site, including what additional remedial actions may be required by the EPA, new technologies and what costs we are required to cover, the estimate of our liability may change as further facts develop. We cannot predict the amount of any such change, but additional accruals in the future are possible.
Other
In prior years, we were notified by the EPA and certain state environmental divisions that we are a PRP, along with other parties, at the East Rutherford and Berry's Creek sites in New Jersey and the Chamblee site in Georgia. Certain former non-beer business operations, which we discontinued use of and subsequently sold, were involved at these sites. Potential losses associated with these sites could increase as remediation planning progresses.
We are aware of groundwater contamination at some of our properties in Colorado resulting from historical, ongoing, or nearby activities. There may also be other contamination of which we are currently unaware.
EMEA&APAC
We are subject to the requirements of governmental and local environmental and occupational health and safety laws and regulations within each of the countries in which we operate. Compliance with these laws and regulations did not materially affect our 2023capital expenditures, results of operations or our financial or competitive position, and we do not currently anticipate that they will do so in 2024.
14. Stockholders' Equity
Changes to the number of shares of capital stock Class B common stock,outstanding were as follows: | | | | | | | | | | | | | | | | | | | | | | | |
| | Common stock
outstanding | | Exchangeable
shares outstanding |
| | Class A | | Class B | | Class A | | Class B |
| | (Share amounts in millions) |
| Balance as of December 31, 2020 | 2.6 | | | 200.3 | | | 2.7 | | | 11.1 | |
| Shares issued under equity compensation plans | — | | | 0.3 | | | — | | | — | |
| | | | | | | |
| | | | | | | |
| Balance as of December 31, 2021 | 2.6 | | | 200.6 | | | 2.7 | | | 11.1 | |
| Shares issued under equity compensation plans | — | | | 0.3 | | | — | | | — | |
| Purchase of treasury shares | — | | | (1.0) | | | — | | | — | |
| Shares exchanged for common stock | — | | | 0.1 | | | — | | | (0.1) | |
| | | | | | | |
| Balance as of December 31, 2022 | 2.6 | | | 200.0 | | | 2.7 | | | 11.0 | |
| Shares issued under equity compensation plans | — | | | 0.4 | | | — | | | — | |
| Purchase of treasury shares | — | | | (3.4) | | | — | | | — | |
| Shares exchanged for common stock | — | | | 1.6 | | | — | | | (1.6) | |
| | | | | | | |
| Balance as of December 31, 2023 | 2.6 | | | 198.6 | | | 2.7 | | | 9.4 | |
Exchangeable Shares
The Class A exchangeable shares and Class B exchangeable shares is entitled to 1 vote for each share held, without the ability to cumulate votes on the election of directors. Our Class B common stock has fewer voting rights than our Class A common stock and holderswere issued by Molson Coors Canada Inc., a wholly-owned subsidiary of our Class A common stock haveCompany. The exchangeable shares are substantially the ability to effectively control or have a significant influence over company actions requiring stockholder approval. Specifically, holderseconomic equivalent of the corresponding shares of Class B common stock voting together as a single class have the right to elect 3 directors of the
Molson Coors Board of Directors, as well as the right to vote on certain additional matters as outlined in the Restated Certificate of Incorporation (as amended, the “Certificate”), such as merger agreements that require approval under applicable law, sales of all or substantially all of our assets to unaffiliated third parties, proposals to dissolve MCBC, and certain amendments to the Certificate that require approval under applicable law, each as further described and limited by the Certificate. The Certificate also provides that holders of Class A common stock and Class B common stock shall vote together asthat a single class, on an advisory basis, on any proposal to approveMolson Inc. shareholder would have received in the compensationmerger of MCBC's named executive officers.
Conversion Rights
The Certificate provides for the right of holders of Class A common stock to convert their stock into Class B common stock on a one-for-one basis at any time. The exchangeable shares are exchangeable at any time, at the option ofAdolph Coors Company with Molson Inc. in February 2005, if the holder on a 1-for-one basis for correspondinghad elected to receive shares of Molson Coors common stock. Therefore, a portionExchangeable shareholders receive the CAD equivalent of our authorized and unissueddividends declared on Class A and Class B common stock on the date of declaration. Holders of exchangeable shares are reservedalso receive, through a voting trust, the benefit of Molson Coors voting rights, entitling the holder to meet exchange requirements.
9. Properties
| | | | | | | | | | | |
| | As of |
| | December 31, 2021 | | December 31, 2020 |
| | (In millions) |
| Land and improvements | $ | 355.9 | | | $ | 341.3 | |
| Buildings and improvements | 1,225.1 | | | 1,074.8 | |
| Machinery and equipment | 4,547.1 | | | 4,537.7 | |
| Returnable containers | 414.0 | | | 414.8 | |
| Furniture and fixtures | 311.4 | | | 295.9 | |
| Software | 507.1 | | | 466.3 | |
| Natural resource properties | 3.8 | | | 3.8 | |
| Construction in progress | 335.2 | | | 532.1 | |
| Total properties cost | 7,699.6 | | | 7,666.7 | |
| Less: accumulated depreciation | (3,507.2) | | | (3,416.4) | |
| Properties, net | $ | 4,192.4 | | | $ | 4,250.3 | |
Depreciation expense was $568.1 million, $702.0 million and $637.8 million in 2021, 2020 and 2019, respectively. The decrease in depreciation expense for the year ended December 31, 2021 compared to 2020 was primarily due to the decrease in accelerated depreciation recorded as a result of certain facility closures as well as assets becoming fully depreciated during the year. Accelerated depreciation recorded during the years ended December 31, 2021, 2020 and 2019 was $15.4 million, $112.3 million and $31.7 million respectively. See Note 7, "Special Items" for further discussion.
10. Goodwill and Intangible Assets
| | | | | | | | | | | | | | | | | |
| | Americas(1) | | EMEA&APAC(1)(2) | | Consolidated |
| Changes in Goodwill | (In millions) |
| Balance as of December 31, 2019 | $ | 6,146.6 | | | $ | 1,484.8 | | | $ | 7,631.4 | |
| Impairments | — | | | (1,484.3) | | | (1,484.3) | |
| Foreign currency translation | 4.4 | | | (0.5) | | | 3.9 | |
| Balance as of December 31, 2020 | $ | 6,151.0 | | | $ | — | | | $ | 6,151.0 | |
| | | | | |
| | | | | |
| | | | | |
| Foreign currency translation | 1.6 | | | — | | | 1.6 | |
| Balance as of December 31, 2021 | $ | 6,152.6 | | | $ | — | | | $ | 6,152.6 | |
(1) On January 1, 2020, we changed our management structure from 4 segments and a corporate center to 2 reportable segments. Under this new structure we have 2 reporting units, Americas and EMEA&APAC.
(2) During 2020, we recognized a goodwill impairment charge of $1,484.3 million to the EMEA&APAC reporting unit recorded in special items, net, in the consolidated statements of operations as a result of continued challenges and declines within the European beer industry brought on by the extended impacts of the continued duration of the global coronavirus pandemic and related outlook of recovery. As of the year ended December 31, 2020, the EMEA&APAC reporting unit was fully impaired.
The gross amount of goodwill totaled approximately $8.4 billion as of December 31, 2021. Accumulated impairment losses as of December 31, 2021 totaled $2,217.5 million, and are comprised of impairments taken on both the EMEA&APAC and the Americas reporting units as well as our historic India reporting unit which is classified as held for sale in the consolidated balance sheets as of December 31, 2021.
The following table presents details of our intangible assets, other than goodwill, as of December 31, 2021:
| | | | | | | | | | | | | | | | | | | | | | | |
| Useful life | | Gross | | Accumulated
amortization | | Net |
| | (Years) | | (In millions) |
| Intangible assets subject to amortization: | | | | | | | |
| Brands | 10 - 50 | | $ | 5,081.8 | | | $ | (1,267.1) | | | $ | 3,814.7 | |
| License agreements and distribution rights | 15 - 20 | | 206.8 | | | (107.2) | | | 99.6 | |
| Other | 3 - 40 | | 98.5 | | | (32.0) | | | 66.5 | |
| Intangible assets not subject to amortization: | | | | | | | |
| Brands | Indefinite | | 8,197.9 | | | — | | | 8,197.9 | |
| Distribution networks | Indefinite | | 800.5 | | | — | | | 800.5 | |
| Other | Indefinite | | 307.6 | | | — | | | 307.6 | |
| Total | | | $ | 14,693.1 | | | $ | (1,406.3) | | | $ | 13,286.8 | |
The following table presents details of our intangible assets, other than goodwill, as of December 31, 2020:
| | | | | | | | | | | | | | | | | | | | | | | |
| Useful life | | Gross | | Accumulated
amortization | | Net |
| | (Years) | | (In millions) |
| Intangible assets subject to amortization: | | | | | | | |
| Brands | 10 - 50 | | $ | 5,128.4 | | | $ | (1,070.6) | | | $ | 4,057.8 | |
| License agreements and distribution rights | 15 - 20 | | 206.8 | | | (99.5) | | | 107.3 | |
| Other | 3 - 40 | | 109.1 | | | (36.4) | | | 72.7 | |
| Intangible assets not subject to amortization: | | | | | | | |
| Brands | Indefinite | | 8,215.7 | | | — | | | 8,215.7 | |
| Distribution networks | Indefinite | | 795.0 | | | — | | | 795.0 | |
| Other | Indefinite | | 307.6 | | | — | | | 307.6 | |
| Total | | | $ | 14,762.6 | | | $ | (1,206.5) | | | $ | 13,556.1 | |
The changes in the gross carrying amounts of intangible assets from December 31, 2020 to December 31, 2021 are primarily due to the impact of foreign exchange rates, as a significant amount of intangible assets are denominated in foreign currencies.
Based on foreign exchange rates as of December 31, 2021, the estimated future amortization expense of intangible assets is as follows:
| | | | | | | | |
| Year | | Amount |
| | | (In millions) |
| 2022 | | $ | 211.1 | |
| 2023 | | $ | 210.1 | |
| 2024 | | $ | 208.8 | |
| 2025 | | $ | 208.7 | |
| 2026 | | $ | 190.2 | |
Amortization expense of intangible assets was $218.0 million, $220.0 million, and $221.2 million for the years ended December 31, 2021, December 31, 2020 and December 31, 2019, respectively. This expense is primarily presented within marketing, general and administrative expenses in our consolidated statements of operations.
Annual 2021 Impairment Assessment
We completed our required annual goodwill and indefinite-lived intangible asset impairment testing as of October 1, 2021, the first day of our fourth quarter, and concluded that the fair value of the Americas reporting unit was determined to be in excess of its carrying amount and no goodwill impairment charge was required. While the Americas reporting unit did not have an impairment of goodwill, it is considered to be at risk for future impairments as further discussed below.
We also evaluated the indefinite-lived and definite-lived intangible assets within our Americas and EMEA&APAC reporting unit, and concluded no impairments were required for our indefinite-lived and no material impairments were required for our definite-lived intangible assets.
The fair value of the Americas reporting unit was estimated at approximately 6% in excess of carrying amount, as of the October 1, 2021 testing date, and therefore the reporting unit is considered to be at risk of future impairment. The fair value of the Americas reporting unit in the current year is still largely impacted by the continued perceived risk of realizing management's revitalization efforts and the ongoing impacts from the coronavirus pandemic. The fair value as of the 2021 test was further impacted by assumptions related to increased cost inflation pressures in the medium term. Additionally, an increase to the discount rate as a result of the recent interest rate environment adversely affected the results of our impairment testing. Specifically, the discount rate used in developing our annual fair value estimates for the Americas reporting unit in the current year was 8.25% based on market-specific factors, as compared to 8.00% used as of the October 1, 2020 annual testing date. In the Americas segment, we continue to build on the strength of our iconic core brands, grow our above premium portfolio, and expand beyond the beer aisle. While the preliminary results of executing on these strategies are promising, including the increasing proportion of our above premium portfolio in the current year, the growth targets included in management’s forecasted future cash flows are inherently at risk given that the strategies are still in progress. Further, the uncertainty around the ongoing impacts of the coronavirus pandemic including governmental or societal impositions on bars and restaurants and restrictions on public gatherings that limit many on-premise locations to operate at full capacity if at all have negatively impacted the forecasted future cash flows of the reporting unit. Lastly, cost inflation for certain inputs could put pressure on achieving key margin and cash flow projections into the future.
As of the October 1, 2021 testing date, the fair value of our Americas reporting unit was determined to be in excess of its carrying value, although considered to be at risk of future impairment. The fair value determinations are sensitive to further unfavorable changes in forecasted cash flows, macroeconomic conditions, market multiples or discount rates that could negatively impact future analyses, including the ongoing impacts of the coronavirus pandemic and cost inflation on our reporting units. The key assumptions used to derive the estimated fair values of our reporting units represent Level 3 measurements.
Indefinite-Lived Intangible Assets
The fair value of the indefinite-lived Miller brands in the U.S., Coors brands in the Americas and Carling brand in the U.K. are all sufficiently in excess of their respective carrying values as of the annual testing date.
The fair value of the Staropramen brand increased versus the prior year and is sufficiently in excess of its carrying value as of the annual testing date. The increase in the fair value of the Staropramen brand was a result of the progressive reopening throughout Europe, but more impactfully Western Europe, during the year and the related improvement to expected future cash flows based on our long-range plan for this brand.
We utilized Level 3 fair value measurements in our impairment analysis of certain indefinite-lived intangible brand assets, including the Coors and Miller brands in the Americas and the Staropramen and Carling brands in EMEA&APAC. An excess earnings approach is used to determine the fair values of these assets as of the testing date. The future cash flows used in the analysis are based on internal cash flow projections based on our long range plans and include significant assumptions by management as noted below. Separately, we performed a qualitative assessment of our water rights indefinite-lived intangible assets in the U.S. to determine whether it was more likely than not that the fair values of these assets were greater than their respective carrying amounts. Based on this qualitative assessment, we determined that a full quantitative analysis was not necessary.
Key Assumptions
As of the date of our annual impairment test, performed as of October 1, 2021, the Americas reporting unit goodwill balance is at risk of future impairment in the event of significant unfavorable changes in the forecasted cash flows (including company-specific risks like the performance of our above-premium and beyond the beer aisle transformation efforts and overall market performance of new innovations like hard seltzers, along with macro-economic risks like the continued prolonged weakening of economic conditions related to the coronavirus pandemic as well as cost inflation, or significant unfavorable changes in tax rates, environmental or other regulations, including interpretations thereof), terminal growth rates, market multiples and/or weighted-average cost of capital utilized in the discounted cash flow analysis. For testing purposes of our reporting units, management's best estimates of the expected future results are the primary driver in determining the fair value. Current projections used for our Americas reporting unit testing reflect growth assumptions associated with our revitalization plan to build on the strength of our iconic core brands, aggressively grow our above premium portfolio, expand beyond the beer aisle, invest in our capabilities and support our people and our communities all of which are intended to benefit the projected cash flows of the business. These cash flow assumptions are tempered somewhat by the impacts the coronavirus pandemic has had on our overall business and specifically our more profitable on-premise business.
Fair value determinations require considerable judgment and are sensitive to changes in underlying assumptions and factors. As a result, there can be no assurance that the estimates and assumptions made for purposes of the goodwill and indefinite-lived intangible impairment tests will prove to be an accurate prediction of the future. Examples of events or circumstances that could reasonably be expected to negatively affect the underlying key assumptions and ultimately impact the estimated fair value of our reporting units and indefinite-lived intangible assets may include such items as: (i) a decrease in expected future cash flows, specifically, an inability to execute on our strategic initiatives or increase in costs that could significantly impact our immediate and long-range results, a prolonged weakness in consumer demand or other competitive pressures adversely affecting our long-term volume trends, a continuation of the trend away from core brands in certain of our markets, especially in markets where our core brands represent a significant portion of the market, unfavorable working capital changes and an inability to successfully achieve our cost savings targets, (ii) adverse changes in macroeconomic conditions or an economic recovery that significantly differs from our assumptions in timing and/or degree (such as a global pandemic or recession), (iii) significant unfavorable changes in tax rates such as increased corporate income tax rates (iv) volatility in the equity and debt markets or other country specific factors which could result in a higher weighted-average cost of capital, (v) sensitivity to market multiples; and (vi) regulation limiting or banning the manufacturing, distribution or sale of alcoholic beverages.
Based on known facts and circumstances, we evaluate and consider recent events and uncertain items, as well as related potential implications, as part of our annual assessment and incorporate into the analyses as appropriate. These facts and circumstances are subject to change and may impact future analyses. For example, we continue to monitor the challenges within the beer industry for further weakening or additional systemic structural declines, as well as for adverse changes in macroeconomic conditions such as the coronavirus pandemic and cost inflation that could significantly impact our immediate and long-range results and could lead to a material impairment. Additionally, we are monitoring the impacts that the coronavirus pandemic and cost inflation have on the market inputs used in calculating our discount rates, including risk-free rates, equity premiums and our cost of debt, which could result in a meaningful change to our weighted-average cost of capital calculation, as well as the market multiples used in our impairment assessment. Furthermore, increased volatility in the equity and debt markets or other country specific factors, including, but not limited to, extended or future government intervention in response to the pandemic, could also result in a meaningful change to our weighted-average cost of capital calculation and other inputs used in our impairment assessment. Separately, the Ontario government in Canada adopted a bill that, if enacted, could adversely impact the existing terms of the beer distribution and retail systems in the province, as further described in Note 18, "Commitments and Contingencies".While historical performance and current expectations have resulted in fair values of our Americas reporting unit and indefinite-lived intangible assets equal to or in excess of carrying values, if our assumptions are not realized, it is possible that an impairment charge may need to be recorded in the future.
Annual 2020 Impairment Assessment
We completed our required annual goodwill and indefinite-lived intangible asset impairment analysis as of October 1, 2020, and concluded there were no impairments of goodwill within our Americas reporting unit but it was considered to be at risk for future impairments. Further, we recognized a goodwill impairment charge of $1,484.3 million to the EMEA&APAC reporting unit, recorded in special items, net, in the consolidated statement of operations. The impairment charge was primarily due to continued challenges and declines within the European beer industry, the largest market of our EMEA&APAC reporting unit, brought on by the extended impacts of the continued duration of the global coronavirus pandemic and related outlook of recovery as well as an increase in the discount rate used for fair value estimation of the reporting unit. As of the year ended December 31, 2020, the EMEA&APAC reporting unit was fully impaired.
In addition, we also evaluated the indefinite-lived and definite-lived intangible assets within our EMEA&APAC reporting unit, prior to recording the goodwill impairment, and concluded that an insignificant impairment was required for a definite-lived intangible asset but no impairments were required for the indefinite-lived intangible assets; however, the Staropramen indefinite-lived intangible asset was considered to be at risk of future impairment as of the year ended December 31, 2020.
Reporting Unit Changes and Interim 2020 Impairment Testing
During 2020, we changed our management structure from a corporate center and 4 segments to 2 segments - Americas and EMEA&APAC. As a result of the changes, we re-evaluated our historical reporting unit conclusions and consolidated our previously separate U.S. and Canada reporting units into a single Americas reporting unit effective January 1, 2020. Further, during 2020, we completed an interim impairment assessment for our former U.S. and Canada reporting units as of January 1, 2020 immediately prior to the reporting unit change, as well as an impairment assessment of the combined Americas reporting unit immediately after the change, and determined that no impairments existed. Additionally, as the changes resulted in the combination of our U.S. and Canada reporting units into a single Americas reporting unit, no further reallocation of goodwill was required.
Additionally, as a result of the structural changes discussed above, including the centralization of the brand management and strategy for our Coors brands across the Americas segment, we have aggregated our Coors brand indefinite-lived intangible asset in the U.S. and Coors Light distribution agreement indefinite-lived intangible asset in Canada into a single unit of accounting for the purpose of testing for impairment, effective January 1, 2020. During 2020, we completed an interim impairment assessment for each individual indefinite-lived intangible asset immediately prior to aggregation, and determined that no impairments existed.
Definite-Lived Intangible Assets
Regarding definite-lived intangible assets, we continuously monitor the performance of the underlying assets for potential triggering events suggesting an impairment review should be performed. In 2021, we considered whether any triggering events have occurred related to definite lived intangibles during the current year. It was noted that in the second quarter of 2021, consistent with our revitalization plan, management made the decision to discontinue select economy SKUs and brands. It was determined that although these specific brand family line extensions had been discontinued, the brand family itself was still being used and produced. Additional evaluation was performed on these specific definite-lived brand intangible assets with no triggering events noted at the asset group level and no changes in useful life of the brand intangible assets deemed necessary. In 2020, we recognized impairment losses on some of our definite-lived intangible assets related to certain regional craft breweries in the Americas and EMEA&APAC. Impairment losses on the Grolsch brand and distribution agreement definite-lived intangible assets and the brand intangible asset related to our historical India business were recognized in 2019. See Note 7, "Special Items" for further details on these impairment losses.
11. Debt
Debt Obligations
| | | | As of | | As of |
| | | December 31, 2021 | | December 31, 2020 | | December 31, 2023 | | December 31, 2022 |
| | | (In millions) | | (In millions) |
| Long-term debt: | | | |
CAD 500 million 2.84% notes due July 2023(1)(2) | $ | 395.7 | | | $ | 392.9 | |
| Long-term debt | | Long-term debt | | | |
CAD 500 million 2.84% notes due July 2023(1)(2)(3) | |
EUR 800 million 1.25% notes due July 2024(1) | |
CAD 500 million 3.44% notes due July 2026(1)(2) | CAD 500 million 3.44% notes due July 2026(1)(2) | 395.7 | | | 392.9 | |
$1.0 billion 2.1% notes due July 2021(3) | — | | | 1,000.0 | |
$500 million 3.5% notes due May 2022(4)(5) | 500.9 | | | 503.7 | |
$2.0 billion 3.0% notes due July 2026(1) | $2.0 billion 3.0% notes due July 2026(1) | 2,000.0 | | | 2,000.0 | |
$1.1 billion 5.0% notes due May 2042(5) | 1,100.0 | | | 1,100.0 | |
$1.1 billion 5.0% notes due May 2042(4) | |
$1.8 billion 4.2% notes due July 2046(1) | $1.8 billion 4.2% notes due July 2046(1) | 1,800.0 | | | 1,800.0 | |
EUR 800 million 1.25% notes due July 2024(1) | 909.6 | | | 977.3 | |
| Finance leases | Finance leases | 67.2 | | | 64.0 | |
| Other | Other | 30.7 | | | 33.8 | |
| Less: unamortized debt discounts and debt issuance costs | Less: unamortized debt discounts and debt issuance costs | (44.6) | | | (50.3) | |
| Total long-term debt (including current portion) | Total long-term debt (including current portion) | 7,155.2 | | | 8,214.3 | |
| Less: current portion of long-term debt | Less: current portion of long-term debt | (508.0) | | | (1,006.1) | |
| Total long-term debt | Total long-term debt | $ | 6,647.2 | | | $ | 7,208.2 | |
| | | Short-term borrowings: | |
| Short-term borrowings(6) | $ | 6.9 | | | $ | 14.0 | |
Short-term borrowings(5) | |
| Short-term borrowings(5) | |
| Short-term borrowings(5) | |
| Current portion of long-term debt | Current portion of long-term debt | 508.0 | | | 1,006.1 | |
| Current portion of long-term debt and short-term borrowings | Current portion of long-term debt and short-term borrowings | $ | 514.9 | | | $ | 1,020.1 | |
(1)On July 7, 2016, MCBC issued approximately $5.3 billionThese senior notes with portions maturing from July 15, 2019 through July 15, 2046 ("were issued in 2016 USD Notes"), and EUR 800 million senior notes maturing July 15, 2024 ("2016 EUR Notes"), and Molson Coors International L.P., completed a private placement of CAD 1.0 billion senior notes maturing July 15, 2023, and July 15, 2026 ("2016 CAD Notes"), in order to partially fund the financing of the MillerCoors Acquisition (2016 USD(USD Notes, 2016 EUR Notes and 2016 CAD Notes, collectively, the "2016 Notes")Notes). These issuances resulted in total proceeds of approximately $6.9 billion, net of underwriting fees and discounts of $36.5 million and $17.7 million, respectively. Total remaining debt issuance costs capitalized in connection with these notes including underwriting fees, discounts and other financing related costs, were approximately $65$27.2 million as of December 31, 2023 and are being amortized over the respective terms of the 2016 Notes. The 2016 Notes began accruing interest upon issuance, with semi-annual payments due on the 2016 USD Notes and 2016 CAD Notes in January and July beginning in 2017, and annual interest payments due on the 2016 EUR Notes in July beginning in 2017.remaining terms.
(2)We entered into forward starting interest rate swap agreements to hedge interest rate volatility for a 10 year10-year period until theythe swaps were settled on September 18, 2015. We are amortizing a portion of the resulting loss from AOCI to interest expense over the remaining term of the 2016 CAD Notes, as defined below,500 million 3.44% notes maturing July 2026 ("2026 CAD notes"), up to the full 10-year term of the interest rate swap agreements.swaps. The amortizing loss resulted in an increase in our effective cost of borrowing compared to the stated coupon rates by 0.60%0.4% on the 20162026 CAD Notes.notes. See Note 16,10, "Derivative Instruments and Hedging Activities" for further details on the forward starting interest rate swaps. (3)We repaid our $1.0 billion 2.1%CAD 500 million 2.84% notes atupon maturity on July 15, 2021,2023 using a combination of commercial paper borrowings and cash on hand and also settled the associated cross currency swap. Prior to settlement in July 2021, the cross currency swaps economically converted a portion of the repaid $1.0 billion 2.1% notes and associated interest to EUR denominated, which resulted in a EUR interest rate received of 0.71%. See Note 16, "Derivative Instruments and Hedging Activities" for further details.hand. (4)During 2014, we entered into interest rate swaps to economically convert our fixed rate $500 million 3.5% notes due 2022 ("$500 million notes") to floating rate debt. As a result of fair value hedge accounting, the carrying value of the
$500 million notes included a cumulative adjustment for the change in fair value of $18.1 million at the time of termination of the swaps. Beginning in the fourth quarter of 2015, we began amortizing this cumulative adjustment to interest expense over the remaining term of the $500 million notes and will accordingly decrease the annual effective interest rate for the remaining term by 0.56%. The fair value adjustments and subsequent amortization have been excluded from the aggregate principal debt maturities table presented below.
The balance of the fair value hedges being amortized over the life of the note were $0.9 million and $3.7 million as of December 31, 2021 and December 31, 2020, respectively. The balance as of December 31, 2021 was included within the current portion of long-term debt and short-term borrowings of the consolidated balance sheet and the balance as of December 31, 2020 was included within long-term debt of the consolidated balance sheet.
(5)On May 3, 2012, we issued approximately $1.9 billion of senior notes with portions maturing$1.1 billion remaining due in 2017, 2022 and 2042. The issuance resulted in total proceeds, before expenses, of approximately $1.9 billion, net of underwriting fees and discounts of $14.7 million and $4.6 million, respectively. Totalremaining debt issuance costs capitalized in connection with these senior notes, including the underwriting fees and discounts, were approximately $18.0$8.3 million as of December 31, 2023 and are being amortized over the remaining term of the 2042 notes.
(6)(5)Our short-term borrowings include bank overdrafts, borrowings on our overdraft facilities and other items.
As of December 31, 2021,2023, we had $3.0$16.5 million in bank overdrafts and $123.1$75.5 million in bank cash related to our cross-border, cross-currency cash pool for a net positive position of $120.1$59.0 million. As of December 31, 2020,2022, we had $11.0$15.9 million in bank overdrafts and $103.7$49.7 million in bank cash related to our cross-border, cross-currency cash pool for a net positive position of $92.7$33.8 million.
We had total outstanding borrowings of $3.9 million and $3.0 million under our JPY facilities as of December 31, 2021 and December 31, 2020, respectively. In addition, we have CAD, GBP and USD overdraft facilities under which we had no outstanding borrowings as of December 31, 20212023 or December 31, 2020. 2022.
•JPY 1.3 billion line of credit at Japan TIBOR plus 0.30%
•JPY 100 million overdraft facility at Japan short-term Prime rate
•CAD unlimited overdraft facility at CAD Prime plus 0.50%
•GBP 3010 million overdraft facility at GBP base rateBase Rate plus 1.75%2.25%
•USD 10 million overdraft facility at USD Prime plus 5%
Debt Fair Value Measurements
We utilize market approaches to estimate the fair value of certain outstanding borrowings by discounting anticipated future cash flows derived from the contractual terms of the obligations and observable market interest and foreign exchange rates. As of December 31, 20212023 and December 31, 2020,2022, the fair value of our outstanding long-term debt (including current portion of long-term debt) was approximately $7.7 billion and $9.1 billion, respectively.$5.9 billion. All senior notes are valued based on significant observable inputs and classified as Level 2 in the fair value hierarchy. The carrying values of all other outstanding long-term borrowings and our short-term borrowings approximate their fair values and are also classified as Level 2 in the fair value hierarchy.
Revolving Credit Facility and Commercial Paper
We maintain aOn June 26, 2023, we amended and restated our multi-currency revolving credit facility to, among other things, extend the term through June 26, 2028, and to increase the borrowing capacity to $2.0 billion. This $2.0 billion revolving credit facility amended our pre-existing $1.5 billion revolving credit facility, with a maturity date ofwhich was scheduled to mature on July 7, 2024 that also allows us2024. On September 28, 2023, we amended our commercial paper program, which reduces borrowing capacity under the revolving credit facility, to issue a maximum aggregate amountborrowing capacity of $1.5$2.0 billion in commercial paper or make other borrowingsto borrow at any time at variable interest rates. The $150 million sub-facility available for the issuance of letters of credit remains unchanged.
Concurrent with the amended and restated multi-currency revolving credit facility, in the second quarter of 2023, we incurred incremental issuance costs of $5.2 million related to the $2.0 billion revolving credit facility, which are recorded within other current assets, net, and other assets on the consolidated balance sheets and are being amortized over the term of the facility. We use this financingfacility from time to time to leverage cash needs including debt repayments. During 2021, we utilized borrowings from this facility in order to fund the repayment of debt upon maturity and for working capital andor general purposes. We had no borrowings drawn on this revolving credit facility and no commercial paper borrowings as of December 31, 20212023 and December 31, 2020.2022.
Debt Covenants
On June 19, 2020, we entered into an amendment to our existing revolving credit facility agreement, which among other things, revised the leverage ratios under the financial maintenance covenant for each fiscal quarter ending on or after June 30, 2020 through the maturity of the credit facility. The maximum leverage ratio, as defined by our revolving credit facility agreement as of December 31, 2021 is 4.00x net debt to EBITDA, through maturity of the credit facility.
Under the terms of each of our debt facilities, we must comply with certain restrictions. These include customary events of default and specified representations, warranties and covenants, as well as covenants that restrict our ability to incur certain
additional priority indebtedness (certain thresholds of secured consolidated net tangible assets), certain leverage threshold percentages, create or permit liens on assets, and restrictions on mergers, acquisitions, and certain types of sale lease-back transactions.
Under the amended and restated $2.0 billion revolving credit facility, we are required to maintain a maximum leverage ratio, calculated as net debt to EBITDA (as defined in the revolving credit facility agreement) of 4.00x, measured as of the last day of each fiscal quarter through maturity of the credit facility. As of December 31, 20212023 and December 31, 2020,2022, we were in compliance with all of these restrictions and covenants, have met such financial ratios, and have met all debt payment obligations. All of our outstanding senior notes as of December 31, 20212023 rank pari-passu.
As of December 31, 2021,2023, the aggregate principal debt maturities of long-term debt and short-term borrowings, based on foreign exchange rates as of December 31, 2021, for the next 5 years are2023, were as follows:
| | Year | Year | | Amount | Year | | Amount |
| | | | (In millions) | | | (In millions) |
| 2022 | | $ | 512.3 | |
| 2023 | | 400.5 | |
| 2024 | 2024 | | 914.2 | |
| 2025 | 2025 | | 4.4 | |
| 2026 | 2026 | | 2,411.9 | |
| 2027 | |
| 2028 | |
| Thereafter | Thereafter | | 2,895.3 | |
| Total | Total | | $ | 7,138.6 | |
The aggregate principal debt maturities in the table above excludes the present valueOther and Finance leases. The future maturities of finance leases which are disclosed in Note 19,8, "Leases."
Interest
| | | | | | | | | | | | | | | | | |
| | For the years ended |
| | December 31, 2021 | | December 31, 2020 | | December 31, 2019 |
| | (In millions) |
| Interest incurred | $ | 269.1 | | | $ | 282.3 | | | $ | 289.2 | |
| Interest capitalized | (8.8) | | | (7.7) | | | (8.3) | |
| Interest expensed | $ | 260.3 | | | $ | 274.6 | | | $ | 280.9 | |
| | | | | | | | | | | | | | | | | |
| | For the years ended |
| | December 31, 2023 | | December 31, 2022 | | December 31, 2021 |
| | (In millions) |
| Interest incurred | $ | 243.4 | | | $ | 257.4 | | | $ | 269.1 | |
| Interest capitalized | (9.4) | | | (6.8) | | | (8.8) | |
| Interest expensed | $ | 234.0 | | | $ | 250.6 | | | $ | 260.3 | |
12. Inventories10. Derivative Instruments and Hedging Activities
| | | | | | | | | | | |
| | As of |
| | December 31, 2021 | | December 31, 2020 |
| (In millions) |
| Finished goods | $ | 351.5 | | | $ | 266.7 | |
| Work in process | 71.8 | | | 72.7 | |
| Raw materials | 271.2 | | | 242.2 | |
| Packaging materials | 110.2 | | | 82.7 | |
| Inventories, net | $ | 804.7 | | | $ | 664.3 | |
We use derivatives as part of our normal business operations to manage our exposure to fluctuations in interest rates, foreign currency, commodity price risk and for other strategic purposes related to our core business. We have established policies and procedures that govern the risk management of these exposures. Our primary objective in managing these exposures is to decrease the volatility of cash flows affected by changes in the underlying rates and prices.
13. Share-Based PaymentsTo achieve our objectives, we enter into a variety of financial derivatives, including foreign currency exchange, commodity, interest rate, cross currency swaps as well as options. We also enter into physical hedging agreements directly with our suppliers to manage our exposure to certain commodities.
Counterparty Risk
While, by policy, the counterparties to any of the financial derivatives we enter into are major institutions with minimum investment grade credit ratings of BBB- by Standard & Poor's (or the equivalent) or Baa3 by Moody's, we are exposed to credit-related losses in the event of non-performance by counterparties. This credit risk is generally limited to the unrealized gains in such contracts, should any of these counterparties fail to perform as contracted.
We have established a counterparty credit policy and guidelines that are monitored and reported to management to assist in managing this risk. As an additional measure, we utilize a portfolio of institutions either headquartered or operating in the same countries that we conduct our business. In calculating the fair value of our derivative balances, we also record an adjustment to recognize the risk of counterparty credit and our own non-performance risk, as appropriate.
Price and Liquidity Risks
We base the fair value of our derivative instruments upon market rates and prices. The volatility of these rates and prices are dependent on many factors that cannot be forecasted with reliable accuracy. The current fair values of our contracts could differ significantly from the cash settled values with our counterparties. As such, we are exposed to price risk related to unfavorable changes in the fair value of our derivative contracts.
We may be forced to cash settle all or a portion of our derivative contracts before the expected settlement date upon the occurrence of certain contractual triggers including a change of control, termination event or other breach of agreement. This could have a negative impact on our liquidity. For derivative contracts that we have designated as hedging instruments, early cash settlement would result in the timing of our hedge settlement not being matched to the cash settlement of the forecasted transaction or firm commitment. We may also decide to cash settle all or a portion of our derivative contracts before the expected settlement date through negotiations with our counterparties, which could also impact our cash position.
Due to the nature of our counterparty agreements, we are not able to net positions with the same counterparty across business units. Thus, in the event of default, we may be required to early settle all out-of-the-money contracts, without the benefit of netting the fair value of any in-the-money positions against this exposure.
Collateral
We do not receive and are not required to post collateral unless a change of control event occurs. This termination event would give either party the right to early terminate all outstanding swap transactions in the event that the other party consolidates, merges with, or transfers all or substantially all of its assets to, another entity, and the creditworthiness of the surviving entity that has assumed such party's obligations is materially weaker than that of such party. As of December 31, 2023, we did not have any collateral posted with any of our counterparties.
Derivative Accounting Policies
Overview
Our forward starting interest rate swaps and most of our foreign currency forwards are designated in hedging relationships as cash flow hedges. Prior to settlements discussed below, our interest rate swaps were designated as fair value hedges and our cross currency swaps were designated as net investment hedges. In certain situations, we may execute derivatives that do not qualify for, or we do not otherwise seek, hedge accounting but are determined to be important for managing risk. For example, our commodity swaps and commodity options are not designated in hedge accounting relationships. These outstanding economic hedges are measured at fair value on our consolidated balance sheets with changes in fair value recorded in earnings. We have historically elected to apply the NPNS exemption to certain contracts, as applicable. These contracts are typically transacted with our suppliers and include risk management features that allow us to fix the price on specific volumes of purchases for specified delivery periods. We also consider whether any provisions in our contracts represent embedded derivative instruments as defined in authoritative accounting guidance and apply the appropriate accounting.
Hedge Accounting Policies
We formally document all relationships receiving hedge accounting treatment between hedging instruments and hedged items, as well as the risk-management objective and strategy for undertaking hedge transactions pursuant to prescribed guidance. We also formally assess effectiveness both at the hedge's inception and on an ongoing basis, specifically whether the derivatives that are used in hedging transactions have been highly effective in mitigating the risk designated as being hedged and whether those hedges may be expected to remain highly effective in future periods. Specific to net investment hedges, we have elected to use the spot-to-spot methodology to assess effectiveness.
We discontinue hedge accounting prospectively when (1) the derivative is no longer highly effective in offsetting changes in the cash flows of a forecasted future transaction; (2) the derivative expires or is sold, terminated, or exercised; (3) it is no longer probable that the forecasted transaction will occur; (4) management determines that designating the derivative as a hedging instrument is no longer appropriate; or (5) management decides to cease hedge accounting.
When we discontinue hedge accounting prospectively, but it continues to be probable that the forecasted transaction will occur in the originally expected period, the existing gain or loss on the derivative remains in AOCI for cash flow hedges and net investment hedges or in the carrying value of the hedged item for fair value hedges and is reclassified into earnings when the forecasted transaction affects earnings. However, if it is probable that a forecasted transaction will no longer occur by the end of the originally specified time period or within an additional two-month period of time thereafter, the gains and losses in AOCI are recognized immediately in earnings. In all situations in which hedge accounting is discontinued and the derivative remains outstanding, we carry the derivative at its fair value on the consolidated balance sheets until maturity, recognizing future changes in the fair value in current period earnings.
Significant Derivative/Hedge Positions
Net Investment Hedges
Foreign Denominated Debt
In 2016, we issued EUR 800 million senior notes maturing July 15, 2024 to partially fund the MillerCoors Acquisition. Concurrent with the issuance of these notes, we simultaneously designated the principals as net investment hedges of our investment in our Europe business in order to hedge a portion of the foreign currency translational impacts and, accordingly, record the changes in the carrying value due to fluctuations in the spot rate to AOCI.
Cross Currency Swaps
In 2019, we entered into cross currency swap agreements having a total notional value of approximately EUR 353 million ($400 million upon execution) in order to hedge a portion of the foreign currency translational impacts of our European investment. Upon repayment of the $1.0 billion 2.1% senior notes at maturity in July 2021, we settled the associated cross currency swap resulting in a net cash payment of $12.7 million, consisting of the final loss on the cross currency swap of $17.6 million partially offset by the final interest received. The settlement of these cross currency swaps were classified as investing activities in our consolidated statement of cash flows.
We had designated each of these cross currency swaps as net investment hedges and accordingly, recorded changes in fair value due to fluctuations in the spot rate to AOCI. The changes in fair value of the swaps attributable to changes other than those due to fluctuations in the spot rate were excluded from the assessment of hedge effectiveness and recorded to interest expense over the life of the hedge.
Forward Starting Interest Rate Swaps
During 2018, we entered into forward starting interest rate swaps with a notional amount totaling $1.5 billion with termination dates of July 2021, May 2022 and July 2026. The swaps had effective dates mirroring the terms of the forecasted debt issuances. Under the agreements, we are required to early terminate these swaps at the time we expect to issue the related forecasted debt. We designated these contracts as cash flow hedges. As a result, the unrealized mark-to-market gains or losses are recorded to AOCI until termination at which point the realized gain or loss of these swaps at issuance of the hedged debt are reclassified from AOCI and amortized to interest expense over the term of the hedged debt.
In June 2021, we early terminated our $250.0 million forward starting interest rate swap that was originally set to terminate in July 2021. This forward starting interest rate swap was rolled forward to May 2022 through a cashless settlement. The new May 2022 forward starting interest rate swap was incremental to our existing May 2022 forward starting interest rate swap that was executed in 2018, both of which were hedging our forecasted debt issuance expected to occur during 2022. In late April 2022, the forward starting interest rate swaps associated with the $500 million 3.5% notes that we repaid upon maturity on May 1, share-based compensation plan,2022 were terminated and settled. The immaterial loss on settlement of the MCBC Incentive Compensation Plan (the "Incentive Compensation Plan"),swaps was recorded through interest expense during the second quarter of 2022.
In 2015, we entered into forward starting interest rate swaps with a notional of CAD 600 million in order to manage our exposure to the volatility of the interest rates associated with the future interest payments on the forecasted CAD debt issuances. The swaps had a termination date of September 2025 mirroring the terms of initially forecasted CAD debt issuances. Under these agreements we were required to early terminate these swaps at the approximate time we issued the previously forecasted debt. We had designated these swaps as cash flow hedges and accordingly, a portion of the CAD 39.2 million ($29.5 million at settlement) loss on the swaps is being reclassified from AOCI and amortized to interest expense over the remaining term of the 2026 CAD notes up to the full 10-year term of the swaps. Additionally, in 2023 we repaid our CAD 500 million 2.84% notes upon maturity which resulted in an acceleration of amortization of the loss for an immaterial amount. The remaining unamortized portion of the loss in AOCI as of December 31, 2021 and all outstanding awards fall under this plan.2023 was $5.7 million.
Incentive Compensation Plan
We issue the following types of awards related to shares of Class B common stock to certain directors, officers, and other eligible employees, pursuant to the Incentive Compensation Plan: RSUs, DSUs, PSUs and stock options.
RSU awards are issued based upon the market value equal to the price of our stock at the date of the grant and generally vest over a period of three years. In 2021, 2020 and 2019, we granted 0.6 million, 0.5 million and 0.5 million RSUs, respectively, with a weighted-average market value of $45.84, $48.99 and $55.03 each, respectively. Prior to vesting, RSUs have no voting rights.
DSU awards, under the Directors' Stock Plan pursuant to the Incentive Compensation Plan, are elections made by non-employee directors of MCBC that enable them to receive all or one-half of their annual cash retainer payments in our stock. The DSU awards are issued at the market value equal to the price of our stock at the date of the grant. The DSUs are paid in shares of stock upon termination of service. Prior to vesting, DSUs have no voting rights. In 2021, 2020 and 2019, we granted a small number of DSUs with a weighted-average market value of $49.33, $37.53 and $56.68 per share, respectively.
PSU awards are granted with a target value established at the date of grant and vest upon completion of a service requirement. The settlement amount of the PSUs is determined based on market and performance metrics, which include our total shareholder return performance relative to the stock market index defined by each award and specified internal performance metrics designed to drive greater shareholder return. PSU compensation expense is based on fair values assigned to the market and performance metrics upon grant using a Monte Carlo model, with the market metric remaining constant throughout the vesting period of three years and the performance metric varying based on a multiplier determined based on changing estimates of the performance metric projected attainment. During 2021, 2020 and 2019, we granted 0.4 million, 0.3 million and 0.3 million PSUs, respectively, each with a weighted-average fair value of $45.71, $52.60 and $53.31, respectively.
Stock options are granted with an exercise price equal to the market value of a share of Class B common stock on the date of grant. Stock options have a term of ten years and generally vest over three years. During 2021, 2020 and 2019, we granted 0.3 million, 0.4 million and 0.4 million options, respectively, each with a weighted-average fair value of $10.06, $6.70 and $9.20, respectively.
Certain RSU and PSU awards granted in 2020 and beyond entitle participants to receive dividends upon vesting, subject to the performance, vesting and other conditions, including forfeiture, applicable to the respective awards.
The following table presents the pre-tax and after-tax share based compensation expense.
| | | | | | | | | | | | | | | | | |
| | For the years ended |
| | December 31, 2021 | | December 31, 2020 | | December 31, 2019 |
| | (In millions) |
| Pretax share-based compensation expense | $ | 32.1 | | | $ | 24.2 | | | $ | 8.5 | |
| Tax benefit | (5.5) | | | (4.3) | | | (1.6) | |
| After-tax share-based compensation expense | $ | 26.6 | | | $ | 19.9 | | | $ | 6.9 | |
As of December 31, 2021, there was $40.6 million of total unrecognized compensation cost from all share-based compensation arrangements granted under the Incentive Compensation Plan, related to unvested awards. This total compensation expense is expected to be recognized over a weighted-average period of 1.8 years.
| | | | | | | | | | | | | | | | | | | | | | | |
| | RSUs and DSUs | | PSUs |
| | Units | | Weighted-average
grant date fair value per unit | | Units | | Weighted-average grant date fair value per unit |
| | (In millions, except per unit amounts) |
| Non-vested as of December 31, 2020 | 1.0 | | $56.21 | | 0.7 | | $58.12 |
| Granted | 0.6 | | $45.88 | | 0.4 | | $45.71 |
| Vested | (0.2) | | $68.89 | | — | | $— |
| Forfeited | (0.1) | | $49.87 | | (0.1) | | $49.44 |
| Adjustment for performance results achieved | — | | $— | | (0.2) | | $78.28 |
| Non-vested as of December 31, 2021 | 1.3 | | $49.23 | | 0.8 | | $49.47 |
The total intrinsic values of RSUs and DSUs vested during 2021, 2020 and 2019 were $12.7 million, $14.8 million and $23.6 million, respectively.
| | | | | | | | | | | | | | | | | | | | | | | |
| | Stock options |
| | Awards | | Weighted-
average
exercise price per unit | | Weighted-
average
remaining
contractual
life (years) | | Aggregate
intrinsic
value |
| (In millions, except per share amounts and years) |
| Outstanding as of December 31, 2020 | 1.8 | | $66.32 | | 4.5 | | $ | 0.2 | |
| Granted | 0.3 | | $44.97 | | | | |
| Exercised | (0.1) | | $44.10 | | | | |
| | | | | | | |
| Expired | (0.1) | | $78.49 | | | | |
| Outstanding as of December 31, 2021 | 1.9 | | $63.15 | | 4.8 | | $ | 0.6 | |
| Expected to vest as of December 31, 2021 | 0.7 | | $49.27 | | 8.1 | | $ | 0.4 | |
| Exercisable as of December 31, 2021 | 1.2 | | $70.61 | | 3.0 | | $ | 0.2 | |
The total intrinsic values of exercises during 2021, 2020 and 2019 were $0.9 million, $0.8 million and $0.6 million, respectively. Total tax benefits realized, including excess tax benefits, from share-based awards vested or exercised during 2021, 2020 and 2019 was $2.0 million, $3.1 million and $4.5 million, respectively.
The shares of Class B common stock to be issued under our equity plans are made available from authorized and unissued MCBC Class B common stock. As of December 31, 2021, there were 5.0 million shares of MCBC Class B common stock available for issuance under the Incentive Compensation Plan.
The fair value of each option granted in 2021, 2020 and 2019 was determined on the date of grant using the Black-Scholes option-pricing model with the following weighted-average assumptions:
| | | | | | | | | | | | | | | | | |
| | For the years ended |
| | December 31, 2021 | | December 31, 2020 | | December 31, 2019 |
| Risk-free interest rate | 0.79% | | 0.91% | | 2.46% |
| Dividend yield | 3.11% | | 4.40% | | 4.16% |
| Volatility range | 30.84% - 42.44% | | 25.09% - 26.31% | | 24.46% - 24.60% |
| Weighted-average volatility | 33.74% | | 25.40% | | 24.48% |
| Expected term (years) | 5.6 | | 5.5 | | 5.3 |
| Weighted-average fair value | $10.06 | | $6.70 | | $9.20 |
The risk-free interest rates utilized for periods throughout the contractual life of the stock options are based on a zero-coupon U.S. Department of Treasury security yield at the time of grant. Expected volatility is based on a combination of historical and implied volatility of our stock. The expected term of stock options is estimated based upon observations of historical employee option exercise patterns and trends of those employees granted options in the respective year.
The fair values of both the market metric and performance metric for each PSU granted in 2021, 2020 and 2019 was determined on the date of grant using a Monte Carlo model to simulate total stockholder return for MCBC and peer companies with the following weighted-average assumptions.
| | | | | | | | | | | | | | | | | |
| For the years ended |
| December 31, 2021 | | December 31, 2020 | | December 31, 2019 |
| Risk-free interest rate | 0.24% | | 0.84% | | 2.49% |
| Dividend yield | N/A | | N/A | | 4.17% |
| Volatility range | 23.00% - 44.71% | | 15.21% - 45.75% | | 13.82% - 42.46% |
| Weighted-average volatility | 35.46% | | 26.02% | | 24.97% |
| Expected term (years) | 2.8 | | 2.8 | | 2.8 |
| Weighted-average fair market value | $45.71 | | $52.60 | | $53.31 |
The risk-free interest rates utilized for periods throughout the expected term of the PSUs are based on a zero-coupon U.S. Department of Treasury security yield at the time of grant. Expected volatility is based on historical volatility of our stock as well as the stock of our peer firms, as shown within the volatility range above, for a period from the grant date consistent with the expected term. The expected term of PSUs is calculated based on the grant date to the end of the performance period.
14. Accumulated Other Comprehensive Income (Loss)
| | | | | | | | | | | | | | | | | | | | | | | | | | | | | |
| | MCBC stockholders' equity |
| | Foreign
currency
translation
adjustments | | Gain (loss) on
derivative
instruments | | Pension and
postretirement
benefit
adjustments | | Equity method
investments | | Accumulated
other
comprehensive
income (loss) |
| | (In millions) |
| As of December 31, 2018 | $ | (758.7) | | | $ | (0.3) | | | $ | (330.7) | | | $ | (60.3) | | | $ | (1,150.0) | |
| Foreign currency translation adjustments | 129.3 | | | — | | | (2.5) | | | — | | | 126.8 | |
| | | | | | | | | |
| Gain (loss) on net investment hedges | 50.3 | | | — | | | — | | | — | | | 50.3 | |
| Unrealized gain (loss) on derivative instruments | — | | | (111.3) | | | — | | | — | | | (111.3) | |
| Reclassification of derivative (gain) loss to income | — | | | 0.6 | | | — | | | — | | | 0.6 | |
| Pension and other postretirement benefit adjustments | — | | | — | | | (43.7) | | | — | | | (43.7) | |
| Amortization of net prior service (benefit) cost and net actuarial (gain) loss to income and settlement | — | | | — | | | 26.5 | | | — | | | 26.5 | |
| Ownership share of unconsolidated subsidiaries' other comprehensive income (loss) | — | | | — | | | — | | | (14.4) | | | (14.4) | |
| Tax benefit (expense) | (0.1) | | | 27.0 | | | (2.9) | | | 3.8 | | | 27.8 | |
| Net period other comprehensive income (loss) | 179.5 | | | (83.7) | | | (22.6) | | | (10.6) | | | 62.6 | |
Reclassification of stranded tax effects (1) | (73.3) | | | (3.8) | | | 2.3 | | | — | | | (74.8) | |
| As of December 31, 2019 | $ | (652.5) | | | $ | (87.8) | | | $ | (351.0) | | | $ | (70.9) | | | $ | (1,162.2) | |
| Foreign currency translation adjustments | 196.0 | | | — | | | (1.6) | | | — | | | 194.4 | |
| | | | | | | | | |
| Gain (loss) on net investment hedges | (113.5) | | | — | | | — | | | — | | | (113.5) | |
| Unrealized gain (loss) on derivative instruments | — | | | (113.5) | | | — | | | — | | | (113.5) | |
| Reclassification of derivative (gain) loss to income | — | | | (0.5) | | | — | | | — | | | (0.5) | |
| Pension and other postretirement benefit adjustments | — | | | — | | | (52.9) | | | — | | | (52.9) | |
| Amortization of net prior service (benefit) cost and net actuarial (gain) loss to income and settlement | — | | | — | | | (7.6) | | | — | | | (7.6) | |
| Ownership share of unconsolidated subsidiaries' other comprehensive income (loss) | — | | | — | | | — | | | 19.4 | | | 19.4 | |
| Tax benefit (expense) | 30.5 | | | 27.9 | | | 15.4 | | | (5.2) | | | 68.6 | |
| | | | | | | | | |
| | | | | | | | | |
| As of December 31, 2020 | $ | (539.5) | | | $ | (173.9) | | | $ | (397.7) | | | $ | (56.7) | | | $ | (1,167.8) | |
| Foreign currency translation adjustments | (85.6) | | | — | | | (1.2) | | | — | | | (86.8) | |
Reclassification of cumulative translation adjustment to income (2) | 7.5 | | | — | | | — | | | — | | | 7.5 | |
| Gain (loss) on net investment hedges | 76.5 | | | — | | | — | | | — | | | 76.5 | |
| Unrealized gain (loss) on derivative instruments | — | | | 51.1 | | | — | | | — | | | 51.1 | |
| Reclassification of derivative (gain) loss to income | — | | | 7.5 | | | — | | | — | | | 7.5 | |
| Pension and other postretirement benefit adjustments | — | | | — | | | 158.6 | | | — | | | 158.6 | |
| Amortization of net prior service (benefit) cost and net actuarial (gain) loss to income and settlement | — | | | — | | | 7.1 | | | — | | | 7.1 | |
| Ownership share of unconsolidated subsidiaries' other comprehensive income (loss) | — | | | — | | | — | | | 20.8 | | | 20.8 | |
| Tax benefit (expense) | (17.6) | | | (15.7) | | | (41.9) | | | (5.3) | | | (80.5) | |
| | | | | | | | | |
| | | | | | | | | |
| As of December 31, 2021 | $ | (558.7) | | | $ | (131.0) | | | $ | (275.1) | | | $ | (41.2) | | | $ | (1,006.0) | |
(1)Represents the one-time reclassification of stranded tax effects from AOCI to retained earnings resulting from the change in the U.S. federal corporate income tax rate as part of the 2017 Tax Act. This reclassification occurred on January 1, 2019 upon adoption of the associated FASB authoritative guidance.
(2)As a result of the sale of a disposal group within our India business, the associated cumulative foreign currency translation adjustment was reclassified from AOCI and recognized within special items, net.Foreign Currency Forwards
We have significant levelsfinancial foreign exchange forward contracts in place to manage our exposure to foreign currency fluctuations. We hedge foreign currency exposure related to certain royalty agreements, exposure associated with the purchase of net assetsproduction inputs and imports that are denominated in currencies other than the USD dueentity's functional currency and most other foreign exchanges exposures. These contracts have been designated as cash flow hedges of forecasted foreign currency transactions. We use foreign currency forward contracts to hedge these future forecasted transactions up to a 60 month horizon.
In the second quarter of 2023, we entered into approximately CAD 260 million (approximately $195 million USD) of foreign exchange forward contracts to manage our exposure to foreign currency fluctuations related to the repayment of our CAD 500 million 2.84% notes that matured on July 15, 2023. These contracts were not designated in hedge accounting relationships; as such, changes in the fair value were recorded in other non-operating income (expense), net in the consolidated statements of operations. These contracts settled on July 12, 2023 in advance of the notes repayment for an immaterial amount.
Commodity Swaps and Options
We have financial commodity swap and option contracts in place to hedge changes in the prices of natural gas, aluminum, including surcharges relating to our operationsaluminum exposures, corn, sweeteners, barley and diesel. These contracts allow us to swap our floating exposure to changes in foreign countries,these commodity prices for a fixed rate. These contracts are not designated in hedge accounting relationships. As such, changes in fair value of these derivatives are recorded in cost of goods sold in the consolidated statements of operations. We hedge forecasted purchases of natural gas, aluminum, corn, sweeteners and thereforediesel each up to 60 months out in the future for use in our supply chain, in line with our risk management policy. Further, we recognize OCI gains and/hedge forecasted purchases of barley based on crop year and physical inventory management. For purposes of measuring segment operating performance, the unrealized changes in fair value of the swaps not designated in hedge accounting relationships are reported in Unallocated outside of the segment specific operating results until such time that the exposure we are managing is realized. At that time, we reclassify the gain or losses when those items are translated to USD. The foreign currency translation losses recognized during 2021 were primarily dueloss from Unallocated to the weakeningrespective operating segment, allowing our operating segments to realize the economic effects of the GBP, EUR and certain other currencies of our Europe operations versusderivative without the USD. The foreign currency translation adjustment gains during 2020 and 2019 were primarily due to the strengthening of the CAD and GBP versus the USD. Additionally, the 2020 foreign currency translation adjustment gains were further impacted by the strengthening of certain other currencies of our Europe operations versus the USD.resulting unrealized mark-to-market volatility.
Reclassifications from AOCI to income
| | | | | | | | | | | | | | | | | | | | | | | |
| For the years ended | | |
| December 31, 2021 | | December 31, 2020 | | December 31, 2019 | | |
| Reclassifications from AOCI | | Location of gain (loss)
recognized in income |
| (In millions) | | |
| Gain/(loss) on cash flow hedges | | | | | | | |
| Forward starting interest rate swaps | $ | (4.8) | | | $ | (2.9) | | | $ | (3.0) | | | Interest expense, net |
| Foreign currency forwards | (3.5) | | | 4.6 | | | 3.1 | | | Cost of goods sold |
| Foreign currency forwards | 0.8 | | | (1.2) | | | (0.7) | | | Other income (expense), net |
| | | | | | | |
| Total income (loss) reclassified, before tax | (7.5) | | | 0.5 | | | (0.6) | | | |
| Income tax benefit (expense) | 2.0 | | | (0.1) | | | 0.1 | | | |
| Net income (loss) reclassified, net of tax | $ | (5.5) | | | $ | 0.4 | | | $ | (0.5) | | | |
| | | | | | | |
| Amortization of defined benefit pension and other postretirement benefit plan items: | | | | | | | |
| Prior service benefit (cost) | $ | 0.3 | | | $ | 0.4 | | | $ | (0.4) | | | Other pension and postretirement benefits (costs), net |
| Net actuarial gain (loss) and settlement | (7.4) | | | 7.2 | | | (26.1) | | | Other pension and postretirement benefits (costs), net |
| Total income (loss) reclassified, before tax | (7.1) | | | 7.6 | | | (26.5) | | | |
| Income tax benefit (expense) | 1.7 | | | (2.4) | | | 6.8 | | | |
| Net income (loss) reclassified, net of tax | $ | (5.4) | | | $ | 5.2 | | | $ | (19.7) | | | |
| | | | | | | |
| Other reclassifications from AOCI to Income: | | | | | | | |
| India cumulative translation adjustment resulting from sale of disposal group | $ | (7.5) | | | $ | — | | | $ | — | | | Special items, net |
| | | | | | | |
| | | | | | | |
| Income tax benefit (expense) | — | | | — | | | — | | | |
| Net income (loss) reclassified, net of tax | $ | (7.5) | | | $ | — | | | $ | — | | | |
| | | | | | | |
| Total income (loss) reclassified, net of tax | $ | (18.4) | | | $ | 5.6 | | | $ | (20.2) | | | |
15.Warrants
In the fourth quarter of 2018, in connection with the formation of our former Truss joint venture, as discussed further in Note 3, "Investments," our joint venture partner, HEXO, issued to our Canadian subsidiary warrants to purchase common shares of HEXO at any time during the three year period following the formation of the joint venture. The warrants to acquire common shares of HEXO expired unexercised on October 4, 2021. All changes in the fair value of the warrants subsequent to issuance and until expiration were recorded in other non-operating income (expense), net on the consolidated statements of operations. Derivative Fair Value Measurements
We utilize market approaches to estimate the fair value of our derivative instruments by discounting anticipated future cash flows derived from the derivative's contractual terms and observable market interest, foreign exchange and commodity rates. The fair values of our derivatives also include credit risk adjustments to account for our counterparties' credit risk, as well as our own non-performance risk, as appropriate.
The table below summarizes our derivative assets and (liabilities) that were measured at fair value as of December 31, 2023 and December 31, 2022. See Note 1, "Basis of Presentation and Summary of Significant Accounting Policies" for further discussion related to measuring the fair value of derivative instruments. Fair value for all derivative contracts as of December 31, 2023 and 2022 were valued using significant other observable inputs, also known as Level 2 inputs. | | | | | | | | | | | |
| As of |
| | December 31, 2023 | | December 31, 2022 |
| | (In millions) |
| Forward starting interest rate swaps | $ | 41.6 | | | 40.0 | |
| Foreign currency forwards | (1.4) | | | 7.6 | |
| Commodity swaps and options | (30.4) | | | 69.0 | |
| Total | $ | 9.8 | | | $ | 116.6 | |
As of December 31, 2023 and December 31, 2022, we had no significant transfers between Level 1 and Level 2. New derivative contracts transacted during 2023 were all included in Level 2.
Results of Period Derivative Activity
The following tables include the year-to-date results of our derivative activity in our consolidated balance sheets as of December 31, 2023 and December 31, 2022, and our consolidated statements of operations for the years ended December 31, 2023, December 31, 2022 and December 31, 2021.
Fair Value of Derivative Instruments in the Consolidated Balance Sheets (in millions) | | | | | | | | | | | | | | | | | | | | | | | | | | | | | |
| | December 31, 2023 |
| | | | Asset derivatives | | Liability derivatives |
| | Notional amount | | Balance sheet location | | Fair value | | Balance sheet location | | Fair value |
| Derivatives designated as hedging instruments: | | | | | | |
| | | | | | | | | |
| Forward starting interest rate swaps | $ | 1,000.0 | | | Other non-current assets | | $ | 41.6 | | | Other liabilities | | $ | — | |
| Foreign currency forwards | $ | 219.4 | | | Other current assets | | 1.1 | | | Accounts payable and other current liabilities | | (1.2) | |
| | | Other non-current assets | | — | | | Other liabilities | | (1.3) | |
| Total derivatives designated as hedging instruments | | | | $ | 42.7 | | | | | $ | (2.5) | |
| Derivatives not designated as hedging instruments: | | | | | | |
Commodity swaps(1) | $ | 653.5 | | | Other current assets | | $ | 11.1 | | | Accounts payable and other current liabilities | | $ | (42.0) | |
| | | Other non-current assets | | 6.6 | | | Other liabilities | | (6.1) | |
Commodity options(1) | $ | 21.7 | | | Other current assets | | 0.2 | | | Accounts payable and other current liabilities | | (0.2) | |
| | | | | | | | | |
| | | | | | | | | |
| Total derivatives not designated as hedging instruments | | $ | 17.9 | | | | | $ | (48.3) | |
| | | | | | | | | | | | | | | | | | | | | | | | | | | | | |
| | December 31, 2022 |
| | | | Asset derivatives | | Liability derivatives |
| | Notional amount | | Balance sheet location | | Fair value | | Balance sheet location | | Fair value |
| Derivatives designated as hedging instruments: | | | | | | |
| | | | | | | | | |
| Forward starting interest rate swaps | $ | 1,000.0 | | | Other non-current assets | | $ | 40.0 | | | Other liabilities | | $ | — | |
| Foreign currency forwards | $ | 176.6 | | | Other current assets | | 6.2 | | | Accounts payable and other current liabilities | | (0.1) | |
| | | Other non-current assets | | 1.6 | | | Other liabilities | | (0.1) | |
| Total derivatives designated as hedging instruments | | | | $ | 47.8 | | | | | $ | (0.2) | |
| Derivatives not designated as hedging instruments: | | | | | | |
Commodity swaps(1) | $ | 525.2 | | | Other current assets | | $ | 86.1 | | | Accounts payable and other current liabilities | | $ | (14.1) | |
| | | Other non-current assets | | 7.4 | | | Other liabilities | | (10.4) | |
Commodity options(1) | $ | 19.7 | | | Other current assets | | 0.8 | | | Accounts payable and other current liabilities | | (0.8) | |
| Total derivatives not designated as hedging instruments | | $ | 94.3 | | | | | $ | (25.3) | |
(1)Notional includes offsetting buy and sell positions, shown in terms of absolute value. Buy and sell positions are shown gross in the asset and/or liability position, as appropriate.
The Pretax Effect of Cash Flow Hedge Accounting on Other Comprehensive Income (Loss), Accumulated Other Comprehensive Income (Loss), and Income (Loss) (in millions): | | | | | | | | | | | | | | | | | | | | |
| Derivatives in cash flow hedge relationships | | Amount of gain
(loss) recognized
in OCI on derivatives | | Location of gain (loss)
reclassified from AOCI into
income | | Amount of gain
(loss) recognized
from AOCI into income on
derivative |
| For the year ended December 31, 2023 | | | | | | |
| Forward starting interest rate swaps | | $ | 1.6 | | | Interest income (expense), net | | $ | (5.2) | |
| Foreign currency forwards | | (5.2) | | | Cost of goods sold | | 4.9 | |
| | | | Other non-operating income (expense), net | | (1.0) | |
| Total | | $ | (3.6) | | | | | $ | (1.3) | |
| For the year ended December 31, 2022 | | | | | | |
| Forward starting interest rate swaps | | $ | 198.9 | | | Interest income (expense), net | | $ | (14.3) | |
| Foreign currency forwards | | 10.8 | | | Cost of goods sold | | 1.8 | |
| | | | Other non-operating income (expense), net | | (0.4) | |
| Total | | $ | 209.7 | | | | | $ | (12.9) | |
| For the year ended December 31, 2021 | | | | | | |
| Forward starting interest rate swaps | | $ | 50.7 | | | Interest income (expense), net | | $ | (4.8) | |
| Foreign currency forwards | | 0.4 | | | Cost of goods sold | | (3.5) | |
| | | | Other non-operating income (expense), net | | 0.8 | |
| Total | | $ | 51.1 | | | | | $ | (7.5) | |
The Pretax Effect of Net Investment Hedge Accounting on Other Comprehensive Income (Loss), Accumulated Other Comprehensive Income (Loss) and Income (Loss) (in millions)
| | | | | | | | | | | | | | | | | | | | |
| Net investment hedge relationships | | Amount of gain
(loss) recognized
in OCI | | Location of gain (loss) recognized in income (amount excluded from effectiveness testing) | | Amount of gain (loss) recognized in income (amount excluded from effectiveness testing)(1) |
| For the year ended December 31, 2023 | | | | | | |
| | | | | | |
| EUR 800 million notes due 2024 | | $ | (26.5) | | | Other non-operating income (expense), net | | $ | — | |
| Total | | $ | (26.5) | | | | | $ | — | |
| For the year ended December 31, 2022 | | | | | | |
| | | | | | |
| EUR 800 million notes due 2024 | | $ | 53.2 | | | Other non-operating income (expense), net | | $ | — | |
| Total | | $ | 53.2 | | | | | $ | — | |
| For the year ended December 31, 2021 | | | | | | |
| Cross currency swaps | | $ | 8.8 | | | Interest income (expense), net | | $ | 6.1 | |
| EUR 800 million notes due 2024 | | 67.7 | | | Other non-operating income (expense), net | | — | |
| Total | | $ | 76.5 | | | | | $ | 6.1 | |
(1)Represents amounts excluded from the assessment of effectiveness for which the difference between changes in fair value and period amortization is recorded in OCI.
The cumulative translation adjustments related to our net investment hedges remain in AOCI until the respective underlying net investment is sold or liquidated. During the years ended December 31, 2023, December 31, 2022 and December 31, 2021, respectively, we did not reclassify any amounts related to net investment hedges from AOCI into earnings.
We expect net losses of approximately $3 million (pretax) recorded in AOCI as of December 31, 2023 will be reclassified into earnings within the next 12 months. For derivatives designated in cash flow hedge relationships, the maximum length of time over which forecasted transactions are hedged as of December 31, 2023 is approximately 3 years, including those related to our forecasted debt issuances in 2026.
The Effect of Derivatives Not Designated as Hedging Instruments on the Consolidated Statements of Operations (in millions):
| | | | | | | | | | | | | | |
| Derivatives not in hedging relationship | | Location of gain (loss) recognized
in income on derivative | | Amount of gain (loss) recognized
in income on derivative |
| For the year ended December 31, 2023 | | | | |
| Commodity swaps | | Cost of goods sold | | $ | (61.7) | |
| | | | |
| Foreign currency swaps | | Other non-operating income (expense), net | | 2.7 | |
| | | | |
| | | | |
| Total | | | | $ | (59.0) | |
| For the year ended December 31, 2022 | | | | |
| Commodity swaps | | Cost of goods sold | | $ | 42.6 | |
| | | | |
| | | | |
| | | | |
| | | | |
| Total | | | | $ | 42.6 | |
| For the year ended December 31, 2021 | | | | |
| Commodity swaps | | Cost of goods sold | | $ | 403.4 | |
| Commodity options | | Cost of goods sold | | 0.1 | |
| | | | |
| Warrants | | Other non-operating income (expense), net | | (0.3) | |
| | | | |
| Total | | | | $ | 403.2 | |
11. Employee Retirement Plans and Postretirement Benefits
We maintain retirement plans for the majority of our employees. Depending on the location and benefit program, we provide either defined benefit pension or defined contribution pension plans to our employees. Each plan is managed locally and in accordance with respective local laws and regulations. We have defined benefit pension plans in the U.S., U.K. and Canada. Additionally, we offer OPEB plans to a portion of our Canadian, U.S. and Central European employees which are unfunded plans. BRI and BDL maintain defined benefit, defined contribution and postretirement benefit plans as well; however, those plans are excluded from this disclosure as BRI and BDL are equity method investments and not consolidated.
The
In the U.S. participates, we participate in and makesmake contributions to multi-employer pension plans. Contributions to multi-employer pension plans were $4.1 million, $3.6 million and $7.1 million $8.2 millionfor the years ended December 31, 2023, 2022 and $7.9 million in 2021, 2020 and 2019, respectively. Additionally, the U.S. postretirement health plan qualifies for the federal subsidy under the Medicare Prescription Drug Improvement and Modernization Act of 2003 (“the Act”) because the prescription drug benefits provided under our postretirement health plan for Medicare eligible retirees generally require lower premiums from covered retirees and have lower co-payments and deductibles than the benefits provided in Medicare Part D and, accordingly, are actuarially equivalent to or better than the benefits provided under the Act. The benefits paid, including prescription drugs, were $33.8$31.2 million, $33.0 million and $37.6$33.8 million infor the years ended December 31, 2023, 2022 and 2021, 2020 and 2019, respectively. There were no subsidies received in 2021for the years ended December 31, 2023, 2022 and immaterial subsidies received in 2020 and 2019.2021.
Defined Benefit and OPEB Plans
Net Periodic Pension and OPEB (Benefit) Cost
| | For the years ended | | | For the years ended |
| | | | | | | | | | | | | | | | | | | | | | | | | | | | | | | | | | | | | | | | | | | | | | | December 31, 2023 | | December 31, 2022 | | December 31, 2021 |
| | For the years ended | | Pension | | OPEB | | Consolidated | | Pension | | OPEB | | Consolidated | | Pension | | OPEB | | Consolidated |
| | | December 31, 2021 | | December 31, 2020 | | December 31, 2019 | | (In millions) |
| | Pension | | OPEB | | Consolidated | | Pension | | OPEB | | Consolidated | | Pension | | OPEB | | Consolidated |
| | (In millions) |
| Service cost: | | | | | | |
| Service cost | Service cost | $ | 2.7 | | | $ | 6.0 | | | $ | 8.7 | | | $ | 2.7 | | | $ | 6.0 | | | $ | 8.7 | | | $ | 4.0 | | | $ | 7.0 | | | $ | 11.0 | |
| Other pension and postretirement (benefit) cost, net: | |
| Service cost | |
| Service cost | |
| Service cost | |
| Other pension and postretirement (benefit) cost, net | |
| Interest cost | |
| Interest cost | |
| Interest cost | Interest cost | 93.9 | | | 14.6 | | | 108.5 | | | 120.5 | | | 18.8 | | | 139.3 | | | 161.9 | | | 25.5 | | | 187.4 | |
| Expected return on plan assets, net of expenses | Expected return on plan assets, net of expenses | (161.6) | | | — | | | (161.6) | | | (161.8) | | | 0.2 | | | (161.6) | | | (217.3) | | | 0.5 | | | (216.8) | |
| Amortization of prior service (benefit) cost | Amortization of prior service (benefit) cost | 0.4 | | | (0.7) | | | (0.3) | | | 0.3 | | | (0.7) | | | (0.4) | | | 1.1 | | | (0.7) | | | 0.4 | |
| Amortization of net actuarial (gain) loss | Amortization of net actuarial (gain) loss | 8.7 | | | (6.7) | | | 2.0 | | | 7.3 | | | (14.5) | | | (7.2) | | | 10.4 | | | (14.1) | | | (3.7) | |
Curtailment, settlement or special termination benefit (gain) loss(1) | Curtailment, settlement or special termination benefit (gain) loss(1) | 5.4 | | | — | | | 5.4 | | | — | | | — | | | — | | | 30.5 | | | — | | | 30.5 | |
| Expected participant contributions | Expected participant contributions | (0.4) | | | — | | | (0.4) | | | (0.4) | | | — | | | (0.4) | | | (0.7) | | | — | | | (0.7) | |
| Total other pension and postretirement (benefit) cost, net | Total other pension and postretirement (benefit) cost, net | (53.6) | | | 7.2 | | | (46.4) | | | (34.1) | | | 3.8 | | | (30.3) | | | (14.1) | | | 11.2 | | | (2.9) | |
| | Net periodic pension and OPEB (benefit) cost | Net periodic pension and OPEB (benefit) cost | $ | (50.9) | | | $ | 13.2 | | | $ | (37.7) | | | $ | (31.4) | | | $ | 9.8 | | | $ | (21.6) | | | $ | (10.1) | | | $ | 18.2 | | | $ | 8.1 | |
| Net periodic pension and OPEB (benefit) cost | |
| Net periodic pension and OPEB (benefit) cost | |
(1)The pension settlement charge recognized for the year ended December 31, 2022 primarily consisted of a settlement loss of $8.0 million that was recorded as a result of the annuity purchase for a certain Canadian pension plan, partially offset by a settlement gain of $5.3 million that was recorded as a result of the annuity purchase for a portion of our U.S. qualified pension plan.
The pension settlement charge recognized for the year ended December 31, 2021 was due to lump sum distributions allowed for under ourthe U.K. pension plan being in excess of interest cost for the year ended December 31, 2021. Lower interest cost for the year ended December 31, 2021 was primarily a result of lower interest rates as of December 31, 2020, which were used to establish the 2021 periodic pension cost, compared to prior years. During the fourth quarter of 2019, we utilized plan assets to purchase buy-out annuity contracts for a portion of our Canadian pension plans and recognized a pension settlement charge of $29.8 million.cost.
Obligations and Changes in Funded Status
| | For the year ended December 31, 2021 | | For the year ended December 31, 2020 |
| Pension | | OPEB | | Total | | Pension | | OPEB | | Total |
| (In millions) |
| Change in benefit obligation: | |
| For the year ended December 31, 2023 | | | For the year ended December 31, 2023 | | For the year ended December 31, 2022 |
| Pension | | | Pension | | OPEB | | Total | | Pension | | OPEB | | Total |
| (In millions) | | | (In millions) |
| Change in benefit obligation | |
| Prior year benefit obligation | |
| Prior year benefit obligation | |
| Prior year benefit obligation | Prior year benefit obligation | $ | 5,571.5 | | | $ | 704.7 | | | $ | 6,276.2 | | | $ | 5,198.6 | | | $ | 672.5 | | | $ | 5,871.1 | |
| Service cost, net of expected employee contributions | Service cost, net of expected employee contributions | 2.3 | | | 6.0 | | | 8.3 | | | 2.3 | | | 6.0 | | | 8.3 | |
| Interest cost | Interest cost | 93.9 | | | 14.6 | | | 108.5 | | | 120.5 | | | 18.8 | | | 139.3 | |
| Actual employee contributions | Actual employee contributions | 0.4 | | | — | | | 0.4 | | | 0.4 | | | — | | | 0.4 | |
| Actuarial (gain) loss | Actuarial (gain) loss | (227.4) | | | (37.3) | | | (264.7) | | | 460.3 | | | 43.7 | | | 504.0 | |
| Plan amendments | Plan amendments | — | | | — | | | — | | | 0.8 | | | — | | | 0.8 | |
| Benefits paid | Benefits paid | (293.1) | | | (40.3) | | | (333.4) | | | (316.6) | | | (39.2) | | | (355.8) | |
| Curtailment, settlement and special termination | Curtailment, settlement and special termination | (35.4) | | | — | | | (35.4) | | | (0.1) | | | — | | | (0.1) | |
| Foreign currency exchange rate change | Foreign currency exchange rate change | (16.4) | | | 1.0 | | | (15.4) | | | 105.3 | | | 2.9 | | | 108.2 | |
| Benefit obligation at end of year | Benefit obligation at end of year | $ | 5,095.8 | | | $ | 648.7 | | | $ | 5,744.5 | | | $ | 5,571.5 | | | $ | 704.7 | | | $ | 6,276.2 | |
| Change in plan assets: | | | | | | | | | | | |
| Change in plan assets | |
| Prior year fair value of assets | |
| Prior year fair value of assets | |
| Prior year fair value of assets | Prior year fair value of assets | $ | 5,958.4 | | | $ | — | | | $ | 5,958.4 | | | $ | 5,542.1 | | | $ | — | | | $ | 5,542.1 | |
| Actual return on plan assets | Actual return on plan assets | 55.5 | | | — | | | 55.5 | | | 614.0 | | | — | | | 614.0 | |
| Employer contributions | Employer contributions | 2.2 | | | 40.3 | | | 42.5 | | | 4.8 | | | 39.7 | | | 44.5 | |
| Actual employee contributions | Actual employee contributions | 0.4 | | | — | | | 0.4 | | | 0.4 | | | — | | | 0.4 | |
| Curtailment, settlement and special termination | Curtailment, settlement and special termination | (35.4) | | | — | | | (35.4) | | | (0.2) | | | — | | | (0.2) | |
| Benefits and plan expenses paid | Benefits and plan expenses paid | (293.1) | | | (40.3) | | | (333.4) | | | (316.6) | | | (39.7) | | | (356.3) | |
| Foreign currency exchange rate change | Foreign currency exchange rate change | (20.5) | | | — | | | (20.5) | | | 113.9 | | | — | | | 113.9 | |
| Fair value of plan assets at end of year | Fair value of plan assets at end of year | $ | 5,667.5 | | | $ | — | | | $ | 5,667.5 | | | $ | 5,958.4 | | | $ | — | | | $ | 5,958.4 | |
| Funded status: | $ | 571.7 | | | $ | (648.7) | | | $ | (77.0) | | | $ | 386.9 | | | $ | (704.7) | | | $ | (317.8) | |
| Amounts recognized in the Consolidated Balance Sheets: | | | | | | | | | | | |
| Funded status | |
| Amounts recognized in the Consolidated Balance Sheets | |
| Other non-current assets | |
| Other non-current assets | |
| Other non-current assets | Other non-current assets | $ | 622.9 | | | $ | — | | | $ | 622.9 | | | $ | 492.8 | | | $ | — | | | $ | 492.8 | |
| Accounts payable and other current liabilities | Accounts payable and other current liabilities | (4.1) | | | (41.4) | | | (45.5) | | | (4.1) | | | (43.3) | | | (47.4) | |
| Pension and postretirement benefits | Pension and postretirement benefits | (47.1) | | | (607.3) | | | (654.4) | | | (101.8) | | | (661.4) | | | (763.2) | |
| Net amounts recognized | Net amounts recognized | $ | 571.7 | | | $ | (648.7) | | | $ | (77.0) | | | $ | 386.9 | | | $ | (704.7) | | | $ | (317.8) | |
The accumulated benefit obligation for our defined benefit pension plans was approximately $5.1 billion and $5.6$3.0 billion as of December 31, 20212023 and December 31, 2020,2022, respectively. The $240.8 million improvement in the net underfunded status of our aggregate pension and OPEB plans from December 31, 2020 to December 31, 2021 was primarily due to the increase in discount rates from prior year and favorable asset returns for certain plans.
As of December 31, 20212023 and December 31, 2020,2022, certain defined benefit pension plans in the U.S., Canada and the U.K. were overfunded as a result of our ongoing de-risking strategy. Information for our defined benefit pension plans that had aggregate accumulated benefit obligations and projected benefit obligations in excess of plan assets iswas as follows:
| | As of |
| December 31, 2021 | | December 31, 2020 |
| (In millions) |
| As of | | | As of |
| December 31, 2023 | | | December 31, 2023 | | December 31, 2022 |
| (In millions) | | | (In millions) |
| Accumulated benefit obligation | Accumulated benefit obligation | $ | 51.2 | | | $ | 831.4 | |
| Projected benefit obligation | Projected benefit obligation | $ | 51.2 | | | $ | 831.6 | |
| Fair value of plan assets | Fair value of plan assets | $ | — | | | $ | 725.7 | |
Information for OPEB plans with an accumulated postretirement benefit obligation in excess of plan assets has been disclosed above in "Obligations and Changes in Funded Status" as all of our OPEB plans are unfunded.
Accumulated Other Comprehensive Income (Loss)
Amounts recognized in AOCI not yet recognized as components of net periodic pension and OPEB cost, pretax, were as follows.
| | | | | | | | | | | | | | | | | | | | | | | | | | | | | | | | | | | |
| As of December 31, 2021 | | As of December 31, 2020 |
| Pension | | OPEB | | Total | | Pension | | OPEB | | Total |
| (In millions) |
| Net actuarial (gain) loss | $ | 553.4 | | | $ | (142.3) | | | $ | 411.1 | | | $ | 684.6 | | | $ | (108.6) | | | $ | 576.0 | |
| Net prior service (benefit) cost | 10.1 | | | (3.2) | | | 6.9 | | | 10.5 | | | (4.0) | | | 6.5 | |
| Total not yet recognized | $ | 563.5 | | | $ | (145.5) | | | $ | 418.0 | | | $ | 695.1 | | | $ | (112.6) | | | $ | 582.5 | |
Changes in plan assets and benefit obligations recognized in OCI, pretax, were as follows:
| | | | | | | | | | | | | | | | | |
| Pension | | OPEB | | Total |
| | (In millions) |
| Accumulated other comprehensive (income) loss as of December 31, 2019 | $ | 692.8 | | | $ | (172.4) | | | $ | 520.4 | |
| Amortization of prior service benefit (costs) | (0.3) | | | 0.7 | | | 0.4 | |
| Amortization of net actuarial gain (loss) | (7.3) | | | 14.5 | | | 7.2 | |
| Net prior service cost | 0.8 | | | — | | | 0.8 | |
| | | | | |
| Current year actuarial (gain) loss | 8.1 | | | 44.0 | | | 52.1 | |
| Foreign currency exchange rate change | 1.0 | | | 0.6 | | | 1.6 | |
| Accumulated other comprehensive (income) loss as of December 31, 2020 | $ | 695.1 | | | $ | (112.6) | | | $ | 582.5 | |
| Amortization of prior service benefit (costs) | (0.4) | | | 0.7 | | | 0.3 | |
| Amortization of net actuarial gain (loss) | (8.7) | | | 6.7 | | | (2.0) | |
| | | | | |
| Curtailment, settlement or special termination benefit (gain) loss | (5.4) | | | — | | | (5.4) | |
| Current year actuarial (gain) loss | (121.4) | | | (37.2) | | | (158.6) | |
| Foreign currency exchange rate change | 4.3 | | | (3.1) | | | 1.2 | |
| Accumulated other comprehensive (income) loss as of December 31, 2021 | $ | 563.5 | | | $ | (145.5) | | | $ | 418.0 | |
| | | | | | | | | | | | | | | | | | | | | | | | | | | | | | | | | | | |
| As of December 31, 2023 | | As of December 31, 2022 |
| Pension | | OPEB | | Total | | Pension | | OPEB | | Total |
| (In millions) |
| Net actuarial (gain) loss | $ | 773.3 | | | $ | (260.4) | | | $ | 512.9 | | | $ | 766.4 | | | $ | (278.2) | | | $ | 488.2 | |
| Net prior service (benefit) cost | 9.4 | | | (1.7) | | | 7.7 | | | 9.7 | | | (0.8) | | | 8.9 | |
| Total not yet recognized | $ | 782.7 | | | $ | (262.1) | | | $ | 520.6 | | | $ | 776.1 | | | $ | (279.0) | | | $ | 497.1 | |
Assumptions
Periodic pension and OPEB cost is actuarially calculated annually for each individual plan based on data available and assumptions made at the beginning of each year. Assumptions used in the calculation include the settlement discount rate selected and disclosed at the end of the previous year as well as other assumptions detailed in the table below. The weighted-average rates used in determining the periodic pension and OPEB cost for the fiscal years 2021, 2020ended December 31, 2023, 2022 and 20192021 were as follows:
| | | | For the years ended | | For the years ended |
| | | December 31, 2021 | | December 31, 2020 | | December 31, 2019 | | December 31, 2023 | | December 31, 2022 | | December 31, 2021 |
| | | Pension | | OPEB | | Pension | | OPEB | | Pension | | OPEB | | Pension | | OPEB | | Pension | | OPEB | | Pension | | OPEB |
| Weighted-average assumptions: | Weighted-average assumptions: | | | | | | | | | | | |
| Settlement discount rate | 1.84% | | 2.10% | | 2.55% | | 2.91% | | 3.44% | | 3.92% |
| Discount rate | |
| Discount rate | |
| Discount rate | | 5.01% | | 4.90% | | 2.27% | | 2.59% | | 1.84% | | 2.10% |
| Rate of compensation increase | Rate of compensation increase | 2.00% | | N/A | | 2.00% | | N/A | | 2.00% | | N/A | Rate of compensation increase | 2.00% | | N/A | | 2.00% | | N/A | | 2.00% | | N/A |
Expected return on plan assets(1) | 3.03% | | N/A | | 3.24% | | N/A | | 4.38% | | N/A |
| Expected return on plan assets | | Expected return on plan assets | 4.91% | | N/A | | 3.11% | | N/A | | 3.03% | | N/A |
| Health care cost trend rate | Health care cost trend rate | N/A | | Ranging ratably from 6.00% in 2021 to 3.57% in 2040 | | N/A | | Ranging ratably from 6.25% in 2020 to 3.57% in 2040 | | N/A | | Ranging ratably from 6.5% in 2019 to 4.5% in 2037 | Health care cost trend rate | N/A | | Ranging ratably from 6.50% in 2023 to 3.57% in 2040 | | N/A | | Ranging ratably from 6.00% in 2022 to 3.57% in 2040 | | N/A | | Ranging ratably from 6.00% in 2021 to 3.57% in 2040 |
(1)We develop our EROA assumptions annually with input from independent investment specialists including our actuaries, investment consultants, plan trustee and other specialists. Each EROA assumption is based on historical data, including historical returns, historical market rates and is calculated for each plan's individual asset class. The calculation includes inputs for interest, inflation, credit, and risk premium (active investment management) rates and fees paid to service providers. We consider our EROA to be a significant management estimate. Any material changes in the inputs to our
methodology used in calculating our EROA could have a significant impact on our reported defined benefit pension plans' expense.
Benefit obligations are actuarially calculated annually at the end of each year based on the assumptions detailed in the table below. Obligations under the OPEB plans are determined by the application of the terms of medical, dental, vision and life insurance plans, together with relevant actuarial assumptions and heathhealth care cost trend rates. The weighted-average rates used in determining the projected benefit obligation for defined pension plans and the accumulated postretirement benefit obligation for OPEB plans, as of December 31, 20212023 and December 31, 2020,2022, were as follows.
| | | | | | | | | | | | | | | | | | | | | | | |
| As of December 31, 2021 | | As of December 31, 2020 |
| Pension | | OPEB | | Pension | | OPEB |
| Weighted-average assumptions: | | | | | | | |
| Settlement discount rate | 2.27% | | 2.59% | | 1.84% | | 2.10% |
| Rate of compensation increase | 2.00% | | N/A | | 2.00% | | N/A |
| Health care cost trend rate | N/A | | Ranging ratably from 6.00% in 2022 to 3.57% in 2040 | | N/A | | Ranging ratably from 6.00% in 2021 to 3.57% in 2040 |
| | | | | | | | | | | | | | | | | | | | | | | |
| As of December 31, 2023 | | As of December 31, 2022 |
| Pension | | OPEB | | Pension | | OPEB |
| Weighted-average assumptions | | | | | | | |
| Discount rate | 4.74% | | 4.64% | | 5.01% | | 4.90% |
| Rate of compensation increase | 2.00% | | N/A | | 2.00% | | N/A |
| Health care cost trend rate | N/A | | Ranging ratably from 6.75% in 2024 to 3.57% in 2040 | | N/A | | Ranging ratably from 6.50% in 2023 to 3.57% in 2040 |
The change to the weighted-average discount rates used for our defined benefit pension plans and postretirement plans as of December 31, 20212023 from December 31, 2020, is2022, was primarily due to increasinga decrease in interest rates in 2021.at the end of 2023 across all plans.
Investment Strategy
The obligations of our defined benefit pension plans in the U.S., Canada and the U.K. are supported by assets held in trusts for the payment of future benefits. The business segments are obligated to adequately fund these asset trusts. The underlying investments within our defined benefit pension plans include: cash and short-term instruments, debt securities, equity securities, investment funds, and other investments including derivatives, hedge fund of funds and real estate. Investment allocations reflect the customized strategies of the respective plans.
The plans use liability driven investment strategies in managing defined pension benefits. For all defined benefit pension plan assets, the plans have the following primary investment objectives:
(1)optimize the long-term return on plan assets at an acceptable level of risk and manage projected future cash contributions;
(2)maintain a broad diversification across asset classes and among investment managers; and
(3)manage the risk level of the plans' assets in relation to the plans' liabilities.
Each plan's respective allocation targets promote optimal expected return and volatility characteristics given a focus on a long-term time horizon for fulfilling the plans' obligations. All assets are managed by external investment managers with a mandatean intent to either match or outperform their benchmark. The plans use different asset managers in the U.S., U.K. and Canada and each plan's respective asset allocation could be impacted by a change in asset managers.
Our investment strategies for our defined benefit pension plans also consider the funded status for each plan. For defined benefit pension plans that are highly funded, assets are invested primarily in fixed income holdings that have a similar duration to the associated liabilities. For plans with lower funding levels, the fixed income component is managed in a similar manner to the highly funded plans. In addition to this liability-matching fixed income allocation, these plans also contain exposure to return generating assets including: equities, real estate, debt and other investments held with the goal of producing higher returns, which may also have a higher risk profile. These investments are diversified by investing globally with limitations placed on issuer concentration.
Both our U.K. and Canadian plans hedge a portion of the foreign exchange exposure between plan assets that are not denominated in the local plan currency and the local currency as the Canadian and U.K. pension liabilities will be settled in CAD and GBP, respectively.
Target Allocations
The following compares target asset allocation percentages with actual asset allocations on a weighted-average asset basis as of December 31, 2021. While the actual allocations show a temporary shift away from fixed income securities due to the rising rate environment, the actual allocations remain within our Company defined tolerance levels.2023.
| | | | Target
allocations | | Actual
allocations | | Target
allocations | | Actual
allocations |
| Equities | Equities | 8.7% | | 12.9% | Equities | 7.2% | | 7.8% |
| Fixed income | Fixed income | 70.0% | | 64.4% | Fixed income | 74.2% | | 72.2% |
| | Real estate | Real estate | 5.9% | | 6.2% |
| Annuities | 12.5% | | 12.5% |
| Real estate | |
| Real estate | | 4.7% | | 4.8% |
| Annuities and longevity swap | | Annuities and longevity swap | 13.4% | | 13.4% |
| Other | Other | 2.9% | | 4.0% | Other | 0.5% | | 1.8% |
Significant Concentration Risks
We periodically evaluate our defined benefit pension plan assets for concentration risks. As of December 31, 2021,2023, we did not have any individual underlying asset position that composed a significant concentration of each plan's overall assets. However, we currently have significant plan assets invested in U.K., U.S. and Canadian government fixed income holdings. A provisional credit rating downgrade for any of these governments could negatively impact the asset values.
Further, as our benefit plans maintain exposure to non-government investments, a significant system-wide increase in credit spreads would also negatively impact the reported plan asset values. In general, equity and fixed income risks have been mitigated by company-specific concentration limits and by utilizing multiple equity managers. We do have significant amounts of assets invested with individual fixed income and hedge fund managers, therefore, the plans use outside investment consultants to aid in the oversight of these managers and fund performance.
Valuation Techniques
We use a variety of industry accepted valuation techniques to value our plan assets. The techniques vary depending upon instrument type. Whenever possible, we prioritize the use of observable market data in our valuation processes. We use market, income and cost approaches to value our plan assets as of period end. See Note 1, "Basis of Presentation and Summary of Significant Accounting Policies" for additional information on our fair value methodologies and accounting policies. We have not changed our fair value techniques used to value plan assets this year. Major Categories of Plan Assets
As of December 31, 2021,2023, our major categories of plan assets included the following:
•Cash and short-term instruments—Includes cash, trades awaiting settlement, bank deposits, short-term bills and short-term notes. Our "trades awaiting settlement" category includes payables and receivables associated with asset purchases and sales that are awaiting final cash settlement as of year-endyear end due to the use of trade date accounting for our pension plans assets. These payables normally settle within a few business days of the purchase or sale of the respective asset. The respective assets are included in or removed from our year-end plan assets and categorized in their respective asset categories in the fair value hierarchy below. We include these items in Level 1 of this hierarchy, as the values are derived from quoted prices in active markets. Short-term instruments are included in Level 2 of the fair value hierarchy as these are highly liquid instruments that are valued using observable inputs, but their asset values are not publicly quoted.
•Debt securities—Includes various government and corporate fixed income securities, interest and inflation-linked assets such as bonds and swaps, collateralized securities and other debt securities. The majority of the plans' fixed income assets trade on "over the counter" exchanges, which provides observable inputs that are the primary data used to determine each individual investment's fair value. We also use independent pricing vendors, as well as matrix pricing techniques. Matrix pricing uses observable data from other similar investments as the primary input to determine the individual security's fair value. Government and corporate fixed income securities are generally classified as Level 2 in the fair value hierarchy as they are valued using observable inputs. Assets included in our collateralized securities include mortgage backed securities and collateralized mortgage obligations, which are considered Level 3 due to the use of the significant unobservable inputs in deriving these assets' fair values.
•Equities—Annuities and longevity swap—Includes publicly traded commonassets to mitigate risks of certain plans including buy-in annuities and other equity-like holdings, primarily publicly traded common stock and real estate investment trusts. Equity assets are well diversified between international and domestic investments. We consider equities quoted on public exchanges as Level 1 while other assets that are not quoted on public exchanges but valued using significant observable inputs as Level 2 depending on the individual asset's characteristics.
•NAV per share practical expedient—Includes our debt funds, equity funds, hedge fund of funds, infrastructure funds, real estate fund holdings and private equity funds. The market values for these funds are based on the net asset values multiplied by the number of shares owned.
•Annuities—Includes non-participatinglongevity swap insurance contracts. Non-participating annuity buy-in insurance policies are purchased to covermitigate volatility in cash flows associated with a portion of thecovered plan members. The fair value of non-participating contracts fluctuatesfluctuate based on changes in the obligation associated with covered plan members. The longevity swap insurance contract alleviates risk from fluctuations in estimated life expectancy of covered participants. The fair value of the longevity swap insurance contract is calculated by taking the present value of the expected cash flows from the floating leg on a prevailing market best estimate of mortality, including market views of fees, less the present value of the fixed leg payments that the plan is required to make under the contract including the contractual fees. The prevailing market best estimate of mortality is determined based on the effect of actual plan mortality experience of covered participants, a revised view on future improvements in mortality rates and a view on how risk fees have changed for this type of contract since inception. These values are considered Level 3 due to the use of the significant unobservable inputs used in deriving these assets'the asset's fair values.value.
•Other—Includes derivatives, repurchase agreements, recoverable taxes for taxes paid and awaiting reclaim due to the tax exempt nature of the pension plan venture capital, and private equity. Derivatives are priced using observable inputs including yields, interest rate curves and spreads. Exchange traded derivatives are typically priced using the last trade price. Repurchase agreements are agreements where our plan has created an asset exposure using borrowed assets, creating a repurchase agreement liability, to facilitate the trade. The assets associated with the repurchase agreement and equity options are included in the other category in the fair value hierarchy, and the corresponding repurchase agreement liability is classified as Level 1 in the hierarchy, as the liability is valued using quoted prices in active markets. When determining the presentation of our target and asset allocations for repurchase agreements, we are viewing the asset type, as opposed to the investment vehicle, and accordingly include the associated assets within fixed income, specifically interest and inflation linked assets. We include recoverable tax items in Level 1 of this hierarchy, as these are cash receivables and the values are derived from quoted prices in active markets. Private equity is included in Level 3 as the values are based upon the use of unobservable inputs.
•NAV per share practical expedient—Includes our debt funds, equity funds, hedge funds, real estate fund holdings and private equity funds. The market values for these funds are based on the net asset values multiplied by the number of shares owned.
Fair Value Hierarchy
The following presents our fair value hierarchy for our defined benefit pension plan assets excluding investments using the NAV per share practical expedient (in millions):
| | | | | | Fair value measurements as of December 31, 2021 | | | | Fair value measurements as of December 31, 2023 |
| | | Total as of
December 31, 2021 | | Quoted prices
in active
markets
(Level 1) | | Significant
observable
inputs
(Level 2) | | Significant
unobservable
inputs
(Level 3) | | Total as of December 31, 2023 | | Quoted prices
in active
markets
(Level 1) | | Significant
observable
inputs
(Level 2) | | Significant
unobservable
inputs
(Level 3) |
| Cash and cash equivalents | Cash and cash equivalents | | | | | | | | Cash and cash equivalents | | | |
| Cash | Cash | $ | 198.4 | | | $ | 198.4 | | | $ | — | | | $ | — | |
| Trades awaiting settlement | Trades awaiting settlement | 2.1 | | | 2.1 | | | — | | | — | |
| Bank deposits, short-term bills and notes | Bank deposits, short-term bills and notes | 25.5 | | | — | | | 25.5 | | | — | |
| Debt | Debt | |
| Government debt securities | Government debt securities | 751.0 | | | — | | | 751.0 | | | — | |
| Government debt securities | |
| Government debt securities | |
| Corporate debt securities | Corporate debt securities | 142.0 | | | — | | | 142.0 | | | — | |
| Interest and inflation linked assets | Interest and inflation linked assets | 1,029.7 | | | — | | | 1,013.8 | | | 15.9 | |
| Collateralized debt securities | |
| | Annuities and longevity swap | |
| | Annuities | |
| Buy-in annuities | 708.9 | | | — | | | — | | | 708.9 | |
| | Annuities and longevity swap | |
| | Annuities and longevity swap | |
| Buy-in annuities and longevity swap | |
| Buy-in annuities and longevity swap | |
| Buy-in annuities and longevity swap | |
| Other | Other | |
| | Repurchase agreements | |
| | Repurchase agreements | |
| | Repurchase agreements | Repurchase agreements | (477.4) | | | (477.4) | | | — | | | — | |
| Recoverable taxes | Recoverable taxes | 0.2 | | | 0.2 | | | — | | | — | |
| | Private equity | Private equity | 29.7 | | | — | | | — | | | 29.7 | |
| Private equity | |
| Private equity | |
| Total fair value of investments excluding NAV per share practical expedient | Total fair value of investments excluding NAV per share practical expedient | $ | 2,410.1 | | | $ | (276.7) | | | $ | 1,932.3 | | | $ | 754.5 | |
The following presents our total fair value of plan assets including the NAV per share practical expedient for our defined benefit pension plan assets:
| | | | | |
| Total as of
December 31, 20212023 |
| (In millions) |
| Fair value of investments excluding NAV per share practical expedient | $ | 2,410.11,442.5 | |
| Fair value of investments using NAV per share practical expedient | |
| Debt funds | 2,034.21,263.9 | |
| Equity funds | 732.1260.7 | |
| Real estate funds | 285.0126.3 | |
| |
| Private equity funds | 65.837.8 | |
| Hedge funds | 140.3265.7 | |
| Total fair value of plan assets | $ | 5,667.53,396.9 | |
The following presents our fair value hierarchy for our defined benefit pension plan assets excluding investments using the NAV per share practical expedient (in millions):
| | | | | | Fair value measurements as of December 31, 2020 | | | | Fair value measurements as of December 31, 2022 |
| | | Total as of
December 31, 2020 | | Quoted prices
in active
markets
(Level 1) | | Significant
observable
inputs
(Level 2) | | Significant
unobservable
inputs
(Level 3) | | Total as of December 31, 2022 | | Quoted prices
in active
markets
(Level 1) | | Significant
observable
inputs
(Level 2) | | Significant
unobservable
inputs
(Level 3) |
| Cash and cash equivalents | Cash and cash equivalents | | | | | | | | Cash and cash equivalents | | | |
| Cash | Cash | $ | 144.6 | | | $ | 144.6 | | | $ | — | | | $ | — | |
| Trades awaiting settlement | Trades awaiting settlement | 16.7 | | | 16.7 | | | — | | | — | |
| Bank deposits, short-term bills and notes | Bank deposits, short-term bills and notes | 25.0 | | | — | | | 25.0 | | | — | |
| Debt | Debt | |
| Government securities | 869.6 | | | — | | | 869.6 | | | — | |
| Government debt securities | |
| Government debt securities | |
| Government debt securities | |
| Corporate debt securities | Corporate debt securities | 112.7 | | | — | | | 112.7 | | | — | |
| Interest and inflation linked assets | Interest and inflation linked assets | 1,059.6 | | | — | | | 1,048.6 | | | 11.0 | |
| Collateralized debt securities | |
| Annuities and longevity swap | |
| Buy-in annuities and longevity swap | |
| Buy-in annuities and longevity swap | |
| Buy-in annuities and longevity swap | |
| Other | |
| | Annuities | |
| Buy-in annuities | 783.9 | | | — | | | — | | | 783.9 | |
| Other | |
| Repurchase agreements | |
| | Repurchase agreements | |
| | Repurchase agreements | Repurchase agreements | (483.5) | | | (483.5) | | | — | | | — | |
| Recoverable taxes | Recoverable taxes | 0.2 | | | 0.2 | | | — | | | — | |
| Private equity | Private equity | 61.4 | | | — | | | — | | | 61.4 | |
| | Total fair value of investments excluding NAV per share practical expedient | Total fair value of investments excluding NAV per share practical expedient | $ | 2,590.2 | | | $ | (322.0) | | | $ | 2,055.9 | | | $ | 856.3 | |
| Total fair value of investments excluding NAV per share practical expedient | |
| Total fair value of investments excluding NAV per share practical expedient | |
The following presents our fair value hierarchy including the NAV per share practical expedient for our defined benefit pension plan assets:
| | | | | |
| Total as of
December 31, 20202022 |
| (In millions) |
| Fair value of investments excluding NAV per share practical expedient | $ | 2,590.21,264.6 | |
| Fair value of investments using NAV per share practical expedient | |
| Debt funds | 1,591.41,355.7 | |
| Equity funds | 1,418.6417.4 | |
| Real estate funds | 274.4130.9 | |
| Private equity funds | 77.144.7 | |
| Hedge funds | 6.7123.5 | |
| Total fair value of plan assets | $ | 5,958.43,336.8 | |
Fair Value: Level Three Rollforward
The following presents our Level 3 Rollforward for our defined pension plan assets excluding investments using the NAV per share practical expedient:
| | | | | |
| Amount |
| (In millions) |
Balance as of December 31, 2019 | $ | 830.2 | |
Total gain or loss (realized/unrealized): | |
Realized gain (loss) | 2.1 | |
Unrealized gain (loss) included in AOCI | 11.0 | |
Purchases, issuances, settlements | (12.7) | |
Foreign exchange translation (loss)/gain | 25.7 | |
Balance as of December 31, 2020 | $ | 856.3 | |
Total gain or loss (realized/unrealized): | |
Realized gain (loss) | 0.9 | |
Unrealized gain (loss) included in AOCI | (63.3) | |
Purchases, issuances, settlements | (32.8) | |
| |
Foreign exchange translation (loss)/gain | (6.6) | |
| Balance as of December 31, 2021 | $ | 754.5 | |
| Total gain or loss (realized/unrealized) | |
| Realized gain (loss) | (1.9) | |
| Unrealized gain (loss) included in AOCI | (183.5) | |
| Purchases, issuances, settlements | (6.6) | |
| Foreign exchange translation (loss) gain | (75.5) | |
| Balance as of December 31, 2022 | $ | 487.0 | |
| Total gain or loss (realized/unrealized) | |
| Realized gain (loss) | — | |
| Unrealized gain (loss) included in AOCI | (34.2) | |
| Purchases, issuances, settlements | (2.7) | |
| |
| Foreign exchange translation (loss) gain | 24.5 | |
| Balance as of December 31, 2023 | $ | 474.6 | |
Expected Cash Flows
Defined benefit pension plan contributions in future years will vary based on a number of factors, including actual plan asset returns and interest rates. We fund pension plans to meet the requirements set forth in applicable employee benefits laws. We took and continue to take steps to reduce our exposure to our pension obligations. Such steps include the closure of the U.K. and U.S. pension plans to future earnings of service credit, benefit modifications in certain Canada plans and the entering into of buy-in and buy-out contracts for certain plans. We may also voluntarily increase funding levels to meet financial goals. Our U.K. pension plan is subject to a statutory valuation for funding purposes every three years. The most recent valuation as of June 30, 20192022 indicated that the plan does not have a funding deficit relative to the plan's statutory funding objective, and therefore, no MCBC contributions are currently required.
In 2022,For the year ended December 31, 2024, we expect to make contributions to our defined benefit pension plans of approximately $4 million and benefit payments under our OPEB plans of approximately $41$39 million based on foreign exchange rates as of December 31, 2021.2023. Additionally, we anticipate utilizing approximately $5$6 million of surplus from certain Canadian defined benefit pension plans to fund employer contributions to certain Canadian defined contribution plans. BRI and BDL contributions to their respective defined benefit pension plans are excluded here, as they are not consolidated in our financial statements. Plan funding strategies are influenced by employee benefits, tax laws and plan governance documents.
Expected future benefit payments for defined benefit pension and OPEB plans for the next ten years, based on foreign exchange rates as of December 31, 2021,2023, are as follows:
| | Expected benefit payments | Expected benefit payments | | Pension | | OPEB | Expected benefit payments | | Pension | | OPEB |
| | | | (In millions) | | | (In millions) |
| 2022 | | $ | 318.8 | | | $ | 41.4 | |
| 2023 | | $ | 312.3 | | | $ | 41.1 | |
| 2024 | 2024 | | $ | 312.6 | | | $ | 41.3 | |
| 2025 | 2025 | | $ | 313.2 | | | $ | 40.8 | |
| 2026 | 2026 | | $ | 313.5 | | | $ | 40.6 | |
| 2027-2031 | | $ | 1,567.9 | | | $ | 198.1 | |
| 2027 | |
| 2028 | |
| 2029-2033 | |
Defined Contribution Plans
We offer defined contribution pension plans for the majority of our U.S., Canadian and U.K. employees. The investment strategy for defined contribution plans are determined by each individual participant from the options we have made available as the plan sponsor. U.S. non-union employees are eligible to participate in qualified defined contribution plans which provide
for employer contributions ranging from 5% to 11% of eligible compensation (certain employees were also eligible for additional employer contributions). In addition, U.S. union employees are eligible to participate in a qualified defined contribution plan which provides for employer contributions based on factors associated with various collective bargaining agreements. The employer contributions to the U.K. plans can range up to 8%10% of employee compensation and in Canada plans range from 4% to 10%. Both employee and employer contributions are made in cash in accordance with participant investment elections.
We recognized costs associated with defined contribution plans of $76.8 million, $73.0 million and $77.8 million $75.5 millionfor the years ended December 31, 2023, 2022 and $80.0 million in 2021, 2020 and 2019, respectively.
In addition, we have other deferred compensation and nonqualified defined contribution plans. We have voluntarily funded these liabilities through rabbi trusts. These assets are invested in publicly traded mutual funds whose performance is expected to closely match changes in the plan liabilities. As of December 31, 2021,2023, and December 31, 2020,2022, the plan liabilities were equal to the plan assets and were included in other liabilities and other assets on our consolidated balance sheets, respectively.
12. Income Tax
Our income (loss) before income taxes on which the provision for income taxes was computed was as follows:
| | | | | | | | | | | | | | | | | |
| | For the years ended |
| | December 31, 2023 | | December 31, 2022 | | December 31, 2021 |
| | (In millions) |
| Domestic | $ | 1,486.0 | | | $ | 228.4 | | | $ | 1,307.5 | |
| Foreign | (233.5) | | | (290.9) | | | (68.5) | |
| Total | $ | 1,252.5 | | | $ | (62.5) | | | $ | 1,239.0 | |
The components of the provision for income taxes were as follows: | | | | | | | | | | | | | | | | | |
| | For the years ended |
| | December 31, 2023 | | December 31, 2022 | | December 31, 2021 |
| | (In millions) |
| Current | | | | | |
| Federal | $ | 200.7 | | | $ | 146.1 | | | $ | 43.5 | |
| State | 22.1 | | | 22.3 | | | 7.1 | |
| Foreign | 37.3 | | | (17.2) | | | (1.0) | |
| Total current tax (benefit) expense | $ | 260.1 | | | $ | 151.2 | | | $ | 49.6 | |
| Deferred | | | | | |
| Federal | $ | 75.0 | | | $ | 56.4 | | | $ | 163.5 | |
| State | 27.8 | | | (26.2) | | | 70.4 | |
| Foreign | (66.8) | | | (57.4) | | | (53.0) | |
| Total deferred tax (benefit) expense | $ | 36.0 | | | $ | (27.2) | | | $ | 180.9 | |
| Total income tax (benefit) expense | $ | 296.1 | | | $ | 124.0 | | | $ | 230.5 | |
16. Derivative InstrumentsA reconciliation from the U.S. statutory federal income tax rate to the effective income tax rate was as follows: | | | | | | | | | | | | | | | | | | | | | | | | | | | | | | | | | | | |
| | For the years ended |
| | December 31, 2023 | | December 31, 2022 | | December 31, 2021 |
| ($ in millions) |
| Statutory federal income tax rate | 21.0 | % | | $ | 263.0 | | | 21.0 | % | | $ | (13.1) | | | 21.0 | % | | $ | 260.2 | |
| State income taxes, net of federal benefits | 2.4 | % | | 30.6 | | | 6.1 | % | | (3.8) | | | 4.7 | % | | 57.8 | |
| Effect of foreign tax rates | (2.4) | % | | (30.5) | | | 92.6 | % | | (57.9) | | | (5.5) | % | | (68.3) | |
| Effect of foreign tax law and rate changes | 0.9 | % | | 11.5 | | | (0.8) | % | | 0.5 | | | 1.6 | % | | 19.6 | |
| Effect of unrecognized tax benefits | 0.8 | % | | 9.5 | | | (20.5) | % | | 12.8 | | | (6.2) | % | | (76.3) | |
| Change in valuation allowance | 0.2 | % | | 2.5 | | | 1.1 | % | | (0.7) | | | (0.1) | % | | (1.1) | |
| Goodwill impairment | — | | | — | | | (287.0) | % | | 179.3 | | | (0.2) | % | | (2.9) | |
| Other, net | 0.7 | % | | 9.5 | | | (10.9) | % | | 6.9 | | | 3.3 | % | | 41.5 | |
| Effective tax rate / Tax (benefit) expense | 23.6 | % | | $ | 296.1 | | | (198.4) | % | | $ | 124.0 | | | 18.6 | % | | $ | 230.5 | |
The increase in the effective tax rate for the year ended December 31, 2023 when compared to the federal statutory rate was not significant and Hedging Activitieswas due to the impacts of state income taxes, foreign tax rates and the impact of a foreign statutory tax rate change enacted in the fourth quarter of 2023.
Overview and Risk Management Policies
We use derivatives as partThe decrease in the effective tax rate for the year ended December 31, 2022 when compared to the federal statutory rate was primarily due to the impact of the $845 million partial goodwill impairment, recorded within our normal business operations to manage our exposure to fluctuationsAmericas segment in interest rates, foreign currency, commodity price risk and for other strategic purposesthe fourth quarter of 2022, which related to our core business. We have established policies and procedures that governgoodwill not deductible for tax purposes.
The decrease to the risk managementeffective tax rate for the year ended December 31, 2021 when compared to the federal statutory rate was primarily due to the release of these exposures. Our primary objective$73 million of reserves for unrecognized tax benefit positions recognized in managing these exposures is to decrease the volatilitythird quarter of cash flows affected by2021. The reserve release included amounts for an income tax audit settlement, net of changes in the underlying rates and prices.
To achieve our objectives, we enter into a variety of financial derivatives, including foreign currency exchange, commodity, interest rate, cross currency swapsestimates associated with prior period uncertain tax positions, as well as options. We also enter into physical hedging agreements directly withamounts for the expiration of statutes of limitations. Additionally, during the second quarter of 2021, the U.K. government enacted, and royal assent was received for, legislation to increase the corporate income tax rate from 19% to 25%. Remeasurement of our suppliers to manage our exposure to certain commodities.
Counterparty Risk
While, by policy,deferred tax liabilities under the counterparties to any of the financial derivatives we enter into are major institutions with investment grade credit ratings of at least A- by Standard & Poor's (or the equivalent) or A3 by Moody's, we are exposed to credit-related losseshigher income tax rate resulted in the eventrecognition of non-performance by counterparties. This credit risk is generally limited to the unrealized gains in such contracts, should anyadditional discrete tax expense of these counterparties fail to perform as contracted.
We have established a counterparty credit policy and guidelines that are monitored and reported to management according to prescribed guidelines to assist in managing this risk. As an additional measure, we utilize a portfolio of institutions either headquartered or operatingapproximately $18 million in the same countries that we conduct our business. In calculatingsecond quarter of 2021.
On August 16, 2022, the fair valueInflation Reduction Act of our derivative balances, we also record an adjustment to recognize2022 ("IRA") was signed into U.S. law. The IRA includes a new corporate alternative minimum tax of 15% on the riskadjusted financial statement income ("AFSI") of counterparty credit and our own non-performance risk, as appropriate.
Price and Liquidity Risks
We base the fair value of our derivative instruments upon market rates and prices.corporations with average AFSI exceeding $1.0 billion over a three-year period, effective for tax years beginning after December 31, 2022. The volatility of these rates and prices are dependent on many factors that cannot be forecasted with reliable accuracy. The current fair values of our contracts could differ significantly from the cash settled values with our counterparties. As such, we are exposed to price risk related to unfavorable changes in the fair value of our derivative contracts.
We may be forced to cash settle all or a portion of our derivative contracts before the expected settlement date upon the occurrence of certain contractual triggers including a change of control, termination event or other breach of agreement. This could have a negative impact on our liquidity. For derivative contracts that we have designated as hedging instruments, early cash settlement would result in the timing of our hedge settlementalternative minimum tax did not being matched to the cash settlement of the forecasted transaction or firm commitment. We may also decide to cash settle all or a portion of our derivative contracts before the expected settlement date through negotiations with our counterparties, which could also impact our financial or cash position.
Due totax position in 2023. Additionally, the natureIRA imposes an excise tax of our counterparty agreements, we are not able to net positions with the same counterparty across business units. Thus,1% on stock repurchases, effective January 1, 2023. The excise tax is recorded as an incremental cost in the event of default, we may be required to early settle all out-of-the-money contracts, without the benefit of netting the fair value of any in-the-money positions against this exposure.
Collateral
We do not receive and are not required to post collateral unless a change of control event occurs. This termination event would give either party the right to early terminate all outstanding swap transactions in the event that the other party consolidates, merges with, or transfers all or substantially all of its assets to, another entity, and the creditworthiness of the surviving entity that has assumed such party's obligations is materially weaker than that of such party. As of December 31, 2021, we did not have any collateral posted with any of our counterparties.
Derivative Accounting Policies
Overview
Our foreign currency forwards and our forward starting interest rate swaps are designated in hedging relationships as cash flow hedges. Prior to settlements discussed below, our interest rate swaps were designated as fair value hedges and our cross currency swaps were designated as net investment hedges. In certain situations, we may execute derivatives that do not qualify for, or we do not otherwise seek, hedge accounting but are determined to be important for managing risk. For example, our commodity swaps and commodity options are not designated in hedge accounting relationships. These outstanding economic hedges are measured at fair valuetreasury stock on our consolidated balance sheets and was immaterial for the year ended December 31, 2023.
Additionally, our foreign businesses operate in jurisdictions with changesstatutory income tax rates that differ from the U.S. Federal statutory rate. Specifically, the statutory income tax rates in fair value recordedthe countries in earnings. We have historically electedEurope in which we operate range from 9% to apply the NPNS exemption to certain contracts, as applicable. These contracts are typically transacted with our suppliers25.8%, and include risk management features that allow us to fix the price on specific volumesCanada has a combined federal and provincial statutory income tax rate of purchases forapproximately 26%.
specified delivery periods. | | | | | | | | | | | |
| | As of |
| | December 31, 2023 | | December 31, 2022 |
| | (In millions) |
| Deferred tax assets | | | |
| Compensation-related obligations | $ | 43.2 | | | $ | 44.7 | |
| Pension and postretirement benefits | 23.7 | | | 33.7 | |
| | | |
| | | |
| | | |
| Tax credit carryforwards | 36.0 | | | 39.0 | |
| Tax loss carryforwards | 312.8 | | | 291.1 | |
| | | |
| | | |
| Accrued liabilities and other | 202.5 | | | 149.0 | |
| | | |
| Valuation allowance | (61.9) | | | (57.2) | |
| Deferred tax assets | $ | 556.3 | | | $ | 500.3 | |
| Deferred tax liabilities | | | |
| Fixed assets | 354.9 | | | 358.9 | |
| Partnerships and investments | 38.7 | | | 33.2 | |
| | | |
| Intangible assets | 2,679.9 | | | 2,563.2 | |
| Derivative instruments | 12.2 | | | 31.5 | |
| Deferred tax liabilities | $ | 3,085.7 | | | $ | 2,986.8 | |
| | | |
| Net deferred tax liabilities | $ | 2,529.4 | | | $ | 2,486.5 | |
Our deferred tax valuation allowances are primarily the result of uncertainties regarding the future realization of recorded tax benefits on tax loss carryforwards from operations in various jurisdictions. The measurement of deferred tax assets is reduced by a valuation allowance if, based upon available evidence, it is more likely than not that the deferred tax assets will not be realized. We also consider whether any provisionshave evaluated the realizability of our deferred tax assets in our contracts represent embedded derivative instruments as definedeach jurisdiction by assessing the adequacy of expected taxable income, including the reversal of existing temporary differences, historical and projected operating results and the availability of prudent and feasible tax planning strategies. Based on this analysis, we have determined that the valuation allowances recorded in authoritative accounting guidanceeach period presented are appropriate.
As of December 31, 2023, we have deferred tax assets for U.S. tax loss and apply the appropriate accounting.
Hedge Accounting Policies
We formally document all relationships receiving hedge accounting treatmentcredit carryforwards that expire between hedging instruments2024 and hedged items, as well as the risk-management objective2043 of $69.5 million and strategy for undertaking hedge transactions pursuant to prescribed guidance. We also formally assess effectiveness both at the hedge's inception and on an ongoing basis, specifically whether the derivativesU.S. tax losses that are used in hedging transactions have been highly effective in mitigating the risk designated as being hedged and whether those hedges may be expected to remain highly effective in future periods. Specific tocarried forward indefinitely of $10.0 million. We have foreign tax loss and credit carryforwards that expire between 2024 and 2042 of $219.1 million and foreign tax losses that may be carried forward indefinitely of $43.0 million.
The following table presents our net investment hedges, we have elected to use the spot-to-spot methodology to assess effectiveness.deferred tax liabilities as of December 31, 2023 and December 31, 2022.
We discontinue hedge accounting prospectively when (1) the derivative is no longer highly effective in offsetting changes in the cash flows of a forecasted future transaction; (2) the derivative expires or is sold, terminated, or exercised; (3) it is no longer probable that the forecasted transaction will occur; (4) management determines that designating the derivative as a hedging instrument is no longer appropriate; or (5) management decides to cease hedge accounting. | | | | | | | | | | | |
| | As of |
| | December 31, 2023 | | December 31, 2022 |
| | (In millions) |
| Domestic deferred tax liabilities | $ | 2,029.7 | | | $ | 1,927.7 | |
| Foreign deferred tax assets | 123.7 | | | 125.8 | |
| Foreign deferred tax liabilities | 623.4 | | | 684.6 | |
| Net deferred tax liabilities | $ | 2,529.4 | | | $ | 2,486.5 | |
When we discontinue hedge accounting prospectively, but it continues to be probable that the forecasted transaction will occur in the originally expected period, the existing gain or loss on the derivative remains in AOCI for cash flow hedges and net investment hedges or in the carrying value of the hedged item for fair value hedges and is reclassified into earnings when the forecasted transaction affects earnings. However, if it is probable that a forecasted transaction will no longer occur by the end of the originally specified time period orThe total foreign deferred tax assets above are presented within an additional two-month period of time thereafter, the gains and losses in AOCI are recognized immediately in earnings. In all situations in which hedge accounting is discontinued and the derivative remains outstanding, we carry the derivative at its fair valueother assets on the consolidated balance sheets until maturity, recognizing future changes inand domestic and foreign deferred tax liabilities above are presented within deferred tax liabilities on the fair value in current period earnings.consolidated balance sheets. The deferred tax liability amounts as of December 31, 2023 and December 31, 2022 excluded $44.1 million and $34.0 million, respectively, of unrecognized tax benefits that have been recorded as a reduction of deferred tax assets, which was presented within deferred tax liabilities due to jurisdictional netting on the consolidated balance sheets.
Significant Derivative/Hedge Positions
Interest Rate Swaps
In prior years, we entered into interest rate swap agreements to economically convert our fixed rate $500 million 3.5% notes due in 2022 to floating rate debt. These interest rate swap agreements, which were designated as fair value hedges, were previously voluntarily cash settled, at which time we ceased adjusting the carrying valueA reconciliation of the notes for the fair value movements. The cumulative adjustments on the $500 million 3.5% notes increased the carrying value beginning and ending amounts of the notesunrecognized tax benefits, excluding interest and are being amortizedpenalties, was as a benefit to interest expense over the expected remaining term of the notes.
Net Investment Hedges
Foreign Denominated Debt
On July 7, 2016, we issued EUR 800 million senior notes maturing July 15, 2024 to partially fund the Acquisition. Separately, on March 15, 2017, we issued an aggregate of EUR 500 million, 0.35% plus three-month EURIBOR floating rate senior notes due March 15, 2019. Concurrent with the issuances of both sets of Notes, we simultaneously designated the principals as net investment hedges of our investment in our Europe business in order to hedge a portion of the foreign currency translational impacts and, accordingly, record the changes in the carrying value of the 2016 EUR Notes and 2017 EUR Notes due to fluctuations in the spot rate to AOCI. In March 2019, we repaid the 2017 EUR Notes. See Note 11, "Debt" for further discussion.follows:Cross Currency Swaps | | | | | | | | | | | | | | | | | |
| | For the years ended |
| | December 31, 2023 | | December 31, 2022 | | December 31, 2021 |
| | (In millions) |
| Balance at beginning of year | $ | 39.3 | | | $ | 28.0 | | | $ | 235.7 | |
| Additions for tax positions related to the current year | 12.9 | | | 15.9 | | | 28.6 | |
| Additions for tax positions of prior years | 0.8 | | | 1.9 | | | — | |
| Reductions for tax positions related to the current year | (2.0) | | | — | | | (24.1) | |
| Reductions for tax positions of prior years | (1.7) | | | — | | | (48.9) | |
| Settlements | — | | | (3.7) | | | (161.8) | |
| Release due to statute expirations | (0.7) | | | (1.3) | | | (3.4) | |
| Foreign currency adjustment | 0.3 | | | (1.5) | | | 1.9 | |
| Balance at end of year | $ | 48.9 | | | $ | 39.3 | | | $ | 28.0 | |
Effective March 20, 2019,Our remaining unrecognized tax benefits as of December 31, 2023, related to tax years that were open to examination. As of December 31, 2023 and December 31, 2022, we entered into cross currency swap agreements having a total notional value of approximately EUR 353 million ($400 million upon execution) in order to hedge a portion of the foreign currency translational impacts of our European investment. As a result of the swaps, we economically converted a portion of our $1.0 billion 2.1% senior notes due 2021 and associated interest to EUR denominated, which results in a EUR interest rate to be received at 0.71%. Upon repayment of the $1.0 billion 2.1% senior notes at maturity in July 2021, we settled the associated cross currency swap resulting in a net cash payment of $12.7 million, consisting of the final loss on the cross currency swap of $17.6 million partially offset by the final interest received. The settlement of these cross currency swaps were classified as investing activitieshad remaining unrecognized tax benefits recorded within other liabilities in our consolidated statementbalance sheets of cash flows.
Separately, effective April 3, 2019, we voluntarily early terminated our $500$5.0 million cross currency swaps due in 2020 under which we were receiving EUR interest payments at a rate received of 0.85%, and concurrently entered into new cross currency swap agreements having a total notional of approximately EUR 445$5.4 million, ($500 million upon execution) in order to hedge a portion of the foreign currency translation impactsrespectively. The remaining balance of our European investment. As a result of the swaps, we economically converted our $500 million 2.25% senior notes due 2020 and associated interest to EUR denominated, which
resulted in a EUR interest rate to be received of 0.68%. The termination of the original $500 million cross currency swaps resulted in cash receipts of approximately $47 million during the second quarter of 2019. Upon repayment of the $500 million 2.25% senior notes at maturity in March 2020, we settled the associated cross currency swaps resulting in cash receipts of $3.2 million. The settlement of these cross currency swaps were classified as investing activitiesunrecognized tax benefits was recorded within deferred tax liabilities in our consolidated statementbalance sheets. Annual tax provisions included amounts considered sufficient to pay assessments that may result from examination of cash flows.prior year tax returns; however, the amount ultimately paid upon resolution of issues may differ materially from the amount accrued.
We had designated eachrecognized interest and penalties related to unrecognized tax benefits as part of these cross currency swapsincome taxes on our consolidated statements of operations. Expense (benefit) recognized on interest and penalties related to unrecognized tax benefits as net investment hedgesof December 31, 2023, December 31, 2022, and accordingly, recorded changesDecember 31, 2021 was $0.2 million, $(5.9) million and $1.4 million, respectively. If we were to prevail on all uncertain tax positions, the reversal of this accrual, inclusive of interest and penalties, would result in fair value due to fluctuations in the spot rate to AOCI. The changes in fair valuea benefit of the swaps attributable to changes other than those due to fluctuations in the spot rate were excluded from the assessment of hedge effectiveness and recorded to interest expense over the life of the hedge.
Forward Starting Interest Rate Swaps$40.9 million.
During the third quarter of 2018, we entered into forward starting interest rate swaps with a notional amount totaling $1.5 billion with termination dates of July 2021, May 2022 and July 2026. The swaps had effective dates mirroringan income tax audit settlement, which included the termsresolution of the forecasted debt issuances. Under the agreements, we are required to early terminate these swaps at the time we expect to issue the related forecasted debt. We have designated these contracts as cash flow hedges. As a result, the unrealized mark-to-market gains or losses will be recorded to AOCI until termination at which point the realized gain or loss of these swaps at issuanceimpact of the hedged debt will be reclassified from AOCI and amortized to interest expense over the term of the hedged debt.
In June 2021, we early terminated our $250.0 million forward starting interest rate swap that was originally set to terminate in July 2021. This forward starting interest rate swap was rolled forward to May 2022 through a cashless settlement. The new May 2022 forward starting interest rate swap is incremental to our existing May 2022 forward starting interest rate swap that was executed in 2018, both of which are hedging our forecasted debt issuance expected to occur during 2022. At the time of the transaction, there was approximately $33.4 million of unrealized lossesfinal hybrid regulations recorded in AOCI. Approximately $1.7 million was recorded to interest expense in the second quarter of 2021 when it became probable that one of the forecasted interest payments originally hedged would not occur.2020, was reached with taxing authorities. The remaining $31.7 million will be amortizedsettlement, along with changes to interest expense throughout the term of the respective debt unless it becomes probable that the cash flows originally hedged will not occur, in which case the proportionate amount of the loss will be recorded to interest expense at that time. The new forward starting interest rate swap has an effective date of June 2021, a termination date of May 2022 and an effective interest rate of approximately 3.22%.
Cash settlements related to interest rate contracts are generally classified as operating activities on the consolidated statements of cash flows. However, due to an other-than-insignificant financing elementother unrecognized positions resulted in the May 2022 forward startingnet reduction of our unrecognized tax benefit position by approximately $250 million, including interest, rate swap that was designated in June 2021, the third quarter of 2021. The cash flow related to this contract will be classified as financing activities.
In 2015 we entered into forward starting interest rate swaps with a notional of CAD 600 million in order to manage our exposure to the volatility of the interest ratestax payment associated with the future interest payments onsettlement, after application of available net operating losses, was made in the forecasted CAD debt issuances,fourth quarter of 2021 which ultimately became the 2015 Notes and a portiontotaled approximately $125 million. As of the 2016 Notes. The swaps had an effective datefourth quarter of September 2015 and a termination date of September 2025 mirroring the terms of the initially forecasted CAD debt issuance. Under these agreements2023, we were required to early terminate these swaps at the approximate time we issued the previously forecasted debt. We had designated these contracts as cash flow hedges and accordingly, a portion of the CAD 39.2 million ($29.5 million at settlement) loss on the forward starting interest rate swaps is being reclassified from AOCI and amortized to interest expense over the remaining term of the 2015 Notes, repaid in September 2020, and over a portion of the CAD 500 million notes due in 2026 up to the full 10-year term of the interest rate swap agreements.
Foreign Currency Forwards
We have financial foreign exchange forward contracts in place to manage our exposure to foreign currency fluctuations. We hedge foreign currency exposure related to certain royalty agreements, exposure associated with the purchase of production inputs and imports that are denominated in currencies other than the functional entity's local currency, and other foreign exchanges exposures. These contracts have been designated as cash flow hedges of forecasted foreign currency transactions. We use foreign currency forward contracts to hedge these future forecasted transactions up to a 60 month horizon.
Commodity Swaps and Options
We have financial commodity swap and option contracts in place to hedgedo not anticipate material changes in the prices of natural gas, aluminum, including surcharges relating to our aluminum exposures, corn, barley and diesel. These contracts allow us to swap our floating exposure to changes in these commodity prices for a fixed rate. These contracts are not designated in hedge accounting relationships. As such, changes in fair value of these derivatives are recorded in cost of goods sold in the consolidated statements of operations. We hedge forecasted purchases of natural gas, aluminum, corn and diesel each up to 60 months out in the future for use in our supply chain, in line with our risk management policy. Further, we hedge forecasted
purchases of barley based on crop year and physical inventory management. For purposes of measuring segment operating performance, the unrealized changes in fair value of the swaps not designated in hedge accounting relationships are reported in Unallocated outside of the segment specific operating results until such time that the exposure we are managing is realized. At that time, we reclassify the gain or loss from Unallocated to the operating segment, allowing our operating segments to realize the economic effects of the derivative without the resulting unrealized mark-to-market volatility.
Warrants
On October 4, 2018, in connection with the formation of the Truss joint venture, as discussed further in Note 4, "Investments," our joint venture partner, HEXO, issued to our Canadian subsidiary a total of 11.5 million warrants to purchase common shares of HEXO at a strike price of CAD 6.00 per share at any time during the three year period following the formation of the joint venture. The fair value of the warrants at issuance of approximately $45 million was recorded as a non-current asset and as an adjustment to paid-in capital, net of tax. On December 23, 2020, HEXO consolidated its issued and outstanding common shares on the basis of 4 old shares for one new share that resulted in the adjustment of the strike price to CAD 24.00 per share and a reduction in warrants to 2.9 million. The warrants to acquire common shares of HEXO expired unexercised on October 4, 2021. All changes in the fair value of the warrants subsequent to issuance were recorded in other income (expense), net on the consolidated statements of operations.Derivative Fair Value Measurements
We utilize market approaches to estimate the fair value of our derivative instruments by discounting anticipated future cash flows derived from the derivative's contractual terms and observable market interest, foreign exchange and commodity rates. The fair values of our derivatives also include credit risk adjustments to account for our counterparties' credit risk, as well as our own non-performance risk, as appropriate. The fair value of our warrants to acquire common shares of HEXO prior to expiration were estimated using the Black-Scholes option-pricing model.
The tables below summarize our derivative assets and (liabilities) that were measured at fair value as of December 31, 2021 and December 31, 2020. See Note 1, "Basis of Presentation and Summary of Significant Accounting Policies" for further discussion related to measuring the fair value of derivative instruments. | | | | | | | | | | | | | | | | | | | | | | | |
| | | | Fair Value Measurements as of
December 31, 2021 |
| | Total as of
December 31, 2021 | | Quoted prices
in active markets
(Level 1) | | Significant
Other
Observable
Inputs
(Level 2) | | Significant
Unobservable
Inputs
(Level 3) |
| | (In millions) |
| | | | | | | |
| Interest rate swaps | $ | (170.8) | | | $ | — | | | $ | (170.8) | | | $ | — | |
| Foreign currency forwards | (1.5) | | | — | | | (1.5) | | | — | |
| Commodity swaps and options | 300.9 | | | — | | | 300.9 | | | — | |
| | | | | | | |
| Total | $ | 128.6 | | | $ | — | | | $ | 128.6 | | | $ | — | |
| | | | | | | | | | | | | | | | | | | | | | | |
| | | | Fair Value Measurements as of
December 31, 2020 |
| | Total as of
December 31, 2020 | | Quoted prices
in active markets
(Level 1) | | Significant
Other
Observable
Inputs
(Level 2) | | Significant
Unobservable
Inputs
(Level 3) |
| | (In millions) |
| Cross currency swaps | $ | (26.5) | | | $ | — | | | $ | (26.5) | | | $ | — | |
| Interest rate swaps | (221.5) | | | — | | | (221.5) | | | — | |
| Foreign currency forwards | (4.9) | | | — | | | (4.9) | | | — | |
| Commodity swaps and options | 65.2 | | | — | | | 65.2 | | | — | |
| Warrants | 0.3 | | | — | | | 0.3 | | | — | |
| Total | $ | (187.4) | | | $ | — | | | $ | (187.4) | | | $ | — | |
As of December 31, 2021 and December 31, 2020, we had no significant transfers between Level 1 and Level 2. New derivative contracts transacted during 2021 were all included in Level 2.
Results of Period Derivative Activity
The following tables include the year-to-date results of our derivative activity in our consolidated balance sheets as of December 31, 2021 and December 31, 2020, and our consolidated statements of operations for the years ended December 31, 2021, December 31, 2020 and December 31, 2019.
Fair Value of Derivative Instruments in the Consolidated Balance Sheets (in millions) | | | | | | | | | | | | | | | | | | | | | | | | | | | | | |
| | December 31, 2021 |
| | | | Asset derivatives | | Liability derivatives |
| | Notional amount | | Balance sheet location | | Fair value | | Balance sheet location | | Fair value |
| Derivatives designated as hedging instruments: | | | | | | |
| | | | | | | | | |
| | | | | | | | | |
| Interest rate swaps | $ | 1,500.0 | | | Other current assets | | $ | — | | | Accounts payable and other current liabilities | | $ | (67.7) | |
| | | Other non-current assets | | — | | | Other liabilities | | (103.1) | |
| Foreign currency forwards | $ | 170.8 | | | Other current assets | | 0.5 | | | Accounts payable and other current liabilities | | (2.4) | |
| | | Other non-current assets | | 0.6 | | | Other liabilities | | (0.2) | |
| Total derivatives designated as hedging instruments | | | | $ | 1.1 | | | | | $ | (173.4) | |
| Derivatives not designated as hedging instruments: | | | | | | |
Commodity swaps(1) | $ | 722.1 | | | Other current assets | | $ | 225.1 | | | Accounts payable and other current liabilities | | $ | (1.1) | |
| | | Other non-current assets | | 77.1 | | | Other liabilities | | (0.3) | |
Commodity options(1) | $ | 68.2 | | | Other current assets | | 1.0 | | | Accounts payable and other current liabilities | | (0.9) | |
| | | | | | | | | |
| | | | | | | | | |
| | | | | | | | | |
| Total derivatives not designated as hedging instruments | | $ | 303.2 | | | | | $ | (2.3) | |
| | | | | | | | | | | | | | | | | | | | | | | | | | | | | |
| | December 31, 2020 |
| | | | Asset derivatives | | Liability derivatives |
| | Notional amount | | Balance sheet location | | Fair value | | Balance sheet location | | Fair value |
| Derivatives designated as hedging instruments: | | | | | | |
| Cross currency swaps | $ | 400.0 | | | Other current assets | | $ | — | | | Accounts payable and other current liabilities | | $ | (26.5) | |
| | | Other non-current assets | | — | | | Other liabilities | | — | |
| Interest rate swaps | $ | 1,500.0 | | | Other non-current assets | | — | | | Accounts payable and other current liabilities | | (47.7) | |
| | | | | | | Other liabilities | | (173.8) | |
| Foreign currency forwards | $ | 181.2 | | | Other current assets | | 0.3 | | | Accounts payable and other liabilities | | (3.0) | |
| | | Other non-current assets | | — | | | Other liabilities | | (2.2) | |
| Total derivatives designated as hedging instruments | | | | $ | 0.3 | | | | | $ | (253.2) | |
| Derivatives not designated as hedging instruments: | | | | | | |
Commodity swaps(1) | $ | 918.9 | | | Other current assets | | $ | 44.5 | | | Accounts payable and other current liabilities | | $ | (20.6) | |
| | | Other non-current assets | | 45.4 | | | Other liabilities | | (4.1) | |
Commodity options(1) | $ | 16.8 | | | Other current assets | | — | | | Accounts payable and other current liabilities | | — | |
| Warrants | $ | 54.2 | | | Other non-current assets | | 0.3 | | | Other liabilities | | — | |
| Total derivatives not designated as hedging instruments | | $ | 90.2 | | | | | $ | (24.7) | |
(1)Notional includes offsetting buy and sell positions, shown in terms of absolute value. Buy and sell positions are shown gross in the asset and/or liabilityremaining unrecognized tax benefit position as appropriate.
The Pretax Effect of Cash Flow Hedge Accounting on Other Comprehensive Income, Accumulated Other Comprehensive Income (Loss), and income (in millions): | | | | | | | | | | | | | | | | | | | | |
| Derivatives in cash flow hedge relationships | | Amount of gain
(loss) recognized
in OCI on derivatives | | Location of gain (loss)
reclassified from AOCI into
income | | Amount of gain
(loss) recognized
from AOCI into income on
derivative |
| For the year ended December 31, 2021 | | | | | | |
| Forward starting interest rate swaps | | $ | 50.7 | | | Interest income (expense), net | | $ | (4.8) | |
| Foreign currency forwards | | 0.4 | | | Cost of goods sold | | (3.5) | |
| | | | Other income (expense), net | | 0.8 | |
| Total | | $ | 51.1 | | | | | $ | (7.5) | |
| For the year ended December 31, 2020 | | | | | | |
| Forward starting interest rate swaps | | $ | (110.0) | | | Interest income (expense), net | | $ | (2.9) | |
| Foreign currency forwards | | (3.5) | | | Cost of goods sold | | 4.6 | |
| | | | Other income (expense), net | | (1.2) | |
| Total | | $ | (113.5) | | | | | $ | 0.5 | |
| For the year ended December 31, 2019 | | | | | | |
| Forward starting interest rate swaps | | $ | (99.2) | | | Interest income (expense), net | | $ | (3.0) | |
| Foreign currency forwards | | (12.1) | | | Cost of goods sold | | 3.1 | |
| | | | Other income (expense), net | | (0.7) | |
| Total | | $ | (111.3) | | | | | $ | (0.6) | |
The Pretax Effect of Net Investment Hedge Accounting on Other Comprehensive Income, Accumulated Other Comprehensive Income (Loss) and income (in millions)
| | | | | | | | | | | | | | | | | | | | |
| Net investment hedge relationships | | Amount of gain
(loss) recognized
in OCI | | Location of gain (loss) recognized in income (amount excluded from effectiveness testing) | | Amount of gain (loss) recognized in income (amount excluded from effectiveness testing)(1) |
| For the year ended December 31, 2021 | | | | | | |
| Cross currency swaps | | $ | 8.8 | | | Interest income (expense), net | | $ | 6.1 | |
| EUR 800 million notes due 2024 | | 67.7 | | | Other income (expense), net | | — | |
| Total | | $ | 76.5 | | | | | $ | 6.1 | |
| For the year ended December 31, 2020 | | | | | | |
| Cross currency swaps | | $ | (33.2) | | | Interest income (expense), net | | $ | 14.2 | |
| EUR 800 million notes due 2024 | | (80.3) | | | Other income (expense), net | | — | |
| Total | | $ | (113.5) | | | | | $ | 14.2 | |
| For the year ended December 31, 2019 | | | | | | |
| Cross currency swaps | | $ | 19.8 | | | Interest income (expense), net | | $ | 23.5 | |
| EUR 800 million notes due 2024 | | 20.4 | | | Other income (expense), net | | — | |
| EUR 500 million notes due 2019 | | 10.1 | | | Other income (expense), net | | — | |
| Total | | $ | 50.3 | | | | | $ | 23.5 | |
(1)Represents amounts excluded from the assessment of effectiveness for which the difference between changes in fair value and period amortization is recorded in other comprehensive income.
The cumulative translation adjustments related to our net investment hedges remain in AOCI until the respective underlying net investment is sold or liquidated. During the years ended December 31, 2021, December 31, 2020 and December 31, 2019, respectively, we did not reclassify any amounts related to net investment hedges from AOCI into earnings.
We expect net losses of approximately $5 million (pretax) recorded in AOCI as of December 31, 2021 will be reclassified into earnings within the next 12 months. For derivatives designated
We file income tax returns in cash flow hedge relationships,most of the maximum length of time over which forecasted transactions are hedged as of December 31, 2021 is approximately 4 years, as well as those related to our forecasted debt issuances in 2022federal, state and 2026.
The Effect of Derivatives Not Designated as Hedging Instruments on the Consolidated Statements of Operations (in millions):
| | | | | | | | | | | | | | |
Derivatives not in hedging relationship | | Location of gain (loss) recognized
in income on derivative | | Amount of gain (loss) recognized
in income on derivative |
For the year ended December 31, 2021 | | | | |
Commodity swaps | | Cost of goods sold | | $ | 403.4 | |
Commodity options | | Cost of goods sold | | 0.1 | |
| | | | |
Warrants | | Other income (expense), net | | (0.3) | |
| | | | |
Total | | | | $ | 403.2 | |
For the year ended December 31, 2020 | | | | |
Commodity swaps | | Cost of goods sold | | $ | 28.5 | |
| | | | |
| | | | |
Warrants | | Other income (expense), net | | (2.4) | |
| | | | |
Total | | | | $ | 26.1 | |
For the year ended December 31, 2019 | | | | |
Commodity swaps | | Cost of goods sold | | $ | (26.8) | |
| | | | |
| | | | |
Warrants | | Other income (expense), net | | (17.8) | |
| | | | |
Total | | | | $ | (44.6) | |
The gains and losses recognized in income related to our commodity swaps are largely driven by changesprovincial jurisdictions in the respective commodity market prices.U.S., Canada and various countries in Europe. Tax years through 2013 are closed in the U.S. In Canada, tax years through 2018 are closed or have been settled through examination except for issues relating to intercompany cross-border transactions. The statute of limitations for intercompany cross-border transactions is closed through tax year 2015. Tax years through 2014 are closed for most European jurisdictions in which we operate, with statutes of limitations varying from 3 to 7 years for most jurisdictions.
17. Accounts PayableWhen cash is available after satisfying working capital needs and Other Current Liabilities
| | | | | | | | | | | |
| | As of |
| | December 31, 2021 | | December 31, 2020 |
| | (In millions) |
| Accounts payable and accrued trade payables | $ | 2,098.1 | | | $ | 1,732.7 | |
| Accrued compensation | 243.7 | | | 278.5 | |
| Accrued excise and other non-income related taxes | 242.6 | | | 257.6 | |
| Accrued interest | 91.4 | | | 101.4 | |
| Container liability | 114.9 | | | 100.9 | |
| Operating leases | 45.4 | | | 47.1 | |
Other(1) | 271.2 | | | 371.3 | |
| Accounts payable and other current liabilities | $ | 3,107.3 | | | $ | 2,889.5 | |
(1)Includesall other business obligations, we may distribute current liabilities relatedearnings and the associated cash from a foreign subsidiary to derivatives, income taxes, pensionsits U.S. parent, and other postretirement benefits, guarantee liabilities for somerecord the tax impact associated with the distribution. However, to the extent current earnings of our equity method investmentsforeign operations exist and various other accrued expenses.are not otherwise distributed or planned to be distributed, such earnings accumulate. These accumulated earnings are not considered permanently reinvested in our foreign operations. The taxes associated with any future repatriation of undistributed earnings are anticipated to be insignificant.
18.13. Commitments and Contingencies
Letters of Credit
As of December 31, 2021,2023, we had $62.2$54 million outstanding in letters of credit with financial institutions. These letters primarily expire throughout 20222024 and $15.1$15 million of the letters contain a feature that automatically renews the letter for an additional year if no cancellation notice is submitted. These letters of credit are being maintained as security for deferred compensation payments, reimbursements to insurance companies, reimbursements to the trustee for pension payments, deductibles or retention payments made on our behalf, various payments due to governmental agencies, operations of underground storage tanks and other general business purposes and are not included on our consolidated balance sheets.
Guarantees and Indemnities
We guarantee indebtedness and other obligations to banks and other third parties for some of our equity method investments and consolidated subsidiaries. As of December 31, 20212023 and December 31, 2020,2022, the consolidated balance sheets include liabilities related to these guarantees of $38.1$36.9 million and $38.2$33.3 million, respectively. See Note 4,3, "Investments" for further detail. Kaiser
In 2006, we sold our entire equity interest in our Brazilian unit, Cervejarias Kaiser, Brasil S.A. ("Kaiser") to FEMSA Cerveza S.A. de C.V. ("FEMSA").FEMSA. The terms of the sale agreement require us to indemnify FEMSA for certain exposures related to tax, civil and labor contingencies arising prior to FEMSA's purchase of Kaiser. In addition, we provided an indemnity to FEMSA for losses Kaiser may incur with respect to tax claims associated with certain previously utilized purchased tax credits. We settled a portion of our tax credit indemnity obligation during 2010. The maximum potential claims amount for the remainder of the purchased tax credits was $62.8$72.1 million as of December 31, 2021.2023. Our total estimate of the indemnity liability for these purchased tax credits as of December 31, 20212023 was $7.2$8.3 million which is classified as non-current.
Our estimates consider a number of scenarios for the ultimate resolution of these issues, the probabilities of which are influenced not only by legal developments in Brazil but also by management's intentions with regard to various alternatives that could present themselves leading to the ultimate resolution of these issues. The liabilities are impacted by changes in estimates regarding amounts that could be paid, the timing of such payments, adjustments to the probabilities assigned to various scenarios and foreign currency exchange rates. Our indemnity also coversmay cover certain fees and expenses that Kaiser incurs to manage theany cases finally determined to be unsuccessful through the administrative and judicial systems.
Additionally, we also provided FEMSA with indemnity related to all other tax, civil and labor contingencies existing as of the date of sale. In this regard, however, FEMSA assumed their full share of all of these contingent liabilities that had been previously recorded and disclosed by us prior to the sale on January 13, 2006. However, we may have to provide indemnity to FEMSA if those contingencies settle at amounts greater than those amounts previously recorded or disclosed by us. We will be able to offset any indemnity exposures in these circumstances with amounts that settle favorably to amounts previously recorded. Our exposure related to these indemnity claims is capped at the amount of the sales price of the 68% equity interest of Kaiser, which was $68 million. As a result of these contract provisions, our estimates include not only probability-weighted potential cash outflows associated with indemnity provisions, but also probability-weighted cash inflows that could result from
favorable settlements, which could occur through negotiation or settlement programs arising from the federal or any of the various state governments in Brazil. The recorded value of the tax, civil and labor indemnity liability was $3.0$3.5 million as of December 31, 2021,2023, which iswas classified as non-current. For the remaining portion of our indemnity obligations, not deemed probable, we continue to utilize probability-weighted scenarios in determining the value of the indemnity obligations.
Future settlement procedures and related negotiation activities associated with these contingencies are largely outside of our control. The sale agreement requires annual cash settlements relating to the tax, civil and labor indemnities. Indemnity obligations related to purchased tax credits must be settled upon notification of FEMSA's settlement. Due to the uncertainty involved with the ultimate outcome and timing of these contingencies, significant adjustments to the carrying values of the indemnity obligations have been recorded to date and additional future adjustments may be required. These liabilities are denominated in Brazilian Reais and are therefore, subject to foreign exchange gains or losses. As a result, these foreign exchange gains and losses are the only impacts recorded within other non-operating income (expense), net.
The table below provides a summary of reserves associated with the Kaiser indemnity obligations from December 31, 2018, through December 31, 2021: | | | | | | | | | |
| | | | | Total indemnity
reserves |
| | | | | (In millions) |
Balance as of December 31, 2018 | | | | | $ | 14.7 | |
Changes in estimates | | | | | — | |
Foreign exchange impacts | | | | | (0.5) | |
Balance as of December 31, 2019 | | | | | $ | 14.2 | |
Changes in estimates | | | | | — |
Foreign exchange impacts | | | | | (3.2) | |
Balance as of December 31, 2020 | | | | | $ | 11.0 | |
Changes in estimates | | | | | — | |
Foreign exchange impacts | | | | | (0.8) | |
Balance as of December 31, 2021 | | | | | $ | 10.2 | |
Purchase ObligationsWe have various long-term supply contracts and distribution agreements with unaffiliated third parties and our joint venture partners to purchase materials used in production and packaging and to provide distribution services. TheCertain supply contracts provide that we purchase certain minimum levels of materials throughout the terms of the contracts. Additionally, we have various long-term non-cancelable commitments for advertising, sponsorships and promotions, including marketing at sports arenas, stadiums and other venues and events. The future aggregate minimum required commitments under these purchase obligations are shown in the table below based on foreign exchange rates as of December 31, 2021.2023. The amounts in the table do not represent all anticipated payments under long-term contracts. Rather, they represent unconditional, non-cancelable purchase commitments under contracts with remaining terms greater than one year.
| | | | | | | | | | | | | | |
| Year | | Supply and Distribution | | Advertising and Promotions |
| | | (Amounts in millions) |
| 2022 | | $ | 400.2 | | | $ | 145.6 | |
| 2023 | | 347.3 | | | 144.4 | |
| 2024 | | 193.5 | | | 131.8 | |
| 2025 | | 179.7 | | | 107.3 | |
| 2026 | | 147.9 | | | 81.5 | |
| Thereafter | | 338.2 | | | 232.1 | |
| Total | | $ | 1,606.8 | | | $ | 842.7 | |
| | | | | | | | | | | | | | |
| Year | | Supply and Distribution | | Advertising and Promotions |
| | | (Amounts in millions) |
| 2024 | | $ | 371.9 | | | $ | 150.6 | |
| 2025 | | 232.0 | | | 151.3 | |
| 2026 | | 208.1 | | | 106.4 | |
| 2027 | | 185.2 | | | 80.5 | |
| 2028 | | 194.2 | | | 61.6 | |
| Thereafter | | 182.0 | | | 122.7 | |
| Total | | $ | 1,373.4 | | | $ | 673.1 | |
Total purchases under our long-term unconditional, non-cancellable supply and distribution contracts in 2021, 2020 and 2019 were approximately $0.4 billion, $0.5 billionduring each of the years ended December 31, 2023, 2022 and $1.0 billion, respectively.
Litigation, and Other Disputes and Environmental
Related to litigation, other disputes and environmental issues, we had an aggregate accrued contingent liability of $11.3$70.2 million and $17.9$77.0 million as of December 31, 20212023 and December 31, 2020,2022, respectively. While we cannot predict the eventual aggregate cost for litigation, other disputes and environmental matters in which we are currently involved, we believe adequate reserves have been provided for losses that are probable and estimable. Additionally, as noted below, there are certain loss contingencies that we deem reasonably possible for which a range of loss is not estimable at this time; for all other matters, we believe that any reasonably possible losses in excess of the amounts accrued are immaterial to our audited consolidated financial statements.
We are involved in other disputes and legal actions arising in the ordinary course of our business. While it is not feasible to predict or determine the outcome of these proceedings, in our opinion, based on a review with legal counsel, other than as noted, none of these disputes or legal actions are expected to have a material impact on our business, consolidated financial position, results of operations or cash flows. However, litigation is subject to inherent uncertainties and an adverse result in these or other matters may arise from time to time that may harm our business.
On February 12, 2018, Stone Brewing Company filed a trademark infringement lawsuit in federal court in the Southern District of California against Molson Coors Beverage Company USA LLC ("MCBC USAUSA"), a wholly owned subsidiary of our Company, alleging that theKeystone brand hashad “rebranded” itself as “Stone” and iswas marketing itself in a manner confusingly similar to Stone Brewing Company's registered Stone trademark. Stone Brewing Company seekssought treble damages and disgorgement of MCBC USA's profit from Keystone sales. MCBC USA subsequently filed an answer and counterclaims against Stone Brewing Company. On May 31, 2018, Stone Brewing Company filed a motion to dismiss MCBC USA's counterclaims and for a preliminary injunction seeking to bar MCBC USA from continuing to use “STONE” on Keystone Light cans and related marketing materials. In March 2019, the court denied Stone Brewing Company’s motion for preliminary injunction and its motion to dismiss MCBC USA's counterclaims. Discovery is closed. The jury trial scheduled to begin November 8, 2021 was continued by the court and has now been reset to beginbegan on March 7, 2022. We intend to vigorously assertThe jury returned a verdict in which it concluded that trademark infringement had occurred and defendawarded Stone Brewing Company $56.0 million in damages. The jury also found that no "willful" trademark infringement had occurred. The trial court subsequently denied Stone Brewing Company’s motion for permanent injunction, motion for disgorgement of profits and motion for treble damages. Judgment was entered on September 8, 2022. Both parties filed post-trial motions, including MCBC USA’s renewed motion for judgment as a matter of law or, in the alternative, a new trial and/or remittitur and Stone Brewing Company’s motion for partial new trial of equitable issues. The court denied both parties' post-trial motions on September 25, 2023. On October 24, 2023, MCBC USA filed a notice of appeal in the 9th Circuit Court of Appeals. As of December 31, 2023 and December 31, 2022, the Company had a recorded accrued liability of $58.5 million and $56.6 million, respectively, within other liabilities on our rightsconsolidated balance sheets reflecting the best estimate of probable loss in this lawsuit. A rangecase based on the judgment plus associated post-judgment interest. However, it is reasonably possible that the estimate of potentialthe loss is not estimable atcould change in the near term based on the progression of the case, including the appeals process. We will continue to monitor the status of the case and will adjust the accrual in the period in which any significant change occurs which could impact the estimate of the loss for this time.matter.
Regulatory Contingencies
In December 2018, the U.S. Department of Treasury issued a regulationThe Representative Owners and TBS are parties to an MFA that impacted our ability to claim a refund of certain federal duties, taxes, and fees paid for beer sold between the U.S. and certain other countries effective in February 2019. As a result, based on the terms of the regulation, it was the U.S. Department of Treasury's position that future claims would no longer be accepted, and we would be further unable to collect previously claimed, but not yet received, refunds. In January 2020, the United States Court of International Trade issued an opinion and order ruling the challenged portions of this regulation dealing with refunds of certain federal duties, taxes and fees paid with respect to certain imported beer, to the extent of certain exported beer, to be unlawful. On April 17, 2020, the U.S. Department of Treasury appealed this ruling as well as filed a motion for stay of the enforcement of judgment and suspension of claims pending appeal. The U.S. Department of Treasury's motion to stay was denied pending appeal and they were ordered to pay on all claims under the accelerated payment program. On July 23, 2020, the U.S. Department of Treasury filed its opening appellate brief in the United States Court of Appeals for the Federal Circuit. An opposition/response brief was filed on October 1, 2020 and final reply brief was submitted on December 11, 2020. On August 23, 2021, the Federal Circuit Court of Appeals issued its unanimous written opinion affirming the judgment of the Court of International Trade and, on October 14, 2021, issued its Mandate on the judgment. All other appellate deadlines have since passed, the judgment is final and litigation has concluded. As a result, both amounts previously collected on filed claims and the amounts of previously filed claims that have not yet been received are no longer at risk.
In June 2019, the Ontario government adopted a bill that, if enacted, would terminate a 10-year Master Framework Agreement that was originally signed between the previous government administration and Molson Canada 2005, a wholly owned indirect subsidiary of our Company, Labatt Brewing Company Limited, Sleeman Breweries Ltd., and Brewers Retail Inc. in 2015 and dictates the terms of the beer distribution and retail systems in Ontario. The initial term of the MFA does not expire until December 31, 2025, and the MFA contains a provision requiring two-year advance notice of the government's intention to not renew the MFA. In December 2023, the Province of Ontario throughnotified the Representative Owners and TBS that it would not be renewing the MFA after the initial term of the MFA expires on December 31, 2025. The government has not yet proclaimedProvince of Ontario simultaneously announced a set of Key Principles agreed upon between the bill as law.Province of Ontario, the Representative Owners, and TBS, concerning the intended features of the future marketplace for beer distribution and retail systems in the Province of Ontario to be introduced no later than January 1, 2026. Under the Key Principles, TBS will continue its retail operations and will continue to be the primary distributor of beer in the Province of Ontario at least through 2031. The Key Principles also state grocery stores, convenience stores, gas stations and big-box retailers in the Province of Ontario will be able to apply for licenses to sell beer, wine, cider and ready-to-drink cocktails starting in 2026. We continue to evaluate the impacts of these potential legislative changes are unknown at this time, but could have a negative impactthe Key Principles on theour results of operations, cash flows and financial position of the Americas segment. Molson Canada 2005 and the other Master Framework Agreement signatories are prepared to vigorously defend our rights and pursue legal recourse, should the Master Framework Agreement be unilaterally terminated by the enactment of the legislation.operations.
Environmental
When we determine it is probable that a liability for environmental matters or other legal actions exists and the amount of the loss is reasonably estimable, an estimate of the future costs is recorded as a liability in the financial statements. Costs that extend the life, increase the capacity or improve the safety or efficiency of our assets or are incurred to mitigate or prevent
future environmental contamination may be capitalized. Other environmental costs are expensed when incurred. Total environmental expenditures recognized for 2021, 2020the years ended December 31, 2023, 2022 and 20192021 were immaterial to our consolidated financial statements.statements of operations.
Americas
Our Canada brewing operations are subject to provincial environmental regulations and local permit requirements. Our Longueuil, Chilliwack and Toronto breweries have water treatment facilities to pre-treat waste waterwastewater before it goes to the respective local governmental facility for final treatment. We have environmental programs in Canada including organization, monitoring and verification, regulatory compliance, reporting, education and training and corrective action.
In Canada, we sold a chemical specialties business in 1996. We are still responsible for certain aspects of environmental remediation, undertaken or planned, at those chemical specialties business locations. We have established provisions for the costs of these remediation programs.
In January 2023, MCBC USA received a Notice of Violation / Cease and Desist Order ("Order") from the Colorado Department of Public Health & Environment’s Water Quality Control Division, alleging certain violations of the Colorado Water Quality Control Act (the “Act”) and the Colorado Discharge Permit related to our Company’s brewery and facilities in Golden, Colorado. The Order alleged MCBC USA failed to comply with permit effluent limitations, failed to properly monitor and report sampling results and failed to adhere to the permit compliance schedule.
In the U.S., we were previously notified that we are or may be a potentially responsible party ("PRP") under the Comprehensive Environmental Response, Compensation and Liability Act or similar state laws for the cleanup of sites where hazardous substances have allegedly been released into the environment. We cannot predict with certainty the total costs of cleanup, our share of the total cost, the extent to which contributions will be available from other parties, the amount of time necessary to complete the cleanups or insurance coverage.
Lowry
We are one of a number of entities named by the Environmental Protection Agency ("EPA") as a PRP at the Lowry Superfund site in Colorado. This landfill is owned by the City and County of Denver ("Denver") and is managed by Waste Management of Colorado, Inc. ("Waste Management"). In 1990, we recorded a pretax charge of $30 million, a portion of which was put into a trust in 1993 as part of a settlement with Denver and Waste Management regarding the then-outstanding litigation. Our settlement was based on an assumed remediation cost of $120 million (in 1992 adjusted dollars). We are obligated to pay a portion of future costs in excess of that amount.
Waste Management provides us with updated annual cost estimates through 2032. We review these cost estimates in the assessment of our accrual related to this issue. Our expected liability is based on our best estimates available.
Based on the assumptions utilized, the present value and gross amount of the costs as of December 31, 20212023 are approximately $6 $5 million and $6 million, respectively. CostCost estimates were discounted using a 1.43%3.88% risk-free rate of return. We did not assume any future recoveries from insurance companies in the estimate of our liability and none are expected.
Considering the estimates extend through the year 2032 and the related uncertainties at the site, including what additional remedial actions may be required by the EPA, new technologies and what costs we are required to cover, the estimate of our liability may change as further facts develop. We cannot predict the amount of any such change, but additional accruals in the future are possible.
Other
In prior years, we were notified by the EPA and certain state environmental divisions that we are a PRP, along with other parties, at the East Rutherford and Berry's Creek sites in New Jersey and the Chamblee site in Georgia. Certain former non-beer business operations, which we discontinued use of and subsequently sold, were involved at these sites. Potential losses associated with these sites could increase as remediation planning progresses.
We are aware of groundwater contamination at some of our properties in Colorado resulting from historical, ongoing, or nearby activities. There may also be other contamination of which we are currently unaware.
EMEA&APAC
We are subject to the requirements of governmental and local environmental and occupational health and safety laws and regulations within each of the countries in which we operate. Compliance with these laws and regulations did not materially affect our 20212023 capital expenditures, results of operations or our financial or competitive position, and we do not currently anticipate that they will do so in 2022.2024.
19. Leases14. Stockholders' Equity
Montreal Brewery SaleChanges to the number of shares of capital stock outstanding were as follows: | | | | | | | | | | | | | | | | | | | | | | | |
| | Common stock
outstanding | | Exchangeable
shares outstanding |
| | Class A | | Class B | | Class A | | Class B |
| | (Share amounts in millions) |
| Balance as of December 31, 2020 | 2.6 | | | 200.3 | | | 2.7 | | | 11.1 | |
| Shares issued under equity compensation plans | — | | | 0.3 | | | — | | | — | |
| | | | | | | |
| | | | | | | |
| Balance as of December 31, 2021 | 2.6 | | | 200.6 | | | 2.7 | | | 11.1 | |
| Shares issued under equity compensation plans | — | | | 0.3 | | | — | | | — | |
| Purchase of treasury shares | — | | | (1.0) | | | — | | | — | |
| Shares exchanged for common stock | — | | | 0.1 | | | — | | | (0.1) | |
| | | | | | | |
| Balance as of December 31, 2022 | 2.6 | | | 200.0 | | | 2.7 | | | 11.0 | |
| Shares issued under equity compensation plans | — | | | 0.4 | | | — | | | — | |
| Purchase of treasury shares | — | | | (3.4) | | | — | | | — | |
| Shares exchanged for common stock | — | | | 1.6 | | | — | | | (1.6) | |
| | | | | | | |
| Balance as of December 31, 2023 | 2.6 | | | 198.6 | | | 2.7 | | | 9.4 | |
Exchangeable Shares
The Class A exchangeable shares and Leaseback TransactionClass B exchangeable shares were issued by Molson Coors Canada Inc., a wholly-owned subsidiary of our Company. The exchangeable shares are substantially the economic equivalent of the corresponding shares of Class A and Class B common stock that a Molson Inc. shareholder would have received in the merger of Adolph Coors Company with Molson Inc. in February 2005, if the holder had elected to receive shares of Molson Coors common stock. Exchangeable shareholders receive the CAD equivalent of dividends declared on Class A and B common stock on the date of declaration. Holders of exchangeable shares also receive, through a voting trust, the benefit of Molson Coors voting rights, entitling the holder to one vote on the same basis and in the same circumstances as one corresponding share of Molson Coors common stock.
In June 2019,
Voting Rights
Each holder of record of Class A common stock, Class B common stock, Class A exchangeable shares and Class B exchangeable shares is entitled to one vote for each share held, without the ability to cumulate votes on the election of directors. Our Class B common stock has fewer voting rights than our Class A common stock and holders of our Class A common stock have the ability to effectively control or have a significant influence over company actions requiring stockholder approval. Specifically, holders of Class B common stock voting together as a single class have the right to elect three directors of the Molson Coors Board of Directors, as well as the right to vote on certain additional matters as outlined in the Restated Certificate of Incorporation (as amended, the "Certificate"), such as merger agreements that require approval under applicable law, sales of all or substantially all of our assets to unaffiliated third parties, proposals to dissolve MCBC, and certain amendments to the Certificate that require approval under applicable law, each as further described and limited by the Certificate. The Certificate also provides that holders of Class A common stock and Class B common stock shall vote together as a single class, on an advisory basis, on any proposal to approve the compensation of MCBC's named executive officers.
Conversion Rights
The Certificate provides for the right of holders of Class A common stock to convert their stock into Class B common stock on a one-for-one basis at any time. The exchangeable shares are exchangeable at any time, at the option of the holder on a one-for-one basis for corresponding shares of Molson Coors common stock. Therefore, a portion of our authorized and unissued Class A and Class B common shares are reserved to meet exchange requirements.
Share Repurchase Program
On September 29, 2023, our Board approved a new share repurchase program authorizing the repurchase of up to an aggregate of $2.0 billion of our Company's Class B common stock excluding brokerage commissions and excise taxes, with an expected program term of five years. This repurchase program replaces and supersedes any repurchase program previously approved by our Board, including the program approved during the first quarter of 2022. The number, price, structure and timing of the repurchases under the program, if any, will be at our sole discretion and future repurchases will be evaluated by us depending on market conditions, liquidity needs, restrictions under our debt arrangements and other factors. Share repurchases may be made in the open market, in structured transactions, or in privately negotiated transactions. The repurchase authorization does not oblige us to acquire any particular amount of our Company's Class B common stock. The Board may suspend, modify or terminate the repurchase program at any time without prior notice.
During the year ended December 31, 2023, we completedrepurchased 3,454,694 shares under the share repurchase program at a weighted average price of $61.06 per share, including brokerage commissions and excluding excise taxes, for an aggregate value of $211.0 million. During the year ended December 31, 2022, we repurchased 995,000 shares under the share repurchase program approved in 2022 at a weighted average price of $51.70 per share, including brokerage commissions, for an aggregate value of $51.5 million. As of December 31, 2023, approximately $1.8 billion remained available for repurchase under the $2.0 billion program.
15. Accumulated Other Comprehensive Income (Loss)
| | | | | | | | | | | | | | | | | | | | | | | | | | | | | |
| | MCBC stockholders' equity |
| | Foreign
currency
translation
adjustments | | Gain (loss) on
derivative
instruments | | Pension and
postretirement
benefit
adjustments | | Equity method
investments | | Accumulated
other
comprehensive
income (loss) |
| | (In millions) |
| As of December 31, 2020 | $ | (539.5) | | | $ | (173.9) | | | $ | (397.7) | | | $ | (56.7) | | | $ | (1,167.8) | |
| Foreign currency translation adjustments | (85.6) | | | — | | | (1.2) | | | — | | | (86.8) | |
Cumulative translation adjustment reclassified from other comprehensive income (loss)(1) | 7.5 | | | — | | | — | | | — | | | 7.5 | |
| Gain (loss) recognized on net investment hedges | 76.5 | | | — | | | — | | | — | | | 76.5 | |
| Unrealized gain (loss) recognized on derivative instruments | — | | | 51.1 | | | — | | | — | | | 51.1 | |
| Derivative instrument activity reclassified from other comprehensive income (loss) | — | | | 7.5 | | | — | | | — | | | 7.5 | |
| Net change in pension and other postretirement benefit assets and liabilities recognized in other comprehensive income (loss) | — | | | — | | | 158.6 | | | — | | | 158.6 | |
| Pension and other postretirement activity reclassified from other comprehensive income (loss) | — | | | — | | | 7.1 | | | — | | | 7.1 | |
| Ownership share of unconsolidated subsidiaries' other comprehensive income (loss) | — | | | — | | | — | | | 20.8 | | | 20.8 | |
| Tax benefit (expense) | (17.6) | | | (15.7) | | | (41.9) | | | (5.3) | | | (80.5) | |
| | | | | | | | | |
| | | | | | | | | |
| As of December 31, 2021 | $ | (558.7) | | | $ | (131.0) | | | $ | (275.1) | | | $ | (41.2) | | | $ | (1,006.0) | |
| Foreign currency translation adjustments | (356.1) | | | — | | | 1.2 | | | — | | | (354.9) | |
Cumulative translation adjustment reclassified from other comprehensive income (loss)(1) | 12.1 | | | — | | | — | | | — | | | 12.1 | |
| Gain (loss) recognized on net investment hedges | 53.2 | | | — | | | — | | | — | | | 53.2 | |
| Unrealized gain (loss) recognized on derivative instruments | — | | | 209.7 | | | — | | | — | | | 209.7 | |
| Derivative instrument activity reclassified from other comprehensive income (loss) | — | | | 12.9 | | | — | | | — | | | 12.9 | |
| Net change in pension and other postretirement benefit assets and liabilities recognized in other comprehensive income (loss) | — | | | — | | | (78.2) | | | — | | | (78.2) | |
| Pension and other postretirement activity reclassified from other comprehensive income (loss) | — | | | — | | | (2.1) | | | — | | | (2.1) | |
| Ownership share of unconsolidated subsidiaries' other comprehensive income (loss) | — | | | — | | | — | | | 18.7 | | | 18.7 | |
| Tax benefit (expense) | (25.7) | | | (59.4) | | | 19.1 | | | (4.9) | | | (70.9) | |
| | | | | | | | | |
| | | | | | | | | |
| As of December 31, 2022 | $ | (875.2) | | | $ | 32.2 | | | $ | (335.1) | | | $ | (27.4) | | | $ | (1,205.5) | |
| Foreign currency translation adjustments | 113.5 | | | — | | | — | | | — | | | 113.5 | |
Cumulative translation adjustment reclassified from other comprehensive income (loss)(2) | (0.7) | | | — | | | — | | | — | | | (0.7) | |
| Gain (loss) recognized on net investment hedges | (26.5) | | | — | | | — | | | — | | | (26.5) | |
| Unrealized gain (loss) recognized on derivative instruments | — | | | (3.6) | | | — | | | — | | | (3.6) | |
| Derivative instrument activity reclassified from other comprehensive income (loss) | — | | | 1.3 | | | — | | | — | | | 1.3 | |
| Net change in pension and other postretirement benefit assets and liabilities recognized in other comprehensive income (loss) | — | | | — | | | (8.5) | | | — | | | (8.5) | |
| Pension and other postretirement activity reclassified from other comprehensive income (loss) | — | | | — | | | (15.0) | | | — | | | (15.0) | |
| Ownership share of unconsolidated subsidiaries' other comprehensive income (loss) | — | | | — | | | — | | | 15.4 | | | 15.4 | |
| Tax benefit (expense) | 10.9 | | | 0.7 | | | 5.9 | | | (4.2) | | | 13.3 | |
| | | | | | | | | |
| | | | | | | | | |
| As of December 31, 2023 | $ | (778.0) | | | $ | 30.6 | | | $ | (352.7) | | | $ | (16.2) | | | $ | (1,116.3) | |
(1)As a result of the sale of a disposal group within our Montreal brewery for $96.2 million, resulting in a $61.3 million gain, which was recorded as a special itemIndia business for the year ended December 31, 2019. In conjunction with2021, and the completion of the sale we agreed to lease backof our non-operating India entity during the year ended December 31, 2022, the associated respective cumulative foreign currency translation adjustments were reclassified from AOCI and recognized within other operating income (expense), net.
existing property(2)As a result of the sale of our interest in Truss, the associated cumulative foreign currency translation adjustment was reclassified from AOCI. The impact of the cumulative foreign currency translation adjustment was recorded in other operating income (expense), net, as a component of the loss on sale when the entity was disposed during the third quarter of 2023.
We have significant levels of net assets denominated in currencies other than USD due to continueour operations in foreign countries, and therefore we recognize OCI gains and/or losses when those items are translated to USD. The foreign currency translation adjustment gains during 2023 were primarily due to the strengthening of the CAD, GBP, EUR and certain other currencies of our Europe operations versus the USD. The foreign currency translation adjustment losses during 2022 were primarily due to the weakening of the CAD, GBP, EUR and certain other currencies of our Europe operations versus the USD. The foreign currency translation losses recognized during 2021 were primarily due to the weakening of the GBP, EUR and certain other currencies of our Europe operations versus the USD.
Reclassifications from AOCI
| | | | | | | | | | | | | | | | | | | | | | | |
| For the years ended | | |
| December 31, 2023 | | December 31, 2022 | | December 31, 2021 | | |
| Reclassifications from AOCI | | Locations of Reclassifications |
| (In millions) | | |
| Gain/(loss) on cash flow hedges | | | | | | | |
| Forward starting interest rate swaps | $ | (5.2) | | | $ | (14.3) | | | $ | (4.8) | | | Interest expense, net |
| Foreign currency forwards | 4.9 | | | 1.8 | | | (3.5) | | | Cost of goods sold |
| Foreign currency forwards | (1.0) | | | (0.4) | | | 0.8 | | | Other non-operating income (expense), net |
| | | | | | | |
| Total income (loss) reclassified, before tax | (1.3) | | | (12.9) | | | (7.5) | | | |
| Income tax benefit (expense) | 0.4 | | | 3.5 | | | 2.0 | | | |
| Net income (loss) reclassified, net of tax | $ | (0.9) | | | $ | (9.4) | | | $ | (5.5) | | | |
| | | | | | | |
| Amortization of defined benefit pension and other postretirement benefit plan items | | | | | | | |
| Prior service benefit (cost) | $ | 0.4 | | | $ | 0.4 | | | $ | 0.3 | | | Other pension and postretirement benefits (costs), net |
| Net actuarial gain (loss) and settlement | 14.6 | | | 1.7 | | | (7.4) | | | Other pension and postretirement benefits (costs), net |
| Total income (loss) reclassified, before tax | 15.0 | | | 2.1 | | | (7.1) | | | |
| Income tax benefit (expense) | (3.8) | | | (0.5) | | | 1.7 | | | |
| Net income (loss) reclassified, net of tax | $ | 11.2 | | | $ | 1.6 | | | $ | (5.4) | | | |
| | | | | | | |
| Other reclassifications from AOCI | | | | | | | |
| Cumulative translation adjustment resulting from sale of disposal groups | $ | 0.7 | | | $ | (12.1) | | | $ | (7.5) | | | Other operating income (expense), net |
| | | | | | | |
| | | | | | | |
| | | | | | | |
| Net income (loss) reclassified, net of tax | $ | 0.7 | | | $ | (12.1) | | | $ | (7.5) | | | |
| | | | | | | |
| Total income (loss) reclassified, net of tax | $ | 11.0 | | | $ | (19.9) | | | $ | (18.4) | | | |
16. Share-Based Payments
We have one share-based compensation plan, the MCBC Incentive Compensation Plan (the "Incentive Compensation Plan"), as of December 31, 2023 and all outstanding awards fall under this plan.
Incentive Compensation Plan
We issue the following types of awards related to shares of Class B common stock to certain directors, officers and other eligible employees, pursuant to the Incentive Compensation Plan: RSUs, DSUs, PSUs and stock options.
RSU awards are issued based upon the market value equal to the price of our stock at the date of grant and generally vest over a period of three years. During the years ended December 31, 2023, 2022 and 2021, we granted 0.5 million, 0.5 million and 0.6 million RSUs, respectively, with a weighted-average market value of $54.97, $52.05 and $45.84 each, respectively. Prior to vesting, RSUs have no voting rights.
DSU awards, under the Directors' Stock Plan pursuant to the Incentive Compensation Plan, are elections made by non-employee directors of MCBC that enable them to receive all or one-half of their annual cash retainer payments in our stock. The DSU awards are issued at the market value equal to the price of our stock at the date of the grant. The DSUs are paid in shares of stock upon termination of service. Prior to vesting, DSUs have no voting rights. During the years ended December 31, 2023, 2022 and 2021, we granted a small number of DSUs.
PSU awards are granted with a target value established at the date of grant and vest upon completion of a service requirement. The settlement amount of the PSUs is determined based on market and performance metrics, which include our total shareholder return performance relative to the stock market index defined by each award and specified internal performance metrics designed to drive greater shareholder return. PSU compensation expense is based on fair values assigned to the market and performance metrics upon grant. The market metric is based upon a Monte Carlo model, with the market metric remaining constant throughout the vesting period of three years. The performance metric is based upon the market value equal to the price of our stock at the date of grant for the 2023 and 2022 awards and a Monte Carlo model for all previous awards, varying based on a multiplier tied to projected performance metric attainment. During the years ended December 31, 2023, 2022 and 2021, we granted 0.3 million, 0.3 million and 0.4 million PSUs, respectively, each with a weighted-average fair value of $62.31, $62.98 and $45.71, respectively.
Stock options are granted with an uninterrupted basisexercise price equal to the market value of a share of Class B common stock on the date of grant. Stock options have a term of ten years and generally vest over three years. During the years ended December 31, 2023, 2022 and 2021, we granted 0.2 million, 0.3 million and 0.3 million options, respectively, each with a weighted-average fair value of $13.38, $12.16 and $10.06, respectively.
Certain RSU and PSU awards, granted starting in 2020, entitle participants to receive dividends earned during the vesting period, subject to the performance, vesting and other conditions, including forfeiture, applicable to the respective awards.
The following table presents the pre-tax and after-tax share-based compensation expense.
| | | | | | | | | | | | | | | | | |
| | For the years ended |
| | December 31, 2023 | | December 31, 2022 | | December 31, 2021 |
| | (In millions) |
| Pre-tax share-based compensation expense | $ | 44.9 | | | $ | 33.6 | | | $ | 32.1 | |
| Tax benefit | (7.8) | | | (5.9) | | | (5.5) | |
| After-tax share-based compensation expense | $ | 37.1 | | | $ | 27.7 | | | $ | 26.6 | |
As of December 31, 2023, there was $54.0 million of total unrecognized compensation cost from all share-based compensation arrangements granted under the Incentive Compensation Plan related to unvested awards. This total compensation expense is expected to be recognized over a weighted-average period of 1.8 years.
The following table presents the activity for RSUs, DSUs and PSUs.
| | | | | | | | | | | | | | | | | | | | | | | |
| | RSUs and DSUs | | PSUs |
| | Units | | Weighted-average
grant date fair value per unit | | Units | | Weighted-average grant date fair value per unit |
| | (In millions, except per unit amounts) |
| Non-vested as of December 31, 2022 | 1.3 | | $49.07 | | 0.9 | | $53.54 |
| Granted | 0.5 | | $54.98 | | 0.3 | | $62.31 |
| Vested | (0.4) | | $49.29 | | — | | $— |
| Forfeited | (0.1) | | $49.06 | | (0.1) | | $56.29 |
| Adjustment for performance results achieved | — | | $— | | (0.2) | | $52.60 |
| Non-vested as of December 31, 2023 | 1.3 | | $51.26 | | 0.9 | | $56.75 |
The total intrinsic values of RSUs and DSUs vested during the years ended December 31, 2023, 2022 and 2021 were $22.0 million, $17.2 million and $12.7 million, respectively.
The following table presents the activity for stock options.
| | | | | | | | | | | | | | | | | | | | | | | |
| | Stock options |
| | Awards | | Weighted-
average
exercise price per unit | | Weighted-
average
remaining
contractual
life (years) | | Aggregate
intrinsic
value |
| (In millions, except per share amounts and years) |
| Outstanding as of December 31, 2022 | 1.5 | | $57.14 | | 6.6 | | $ | 2.1 | |
| Granted | 0.3 | | $53.75 | | | | |
| Exercised | (0.2) | | $50.37 | | | | |
| Forfeited | (0.1) | | $51.62 | | | | |
| | | | | | | |
| Outstanding as of December 31, 2023 | 1.5 | | $57.25 | | 6.1 | | $ | 11.7 | |
| Expected to vest as of December 31, 2023 | 0.5 | | $51.61 | | 8.4 | | $ | 4.7 | |
| Exercisable as of December 31, 2023 | 1.0 | | $59.87 | | 5.0 | | $ | 7.0 | |
The total intrinsic values of exercises during the years ended December 31, 2023, 2022 and 2021 were $2.2 million, $0.7 million and $0.9 million, respectively. Total tax benefits realized, including excess tax benefits, from share-based awards vested or exercised during the years ended December 31, 2023, 2022 and 2021 was $5.2 million, $2.9 million and $2.0 million, respectively.
The shares of Class B common stock to be issued under our equity plans are made available from authorized and unissued MCBC Class B common stock. As of December 31, 2023, there were 4.3 million shares of MCBC Class B common stock available for issuance under the Incentive Compensation Plan.
The fair value of each stock option granted during the years ended December 31, 2023, 2022 and 2021 was determined on the date of grant using the Black-Scholes option-pricing model with the following weighted-average assumptions:
| | | | | | | | | | | | | | | | | |
| | For the years ended |
| | December 31, 2023 | | December 31, 2022 | | December 31, 2021 |
| Risk-free interest rate | 4.05% | | 1.88% | | 0.79% |
| Dividend yield | 3.04% | | 2.86% | | 3.11% |
| Volatility range | 22.62% - 32.04% | | 30.91% - 33.85% | | 30.84% - 42.44% |
| Weighted-average volatility | 29.69% | | 31.65% | | 33.74% |
| Expected term (years) | 5.6 | | 5.7 | | 5.6 |
| Weighted-average fair value | $13.38 | | $12.16 | | $10.06 |
The risk-free interest rates utilized for periods throughout the contractual life of the stock options are based on a zero-coupon U.S. Department of Treasury security yield at the time of grant. Expected volatility is based on a combination of historical and implied volatility of our stock. The expected term of stock options is estimated based upon observations of historical employee option exercise patterns and trends of those employees granted options in the respective year.
The fair values of the market metric for each PSU granted during the years ended December 31, 2023, 2022 and 2021 and the performance metric for each PSU granted during the year ended December 31, 2021 were determined on the date of grant using a Monte Carlo model to simulate total stockholder return for MCBC and peer companies with the following weighted-average assumptions.
| | | | | | | | | | | | | | | | | |
| For the years ended |
| December 31, 2023 | | December 31, 2022 | | December 31, 2021 |
| Risk-free interest rate | 4.42% | | 1.58% | | 0.24% |
| Volatility range | 17.19% - 35.87% | | 22.65% - 45.30% | | 23.00% - 44.71% |
| Weighted-average volatility | 32.58% | | 35.93% | | 35.46% |
| Expected term (years) | 2.8 | | 2.8 | | 2.8 |
| Weighted-average fair market value | $62.31 | | $62.98 | | $45.71 |
The risk-free interest rates utilized for periods throughout the expected term of the PSUs are based on a zero-coupon U.S. Department of Treasury security yield at the time of grant. Expected volatility is based on historical volatility of our stock as well as the stock of our peer firms, as shown within the volatility range above, for a period upfrom the grant date consistent with the expected term. The expected term of PSUs is calculated based on the grant date to 5the end of the performance period. No dividend yield is utilized in the model as participants are entitled to dividends earned during the vesting period of each respective award.
17. Other Operating Income (Expense), net
We have recorded incurred charges or realized benefits that we believe are significant to our current operating results warranting separate classification in other operating income (expense), net.
| | | | | | | | | | | | | | | | | |
| | For the years ended |
| | December 31, 2023 | | December 31, 2022 | | December 31, 2021 |
| | (In millions) |
| Restructuring | | | | | |
| Employee-related charges | $ | (4.1) | | | $ | (6.0) | | | $ | (11.7) | |
Asset abandonment and other restructuring costs(1) | — | | | (3.1) | | | (25.9) | |
| | | | | |
Intangible and tangible asset impairments, excluding goodwill(2) | (160.8) | | | (36.3) | | | (13.5) | |
| | | | | |
Gains and (losses) on disposals and other(3) | 2.2 | | | 6.8 | | | 6.6 | |
| | | | | |
| Other operating income (expense), net | $ | (162.7) | | | $ | (38.6) | | | $ | (44.5) | |
(1)A significant portion of asset abandonment and other restructuring costs consists of accelerated depreciation, which is in excess of normal depreciation. There was no accelerated depreciation recorded to other operating income (expense), net for the years with early termination options at our discretion, while our new brewery in Longueuil, Québec was being constructed. Accordingly,ended December 31, 2023 and December 31, 2022 and $15.4 million recorded to other operating income (expense), net for the year ended December 31, 2019, we recorded operating lease right-of-use assets and liabilities of approximately CAD 6 million assuming a lease term that is coterminous with2021.
During the construction of our new brewery, which began operations during the fourth quarter of 2021. However, due to the uncertainty inherent in our estimates, the term of the brewery lease is subject to reassessment. Once the existing property has been entirely redeveloped by the purchaser, we plan to lease a minor portion of the future space for administrative and other purposes. We evaluated this transaction pursuant to the accounting guidance for sale and leaseback transactions and concluded that the relevant criteria were met for full gain recognition upon completion of the transaction in the second quarter of 2019.
Lease Financial Information
For the yearsyear ended December 31, 2021, we incurred accelerated depreciation related to the Montreal brewery closure and our Burtonwood and Japan locations.
(2)During the year ended December 31, 2020 and2023, we recognized a partial impairment charge of $160.7 million to our indefinite-lived intangible asset related to the Staropramen family ofbrands within our EMEA&APAC segment. The indefinite-lived intangible asset was measured at fair value primarily using a market approach with Level 3 inputs.
During the year ended December 31, 2019, lease expense (including immaterial short-term and variable lease costs) was as follows.
| | | | | | | | | | | | | | | | | |
| For the years ended |
| December 31, 2021 | | December 31, 2020 | | December 31, 2019 |
| (In millions) |
| Operating lease expense | $ | 73.2 | | | $ | 71.4 | | | $ | 71.0 | |
| Finance lease expense | 10.4 | | | 11.5 | | | 12.1 | |
| Total lease expense | $ | 83.6 | | | $ | 82.9 | | | $ | 83.1 | |
We recorded impairment losses on certain right-of-use assets, primarily2022, we identified a triggering event related to the former Truss joint venture asset group within our Denver, Colorado office lease, during 2020Americas segment and 2019 as discussedrecognized an impairment loss of $28.6 million, of which $12.1 million was attributable to the noncontrolling interest. The asset group was measured at fair value primarily using a market approach with Level 3 inputs.
During the year ended December 31, 2021, we recognized an impairment loss of $13.5 million related to the held for sale classification of the remaining portion of our India business.
The former Alton brewery site in the U.K. was divided into tranches with one tranche selling in the third quarter of 2021, resulting in a gain of $11.4 million and another tranche selling in the third quarter of 2022 resulting in a gain of $4.9 million.
18. Segment Reporting
Our reporting segments are based on the key geographic regions in which we operate and include the Americas and EMEA&APAC segments. Our Americas segment operates in the U.S., Canada and various countries in the Caribbean, Latin and South America and our EMEA&APAC segment operates in Bulgaria, Croatia, Czech Republic, Hungary, Montenegro, the Republic of Ireland, Romania, Serbia, the U.K., various other European countries and certain countries within the Middle East, Africa and Asia Pacific. We also have certain activity that is not allocated to our segments, which has been reflected as “Unallocated” below.
Reporting Segments
Americas
The Americas segment consists of our production, marketing and sales of our brands and other owned and licensed brands in the U.S., Canada and various countries in the Caribbean, Latin and South America. We have contract brewing agreements to brew, package, market, distribute and/or sell certain products in the Americas as well as joint venture arrangements in Canada to distribute and sell beer in Ontario and the western provinces of Canada.
EMEA&APAC
The EMEA&APAC segment consists of our production, marketing and sales of our primary brands as well as other owned and licensed brands in the U.K., Central Europe and various other European countries, along with certain countries within the Middle East, Africa and Asia Pacific.
Unallocated
"Unallocated" activity primarily includes financing-related costs such as interest expense and income, foreign exchange gains and losses on intercompany balances, realized and unrealized changes in fair value on instruments not designated in hedging relationships related to leasesfinancing and other treasury-related activities and the unrealized changes in fair value on our commodity swaps not designated in hedging relationships recorded within cost of goods sold, which are later reclassified when realized to the segment in which the underlying exposure resides. Additionally, only the service cost component of net periodic pension and OPEB cost is reported within each operating segment and all other components remain unallocated.
Summarized Financial Information
No single customer accounted for more than 10% of our consolidated net sales for the years ended December 31, 2021, December 31, 20202023, 2022 or 2021.
Consolidated net sales represent sales to third-party external customers less excise taxes. Inter-segment transactions impacting net sales and December 31, 2019 wasincome (loss) before income taxes eliminate upon consolidation and are primarily related to the Americas segment royalties received from, and sales to the EMEA&APAC segment.
The following tables present net sales, equity income (loss), interest expense, interest income and reconciliations of amounts shown as
follows. | | | | | | | | | | | | | | | | | |
| For the years ended |
| December 31, 2021 | | December 31, 2020 | | December 31, 2019 |
| (In millions) | | |
| Cash paid for amounts included in the measurements of lease liabilities: | | | | | |
| Operating cash flows from operating leases | $ | 56.8 | | | $ | 53.2 | | | $ | 52.2 | |
| Operating cash flows from finance leases | $ | 4.5 | | | $ | 7.6 | | | $ | 3.8 | |
| Financing cash flows from finance leases | $ | 3.6 | | | $ | 34.5 | | | $ | 2.8 | |
| Supplemental non-cash information on right-of-use assets obtained in exchange for new lease liabilities: | | | | | |
| Operating leases | $ | 34.0 | | | $ | 28.5 | | | $ | 45.6 | |
| Finance leases | $ | 7.5 | | | $ | 5.4 | | | $ | 9.2 | |
| | | | | | | | | | | | | | | | | | | | | | | | | | | | | |
| Year ended December 31, 2023 |
| | Americas | | EMEA&APAC | | Unallocated | | Inter-segment net sales eliminations | | Consolidated |
| | (In millions) |
| Net sales | $ | 9,425.2 | | | $ | 2,296.1 | | | $ | — | | | $ | (19.2) | | | $ | 11,702.1 | |
| Equity income (loss) | 12.0 | | | — | | | — | | | — | | | 12.0 | |
| Interest expense | (1.4) | | | (4.6) | | | (228.0) | | | — | | | (234.0) | |
| Interest income | 0.7 | | | 0.7 | | | 24.0 | | | — | | | 25.4 | |
| Income (loss) before income taxes | $ | 1,566.7 | | | $ | (41.1) | | | $ | (273.1) | | | $ | — | | | $ | 1,252.5 | |
| Income tax benefit (expense) | | | | | | | | | (296.1) | |
| Net income (loss) | | | | | | | | | 956.4 | |
| Net (income) loss attributable to noncontrolling interests | | | | | | | | | (7.5) | |
| Net income (loss) attributable to MCBC | | | | | | | | | $ | 948.9 | |
| | | | | | | | | | | | | | | | | | | | | | | | | | | | | |
| | Year ended December 31, 2022 |
| | Americas | | EMEA&APAC | | Unallocated | | Inter-segment net sales eliminations | | Consolidated |
| | (In millions) |
| Net sales | $ | 8,711.5 | | | $ | 2,005.2 | | | $ | — | | | $ | (15.7) | | | $ | 10,701.0 | |
| Equity income (loss) | 4.7 | | | — | | | — | | | — | | | 4.7 | |
| Interest expense | (1.5) | | | (5.1) | | | (244.0) | | | — | | | (250.6) | |
| Interest income | 0.2 | | | 0.2 | | | 3.9 | | | — | | | 4.3 | |
| Income (loss) before income taxes | $ | 312.9 | | | $ | 61.0 | | | $ | (436.4) | | | $ | — | | | $ | (62.5) | |
| Income tax benefit (expense) | | | | | | | | | (124.0) | |
| Net income (loss) | | | | | | | | | (186.5) | |
| Net (income) loss attributable to noncontrolling interests | | | | | | | | | 11.2 | |
| Net income (loss) attributable to MCBC | | | | | | | | | $ | (175.3) | |
| | | | | | | | | | | | | | | | | | | | | | | | | | | | | |
| | Year ended December 31, 2021 |
| | Americas | | EMEA&APAC | | Unallocated | | Inter-segment net sales eliminations | | Consolidated |
| | (In millions) |
| Net sales | $ | 8,485.0 | | | $ | 1,802.3 | | | $ | — | | | $ | (7.6) | | | $ | 10,279.7 | |
| | | | | | | | | |
| Interest expense | (1.4) | | | (5.8) | | | (253.1) | | | — | | | (260.3) | |
| Interest income | — | | | 0.2 | | | 1.8 | | | — | | | 2.0 | |
| Income (loss) before income taxes | $ | 1,176.5 | | | $ | 32.9 | | | $ | 29.6 | | | $ | — | | | $ | 1,239.0 | |
| Income tax benefit (expense) | | | | | | | | | (230.5) | |
| Net income (loss) | | | | | | | | | 1,008.5 | |
| Net (income) loss attributable to noncontrolling interests | | | | | | | | | (2.8) | |
| Net income (loss) attributable to MCBC | | | | | | | | | $ | 1,005.7 | |
The following table presents total assets and select cash flow information by segment.
| | | | | | | | | | | | | | | | | | | | | | | | | | | | | | | | | | | | | | | | | | | | | | | |
| Assets | | Depreciation and amortization | | Capital expenditures |
| | As of December 31, | | For the years ended December 31, | | For the years ended December 31, |
| | 2023 | | 2022 | | 2023 | | 2022 | | 2021 | | 2023 | | 2022 | | 2021 |
| | (In millions) |
| Americas | $ | 22,753.8 | | | $ | 22,242.7 | | | $ | 514.4 | | | $ | 526.9 | | | $ | 601.4 | | | $ | 525.8 | | | $ | 483.5 | | | $ | 405.0 | |
| EMEA&APAC | 3,621.3 | | | 3,625.6 | | | 168.4 | | | 157.9 | | | 184.7 | | | 145.7 | | | 177.9 | | | 117.6 | |
| Consolidated | $ | 26,375.1 | | | $ | 25,868.3 | | | $ | 682.8 | | | $ | 684.8 | | | $ | 786.1 | | | $ | 671.5 | | | $ | 661.4 | | | $ | 522.6 | |
The following table presents net sales by geography, based on the location of the customer.
| | | | | | | | | | | | | | | | | |
| | For the years ended |
| | December 31, 2023 | | December 31, 2022 | | December 31, 2021 |
| | (In millions) |
| Net sales to unaffiliated customers | | | | | |
| United States and its territories | $ | 8,059.6 | | | $ | 7,405.6 | | | $ | 7,168.7 | |
| Canada | 1,224.0 | | | 1,165.3 | | | 1,188.4 | |
| United Kingdom | 1,313.7 | | | 1,166.3 | | | 959.1 | |
Other countries(1) | 1,104.8 | | | 963.8 | | | 963.5 | |
| Consolidated net sales | $ | 11,702.1 | | | $ | 10,701.0 | | | $ | 10,279.7 | |
Supplemental balance sheet information related to leases as(1)Reflects net sales within certain countries in Europe, Latin America, South America, the Middle East, Africa and Asia. No individual country within the other countries line has total net sales exceeding 10% of December 31, 2021 and December 31, 2020 was as follows:total consolidated net sales. | | | | | | | | | | | | | | |
| | As of |
| | December 31, 2021 | | December 31, 2020 |
| Balance Sheet Classification | (In millions) |
| Operating Leases | | | | |
| Operating lease right-of-use assets | Other assets | $ | 119.1 | | | $ | 136.2 | |
| Current operating lease liabilities | Accounts payable and other current liabilities | $ | 45.4 | | | $ | 47.1 | |
| Non-current operating lease liabilities | Other liabilities | 87.8 | | | 106.4 | |
| Total operating lease liabilities | | $ | 133.2 | | | $ | 153.5 | |
| | | | |
| Finance Leases | | | | |
| Finance lease right-of-use assets | Properties, net | $ | 61.5 | | | $ | 60.5 | |
| Current finance lease liabilities | Current portion of long-term debt and short-term borrowings | $ | 4.6 | | | $ | 4.1 | |
| Non-current finance lease liabilities | Long-term debt | 62.6 | | | 59.9 | |
| Total finance lease liabilities | | $ | 67.2 | | | $ | 64.0 | |
The weighted-average remaining lease termfollowing table presents property, plant and discount rate asequipment, net and operating ROU assets by geographic location. See Note 8, "Leases" for further information on our operating ROU assets and Note 5, "Property, Plant and Equipment" for further information on our net property, plant and equipment. | | | | | | | | | | | |
| | As of |
| | December 31, 2023 | | December 31, 2022 |
| | (In millions) |
| Property, plant and equipment, net and operating ROU assets | | | |
| United States and its territories | $ | 2,720.2 | | | $ | 2,444.6 | |
| Canada | 1,002.9 | | | 1,050.6 | |
| United Kingdom | 414.1 | | | 365.4 | |
Other countries(1) | 508.0 | | | 494.9 | |
| Consolidated property, plant and equipment, net and operating ROU assets | $ | 4,645.2 | | | $ | 4,355.5 | |
(1)Reflects property, plant and equipment, net and operating ROU assets within certain countries in Europe, Latin America, South America, Africa and Asia. No individual country within the other countries line has total property, plant and equipment, net or operating ROU assets exceeding 10% of December 31, 2021 are as follows:total consolidated property, plant and equipment, net or operating ROU assets, respectively. | | | | | | | | | | | |
| Weighted-Average Remaining Lease Term (Years) | | Weighted-Average Discount Rate |
| Operating leases | 4.1 | | 3.5% |
| Finance leases | 11.9 | | 6.5% |
Based on foreign exchange rates as of December 31, 2021, maturities of lease liabilities were as follows:
| | | | | | | | | | | |
| Operating Leases | | Finance Leases |
| (In millions) |
| 2022 | $ | 49.8 | | | $ | 8.4 | |
| 2023 | 37.0 | | | 8.1 | |
| 2024 | 22.2 | | | 8.2 | |
| 2025 | 14.7 | | | 7.8 | |
| 2026 | 10.6 | | | 11.6 | |
| Thereafter | 9.6 | | | 54.4 | |
| Total lease payments | $ | 143.9 | | | $ | 98.5 | |
| Less: interest | (10.7) | | | (31.3) | |
| Present value of lease liabilities | $ | 133.2 | | | $ | 67.2 | |
Executed leases that have not yet commenced as of December 31, 2021 are immaterial except for a railcar lease with total undiscounted payments of $27.7 million expected to commence in 2022.
ITEM 9. CHANGES IN AND DISAGREEMENTS WITH ACCOUNTANTS ON ACCOUNTING AND FINANCIAL DISCLOSURE
None.
ITEM 9A. CONTROLS AND PROCEDURES
Evaluation of Disclosure Controls and Procedures
Under the supervision and with the participation of our management, including our Chief Executive Officer and Chief Financial Officer, we conducted an evaluation of our disclosure controls and procedures as such term is defined under Rule 13a-15(e) under the Exchange Act. Based on this evaluation, our Chief Executive Officer and Chief Financial Officer concluded that our disclosure controls and procedures were effective as of December 31, 20212023 to provide reasonable assurance that information required to be disclosed in our reports that we file or submit under the Exchange Act is recorded, processed, summarized and reported within the time periods specified in the SEC rules and forms and that such information is accumulated and communicated to our management, including our Chief Executive Officer and Chief Financial Officer, as appropriate, to allow timely decisions regarding required disclosure. Management necessarily applies its judgment in assessing the costs and benefits of such disclosure controls and procedures that, by their nature, can only provide reasonable assurance regarding management's control objectives. Also, we have investments in certain unconsolidated entities that we do not control or manage.
Management's Annual Report on Internal Control over Financial Reporting
Our management is responsible for establishing and maintaining adequate internal control over financial reporting as such term is defined in Exchange Act Rule 13a-15(f). Our internal control over financial reporting is a process designed to provide reasonable assurance regarding the reliability of financial reporting and the preparation of financial statements for external purposes in accordance with U.S. GAAP. A company's internal control over financial reporting includes those policies and procedures that (i) pertain to the maintenance of records that, in reasonable detail, accurately and fairly reflect the transactions and dispositions of the assets of the company; (ii) provide reasonable assurance that transactions are recorded as necessary to permit preparation of financial statements in accordance with U.S. GAAP, and that receipts and expenditures of the company are being made only in accordance with authorizations of management and directors of the company; and (iii) provide reasonable assurance regarding prevention or timely detection of unauthorized acquisition, use, or disposition of the company's assets that could have a material effect on the financial statements.
Because of its inherent limitations, internal control over financial reporting may not prevent or detect misstatements. Also, projections of any evaluation of effectiveness to future periods are subject to the risk that controls may become inadequate because of changes in conditions, or that the degree of compliance with the policies or procedures may deteriorate.
Our Chief Executive Officer and our Chief Financial Officer, with assistance from other members of management, assessed the effectiveness of our internal control over financial reporting as of December 31, 2021,2023, based on the framework and criteria established in Internal Control—Integrated Framework (2013 Framework), issued by the Committee of Sponsoring Organizations of the Treadway Commission. Based on its evaluation, management has concluded that our internal control over financial reporting was effective as of December 31, 2021.2023.
An independent registered public accounting firm, PricewaterhouseCoopers LLP, has audited the effectiveness of our internal control over financial reporting as of December 31, 2021,2023, as stated in their report which appears in Part II—Item 8 Financial Statements and Supplementary Data.
Changes in Internal Control over Financial Reporting
There were no changes in our internal control over financial reporting (as defined in Exchange Act Rule 13a-15(f)) during the quarter ended December 31, 2021,2023, that have materially affected, or are reasonably likely to materially affect, our internal control over financial reporting.
ITEM 9B. OTHER INFORMATION
None.During the three months ended December 31, 2023, no directors or officers adopted or terminated a "Rule 10b5-1 trading arrangement" or a "non-Rule 10b5-1 trading arrangement", as each term is defined in Item 408(a) of Regulation S-K.
ITEM 9C. DISCLOSURES REGARDING FOREIGN JURISDICTIONS THAT PREVENT INSPECTION
None.
PART III
ITEM 10. DIRECTORS, EXECUTIVE OFFICERS AND CORPORATE GOVERNANCE
Incorporated by reference to our definitive proxy statement for our 20222024 annual meeting of stockholders, which will be filed no later than 120 days after December 31, 2021.2023.
ITEM 11. EXECUTIVE COMPENSATION
Incorporated by reference to our definitive proxy statement for our 20222024 annual meeting of stockholders, which will be filed no later than 120 days after December 31, 2021.2023.
ITEM 12. SECURITY OWNERSHIP OF CERTAIN BENEFICIAL OWNERS AND MANAGEMENT AND RELATED STOCKHOLDER MATTERS
Incorporated by reference to our definitive proxy statement for our 20222024 annual meeting of stockholders, which will be filed no later than 120 days after December 31, 2021.2023.
Equity Compensation Plan Information
The following table summarizes information about the Incentive Compensation Plan as of December 31, 2021.2023. All outstanding awards shown in the table below relate to our Class B common stock.
| | Plan category | Plan category | Number of securities to be
issued upon exercise of
outstanding options,
warrants and rights (Column A) | | Weighted-average
exercise price of
outstanding options,
warrants and rights | | Number of securities remaining available for future issuance under equity compensation plans (excluding securities reflected in column A) | Plan category | Number of securities to be
issued upon exercise of
outstanding options,
warrants and rights (Column A) | | Weighted-average
exercise price of
outstanding options,
warrants and rights | | Number of securities remaining available for future issuance under equity compensation plans (excluding securities reflected in column A) |
Equity compensation plans approved by security holders(1) | Equity compensation plans approved by security holders(1) | 4,107,607 | | $63.15 | | 4,951,399 | Equity compensation plans approved by security holders(1) | 3,697,498 | | $57.25 | | 4,325,695 |
| Equity compensation plans not approved by security holders | Equity compensation plans not approved by security holders | — | | N/A | | — | Equity compensation plans not approved by security holders | — | | N/A | | — |
| Total | Total | 4,107,607 | | $63.15 | | 4,951,399 | Total | 3,697,498 | | $57.25 | | 4,325,695 |
(1)Under the Incentive Compensation Plan, we may issue RSUs, DSUs, PSUs and stock options. The number of securities to be issued upon exercise of outstanding awards includes 1,326,7861,279,121 RSUs and DSUs, 867,721880,125 PSUs (assuming the target award is met) and 1,913,1001,538,252 options outstanding as of December 31, 2021.2023. See Part II—Item 8 Financial Statements and Supplementary Data, Note 13,16, "Share-Based Payments" for further discussion. Outstanding RSUs, DSUs
and PSUs do not have exercise prices and therefore have been disregarded for purposes of calculating the weighted-average exercise price.
ITEM 13. CERTAIN RELATIONSHIPS AND RELATED TRANSACTIONS, AND DIRECTOR INDEPENDENCE
Incorporated by reference to our definitive proxy statement for our 20222024 annual meeting of stockholders, which will be filed no later than 120 days after December 31, 2021.2023.
ITEM 14. PRINCIPAL ACCOUNTANT FEES AND SERVICES
Incorporated by reference to our definitive proxy statement for our 20222024 annual meeting of stockholders, which will be filed no later than 120 days after December 31, 2021.
PART IV
ITEM 15. EXHIBITS, FINANCIAL STATEMENT SCHEDULES
(a)Financial Statements, Financial Statement Schedules and Exhibits
The following are filed or incorporated by reference as a part of this Annual Report on Form 10-K:
(1)Management's Report
Report of Independent Registered Public Accounting Firm
Consolidated Statements of Operations for the years ended December 31, 2021,2023, December 31, 20202022 and December 31, 20192021
Consolidated Statements of Comprehensive Income (Loss) for the years ended December 31, 2021,2023, December 31, 20202022 and December 31, 20192021
Consolidated Balance Sheets as of December 31, 20212023 and December 31, 20202022
Consolidated Statements of Cash Flows for the years ended December 31, 2021,2023, December 31, 20202022 and December 31, 20192021
Consolidated Statements of Stockholders' Equity and Noncontrolling Interests for the years ended December 31, 2021,2023, December 31, 20202022 and December 31, 20192021
Notes to Consolidated Financial Statements
(2)Schedule II—Valuation and Qualifying Accounts for the years ended December 31, 2021,2023, December 31, 20202022 and December 31, 20192021
(3)Exhibit list
| | | | | | | | | | | | | | | | | | | | | | | | | | | | | | | | | | | |
| | | | | Incorporated by Reference | | Filed Herewith |
| Exhibit Number | | | Document Description | | Form | | Exhibit | | Filing Date | | |
| 3.1 | | | | | 10-K | | 3.1 | | February 12, 2020 | | |
| 3.2 | | | | | 8-K | | 3.2 | | January 2, 2020 | | |
| 4.1.1 | | | | | 10-K | | 4.1.1 | | February 12, 2020 | | |
| 4.1.2 | | | | | 10-K | | 4.1.2 | | February 12, 2020 | | |
| 4.2.1 | | | | | 8-K | | 4.1 | | May 3, 2012 | | |
| 4.2.2 | | | | | 8-K | | 4.2 | | May 3, 2012 | | |
| 4.2.3 | | | | | 10-Q | | 4.8 | | August 8, 2012 | | |
| 4.2.4 | | | | | 8-K | | 4.3 | | June 28, 2016 | | |
| | | | | | | | | | | | | | | | | | | | | | | | | | | | | | | | | | | |
| | | | | Incorporated by Reference | | Filed/Furnished Herewith |
| Exhibit Number | | | Document Description | | Form | | Exhibit | | Filing Date | | |
| 3.1 | | | | | 10-K | | 3.1 | | February 12, 2020 | | |
| 3.2 | | | | | 8-K | | 3.1 | | May 23, 2022 | | |
| 4.1.1 | | | | | 10-K | | 4.1.1 | | February 12, 2020 | | |
| 4.1.2 | | | | | 10-K | | 4.1.2 | | February 12, 2020 | | |
| 4.2.1 | | | | | 8-K | | 4.1 | | May 3, 2012 | | |
| 4.2.2 | | | | | 8-K | | 4.2 | | May 3, 2012 | | |
| | | | | | | | | | | | | | | | | | | | | | | | | | | | | | | | | | | |
| | | | | Incorporated by Reference | | Filed Herewith |
| Exhibit Number | | | Document Description | | Form | | Exhibit | | Filing Date | | |
| 4.2.5 | | |
| | 10-Q | | 4.9 | | November 1, 2016 | | |
| 4.2.6 | | |
| | 10-Q | | 4.10 | | November 1, 2016 | | |
| 4.2.7 | | | | | 10-K | | 4.2.7 | | February 14, 2017 | | |
| 4.2.8 | | |
| | 10-K | | 4.1.8 | | February 14, 2018 | | |
| 4.2.8 | | | | | 10-Q | | 4.1 | | October 29, 2020 | | |
| 4.3 | | | | | 8-K | | 4.2 | | May 3, 2012 | | |
| 4.4 | | | | | 8-K | | 4.2 | | May 3, 2012 | | |
| 4.5 | | | Registration Rights Agreement, dated as of February 9, 2005, by and among Adolph Coors Company, Pentland Securities (1981) Inc., 4280661 Canada Inc., Nooya Investments Ltd., Lincolnshire Holdings Limited, 4198832 Canada Inc., BAX Investments Limited, 6339522 Canada Inc., Barleycorn Investments Ltd., DJS Holdings Ltd., 6339549 Canada Inc., Hoopoe Holdings Ltd., 6339603 Canada Inc., and The Adolph Coors, Jr. Trust dated September 12, 1969. | | 8-K | | 99.2 | | February 15, 2005 | | |
| 4.6.1 | | | | | 8-K | | 4.1 | | July 7, 2016 | | |
| 4.6.2 | | | | | 8-K | | 4.2 | | July 7, 2016 | | |
| 4.6.3 | | | | | 8-K | | 4.3 | | July 7, 2016 | | |
| 4.6.4 | | |
| | 10-Q | | 4.14 | | November 1, 2016 | | |
| 4.6.5 | | |
| | 10-Q | | 4.15 | | November 1, 2016 | | |
| | | | | | | | | | | | | | | | | | | | | | | | | | | | | | | | | | | |
| | | | | Incorporated by Reference | | Filed/Furnished Herewith |
| Exhibit Number | | | Document Description | | Form | | Exhibit | | Filing Date | | |
| 4.2.3 | | | | | 10-Q | | 4.8 | | August 8, 2012 | | |
| 4.2.4 | | | | | 8-K | | 4.3 | | June 28, 2016 | | |
| 4.2.5 | | |
| | 10-Q | | 4.9 | | November 1, 2016 | | |
| 4.2.6 | | |
| | 10-Q | | 4.10 | | November 1, 2016 | | |
| 4.2.7 | | | | | 10-K | | 4.2.7 | | February 14, 2017 | | |
| 4.2.8 | | |
| | 10-K | | 4.1.8 | | February 14, 2018 | | |
| 4.2.9 | | | | | 10-Q | | 4.1 | | October 29, 2020 | | |
| 4.3 | | | | | 8-K | | 4.2 | | May 3, 2012 | | |
| 4.4 | | | Registration Rights Agreement, dated as of February 9, 2005, by and among Adolph Coors Company, Pentland Securities (1981) Inc., 4280661 Canada Inc., Nooya Investments Ltd., Lincolnshire Holdings Limited, 4198832 Canada Inc., BAX Investments Limited, 6339522 Canada Inc., Barleycorn Investments Ltd., DJS Holdings Ltd., 6339549 Canada Inc., Hoopoe Holdings Ltd., 6339603 Canada Inc., and The Adolph Coors, Jr. Trust dated September 12, 1969. | | 8-K | | 99.2 | | February 15, 2005 | | |
| 4.5.1 | | | | | 8-K | | 4.1 | | July 7, 2016 | | |
| 4.5.2 | | | | | 8-K | | 4.2 | | July 7, 2016 | | |
| 4.5.3 | | | | | 8-K | | 4.3 | | July 7, 2016 | | |
| | | | | | | | | | | | | | | | | | | | | | | | | | | | | | | | | | | |
| | | | | Incorporated by Reference | | Filed Herewith |
| Exhibit Number | | | Document Description | | Form | | Exhibit | | Filing Date | | |
| 4.6.6 | | | | | 10-K | | 4.5.6 | | February 14, 2017 | | |
| 4.6.7 | | | | | 10-K | | 4.8.7 | | February 14, 2018 | | |
| 4.6.8 | | | | | 10-Q | | 4.3 | | October 29, 2020 | | |
| 4.7 | | | | | 8-K | | 4.2 | | July 7, 2016 | | |
| 4.8 | | | | | 8-K | | 4.3 | | July 7, 2016 | | |
| 4.9 | | | | | 8-K | | 4.3 | | July 7, 2016 | | |
| 4.10.1 | | | | | 8-K | | 4.9 | | July 7, 2016 | | |
| 4.10.2 | | | | | 8-K | | 4.10 | | July 7, 2016 | | |
| 4.10.3 | | |
| | 10-Q | | 4.7 | | November 1, 2016 | | |
| 4.10.4 | | |
| | 10-Q | | 4.8 | | November 1, 2016 | | |
| 4.10.5 | | | | | 10-K | | 4.11.5 | | February 14, 2017 | | |
| 4.10.6 | | | | | 10-K | | 4.14.6 | | February 14, 2018 | | |
| 4.10.7 | | | | | 10-Q | | 4.4 | | October 29, 2020 | | |
| 4.11 | | | | | 8-K | | 4.10 | | July 7, 2016 | | |
| 4.12 | | | | | 8-K | | 4.10 | | July 7, 2016 | | |
| 4.13 | | |
| | 10-K | | 4.18 | | February 12, 2020 | | |
| 10.1 | * | | | | 10-Q | | 10.7 | | August 8, 2012 | | |
| | | | | | | | | | | | | | | | | | | | | | | | | | | | | | | | | | | |
| | | | | Incorporated by Reference | | Filed/Furnished Herewith |
| Exhibit Number | | | Document Description | | Form | | Exhibit | | Filing Date | | |
| 4.5.4 | | |
| | 10-Q | | 4.14 | | November 1, 2016 | | |
| 4.5.5 | | |
| | 10-Q | | 4.15 | | November 1, 2016 | | |
| 4.5.6 | | | | | 10-K | | 4.5.6 | | February 14, 2017 | | |
| 4.5.7 | | | | | 10-K | | 4.8.7 | | February 14, 2018 | | |
| 4.5.8 | | | | | 10-Q | | 4.3 | | October 29, 2020 | | |
| 4.6 | | | | | 8-K | | 4.2 | | July 7, 2016 | | |
| 4.7 | | | | | 8-K | | 4.3 | | July 7, 2016 | | |
| 4.8 | | | | | 8-K | | 4.3 | | July 7, 2016 | | |
| 4.9.1 | | | | | 8-K | | 4.9 | | July 7, 2016 | | |
| 4.9.2 | | | | | 8-K | | 4.10 | | July 7, 2016 | | |
| 4.9.3 | | |
| | 10-Q | | 4.7 | | November 1, 2016 | | |
| 4.9.4 | | |
| | 10-Q | | 4.8 | | November 1, 2016 | | |
| 4.9.5 | | | | | 10-K | | 4.11.5 | | February 14, 2017 | | |
| 4.9.6 | | | | | 10-K | | 4.14.6 | | February 14, 2018 | | |
| | | | | | | | | | | | | | | | | | | | | | | | | | | | | | | | | | | |
| | | | | Incorporated by Reference | | Filed Herewith |
| Exhibit Number | | | Document Description | | Form | | Exhibit | | Filing Date | | |
| 10.2.1 | * | | | | 8-K | | 10.1 | | May 28, 2021 | | |
| 10.2.2 | * | |
| | 10-K | | 10.2.2 | | February 14, 2017 | | |
| 10.2.3 | * | |
| | 10-K | | 10.2.3 | | February 14, 2017 | | |
| 10.2.4 | * | |
| | 10-K | | 10.2.4 | | February 14, 2017 | | |
| 10.2.5 | * | | | | 10-Q | | 10.6 | | November 7, 2008 | | |
| 10.2.6 | * | | | | 10-K | | 10.7.8 | | February 12, 2015 | | |
| 10.2.7 | * | | | | | | | | | | X |
| 10.2.8 | * | | | | | | | | | | X |
| 10.2.9 | * | | | | | | | | | | X |
| 10.2.10 | * | | | | | | | | | | X |
| 10.2.11 | * | | | | | | | | | | X |
| 10.3 | * | | | | 10-Q | | 10.7 | | May 11, 2005 | | |
| 10.4 | * | | | | 8-K | | 10.1 | | July 24, 2019 | | |
| 10.5.1 | | | Credit Agreement, dated as of July 7, 2017, by and among Molson Coors Brewing Company, the borrowing subsidiaries party thereto, CitiBank, N.A., as administrative agent and a U.S. issuing bank, Bank of America, N.A., as a U.S. issuing bank, The Bank of Tokyo Mitsubishi UFJ, LTD. as a U.S. issuing bank, Citigroup Global Markets, Inc., Merrill Lynch, Pierce, Fenner & Smith Incorporated, and The Bank of Tokyo Mitsubishi UFJ, Ltd. as joint lead arrangers and joint bookrunners, and Bank of America, N.A. and The Bank of Tokyo Mitsubishi UFJ, Ltd. as Co-Syndication Agents. | | 8-K | | 10.1 | | July 13, 2017 | | |
| | | | | | | | | | | | | | | | | | | | | | | | | | | | | | | | | | | |
| | | | | Incorporated by Reference | | Filed/Furnished Herewith |
| Exhibit Number | | | Document Description | | Form | | Exhibit | | Filing Date | | |
| 4.9.7 | | | | | 10-Q | | 4.4 | | October 29, 2020 | | |
| 4.10 | | | | | 8-K | | 4.10 | | July 7, 2016 | | |
| 4.11 | | |
| | 10-K | | 4.18 | | February 12, 2020 | | |
| 10.1 | * | | | | 10-Q | | 10.7 | | August 8, 2012 | | |
| 10.2.1 | * | | | | 8-K | | 10.1 | | May 28, 2021 | | |
| 10.2.2 | * | |
| | 10-K | | 10.2.2 | | February 14, 2017 | | |
| 10.2.3 | * | |
| | 10-K | | 10.2.3 | | February 14, 2017 | | |
| 10.2.4 | * | |
| | 10-K | | 10.2.4 | | February 14, 2017 | | |
| 10.2.5 | * | | | | 10-Q | | 10.6 | | November 7, 2008 | | |
| 10.2.6 | * | | | | 10-K | | 10.7.8 | | February 12, 2015 | | |
| 10.2.7 | * | | | | 10-K | | 10.2.7 | | February 23, 2022 | | |
| 10.2.8 | * | | | | 10-Q | | 10.6 | | May 2, 2023 | | |
| 10.2.9 | * | | | | 10-K | | 10.2.9 | | February 23, 2022 | | |
| 10.2.10 | * | | | | 10-K | | 10.2.10 | | February 23, 2022 | | |
| 10.2.11 | * | | | | 10-K | | 10.2.11 | | February 23, 2022 | | |
| 10.2.12 | * | | | | 10-Q | | 10.1 | | May 3, 2022 | | |
| | | | | | | | | | | | | | | | | | | | | | | | | | | | | | | | | | | |
| | | | | Incorporated by Reference | | Filed Herewith |
| Exhibit Number | | | Document Description | | Form | | Exhibit | | Filing Date | | |
| 10.5.2 | | | Amendment No. 1 and Extension Agreement, dated as of July 19, 2018, by and among Molson Coors Brewing Company, Molson Coors Brewing Company (UK) Limited, Molson Canada 2005, Molson Coors Canada Inc. and Molson Coors International LP, the lenders party thereto, and Citibank, N.A., as administrative agent.
| | 8-K | | 10.1 | | July 19, 2018 | | |
| 10.5.3 | | | | | 8-K | | 10.1 | | July 8, 2019 | | |
| 10.5.4 | | | Amendment No. 2, dated as of June 19, 2020, by and among Molson Coors Beverage Company, Molson Coors Brewing Company (UK) Limited, Molson Canada 2005, Molson Coors Canada Inc. and Molson Coors International LP, the lenders party thereto, and Citibank, N.A., as administrative agent. | | 8-K | | 10.1 | | June 22, 2020 | | |
| 10.5.5 | | | Amendment No. 3 to the Credit Agreement, dated as of October 5, 2021, by and among Molson Coors Beverage Company, Molson Coors Brewing Company (UK) Limited, Molson Canada 2005, Molson Coors Canada, Inc., Molson Coors International LP and Citibank, N.A., as administrative agent. | | 8-K | | 10.1 | | October 7, 2021 | | |
| 10.5.6 | | | | | 8-K | | 10.2 | | July 13, 2017 | | |
| 10.5.7 | | | Supplement No. 1, dated as of January 11, 2018, to the Subsidiary Guarantee Agreement, dated July 7, 2017, by and among Molson Coors Brewing Company, the subsidiaries named on Schedule I thereto, and Citibank, N.A., as administrative agent. | | 10-K | | 10.8.3 | | February 14, 2018 | | |
| 10.5 .8 | | | Supplement No. 2, dated as of January 14, 2019, to the Subsidiary Guarantee Agreement, dated July 7, 2017, by and among Molson Coors Brewing Company, the subsidiaries named on Schedule I thereto, and Citibank, N.A., as administrative agent. | | 10-K | | 10.7.5 | | February 12, 2019 | | |
| 10.5.9 | | | | | 10-Q | | 10.1 | | October 29, 2020 | | |
| 10.6 | | | | | 8-K | | 10.3 | | July 13, 2017 | | |
| 10.7.1 | | | | | 8-K | | 10.1 | | May 26, 2020 | | |
| 10.7.2 | | | | | 8-K | | 10.2 | | May 26, 2020 | | |
| 10.8 | * | | | | 8-K | | 10.1 | | November 25, 2016 | | |
| 10.9 | * | | | | 8-K | | 10.1 | | May 25, 2018 | | |
| 10.10 | * | | | | 10-Q | | 10.2 | | July 29, 2021 | | |
| 10.11 | * | | | | 10-Q | | 10.2 | | May 1, 2019 | | |
| | | | | | | | | | | | | | | | | | | | | | | | | | | | | | | | | | | |
| | | | | Incorporated by Reference | | Filed/Furnished Herewith |
| Exhibit Number | | | Document Description | | Form | | Exhibit | | Filing Date | | |
| 10.2.13 | * | | | | 10-Q | | 10.2 | | May 3, 2022 | | |
| 10.2.14 | * | | | | 10-Q | | 10.3 | | May 3, 2022 | | |
| 10.2.15 | * | | | | 10-Q | | 10.6 | | May 2, 2023 | | |
| 10.2.16 | * | | | | 10-Q | | 10.2 | | May 2, 2023 | | |
| 10.3 | * | | | | 10-Q | | 10.7 | | May 11, 2005 | | |
| 10.4 | * | | | | 8-K | | 10.1 | | May 25, 2018 | | |
| 10.5 | * | | | | 8-K | | 10.1 | | July 24, 2019 | | |
| 10.6 | * | | | | 8-K | | 10.1 | | November 25, 2016 | | |
| 10.7 | * | |
| | 8-K | | 10.1 | | July 31, 2019 | | |
| 10.8 | * | | | | 8-K | | 10.1 | | February 28, 2023 | | |
| 10.9.1 | * | | | | 10-Q | | 10.3 | | May 2, 2023 | | |
| 10.9.2 | * | | | | 8-K | | 10.1 | | April 6, 2023 | | |
| 10.9.3 | * | | | | 8-K | | 10.2 | | April 6, 2023 | | |
| 10.10.1 | ** | | Amended and Restated Credit Agreement, dated June 26, 2023, by and among Molson Coors Beverage Company, Molson Coors Brewing Company (UK) Limited, Molson Canada 2005, Molson Coors Canada Inc., Molson Coors International LP, the lenders party thereto, and Citibank, N.A., as administrative agent. | | 8-K | | 10.1 | | June 28, 2023 | | |
| 10.10.2 | ** | | Amended and Restated Subsidiary Guarantee Agreement, dated June 26, 2023, by and among Molson Coors Beverage Company, Molson Coors Brewing Company (UK) Limited, Molson Canada 2005, Molson Coors Canada Inc., Molson Coors International LP, each subsidiary listed on Schedule I thereto, and Citibank, N.A., as administrative agent. | | 8-K | | 10.2 | | June 28, 2023 | | |
| 10.11 | | | | | 8-K | | 10.3 | | July 13, 2017 | | |
| 10.12 | | | | | 10-K | | 10.12 | | February 21, 2023 | | |
| 21 | | | | | | | | | | | X |
| 22 | | | | | | | | | | | X |
| | | | | | | | | | | | | | | | | | | | | | | | | | | | | | | | | | | |
| | | | | Incorporated by Reference | | Filed Herewith |
| Exhibit Number | | | Document Description | | Form | | Exhibit | | Filing Date | | |
| 10.12 | * | |
| | 8-K | | 10.1 | | July 31, 2019 | | |
| 10.13 | * | |
| | 10-Q | | 10.2 | | April 30, 2020 | | |
| 10.14 | * | | | | 10-Q | | 10.3 | | April 30, 2020 | | |
| 10.15 | | | | | 10-Q | | 10.1 | | April 30, 2020 | | |
| 21 | | | | | | | | | | | X |
| 22 | | | | | | | | | | | X |
| 23.1 | | | | | | | | | | | X |
| 31.1 | | | | | | | | | | | X |
| 31.2 | | | | | | | | | | | X |
| 32 | | | | | | | | | | | X |
| 101.INS | ** | | XBRL Instance Document - the instance document does not appear in the Interactive Data File because its XBRL tags are embedded within the Inline XBRL document** | | | | | | | | X |
| 101.SCH | ** | | XBRL Taxonomy Extension Schema Document | | | | | | | | X |
| 101.CAL | ** | | XBRL Taxonomy Extension Calculation Linkbase Document | | | | | | | | X |
| 101.DEF | ** | | XBRL Taxonomy Extension Definition Linkbase Document | | | | | | | | X |
| 101.LAB | ** | | XBRL Taxonomy Extension Label Linkbase Document | | | | | | | | X |
| 101.PRE | ** | | XBRL Taxonomy Extension Presentation Linkbase Document | | | | | | | | X |
| | | | | | | | | | | | | | | | | | | | | | | | | | | | | | | | | | | |
| | | | | Incorporated by Reference | | Filed/Furnished Herewith |
| Exhibit Number | | | Document Description | | Form | | Exhibit | | Filing Date | | |
| 23 | | | | | | | | | | | X |
| 31.1 | | | | | | | | | | | X |
| 31.2 | | | | | | | | | | | X |
| 32 | | | | | | | | | | | XX |
| 97 | * | | | | | | | | | | X |
| 101.INS | *** | | XBRL Instance Document - the instance document does not appear in the Interactive Data File because its XBRL tags are embedded within the Inline XBRL document | | | | | | | | X |
| 101.SCH | *** | | XBRL Taxonomy Extension Schema Document | | | | | | | | X |
| 101.CAL | *** | | XBRL Taxonomy Extension Calculation Linkbase Document | | | | | | | | X |
| 101.DEF | *** | | XBRL Taxonomy Extension Definition Linkbase Document | | | | | | | | X |
| 101.LAB | *** | | XBRL Taxonomy Extension Label Linkbase Document | | | | | | | | X |
| 101.PRE | *** | | XBRL Taxonomy Extension Presentation Linkbase Document | | | | | | | | X |
| 104 | | | Cover page formatted as Inline XBRL and contained in Exhibit 101. | | | | | | | | X |
* Represents a management contract or compensatory plan or arrangement.
** Certain of the exhibits and schedules to this exhibit have been omitted in accordance with Regulation S-K Item 601(a)(5). The Company agrees to furnish supplementally a copy of all omitted exhibits and schedules to the SEC upon its request.
*** Attached as Exhibit 101 to this report are the following documents formatted in iXBRL (Inline Extensible Business Reporting Language): (i) the Consolidated Statements of Operations, (ii) the Consolidated Statements of Comprehensive Income (Loss), (iii) the Consolidated Balance Sheets, (iv) the Consolidated Statements of Cash Flows, (v) the Consolidated Statements of Stockholders' Equity and Noncontrolling Interests, (vi) the Notes to Consolidated Financial Statements, and (vii) document and entity information.
X Filed herewith
XX Furnished herewith
(b)Exhibits
The exhibits included in Item 15(a)(3) above are filed or incorporated by reference pursuant to the requirements of Item 601 of Regulation S-K.
(c)Other Financial Statement Schedules
SCHEDULE II
MOLSON COORS BEVERAGE COMPANY AND SUBSIDIARIES
VALUATION AND QUALIFYING ACCOUNTS
(IN MILLIONS)
| | | | | | | | | | | | | | | | | | | | | | | | | | | | | |
| Balance at
beginning
of year | | Additions
charged to
costs and
expenses | | Deductions | | Foreign
exchange
impact | | Balance at
end of year |
| Allowance for doubtful accounts—trade accounts receivable | | | | | | | | | |
| Year ended: | | | | | | | | | |
| December 31, 2021 | $ | 18.1 | | | $ | 6.2 | | | $ | (4.7) | | | $ | (0.6) | | | $ | 19.0 | |
| December 31, 2020 | $ | 12.1 | | | $ | 12.8 | | | $ | (7.4) | | | $ | 0.6 | | | $ | 18.1 | |
| December 31, 2019 | $ | 14.5 | | | $ | 7.0 | | | $ | (9.3) | | | $ | (0.1) | | | $ | 12.1 | |
| | | | | | | | | |
| | | | | | | | | |
| | | | | | | | | |
| | | | | | | | | |
| | | | | | | | | |
| | | | | | | | | |
| | | | | | | | | |
| | | | | | | | | |
| | | | | | | | | |
| | | | | | | | | |
| Allowance for obsolete supplies and inventory | | | | | | | | | |
| Year ended: | | | | | | | | | |
| December 31, 2021 | $ | 38.4 | | | $ | 109.9 | | | $ | (103.8) | | | $ | (0.4) | | | $ | 44.1 | |
| December 31, 2020 | $ | 22.2 | | | $ | 70.6 | | | $ | (54.3) | | | $ | (0.1) | | | $ | 38.4 | |
| December 31, 2019 | $ | 25.4 | | | $ | 34.8 | | | $ | (38.2) | | | $ | 0.2 | | | $ | 22.2 | |
| Deferred tax valuation account | | | | | | | | | |
| Year ended: | | | | | | | | | |
| December 31, 2021 | $ | 62.2 | | | $ | 14.8 | | | $ | (16.2) | | | $ | (0.1) | | | $ | 60.7 | |
| December 31, 2020 | $ | 73.8 | | | $ | 31.8 | | | $ | (43.4) | | | $ | — | | | $ | 62.2 | |
| December 31, 2019 | $ | 1,040.0 | | | $ | 46.4 | | | $ | (990.4) | | | $ | (22.2) | | | $ | 73.8 | |
| | | | | | | | | | | | | | | | | | | | | | | | | | | | | |
| Balance at
beginning
of year | | Additions
charged to
costs and
expenses | | Deductions | | Foreign
exchange
impact | | Balance at
end of year |
| Deferred tax valuation allowance | | | | | | | | | |
| Year ended: | | | | | | | | | |
| December 31, 2023 | $ | 57.2 | | | $ | 13.2 | | | $ | (10.2) | | | $ | 1.7 | | | $ | 61.9 | |
| December 31, 2022 | $ | 60.7 | | | $ | 20.6 | | | $ | (23.0) | | | $ | (1.1) | | | $ | 57.2 | |
| December 31, 2021 | $ | 62.2 | | | $ | 14.8 | | | $ | (16.2) | | | $ | (0.1) | | | $ | 60.7 | |
Deductions relate to write-offs
Deduction amounts related to the deferred tax valuation allowance are primarily due to the utilization of capital loss and operating loss carryforwards and re-evaluations of deferred tax assets.
The impacts of changes in income tax rates on deferred tax valuation allowances are reported in the additions or deductions column accordingly. The significant decrease in our deferred tax valuation account during the year ended December 31, 2019 is attributable to the liquidation of certain European entities, resulting in the write-off of their associated full valuation allowances.
ITEM 16. FORM 10-K SUMMARY
None.
SIGNATURES
Pursuant to the requirements of Section 13 or 15(d) of the Securities Exchange Act of 1934, the registrant has duly caused this report to be signed on its behalf by the undersigned, thereunto duly authorized.
MOLSON COORS BEVERAGE COMPANY
| | | | | | | | | | | | | | |
| | | | |
| By | | /s/ GAVIN D.K. HATTERSLEY | | President, Chief Executive Officer and Director
(Principal Executive Officer) |
| | Gavin D.K. Hattersley | |
February 23, 202220, 2024
Pursuant to the requirements of the Securities Exchange Act of 1934, this report has been signed below by the following persons on behalf of the registrant and in the capacities and on the date indicated.
| | | | | | | | | | | | | | |
| By | | /s/ GAVIN D.K. HATTERSLEY | | President, Chief Executive Officer and Director (Principal Executive Officer) |
| | Gavin D.K. Hattersley | |
| By | | /s/ TRACEY I. JOUBERT | | Chief Financial Officer
(Principal Financial Officer) |
| | Tracey I. Joubert | |
| By | | /s/ ROXANNE M. STELTER | | Vice President and Controller
(Principal Accounting Officer) |
| | Roxanne M. Stelter | |
| By | | /s/ GEOFFREY E. MOLSON | | Chairman |
| | Geoffrey E. Molson | | |
| By | | /s/ DAVID S. COORS | | Vice Chairman |
| | David S. Coors | | |
| By | | /s/ JULIA M. BROWN | | Director |
| | Julia M. Brown | | |
| By | | /s/ PETER H. COORS | | ChairmanDirector |
| | Peter H. Coors | | |
| By | | /s/ ROGER G. EATON | | Director |
| | Roger G. Eaton | | |
| By | | /s/ MARY LYNN FERGUSON-MCHUGH | | Director |
| | Mary Lynn Ferguson-McHugh | | |
| By | | /s/ CHARLES M. HERINGTON | | Director |
| | Charles M. Herington | | |
| By | | /s/ ANDREW T. MOLSON | | Vice ChairmanDirector |
| | Andrew T. Molson | | |
By | | /s/ JULIA M. BROWN | | Director |
| | Julia M. Brown | | |
By | | /s/ DAVID S. COORS | | Director |
| | David S. Coors | | |
By | | /s/ ROGER G. EATON | | Director |
| | Roger G. Eaton | | |
By | | /s/ MARY LYNN FERGUSON-MCHUGH | | Director |
| | Mary Lynn Ferguson-McHugh | | |
By | | /s/ CHARLES M. HERINGTON | | Director |
| | Charles M. Herington | | |
By | | /s/ GEOFFREY E. MOLSON | | Director |
| | Geoffrey E. Molson | | |
| By | | /s/ NESSA O'SULLIVAN | | Director |
| | Nessa O'Sullivan | | |
| By | | /s/ H. SANFORD RILEY | | Director |
| | H. Sanford Riley | | |
| By | | /s/ DOUGLAS D. TOUGHJILL TIMM | | Director |
| | Douglas D. ToughJill Timm | | |
| By | | /s/ LOUIS VACHONLEROY J. WILLIAMS, JR. | | Director |
| | Louis VachonLeroy J. Williams, Jr. | | |
| By | | /s/ JAMES A. WINNEFELD, JR. | | Director |
| | James A. Winnefeld, Jr. | | |
February 23, 202220, 2024