UNITED STATES
SECURITIES AND EXCHANGE COMMISSION
Washington, D.C. 20549
FORM 10-K
(Mark One)
þ ANNUAL REPORT PURSUANT TO SECTION 13 OR 15(d) OF THE SECURITIES EXCHANGE ACT OF 1934
For the fiscal year ended December 26, 202030, 2023
OR
o TRANSITION REPORT PURSUANT TO SECTION 13 OR 15(d) OF THE SECURITIES EXCHANGE ACT OF 1934
For the transition period from _________ to ________.
Commission File Number 0-2585
The Dixie Group, Inc.
(Exact name of registrant as specified in its charter)
| | | | | | | | | | | | | | |
| Tennessee | | | | 62-0183370 |
| (State or other jurisdiction of incorporation of organization) | | | | (I.R.S. Employer Identification No.) |
| | | | |
| 475 Reed Road, Dalton, GA 30720 | | | | (706) 876-5800 |
| (Address of principal executive offices and zip code) | | | | (Registrant's telephone number, including area code) |
| | | | |
| Securities registered pursuant to Section 12(b) of the Act: | | | | |
| Title of Class | | Trading Symbol | | Name of each exchange on which registered |
| Common Stock, $3.00 par value | | DXYN | | NASDAQ Stock Market, LLC |
| | | | |
| Securities registered pursuant to Section 12(g) of the Act: | | | | |
| Title of class | | | | |
| None | | | | |
Indicate by check mark if the registrant is a well-known seasoned issuer, as defined in Rule 405 of the Securities Act. ¨ Yes þ No
Indicate by check mark if the registrant is not required to file reports pursuant to Section 13 or 15(d) of the Act. ¨ Yes þ No
Indicate by check mark whether the registrant (1) has filed all reports required to be filed by Section 13 or 15(d) of the Securities Exchange Act of 1934 during the preceding 12 months (or for such shorter period that the registrant was required to file such reports), and (2) has been subject to such filing requirements for the past 90 days. þ Yes ¨ No
Indicate by check mark whether the registrant has submitted electronically and posted on its corporate Web site, if any, every Interactive Data File required to be submitted and posted pursuant to Rule 405 of Regulations S-T (Section 232.405 of this chapter) during the preceding 12 months (or for such shorter period that the registrant was required to submit and post such files). þ Yes ¨ No
Indicate by check mark if disclosure of delinquent filers pursuant to Item 405 of Regulation S-K is not contained herein, and will not be contained, to the best of the registrant's knowledge, in definitive proxy or information statements incorporated by reference in Part III of the Form 10-K or any amendment to this Form 10-K. þ
Indicate by check mark whether the registrant is a large accelerated filer, an accelerated filer, a non-accelerated filer, or a smaller reporting company, or an emerging growth company. See definitiondefinitions of "large accelerated filer",filer," "accelerated filer" andfiler," "smaller reporting company"company," in Rule 12b-2 of the Exchange Act.
Large accelerated filer ¨Accelerated filer ¨Non-accelerated filer ¨Smaller reporting company þ Emerging growth company ¨
If an emerging growth company, indicate by check mark if the registrant has elected not to use the extended transition period for complying with any new or revised financial accounting standards provided pursuant to Section 13(a) of the Exchange Act.
Indicate by check mark whether the registrant has filed a report on attestation to its management's assessment of the effectiveness of its internal control over financial reporting under Section 404(b) of the Sarbanes-Oxley Act (15 U.S.C. 7262(b)) by the registered public accounting firm that prepared or issued its audit report. ¨
If securities are registered pursuant to Section 12(b) of the Act, indicate by check mark whether the financial statements of the registrant included in the filing reflect the correction of an error to previously issued financial statements. ¨
Indicate by check mark whether any of those error corrections are restatements that required a recovery analysis of incentive-based compensation received by any of the registrant's executive officers during the relevant recovery period pursuant to Section 240.10D-1(b). ¨
Indicate by check mark whether the registrant is a shell company (as defined in Rule 12b-2 of the Act). ¨ Yes þ No
The aggregate market value of the Common Stock held by non-affiliates of the registrant on June 27, 202030, 2023 (the last business day of the registrant's most recently completed fiscal second quarter) was $10,862,025.$18,370,085. The aggregate market value was computed by reference to the closing price of the Common Stock on such date. In making this calculation, the registrant has assumed, without admitting for any purpose, that all executive officers, directors, and holders of more than 10% of a class of outstanding Common Stock, and no other persons, are affiliates. No market exists for the shares of Class B Common Stock, which is neither registered under Section 12 of the Act nor subject to Section 15(d) of the Act.
Indicate the number of shares outstanding of each of the registrant's classes of Common Stock as of the latest practicable date.
| | | | | | | | | | | | | | |
| Class | | Outstanding as of February 25, 202123, 2024 |
| Common Stock, $3.00 Par Value | | 14,557,43514,409,281 | | | shares |
| Class B Common Stock, $3.00 Par Value | | 880,3131,121,129 | | | shares |
| Class C Common Stock, $3.00 Par Value | | 0— | | | shares |
DOCUMENTS INCORPORATED BY REFERENCE
Specified portions of the following document are incorporated by reference:
Proxy Statement of the registrant for annual meeting of shareholders to be held May 5, 20211, 2024 (Part III).
THE DIXIE GROUP, INC.
Index to Annual Report
on Form 10-K for
Year Ended December 26, 202030, 2023
| | | | | | | | |
| PART I | Page |
| Item 1. | | |
| Item 1A. | | |
| Item 1B. | | |
| Item 1C. | | |
| Item 2. | | |
| Item 3. | | |
| Item 4. | | |
| | | |
| PART II | |
| Item 5. | | |
| Item 6. | | |
| Item 7. | | |
| Item 7A. | | |
| Item 8. | | |
| Item 9. | | |
| Item 9A. | | |
| Item 9B. | | |
| Item 9C. | | |
| PART III | |
| Item 10. | | |
| Item 11. | | |
| Item 12. | | |
| Item 13. | | |
| Item 14. | | |
| PART IV | |
| Item 15. | | |
| Item 16. | | |
| | |
| |
| |
| | |
| | | |
| | | |
| | | |
| | |
| | | |
| | | |
| | | |
| | | |
FORWARD-LOOKING INFORMATION
This Report contains statements that may be considered forward-looking statements within the meaning of Section 27A of the Securities Act of 1933, as amended, and Section 21E of the Securities Exchange Act of 1934, as amended. Such statements include the use of terms or phrases such as "expects," "estimates," "projects," "believes," "anticipates," "intends," and similar terms and phrases. Such forward-looking statements relate to, among other matters, our future financial performance, business prospects, growth strategies or liquidity. The following important factors may affect our future results and could cause those results to differ materially from our historical results; these factors include, in addition to those "Risk Factors" detailed in Item 1A of this report, and described elsewhere in this document, the cost and availability of capital, raw material and transportation costs related to petroleum price levels, the cost and availability of energy supplies, the loss of a significant customer or group of customers, the ability to attract, develop and retain qualified personnel, materially adverse changes in economic conditions generally in carpet, rug and floorcovering markets we serve and other risks detailed from time to time in our filings with the Securities and Exchange Commission.
PART I.
Item 1. BUSINESS
General
Our business consists principally of marketing, manufacturing and selling floorcovering products to high-end residential and commercial customers through our various sales forces and brands. We focus exclusively on the upper-end of the floorcovering market where we believe we have strong brands and competitive advantages with our style and design capabilities and customer relationships. Our Fabrica, Masland, and Dixie HomeDH Floors brands have a significant presence in the high-end residential floorcovering markets. Our AtlasMasland brand participates in the upper-end specified commercial marketplace. Dixie International sells all of our brands outside of the North American market.
Our business is primarily concentratedparticipates in areas of themarkets for soft floorcovering marketsfloorcoverings, which include broadloom carpet carpet tiles and rugs. However, over the past few years, thererugs, and hard surfaces, which include luxury vinyl flooring (LVF) and engineered wood. There has been a significant shift in the flooring marketplace as hard surface products have grown at a rate much faster than soft surface products. We have respondedcontinue to respond to this accelerated shift to hard surface flooring by launching several initiatives in both our residential and commercial brands. Our commercial business offers luxury vinyl flooring (“LVF”) products under the Calibré brand in the commercial markets. Within the residential markets we launchedhard surface offerings. TRUCOR™ and TRUCOR Prime™ offeringoffers a wide range of LVF products. In 2020, we experienced significant growth in sales of our TRUCOR™ family of products and our Fabrica Wood program. We continue to innovateintroduce new products in our soft floorcovering residential markets with a new tufting technology, “TECHnique”, which is being showcased in our1866 by Masland and Decor by Fabrica lines. TECHnique delivers beautiful patterns through precise yarn placementcollections, which are targeted at high end, luxury soft surface markets including wool broadloom and control at each needle. In the soft floorcovering commercial market, we have made our unique Sustaina™ backing the standard in our modular carpet tile offerings. The Sustaina™ modular tile backing system, with its very high recycled content, is an environmentally conscious PVC and polyurethane free cushion modular carpet tile backing.decorative rugs.
We have one reportable segment, Floorcovering, which is comprised of two operating segments, Residential and Commercial. We have aggregated the two operating segments into one reporting segment because they have similar economic characteristics, and the operating segments are similar in all of the following areas: (a) the nature of the products and services; (b) the nature of the production processes; (c) the type or class of customer for their products and services; (d) the methods used to distribute their products or provide their services; and (e) the nature of the regulatory environment.Floorcovering.
Our Brands
Our brands are well known, highly regarded and complementary; by being differentiated, we offer meaningful alternatives to the discriminating customer.
Fabrica markets and manufactures luxurious residential carpet, custom rugs, and engineered wood at selling prices that we believe are approximately five times the average for the residential soft floorcovering industry. Its primary customers are interior decorators and designers, selected retailers and furniture stores, luxury home builders and manufacturers of luxury motor coaches and yachts. Fabrica is among the leading premium brands in the domestic marketplace and is known for styling innovation and unique colors and patterns. Fabrica consists of extremely high quality carpets and area rugs in both nylon and wool, with a wide variety of patterns and textures. Fabrica is viewed by the trade as the premier quality brand for very high-end carpet and enjoys an established reputation as a styling trendsetter and a market leader in providing both custom and designer products to the very high-end residential sector.
Masland Residential, founded in 1866, markets and manufactures design-driven specialty carpets and rugs for the high-end residential marketplace. In addition, it offers luxury vinyl flooring products to the marketplace it serves. Its residential and commercial broadloom carpet products are marketed at selling prices that we believe are over three times the average for the residential soft floorcovering industry. Its products are marketed through the interior design community, as well as to consumers through specialty floorcovering retailers. Masland Residential has strong brand recognition within the upper-end residential market. Masland Residential competes through innovative styling, color, product design, quality and service.
Dixie HomeDH Floors provides stylishly designed, differentiated products that offer affordable fashion to residential consumers. Dixie HomeDH Floors markets an array of residential tufted broadloom carpet and rugs to selected retailers and home centers under the Dixie HomeDH Floors and private label brands. In addition, it offers luxury vinyl flooring products to the marketplace it serves. Its objective is to make the Dixie HomeDH Floors brand the choice for styling, service and quality in the more moderately priced sector of the high-end residential market. Its products are marketed at selling prices which we believe average two times the soft floorcovering industry's average selling price.
AtlasMasland is our combined brand of the former Atlas Carpet Mills and Masland Contract. We strategically re-aligned our business in 2018 by merging the two brands into one cohesive operating unit with a broader array of products but a single management, marketing, back office, manufacturing and sales structure to serve the specified commercial marketplace.Its commercial products are marketed to the architectural and specified design community and directly to commercial end users, as
well as to consumers through specialty floorcovering retailers. AtlasMasland also sells to the hospitality market with both custom designed and running line products. Utilizing computerized yarn placement technology, as well as offerings utilizing our state of the art Infinity tufting technology, this brand provides excellent service and design flexibility to the hospitality market serving upper-end hotels, conference centers and senior living markets. Its broadloom, rug product and luxury vinyl flooring offerings are designed for the interior designer in the upper-end of the hospitality market who appreciates sophisticated texture, color and patterns with excellent service. AtlasMasland has strong brand recognition within the upper-end contract market, and competes through innovative styling, color, patterns, quality and service.
Industry
We are a flooring manufacturer in an industry composed of a wide variety of companies from small privately held firms to large multinationals. In 2019,2022, according to the most recent information available, the U.S. floorcovering industry reported $27.6$37.6 billion in sales, up approximately 1.1% over 2018's7.5% from the 2021 sales of $27.3 billion.total. In 2019,2022, the primary categories of flooring in the U.S., based on sales dollars, were carpet and rug (41%(34%), luxury vinyl flooring (LVF) (17%(28%), wood (12%), ceramic tile (14%), wood (13%), stone (6%), vinyl (5%(4%), and laminate and other (4%(3%). In 2019,2022, the primary categories of flooring in the U.S., based on square feet, were carpet and rug (46%(39%), luxury vinyl flooring (LVF) (17%(32%), ceramic tile (14%(12%), vinyl (9%(6%), wood (7%(5%), laminate (4%(3%), and stone and other (3%). Each of these categoriescategories is influenced by the residential construction, commercial construction, and residential remodeling markets. These markets are influenced by many factors including consumer confidence, spending for durable goods, turnover in housing and the overall strength of the economy.
The carpet and rug category has two primary markets, residential and commercial, with the residential market making up the largest portion of the industry's sales. A substantial portion of industry shipments is made in response to replacement demand. Residential products consist of broadloom carpets and rugs in a broad range of styles, colors and textures.textures and hard surface products such as wood, luxury vinyl flooring, stone and ceramic tile. Commercial products consist primarily of broadloom carpet and modular carpet tile for a variety of institutional applications such as office buildings, restaurant chains, schools and other commercial establishments. The carpet industry also manufactures carpet for the automotive, recreational vehicle, small boat and other industries.
The Carpet and Rug Institute (the "CRI") is the national trade association representing carpet and rug manufacturers. Information compiled by the CRI suggests that the domestic carpet and rug industry is comprised of fewer than 100 manufacturers, with a significant majority of the industry's production concentrated in a limited number of manufacturers focused on the lower end of the price curve. We believe that this industry focus provides us with opportunities to capitalize on our competitive strengths in selected markets where innovative styling, design, product differentiation, focused service and limited distribution add value.
Competition
The floorcovering industry is highly competitive. We compete with other carpet, rug and hard surface manufacturers. In addition, the industry provides multiple floorcovering surfaces such as luxury vinyl tile and wood. Though soft floorcovering is still the dominant floorcovering surface, it has gradually lost market share to hard floorcovering surfaces over the last 25 years. We believe our products are among the leaders in styling and design in the high-end residential and high-end commercial carpet markets. However, a number of manufacturers produce competitive products and some of these manufacturers have greater financial resources than we do.
We believe the principal competitive factors in our primary floorcovering markets are styling, color, product design, quality and service. In the high-end residential and commercial markets, we compete with various other floorcovering suppliers. Nevertheless, we believe we have competitive advantages in several areas. We have an attractive portfolio of brands that we believe are well known, highly regarded by customers and complementary; by being differentiated, we offer meaningful alternatives to the discriminating customer. We believe our investment in new yarns and innovative tufting and dyeing technologies, strengthens our ability to offer product differentiation to our customers. In addition, we have established longstanding relationships with key suppliers for which we utilize both branded yarns andof luxury vinyl flooring and with significant customers in most of our markets. Finally, our reputation for innovative design excellence and our experienced management team enhance our competitive position. See "Risk Factors" in Item 1A of this report.
Backlog
Sales order backlog is not material to understanding our business, due to relatively short lead times for order fulfillment in the markets for the vast majority of our products.
Trademarks
Our floorcovering businesses own a variety of trademarks under which our products are marketed. Among such trademarks, the names "Fabrica", "Masland", "Dixie Home", "Atlas|Masland”"DH Floors" and "Masland Hospitality"TRUCOR™ are of greatest importance to our business. We believe that we have taken adequate steps to protect our interest in all significant trademarks.
Customer and Product Concentration
As a percentage of our net sales, one customer, a mass merchant, accounted for approximately 7% in 2020, 11% in 2019, and 13% in 2018 and as a percentage of our customer's trade accounts receivable, accounted for approximately 20% in 2020 and 18% in 2019. No other customer was more than 10 percent of our net sales during the periods presented. During 2020,2023, sales to our top ten customers accounted for approximately 10% of6% of our sales and our top 20 customers accounted for approximately 12%10% of our sales. We do not makehave a material amount of sales in foreign countries.
We do not have any single class of products that accounts for more than 10% of our sales. However, sales of our floorcovering products may be classified by significant end-user markets into which we sell, and such information for the past three years is summarized as follows:
| | | | | | | | | | | | | | | | | |
| 2020 | | 2019 | | 2018 |
| Residential floorcovering products | 79 | % | | 72 | % | | 72 | % |
| Commercial floorcovering products | 21 | % | | 28 | % | | 28 | % |
Seasonality
Our sales historically have normally reached their lowesthighest level in the second quarter (approximately 26% of our annual sales) and their lowest levels in the first quarter (approximately 23% of our annual sales), with the remaining sales being distributed relatively equally amongbetween the second, third and fourth quarters. During 2020, primarily as a result of the COVID-19 pandemic, our sales reached their lowest level in the second quarter (approximately 19% of our annual sales) with the remaining sales being distributed relatively equally among the first, third and fourth quarters. Working capital requirements have normally reached their highest levels in the thirdsecond and fourththird quarters of the fiscal year.
Environmental
Our operations are subject to federal, state and local laws and regulations relating to the generation, storage, handling, emission, transportation and discharge of materials into the environment. The costs of complying with environmental protection laws and regulations have not had a material adverse impact on our financial condition or results of operations in the past. See "Risk Factors” in Item 1A of this report.
Raw Materials
Our primary raw material is continuous filament yarn. Nylon is the primary yarn we utilize and, to a lesser extent, wool and polyester yarn is used. Additionally, we utilize polypropylene carpet backing, latex, dyes and chemicals, and man-made topical applications in the construction of our products. The volatility of petroleum prices could adversely affect our supply and cost of synthetic fibers. Our synthetic yarns are purchased primarily from domestic fiber suppliers and wool is purchased from a number of international sources. Our other raw materials are purchased primarily from domestic suppliers, although the majority of our luxury vinyl tile is sourced outside the United States. Where possible,Normally, we pass raw material price increases through to our customers; however, there can be no assurance that pricecost increases can be passed through to customers and that increases in raw material prices will not have an adverse effect on our profitability. See "Risk Factors” in Item 1A of this report. We purchase a significant portion of our primary raw material (nylon yarn) from one supplier. We believe thereThere are othermultiple sources of nylon yarn; however, an unanticipated termination or interruption of our supply arrangements could adversely affect our supplies of raw materials and could have a material effect on our operations. See "Risk Factors” in Item 1A of this report.
Utilities
We use electricity as our principal energy source, with oil or natural gas used in some facilities for dyeing and finishing operations as well as heating. We have not experienced any material problemsignificant problems or issues in obtaining adequate supplies of electricity, natural gas or oil. Energy shortages of extended duration could have an adverse effect on our operations, and price volatility could negatively impact future earnings. See "Risk Factors” in Item 1A of this report.
Working Capital
We are required to maintain significant levels of inventory in order to provide the enhanced service levels demanded by the nature of our business and our customers, and to ensure timely delivery of our products. Consistent and dependable sources of liquidity are required to maintain such inventory levels. Failure to maintain appropriate levels of inventory could materially adversely affect our relationships with our customers and adversely affect our business. See "Risk Factors” in Item 1A of this report.
Employment LevelHuman Capital Resources
At December 26, 2020, we30, 2023, our total employed 1,441 associates in our operations.was 970.
Available Information
Our internet address is www.thedixiegroup.com. We make the following reports filed by us with the Securities and Exchange Commission available, free of charge, on our website under the heading "Investor Relations":
1.annual reports on Form 10-K;
2. quarterly reports on Form 10-Q;
3. current reports on Form 8-K; and
4. amendments to the foregoing reports.
The contents of our website are not a part of this report.
Item 1A. RISK FACTORSRisk Factors
In addition to the other information provided in this Report, the following risk factors should be considered when evaluating the results of our operations, future prospects and an investment in shares of our Common Stock. Any of these factors could cause our actual financial results to differ materially from our historical results, and could give rise to events that might have a material adverse effect on our business, financial condition and results of operations.
Our financial condition and results orof operations have been and willcould likely continue to be adversely impacted in the future by the COVID-19 pandemicor other pandemics and the related downturn innegative impact on economic conditions.
TheGlobal and/or local pandemics, such as COVID-19, pandemic continues to impacthave negatively impacted areas where we operate and sell our products and services. The COVID-19 outbreak in the second quarter of 2020 had a material adverse effect on our ability to operate and our results of operations as public health organizations recommended, and many governments implemented, measures to slow and limit the transmission of the virus, including shelter in place and social distancing ordinances. Although many areasthe accessibility of vaccines and other preventive measures have lifted or reducedlessened the impact, of such orders, the continuing spread of the virusnew variants may necessitate a return of such restrictive, preventive measures which may have a material adverse effect on our business for an indefinite period of time, such as the potential shut down of certain locations, decreased employee availability, disruptions to the businesses of our selling channel partners, and others. Our suppliers and customers may also face these and other challenges, which could lead to a disruption in our supply chain as well as decreased construction and renovation spending and consumer demand for our products and services. These issues may also materially affect our current and future access to sources of liquidity, particularly our cash flows from operations, and access to financing. The long-term economic impact and near-term financial impacts of the COVID-19 pandemic, including but not limited to, potential near term or long-term risk of asset impairment, restructuring, and other charges, cannot be reliably quantified or estimated at this time due to the uncertainty of future developments.
The floorcovering industry is sensitive to changes in general economic conditions and a decline in residential or commercial construction activity or corporatehome remodeling and refurbishment could have a material adverse effect on our business.
The floorcovering industry, in which we participate, is highly dependent on general economic conditions, such as interest rate levels, consumer confidence and income, corporate and government spending, interest rate levels, availability of credit and demand for housing. We derive a majority of our sales from the replacement segment of the market. Therefore, unfavorable economic changes, thatsuch as an economic recession, could result in a significant or prolonged decline in spending for remodeling and replacement activities which could have a material adverse effect on our business and results of operations.
The residential floorcovering industrymarket is highly dependent on constructionhousing activity, including new construction, which is cyclical in nature.remodeling. The U.S. and global economies, along with the residential and commercial markets in such economies, can negatively impact the floorcovering industry and our business. Although the impact of a decline in new constructionhousing activity is typically accompanied by an increase in remodeling and replacement activity, these activities typically lag during a cyclical downturn. Additional or extended downturns could cause the industry to deteriorate in the foreseeable future.prolonged deterioration. A significant or prolonged decline in residential or commercial constructionhousing activity could have a material adverse effect on our business and results of operations.
We have had significant levels of sales in certain channels of distribution and reduction in sales through these channels could adversely affect our business.
A significant amount of our recent past sales arewere generated through a certain mass merchant retailer. We have seen aA change in strategy by this customer to emphasize products at a lower price point than we currently offer which has adversely affected ourlimited future sales opportunities with this customer. In response to this customer. Further reductions ofloss in sales through this channelvolume and other factors, we implemented our restructuring plan to consolidate our east coast manufacturing operations to better match production demand. If we are unable to maintain volume in line with expected production capacity, any excess capacity in the manufacturing facilities could adversely affect our business. Such a shift could also occur if this retailer decidedresult in an unfavorable impact on gross margins due to reduce the amount of emphasis on soft surface flooring or determine that our concentration of better goods was not advantageous to their marketing program.
We have significant levels of indebtedness that could result in negative consequences to us.
We have a significant amount of indebtedness relative to our equity. Insufficient cash flow, profitability, or the value of our assets securing our loans could have a material adverse effect on our ability to generate sufficient funds to satisfy the terms of our senior loan agreements and other debt obligations. Our senior loan agreement and term loans include certain compliance, affirmative, and financial covenants. The impact of continued operating losses on our liquidity position could affect our ability to comply with these covenants by our primary lenders. Additionally, the inability to access debt or equity markets at competitive rates in sufficient amounts to satisfy our obligations could adversely impact our business. Significant increases in interest rates tied to our floating rate debt could have a material adverse effect on our financial results. Further, our trade relations depend on our economic viability and insufficient capital could harm our ability to attract and retain customers and or supplier relationships.
Uncertainty in the credit market or downturns in the economy and our business could affect our overall availability and cost of credit.
Economic factors, including an economic recession, could have a material adverse effect on demand for our products and on our financial condition and operating results. Uncertainty in the credit markets could affect the availability and cost of credit. If banks and financial institutions with whom we have banking relationships enter receivership or become insolvent in the future, we may be unable to access, and we may lose, some or all of our existing cash and cash equivalents to the extent those funds are not insured or otherwise protected by the FDIC. Market conditions could impact our ability to obtain financing in the future, including any financing necessary to refinance existing indebtedness. The cost and terms of such financing is uncertain. Continued operating losses could affect our ability to continue to access the credit markets under our current terms and conditions. These and other economic factors could have
If we are not able to maintain a material adverse effect on demandminimum bid price of $1 per share for our productscommon stock, we may be subject to delisting from The NASDAQ Stock Market.
NASDAQ Marketplace Rule 5550(a)(2) requires that, for continued listing on the exchange, we must maintain a minimum bid price of $1 per share. We received notice from NASDAQ on September 27, 2023 that our closing bid price was below $1 per share for 30 consecutive business days. If we are not able to regain compliance before March 25, 2024, we may be eligible for an additional 180 days provided we meet other listing requirements. To the extent that we are unable to stay in compliance with the relevant NASDAQ bid price listing rule, there is a risk that our common stock may be delisted from NASDAQ, which would adversely impact liquidity of our common stock and onpotentially result in even lower bid prices for our financial condition and operating results.common stock.
Our stock price has been and could remain volatile, which could further adversely affect the market price of our stock, our ability to raise additional capital and/or cause us to be subject to securities class action litigation.capital.
The market price of our common stock has historically experienced and may continue to experience significant volatility. Our progress in restructuring our business, our quarterly operating results, our perceived prospects, lack of securities analysts’ recommendations or earnings estimates, changes in general conditions in the economy or the financial markets, adverse events related to our strategic relationships, significant sales of our common stock by existing stockholders, and other developments affecting us or our competitors could cause the market price of our common stock to fluctuate substantially. In addition, in recent years, the stock market has experienced significant price and volume fluctuations. This volatility has affected the market prices of securities issued by many companies for reasons unrelated to their operating performance and may adversely affect the price of our common stock. Such market price volatility could adversely affect our ability to raise additional capital. In addition, we may be subject to securities class action litigation as a result of volatility in the price of our common stock, which could result in substantial costs and diversion of management’s attention and resources and could harm our stock price, business, prospects, results of operations and financial condition
We face intense competition in our industry, which could decrease demand for our products and could have a material adverse effect on our profitability.
The floorcovering industry is highly competitive. We face competition from a number of domestic manufacturers and independent distributors of floorcovering products and, in certain product areas, foreign manufacturers. Significant consolidation within the floorcovering industry has caused a number of our existing and potential competitors to grow significantly larger and have greater access to resources and capital than we do. Maintaining our competitive position may require us to make substantial additional investments in our product development efforts, manufacturing facilities, distribution network and sales and marketing activities. These additional investments may be limited by our access to capital, as well as restrictions set forth in our credit facilities. Competitive pressures and the accelerated growth of hard surface alternatives have resulted in decreased demand for our soft floorcovering products and in the loss of market share to hard surface products. As a result, competition from providers of other soft surfaces has intensified and may result in decreasedlower demand for our products. In addition, we face, and will continue to face, competitive pressures on our sales priceprices and cost of our products. As a result of any of these factors, there could be a material adverse effect on our sales and profitability.
If we are unable to anticipate consumer preferences and successfully develop and introduce new, innovative and updated products, we may not be able to maintain or increase our net revenues and profitability.
Our success depends on our ability to identify and originate product trends as well as to anticipate and react to changing consumer demands in a timely manner. All of our products are subject to changing consumer preferences that cannot be predicted with certainty. In addition, long lead times for certain products may make it hard for us to quickly respond to changes in consumer demands. Recently we have seen the supply of white dyeable yarns for the commercial business decline and that has forced us to transition to new products faster than was originally intended. If we fail to successfully replace those products with equally desirable products to the marketplace, we will lose sales volume. Our newNew products may not receive consumer acceptance as consumer preferences could shift rapidly to different types of flooring products or away from these types of products altogether, and our future success depends in part on our ability to anticipate and respond to these changes. Failure to anticipate and respond in a timely manner to changing consumer preferences could lead to, among other things, lower sales and excess inventory levels, which could have a material adverse effect on our financial condition.
Raw material prices maywill vary and the inability to either offset or pass on such cost increases or avoid passing on decreases larger than the cost decrease to our customers could have a material adverse effect on our business, results of operations and financial condition.
We require substantial amounts of raw materials to produce our products, including nylon and polyester yarn, as well as wool yarns, synthetic backing, latex, and dyes. Substantially all of the raw materials we require are purchased from outside sources. The prices of raw materials and fuel-related costs varyhave increased significantly withdue to market conditions.conditions and inflationary pressures, the duration and extent of which is difficult to predict. The fact that we source a significant amount of raw materials means that several months of raw materials and work in process are moving through our supply chain at any point in time. We are sourcing the majority of our new luxury vinyl flooring and wood product lines from overseas. We are not able to predict whether commodity costs will significantly increase or decrease in the future. If commodity costs continue to increase in the future and we are not able to reduce or eliminate the effect of the cost increases by reducing production costs or implementing price increases, our profit margins could decrease. If commodity costs decline, we may experience pressures from customers to reduce our selling prices. The timing of any price reductions and decreases in commodity costs may not align. As a result, our margins could be affected.
Unanticipated termination or interruption
Disruption to suppliers of nylon yarnraw materials could have a material adverse effect on us.
Nylon yarn is the principal raw material used in our floorcovering products. A significant portion of such yarn is purchased from one supplier. Our yarn supplier is oneOne of the leading fiber suppliers within the industry and ishad been the exclusive supplier of certain innovative branded fiber technologyfibers upon which we rely.formerly relied. Access to these branded fibers is no longer available. We believe ourhave developed and are developing products and product offerings of this innovativeusing fiber technology contribute materiallysystems from other fiber suppliers, but there can be no certainty as to the competitivenesssuccess of our efforts to develop and market such products. While we believe there are other sourcesAdditionally, the supply of all nylon yarn and yarn systems has been negatively impacted by a variety of overall market factors. The cost of nylon yarns an unanticipated termination or interruptionhas risen significantly and availability of nylon yarns has been restricted. Our efforts to develop alternate sources and to diversify our currentyarn suppliers has been met with success to date; however, supply of branded nylon yarn could have a material adverse effect onconstraints may impact our ability to supplysuccessfully develop products and effectively service our products to our customers and have a material adverse impact on our competitiveness if we are unable to replace our nylon supplier with another supplier that can offer similar innovative and branded fiber products. Recently, we have had a disruption in our supply of white dyeable yarns for the commercial market place which has resulted in our taking additional charges for the write down of certain inventories. . An interruption in the supply of these or other raw materials or sourced products used in our business or in the supply of suitable substitute materials or products would disrupt our operations, which could have a material adverse effect on our business. We continually evaluate our sources of yarn and other raw materials for competitive costs, performance characteristics, brand value, and diversity of supply.
We rely on information systems in managing our operations and any system failure, cyber incident or deficiencies of such systems may have an adverse effect on our business.
Our businesses rely on sophisticated systems to obtain, rapidly process, analyze and manage data. We rely on these systems to, among other things, facilitate the purchase, manufacture and distribution of our products; receive, process and ship orders on a timely basis; and to maintain accurate and up-to-date operating and financial data for the compilation of management information. We rely on our computer hardware, software and network for the storage, delivery and transmission of data to our sales and distribution systems, and certain of our production processes are managed and conducted by computer. Any damage by unforeseen events or system failure which causes interruptions to the input, retrieval and transmission of data or increase in the service time, whether caused by human error, natural disasters, power loss, computer viruses, intentional acts of vandalism, various forms of cybercrimescyber crimes including and not limited to hacking, ransomware, intrusions and malware or otherwise, could disrupt our normal operations. ThereDepending upon the severity of the incident, there can be no assurance that we can effectively carry out our disaster recovery plan to handle thea failure of our information systems, or that we will be able to restore our operational capacity within sufficient time to avoid material disruption to our business. The occurrence of any of these events could cause unanticipated disruptions in service, decreased customer service and customer satisfaction and harm to our reputation, which could result in loss of customers, increased operating expenses and financial losses. Any such events could in turn have a material adverse effect on our business, financial condition, results of operations, and prospects.
The long-term performance of our business relies on our ability to attract, develop and retain qualified personnel.
To be successful, we must attract, develop and retain qualified and talented personnel in management, sales, marketing, product design and operations. We compete with other floorcovering companies for these employees and invest resources in recruiting, developing, motivating and retaining them. The failure to attract, develop, motivate and retain key employees could negatively affect our business, financial condition and results of operations.
We are subject to various governmental actions that may interrupt our supply of materials.
We import most of our luxury vinyl flooring ("LVF"), some of our wood offering, some of our rugs and broadloom offerings. Though currently a small part of our business, the growth in LVF products is an important product offering to provide our customers a complete selection of flooring alternatives. Recently thereThere have been trade proposals that threatened these product categories with added tariffs which would make our offerings less competitive compared to those manufactured in other countries or produced domestically. These proposals, if enacted, or if expanded, or imposed for a significant period of time, would materially interfere with our ability to successfully enter into these product categories and could have a material adverse effect upon the company'sour cost of goodssales and results of operations.
Regulatory efforts to monitor political, social, and environmental conditions in foreign countries that produce products or components of products purchased by us will necessarily add complexity and cost to our products and processes and may reduce the availability of certain products. Regulatory efforts to prevent or reduce the risk that certain flooring products or elements of such products are produced in regions where forced or involuntary labor are known or believed to occur will result in increased cost to us as we attempt to ensure that none of our products or components of our products are produced in such regions. Such increased cost may make our products less competitive.
We may experience certain risks associated with internal expansion, acquisitions, joint ventures and strategic investments.
We continually look for strategic and tactical initiatives, including internal expansion, acquisitions and investment in new products, to strengthen our future and to enable us to return to sustained growth and to achieve profitability. Growth through expansion and acquisition involves risks, many of which may continue to affect us after the acquisition or expansion. An acquired company, operation or internal expansion may not achieve the levels of revenue, profitability and production that we expect. The combination of an acquired company’s business with ours involves risks. Further, internally generated growth that involves expansion involves risks as well. Such risks include the integration of computer systems, alignment of human resource policies and the retention of valued talent. Reported earnings may not meet expectations because of goodwill and intangible asset impairment, other asset impairments, increased interest costs and issuance of additional securities or debt as a result of these acquisitions. We may also face challenges in consolidating functions and integrating our organizations, procedures, operations and product lines in a timely and efficient manner.
The diversion of management attention and any difficulties encountered in the transition and integration process could have a material adverse effect on our revenues, level of expenses and operating results. Failure to successfully manage and integrate an acquisition with our existing operations or expansion of our existing operations could lead to the potential loss of customers of the acquired or existing business, the potential loss of employees who may be vital to the new or existing operations, the potential loss of business opportunities or other adverse consequences that could have a material adverse effect on our business, financial condition and results of operations. Even if integration occurs successfully, failure of the expansion or acquisition to achieve levels of anticipated sales growth, profitability or productivity, or otherwise perform as expected, may have a material adverse effect on our business, financial condition and results of operations.
We are subject to various environmental, safety and health regulations that may subject us to costs, liabilities and other obligations, which could have a material adverse effect on our business, results of operations and financial condition.
We are subject to various environmental, safety and health and other regulations that may subject us to costs, liabilities and other obligations which could have a material adverse effect on our business. The applicable requirements under these laws are subject to amendment, to the imposition of new or additional requirements and to changing interpretations of agencies or courts. We could incur material expenditures to comply with new or existing regulations, including fines and penalties and increased costs of our operations. Additionally, future laws, ordinances, regulations or regulatory guidelines could give rise to additional compliance or remediation costs that could have a material adverse effect on our business, results of operations and financial condition. For example, producer responsibility regulations regarding end-of-life disposal could impose additional cost and complexity to our business.
The Environmental Protection Agency has declared an intent to focus on perceived risks posed by certain chemicals (principally PFOA and PFOAS) previously used by the carpet industry. New or revised regulatory actions could result in requirements that industry participants, including us, incur costs related to testing and cleanup of areas affected by such chemical usage. Other chemicals or materials historically used by the industry and us could become the focus of similar governmental action.
Various federal, state and local environmental laws govern the use of our current and former facilities. These laws govern such matters as:
•Discharge to air and water;
•Handling and disposal of solid and hazardous substances and waste, and
•Remediation of contamination from releases of hazardous substances in our facilities and off-site disposal locations.
We are a manufacturer and distributor of flooring products which require processes and materials that necessarily utilize substantial amounts of carbon-based energy and accordingly involve the emission of “greenhouse gasses.” Regulatory monitoring, reporting and, more generally, efforts to eliminate or substantially reduce “greenhouse gasses” will necessarily add complexity and cost to our products and processes decreasing profitability and consumer demand. Additionally, consumer preferences may be affected by publicly announced issues related to “greenhouse gasses” which may negatively affect demand for our products. There can be no assurance that we can cost effectively respond to any such regulatory efforts or that demand for our products can be sustained under such pressures.
Our operations also are governed by laws relating to workplace safety and worker health, which, among other things, establish noise standards and regulate the use of hazardous materials and chemicals in the workplace. We have taken, and will continue to take, steps to comply with these laws. If we fail to comply with present or future environmental or safety regulations, we could be subject to future liabilities. However, we cannot ensure that complying with these environmental or health and safety laws and requirements will not adversely affect our business, results of operations and financial condition.
We may be exposed to litigation, claims and other legal proceedings in the ordinary course of business relating to our products or business, which could have a material adverse effect on our business, results of operations and financial condition.
In the ordinary course of business, we are subject to a variety of work-related and product-related claims, lawsuits and legal proceedings, including those relating to product liability, product warranty, product recall, personal injury, and other matters that are inherently subject to many uncertainties regarding the possibility of a loss to our business. Such matters could have a material adverse effect on our business, results of operations and financial condition if we are unable to successfully defend against or resolve these matters or if our insurance coverage is insufficient to satisfy any judgments against us or settlements relating to these matters. Although we have product liability insurance, the policies may not provide coverage for certain claims against us or may not be sufficient to cover all possible liabilities. Further, we may not be able to maintain insurance at commercially acceptable premium levels. Additionally, adverse publicity arising from claims made against us, even if the claims are not successful, could adversely affect our reputation or the reputation and sales of our products.
Our business operations could suffer significant losses from natural disasters, catastrophes, fire or other unexpected events.
Many of our business activities involve substantial investments in manufacturing facilities and many products are produced at a limited number of locations. These facilities could be materially damaged by natural disasters, such as floods, tornadoes, hurricanes and earthquakes, or by fire or other unexpected events such as adverse weather conditions or other disruptions to our facilities, supply chain or our customer's facilities. We could incur uninsured losses and liabilities arising from such events, including damage to our reputation, and/or suffer material losses in operational capacity, which could have a material adverse impact on our business, financial condition and results of operations.
Item 1B.UNRESOLVED STAFF COMMENTS
None.
Item 1C. CYBERSECURITY
Cybersecurity Risk Management and Strategy
We recognize cybersecurity as a critical aspect of our overall risk management program and are committed to maintaining a cybersecurity program to protect our information assets, systems, and operations. Our cybersecurity risk management program is integrated into our overall enterprise risk management program and shares common methodologies, reporting channels and governance processes that apply across the enterprise risk management program to other legal, compliance, strategic, operational and financial risks areas. We continuously evaluate and enhance our cybersecurity program based on lessons learned, industry best practices and feedback from internal and external stakeholders.
Key aspects of our cybersecurity risk management program include:
•risk assessments designed to help identify, prioritize and mitigate potential material cybersecurity risks to our critical systems and information;
•an internal Information Technology staff responsible for managing our cybersecurity risk assessment processes, our security controls and our response to cybersecurity incidents;
•the use of external service providers, where appropriate, to assess, test or otherwise assist with aspects of our security controls;
•cybersecurity awareness training of our associates, incident response personnel and senior management;
•a cybersecurity incident response plan that includes procedures for responding to cybersecurity incidents; and
•a third-party risk management process for key service providers, suppliers, and vendors.
We did not experience a material cybersecurity incident during the year ended December 30, 2023; however, the scope and impact of any future incident cannot be predicted. See "Item 1A. Risk Factors" for more information on our cybersecurity-related risks.
Cybersecurity Governance
Our Board of Directors (the "Board") has oversight responsibility for cybersecurity risk management. The Board oversees management's ongoing activities related to our cybersecurity risk management program. The management team is responsible for the implementation and execution of our cybersecurity program. In addition, the management team provides guidance and direction on cybersecurity priorities, resource allocation and risk tolerance levels. The Board receives quarterly updates from the management team on cybersecurity matters.
Item 2. PROPERTIES
The following table lists our facilities according to location, type of operation and approximate total floor space as of February 25, 2021:23, 2024:
| | | | | | | | | | | | | | |
| Location | | Type of Operation | | Approximate Square Feet |
| Administrative: | | | | |
| Saraland, AL* | | Administrative | | 29,000 | |
| Santa Ana, CA* | | Administrative | | 4,000 | |
| Calhoun, GA | | Administrative | | 10,600 | |
| Dalton, GA* | | Administrative | | 50,800 | |
| | Total Administrative | | 94,400 | |
| | | | |
| Manufacturing and Distribution: | | |
| Atmore, AL | | Carpet Manufacturing, Distribution / Warehouse | | 610,000 | |
| Roanoke, AL | | Carpet Yarn Processing | | 204,000 | |
| Saraland, AL* | | Carpet, Rug and Tile Manufacturing, DistributionWarehouse | | 384,000 | |
| Porterville, CA* | | Carpet Yarn Processing | | 249,000 | |
| Santa Ana, CA* | | Carpet and Rug Manufacturing, Distribution | | 200,000 | |
Adairsville, GAGA* | | Samples and Rug Manufacturing, Distribution | | 292,000 | |
Calhoun, GA * | | Distribution | | 99,000 | |
| Calhoun, GA | | Carpet Dyeing & Processing | | 193,300 | |
| Eton, GA | | Carpet Manufacturing, Distribution | | 408,000 | |
Dalton,Chatsworth, GA* | | Samples Warehouse and Distribution | | 40,000161,400 | |
| | Total Manufacturing and Distribution | | 2,679,3002,701,700 | |
| | | | |
| * Leased properties | | TOTAL | | 2,773,7002,796,100 | |
In addition to the facilities listed above, we lease a small amount of office space in various locations.
In our opinion, our manufacturing facilities are well maintained and our machinery is efficient and competitive. Operations of our facilities generally vary between 120 and 168 hours per week. Substantially all of our owned properties are subject to mortgages, which secure the outstanding borrowings under our senior credit facilities.these mortgages.
Item 3. LEGAL PROCEEDINGS
We have been sued together with 3M Company and approximately 3015 other named defendants and unnamed "fictitious defendants" including various carpet manufacturers and suppliers, in four lawsuits whereby the plaintiffs seek monetary damages and injunctive relief related to the manufacture, supply, and/or use of certain chemical products in the manufacture, finishing, and treatment of carpet products in the Dalton, Georgia area. These chemical products allegedly include without limitation perflourinated compounds ("PFC") such as perflourinated acid ("PFOA") and perfluorooctane sulfonate ("PFOS"). In each lawsuit, the plaintiff(s) alleges that, as a consequence of these actions, these chemical compounds have discharged or leached into the water systems around Dalton and then flow into the waters in or near the water bodies from which the plaintiff(s) draw for drinking water.
Two of these lawsuits werecivil action filed in Alabama. The first lawsuit in Alabama was filed on SeptemberJanuary 22, 2016 by The Water Works and Sewer Board of the City of Gadsden (Alabama) in the Circuit Court of Etowah County, Alabama (styled The Water Works and Sewer Board of the City of Gadsden v. 3M Company, et al., Civil Action No. 31-CV-2016-900676.00). The second lawsuit in Alabama was filed on May 15, 2017 by The Water Works and Sewer Board of the Town of Centre (Alabama) in the Circuit Court of Cherokee County, Alabama (styled The Water Works and Sewer Board of the Town of Centre v. 3M Company, et al., Civil Action No. 13-CV- 2017-900049.00). In each of these Alabama lawsuits, the plaintiff seeks damages that include but are not limited to the expenses associated with the future installation and operation of a filtration system capable of removing from the water the chemicals that are allegedly present as a result of the manufacturing and treatment process described above. Each plaintiff requests a jury trial, does not specify an amount of damages other than an assertion that its damages exceed $10,000, and requests injunctive relief. We have answered the complaint in each of these lawsuits, intend to defend those matters vigorously, and are unable to estimate our potential exposure to loss, if any, for these lawsuits at this time.
The other two lawsuits were filed in Georgia. The first lawsuit in Georgia was filed on November 19, 2019 by the City of Rome (Georgia)2024, in the Superior Court of FloydGordon County Georgia (styled Georgia. The case is styled: Moss Land Company, LLC and Revocable Living Trust of William Darryl Edwards, by and through William Darryl Edwards, Trustee vs. City of Rome, Georgia v. 3M Company,Calhoun et al., No. 19CV02405JFL003). Civil Action Number 24CV73929. The plaintiffplaintiffs are two landowners located in Gordon County Georgia. The relief sought is compensation for alleged damages to the plaintiffs’ real property, an injunction from alleged further damage to their property and abatement of alleged nuisance related to the presence of PFAS and related chemicals on their property. The Plaintiffs allege that case also seeks damages that include without limitationsuch chemicals have been deposited on their property by the expenses associated with the future installation and operationCity of a filtration system capable of removing from the water the chemicals that are allegedly presentCalhoun as a resultbyproduct of treating water containing such chemicals used by manufacturing operations in and around Calhoun Georgia. The defendants include the manufacturingCity of Calhoun Georgia, several other carpet manufacturers, and treatment process described above. The plaintiff requests a jury trialcertain manufacturers and also seeks injunctive relief. While thesellers of chemicals containing PFAS. No specific amount of damages is unspecified, the plaintiff asserts it has spent "tens of millions" to remove the chemicals from the county's water supply and will incur additional costs related to removing such chemicals in the future.been demanded. We have not yet answered the complaint intendbut anticipate denying liability and vigorously defending the matter.
On March 1, 2024, the City of Calhoun Georgia served an answer and crossclaim for Damages and injunctive relief in the pending matter styled: In re: Moss Land Company, LLC and Revocable living Trust of William Darryl Edwards by and through William Darryl Edwards, Trustee v. The Dixie Group, Inc. In the Superior Court of Gordon County Georgia. case Number: 24CV73929. In its Answer and Crossclaim defendant Calhoun sues The Dixie Group, Inc. and other named carpet manufacturing defendants for unspecified monetary damages and other injunctive relief based on injury claimed to have resulted from defendant’s use and disposal of chemical wastewater containing PFAS chemicals. Dixie Group has advised us that it intends to deny liability and to defend the matter vigorously, and are unable to estimate our potential exposure to loss, if any, at this time.
The second lawsuit in Georgia was originally filed on November 26, 2019 and is presented as a class action lawsuit by and on behalf of a class of persons who obtain drinking water from the City of Rome, Georgia and the Floyd County Water Department (and similarly situated persons) (generally, for these purposes, residents of Floyd County) (styled Jarrod Johnson v. 3M Company, et al., Civil Action No. 19-CV-02448-JFL-003) (the "Class Action Lawsuit"). On January 10, 2020, the Class Action Lawsuit was removed to the United States District Court for the Northern District of Georgia, Rome Division (styled Jarrod Johnson v. 3M Company, et al Civil Action No. 4:20-CV-0008-AT). The plaintiffs in this case allege their damages include without limitation the surcharges incurred for the costs of partially filtering the chemicals from their drinking water. The Complaint requests a jury trial and asserts damages unspecified in amount, in addition to requests for injunctive relief. We have filed a response to the Complaint, intend to defend the matter vigorously, and are unable to estimate our potential exposure, if any, at this time.vigorously.
Item 4. MINE SAFETY DISCLOSURES
Not applicable.
Pursuant to instruction G of Form 10-K the following is included as an unnumbered item to PART I.
EXECUTIVE OFFICERS OF THE REGISTRANT
The names, ages, positions and offices held by the executive officers of the registrant as of February 25, 2021, are23, 2024, are listed below along with their business experience during the past five years.
| | | | | | | | |
| Name, Age and Position | | Business Experience During Past Five Years |
| | |
Daniel K. Frierson, 7982
Chairman of the Board, and Chief Executive Officer, Director | | Director since 1973, Chairman of the Board since 1987 and Chief Executive Officer since 1980. He is the Chairman of the Company's Executive Committee. He is past Chairman of The Carpet and Rug Institute. He serves as Director of Astec Industries, Inc. headquartered in Chattanooga, Tennessee. |
| | |
D. Kennedy Frierson, Jr., 5356
Vice President and Chief Operating Officer, Director | | Director since 2012 and Vice President and Chief Operating Officer since August 2009. Vice President and President Masland Residential from February 2006 to July 2009. President Masland Residential from December 2005 to January 2006. Executive Vice President and General Manager, Dixie Home, 2003 to 2005. Business Unit Manager, Bretlin, 2002 to 2003. |
| | |
Allen L. Danzey, 5154
Vice President and Chief Financial Officer | | Chief Financial Officer since January 2020. Director of Accounting from May 2018 to December 2019. Commercial Division Controller from July 2009 to May 2018. Residential Division Controller and Senior Accountant from February 2005 to July 2009.
|
| | |
Thomas M. Nuckols, 53Jr., 56
Vice President and President, Dixie Residential | | Vice President and President of Dixie Residential since November 2017. Executive Vice President, Dixie Residential from February 2017 to November 2017. Dupont/Invista, from 1989 to 2017, Senior Director of Mill Sales and Product Strategy from 2015 to 2017. |
| | |
W. Derek Davis, 7073
Vice President, Human Resources and Corporate Secretary | | Vice President of Human Resources since January 1991 and Corporate Secretary since January 2016. Corporate Employee Relations Director, 1988 to 1991. |
The executive officers of the registrant are generally elected annually by the Board of Directors at its first meeting held after each annual meeting of our shareholders.
PART II.
Item 5.MARKET FOR THE REGISTRANT'S COMMON EQUITY, RELATED STOCKHOLDER MATTERS AND ISSUER PURCHASES OF EQUITY SECURITIES
Our Common Stock trades on the NASDAQ Global Market under the symbol DXYN. No market exists for our Class B Common Stock.
As of February 25, 2021,23, 2024, the total number of holders of our Common Stock was approximately 3,9003,000 including an estimated 3,2002,480 shareholders who hold our Common Stock in nominee names. The total number of holders of our Class B Common Stock was 10.
Recent Sales of Unregistered Securities
None.
Issuer Purchases of Equity Securities
| | | | | | | | | | | | | | | | | | | | | | | | | | |
| | | | | | | | |
| Fiscal Month Ending | | Total Number of Shares Purchased | | Average Price Paid Per Share | | Total Number of Shares Purchased as Part of Publicly Announced Plans or Programs | | Maximum Number (or approximate dollar value) of Shares That May Yet Be Purchased Under Plans or Programs |
| October 31, 2020 | | — | | | $ | — | | | — | | | |
| November 28, 2020 | | 375,938 | | * | 1.88 | | | 375,938 | | | |
| December 26, 2020 | | — | | | — | | | — | | | |
| Three Fiscal Months Ended December 26, 2020 | | 375,938 | | | $ | 1.88 | | | 375,938 | | | $ | 2,186,275 | |
| | | | | | | | | | | | | | | | | | | | | | | | | | | | | |
| | | | | | | | | |
| Fiscal Month Ending | | Total Number of Shares Purchased | (1) | Average Price Paid Per Share | | Total Number of Shares Purchased as Part of Publicly Announced Plans or Programs | | Maximum Number (or approximate dollar value) of Shares That May Yet Be Purchased Under Plans or Programs | (1) |
| November 4, 2023 | | — | | | $ | — | | | — | | | — | | |
| December 2, 2023 | | — | | | — | | | — | | | — | | |
| December 30, 2023 | | — | | | — | | | — | | | — | | |
| Three Fiscal Months Ended December 30, 2023 | | — | | | $ | — | | | — | | | $ | — | | |
*(1) On November 4, 2020, the Company’sAugust 3, 2022, our Board of Directors approved the repurchase of up to $2.9 million$3,000 of the Company’s common stock. Such purchases would be under a Planour Common Stock. Currently, we do not have an active 10b-5-1 plan to be entered into on or after November 6, 2020, pursuant to Rule 10b5-1repurchase shares of the Securities and Exchange act. Subject to the requirements of Rule 10b5-1, the repurchase plan would permit the purchase of up to $2.9 million of the Company’s shares beginning as of November 11, 2020 and continuing until June 2021. It is intended that purchases would be conducted to come within Rule 10b-18 and would be managed by Raymond James & Associates. The plan may be amended or terminated at any time in accordance with the Rule.Common Stock.
Quarterly Financial Data, Dividends and Price Range of Common Stock
Following are quarterly financial data, dividends and price range of Common Stock for the four quarterly periods in the years ended December 26, 2020 and December 28, 2019. Due to rounding, the totals of the quarterly information for each of the years reflected below may not necessarily equal the annual totals. There is a restriction on the payment of dividends under our revolving credit facility and we have not paid any dividends in the years ended December 26, 202030, 2023 and December 28, 2019.31, 2022.
The following table provides the price range of common stock for the four fiscal quarterly periods in the years ended December 30, 2023 and December 31, 2022.
| | | | | | | | | | | | | | | | | | | | | | | | | | |
| THE DIXIE GROUP, INC. |
| QUARTERLY PRICE RANGE OF COMMON STOCK |
|
| | FISCAL QUARTER |
| 2023 | | 1ST | | 2ND | | 3RD | | 4TH |
| | | | | | | | |
| Common Stock Prices: | | | | | | | | |
| High | | $ | 1.06 | | | $ | 1.36 | | | $ | 1.34 | | | $ | 0.98 | |
| Low | | 0.70 | | | 0.67 | | | 0.62 | | | 0.46 | |
| | | | | | | | |
| 2022 | | 1ST | | 2ND | | 3RD | | 4TH |
| | | | | | | | |
| Common Stock Prices: | | | | | | | | |
| High | | $ | 6.32 | | | $ | 3.44 | | | $ | 1.83 | | | $ | 1.25 | |
| Low | | 2.69 | | | 1.35 | | | 1.08 | | | 0.75 | |
| | | | | | | | | | | | | | | | | | | | | | | | | | |
| THE DIXIE GROUP, INC. |
| QUARTERLY FINANCIAL DATA, DIVIDENDS AND PRICE RANGE OF COMMON STOCK |
| (unaudited) (dollars in thousands, except per share data) |
| 2020 | | 1ST | | 2ND | | 3RD | | 4TH |
| Net sales | | $ | 80,578 | | | $ | 60,824 | | | $ | 85,920 | | | $ | 88,618 | |
| Gross profit | | 18,993 | | | 12,244 | | | 22,241 | | | 22,978 | |
| Operating income (loss) | | (1,336) | | | (5,625) | | | 2,563 | | | 1,479 | |
| Income (loss) from continuing operations | | (2,613) | | | (6,979) | | | 906 | | | (401) | |
| Income (loss) from discontinued operations | | (76) | | | (81) | | | (46) | | | 83 | |
| Net income (loss) | | $ | (2,689) | | | $ | (7,060) | | | $ | 860 | | | $ | (318) | |
| Basic earnings (loss) per share: | | | | | | | | |
| Continuing operations | | $ | (0.17) | | | $ | (0.46) | | | $ | 0.06 | | | $ | (0.03) | |
| Discontinued operations | | (0.01) | | | (0.01) | | | 0.00 | | | 0.01 | |
| Net income (loss) | | $ | (0.18) | | | $ | (0.47) | | | $ | 0.06 | | | $ | (0.02) | |
| Diluted earnings (loss) per share: | | | | | | | | |
| Continuing operations | | $ | (0.17) | | | $ | (0.46) | | | $ | 0.06 | | | $ | (0.03) | |
| Discontinued operations | | (0.01) | | | (0.01) | | | 0.00 | | | 0.01 | |
| Net income (loss) | | $ | (0.18) | | | $ | (0.47) | | | $ | 0.06 | | | $ | (0.02) | |
| | | | | | | | |
| Common Stock Prices: | | | | | | | | |
| High | | $ | 1.60 | | | $ | 1.04 | | | $ | 1.34 | | | $ | 2.92 | |
| Low | | 0.53 | | | 0.55 | | | 0.76 | | | 0.77 | |
| | | | | | | | |
| 2019 | | 1ST | | 2ND | | 3RD | | 4TH |
| Net sales | | $ | 88,606 | | | $ | 100,394 | | | $ | 95,447 | | | $ | 90,135 | |
| Gross profit | | 18,919 | | | 23,493 | | | 21,074 | | | 22,719 | |
| Operating loss | | (4,863) | | | 574 | | | (1,042) | | | 26,680 | |
| Loss from continuing operations | | (6,641) | | | (1,181) | | | (2,577) | | | 26,018 | |
| Income (loss) from discontinued operations | | (31) | | | (35) | | | 23 | | | (305) | |
| Net loss | | $ | (6,672) | | | $ | (1,216) | | | $ | (2,554) | | | $ | 25,713 | |
| Basic earnings (loss) per share: | | | | | | | | |
| Continuing operations | | $ | (0.42) | | | $ | (0.07) | | | $ | (0.16) | | | $ | 1.61 | |
| Discontinued operations | | (0.00) | | | (0.00) | | | (0.00) | | | (0.02) | |
| Net loss | | $ | (0.42) | | | $ | (0.07) | | | $ | (0.16) | | | $ | 1.59 | |
| Diluted earnings (loss) per share: | | | | | | | | |
| Continuing operations | | $ | (0.42) | | | $ | (0.07) | | | $ | (0.16) | | | $ | 1.60 | |
| Discontinued operations | | (0.00) | | | (0.00) | | | (0.00) | | | (0.02) | |
| Net loss | | $ | (0.42) | | | $ | (0.07) | | | $ | (0.16) | | | $ | 1.58 | |
| | | | | | | | |
| Common Stock Prices: | | | | | | | | |
| High | | $ | 1.47 | | | $ | 0.97 | | | $ | 1.50 | | | $ | 2.09 | |
| Low | | 0.70 | | | 0.34 | | | 0.51 | | | 1.04 | |
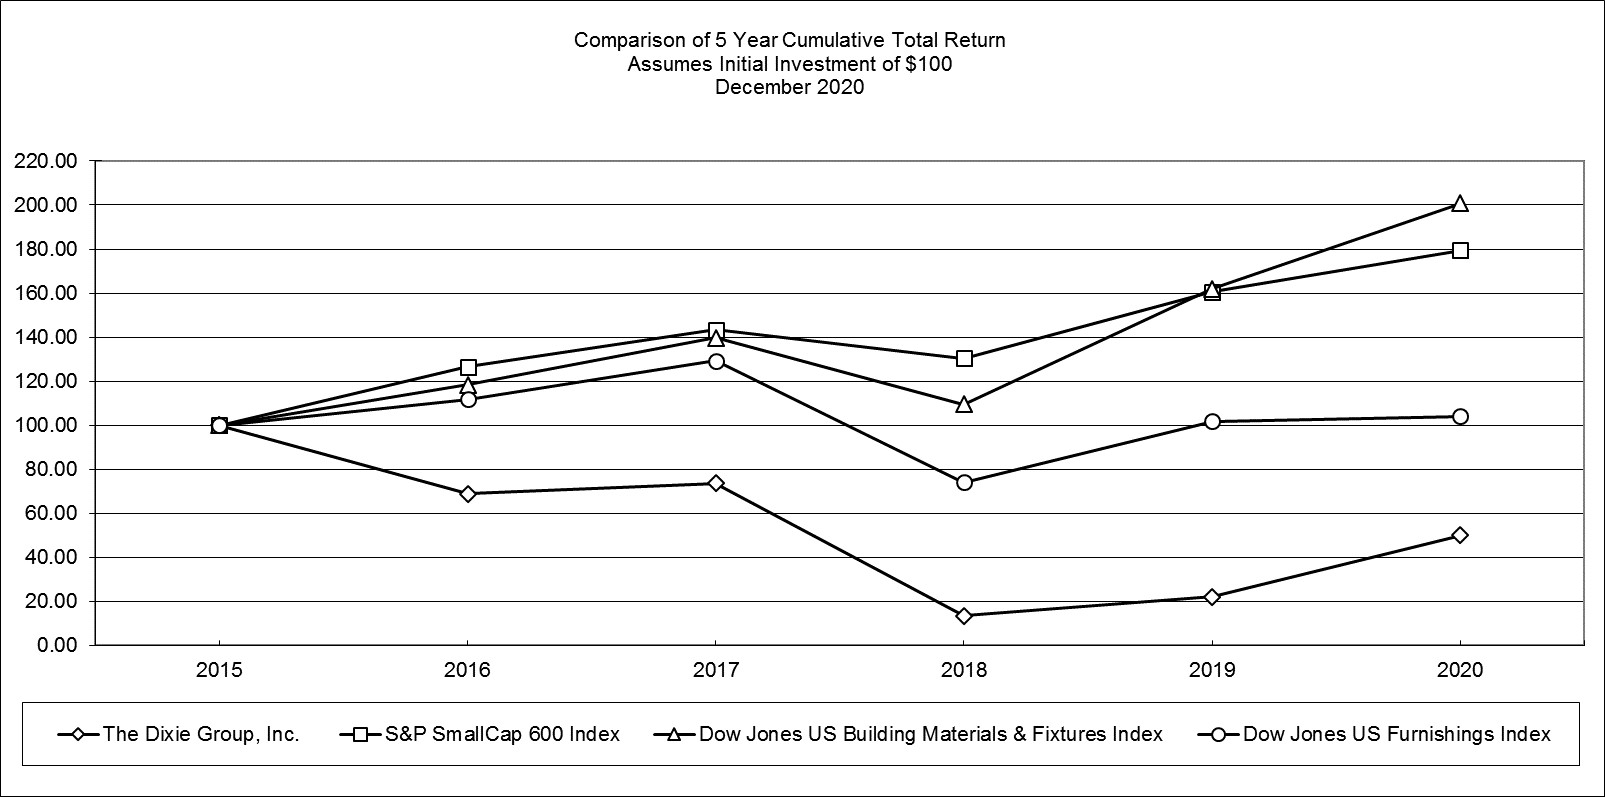
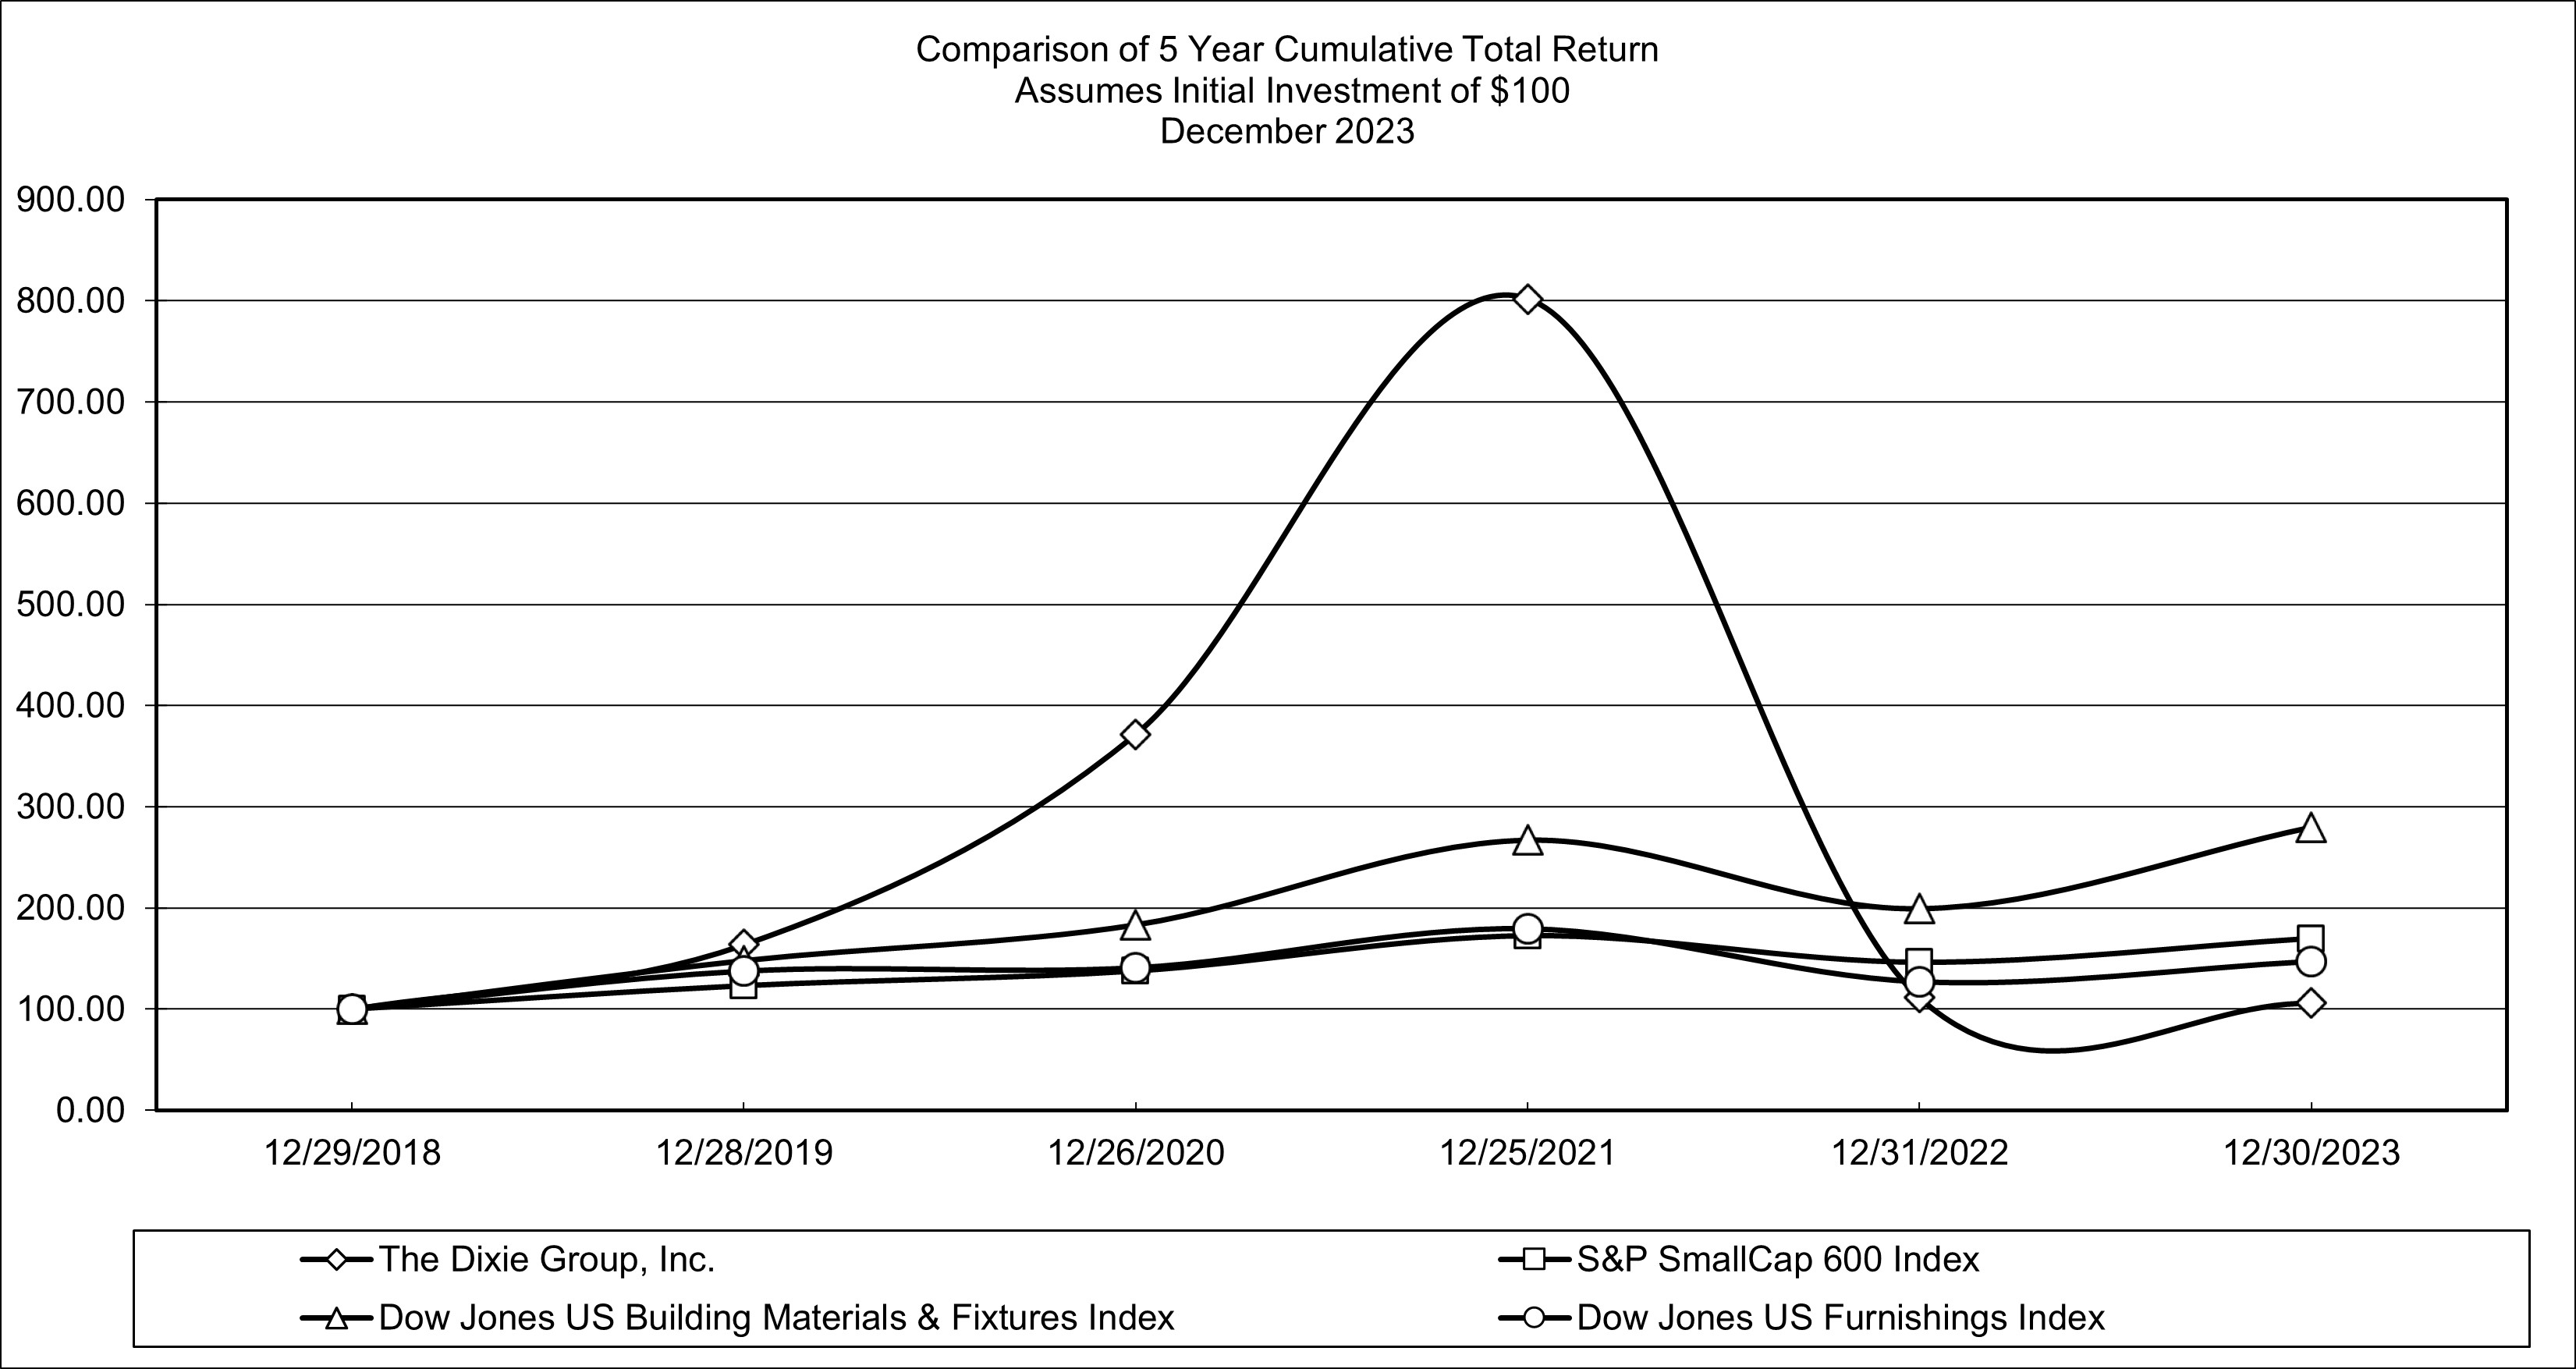
Shareholder Return Performance Presentation
We compare our performance to two different industry indices published by Dow Jones, Inc. The first of these is the Dow Jones US Furnishings Index, which is composed of publicly traded companies classified by Dow Jones in the furnishings industry. The second is the Dow Jones US Building Materials & Fixtures Index, which is composed of publicly traded companies classified by Dow Jones in the building materials and fixtures industry.
In accordance with SEC rules, setSet forth below is a line graph comparing the yearly change in the cumulative total shareholder return on our Common Stock against the total return of the Standard & Poor's Small Cap 600 Stock Index, plus both the Dow Jones US Furnishings Index and the Dow Jones US Building Materials & Fixtures Index, in each case for the five year period ended December 31, 2020.30, 2023. The comparison assumes that $100.00 was invested on December 31, 2015,29, 2018, in our Common Stock, the S&P Small Cap 600 Index, and each of the two Peer Groups, and assumes the reinvestment of dividends.
The foregoing shareholder performance presentation shall not be deemed "soliciting material" or to be "filed" with the Commission subject to Regulation 14A, or subject to the liabilities of Section 18 of the Exchange Act.
Item 6.6SELECTED FINANCIAL DATA
| | | | | | | | | | | | | | | | | | | | | | | | | | | | | | | | |
| The Dixie Group, Inc. |
| Historical Summary |
| (dollars in thousands, except share and per share data) |
| | | | | | | | | | |
| FISCAL YEARS | | 2020 (1) | | 2019 (2) | | 2018 (3) | | 2017 (4) | | 2016 (5) |
| OPERATIONS | | | | | | | | | | |
| Net sales | | $ | 315,939 | | | $ | 374,582 | | | $ | 405,033 | | | $ | 412,462 | | | $ | 397,453 | |
| Gross profit | | 76,456 | | | 86,205 | | | 86,991 | | | 101,213 | | | 95,425 | |
| Operating income (loss) | | (2,919) | | | 21,349 | | | (15,816) | | | 3,947 | | | (3,436) | |
| Income (loss) from continuing operations before taxes | | (9,400) | | | 14,962 | | | (22,310) | | | (1,813) | | | (8,829) | |
| Income tax provision (benefit) | | (312) | | | (657) | | | (831) | | | 7,509 | | | (3,622) | |
| Income (loss) from continuing operations | | (9,088) | | | 15,619 | | | (21,479) | | | (9,322) | | | (5,207) | |
| Depreciation and amortization | | 10,746 | | | 11,440 | | | 12,653 | | | 12,947 | | | 13,515 | |
| Dividends | | — | | | — | | | — | | | — | | | — | |
| Capital expenditures | | 1,760 | | | 4,235 | | | 4,052 | | | 12,724 | | | 4,904 | |
| Assets purchased under capital leases & notes, including deposits utilized and accrued purchases | | 1,314 | | | 240 | | | 389 | | | 859 | | | 427 | |
| FINANCIAL POSITION | | | | | | | | | | |
| Total assets | | $ | 232,868 | | | $ | 247,659 | | | $ | 252,778 | | | $ | 283,907 | | | 268,987* |
| Working capital | | 78,869 | | | 88,237 | | | 96,534 | | | 105,113 | | | 81,727 | |
| Long-term debt | | 72,041 | | | 81,667 | | | 120,251 | | | 123,446 | | | 98,256 | |
| Stockholders' equity | | 63,791 | | | 73,211 | | | 58,984 | | | 79,263 | | | 87,122 | |
| PER SHARE | | | | | | | | | | |
| Income (loss) from continuing operations: | | | | | | | | | | |
| Basic | | $ | (0.59) | | | $ | 0.96 | | | $ | (1.36) | | | $ | (0.59) | | | $ | (0.33) | |
| Diluted | | (0.59) | | | 0.95 | | | (1.36) | | | (0.59) | | | (0.33) | |
| Dividends: | | | | | | | | | | |
| Common Stock | | — | | | — | | | — | | | — | | | — | |
| Class B Common Stock | | — | | | — | | | — | | | — | | | — | |
| Book value | | 4.13 | | | 4.62 | | | 3.60 | | | 4.91 | | | 5.40 | |
| GENERAL | | | | | | | | | | |
| Weighted-average common shares outstanding: | | | | | | | | | | |
| Basic | | 15,315,713 | | | 15,821,574 | | | 15,763,890 | | | 15,698,915 | | | 15,638,112 | |
| Diluted | | 15,315,713 | | | 15,925,822 | | | 15,763,890 | | | 15,698,915 | | | 15,638,112 | |
| Number of shareholders (7) | | 3,900 | | | 2,800 | | | 2,800 | | | 2,800 | | | 3,000 | |
| Number of associates | | 1,441 | | | 1,526 | | | 1,646 | | | 1,930 | | | 1,746 | |
*These periods do not have prior period adoption adjustment or the right to return asset for the ASC 606 adoption.
(1). Includes expenses of $3,752 for facility consolidation and severance expenses in 2020.
(2)2019 results include expenses of $5,019 for facility consolidation and severance expenses and a gain of $25,121 for the sale of the Susan Street facility, see Note 20.
(3)2018 results include expenses of $3,167 for facility consolidation and severance expenses and $6,709 for the impairment of tangible and intangible assets.
(4)Includes expenses of $636 for facility consolidation and severance expenses in 2017.
(5)Includes expenses of $1,456, or $859 net of tax, for facility consolidation expenses in 2016.
(6)The approximate number of record holders of our Common Stock for 2016 through 2020 includes Management's estimate of shareholders who held our Common Stock in nominee names as follows: 2016 - 2,600 shareholders; 2017 - 2,400 shareholders; 2018 - 2,400 shareholders; 2019 - 2,400 shareholders; 2020 - 3,200 shareholders.[RESERVED]
Item 7. MANAGEMENT'S DISCUSSION AND ANALYSIS OF FINANCIAL CONDITION AND RESULTS OF OPERATIONS
The following discussion and analysis should be read in conjunction with our consolidated financial statements and related notes appearing elsewhere in this report.
OVERVIEW
Our business consists principally of marketing, manufacturing and selling floorcovering products to high-end residential and commercial customers through our various sales forces and brands. We focus primarily on the upper end of the floorcovering market where we believe we have strong brands and competitive advantages with our style and design capabilities and customer relationships. Our Fabrica, Masland, and Dixie HomeDH Floors brands have a significant presence in the high-end residential floorcovering markets. Our AtlasMasland brand participates in the upper end specified commercial marketplace. Dixie International sells all of our brands outside of the North American market.
Our business is primarily concentrated in areas of the soft floorcovering markets which include broadloom carpet, carpet tiles and rugs. However, in response to a significant shift in the flooring marketplace toward hard surface products, we have launched multiple hard surface initiatives in both our residential and commercial brands over the last few years. Our commercial brands offer Luxury Vinyl Flooring (“LVF”) products under the Calibré brand in the commercial markets. Our residential brands, Dixie Home and Masland Residential, offer Stainmaster® TRUCOR™ Luxury Vinyl Flooring and our premium residential brand, Fabrica, offers a high-end engineered wood line.
COVID-19 PANDEMIC
Beginning with the second week of March 2020, we started experiencing reduced volume as the result of the COVID-19 pandemic and related government restrictions. The sales decline continued into the second quarter through the third week of April after which we started to see a gradual and consistent improvement in sales through the end of the the year. Once the extent of the pandemic became apparent, we implemented our continuity plan to maintain the health and safety of our associates, preserve cash, and minimize the impact on our customers. We implemented cost reductions including cutting nonessential expenditures, reducing capital expenditures, rotating layoffs and furloughs, select job eliminations and temporary salary reductions. We also deferred new product introductions and reduced our sample and marketing expenses for 2020. We pursued and closed on financing initiatives that increased our borrowing availability and strengthened our financial position.
The recovery of sales in the residential markets, that began in the second quarter of 2020, continued through the end of the year. Sales volume in the commercial markets have continued to be at lower levels. Many of the cost reductions implemented in the second quarter as part of our COVID-19 recovery plan have been made permanent even as sales volumes improve. As allowed under the Coronavirus Aid, Relief, and Economic Security (CARES) Act, we deferred payment of certain payroll related taxes over the second and third quarter in the total amount of $1.8 million. We also recognized a credit of $2.1 million in the fourth quarter of 2020 related to certain employee retention credits as defined in the CARES Act. Despite the improvement in sales activity, as cases of COVID-19 continue to be reported and as government authorities consider necessary safety measures, we cannot be certain as to any additional future impact of the COVID-19 crisis.
During 2020, our net sales decreased 15.7% compared with net sales in 2019. Sales of residential products decreased 7.0% in 2020 versus 2019. Residential soft surface sales were down 13.6% in 2020 as compared to 2019, while, we estimate, the industry was down in the mid single digits. Our residential soft surface sales in 2020 were negatively impacted by a change in emphasis to hard surfaces by certain mass merchant customers. Residential hard surface sales increased by 77% in 2020 relative to sales in 2019. Despite recent slow activity, we anticipate the residential housing market will have steady but moderate growth over the next several years. Commercial product sales decreased 37.0% during 2020. Soft surface sales of commercial products were down 37.5%, while, we believe, the industry was down in the low twenty percentile. Commercial markets did not recover from the impact of the pandemic as many customers in the hospitality and restaurant industries continue to be severely impacted. Customers in corporate environments where many employees are working remotely have delayed projects. We anticipate the commercial market to remain relatively flat in 2021.
For the year ended December 26, 2020, we had an operating loss of $2.9 million compared with an operating income of $21.3 million in 2019. In 2019, we recorded a $25.1 million gain on the sale of our building in Santa Ana, California. Without this gain on sale we had an operating loss of $3.8 million. Gross profit as a percent of sales improved year over year despite the reduced sales volume in 2020 and the resulting under absorbed manufacturing costs. This was primarily the result of operating improvements related to the Profit Improvement Plan (the "Plan") that was fully implemented in 2019. We also reduced plant running schedules in 2020 to reduce inventories to a more appropriate level and implemented temporary and permanent cost reductions in response to the COVID 19 pandemic and the resulting reduction in volume.
RESULTS OF OPERATIONS
Fiscal Year Ended December 26, 202030, 2023 Compared with Fiscal Year Ended December 28, 201931, 2022
| | | | Fiscal Year Ended (amounts in thousands) | |
| December 26, 2020 | % of Net Sales | | December 28, 2019 | % of Net Sales | | Increase (Decrease) | % Change |
| December 30, 2023 | |
| December 30, 2023 | |
| December 30, 2023 | | % of Net Sales | | December 31, 2022 | % of Net Sales | | Increase (Decrease) | % Change |
| Net sales | Net sales | $ | 315,939 | | 100.0 | % | | $ | 374,582 | | 100.0 | % | | $ | (58,643) | | (15.7) | % | Net sales | $ | 276,343 | | 100.0 | 100.0 | % | | $ | 303,570 | | 100.0 | 100.0 | % | | $ | (27,227) | | (9.0) | (9.0) | % |
| Cost of sales | Cost of sales | 239,483 | | 75.8 | % | | 288,377 | | 77.0 | % | | (48,894) | | (17.0) | % | Cost of sales | 202,464 | | 73.3 | 73.3 | % | | 249,946 | | 82.3 | 82.3 | % | | (47,482) | | (19.0) | (19.0) | % |
| Gross profit | Gross profit | 76,456 | | 24.2 | % | | 86,205 | | 23.0 | % | | (9,749) | | (11.3) | % | Gross profit | 73,879 | | 26.7 | 26.7 | % | | 53,624 | | 17.7 | 17.7 | % | | 20,255 | | 37.8 | 37.8 | % |
| Selling and administrative expenses | Selling and administrative expenses | 75,731 | | 24.0 | % | | 83,825 | | 22.4 | % | | (8,094) | | (9.7) | % | Selling and administrative expenses | 74,136 | | 26.8 | 26.8 | % | | 76,957 | | 25.4 | 25.4 | % | | (2,821) | | (3.7) | (3.7) | % |
| Other operating (income) expense, net | Other operating (income) expense, net | (108) | | — | % | | (23,988) | | (6.4) | % | | 23,880 | | (99.5) | % | Other operating (income) expense, net | (9,172) | | (3.3) | (3.3) | % | | 239 | | 0.1 | 0.1 | % | | (9,411) | | (3,937.7) | (3,937.7) | % |
| Facility consolidation and severance expenses, net | Facility consolidation and severance expenses, net | 3,752 | | 1.2 | % | | 5,019 | | 1.3 | % | | (1,267) | | (25.2) | % | Facility consolidation and severance expenses, net | 3,867 | | 1.4 | 1.4 | % | | 4,584 | | 1.5 | 1.5 | % | | (717) | | (15.6) | (15.6) | % |
| Operating income (loss) | Operating income (loss) | (2,919) | | (1.0) | % | | 21,349 | | 5.7 | % | | (24,268) | | (113.7) | % | Operating income (loss) | 5,048 | | 1.8 | 1.8 | % | | (28,156) | | (9.3) | (9.3) | % | | 33,204 | | (117.9) | (117.9) | % |
| Interest expense | Interest expense | 5,803 | | 1.8 | % | | 6,444 | | 1.7 | % | | (641) | | (9.9) | % | Interest expense | 7,217 | | 2.6 | 2.6 | % | | 5,340 | | 1.8 | 1.8 | % | | 1,877 | | 35.1 | 35.1 | % |
| Other (income) expense, net | Other (income) expense, net | 678 | | 0.2 | % | | (57) | | — | % | | 735 | | (1,289.5) | % | Other (income) expense, net | (431) | | (0.2) | (0.2) | % | | 6 | | — | — | % | | (437) | | (7,283.3) | (7,283.3) | % |
| | Income (loss) before taxes | (9,400) | | (3.0) | % | | 14,962 | | 4.0 | % | | (24,362) | | (162.8) | % |
| Income tax benefit | (312) | | (0.1) | % | | (657) | | (0.2) | % | | 345 | | (52.5) | % |
| Income (loss) from continuing operations | (9,088) | | (2.9) | % | | 15,619 | | 4.2 | % | | (24,707) | | (158.2) | % |
| Loss from discontinued operations | (120) | | — | % | | (348) | | (0.1) | % | | 228 | | (65.5) | % |
| Loss from continuing operations before taxes | |
| | Net income (loss) | $ | (9,208) | | (2.9) | % | | $ | 15,271 | | 4.1 | % | | $ | (24,479) | | (160.3) | % |
| Loss from continuing operations before taxes | |
| | Loss from continuing operations before taxes | | (1,738) | | (0.6) | % | | (33,502) | | (11.1) | % | | 31,764 | | (94.8) | % |
| Income tax provision (benefit) | | Income tax provision (benefit) | 214 | | 0.1 | % | | (87) | | — | % | | 301 | | (346.0) | % |
| Loss from continuing operations | | Loss from continuing operations | (1,952) | | (0.7) | % | | (33,415) | | (11.1) | % | | 31,463 | | (94.2) | % |
| Loss from discontinued operations, net of tax | | Loss from discontinued operations, net of tax | (766) | | (0.3) | % | | (1,664) | | (0.5) | % | | 898 | | (54.0) | % |
| | Net loss | |
| Net loss | |
| Net loss | | $ | (2,718) | | (1.0) | % | | $ | (35,079) | | (11.6) | % | | $ | 32,361 | | (92.3) | % |
Net Sales. Net sales for the year ended December 26, 202030, 2023 were $315.9$276.3 million compared with $374.6$303.6 in the year-earlierprior period, a decrease of 15.7%9.0% for the year-over-year comparison. SalesFiscal year 2022 consisted of residential floorcovering products were down 7.0% and sales of commercial floorcovering products decreased 37.0%. Net53 weeks as compared to fiscal year 2023 at 52 weeks. On an average weekly basis, sales in our residential markets have begunfiscal year 2023 amounted to recover from$5.3 million per week compared to $5.7 million per week in 2022, or a 7.2% decrease. The decrease in net sales in 2023 was primarily the COVID-19 pandemic but our commercial markets continue to experience reduced sales activity.result of lower demand within the floorcovering industry and related markets.
Gross Profit. Gross profit, as a percentage of net sales, increased 1.29.0 percentage points in 20202023 compared with 2019. Cost reductions resulting2022. In the fourth quarter of 2021, our primary supplier of raw materials for our nylon broadloom products announced an abrupt exit from the business and imposed exorbitantly high price increases on us at levels that we were unable to pass on to our Profit Improvement Plan, which was implementedcustomers. We completed the conversion of our new lower cost raw materials from multiple suppliers in the prior year,third quarter of 2022, but gross profit margins were negatively impacted throughout 2022.
In addition, our gross profit margins in 2022 were negatively impacted by extreme increases in the cost of ocean freight for our imported inventory. The rapid pace and net expense reductionshigh level of the increases prevented us from being able to pass along all of the implementationcosts through our pricing to customers. These rates had returned to lower, more expected levels by the end of 2022. In addition, inflationary pressure also negatively impacted our gross profit margins in 2022.
The historically high gross profit margins in 2023 reflect the benefits of our COVID-19 Continuity Plan contributedconversion to raw materials suppliers at lower price points, the improved gross profit margin. These cost savings were partially offset by under absorbed fixed costs due to reduced sales volume after the first quarterconsolidation of our east coast tufting facilities and costs related to the COVID-19 Recovery Plan.efficiencies within our manufacturing operations.
Selling and Administrative Expenses. Selling and administrative expenses were $75.7$74.1 million in 20202023 compared with $83.8$77.0 million in 2019, but higher as a percentage of the lower sales volume.2022. Selling and administrative expenses as a percent of the net sales for 20202023 and 20192022 were 24.0%26.8% and 22.4%25.4% respectively. The reductionContinued investments in expenses forsamples to support the introduction of our new products, including products within our new decorative lines, drove the increase in selling and administrative expenses in 2020 was the resultas a percent of cost cuts in response to the COVID-19 pandemic and cost reductions in place from the Profit Improvement Plan implemented in previous years.net sales.
Other Operating (Income) Expense, Net. Net other operating (income) expense was an income of $108$9.2 million in 2023 compared with an expense of $239 thousand in 2020 compared with2022. In 2023, we completed a sale and leaseback of our Adairsville, Georgia distribution center resulting in a gain of $8.2 million. In addition, we leased out excess space in our Saraland, Alabama facility resulting in $705 thousand of lease income of $24.0 million in 2019.2023. In 2020,2022, the incomeexpense was primarily the result of a loss on impairment of assets of $267 thousand and retirement expenses of $483 thousand net gains on currency exchange rate adjustments. In 2019, we recognizedof additional insurance proceeds of $394 thousand related to a $25.1 million gain on the sale ofclaim at our facility in Santa Ana, California.Roanoke, Alabama facility.
Facility Consolidation and Severance Expenses, Net. Facility consolidation expenses were $3.8$3.9 million in 20202023 compared with $5.0$4.6 million in the year-earlier period.2022. The facility consolidation expenses incurred during 20202023 and 2022 were primarily related to our COVID-19 Continuity Plan including severanceplan for the consolidation of our east coast manufacturing to better align our production capacity with our sales volume and financing related charges, as well as residual costs fromconcentrate production into our Profit Improvement Plan including adjustments for workers' compensation related charges. The expenses in 2019 were primarily related to the Profit Improvement Plan.lower cost facility.
Operating Income (Loss). The operating lossincome in 20202023 was $2.9$5.0 million compared to incomean operating loss of $21.3$28.2 million in 2019.2022. The 2019 income was heavily driven by the gain of $25.1 million on the sale of our Santa Ana facility. Adjusted for this transaction, the 2019 operating loss would have been $3.8 million. The 2020 operating2022 loss was the result of lower sales volume due to lower demand and the related under absorbed fixedloss of our largest mass merchant customer, higher costs as well as $3.8 million in restructuring expenses primarily related to COVID recovery. These negative impacts were mitigated byour former primary fiber supplier exiting the business, higher gross profit marginsfreight cost on imported goods, higher material costs as a result of cost reductions relatedinflation, increased sample costs and high restructuring expenses from our plan to our Profit Improvement Plan from prior years and our current year COVID recovery initiatives.consolidate the east coast manufacturing.
Interest Expense. Interest expense of $5.8was $7.2 million in 2020 was a reduction of $641 thousand from $6.42023 compared with $5.3 million incurred in 2019.2022. The reductionincrease is the result of generally lowerhigher interest rates and lower levels of debt in 2020 offset by financing costs andthroughout 2023.
adjustments Net other (income) expense was income of $431 thousand in 2023 compared with $6 thousand of expense in 2022. The 2023 income included a gain of $625 thousand related to other comprehensive income asan extinguishment of a resultdebt arrangement offset by an expense of $206 thousand related to the write-off of previously deferred financing initiatives in the fourth quarter and elimination ofcosts related swap agreements.to our Adairsville, Georgia note payable.
Income Tax Benefit.Provision (Benefit). Our effective income tax rate was a benefitprovision of 3.32%12.3% in 2020.2023. The benefitprovision relates to federal and state cash taxes paid offset by certain federal and state credits and also includes a benefit for the termination of certain derivative contracts for which there existed stranded tax effects within other comprehensive income (loss).income. In 2020,2023, we increaseddecreased our valuation allowance by $2.1 million$384 thousand related to our net deferred tax asset and specific federal and state net operating losslosses and federal and state tax credit carryforwards.
Our effective income tax rate was a benefit of 4.39%0.26% in 2019.2022. The provision benefit relates to federal and state cash taxes paid offset by certain federal and state credits and also includes a benefit for the reductiontermination of certain indefinite lived assets not covered by our valuation allowance. In 2019, we decreased our valuation allowance by $3.7 million related to our net deferredderivative contracts for which there existed stranded tax asset and specific state net operating loss and state credit carryforwards.effects within other comprehensive income.
Net (Income) Loss. Continuing operations reflected a loss of $9.1$2.0 million, or $0.59$0.13 per diluted share in 2020,2023, compared with incomea loss from continuing operations of $15.6$33.4 million, or $0.95$2.21 per diluted share in 2019.2022. Our discontinued operations reflected a loss of $120$766 thousand, or $0.01$0.05 per diluted share in 20202023 compared with a loss of $348 thousand,$1.7 million, or $0.02$0.11 per diluted share in 2019.2022. Including discontinued operations, we had a net loss of $9.2$2.7 million, or $0.60$0.18 per diluted share, in 20202023 compared with a net incomeloss of $15.3$35.1 million, or $0.93$2.32 per diluted share, in 2019.
Fiscal Year Ended December 28, 2019 Compared with Fiscal Year Ended December 29, 2018
| | | | | | | | | | | | | | | | | | | | | | | | | | |
| | Fiscal Year Ended (amounts in thousands) | | | |
| December 28, 2019 | % of Net Sales | | December 29, 2018 | % of Net Sales | | Increase (Decrease) | % Change |
| Net sales | $ | 374,582 | | 100.0 | % | | $ | 405,033 | | 100.0 | % | | $ | (30,451) | | (7.5) | % |
| Cost of sales | 288,377 | | 77.0 | % | | 318,042 | | 78.5 | % | | (29,665) | | (9.3) | % |
| Gross profit | 86,205 | | 23.0 | % | | 86,991 | | 21.5 | % | | (786) | | (0.9) | % |
| Selling and administrative expenses | 83,825 | | 22.4 | % | | 92,473 | | 22.8 | % | | (8,648) | | (9.4) | % |
| Other operating (income) expense, net | (23,988) | | (6.4) | % | | 458 | | 0.1 | % | | (24,446) | | (5,337.6) | % |
| Facility consolidation and severance expenses, net | 5,019 | | 1.3 | % | | 3,167 | | 0.8 | % | | 1,852 | | 58.5 | % |
| Impairment of assets | — | | — | % | | 6,709 | | 1.7 | % | | (6,709) | | — | % |
| Operating income (loss) | 21,349 | | 5.7 | % | | (15,816) | | (3.9) | % | | 37,165 | | (235.0) | % |
| Interest expense | 6,444 | | 1.7 | % | | 6,491 | | 1.6 | % | | (47) | | (0.7) | % |
| Other (income) expense, net | (57) | | — | % | | 3 | | — | % | | (60) | | (2,000.0) | % |
| | | | | | | | |
| | | | | | | | |
| Income (loss) before taxes | 14,962 | | 4.0 | % | | (22,310) | | (5.5) | % | | 37,272 | | (167.1) | % |
| Income tax provision (benefit) | (657) | | (0.2) | % | | (831) | | (0.2) | % | | 174 | | (20.9) | % |
| Income (loss) from continuing operations | 15,619 | | 4.2 | % | | (21,479) | | (5.3) | % | | 37,098 | | (172.7) | % |
| Income (Loss) from discontinued operations | (348) | | (0.1) | % | | 95 | | — | % | | (443) | | (466.3) | % |
| | | | | | | | |
| Net income (loss) | $ | 15,271 | | 4.1 | % | | $ | (21,384) | | (5.3) | % | | $ | 36,655 | | (171.4) | % |
Net Sales. Net sales for the year ended December 28, 2019 were $374.6 million compared with $405.0 million in the year-earlier period, a decrease of 7.5% for the year-over-year comparison. Sales of residential floorcovering products were down 7.2% primarily due to our mass merchant customers shifting their emphasis from soft surface to hard surface floor coverings. Sales of commercial floorcovering products decreased 9.4%. The decrease in commercial net sales was due to distractions caused by the restructuring of our commercial operations and sales force during the first half of 2019.
Gross Profit. Gross profit, as a percentage of net sales, increased 1.5 percentage points in 2019 compared with 2018. Gross profit in 2019 was favorably impacted by savings from our Profit Improvement Plan. Gross profit in 2018 was negatively impacted by inventory write downs related to the Profit Improvement Plan.
Selling and Administrative Expenses. Selling and administrative expenses were $83.8 million in 2019 compared with $92.5 million in 2018, a decrease of .4% as a percentage of sales. The improved results in the 2019 selling expenses are the result of changes made as part of our Profit Improvement Plan.
Other Operating (Income) Expense, Net. Net other operating (income) expense was income of $24.0 million in 2019 compared with expense of $458 thousand in 2018. In 2019 we recognized a gain of $25.1 million for the sale of our Susan Street manufacturing facility in Santa Ana, California.
Facility Consolidation and Severance Expenses, Net. Facility consolidation expenses were $5.0 million in 2019 compared with $3.2 million in the year-earlier period. Facility consolidation expenses increased in 2019 as we completed our Profit
Improvement Plan, announced in 2017, which included the consolidation of our two commercial brands, consolidation of commercial manufacturing operations and sales forces, and an overall review of corporate wide operations and functions. As a result of this plan, we incurred expenses of $5.0 million during 2019 primarily related to facility consolidation expenses and severance costs.
Asset Impairments. There were no expenses related to asset impairments recorded in 2019. The asset impairments recorded in 2018 were $6.7 million. The asset impairments incurred in 2018 included the impairment of fixed assets as part of our Profit Improvement Plan ($1.2 million). We also incurred intangible asset impairments ($2.1 million) and goodwill impairment ($3.4 million).
Operating Income (Loss). Operations reflected operating income of $21.3 million in 2019 compared with an operating loss of $15.8 million in 2018. The operating results for 2019 were heavily impacted by the $25.1 million gain on the sale of our building in Santa Ana, California. This gain was partially offset by lower gross profit as a result of lower sales volume and expenses related to the Profit Improvement Plan.
Interest Expense. Interest expense decreased $47 thousand in 2019 as compared to 2018 principally due to lower levels of debt in the last quarter of the year as a result of the sale of our building in Santa Ana, California.
Income Tax Provision (Benefit). Our effective income tax rate was a benefit of 4.39% in 2019. The benefit relates to certain federal and state credits and also includes a benefit for the reduction of certain indefinite lived assets not covered by our valuation allowance. In 2019, we decreased our valuation allowance by $3.7 million related to our net deferred tax asset and specific state net operating loss and state credit carryforwards.
Our effective income tax rate was a benefit of 3.72% in 2018. The benefit relates to certain federal and state credits and also includes a benefit for the reduction of certain indefinite lived assets not covered by our valuation allowance. In 2018, we increased our valuation allowance by $4 million related to our net deferred tax asset and specific state net operating loss and state credit carryforwards.
Net (Income) Loss. Continuing operations reflected income of $15.6 million, or $.95 per diluted share in 2019, compared with a loss from continuing operations of $21.5 million, or $1.36 per diluted share in 2018. Our discontinued operations reflected a loss of $348 thousand, or $0.02 per diluted share in 2019 compared with income of $95 thousand, or $0.01 per diluted share in 2018. Including discontinued operations, we had a net income of $15.3 million, or $0.96 per diluted share, in 2019 compared with a net loss of $21.4 million, or $1.35 per diluted share, in 2018.2022.
LIQUIDITY AND CAPITAL RESOURCES
During the year ended December 26, 2020,30, 2023, cash provided by continuing operations was $13.5$4.2 million driven by reductions in inventorya reduction of $10.1receivables of $1.1 million and increasesa $7.5 million decrease in accounts payableinventories. These favorable contributions to cash were offset by a $2.0 million increase in prepaid and other accrued expenses of $1.4 million. The reduction in inventories was the result of operational efficiencies. The increase in accounts payable and accrued expenses was primarily driven by accruals for raw material purchases in order to replenish inventory to meet the growing demand.current assets.
Capital expenditures were eliminated or postponed after the onset of the COVID 19 pandemic. Capital asset acquisitions forNet cash provided by investing activities was $15.1 million during the year ended December 26, 2020 were $1.830, 2023. This amount was primarily the result of net proceeds of $16.1 million from the sale of our Adairsville, Georgia distribution center offset by the purchase of property, plant and equipment of $1.0 million. Depreciation and amortization for the year ended December 26, 2020 were $10.7 million. We expect capital expenditures to be approximately $5.0 million in 2021 while depreciation and amortization is expected to be approximately $10.1 million. Planned capital expenditures in 2021 are primarily for new equipment.
During the year ended December 26, 2020,30, 2023, cash used in financing activities was $10.7$18.0 million. We had net payments of $31.3$4.2 million on the revolving credit facility. We had payments of $11.4 million on building and other term loans which included $10.4 payoff of the Adairsville, Georgia facility concurrent with the sale of the facility. Borrowings on notes payable, net of payments increased cash by $23.7 millionwas $822 thousand and finance leases were reduced by payments net of borrowings, of $2.5 million.$256 thousand. The balance in amount of checks outstanding in excess of cash at year end 2020 increased2023 decreased from prior year resulting in a cash inflowoutflow of $2.1 million.
During the fourth quarter of 2020, the Company replaced its senior credit facility with Wells Fargo Capital Finance with a $75 million, senior secured Revolving Credit Facility with Fifth Third Bank National Association. As of December 26, 2020, availability under the new senior secured facility was $43.3 million. Additionally, the Company entered into two fixed asset loans in the combined principal amount of $25$1.3 million.
We believe, after having reviewed various financial scenarios, our operating cash flows, credit availability under our revolving credit facility and other sources of financing are adequate to finance our anticipated liquidity requirements under current operating conditions. We cannot predict, and are unable to know,have specifically considered the long-term impact of continued operating losses on our liquidity position and our ability to comply with financial covenants by our primary lenders. As part of our evaluation, we considered the COVID-19 pandemic and the related economic consequences or how these events may affectimproved gross margins driven by cost reductions implemented under our future liquidity. As noted above and in Footnote 10, availabilityEast Coast Consolidation Plan. Availability under the new Senior Secured Revolving Credit Facility on December 26, 202030, 2023 was $43.3$14.1 million. Significant additional cash expenditures above our normal liquidity requirements, significant deterioration in economic conditions or continued operating losses could affect our business and require supplemental financing or other funding sources. There can be no assurance that suchother supplemental financing or other sources of funding can be obtained or will be obtained on terms favorable to us. We cannot predict, and are unable to know, the long-term impact of the COVID-19 pandemic and the related economic consequences or how these events may affect our future liquidity.
Debt Facilities
Revolving Credit Facility. During the fourth quarter,On October 30, 2020, we entered into a $75.0 million Senior Secured Revolving Credit Facility with Fifth Third Bank National Association as lender. The loan is secured by a first priority security interest on all accounts receivable, cash, and inventory, and provides for borrowing limited by certain percentages of values of the accounts receivable and inventory. The revolving credit facility matures on October 30, 2025.
At our election, advances of the revolving credit facility bear interest at annual rates equal to either (a) LIBORSOFR (plus a 0.10% SOFR adjustment) for 1 2, or 3 month periods, as defined with a floor orof 0.75% or published SOFR and previously LIBOR, plus an applicable margin ranging between 1.50% and 2.00%, or (b) the higher of the prime rate plus an applicable margin ranging between 0.50% and 1.00%. The applicable margin is determined based on availability under the revolving credit facility with margins increasing as availability decreases. The applicable margin can be increased by 0.50% if the fixed charge coverage ratio is below a 1.10 to 1.00 ratio. As of December 26, 2020,30, 2023, the applicable margin on our revolving credit facility was 1.75%.2.50% for SOFR and 1.50% for Prime due to the fixed charge coverage ratio being below 1.10 to 1.00. We pay an unused line fee on the average amount by which the aggregate commitments exceed utilization of the revolving credit facility equal to 0.25% per annum. The weighted-average interest rate on borrowings outstanding under the revolving credit facility was 2.68%8.15% at December 26, 202030, 2023 and 4.79% at6.81% for December 28, 2019.31, 2022.
The agreement is subject to customary terms and conditions and annual administrative fees with pricing varying on excess availability and a fixed charge coverage ratio. The agreement is also subject to certain compliance, affirmative, and financial covenants. As of the reporting date, we are in compliance with all such applicable financial covenants. We are only subject to the financial covenants if borrowing availability is less than $8.3 million, which is equal to 12.5% of the lesser of the total loan availability of $75.0 million or total collateral available, and remains until the availability is greater than 12.5% for thirty consecutive days. As of December 26, 2020,30, 2023, the unused borrowing availability under the revolving credit facility was $43,344.
Effective October 30, 2020, our previous Senior Secured Credit Facility with Wells Fargo Capital Finance, LLC was terminated and repaid, with the subsequent new loans, by us upon notice to the lender in accordance with the terms of the facility.$14.1 million.
Term Loans. Effective October 28, 2020, we entered into a $10.0 million principal amount USDA Guaranteed term loan with AmeriState Bank as lender. The term of the loan is 25 years and bears interest at a minimum 5.00% rate or 4.00% above 5-year treasury, to be reset every 5 years at 3.5% above 5-year treasury. The loan is secured by a first mortgage on our Atmore, Alabama and Roanoke, Alabama facilities andfacilities. The loan requires certain compliance, affirmative, and financial covenants and, as of the reporting date, we are in compliance with or have received waivers for all such financial covenants.
Effective October 29, 2020, we entered into a $15.0 million principal amount USDA Guaranteed term loan with the Greater Nevada Credit Union as lender. The term of the loan is 10 years and bears interest at a minimum 5.00% rate or 4.00% above 5- year5-year treasury, to be reset after 5 years at 3.5% above 5-year treasury. The loan is secured by a first lien on a substantial portion of the Company’s machinery and equipment and a second lien on our Atmore and Roanoke facilities. Payments on the loan are interest only over the first three years and principal and interest over the remaining seven years. The loan is secured by a first lien on a substantial portion of our machinery and equipment, a certificate of deposit and a second lien on our Atmore and Roanoke facilities. The loan requires certain compliance, affirmative, and financial covenants and, as of the reporting date, we are in compliance with or have received waivers for all such financial covenants.
Notes Payable - Buildings. On November 7, 2014,March 16, 2022, we entered into a ten-year $8.3twenty-year $11.0 million note payable to purchase a previously leasedrefinance our existing note payable on our distribution center in Adairsville, Georgia.Georgia (the "Property"). The note payable is scheduled to mature on November 7, 2024bore interest at a fixed annual rate of 3.81%. On December 14, 2023, we sold the Property and iscompleted a successful sale and leaseback of the Property. We paid off the existing note in the amount of $10.4 million. The note had been secured by the distribution center. The note payable bears interest atProperty and a variable rate equal to one-month LIBOR plus 2.0% and is payable in equal monthly installments of principal of $35 thousand, plus interest calculated on the declining balanceguarantee of the note,Company. Concurrent with a final paymentthe sale of $4.2 million due on maturity. In addition,the Adairsville, Georgia distribution center, we entered into an interest rate swapoperating lease to lease back the property for a term of 10 years with two 5 year renewal options. The initial annual rent is $1.5 million for the first five years increasing to an amortizing notionalannual amount effective November 7, 2014 which effectively fixesof $1.6 million for the interest rate at 4.50%.second five years. We are responsible for normal maintenance of the building and facilities.
Notes Payable - Equipment and Other.Our equipment financing notes have terms ranging from 1 to 7 years, bear interest ranging from 1.60% to 7.00% and are due in monthly installments through their maturity dates. Our equipment financing notes are secured by the specific equipment financed and do not contain any financial covenants.
Finance Lease - Buildings. On January 14, 2019, we entered into a purchase and sale agreement (the “Purchase and Sale Agreement”) with Saraland Industrial, LLC, an Alabama limited liability company (the “Purchaser”). Pursuant to the terms of the Purchase and Sale Agreement, we sold our Saraland facility, and approximately 17.12 acres of surrounding property located in Saraland, Alabama (the “Property”) to the Purchaser for a purchase price of $11,500.$11.5 million. Concurrent with the sale of the Property, we and the Purchaser entered into a twenty-year lease agreement (the “Lease Agreement”), whereby we will leaseleased back the Property at an annual rental rate of $977 thousand, subject to annual rent increases of 1.25%. Under the Lease Agreement, we have two (2) consecutive options to extend the term of the Lease by ten years for each such option. This transaction was recorded as a failed sale and leaseback as the present value of lease payments exceeded 90% of its fair value. We recorded a liability for the amounts received, will continuecontinued to depreciate the asset, and have imputed an interest rate so that the net carrying amount of the financial liability and remaining assets will be zero at the end of the lease term. Concurrently with the sale, we paid off the approximately $5,000 mortgage on the property
Our other financing notes have terms up to First Tennessee Bank National Association1 year, bear interest ranging from 6.34% to 7.84% and terminated the related fixed interest rate swap agreement.are due in monthly installments through their maturity dates. Our other notes do not contain any financial covenants.
Finance Lease Obligations. Our finance lease obligations have terms ranging from 3 to 6 years and are due in monthly or quarterly installments through their maturity dates. Our finance lease obligations are secured by the specific equipment leased. (See Note 1110 to our Consolidated Financial Statements).
Contractual Obligations
The following table summarizes our future minimum payments under contractual obligations as of December 26, 2020:
| | | | | | | | | | | | | | | | | | | | | | | | | | | | | | | | | | | | | | | | | | | | |
| | Payments Due By Period |
| | (dollars in millions) |
| | 2021 | | 2022 | | 2023 | | 2024 | | 2025 | | Thereafter | | Total |
| Debt | | $ | 3.3 | | | $ | 1.5 | | | $ | 1.3 | | | $ | 6.6 | | | $ | 30.5 | | | $ | 19.9 | | | $ | 63.1 | |
| Interest - debt (1) | | 1.4 | | | 1.3 | | | 1.2 | | | 1.1 | | | 1.1 | | | 6.7 | | | 12.8 | |
| Finance leases | | 2.8 | | | 1.5 | | | 2.3 | | | 0.3 | | | 0.4 | | | 9.6 | | | 16.9 | |
| Interest - finance leases | | 1.5 | | | 1.3 | | | 1.1 | | | 0.7 | | | 0.7 | | | 5.3 | | | 10.6 | |
| Operating leases | | 3.3 | | | 3.0 | | | 2.2 | | | 2.0 | | | 2.2 | | | 10.0 | | | 22.7 | |
| Interest - operating leases | | 1.5 | | | 1.2 | | | 1.1 | | | 0.9 | | | 0.8 | | | 1.5 | | | 7.0 | |
| Purchase commitments | | 0.6 | | | — | | | — | | | — | | | — | | | — | | | 0.6 | |
| Totals | | $ | 14.4 | | | $ | 9.8 | | | $ | 9.2 | | | $ | 11.6 | | | $ | 35.7 | | | $ | 53.0 | | | $ | 133.7 | |
(1) Interest rates used for variable rate debt were those in effect at December 26, 2020.
Stock-Based Awards
We recognize compensationcompensation expense related to share-based stock awards based on the fair value of the equity instrument over the period of vesting for the individual stock awards that were granted. At December 26, 2020,30, 2023, the total unrecognized compensation expense related to unvested restricted stock awards was $705 thousand$1.1 million with a weighted-average vesting period of 10.36.9 years. At December 26, 2020, the total unrecognized compensation expense related to Directors' Stock Performance Units was $5 thousand with a weighted-average vesting period
Off-Balance Sheet Arrangements
We have no off-balance sheet arrangements at December 26, 202030, 2023 or December 28, 2019.31, 2022.
Income Tax Considerations
InFor the tax year ended December 26, 202030, 2023, we increaseddecreased our valuation allowances by $2.1 million$384 thousand related to our net deferred tax asset and specific federal and state net operating losslosses and federal and state credit carryforwards.
During 20212024 and 2022,2025, we do not anticipate any cash outlays for income taxes to exceed $500$200 thousand. This is due to our tax loss carryforwards and tax credit carryforwards that will be used to partially offset taxable income. At December 26, 2020,30, 2023, we were in a net deferred tax liability position of $91 thousand.thousand, which was included in other long-term liabilities in our Consolidated Balance Sheets.
Discontinued Operations - Environmental Contingencies
We havehave reserves for environmental obligations established at fivefour previously owned sites that were associated with our discontinued textile businesses. We have a reserve of $1.9$2.2 million for environmental liabilities at these sites as of December 26, 2020.30, 2023. The liability established represents our best estimate of loss and is the reasonable amount to which there is any meaningful degree of certainty given the periods of estimated remediation and the dollars applicable to such remediation for those periods. The actualactual timeline to remediate, and thus, the ultimate cost to complete such remediation through these remediation efforts, may differ significantly from our estimates. Pre-tax cost for environmental remediation obligations classified as discontinued operations were primarily a result of specific events requiring action and additional expense in each period.
Fair Value of Financial Instruments
At December 26, 2020,30, 2023, we had no assets or liabilities measured at fair value that fall under a level 3 classification in the hierarchy (those subject to significant management judgment or estimation).
Certain Related Party Transactions
We were a party to a 5-year lease with the seller of Atlas Carpet Mills, Inc. to lease three manufacturing facilities as part of the acquisition in 2014. The lessor was controlled by an associate of our Company. Rent paid to the lessor during 2019 and 2018 was $497 thousand and $1.0 million, respectively. The lease was based on current market values for similar facilities. These leases terminated as of September, 2019.
We purchase a portion of our product needs in the form of fiber, yarn and carpet from Engineered Floors, an entity substantially controlled by Robert E. Shaw, a shareholder of our Company. An affiliate of Mr. Shaw holds approximately 7.7%7.8% of our Common Stock, which represents approximately 3.5%3.1% of the total vote of all classes of our Common Stock. Engineered Floors is one of several suppliers of such materials to us. Total purchases from Engineered Floors for 2020, 2019,2023 and 20182022 were approximately $4.5 million, $5.9 million$64 thousand and $8.2 million,$917 thousand, respectively; or approximately 1.9%, 2.1%,0.03% and 2.6%0.40% of our cost of goods soldsales in 2020, 2019,2023 and 2018,2022, respectively. Purchases from Engineered Floors are based on market value, negotiated prices. We have no contractual commitments with Mr. Shaw associated with our business relationship with Engineered Floors. Transactions with Engineered Floors are reviewed annually by our board of directors.
We are a party to a ten-year lease with the Rothman Family Partnership to lease a facility as part of the Robertex acquisition in 2013. The controlling principal of the lessor was an associate of our Company until June 30, 2018. Rent paid to the lessor during 2020, 2019, and 2018 was $289 thousand, $284 thousand, and $278 thousand, respectively. The lease was based on current market values for similar facilities.
Recent Accounting Pronouncements
See Note 2 to our Consolidated Financial Statements of this Form 10-K for a discussion of new accounting pronouncements which is incorporated herein by reference.
Critical Accounting Policies
Certain estimates and assumptions are made when preparing our consolidated financial statements. Estimates involve judgments with respect to, among other things, future economic factors that are difficult to predict. As a result, actual amounts could differ from estimates made when our financial statements are prepared.
The Securities and Exchange Commission requires management to identify its most critical accounting policies, defined as those that are both most important to the portrayal of our financial condition and operating results and the application of which requires our most difficult, subjective, and complex judgments. Although our estimates have not differed materially from our experience, such estimates pertain to inherently uncertain matters that could result in material differences in subsequent periods.
We believe application of the following accounting policies require significant judgments and estimates and represent our critical accounting policies. Other significant accounting policies are discussed in Note 1 to our Consolidated Financial Statements.
•Revenue recognition. We derive our revenues primarily from the sale of floorcovering products and processing services. Revenues are recognized when control of these products or services is transferred to our customers, in an amount that reflects the consideration we expect to be entitled to in exchange for those products and services. Sales, value add, and other taxes we collect concurrent with revenue-producing activities are excluded from revenue. Shipping and handling fees charged to customers are reported within revenue. When we transfer control of our products to the customer prior to the related shipping and handling activities, we have adopted a policy of accounting for shipping and handling activities as a fulfillment cost rather than a performance obligation. Incidental items that are immaterial in the context of the contract are recognized as expense. While we pay sales commissions to certain personnel, we have not capitalized these costs as costs to obtain a contract as we have elected to expense costs as incurred when the expected amortization period is one year or less. We do not have any significant financing components as payment is received at or shortly after the point of sale. We determine revenue recognition through the following steps:
▪Identification of the contract with a customer
▪Identification of the performance obligations in the contract
▪Determination of the transaction price
▪Allocation of the transaction price to the performance obligations in the contract
▪Recognition of revenue when, or as, the performance obligation is satisfied
•Variable Consideration. The nature of our business gives rise to variable consideration, including rebates, allowances, and returns that generally decrease the transaction price, which reduces revenue. These variable amounts are generally credited to the customer, based on achieving certain levels of sales activity, product returns, or price concessions.
Variable consideration is estimated at the most likely amount that is expected to be earned. Estimated amounts are included in the transaction price to the extent it is probable that a significant reversal of cumulative revenue recognized will not occur when the uncertainty associated with the variable consideration is resolved. Estimates of variable consideration are estimated based upon historical experience and known trends.
•Customer claims and product warranties. We generally provide product warranties related to manufacturing defects and specific performance standards for our products for a period of up to two years. We accrue for estimated future assurance warranty costs in the period in which the sale is recorded. The costs are included in Cost of Sales in the Consolidated Statements of Operations and the product warranty reserve is included in accrued expenses in the Consolidated Balance Sheets. We calculate our accrual using the portfolio approach based upon historical experience and known trends. We do not provide an additional service-type warranty.
•Inventories. Inventories are stated at the lower of cost or market. Cost is determined using the last-in, first-out method (LIFO), which generally matches current costs of inventory sold with current revenues, for substantially all inventories. Reserves are also established to adjust inventories that are off-quality, aged or obsolete to their estimated net realizable value. Additionally, rates of recoverability per unit of off-quality, aged or obsolete inventory are estimated based on historical rates of recoverability and other known conditions or circumstances that may affect future recoverability. Actual results could differ from assumptions used to value our inventory.
•Goodwill. Goodwill is tested annually for impairment during the fourth quarter or earlier if significant events or substantive changes in circumstances occur that may indicate that goodwill may not be recoverable. The goodwill impairment tests are based on determining the fair value of the specified reporting units based on management judgments and assumptions using the discounted cash flows and comparable company market valuation approaches. We have identified our reporting unit as our floorcovering business for the purposes of allocating goodwill and assessing impairments. The valuation approaches are subject to key judgments and assumptions that are sensitive to change such as judgments and assumptions about sales growth rates, operating margins, the weighted average cost of capital (“WACC”), synergies from the viewpoint of a market participant and comparable company market multiples. When developing these key judgments and assumptions, we consider economic, operational and market conditions that could impact the fair value of the reporting unit. However, estimates are inherently uncertain and represent only management’s reasonable expectations regarding future developments. These estimates and the judgments and assumptions upon which the estimates are based will, in all likelihood, differ in some respects from actual future results. We performed our annual assessment of goodwill in the fourth quarter of 2018 and an impairment was indicated. In accordance with the results of our testing, the goodwill was considered impaired and the asset was removed and a corresponding expense was recorded for asset impairment on the Consolidated Statements of Operations. (See Note 7 to our Consolidated Financial Statements)
•Self-insured accruals. We estimate costs required to settle claims related to our self-insured medical, dental and workers' compensation plans. These estimates include costs to settle known claims, as well as incurred and unreported claims. The estimated costs of known and unreported claims are based on historical experience. Actual results could differ from assumptions used to estimate these accruals.
•Income taxes. Our effective tax rate is based on income, statutory tax rates and tax planning opportunities available in the jurisdictions in which we operate. Tax laws are complex and subject to different interpretations by the taxpayer and respective governmental taxing authorities. Deferred tax assets represent amounts available to reduce income taxes payable on taxable income in a future period. We evaluate the recoverability of these future tax benefits by assessing the adequacy of future expected taxable income from all sources, including reversal of taxable temporary differences, forecasted operating earnings and available tax planning strategies. These sources of income inherently rely on estimates, including business forecasts and other projections of financial results over an extended period of time. In the event that we are not able to realize all or a portion of our deferred tax assets in the future, a valuation allowance is provided. We recognize such amounts through a charge to income in the period in which that determination is made or when tax law changes are enacted. We had valuation allowances of $15.4$21.0 million at December 26, 202030, 2023 and $13.3$21.3 million at December 28, 2019.31, 2022. At December 26, 2020,30, 2023, we were in a net deferred tax liability position of $91 thousand. For further information regarding our valuation allowances, see Note 1513 to the Consolidated Financial Statements.
•Loss contingencies. We routinely assess our exposure related to legal matters, environmental matters, product liabilities or any other claims against our assets that may arise in the normal course of business. If we determine that it is probable a loss has been incurred, the amount of the loss, or an amount within the range of loss, that can be reasonably estimated will be recorded.
Item 7A. QUANTITATIVE AND QUALITATIVE DISCLOSURES ABOUT MARKET RISK (Dollars in thousands)
Our earnings, cash flows and financial position are exposed to market risks relating to interest rates, among other factors. It is our policy to minimize our exposure to adverse changes in interest rates and manage interest rate risks inherent in funding our Company with debt. We address this financial exposure through a risk management program that includes maintaining a mix of fixed and floating rate debt and the occasional use of interest rate swap agreements (See Note 13 to the Consolidated Financial Statements).agreements.
At December 26, 2020, $53,322,30, 2023, $71,494, or approximately 68%85% of our total debt, was subject to floating interest rates. A one-hundred basis point fluctuation in the variable interest rates applicable to this floating rate debt would have an annual pre-tax impact of approximately $395. $715. Included in the $53,322, $71,494, is the amount outstanding for the term loans of $24,970. Both$23,875. Both loans are currently set to bear interest of 5% for five years. Every five years, these rates will be reset to reflect the then current 5-year treasury rate plus a margin. A one-hundred basis point fluctuation in the interest rates applicable to the term loans debt would have an annual pre-tax impact of approximately $239. See Note 109 for further discussion of these loans.
Item 8. FINANCIAL STATEMENTS AND SUPPLEMENTARY DATA
The supplementary financial information required by ITEM 302 of Regulation S-K is included in PART II, ITEM 5 of this report and the Financial Statements are included in a separate section of this report.
Item 9.CHANGES IN AND DISAGREEMENTS WITH ACCOUNTANTS ON ACCOUNTING AND FINANCIAL DISCLOSURE
None.
Item 9A. CONTROLS AND PROCEDURES
(a) Evaluation of Disclosure Controls and Procedures. We maintain disclosure controls and procedures to ensure that information required to be disclosed in the reports that we file or submit under the Exchange Act is recorded, processed, summarized and reported within the time periods specified in the Commission’s rules and forms and is accumulated and communicated to management, including our principal executive officer and principal financial officer, or persons performing similar functions, as appropriate to allow timely decisions regarding required disclosure. Our management, under the supervision and with the participation of our Chief Executive Officer (“CEO”) and Chief Financial Officer (“CFO”), evaluated the effectiveness of the design and operation of our disclosure controls and procedures (as such terms are defined in Rules 13(a)-15(e) and 15(d)-15(e)) under the Securities Exchange Act of 1934, as amended (the “Exchange Act”) as of December 26, 2020,30, 2023, the date of the financial statements included in this Form 10-K (the “Evaluation Date”). Based on that evaluation, our CEO and CFO concluded that our disclosure controls and procedures were effective as of the Evaluation Date.
(b) Changes in Internal Control over Financial Reporting. No changes in our internal control over financial reporting occurred during the quarter covered by this report that materially affected, or are reasonably likely to materially affect, our internal control over financial reporting.
Internal control over financial reporting cannot provide absolute assurance of achieving financial reporting objectives because of its inherent limitations. Internal control over financial reporting is a process that involves human diligence and compliance and is subject to lapses in judgment and breakdowns resulting from human failures, as well as diverse interpretation of U. S. generally accepted accounting principles by accounting professionals. It is also possible that internal control over financial reporting can be circumvented by collusion or improper management override. Because of such limitations, there is a risk that material misstatements may not be prevented or detected on a timely basis by internal control over financial reporting. Furthermore, projections of any evaluation of effectiveness to future periods are subject to the risk that controls may become inadequate because of changes in conditions, or that the degree of compliance with the policies or procedures may deteriorate. These inherent limitations are known features of the financial reporting process; therefore, while it is possible to design into the process safeguards to reduce such risk, it is not possible to eliminate all risk.
Our management report on internal control over financial reporting is contained in Item 15(a)(1) of this report.
Item 9B.OTHER INFORMATION
None.
Item 9C.DISCLOSURE REGARDING FOREIGN JURISDICTIONS THAT PREVENT INSPECTIONS
Not Applicable.
PART III.
Item 10.DIRECTORS, EXECUTIVE OFFICERS AND CORPORATE GOVERNANCE
The sectionssection entitled "Information about Nominees for Director" and "Section 16(a) Beneficial Ownership Reporting Compliance" in the Proxy Statement of the registrant for the annual meeting of shareholders to be held May 5, 2021 are1, 2024 is incorporated herein by reference. Information regarding the executive officers of the registrant is presented in PART I of this report.
We adopted a Code of Business Conduct and Ethics (the "Code of Ethics") which applies to our principal executive officer, principal financial officer and principal accounting officer or controller, and any persons performing similar functions. A copy of the Code of Ethics is incorporated by reference herein as Exhibit 14 to this report.
We adopted insider trading policies and procedures governing transactions in our securities that are designed to promote compliance with applicable insider trading laws, rules and regulations. A copy of the policy is incorporated by reference therein as Exhibit 19.1 to this report.
Audit Committee Financial Expert
The Board has determined that Michael L. Owens is an audit committee financial expert as defined by Item 407 (e)(5) of Regulation S-K of the Securities Exchange Act of 1934, as amended, and is independent within the meaning of the applicable Securities and Exchange Commission rules and NASDAQ standards. For a brief listing of Mr. Owens' relevant experience, please refer to the "Election of Directors" section of the Company's Proxy Statement.
Audit Committee
We have a standing audit committee. At December 26, 2020,30, 2023, members of our audit committee are Michael L. Owens, Chairman, William F. Blue, Jr., Charles E. Brock, Lowry F. Kline, and Hilda S. Murray.
Item 11.EXECUTIVE COMPENSATION
The sections entitled "Compensation Discussion and Analysis", "Executive Compensation Information" and "Director Compensation" in the Proxy Statement of the registrant for the annual meeting of shareholders to be held May 5, 20211, 2024 are incorporated herein by reference.
Item 12.SECURITY OWNERSHIP OF CERTAIN BENEFICIAL OWNERS AND MANAGEMENT AND RELATED STOCKHOLDER MATTERS
The section entitled "Principal Shareholders", as well as the beneficial ownership table (and accompanying notes), in the Proxy Statement of the registrant for the annual meeting of shareholders to be held May 5, 20211, 2024 are incorporated herein by reference.
Equity Compensation Plan Information as of December 26, 202030, 2023
The following table sets forth information as to our equity compensation plans as of the end of the 20202023 fiscal year:
| | | | (a) | | (b) | | (c) |
| Plan Category | Plan Category | Number of securities to be issued upon exercise of the outstanding options, warrants and rights | | Weighted-average exercise price of outstanding options, warrants and rights | | Number of securities remaining available for future issuance under equity compensation plans (excluding securities reflected in column (a) |
| Plan Category | |
| Plan Category | |
| Equity Compensation Plans approved by security holders | Equity Compensation Plans approved by security holders | 281,320 | | (1) | $ | 4.35 | | (2) | 609,453 | |
| Equity Compensation Plans approved by security holders | |
| Equity Compensation Plans approved by security holders | |
(1)Includes the options to purchase 151,000419,000 shares of Common Stock under our 2016Omnibus Equity Incentive Compensation Plan and 130,320 Performance Units issued under the 2016 Incentive Compensation Plan, each unit being equivalent to one share of Common Stock. Does not include shares of Common Stock issued but not vested pursuant to outstanding restricted stock awards.
(2)Includes the aggregate weighted-average of (i) the exercise price per share for outstanding options to purchase 151,000419,000 shares of Common Stock under our 2016Omnibus Equity Incentive Compensation Plan and (ii) the price per share of the Common Stock on the grant date for each of 130,320 Performance Units issued under the 2016 Incentive Compensation Plan (each unit equivalent to one share of Common Stock).
(3)Includes 149,908 shares remaining to be issued under the 2016 Incentive Compensation Plan and 786,000 shares remaining to be issued under the Omnibus Equity Incentive Plan.
Item 13.CERTAIN RELATIONSHIPS AND RELATED TRANSACTIONS, AND DIRECTOR INDEPENDENCE
The sections entitled "Certain Transactions Between the Company and Directors and Officers" and "Independent Directors" in the Proxy Statement of the registrant for the annual meeting of shareholders to be held May 5, 20211, 2024 are incorporated herein by reference.
Item 14.PRINCIPAL ACCOUNTING FEES AND SERVICES
The section entitled "Audit Fees Discussion" in the Proxy Statement of the Registrant for the Annual Meeting of Shareholders to be held May 5, 20211, 2024 is incorporated herein by reference.
The independent registered public accounting firm is FORVIS, LLP (PCAOB Firm ID No. 686) located in Atlanta, Georgia.
PART IV.
Item 15.EXHIBITS AND FINANCIAL STATEMENT SCHEDULES
(a)(1) Financial Statements - The response to this portion of Item 15 is submitted as a separate section of this report.
(2) Financial Statement Schedules - The response to this portion of Item 15 is submitted as a separate section of this report.
(3) Exhibits - Please refer to the Exhibit Index which is attached hereto.
(b)Exhibits - The response to this portion of Item 15 is submitted as a separate section of this report. See Item 15(a)(3) above.
(c)Financial Statement Schedules - The response to this portion of Item 15 is submitted as a separate section of this report. See Item 15(a)(2).
Item 16. FORM 10-K SUMMARY
None.
SIGNATURES
Pursuant to the requirements of Section 13 or 15(d) of the Securities Exchange Act of 1934, the registrant has duly caused this report to be signed on its behalf by the undersigned, thereunto duly authorized.
| | | | | | | | |
Date: March 10, 202120, 2024 | | The Dixie Group, Inc. |
| | |
| | /s/ DANIEL K. FRIERSON |
| | By: Daniel K. Frierson |
| | Chairman of the Board and Chief Executive Officer |
Pursuant to the requirements of the Securities Exchange Act of 1934, this report has been signed below by the following persons on behalf of the registrant and in the capacities and on the dates indicated.
| | | | | | | | | | | | | | |
| Signature | | Capacity | | Date |
| | | | |
| /s/ DANIEL K. FRIERSON | | Chairman of the Board, Director and Chief Executive Officer | | March 10, 202120, 2024 |
| Daniel K. Frierson | | | | |
| | | | |
| /s/ ALLEN L. DANZEY | | Vice President, Chief Financial Officer | | March 10, 202120, 2024 |
| Allen L. Danzey | | | | |
| | | | |
| /s/ D. KENNEDY FRIERSON, JR. | | Vice President, Chief Operating Officer and Director | | March 10, 202120, 2024 |
| D. Kennedy Frierson, Jr. | | | | |
| | | | |
| /s/ WILLIAM F. BLUE, JR. | | Director | | March 10, 202120, 2024 |
| William F. Blue, Jr. | | | | |
| | | | |
| /s/ CHARLES E. BROCK | | Director | | March 10, 202120, 2024 |
| Charles E. Brock | | | | |
| | | | |
| /s/ LOWRY F. KLINE | | Director | | March 10, 202120, 2024 |
| Lowry F. Kline | | | | |
| | | | |
| /s/ HILDA S. MURRAY | | Director | | March 10, 202120, 2024 |
| Hilda S. Murray | | | | |
| | | | |
| /s/ MICHAEL L. OWENS | | Director | | March 10, 202120, 2024 |
| Michael L. Owens | | | | |
ANNUAL REPORT ON FORM 10-K
ITEM 8 AND ITEM 15(a)(1) AND ITEM 15(a)(2)
LIST OF FINANCIAL STATEMENTS AND FINANCIAL STATEMENT SCHEDULES
FINANCIAL STATEMENTS
FINANCIAL STATEMENT SCHEDULES
YEAR ENDED DECEMBER 26, 202030, 2023
THE DIXIE GROUP, INC.
DALTON, GEORGIA
FORM 10-K - ITEM 8 and ITEM 15(a)(1) and (2)
THE DIXIE GROUP, INC. AND SUBSIDIARIES
LIST OF FINANCIAL STATEMENTS AND FINANCIAL STATEMENT SCHEDULES
The following consolidated financial statements and financial statement schedules of The Dixie Group, Inc. and subsidiaries are included in Item 8 and Item 15(a)(1) and 15(c):
All other schedules for which provision is made in the applicable accounting regulation of the Securities and Exchange Commission are not required under the related instructions, or are inapplicable, or the information is otherwise shown in the financial statements or notes thereto, and therefore such schedules have been omitted.
Management's Report on Internal Control Over Financial Reporting
Our management is responsible for establishing and maintaining adequate internal control over financial reporting, as such term is defined in Rule 13a-15(f) under the Securities Exchange Act of 1934, as amended.
Internal control over financial reporting cannot provide absolute assurance of achieving financial reporting objectives because of its inherent limitations. Internal control over financial reporting is a process that involves human diligence and compliance and is subject to lapses in judgment and breakdowns resulting from human failures, as well as diverse interpretation of U. S. generally accepted accounting principles by accounting professionals. It is also possible that internal control over financial reporting can be circumvented by collusion or improper management override. Because of such limitations, there is a risk that material misstatements may not be prevented or detected on a timely basis by internal control over financial reporting. Furthermore, projections of any evaluation of effectiveness to future periods are subject to the risk that controls may become inadequate because of changes in conditions, or that the degree of compliance with the policies or procedures may deteriorate. These inherent limitations are known features of the financial reporting process; therefore, while it is possible to design into the process safeguards to reduce such risk, it is not possible to eliminate all risk.
Management, including our principal executive officer and principal financial officer, has used the criteria set forth in the report entitled “Internal Control - Integrated Framework” published by the Committee of Sponsoring Organizations of the Treadway Commission (2013 framework) to evaluate the effectiveness of its internal control over financial reporting. Management has concluded that its internal control over financial reporting was effective as of December 26, 2020,30, 2023, based on those criteria.
/s/ Daniel K. Frierson
Chairman of the Board and
Chief Executive Officer
/s/ Allen L. Danzey
Chief Financial Officer
Report of Independent Registered Public Accounting Firm
To the Shareholders, and Board of Directors, and Audit Committee of
The Dixie Group, Inc.
Opinion on the Consolidated Financial Statements
We have audited the accompanying consolidated balance sheets of The Dixie Group, Inc. (the "Company"“Company”) as of December 26, 202030, 2023 and December 28, 2019,31, 2022, the related consolidated statements of operations, comprehensive income (loss), stockholders’ equity, and cash flows and stockholders’ equity for each of the three years in the two-year period ended December 26, 2020,30, 2023, and the related notes and schedule listed in the Index at Item 15 (collectively referred to as the "financial statements"“financial statements”). In our opinion, the consolidated financial statements referred to above present fairly, in all material respects, the financial position of the Company as of December 26, 202030, 2023 and December 28, 2019,31, 2022, and the results of its operations and its cash flows for each of the three years in the two-year period ended December 26, 2020,30, 2023, in conformity with accounting principles generally accepted accounting principles in the United States of America (“U.S. GAAP”).
Basis for Opinion
These financial statements are the responsibility of the Company'sCompany’s management. Our responsibility is to express an opinion on the Company'sCompany’s financial statements based on our audits.
We are a public accounting firm registered with the Public Company Accounting Oversight Board (United States) ("PCAOB"(“PCAOB”) and are required to be independent with respect to the Company in accordance with the U.S. federal securities laws and the applicable rules and regulations of the Securities and Exchange Commission and the PCAOB.
We conducted our audits in accordance with the standards of the PCAOB. Those standards require that we plan and perform the audit to obtain reasonable assurance about whether the financial statements are free of material misstatement, whether due to error or fraud. The Company is not required to have, nor were we engaged to perform, an audit of its internal control over financial reporting. As part of our audits, we are required to obtain an understanding of internal control over financial reporting but not for the purpose of expressing an opinion on the effectiveness of the Company'sCompany’s internal control over financial reporting. Accordingly, we express no such opinion.
Our audits included performing procedures to assess the risks of material misstatement of the financial statements, whether due to error or fraud, and performing procedures that respond to those risks. Such procedures includedinclude examining, on a test basis, evidence regarding the amounts and disclosures in the financial statements. Our audits also included evaluating the accounting principles used and significant estimates made by management, as well as evaluating the overall presentation of the financial statements. We believe that our audits provide a reasonable basis for our opinion.
Critical Audit Matter
The critical audit matter communicated below is a matter arising from the current periodcurrent-period audit of the financial statements that waswere communicated or required to be communicated to the audit committee and that: (1) relates to accounts or disclosures that are material to the financial statements and (2) involved our especially challenging, subjective, or complex judgments. The communication of a critical audit matter does not alter in any way our opinion on the financial statements, taken as a whole, and we are not, by communicating the critical audit matter below, providing a separate opinion on the critical audit matter or on the accounts or disclosures to which it relates.
Critical Audit Matter – LIFO Reserve
As disclosed in Notes 1 and 5 to the consolidated financial statements, the Company recognizes its inventory using the last-in, first-out (“LIFO”) method, which requires a reserve to adjust the historical cost carrying value of inventory to the lower of LIFO or market. As of December 26, 2020,30, 2023, the LIFO reserve was approximately $18,511,000.$21,097,000. There is inherent complexity in the accounting for the LIFO reserve including complex calculations based on inventory pools, changes in those pools, and lower of cost or market adjustments.
We identified the LIFO reserve as a critical audit matter. The principal considerations for that determination included the complexity of the calculations, the judgment required for market adjustments, and the nature and extent of audit effort required to address the matter.
Our audit procedures to test the appropriateness of the valuation of inventory included,LIFO Reserve, among others:
•We tested the completeness of the LIFO reserve by evaluating whether the underlying data used as key inputsall appropriate inventory items were included in the Company’s LIFO reserve were consistent with gross inventory.calculation and in the appropriate category. This included reconciling the inventory used forto calculate the LIFO reserve to the inventory subledger.
•We independently recalculated management’s LIFO pool calculation, including pool increases or inventory liquidations.
•We tested the aggregation of the pools used to arrive at the LIFO reserve, and considered whether methodologies were consistently applied, or that changes, if any, were in accordance with U.S. GAAP.
•We tested the completenessa sample of the LIFO reserve by evaluating whether all appropriate inventory items were included inand tested whether the LIFO reserve calculation and in the appropriate category.
•We tested that the associated lower of cost or market adjustments made by management were in accordance with U.S. GAAP for a sample of inventory items.GAAP.
/s/ Dixon Hughes GoodmanFORVIS, LLP
We have served as the Company's auditor since 2013.
Atlanta, GeorgiaGA
March 10, 2021
THE DIXIE GROUP, INC.
CONSOLIDATED BALANCE SHEETS
(amounts in thousands, except share data)
| | | | December 26,
2020 | | December 28,
2019 | | December 30,
2023 | | December 31,
2022 |
| ASSETS | ASSETS | | | |
| CURRENT ASSETS | CURRENT ASSETS | |
| CURRENT ASSETS | |
| CURRENT ASSETS | |
| Cash and cash equivalents | |
| Cash and cash equivalents | |
| Cash and cash equivalents | Cash and cash equivalents | $ | 1,920 | | | $ | 769 | |
| Receivables, net | Receivables, net | 37,716 | | | 37,138 | |
| Inventories, net | Inventories, net | 85,399 | | | 95,509 | |
| Prepaid expenses | Prepaid expenses | 8,296 | | | 6,179 | |
| | Current assets of discontinued operations | |
| Current assets of discontinued operations | |
| Current assets of discontinued operations | |
| TOTAL CURRENT ASSETS | TOTAL CURRENT ASSETS | 133,331 | | | 139,595 | |
| | | | | | | | |
| PROPERTY, PLANT AND EQUIPMENT, NET | PROPERTY, PLANT AND EQUIPMENT, NET | 57,904 | | | 65,442 | |
| OPERATING LEASE RIGHT-OF-USE ASSETS | OPERATING LEASE RIGHT-OF-USE ASSETS | 22,074 | | | 24,835 | |
| | OTHER ASSETS | OTHER ASSETS | 19,559 | | | 17,787 | |
| OTHER ASSETS | |
| OTHER ASSETS | |
| LONG-TERM ASSETS OF DISCONTINUED OPERATIONS | |
| TOTAL ASSETS | TOTAL ASSETS | $ | 232,868 | | | $ | 247,659 | |
| | LIABILITIES AND STOCKHOLDERS' EQUITY | |
| LIABILITIES AND STOCKHOLDERS' EQUITY | |
| LIABILITIES AND STOCKHOLDERS' EQUITY | LIABILITIES AND STOCKHOLDERS' EQUITY | | | | | | |
| CURRENT LIABILITIES | CURRENT LIABILITIES | | | | CURRENT LIABILITIES | | | |
| Accounts payable | Accounts payable | $ | 19,058 | | | $ | 16,084 | |
| Accrued expenses | Accrued expenses | 25,965 | | | 25,418 | |
| Current portion of long-term debt | Current portion of long-term debt | 6,116 | | | 6,684 | |
| Current portion of operating lease liabilities | Current portion of operating lease liabilities | 3,323 | | | 3,172 | |
| Current liabilities of discontinued operations | |
| TOTAL CURRENT LIABILITIES | TOTAL CURRENT LIABILITIES | 54,462 | | | 51,358 | |
| | LONG-TERM DEBT, NET | |
| LONG-TERM DEBT, NET | |
| LONG-TERM DEBT, NET | LONG-TERM DEBT, NET | 72,041 | | | 81,667 | |
| OPERATING LEASE LIABILITIES | OPERATING LEASE LIABILITIES | 19,404 | | | 22,123 | |
| | OTHER LONG-TERM LIABILITIES | OTHER LONG-TERM LIABILITIES | 23,170 | | | 19,300 | |
| OTHER LONG-TERM LIABILITIES | |
| OTHER LONG-TERM LIABILITIES | |
| LONG-TERM LIABILITIES OF DISCONTINUED OPERATIONS | |
| TOTAL LIABILITIES | TOTAL LIABILITIES | 169,077 | | | 174,448 | |
| | COMMITMENTS AND CONTINGENCIES (See Note 19) | 0 | | 0 |
| COMMITMENTS AND CONTINGENCIES (See Note 17) | |
| COMMITMENTS AND CONTINGENCIES (See Note 17) | |
| COMMITMENTS AND CONTINGENCIES (See Note 17) | | | | |
| | STOCKHOLDERS' EQUITY | STOCKHOLDERS' EQUITY | | | |
| Common Stock ($3 par value per share): Authorized 80,000,000 shares, issued and outstanding - 14,557,435 shares for 2020 and 15,025,087 shares for 2019 | 43,672 | | | 45,075 | |
| Class B Common Stock ($3 par value per share): Authorized 16,000,000 shares, issued and outstanding - 880,313 shares for 2020 and 836,669 shares for 2019 | 2,641 | | | 2,510 | |
| STOCKHOLDERS' EQUITY | |
| STOCKHOLDERS' EQUITY | | | | |
| Common Stock ($3 par value per share): Authorized 80,000,000 shares, issued and outstanding - 14,409,281 shares for 2023 and 14,453,466 shares for 2022 | |
| Class B Common Stock ($3 par value per share): Authorized 16,000,000 shares, issued and outstanding - 1,121,129 shares for 2023 and 1,129,158 shares for 2022 | |
| Additional paid-in capital | Additional paid-in capital | 158,329 | | | 157,547 | |
| Accumulated deficit | Accumulated deficit | (140,321) | | | (131,113) | |
| Accumulated other comprehensive income (loss) | (530) | | | (808) | |
| Accumulated other comprehensive income | |
| TOTAL STOCKHOLDERS' EQUITY | TOTAL STOCKHOLDERS' EQUITY | 63,791 | | | 73,211 | |
| TOTAL LIABILITIES AND STOCKHOLDERS' EQUITY | TOTAL LIABILITIES AND STOCKHOLDERS' EQUITY | $ | 232,868 | | | $ | 247,659 | |
See accompanying notes to the consolidated financial statements.
THE DIXIE GROUP, INC.
CONSOLIDATED STATEMENTS OF OPERATIONS
(amounts in thousands, except per share data)
| | | |
| | | | Year Ended | Year Ended |
| | | December 26,
2020 | | December 28,
2019 | | December 29,
2018 |
| | NET SALES | NET SALES | $ | 315,939 | | | $ | 374,582 | | | $ | 405,033 | |
| | NET SALES | |
| | NET SALES | |
| Cost of sales | Cost of sales | 239,483 | | | 288,377 | | | 318,042 | |
| Cost of sales | |
| Cost of sales | |
| GROSS PROFIT | |
| GROSS PROFIT | |
| GROSS PROFIT | GROSS PROFIT | 76,456 | | | 86,205 | | | 86,991 | |
| | Selling and administrative expenses | Selling and administrative expenses | 75,731 | | | 83,825 | | | 92,473 | |
| | Selling and administrative expenses | |
| | Selling and administrative expenses | |
| | Other operating (income) expense, net | |
| | Other operating (income) expense, net | |
| | Other operating (income) expense, net | Other operating (income) expense, net | (108) | | | (23,988) | | | 458 | |
| Facility consolidation and severance expenses, net | Facility consolidation and severance expenses, net | 3,752 | | | 5,019 | | | 3,167 | |
| Impairment of assets | 0 | | | 0 | | | 6,709 | |
| Facility consolidation and severance expenses, net | |
| Facility consolidation and severance expenses, net | |
| | OPERATING INCOME (LOSS) | |
| | OPERATING INCOME (LOSS) | |
| | OPERATING INCOME (LOSS) | OPERATING INCOME (LOSS) | (2,919) | | | 21,349 | | | (15,816) | |
| | Interest expense | Interest expense | 5,803 | | | 6,444 | | | 6,491 | |
| | Interest expense | |
| | Interest expense | |
| Other (income) expense, net | |
| Other (income) expense, net | |
| Other (income) expense, net | Other (income) expense, net | 678 | | | (57) | | | 3 | |
| | INCOME (LOSS) FROM CONTINUING OPERATIONS BEFORE TAXES | (9,400) | | | 14,962 | | | (22,310) | |
| LOSS FROM CONTINUING OPERATIONS BEFORE TAXES | |
| | LOSS FROM CONTINUING OPERATIONS BEFORE TAXES | |
| | LOSS FROM CONTINUING OPERATIONS BEFORE TAXES | |
| Income tax provision (benefit) | Income tax provision (benefit) | (312) | | | (657) | | | (831) | |
| INCOME (LOSS) FROM CONTINUING OPERATIONS | (9,088) | | | 15,619 | | | (21,479) | |
| Income (loss) from discontinued operations, net of tax | (120) | | | (348) | | | 95 | |
| Income tax provision (benefit) | |
| Income tax provision (benefit) | |
| LOSS FROM CONTINUING OPERATIONS | |
| LOSS FROM CONTINUING OPERATIONS | |
| LOSS FROM CONTINUING OPERATIONS | |
| Loss from discontinued operations, net of tax | |
| Loss from discontinued operations, net of tax | |
| Loss from discontinued operations, net of tax | |
| | NET INCOME (LOSS) | $ | (9,208) | | | $ | 15,271 | | | $ | (21,384) | |
| NET LOSS | |
| | NET LOSS | |
| | NET LOSS | |
| | BASIC EARNINGS (LOSS) PER SHARE: | |
| | BASIC EARNINGS (LOSS) PER SHARE: | |
| | BASIC EARNINGS (LOSS) PER SHARE: | BASIC EARNINGS (LOSS) PER SHARE: | | | | | |
| Continuing operations | Continuing operations | $ | (0.59) | | | $ | 0.96 | | | $ | (1.36) | |
| Continuing operations | |
| Continuing operations | |
| Discontinued operations | |
| Discontinued operations | |
| Discontinued operations | Discontinued operations | (0.01) | | | (0.02) | | | 0.01 | |
| | Net income (loss) | $ | (0.60) | | | $ | 0.94 | | | $ | (1.35) | |
| Net loss | |
| | Net loss | |
| | Net loss | |
| | BASIC SHARES OUTSTANDING | |
| | BASIC SHARES OUTSTANDING | |
| | BASIC SHARES OUTSTANDING | BASIC SHARES OUTSTANDING | 15,316 | | | 15,822 | | | 15,764 | |
| | DILUTED EARNINGS (LOSS) PER SHARE: | DILUTED EARNINGS (LOSS) PER SHARE: | | | | | |
| | DILUTED EARNINGS (LOSS) PER SHARE: | |
| | DILUTED EARNINGS (LOSS) PER SHARE: | |
| Continuing operations | |
| Continuing operations | |
| Continuing operations | Continuing operations | $ | (0.59) | | | $ | 0.95 | | | $ | (1.36) | |
| Discontinued operations | Discontinued operations | (0.01) | | | (0.02) | | | 0.01 | |
| Discontinued operations | |
| Discontinued operations | |
| | Net income (loss) | $ | (0.60) | | | $ | 0.93 | | | $ | (1.35) | |
| Net loss | |
| | Net loss | |
| | Net loss | |
| | DILUTED SHARES OUTSTANDING | |
| | DILUTED SHARES OUTSTANDING | |
| | DILUTED SHARES OUTSTANDING | DILUTED SHARES OUTSTANDING | 15,316 | | | 15,926 | | | 15,764 | |
| | DIVIDENDS PER SHARE: | DIVIDENDS PER SHARE: | | | | | |
| | DIVIDENDS PER SHARE: | |
| | DIVIDENDS PER SHARE: | |
| Common Stock | |
| Common Stock | |
| Common Stock | Common Stock | $ | 0 | | | $ | 0 | | | $ | 0 | |
| Class B Common Stock | Class B Common Stock | 0 | | | 0 | | | 0 | |
| Class B Common Stock | |
| Class B Common Stock | |
See accompanying notes to the consolidated financial statements.
THE DIXIE GROUP, INC.
CONSOLIDATED STATEMENTS OF COMPREHENSIVE INCOME (LOSS)
(amounts in thousands)
| | | | | | | | | | | | | | | | | |
| | Year Ended |
| | December 26,
2020 | | December 28,
2019 | | December 29,
2018 |
| NET INCOME (LOSS) | $ | (9,208) | | | $ | 15,271 | | | $ | (21,384) | |
| | | | | |
| OTHER COMPREHENSIVE INCOME (LOSS), NET OF TAX: | | | | | |
| Unrealized gain (loss) on interest rate swaps | (1,316) | | | (1,109) | | | 531 | |
| Income taxes | 0 | | | 0 | | | 0 | |
| Unrealized gain (loss) on interest rate swaps, net | (1,316) | | | (1,109) | | | 531 | |
| | | | | |
| Reclassification of loss into earnings from interest rate swaps (1) | 1,967 | | | 454 | | | 673 | |
| Income taxes | 343 | | | 10 | | | 0 | |
| Reclassification of loss into earnings from interest rate swaps, net | 1,624 | | | 444 | | | 673 | |
| | | | | |
| | | | | |
| | | | | |
| | | | | |
| | | | | |
| Unrecognized net actuarial gain (loss) on postretirement benefit plans | 0 | | | (6) | | | 18 | |
| Income taxes | 0 | | | 0 | | | 0 | |
| Unrecognized net actuarial gain (loss) on postretirement benefit plans, net | 0 | | | (6) | | | 18 | |
| | | | | |
| Reclassification of net actuarial gain into earnings from postretirement benefit plans (2) | (27) | | | (27) | | | (27) | |
| Income taxes | 0 | | | 0 | | | 0 | |
| Reclassification of net actuarial gain into earnings from postretirement benefit plans, net | (27) | | | (27) | | | (27) | |
| | | | | |
| Reclassification of prior service credits into earnings from postretirement benefit plans (2) | (3) | | | (2) | | | (4) | |
| Income taxes | 0 | | | 0 | | | 0 | |
| Reclassification of prior service credits into earnings from postretirement benefit plans, net | (3) | | | (2) | | | (4) | |
| | | | | |
| TOTAL OTHER COMPREHENSIVE INCOME (LOSS), NET OF TAX | 278 | | | (700) | | | 1,191 | |
| | | | | |
| COMPREHENSIVE INCOME (LOSS) | $ | (8,930) | | | $ | 14,571 | | | $ | (20,193) | |
| | | | | | | | | | | | | |
| | Year Ended |
| | December 30,
2023 | | December 31,
2022 | | |
| NET LOSS | $ | (2,718) | | | $ | (35,079) | | | |
| | | | | |
| OTHER COMPREHENSIVE INCOME (LOSS), NET OF TAX: | | | | | |
| | | | | |
| | | | | |
| | | | | |
| | | | | |
| Reclassification of (gain) loss into earnings from interest rate swaps (1) | — | | | (7) | | | |
| Income taxes | — | | | (2) | | | |
| Reclassification of (gain) loss into earnings from interest rate swaps, net | — | | | (5) | | | |
| | | | | |
| Amortization of unrealized loss on dedesignated interest rate swaps (1) | — | | | 210 | | | |
| Income taxes | — | | | 33 | | | |
| Amortization of unrealized loss on dedesignated interest rate swaps, net | — | | | 177 | | | |
| | | | | |
| Unrecognized net actuarial gain on postretirement benefit plans | 75 | | | 39 | | | |
| Income taxes | — | | | — | | | |
| Unrecognized net actuarial gain on postretirement benefit plans, net | 75 | | | 39 | | | |
| | | | | |
| Reclassification of net actuarial gain into earnings from postretirement benefit plans (2) | (26) | | | (22) | | | |
| Income taxes | — | | | — | | | |
| Reclassification of net actuarial gain into earnings from postretirement benefit plans, net | (26) | | | (22) | | | |
| | | | | |
| | | | | |
| | | | | |
| | | | | |
| | | | | |
| TOTAL OTHER COMPREHENSIVE INCOME, NET OF TAX | 49 | | | 189 | | | |
| | | | | |
| COMPREHENSIVE LOSS | $ | (2,669) | | | $ | (34,890) | | | |
(1) Amounts for cash flow hedges reclassified from accumulated other comprehensive income (loss) to net income (loss) were included in interest expense in the Company's Consolidated Statements of Operations.
(2) Amounts for postretirement plans reclassified from accumulated other comprehensive income (loss) to net income (loss) were included in selling and administrative expenses in the Company's Consolidated Statements of Operations.
See accompanying notes to the consolidated financial statements.
THE DIXIE GROUP, INC.
CONSOLIDATED STATEMENTS OF CASH FLOWS
(amounts in thousands)
| | | | | | | | | | | | | | | | | |
| | Year Ended |
| | December 26,
2020 | | December 28,
2019 | | December 29,
2018 |
| CASH FLOWS FROM OPERATING ACTIVITIES | | | | | |
| Income (loss) from continuing operations | $ | (9,088) | | | $ | 15,619 | | | $ | (21,479) | |
| Income (loss) from discontinued operations | (120) | | | (348) | | | 95 | |
| | | | | |
| Net income (loss) | (9,208) | | | 15,271 | | | (21,384) | |
| | | | | |
| Adjustments to reconcile net income (loss) to net cash provided by operating activities: | | | | | |
| | | | | |
| Depreciation and amortization | 10,746 | | | 11,440 | | | 12,653 | |
| | | | | |
| Benefit for deferred income taxes | (343) | | | (487) | | | (537) | |
| Net loss (gain) on property, plant and equipment disposals | 41 | | | (25,281) | | | (1,047) | |
| Impairment of assets | 0 | | | 0 | | | 1,164 | |
| Impairment of goodwill and intangibles | 0 | | | 0 | | | 5,545 | |
| | | | | |
| Stock-based compensation (credit) expense | 431 | | | 483 | | | (29) | |
| | | | | |
| Bad debt expense | 90 | | | 240 | | | 163 | |
| Write-off of deferred financing costs | 157 | | | 0 | | | 0 | |
| Changes in operating assets and liabilities: | | | | | |
| Receivables | (668) | | | 5,164 | | | 3,775 | |
| Inventories | 10,110 | | | 9,686 | | | 8,462 | |
| Prepaids and other current assets | (2,117) | | | (975) | | | (535) | |
| Accounts payable and accrued expenses | 1,427 | | | (3,678) | | | (4,198) | |
| Other operating assets and liabilities | 2,883 | | | (176) | | | 1,073 | |
| NET CASH PROVIDED BY OPERATING ACTIVITIES | 13,549 | | | 11,687 | | | 5,105 | |
| | | | | |
| CASH FLOWS FROM INVESTING ACTIVITIES | | | | | |
| Net proceeds from sales of property, plant and equipment | 44 | | | 37,205 | | | 1,856 | |
| | | | | |
| Purchase of property, plant and equipment | (1,760) | | | (4,235) | | | (4,052) | |
| | | | | |
| | | | | |
| | | | | |
| NET CASH PROVIDED BY (USED IN) INVESTING ACTIVITIES | (1,716) | | | 32,970 | | | (2,196) | |
| | | | | |
| CASH FLOWS FROM FINANCING ACTIVITIES | | | | | |
| Net borrowings (payments) on previous revolving credit facility | (59,693) | | | (39,524) | | | 1,512 | |
| Net borrowings on revolving credit facility | 28,352 | | | 0 | | | 0 | |
| Borrowings on notes payable - buildings and other term loans | 25,000 | | | 0 | | | 0 | |
| Payments on notes payable - buildings and other term loans | (343) | | | (5,475) | | | (731) | |
| Payments on notes payable related to acquisitions | 0 | | | 0 | | | (791) | |
| Borrowings on notes payable - equipment and other | 1,460 | | | 1,379 | | | 3,273 | |
| Payments on notes payable - equipment and other | (2,380) | | | (3,375) | | | (4,260) | |
| Borrowings on finance leases | 2,211 | | | 11,500 | | | 0 | |
| Payments on finance leases | (4,756) | | | (4,166) | | | (4,617) | |
| Change in outstanding checks in excess of cash | 2,094 | | | (3,141) | | | 2,762 | |
| | | | | |
| | | | | |
| Repurchases of Common Stock | (921) | | | (827) | | | (58) | |
| | | | | |
| Payments for debt issuance costs | (1,706) | | | (277) | | | 0 | |
| NET CASH USED IN FINANCING ACTIVITIES | (10,682) | | | (43,906) | | | (2,910) | |
| | | | | |
| INCREASE (DECREASE) IN CASH AND CASH EQUIVALENTS | 1,151 | | | 751 | | | (1) | |
| CASH AND CASH EQUIVALENTS AT BEGINNING OF PERIOD | 769 | | | 18 | | | 19 | |
| CASH AND CASH EQUIVALENTS AT END OF PERIOD | $ | 1,920 | | | $ | 769 | | | $ | 18 | |
| | | | | |
| SUPPLEMENTAL CASH FLOW INFORMATION: | | | | | |
| | | | | |
| | | | | |
| Right-of-use assets obtained in exchange for new finance lease liabilities | 0 | | | 52 | | | 0 | |
| Equipment purchased under capital leases | 0 | | | 0 | | | 223 | |
| Equipment purchased under notes payable | 1,314 | | | 0 | | | 0 | |
| Right-of-use assets obtained in exchange for new operating lease liabilities | 653 | | | 18,167 | | | 0 | |
| | | | | |
| | | | | |
| | | | | |
| | | | | |
| | | | | |
| | | | | |
| | | | | |
| | | | | |
| Accrued purchases of equipment | 0 | | | 188 | | | 166 | |
| | | | | |
| | | | | |
| | | | | |
| | | | | | | | | | | | | |
| | Year Ended |
| | December 30,
2023 | | December 31,
2022 | | |
| CASH FLOWS FROM OPERATING ACTIVITIES | | | | | |
| Loss from continuing operations | $ | (1,952) | | | $ | (33,415) | | | |
| Loss from discontinued operations | (766) | | | (1,664) | | | |
| | | | | |
| Net loss | (2,718) | | | (35,079) | | | |
| Adjustments to reconcile net loss to net cash provided by (used in) operating activities: | | | | | |
| Depreciation and amortization | 7,331 | | | 7,624 | | | |
| | | | | |
| Benefit for deferred income taxes | — | | | (31) | | | |
| Net (gain) loss on property, plant and equipment disposals | (8,198) | | | 1,003 | | | |
| | | | | |
| | | | | |
| | | | | |
| Stock-based compensation expense | 687 | | | 766 | | | |
| | | | | |
| Bad debt expense | 31 | | | 62 | | | |
| Net gain on extinguishment of debt | (419) | | | — | | | |
| Changes in operating assets and liabilities: | | | | | |
| Receivables | 1,094 | | | 15,223 | | | |
| Inventories | 7,488 | | | (960) | | | |
| Prepaid and other current assets | (1,987) | | | (242) | | | |
| Accounts payable and accrued expenses | (506) | | | (9,647) | | | |
| Other operating assets and liabilities | 645 | | | 2,121 | | | |
| NET CASH PROVIDED BY (USED IN) OPERATING ACTIVITIES | 4,214 | | | (17,496) | | | |
| NET CASH PROVIDED BY (USED IN) OPERATING ACTIVITIES - DISCONTINUED OPERATIONS | (1,595) | | | 817 | | | |
| | | | | |
| CASH FLOWS FROM INVESTING ACTIVITIES | | | | | |
| Net proceeds from sales of property, plant and equipment | 16,055 | | | 88 | | | |
| | | | | |
| Purchase of property, plant and equipment | (980) | | | (4,579) | | | |
| Investment in joint venture, net of capital distributions | — | | | (50) | | | |
| | | | | |
| | | | | |
| | | | | |
| NET CASH PROVIDED BY (USED IN) INVESTING ACTIVITIES | 15,075 | | | (4,541) | | | |
| NET CASH PROVIDED BY INVESTING ACTIVITIES - DISCONTINUED OPERATIONS | 8 | | | 240 | | | |
| | | | | |
| CASH FLOWS FROM FINANCING ACTIVITIES | | | | | |
| | | | | |
| Net borrowings (payments) on revolving credit facility | (4,175) | | | 18,636 | | | |
| Borrowings on notes payable - buildings and other term loans | — | | | 11,000 | | | |
| Payments on notes payable - buildings and other term loans | (11,424) | | | (5,965) | | | |
| | | | | |
| Borrowings on notes payable - other | 1,542 | | | 1,657 | | | |
| Payments on notes payable - other | (2,364) | | | (2,484) | | | |
| | | | | |
| Payments on finance leases | (256) | | | (565) | | | |
| Change in outstanding checks in excess of cash | (1,266) | | | (1,443) | | | |
| | | | | |
| | | | | |
| Repurchases of Common Stock | (43) | | | (737) | | | |
| | | | | |
| Payments for debt issuance costs | — | | | (227) | | | |
| NET CASH PROVIDED BY (USED) IN FINANCING ACTIVITIES | (17,986) | | | 19,872 | | | |
| DECREASE IN CASH AND CASH EQUIVALENTS | (284) | | | (1,108) | | | |
| CASH AND CASH EQUIVALENTS AT BEGINNING OF PERIOD | 363 | | | 1,471 | | | |
| CASH AND CASH EQUIVALENTS AT END OF PERIOD | $ | 79 | | | $ | 363 | | | |
| | | | | |
| SUPPLEMENTAL CASH FLOW INFORMATION: | | | | | |
| Interest paid | $ | 7,020 | | | $ | 3,409 | | | |
| | | | | |
| Income taxes paid, net of (tax refunds) | (786) | | | 6 | | | |
| Right-of-use assets obtained in exchange for new operating lease | 10,765 | | | 911 | | | |
| Equipment purchased under finance leases | 133 | | | — | | | |
| Commission accrued on sale of building | 433 | | | — | | | |
| | | | | |
| | | | | |
| | | | | |
| | | | | |
| | | | | |
| | | | | |
| | | | | |
| | | | | |
| | | | | |
| | | | | |
| | | | | |
| | | | | |
| Receivable on sale of equipment | — | | | 350 | | | |
| | | | | |
See accompanying notes to the consolidated financial statements.
THE DIXIE GROUP, INC.
CONSOLIDATED STATEMENTS OF STOCKHOLDERS' EQUITY
(amounts in thousands, except share data)
| | | | | | | | | | | | | | | | | | | | | | | | | | | | | | | | | | | |
| | Common Stock | | Class B Common Stock | | Additional Paid-In Capital | | Accumulated Deficit | | Accumulated Other Comprehensive Income (Loss) | | Total Stockholders' Equity |
| Balance at December 30, 2017 | $ | 45,839 | | | $ | 2,584 | | | $ | 157,139 | | | $ | (125,000) | | | $ | (1,299) | | | $ | 79,263 | |
| Common Stock issued - 39,711 shares | 119 | | | 0 | | | (119) | | | 0 | | | 0 | | | 0 | |
| Repurchases of Common Stock - 20,226 shares | (61) | | | 0 | | | 4 | | | 0 | | | 0 | | | (57) | |
| Restricted stock grants issued - 307,292 shares | 677 | | | 245 | | | (922) | | | 0 | | | 0 | | | 0 | |
| Restricted stock grants forfeited - 106,196 shares | (25) | | | (292) | | | (621) | | | 0 | | | 0 | | | (938) | |
| Class B converted into Common Stock - 6,250 shares | 19 | | | (19) | | | 0 | | | 0 | | | 0 | | | 0 | |
| Stock-based compensation expense | 0 | | | 0 | | | 909 | | | 0 | | | 0 | | | 909 | |
| | | | | | | | | | | |
| Net loss | 0 | | | 0 | | | 0 | | | (21,384) | | | 0 | | | (21,384) | |
| Other comprehensive income | 0 | | | 0 | | | 0 | | | 0 | | | 1,191 | | | 1,191 | |
| | | | | | | | | | | |
| Balance at December 29, 2018 | $ | 46,568 | | | $ | 2,518 | | | $ | 156,390 | | | $ | (146,384) | | | $ | (108) | | | $ | 58,984 | |
| Common Stock issued - 29,001 shares | 87 | | | 0 | | | (87) | | | 0 | | | 0 | | | 0 | |
| Repurchases of Common Stock - 511,353 shares | (1,535) | | | 0 | | | 708 | | | 0 | | | 0 | | | (827) | |
| | | | | | | | | | | |
| Restricted stock grants forfeited - 17,784 shares | (53) | | | 0 | | | 42 | | | 0 | | | 0 | | | (11) | |
| Class B converted into Common Stock - 2,635 shares | 8 | | | (8) | | | 0 | | | 0 | | | 0 | | | 0 | |
| Stock-based compensation expense | 0 | | | 0 | | | 494 | | | 0 | | | 0 | | | 494 | |
| Net income | 0 | | | 0 | | | 0 | | | 15,271 | | | 0 | | | 15,271 | |
| Other comprehensive loss | 0 | | | 0 | | | 0 | | | 0 | | | (700) | | | (700) | |
| Balance at December 28, 2019 | $ | 45,075 | | | $ | 2,510 | | | $ | 157,547 | | | $ | (131,113) | | | $ | (808) | | | $ | 73,211 | |
| Repurchases of Common Stock - 555,875 shares | (1,668) | | | 0 | | | 747 | | | 0 | | | 0 | | | (921) | |
| Restricted stock grants issued - 131,867 shares | 265 | | | 131 | | | (396) | | | 0 | | | 0 | | | 0 | |
| Stock-based compensation expense | 0 | | | 0 | | | 431 | | | 0 | | | 0 | | | 431 | |
| Net loss | 0 | | | 0 | | | 0 | | | (9,208) | | | 0 | | | (9,208) | |
| Other comprehensive income | 0 | | | 0 | | | 0 | | | 0 | | | 278 | | | 278 | |
| Balance at December 26, 2020 | $ | 43,672 | | | $ | 2,641 | | | $ | 158,329 | | | $ | (140,321) | | | $ | (530) | | | $ | 63,791 | |
| | | | | | | | | | | | | | | | | | | | | | | | | | | | | | | | | | | |
| | Common Stock | | Class B Common Stock | | Additional Paid-In Capital | | Accumulated Deficit | | Accumulated Other Comprehensive Income | | Total Stockholders' Equity |
| Balance at December 25, 2021 | $ | 44,378 | | | $ | 3,015 | | | $ | 157,657 | | | $ | (138,705) | | | $ | 30 | | | $ | 66,375 | |
| Repurchases of Common Stock - 640,909 shares | (1,923) | | | — | | | 1,186 | | | — | | | — | | | (737) | |
| Restricted stock grants issued - 427,911 shares | 911 | | | 373 | | | (1,284) | | | — | | | — | | | — | |
| Restricted stock grants forfeited - 2,000 shares | (6) | | | — | | | 6 | | | — | | | — | | | — | |
| | | | | | | | | | | |
| Stock-based compensation expense | — | | | — | | | 766 | | | — | | | — | | | 766 | |
| Net loss | — | | | — | | | — | | | (35,079) | | | — | | | (35,079) | |
| Other comprehensive income | — | | | — | | | — | | | — | | | 189 | | | 189 | |
| Balance at December 31, 2022 | $ | 43,360 | | | $ | 3,388 | | | $ | 158,331 | | | $ | (173,784) | | | $ | 219 | | | $ | 31,514 | |
| | | | | | | | | | | |
| Repurchases of Common Stock - 55,994 shares | (168) | | | — | | | 125 | | | — | | | — | | | (43) | |
| | | | | | | | | | | |
| Restricted stock grants issued - 55,000 shares | 165 | | | — | | | (165) | | | — | | | — | | | — | |
| Restricted stock grants forfeited - 51,220 shares | (154) | | | — | | | 107 | | | — | | | — | | | (47) | |
| Class B converted into Common Stock - 8,029 shares | 25 | | | (25) | | | — | | | — | | | — | | | — | |
| Stock-based compensation expense | — | | | — | | | 734 | | | — | | | — | | | 734 | |
| Net loss | — | | | — | | | — | | | (2,718) | | | — | | | (2,718) | |
| Cumulative effect of CECL adoption | — | | | — | | | — | | | (198) | | | — | | | (198) | |
| Other comprehensive income | — | | | — | | | — | | | — | | | 49 | | | 49 | |
| Balance at December 30, 2023 | $ | 43,228 | | | $ | 3,363 | | | $ | 159,132 | | | $ | (176,700) | | | $ | 268 | | | $ | 29,291 | |
See accompanying notes to the consolidated financial statements.
THE DIXIE GROUP, INC.
NOTES TO CONSOLIDATED FINANCIAL STATEMENTS
(amounts in thousands, except per share data)
(Continued)
NOTE 1 - SUMMARY OF SIGNIFICANT ACCOUNTING POLICIES
Business
The Company's businesses consist principally of marketing, manufacturing and selling finished carpet, rugs, and luxury vinyl flooring and engineered wood flooring in the domestic floorcovering market. The Company sells floorcovering products in both residential and commercial applications. Additionally, the Company provides manufacturing support to its carpet businesses through its separate processing operations.
Based on applicable accounting standards, the Company has determined that it has one reportable segment, Floorcovering comprisingFloorcovering. Prior to the sale of the Commercial Business, the Company had two operating segments, Residential and Commercial. Pursuant to accounting standards, the Company hasCommercial that was aggregated the two operating segments into one reporting segment because theyreportable segment. The Company's Floorcovering products have similar economic characteristics and the operating segments are similar in all of the following areas: (a) the nature of the products and services; (b) the nature of the production processes; (c) the type or class of customer for their products and services; (d) the methods used to distribute their products or provide their services; and (e) the nature of the regulatory environment.
Unless specifically noted otherwise, footnote disclosures reflect the results of continuing operations only. The results of discontinued operations are presented in Note 20.
Principles of Consolidation
The Consolidated Financial Statements include the accounts of The Dixie Group, Inc. and its wholly-owned subsidiaries (the "Company"). Significant intercompany accounts and transactions have been eliminated in consolidation.
Use of Estimates in the Preparation of Financial Statements
The preparation of consolidated financial statements in conformity with U.S. generally accepted accounting principles ("U.S. GAAP") requires management to make estimates and assumptions that affect the amounts reported in the financial statements and accompanying notes. Actual results could differ from those estimates and these differences could be material.
Fiscal Year
The Company ends its fiscal year on the last Saturday of December. All references herein to "2020," "2019,""2023" and "2018,""2022" mean the fiscal years ended December 26, 2020, December 28, 2019,30, 2023 and December 29, 2018,31, 2022 respectively. All years presentedFiscal year 2023 contained 52 weeks and Fiscal year 2022 contained 53 weeks.
Reclassifications
The Company reclassified certain amounts in 20192022 in Note 9 Long-Term Debt and 2018Credit Arrangements and Note 10 Leases to conform to the 20202023 presentation. In 2022, the Company included its failed sales and leaseback transactions in its lease footnote with a note indicating they were included. In 2023, the Company included these transactions in its debt footnote and reclassified amounts in the comparative 2022 year.
Discontinued Operations
The consolidated financial statements separately report discontinued operations and the results of continuing operations (See Note 22)20).
Cash and Cash Equivalents
Highly liquid investments with original maturities of three months or less when purchased are reported as cash equivalents.
Market Risk
The Company sells carpet to floorcovering retailers, the interior design, architectural and specifier communities and supplies carpet yarn and carpet dyeing and finishing services to certain manufacturers. The Company's customers are located principally throughout the United States. As a percentage of net sales, 1 customer accounted for approximately 7% in 2020, 11% in 2019 and 13% in 2018. No other customer accounted for more than 10% of net sales in 2020, 2019,2023 or 2018,2022, nor did the Company make a significant amount of sales to foreign countries during 2020, 2019,2023 or 2018.2022.
THE DIXIE GROUP, INC.
NOTES TO CONSOLIDATED FINANCIAL STATEMENTS
(amounts in thousands, except per share data)
Allowance for Expected Credit RiskLosses
The Company grants credit to its customers with defined payment terms, performs ongoing evaluations of the credit worthiness of its customers and generally does not require collateral. Accounts receivable are carried at their outstanding principal amounts, less an anticipated amount for discounts and an allowance for doubtful accounts,expected credit losses, which management believes is sufficient to cover potential credit losses based on historical experience and periodic evaluation of the financial condition of the Company's customers. As a percentageEstimated credit losses consider relevant information about past events, current conditions and reasonable and supporting forecasts that affect the collectibility of customer's trade accounts receivable, 1 customer accounted for approximately 20% in 2020,
THE DIXIE GROUP, INC.
NOTES TO CONSOLIDATED FINANCIAL STATEMENTS
(amounts in thousands, except per share data)
(Continued)
18% in 2019, and 34% in 2018.financial assets. Notes receivable are carried at their outstanding principal amounts, less an allowance for doubtful accountsexpected credit losses to cover potential credit losses based on the financial condition of borrowers and collateral held by the Company.
Inventories
Inventories are stated at the lower of cost or market. Cost is determined using the last-in, first-out ("LIFO") method, which generally matches current costs of inventory sold with current revenues, for substantially all inventories.
Property, Plant and Equipment
Property, plant and equipment are stated at the lower of cost or impaired value. Provisions for depreciation and amortization of property, plant and equipment have been computed for financial reporting purposes using the straight-line method over the estimated useful lives of the related assets, ranging from 10 to 40 years for buildings and improvements, and 3 to 10 years for machinery and equipment. Costs to repair and maintain the Company's equipment and facilities are expensed as incurred. Such costs typically include expenditures to maintain equipment and facilities in good repair and proper working condition.
Impairment of Long-Lived Assets
Long-lived assets are reviewed for impairment when circumstances indicate that the carrying value of an asset may not be fully recoverable. When the carrying value of the asset exceeds the value of its estimated undiscounted future cash flows, an impairment charge is recognized equal to the difference between the asset's carrying value and its fair value. Fair value is estimated using discounted cash flows, prices for similar assets or other valuation techniques.
Goodwill and Other Intangible Assets
Goodwill represents the excess of purchase price over the fair value of identified net assets acquired in business combinations. In accordance with the provisions of the Financial Accounting Standards Board ("FASB") Accounting Standards Codification Topic ("ASC") 350, “Intangibles-Goodwill and Other,” the Company tests goodwill for impairment annually in the fourth quarter of each year or more frequently if events or circumstances indicate that the carrying value of goodwill associated with a reporting unit may not be fully recoverable. The goodwill impairment tests are based on determining the fair value of the specified reporting units based on management judgments and assumptions using the discounted cash flows and comparable company market valuation approaches. The Company has identified its reporting unit as its floorcovering business for the purposes of allocating goodwill and assessing impairments. The valuation approaches are subject to key judgments and assumptions that are sensitive to change such as judgments and assumptions about sales growth rates, operating margins, the weighted average cost of capital (“WACC”) and comparable company market multiples. When developing these key judgments and assumptions, the Company considers economic, operational and market conditions that could impact the fair value of the reporting unit. However, estimates are inherently uncertain and represent only management’s reasonable expectations regarding future developments. These estimates and the judgments and assumptions upon which the estimates are based will, in all likelihood, differ in some respects from actual future results. Should a significant or prolonged deterioration in economic conditions occur or a decline in comparable company market multiples, then key judgments and assumptions could be impacted.
In the goodwill assessment process, the Company compares the carrying value of a reporting unit, including goodwill, to the fair value of the reporting unit to identify potential goodwill impairments. The Company estimates the fair value of the reporting unit by using both a discounted cash flow and comparable company market valuation approach. If an impairment is indicated in the assessment, the impairment would be measured as the amount by which the reporting unit's carrying value exceeds its fair value, not to exceed the carrying value of goodwill (See Note 7).
Identifiable intangible assets with finite lives are generally amortized on a straight-line basis over their respective lives, which range from 10 to 20 years (See Note 7).
Self-Insured Benefit Programs
The Company records liabilities to reflect an estimate of the ultimate cost of claims related to its self-insured medical and dental benefits and workers' compensation. The amounts of such liabilities are based on an analysis of the Company's historical experience for each type of claim.
THE DIXIE GROUP, INC.
NOTES TO CONSOLIDATED FINANCIAL STATEMENTS
(amounts in thousands, except per share data)
(Continued)
Income Taxes
The Company recognizes deferred income tax assets and liabilities for the future tax consequences of the differences between the financial statement carrying amounts of existing assets and liabilities and their respective tax bases. The Company evaluates the recoverability of these future tax benefits by assessing the adequacy of future expected taxable income from all sources. In the event that the Company is not able to realize all or a portion of the deferred tax assets in the future, a valuation allowance is provided. The Company recognizes such amounts through a charge to income in the period in which that determination is made or when tax law changes are enacted. The Company accounts for uncertainty in income tax positions according to FASB guidance relating to uncertain tax positions. The Company recognizes interest and penalties related to uncertain tax positions, if any, in income tax expense.
Derivative Financial Instruments
The Company does not hold speculative financial instruments, nor does it hold or issue financial instruments for trading purposes. The Company uses derivative instruments, currently interest rate swaps, to minimize the effects of interest rate volatility.
The Company recognizes all derivatives at fair value. Derivatives that are designated as cash flow hedges are linked to specific liabilities on the Company's balance sheet. The Company assesses, both at inception and on an ongoing basis, whether the derivatives that are used in hedging transactions are highly effective in offsetting changes in cash flows of the hedged items. When it is determined that a derivative is not highly effective or the derivative expires, is sold, terminated, or exercised, the Company discontinues hedge accounting for that specific hedge instrument. Changes in the fair value of effective cash flow hedges are deferred in accumulated other comprehensive income (loss) ("AOCIL") and reclassified to earnings in the same periods during which the hedge transaction affects earnings. Changes in the fair value of derivatives that are not effective cash flow hedges are recognized in results of operations.
Treasury Stock
The Company classifies treasury stock as a reduction to Common Stock for the par value of such shares acquired and the difference between the par value and the price paid for each share recorded either entirely to retained earnings or to additional paid-in-capital for periods in which the Company does not have retained earnings. This presentation reflects the repurchased shares as authorized but unissued as prescribed by state statute.
Revenue Recognition
The Company derives its revenues primarily from the sale of floorcovering products and processing services. Revenues are recognized when control of these products or services is transferred to its customers, in an amount that reflects the consideration the Company expects to be entitled to in exchange for those products and services. Sales, value add, and other taxes the Company collects concurrent with revenue-producing activities are excluded from revenue. Shipping and handling fees charged to customers are reported within revenue. When the Company transfers control of its products to the customer prior to the
THE DIXIE GROUP, INC.
NOTES TO CONSOLIDATED FINANCIAL STATEMENTS
(amounts in thousands, except per share data)
related shipping and handling activities, the Company has adopted a policy of accounting for shipping and handling activities as a fulfillment cost rather than a performance obligation. Incidental items that are immaterial in the context of the contract are recognized as expense. While the Company pays sales commissions to certain personnel, the Company has not capitalized these costs as costs to obtain a contract as the Company has elected to expense costs as incurred when the expected amortization period is one year or less. The Company does not have any significant financing components as payment is received at or shortly after the point of sale. The Company determined revenue recognition through the following steps:
•Identification of the contract with a customer
•Identification of the performance obligations in the contract
•Determination of the transaction price
•Allocation of the transaction price to the performance obligations in the contract
•Recognition of revenue when, or as, the performance obligation is satisfied
Performance Obligations
For performance obligations related to residential floorcovering and commercial floorcovering products, control transfers at a point in time. To indicate the transfer of control, the Company must have a present right to payment, legal title must have passed to the customer and the customer must have the significant risks and rewards of ownership. The Company’s principal terms of sale are FOB Shipping Point and FOB Destination and the Company transfers control and records revenue for product sales either upon shipment or delivery to the customer, respectively. Revenue is allocated to each performance obligation based on its relative stand-alone selling prices. Stand-alone selling prices are based on observable prices at which the Company separately sells the products or services.
THE DIXIE GROUP, INC.
NOTES TO CONSOLIDATED FINANCIAL STATEMENTS
(amounts in thousands, except per share data)
(Continued)
Variable Consideration
The nature of the Company’s business gives rise to variable consideration, including rebates, allowances, and returns that generally decrease the transaction price, which reduces revenue. These variable amounts are generally credited to the customer, based on achieving certain levels of sales activity, product returns, or price concessions.
Variable consideration is estimated at the most likely amount that is expected to be earned. Estimated amounts are included in the transaction price to the extent it is probable that a significant reversal of cumulative revenue recognized will not occur when the uncertainty associated with the variable consideration is resolved. Estimates of variable consideration are estimated based upon historical experience and known trends.
Advertising Costs
The Company engages in promotional and advertising programs. Expenses relating to these programs are charged to results of operations during the period of the related benefits. These arrangements do not require significant estimates of costs. Costs related to cooperative advertising programs are normally recorded as selling and administrative expenses when the Company can reasonably identify the benefit associated with the program and can reasonably estimate that the fair value of the benefit is equal to or greater than its cost. The amount of advertising and promotion expenses included in selling and administrative expenses was not significant for the years 2020, 2019, or 2018.2023 and 2022.
Warranties
The Company generally provides product warranties related to manufacturing defects and specific performance standards for its products for a period of up to two years. The Company accrues for estimated future assurance warranty costs in the period in which the sale is recorded. The costs are included in cost of sales in the Consolidated Statements of Operations and the product warranty reserve is included in accrued expenses in the Consolidated Balance Sheets. The Company calculates its accrual using the portfolio approach based upon historical experience and known trends (See Note 9)8). The Company does not provide an additional service-type warranty.
Cost of Sales
Cost of sales includes all costs related to manufacturing the Company's products, including purchasing and receiving costs, inspection costs, warehousing costs, freight costs, internal transfer costs or other costs of the Company's distribution network.
Selling and Administrative Expenses
Selling and administrative expenses include all costs, not included in cost of sales, related to the sale and marketing of the Company's products and general administration of the Company's business.
THE DIXIE GROUP, INC.
NOTES TO CONSOLIDATED FINANCIAL STATEMENTS
(amounts in thousands, except per share data)
Operating Leases
The Company determines if an arrangement is an operating lease or a financing lease at inception. A lease exists if the Company obtains substantially all of the economic benefits of, and has the right to control the use of, an asset for a period of time. Right-of-use assets represent the Company's right to use an underlying asset for the lease term, and lease liabilities represent the Company's obligation to make lease payments arising from the lease agreement. Lease assets and obligations are recognized at the lease commencement date based on the present value of lease payments over the term of the lease. Right-of-use assets may also be adjusted to reflect any prepayments made or any incentive payments received. Generally, the Company's leases do not provide a readily determinable implicit interest rate, therefore, the Company uses its incremental borrowing rate, which is based on information available at the lease commencement date, to determine the present value of lease payments.
The Company has operating leases primarily for real estate and equipment used in manufacturing. Operating lease expense is recognized in continuing operations on a straight-line basis over the lease term within cost of sales and selling and administrative expenses. Financing lease expense is comprised of both interest expense, which is recognized using the effective interest method, and amortization of the right-of-use assets. These expenses are presented consistently with the presentation of other interest expense and amortization or depreciation of similar assets. In determining lease asset values, the Company considers fixed and variable payment terms, prepayments, incentives, and options to extend, terminate or purchase. Renewal, termination, or purchase options affect the lease term used for determining lease asset value only if the option is reasonably certain to be exercised. The Company does not recognize a right-of-use asset and lease liability for leases with a term of twelve months or less.
THE DIXIE GROUP, INC.
NOTES TO CONSOLIDATED FINANCIAL STATEMENTS
(amounts in thousands, except per share data)
(Continued)
Stock-Based Compensation
The Company recognizes compensation expense relating to stock-based payments based on the fair value of the equity or liability instrument issued. Restricted stock grants with pro-rata vesting are expensed using the straight-line method. (Terms of the Company's awards are specified in Note 17)15). The Company accounts for forfeitures when they actually occur.
NOTE 2 - RECENT ACCOUNTING PRONOUNCEMENTS
Adopted Accounting Standards Adopted in Fiscal 2020
In August 2018,June 2016, the FASBFinancial Accounting Standards Board ("FASB") issued ASU 2018-13, “Accounting Standards Update ("ASU") 2016-13,Fair Value Financial Instruments – Credit Losses (Topic 326): Measurement (Topic 820) - Disclosure Framework - Changes to the Disclosure Requirements for Fair Value Measurement.” This update is a part of FASB’s disclosure framework project to improve the effectiveness of disclosures in the notes to financial statements. The amendments in this update remove, modify, and add certain disclosure requirements within Topic 820. This standard is effective for fiscal years, and interim periods within those fiscal years, beginning after December 15, 2019. Certain disclosure amendments are to be applied prospectively for only the most recent interim or annual period presented, while other amendments are to be applied retrospectively to all periods presented. The adoption of this ASU did not have a significant impact on the consolidated financial statements.
In March 2020, the FASB issued ASU 2020-04, "Reference Rate Reform (Topic 848) - Facilitation of the Effects of Reference Rate ReformCredit Losses on Financial Reporting.Instruments", which was further amended by additional accounting standards updates issued by the FASB. The amendments in this update provide optional guidancenew standard replaced the incurred loss impairment methodology for recognizing credit losses with a limited periodnew methodology that requires recognition of time to ease the potential burden in accounting for (or recognizing the effects of) reference rate reform onlifetime expected credit losses when a financial reporting. In particular,asset is originated or purchased, even if the risk of cessationloss is remote. The new methodology (referred to as the current expected credit losses model, or "CECL") applies to most financial assets measured at amortized cost, including trade receivables, and requires consideration of the London Interbank Offered Rate (LIBOR). Among the amendments are expedientsa broader range of reasonable and exceptions for applying U.S. GAAPsupportable information to contracts, hedging relationships, and other transactions affected by reference rate reform if certain criteria are met. The amendments in this update are effective for all entities as of March 12, 2020 through December 31, 2022.estimate expected credit losses. The Company is currently evaluatingadopted the new standard effective January 1, 2023 using a modified retrospective transition approach, with the cumulative impact of $198 recorded as an increase in the transition from LIBOR to alternative reference interest rates, but does not expect a significant impact to its operating results, financial position or cash flows.accumulated deficit.
Accounting Standards Yet to Be Adopted
In June 2016,November 2023, the FASB issued ASU No. 2016-13, "2023-07, Financial Instruments - Credit LossesSegment Reporting (Topic 326)280): Measurement of Credit Losses on Financial Instruments,"Improvements to Reportable Segment Disclosures, which amends the impairment model to utilize an expected loss methodology in placeenhances reporting requirements under Topic 280. The enhanced disclosure requirements include: title and position of the current incurredChief Operating Decision Maker (CODM), significant segment expenses provided to the CODM, extending certain annual disclosures to interim periods, clarifying single reportable segment entities must apply ASC 280 in its entirety, and permitting more than one measure of segment profit or loss methodology, which will result in the more timely recognition of losses. For smaller reporting entities, ASU 2016-13to be reported under certain circumstances. This change is effective for annualfiscal years beginning after December 15, 2023 and interim periods beginning after December 15, 2022, including interim periods within those fiscal years. The ASU, including the subsequently issued codification improvements update ("Codification Improvements to Topic 326, Financial Instruments—Credit Losses, Topic 815, Derivatives and Hedging, and Topic 825, Financial Instruments," ASU 2019-04) and the targeted transition relief update ("Financial Instruments-Credit Losses (Topic 326)," ASU 2019-05), is not expected to have a significant impact on the consolidated financial statements due to the nature of the Company's customers and the limited amount of write-offs in past years.
In August 2018, the FASB issued ASU 2018-14, “Compensation - Retirement Benefits - Defined Benefit Plans - General (Subtopic 715-20) - Disclosure Framework - Changes to the Disclosure Requirements for Defined Benefit Plans.” 2024. This update is a part of FASB’s disclosure framework project to improve the effectiveness of disclosures in the notes to financial statements. The amendments in this update modify the disclosure requirements for employers that sponsor defined benefit pension or other postretirement plans. This standard is effective for fiscal years ending after December 15, 2020 and early adoption is permitted. Upon adoption, this update is to be applied on a retrospective basischange will apply retrospectively to all periods presented. The Company does not believe thatexpect the adoption of this ASU will have a significant impact on its consolidated financial statements.
In December 2019, the FASB issued ASU No. 2019-12, "Income Taxes (ASC 740): Simplifying the Accounting for Income Taxes." The standard eliminates the need for an organization to analyze whether the following apply in a given period: (1) the exception to the incremental approach for intraperiod tax allocation; (2) the exceptions to accounting for basis differences when there are ownership changes in foreign investments; and (3) the exception in interim periods income tax accounting for year-to-date losses that exceed anticipated losses. The ASU also is designed to improve financial statement preparers’ application of income tax-related guidance and simplify GAAP for (1) franchise taxes that are partially based on income, (2) transactions with a government that result in a step-up in the tax basis of goodwill, (3) separate financial statements of legal entities that are not subject to tax, (4) enacted changes in tax laws in interim periods and (5) certain income tax accounting for employee stock ownership plans and affordable housing projects. The amendments in this Update are effective for fiscal years, and interim periods within those fiscal years, beginning after December 15, 2020. The Company does not expect adoption to have a material impact on its financial statements.
In December 2023, the FASB issued ASU 2023-09, Improvements to Income Tax Disclosures (Topic 740), which establishes new income tax disclosure requirements in addition to modifying and eliminating certain existing requirements. The new guidance requires consistent categorization and greater disaggregation of information in the rate reconciliation, as well as further disaggregation of income taxes paid. This change is effective for annual periods beginning after December 15, 2024. This change will apply on a prospective basis to annual financial statements for periods beginning after the effective date. However, retrospective application in all prior periods presented is permitted. The Company does not expect the adoption of this ASU to have a material impact on its financial statements.
THE DIXIE GROUP, INC.
NOTES TO CONSOLIDATED FINANCIAL STATEMENTS
(amounts in thousands, except per share data)
(Continued)
NOTE 3 - REVENUE
Disaggregation of Revenue from Contracts with Customers
The following table disaggregates the Company’s revenue by end-user markets for the years ended December 26, 2020, December 28, 2019, and December 29, 2018:markets:
| | | | | | | | | | | | | | | | | | | | | | | | |
| | 2020 | | 2019 | | 2018 | | | | |
| Residential floorcovering products | | $ | 249,388 | | | $ | 268,186 | | | $ | 289,129 | | | | | |
| Commercial floorcovering products | | 65,070 | | | 103,286 | | | 113,971 | | | | | |
| Other services | | 1,481 | | | 3,110 | | | 1,933 | | | | | |
| Total net sales | | $ | 315,939 | | | $ | 374,582 | | | $ | 405,033 | | | | | |
| | | | | | | | | | | | | | | | | | | | |
| | 2023 | | 2022 | | | | | | |
| Residential floorcovering products | | $ | 272,210 | | | $ | 297,195 | | | | | | | |
| Other services | | 4,133 | | | 6,375 | | | | | | | |
| Total net sales | | $ | 276,343 | | | $ | 303,570 | | | | | | | |
Residential floorcovering products. Residential floorcovering products include broadloom carpet, rugs, luxury vinyl flooring and engineered hardwood. These products are sold into the designer, retailer, mass merchant and builder markets.
Commercial floorcovering products. Commercial floorcovering products include broadloom carpet, carpet tile, rugs, and luxury vinyl flooring. These products are sold into the corporate, hospitality, healthcare, government, and education markets through the use of designers and architects.
Other services.Other services include carpet yarn processing and carpet dyeing services.
Contract Balances
Other than receivables that represent an unconditional right to consideration, which are presented separately (See Note 4), the Company does not recognize any contract assets which give conditional rights to receive consideration, as the Company does not incur costs to obtain customer contracts that are recoverable. The Company often receives cash payments from customers in advance of the Company’s performance for limited production run orders resulting in contract liabilities. These contract liabilities are classified in accrued expenses in the Consolidated Balance Sheets based on the timing of when the Company expects to recognize revenue, which is typically less than a year. The net decrease or increase in the contract liabilities is primarily driven by order activity for limited runs requiring deposits offset by the recognition of revenue and application of deposit on the receivables ledger for such activity during the period. The activity in the advanced deposits for the year ended December 26, 2020, December 28, 2019, and December 29, 2018 iscontinuing operations are as follows:
| | | | | | | | | | | | | | | | | |
| 2020 | | 2019 | | 2018 |
| Beginning contract liability | $ | 4,685 | | | $ | 6,013 | | | $ | 5,717 | |
| Revenue recognized from contract liabilities included in the beginning balance | (4,404) | | | (5,873) | | | (5,717) | |
| Increases due to cash received, net of amounts recognized in revenue during the period | 2,859 | | | 4,545 | | | 6,013 | |
| Ending contract liability | $ | 3,140 | | | $ | 4,685 | | | $ | 6,013 | |
| | | | | | | | | | | | | |
| 2023 | | 2022 | | |
| Beginning contract liability | $ | 1,055 | | | $ | 1,285 | | | |
| Revenue recognized from contract liabilities included in the beginning balance | (881) | | | (1,104) | | | |
| Increases due to cash received, net of amounts recognized in revenue during the period | 792 | | | 874 | | | |
| Ending contract liability | $ | 966 | | | $ | 1,055 | | | |
NOTE 4 - RECEIVABLES, NET
Receivables are summarized as follows:
| | 2020 | | 2019 |
| 2023 | | | 2023 | | 2022 |
| Customers, trade | Customers, trade | $ | 36,735 | | | $ | 34,285 | |
| Other receivables | Other receivables | 1,125 | | | 3,115 | |
| Gross receivables | Gross receivables | 37,860 | | | 37,400 | |
| Less: allowance for doubtful accounts | (144) | | | (262) | |
Less: allowance for expected credit losses (1) | |
| Receivables, net | Receivables, net | $ | 37,716 | | | $ | 37,138 | |
Bad debt(1)The Company adopted the new standard , ASU 2016-13, Financial Instruments - Credit Losses (Topic 326): Measurement of Credit Losses on Financial Instruments, on January 1, 2023 using a modified retrospective transition approach, with the cumulative impact being $388 from continuing operations. The Company recognized an expense wasto the provision for the expected credit losses of $31 and recognized write-offs, net of recoveries of $90 in 2020, $240 in 2019, and $163 in 2018.2023.
THE DIXIE GROUP, INC.
NOTES TO CONSOLIDATED FINANCIAL STATEMENTS
(amounts in thousands, except per share data)
(Continued)
NOTE 5 - INVENTORIES, NET
Inventories are summarized as follows:
| | 2020 | | 2019 |
| 2023 | | | 2023 | | 2022 |
| Raw materials | Raw materials | $ | 31,167 | | | $ | 32,377 | |
| Work-in-process | Work-in-process | 13,305 | | | 18,642 | |
| Finished goods | Finished goods | 59,271 | | | 64,978 | |
| Supplies and other | Supplies and other | 167 | | | 260 | |
| LIFO reserve | LIFO reserve | (18,511) | | | (20,748) | |
| Inventories, net | Inventories, net | $ | 85,399 | | | $ | 95,509 | |
Reduction of inventory quantities in 20202023 resulted in liquidations of LIFO inventories carried at prevailing costs established in prior years and decreased cost of sales by $559$1,145 in 2020.
In March 2019, the Company incurred an inventory liquidation due to a consignment agreement with a primary vendor of raw materials. The former inventory levels are not expected to be reinstated. The Company recognized the effect within 2019 which resulted in liquidations of LIFO inventories carried at prevailing costs established in prior years and reduced cost of sales by $281.2023.
NOTE 6 - PROPERTY, PLANT AND EQUIPMENT, NET
Property, plant and equipment consists of the following:
| | 2020 | | 2019 |
| 2023 | | | 2023 | | 2022 |
| Land and improvements | Land and improvements | $ | 3,422 | | | $ | 3,422 | |
| Buildings and improvements | Buildings and improvements | 51,479 | | | 51,432 | |
| Machinery and equipment | Machinery and equipment | 181,642 | | | 179,993 | |
| Assets under construction | Assets under construction | 1,167 | | | 1,459 | |
| 237,710 | | | 236,306 | |
| 200,772 | |
| Accumulated depreciation | Accumulated depreciation | (179,806) | | | (170,864) | |
| Property, plant and equipment, net | Property, plant and equipment, net | $ | 57,904 | | | $ | 65,442 | |
Depreciation of property, plant and equipment, including amounts for finance leases, totaled $10,527$7,122 in 2020, $11,2192023 and $7,412 in 2019 and $12,141 in 2018.2022.
NOTE 7 - GOODWILL AND OTHER INTANGIBLE ASSETS
The carrying amount of goodwill is $0 as of December 26, 2020 and December 28, 2019, respectively. The Company performed its annual assessment of goodwill in the fourth quarter of 2018. At the end of 2018, it was determined that the carrying value was greater than calculated fair value. Also at the end of 2018, the intangibles were determined to not be recoverable based on revised projections. Impairment costs incurred are classified as "impairment of assets" in the Company's Consolidated Statements of Operations.
The following table represents the details of the Company's intangible assets that were subject to amortization during 2018:
| | | | | | | | | | | | | | | | | | | | | | | | | | | | | | | |
| | | 2018 |
| | | | | | | | | Gross | | Accumulated Amortization | | Impairment | | Net |
| Customer relationships | | | | | | | | | $ | 208 | | | $ | (96) | | | $ | (112) | | | $ | 0 | |
| Rug design coding | | | | | | | | | 144 | | | (86) | | | (58) | | | 0 | |
| Trade names | | | | | | | | | 3,300 | | | (1,314) | | | (1,986) | | | 0 | |
| Total | | | | | | | | | $ | 3,652 | | | $ | (1,496) | | | $ | (2,156) | | | $ | 0 | |
THE DIXIE GROUP, INC.
NOTES TO CONSOLIDATED FINANCIAL STATEMENTS
(amounts in thousands, except per share data)
(Continued)
Amortization expense for intangible assets is summarized as follows:
| | | | | | | | | | | | | | | | | | |
| | |
| 2020 | | 2019 | | 2018 | |
| Customer relationships | $ | 0 | | | $ | 0 | | | $ | 16 | | |
| Rug design coding | 0 | | | 0 | | | 14 | | |
| Trade names | 0 | | | 0 | | | 275 | | |
| Amortization expense | $ | 0 | | | $ | 0 | | | $ | 305 | | |
NOTE 87 - ACCRUED EXPENSES
Accrued expenses are summarized as follows:
| | 2020 | | 2019 |
| 2023 | | | 2023 | | 2022 |
| Compensation and benefits (1) | Compensation and benefits (1) | $ | 9,159 | | | $ | 8,804 | |
| Provision for customer rebates, claims and allowances | Provision for customer rebates, claims and allowances | 8,006 | | | 7,682 | |
| Advanced customer deposits | Advanced customer deposits | 3,139 | | | 4,685 | |
| Outstanding checks in excess of cash | Outstanding checks in excess of cash | 2,094 | | | 0 | |
| Other | Other | 3,567 | | | 4,247 | |
| Accrued expenses | Accrued expenses | $ | 25,965 | | | $ | 25,418 | |
(1)Includes a liability related to the Company's self-insured Workers' Compensation program. This program is collateralized by letters of credit in the aggregate amount of $2,452.$4,131. The Company has other letters of credit outstanding totaling $852.
THE DIXIE GROUP, INC.
NOTES TO CONSOLIDATED FINANCIAL STATEMENTS
(amounts in thousands, except per share data)
NOTE 98 - PRODUCT WARRANTY RESERVES
The Company generally provides product warranties related to manufacturing defects and specific performance standards for its products. Product warranty reserves are included in accrued expenses in the Company's Consolidated Balance Sheets. The following is a summary of the Company's product warranty activity:activity for continuing operations:
| | | | | | 2020 | | 2019 | 2023 | | 2022 |
| | Product warranty reserve at beginning of period | Product warranty reserve at beginning of period | $ | 1,002 | | | $ | 1,069 | |
| Product warranty reserve at beginning of period | |
| Product warranty reserve at beginning of period | |
| | Warranty liabilities accrued | Warranty liabilities accrued | 782 | | | 1,667 | |
| Warranty liabilities accrued | |
| Warranty liabilities accrued | |
| Warranty liabilities settled | Warranty liabilities settled | (790) | | | (1,695) | |
| Changes for pre-existing warranty liabilities | 0 | | | (39) | |
| | Product warranty reserve at end of period | Product warranty reserve at end of period | $ | 994 | | | $ | 1,002 | |
| Product warranty reserve at end of period | |
| Product warranty reserve at end of period | |
THE DIXIE GROUP, INC.
NOTES TO CONSOLIDATED FINANCIAL STATEMENTS
(amounts in thousands, except per share data)
(Continued)
NOTE 109 - LONG-TERM DEBT AND CREDIT ARRANGEMENTS
Long-term debt consists of the following:
| | 2020 | | 2019 |
| 2023 | | | 2023 | 2022 |
| Revolving credit facility | Revolving credit facility | $ | 28,353 | | | $ | 59,693 | |
| Term loans | Term loans | 24,970 | | | 0 | |
| Notes payable - buildings | Notes payable - buildings | 5,900 | | | 6,213 | |
| Notes payable - equipment and other | 3,926 | | | 3,533 | |
| Finance lease - buildings | 11,097 | | | 11,296 | |
| Notes payable - other | |
| | Finance lease obligations | |
| Finance lease obligations | |
| Finance lease obligations | Finance lease obligations | 5,841 | | | 8,187 | |
| Deferred financing costs, net | Deferred financing costs, net | (1,930) | | | (571) | |
| Total long-term debt | 78,157 | | | 88,351 | |
| Total debt | |
| Less: current portion of long-term debt | Less: current portion of long-term debt | 6,116 | | | 6,684 | |
| Long-term debt | Long-term debt | $ | 72,041 | | | $ | 81,667 | |
Revolving Credit Facility
During the fourth quarter,On October 30, 2020, the Company entered into a $75,000 Senior Secured Revolving Credit Facility with Fifth Third Bank National Association as lender. The loan is secured by a first priority security interest on all accounts receivable, cash, and inventory, and provides for borrowing limited by certain percentages of values of the accounts receivable and inventory. The revolving credit facility matures on October 30, 2025.
At the Company's election, advances of the revolving credit facility bear interest at annual rates equal to either (a) LIBORSOFR (plus a 0.10% SOFR adjustment) for 1 2, or 3 month periods, as defined with a floor orof 0.75% or published LIBOR,SOFR, plus an applicable margin ranging between 1.50% and 2.00%, or (b) the higher of the prime rate plus an applicable margin ranging between 0.50% and 1.00%. The applicable margin is determined based on availability under the revolving credit facility with margins increasing as availability decreases. The applicable margin can be increased by 0.50% if the fixed charge coverage ratio is below a 1.10 to 1.00 ratio. As of December 26, 2020,30, 2023, the applicable margin on the Company's revolving credit facility was 1.75%.2.50% for SOFR and 1.50% for Prime due to the fixed charge coverage ratio being below 1.10 to 1.00. The Company pays an unused line fee on the average amount by which the aggregate commitments exceed utilization of the revolving credit facility equal to 0.25% per annum. The weighted-average interest rate on borrowings outstanding under the revolving credit facility was 2.68%8.15% at December 26, 2020. Under the old revolving credit facility, the Company's weighted-average interest rate on borrowings outstanding was 4.79% at30, 2023 and 6.81% for December 28, 2019. At the Company's election, advances of the old revolving credit facility bore interest at annual rates equal to either (a) LIBOR for 1, 2 or 3 month periods, as selected by the Company, plus an applicable margin ranging between 1.50% and 2.00%, or (b) the higher of the prime rate, the Federal Funds rate plus 0.5%, or a daily LIBOR rate plus 1.00%, plus an applicable margin ranging between 0.50% and 1.00%.31, 2022.
The agreement is subject to customary terms and conditions and annual administrative fees with pricing varying on excess availability and a fixed charge coverage ratio. The agreement is also subject to certain compliance, affirmative, and financial covenants. As of the reporting date, the Company is in compliance with all such applicable financial covenants. The Company is only subject to the financial covenants if borrowing availability is less than $8,342, which is equal to 12.5% of the lesser of the total loan availability of $75,000 or total collateral available, and remains until the availability is greater than 12.5% for thirty consecutive days. As of December 26, 2020,30, 2023, the unused borrowing availability under the revolving credit facility was $43,344.$14,132.
Effective October 30, 2020, the Company's previous Senior Secured Credit Facility with Wells Fargo Capital Finance, LLC was terminated and repaid, with the subsequent new loans, by the Company upon notice to the lender
THE DIXIE GROUP, INC.
NOTES TO CONSOLIDATED FINANCIAL STATEMENTS
(amounts in accordance with the terms of the facility.thousands, except per share data)
Term Loans
Effective October 28, 2020, the Company entered into a $10,000 principal amount USDA Guaranteed term loan with AmeriState Bank as lender. The term of the loan is 25 years and bears interest at a minimum 5.00% rate or 4.00% above 5-year treasury, to be reset every 5 years at 3.5% above 5-year treasury. The loan is secured by a first mortgage on the Company’s Atmore, Alabama and Roanoke, Alabama facilities and requires certain compliance, affirmative, and financial covenants. As of the reporting date, the Company is in compliance with all such covenants.facilities.
Effective October 29, 2020, the Company entered into a $15,000 principal amount USDA Guaranteed term loan with the Greater Nevada Credit Union as lender. The term of the loan is 10 years and bears interest at a minimum 5.00% rate or 4.00% above 5- year treasury, to be reset after 5 years at 3.5% above 5-year treasury. Payments on the loan are interest only over the first three years and principal and interest over the remaining seven years. The loan is secured by a first lien on a substantial portion of the Company’s machinery and equipment and a second lien on the Company’s Atmore and Roanoke facilities. The loan
THE DIXIE GROUP, INC.
NOTES TO CONSOLIDATED FINANCIAL STATEMENTS
(amounts in thousands, except per share data)
(Continued)Notes Payable - Buildings
On March 16, 2022, the Company entered into a twenty-year $11,000 note payable to refinance an existing note payable on its distribution center in Adairsville, Georgia (the "Property"). The refinanced note payable bore interest at a fixed annual rate of 3.81%. Concurrent with the closing of this note, the Company paid off the existing note secured by the Property in the amount of $5,456 and terminated the existing interest rate swap agreement. On December 14, 2023, the Company sold the Property and completed a successful sale and leaseback of the Property. The Company paid off the existing note in the amount of $10,368. As a result of the debt extinguishment, the Company recognized an expense of $206 for previously deferred financing costs on the note. The note had been secured by the Property and a guarantee of the Company. (See Note 10.)
requires
Debt Covenant Compliance and Liquidity Considerations
The Company's agreements for its Revolving Credit Facility and its term loans include certain compliance, affirmative, and financial covenants and, as of the reporting date, the Company is in compliance with or has received waivers for all such financial covenants. Payments
In the Company's self-assessment of going concern, with reflection on the loan are interest only overCompany's operating losses in 2023 and 2022, the first three yearsCompany considered its future ability to comply with the financial covenants in its existing debt agreements. Topic 205 requires Company management to perform a going concern self-assessment each annual and principalinterim reporting period. In performing its evaluation, management considered known and interest overreasonably knowable information as of the remaining seven years.reporting date. The Company also considered the significant unfavorable impact if it were unable to maintain compliance with financial covenants by its primary lenders. As part of the evaluation, the Company considered the improved gross margins driven by cost reductions implemented under its East Coast Consolidation Plan. The financial statements do not include any adjustments that might result from the outcome of the uncertainty of the ability to maintain compliance with the financial covenants.
Notes Payable - Buildings
On November 7, 2014, the Company entered into a ten-year $8,330 note payable to purchase a previously leased distribution center in Adairsville, Georgia. The note payable is scheduled to mature on November 7, 2024 and is secured by the distribution center. The note payable bears interest at a variable rate equal to one-month LIBOR plus 2.0% and is payable in equal monthly installments of principal of $35, plus interest calculated on the declining balance of the note, with a final payment of $4,165 due on maturity. In addition, the Company entered into an interest rate swap with an amortizing notional amount effective November 7, 2014 which effectively fixes the interest rate at 4.50%.
Notes Payable - Equipment and Other
The Company's equipment financing notes have terms ranging from 1 to 7 years, bear interest ranging from 1.60% to 7.00% and are due in monthly installments through their maturity dates. The Company's equipment financing notes are secured by the specific equipment financed and do not contain any financial covenants.
Finance Lease - Buildings
On January 14, 2019, the Company, entered into a purchase and sale agreement (the “Purchase and Sale Agreement”) with Saraland Industrial, LLC, an Alabama limited liability company (the “Purchaser”). Pursuant to the terms of the Purchase and Sale Agreement, the Company sold its Saraland facility, and approximately 17.12 acres of surrounding property located in Saraland, Alabama (the “Property”) to the Purchaser for a purchase price of $11,500. Concurrent with the sale of the Property, the Company and the Purchaser entered into a twenty-yeartwenty-year lease agreement (the “Lease Agreement”), whereby the Company will lease back the Property at an annual rental rate of $977, subject to annual rent increases of 1.25%. Under the Lease Agreement, the Company has two (2) consecutive options to extend the term of the Lease by ten years for each such option. This transaction was recorded as a failed sale and leaseback as the present value of lease payments exceeded 90% of its fair value.leaseback. The Company recorded a liability for the amounts received, will continue to depreciate the asset, and has imputed an interest rate of 7.07% so that the net carrying amount of the financial liability and remaining assets will be zero at the end of the twenty-year lease term. Concurrently with the sale, the Company paid off the approximately $5,000 mortgage on the property to First Tennessee Bank National Association and terminated the related fixed interest rate swap agreement.
Finance Lease ObligationsOn September 15, 2023, the Company modified a note payable on equipment which had previously been recorded as a failed sale and leaseback. The note payable bears interest at fixed interest rate of 7.84% and matures on December 1, 2024. The Company recognized a gain of $625 related to an extinguishment of debt on the note payable.
The Company's financed lease obligationsother financing notes have terms up to 1 year, bear interest ranging from 36.34% to 6 years7.84% and are due in monthly or quarterly installments through their maturity dates. The Company's finance lease obligations are secured by the specific equipment leased.
See Note 11 for further discussion of the impact of COVID-19 on the Company's finance lease obligations.
Interest Payments and Debt Maturities
Cash paid for interest for continuing operations was $5,293 in 2020, $6,303 in 2019, and $6,290 in 2018. These amounts include cash paid for financing leases of $1,702 in 2020, $1,378 in 2019, and $791 in 2018. Maturities of long-term debt for periods following December 26, 2020 are as follows:
| | | | | | | | | | | | | | | | | |
| | Long-Term
Debt | | Finance Leases (See Note 11) | | Total |
|
| 2021 | $ | 3,346 | | | $ | 2,768 | | | $ | 6,114 | |
| 2022 | 1,520 | | | 1,486 | | | 3,006 | |
| 2023 | 1,259 | | | 2,344 | | | 3,603 | |
| 2024 | 6,578 | | | 325 | | | 6,903 | |
| 2025 | 30,540 | | | 357 | | | 30,897 | |
| Thereafter | 19,906 | | | 9,658 | | | 29,564 | |
| Total maturities of long-term debt | $ | 63,149 | | | $ | 16,938 | | | $ | 80,087 | |
| Deferred financing costs, net | (1,930) | | | 0 | | | (1,930) | |
| Total long-term debt | $ | 61,219 | | | $ | 16,938 | | | $ | 78,157 | |
THE DIXIE GROUP, INC.
NOTES TO CONSOLIDATED FINANCIAL STATEMENTS
(amounts in thousands, except per share data)
(Continued)
NOTE 11 - LEASES
COVID-19 Pandemic
In response to the large volume of anticipated lease concessions to be granted related to the effects of the COVID-19 pandemic, and the resulting expected cost and complexity of applying the lease modification requirements in ASC 842, the FASB issued Staff Q&A-Topic 842 and Topic 840: Accounting for Lease Concessions Related to the Effects of the COVID-19 Pandemic, in April 2020 as interpretive guidance to provide clarity in response to the crisis. The FASB staff indicated that it would be acceptable for entities to make an election to account for lease concessions related to the effects of the COVID-19 pandemic consistent with how they would be accounted for as though enforceable rights and obligations for those concessions existed in the original contract. Consequently, for such lease concessions, an entity will not need to reassess each existing contract to determine whether enforceable rights and obligations for concessions exist and an entity can then elect to apply or not to apply the lease modification guidance in ASC 842 to those contracts. This election is available for concessions related to the effects of the COVID-19 pandemic that will result in the total payments required by the modified contract being substantially the same as or less than total payments required by the original contract.
The Company has made this election and, consequently, for such lease concessions, did not reassess each existing contract to determine whether enforceable rights and obligations for concessions existed and elected not to apply the lease modification guidance in ASC 842 to those contracts. The Company has accounted for the concessions as if no changes to the lease contract were made and has subsequently increased accounts payable and has continued to recognize expense during the deferral period.
Balance sheet information related to right-of-use assets and liabilities is as follows:
| | | | | | | | | | | | | | | | | |
| Balance Sheet Location | | December 26, 2020 | | December 28, 2019 |
| Operating Leases: | | | | | |
| Operating lease right-of-use assets | Operating lease right-of-use assets | | $ | 22,074 | | | $ | 24,835 | |
| | | | | |
| Current portion of operating lease liabilities | Current portion of operating lease liabilities | | 3,323 | | | 3,172 | |
| Noncurrent portion of operating lease liabilities | Operating lease liabilities | | 19,404 | | | 22,123 | |
| Total operating lease liabilities | | | $ | 22,727 | | | $ | 25,295 | |
| | | | | |
| Finance Leases: | | | | | |
| Finance lease right-of-use assets (1) | Property, plant, and equipment, net | | $ | 14,332 | | | $ | 15,152 | |
| | | | | |
| Current portion of finance lease liabilities (1) | Current portion of long-term debt | | 2,771 | | | 4,011 | |
| Noncurrent portion of finance lease liabilities (1) | Long-term debt | | 14,167 | | | 15,472 | |
| | | $ | 16,938 | | | $ | 19,483 | |
(1) Includes leases classified as failed sale-leaseback transactions.
THE DIXIE GROUP, INC.
NOTES TO CONSOLIDATED FINANCIAL STATEMENTS
(amounts in thousands, except per share data)
(Continued)
Finance Lease Obligations
The Company's financed lease obligations are due in monthly installments through their maturity dates. The Company's finance lease obligations are secured by the specific equipment leased.
Debt Maturities
Maturities of long-term debt for periods following December 30, 2023 are as follows:
| | | | | | | | | | | | | | | | | |
| | Long-Term
Debt | | Finance Leases (See Note 10) | | Total |
|
| 2024 | $ | 4,201 | | | $ | 29 | | | $ | 4,230 | |
| 2025 | 50,147 | | | 25 | | | 50,172 | |
| 2026 | 2,657 | | | 27 | | | 2,684 | |
| 2027 | 2,860 | | | 32 | | | 2,892 | |
| 2028 | 3,198 | | | 18 | | | 3,216 | |
| Thereafter | 20,731 | | | — | | | 20,731 | |
| Total maturities of long-term debt | $ | 83,794 | | | $ | 131 | | | $ | 83,925 | |
| Deferred financing costs, net | (1,405) | | | — | | | (1,405) | |
| Total long-term debt | $ | 82,389 | | | $ | 131 | | | $ | 82,520 | |
NOTE 10 - LEASES
Leases as Lessee
Balance sheet information related to right-of-use assets and liabilities is as follows:
| | | | | | | | | | | | | | | | | |
| Balance Sheet Location | | 2023 | | 2022 |
| Operating Leases: | | | | | |
| Operating lease right-of-use assets | Operating lease right-of-use assets | | $ | 28,962 | | | $ | 20,617 | |
| | | | | |
| Current portion of operating lease liabilities | Current portion of operating lease liabilities | | $ | 3,654 | | | $ | 2,774 | |
| Noncurrent portion of operating lease liabilities | Operating lease liabilities | | 25,907 | | | 18,802 | |
| Total operating lease liabilities | | | $ | 29,561 | | | $ | 21,576 | |
| | | | | |
| Finance Leases: | | | | | |
| Finance lease right-of-use assets | Property, plant, and equipment, net | | $ | 138 | | | $ | 751 | |
| | | | | |
| Current portion of finance lease liabilities | Current portion of long-term debt | | $ | 29 | | | $ | 249 | |
| Noncurrent portion of finance lease liabilities | Long-term debt | | 102 | | | 5 | |
| Total financing lease liabilities | | | $ | 131 | | | $ | 254 | |
Lease cost recognized in the consolidated financial statements is summarized as follows:
| | | | | | | | | | | | | | | | | | |
| | | | December 26, 2020 | | December 28, 2019 |
| Operating lease cost | | | | $ | 5,078 | | | $ | 3,528 | |
| | | | | | |
| Finance lease cost: | | | | | | |
| Amortization of lease assets (1) | | | | 3,160 | | | 3,000 | |
| Interest on lease liabilities (1) | | | | 1,702 | | | 1,378 | |
| Total finance lease costs (1) | | | | $ | 4,862 | | | $ | 4,378 | |
(1) Includes leases classified as failed sale-leaseback transactions. | | | | | | | | | | | | | | | | | | |
| | | | 2023 | | 2022 |
| Operating lease cost | | | | $ | 4,115 | | | $ | 4,192 | |
| | | | | | |
| Finance lease cost: | | | | | | |
| Amortization of lease assets | | | | $ | 174 | | | $ | 378 | |
| Interest on lease liabilities | | | | 10 | | | 31 | |
| Total finance lease costs | | | | $ | 184 | | | $ | 409 | |
Other supplemental information related to leases is summarized as follows:
| | | | | | | | | | | | | | |
| | December 26, 2020 | | December 28, 2019 |
| Weighted average remaining lease term (in years): | | | | |
| Operating leases | | 7.73 | | 8.42 |
| Finance leases (1) | | 12.57 | | 12.03 |
| | | | |
| Weighted average discount rate: | | | | |
| Operating leases | | 6.91 | % | | 6.98 | % |
| Finance leases (1) | | 9.42 | % | | 6.72 | % |
| | | | |
| Cash paid for amounts included in the measurement of lease liabilities: | | | | |
| Operating cash flows from operating leases | | 4,874 | | | 3,518 | |
| Operating cash flows from finance leases (1) | | 1,702 | | | 1,378 | |
| Financing cash flows from finance leases (1) | | 4,756 | | | 4,166 | |
(1) Includes leases classified as failed sale-leaseback transactions.
The following table summarizes the Company's undiscounted future minimum lease payments under non-cancellable contractual obligations for operating and financing liabilities as of December 26, 2020:
| | | | | | | | | | | |
| Fiscal Year | | Operating Leases | Finance Leases |
| 2021 | | 4,783 | | 4,259 | |
| 2022 | | 4,198 | | 2,782 | |
| 2023 | | 3,251 | | 3,409 | |
| 2024 | | 2,940 | | 1,045 | |
| 2025 | | 2,969 | | 1,053 | |
| Thereafter | | 11,561 | | 14,988 | |
| Total future minimum lease payments (undiscounted) | | 29,702 | | 27,536 | |
| Less: Present value discount | | (6,975) | | (10,598) | |
| Total lease liability | | 22,727 | | 16,938 | |
On October 22, 2019, the Company sold its Susan Street facility in Santa Ana, California to CenterPoint Properties Trust. The sale price was $37,195. The gain on the sale transaction was $25,121. The transaction was accounted for as a successful sale-leaseback.
Concurrent with the sale of the Susan Street facility, the Company (by a wholly-owned subsidiary) entered into an operating lease to lease back the property for a term of 10 years with two 5 year renewal options. The initial annual rental is $2,083 increasing at 2% per year for the term of the lease. The lease requires the landlord to make certain required capital improvements, at no further rental increase or charge to the Company. The Company is responsible for normal maintenance of the building and facilities. The Company concurrently executed a lease guaranty, pursuant to which it guaranteed the prompt payment when due of all rent payments to be made under the lease agreement.
THE DIXIE GROUP, INC.
NOTES TO CONSOLIDATED FINANCIAL STATEMENTS
(amounts in thousands, except per share data)
(Continued)
Commitments for minimum rentals under non-cancelable leases, including any applicable rent escalation clauses, were as follows under Topic 840 for 2018:
| | | | | | | | | | | |
| | Capital
Leases | | Operating
Leases |
| 2019 | $ | 4,590 | | | $ | 3,002 | |
| 2020 | 4,205 | | | 2,533 | |
| 2021 | 3,333 | | | 2,121 | |
| 2022 | 989 | | | 1,667 | |
| 2023 | 244 | | | 882 | |
| Thereafter | 0 | | | 3,155 | |
| Total commitments | 13,361 | | | 13,360 | |
| Less amounts representing interest | (1,265) | | | 0 | |
| Total | $ | 12,096 | | | $ | 13,360 | |
| | | | | | | | | | | | | | |
| | 2023 | | 2022 |
| Weighted average remaining lease term (in years): | | | | |
| Operating leases | | 7.25 | | 6.63 |
| Finance leases | | 4.51 | | 0.79 |
| | | | |
| Weighted average discount rate: | | | | |
| Operating leases | | 6.81 | % | | 6.40 | % |
| Finance leases | | 6.65 | % | | 6.19 | % |
| | | | |
| Cash paid for amounts included in the measurement of lease liabilities: | | | | |
| Operating cash flows from operating leases | | $ | 4,080 | | | $ | 3,972 | |
| Operating cash flows from finance leases | | 10 | | | 31 | |
| Financing cash flows from finance leases | | 256 | | | 565 | |
RentalThe following table summarizes the Company's undiscounted future minimum lease payments under non-cancellable contractual obligations for operating and financing lease liabilities as of year end:
| | | | | | | | | | | |
| Fiscal Year | | Operating Leases | Finance Leases |
| 2024 | | $ | 5,613 | | $ | 37 | |
| 2025 | | 5,331 | | 31 | |
| 2026 | | 5,124 | | 31 | |
| 2027 | | 5,294 | | 34 | |
| 2028 | | 5,330 | | 19 | |
| Thereafter | | 11,348 | | — | |
| Total future minimum lease payments (undiscounted) | | 38,040 | | 152 | |
| Less: Present value discount | | (8,479) | | (21) | |
| Total lease liability | | $ | 29,561 | | $ | 131 | |
On December 15, 2023, the Company sold its Adairsville, Georgia distribution center. The sales price was $16,250. The gain on the sale transaction was $8,198 and is included in other operating (income) expense, net in the consolidated statements of operations. The transaction was approximately $4,453 during 2018.accounted for as a successful sale and leaseback transaction.
Concurrent with the sale of the Adairsville, Georgia distribution center, the Company entered into an operating lease to lease back the property for a term of 10 years with two 5 year renewal options. The Company concluded it was not reasonably certain to exercise the renewal options and therefore, did not include in the lease liability or right of use asset. The initial annual rent is $1,496 for the first five years increasing to an annual amount of $1,585 for the second five years. The Company is responsible for normal maintenance of the building and facilities.
Leases as Lessor
The Company leases or subleases certain excess space in its facilities to third parties, which are included as fixed assets. The leases are accounted for as operating leases and the lease or sublease income is included in other operating (income) expense, net. The Company recognizes lease income on a straight-line basis as collectability is probable, including any escalation or lease incentives, as applicable, and the Company continues to recognize the underlying asset. The Company has elected the practical expedient to combine all non-lease components as a combined component. The nature of the Company’s sublease agreements do not provide for variable lease payments, options to purchase, or extensions.
THE DIXIE GROUP, INC.
NOTES TO CONSOLIDATED FINANCIAL STATEMENTS
(amounts in thousands, except per share data)
Lease income and sublease income related to fixed lease payments is recognized in other operating (income) expense, net in the in the consolidated statements of operations and is summarized as follows:
| | | | | | | | | | | |
| 2023 | | 2022 |
| Operating lease income | $ | 705 | | | $ | — | |
The following table summarizes the Company's undiscounted lease payments to be received under operating leases including amounts to be paid by the Company to the head lessor for the next five years and thereafter as of 2023:
| | | | | | | | | | | |
| Fiscal Year | Gross Lease Payments | Payments to Head Lessor | Net Lease Payments |
| 2024 | $ | 1,305 | | $ | 251 | | $ | 1,054 | |
| 2025 | $ | 1,253 | | $ | 253 | | $ | 1,000 | |
| 2026 | $ | 1,278 | | $ | 256 | | $ | 1,022 | |
| 2027 | $ | 1,303 | | $ | 259 | | $ | 1,044 | |
| 2028 | $ | 766 | | $ | 163 | | $ | 603 | |
| Thereafter | $ | — | | $ | — | | $ | — | |
| Total | $ | 5,905 | | $ | 1,182 | | $ | 4,723 | |
NOTE 1211 - FAIR VALUE MEASUREMENTS
Fair value is defined as the exchange value of an asset or a liability in an orderly transaction between market participants. The fair value guidance outlines a valuation framework and establishes a fair value hierarchy in order to increase the consistency and comparability of fair value measurements and disclosures. The hierarchy consists of three levels as follows:
Level 1 - Quoted market prices in active markets for identical assets or liabilities as of the reported date;
Level 2 - Other than quoted market prices in active markets for identical assets or liabilities, quoted prices for similar assets and liabilities in active markets, quoted prices for identical or similar assets or liabilities in markets that are not active, and other than quoted prices for assets or liabilities and prices that are derived principally from or corroborated by market data by correlation or other means; and
Level 3 - Measurements using management's best estimate of fair value, where the determination of fair value requires significant management judgment or estimation.
The following table reflects the fair values of assets and liabilities measured and recognized at fair value on a recurring basis on the Company's Consolidated Balance Sheets as of December 26, 2020 and December 28, 2019:
| | | | | | | | | | | | | | | | | |
| | 2020 | | 2019 | | Fair Value Hierarchy Level |
| | | | | |
| | | | | |
| | | | | |
| Liabilities: | | | | | |
| Interest rate swaps (1) | $ | 440 | | | $ | 1,653 | | | Level 2 |
| | | | | |
(1) The Company uses certain external sources in deriving the fair value of the interest rate swaps. The interest rate swaps were valued using observable inputs (e.g., LIBOR yield curves, credit spreads). Valuations of interest rate swaps may fluctuate considerably from period-to-period due to volatility in underlying interest rates, which are driven by market conditions and the duration of the instrument. Credit adjustments could have a significant impact on the valuations due to changes in credit ratings of the Company or its counterparties.
THE DIXIE GROUP, INC.
NOTES TO CONSOLIDATED FINANCIAL STATEMENTS
(amounts in thousands, except per share data)
(Continued)
The carrying amounts and estimated fair values of the Company's financial instruments are summarized as follows:
| | | | 2020 | | 2019 | | 2023 | | 2022 |
| | | Carrying | | Fair | | Carrying | | Fair | | Carrying | | Fair | | Carrying | | Fair |
| | | Amount | | Value | | Amount | | Value | | Amount | | Value | | Amount | | Value |
| Financial assets: | Financial assets: | | | | | | | | Financial assets: | | | |
| Cash and cash equivalents | Cash and cash equivalents | $ | 1,920 | | | $ | 1,920 | | | $ | 769 | | | $ | 769 | |
| | Financial liabilities: | Financial liabilities: | | | | |
| | Financial liabilities: | |
| | Financial liabilities: | |
| Long-term debt, including current portion | |
| Long-term debt, including current portion | |
| Long-term debt, including current portion | Long-term debt, including current portion | 61,219 | | | 58,803 | | | 68,868 | | | 72,115 | |
| Finance leases, including current portion | Finance leases, including current portion | 16,938 | | | 18,451 | | | 19,483 | | | 20,361 | |
| Interest rate swaps | 440 | | | 440 | | | 1,653 | | | 1,653 | |
|
The fair values of the Company's long-term debt and finance leases were estimated using market rates the Company believes would be available for similar types of financial instruments and represent level 2 measurements. The fair values of cash and cash equivalents and notes receivable approximate their carrying amounts due to the short-term nature of the financial instruments.
NOTE 13 - DERIVATIVES
The Company's earnings, cash flows and financial position are exposed to market risks relating to interest rates. It is the Company's policy to minimize its exposure to adverse changes in interest rates and manage interest rate risks inherent in funding the Company with debt. The Company addresses this risk by maintaining a mix of fixed and floating rate debt and entering into interest rate swaps for a portion of its variable rate debt to minimize interest rate volatility.
The following is a summary of the Company's interest rate swaps as of December 26, 2020:
| | | | | | | | | | | | | | | | | |
| Type | Notional Amount | | Effective Date | Fixed Rate | Variable Rate |
| Interest rate swap | $ | 5,796 | | (1) | November 7, 2014 through November 7, 2024 | 4.500% | 1 Month LIBOR |
(1) Interest rate swap notional amount amortizes by $35 monthly to maturity.
The following table summarizes the fair values of derivative instruments included in the Company's Consolidated Balance Sheets:
| | | | | | | | | | | | | | |
| Location on Consolidated Balance Sheets | Fair Value |
| 2020 | | 2019 |
| | | | |
| | | | |
| | | | |
| | | | |
| | | | |
| | | | |
| Liability Derivatives: | | | | |
| Derivatives designated as hedging instruments: | | | | |
| Interest rate swaps, current portion | Accrued Expenses | $ | 135 | | | $ | 841 | |
| Interest rate swaps, long-term portion | Other Long-Term Liabilities | 305 | | | 812 | |
| Total Liability Derivatives | | $ | 440 | | | $ | 1,653 | |
THE DIXIE GROUP, INC.
NOTES TO CONSOLIDATED FINANCIAL STATEMENTS
(amounts in thousands, except per share data)
(Continued)
The following tables summarize the pre-tax impact of derivative instruments on the Company's consolidated financial statements:
| | | | | | | | | | | | | | | | | | | |
| | Amount of Gain or (Loss) Recognized in AOCIL on the effective portion of the Derivative | | |
| | | | | |
| | 2020 | | 2019 | | 2018 | | |
| Derivatives designated as hedging instruments: | | | | | | | |
| Cash flow hedges - interest rate swaps | $ | (1,316) | | | $ | (1,109) | | | $ | 531 | | | |
| | | | | | | |
| | Amount of Gain or (Loss) Reclassified from AOCIL on the effective portion into Income (1)(2) | | |
| | | | | |
| | 2020 | | 2019 | | 2018 | | |
| Derivatives designated as hedging instruments: | | | | | | | |
| Cash flow hedges - interest rate swaps | $ | 1,106 | | | $ | (454) | | | $ | (673) | | | |
| | | | | | | |
| Amount of Gain or (Loss) Recognized on the Dedesignated Portion in Income on Derivative (3) | | |
| 2020 | | 2019 | | 2018 | | |
| Derivatives dedesignated as hedging instruments: | | | | | | | |
| Cash flow hedges - interest rate swaps | $ | 861 | | | $ | 0 | | | $ | 0 | | | |
(1)The amount of gain (loss) reclassified from AOCIL is included in interest expense on the Company's Consolidated Statements of Operations.
(2)The amount of loss expected to be reclassified from AOCIL into earnings during the next 12 months subsequent to fiscal 2020 is $135.
(3)The amount of gain (loss) recognized in income on the dedesignated portion of interest rate swaps is included in other income or other expense on the Company's Consolidated Statements of Operations. The amount of expense recognized on the Company's Consolidated Statements of Operations for the terminated portion of interest rate swaps is included in interest expense.
On October 30, 2020, the Company terminated two interest rate swap agreements tied to its revolving line of credit. The cost to terminate the swap agreements was $1,427. During the fourth quarter of 2020, the Company performed its retrospective and prospective effectiveness assessments of the interest rate swap agreements. Based upon the Company's ability to secure additional fixed asset borrowings, the Company could no longer assert that the cash flows for $25,000 of notional amount of the interest rate swaps are probable. Because it is probable that none of the remaining forecasted interest payments that were being hedged by the second $25,000 interest rate swap will occur, the related losses that had been deferred in AOCIL were immediately reclassified into other (income) expense. However, the losses related to the first $25,000 interest rate swap will be reclassified from AOCIL to interest expense as the hedged interest payments are recognized as the Company could not establish that future cash flows are probable not to occur on the first interest rate swap.
NOTE 1412 - EMPLOYEE BENEFIT PLANS
Defined Contribution Plans
The Company sponsors a 401(k) defined contribution plan that covers a significant portion, or approximately 85%98% of the Company's associates. This plan includes a mandatory Company match on the first 1% of participants' contributions. The Company matches the next 2% of participants' contributions if the Company meets prescribed earnings levels. The plan also provides for additional Company contributions above the 3% level if the Company attains certain additional performance targets. Matching contribution expense for this 401(k) plan was $345$652 in 2020, $4182023 and $254 in 2019 and $448 in 2018.2022.
Additionally, the Company sponsors a 401(k) defined contribution plan that covers those associates at one facility who are under a collective-bargaining agreement, or approximately 15%2% of the Company's associates. Under this plan, the Company generally matches participants' contributions, on a sliding scale, up to a maximum of 2.75% of the participant's earnings. Matching contribution expense for the collective-bargaining 401(k) plan was $96$11 in 2020, $1432023 and $67 in 2019 and $123 in 2018.2022.
THE DIXIE GROUP, INC.
NOTES TO CONSOLIDATED FINANCIAL STATEMENTS
(amounts in thousands, except per share data)
(Continued)
Non-Qualified Retirement Savings Plan
The Company sponsors a non-qualified retirement savings plan that allows eligible associates to defer a specified percentage of their compensation. The obligations for continuing operations owed to participants under this plan were $17,647$14,289 at December 26, 202030, 2023 and $16,203$12,346 at December 28, 201931, 2022 and are included in other long-term liabilities in the Company's Consolidated Balance Sheets. The obligations are unsecured general obligations of the Company and the participants have no right, interest or claim in the assets of the Company, except as unsecured general creditors. The Company utilizes a Rabbi Trust to hold, invest and reinvest deferrals and contributions under the plan. Amounts are invested in Company-owned life insurance in the Rabbi Trust and the cash surrender value of the policies for continuing operations was $17,951$14,836 at December 26, 202030, 2023 and $16,500$12,296 at December 28, 201931, 2022 and is included in other assets in the Company's Consolidated Balance Sheets.
Multi-Employer Pension Plan
The Company contributes to a multi-employer pension plan under the terms of a collective-bargaining agreement that covers its union-represented employees. These union-represented employees represented approximately 15%2% of the Company's total employees. The risks of participating in multi-employer plans are different from single-employer plans. If a participating employer stops contributing to the plan, the unfunded obligations of the plan may be borne by the remaining participating employers. If the Company chooses to stop participating in the multi-employer plan, the Company may be required to pay the plan an amount based on the underfunded status of the plan, referred to as a withdrawal liability.
The Company's participation in the multi-employer pension plan for 20202023 is provided in the table below. The "EIN/Pension Plan Number" column provides the Employee Identification Number (EIN) and the three digit plan number. The most recent Pension Protection Act (PPA) zone status available in 20202023 and 20192022 is for the plan's year-end at 20192022 and 2018,2021, respectively. The zone status is based on information that the Company received from the plan and is certified by the plan's actuary. Among other factors, plans in the red zone are generally less than 65% funded, plans in the yellow zone are less than 80% funded and plans in the green zone are at least 80% funded. The "FIP/RP Status Pending/Implemented" column indicates a plan for which a financial improvement plan (FIP) or a rehabilitation plan (RP) is either pending or has been implemented. The last column lists the expiration date of the collective-bargaining agreement to which the plan is subject.
| | | | | | | | | | | | | | | | | | | | | | | | | | | | | |
| Pension Fund | EIN/Pension Plan Number | Pension Protection Act Zone Status | FIP/RP Status Pending/Implemented (1) | Contributions (2) | Surcharge Imposed (1) | Expiration Date of Collective-Bargaining Agreement |
| 2020 | 2019 | 2020 | 2019 | 2018 |
| The Pension Plan of the National Retirement Fund | 13-6130178 - 001 | Red | Red | Implemented | $ | 272 | | $ | 335 | | $ | 320 | | Yes | 6/4/2022 |
| | | | | | | | | | | | | | | | | | | | | | | | | | | | | |
| Pension Fund | EIN/Pension Plan Number | Pension Protection Act Zone Status | FIP/RP Status Pending/Implemented (1) | Contributions (2) | Surcharge Imposed (1) | Expiration Date of Collective-Bargaining Agreement |
| 2023 | 2022 | 2023 | 2022 | 2021 |
| The Pension Plan of the National Retirement Fund | 13-6130178 - 001 | Red | Red | Implemented | $ | 23 | | $ | 151 | | $ | 280 | | Yes | 6/4/2024 |
(1) The collective-bargaining agreement requires the Company to contribute to the plan at the rate of $0.47 per compensated hour for each covered employee. The Company will make additional contributions, as mandated by law, in accordance with the fund's 2010 Rehabilitation Plan which required a surcharge equal to $0.03 per hour (from $0.47 to $0.50) effective June 1, 2014 to May 31, 2015, a surcharge equal to $0.03 per hour (from $0.50 to $0.53) effective June 1, 2015 to May 31, 2016, a surcharge equal to $0.02 per hour (from $0.53 to $0.55) effective June 1, 2016 to May 31, 2017, a surcharge equal to $0.03 per hour (from $0.55 to $0.58) effective June 1, 2017 to May 31, 2018, a surcharge equal to $0.02 per hour (from $0.58 to $0.60) effective June 1, 2018 to May 31, 2019, a surcharge equal to $0.03 per hour (from $0.60 to $0.63) effective June 1, 2019 to May 31, 2020, and a surcharge equal to $0.03 per hour (from $0.63 to $0.66) effective June 1, 2020 to May 31, 2021.2021, a surcharge equal to $0.03 per hour (from $0.66 to $0.69) effective June 1, 2021 to May 31, 2022, a surcharge equal to $0.03 per hour (from $0.69 to $0.72) effective June 1, 2022 to May 31, 2023 and a surcharge equal to $0.03 per hour (from $0.72 to $0.75) effective June 1, 2023 to May 31, 2024. Based upon current employment and benefit levels, the Company's contributions to the multi-employer pension plan are expected to be approximately $277$28 for 2021.2024.
THE DIXIE GROUP, INC.
NOTES TO CONSOLIDATED FINANCIAL STATEMENTS
(amounts in thousands, except per share data)
(2) The Company's contributions to the plan do not represent more than 5% of the total contributions to the plan for the most recent plan year available.
Postretirement Plans
The Company sponsors a postretirement benefit plan that provides life insurance to a limited number of associates upon retirement as part of a collective bargaining agreement.
Information about the benefit obligation and funded status of the Company's postretirement benefit plan is summarized as follows:
| | | | | | | | | | | |
| | 2023 | | 2022 |
| Change in benefit obligation: | | | |
| Benefit obligation at beginning of year | $ | 379 | | | $ | 396 | |
| Service cost | 5 | | | 8 | |
| Interest cost | 16 | | | 15 | |
| | | |
| Actuarial gain | (75) | | | (39) | |
| Benefits paid | (1) | | | (1) | |
| | | |
| Benefit obligation at end of year | 324 | | | 379 | |
| | | |
| Change in plan assets: | | | |
| Fair value of plan assets at beginning of year | — | | | — | |
| Employer contributions | 1 | | | 1 | |
| | | |
| Benefits paid | (1) | | | (1) | |
| | | |
| Fair value of plan assets at end of year | — | | | — | |
| | | |
| Unfunded amount | $ | (324) | | | $ | (379) | |
The balance sheet classification of the Company's liability for the postretirement benefit plan is included in discontinued operations and is summarized as follows:
| | | | | | | | | | | |
| | 2023 | | 2022 |
| Current liabilities of discontinued operations | $ | 23 | | | $ | 21 | |
| Long-term liabilities of discontinued operations | 301 | | | 358 | |
| Total liability | $ | 324 | | | $ | 379 | |
Benefits expected to be paid on behalf of associates for the postretirement benefit plan during the period 2024 through 2033 are summarized as follows:
| | | | | |
| Years | Postretirement
Plan |
| 2024 | $ | 23 | |
| 2025 | 21 | |
| 2026 | 20 | |
| 2027 | 20 | |
| 2028 | 19 | |
| 2029-33 | 93 | |
Assumptions used to determine the benefit obligation of the Company's postretirement benefit plan are summarized as follows:
| | | | | | | | | | | |
| | 2023 | | 2022 |
| Weighted-average assumptions as of year-end: | | | |
| Discount rate (benefit obligation) | 4.00 | % | | 3.75 | % |
THE DIXIE GROUP, INC.
NOTES TO CONSOLIDATED FINANCIAL STATEMENTS
(amounts in thousands, except per share data)
(Continued)
Information aboutComponents of net periodic benefit cost (credit) for the benefit obligation and funded status ofpostretirement plan are summarized as follows:
| | | | | | | | | | | | | |
| | | |
| | 2023 | | 2022 | | |
| Service cost | $ | 5 | | | $ | 8 | | | |
| Interest cost | 16 | | | 15 | | | |
| | | | | |
| Recognized net actuarial gains | (26) | | | (22) | | | |
| | | | | |
| Net periodic benefit cost (credit) | $ | (5) | | | $ | 1 | | | |
Pre-tax amounts included in accumulated other comprehensive income for the Company's postretirement benefit plan isat 2023 are summarized as follows:
| | | | | | | | | | | |
| | 2020 | | 2019 |
| Change in benefit obligation: | | | |
| Benefit obligation at beginning of year | $ | 360 | | | $ | 331 | |
| Service cost | 8 | | | 7 | |
| Interest cost | 17 | | | 17 | |
| | | |
| Actuarial (gain) loss | 6 | | | 6 | |
| Benefits paid | (1) | | | (1) | |
| | | |
| Benefit obligation at end of year | 390 | | | 360 | |
| | | |
| Change in plan assets: | | | |
| Fair value of plan assets at beginning of year | 0 | | | 0 | |
| Employer contributions | 1 | | | 1 | |
| | | |
| Benefits paid | (1) | | | (1) | |
| | | |
| Fair value of plan assets at end of year | 0 | | | 0 | |
| | | |
| Unfunded amount | $ | (390) | | | $ | (360) | |
| | | | | | | | | | | |
| | Postretirement Benefit Plan |
| | Balance at 2023 | | 2024 Expected Amortization |
| | | |
| Unrecognized actuarial gains | $ | 369 | | | $ | 20 | |
| Totals | $ | 369 | | | $ | 20 | |
NOTE 13 - INCOME TAXES
The balance sheet classificationprovision (benefit) for income taxes on income (loss) from continuing operations consists of the Company's liability for the postretirement benefit plan is summarized as follows:
| | | | | | | | | | | |
| | 2020 | | 2019 |
| Accrued expenses | $ | 17 | | | $ | 16 | |
| Other long-term liabilities | 373 | | | 344 | |
| Total liability | $ | 390 | | | $ | 360 | |
Benefits expected to be paid on behalf of associates for the postretirement benefit plan during the period 2021 through 2030 are summarized as follows:
| | | | | |
| Years | Postretirement
Plan |
| 2021 | $ | 17 | |
| 2022 | 16 | |
| 2023 | 16 | |
| 2024 | 16 | |
| 2025 | 16 | |
| 2026-30 | 79 | |
Assumptions used to determine the benefit obligation of the Company's postretirement benefit plan are summarized as follows:
| | | | | | | | | | | |
| | 2020 | | 2019 |
| Weighted-average assumptions as of year-end: | | | |
| Discount rate (benefit obligation) | 3.25 | % | | 3.50 | % |
| | | | | | | | | | | | | |
| | 2023 | | 2022 | | |
| Current | | | | | |
| Federal | $ | 208 | | | $ | (117) | | | |
| State | 6 | | | 61 | | | |
| Total current | 214 | | | (56) | | | |
| | | | | |
| Deferred | | | | | |
| Federal | — | | | (25) | | | |
| State | — | | | (6) | | | |
| Total deferred | — | | | (31) | | | |
| Income tax provision (benefit) | $ | 214 | | | $ | (87) | | | |
THE DIXIE GROUP, INC.
NOTES TO CONSOLIDATED FINANCIAL STATEMENTS
(amounts in thousands, except per share data)
(Continued)
Components of net periodic benefit cost (credit) for the postretirement plan are summarized as follows:
| | | | | | | | | | | | | | | | | | | |
| | | | | |
| | 2020 | | 2019 | | 2018 | | |
| Service cost | $ | 8 | | | $ | 7 | | | $ | 8 | | | |
| Interest cost | 17 | | | 17 | | | 17 | | | |
| Amortization of prior service credits | 0 | | | (3) | | | (4) | | | |
| Recognized net actuarial gains | (25) | | | (27) | | | (28) | | | |
| | | | | | | |
| Net periodic benefit cost (credit) | $ | 0 | | | $ | (6) | | | $ | (7) | | | |
Pre-tax amounts included in AOCIL for the Company's postretirement benefit plan at 2020 are summarized as follows:
| | | | | | | | | | | |
| | Postretirement Benefit Plan |
| | Balance at 2020 | | 2021 Expected Amortization |
| | | |
| Unrecognized actuarial gains | $ | (309) | | | $ | (24) | |
| Totals | $ | (309) | | | $ | (24) | |
NOTE 15 - INCOME TAXES
The provision (benefit) for income taxes on income (loss) from continuing operations consists of the following:
| | | | | | | | | | | | | | | | | |
| | 2020 | | 2019 | | 2018 |
| Current | | | | | |
| Federal | $ | (78) | | | $ | (287) | | | $ | (178) | |
| State | 109 | | | 107 | | | (116) | |
| Total current | 31 | | | (180) | | | (294) | |
| | | | | |
| Deferred | | | | | |
| Federal | (277) | | | (385) | | | (434) | |
| State | (66) | | | (92) | | | (103) | |
| Total deferred | (343) | | | (477) | | | (537) | |
| Income tax provision (benefit) | $ | (312) | | | $ | (657) | | | $ | (831) | |
Differences between the provision (benefit) for income taxes and the amount computed by applying the statutory federal income tax rate to income (loss) from continuing operations before taxes are summarized as follows:
| | | |
| | | | 2020 | | 2019 | | 2018 |
| Federal statutory rate | Federal statutory rate | 21 | % | | 21 | % | | 21 | % |
| Statutory rate applied to income (loss) from continuing operations before taxes | $ | (1,974) | | | $ | 3,142 | | | $ | (4,685) | |
| Federal statutory rate | |
| Federal statutory rate | |
| Statutory rate applied to loss from continuing operations before taxes | |
| Statutory rate applied to loss from continuing operations before taxes | |
| Statutory rate applied to loss from continuing operations before taxes | |
| Plus state income taxes, net of federal tax effect | |
| Plus state income taxes, net of federal tax effect | |
| Plus state income taxes, net of federal tax effect | Plus state income taxes, net of federal tax effect | 34 | | | 12 | | | (173) | |
| Total statutory provision (benefit) | Total statutory provision (benefit) | (1,940) | | | 3,154 | | | (4,858) | |
| Total statutory provision (benefit) | |
| Total statutory provision (benefit) | |
| Effect of differences: | |
| Effect of differences: | |
| Effect of differences: | Effect of differences: | | | | | |
| Nondeductible meals and entertainment | Nondeductible meals and entertainment | 37 | | | 77 | | | 90 | |
| Nondeductible meals and entertainment | |
| Nondeductible meals and entertainment | |
| Executive compensation limitation | |
| Executive compensation limitation | |
| Executive compensation limitation | Executive compensation limitation | 0 | | | 0 | | | 258 | |
| Federal tax credits | Federal tax credits | (279) | | | (545) | | | (286) | |
| Federal tax credits | |
| Federal tax credits | |
| State tax credits | |
| State tax credits | |
| State tax credits | |
| Reserve for uncertain tax positions | Reserve for uncertain tax positions | 7 | | | 39 | | | 27 | |
| Reserve for uncertain tax positions | |
| Reserve for uncertain tax positions | |
| | Change in valuation allowance | |
| | Change in valuation allowance | |
| | Change in valuation allowance | Change in valuation allowance | 1,754 | | | (3,400) | | | 3,990 | |
| | Stock-based compensation | Stock-based compensation | 141 | | | 86 | | | 82 | |
| | | Stock-based compensation | |
| | Stock-based compensation | |
| | Other items | |
| | Other items | |
| | Other items | Other items | (32) | | | (68) | | | (134) | |
| Income tax provision (benefit) | Income tax provision (benefit) | $ | (312) | | | $ | (657) | | | $ | (831) | |
| Income tax provision (benefit) | |
| Income tax provision (benefit) | |
THE DIXIE GROUP, INC.
NOTES TO CONSOLIDATED FINANCIAL STATEMENTS
(amounts in thousands, except per share data)
(Continued)
During the fourth quarter of 2017, theThe Company recordedhas a full valuation allowance against its deferred tax assets, which remains in effect as of December 26, 2020.assets. The Company intends to maintain this position until there is sufficient evidence to support the reversal of all or some portion of these allowances. The Company also has certain assets with indefinite lives for which the basis is different for book and tax. In accordance with ASC 740-10-30-18, the deferred tax liability related to these intangible assets cannot be used to offset deferred tax assets when determining the amount of the valuation allowance for deferred tax assets which are not more-likely-than-not to be realized. The result is that the Company is in a net deferred tax liability position of $91 at December 26, 202030, 2023 and December 28, 2019, respectively,31, 2022, which is recorded in other long-term liabilities in the Company's Consolidated Balance Sheets.
The income tax benefit for the twelve months ended December 26, 2020 was $312 compared with an income tax benefit of $657 for the twelve months ended December 28, 2019. Due to its full valuation allowance against its deferred tax balances, the Company is only able to recognize refundable credits and a small amount of federal and state taxes and benefits for both the reduction of certain indefinite lived assets not covered by the Company's valuation allowance and the recognition of stranded tax effects within other comprehensive income related to the termination of certain derivative contracts in the tax benefitprovision (benefit) for 2018, 2019,2023 and 2020.
Income tax payments, net of (income tax refunds) received for continuing and discontinued operations were $(100) in 2020, $128 in 2019 and $20 in 2018.2022.
Significant components of the Company's deferred tax assets and liabilities are as follows:
| | | | 2020 | | 2019 | | 2023 | | 2022 |
| Deferred tax assets: | Deferred tax assets: | | | | Deferred tax assets: | | | |
| Inventories | Inventories | $ | 3,428 | | | $ | 3,336 | |
| Retirement benefits | Retirement benefits | 1,190 | | | 1,394 | |
| State net operating losses | State net operating losses | 3,305 | | | 3,362 | |
| Federal net operating losses | Federal net operating losses | 556 | | | 715 | |
| State tax credit carryforwards | State tax credit carryforwards | 1,688 | | | 1,688 | |
| Federal tax credit carryforwards | Federal tax credit carryforwards | 4,413 | | | 4,282 | |
| Allowances for bad debts, claims and discounts | Allowances for bad debts, claims and discounts | 2,024 | | | 1,978 | |
| Other | Other | 5,196 | | | 4,039 | |
| Total deferred tax assets | Total deferred tax assets | 21,800 | | | 20,794 | |
| Valuation allowance | Valuation allowance | (15,443) | | | (13,264) | |
| Net deferred tax assets | Net deferred tax assets | 6,357 | | | 7,530 | |
| | Deferred tax liabilities: | Deferred tax liabilities: | | |
| Deferred tax liabilities: | |
| Deferred tax liabilities: | |
| Property, plant and equipment | |
| Property, plant and equipment | |
| Property, plant and equipment | Property, plant and equipment | 6,448 | | | 7,621 | |
| Total deferred tax liabilities | Total deferred tax liabilities | 6,448 | | | 7,621 | |
| | Net deferred tax liability | Net deferred tax liability | $ | (91) | | | $ | (91) | |
| Net deferred tax liability | |
| Net deferred tax liability | |
THE DIXIE GROUP, INC.
NOTES TO CONSOLIDATED FINANCIAL STATEMENTS
(amounts in thousands, except per share data)
At December 26, 2020, $556 of deferred tax assets related to30, 2023, the Company had approximately $2,646$24,833 of federal net operating loss carryforwards and $3,305 of deferred tax assets related to approximately $61,640$74,018 of state net operating loss carryforwards.carryforwards available from both continuing and discontinued operations. In addition, $4,413$4,579 of federal tax credit carryforwards and $1,688$1,669 of state tax credit carryforwards were available to the Company. The federal tax credit carryforwards will expire between 2029 and 2041.2044. The federal net operating loss carryforwards generated in 2018 have no expiration.expiration date. The state net operating loss carryforwards and the state tax credit carryforwards will expire between 20202023 and 2040.2043. A valuation allowance of $15,443 is recorded to reflect the estimated amount of deferred tax assets attributable to continuing operations that mayare estimated not to be realized duringrealizable based on the carryforward periods.available evidence. At December 26, 2020,30, 2023, the Company is in a net deferred tax liability position of $91 which is included in other long-term liabilities in the Company's Consolidated Balance Sheets.
Beginning in 2022, the Tax Cuts and Jobs Act (the "TCJA") amended Section 174 to eliminate current year deductibility of research and experimentation ("R&E") expenditures and software development costs (collectively, "R&E expenditures") and instead requires taxpayers to charge their R&E expenditures to a capital account amortized over 5 years. For the 2023 and 2022 tax years, the Company capitalized $4,642 and $4,791 of research and development expenses respectively.
Tax Uncertainties
The Company accounts for uncertainty in income tax positions according to FASB guidance relating to uncertain tax positions. Unrecognized tax benefits, were $487 at December 26, 2020, $480 at December 28, 2019, and $441 at December 29, 2018. Such benefits, if recognized, would affect the Company's effective tax rate. There were 0no significant interest or penalties accrued as of December 26, 2020, December 28, 2019,30, 2023 or December 29, 2018.
THE DIXIE GROUP, INC.
NOTES TO CONSOLIDATED FINANCIAL STATEMENTS
(amounts in thousands, except per share data)
(Continued)
31, 2022.
The following is a summary of the change in the Company's unrecognized tax benefits:
| | | |
| | | | 2020 | | 2019 | | 2018 |
| Balance at beginning of year | Balance at beginning of year | $ | 480 | | | $ | 441 | | | $ | 414 | |
| Balance at beginning of year | |
| Balance at beginning of year | |
| | Additions based on tax positions taken during a current period | |
| | Additions based on tax positions taken during a current period | |
| | Additions based on tax positions taken during a current period | Additions based on tax positions taken during a current period | 7 | | | 39 | | | 27 | |
| | Balance at end of year | Balance at end of year | $ | 487 | | | $ | 480 | | | $ | 441 | |
| | Balance at end of year | |
| | Balance at end of year | |
The Company and its subsidiaries are subject to United States federal income taxes, as well as income taxes in a number of state jurisdictions. The tax years subsequent to 20162019 remain open to examination for U.S. federal income taxes. The majority of state jurisdictions remain open for tax years subsequent to 2016.2019. A few state jurisdictions remain open to examination for tax years subsequent to 2015.2018.
NOTE 1614 - COMMON STOCK AND EARNINGS (LOSS) PER SHARE
Common & Preferred Stock
The Company's charter authorizes 80,000,000 shares of Common Stock with a $3 par value per share and 16,000,000 shares of Class B Common Stock with a $3 par value per share. Holders of Class B Common Stock have the right to 20twenty votes per share on matters that are submitted to Shareholders for approval and to dividends in an amount not greater than dividends declared and paid on Common Stock. Class B Common Stock is restricted as to transferability and may be converted into Common Stock on a one share for one share basis. The Company's charter also authorizes 200,000,000 shares of Class C Common Stock, $3 par value per share, and 16,000,000 shares of Preferred Stock. NaNNo shares of Class C Common Stock or Preferred Stock have been issued.
Repurchases of Common Stock
On August 3, 2022, the Company's Board of Directors approved the repurchase of up to $3,000 of the Company's Common Stock. A portion of such purchases was under a plan pursuant to Rule 10b-5-1 of the Securities and Exchange Act ("Plan"). The Company repurchased 605,749 shares under the Plan at a cost of $642 in 2022.
Earnings (Loss) Per Share
The Company's unvested stock awards that contain non-forfeitable rights to dividends or dividend equivalents, whether paid or unpaid, are considered participating securities and are included in the computation of earnings per share. The Company calculates basic and diluted earnings per common share using the two-class method. The accounting guidance requires additional disclosure of EPS for common stock and unvested share-based payment awards, separately disclosing distributed and undistributed earnings. Undistributed earnings represent earnings that were available for distribution but were not distributed. Common stock and unvested share-based payment awards earn dividends equally. All earnings were undistributed in all periods presented.
THE DIXIE GROUP, INC.
NOTES TO CONSOLIDATED FINANCIAL STATEMENTS
(amounts in thousands, except per share data)
(Continued)
The following table sets forth the computation of basic and diluted earnings (loss) per share from continuing operations:
| | | |
| | | | | | 2020 | | 2019 | | 2018 | |
| Basic earnings (loss) per share: | Basic earnings (loss) per share: | | | | | | |
| Income (loss) from continuing operations | $ | (9,088) | | | $ | 15,619 | | | $ | (21,479) | | |
| Basic earnings (loss) per share: | |
| Basic earnings (loss) per share: | |
| Loss from continuing operations | |
| Loss from continuing operations | |
| Loss from continuing operations | |
| Less: Allocation of earnings to participating securities | Less: Allocation of earnings to participating securities | 0 | | | (468) | | | 0 | | |
| Income (loss) from continuing operations available to common shareholders - basic | $ | (9,088) | | | $ | 15,151 | | | $ | (21,479) | | |
| Less: Allocation of earnings to participating securities | |
| Less: Allocation of earnings to participating securities | |
| Loss from continuing operations available to common shareholders - basic | |
| Loss from continuing operations available to common shareholders - basic | |
| Loss from continuing operations available to common shareholders - basic | |
| Basic weighted-average shares outstanding (1) | Basic weighted-average shares outstanding (1) | 15,316 | | | 15,822 | | | 15,764 | | |
| Basic weighted-average shares outstanding (1) | |
| Basic weighted-average shares outstanding (1) | |
| Basic earnings (loss) per share - continuing operations | |
| Basic earnings (loss) per share - continuing operations | |
| Basic earnings (loss) per share - continuing operations | Basic earnings (loss) per share - continuing operations | $ | (0.59) | | | $ | 0.96 | | | $ | (1.36) | | |
| | Diluted earnings (loss) per share: | Diluted earnings (loss) per share: | | |
| Income (loss) from continuing operations available to common shareholders - basic | $ | (9,088) | | | $ | 15,151 | | | $ | (21,479) | | |
| | Diluted earnings (loss) per share: | |
| | Diluted earnings (loss) per share: | |
| Loss from continuing operations available to common shareholders - basic | |
| Loss from continuing operations available to common shareholders - basic | |
| Loss from continuing operations available to common shareholders - basic | |
| Add: Undistributed earnings reallocated to unvested shareholders | Add: Undistributed earnings reallocated to unvested shareholders | 0 | | | 3 | | | 0 | | |
| Income (loss) from continuing operations available to common shareholders - basic | $ | (9,088) | | | $ | 15,154 | | | $ | (21,479) | | |
| Add: Undistributed earnings reallocated to unvested shareholders | |
| Add: Undistributed earnings reallocated to unvested shareholders | |
| Loss from continuing operations available to common shareholders - basic | |
| Loss from continuing operations available to common shareholders - basic | |
| Loss from continuing operations available to common shareholders - basic | |
| Basic weighted-average shares outstanding (1) | |
| Basic weighted-average shares outstanding (1) | |
| Basic weighted-average shares outstanding (1) | Basic weighted-average shares outstanding (1) | 15,316 | | | 15,822 | | | 15,764 | | |
| Effect of dilutive securities: | Effect of dilutive securities: | | | |
| Effect of dilutive securities: | |
| Effect of dilutive securities: | |
| Stock options (2) | |
| Stock options (2) | |
| Stock options (2) | Stock options (2) | 0 | | | 0 | | | 0 | | |
| Directors' stock performance units (2) | Directors' stock performance units (2) | 0 | | | 104 | | | 0 | | |
| Directors' stock performance units (2) | |
| Directors' stock performance units (2) | |
| Diluted weighted-average shares outstanding (1)(2) | |
| Diluted weighted-average shares outstanding (1)(2) | |
| Diluted weighted-average shares outstanding (1)(2) | Diluted weighted-average shares outstanding (1)(2) | 15,316 | | | 15,926 | | | 15,764 | | |
| Diluted earnings (loss) per share - continuing operations | Diluted earnings (loss) per share - continuing operations | $ | (0.59) | | | $ | 0.95 | | | $ | (1.36) | | |
| Diluted earnings (loss) per share - continuing operations | |
| Diluted earnings (loss) per share - continuing operations | |
(1)Includes Common and Class B Common shares, excluding 360, 461,706 and 570944 unvested participating securities, in thousands, for 2020, 2019,2023 and 2018,2022, respectively.
(2)Shares issuable under stock option plans where the exercise price is greater than the average market price of the Company's Common Stock during the relevant period and directors' stock performance units have been excluded to the extent they are anti-dilutive. Aggregate shares, in thousands, excluded were 281549 in 2020, 1662023 and 130 in 2019 and 422 in 2018.2022.
NOTE 1715 - STOCK PLANS AND STOCK COMPENSATION EXPENSE
The Company recognizes compensation expense relating to share-based payments based on the fair value of the equity instrument issued and records such expense in selling and administrative expenses in the Company's Consolidated Statements of Operations. The number of shares to be issued is determined by dividing the specified dollar value of the award by the market value per share on the grant date. The Company's stock compensation expense (credit) was $431$687 in 2020, $4832023 and $766 in 20192022.
Omnibus Equity Incentive Plan
On May 4, 2022, the Company's shareholders' approved and $(29) in 2018. The credit in 2018 is relatedadopted the Company's Omnibus Equity Incentive Plan (the "Omnibus Equity Incentive Plan" or the "2022 Plan") which provides for the issuance of a maximum of 1,300,000 shares of Common Stock and/or Class B Common Stock for the grant of options, and/or other stock-based or stock-denominated awards to employees, officers, directors and agents of the reversal of stock compensation that did not vest.Company and its participating subsidiaries.
2016 Incentive Compensation Plan
On May 3, 2016, the Company's shareholders' approved and adopted the Company's 2016 Incentive Compensation Plan (the "2016 Incentive Compensation Plan") which providesprovided for the issuance of a maximum of 800,000 shares of Common Stock and/or Class B Common Stock for the grant of options, and/or other stock-based or stock-denominated awards to employees, officers, directors, and agents of the Company and its participating subsidiaries. The 2016 Incentive Compensation Plan and the allocation of shares thereunder superseded and replaced The Dixie Group, Inc. Stock Awards Plan, as amended (the "2006 Plan") and the allocation of shares thereunder. The 2006 Plan was terminated with respect to new awards. Awards previously granted under the 2006 Plan continue to be governed by the terms of that plan and are not affected by its termination. On May 6, 2020, the board approved an amendment of the Company's 2016 Incentive Compensation Plan to increase the original number of shares by an additional 500,000.
2006 Stock Awards There are 149,908 shares remaining under the 2016 Incentive Plan
The Company had a Stock Awards Plan, ("2006 Plan"), as amended, which provided for the issuance due to forfeiture or cancellation of up to 1,800,000 shares of Common Stock and/or Class B Common Stock as stock-based or stock-denominatedunvested awards to directors of the Company and to salaried employees of the Company and its participating subsidiaries.outstanding under that plan.
THE DIXIE GROUP, INC.
NOTES TO CONSOLIDATED FINANCIAL STATEMENTS
(amounts in thousands, except per share data)
(Continued)
Restricted Stock Awards
EachPursuant to the Company's Omnibus Equity Incentive Plan, the Company's practice has been to adopt an annual incentive plan which provides for the grant of restricted stock awards denominated as Long-Term Incentive Stock Awards and Career Share awards. Under the plan adopted for 2023, each executive officer has the opportunity to earn a Primary Long-Term Incentive Award of restricted stock and separately receive an award of restricted stock denominated as “Career Shares.” The number of shares issued, if any, is based on the market price of the Company’s Common Stock at the time of grant of the award, subject to a $5.00 per share minimum value. Primary Long-Term Incentive Awards vest over three years. For participants over age 60, Career Shares awards fully vest when the participant becomes (i) qualified to retire from the Company and (ii) has retained such shares two years following the grant date. For the participants under age 60, Career Shares vest ratably over five years beginning on the participant's 61st birthday.
On March 12, 2020, the Company issued 131,867 shares of restricted stock to officers and other key employees. The grant-date fair value of the awards was $132, or $1.00 per share, and is expected to be recognized as stock compensation expense over a weighted-average period of 8.4 years from the date the awards were granted. Each award is subject to a continued service condition. The fair value of each share of restricted stock awarded was equal to the market value of a share of the Company's Common Stock on the grant date.
On March 12, 2018, the Company granted 297,292 shares of restricted stock to certain key employees. The grant-date fair value of the awards was $832, or $2.80 per share, and will be recognized as stock compensation expense over a weighted-average period of 6.1 years from the date the awards were granted. Each award is subject to a continued service condition. The fair value of each share of restricted stock awarded was equal to the market value of a share of the Company's Common Stock on the grant date.
On July 30, 2018, the Company granted 10,000 shares of restricted stock to an employee. The grant-date fair value of the award was $20, or $2.00 per share and will be recognized as stock compensation over a three-year vesting period from the date the award was granted. The award is subject to a continued service condition. The fair value of each share of restricted stock awarded was equal to the market value of a share of the Company's Common Stock on the grant date.
Restricted stock activity for the threetwo years ended December 26, 2020 isare summarized as follows:
| | | | Number of Shares | | Weighted-Average Grant-Date Fair Value | | Number of Shares | | Weighted-Average Grant-Date Fair Value |
| Outstanding at December 30, 2017 | 433,841 | | | $ | 6.66 | |
| | Outstanding at December 25, 2021 | |
| | Outstanding at December 25, 2021 | |
| | Outstanding at December 25, 2021 | |
| Granted | Granted | 307,292 | | | 2.77 | |
| Vested | Vested | (64,939) | | | 6.58 | |
| Forfeited | Forfeited | (106,196) | | | 9.51 | |
| Outstanding at December 29, 2018 | 569,998 | | | 4.04 | |
| | Outstanding at December 31, 2022 | |
| Granted | |
| Vested | Vested | (90,791) | | | 2.83 | |
| Forfeited | Forfeited | (17,784) | | | 3.48 | |
| Outstanding at December 28, 2019 | 461,423 | | | 4.30 | |
| Granted | 131,867 | | | 1.00 | |
| Vested | (233,639) | | | 3.90 | |
| Outstanding at December 26, 2020 | 359,651 | | | $ | 3.35 | |
| Outstanding at December 30, 2023 | |
As of December 26, 2020,30, 2023, unrecognized compensation cost related to unvested restricted stock was $705.$1,079. That cost is expected to be recognized over a weighted-average period of 10.36.9 years. The total fair value of shares vested was approximately $241, $94$197 and $173$399 during 2020, 20192023 and 2018,2022, respectively.
Stock Performance Units
ThePrior to 2021, the Company's non-employee directors receivereceived an annual retainer of $18 in cash and $18 in value of Stock Performance Units (subject to a $5.00 minimum per unit). If market value at the date of the grants iswas above $5.00 per share; there iswas no reduction in the number of units issued. However, if the market value at the date of the grants iswas below $5.00, units willwould be reduced to reflect the $5.00 per share minimum. Upon retirement, the Company issueswill issue the number of shares of Common Stock equivalent to the number of Stock Performance Units held by non-employee directors at that time. As of December 26, 2020,30, 2023, there were 130,320 Stock Performance Units were outstanding under this plan. As of December 26, 2020,30, 2023, there was no unrecognized compensation cost related to Stock Performance Units was $5. That cost is expected to be recognized over a weighted-average period of 0.3 years.Units.
THE DIXIE GROUP, INC.
NOTES TO CONSOLIDATED FINANCIAL STATEMENTS
(amounts in thousands, except per share data)
(Continued)
Stock Options
Options granted under the Company's 2006 Plan and the 2016Omnibus Equity Incentive Plan were exercisable for periods determined at the time the awards are granted. Effective 2009, the Company established a $5.00 minimum price for calculating the number of options to be granted.
On May 30, 2017,25, 2023, the Company granted 203,000444,000 options with a market condition to certain key employees of the Company at a weighted-average exercise price of $4.30.$1.00. The grant-date fair value of these options was $306.$186. These options vest over a two-yeartwo-year period and require the Company's stock to trade at or above $7.00$3.00 for 5five consecutive trading days afterduring the two-year period and within five yearsterm of issuancethe option to meet the market condition.
The fair value of each option was estimated on the date of grant using a lattice model. Expected volatility was based on historical volatility of the Company's stock, using the most recent period equal to the expected life of the options. The risk-free interest rate was based on the U.S. Treasury yield for a term equal to the expected life of the option at the time of grant. The Company usesused historical exercise behavior data of similar employee groups to determine the expected lives of options.
THE DIXIE GROUP, INC.
NOTES TO CONSOLIDATED FINANCIAL STATEMENTS
(amounts in thousands, except per share data)
The following weighted-average assumptions were used to estimate the fair value of stock options were granted during the years ended December 26, 2020, December 28, 2019,2023 and December 29, 2018.2022.
| | | | | | | | | | | |
| 2023 | | 2022 |
| Risk-free interest rate | 3.80 | % | | — | % |
| Expected volatility | 97.96 | % | | — | % |
| Expected dividends | — | % | | — | % |
| Expected life of options | 5 years | | 0 years |
Option activity for the threetwo years ended December 26, 2020 is summarized as follows:
| | | | | | | | | | | | | | | | | | | | | | | |
| | Number of Shares | | Weighted-Average Exercise Price | | Weighted-Average Remaining Contractual Life (in years) | Weighted-Average Fair Value of Options Granted During the Year |
| Outstanding at December 30, 2017 | 306,500 | | | $ | 4.54 | | | | | — | |
| Granted | 0 | | | 0 | | | | | 0 | |
| Exercised | 0 | | | 0 | | | | | — | |
| Forfeited | (8,000) | | | 4.17 | | | | | — | |
| Outstanding at December 29, 2018 | 298,500 | | | 4.55 | | | | | — | |
| Granted | 0 | | | 0 | | | | | 0 | |
| Exercised | 0 | | | 0 | | | | | — | |
| Forfeited | (132,500) | | | 4.82 | | | | | — | |
| Outstanding at December 28, 2019 | 166,000 | | | 4.33 | | | 0 | | — | |
| Granted | 0 | | | 0 | | | | | — | |
| Exercised | 0 | | | 0 | | | | | — | |
| Forfeited | (15,000) | | | 4.17 | | | | | — | |
| Outstanding at December 26, 2020 | 151,000 | | | $ | 4.35 | | | 1.40 | | $ | — | |
| | | | | | | |
| Options exercisable at: | | | | | | | |
| December 29, 2018 | 103,500 | | | $ | 5.00 | | | | | — | |
| December 28, 2019 | 166,000 | | | 4.33 | | | | | — | |
| December 26, 2020 | 151,000 | | | 4.35 | | | 1.40 | | — | |
| | | | | | | | | | | | | | | | | | | | | | | |
| | Number of Shares | | Weighted-Average Exercise Price | | Weighted-Average Remaining Contractual Life (in years) | Weighted-Average Fair Value of Options Granted During the Year |
| | | | | | | |
| | | | | | | |
| | | | | | | |
| | | | | | | |
| Outstanding at December 25, 2021 | 141,000 | | | $ | 4.36 | | | 0.40 | | $ | — | |
| | | | | | | |
| | | | | | | |
| Expired | (141,000) | | | 4.36 | | | — | | | — | |
| Outstanding at December 31, 2022 | — | | | — | | | 0.00 | | — | |
| Granted | 444,000 | | | 1.00 | | | — | | | 0.42 | |
| | | | | | | |
| Forfeited | (25,000) | | | 1.00 | | | — | | | — | |
| | | | | | | |
| Outstanding at December 30, 2023 | 419,000 | | | $ | 1.00 | | | 4.40 | | $ | — | |
| | | | | | | |
| | | | | | | |
| Options exercisable at December 30, 2023 | — | | | $ | — | | | — | | | $ | — | |
At December 26, 2020,30, 2023, there was 0no intrinsic value of outstanding stock options and 0no intrinsic value of exercisable stock options. The intrinsic value of stock options exercised during 2020, 2019 and 2018 was $0, $0 and $0, respectively. At December 26, 2020,30, 2023, there was 0$123 unrecognized compensation expense related to unvested stock options.options and is expected to be recognized over a weighted-average period of 1.4 years.
NOTE 16 - ACCUMULATED OTHER COMPREHENSIVE INCOME
Components of accumulated other comprehensive income, net of tax, are as follows:
| | | | | | | | | | | | | | | | | |
| Interest Rate Swaps | | Post-Retirement Liabilities | | Total |
| Balance at December 25, 2021 | $ | (172) | | | $ | 202 | | | $ | 30 | |
| Unrealized gain on interest rate swaps, net of tax of $0 | — | | | — | | | — | |
| Reclassification of loss into earnings from interest rate swaps, net of tax of $(2) | (5) | | | — | | | (5) | |
| Reclassification of unrealized loss into earnings from dedesignated interest rate swaps, net of tax of $33 | 177 | | | — | | | 177 | |
| Unrecognized net actuarial gain on postretirement benefit plans, net of tax of $0 | — | | | 39 | | | 39 | |
| Reclassification of net actuarial gain into earnings from postretirement benefit plans, net of tax of $0 | — | | | (22) | | | (22) | |
| Balance at December 31, 2022 | $ | — | | | $ | 219 | | | $ | 219 | |
| | | | | |
| | | | | |
| | | | | |
| Unrecognized net actuarial gain on postretirement benefit plans, net of tax of $0 | — | | | 75 | | | 75 | |
| Reclassification of net actuarial gain into earnings from postretirement benefit plans, net of tax of $0 | — | | | (26) | | | (26) | |
| Balance at December 30, 2023 | $ | — | | | $ | 268 | | | $ | 268 | |
THE DIXIE GROUP, INC.
NOTES TO CONSOLIDATED FINANCIAL STATEMENTS
(amounts in thousands, except per share data)
(Continued)
NOTE 18 - ACCUMULATED OTHER COMPREHENSIVE INCOME (LOSS)
Components of accumulated other comprehensive income (loss), net of tax, are as follows:
| | | | | | | | | | | | | | | | | |
| Interest Rate Swaps | | Post-Retirement Liabilities | | Total |
| Balance at December 30, 2017 | (1,587) | | | 288 | | | (1,299) | |
| Unrealized gain on interest rate swaps, net of tax of $0 | 531 | | | — | | | 531 | |
| Reclassification of loss into earnings from interest rate swaps, net of tax of $0 | 673 | | | — | | | 673 | |
| Unrecognized net actuarial gain on postretirement benefit plans, net of tax of $0 | — | | | 18 | | | 18 | |
| Reclassification of net actuarial gain into earnings from postretirement benefit plans, net of tax of $0 | — | | | (27) | | | (27) | |
| Reclassification of prior service credits into earnings from postretirement benefit plans, net of tax of $0 | — | | | (4) | | | (4) | |
| Balance at December 29, 2018 | (383) | | | 275 | | | (108) | |
| Unrealized gain on interest rate swaps, net of tax of $0 | (1,109) | | | — | | | (1,109) | |
| Reclassification of loss into earnings from interest rate swaps, net of tax of $10 | 444 | | | — | | | 444 | |
| Unrecognized net actuarial gain on postretirement benefit plans, net of tax of $0 | — | | | (6) | | | (6) | |
| Reclassification of net actuarial gain into earnings from postretirement benefit plans, net of tax of $0 | — | | | (27) | | | (27) | |
| Reclassification of prior service credits into earnings from postretirement benefit plans, net of tax of $0 | — | | | (2) | | | (2) | |
| Balance at December 28, 2019 | $ | (1,048) | | | $ | 240 | | | $ | (808) | |
| Unrealized gain on interest rate swaps, net of tax of $0 | (1,316) | | | — | | | (1,316) | |
| Reclassification of loss into earnings from interest rate swaps, net of tax of $343 | 1,624 | | | — | | | 1,624 | |
| | | | | |
| Reclassification of net actuarial gain into earnings from postretirement benefit plans, net of tax of $0 | — | | | (27) | | | (27) | |
| Reclassification of prior service credits into earnings from postretirement benefit plans, net of tax of $0 | — | | | (3) | | | (3) | |
| Balance at December 26, 2020 | $ | (740) | | | $ | 210 | | | $ | (530) | |
NOTE 1917 - COMMITMENTS AND CONTINGENCIES
Commitments
The Company had purchase commitments of $555$1,178 at December 26, 2020,30, 2023, primarily related to machinery and equipment. The Company entersentered into fixed-price contracts with suppliers to purchase natural gas to support certain manufacturing processes. The Company had contract purchases of $72processes in 2020, $431 in 2019 and $428 in 2018.prior years. At December 26, 2020,30, 2023, the Company has 0no commitments to purchase natural gas for 2021.2023.
Contingencies
The Company assesses its exposure related to legal matters, including those pertaining to product liability, safety and health matters and other items that arise in the regular course of its business. If the Company determines that it is probable a loss has been incurred, the amount of the loss, or an amount within the range of loss, that can be reasonably estimated will be recorded. The Company does not accrue for legal costs relating to loss contingencies. The Company has not identified any legal matters that could have a material adverse effect on its consolidated results of operations, financial position or cash flows.
Environmental Remediation
The Company accrues for losses associated with environmental remediation obligations when such losses are probable and estimable. Remediation obligations are accrued based on the latest available information and are recorded at undiscounted amounts. The Company regularly monitors the progress of environmental remediation. If studies indicate that the cost of remediation has changed from the previous estimate, an adjustment to the liability would be recorded in the period in which such determination is made. (See Note 22)20).
Legal Proceedings
The Company has been sued together with 15 other defendants in a civil action filed January 22, 2024, in the Superior Court of Gordon County Georgia. The case is styled: Moss Land Company, LLC and Revocable Living Trust of William Darryl Edwards, by and through William Darryl Edwards, Trustee vs. City of Calhoun et al. Civil Action Number 24CV73929. The plaintiffs are two landowners located in Gordon County Georgia. The relief sought is compensation for alleged damages to the plaintiffs’ real property, an injunction from alleged further damage to their property and abatement of alleged nuisance related to the presence of PFAS and related chemicals on their property. The Plaintiffs allege that such chemicals have been deposited on their property by the City of Calhoun as a byproduct of treating water containing such chemicals used by manufacturing operations in and around Calhoun Georgia. The defendants include the City of Calhoun Georgia, several other carpet manufacturers, and certain manufacturers and sellers of chemicals containing PFAS. No specific amount of damages has been demanded. The Company has not yet answered the complaint but anticipates denying liability and vigorously defending the matter.
On March 1, 2024, the City of Calhoun Georgia served an answer and crossclaim for Damages and injunctive relief in the pending matter styled: In re: Moss Land Company, LLC and Revocable living Trust of William Darryl Edwards by and through William Darryl Edwards, Trustee v. The Dixie Group, Inc. In the Superior Court of Gordon County Georgia. case Number: 24CV73929. In its Answer and Crossclaim defendant Calhoun sues The Dixie Group, Inc. and other named carpet manufacturing defendants for unspecified monetary damages and other injunctive relief based on injury claimed to have resulted from defendant’s use and disposal of chemical wastewater containing PFAS chemicals. Dixie Group has advised us that it intends to deny liability and to defend the matter vigorously.
NOTE 18 - OTHER (INCOME) EXPENSE, NET
Other operating (income) expense, net is summarized as follows:
| | | | | | | | | | | |
| | 2023 | | 2022 |
| Other operating (income) expense, net: | | | |
| Lease income | $ | (705) | | | $ | — | |
| Insurance proceeds | (616) | | | (394) | |
| Loss on property, plant and equipment disposals | 2 | | | 267 | |
| Gain on sale of building | (8,198) | | | — | |
| Loss on currency exchanges | 36 | | | 148 | |
| | | |
| Retirement expenses | 195 | | | 483 | |
| Miscellaneous (income) expense | 114 | | | (265) | |
| Other operating (income) expense, net | $ | (9,172) | | | $ | 239 | |
THE DIXIE GROUP, INC.
NOTES TO CONSOLIDATED FINANCIAL STATEMENTS
(amounts in thousands, except per share data)
(Continued)
Legal Proceedings
The Company has been sued, together with 3M Company and approximately 30 other named defendants and unnamed "fictitious defendants" including various carpet manufacturers and suppliers, in four lawsuits whereby the plaintiffs seek monetary damages and injunctive relief related to the manufacture, supply, and/or use of certain chemical products in the manufacture, finishing, and treatment of carpet products in the Dalton, Georgia area. These chemical products allegedly include without limitation perflourinated compounds ("PFC") such as perflourinated acid ("PFOA") and perfluorooctane sulfonate ("PFOS"). In each lawsuit, the plaintiff(s) alleges that, as a consequence of these actions, these chemical compounds have discharged or leached into the water systems around Dalton and then flow into the waters in or near the water bodies from which the plaintiff(s) draw for drinking water.
Two of these lawsuits wereThe 2023 insurance proceeds includes reimbursement for claims filed for building flood in Alabama.2023 and cyber event from 2021. The first lawsuit in Alabama was filed on September 22, 2016 by The Water Works and Sewer Board of the City of Gadsden (Alabama) in the Circuit Court of Etowah County, Alabama (styled The Water Works and Sewer Board of the City of Gadsden v. 3M Company, et al., Civil Action No. 31-CV-2016-900676.00). The second lawsuit in Alabama was filed on May 15, 2017 by The Water Works and Sewer Board of the Town of Centre (Alabama) in the Circuit Court of Cherokee County, Alabama (styled The Water Works and Sewer Board of the Town of Centre v. 3M Company, et al., Civil Action No. 13-CV- 2017-900049.00). In each of these Alabama lawsuits, the plaintiff seeks damages that include but are not limited to the expenses associated with the future installation and operation of a filtration system capable of removing from the water the chemicals that are allegedly present as a result of the manufacturing and treatment process described above. Each plaintiff requests a jury trial, does not specify2022 insurance proceeds includes an amount of damages other than an assertion that its damages exceed $10, and requests injunctive relief. The Company has answered the complaint in each of these lawsuits, intends to defend those matters vigorously, and is unable to estimate its potential exposure to loss, if any,additional insurance reimbursement for these lawsuits at this time.
The other two lawsuits were filed in Georgia. The first lawsuit in Georgia was filed on November 19, 2019 by the City of Rome (Georgia) in the Superior Court of Floyd County, Georgia (styled The City of Rome, Georgia v. 3M Company, et al., No. 19CV02405JFL003). The plaintiff in that case also seeks damages that include without limitation the expenses associated with the future installation and operation of a filtration system capable of removing from the water the chemicals that are allegedly present as a result of the manufacturing and treatment process described above. The plaintiff requests a jury trial and also seeks injunctive relief. While the amount of damages is unspecified, the plaintiff asserts it has spent "tens of millions" to remove the chemicals from the county's water supply and will incur additional costs related to removing such chemicals in the future. The Company has answered the complaint, intends to defend the matter vigorously, and is unable to estimate its potential exposure to loss, if any, at this time.
The second lawsuit in Georgia was originally filed on November 26, 2019 and is presented as a class action lawsuit by and on behalf of a class of persons who obtain drinking water from the City of Rome, Georgia and the Floyd County Water Department (and similarly situated persons) (generally, for these purposes, residents of Floyd County) (styled Jarrod Johnson v. 3M Company, et al., Civil Action No. 19-CV-02448-JFL-003) (the "Class Action Lawsuit"). On January 10, 2020, the Class Action Lawsuit was removed to the United States District Court$394 for the Northern Districtreplacement of Georgia, Rome Division (styled Jarrod Johnson v. 3M Company, et al Civil Action No. 4:20-CV-0008-AT). The plaintiffs in this case allege their damages include without limitation the surcharges incurred for the costs of partially filtering the chemicals from their drinking water. The Complaint requests a jury trialassets and asserts damages unspecified in amount, in addition to requests for injunctive relief. The Company has filed a response to the Complaint, intends to defend the matter vigorously, and is unable to estimate its potential exposure, if any, at this time.
THE DIXIE GROUP, INC.
NOTES TO CONSOLIDATED FINANCIAL STATEMENTS
(amounts in thousands, except per share data)
(Continued)
NOTE 20 - OTHER (INCOME) EXPENSE, NET
Other operating expense, net is summarized as follows:
| | | | | | | | | | | | | | | | | | | |
| | | | | |
| | 2020 | | 2019 | | 2018 | | |
| Other operating (income) expense, net: | | | | | | | |
| | | | | | | |
| (Gain) loss on property, plant and equipment disposals | $ | 41 | | | $ | 353 | | | $ | (1,047) | | | |
| Gain on sale of building | 0 | | | (25,121) | | | 0 | | | |
| (Gain) loss on currency exchanges | (55) | | | 41 | | | 126 | | | |
| Amortization of intangibles | 0 | | | 0 | | | 305 | | | |
| Retirement expenses | 40 | | | 72 | | | 64 | | | |
| Miscellaneous (income) expense | (134) | | | 667 | | | 1,010 | | | |
| Other operating (income) expense, net | $ | (108) | | | $ | (23,988) | | | $ | 458 | | | |
Other (income) expense, net is summarized as follows:
| | | | | | | | | | | | | | | | | | | |
| | | | | |
| | 2020 | | 2019 | | 2018 | | |
| Other (income) expense, net: | | | | | | | |
| | | | | | | |
| | | | | | | |
| Interest Income | $ | (3) | | | $ | (49) | | | $ | 0 | | | |
| Post-retirement income | (8) | | | (14) | | | (15) | | | |
| Miscellaneous expense | 689 | | | 6 | | | 18 | | | |
| Other (income) expense, net | $ | 678 | | | $ | (57) | | | $ | 3 | | | |
| | | | | | | | | | | |
| 2023 | | 2022 |
| Other (income) expense, net: | | | |
| Gain on extinguishment of debt, net | $ | (419) | | | $ | — | |
| Miscellaneous (income) expense | (12) | | | 6 | |
| Other (income) expense, net | $ | (431) | | | $ | 6 | |
NOTE 2119 - FACILITY CONSOLIDATION AND SEVERANCE EXPENSES, NET
2015 Corporate Office2022 Consolidation of East Coast Manufacturing Plan
In April 2015, the Company's Board of Directors approved the Corporate Office Consolidation Plan, to cover the costs of consolidating three of the Company's existing leased divisional and corporate offices to a single leased facility located in Dalton, Georgia. The Company paid a fee to terminate one of the leased facilities, did not renew a second facility and vacated the third facility. Related to the vacated facility,During 2022, the Company recorded the estimated costs relatedimplemented a plan to the fulfillment ofconsolidate its contractual lease obligation and on-going facility maintenance, net of an estimate of sub-lease expectations. Accordingly, if the estimates differ, the Company would record an additional charge or benefit, as appropriate. Costs relatedEast Coast manufacturing in order to the consolidation included the lease termination fee, contractual lease obligations and movingreduce its manufacturing costs. The plan is now substantially complete.
2017 Profit Improvement Plan
During the fourth quarter of 2017, the Company announced a Profit Improvement Plan to improve profitability through lower cost and streamlined decision making and aligning processes to maximize efficiency. The plan included consolidating the management of the Company's two commercial brands, Atlas Carpet Mills and Masland Contract, under one management team, sharing operations in sales, marketing, product development and manufacturing. Specific toUnder this plan, the Company has focused nearly all commercial solution dyed make-to-order productionwill consolidate its East Coast tufting operations into one plant in North Georgia and relocate the distribution of luxury vinyl flooring from its Saraland, Alabama facility to its Atmore, Alabama operations wherefacility. Costs for the Company has developed such make-to-order capabilities overplan will include machinery and equipment relocation, inventory relocation, staff reductions and unabsorbed fixed costs during conversion of the last 5 years. Further, the Company aligned its west coast production facilities, better utilizing its west coast real estate by moving production to its Santa Ana, California and Atmore Alabama operations to more efficiently distribute its west coast products. Furthermore, the Company re-configured its east coast distribution facilities to provide more efficient distribution of its products. In addition, the Company realized reductions in related support functions such as accounting and information services. The plan is now substantially complete.facility.
2020 COVID-19 Continuity Plan
As the extent of the COVID-19 pandemic became apparent, the Company implemented a continuity plan to maintain the health and safety of associates, preserve cash, and minimize the impact on customers. The response has included restrictions on travel, implementation of telecommuting where appropriate and limiting contact and maintaining social distancing between associates and with customers. In line with demand, running schedules have been reduced for most facilities to one shift while simultaneously reducing inventories to align them with the lower customer demand. Cost reductions have been implemented including cutting non-essential expenditures, reducing capital expenditures, rotating layoffs and furloughs, selected job eliminations and temporary salary reductions. The Company has also deferred new product introductions and reduced sample and marketing expenses for 2020. Initiatives were taken with suppliers, lenders and landlords to extend payment terms in the
THE DIXIE GROUP, INC.
NOTES TO CONSOLIDATED FINANCIAL STATEMENTS
(amounts in thousands, except per share data)
(Continued)
second quarter for existing agreements. The Company is taking advantage of payment deferrals and credits related to payroll taxes under the Coronavirus Aid, Relief, and Economic Security ("CARES") Act as well as deferring payments into its defined contribution retirement plan. The CARES Act also provides for an employee retention credit, which is a refundable tax credit against certain employment taxes of up to $5 per employee for eligible employers. The tax credit is equal to 50% of qualified wages paid to employees, capped at $10 of qualified wages per employee throughout the year. The Company qualified for the tax credit in the second, third and fourth quarters of 2020 and recognized $2,100 in the fourth quarter of 2020, related to the Employee Retention Credit. Of the $2,100 credit, $1,500 million was recorded to Cost of Sales and the remaining $600 was recorded to Selling and Administrative Expenses.
Costs related to the facility consolidation plans are summarized as follows:
| | | | | | | | | | | | | | | | | | | | | | | | | | | | | | | | | | | |
| | | | | | | | | As of December 26, 2020 |
| Accrued Balance at December 28, 2019 | | 2020 Expenses (1) | | 2020 Cash Payments | | Accrued Balance at December 26, 2020 | | Total Costs Incurred to Date | | Total Expected Costs |
| Corporate Office Consolidation Plan | 38 | | | 6 | | | 44 | | | 0 | | | 835 | | | 835 | |
| Profit Improvement Plan | 305 | | | 1,376 | | | 1,577 | | | 104 | | | 10,176 | | | 10,176 | |
| COVID-19 Continuity Plan | 0 | | $ | 2,370 | | | $ | 1,916 | | | 454 | | | $ | 2,531 | | | $ | 2,531 | |
| Total All Plans | $ | 343 | | | $ | 3,752 | | | $ | 3,537 | | | $ | 558 | | | $ | 13,542 | | | $ | 13,542 | |
| | | | | | | | | | | |
| Asset Impairments | $ | 0 | | | $ | 0 | | | $ | 0 | | | $ | 0 | | | $ | 3,323 | | | $ | 3,323 | |
| | | | | | | | | | | |
| Accrued Balance at December 29, 2018 | | 2019 Expenses (1) | | 2019 Cash Payments | | Accrued Balance at December 28, 2019 | | | | |
| Corporate Office Consolidation Plan | 98 | | | 13 | | | 73 | | | 38 | | | | | |
| Profit Improvement Plan | $ | 846 | | | $ | 5,006 | | | $ | 5,547 | | | $ | 305 | | | | | |
| Total All Plans | $ | 944 | | | $ | 5,019 | | | $ | 5,620 | | | $ | 343 | | | | | |
| | | | | | | | | | | |
| Asset Impairments | $ | 0 | | | $ | 3 | | | $ | 0 | | | $ | 0 | | | | | |
| | | | | | | | | | | | | | | | | | | | | | | | | | | | | | | | | | | |
| | | | | | | | | As of December 30, 2023 |
| Accrued Balance at December 31, 2022 | | 2023 Expenses (1) | | 2023 Cash Payments | | Accrued Balance at December 30, 2023 | | Total Costs Incurred to Date | | Total Expected Costs |
| Consolidation of East Coast Manufacturing Plan | $ | 1,011 | | | $ | 2,886 | | | $ | 3,861 | | | $ | 36 | | | $ | 7,715 | | | $ | 8,641 | |
| | | | | | | | | | | |
| Asset Impairments/Non-cash items | $ | — | | | $ | 981 | | | $ | — | | | $ | — | | | $ | 1,717 | | | $ | 1,717 | |
| | | | | | | | | | | |
| Accrued Balance at December 25, 2021 | | 2022 Expenses (1) | | 2022 Cash Payments | | Accrued Balance at December 31, 2022 | | | | |
| Consolidation of East Coast Manufacturing Plan | $ | — | | | $ | 3,848 | | | $ | 2,837 | | | $ | 1,011 | | | | | |
| | | | | | | | | | | |
| Asset Impairments | $ | — | | | $ | 736 | | | $ | — | | | $ | — | | | | | |
(1)Costs incurred under these plans are classified as "facility"facility consolidation and severance expenses, net"net" in the Company's Consolidated Statements of Operations.
NOTE 2220 - DISCONTINUED OPERATIONS
The Company has either sold or discontinued certain operations that are accounted for as "Discontinued Operations" under applicable accounting guidance. Discontinued operations are summarized as follows:
| | | | 2020 | | 2019 | | 2018 | |
| | | Income (loss) from discontinued operations: | | | | | | |
| | | 2023 | | 2022 |
| Workers' compensation costs from former textile operations | Workers' compensation costs from former textile operations | $ | (60) | | | $ | 38 | | | $ | 212 | | |
| Environmental remediation costs from former textile operations | Environmental remediation costs from former textile operations | (60) | | | (386) | | | (117) | | |
| Income (loss) from discontinued operations, before taxes | $ | (120) | | | $ | (348) | | | $ | 95 | | |
| Commercial business operations | |
| | Loss from discontinued operations, before taxes | |
| Loss from discontinued operations, before taxes | |
| Loss from discontinued operations, before taxes | |
| Income tax benefit | Income tax benefit | 0 | | | 0 | | | 0 | | |
| Income (loss) from discontinued operations, net of tax | $ | (120) | | | $ | (348) | | | $ | 95 | | |
| | Loss from discontinued operations, net of tax | |
THE DIXIE GROUP, INC.
NOTES TO CONSOLIDATED FINANCIAL STATEMENTS
(amounts in thousands, except per share data)
Workers' compensation costs from former textile operations
Undiscounted reserves are maintained for the self-insured workers' compensation obligations related to the Company's former textile operations. These reserves are administered by a third-party workers' compensation service provider under the supervision of Company personnel. Such reserves are reassessed on a quarterly basis. Pre-tax cost incurred for workers' compensation as a component of discontinued operations primarily represents a change in estimate for each period from unanticipated medical costs associated with the Company's obligations.
THE DIXIE GROUP, INC.
NOTES TO CONSOLIDATED FINANCIAL STATEMENTS
(amounts in thousands, except per share data)
(Continued)
Reserves for environmental remediation obligations are established on an undiscounted basis. The Company has an accrual for environmental remediation obligations related to discontinued operations of $1,924$2,205 as of December 26, 202030, 2023 and $1,987$2,205 as of December 28, 2019.31, 2022. The liability established represents the Company's best estimate of possible loss and is the reasonable amount to which there is any meaningful degree of certainty given the periods of estimated remediation and the dollars applicable to such remediation for those periods. The actual timeline to remediate, and thus, the ultimate cost to complete such remediation through these remediation efforts, may differ significantly from the Company's estimates. Pre-tax cost for environmental remediation obligations classified as discontinued operations were primarily a result of specific events requiring action and additional expense in each period.
Commercial business operations
In accordance with the Asset Purchase Agreement dated September 13, 2021, the Company sold assets that include certain inventory, certain items of machinery and equipment used exclusively in the Commercial Business, and related intellectual property. Additionally, the Company agreed not to compete with the specified commercial business and the Atlas|Masland markets for a period of five years following September 13, 2021. The agreement allowed for the Company to sell the commercial inventory retained by the company after the divestiture.
The Company reclassified the following assets and liabilities for discontinued operations in the accompanying Consolidated Balance Sheets:
| | | | | | | | | | | |
| 2023 | | 2022 |
| Current Assets of Discontinued Operations: | | | |
| Receivables, net | $ | 158 | | | $ | 385 | |
| Inventories, net | 107 | | | 255 | |
| Prepaid expenses | — | | | 1 | |
| Current Assets Held for Discontinued Operations | $ | 265 | | | $ | 641 | |
| | | |
| Long Term Assets of Discontinued Operations: | | | |
| Property, plant and equipment, net | $ | 176 | | | $ | 185 | |
| Operating lease right of use assets | — | | | 63 | |
| Other assets | 1,138 | | | 1,304 | |
| Long Term Assets Held for Discontinued Operations | $ | 1,314 | | | $ | 1,552 | |
| | | |
| Current Liabilities of Discontinued Operations: | | | |
| Accounts payable | $ | 128 | | | $ | 127 | |
| Accrued expenses | 1,009 | | | 2,245 | |
| Current portion of operating lease liabilities | — | | | 75 | |
| Current Liabilities Held for Discontinued Operations | $ | 1,137 | | | $ | 2,447 | |
| | | |
| Long Term Liabilities of Discontinued Operations: | | | |
| Other long term liabilities | $ | 3,536 | | | $ | 3,759 | |
| Long Term Liabilities Held for Discontinued Operations | $ | 3,536 | | | $ | 3,759 | |
THE DIXIE GROUP, INC.
NOTES TO CONSOLIDATED FINANCIAL STATEMENTS
(amounts in thousands, except per share data)
For the twelve months ended December 30, 2023 and December 31, 2022, the Company reclassified the following operations of the Commercial business included in discontinued operations in the accompanying Consolidated Statements of Operations:
| | | | | | | | | | | |
| 2023 | | 2022 |
| Net sales | $ | 199 | | | $ | 7,790 | |
| Cost of sales | 624 | | | 8,159 | |
| Gross profit (loss) | (425) | | | (369) | |
| | | |
| Selling and administrative expenses | 178 | | | 1,395 | |
| Other operating (income) expense, net | 115 | | | (475) | |
| Loss from discontinued Commercial business before taxes | $ | (718) | | | $ | (1,289) | |
NOTE 2321 - RELATED PARTY TRANSACTIONS
The Company was a party to a 5-year lease with the seller of Atlas Carpet Mills, Inc. to lease three manufacturing facilities as part of the acquisition in 2014. The lessor was controlled by an associate of the Company. Rent paid to the lessor during 2019 and 2018 was $497 and $1,003, respectively. The lease was based on current market values for similar facilities. These leases terminated as of September, 2019.
The Company purchases a portion of its product needs in the form of fiber, yarn and carpet from Engineered Floors, an entity substantially controlled by Robert E. Shaw, a shareholder of the Company. An affiliate of Mr. Shaw holds approximately 7.7%7.8% of the Company's Common Stock, which represents approximately 3.5%3.1% of the total vote of all classes of the Company's Common Stock. Engineered Floors is one of several suppliers of such materials to the Company. Total purchases from Engineered Floors for 2020, 2019,2023 and 20182022 were approximately $4,500, $5,900$64 and $8,200,$917 respectively; or approximately 1.9%, 2.1%,0.03% and 2.6%0.40% of the Company's cost of goods sold in 2020, 2019,2023 and 2018,2022, respectively. Purchases from Engineered Floors are based on market value, negotiated prices. The Company has no contractual commitments with Mr. Shaw associated with its business relationship with Engineered Floors. Transactions with Engineered Floors are reviewed annually by the Company's board of directors.
The Company is a party to a ten-year lease with the Rothman Family Partnership to lease a facility as part of the Robertex acquisition in 2013. The controlling principle of the lessor was an associate of the Company until June 30, 2018. Rent paid to the lessor during 2020, 2019, and 2018 was $289, $284, and $278, respectively. The lease was based on current market values for similar facilities.
Item 15(a)(2)
SCHEDULE II - VALUATION AND QUALIFYING ACCOUNTS
THE DIXIE GROUP, INC.
(dollars in thousands)
| | Description | Description | | Balance at Beginning of Year | | Additions - Charged to Costs and Expenses | | Additions - Charged to Other Account - Describe | | Deductions - Describe | | Balance at End of Year | Description | | Balance at Beginning of Year | | Additions - Charged to Costs and Expenses | | Additions - Charged to Other Account - Describe | | Deductions - Describe | | Balance at End of Year |
| | Year ended December 26, 2020: | |
| Year ended December 30, 2023: | |
| Year ended December 30, 2023: | |
| Year ended December 30, 2023: | |
| | Reserves deducted from asset accounts: | Reserves deducted from asset accounts: | |
| Allowance for doubtful accounts | | $ | 262 | | | $ | 90 | | | $ | 0 | | | $ | 208 | | (1) | $ | 144 | |
| | Reserves deducted from asset accounts: | |
| | Reserves deducted from asset accounts: | |
| Allowance for expected credit losses | |
| Allowance for expected credit losses | |
| Allowance for expected credit losses | |
| | Reserves classified as liabilities: | Reserves classified as liabilities: | |
| Reserves classified as liabilities: | |
| Reserves classified as liabilities: | |
| Provision for claims, allowances and warranties | |
| Provision for claims, allowances and warranties | |
| Provision for claims, allowances and warranties | Provision for claims, allowances and warranties | | 4,541 | | | 7,938 | | | 0 | | | 7,999 | | — | | 4,480 | |
| | Year ended December 28, 2019: | |
| Year ended December 31, 2022: | |
| Year ended December 31, 2022: | |
| Year ended December 31, 2022: | |
| | Reserves deducted from asset accounts: | Reserves deducted from asset accounts: | |
| Allowance for doubtful accounts | | $ | 174 | | | $ | 240 | | | $ | 0 | | | $ | 152 | | (1) | $ | 262 | |
| | Reserves deducted from asset accounts: | |
| | Reserves deducted from asset accounts: | |
| Allowance for expected credit losses | |
| Allowance for expected credit losses | |
| Allowance for expected credit losses | |
| | Reserves classified as liabilities: | Reserves classified as liabilities: | |
| Reserves classified as liabilities: | |
| Reserves classified as liabilities: | |
| Provision for claims, allowances and warranties | |
| Provision for claims, allowances and warranties | |
| Provision for claims, allowances and warranties | Provision for claims, allowances and warranties | | 5,717 | | | 10,538 | | | 0 | | | 11,714 | | — | | 4,541 | |
| | Year ended December 29, 2018: | |
| | Reserves deducted from asset accounts: | |
| Allowance for doubtful accounts | | $ | 133 | | | $ | 162 | | | $ | 0 | | | $ | 121 | | (1) | $ | 174 | |
| | Reserves classified as liabilities: | |
| Provision for claims, allowances and warranties | | 6,360 | | | 11,995 | | | 0 | | | 12,638 | | (2) | 5,717 | |
|
(1) The Company adopted the new standard , ASU 2016-13, Financial Instruments - Credit Losses (Topic 326): Measurement of Credit Losses on Financial Instruments, on January 1, 2023 using a modified retrospective transition approach, with the cumulative impact being $388 for continuing operations.
(2) Uncollectible accounts written off, net of recoveries. The Allowance for Expected Credit Losses is included in Receivables, net on the Consolidated Balance Sheet. See Note 4 - Receivables, Net for further information.
(2)(3) Net reserve reductions for claims, allowances and warranties settled. The provision for claims, allowances and warranties is included in Accrued Expenses under Current Liabilities on the Consolidated Balance Sheet and included, along with the accrual of rebates, within the Provision for customer rebates, claims and allowances in Note 7 - Accrued Expenses.
ANNUAL REPORT ON FORM 10-K
ITEM 15(b)
EXHIBITS
YEAR ENDED DECEMBER 26, 202030, 2023
THE DIXIE GROUP, INC.
DALTON, GEORGIA
Exhibit Index
| | | | | |
| EXHIBIT NO. | DESCRIPTION |
(1.1)* | |
(2.1)* | |
| (3.1)* | |
| (3.2)* | |
| (5.1)* | |
| (10.1)* | The Dixie Group, Inc. New Non-qualified Retirement Savings Plan effective August 1, 1999. (Incorporated by reference to Exhibit (10.1) to Dixie's Quarterly Report on Form 10-Q for the quarter ended June 26, 1999.)** |
| (10.2)* | |
(10.3)* | |
(10.4)* | |
(10.5)* | |
(10.6)* | |
(10.7)* | |
(10.8)* | |
(10.9)* | |
(10.10)* | |
(10.11)* | |
(10.12)* | |
(10.13)(10.3)* |
|
(10.14)(10.4)* | |
(10.15)(10.5)* | |
(10.16)* | |
| | | | | |
(10.17)(10.6)* | |
(10.18)(10.7)* | |
(10.19)(10.8)* | |
(10.20)(10.9)* | |
(10.21)* | |
(10.22)(10.10)* | |
(10.23)* | |
(10.24)* | |
(10.25)(10.11)* | |
(10.26)(10.12)* | |
(10.27)(10.13)* | |
(10.28)(10.14)* | |
(10.29)(10.15)* | |
(10.30)(10.16)* | |
(10.31)(10.17)* | |
(10.32)(10.18)* |
|
(10.33)(10.19)* |
|
(10.34)* | |
(10.35)(10.20)* | |
(10.36)(10.21)* | |
| (10.37)* | | | | |
(10.38)(10.22)* | |
(10.39)(10.23)* | |
(10.40)(10.24)* |
|
(10.41)(10.25)* | |
(10.42)(10.26)* | |
(10.43)(10.27)* | Loan Agreement dated effective as of October 26, 2020 entered into by and between The Dixie Group, a Tennessee corporation, and TDG Operations, LLC, a Georgia limited liability company,, and AmeriState Bank, an Oklahoma state banking corporation.(Incorporated (Incorporated by Reference to Exhibit (10.1) to Dixie's Current Report on Form 8-K dated November 2,, 2020.) |
| | | | | |
(10.44)(10.28)* | Real Estate Mortgage, Security Agreement, Assignment of Rents and Fixture Filing for Atmore, Alabama facility dated effective as of October 26, 2020 entered into by and between The Dixie Group, a Tennessee corporation, and TDG Operations, LLC, a Georgia limited liability company,, and AmeriState Bank, an Oklahoma state banking corporation. (Incorporated by Reference to Exhibit (10.2) to Dixie's Current Report on Form 8-K dated November 2, 2020.) |
(10.45)(10.29)* | Real Estate Mortgage, Security Agreement, Assignment of Rents and Fixture Filing for Roanoke, Alabama facility dated effective as of October 26, 2020 entered into by and between The Dixie Group, a Tennessee corporation, and TDG Operations, LLC, a Georgia limited liability company, and AmeriState Bank, an Oklahoma state banking corporation. (Incorporated by Reference to Exhibit (10.3) to Dixie's Current Report on Form 8-K dated November 2, 2020.) |
(10.46)(10.30)* | |
(10.47)(10.31)* | |
(10.48)(10.32)* | |
(10.49)(10.33)* | |
| (10.34)* | |
| (10.35)* | |
| (10.36)* | |
| (10.37)* | |
| (10.38)* | |
| (10.39)* | |
| (10.40)* | |
| (10.41)* | |
| (10.42)* | |
| (10.43)* | |
| (10.44)* | |
| (10.45)* | |
| | | | | |
| (10.46)* | |
| (10.47)* | |
| (10.48)* | |
| (10.49)* | |
| (10.50)* | |
| (10.51)* | |
| (10.52)* | |
| (10.53)* | |
| (14)* | |
| (16)* | |
| (19.1) | |
| (21) | |
| (23) | |
| (31.1) | |
| (31.2) | |
| (32.1) | |
| (32.2) | |
| (97)* |
|
| (101.INS) | XBRL Instance Document. (Filed herewith.) |
| (101.SCH) | XBRL Taxonomy Extension Schema Document. (Filed herewith.) |
| (101.CAL) | XBRL Taxonomy Extension Calculation Linkbase Document. (Filed herewith.) |
| (101.DEF) | XBRL Taxonomy Extension Definition Linkbase Document. (Filed herewith.) |
| (101.LAB) | XBRL Taxonomy Extension Label Linkbase Document. (Filed herewith.) |
| (101.PRE) | XBRL Taxonomy Extension Presentation Linkbase Document. (Filed herewith.) |
* Commission File No. 0-2585.
** Indicates a management contract or compensatory plan or arrangement.