UNITED STATES
SECURITIES AND EXCHANGE COMMISSION
Washington, D.C. 20549
FORM 10-K
(Mark One)
| [X] | ANNUAL REPORT PURSUANT TO SECTION 13 or 15(d) OF THE SECURITIES EXCHANGE ACT OF 1934 |
For the Fiscal Year ended December 31, 201630, 2017
OR
| [ ] | TRANSITION REPORT PURSUANT TO SECTION 13 OR 15(d) OF THE SECURITIES EXCHANGE ACT OF 1934 |
For the transition period from ________________ to _______________
Commission File Number 0-599001-35383
THE EASTERN COMPANY
(Exact name of registrant as specified in its charter)
Connecticut | 06-0330020 |
| (State or other jurisdiction of | (I.R.S. Employer |
| incorporation or organization) | Identification No.) |
112 Bridge Street, Naugatuck, Connecticut | 06770 |
| (Address of principal executive offices) | (Zip Code) |
Securities registered pursuant to Section 12(b) of the Act: Common Stock No Par Value The NASDAQ Stock Market LLC
(Title of each class) (Name of each exchange
on which registered)
Securities registered pursuant to Section 12(g) of the Act: None
Indicate by check mark if the registrant is a well-known seasoned issuer, as defined in Rule 405 of the Securities Act.
Yes [X] No [
Indicate by check mark if the registrant is not required to file reports pursuant to Section 13 or Section 15(d) of the Act.
Yes [ ] No [X]
Indicate by check mark whether the registrant (1) has filed all reports required to be filed by Section 13 or 15(d) of the Securities Exchange Act of 1934 during the preceding 12 months (or for such shorter period that the registrant was required to file such reports), and (2) has been subject to such filing requirements for the past 90 days. Yes [X] No [ ]
Indicate by check mark whether the registrant has submitted electronically and posted on its corporate Website, if any, every Interactive Data File required to be submitted and posted pursuant to Rule 405 of Regulation S-T (§232.405 of this chapter) during the preceding 12 months (or for such shorter period that the registrant was required to submit and post such files). Yes [X] No [ ]
Indicate by check mark if disclosure of delinquent filers pursuant to Item 405 of Regulation S-K (§229.405 of this chapter) is not contained herein, and will not be contained, to the best of registrant’sregistrant's knowledge, in definitive proxy or information statements incorporated by reference in Part III of this Form 10-K or any amendment to this Form 10-K. [ ]
Indicate by check mark whether the registrant is a large accelerated filer, an accelerated filer, a non-accelerated filer, or a smaller reporting company, or an emerging growth company. See definitions of “large"large accelerated filer”, “accelerated filer”filer," "accelerated filer," "smaller reporting company," and “smaller reporting company”"emerging growth company" in Rule 12b-2 of the Exchange Act.
Large accelerated filer [ ] | Accelerated filer [X] |
Non-accelerated filer [ ] (Do not check if a smaller reporting company) | Smaller reporting company [ ] |
Emerging growth company [ ] |
If an emerging growth company, indicate by check mark if the registrant has elected not to use the extended transition period for complying with any new or revised financial accounting standards provided pursuant to Section 13(a) of the Exchange Act. [ ]
Indicate by check mark whether the registrant is a shell company (as defined in Rule 12b-2 of the Act). Yes [ ] No [X]
As of July 2, 2016,1, 2017, the last day of registrant’sregistrant's most recently completed second fiscal quarter, the aggregate market value of the voting stock held by non-affiliates of the registrant was $87,125,916$155,324,724 (based on the closing sales price of the registrant’sregistrant's common stock on the last trading date prior to that date). Shares of the registrant’sregistrant's common stock held by each officer and director and shares held in trust by the pension plans of the Company have been excluded in that such persons may be deemed to be affiliates. This determination of affiliate status is not necessarily a conclusive determination for other purposes.
As of March 13, 2017, 6,256,098February 27, 2018, 6,263,245 shares of the registrant’sregistrant's common stock, no par value per share, were issued and outstanding.
DOCUMENTS INCORPORATED BY REFERENCE
Company's shareholders, which will be filed with the Securities and Exchange Commission pursuant to Regulation 14A not later than 120 days after December 30, 2017.
The Eastern Company
FOR THE FISCAL YEAR ENDED DECEMBER 31, 201630, 2017
TABLE OF CONTENTS
| Page | |||
| 3. | |||
| | |||
| 4. | |||
| | |||
| 14. | |||
3
LITIGATION REFORM ACT OF 1995
This Annual Report on Form 10-K (this "Form 10-K") contains forward-looking statements within the meaning of the Private Securities Litigation Reform Act of 1995. Such statements reflect the Company’sCompany's current expectations regarding its products, its markets and its future financial and operating performance. These statements, however, are subject to risks and uncertainties that may cause the Company’sCompany's actual results in future periods to differ materially from those expected. Such risks and uncertainties include, but are not limited to, unanticipated slowdowns in the Company’sCompany's major markets, changing customer preferences, lack of success of new products, loss of customers, competition, increased raw material prices, problems associated with foreign sourcing of parts and products, worldwide conditions and foreign currency fluctuations that may affect results of operations, and other factors discussed in itemItem 1A of this Annual Report on Form 10-K and, from time to time, in the Company’sCompany's filings with the Securities and Exchange Commission. The Company is not obligatedundertakes no obligation to update, alter, or otherwise revise the aforementionedany forward-looking statements, for thosewhether written or oral, that may be made from time to time, whether as a result of new developments.information, future events, or otherwise.
(a) General Development of Business
The Eastern Company (the “Company”"Company," "Eastern," "we," "us," or "our") was incorporated under the laws of the State of Connecticut in October, 1912, succeeding a co-partnership established in October, 1858.
The business of the Company is the design, manufacture and sale of industrial hardware, security products and metal products from six U.S. operations and seven wholly-owned foreign subsidiaries. Theproducts.
Today, the Company maintains thirteensixteen physical locations.locations across North America and Asia.
RECENT DEVELOPMENTS
On January 13, 2016,April 3, 2017, the Board of DirectorsCompany completed a Securities Purchase Agreement (the "Securities Purchase Agreement") with Velvac Holdings, Inc., a Delaware corporation ("Velvac"), Jeffery R. Porter, W. Greg Bland, John Backovitch, Dave Otto, Bob Otto, Timothy Rintelman, Robert Brester, Dan Mcgrew, Mark Moeller, and Prospect Partners II, L.P. (collectively, the "Sellers"). Pursuant to the Securities Purchase Agreement, the Company acquired 100% of the issued and outstanding stock of Velvac from the Sellers (the "Velvac Acquisition") for $39.5 million and an earnout consideration contingent upon Velvac achieving minimum earnings performance levels and based on sales of Velvac's new proprietary Road-iQ product line (the "Earnout Consideration"). The Velvac Acquisition was financed with a $31 million term loan from People's United Bank, National Association ("People's"), a $5 million draw down on the Company's $10 million revolving credit facility with People's and $3.5 million in cash. In addition, the Company approved amendmentspaid a working capital adjustment of $0.6 million by which working capital exceeded a pre-determined target amount. Please refer to the Certificate of IncorporationCompany's Current Report on Form 8-K filed on April 7, 2017 and the By-Laws of the Company which will eliminate the classification of the Board of Directors in a phased in manner and will provideamendment thereto filed on June 19, 2017 for the election of directors by a majority of the votes cast at the Annual Meeting of Shareholders. The declassification of the Board of Directors and the election of Directors by a majority of the votes cast became effective at the Annual Meeting of Shareholders held on April 27, 2016.further details.
(b) Financial Information about Industry Segments
Financial information about industry segments is included in Note 1110 to the Company’sCompany's financial statements, included atin Item 8 of this Annual Report on Form 10-K.
(c) Narrative Description of Business
The Eastern Company actively manages niche industrial divisions that focus on the design, manufacture and sale of particular products and industrial services and are leaders in their specific market sector. We believe Eastern's divisions operate in industries with long-term macroeconomic growth opportunities, have positive and stable cash flows, face minimal threats of technological or competitive obsolescence, and have strong management teams largely in place.
Eastern focuses on proactive financial and operational management of its divisions in order to increase earnings and increase long-term shareholder value. Among other things, Eastern regularly monitors financial and operational performance, instilling consistent financial discipline and assisting management in their analysis and pursuit of prudent organic growth strategies.
4
Eastern also identifies and works with division management to execute attractive external growth and acquisition opportunities. In addition, Eastern recruits and retains talented managers to operate its divisions.
Eastern continuously reviews acquisitions of businesses that have the potential for significant long-term value creation and periodically evaluates the retention and disposition of its existing divisions and investments. We seek to acquire businesses that produce stable and growing earnings and cash flows. Eastern may pursue acquisitions in industries other than those in which its divisions currently operate if an acquisition presents an attractive opportunity.
The Company operates in three business segments: Industrial Hardware, Security Products and Metal Products.
Industrial Hardware
The Industrial Hardware business segment consists of Eberhard Manufacturing, Eberhard Hardware Manufacturing Ltd., Eastern Industrial Ltd, Velvac, Canadian Commercial Vehicles Corporation, Composite Panel Technologies Eastern Industrial Ltd. and Sesamee Mexicana, S.A. de C.V. The unitsThese divisions design, manufacture and market a diverse product line of custom and standard vehicular and industrial hardware, including passenger restraint and vehicular hardware throughout North America. The segment’s locks, latches, hinges, handles, lightweight composite structuresmirrors, mirror-cameras, light-weight sleeper boxes and related hardwaretruck bodies. These products can be found on tractor-trailer trucks, moving vans, off-road constructionspecialty commercial vehicles, recreational vehicles, fire and farming equipment,rescue vehicles, school buses, military vehicles
and recreational boats. They are also used on pickup trucks, sport utility vehicles and fire and rescueother vehicles. In addition, the segment designs and manufactures a wide selection of fasteners and other closure devices used to secure access doors on various types of industrial equipment such as metal cabinets, machinery housings and electronic instruments. Eastern Industrial expands the range of offerings of thisThe segment to include plastic injection molding.
Security Products
The Security Products business segment made upconsists of Greenwald Industries, Argo EMS (formerly Argo Transdata), Illinois Lock Company/CCL Security Products, World Lock Company Ltd., Dongguan Reeworld Security Products Ltd. and, World Security Industries Ltd., is a leading manufacturerGreenwald Industries ("Greenwald"), and Argo EMS (formerly Argo Transdata). Illinois Lock Company/CCL Security Products designs, manufactures and distributes custom engineered and standard closing and locking systems, including vehicular accessory locks, cabinet locks, cam locks, electric switch locks, tubular key locks and combination padlocks. Some of security products. This segment manufactures electronic and mechanical locking devices, both keyed and keyless, for the computer, electronics, vending and gaming industries. The segment also supplies its products are sold under the names SESAMEE®, PRESTOLOCK® andSEARCHALERT™. These products are sold to the luggage, furniture, laboratoryoriginal equipment manufacturers, distributors, route operators, and commercial laundry industries.locksmiths through in-house salesmen and outside sales representatives. Greenwald manufactures and markets coin acceptors and other coin security products used primarily in the commercial laundry markets, as well as hardware and accessories for the appliance industry. In addition, the segment provides a new level of security for the commercial laundry industry through the use of “smart card” technology. Argo EMS supplies printed circuit boards and other electronic assemblies to Original Equipment Manufacturers (“OEM”) in industries such as measurement systems, semiconductor equipment manufacturing, and industrial controls, medical and military markets.
military products. The Security Products segment continuously seeks new markets where it can offer competitive pricing and provide customers with engineered solutions for theirthat meet manufacturers' security needs.
Metal Products
The Company believes that its Metal Products business segment, based at the Company’sCompany's Frazer & Jones facility, is the largest and most efficient producer of expansion shells for use in supporting the roofs of underground mines. This segment also manufactures specialty malleable and ductile iron castings.
Typical products include mine roof support anchors, couplers for railroad braking systems, support anchoring for construction and couplers/fittings for utility (oil, water and gas) industries. Mine roof support anchors are sold to bolt manufacturers while specialty castings are sold to original equipment manufacturers or machine houses. Frazer & Jones will not be effected by the new metals tariff since all metals are purchased domestically.
General
The Company obtains materials from domestic, Asian affiliated and nonaffiliated sources. Raw materials and outside services were readily available from domestic sources for all of the Company’sCompany's segments during 20162017 and are expected to be readily available in 20172018 and the foreseeable future. The Company also obtains materials from Asian affiliated and nonaffiliated sources. The Company has not experienced any significant problems obtaining material from its Asian sources in 2016 and does not expect any such problems in 2017. In 2014,2017, the Company experienced price increases for many of the raw materials used in producing its products, including: scrap iron, zinc, brass and stainless steel. In 20152016, the Company experienced a price decline for many of these same materials. TheAt this time, the Company expects raw material prices to stabilize and then continue to increase as demand for raw materials increases
5
as the worldglobal economy grows. These raw material cost increases could negatively impact the Company’sCompany's gross margin if raw material prices increase too rapidly for the Company
to recover those cost increases through either price increases to our customers or cost reductions in other areas of the businesses.business.
Patent and trademark protection for the various product lines within the Company is limited, but believed by the Company to be sufficient to protect the Company’sCompany's competitive positions. No business segment is dependent on any patent nor would the loss of any patent have any material adverse effect on the Company's business. Foreign sales and license agreements are not significant.
None of the Company’s businessCompany's division segments are seasonal.
Customers for all business segments are broad-based geographically and by markets, and sales are generally not highly concentrated by customer. One customer of the Metal Products segment, Jennmar Corporation, accounted for 10.5% of the Company’s consolidated sales in 2014. No otherone customer exceeded 10% of total consolidated sales in 2017, 2016 2015 or 2014.2015.
The dollar amount of the backlog of orders received by the Company is believed to be firm as of the fiscal year endended December 31, 2016 is $26,993,000,30, 2017. Such backlogs was $34,991,000 at December 30, 2017, as compared to $27,622,000$26,993,000 at January 2,December 31, 2016. The primary reasons for the decreasechange from 20152016 to 20162017 were the acquisition of Velvac on April 3, 2017 and the timing of orders received from customers.
The Company encounters competition in all of its business segments. The Company has been successful in dealing with this competition by offering high quality diversified products with the flexibility of meeting customer needs on a timely basis. This is accomplished by effectively using internal engineering resources and cost effective manufacturing capabilities, expanding product lines through product development and acquisitions, and maintaining sufficient inventory for fast turnaround of customer orders. Imports from Asia and Latin America with favorable currency exchange rates and low cost labor have created additional competitive pressures.pricing pressure. The Company currently utilizes fourcompetes successfully by offering high quality custom engineered products on a timely basis. To compete, the Company deploys internal engineering resources, maintains cost effective manufacturing capabilities through its wholly-owned Asian subsidiaries, in Asia to help offset offshore competition.expands its product lines through product development and acquisitions, and maintains sufficient inventory for fast turnaround of customer orders.
Research and development expenditures in 20162017 were $1,526,000$3,678,000 and represented less than 1%1.8% of gross revenues. In 2016 and 2015, such expenditures were $1,526,000 and 2014 they were $1,219,000, and $1,080,000, respectively. The research and developments costs are primarily attributable to the Greenwald IndustriesVelvac and Eberhard Manufacturing divisions. GreenwaldVelvac performs ongoing research, in both the mechanical and electronic product lines, whichand in RoadIQ. This research is necessary in orderfor the Company to remain competitive and to continue to provide technologically advanced electronic systems. Eberhard Manufacturing develops new products for the various markets they serveit serves based on changing customer requirements to remain competitive. Other research projects include the development of various latches and rotaries and various transportation and industrial hardware products.
The Company does not anticipate that compliance with federal, state or local environmental laws or regulations is likely to have a material effect on the Company’sCompany's capital expenditures, earnings or competitive position.
The average number of employees in 2017 was 1,189.
The Company's ratio of working capital to sales improved in 2017 to 33.7% from 47.1% in 2016 and 41.6% in 2015. The improvement in working capital was 862.the result of a reduction in inventory in the Metal business segment and partially the result of the Velvac acquisition. Working capital includes cash held in various foreign subsidiaries. With the passage of recent tax legislation cash previously held in foreign countries can be repatriated back to the United States and used for other business needs thus reducing working capital further. Other factors affecting working capital include our average days' sales in accounts receivable, inventory turnover ratio and payment of vendor accounts payable. In some cases, the company must hold extra inventory due to extended lead time in receiving products ordered from our foreign subsidiaries to ensure product is available for our customers. The Company continues to monitor its working capital needs with the goal of reducing our ratio of working capital to sales to 25%.
(d) Financial Information about Geographic Areas
The Company includes six separate operating divisions located within the United States, two wholly-owned Canadian subsidiaries (one located in Tillsonburg, Ontario, Canada, and one in Kelowna, British Columbia, Canada), a wholly-owned Taiwanese subsidiary located in Taipei, Taiwan, a wholly-owned subsidiary located in Hong Kong, two wholly-owned Chinese subsidiaries (one located in Shanghai, China, and one located in Dongguan, China), a wholly-owned subsidiary located in Reynosa, Mexico, and a wholly-owned subsidiary located in Lerma, Mexico.
Individually, the Canadian, Taiwanese, Hong Kong, Chinese and Mexican subsidiaries’ revenuesubsidiaries' revenues and assets are not significant. Substantially all other revenues are derived from customers located in the United States.
6
Financial information about foreign and domestic operations’operations' revenues and identifiable assets is included in Note 1110 to the Company’sCompany's financial statements, included atin Item 8 of this Annual Report on Form 10-K. Information about risks attendant to the Company’sCompany's foreign operations is set forth atin Item 1A of this Annual Report on Form 10-K.
(e) e) Available Information
The Company makes available, free of charge through its Internet website at http://www.easterncompany.com, its annual report on Form 10-K, quarterly reports on Form 10-Q, current reports on Form 8-K and amendments to those reports filed or furnished pursuant to Section 13(a) or 15(d) of the Securities Exchange Act of 1934, as amended (the "Exchange Act"), as soon as reasonably practicable after such material is electronically filed with or furnished to the Securities and Exchange Commission.Commission (the "SEC"). The public may read and
copy any materials that the Company files with the SEC at the SEC’sSEC's Public Reference Room, 100 F Street, N.E., Washington, DC 20549 or by calling the SEC at 1-800-SEC-0330. The Company’sCompany's reports filed with, or furnished to, the SEC are also available on the SEC’sSEC's website at www.sec.gov.
In addition to the other information contained in this Form 10-K and the exhibits hereto and the Company’sCompany's other filings with the SEC, the following risk factors should be considered carefully in evaluating the Company’sCompany's business. The Company’sCompany's business, financial condition or results of operation could be materially adversely affected by any of these risks or additional risks not presently known to the Company, or by risks the Company currently deems immaterialimmaterial. which may also adversely affect its business, financial condition or results of operations, such as: changes in the economy, including changes in inflation, tax rates, interest rates and currency exchange rates; risk associated with possible disruption in the Company’sCompany's operations due to terrorism, cybersecurity threats and other manmade or natural disasters; future regulatory actions, legal issues or environmental matters; loss of, or changes in, executive management; and changes in accounting standards whichthat are adverse to the Company. Also,Additionally, there can be no assurance that the Company has correctly identified and appropriately assessed all factors affecting its business or that information publicly available with respect to these matters is complete and correct.
The Company’sCompany's business is subject to risks associated with conducting business overseas.
International operations could be adversely affected by changes in political and economic conditions, trade protection measures, restrictions on repatriation of earnings, differing intellectual property rights and changes in regulatory requirements that restrict the sales of products or increase costs. Changes in exchange rates between the U.S. dollar and otherforeign currencies could result in increases or decreases in earnings and may adversely affect the value of the Company’sCompany's assets outside the United States. The Company’sCompany's operations are also subject to the effects of international trade agreements and regulations. Although generally theseThese trade agreements have positive effects, they can alsocould impose requirements that adversely affect the Company’sCompany's business, such as, but not limited to, setting quotas on productproducts that may be imported from a particular country into the Company’sCompany's key markets in North America.
The Company’sCompany's ability to import products in a timely and cost-effective manner may also be affected by conditions at ports or issues that otherwise affect transportation and warehousing providers, such as port and shipping capacity, labor disputes, severe weather or increased homeland security requirements in the United States or other countries. These issues could delay importation of products or require the Company to locate alternative ports or warehousing providers to avoid disruption to customers. These alternatives may not be available on short notice or could result in higher transit costs, which could have an adverse impact on the Company’sCompany's business, financial conditions or results of operations.
Indebtedness may affect our business and may restrict our operating flexibility.
As of December, 31, 2017, the Company had $35,225,000 in total consolidated indebtedness. Subject to restrictions contained in our credit facility, the Company may incur additional indebtedness in the future, including indebtedness incurred to finance acquisitions. The level of indebtedness and servicing costs associated with that indebtedness could have important effects on our operation and business strategy. For example, the indebtedness could:
| · | Place the Company at a competitive disadvantage relative to the Company's competitors, some of which have lower debt service obligations and greater financial resources; |
| · | Limit our ability to borrow additional funds; |
7
| · | Limit our ability to complete future acquisitions; |
| · | Limit our ability to pay dividends; |
| · | Limit our ability to make capital expenditures; and |
| · | Increase the Company's vulnerability to general adverse economic and industry conditions. |
The Company's ability to make scheduled principal payments, to pay interest on, or to refinance our indebtedness and to satisfy other debt obligations will depend upon future operating performance, which may be affected by factors beyond the Company's control. In addition, there can be no assurance that future borrowings or the issuance of equity would be available to the Company on favorable terms for the payment or refinancing of the Company's debt. If the Company is unable to service its indebtedness, the business, financial condition and results of operation would be materially adversely affected.
The Company's credit facility contains covenants requiring the Company to achieve certain financial and operations results and maintain compliance with specified financial ratios. The Company's ability to meet the financial covenants or requirements in its credit facility may be affected by events beyond our control, and the Company may not be able to satisfy such covenants and requirements. A breach of these covenants or the Company's inability to comply with the financial ratios, tests or other restrictions contained in our credit facility could result in an event of default under such credit facility. Upon the occurrence of an event of default under our credit facility and/or the expiration of any grace periods, the lenders could elect to declare all amounts outstanding under our credit facility, together with accrued interest, to be immediately due and payable. If this were to occur, the Company's assets may not be sufficient to fully repay the amounts due under our credit facility or the Company's other indebtedness. See also “"ITEM 7A - QUANTITATIVE AND QUALITATIVE DISCLOSURES ABOUT MARKET RISK”" of this Form 10-K.
In addition, the Company’sCompany's growth strategy involves expanding sales of its products into foreign markets. There is no guarantee that the Company’sCompany's products will be accepted by foreign customers or how long it may take to develop sales of the Company’sCompany's products in these foreign markets.
Increases in the price or reduced availability of raw materials.
Raw materials needed to manufacture products are obtained from numerous suppliers. Under normal market conditions, these raw materials are readily available on the open market from a variety of producers. However, from time to time, the prices and availability of these raw materials fluctuate, which could impair the Company’sCompany's ability to procure the required raw materials for its operations or increase the cost of manufacturing its products. If the price of raw materials increases, the Company may be unable to pass these increases on to its customers and could experience reductionreductions to its profit margins. Also, any decrease in the availability of raw materials could impair the Company’sCompany's ability to meet production requirements in a timely manner.
The Company obtains raw materials, including stainless steel used in the production of its products from domestic, Asian affiliated and nonaffiliated sources. The President of the United States recently announced a proposal to impose tariffs of 25 percent on imported steel and 10 percent on imported aluminum through the issuance of an executive order. If implemented, such tariffs may cause an increase in costs for all domestic entities, including the Company, that purchase imported steel or aluminum. Because steel are raw materials used in a wide-range of the Company's products, a broad-based cost increase would result in an increase in the Company's cost of goods sold, which may require us to increase prices for some of our products. However, our inability to pass along such price increases to our customers, or an inability of our suppliers to meet our raw material requirements, may have a material adverse impact on our business, results of operations or financial condition.
Changes in competition in the markets that the Company services could impact revenues and earnings.
Any change in competition may result in lost market share or reduced prices, which could result in reduced profitprofits and margins. This may impair the ability to grow or even maintain current levels of revenues and earnings. While the Company has an extensive
customer base, loss of certain customers could adversely affect the Company’sCompany's business, financial condition or results of operations until such business is replaced, and no assurances can be made that the Company would be able to regain or replace any lost customers.
8
The Company is required to evaluate its internal control over financial reporting under Section 404 of the Sarbanes-Oxley Act of 2002.
The Company is an “accelerated filer”"accelerated filer" as defined in Rule 12b-2 under the Securities Exchange Act of 1934, as amended, and is thus required to comply with Section 404 of the Sarbanes-Oxley Act of 2002. Section 404 requires the Company to include in its report management’smanagement's assessment of the effectiveness of the Company’sCompany's internal control over financial reporting as of the end of the fiscal period for which the Company is filing its Annual Report on Form 10-K. This report must also include disclosure of any material weaknesses in internal control over financial reporting that the Company has identified. Additionally, the Company’sCompany's independent registered public accounting firm is required to issue a report on the Company’sCompany's internal control over financial reporting and their evaluation of the operating effectiveness of the Company’sCompany's internal control over financial reporting. The Company’sCompany's assessment requires it to make subjective judgments, and the independent registered public accounting firm may not agree with the Company’sCompany's assessment. If the Company or its independent registered public accounting firm were unable to complete the assessments within the period prescribed by Section 404 and thus be unable to conclude that the internal control over financial reporting is effective, investors could lose confidence in the Company’sCompany's reported financial information, which could have an adverse effect on the market price of the Company’sCompany's common stock or impact the Company’sCompany's borrowing ability. In addition, changes in operating conditions and changes in compliance with policies and procedures currently in place may result in inadequate internal control over financial reporting in the future.
The inability to identify or complete acquisitionsdevelop new products could limit future growth.
Demand for new products and the inability to develop and introduce new competitive products at favorable profit margins could adversely affect the Company’sCompany's performance and prospects for future growth, and the Company would not be positioned to maintain current levels of revenues and earnings.
The uncertainties associated with developing and introducing new products, such as the market demands and the costs of development and production, may impede the successful development and introduction of new products. Acceptance of the new products may not meet sales expectations due to several factors, such as the Company’s failureCompany's potential inability to accurately predict market demand or its inability to resolve technical issues in a timely and cost-effectivecost effective manner. Additionally, the inability to develop new products on a timely basis could result in the loss of business to competitors.
The inability to identify or complete acquisitions could limit growth.
The Company's future growth may partly depend on its ability to acquire and successfully integrate new businesses. The Company intends to seek additional acquisition opportunities, both to expend into new markets and to enhance the Company's position in existing markets. However, there can be no assurances that the Company will be able to successfully identify suitable candidates, negotiate appropriate terms, obtain financing on acceptable terms, complete proposed acquisitions, successfully integrate acquired businesses or expand into new markets. Once acquired, operations may not achieve anticipated levels of revenues or profitability.
Acquisitions involve risk, including difficulties in the integration of the operations, technologies, services and products of the acquired companies and the diversion of management's attention from other business concerns. Although the Company's management will endeavor to evaluate the risks inherent in any particular transaction, there can be no assurances that the Company's management will properly ascertain all such risks. In addition, prior acquisitions have resulted, and future acquisitions could result in the incurrence of substantial debt and other expenses. Future acquisitions may also result in potentially dilutive issuances of equity securities. Difficulties encountered with acquisitions may have a material adverse effect on our business, financial condition and results of operations.
Environmental compliance costs and liabilities could increase the Company's expenses and adversely affect the Company's financial condition.
The Company's operations and properties are subject to laws and regulations relating to environmental protection, including air emissions, water discharges, waste management and workplace safety. These laws and regulations can result in the imposition of substantial fines and sanctions for violations and could require the installation of pollution control equipment or operational changes to limit pollution emissions and/or decrease the likelihood of accidental hazardous substance releases. The Company must conform its operations and properties to these laws and adapt to regulatory requirements in the countries in which the Company's divisions operate as these requirements change.
9
The Company uses and generates hazardous substances and wastes in its operations and, as a result, could be subject to potentially material liabilities relating to the investigation and clean-up of contaminated properties and to claims alleging personal injury. The Company has experienced, and expects to continue to experience, costs relating to compliance with environmental laws and regulations. In connection with the Company's acquisitions, the Company may assume significant environmental liabilities, some of which it may not be aware of at the time of acquisition. In addition, new laws and regulations, stricter enforcement of existing laws and regulations, the discovery of previously unknown contamination or the imposition of new clean-up requirements could require the Company to incur costs or become the basis for new or increased liabilities that could have a material adverse effect on our business, financial condition and results of operations.
Our technology is important to the Company's success and the failure to protect this technology could put the Company at a competitive disadvantage.
Some of the Company's products rely on proprietary technology; therefore, the Company believes that the development and protection of intellectual property rights through patents, copyrights, trade secrets, trademarks, confidentiality agreements and other contractual provisions are important to the future success of its business. Despite the Company's efforts to protect proprietary rights, unauthorized parties or competitors may copy or otherwise obtain and use the Company's products or technology. Actions to enforce these rights may result in substantial costs and diversion of resources and the Company make no assurances that any such actions will be successful.
The Company relies on information and technology for many of its business operations, which could fail and cause disruption to the Company's business operations.
The Company's business operations are dependent upon information technology networks and systems to securely transmit, process and store electronic information and to communicate among its locations around the world and with clients and vendors. A shut-down of, or inability to access, one or more of the Company's facilities, a power outage or a failure of one or more of the Company's information technology, telecommunications or other systems could significantly impair the Company's ability to perform such functions on a timely basis. Computer viruses, cyberattacks, other external hazards and human error could result in the misappropriation of assets or sensitive information, corruption of data or operational disruption. If sustained or repeated, such a business interruption, system failure, service denial or data loss and damage could result in a deterioration of the Company's ability to write and process orders, provide customer service or perform other necessary business functions.
A breach in the security of the Company's software could harm its reputation, result in a loss of current and potential customers and subject the Company to material claims, which could materially harm our operating results and financial condition.
If the Company's security measures are breached, an unauthorized party may obtain access to the Company's data or users' or customers' data. In addition, cyber-attacks and similar acts could lead to interruptions and delays in customer processing or a loss or breach of a customer's data. Because the techniques used to obtain unauthorized access, disable or degrade service, or sabotage systems change frequently and often are not recognized until launched against a target, the Company may be unable to anticipate these techniques or to implement adequate preventative measures. The risk that these types of events could seriously harm the Company's business is likely to increase as the Company expands the number of web-based products we offer, the services we provide, and our global operations.
Regulatory authorities around the world are considering a number of legislative and regulatory proposals concerning data protection. In addition, the interpretation and application of consumer and data protection laws in the United States and elsewhere are often uncertain and in flux. It is possible that these laws may be interpreted and applied in a manner that is inconsistent with the Company's data practices. If so, in addition to the possibility of fines, this could result in an order requiring that the Company change its data practices, which could have an adverse effect on its business and results of operations.
Any security breaches for which the Company is, or is perceived to be, responsible, in whole or in part, could subject us to legal claims or legal proceedings, including regulatory investigations, which could harm the Company's reputation and result in significant litigation costs and damage awards or settlement amounts. Any imposition of liability, particularly liability that is not covered by insurance or is in excess of insurance coverage, could materially harm our operating results and financial condition. Security breaches also could cause the Company to lose current and potential customers, which could have an adverse effect on
10
our business. Moreover, the Company might be required to expend significant financial and other resources to further protect against security breaches or to rectify problems caused by any security breach.
The Company could be subject to litigation, which could have a material impact on the Company’sCompany's business, financial condition or results of operations.
From time to time, the Company’sCompany's operations are parties to or targets of lawsuits, claims, investigations and proceedings, including product liability, personal injury, patent and intellectual property, commercial, contract, and environmental and employment matters, which are defended and settled in the ordinary course of business. While the Company is unable to predict the outcome of any of these matters, it does not believe, based upon currently available information, that the resolution of any pending matter will have a material adverse effect on its business, financial condition or results of operations. See “ITEM"ITEM 3 – LEGAL PROCEEDINGS”PROCEEDINGS" in this Form 10-K for a discussion of current litigation.
The Company could be subject to additional tax liabilities.
The Company is subject to income tax laws inof the United States, its states and municipalities and those of other foreign jurisdictions in which the Company has business operations. These laws are complex and subject to interpretations by the taxpayer and the relevant governmental taxing authorities. Significant judgment and interpretation is required in determining the Company’sCompany's worldwide provision for income taxes. In the ordinary course of business, transactions arise where the ultimate tax determination is uncertain. Although the Company believes itsthat our tax estimates are reasonable, the final outcome of tax audits and any related litigation could be materially different from that which is reflected in historical income tax provisions and accruals. Based on the status of a given tax audit or related litigation, a material effect on the Company’sCompany's income tax provision or net income may result during the period or periods from the initial recognition of a particular matter in the Company’sCompany's reported financial results to the final closure of that tax audit or settlement of related litigation when the ultimate tax and related cash flow is known with certainty.
The Company’sCompany's goodwill or indefinite-lived intangible assets may become impaired, which could require a significant charge to earnings to be recognized.
Under accounting principles generally accepted in the United States, goodwill and indefinite-lived intangible assets are not amortized but are reviewed for impairment at least annually. Future operating results used in the assumptions, such as sales or profit forecasts, may not materialize, and the Company could be required to record a significant charge to earnings in the financial statements during the period in which any impairment is determined, resulting in an unfavorable impact on our results of operations. Numerous assumptions are used in the evaluation of impairment, and there is no guarantee that the Company’sCompany's independent registered public accounting firm would reach the same conclusion as the Company or an independent valuation firm, which could result in a disagreement between management and the Company's independent registered public accounting firm.
The Company may need additional capital in the future, and itwhich may not be available on acceptable terms, if at all.
From time-to-time, the Company has historically relied on outside financing to fund expanded operations, capital expenditure programs and acquisitions. The Company may require additional capital in the future to fund operations or strategic opportunities. The Company cannot be assured that additional financing will be available on favorable terms, or at all. In addition, the terms of available financing may place limits on the Company’sCompany's financial and operating flexibility. If the Company is unable to obtain sufficient capital in the future, the Company may not be able to expand or acquire complementary businesses and may not be able to continue to develop new products or otherwise respond to changing business conditions or competitive pressures.
The Company’sCompany's stock price may become highly volatile due to low float, which is the number of shares of the Company’s common stock that are outstanding and available for trading by the public.volatile.
The Company’sCompany's stock price may change dramatically when buyers seeking to purchase shares of the Company’sCompany's common stock exceed the shares available on the market, or when there are no buyers to purchase shares of the Company’sCompany's common stock when shareholders are trying to sell their shares.
11
The Company may not be able to reach acceptable terms for contracts negotiated with its labor unions and be subject to work stoppages or disruption of production.
During 2017,2018, union contracts covering approximately 14%9% of the Company's total workforce of the Company will expire. The Company has been successful in negotiating new contracts over the years, but cannot guarantee that will continue. Failure to negotiate new union contracts could result in the disruption of production, inability to deliver product or a number of unforeseen circumstances, any of which could have an unfavorable material impact on the Company’sCompany's results of operations or financial statements.condition.
Deterioration in the creditworthiness of several major customers could have a material impact on the Company’sCompany's business, financial condition or results of operations.
Included as a significant asset on the Company’sCompany's balance sheet are accounts receivable from our customers. If several large customers become insolvent or are otherwise unable to pay for products, or become unwilling or unable to make payments in a timely manner, it could have an unfavorable material impact on the Company’sCompany's results of operations or financial statements.condition.
Although the Company is not dependent on any one customer, deterioration in several large customers at the same time could have an unfavorable material impact on the Company’sCompany's results of operations or financial statements.condition. No customersone customer exceeded 10% of total accounts receivable for 2017, 2016 2015 or 2014.2015.
The Company’sCompany's operating results may fluctuate, which makes the results of operations difficult to predict and could cause the results to fall short of expectations.
The Company’sCompany's operating results may fluctuate as a result of a number of factors, many of which are outside of our control. As a result, comparing the Company’sCompany's operating results on a period-to-period basis may not be meaningful, and past results should not be relied upon as an indication of future performance. Quarterly, year to date and annual costs and expenses as a percentage of revenuerevenues may differ significantly from historical or projected rates.levels. Future operating results may fall below expectations. These types of events could cause the price of the Company’sCompany's stock to fall.
New or existing U.S. or foreign laws could subject the Company to claims or otherwise impact the Company’sCompany's business, financial condition or results of operations.
The Company is subject to a variety of laws in both the U.S. and foreign countries that are costly to comply with, can result in negative publicity and diversion of management time and effort and can subject the Company to claims or other remedies.
None.
The corporate office of the Company is located in Naugatuck, Connecticut in a two-story, 8,000 square foot administrative building on 3.2 acres of land.
All of the Company’sCompany's properties are owned or leased and are adequate to satisfy current requirements. All of the Company’sCompany's properties have the necessary flexibility to cover any long-term expansion requirements.
The Industrial Hardware Group includes the following:
The Eberhard Manufacturing Division in Strongsville, Ohio owns 9.6 acres of land and a building containing 157,580 square feet, located in an industrial park. The building is steel frame, is one-story havingand has curtain walls of brick, glass and insulated steel panel.panels. The building has two high bays, one of which houses two units of automated warehousing.
12
Eberhard Hardware Manufacturing, Ltd., a wholly-owned Canadian subsidiary in Tillsonburg, Ontario, owns 4.4 acres of land and a building containing 31,000 square feet in an industrial park. The building is steel frame, is one-story, havingand has curtain walls of brick, glass and insulated steel panel.panels. It is particularly suited for light fabrication, assembly and warehousing and is adequate for long-term expansion requirements.
The Composite Panel Technologies Division (“CPT”("CPT") in Salisbury, North Carolina, leases 70,000 square feet of building space located in an industrial park. The building is made from brick and concrete, contains approximately 6,600 square feet of office space on one level and houses a modern paint booth for finishing our products. The building is protected by a water sprinkler fire suppression system and is alarmed for fire and security. The current lease expires on October 31, 2019 and is renewable.
The Sesamee Mexicana subsidiary leases 42,588 square feet in a facility located in an industrial park in Lerma, Mexico. The current lease expires on November 30, 2020 and is renewable. The building is steel framedframe with concrete block and glass curtain walls.
Velvac, Inc., a wholly-owned subsidiary in New Berlin, Wisconsin, leases a 98,000 square foot building. The building includes 17,000 square feet of office space and 81,000 square feet of warehousing and distribution operations. The current lease expires on May 31, 2021.
Velvac de Reynosa, S. De R.L De C.V., a maquiladora wholly-owned in Reynosa, Tamaulipas, Mexico, leases 90,000 square feet of building space located in an industrial park identified as Buildings 19, 20 and 21 and on a tract of land with an area of 165,507 square feet. The building is one level and is made from brick and concrete. The building is protected by a 24 hour security system and onsite security. The current lease expires on August 31, 2021.
Velvac, Inc. also leases a 9,300 square foot building in Bellingham, Washington. The premises are used solely for software development and research and development. The current lease expires on September 30, 2021.
The Security Products Group includes the following:
The Greenwald Industries Division in Chester, Connecticut owns 26 acres of land and a building containing 120,000 square feet. The building is steel frame, one story, havingis one-story, and has brick over concrete blocks.
The Illinois Lock Company/CCL Security Products Division owns 2.5 acres of land and a building containing 44,000 square feet in Wheeling, Illinois. The building is brick and is located in an industrial park.
The Argo EMS Division leases approximately 17,000 square feet of space in a building located in an industrial park in Clinton, CT.Connecticut. The building is a two-story steel framedframe structure and is situated on 2.9 acres of land. The current lease expires on March 31, 2019.
The World Lock Co. Ltd. subsidiary leases 5,285 square feet of space in a building located in Taipei, Taiwan. The building is made from brick and concrete and is protected by a fire alarm and sprinklers. A two-year lease was signed in 2016, which expires on July 31, 2018 and is renewable.
13
The Dongguan Reeworld Security Products Company Ltd. subsidiary was established in July 2013 to manufacture locks and hardware and leases 118,000 square feet of space in concrete buildings that are located in an industrial park located in Dongguan, China. A five-year lease was signed in 2013, which expires on June 30, 2018 and is renewable.
The Metal Products Group consists of:
The Frazer and Jones Division in Solvay, New York owns 17.9 acres of land and buildings containing 205,000 square feet constructed for foundry use. These facilities are well adapted to handle the division’sdivision's current and future casting requirements.
All owned properties are free and clear of any encumbrances.
In 2010, the Company was contacted by the State of Illinois regarding potential ground contamination at ourits plant in Wheeling, Illinois. The Company signed up withentered into a voluntary remediation program in Illinois and has engaged an environmental clean-up company to perform testing and develop a remediation plan. Since 2010, the environmental company has completed a number of tests and the design of a final remediation system designis currently being reviewed and is expected to be approved in Fiscal 2017. the first quarter of 2018. The total estimated cost for the proposed remediation system is anticipated to be approximately $50,000.
In Fiscal 2016, the Company had expensescreated a plan to remediate a landfill of $10,738 relatedspent foundry sand maintained at the Company's Metal Casting facility in New York. This plan was presented to this issue. Finalthe New York Department of Environmental Conservation (the "DEC") for approval in the first quarter of 2018. The Company is in final negotiations with the DEC, and, based on estimates provided by the Company's environmental engineers, the anticipated cost to remediate have not been determined at this time.and monitor the landfill is $380,000. The Company accrued for and expensed such estimated cost in the second and third quarters of 2017.
There are no other legal proceedings, other than ordinary routine litigation incidental to the Company’sCompany's business, to which either the Company or any of its subsidiaries is a party or toof which any property of their propertythe Company or any subsidiary is the subject.
Not applicable.
14
| ITEM 5 | MARKET FOR |
The Company’sCompany's common stock is tradedquoted on the NASDAQ (tickerGlobal Market under the symbol EML)"EML". The approximate number of record holders of the Company common stock on December 31, 201630, 2017 was 369.354.
The following table sets forth the high and low per share sales priceprices of the Company’sCompany's common stock, and the per share annualquarterly dividend declared on the Company’sCompany's common stock, for each quarter of the pastimmediately preceding two years.years as reported on the NASDAQ Global Market.
| 2016 | 2015 | 2017 | 2016 | ||||||||||||||||||||||||||||||
| Market Price | Market Price | Market Price | Market Price | ||||||||||||||||||||||||||||||
| Quarter | High | Low | Dividend | Quarter | High | Low | Dividend | High | Low | Dividend | Quarter | High | Low | Dividend | |||||||||||||||||||
| First | $19.04 | $15.01 | $.11 | First | $20.67 | $16.75 | $.11 | $ | 21.50 | $ | 18.85 | $ | 0.11 | First | $ | 19.04 | $ | 15.01 | $ | 0.11 | |||||||||||||
| Second | 17.21 | 15.74 | .11 | Second | 20.66 | 18.10 | .11 | 31.50 | 21.06 | 0.11 | Second | 17.21 | 15.74 | 0.11 | |||||||||||||||||||
| Third | 20.12 | 16.39 | .11 | Third | 18.74 | 15.75 | .12 # | 31.15 | 24.35 | 0.11 | Third | 20.12 | 16.39 | 0.11 | |||||||||||||||||||
| Fourth | 21.50 | 18.90 | .11 | Fourth | 19.27 | 15.82 | .11 | 30.85 | 25.10 | 0.11 | Fourth | 21.50 | 18.90 | 0.11 | |||||||||||||||||||
The Company expects to continue its policy of paying regular cash dividends, although there iscan be no assurance as to future dividends because they are dependent on future earnings, capital requirements and financial conditions.condition. The payment of dividends is subject to the restrictions of the Company’sCompany's loan agreement if such payment would result in an event of default. See Item 7 – Management’sManagement's Discussion and Analysis of Financial Condition and Results of Operations, and Note 5 to the Company’sCompany's financial statements included atin Item 8 of this Annual Report on Form 10-K.
The following table sets forth information regarding securities authorized for issuance under the Company’sCompany's equity compensation plans as of December 31, 2016,30, 2017, consisting of the Company’sCompany's 2010 plan.Executive Stock Incentive Plan (the "2010 Plan").
| Equity Compensation Plan Information | ||||||||||||
| Plan category | Number of securities to be issued upon exercise of outstanding options, warrants and rights | Weighted-average exercise price of outstanding options, warrants and rights | Number of securities remaining available for future issuance under equity compensation plans (excluding securities reflected in column (a)) | |||||||||
| (a) | (b) | (c) | ||||||||||
| Equity compensation plans approved by security holders | 56,330 | 20.36 | 333,500 | 1 | ||||||||
| Equity compensation plans not approved by security holders | - | - | - | |||||||||
| Total | 56,330 | 20.36 | 333,500 | |||||||||
1 Includes shares available for future issuance under the 2010 plan.Plan.
Each director who is not an employee of the Company (“("Outside Director”Director") is paid a director’sdirector's fee for his services at the annual rate of $30,000. Effective August 1, 2017, the chairman of the board will receive an annual fee of $60,000 for his services and all chairs of the varying committees will receive additional compensation. All annual fees paid to non-employee members of the Board of Directors of the Company are paid in common stock of the Company or cash, in accordance with the Directors Fee Program adopted by the shareholders on March 26, 1997 and amended on January 5, 2004. The directors make an annual election, within a reasonable time before their first quarterly payment, to receive their fees in the form of cash, stock or a combination thereof. The election remains in force for one year.
15
During fiscal years 2017, 2016 2015 or 2014,2015, there were no sales by the Company of its securities of the registrant sold whichthat were not registered under the Securities Act.
Act of 1933, as amended (the "Securities Act").
The Company doesdid not have any share repurchase plans or programs.programs in effect during fiscal year 2017.
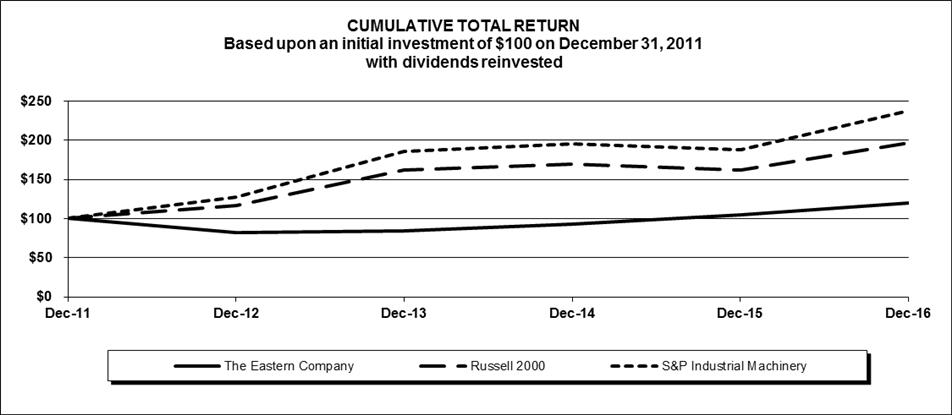
Stock Performance Graph
The following graph sets forth the Company’sCompany's cumulative total shareholder return based upon an initial $100 investment made on December 31, 20112012 (i.e., stock appreciation plus dividends during the past five fiscal years) compared to the Russell 2000 Index and the S&P Industrial Machinery Index.
The Company manufactures and markets a broad range of locks, latches, fasteners and other security hardware that meets the diverse security and safety needs of industrial and commercial customers. Consequently, while the S&P Industrial Machinery Index being used for comparison is the standard index most closely related to the Company, it does not completely represent the Company’sCompany's products or market applications. The Russell 2000 is a small cap market index of the smallest 2,000 stocks in the Russell 3000 Index.

| Dec. 12 | Dec. 13 | Dec. 14 | Dec. 15 | Dec. 16 | Dec. 17 | |||||||||||||||||||
| The Eastern Company | $ | 100 | $ | 103 | $ | 114 | $ | 129 | $ | 147 | $ | 187 | ||||||||||||
| Russell 2000 | $ | 100 | $ | 139 | $ | 146 | $ | 139 | $ | 169 | $ | 194 | ||||||||||||
| S&P Industrial Machinery | $ | 100 | $ | 146 | $ | 153 | $ | 147 | $ | 187 | $ | 249 | ||||||||||||
| Copyright© 2018 Standard & Poor's, a division of S&P Global. All rights reserved. | ||||||||||||||||||||||||
| Copyright© 2018 Russell Investment Group. All rights reserved. | ||||||||||||||||||||||||
| Dec. 11 | Dec. 12 | Dec. 13 | Dec. 14 | Dec. 15 | Dec. 16 | |
| The Eastern Company | $100 | $82 | $84 | $93 | $105 | $120 |
| Russell 2000 | $100 | $116 | $162 | $169 | $162 | $196 |
| S&P Industrial Machinery | $100 | $127 | $186 | $195 | $188 | $238 |
| Copyright© 2017 Standard & Poor's, a division of S&P Global. All rights reserved. | ||||||
| Copyright© 2017 Russell Investment Group. All rights reserved. | ||||||
16
| 2016 | 2015 | 2014 | 2013 | 2012 | 2017 | 2016 | 2015 | 2014 | 2013 | ||||||||||||||||||
| INCOME STATEMENT ITEMS (in thousands) | INCOME STATEMENT ITEMS (in thousands) | INCOME STATEMENT ITEMS (in thousands) | |||||||||||||||||||||||||
| Net sales | Net sales | $ 137,608 | $ 144,568 | $ 140,825 | $ 142,458 | $ 157,509 | Net sales | $ | 204,240 | $ | 137,608 | $ | 144,568 | $ | 140,825 | $ | 142,458 | ||||||||||
| Cost of products sold | Cost of products sold | 103,315 | 112,187 | 108,339 | 112,311 | 124,157 | Cost of products sold | 154,189 | 103,315 | 112,187 | 108,339 | 112,311 | |||||||||||||||
| Depreciation and amortization | Depreciation and amortization | 3,814 | 3,921 | 3,486 | 3,825 | 3,440 | Depreciation and amortization | 4,719 | 3,814 | 3,921 | 3,486 | 3,825 | |||||||||||||||
| Interest expense | Interest expense | 122 | 185 | 255 | 323 | 369 | Interest expense | 977 | 122 | 185 | 255 | 323 | |||||||||||||||
| Income before income taxes | Income before income taxes | 11,223 | 8,021 | 11,529 | 10,114 | 13,225 | Income before income taxes | 11,455 | 11,223 | 8,021 | 11,529 | 10,114 | |||||||||||||||
| Income taxes | Income taxes | 3,438 | 2,294 | 3,867 | 3,212 | 4,599 | Income taxes | 6,410 | 3,438 | 2,294 | 3,867 | 3,212 | |||||||||||||||
| Net income | Net income | 7,785 | 5,727 | 7,661 | 6,902 | 8,626 | Net income | 5,045 | 7,785 | 5,727 | 7,661 | 6,902 | |||||||||||||||
| Dividends # | Dividends # | 2,751 | 2,811 | 2,987 | 2,613 | 3,109 | Dividends # | 2,755 | 2,751 | 2,811 | 2,987 | 2,613 | |||||||||||||||
| BALANCE SHEET ITEMS (in thousands) | BALANCE SHEET ITEMS (in thousands) | BALANCE SHEET ITEMS (in thousands) | |||||||||||||||||||||||||
| Inventories | Inventories | $ 34,030 | $ 36,842 | $ 34,402 | $ 30,658 | $ 29,385 | Inventories | $ | 47,269 | $ | 34,030 | $ | 36,842 | $ | 34,402 | $ | 30,658 | ||||||||||
| Working capital | Working capital | 64,831 | 60,105 | 57,845 | 57,379 | 56,920 | Working capital | 68,751 | 64,831 | 60,105 | 57,845 | 57,379 | |||||||||||||||
| Property, plant and equipment, net | Property, plant and equipment, net | 26,166 | 26,801 | 28,051 | 27,392 | 25,661 | Property, plant and equipment, net | 29,192 | 26,166 | 26,801 | 28,051 | 27,392 | |||||||||||||||
| Total assets | Total assets | 124,198 | 121,739 | 121,271 | 113,858 | 115,854 | Total assets | 176,458 | 124,198 | 121,739 | 121,271 | 113,858 | |||||||||||||||
| Shareholders’ equity | 82,468 | 79,405 | 74,975 | 81,505 | 71,582 | ||||||||||||||||||||||
| Shareholders' equity | Shareholders' equity | 86,931 | 82,468 | 79,405 | 74,975 | 81,505 | |||||||||||||||||||||
| Capital expenditures | Capital expenditures | 2,863 | 2,538 | 3,633 | 5,524 | 4,217 | Capital expenditures | 2,763 | 2,863 | 2,538 | 3,633 | 5,524 | |||||||||||||||
| Long-term obligations, less current portion | Long-term obligations, less current portion | 893 | 1,786 | 3,214 | 4,286 | 6,071 | Long-term obligations, less current portion | 28,675 | 893 | 1,786 | 3,214 | 4,286 | |||||||||||||||
| PER SHARE DATA | PER SHARE DATA | PER SHARE DATA | |||||||||||||||||||||||||
| Net income per share | Net income per share | Net income per share | |||||||||||||||||||||||||
| Basic | Basic | $ 1.25 | $ .92 | $ 1.23 | $ 1.11 | $ 1.39 | Basic | $ | .81 | $ | 1.25 | $ | 0.92 | $ | 1.23 | $ | 1.11 | ||||||||||
| Diluted | Diluted | 1.25 | .92 | 1.23 | 1.11 | 1.38 | Diluted | 0.80 | 1.25 | 0.92 | 1.23 | 1.11 | |||||||||||||||
Dividends # | Dividends # | .44 | .45 | .48 | .42 | .50 | Dividends # | 0.44 | 0.44 | 0.45 | 0.48 | 0.42 | |||||||||||||||
| Shareholders’ equity (Basic) | 13.19 | 12.71 | 12.04 | 13.10 | 11.51 | ||||||||||||||||||||||
| Shareholders' equity (Basic) | Shareholders' equity (Basic) | 13.89 | 13.19 | 12.71 | 12.04 | 13.10 | |||||||||||||||||||||
| Average shares outstanding: | Basic | 6,251,535 | 6,245,057 | 6,225,068 | 6,220,928 | 6,216,931 | Basic | 6,259,139 | 6,251,535 | 6,245,057 | 6,225,068 | 6,220,928 | |||||||||||||||
| Diluted | 6,251,535 | 6,245,057 | 6,237,914 | 6,237,758 | 6,233,375 | ||||||||||||||||||||||
| Diluted | Diluted | 6,294,773 | 6,251,535 | 6,245,057 | 6,237,914 | 6,237,758 | |||||||||||||||||||||
# - Dividends for 2015 dividends include a $0.01 per share redemption for the termination of the 2008 Shareholder Rights Agreement. Dividends for 2014 dividends include a one-time extra payment of $0.04 per share distributed on 9/15/September 15, 2014. 2012 dividends include a one-time extra payment of $0.10 per share distributed on 12/14/2012.
Critical Accounting Policies and Estimates
The preparation of financial statements in accordance with accounting principles generally accepted in the United States ("U.S. GAAP") requires management to make judgments, estimates and assumptions regarding uncertainties that affect the reported amounts of assets and liabilities, the disclosure of contingent assets and liabilities and the reported amounts of revenues and expenses. Areas of uncertainty that require judgments, estimates and assumptions include items such as the accounting for derivatives; environmental matters; the testing of goodwill and other intangible assets for impairment; proceeds on assets to be sold; pensions and other postretirement benefits; and tax matters. Management uses historical experience and all available information to make its estimates and assumptions, but actual results will inevitably differ from the estimates and assumptions that are used to prepare the Company's financial statements at any given time. Despite these inherent limitations, management believes that Management's Discussion and Analysis of Financial Condition and Results of Operations and the financial statements and related footnotes provide a meaningful and fair presentation of the Company.
Management believes that the application of these estimates and assumptions on a consistent basis enables the Company to provide the users of the financial statements with useful and reliable information about the Company's operating results and financial condition.
Allowance for Doubtful Accounts
The Company maintains an allowance for doubtful accounts for estimated losses resulting from the inability of its customers to make required payments. The Company reviews the collectability of its receivables on an ongoing basis, taking into account a
17
combination of factors. The Company reviews potential problems, such as past due accounts, a bankruptcy filing or deterioration in the customer's financial condition, to ensure that the Company has adequately accrued for potential loss. Accounts are considered past due based on when payment was originally due. If a customer's situation changes, such as a bankruptcy or its creditworthiness, or there is a change in the current economic climate, the Company may modify its estimate of the allowance for doubtful accounts. The Company will write off accounts receivable after reasonable collection efforts have been made and the accounts are deemed uncollectible.
Inventory Reserve
Inventories are valued at the lower of cost or market and or net realizable value. Cost is determined by the last-in, first-out ("LIFO") method at the Company's U.S. facilities. Accordingly, a LIFO valuation reserve is calculated using the dollar value link chain method.
We review the net realizable value of inventory in detail on an ongoing basis, giving consideration to deterioration, obsolescence and other factors. Based on these assessments, we provide for an inventory reserve in the period in which an impairment is identified. The reserve fluctuates with market conditions, design cycles and other economic factors.
Goodwill and Other Intangible Assets
Intangible assets with finite useful lives are generally amortized on a straight-line basis over the periods benefited. Goodwill and other intangible assets with indefinite useful lives are not amortized. The Company performed its most recent qualitative assessment as of the end of fiscal 2017 and determined that it is more likely than not that no impairment of goodwill existed at the end of 2017. The Company will perform annual qualitative assessments in subsequent years as of the end of each fiscal year. Additionally, the Company will perform interim analysis whenever conditions warrant.
Pension and Other Postretirement Benefits
The amounts recognized in the consolidated financial statements related to pension and other postretirement benefits are determined from actuarial valuations. Inherent in these valuations are assumptions about such factors as expected return on plan assets, discount rates at which liabilities could be settled, rate of increase in future compensation levels, mortality rates, and trends in health insurance costs. These assumptions are reviewed annually and updated as required. In accordance with GAAP, actual results that differ from the assumptions are accumulated and amortized over future periods and, therefore, affect the expense recognized and obligations recorded in future periods.
The discount rate used is based on a single equivalent discount rate derived with the assistance of our actuaries by matching expected future benefit payments in each year to the corresponding spot rates from the Citigroup Pension Liability Yield Curve, comprised of high quality (rated AA or better) corporate bonds. Effective January 1, 2017, the Company elected to refine its approach for calculating its service and interest costs in future years by applying the specific spot rates along the selected yield curve to the relevant projected cash flows. The Company believes this method more precisely measures its obligations.
The expected long-term rate of return on assets is also developed with input from the Company's actuarial firms. We consider the Company's historical experience with pension fund asset performance, the current and expected allocation of our plan assets and expected long-term rates of return. The long-term rate-of-return assumption used for determining net periodic pension expense was 7.5% for 2017 and 8.0% for 2016. The Company reviews the long-term rate of return each year. Effective January 1, 2017, the Company lowered the long-term rate-of-return assumption to 7.5% to better reflect the expected returns of its current investment portfolio.
Future actual pension income and expense will depend on future investment performance, changes in future discount rates and various other factors related to the population of participants in the Company's pension plans.
The Company expects to make cash contributions of approximately $510,000 and $105,000 to our pension plans and other postretirement plan, respectively, in 2018. The Company may contribute $1,000,000 to $2,000,000 in 2018 to take advantage of the 34% corporate tax rate that would be applied to its 2017 federal tax return. The Company has until September 15, 2018, or until the Company files its 2017 federal tax return to make that determination and contribution.
In connection with our pension and other postretirement benefits, the Company reported a $0.6 million, ($1.1) million, and $3.5 million gain/(loss) (net of tax) on its Consolidated Statement of Comprehensive Income for Fiscal Years 2017, 2016 and 2015, respectively. While the main factor driving this gain/(loss) was the change in the discount rate during the applicable period, the Company froze the benefits of our salaried pension plan effective May 31, 2016, resulting in an approximate $2.5 million gain for this significant event.
18
Assumptions used to determine net periodic pension benefit cost for the fiscal years indicated were as follows:
2017 | 2016 | 2015 | ||||||||||
| Discount rate | 4.04% - 4.08 | % | 4.24%-4.28 | % | 3.90 | % | ||||||
| Expected return on plan assets | 7.5 | % | 8.0 | % | 8.0 | % | ||||||
| Rate of compensation increase | 0.0 | % | 3.25 | % | 3.25 | % | ||||||
Assumptions used to determine net periodic other postretirement benefit cost are the same as those assumptions used for the pension benefit cost, except that the rate of compensation is not applicable for other postretirement benefit cost.
The changes in assumptions had the following effect on the net periodic pension and other postretirement costs recorded in Other Comprehensive Income as follows:
| Year ended | ||||||||||||
| December 30 | December 31 | January 2 | ||||||||||
| 2017 | 2016 | 2016 | ||||||||||
| Discount rate | $ | (6,382,182 | ) | $ | (2,394,216 | ) | $ | 4,208,918 | ||||
| Mortality table | -- | -- | -- | |||||||||
| Additional recognition due to significant event | (496,899 | ) | 2,534,589 | -- | ||||||||
| Asset gain or loss | 6,043,672 | (4,358,254 | ) | (577,892 | ) | |||||||
| Amortization of: | ||||||||||||
| Unrecognized gain or loss | 1,153,885 | 1,610,942 | 1,947,102 | |||||||||
| Unrecognized prior service cost | 157,430 | 176,678 | 194,696 | |||||||||
| Other | 140,969 | 776,658 | (415,479 | ) | ||||||||
| Comprehensive income, before tax | 616,875 | (1,653,603 | ) | 5,357,345 | ||||||||
| Income tax | 62,632 | (543,297 | ) | 1,899,285 | ||||||||
| Comprehensive income, net of tax | $ | 554,243 | $ | (1,110,306 | ) | $ | 3,458,060 | |||||
The Plan has been investing a portion of the assets in long-term bonds in an effort to better match the impact of changes in interest rates on its assets and liabilities and thus reduce some of the volatility in Other Comprehensive Income. Please refer to Note 9 – Retirement Benefit Plans in Item 8 of this Form 10-K for additional disclosures concerning the Company's pension and other postretirement benefit plans.
Software Development Costs
Software development costs, including costs to develop software sold, leased, or otherwise marketed, that are incurred subsequent to the establishment of technological feasibility are capitalized if significant. Costs incurred during the application development stage for internal-use software are capitalized if significant. Capitalized software development costs are amortized using the straight-line amortization method over the estimated useful life of the applicable software. Such software development costs required to be capitalized have not been material to date.
Items Impacting Earnings
To supplement our consolidated financial statements presented in accordance with GAAP, we disclose certain non-GAAP financial measures, including adjusted net income and adjusted earnings per diluted share. Adjusted net income and adjusted earnings per diluted share exclude transaction-related expenses, a charge to costs of goods sold as a result of the impact of purchase accounting and environmental remediation costs. In addition, reported growth in the Industrial Hardware business segment excludes the results of the Velvac division, which was acquired on April 3, 2017. Furthermore, we show the impact of the one-time charge related to the Tax Cuts and Jobs Act of 2017. These measures are not in accordance with GAAP.
Management uses such measures to evaluate performance period over period, to analyze the underlying trends in our business, including our business segments, to assess our performance relative to our competitors and to establish operational goals and
19
forecasts that are used in allocating resources. These financial measures should not be considered in isolation from, or as a replacement for, GAAP financial measures.
We believe that presenting non-GAAP financial measures in addition to GAAP financial measures provides investors greater transparency to the information used by our management for its financial and operational decision-making. We further believe that providing this information better enables our investors to understand our operating performance and to evaluate the methodology used by management to evaluate and measure such performance.
| Reconciliation of expenses from GAAP to Non-GAAP financial measures | ||||||||||||||||
| For the Three and Twelve Months ended December 30, 2017 | ||||||||||||||||
| Three Months Ended | Twelve Months Ended | |||||||||||||||
| December 30, 2017 | December 30, 2017 | |||||||||||||||
| Net Income as reported per generally accepted accounting principles (GAAP) | $ | (168,769 | ) | $ | 5,045,255 | |||||||||||
| Earnings Per Share as reported under generally accepted accounting principles (GAAP): | ||||||||||||||||
| Basic | $ | (0.03 | ) | $ | 0.81 | |||||||||||
| Diluted | $ | (0.03 | ) | $ | 0.80 | |||||||||||
Adjustments for one-time expenses | ||||||||||||||||
| Charge to cost of goods sold relating to purchase accounting for the Velvac acquisition. | $ | 0 | $ | 1,187,668 | ||||||||||||
| Transaction expenses related to the Velvac acquisition | $ | 0 | $ | 869,000 | ||||||||||||
| Environmental remediation expense related to the Metal Products Segment | $ | 0 | $ | 380,000 | ||||||||||||
| Personnel expenses related to the Security Products Segment | $ | 0 | $ | 205,000 | ||||||||||||
| $ | 0 | $ | 2,641,668 | |||||||||||||
| Income Taxes Related to Expense Adjustment | $ | 0 | $ | 887,600 | ||||||||||||
| Income Taxes Related to Tax Cuts and Jobs Act | $ | 2,565,375 | $ | 2,565,372 | ||||||||||||
| Adjustment to Net Income (related to expenses and Tax Cuts and Jobs Act); (Non-GAAP) | $ | 2,396,606 | $ | 9,364,695 | ||||||||||||
| Adjustment to Earnings per share (related to expenses and Tax Cuts and Jobs Act); (Non-GAAP) | ||||||||||||||||
| Basic | $ | 0.38 | $ | 1.50 | ||||||||||||
| Diluted | $ | 0.38 | $ | 1.49 | ||||||||||||
20
Reconciliation of Industrial Hardware Segment net sales from GAAP to Non-GAAP financial measurer | ||||||||||||||||
| For the Three and Twelve Months ended December 30, 2017 and December 31, 2016 | ||||||||||||||||
| Three Months Ended | Three Months Ended | Twelve Months Ended | Twelve Months Ended | |||||||||||||
| December 30, 2017 | December 31, 2016 | December 30, 2017 | December 30, 2016 | |||||||||||||
| Net sales Industrial Hardware Segment (GAAP) | $ | 31,772,577 | $ | 15,369,767 | $ | 115,273,233 | $ | 61,058,871 | ||||||||
| Percent change (GAAP) | 107 | % | 89 | % | ||||||||||||
| Net sales Velvac | $ | 15,487,191 | $ | 0 | $ | 47,313,216 | $ | 0 | ||||||||
| Net sales Industrial Hardware Segment (excluding Velvac); (Non-GAAP) | $ | 16,285,386 | $ | 15,369,767 | $ | 67,960,017 | $ | 61,058,871 | ||||||||
| Percent change (excluding Velvac); (Non-GAAP) | 6 | % | 11 | % | ||||||||||||
| Use of Non-GAAP Financial Measures | ||||||||||||||||
| ITEM 7 |
| Summary |
The Company anticipates solid growth in 2015. A strong U.S. dollar benefited margins along with cost reduction including the freezingsales and earnings in fiscal 2018 as a result of the salaried pension plan benefitedacquisition of Velvac and our investments in Illinois Lock and new product development. We expect to start seeing returns on our investments in Road-iQ in the second half of the year. We believe that sales and earnings will also benefit from strong demand in 2016 versus 2015. In addition, 2015 included expenses associated with a proxy contest costing ($0.21) per diluted share.several of our core markets, including Class 8 trucks and recreational vehicles. A reduction in the Company's taxes will also contribute to earnings growth.
21
Fourth Quarter 20162017 Compared to Fourth Quarter 20152016
The following table shows, for the fourth quarter of 20162017 and 2015,2016, selected line items from the consolidated statements of income as a percentage of net sales, by segment.
| 2016 Fourth Quarter | 2017 Fourth Quarter | ||||||||||||||||||||||||||
| Industrial | Security | Metal | Industrial | Security | Metal | ||||||||||||||||||||||
| Hardware | Products | Products | Total | Hardware | Products | Products | Total | ||||||||||||||||||||
| Net sales | 100.0 | % | 100.0 | % | 100.0 | % | 100.0 | % | 100.0 | % | 100.0 | % | 100.0 | % | 100.0 | % | |||||||||||
| Cost of products sold | 67.3 | % | 69.4 | % | 76.0 | % | 69.5 | % | 73.2 | % | 67.3 | % | 93.2 | % | 74.4 | % | |||||||||||
| Gross margin | 32.7 | % | 30.6 | % | 24.0 | % | 30.5 | % | 26.8 | % | 32.7 | % | 6.8 | % | 25.6 | % | |||||||||||
| Engineering expense | 3.1 | % | 3.1 | % | -- | % | 2.7 | % | |||||||||||||||||||
| Selling and administrative expense | 20.2 | % | 22.1 | % | 9.8 | % | 19.4 | % | 16.6 | % | 17.3 | % | 7.8 | % | 15.5 | % | |||||||||||
| Operating profit | 12.5 | % | 8.5 | % | 14.2 | % | 11.1 | % | 7.1 | % | 12.3 | % | -1.0 | % | 7.4 | % | |||||||||||
| 2015 Fourth Quarter | 2016 Fourth Quarter | ||||||||||||||||||||||||||
| Industrial | Security | Metal | Industrial | Security | Metal | ||||||||||||||||||||||
| Hardware | Products | Products | Total | Hardware | Products | Products | Total | ||||||||||||||||||||
| Net sales | 100.0 | % | 100.0 | % | 100.0 | % | 100.0 | % | 100.0 | % | 100.0 | % | 100.0 | % | 100.0 | % | |||||||||||
| Cost of products sold | 75.1 | % | 71.5 | % | 90.5 | % | 76.5 | % | 67.3 | % | 66.2 | % | 76.0 | % | 68.2 | % | |||||||||||
| Gross margin | 24.9 | % | 28.5 | % | 9.5 | % | 23.5 | % | 32.7 | % | 33.8 | % | 24.0 | % | 31.8 | % | |||||||||||
| Engineering expense | 0.9 | % | 3.2 | % | -- | % | 1.7 | % | |||||||||||||||||||
| Selling and administrative expense | 16.9 | % | 20.0 | % | 9.1 | % | 16.7 | % | 19.3 | % | 22.1 | % | 9.8 | % | 19.0 | % | |||||||||||
| Operating profit | 8.0 | % | 8.5 | % | 0.4 | % | 6.8 | % | 12.5 | % | 8.5 | % | 14.2 | % | 11.1 | % | |||||||||||
The following table shows the amount of change from the fourth quarter of 20152016 to the fourth quarter of 20162017 in sales, cost of products sold, gross margin, selling and administrative expenses and operating profit, by segment (dollars in thousands).
| Industrial | Security | Metal | ||||||||||||||
| Hardware | Products | Products | Total | |||||||||||||
| Net sales | $ | 16,403 | $ | 1,212 | $ | 2,383 | $ | 19,998 | ||||||||
| Volume | 101.5 | % | 6.6 | % | 30.2 | % | 53.0 | % | ||||||||
| Prices | -0.7 | % | 0.3 | % | 2.4 | % | 0.2 | % | ||||||||
| New Products | 5.9 | % | 2.0 | % | 12.9 | % | 5.4 | % | ||||||||
| 106.7 | % | 8.9 | % | 45.5 | % | 58.6 | % | |||||||||
| Cost of products sold | $ | 12,918 | $ | 969 | $ | 3,127 | $ | 17,014 | ||||||||
| 124.8 | % | 10.8 | % | 78.5 | % | 73.1 | % | |||||||||
| Gross margin | $ | 3,485 | $ | 243 | $ | (744 | ) | $ | 2,984 | |||||||
| 69.4 | % | 5.3 | % | -59.0 | % | 27.5 | % | |||||||||
| Engineering expense | $ | 863 | $ | 20 | $ | -- | $ | 883 | ||||||||
| 654.2 | % | 4.5 | % | % | 153.1 | % | ||||||||||
| Selling and administrative expenses | $ | 2,287 | $ | (448 | ) | $ | 81 | $ | 1,920 | |||||||
| 77.0 | % | -15.0 | % | 16.1 | % | 29.6 | % | |||||||||
| Operating profit | $ | 335 | $ | 671 | $ | (825 | ) | $ | 181 | |||||||
| 17.5 | % | 58.9 | % | -110.4 | % | 4.7 | % | |||||||||
| Industrial | Security | Metal | |||||||||||
| Hardware | Products | Products | Total | ||||||||||
| Net sales | $ | 265 | $ | 397 | $ | (931 | ) | $ | (269 | ) | |||
| Volume | -10.5 | % | -0.2 | % | -16.3 | % | -7.6 | % | |||||
| Prices | -0.6 | % | -0.7 | % | 0.0 | % | -0.5 | % | |||||
| New Products | 12.8 | % | 3.9 | % | 1.2 | % | 7.3 | % | |||||
| 1.8 | % | 3.0 | % | -15.1 | % | -0.8 | % | ||||||
| Cost of products sold | $ | (988 | ) | $ | 6 | $ | (1,605 | ) | $ | (2,587 | ) | ||
| -8.7 | % | .1 | % | -28.7 | % | -9.8 | % | ||||||
| Gross margin | $ | 1,253 | $ | 391 | $ | 674 | $ | 2,318 | |||||
| 33.3 | % | 10.4 | % | 115.0 | % | 28.6 | % | ||||||
| Selling and administrative expenses | $ | 541 | $ | 373 | $ | (51 | ) | $ | 863 | ||||
| 21.1 | % | 14.2 | % | -9.0 | % | 15.0 | % | ||||||
| Operating profit | $ | 712 | $ | 18 | $ | 725 | $ | 1,455 | |||||
| 59.3 | % | 1.6 | % | 3,117 | % | 61.9 | % | ||||||
22
Net sales in the fourth quarter of 2016 decreased less than 1%2017 increased 59% to $34.1$54.1 million from $34.4$34.1 million a year earlier. Sales growth reflects the acquisition of Velvac, which closed on April 3, 2017, as well as organic growth of approximately 13% in the fourth quarter of 2017, compared to the same period in 2016. Sales increased in the Industrial Hardware business segment by 2%107% and, excluding Velvac, increased 6% as compared to the fourth quarter sales on 2015.in 2016 a result of strong sales growth to Class 8 Trucks, service bodies and bus customers. Sales increased 13% for of new product sales ofproducts contributed 6% and included tumbler paddles, handle assemblies, latch brackets and lightweight composite panels for electronic smartboards, which was offset by decreases in sales of our lightweight composite panels materialthe class 8 trucking, off highway and industrial customers. Sales for the Class 8 truck market by 11%. Security Products business segment sales infor the fourth quarter of 2017 increased by 3%9% compared to the fourth quarter of 2015. Contributing to this increase was a 49% increase2016 as the result of increased sales volume from our investment in sales fromgrowth in Illinois Lock and Argo EMS. Sales for the fourth quarter of 2016 in our electronic circuit board assembly and lock products sold in both domestic and international markets. The Metal Products business segment sales declined 15%increased 45% from sales in the fourth quarter of 20152016 as a result mainly fromof a declineresurgence in sales to mining customers and diversification to other industrial casting sales
Cost of products sold in the fourth quarter decreased $2.6increased $17.0 million or 10%73% from 20152016 to 2016. 2017. The increase in the cost of products sold in the four quarter of 2017 when compared to the respective corresponding prior year period primarily reflects cost of products sold attributable to the Velvac Acquisition.
The most significant factors resulting in changes in cost of products sold in the fourth quarter of 20162017 compared to 20152016 fourth quarter included:
| § |
| § | an increase of $3.6 million or 54% in payroll and payroll related |
| § |
| § |
| § |
| § |
| and an increase of |
Gross margin as a percentage of net sales for the fourth quarter of 20162017 was 31%26% compared to 24%32% in the fourth quarter of 2015.2016. The increasedecrease is primarily the result of product mix, material cost increases and the changesVelvac Acquisition noted above.
Engineering expenses as a percentage of sales increased in costthe fourth quarter of products sold enumerated above,2017 to 3% from 2% in the mixfourth quarter of products produced, and higher production capacity being consumed in our Metals Products segment.2016. This increase was primarily the result of the Velvac Acquisition.
Selling and administrative expenses for the fourth quarter of 20162017 increased $0.9$1.9 million or 15%30% compared to the prior year quarter. The most significant factor resulting in changes in selling and administrative expenses in the fourth quarter of 20162017 compared to 20152016 fourth quarter was:
| § | an increase of |
| § | an increase of $0.2 million or |
| § |
| and a decrease of |
Net income (loss) for the fourth quarter of 2016 increased 53%2017 decreased to ($0.2) million or ($0.03) per diluted share from $2.6 million (oror $.42 per diluted share) from $1.7share for the comparable period in 2016. In the fourth quarter of 2017, we incurred an incremental one-time charge of $2.5 million, (or $.28or $0.41 per fully diluted share)share, consisting of a year earlier.
23
| 2016 | 2015 | 2014 | |||
| Discount rate | 4.24% - 4.28% | 3.90% | 4.80% | ||
| Expected return on plan assets | 8.0% | 8.0% | 8.0% | ||
| Rate of compensation increase | 3.25% | 3.25% | 3.25% |
| Year ended | ||||||||||
| December 31 | January 2 | January 3 | ||||||||
| 2016 | 2016 | 2015 | ||||||||
| Discount rate | $ | (2,394,216 | ) | $ | 4,208,918 | $ | (11,046,554 | ) | ||
| Mortality table | -- | -- | (2,883,430 | ) | ||||||
| Additional recognition due to significant event | 2,534,589 | -- | -- | |||||||
| Asset gain or loss | (4,358,254 | ) | (577,892 | ) | (257,073 | ) | ||||
| Amortization of: | ||||||||||
| Unrecognized gain or loss | 1,610,942 | 1,947,102 | 944,130 | |||||||
| Unrecognized prior service cost | 176,678 | 194,696 | 194,697 | |||||||
| Other | 776,658 | (415,479 | ) | (3,105,095 | ) | |||||
| Comprehensive income, before tax | (1,653,603 | ) | 5,357,345 | (16,153,325 | ) | |||||
| Income tax | (543,297 | ) | 1,899,285 | (5,767,236 | ) | |||||
| Comprehensive income, net of tax | $ | (1,110,306 | ) | $ | 3,458,060 | $ | (10,386,089 | ) | ||
RESULTS OF OPERATIONS
Fiscal 2016Year 2017 Compared to Fiscal 2015Year 2016
The following table shows, for 2016fiscal year 2017 and 2015,fiscal year 2016, selected line items from the consolidated statements of income as a percentage of net sales, by segment.
| Industrial | Security | Metal | ||||||||||||||
| Hardware | Products | Products | Total | |||||||||||||
| Fiscal Year 2017 | ||||||||||||||||
| Net sales | 100.0 | % | 100.0 | % | 100.0 | % | 100.0 | % | ||||||||
| Cost of products sold | 76.0 | % | 69.2 | % | 87.1 | % | 75.5 | % | ||||||||
| Gross margin | 24.0 | % | 30.8 | % | 12.9 | % | 24.5 | % | ||||||||
| Engineering | 3.3 | % | 3.0 | % | -- | % | 2.8 | % | ||||||||
| Selling and administrative expense | 16.3 | % | 17.8 | % | 9.1 | % | 15.7 | % | ||||||||
| Operating profit | 4.4 | % | 10.0 | % | 3.8 | % | 6.0 | % | ||||||||
| Fiscal Year 2016 | ||||||||||||||||
| Net sales | 100.0 | % | 100.0 | % | 100.0 | % | 100.0 | % | ||||||||
| Cost of products sold | 72.8 | % | 68.5 | % | 91.4 | % | 73.6 | % | ||||||||
| Gross margin | 27.2 | % | 31.5 | % | 8.6 | % | 26.4 | % | ||||||||
| Engineering | 0.8 | % | 3.6 | % | -- | % | 1.9 | % | ||||||||
| Selling and administrative expense | 17.1 | % | 18.0 | % | 9.8 | % | 16.4 | % | ||||||||
| Operating profit | 9.3 | % | 9.9 | % | -1.2 | % | 8.1 | % | ||||||||
| Industrial | Security | Metal | ||||||||
| Hardware | Products | Products | Total | |||||||
| 2016 | ||||||||||
| Net sales | 100.0 | % | 100.0 | % | 100.0 | % | 100.0 | % | ||
| Cost of products sold | 72.8 | % | 72.0 | % | 91.4 | % | 75.1 | % | ||
| Gross margin | 27.2 | % | 28.0 | % | 8.6 | % | 24.9 | % | ||
| Selling and administrative expense | 17.9 | % | 18.1 | % | 9.8 | % | 16.8 | % | ||
| Operating profit | 9.3 | % | 9.9 | % | -1.2 | % | 8.1 | % | ||
| 2015 | ||||||||||
| Net sales | 100.0 | % | 100.0 | % | 100.0 | % | 100.0 | % | ||
| Cost of products sold | 74.8 | % | 74.4 | % | 90.8 | % | 77.6 | % | ||
| Gross margin | 25.2 | % | 25.6 | % | 9.2 | % | 22.4 | % | ||
| Selling and administrative expense | 18.2 | % | 18.9 | % | 9.5 | % | 16.8 | % | ||
| Operating profit | 7.0 | % | 6.7 | % | -0.3 | % | 5.6 | % | ||
The following table shows the amount of change from fiscal year 2016 to fiscal year 2017 in sales, cost of products sold, gross margin, selling and administrative expenses, and operating profit, by segment (dollars in thousands):
| Industrial | Security | Metal | ||||||||||||||
| Hardware | Products | Products | Total | |||||||||||||
| Net sales | $ | 54,214 | $ | 3,722 | $ | 8,695 | $ | 66,631 | ||||||||
| Volume | 83.5 | % | 4.8 | % | 29.8 | % | 43.2 | % | ||||||||
| Prices | -0.4 | % | -- | % | 2.7 | % | 0.2 | % | ||||||||
| New Products | 5.7 | % | 1.7 | % | 12.6 | % | 5.1 | % | ||||||||
| 88.8 | % | 6.5 | % | 45.1 | % | 48.5 | % | |||||||||
| Cost of products sold | $ | 43,183 | $ | 2,975 | $ | 6,749 | $ | 52,907 | ||||||||
| 97.1 | % | 7.6 | % | 38.3 | % | 52.2 | % | |||||||||
| Gross margin | $ | 11,031 | $ | 747 | $ | 1,946 | $ | 13,724 | ||||||||
| 66.5 | % | 4.1 | % | 116.7 | % | 37.8 | % | |||||||||
| Engineering expenses | $ | 3,264 | $ | (209 | ) | $ | -- | $ | 3,055 | |||||||
| 633.9 | % | -10.2 | % | % | 118.9 | % | ||||||||||
| Selling and administrative expenses | $ | 8,325 | $ | 514 | $ | 670 | $ | 9,509 | ||||||||
| 80.0 | % | 5.0 | % | 35.4 | % | 42.0 | % | |||||||||
| Operating profit | $ | (558 | ) | $ | 442 | $ | 1,276 | $ | 1,160 | |||||||
| -9.8 | % | 7.8 | % | 566.8 | % | 10.4 | % | |||||||||
24
Summary
Net sales for 2017 increased 48% to $204.2 million from $137.6 million in 2016. Sales growth reflects the acquisition of Velvac, which closed on April 3, 2017, as well as organic growth of approximately 14% in 2017. Net sales in the Industrial Hardware segment increased approximately 89% in 2017, and excluding Velvac, sales increased 11% as compared to the same period in 2016. Sales of existing products increased 83% in 2017 primarily as the result of the Velvac Acquisition, as well as strong sales growth from our existing Class 8 truck, service bodies and bus customers. Net sales in the Security Products segment increased approximately 7% in 2017 primary a result of increased sales volume from our investment in growth at our Illinois Lock and Argo EMS divisions. The Metal Products business segment's net sales increased approximately 45% in 2017 compared to the prior year period. Sales volume increased 34% in mine roof products sold to our customers as a result of a resurgence in the coal mining industry due to higher natural gas prices and an easing of regulatory restriction in the coal mining industry. Net sales also increased 127% in industrial casting products through our continued efforts to diversify away from mining products. Net income for 2017 decreased 35% to $5.0 million, or $0.80 per diluted share, from $7.8 million, or $1.25 per diluted share, in 2016. The decrease in net income was primarily the result of the recognition of one-time charges of $2.5 million related to the enactment of the Tax Cuts and Jobs Act in 2017 and $1.8 million, net of tax expenses, related to the Velvac Acquisition, environmental remediation expenses and personnel related expenses. Excluding these one-time charges, we generated adjusted earnings of $1.49 per fully diluted share in 2017. Adjusted earnings per share is a non-GAAP measure.
Industrial Hardware Business Segment
Net sales in the Industrial Hardware business segment increased 89% in 2017 from the 2016 level. Sales of existing products increased 83% in 2017 as the result of the Velvac Acquisition. Excluding Velvac, the Industrial Hardware business segment had strong organic sales growth in Class 8 trucks, service bodies and bus customers, which contributed 11% in increased sales volume in 2017, whereas new product sales of tumbler paddles, handle assemblies, latch brackets and composite panels contributed 6% in 2017, each as compared to 2016. From the date on which the acquisition of Velvac closed, April 3, 2017, to December 30, 2017, Velvac sales were $ 47.3 million and earnings were $(0.1) million.
Cost of products sold for the Industrial Hardware segment increased $43.2 million or 97% from 2016 to 2017. The increase in the cost of products sold in the annual period of 2017 when compared to the annual period of 2016 primarily reflects cost of products sold attributable to the Velvac Acquisition.
The most significant factors resulting in changes in cost of products sold in 2017 compared to 2016 included:
| § | an increase of $30.6 million or 119% in raw materials, with Velvac representing $26.0 million of such increase; |
| § | an increase of $4.8 million or 38% in costs for payroll and payroll related charges, with Velvac representing $4.3 million of such increase; |
| § | an increase of $4.3 million in freight costs, with Velvac representing the total increase; |
| § | an increase of $0.9 million or 183% in rent expense, with Velvac representing the total increase; |
| § | an increase of $0.5 million or 205% in foreign currency translation costs; |
| § | an increase of $0.3 million or 127% in scrap costs, with Velvac representing the total increase; |
| § | an increase of $0.3 million or 29% in depreciation charges, with Velvac representing the total increase; |
| § | an increase of $0.3 million or 38% in supplies and tools expense, with Velvac representing $0.2 million of the increase; |
| § | an increase of $0.2 million or 53% for repairs and maintenance; |
| § | an increase of $0.2 million or 42% in utilities expenses, with Velvac representing the total increase; |
| § | an increase of $0.2 million in freight on supplies, with Velvac representing the total increase; and |
| § | an increase of $0.6 million in other expenses. |
Gross margin as a percentage of sales in the Industrial Hardware business segment decreased to 24% in 2017 from 27% in 2016. The decrease reflects the mix of products produced and the changes in cost of products sold. Also affecting gross margin in fiscal 2017 was a one-time change to cost of goods sold, for $1.2 million, as a result of the impact of the purchase accounting in connection with the Velvac acquisition. In addition, rising prices in raw material such as stainless steel, cold roll steel, hot rolled steel and zinc increased from 10% on stainless steel to 37% on zinc materials used in our products during 2017. As a result of these cost increases, our margins were negatively affected and could not be fully recovered in price increases to customers or offset through operational improvements.
Engineering expenses as a percentage of sales increased in 2017 to 3% from 0.8% in 2016. This increase was primarily the result of the Velvac Acquisition.
25
Selling and administrative expenses in the Industrial Hardware business segment increased $8.3 million or 80% in 2017 from the 2016 level. The increase in selling and administrative expenses in the annual period of 2017 when compared to the prior year primarily reflects expenses attributable to the Velvac Acquisition.
The most significant factors resulting in changes in selling and administrative expenses in the Industrial Hardware business segment in 2017 compared to 2016 included:
| § | an increase of $5.8 million or 74% in payroll and payroll related charges, with Velvac representing $3.4 million of the increase; |
| § | an increase of $1.0 million in commissions and royalty costs, with Velvac representing the total increase; |
| § | an increase of $0.6 million or 154% in business travel costs, with Velvac representing the total increase; |
| § | an increase of $0.7 million in depreciation and amortization expenses, with Velvac representing $0.4 million of the increase; and |
| § | an increase of $0.2 million in advertising expenses, with Velvac representing the total increase. |
Security Products Business Segment
Net sales in the Security Products business segment increased 7% in 2017 from the 2016 level. The increase in sales in 2017 in the Security Products segment compared to the prior year period was a result of our investment in growth in Illinois Lock and Argo EMS. New product sales included a zinc branded puck lock, a spring return lock, a push button lock and a mini cam lock.
Cost of products sold for the Security Products business segment increased $3.0 million or 8% from 2016 to 2017. The most significant factors resulting in changes in cost of products sold in 2017 compared to 2016 included:
| § | an increase of $1.7 million or 7% in raw materials; |
| § | an increase of $0.4 million or 4% in payroll and payroll related charges; |
| § | an increase of $0.5 million in foreign exchange costs; |
| § | an increase of $0.2 million or 12% in other shipping expenses; and |
| § | an increase of $0.1 million or 11% in supplies and tools. |
Gross margin as a percentage of sales in the Security Products business segment increased to 31% in 2017 from 28% in 2016. The increase reflects the mix of products sold and higher utilization of fixed charges on increased volume. Our margins were negatively impacted by higher material costs, primarily in zinc, which was up 37%, and brass, which was up 23%, from the prior year.
Engineering expenses as a percentage of sales decreased to 3% in 2017 from 4% in 2016.
Selling and administrative expenses in the Security Products business segment increased by $0.5 million or 5% in 2017 from the 2016 level. The most significant factors resulting in changes in selling and administrative expenses in the Security Products segment in 2017 compared to 2016 included:
| § | an increase of $0.3 million or 4% in payroll and payroll related charges; and |
| § | an increase of $0.2 million or 12% in other administration expenses. |
Metal Products Business Segment
Net sales in the Metal Products business segment increased 45% in 2017 compared to the prior year period. Sales volume increased 34% in mine roof products sold to our customers a result of a resurgence in the coal mining industry due to higher natural gas prices and an easing of regulatory restriction in the coal mining industry. Net sales also increased 127% in industrial casting products through our continued efforts to diversify away from mining products.
Cost of products sold for the Metal Products segment increased $6.8 million or 38% from 2016 to 2017. The most significant factors resulting in changes in cost of products sold in 2017 compared to 2016 included:
| § | an increase of $2.1 million or 33% in costs for payroll and payroll related charges; |
| § | an increase of $1.5 million or 29% in raw materials; |
| § | an increase of $1.8 million or 103% for supplies and tools; |
26
| § | an increase of $0.5 million or 44% for utility costs; |
| § | an increase of $0.2 million in other expenses; and |
| § | an increase of $0.1 million or 41% in other shipping expenses. |
Gross margin as a percentage of sales in the Metal Products business segment increased to 13% in 2017 from 9% in 2016. The increase reflects the mix of products produced and the utilization of productive capacity. Our margins were negatively impacted by a 48% increase in raw material scrap iron prices. Not all increases in the prices of raw materials could be recovered from price increases to customers.
Selling and administrative expenses in the Metal Products segment increased $0.7 million or 35% from 2016 to 2017. The most significant factors, resulting in changes in selling and administrative expenses in the Metal Products business segment in 2017 compared to 2016 were:
| § | an increase of $0.5 million or 38% in payroll and payroll related charges; and |
| § | a $0.4 million environmental charge. |
Other Items
The following table shows the amount of change from 2016 to 2017 in other items (dollars in thousands):
| Amount | % | |||||||
| Interest expense | $ | 855 | 704 | % | ||||
| Other income | $ | (54 | ) | -26 | % | |||
| Income taxes | $ | 2,972 | 86 | % | ||||
Interest expense increased from 2016 in 2017 due to the increased level of debt in 2017 that was incurred in connection with the Velvac Acquisition.
Other income in 2017 decreased from the 2016 level. Other income in 2017 included the recognition of a gain on marketable securities of $72,658. In 2016, other income included $144,231 as a result of Argo EMS not meeting the sales goals for the second year earn-out period.
The effective tax rate for 2017 was 56% compared to the 2016 effective tax rate, which was 31%. The effective tax rate for 2017 was higher than the prior year period due to the enactment of the Tax Cuts and Jobs Act (the "Jobs Act") in 2017 and its impact on foreign repatriation tax.
Total income taxes paid were $4,104,701 in 2017, $3,493,558 in 2016 and $2,348,865 in 2015.
The Jobs Act resulted in significant changes to U.S. corporate income tax laws by, among other provisions, reducing the maximum U.S. corporate income tax rate from 35% to 21% starting in 2018, and creating a territorial tax system with a one-time mandatory tax on previously deferred foreign earnings of U.S. subsidiaries. During the year ending December 30, 2017, the Company recognized deferred income tax expense of $531,307 as a result of the re-measurement of deferred tax assets and liabilities to the new lower statutory rate of 21%.
Due to the passage of the Act, U.S. income taxes have been provided on the undistributed earnings of foreign subsidiaries ($17,153,163 at December 30, 2017), as well as the associated withholding taxes from the foreign countries. The amount of taxes associated with the changes to the provisions of the tax law regarding foreign earnings is $2,034,065. Foreign subsidiaries that were previously treated as corporations for U.S. income tax purposes will generally no longer be taxed on their foreign source income by the U.S. federal government. Of the $2,034,065 in taxes associated with the new treatment of foreign earnings under the Jobs Act, $861,964 are associated with the withholding taxes assessed by the foreign countries, net of the applicable U.S. tax credits, and $1,172,101 are associated with the deemed repatriation of earnings held in foreign corporations. The Company has made an election to pay the $1,172,101 in taxes on an installment basis over eight years with payments of $93,768 becoming due in each of the years 2018 to 2022; one payment of $175,815 becoming due in 2023; one payment of $234,420 becoming due in 2024; and a final payment of $293,026 becoming due in 2025.
27
Fiscal Year 2016 Compared to Fiscal Year 2015
The following table shows, for fiscal year 2016 and fiscal year 2015, selected line items from the consolidated statements of income as a percentage of net sales, by business segment.
| Industrial | Security | Metal | ||||||||||||||
| Hardware | Products | Products | Total | |||||||||||||
| Fiscal Year 2016 | ||||||||||||||||
| Net sales | 100.0 | % | 100.0 | % | 100.0 | % | 100.0 | % | ||||||||
| Cost of products sold | 72.8 | % | 72.0 | % | 91.4 | % | 75.1 | % | ||||||||
| Gross margin | 27.2 | % | 28.0 | % | 8.6 | % | 24.9 | % | ||||||||
| Selling and administrative expense | 17.9 | % | 18.1 | % | 9.8 | % | 16.8 | % | ||||||||
| Operating profit | 9.3 | % | 9.9 | % | -1.2 | % | 8.1 | % | ||||||||
| Fiscal Year 2015 | ||||||||||||||||
| Net sales | 100.0 | % | 100.0 | % | 100.0 | % | 100.0 | % | ||||||||
| Cost of products sold | 74.8 | % | 74.4 | % | 90.8 | % | 77.6 | % | ||||||||
| Gross margin | 25.2 | % | 25.6 | % | 9.2 | % | 22.4 | % | ||||||||
| Selling and administrative expense | 18.2 | % | 18.9 | % | 9.5 | % | 16.8 | % | ||||||||
| Operating profit | 7.0 | % | 6.7 | % | -0.3 | % | 5.6 | % | ||||||||
The following table shows the amount of change from 2015 to 2016 in sales, cost of products sold, gross margin, selling and administrative expenses, and operating profit, by segment (dollars in thousands):
| Industrial | Security | Metal | ||||||||||||||
| Hardware | Products | Products | Total | |||||||||||||
| Net sales | $ | (280 | ) | $ | 657 | $ | (7,336 | ) | $ | (6,959 | ) | |||||
| Volume | -8.1 | % | 0.4 | % | -28.5 | % | -8.5 | % | ||||||||
| Prices | -0.6 | % | -0.4 | % | 0.0 | % | -0.4 | % | ||||||||
| New Products | 8.2 | % | 1.1 | % | 0.9 | % | 4.1 | % | ||||||||
| -0.5 | % | 1.2 | % | -27.5 | % | -4.8 | % | |||||||||
| Cost of products sold | $ | (1,422 | ) | $ | (899 | ) | $ | (6,550 | ) | $ | (8,871 | ) | ||||
| -3.1 | % | -2.1 | % | -27.1 | % | -7.9 | % | |||||||||
| Gross margin | $ | 1,142 | $ | 1,556 | $ | (786 | ) | $ | 1,912 | |||||||
| Selling and administrative expenses | $ | (228 | ) | $ | (323 | ) | $ | (645 | ) | $ | (1,196 | ) | ||||
| 2.0 | % | -3.0 | % | -25.4 | % | -4.9 | % | |||||||||
| Operating profit | $ | 1,370 | $ | 1,879 | $ | (141 | ) | $ | 3,108 | |||||||
| 31.7 | % | 49.5 | % | -166.3 | % | 38.7 | % | |||||||||
28
Industrial Hardware Business Segment
Net sales in the Industrial Hardware business segment decreased less than 1% in 2016 from the 2015 level. Sales of existing product decreased 8% in 2016 as thea result of a decrease in sales of our lightweight composite material for the Class 8 truck market. This decrease was offset by an 8% increase in the new product sales of lightweight composite panels for electronic smartboards.
Cost of products sold for the Industrial Hardware business segment decreased $1.4 million or 3% from 2015 to 2016. The most significant factors resulting in changes in cost of products sold in 2016 compared to 2015 included:
| § | a decrease of $0.9 million or 4% in raw materials; |
| § | a decrease of $0.6 million or 4% in costs for payroll and payroll related charges; |
| § | a decrease of $0.1 million or 9% for supplies and tools; |
| § | a decrease of $0.1 million or 8% in depreciation charges; |
| § | a decrease of $0.2 million or 94% in miscellaneous income; and |
| § |
Gross margin of 27% for 2016 of 27% increased as compared to 25% in the 2015 period for the Industrial Hardware business segment. The increase reflects the mix of products produced, the changes in cost of products sold discussed above and lower utilization of our production facilities in both Kelowna, British Columbia, Canada and North Carolina.
Selling and administrative expenses in the Industrial Hardware segment decreased $0.2 million or 2% from 2015 to 2016. The most significant factors resulting in changes in selling and administrative expenses in the Industrial Hardware segment in 2016 compared to 2015 included:
| § | a decrease of $0.3 million or 4% in payroll and payroll related charges; and |
| § |
Security Products Business Segment
Net sales in the Security Products business segment increased 1% in 2016 from the 2015 level. The increase in sales in 2016 in the Security Products business segment when compared to the prior year period was primarily due to a combination of primarily volume sales and new product sales in the laundry industry (partially(which was partially offset by a decrease in the vehicle lock industry). Sales volume increased in the smart card and flash cash products sold in the international laundry market. New products included high security equipment for add value card systems in the laundry industry and also, new product sales in the storage, locksmith and industrial distribution and electronic locking enclosures industries. New product sales included a zinc branded puck lock, a spring return lock, a push button lock and a mini cam lock.
Cost of products sold for the Security Products segment decreased $0.9 million or 2% from 2015 to 2016. The most significant factors resulting in changes in cost of products sold in 2016 compared to 2015 included:
| § | a decrease of $0.4 million or 2% in raw materials; |
| § | a decrease of $0.9 million or 11% in payroll and payroll related charges; |
| § | an increase of $0.2 million or 57% in foreign exchange gains; |
| § | an increase of $0.1 million or 12% in engineering costs; |
| § | an increase of $0.1 million or 8% in supplies and tools; and |
| § |
Gross margin as a percentage of sales in the Security Products business segment increased to 28% in 2016 from 26% in 2015 to 28% in 2016.2015. The increase reflects the mix of products produced and the changes in cost of products sold, as discussed above.
Selling and administrative expenses in the Security Products segment decreased $0.3 million or 3% from 2015 to 2016. The most significant factors resulting in changes in selling and administrative expenses in the Security Products segment in 2016 compared to 2015 included:
| § | a decrease of $0.3 million or 4% in payroll and payroll related charges; |
| § | a decrease of $0.1 million or 278% in bad debt charges; |
| § | a decrease of $0.1 million or 21% in commissions and royalty expenses; and |
| § |
29
Metal Products Business Segment
Net sales in the Metal Products business segment decreased 28% in 2016 from the 2015 level. Sales of mine products decreased 26% and industrial casting products decreased 41% in 2016 compared to 2015. The decrease in sales of mining products was driven by lower demand for existing products compared to the prior year period primarily in the U.S. mining market where lower oil and natural gas prices, coupled with excessive coal inventories, have reduced demand for our products. U.S. coal production is expected to rise in 2017. NewOur new products, increased sales by 1%, consisting of tie plates for the rail industry and pipe fittings for the water, oil and gas industries.industries, resulted in an increase in sales of 1%. The Company is actively developing new customers in the industrial casting business and is close to producing several new products for the gas, water and energy industry.industries.
Cost of products sold for the Metal Products business segment decreased $6.6 million or 27% from 2015 to 2016. The most significant factors resulting in changes in cost of products sold in 2016 compared to 2015 included:
| § | a decrease of $3.8 million or 39% in |
| § | a decrease of $2.1 million or 61% for supplies and tools; |
| § | a decrease of $0.9 million or 53% in costs for maintenance and repair; |
| § | a decrease of $0.6 million or 34% for utility costs; |
| § | an increase of $0.8 million or 18% in raw materials; and |
| § |
Gross margin as a percentage of sales in the Metal Products business segment was approximately the same at 9% in both 20152016 and 2016.2015.
Selling and administrative expenses in the Metal Products segment decreased $0.6 million or 25% from 2015 to 2016. The most significant factorfactors resulting in changes in selling and administrative expenses in the Metal Products business segment in 2016 compared to 2015 was:were:
| § | a decrease of $0.5 million or 29% in payroll and payroll related charges; and |
| § |
Other Items
The following table shows the amount of change from 2015 to 2016 in other items (dollars in thousands):
| Amount | % | |||||||
| Interest expense | $ | (64 | ) | -35 | % | |||
| Other income | $ | 30 | 17 | % | ||||
| Income taxes | $ | 1,114 | 50 | % | ||||
Interest expense decreased from 2015 to 2016 due to the decreased level of debt in 2016.
Other income, which is not material to the financial statements, increased from 2015 to 2016 due to the Company recognizing $144,231 in income as a result of Argo EMS not meeting the sales goals for the 2ndsecond year earn-out period.
| Industrial | Security | Metal | ||||||||
| Hardware | Products | Products | Total | |||||||
| 2015 | ||||||||||
| Net sales | 100.0 | % | 100.0 | % | 100.0 | % | 100.0 | % | ||
| Cost of products sold | 74.8 | % | 74.4 | % | 90.8 | % | 77.6 | % | ||
| Gross margin | 25.2 | % | 25.6 | % | 9.2 | % | 22.4 | % | ||
| Selling and administrative expense | 18.2 | % | 18.9 | % | 9.5 | % | 16.8 | % | ||
| Operating profit | 7.0 | % | 6.7 | % | -0.3 | % | 5.6 | % | ||
| 2014 | ||||||||||
| Net sales | 100.0 | % | 100.0 | % | 100.0 | % | 100.0 | % | ||
| Cost of products sold | 74.4 | % | 74.9 | % | 84.6 | % | 76.9 | % | ||
| Gross margin | 25.6 | % | 25.1 | % | 15.4 | % | 23.1 | % | ||
| Selling and administrative expense | 17.0 | % | 16.9 | % | 7.5 | % | 14.8 | % | ||
| Operating profit | 8.6 | % | 8.2 | % | 7.9 | % | 8.3 | % | ||
| Industrial | Security | Metal | |||||||||||||||||
| Hardware | Products | Products | Total | ||||||||||||||||
| Net sales | $ | 2,673 | $ | 7,217 | $ | (6,147 | ) | $ | 3,743 | ||||||||||
| Volume | -6.7 | % | 3.0 | % | -20.3 | % | -6.4 | % | |||||||||||
| Prices | 0.2 | % | 0.2 | % | 0.0 | % | 0.1 | % | |||||||||||
| New Products | 11.1 | % | 11.4 | % | 1.5 | % | 9.0 | % | |||||||||||
| 4.6 | % | 14.6 | % | -18.8 | % | 2.7 | % | ||||||||||||
| Cost of products sold | $ | 2,275 | $ | 5,135 | $ | (3,562 | ) | $ | 3,848 | ||||||||||
| 5.2 | % | 13.9 | % | -12.8 | % | 3.6 | % | ||||||||||||
| Gross margin | $ | 398 | $ | 2,082 | $ | (2,585 | ) | $ | (105 | ) | |||||||||
| 2.6 | % | 16.8 | % | -51.3 | % | -0.3 | % | ||||||||||||
| Selling and administrative expenses | $ | 1,147 | $ | 2,343 | $ | 96 | $ | 3,586 | |||||||||||
| 11.5 | % | 28.1 | % | 3.9 | % | 17.3 | % | ||||||||||||
| Operating profit | $ | (750 | ) | $ | (260 | ) | $ | (2,681 | ) | $ | (3,691 | ) | |||||||
| -14.8 | % | -6.4 | % | -103.3 | % | -31.5 | % | ||||||||||||
| Amount | % | ||||||
| Interest expense | $ | (69 | ) | -27 | % | ||
| Other income | $ | 114 | 176 | % | |||
| Income taxes | $ | (1,573 | ) | -41 | % | ||
Liquidity and Sources of Capital
The Company’sCompany's financial position strengthened in 2016.2017. The primary source of the Company’sCompany's cash is earnings from operating activities adjusted for cash generated from or used for net working capital.capital and the term loan from People's Bank. The most significant recurring non-cash items included in net income are depreciation and amortization expense. Changes in working
30
capital fluctuate with the changes in operating activities. As sales increase, there generally is an increased need for working capital. Since increases in working capital reduce the Company’sCompany's cash, management attempts to keep the Company’sCompany's investment in net working capital at a reasonable level by closely monitoring inventory levels and matching production to expected market demand, keeping tight control over the collection of receivables and optimizing payment terms on its trade and other payables.
The Company is dependent on the continued demand for itsour products and subsequent collection of accounts receivable from itsour customers. The Company serves a broad base of customers and industries with a variety of products. As a result, any fluctuations in demand or payment from a particular industry or customer should not have a material impact on the Company’sCompany's sales and collection of receivables. Management expects that the Company’sCompany's foreseeable cash needs for operations, capital expenditures, debt service and dividend payments will continue to be met by the Company’sCompany's operating cash flows and available credit facility.
The following table shows key financial ratios at the end of each year:
| 2017 | 2016 | 2015 | ||||||||||
| Current ratio | 3.2 | 6.0 | 5.0 | |||||||||
| Average days' sales in accounts receivable | 46 | 49 | 47 | |||||||||
| Inventory turnover | 3.4 | 3.0 | 3.0 | |||||||||
| Ratio of working capital to sales | 33.7 | % | 47.1 | % | 41.6 | % | ||||||
| Total debt to shareholders' equity | 40.5 | % | 2.2 | % | 4.0 | % | ||||||
| 2016 | 2015 | 2014 | |||||
| Current ratio | 6.0 | 5.0 | 5.3 | ||||
| Average days’ sales in accounts receivable | 49 | 47 | 49 | ||||
| Inventory turnover | 3.0 | 3.0 | 3.1 | ||||
| Ratio of working capital to sales | 47.1 | % | 41.6 | % | 41.1 | % | |
| Total debt to shareholders’ equity | 2.2 | % | 4.0 | % | 5.7 | % |
The following table shows important liquidity measures as of the fiscal year-end balance sheet date for each of the preceding three years (in millions):
| 2017 | 2016 | 2015 | ||||||||||
| Cash and cash equivalents | ||||||||||||
| - Held in the United States | $ | 7.9 | $ | 11.2 | $ | 6.9 | ||||||
| - Held by foreign subsidiary | 14.4 | 11.5 | 10.9 | |||||||||
| 22.3 | 22.7 | 17.8 | ||||||||||
| Working capital | 68.8 | 64.8 | 60.1 | |||||||||
| Net cash provided by operating activities | 11.2 | 12.4 | 9.1 | |||||||||
Change in working capital impact on net cash (used)/provided by operating activities | 2.4 | (0.5 | ) | (2.0 | ) | |||||||
| Net cash used in investing activities | (44.7 | ) | (2.9 | ) | (2.5 | ) | ||||||
| Net cash (used in)/provided by financing activities | 30.7 | (4.2 | ) | (3.9 | ) | |||||||
| 2016 | 2015 | 2014 | |||||
| Cash and cash equivalents | |||||||
| - Held in the United States | $ | 11.2 | $ | 6.9 | $ | 5.6 | |
| - Held by foreign subsidiary | 11.5 | 10.9 | 10.2 | ||||
| 22.7 | 17.8 | 15.8 | |||||
| Working capital | 64.8 | 60.1 | 57.8 | ||||
| Net cash provided by operating activities | 12.4 | 9.1 | 9.3 | ||||
Change in working capital impact on net cash (used)/provided by operating activities | (0.5 | ) | (2.0 | ) | (1.8 | ) | |
| Net cash used in investing activities | (2.9 | ) | (2.5 | ) | (8.6 | ) | |
| Net cash (used in)/provided by financing activities | (4.2 | ) | (3.9 | ) | (4.5 | ) |
The Jobs Act resulted in significant changes U.S. corporate income tax laws by, among other provisions, reducing the maximum U.S. corporate income tax rate from 35% to 21%, starting in 2018 and creating a territorial tax system with a one-time mandatory tax on previously deferred foreign earnings of U.S. subsidiaries. During the year ending December 30, 2017, the Company recognized deferred income tax expense of $531,000 as a result of the re-measurement of deferred tax assets and liabilities to the new lower statutory rate of 21%.
Due to the enactment of the Act, U.S. income taxes have not been provided on the undistributed earnings of the Company’s foreign subsidiaries except where required($17,153,163 at December 30, 2017), as well as the associated withholding taxes from the foreign countries. The amount of taxes associated with the changes to the provisions of the tax law regarding foreign earnings is $2,034,000. Foreign divisions that were previously treated as corporations for U.S. income tax purposes will generally no longer be taxed on their foreign source income by the U.S. federal government. Of the $2,034,000 in taxes associated with the new treatment of foreign earnings under the Jobs Act, $862,000 are associated with the withholding of taxes assessed by foreign countries, net of the applicable U.S. tax laws. The Company would be required to accruecredits, and pay United States income$1,172,000 in taxes to repatriateare associated with the fundsdeemed repatriation of earnings held byin foreign subsidiaries not otherwise provided. The Company intends to reinvest these earnings outside the United States indefinitely.corporations. See Note 7 – Income Taxes for additional information.
All cash held by foreign subsidiaries is readily convertible into other currencies, including the U.S. Dollar.dollar.
Net cash provided by operating activities was $13.1 million in 2017 compared to $12.4 million compared toin 2016 and $9.1 million in 20152015. In 2017 and $9.3 million in 2014. In 2016, the Company was not required to, and did not, contribute anything into its salaried retirement plan, as comparedplan. Due to
31
improved benefits of the $2 million contribution made in 2015. AlsoCompany's 401(k) plan in 2015 and 2016 the contribution required by the Company improvedincreased by $595,000 for 2017 over the benefits of its 401(k) Plan with the result being increased contributions of approximately $380,000 in 2016 over 2015 contributions.amount contributed for 2016. See Note 109 – Retirement Benefit Plans for details of the Plan changes. Finally, in 2015 the Company paid approximately $1.4 million, net of tax, associated with the proxy contest in the first half of 2015 which did not reoccur in 2016. While not a significant change from 2014, inventory increased $3.1 million in 2015, mainly the result of a $1.2 million increase at our Metal Products segment as a result of a slowdown in business in the mining industry and a $0.6 change in LIFO reserves as a result of declining metal prices in all of our segments.
The Company, across all of its business segments, has increased its emphasis on sales and customer service by fulfilling the rapid delivery requirements of our customers. As a result, investments in additional inventories are made on a selective basis.
In Fiscalfiscal year 2017 the impact on cash from the net change in working capital was $0.2 million, which was primarily due to an increase in accounts receivable derived from increased sales activity at the end of the year. In fiscal year 2016, inventory declined $2.5 million mainlyprimarily due to inventory reduction in the Metal ProductProducts business segment in response to the slowdown in the mining industry in 2015 and 2016. This change was offset by an increase in accounts receivable of $1.1 million due to increased sales late in the fiscal year and a reduction of accounts payable related to the previously mentioned inventory reduction. In Fiscalfiscal year 2015, the impact on cash from the net change in working capital was a decline ofdeclined by approximately $2.0 million, due mainly toprimarily as a result of increased inventory and accounts receivable, which were partially offset by declines in accounts payable, prepaid expenses and recoverable taxes. In Fiscal 2014 the impact on cash from the net change in working capital was a decline of approximately $1.8 million, due mainly to the increased inventory levels at the end of the year
The Company used $44.7 million, $2.9 million $2.5 million and $8.6$2.5 million for investing activities in 2017, 2016 2015 and 20142015, respectively. Included in the 20142017 figure is approximately $5.0$42.1 million used for the acquisition of the assets of Argo Transdata Corporation.Velvac. This transaction is more fully discussed in Note 3 of the 20162017 Audited Financial Statements located in Item 8 of this Form 10-K. VirtuallyAlmost all of the entire amount of cash used in investing activities in Fiscalfiscal years 2016 and 2015, and the balance of $3.6$2.6 million in 2014fiscal year 2017, was used for theto purchase of fixed assets. Capital expenditures in Fiscal 2017fiscal year 2018 are expected to be in the range of $3 million.
In Fiscalfiscal year 2017, the Company received approximately $30.7 million in cash from financing activities. The Company received proceeds of $37.6 million from the issuance of new debt and used approximately $4.1 million for debt repayments and $2.8 million for the payment of dividends. See Note 3 – Debt for additional details on the debt that was issued.
In fiscal year 2016, the Company used approximately $4.2 million in cash for financing activities. Approximately $1.4 million was used for debt repayments and another $2.8 million was paid in dividends.
In Fiscalfiscal year 2015, the Company used approximately $3.9 million in cash for financing activities. Approximately $1.1 million was used for debt repayments and another $2.8 million was paid in dividends.
The Company leases certain equipment and buildings under cancelable and non-cancelable operating leases expiringthat expire at various dates up to five years. Rent expense amounted to approximately $2.2 million in 2017; $1.3 million in 2016; and $1.3 million in 2015; and $1.2 million in 2014.2015.
On January 29, 2010, the Company signed a secured Loan Agreement (the “Loan Agreement”"Loan Agreement") with People’sPeople's United Bank (“People’s”("People's"), which included a $5,000,000 term portion (the "Original Term Loan") and a $10,000,000 revolving credit portion. The term portion of the loan requires quarterly principal payments of $178,571 for a period of seven (7) years, maturing on January 31, 2017. The revolving credit portion had a quarterly commitment fee of one quarter of one percent (0.25%), and a maturity date of January 31, 2012. The Loan Agreement is secured by all of the assets of the Company.
On January 25, 2012, the Company amended the Loan Agreement by taking an additional $5,000,000 term loan (the “2012"2012 Term Loan”Loan"). The 2012 Term Loan requires quarterly principal payments of $178,571 for a period of seven (7) years, maturing on January 31, 2019. At the same time the maturity date of the revolving credit portion was extended to January 31, 2014 and continued to have a quarterly commitment fee of one quarter of one percent (0.25%).
Interest on the original termOriginal Term Loan portion of the Loan Agreement is fixed at 4.98%. Interest on the 2012 Term Loan is fixed at 3.90%. For the period from January 25, 2012 to January 23, 2014,The interest rate on the revolving credit portion of the Loan Agreement varied based on the LIBOR rate or People’sPeople's Prime rate plus a margin spread of 2.25%, with a floor interest rate of 3.25% withand a maturity date of January 31, 2014. On January 23, 2014, the Company amendedsigned an amendment to the Loan Agreement with People’s. The amendment renewed andPeople's that extended the maturity date of the $10,000,000 revolving credit portion of the Loan Agreement to July 1, 2016 and changed the interest rate to LIBOR plus 2.25%, and eliminatedeliminating the 3.25% floor interest rate previously in place. The interest rate at December 31, 2016 on the revolving credit portion of the Loan Agreement was 3.02%. The quarterly commitment fee of one quarter of one percent (0.25%) remained unchanged. On June 9, 2016, the Company signed a third amendment to its secured Loan Agreement, which extended the maturity date of the $10,000,000 revolverrevolving credit portion of the Loan Agreement to July 1, 2018.
On April 3, 2017, the Company signed an amended and restated loan agreement (the "Restated Loan Agreement") with People's that included a $31,000,000 term portion and a $10,000,000 revolving credit portion. Proceeds of the loan were used to repay the remaining outstanding term loan of the Company (approximately $1,429,000) and to acquire 100% of the common stock of Velvac Holdings, Inc. (see Footnote 3). The term portion of the Restated Loan Agreement requires quarterly principal payments of $387,500 for a two-year period beginning July 3, 2017. The repayment amount then increases to $775,000 per quarter beginning July 1, 2019. The term portion of the Restated Loan Agreement is a five-year loan with any remaining outstanding balance due on March 1, 2022. The revolving credit portion has a quarterly commitment fee ranging from 0.2% to 0.375% based on operating results. Under the terms of the Restated Loan Agreement, this quarterly commitment fee will be 0.25% for the first six months. The revolving credit portion has a maturity date of April 1, 2022. On April 3, 2017, the Company borrowed approximately $6.6 million on the revolving credit facility. The Company did not utilizesubsequently paid off $1.6 million on the revolving credit portion of the Restated Loan Agreement, at any time during 2015 or 2016.
32
The interest rates on the term and revolving credit portion of the Restated Loan Agreement vary. The interest rates may vary based on the LIBOR rate plus a margin spread of 1.75% to 2.50%. The margin spread is based on operating results calculated on a rolling-four-quarter basis. The Company may also borrow funds at the lender's Prime rate. On December 30, 2017, the interest rate for one half ($15.1 million) of the term portion was 3.11%, using a one-month LIBOR rate and 3.33% on the remaining balance ($15.1 million) of the term portion based on a three-month LIBOR rate. The interest rate on the $5,000,000 balance on the revolving credit portion was 3.11%.
The quarterly payment dates as listed in the Loan Agreement and the Restated Loan Agreement are the first business day of the calendar quarter. As a result, there were five scheduled payments in Fiscal 2014 and only three payment dates in Fiscalfiscal year 2015. In Fiscalfiscal years 2016 and 2017, there were four scheduled payments.payment dates.
Tabular Disclosure of Contractual Obligations
The Company’sCompany's known contractual obligations as of December 31, 2016,30, 2017 are shown below (in thousands):
| Payments due by period | Payments due by period | |||||||||||||||||||||||||||||||||||
Total | Less than 1 Year | 1-3 Years | 3-5 Years | More than 5 Years | Total | Less than 1 Year | 1-3 Years | 3-5 Years | More than 5 Years | |||||||||||||||||||||||||||
| Long-term debt obligations | $ | 1,786 | $ | 893 | $ | 893 | $ | -- | $ | -- | $ | 30,225 | $ | 1,550 | $ | 5,425 | $ | 23,250 | $ | -- | ||||||||||||||||
| Estimated interest on long-term debt | 70 | 49 | 21 | -- | -- | 5,028 | 1,133 | 2,151 | 1,744 | -- | ||||||||||||||||||||||||||
| Operating lease obligations | 3,986 | 1,218 | 1,886 | 800 | 82 | 5,818 | 2,178 | 2,732 | 908 | -- | ||||||||||||||||||||||||||
| Estimated contributions to pension plans | 26,632 | 877 | 6,096 | 7,466 | 12,193 | 26,423 | 528 | 4,985 | 6,612 | 14,298 | ||||||||||||||||||||||||||
Estimated other postretirement benefits other than pensions | 1,052 | 103 | 213 | 224 | 512 | 1,106 | 105 | 213 | 219 | 569 | ||||||||||||||||||||||||||
| Total | $ | 33,526 | $ | 3,140 | $ | 9,109 | $ | 8,490 | $ | 12,787 | $ | 68,600 | $ | 5,494 | $ | 15,506 | $ | 32,733 | $ | 14,867 | ||||||||||||||||
The amounts shown in the above table for estimated contributions to pension plans and for estimated postretirement benefits other than pensions are based on the assumptions set forth in Note 109 to the consolidated financial statements, as well as the assumption that participant counts will remain stable.
The Company does not have any non-cancellable open purchase obligations.
The Company believes it has sufficient cash on hand and credit resources available to it to sustain itself though the next fiscal year.
The Company’sCompany's foreign manufacturing facilities account for approximately 14%13% of total sales and 14%13% of total assets. ItsOur U.S. operations buy from and sell to these foreign affiliates and also make limited sales (approximately 15%13% of total sales) to nonaffiliated foreign customers. This trade activity could be affected by fluctuations in foreign currency exchange or by weak economic conditions. The Company’sCompany's currency exposure is concentrated in the Canadian dollar, Mexican peso, New Taiwan dollar, Chinese RMB and Hong Kong dollar. Because of the Company’sCompany's limited exposure to any single foreign market, any exchange gains or losses have not been material and are not expected to be material in the future. Had the exchange rate as of December 31, 201630, 2017 for all of the listed currencies changed by 1%, the total change in reported earnings would have been approximately $37,000.$34,000. As a result, the Company does not attempt to mitigate its foreign currency exposure through the acquisition of any speculative or leveraged financial instruments. In 2016,2017, a 10% increase/decrease in exchange rates would have resulted in a translation increase/decrease of approximately $2.4 million to sales ofand approximately $1.8 million, and$949,000 to equity of approximately $680,000.equity.
33
The Company has been able to recover cost increases in raw materials through either price increases to our customers or cost reductions in other areas of the business. Therefore, the Company has not entered into any contracts to address commodity price risk.
The Company does not have anyCompany's exposure to the risk of changes in market interest rate risk as all of its long-termrates relates primarily to the Company's debt, which bears interest at variable rates based on the LIBOR rate plus a fixed rate. See Note 5margin spread of 1.75% to 2.50%. The Company had an interest rate swap with a notional amount of $15,112,500 on December 30, 2017 to convert the termportion of the Company’s financial statements included at Item 8Restated Loan Agreement from variable to fixed rates. The valuation of this Annual Report on Form 10-K for complete details.swap is determined using the three month LIBOR rate index and mitigates the Company's exposure to interest rate risk.
34
The Eastern Company
Consolidated Balance Sheets
| December 31 | January 2 | December 30 | December 31 | ||||||||||||
| 2016 | 2016 | 2017 | 2016 | ||||||||||||
| ASSETS | |||||||||||||||
| Current Assets | |||||||||||||||
| Cash and cash equivalents | $ | 22,725,376 | $ | 17,814,986 | $ | 22,275,477 | $ | 22,725,376 | |||||||
| Accounts receivable, less allowances of $430,000 in 2016 and $450,000 in 2015 | 18,135,792 | 17,502,445 | |||||||||||||
| Accounts receivable, less allowances of $470,000 in 2017 and $430,000 in 2016 | 27,119,910 | 18,135,792 | |||||||||||||
| Inventories: | |||||||||||||||
| Raw materials and component parts | 8,829,236 | 10,913,827 | 14,331,915 | 8,829,236 | |||||||||||
| Work in process | 7,118,149 | 7,681,576 | 7,718,379 | 7,118,149 | |||||||||||
| Finished goods | 18,082,901 | 18,247,010 | 25,218,463 | 18,082,901 | |||||||||||
| 34,030,286 | 36,842,413 | 47,268,757 | 34,030,286 | ||||||||||||
| Prepaid expenses and other assets | 1,858,471 | 2,122,215 | 3,401,456 | 1,858,471 | |||||||||||
| Deferred income taxes | 947,001 | 986,167 | — | 947,001 | |||||||||||
| Total Current Assets | 77,696,926 | 75,268,226 | 100,065,600 | 77,696,926 | |||||||||||
| Property, Plant and Equipment | |||||||||||||||
| Land | 1,159,901 | 1,159,732 | 1,160,298 | 1,159,901 | |||||||||||
| Buildings | 16,303,521 | 16,072,536 | 16,426,977 | 16,303,521 | |||||||||||
| Machinery and equipment | 47,447,649 | 46,205,973 | 52,680,240 | 47,447,649 | |||||||||||
| Accumulated depreciation | (38,745,557 | ) | (36,636,775 | ) | (41,075,121 | ) | (38,745,557 | ) | |||||||
| 26,165,514 | 26,801,466 | 29,192,394 | 26,165,514 | ||||||||||||
| Other Assets | |||||||||||||||
| Goodwill | 14,819,835 | 14,790,793 | 32,228,891 | 14,819,835 | |||||||||||
| Trademarks | 166,312 | 164,957 | 3,686,063 | 166,312 | |||||||||||
| Patents, technology and other intangibles net of accumulated amortization | 1,764,449 | 2,113,576 | 9,275,158 | 1,764,449 | |||||||||||
| Deferred income taxes | 3,585,360 | 2,599,541 | 2,010,291 | 3,585,360 | |||||||||||
| 20,335,956 | 19,668,867 | 47,200,403 | 20,335,956 | ||||||||||||
| TOTAL ASSETS | $ | 124,198,396 | $ | 121,738,559 | $ | 176,458,397 | $ | 124,198,396 | |||||||
35
Consolidated Balance Sheets
| December 31 | January 2 | December 30 | December 31 | ||||||||||||
| 2016 | 2016 | 2017 | 2016 | ||||||||||||
| LIABILITIES AND SHAREHOLDERS’ EQUITY | |||||||||||||||
| LIABILITIES AND SHAREHOLDERS' EQUITY | |||||||||||||||
| Current Liabilities | |||||||||||||||
| Accounts payable | $ | 7,048,174 | $ | 9,109,394 | $ | 14,712,414 | $ | 7,048,174 | |||||||
| Accrued compensation | 3,112,404 | 2,873,871 | 4,376,211 | 3,112,404 | |||||||||||
| Other accrued expenses | 1,812,647 | 1,751,052 | 3,606,057 | 1,812,647 | |||||||||||
| Contingent Liability | 2,070,000 | ||||||||||||||
| Current portion of long-term debt | 892,857 | 1,428,571 | 6,550,000 | 892,857 | |||||||||||
| Total Current Liabilities | 12,866,082 | 15,162,888 | 31,314,682 | 12,866,082 | |||||||||||
| Deferred income taxes | 1,723,543 | — | |||||||||||||
| Other long-term liabilities | 288,805 | 286,920 | 358,982 | 288,805 | |||||||||||
| Long-term debt, less current portion | 892,857 | 1,785,714 | 28,675,000 | 892,857 | |||||||||||
| Accrued other postretirement benefits | 1,051,700 | 793,055 | 1,032,171 | 1,051,700 | |||||||||||
| Accrued pension cost | 26,631,438 | 24,304,926 | 26,423,429 | 26,631,438 | |||||||||||
| Commitments and contingencies (See Note 4) | |||||||||||||||
| Shareholders’ Equity | |||||||||||||||
| Shareholders' Equity | |||||||||||||||
| Voting Preferred Stock, no par value: | |||||||||||||||
| Authorized and unissued: 1,000,000 shares | |||||||||||||||
| Nonvoting Preferred Stock, no par value: | |||||||||||||||
| Authorized and unissued: 1,000,000 shares | |||||||||||||||
| Common Stock, no par value: | |||||||||||||||
| Authorized: 50,000,000 shares | |||||||||||||||
| Issued: 8,950,827 shares in 2016 and 8,942,461 shares in 2015 | |||||||||||||||
| Outstanding: 6,256,098 shares in 2016 and 6,247,732 shares in 2015 | 29,146,622 | 28,997,050 | |||||||||||||
| Treasury Stock: 2,694,729 shares in 2016 and 2015 | (19,105,723 | ) | (19,105,723 | ) | |||||||||||
| Issued: 8,957,974 shares in 2017 and 8,950,827 shares in 2016 | |||||||||||||||
| Outstanding: 6,263,245 shares in 2017 and 6,256,098 shares in 2016 | 29,501,123 | 29,146,622 | |||||||||||||
| Treasury Stock: 2,694,729 shares in 2017 and 2016 | (19,105,723 | ) | (19,105,723 | ) | |||||||||||
| Retained earnings | 95,631,216 | 90,597,041 | 97,921,903 | 95,631,216 | |||||||||||
| Accumulated other comprehensive income (loss): | |||||||||||||||
| Foreign currency translation | (2,165,081 | ) | (1,154,098 | ) | (943,193 | ) | (2,165,081 | ) | |||||||
| Unrealized gain on interest rate swap, net of tax | 41,757 | — | |||||||||||||
| Unrecognized net pension and other postretirement benefit costs, net of taxes | (21,039,520 | ) | (19,929,214 | ) | (20,485,277 | ) | (21,039,520 | ) | |||||||
| Accumulated other comprehensive loss | (23,204,601 | ) | (21,083,312 | ) | (21,386,713 | ) | (23,204,601 | ) | |||||||
| Total Shareholders’ Equity | 82,467,514 | 79,405,056 | |||||||||||||
| TOTAL LIABILITIES AND SHAREHOLDERS’ EQUITY | $ | 124,198,396 | $ | 121,738,559 | |||||||||||
| Total Shareholders' Equity | 86,930,590 | 82,467,514 | |||||||||||||
| TOTAL LIABILITIES AND SHAREHOLDERS' EQUITY | $ | 176,458,397 | $ | 124,198,396 | |||||||||||
See accompanying notes.
36
Consolidated Statements of Income
| Year ended | Year ended | |||||||||||||||||||||
| December 31 | January 2 | January 3 | December 30 | December 31 | January 2 | |||||||||||||||||
| 2016 | 2016 | 2015 | 2017 | 2016 | 2016 | |||||||||||||||||
| Net sales | $ | 137,608,258 | $ | 144,567,951 | $ | 140,825,360 | $ | 204,239,613 | $ | 137,608,258 | $ | 144,567,951 | ||||||||||
| Cost of products sold | (103,315,387 | ) | (112,186,725 | ) | (108,338,956 | ) | (154,188,794 | ) | (101,262,048 | ) | (110,318,320 | ) | ||||||||||
| Gross margin | 34,292,871 | 32,381,226 | 32,486,404 | 50,050,819 | 36,346,210 | 34,249,631 | ||||||||||||||||
| Engineering Expenses | (5,622,829 | ) | (2,568,307 | ) | (2,459,062 | ) | ||||||||||||||||
| Selling and administrative expenses | (23,156,999 | ) | (24,353,498 | ) | (20,767,756 | ) | (32,151,289 | ) | (22,642,031 | ) | (23,762,841 | ) | ||||||||||
| Operating profit | 11,135,872 | 8,027,728 | 11,718,648 | 12,276,701 | 11,135,872 | 8,027,728 | ||||||||||||||||
| Interest expense | (121,500 | ) | (185,475 | ) | (254,576 | ) | (976,512 | ) | (121,500 | ) | (185,475 | ) | ||||||||||
| Other income | 209,043 | 178,722 | 64,691 | 154,753 | 209,043 | 178,722 | ||||||||||||||||
| Income before income taxes | 11,223,415 | 8,020,975 | 11,528,763 | 11,454,942 | 11,223,415 | 8,020,975 | ||||||||||||||||
| Income taxes | 3,438,092 | 2,293,932 | 3,867,287 | 6,409,687 | 3,438,092 | 2,293,932 | ||||||||||||||||
| Net income | $ | 7,785,323 | $ | 5,727,043 | $ | 7,661,476 | $ | 5,045,255 | $ | 7,785,323 | $ | 5,727,043 | ||||||||||
| Earnings per Share: | ||||||||||||||||||||||
| Basic | $ | 1.25 | $ | .92 | $ | 1.23 | $ | .81 | $ | 1.25 | $ | .92 | ||||||||||
| Diluted | $ | 1.25 | $ | .92 | $ | 1.23 | $ | .80 | $ | 1.25 | $ | .92 | ||||||||||
See accompanying notes.
Consolidated Statements of Comprehensive Income
| Year ended | Year ended | |||||||||||||||||||||
| December 31 | January 2 | January 3 | December 30 | December 31 | January 2 | |||||||||||||||||
| 2016 | 2016 | 2015 | 2017 | 2016 | 2016 | |||||||||||||||||
| Net income | $ | 7,785,323 | $ | 5,727,043 | $ | 7,661,476 | $ | 5,045,255 | $ | 7,785,323 | $ | 5,727,043 | ||||||||||
| Other comprehensive income/(loss) - | ||||||||||||||||||||||
| Change in foreign currency translation | (1,010,983 | ) | (2,009,277 | ) | (1,128,327 | ) | 1,221,888 | (1,010,983 | ) | (2,009,277 | ) | |||||||||||
| Change in pension and other postretirement benefit costs, net of income taxes (expense)/benefit of ($543,297) in 2016, $1,899,285 in 2015 and $5,767,236 in 2014 | (1,110,306 | ) | 3,458,060 | (10,386,089 | ) | |||||||||||||||||
| Change in fair value of interest rate swap, net of tax benefit of: $7,310. | 41,757 | — | — | |||||||||||||||||||
| Change in pension and other postretirement benefit costs, net of income taxes (expense)/benefit of: $62,632 in 2017, ($543,297) in 2016 and $1,899,285 in 2015 | 554,243 | (1,110,306 | ) | 3,458,060 | ||||||||||||||||||
| Total other comprehensive income/(loss) | (931,548 | ) | 1,448,783 | (11,514,416 | ) | 1,817,888 | (931,548 | ) | 1,448,783 | |||||||||||||
| Comprehensive income/(loss) | $ | 5,664,034 | $ | 7,175,826 | $ | (3,852,940 | ) | $ | 6,863,143 | $ | 5,664,034 | $ | 7,175,826 | |||||||||
See accompanying notes.
37
Consolidated Statements of Shareholders’Shareholders' Equity
| Common Shares | Common Stock | Treasury Shares | Treasury Stock | Retained Earnings | Accumulated Other Comprehensive Income (Loss) | Shareholders’ Equity | Common Shares | Common Stock | Treasury Shares | Treasury Stock | Retained Earnings | Accumulated Other Comprehensive Income (Loss) | Shareholders' Equity | |||||||||||||||||||||||||||||||||||
| Balances at December 28, 2013 | 8,916,897 | $ | 28,621,582 | (2,694,729 | ) | $ | (19,105,723 | ) | $ | 83,006,671 | $ | (11,017,679 | ) | $ | 81,504,851 | |||||||||||||||||||||||||||||||||
| Net income | 7,661,476 | 7,661,476 | ||||||||||||||||||||||||||||||||||||||||||||||
| Cash dividends declared, $.48 per share | (2,987,480 | ) | (2,987,480 | ) | ||||||||||||||||||||||||||||||||||||||||||||
| Currency translation adjustment | (1,128,327 | ) | (1,128,327 | ) | ||||||||||||||||||||||||||||||||||||||||||||
| Change in pension and other postretirement benefit costs, net of tax | (10,386,089 | ) | (10,386,089 | ) | ||||||||||||||||||||||||||||||||||||||||||||
| Issuance of Common Stock upon the exercise of stock options | 20,000 | 271,600 | 271,600 | |||||||||||||||||||||||||||||||||||||||||||||
| Tax benefit from | ||||||||||||||||||||||||||||||||||||||||||||||||
| disqualifying | ||||||||||||||||||||||||||||||||||||||||||||||||
| dispositions of | ||||||||||||||||||||||||||||||||||||||||||||||||
| incentive stock options | 8,882 | 8,882 | ||||||||||||||||||||||||||||||||||||||||||||||
| Issuance of Common Stock for directors’ fees | 1,845 | 29,994 | 29,994 | |||||||||||||||||||||||||||||||||||||||||||||
| Balances at January 3, 2015 | 8,938,742 | 28,932,058 | (2,694,729 | ) | (19,105,723 | ) | 87,680,667 | (22,532,095 | ) | 74,974,907 | 8,938,742 | $ | 28,932,058 | (2,694,729 | ) | $ | (19,105,723 | ) | $ | 87,680,667 | $ | (22,532,095 | ) | $ | 74,974,907 | |||||||||||||||||||||||
| Net income | 5,727,043 | 5,727,043 | 5,727,043 | 5,727,043 | ||||||||||||||||||||||||||||||||||||||||||||
| Cash dividends declared, $.45 per share | (2,810,669 | ) | (2,810,669 | ) | (2,810,669 | ) | (2,810,669 | ) | ||||||||||||||||||||||||||||||||||||||||
| Currency translation adjustment | (2,009,277 | ) | (2,009,277 | ) | (2,009,277 | ) | (2,009,277 | ) | ||||||||||||||||||||||||||||||||||||||||
| Change in pension and other postretirement benefit costs, net of tax | 3,458,060 | 3,458,060 | 3,458,060 | 3,458,060 | ||||||||||||||||||||||||||||||||||||||||||||
| Issuance of Common Stock for directors’ fees | 3,719 | 64,992 | 64,992 | |||||||||||||||||||||||||||||||||||||||||||||
Issuance of Common Stock for directors' fees | 3,719 | 64,992 | 64,992 | |||||||||||||||||||||||||||||||||||||||||||||
| Balances at January 2, 2016 | 8,942,461 | 28,997,050 | (2,694,729 | ) | (19,105,723 | ) | 90,597,041 | (21,083,312 | ) | 79,405,056 | 8,942,461 | 28,997,050 | (2,694,729 | ) | (19,105,723 | ) | 90,597,041 | (21,083,312 | ) | 79,405,056 | ||||||||||||||||||||||||||||
| Net income | 7,785,323 | 7,785,323 | 7,785,323 | 7,785,323 | ||||||||||||||||||||||||||||||||||||||||||||
| Cash dividends declared, $.44 per share | (2,751,148 | ) | (2,751,148 | ) | (2,751,148 | ) | (2,751,148 | ) | ||||||||||||||||||||||||||||||||||||||||
| Currency translation adjustment | (1,010,983 | ) | (1,010,983 | ) | (1,010,983 | ) | (1,010,983 | ) | ||||||||||||||||||||||||||||||||||||||||
| Change in pension and other postretirement benefit costs, net of tax | (1,110,306 | ) | (1,110,306 | ) | (1,110,306 | ) | (1,110,306 | ) | ||||||||||||||||||||||||||||||||||||||||
| Issuance of Common Stock for directors’ fees | 8,366 | 149,572 | 149,572 | |||||||||||||||||||||||||||||||||||||||||||||
Issuance of Common Stock for directors' fees | 8,366 | 149,572 | 149,572 | |||||||||||||||||||||||||||||||||||||||||||||
| Balances at December 31, 2016 | 8,950,827 | $ | 29,146,622 | (2,694,729 | ) | $ | (19,105,723 | ) | $ | 95,631,216 | $ | (23,204,601 | ) | $ | 82,467,514 | 8,950,827 | 29,146,622 | (2,694,729 | ) | (19,105,723 | ) | 95,631,216 | (23,204,601 | ) | 82,467,514 | |||||||||||||||||||||||
Net income | 5,045,255 | 5,045,255 | ||||||||||||||||||||||||||||||||||||||||||||||
Cash dividends declared, $.44 per share | (2,754,568 | ) | (2,754,568 | ) | ||||||||||||||||||||||||||||||||||||||||||||
Currency translation adjustment | 1,221,888 | 1,221,888 | ||||||||||||||||||||||||||||||||||||||||||||||
Change in fair value of interest rate swap | 41,757 | 41,757 | ||||||||||||||||||||||||||||||||||||||||||||||
Change in pension and other postretirement benefit costs, net of tax | 554,243 | 554,243 | ||||||||||||||||||||||||||||||||||||||||||||||
Issuance of SARS | 172,806 | 172,806 | ||||||||||||||||||||||||||||||||||||||||||||||
Issuance of Common Stock for directors' fees | 7,147 | 181,695 | 181,695 | |||||||||||||||||||||||||||||||||||||||||||||
Balances at December 30, 2017 | 8,957,974 | $ | 29,501,123 | (2,694,729 | ) | $ | (19,105,723 | ) | $ | 97,921,903 | $ | (21,386,713 | ) | $ | 86,930,590 | |||||||||||||||||||||||||||||||||
See accompanying notes.
38
Consolidated Statements of Cash Flows
| Year ended | Year ended | |||||||||||||||||||||
| December 31 | January 2 | January 3 | December 30 | December 31 | January 2 | |||||||||||||||||
| 2016 | 2016 | 2015 | 2017 | 2016 | 2016 | |||||||||||||||||
| Operating Activities | ||||||||||||||||||||||
| Net income | $ | 7,785,323 | $ | 5,727,043 | $ | 7,661,476 | $ | 5,045,255 | $ | 7,785,323 | $ | 5,727,043 | ||||||||||
| Adjustments to reconcile net income to net cash provided by operating activities: | ||||||||||||||||||||||
| Depreciation and amortization | 3,814,393 | 3,921,438 | 3,486,302 | 4,719,185 | 3,814,393 | 3,921,438 | ||||||||||||||||
| Unrecognized pension & other postretirement benefits | 931,554 | 1,384,605 | (175,687 | ) | 326,706 | 931,554 | 1,384,605 | |||||||||||||||
| Loss on sale of equipment and other assets | 73,309 | 49,796 | 69,258 | (369,128 | ) | 73,309 | 49,796 | |||||||||||||||
| Provision for doubtful accounts | 120,252 | 9,459 | 37,601 | 55,284 | 120,252 | 9,459 | ||||||||||||||||
| Issuance of Common Stock for directors’ fees | 149,572 | 64,992 | 29,994 | |||||||||||||||||||
| Deferred Taxes | 1,198,020 | (403,002 | ) | (240,071 | ) | |||||||||||||||||
| Issuance of Stock Compensation | 354,501 | 149,572 | 64,992 | |||||||||||||||||||
| Changes in operating assets and liabilities: | ||||||||||||||||||||||
| Accounts receivable | (1,062,654 | ) | (852,168 | ) | (207,631 | ) | (2,574,823 | ) | (1,062,654 | ) | (852,168 | ) | ||||||||||
| Inventories | 2,514,371 | (3,095,801 | ) | (2,825,155 | ) | 152,130 | 2,514,371 | (3,095,801 | ) | |||||||||||||
| Prepaid expenses | 217,389 | 483,178 | 593,075 | (1,709,241 | ) | 217,389 | 483,178 | |||||||||||||||
| Recoverable tax receivables | — | 380,000 | (380,000 | ) | — | — | 380,000 | |||||||||||||||
| Other assets | (84,626 | ) | (106,081 | ) | (156,164 | ) | 709,757 | (84,626 | ) | (106,081 | ) | |||||||||||
| Accounts payable | (1,755,159 | ) | 1,182,124 | 998,502 | 892,439 | (1,755,159 | ) | 1,182,124 | ||||||||||||||
| Accrued compensation | 261,231 | 28,426 | 185,724 | 911,572 | 261,231 | 28,426 | ||||||||||||||||
| Other accrued expenses | (549,715 | ) | (43,582 | ) | 29,889 | 1,468,525 | (146,713 | ) | 196,489 | |||||||||||||
| Net cash provided by operating activities | 12,415,240 | 9,133,429 | 9,347,184 | 11,180,182 | 12,415,240 | 9,133,429 | ||||||||||||||||
| Investing Activities | ||||||||||||||||||||||
| Purchases of property, plant and equipment | (2,863,470 | ) | (2,538,236 | ) | (3,633,165 | ) | (2,762,949 | ) | (2,863,470 | ) | (2,538,236 | ) | ||||||||||
| Proceeds from sale of equipment and other assets | 8,350 | 25,000 | 22,500 | 44,100 | 8,350 | 25,000 | ||||||||||||||||
| Business acquisitions | — | — | (5,034,289 | ) | (40,078,000 | ) | — | — | ||||||||||||||
| Net cash used in investing activities | (2,855,120 | ) | (2,513,236 | ) | (8,644,954 | ) | (42,796,849 | ) | (2,855,120 | ) | (2,513,236 | ) | ||||||||||
| Financing Activities | ||||||||||||||||||||||
| Principal payments on long-term debt | (1,428,571 | ) | (1,071,428 | ) | (1,785,714 | ) | (2,560,714 | ) | (1,428,571 | ) | (1,071,428 | ) | ||||||||||
| Proceeds from sales of Common Stock | — | — | 271,600 | |||||||||||||||||||
| Tax benefit from disqualifying dispositions of incentive stock options | — | — | 8,882 | |||||||||||||||||||
| Proceeds from issuance of long-term debt and note | 31,000,000 | — | — | |||||||||||||||||||
| Proceeds from short-term borrowing (Revolver) | 6,614,611 | — | — | |||||||||||||||||||
| Payments on Revolving Credit Note | (1,614,611 | ) | — | — | ||||||||||||||||||
| Dividends paid | (2,751,148 | ) | (2,810,669 | ) | (2,987,480 | ) | (2,754,568 | ) | (2,751,148 | ) | (2,810,669 | ) | ||||||||||
| Net cash used in financing activities | (4,179,719 | ) | (3,882,097 | ) | (4,492,712 | ) | 30,684,718 | (4,179,719 | ) | (3,882,097 | ) | |||||||||||
| Effect of exchange rate changes on cash | (470,011 | ) | (757,554 | ) | (363,435 | ) | 482,049 | (470,011 | ) | (757,554 | ) | |||||||||||
| Net change in cash and cash equivalents | 4,910,390 | 1,980,542 | (4,153,917 | ) | (449,899 | ) | 4,910,390 | 1,980,542 | ||||||||||||||
| Cash and cash equivalents at beginning of year | 17,814,986 | 15,834,444 | 19,988,361 | 22,725,376 | 17,814,986 | 15,834,444 | ||||||||||||||||
| Cash and cash equivalents at end of year | $ | 22,725,376 | $ | 17,814,986 | $ | 15,834,444 | $ | 22,275,477 | $ | 22,725,376 | $ | 17,814,986 | ||||||||||
See accompanying notes.
39
The Eastern Company
Notes to Consolidated Financial Statements
1. Description of Business
The Eastern Company (the “Company”"Company") includes sixeight separate operating divisions located within the United States, two wholly-owned Canadian subsidiaries (one located in Tillsonburg, Ontario, Canada, and one in Kelowna, British Columbia, Canada), a wholly-owned Taiwanese subsidiary located in Taipei, Taiwan, a wholly-owned subsidiary in Hong Kong, two wholly-owned Chinese subsidiaries (one located in Shanghai, China, and one located in Dongguan, China) and atwo wholly-owned subsidiarysubsidiaries in Mexico (one located in Lerma, Mexico.Mexico and one located in Reynosa, Mexico).
The operations of the Company consist of three business segments: industrial hardware, security products, and metal products.
The Industrial Hardware segment consists of Eberhard Manufacturing, Eberhard Hardware Manufacturing Ltd., Eastern Industrial Ltd, Velvac Holdings Inc., Canadian Commercial Vehicles Corporation, Composite Panel Technologies. and Sesamee Mexicana, S.A. de C.V. These businesses design, manufacture and market a diverse product line of custom and standard vehicular and industrial hardware, including passenger restraint and vehicular locks, latches, hinges, mirrors, mirror-cameras, light weight sleeper boxes and truck bodies. The segment's products can be found on tractor-trailer trucks, specialty commercial vehicles, recreational vehicles, fire and rescue vehicles, school buses, military vehicles and other vehicles. In addition, the segment produces latchingdesigns and manufactures a wide selection of fasteners and other closure devices for useused to secure access doors on various types of industrial equipment and instrumentation, composite panels used primarily in the transportationsuch as metal cabinets, machinery housings and electronic white board industries, as well as a broad line of proprietary hardware designed for truck bodiesinstruments.
The Security Products segment, Illinois Lock Company/CCL Security Products, World Lock Company Ltd., Dongguan Reeworld Security Products Ltd. and other vehicular type equipment. The security products segmentWorld Security Industries Ltd., Greenwald Industries, Argo EMS (formerly Argo Transdata). Illinois Lock Company/CCL Security Products design, manufactures and markets a broad range ofdistributes custom engineered and many standard closing and locking systems, including vehicular accessory locks, for traditional general purpose security applications as well as specializedcabinet locks, for soft luggage, coin-operated vendingcam locks, electric switch locks, tubular key locks and gaming equipment, and electric and computer peripheral components. This segment alsocombination padlocks. Greenwald manufactures and markets coin acceptors and metering systems to secure cashother coin security products used primarily in the commercial laundry industry and produces cashless payment systems utilizing advancedmarkets. Greenwald's products include timers, drop meters, coin chutes, money boxes, meter cases, smart cards, value transfer stations, smart card technology. readers, card management software, assess control units. Argo EMS supplies printed circuit boards and other electronic assemblies.
The metal productsMetal Products segment produces anchoring devices used in supporting the roofs of underground coal mines and specialty products which serve the construction, automotive, railroad and electrical industries.
Sales are made to customers primarily in North America.
2. Accounting Policies
Use of Estimates
The preparation of financial statements in conformity with accounting principles generally accepted in the United States requires management to make estimates and assumptions that affect the reported amounts of assets and liabilities and the disclosure of contingent assets and liabilities at the date of the financial statements, as well as the reported amounts of revenues and expenses during the reporting period. On an ongoing basis the Company evaluates its estimates, including those related to product returns, bad debts, carrying value of inventories, intangible and other long-lived assets, income taxes, pensions and other postretirement benefits. Actual results could differ from those estimates.
Fiscal Year
The Company’sCompany's year ends on the Saturday nearest to December 31. Fiscal 2017 was a 52 week year, 2016 was a 52 week year and 2015 was a 52 week year and 2014 was a 53 week year.
Principles of Consolidation
The consolidated financial statements include the accounts of the Company and its subsidiaries, all of which are wholly-owned. All intercompany accounts and transactions are eliminated.
40
The Eastern Company
Notes to Consolidated Financial Statements
Cash Equivalents
Highly liquid investments purchased with a maturity of three months or less are considered cash equivalents. The Company has deposits that exceed amounts insured by the Federal Deposit Insurance Corporation (FDIC) up to $250,000, but the Company does not consider this a significant concentration of credit risk based on the strength of the financial institution. Approximately 51%64% of available cash is located outside of the United States in our foreign subsidiaries.
Reclassification
2. Accounting Policies (continued)
Foreign Currency
For foreign operations balance sheet accounts are translated at the current year-end exchange rate; income statement accounts are translated at the average exchange rate for the year. Resulting translation adjustments are made directly to a separate component of shareholders’shareholders' equity – “Accumulated"Accumulated other comprehensive income (loss) – Foreign currency translation”translation". Foreign currency exchange transaction gains and losses are not material in any year.
Recognition of Sales
Sales are recognized when persuasive evidence of an arrangement exists, the price is fixed and determinable, delivery has occurred, and there is a reasonable assurance of collection of the sales proceeds. The Company obtains written purchase authorizations from its customers for a specified amount of product at a specified price and delivery occurs at the time of shipment. Credit is extended based on an evaluation of each customer’scustomer's financial condition; collateral is not required. Sales are recorded net of returns and allowances. Accounts receivable are recorded net of applicable allowances. No one customer accounted for 10% of net sales during 2017, 2016 2015 or 2014.2015. No one customer exceeded 10% of total accounts receivable at year end 2016 or 2015.2017 for 2016.
Accounts Receivable
Accounts receivable are stated at their net realizable value. The Company maintains an allowance for doubtful accounts for estimated losses resulting from the inability of its customers to make required payments. The Company reviews the collectability of its receivables on an ongoing basis taking into account a combination of factors. The Company reviews potential problems, such as past due accounts, a bankruptcy filing or deterioration in the customer’scustomer's financial condition, to ensure the Company is adequately accrued for potential loss. Accounts are considered past due based on when payment was originally due. If a customer’scustomer's situation changes, such as a bankruptcy or creditworthiness, or there is a change in the current economic climate, the Company may modify its estimate of the allowance for doubtful accounts. The Company will write off accounts receivable after reasonable collection efforts have been made and the accounts are deemed uncollectible. Write-offs have been within management’s estimates.
Inventories
Inventories are valued at the lower of cost or market.market or net realizable value. Cost is determined by the last-in, first-out (LIFO) method in the U.S. ($28,052,36826,280,620 for U.S. inventories at December 31, 2016)30, 2017 excluding Velvac) and by the first-in, first-out (FIFO) method for inventories outside the U.S. ($5,977,9188,034,924 for inventories outside the U.S. at December 31, 2016)30, 2017). Cost exceeds the LIFO carrying value by approximately $6,476,073 at December 30, 2017 and $6,121,286 at December 31, 2016 and $6,297,368 at January 2, 2016. There was no material LIFO quantity liquidation in 2017, 2016 2015 and 2014.2015. In addition, as of the balance sheet dates, the Company has recorded reserves for excess/obsolete inventory.
41
The Eastern Company
Notes to Consolidated Financial Statements
2. Accounting Policies(continued)
Property, Plant and Equipment and Related Depreciation
Property, plant and equipment (including equipment under capital lease) are stated at cost. Depreciation ($3,371,6943,948,728 in 2017, $3,371,694 in 2016, $3,460,516 in 2015, $3,237,426 in 2014)2015) is computed generally using the straight-line method based on the following estimated useful lives of the assets: Buildings 10 to 39.5 years; Machinery and equipment 3 to 10 years.
Goodwill, Intangibles and Impairment of Long-Lived Assets
Patents are recorded at cost and are amortized using the straight-line method over the lives of the patents. Technology and licenses are recorded at cost and are generally amortized on a straight-line basis over periods ranging from 5 to 17 years. Non-compete agreements and customer relationships are being amortized using the straight-line method over a period of 5 years. Amortization expense in 2017, 2016 and 2015 was $770,457, $442,699 and 2014 was $442,699, $460,922, and $248,876, respectively. Total amortization expense for each of the
next five years is estimated to be as follows: 2017 - $406,000; 2018 - $406,000;$1,228,000; 2019 - $406,000;$1,228,000; 2020 - $173,000 and$995,000; 2021 - $147,000.$995,000 and 2022 - $853,000. Trademarks are not amortized as their lives are deemed to be indefinite.
Industrial Hardware Segment | Security Products Segment | Metal Products Segment | Total | Weighted-Average Amortization Period (Years) | ||||||||||||||||
| 2017 Gross Amount | ||||||||||||||||||||
| Patents and developed technology | $ | 7,074,456 | $ | 1,021,918 | $ | — | $ | 8,096,374 | 12.3 | |||||||||||
| Customer relationships | 3,650,000 | 449,706 | — | 4,099,706 | 9.5 | |||||||||||||||
| Non-compete agreements | — | 407,000 | — | 407,000 | 5.0 | |||||||||||||||
| Intellectual property | — | 307,370 | — | 307,370 | 5.0 | |||||||||||||||
| Total Gross Intangibles | $ | 10,724,456 | $ | 2,185,994 | $ | — | $ | 12,910,450 | 10.8 | |||||||||||
| 2017 Accumulated Amortization | ||||||||||||||||||||
| Patents and developed technology | $ | 2,007,418 | $ | 630,784 | $ | — | $ | 2,638,202 | ||||||||||||
| Customer relationships | 298,645 | 269,823 | — | 568,468 | ||||||||||||||||
| Non-compete agreements | — | 244,200 | — | 244,200 | ||||||||||||||||
| Intellectual property | — | 184,422 | — | 184,422 | ||||||||||||||||
| Accumulated Amortization | $ | 2,306,063 | $ | 1,329,229 | $ | — | $ | 3,635,292 | ||||||||||||
| Net 2017 per Balance Sheet | $ | 8,418,393 | $ | 856,765 | $ | — | $ | 9,275,158 | ||||||||||||
| 2016 Gross Amount | ||||||||||||||||||||
| Patents and developed technology | $ | 2,159,060 | $ | 1,035,374 | $ | — | $ | 3,194,434 | 15.6 | |||||||||||
| Customer relationships | — | 449,706 | — | 449,706 | 5.0 | |||||||||||||||
| Non-compete agreements | — | 407,000 | — | 407,000 | 5.0 | |||||||||||||||
| Intellectual property | — | 307,370 | — | 307,370 | 5.0 | |||||||||||||||
| Total Gross Intangibles | $ | 2,159,060 | $ | 2,199,450 | $ | — | $ | 4,358,510 | 12.3 | |||||||||||
42
Industrial Hardware Segment | Security Products Segment | Metal Products Segment | Total | Weighted-Average Amortization Period (Years) | |||||||||||||||||||||||||||||||||
| 2016 Gross Amount | |||||||||||||||||||||||||||||||||||||
| Patents and developed technology | $ | 2,159,060 | $ | 1,035,374 | $ | — | $ | 3,194,434 | 15.6 | ||||||||||||||||||||||||||||
| Customer relationships | — | 449,706 | — | 449,706 | 5.0 | ||||||||||||||||||||||||||||||||
| Non-compete agreements | — | 407,000 | — | 407,000 | 5.0 | ||||||||||||||||||||||||||||||||
| Intellectual property | — | 307,370 | — | 307,370 | 5.0 | ||||||||||||||||||||||||||||||||
| Total Gross Intangibles | $ | 2,159,060 | $ | 2,199,450 | $ | — | $ | 4,358,510 | 12.3 | ||||||||||||||||||||||||||||
Industrial Hardware Segment | Security Products Segment | Metal Products Segment | Total | Weighted-Average Amortization Period (Years) | |||||||||||||||||||||||||||||||||
| 2016 Accumulated Amortization | |||||||||||||||||||||||||||||||||||||
| Patents and developed technology | $ | 1,529,675 | $ | 598,756 | $ | — | $ | 2,128,431 | $ | 1,529,675 | $ | 598,756 | $ | — | $ | 2,128,431 | |||||||||||||||||||||
| Customer relationships | — | 179,882 | — | 179,882 | — | 179,882 | — | 179,882 | |||||||||||||||||||||||||||||
| Non-compete agreements | — | 162,800 | — | 162,800 | — | 162,800 | — | 162,800 | |||||||||||||||||||||||||||||
| Intellectual property | — | 122,948 | — | 122,948 | — | 122,948 | — | 122,948 | |||||||||||||||||||||||||||||
| Accumulated Amortization | $ | 1,529,675 | $ | 1,064,386 | $ | — | $ | 2,594,061 | $ | 1,529,675 | $ | 1,064,386 | $ | — | $ | 2,594,061 | |||||||||||||||||||||
| Net 2016 per Balance Sheet | $ | 629,385 | $ | 1,135,064 | $ | — | $ | 1,764,449 | $ | 629,385 | $ | 1,135,064 | $ | — | $ | 1,764,449 | |||||||||||||||||||||
| 2015 Gross Amount | |||||||||||||||||||||||||||||||||||||
| Patents and developed technology | $ | 2,206,852 | $ | 1,029,181 | $ | — | $ | 3,236,033 | 15.9 | ||||||||||||||||||||||||||||
| Customer relationships | — | 449,706 | — | 449,706 | 5.0 | ||||||||||||||||||||||||||||||||
| Non-compete agreements | — | 407,000 | — | 407,000 | 5.0 | ||||||||||||||||||||||||||||||||
| Intellectual property | — | 307,370 | — | 307,370 | 5.0 | ||||||||||||||||||||||||||||||||
| Total Gross Intangibles | $ | 2,206,852 | $ | 2,193,257 | $ | — | $ | 4,400,109 | 12.6 | ||||||||||||||||||||||||||||
| 2015 Accumulated Amortization | |||||||||||||||||||||||||||||||||||||
| Patents and developed technology | $ | 1,478,692 | $ | 575,026 | $ | — | $ | 2,053,718 | |||||||||||||||||||||||||||||
| Customer relationships | — | 89,941 | — | 89,941 | |||||||||||||||||||||||||||||||||
| Non-compete agreements | — | 81,400 | — | 81,400 | |||||||||||||||||||||||||||||||||
| Intellectual property | — | 61,474 | — | 61,474 | |||||||||||||||||||||||||||||||||
| Accumulated Amortization | $ | 1,478,692 | $ | 807,841 | $ | — | $ | 2,286,533 | |||||||||||||||||||||||||||||
| Net 2015 per Balance Sheet | $ | 728,160 | $ | 1,385,416 | $ | — | $ | 2,113,576 | |||||||||||||||||||||||||||||
In the event that facts and circumstances indicate that the carrying value of long-lived assets, including definite life intangible assets, may be impaired, an evaluation is performed to determine if a write-down is required. No events or changes in circumstances have occurred to indicate that the carrying amount of such long-lived assets held and used may not be recovered.
The Company performed qualitative assessments as of the end of fiscal 20162017 and fiscal 20152016 and determined it is more likely than not that no impairment of goodwill existed at the end of 20162017 or 2015.2016. The Company will perform annual qualitative assessments in subsequent years as of the end of each fiscal year. Additionally, the Company will perform interim analysis whenever conditions warrant.
Goodwill or trademarks would be considered impaired whenever the historical carrying amount exceeds the fair value. Pursuant to the qualitative assessment performed, goodwill and trademarks were not impaired in 2017, 2016 2015 or 2014.2015. Should we reach a different conclusion in the future, additional work would be performed to determine the amount of the non-cash impairment charge to be recognized. The maximum future impairment of goodwill or trademarks that could occur is the amount recognized on our balance sheet.
The following is a roll-forward of goodwill for 20162017 and 2015:2016:
Industrial Hardware Segment | Security Products Segment | Metal Products Segment | Total | |||||||||||||
| 2017 | ||||||||||||||||
| Beginning balance | $ | 1,760,793 | $ | 13,059,042 | $ | — | $ | 14,819,835 | ||||||||
| Investment in Velvac | 17,340,946 | — | — | 17,340,946 | ||||||||||||
| Foreign exchange | 68,110 | — | — | 68,110 | ||||||||||||
| Ending balance | $ | 19,169,849 | $ | 13,059,042 | $ | — | $ | 32,228,891 | ||||||||
Industrial Hardware Segment | Security Products Segment | Metal Products Segment | Total | |||||||||||||
| 2016 | ||||||||||||||||
| Beginning balance | $ | 1,731,751 | $ | 13,059,042 | $ | — | $ | 14,790,793 | ||||||||
| Foreign exchange | 29,042 | — | — | 29,042 | ||||||||||||
| Ending balance | $ | 1,760,793 | $ | 13,059,042 | $ | — | $ | 14,819,835 | ||||||||
43
Industrial Hardware Segment | Security Products Segment | Metal Products Segment | Total | ||||||||||
| 2016 | |||||||||||||
| Beginning balance | $ | 1,731,751 | $ | 13,059,042 | $ | — | $ | 14,790,793 | |||||
| Foreign exchange | 29,042 | — | — | 29,042 | |||||||||
| Ending balance | $ | 1,760,793 | $ | 13,059,042 | $ | — | $ | 14,819,835 | |||||
Industrial Hardware Segment | Security Products Segment | Metal Products Segment | Total | ||||||||||
| 2015 | |||||||||||||
| Beginning balance | $ | 1,901,312 | $ | 13,059,042 | $ | — | $ | 14,960,354 | |||||
| Foreign exchange | (169,561 | ) | — | — | (169,561 | ) | |||||||
| Ending balance | $ | 1,731,751 | $ | 13,059,042 | $ | — | $ | 14,790,793 | |||||
2. Accounting Policies(continued)
Cost of Goods Sold
Cost of goods sold reflects the cost of purchasing, manufacturing and preparing a product for sale. These costs generally represent the expenses to acquire or manufacture products for sale (including an allocation of depreciation and amortization) and are primarily comprised of direct materials, direct labor, and overhead, which includes indirect labor, facility and equipment costs, inbound freight, receiving, inspection, purchasing, warehousing and any other costs related to the purchasing, manufacturing or preparation of a product for sale.
Shipping and Handling Costs
Shipping and handling costs are included in cost of goods sold.
Engineering Costs
Engineering costs, charged to expense as incurred, were $5,622,829 in 2017, $2,568,307 in 2016 and $2,459,062 in 2015.
Selling, General and Administrative Expenses
Selling, general and administrative expenses include all operating costs of the Company that are not directly related to the cost of purchasing, manufacturing and preparing a product for sale. These expenses generally represent the cost of selling or distributing the product once it is available for sale, as well as administrative expenses for support functions and related overhead.
Research & Development Costs
Research & development costs, charged to expense as incurred, were $3,678,481 in 2017, $1,525,650 in 2016 and $1,218,948 in 2015 and $1,079,557 in 2014.2015.
Advertising Costs
The Company expenses advertising costs as incurred. Advertising costs were $526,651 in 2017, $441,853 in 2016 and $496,066 in 2015 and $494,267 in 2014.2015.
Software Development Costs
Software development costs, including costs to develop software sold, leased, or otherwise marketed, that are incurred subsequent to the establishment of technological feasibility are capitalized if significant. Costs incurred during the application development stage for internal-use software are capitalized if significant. Capitalized software development costs are amortized using the straight-line amortization method over the estimated useful life of the applicable software. Such software development costs required to be capitalized have not been material to date.
Income Taxes
The Company accounts for uncertain tax positions pursuant to the provisions of FASB Accounting Standards Codification (“ASC”("ASC") 740 which clarifies the accounting for uncertainty in income taxes recognized in a company’scompany's financial statements. These provisions detail how companies should recognize, measure, present and disclose uncertain tax positions that have or are expected to be taken. As such, the financial statements will reflect expected future tax consequences of uncertain tax positions presuming the taxing authorities’authorities' full knowledge of the position and all relevant facts. See Note 87 Income Taxes.
The Company and its U.S. subsidiaries file a consolidated federal income tax return.
Deferred tax assets and liabilities are determined based on differences between financial reporting and tax bases of assets and liabilities and are measured using the enacted tax rates and laws that will be in effect when the differences are expected to reverse.
44
The Eastern Company
Notes to Consolidated Financial Statements (continued)
2. Accounting Policies(continued)
On December, 22, 2017, SAB 118 was issued due to the complexities involved in accounting for the recently enacted Tax Act. SAB 118 requires the company to include in its financial statements a reasonable estimate of the impact of the Tax Act on earnings to the extent such estimate has been determined. Accordingly, the U.S. provision for income tax for 2017 is based on the reasonable estimate guidance provided by SAB 118. The company is continuing to assess the impact from the Tax Act and will record adjustments in 2018. The final impact on the company from the Tax Act's transition tax legislation may differ from the reasonable estimate due to the complexity of calculating and supporting with primary evidence such U.S. tax attributes as accumulated foreign earnings and profits, foreign tax paid, and other tax components involved in foreign tax credit calculations for prior years back to 1986. Such differences could be material, due to, among other things, changes in interpretations of the Tax Act, future legislative action to address questions that arise because of the Tax Act, changes in accounting standards for income taxes or related interpretations in response to the Tax Act, or any updates or changes to estimates the company has utilized to calculate the transition tax's reasonable estimate.
Earnings per Share
The denominators used in the earnings per share computations follow:
| 2016 | 2015 | 2014 | 2017 | 2016 | 2015 | ||||||||||||||
| Basic: | |||||||||||||||||||
| Weighted average shares outstanding | 6,251,535 | 6,245,057 | 6,225,068 | 6,259,139 | 6,251,535 | 6,245,057 | |||||||||||||
| Diluted: | |||||||||||||||||||
| Weighted average shares outstanding | 6,251,535 | 6,245,057 | 6,225,068 | 6,259,139 | 6,251,535 | 6,245,057 | |||||||||||||
| Dilutive stock options | — | — | 12,846 | 35,634 | — | — | |||||||||||||
| Denominator for diluted earnings per share | 6,251,535 | 6,245,057 | 6,237,914 | 6,294,773 | 6,251,535 | 6,245,057 | |||||||||||||
There were no anti-dilutive stock equivalents in 2017, 2016 2015 or 2014.2015.
Stock Based Compensation
The Company accounts for stock based compensation pursuant to the fair value recognition provisions of ASC 718. For the year ended December 30, 2017, there were 174,500 SARs and options of common stock granted under the 2010 Plan. No stock options were granted in 2016 2015 or 2014,2015, and, since all outstanding options in those years were fully vested in each year presented, there was no impact on the financial statements.
Under the terms of the Director’sDirector's Fee Program, the directors can elect to receive their director’sDirector's fees in cash or in common shares of the Company. This election is made at the beginning of each fiscal year and remains in effect for the entire year.
The Eastern Company
Fair Value of Financial Instruments
Fair value is defined as the exchange price that would be received for an asset or paid to transfer a liability (an exit price) in the principal or most advantageous market for the asset or liability in an orderly transaction between market participants on the measurement date. The company utilizes a fair value hierarchy, which maximizes the use of observable inputs and minimizes the use of unobservable inputs when measuring fair value. The fair value hierarchy has three levels of inputs that may be used to measure fair value:
| Level 1 | Unadjusted quoted prices in active markets that are accessible at the measurement date for identical, unrestricted assets or liabilities. |
| Level 2 | Quoted prices in markets that are not active; or other inputs that are observable, either directly or indirectly, for substantially the full term of the asset or liability. |
45
The Eastern Company
Notes to Consolidated Financial Statements (continued)
2. Accounting Policies(continued)
| Level 3 | Prices or valuation techniques that require inputs that are both significant to the fair value measurement and unobservable. |
The carrying amounts of other financial instruments (cash and cash equivalents, accounts receivable, accounts payable and debt) as of December 31, 201630, 2017 and January 2,December 31, 2016, approximate fair value. Fair value was based on expected cash flows and current market conditions.
The Company's interest rate swap is not an exchange-traded instrument. However, it is valued based on observable inputs for similar liabilities and accordingly is classified as Level 2. The amount of the interest rate swap is included in other accrued liabilities.
3. Business Acquisitions
The above acquisition was accounted for under ASC 805. The acquired business is included inadjusted goodwill of $17,341,000 arising from the consolidated operating resultsVelvac Acquisition consists of the Company fromdifference between the date of acquisition. The excess ofconsideration paid and the cost of Argo over the fair market value of the netassets and liabilities acquired. None of the goodwill recognized is expected to be deductible for income tax purposes. The following table summarizes the consideration paid for Velvac and the amounts of the assets acquired of $1,225,226 has been recordedand liabilities assumed recognized at the acquisition date, as goodwill.well as the fair value at the acquisition date.
| Consideration | ||||
| Cash | $ | 4,078,000 | ||
| Debt | 36,000,000 | |||
| Contingent consideration arrangement | 2,070,000 | |||
| $ | 42,148,000 | |||
| Recognized amounts of identifiable assets acquired and liabilities assumed | ||||
| at fair value | ||||
| Accounts receivable | $ | 6,063,429 | ||
| Inventory | 12,992,377 | |||
| Prepaid and other assets | 494,617 | |||
| Property plant and equipment | 3,911,767 | |||
| Other noncurrent assets | 366,401 | |||
| Other intangible assets | 11,560,000 | |||
| Current liabilities | (7,720,591 | ) | ||
| Deferred tax liabilities | (2,860,946 | ) | ||
| Total identifiable net assets | 24,807,054 | |||
| Goodwill | 17,340,946 | |||
| $ | 42,148,000 | |||
Asset Class/Description | Amount | Weighted-average Amortization Period in Years |
| Patents, technology, and licenses | ||
| Customer relationships | $ 449,706 | 5.0 |
| Intellectual property | 307,370 | 5.0 |
| Non-compete agreements | 407,000 | 5.0 |
| $ 1,164,076 | 5.0 |
46
The Eastern Company
Notes to Consolidated Financial Statements (continued)
3. Business Acquisitions (continued)
The Company determined the acquisition date fair value of the contingent consideration obligation using the Income Approach method which is a valuation technique that provides an estimate of the fair value of an asset based on the market participant expectations of the cash flows that an asset would generate over a period of time. The contingent consideration obligation was based on weighted projected cash flows discounted back to present value equivalents at a risk adjusted discount rate. The Velvac earnout is contingent upon the ability of Velvac to reach certain EBITDA targets over the course of the next five years. At each annual period, the Company will revalue the contingent consideration obligation to estimated fair value and record changes in fair value as income or expense in the Company's consolidated statement of operations.
Accounts Receivable
Acquired receivables are amounts due from customers.
Inventories
The estimated fair value of inventories acquired included a purchase price adjustment of $1,187,668 above the seller's original cost basis of $11,804,709. The entire amount was charged to cost of sales in the second quarter of 2017.
Intangible Assets
The estimated fair value of identifiable intangible assets was determined primarily using the Income Approach method which is a valuation technique that provides an estimate of the fair value of an asset based on the market participant's expectations of the cash flows that an asset would generate over its remaining useful life. Some of the more significant assumption inherent in the development of the identifiable intangible assets valuation, from the perspective of a market participant, include the estimate net cash flows for each year for each project or product, the appropriate discount rate to select in order to measure the risk inherent in each future cash flow stream, the assessment of each asset's life cycle, competitive trends impacting the asset and each cash flow stream as well as other factors.
Acquisition Related Expenses
Included in general and administrative expenses in the consolidated statements of operations for year ended December 30, 2017 was $863,000 for acquisition expenses.
4. Contingencies
The Company is party to various legal proceedings and claims related to its normal business operations. In the opinion of management, the Company has substantial and meritorious defenses for these claims and proceedings in which it is a defendant, and believes these matters will ultimately be resolved without a material adverse effect on the consolidated financial position,
results of operations or liquidity of the Company. The aggregate provision for losses related to contingencies arising in the ordinary course of business was not material to operating results for any year presented.
During 2010, the Company was contacted by the State of Illinois regarding potential ground contamination at ourits plant in Wheeling, Illinois. The Company signed up withentered into a voluntary remediation program in Illinois and has engaged an environmental clean-up company to perform testing and develop a remediation plan. Since 2010, the environmental company has completed a number of tests and the design of a final remediation system designis currently being reviewed and is expected to be approved in Fiscal 2017. In Fiscalthe first quarter of 2018. The total estimated cost for the proposed remediation system is anticipated to be approximately $50,000.
During 2016, the Company had expensescreated a plan to remediate a landfill of $10,738 relatedspent foundry sand maintained at the Company's Metal Casting facility in Syracuse, New York. This plan was presented to this issue. Finalthe New York Department of Environmental Conservation
47
The Eastern Company
Notes to Consolidated Financial Statements (continued)
4. CONTINGENCIES (continued)
(the "DEC") for approval in the first quarter of 2018. The Company is in final negotiations with the DEC, and based on estimates provided by the Company's environmental engineers, the cost to remediate
There are no other legal proceedings, other than ordinary routine litigation incidental to the Company's business, to which either the Company or any of its subsidiaries is not expected to be material.a party or of which any of property of the Company or any subsidiary is the subject.
Approximately 22%31% of the total workforce is subject to negotiated union contracts, and approximately 14%9% of the total workforce is covered by such agreements that expire during 2017.2018.
5. Debt
On January 29, 2010, the Company signed a secured Loan Agreement (the “Loan Agreement”"Loan Agreement") with People’sPeople's United Bank (“People’s”("People's") which included a $5,000,000 term portion (the "Original Term Loan") and a $10,000,000 revolving credit portion. The term portion of the loan requires quarterly principal payments of $178,571 for a period of seven (7) years, maturing on January 31, 2017. The revolving credit portion had a quarterly commitment fee of one quarter of one percent (0.25%), and a maturity date of January 31, 2012. The Loan Agreement is secured by all of the assets of the Company.
On January 25, 2012, the Company amended the Loan Agreementloan agreement by taking an additional $5,000,000 term loan (the “2012"2012 Term Loan”Loan"). The 2012 Term Loan requires quarterly principal payments of $178,571 for a period of seven (7) years, maturing on January 31, 2019. At the same time the maturity date of the revolving credit portion was extended to January 31, 2014 and continued to have a quarterly commitment fee of one quarter of one percent (0.25%).
Interest on the original termOriginal Term Loan portion of the Loan Agreement is fixed at 4.98%. Interest on the 2012 Term Loan is fixed at 3.90%. For the period from January 25, 2012 to January 23, 2014,The interest rate on the revolving credit portion of the Loan Agreement varied based on the LIBOR rate or People’sPeople's Prime rate plus a margin spread of 2.25%, with a floor rate of 3.25% withand a maturity date of January 31, 2014. On January 23, 2014, the Company amended thesigned an amendment to its secured Loan Agreement with People’s. The amendment renewed andPeople's which extended the maturity date of the revolving credit$10,000,000 revolver portion of the Loan Agreement to July 1, 2016 and changed the interest rate to LIBOR plus 2.25%, and eliminatedeliminating the 3.25% floor previously in place. The interest rate at December 31, 2016 on the revolving credit portion of the Loan Agreement was 3.02%. The quarterly commitment fee of one quarter of one percent (0.25%) remained unchanged. On June 9, 2016, the Company signed a third amendment to its secured Loan Agreement which extended the maturity date of the $10,000,000 revolver portion of the Loan Agreement to July 1, 2018.
On April 3, 2017, the Company signed an amended and restated loan agreement (the "Restated Loan Agreement") with People's United Bank that included a $31 million term portion and a $10 million revolving credit portion. Proceeds of the loan were used to repay the remaining outstanding term loan of the Company (approximately $1,429,000) and to acquire 100% of the common stock of Velvac Holdings, Inc. (see Footnote 3). The term portion of the loan requires quarterly principal payments of $387,500 for a two-year period beginning July 3, 2017. The repayment amount then increases to $775,000 per quarter beginning July 1, 2019. The term loan is a five-year loan with any remaining outstanding balance due on March 1, 2022. The revolving credit portion has a quarterly commitment fee ranging from 0.2% to 0.375% based on operating results. Under the terms of the Restated Loan Agreement, this quarterly commitment fee will be 0.25% for the first six months. The revolving credit portion has a maturity
date of April 1, 2022. On April 3, 2017, the Company did not utilizeborrowed approximately $6.6 million on the revolving credit facility. The
Company subsequently paid off $1.6 million on the revolving credit facility leaving a balance on the credit facility of $5 million as of December 30, 2017.
The interest rates on the term and revolving credit portion of the Restated Loan Agreement vary. The interest rates may vary based on the LIBOR rate plus a margin spread of 1.75% to 2.50%. The margin spread is based on operating results calculated on a rolling-four-quarter basis. The Company may also borrow funds at any time during 2015 or 2016.the lender's prime rate. On December 30, 2017, the interest rate for one half ($15.1 million) of the term portion was 3.11%, using a 1 month LIBOR rate and 3.33% on the remaining balance ($15.1 million) of the term loan based on a 3 month LIBOR rate. The interest rate on the $5 million of the revolving credit portion was 3.11%.
| 2016 | 2015 | ||||||
| Term loans | $ | 1,785,714 | $ | 3,214,285 | |||
| Revolving credit loan | — | — | |||||
| 1,785,714 | 3,214,285 | ||||||
| Less current portion | 892,857 | 1,428,571 | |||||
| $ | 892,857 | $ | 1,785,714 | ||||
On April 4, 2017, the Company entered into an interest rate swap contract with the lender with an original notional amount of $15,500,000, which is equal to 50% of the outstanding balance of the term loan on that date. The notional amount will decrease on a quarterly basis beginning July 3, 2017 following the principal repayment schedule of the term loan. The Company paidhas a fixed interest rate of $127,735 in 2016, $174,558 in 20151.92% on the swap contract and $272,993 in 2014.will pay the difference between the fixed rate and the LIBOR rate when the LIBOR rate is below 1.92% and will receive interest when the LIBOR rate exceeds 1.92%.
48
The Eastern Company
Notes to Consolidated Financial Statements (continued)
5. DEBT (continued)
Debt consists of:
| 2017 | 2016 | |||||||
| Term loans | $ | 30,225,000 | $ | 1,785,714 | ||||
| Revolving credit loan | 5,000,000 | — | ||||||
| 35,225,000 | 1,785,714 | |||||||
| Less current portion | 6,550,000 | 892,857 | ||||||
| $ | 28,675,000 | $ | 892,857 | |||||
The Company paid interest of $977,399 in 2017, $127,735 in 2016, and $174,558 in 2015.
The Company’sCompany's loan covenants under the Restated Loan Agreement require the Company to maintain a fixed chargeconsolidated minimum debt service coverage ratio of at least 1.1 to 1 for periods through December 31, 2018 and 1.2 to 1 thereafter, which is to be tested quarterly on a twelve-month trailing basis. In addition, the Company will be required to show a maximum total leverage ratio of no more than 1.75 to4.0x for periods through December 31, 2018, 3.5x for the periods from January 1, 2019 through December 31, 2019, 3.25x for the periods from January 1, 2020 through December 31, 2020 and minimum tangible net worth of $43 million increasing each year by3.0x thereafter. The Company was in compliance with all
covenants for the three month period ended December 28, 2013. As part of an amendment to the Loan Agreement signed on January 23, 2014, the leverage ratio was eliminated, and the minimum tangible net worth covenant was modified to a fixed minimum amount of $55 million, effective with the end of the Company’s first quarter of 2014.30, 2017. In addition, the Company has restrictions on, among other things, new capital leases, purchases or redemptions of its capital stock, mergers and divestitures, and new borrowing. The Company was in compliance with all covenants in 20152016 and 2016.2017.
As of December 31, 2016,30, 2017, scheduled annual principal maturities of long-term debt for each of the next five years follow:
| 2017 | $ | 892,857 | ||||||
| 2018 | 714,286 | $ | 1,550,000 | |||||
| 2019 | 178,571 | 2,325,000 | ||||||
| 2020 | — | 3,100,000 | ||||||
| 2021 | — | 3,100,000 | ||||||
| 2022 | 20,150,000 | |||||||
| Thereafter | — | — | ||||||
| $ | 1,785,714 | $ | 30,225,000 | |||||
6. Stock Rights
Stock Options
49
The Eastern Company
Notes to Consolidated Financial Statements (continued)
6. STOCK OPTIONS AND AWARDS (continued)
will retain vested stock options before exercising them, the estimated volatility of the Company's common stock price and thenumber of options that will be forfeited prior to vesting. The fair value is then amortized on a straight-line basis over the requisite service periods of the awards, which is generally the vesting period. Changes in these estimates and assumptions can materially affect the determination of the fair value of stock-based compensation and consequently, the related amount recognized in the Company's consolidated statements of operations. The Company used several assumptions which included an expected term of 3.5 years, volatility deviation of 22.6% and a risk free rate of 1.47%.
As of December 30, 2017, the Company had one stock option plan, theThe Eastern Company 2010 plan,Executive Stock Incentive Plan (the "2010 Plan"), for officers, other key employees, and non-employee directors.Directors. Incentive stock options granted under the 2010 planPlan must have exercise prices that are not less than 100% of the fair market value of the Company's common stock on the dates the stock options are granted. Restricted stock awards may also be granted to participants under the 2010 planPlan with restrictions determined by the Compensation Committee of the Company’sCompany's Board of Directors. Under the 2010 plan,Plan, non-qualified stock options granted to participants will have exercise prices determined by the Compensation Committee of the Company’sCompany's Board of Directors. NoDuring 2017, 25,000 shares were granted but not issued and during the year of 2016, no stock options or restricted stock were granted that were subject to the meeting of performance measurements.
The 2010 Plan also permits the issuance of Stock Appreciation Rights ("SARs"). The SARs are in the form of an option with a cashless exercise price equal to the difference between the fair value of the Company's common stock at the date of grant and the fair value as of the exercise date resulting in the issuance of the Company's common stock. During 2017, the Company issued 149,500 SARs and during 2016 2015 or 2014.no SARs were issued.
Stock-based compensation expense in connection with SARs granted to employees during fiscal year 2017 was approximately $172,806.
As of December 31, 2016,30, 2017, there were 500,000333,500 shares of common stock reserved and available for future grant under the above noted 2010 plan.Plan.
50
The Eastern Company
Notes to Consolidated Financial Statements (continued)
6. Stock Options and Awards (continued)
The following tables set forth the outstanding SARs for the period specified:
Year Ended December 30, 2017 | Year Ended December 31, 2016 | |||||||||||||||
| Units | Weighted - Average Exercise Price | Units | Weighted - Average Exercise Price | |||||||||||||
| Outstanding at beginning of period | — | $ | — | — | $ | — | ||||||||||
| Issued | 149,500 | 20.39 | — | — | ||||||||||||
| Forfeited | (8,000 | ) | 21.10 | — | — | |||||||||||
| Outstanding at end of period | 141,500 | 20.36 | — | — | ||||||||||||
| SARs Outstanding and Exercisable | ||||||||||||||||||||||||||
| Range of Exercise Prices | Outstanding as of December 30, 2017 | Weighted- Average Remaining Contractual Life | Weighted- Average Exercise Price | Exercisable as of December 30, 2017 | Weighted- Average Remaining Contractual Life | Weighted- Average Exercise Price | ||||||||||||||||||||
| $ | 19.10-21.10 | 141,500 | 4.2 | $ | 20.36 | — | — | — | ||||||||||||||||||
The following tables set forth the outstanding stock grants for the period specified:
Year Ended December 30, 2017 | Year Ended December 31, 2016 | |||||||||||||||
| Shares | Weighted - Average Exercise Price | Shares | Weighted - Average Exercise Price | |||||||||||||
| Outstanding at beginning of period | — | $ | — | — | $ | — | ||||||||||
| Issued | 25,000 | — | — | — | ||||||||||||
| Forfeited | — | — | — | — | ||||||||||||
| Outstanding at end of period | 25,000 | — | — | — | ||||||||||||
| Stock Grants Outstanding and Exercisable | ||||||||||||||||||||||||||
| Range of Exercise Prices | Outstanding as of December 30, 2017 | Weighted- Average Remaining Contractual Life | Weighted- Average Exercise Price | Exercisable as of December 30, 2017 | Weighted- Average Remaining Contractual Life | Weighted- Average Exercise Price | ||||||||||||||||||||
| $ | 0.00 | 25,000 | 5.0 | — | — | — | — | |||||||||||||||||||
As of December 30, 2017, outstanding SARs and options had an intrinsic value of $1,484,375.
51
The Eastern Company
Notes to Consolidated Financial Statements (continued)
7. Stock Options and Awards (continued)
Shares | Weighted Average Exercise Price | ||||||
| Outstanding at December 28, 2013 | 20,000 | $13.58 | |||||
| Exercised | (20,000 | ) | 13.58 | ||||
| Outstanding at January 3, 2015 | — | ||||||
| Exercised | — | ||||||
| Outstanding at January 2, 2016 | — | ||||||
| Exercised | — | ||||||
| Outstanding at December 31, 2016 | — | ||||||
Deferred income taxes are provided on temporary differences between the carrying amounts of assets and liabilities for financial reporting purposes and those for income tax reporting purposes. Deferred income tax (assets) liabilities relate to:
| 2016 | 2015 | 2014 | 2017 | 2016 | 2015 | |||||||||||||||||
| Property, plant and equipment | $ | 6,515,129 | $ | 6,694,885 | $ | 6,503,597 | $ | 3,853,837 | $ | 6,515,129 | $ | 6,694,885 | ||||||||||
| Intangible assets | 2,620,791 | — | — | |||||||||||||||||||
| Other | 119,618 | 99,989 | 92,531 | 64,905 | 119,618 | 99,989 | ||||||||||||||||
| Foreign Withholding Tax | 861,964 | — | — | |||||||||||||||||||
| Total deferred income tax liabilities | 6,634,747 | 6,794,874 | 6,596,128 | 7,401,497 | 6,634,747 | 6,794,874 | ||||||||||||||||
| Other postretirement benefits | (371,460 | ) | (281,154 | ) | (1,030,203 | ) | (235,510 | ) | (371,460 | ) | (281,154 | ) | ||||||||||
| Inventories | (806,680 | ) | (807,061 | ) | (829,876 | ) | (792,724 | ) | (806,680 | ) | (807,061 | ) | ||||||||||
| Allowance for doubtful accounts | (124,329 | ) | (124,351 | ) | (105,296 | ) | (97,570 | ) | (124,329 | ) | (124,351 | ) | ||||||||||
| Intangible assets | (224,609 | ) | (299,137 | ) | (396,541 | ) | — | (224,609 | ) | (299,137 | ) | |||||||||||
| Accrued compensation | (233,806 | ) | (252,297 | ) | (203,180 | ) | (83,829 | ) | (233,806 | ) | (252,297 | ) | ||||||||||
| Pensions | (9,406,224 | ) | (8,616,582 | ) | (9,275,949 | ) | (6,029,034 | ) | (9,406,224 | ) | (8,616,582 | ) | ||||||||||
| Foreign Tax Credit | (449,578 | ) | — | — | ||||||||||||||||||
| Total deferred income tax assets | (11,167,108 | ) | (10,380,582 | ) | (11,841,045 | ) | (7,688,245 | ) | (11,167,108 | ) | (10,380,582 | ) | ||||||||||
| Net deferred income tax (assets) liabilities | $ | (4,532,361 | ) | $ | (3,585,708 | ) | $ | (5,244,917 | ) | $ | (286,748 | ) | $ | (4,532,361 | ) | $ | (3,585,708 | ) | ||||
Income before income taxes consists of:
| 2017 | 2016 | 2015 | ||||||||||
| Domestic | $ | 7,513,348 | $ | 7,276,239 | $ | 4,308,809 | ||||||
| Foreign | 3,941,594 | 3,947,176 | 3,712,166 | |||||||||
| $ | 11,454,942 | $ | 11,223,415 | $ | 8,020,975 | |||||||
| 2016 | 2015 | 2014 | ||||||||
| Domestic | $ | 7,276,239 | $ | 4,308,809 | $ | 8,087,552 | ||||
| Foreign | 3,947,176 | 3,712,166 | 3,441,211 | |||||||
| $ | 11,223,415 | $ | 8,020,975 | $ | 11,528,763 | |||||
The provision for income taxes follows:
| 2017 | 2016 | 2015 | ||||||||||
| Current: | ||||||||||||
| Federal | $ | 3,713,975 | $ | 2,554,341 | $ | 1,337,417 | ||||||
| Foreign | 1,084,353 | 1,091,952 | 1,054,694 | |||||||||
| State | 319,439 | 194,514 | 140,139 | |||||||||
| Deferred: | ||||||||||||
| Federal | (47,241 | ) | (339,412 | ) | (223,530 | ) | ||||||
| Foreign | 1,301,972 | — | — | |||||||||
| State | 37,189 | (63,303 | ) | (14,788 | ) | |||||||
| $ | 6,409,687 | $ | 3,438,092 | $ | 2,293,932 | |||||||
52
The Eastern Company
Notes to Consolidated Financial Statements (continued)
| 2016 | 2015 | 2014 | ||||||||
| Current: | ||||||||||
| Federal | $ | 2,554,341 | $ | 1,337,417 | $ | 2,339,917 | ||||
| Foreign | 1,091,952 | 1,054,694 | 991,257 | |||||||
| State | 194,514 | 140,139 | 295,554 | |||||||
| Deferred: | ||||||||||
| Federal | (339,412 | ) | (223,530 | ) | 164,830 | |||||
| State | (63,303 | ) | (14,788 | ) | 75,729 | |||||
| $ | 3,438,092 | $ | 2,293,932 | $ | 3,867,287 | |||||
A reconciliation of income taxes computed using the U.S. federal statutory rate to that reflected in operations follows:
| 2016 | 2015 | 2014 | 2017 | 2016 | 2015 | ||||||||||||||||||||||||
| Amount | Percent | Amount | Percent | Amount | Percent | Amount | Percent | Amount | Percent | Amount | Percent | ||||||||||||||||||
| Income taxes using U.S. federal statutory rate | $ 3,815,962 | 34 | % | $ 2,727,131 | 34 | % | $ 3,919,779 | 34 | % | $ 3,894,680 | 34 | % | $ 3,815,962 | 34 | % | $ 2,727,131 | 34 | % | |||||||||||
| State income taxes, net of federal benefit | 87,061 | 1 | 82,987 | 1 | 249,324 | 2 | 264,205 | 2 | 87,061 | 1 | 82,987 | 1 | |||||||||||||||||
| Impact on Foreign Repatriation Tax Reform | 2,034,065 | 18 | — | — | — | — | |||||||||||||||||||||||
| Impact of foreign subsidiaries on effective tax rate | (365,528 | ) | (3 | ) | (388,132 | ) | (5 | ) | (76,914 | ) | (1 | ) | (364,569 | ) | (3) | (365,528 | ) | (3 | ) | (388,132 | ) | (5 | ) | ||||||
| Impact on New Tax Law | 531,307 | 5 | — | — | — | — | |||||||||||||||||||||||
| Impact of manufacturers deduction on effective tax rate | (140,690 | ) | (1 | ) | (91,018 | ) | (1 | ) | (185,993 | ) | (1 | ) | (123,554) | (1) | (140,690 | ) | (1 | ) | (91,018 | ) | (1 | ) | |||||||
| Other—net | 41,287 | - | (37,036 | ) | - | (38,909 | ) | - | 173,553 | 1 | 41,287 | — | (37,036 | ) | — | ||||||||||||||
| $ 3,438,092 | 31 | % | $ 2,293,932 | 29 | % | $ 3,867,287 | 34 | % | 6,409,687 | 56 | % | $ 3,438,092 | 31 | % | $ 2,293,932 | 29 | % | ||||||||||||
Total income taxes paid were $4,104,701 in 2017, $3,493,558 in 2016 and $2,348,865 in 2015 and $3,989,978 in 2014.2015.
On December 22, 2017, the United States enacted the Tax Cuts and Jobs Act (the "Act"). The Act, which is also commonly referred to as "U.S. tax reform," significantly changes U.S. corporate income tax laws by, among other provisions, reducing the maximum U.S. corporate income tax rate from 35% to 21% starting in 2018, and creating a territorial tax system with a one-time mandatory tax on previously deferred foreign earnings of U.S. subsidiaries. During the year ending December 30, 2017, the Company recognized deferred income tax expense of $531,307 as a result of the re-measurement of deferred tax assets and liabilities to the new lower statutory rate of 21%.
Due to the passage of the Tax Cut and Jobs Act, United States income taxes have been provided on the undistributed earnings of foreign subsidiaries ($16,163,93217,153,163, at December 31, 2016) only where necessary because such earnings are intended to be reinvested abroad indefinitely or repatriated only when substantially free30, 2017) as well as the associated withholding taxes from the foreign countries. The amount of such taxes. The Company would be required to accrue and pay United States income taxes to repatriate the funds held by foreign subsidiaries not otherwise provided.
The final impact on the company from the Tax Act's transition tax legislation may differ from the aforementioned reasonable estimate due to the complexity of calculating and supporting with primary evidence such U.S. tax attributes as accumulated foreign earnings and profits, foreign tax paid, and other tax components involved in foreign tax credit calculations for prior years back to 1986. Such differences could be material, due to, among other things, changes in interpretations of the Tax Act, future legislative action to address questions that arise because of the Tax Act, changes in accounting standards for income taxes or related interpretations in response to the Tax Act, or any updates or changes to estimates the company has utilized to calculate the transition tax's reasonable estimate.
Pursuant to the SAB118, the company is allowed a measurement period of up to one year after the enactment date of the Tax Act to finalize the recording of the related tax impacts.
53
The Eastern Company
Notes to Consolidated Financial Statements (continued)
7. Income Taxes (continued)
A reconciliation of the beginning and ending amount of unrecognized tax benefits are as follows:
| 2016 | 2015 | 2014 | ||||||||
| Balance at beginning of year | $ | 249,782 | $ | 248,645 | $ | 220,289 | ||||
| Increases for positions taken during the current period | 44,172 | 27,947 | 50,735 | |||||||
| Decreases relating to settlements | — | — | — | |||||||
| Decreases resulting from the expiration of the statute of limitations | (42,115 | ) | (26,810 | ) | (22,379 | ) | ||||
| Balance at end of year | $ | 251,839 | $ | 249,782 | $ | 248,645 | ||||
| 2017 | 2016 | 2015 | ||||||||||
| Balance at beginning of year | $ | 251,839 | $ | 249,782 | $ | 248,645 | ||||||
| Increases for positions taken during the current period | 53,013 | 44,172 | 27,947 | |||||||||
| Decreases resulting from the expiration of the statute of limitations | (5,118 | ) | (42,115 | ) | (26,810 | ) | ||||||
| Balance at end of year | $ | 299,734 | $ | 251,839 | $ | 249,782 | ||||||
The Company files income tax returns in the U.S. federal jurisdiction, and various states and foreign jurisdictions. With few exceptions, the Company is no longer subject to U.S. federal, state and local income tax examinations by tax authorities for years before 2013 and non-U.S. income tax examinations by tax authorities prior to 2010.2011.
Included in the balance at December 31, 2016,30, 2017, are $166,214$236,789 of unrecognized tax benefits that would affect the annual effective tax rate. In 2016,2017, the Company recognized accrued interest related to unrecognized tax benefits in income tax expense. The Company had approximately $37,000$59,316 of accrued interest at December 31, 2016.30, 2017.
The total amount of unrecognized tax benefits could increase or decrease within the next twelve months for a number of reasons, including the closure of federal, state and foreign tax years by expiration of the statute of limitations and the recognition and measurement considerations under ASC 740. The Company believes that the total amount of unrecognized tax benefits will not increase or decrease significantly over the next twelve months.
The Company leases certain equipment and buildings under operating lease arrangements. Most leases are for a fixed term and for a fixed amount; additionally, the Company leases certain buildings under operating leases on a month-to-month basis. The Company is not a party to any leases that have step rent provisions, escalation clauses, capital improvement funding or payment increases based on any index or rate.
Future minimum payments under non-cancelable operating leases with initial or remaining terms in excess of one year during each of the next five years follow:
| 2017 | $ | 1,218,047 | ||||||
| 2018 | 1,145,243 | $ | 2,178,480 | |||||
| 2019 | 741,243 | 1,538,397 | ||||||
| 2020 | 515,845 | 1,193,329 | ||||||
| 2021 | 285,088 | 704,929 | ||||||
| 2022 | 202,943 | |||||||
| $ | 3,905,466 | $ | 5,818,078 | |||||
Rent expense for all operating leases was $2,166,755 in 2017, $1,293,271 in 2016, and $1,324,365 in 2015 and $1,151,749 in 2014.2015. The Company expects future rent expense, including non-cancelable operating leases, leases that are expected to be renewed and buildings leased on a month-to-month basis, for each of the next five years to be in the range of $1,100,000$2,200,000 to $1,400,000.$2,500,000.
54
The Eastern Company
Notes to Consolidated Financial Statements (continued)
9. Retirement Benefit Plans
The Company has non-contributory defined benefit pension plans covering most U.S. employees. Plan benefits are generally based upon age at retirement, years of service and, for its salaried plan, the level of compensation. The Company also sponsors unfunded non-qualified supplemental retirement plans that provide certain former officers with benefits in excess of limits imposed by federal tax law.
The Company also provides health care and life insurance for retired salaried employees in the United States who meet specific eligibility requirements.
Effective for January 1, 2018, as a result of the collective bargaining agreement between the Illinois Lock Company and the Service Employees International Union Local, 1 C.L.C. pension accruals for the covered employees have been frozen. Under ASC 715, the Company is required to remeasure plan assets and obligations during an interim period whenever a significant event occurs that results in a material change in the net periodic pension cost. The determination of significance is based on judgment and consideration of events and circumstances affecting the pension costs. After consulting with our actuary, the freezing of benefits under the Illinois Lock Plan was considered a significant event pursuant to such standard. As a result, the Company expensed the previously unrecognized Prior Service Cost. The Eastern Company increased the expense by $14,928. The freezing of benefit accruals did not impact the pension benefit obligation. The additional recognition occurred as of the end of the fiscal year; thus, a remeasurement was not necessary.
Effective for September 1, 2017, as a result of the collective bargaining agreement between the Eberhard Manufacturing Company and the International Association of Machinists and Aerospace Workers AFL-CIO District # 54 Local #439, the following changes were made:
| · | The pension for the covered employees has been frozen for any new employees who would have entered the plan after September 1, 2017. Under ASC 715, the Company is required to remeasure plan assets and obligations during an interim period whenever a significant event occurs that results in a material change in the net periodic pension cost. The determination of significance is based on judgment and consideration of events and circumstances affecting the pension costs. After consulting with our actuary the partial freezing of benefits under the Eberhard Hourly Union Plan was not considered a significant event pursuant to such standard. The benefit formula multiplier was modified by increasing it by $.50 on September 1, 2017 and by another $.50 on each subsequent anniversary for the lifetime of the contract. The benefit multiplier will equal $45.00 at the end of the current contract (August 31, 2022). |
On April 5, 2016, the Board of Directors passed a resolution freezing the benefits of The Salaried Employees Retirement Plan of The Eastern Company (the “Salaried Plan”"Salaried Plan") effective as of May 31, 2016. Under ASC 715, the Company is required to remeasure plan assets and obligations during an interim period whenever a significant event occurs that results in a material change in the net periodic pension cost. The determination of significance is based on judgment and consideration
such standard. of events and circumstances affecting the pension costs. After consulting with our actuary the freezing of benefits under the Salaried Plan was considered a significant event pursuant to such standard.
| Measurement Date | ||||
| April 30, 2016 | December 31, 2015 | |||
Discount rate | 3.69% | 4.24% | ||
| Expected rate of return | 8.0% | 8.0% | ||
| Rate of compensation increase | -- | 3.25% | ||
| April 30, 2016 | ||||
| Discount rate | $ | 4,383,159 | ||
| Service cost | 770,361 | |||
| Interest cost | 818,565 | |||
| Actuarial loss | 611,693 | |||
| Benefits paid | (1,026,898 | ) | ||
| Additional recognition due to significant event | (2,534,589 | ) | ||
| Net increase in pension benefit obligation | $ | 3,022,291 | ||
Components of the net periodic benefit cost of the Company’sCompany's pension benefit plans for the fiscal year indicated were as follows:
| 2017 | 2016 | 2015 | ||||||||||
| Service cost | $ | 1,276,608 | $ | 1,977,295 | $ | 3,770,191 | ||||||
| Interest cost | 3,170,194 | 3,486,982 | 3,472,870 | |||||||||
| Expected return on plan assets | (4,783,531 | ) | (4,995,858 | ) | (5,151,654 | ) | ||||||
| Amortization of prior service cost | 178,874 | 200,568 | 218,585 | |||||||||
| Amortization of the net loss | 1,231,486 | 1,704,863 | 1,928,298 | |||||||||
| Net periodic benefit cost | $ | 1,073,631 | $ | 2,373,850 | $ | 4,238,290 | ||||||
| 2016 | 2015 | 2014 | ||||||||
| Service cost | $ | 1,977,295 | $ | 3,770,191 | $ | 2,837,134 | ||||
| Interest cost | 3,486,982 | 3,472,870 | 3,365,194 | |||||||
| Expected return on plan assets | (4,995,858 | ) | (5,151,654 | ) | (4,810,524 | ) | ||||
| Amortization of prior service cost | 200,568 | 218,585 | 218,585 | |||||||
| Amortization of the net loss | 1,704,863 | 1,928,298 | 944,130 | |||||||
| Net periodic benefit cost | $ | 2,373,850 | $ | 4,238,290 | $ | 2,554,519 | ||||
55
The Eastern Company
Notes to Consolidated Financial Statements (continued)
9. Retirement Benefit Plans (continued)
As a result of the freezing of the benefits of the Salaried Plan, 2016 pension expense was reduced by $2,447,000.
Assumptions used to determine net periodic benefit cost for the Company's pension benefit plans for the fiscal year indicated were as follows:
| 2017 | 2016 | 2015 | ||||||||||
| Discount rate | ||||||||||||
- Pension plans | 4.04% - 4.08 | % | 4.24% - 4.28 | % | 3.90 | % | ||||||
- Supplemental pension plans | 3.03 | % | 3.53 | % | 3.90 | % | ||||||
| Expected return on plan assets | 7.5 | % | 8.0 | % | 8.0 | % | ||||||
| Rate of compensation increase | 0 | % | 3.25 | % | 3.25 | % | ||||||
Components of the net periodic benefit cost of the Company's other postretirement benefit plan were as follows:
| 2017 | 2016 | 2015 | ||||||||||
| Service cost | $ | 27,389 | $ | 29,300 | $ | 217,570 | ||||||
| Interest cost | 80,827 | �� | 94,872 | 154,915 | ||||||||
| Expected return on plan assets | (51,494 | ) | (47,532 | ) | (91,936 | ) | ||||||
| Amortization of prior service cost | (21,444 | ) | (23,890 | ) | (23,889 | ) | ||||||
| Amortization of the net loss | (77,601 | ) | (93,921 | ) | 18,804 | |||||||
| Net periodic benefit cost | $ | (42,323 | ) | $ | (41,171 | ) | $ | 275,464 | ||||
| 2017 | 2016 | 2015 | ||||||||||
| Discount rate | 4.12 | % | 4.23 | % | 3.90 | % | ||||||
| Expected return on plan assets | 4.0 | % | 8.0 | % | 8.0 | % | ||||||
As of December 30, 2017 and December 31, 2016, the status of the Company's pension benefit plans and other postretirement benefit plan was as follows:
| Pension Benefit | Other Postretirement Benefit | |||||||||||||||
| 2017 | 2016 | 2017 | 2016 | |||||||||||||
| Benefit obligation at beginning of year | $ | 92,258,937 | $ | 87,427,769 | $ | 2,339,050 | $ | 1,981,344 | ||||||||
| Change due to availability of final actual assets and census data | — | — | — | 317,440 | ||||||||||||
| Discount rate | 6,200,491 | 2,359,745 | 181,691 | 34,471 | ) | |||||||||||
| Service cost | 1,276,608 | 1,977,295 | 27,389 | 29,300 | ||||||||||||
| Interest cost | 3,170,194 | 3,486,982 | 80,827 | 94,872 | ||||||||||||
| Actuarial (gain)/loss | (1,495,135 | ) | 2,940,154 | (65,601 | ) | 33,022 | ||||||||||
| Benefits paid | (3,385,793 | ) | (3,398,419 | ) | (139,946 | ) | (151,399 | ) | ||||||||
| Plan Amendment | 496,899 | — | — | — | ||||||||||||
| Additional recognition due to significant event | — | (2,534,589 | ) | — | — | |||||||||||
| Benefit obligation at end of year | $ | 98,522,201 | $ | 92,258,937 | $ | 2,423,410 | $ | 2,339,050 | ||||||||
56
The Eastern Company Notes to Consolidated Financial Statements (continued) 9. Retirement Benefit Plans (continued) | Pension Benefit | Other Postretirement Benefit | ||||||||||||||
| 2017 | 2016 | 2017 | 2016 | |||||||||||||
| Fair value of plan assets at beginning of year | $ | 65,627,499 | $ | 63,122,843 | $ | 1,287,350 | $ | 1,188,289 | ||||||||
| Actual return on plan assets | 9,315,225 | 4,653,349 | 103,889 | 99,061 | ||||||||||||
| Employer contributions | 541,841 | 1,249,726 | 139,946 | 151,399 | ||||||||||||
| Benefits paid | (3,385,793 | ) | (3,398,419 | ) | (139,946 | ) | (151,399 | ) | ||||||||
| Fair value of plan assets at end of year | $ | 72,098,772 | $ | 65,627,499 | $ | 1,391,239 | $ | 1,287,350 | ||||||||
The Eastern Company
Notes to Consolidated Financial Statements (continued)
| Pension Benefit | Other Postretirement Benefit | |||||||||||||||
| Funded Status | 2017 | 2016 | 2017 | 2016 | ||||||||||||
| Net amount recognized in the balance sheet | $ | (26,423,429 | ) | $ | (26,631,438 | ) | $ | (1,032,171 | ) | $ | (1,051,700 | ) | ||||
Amounts recognized in accumulated other comprehensive income consist of:
| Pension Benefit | Other Postretirement Benefit | |||||||||||||||
| 2017 | 2016 | 2017 | 2016 | |||||||||||||
| Net (loss)/gain | $ | (32,565,614 | ) | $ | (33,623,438 | ) | $ | 1,089,785 | $ | 1,231,081 | ||||||
| Prior service (cost) credit | (494,142 | ) | (176,117 | ) | 18,397 | 39,841 | ||||||||||
| $ | (33,059,756 | ) | $ | (33,799,555 | ) | $ | 1,108,182 | $ | 1,270,922 | |||||||
Change in the Company’s pension benefit plans for the fiscal year indicated were as follows:
| 2016 | 2015 | 2014 | |||
| Discount rate | |||||
- Pension plans | 4.24% - 4.28% | 3.90% | 4.80% | ||
- Supplemental pension plans | 3.53% | 3.90% | 4.80% | ||
| Expected return on plan assets | 8.0% | 8.0% | 8.0% | ||
| Rate of compensation increase | 3.25% | 3.25% | 3.25% |
| Pension Benefit | Other Postretirement Benefit | |||||||||||||||
| 2017 | 2016 | 2017 | 2016 | |||||||||||||
| Balance at beginning of period | $ | (33,799,555 | ) | $ | (32,597,167 | ) | $ | 1,270,922 | $ | 1,722,137 | ||||||
| Change due to availability of final actual assets and census data | --- | — | -- | (317,440 | ) | |||||||||||
| Charged to net periodic benefit cost | ||||||||||||||||
| Prior service cost | 178,874 | 200,568 | (21,444 | ) | (23,890 | ) | ||||||||||
| Net loss (gain) | 1,231,486 | 1,704,863 | (77,601 | ) | (93,921 | ) | ||||||||||
| Liability (gains)/losses | ||||||||||||||||
| Discount rate | (6,200,491 | ) | (2,359,745 | ) | (181,691 | ) | (34,471 | ) | ||||||||
| Asset (gains)/losses deferred | 5,978,071 | (4,325,232 | ) | 52,395 | 51,529 | |||||||||||
| Additional recognition due to plan amendment | (496,899 | ) | 2,534,589 | — | — | |||||||||||
| Other | 48,758 | 1,042,569 | 65,601 | (33,022 | ) | |||||||||||
| Balance at end of period | $ | (33,059,756 | ) | $ | (33,799,555 | ) | $ | 1,108,182 | $ | 1,270,922 | ||||||
In 2017, the net periodic pension benefit cost included $1,118,370 of net loss and $120,968 of prior service cost and the Company’snet periodic other postretirement benefit plan were as follows:
| 2016 | 2015 | 2014 | ||||||||
| Service cost | $ | 29,300 | $ | 217,570 | $ | 173,902 | ||||
| Interest cost | 94,872 | 154,915 | 157,481 | |||||||
| Expected return on plan assets | (47,532 | ) | (91,936 | ) | (22,434 | ) | ||||
| Amortization of prior service cost | (23,890 | ) | (23,889 | ) | (23,888 | ) | ||||
| Amortization of the net loss | (93,921 | ) | 18,804 | (72,378 | ) | |||||
| Net periodic benefit cost | $ | (41,171 | ) | $ | 275,464 | $ | 212,683 | |||
| 2016 | 2015 | 2014 | |||
| Discount rate | 4.23% | 3.90% | 4.8% | ||
| Expected return on plan assets | 8.0% | 8.0% | 8.0% |
| Pension Benefit | Other Postretirement Benefit | ||||||||||||
| 2016 | 2015 | 2016 | 2015 | ||||||||||
| Benefit obligation at beginning of year | $ | 87,427,769 | $ | 90,516,922 | $ | 1,981,344 | $ | 4,055,112 | |||||
| Change due to availability of final actual assets and census data | — | — | 317,440 | 346 | |||||||||
| Discount rate | 2,359,745 | (4,121,170 | ) | 34,471 | (87,748 | ) | |||||||
| Service cost | 1,977,295 | 3,770,191 | 29,300 | 217,570 | |||||||||
| Interest cost | 3,486,982 | 3,472,870 | 94,872 | 154,915 | |||||||||
| Actuarial (gain)/loss | 2,940,154 | (3,316,552 | ) | 33,022 | (2,235,904 | ) | |||||||
| Benefits paid | (3,398,419 | ) | (2,894,492 | ) | (151,399 | ) | (122,947 | ) | |||||
| Additional recognition due to significant event | (2,534,589 | ) | — | — | — | ||||||||
| Benefit obligation at end of year | $ | 92,258,937 | $ | 87,427,769 | $ | 2,339,050 | $ | 1,981,344 | |||||
| Pension Benefit | Other Postretirement Benefit | |||||||||||||
| 2016 | 2015 | 2016 | 2015 | |||||||||||
| Fair value of plan assets at beginning of year | $ | 63,122,843 | $ | 64,352,110 | $ | 1,188,289 | $ | 1,149,204 | ||||||
| Actual return on plan assets | 4,653,349 | (1,340,977 | ) | 99,061 | 39,085 | |||||||||
| Employer contributions | 1,249,726 | 3,006,202 | 151,399 | 122,947 | ||||||||||
| Benefits paid | (3,398,419 | ) | (2,894,492 | ) | (151,399 | ) | (122,947 | ) | ||||||
| Fair value of plan assets at end of year | $ | 65,627,499 | $ | 63,122,843 | $ | 1,287,350 | $ | 1,188,289 | ||||||
prior service credit.
57
The Eastern Company
Notes to Consolidated Financial Statements (continued)
| Pension Benefit | Other Postretirement Benefit | ||||||||||||
| Funded Status | 2016 | 2015 | 2016 | 2015 | |||||||||
| Net amount recognized in the balance sheet | $ | (26,631,438 | ) | $ | (24,304,926 | ) | $ | (1,051,700 | ) | $ | (793,055 | ) | |
| Pension Benefit | Other Postretirement Benefit | ||||||||||||
| 2016 | 2015 | 2016 | 2015 | ||||||||||
| Net (loss)/gain | $ | (33,623,438 | ) | $ | (32,220,482 | ) | $ | 1,231,081 | $ | 1,658,406 | |||
| Prior service (cost) credit | (176,117 | ) | (376,685 | ) | 39,841 | 63,731 | |||||||
| $ | (33,799,555 | ) | $ | (32,597,167 | ) | $ | 1,270,922 | $ | 1,722,137 | ||||
| Pension Benefit | Other Postretirement Benefit | ||||||||||||
| 2016 | 2015 | 2016 | 2015 | ||||||||||
| Balance at beginning of period | $ | (32,597,167 | ) | $ | (35,689,141 | ) | $ | 1,722,137 | $ | (543,233 | ) | ||
| Change due to availability of final actual assets and census data | — | — | (317,440 | ) | (346 | ) | |||||||
| Charged to net periodic benefit cost | |||||||||||||
| Prior service cost | 200,568 | 218,585 | (23,890 | ) | (23,889 | ) | |||||||
| Net loss (gain) | 1,704,863 | 1,928,298 | (93,921 | ) | 18,804 | ||||||||
| Liability (gains)/losses | |||||||||||||
| Discount rate | (2,359,745 | ) | 4,121,170 | (34,471 | ) | 87,748 | |||||||
| Asset (gains)/losses deferred | (4,325,232 | ) | (2,813,796 | ) | 51,529 | (52,851 | ) | ||||||
| Additional recognition due to significant event | 2,534,589 | — | — | — | |||||||||
| Other | 1,042,569 | (362,283 | ) | (33,022 | ) | 2,235,904 | |||||||
| Balance at end of period | $ | (33,799,555 | ) | $ | (32,597,167 | ) | $ | 1,270,922 | $ | 1,722,137 | |||
Assumptions used to determine the projected benefit obligations for the Company’sCompany's pension benefit plans and other postretirement benefit plan for the fiscal year indicated were as follows:
| 2017 | 2016 | ||||||||||
| Discount rate | |||||||||||
| - | Pension plans | 3.54% - 3.57 | % | 4.04% - 4.08 | % | ||||||
| - | Supplemental pension plans | 3.10 | % | 3.03 | % | ||||||
| - | Other postretirement plan | 3.60 | % | 4.12 | % | ||||||
| 2016 | 2015 | |||
| Discount rate | ||||
| - | Pension plans | 4.04% - 4.08% | 4.24% - 4.28% | |
| - | Supplemental pension plans | 3.03% | 3.53% | |
| - | Other postretirement plan | 4.12% | 4.23% | |
At December
Information for the under-funded pension plans with a projected benefit obligation and an accumulated benefit obligation in excess of plan assets:
| 2017 | 2016 | |||||||
| Number of plans | 6 | 6 | ||||||
| Projected benefit obligation | $ | 98,522,201 | $ | 92,258,937 | ||||
| Accumulated benefit obligation | 98,522,201 | 92,258,937 | ||||||
| Fair value of plan assets | 72,098,722 | 65,627,499 | ||||||
| Net amount recognized in accrued benefit liability | (26,423,429 | ) | (26,631,438 | ) | ||||
| 2015 | 2015 | ||||||
| Number of plans | 6 | 6 | |||||
| Projected benefit obligation | $ | 92,258,937 | $ | 87,427,769 | |||
| Accumulated benefit obligation | 92,258,937 | 83,433,339 | |||||
| Fair value of plan assets | 65,627,499 | 63,122,843 | |||||
| Net amount recognized in accrued benefit liability | (26,631,438 | ) | (24,304,926 | ) | |||
Estimated future benefit payments to participants of the Company's pension plans are $3.8 million in 2018, $4.1 million in 2019, $4.3 million in 2020, $4.6 million in 2021, $4.8 million in 2022 and a total of $26.8 million from 2023 through 2027.
Estimated future benefit payments to participants of the Company’s pension plansCompany's other postretirement plan are $3.8 million in 2017, $4.0 million$105,000 in 2018, $4.2 million$106,000 in 2019, $4.5 million$107,000 in 2020, $4.7 million$109,000 in 2021, $110,000 in 2022 and a total of $26.2 million$569,000 from 20222023 through 2026.
The Company expects to make cash contributions to its qualified pension plans of approximately $700,000$510,000 and to its other postretirement plan of approximately $103,000$105,000 in 2017.2018.
We consider a number of factors in determining and selecting assumptions for the overall expected long-term rate of return on plan assets. We consider the historical long-term return experience of our assets, the current and expected allocation of our plan assets, and expected long-term rates of return. We derive these expected long-term rates of return with the assistance of our investment advisors and generally base these rates on a 10-year horizon for various asset classes and consider the expected positive impact of active investment management. We base our expected allocation of plan assets on a diversified portfolio consisting of domestic and international equity securities and fixed income securities.
We consider a variety of factors in determining and selecting our assumptions for the discount rate at the end of the year. In 2016,2017, as in 20152016, we developed each plan’splan's discount rate with the assistance of our actuaries by matching expected future benefit payments in each year to the corresponding spot rates from the Citigroup Pension Liability Yield Curve, comprised of high quality (rated AA or better) corporate bonds. Prior to 2015, we used the same process to determine each individual plan’s discount rate, but the average of these rates was used to determine a single rate for all plans.
During 2016, as a result of a legal separation of the Russell Indexes from Russell Investments into different companies with different ownership, the name of our Trustee changed from Russell Trust Company to Russell Investment Trust Company (“RITC”("RITC").
58
The Eastern Company
Notes to Consolidated Financial Statements (continued)
The fair values of the company’scompany's pension plans assets at December 31, 201630, 2017 and January 2,December 31, 2016, utilizing the fair value hierarchy discussed in Note 2, follow:
| December 31, 2016 | |||||||||||||
| Level 1 | Level 2 | Level 3 | Total | ||||||||||
Cash and Equivalents: | |||||||||||||
| Common/collective trust funds | $ | — | $ | 276,129 | $ | — | $ | 276,129 | |||||
Equities: | |||||||||||||
| The Eastern Company Common Stock | 4,535,676 | — | — | 4,535,676 | |||||||||
| Common/collective trust funds | |||||||||||||
| RITC Large Cap Defensive Equity Fund (a) | — | 7,131,589 | — | 7,131,589 | |||||||||
| RITC Equity II Fund (b) | — | 4,875,234 | — | 4,875,234 | |||||||||
| RITC Large Cap U.S. Equity Fund (c) | — | 5,984,636 | — | 5,984,636 | |||||||||
| RITC International Fund with Active Currency (d) | — | 8,178,635 | — | 8,178,635 | |||||||||
| RITC Emerging Markets Fund (e) | — | 3,373,089 | — | 3,373,089 | |||||||||
Fixed Income: | |||||||||||||
| Common/collective trust funds | |||||||||||||
| RITC Fixed Income I Fund (f) | — | 8,700,175 | — | 8,700,175 | |||||||||
| Target Duration LDI Fixed Income Funds (g) | |||||||||||||
· RITC 8 Year LDI Fixed Income Fund | — | 1,499,390 | — | 1,499,390 | |||||||||
· RITC 10 Year LDI Fixed Income Fund | — | 1,851,317 | — | 1,851,317 | |||||||||
· RITC 12 Year LDI Fixed Income Fund | — | 2,122,411 | — | 2,122,411 | |||||||||
· RITC 14 Year LDI Fixed Income Fund | — | 3,790,209 | — | 3,790,209 | |||||||||
· RITC 16 Year LDI Fixed Income Fund | — | 5,650,440 | — | 5,650,440 | |||||||||
| STRIPS Fixed Income Funds (h) | |||||||||||||
· RITC 15 Year STRIPS Fixed Income Fund | — | 2,504,395 | — | 2,504,395 | |||||||||
· RITC 10 Year STRIPS Fixed Income Fund | — | 1,407,518 | — | 1,407,518 | |||||||||
· RITC 28 to 29 Year STRIPS Fixed Income Fund | — | 464,106 | — | 464,106 | |||||||||
| Insurance contracts | — | 3,282,552 | — | 3,282,552 | |||||||||
| Total | $ | 4,535,676 | $ | 61,091,825 | $ | — | $ | 65,627,501 | |||||
| December 30, 2017 | ||||||||||||||||
| Level 1 | Level 2 | Level 3 | Total | |||||||||||||
Cash and Equivalents: | ||||||||||||||||
| Common/collective trust funds | $ | — | $ | 278,016 | $ | — | $ | 278,016 | ||||||||
Equities: | ||||||||||||||||
| The Eastern Company Common Stock | 5,675,021 | — | 5,675,021 | |||||||||||||
| Common/collective trust funds | ||||||||||||||||
| Russell Multi Asset Core Plus Fund (a) | — | 31,642,837 | — | 31,642,837 | ||||||||||||
Fixed Income: | ||||||||||||||||
| Common/collective trust funds | ||||||||||||||||
| Target Duration LDI Fixed Income Funds (b) | ||||||||||||||||
· Russell 8 Year LDI Fixed Income Fund | — | 6,033,648 | — | 6,033,648 | ||||||||||||
· Russell 14 Year LDI Fixed Income Fund | — | 18,083,206 | — | 18,083,206 | ||||||||||||
| STRIPS Fixed Income Funds (c) | ||||||||||||||||
· Russell 15 Year STRIPS Fixed Income Fund | — | 1,905,068 | — | 1,905,068 | ||||||||||||
· Russell 10 Year STRIPS Fixed Income Fund | — | 3,570,427 | — | 3,570,427 | ||||||||||||
· Russell 28 to 29 Year STRIPS Fixed Income Fund | — | 2,144,581 | — | 2,144,581 | ||||||||||||
| Insurance contracts | — | 2,765,967 | — | 2,765,967 | ||||||||||||
| Total | $ | 5,675,021 | $ | 66,423,750 | $ | — | $ | 72,098,771 | ||||||||
59
The Eastern Company
Notes to Consolidated Financial Statements (continued)
| December 31, 2016 | ||||||||||||||||
| Level 1 | Level 2 | Level 3 | Total | |||||||||||||
Cash and Equivalents: | ||||||||||||||||
| Common/collective trust funds | $ | — | $ | 276,129 | $ | — | $ | 276,129 | ||||||||
Equities: | ||||||||||||||||
| The Eastern Company Common Stock | 4,535,676 | — | — | 4,535,676 | ||||||||||||
| Common/collective trust funds | ||||||||||||||||
| RITC Large Cap Defensive Equity Fund (a) | — | 7,131,589 | — | 7,131,589 | ||||||||||||
| RITC Equity II Fund (b) | — | 4,875,234 | — | 4,875,234 | ||||||||||||
| RITC Large Cap U.S. Equity Fund (c) | — | 5,984,636 | — | 5,984,636 | ||||||||||||
| RITC International Fund with Active Currency | — | 8,178,635 | — | 8,178,635 | ||||||||||||
| RITC Emerging Markets Fund | — | 3,373,089 | — | 3,373,089 | ||||||||||||
Fixed Income: | ||||||||||||||||
| Common/collective trust funds | ||||||||||||||||
| RITC Fixed Income I Fund | — | 8,700,175 | — | 8,700,175 | ||||||||||||
| Target Duration LDI Fixed Income Funds | ||||||||||||||||
· RITC 8 Year LDI Fixed Income Fund | — | 1,499,390 | — | 1,499,390 | ||||||||||||
· RITC 10 Year LDI Fixed Income Fund | — | 1,851,317 | — | 1,851,317 | ||||||||||||
· RITC 12 Year LDI Fixed Income Fund | — | 2,122,411 | — | 2,122,411 | ||||||||||||
· RITC 14 Year LDI Fixed Income Fund | — | 3,790,209 | — | 3,790,209 | ||||||||||||
· RITC 16 Year LDI Fixed Income Fund | — | 5,650,440 | — | 5,650,440 | ||||||||||||
| STRIPS Fixed Income Funds | ||||||||||||||||
· RITC 15 Year STRIPS Fixed Income Fund | — | 2,504,395 | — | 2,504,395 | ||||||||||||
· RITC 10 Year STRIPS Fixed Income Fund | — | 1,407,518 | — | 1,407,518 | ||||||||||||
· RITC 28 to 29 Year STRIPS Fixed Income Fund | — | 464,106 | — | 464,106 | ||||||||||||
| Insurance contracts | — | 3,282,552 | — | 3,282,552 | ||||||||||||
| Total | $ | 4,535,676 | $ | 61,091,825 | $ | — | $ | 65,627,501 | ||||||||
| January 2, 2016 | |||||||||||||
| Level 1 | Level 2 | Level 3 | Total | ||||||||||
Cash and Equivalents: | |||||||||||||
| Common/collective trust funds | $ | — | $ | 236,209 | $ | — | $ | 236,209 | |||||
Equities: | |||||||||||||
| The Eastern Company Common Stock | 4,069,088 | — | — | 4,069,088 | |||||||||
| Common/collective trust funds | |||||||||||||
| Russell Large Cap Defensive Equity Fund | — | 6,685,388 | — | 6,685,388 | |||||||||
| Russell Equity II Fund | — | 4,456,364 | — | 4,456,364 | |||||||||
| Russell Large Cap U.S. Equity Fund | — | 5,575,535 | — | 5,575,535 | |||||||||
| Russell International Fund with Active Currency | — | 7,796,625 | — | 7,796,625 | |||||||||
| Russell Emerging Markets Fund | — | 3,350,136 | — | 3,350,136 | |||||||||
| Fixed Income: | |||||||||||||
| Common/collective trust funds | |||||||||||||
| Russell Fixed Income I Fund | — | 8,504,086 | — | 8,504,086 | |||||||||
| Target Duration LDI Fixed Income Funds | |||||||||||||
· Russell 8 Year LDI Fixed Income Fund | — | 1,478,701 | — | 1,478,701 | |||||||||
· Russell 10 Year LDI Fixed Income Fund | — | 1,840,616 | — | 1,840,616 | |||||||||
· Russell 12 Year LDI Fixed Income Fund | — | 2,119,786 | — | 2,119,786 | |||||||||
· Russell 14 Year LDI Fixed Income Fund | — | 3,795,220 | — | 3,795,220 | |||||||||
· Russell 16 Year LDI Fixed Income Fund | — | 5,615,278 | — | 5,615,278 | |||||||||
| STRIPS Fixed Income Funds | |||||||||||||
· Russell 15 Year STRIPS Fixed Income Fund | — | 2,606,554 | — | 2,606,554 | |||||||||
· Russell 10 Year STRIPS Fixed Income Fund | — | 1,411,574 | — | 1,411,574 | |||||||||
· Russell 28 to 29 Year STRIPS Fixed Income Fund | — | 543,357 | — | 543,357 | |||||||||
| Insurance contracts | — | 3,038,326 | — | 3,038,326 | |||||||||
| Total | $ | 4,069,088 | $ | 59,053,755 | $ | — | $ | 63,122,843 | |||||
Equity common funds primarily hold publicly traded common stock of both U.S and international companies selected for purposes of total return and to maintain equity exposure consistent with policy allocations. The Level 1 investment is made up of shares of The Eastern Company Common Stock and is valued at market price. Level 2 investments include commingled funds valued at unit values provided by the investment managers, which are based on the fair value of the underlying publicly traded securities.
60
The Eastern Company
Notes to Consolidated Financial Statements (continued)
| (a) | The investment objective of the RITC (formerly Russell) |
The Target Duration LDI Fixed Income Funds seek to outperform their respective Barclays-Russell LDI Indexes over a full market cycle. These Funds invest primarily in investment grade corporate bonds that closely match those found in discount curves used to value U.S. pension liabilities. They seek to provide additional incremental return through modest interest rate timing, security selection and tactical use of non-credit sectors. Generally for use in combination with other bond funds to gain additional credit exposure, with the goal of reducing the mismatch between a |
The STRIPS (Separate Trading of Registered Interest and Principal of Securities) Funds seek to provide duration and Treasury exposure by investing in an optimized subset of the STRIPS universe with a similar duration profile as the Barclays U.S. Treasury STRIPS 10-11 year, 16-16 year or 28-29 year Index. These passively managed funds are generally used with other bond funds to add additional duration to the asset portfolio. This will help reduce the mismatch between a |
The investment portfolio contains a diversified blend of common stocks, bonds, cash equivalents, and other investments, which may reflect varying rates of return. The investments are further diversified within each asset classification. The portfolio diversification provides protection against a single security or class of securities having a disproportionate impact on aggregate performance. The Company has elected to change its investment strategy to better match the assets with the underlying plan liabilities. Currently, the long-term target allocations for plan assets are 50% in equities and 50% in fixed income although the actual plan asset allocations may be within a range around these targets. The actual asset allocations are reviewed and rebalanced on a periodic basis to maintain the target allocations. It is expected that, as the funded status of the plans improves, more assets will be invested in long-duration fixed income instruments.
The plans’plans' assets include 217,018 shares of the common stock of the Company having a market value of $$5,675,021 and $4,535,676 at December 30, 2017 and $4,069,938 at December 31, 2016, and January 2, 2016, respectively. The Salaried Pension Plan purchased 14,456 shares of common stock at a cost of $232,124 during 2015. No shares were purchased in 2017 or 2016 nor were and shares sold in either period. Dividends received during 20162017 and 20152016 on the common stock of the Company were $95,488 and $92,743$95,488 respectively.
| December 31, 2016 | |||||||||||||
| Level 1 | Level 2 | Level 3 | Total | ||||||||||
| Fixed Income: | |||||||||||||
| Insurance contracts | $ | — | $ | — | $ | 1,287,350 | $ | 1,287,350 | |||||
| Total | $ | — | $ | — | $ | 1,287,350 | $ | 1,287,350 | |||||
| January 2, 2016 | ||||||||||||
| Level 1 | Level 2 | Level 3 | Total | |||||||||
| Fixed Income: | ||||||||||||
| Insurance contracts | $ | — | $ | — | $ | 1,188,289 | $ | 1,188,289 | ||||
| Total | $ | — | $ | — | $ | 1,188,289 | $ | 1,188,289 | ||||
| 2016 | 2015 | |||||||
| Fair value of Level 3 assets at beginning of year | $ | 1,188,289 | $ | 1,149,204 | ||||
| Change due to availability of final actual assets and census data | — | — | ||||||
| Actual return on plan assets | 99,061 | 39,085 | ||||||
| Employer contributions | 92,898 | 81,360 | ||||||
| Benefits paid | (92,898 | ) | (81,360 | ) | ||||
| Fair value of Level 3 assets at end of year | $ | 1,287,350 | $ | 1,188,289 | ||||
U.S. salaried and non-union hourly employees and most employees of the Company’sCompany's Canadian subsidiaries are covered by defined contribution plans.
The Company has a contributory savings plan under Section 401(k) of the Internal Revenue Code covering substantially all U.S. non-union employees. This plan allows participants to make voluntary contributions of up to 100% of their annual compensation on a pretax basis, subject to IRS limitations. The plan provides for contributions by the Company at its discretion.
61
The Eastern Company approved a 50% match on the first 4% of employee contributions.
Notes to Consolidated Financial Statements (continued)
9. Retirement Benefit Plans (continued)
The Company amended the Eastern Company Savings and Investment Plan (“("401(k) Plan Amendment”Amendment") effective June 1, 2016. The 401(k) Plan Amendment increased this match to 50% of the first 6% of contributions for the remainder of Fiscal 2016. The 401(k) Plan Amendment also provided for an additional non-discretionary contribution (the “transitional credit”"transitional credit") for certain non-union U.S. employees who were eligible to participate in the Salaried Plan. The amount of this non-discretionary contribution ranges from 0% to 4% of wages, based on the age of the individual on June 1, 2016. Also in December 2015, the Company approved a non-discretionary profit sharing contribution of 2.5% for the benefit of all non-union U.S. employees who were not eligible for the Company’s Salaried Plan. The 401(k) Plan Amendment increased the non-discretionary safe harbor contribution to 3%, and changed the eligibility to all non-union U.S. employees.
The Company made contributions to the plan as follows:
| 2016 | 2015 | 2014 | 2017 | 2016 | 2015 | |||||||||||||||
| Regular matching contributions | $ | 328,144 | $ | 232,399 | $ | 186,545 | $ | 465,671 | $ | 328,144 | $ | 232,399 | ||||||||
| Transitional credit contributions | 231,847 | --- | --- | 385,578 | 231,847 | — | ||||||||||||||
| Non-discretionary contributions | 51,470 | --- | --- | 355,747 | 51,470 | — | ||||||||||||||
| Total contributions made for the period | $ | 611,461 | $ | 232,399 | $ | 186,545 | $ | 1,206,996 | $ | 611,461 | $ | 232,399 | ||||||||
2017 and is included in the 2017 figure. The non-discretionary contribution for $51,470 was expensed in Fiscal 2015 and contributed to the Plan in Fiscal 2016.
62
The Eastern Company
Notes to Consolidated Financial Statements (continued)
| 2016 | 2015 | 2014 | 2017 | 2016 | 2015 | |||||||||||||||||
Sales: Sales to unaffiliated customers: | ||||||||||||||||||||||
| Industrial Hardware | $ | 61,058,871 | $ | 61,338,812 | $ | 58,666,229 | $ | 115,273,233 | $ | 61,058,871 | $ | 61,338,812 | ||||||||||
| Security Products | 57,255,101 | 56,598,487 | 49,381,553 | 60,976,998 | 57,255,101 | 56,598,487 | ||||||||||||||||
| Metal Products | 19,294,286 | 26,630,652 | 32,777,578 | 27,989,382 | 19,294,286 | 26,630,652 | ||||||||||||||||
| $ | 137,608,258 | $ | 144,567,951 | $ | 140,825,360 | $ | 204,239,613 | $ | 137,608,258 | $ | 144,567,951 | |||||||||||
| Inter-segment Sales: | ||||||||||||||||||||||
| Industrial Hardware | $ | 524,536 | $ | 637,405 | $ | 595,596 | ||||||||||||||||
| Security Products | 2,935,797 | 2,716,802 | 2,813,576 | |||||||||||||||||||
| Metal Products | 21,431 | — | 16,804 | |||||||||||||||||||
| $ | 3,481,764 | $ | 3,354,207 | $ | 3,425,976 | |||||||||||||||||
| Income Before Income Taxes: | ||||||||||||||||||||||
| Industrial Hardware | $ | 5,126,128 | $ | 5,683,730 | $ | 4,314,149 | ||||||||||||||||
| Security Products | 6,099,777 | 5,677,264 | 3,798,115 | |||||||||||||||||||
| Metal Products | 1,050,796 | (225,122 | ) | (84,536 | ) | |||||||||||||||||
| Operating Profit | 12,276,701 | 11,135,872 | 8,027,728 | |||||||||||||||||||
| Interest expense | (976,512 | ) | (121,500 | ) | (185,475 | ) | ||||||||||||||||
| Other income | 154,753 | 209,043 | 178,722 | |||||||||||||||||||
| $ | 11,454,942 | $ | 11,223,415 | $ | 8,020,975 | |||||||||||||||||
| Geographic Information: | ||||||||||||||||||||||
| Net Sales: | ||||||||||||||||||||||
| United States | $ | 178,124,818 | $ | 117,679,860 | $ | 126,115,036 | ||||||||||||||||
| Foreign | 26,114,795 | 19,928,398 | 18,452,915 | |||||||||||||||||||
| $ | 204,239,613 | $ | 137,608,258 | $ | 144,567,951 | |||||||||||||||||
| Foreign sales are primarily to customers in North America. | Foreign sales are primarily to customers in North America. | |||||||||||||||||||||
| Identifiable Assets: | ||||||||||||||||||||||
| United States | $ | 153,712,643 | $ | 107,031,435 | $ | 106,662,743 | ||||||||||||||||
| Foreign | 22,745,754 | 17,166,961 | 15,075,816 | |||||||||||||||||||
| $ | 176,458,397 | $ | 124,198,396 | $ | 121,738,559 | |||||||||||||||||
| Industrial Hardware | $ | 44,828,458 | $ | 32,278,281 | $ | 30,425,348 | ||||||||||||||||
| Security Products | 53,724,837 | 49,520,708 | 52,688,497 | |||||||||||||||||||
| Metal Products | 18,126,395 | 18,447,526 | 20,931,863 | |||||||||||||||||||
| 116,679,690 | 100,246,515 | 104,045,708 | ||||||||||||||||||||
| General corporate | 59,778,707 | 23,951,881 | 17,692,851 | |||||||||||||||||||
| $ | 176,458,397 | $ | 124,198,396 | $ | 121,738,559 | |||||||||||||||||
| Inter-segment Sales: | ||||||||||
| Industrial Hardware | $ | 637,405 | $ | 595,596 | $ | 984,192 | ||||
| Security Products | 2,716,802 | 2,813,576 | 2,565,733 | |||||||
| Metal Products | — | 16,804 | — | |||||||
| $ | 3,354,207 | $ | 3,425,976 | $ | 3,549,925 |
| Income Before Income Taxes: | ||||||||||
| Industrial Hardware | $ | 5,683,730 | $ | 4,314,149 | $ | 5,063,786 | ||||
| Security Products | 5,677,264 | 3,798,115 | 4,058,554 | |||||||
| Metal Products | (225,122 | ) | (84,536 | ) | 2,596,308 | |||||
| Operating Profit | 11,135,872 | 8,027,728 | 11,718,648 | |||||||
| Interest expense | (121,500 | ) | (185,475 | ) | (254,576 | ) | ||||
| Other income | 209,043 | 178,722 | 64,691 | |||||||
| $ | 11,223,415 | $ | 8,020,975 | $ | 11,528,763 | |||||
| Geographic Information: | ||||||||||
| Net Sales: | ||||||||||
| United States | $ | 117,679,860 | $ | 126,115,036 | $ | 117,478,557 | ||||
| Foreign | 19,928,398 | 18,452,915 | 23,346,803 | |||||||
| $ | 137,608,258 | $ | 144,567,951 | $ | 140,825,360 |
| Identifiable Assets: | ||||||||||
| United States | $ | 107,031,435 | $ | 106,662,743 | $ | 105,771,961 | ||||
| Foreign | 17,166,961 | 15,075,816 | 15,498,595 | |||||||
| $ | 124,198,396 | $ | 121,738,559 | $ | 121,270,556 | |||||
| Industrial Hardware | $ | 32,278,281 | $ | 30,425,348 | $ | 29,660,695 | ||||
| Security Products | 49,520,708 | 52,688,497 | 51,573,271 | |||||||
| Metal Products | 18,447,526 | 20,931,863 | 21,037,058 | |||||||
| 100,246,515 | 104,045,708 | 102,271,004 | ||||||||
| General corporate | 23,951,881 | 17,692,851 | 18,999,552 | |||||||
| $ | 124,198,396 | $ | 121,738,559 | $ | 121,270,556 |
63
The Eastern Company
Notes to Consolidated Financial Statements (continued)
10. 11. Reportable Segments (continued)
| 2017 | 2016 | 2015 | ||||||||||
| Depreciation and Amortization: | ||||||||||||
| Industrial Hardware | $ | 2,526,460 | $ | 1,468,904 | $ | 1,580,741 | ||||||
| Security Products | 964,873 | 980,048 | 1,010,262 | |||||||||
| Metal Products | 1,227,852 | 1,365,441 | 1,330,435 | |||||||||
| $ | 4,719,185 | $ | 3,814,393 | $ | 3,921,438 | |||||||
| Capital Expenditures: | ||||||||||||
| Industrial Hardware | $ | 1,151,868 | $ | 648,516 | $ | 1,479,984 | ||||||
| Security Products | 705,178 | 1,018,371 | 388,377 | |||||||||
| Metal Products | 899,663 | 1,153,872 | 632,016 | |||||||||
| 2,756,709 | 2,820,759 | 2,500,377 | ||||||||||
| Currency translation adjustment | 6,240 | (8,889 | ) | 25,020 | ||||||||
| General corporate | — | 51,600 | 12,839 | |||||||||
| $ | 2,762,949 | $ | 2,863,470 | $ | 2,538,236 | |||||||
| 2016 | 2015 | 2014 | ||||||||
| Depreciation and Amortization: | ||||||||||
| Industrial Hardware | $ | 1,468,904 | $ | 1,580,741 | $ | 1,631,521 | ||||
| Security Products | 980,048 | 1,010,262 | 621,501 | |||||||
| Metal Products | 1,365,441 | 1,330,435 | 1,233,280 | |||||||
| $ | 3,814,393 | $ | 3,921,438 | $ | 3,486,302 | |||||
| Capital Expenditures: | ||||||||||
| Industrial Hardware | $ | 648,516 | $ | 1,479,984 | $ | 1,929,022 | ||||
| Security Products | 1,018,371 | 388,377 | 973,365 | |||||||
| Metal Products | 1,153,872 | 632,016 | 644,851 | |||||||
| 2,820,759 | 2,500,377 | 3,567,238 | ||||||||
| Currency translation adjustment | (8,889 | ) | 25,020 | 10,347 | ||||||
| General corporate | 51,600 | 12,839 | 55,580 | |||||||
| $ | 2,863,470 | $ | 2,538,236 | $ | 3,633,165 |
In May 2014, the FASB issued ASU No. 2014-09, Revenue from Contracts with Customers. ASU No. 2014-09 provides authoritative guidance which impacts virtually all aspects of an entity's revenue recognition. The core principle of the new standard is that revenue should be recognized to depict the transfer of promised goods or services to customers in an amount that reflects the consideration to which the entity expects to be entitled in exchange for those goods or services. The standard is effective for annual reporting periods beginning after December 15, 2016.2017.
In August 2015, the FASB issued ASU No. 2015-14, Revenue from Contracts with Customers - Deferral of the Effective Date. ASU No. 2015-14 defers the adoption date of ASU 2014-09, Revenue from Contracts with Customers in which both the FASB and IASB in a joint project will clarify the principles for recognizing revenue and to develop a common revenue standard. The guidance is to be applied using a retrospective approach at the beginning of the earliest comparative period in the financial statements and is effective for years beginning after December 15, 2017. Early adoption is permitted. The Company is still in the process of determining the effect that the adoption of ASU 2015-14 will have on the accompanying financial statements.
In July 2015, the FASB issued ASU 2015-11, Inventory: Simplifying the Measurement of Inventory. ASU No. 2015-11 provides authoritative guidance which requires a company to change its valuation method of inventory from the lower of cost or market (market being replacement cost, net realizable value or net realizable value less an approximate profit margin) to the lower of cost or net realizable value. The amendment is effective for fiscal years beginning after December 15, 2016, including interim periods within those fiscal years. The amendment should be applied prospectively with earlier application permitted as of the beginning of an interim or annual reporting period. The adoption of this amendment isdid not expected to have a material impact on the consolidated financial statements of the Company.
In September 2015, the FASB issued ASU No. 2015-16, Business Combinations. ASU 2015-16 provides authoritative guidance which will simplify the accounting for adjustments made to provisional amounts recognized in a business combination. U.S. GAAP currently requires that during the measurement period, the acquirer retrospectively adjust the provisional amounts recognized at the acquisition date with a corresponding adjustment to goodwill. The amendments require that the acquirer recognize adjustments to provisional amounts that are identified during the measurement period in the reporting period in which the adjustment amounts are determined. The amendments wereguidance is effective for Fiscal 2017, including interim periods.fiscal years beginning after December 15, 2015. The amendments should be applied prospectively to adjustments to provisional amounts that occur after the effective date with earlier application permitted for financial statements that have not yet been issued. The adoption of this amendment did not have a material impact on the consolidated financial statements of the Company.
64
The Eastern Company
Notes to Consolidated Financial Statements (continued)
11. Recent Accounting Pronouncements (continued)
In November 2015, the FASB issued accounting standards update 2015-07 which simplifies the balance sheet classification of deferred taxes. This standard requires that all deferred tax assets and liabilities be classified as non-current in the classified balance sheet, rather than separating such deferred taxes into current and non-current amounts, as is required under current guidance. The standard is effective for annual reporting periods beginning after December 15, 2016, including interim periods within that reporting period with early application permitted. The Company hasadoption of this amendment did not early adopted ASU 2015-17. This guidance will be effective forhave a material impact on the Company inconsolidated financial statements of the first quarter of 2017Company.
In February 2016, the FASB issued ASU No. 2016-02, Leases. ASU 2016-02 requires lesseesleases to present right-of-use assets and lease liabilities on the balance sheet for all leases with terms longer than 12 months. The guidance is to be applied using a modified retrospective approach at the beginning of the earliest comparative period in the financial statements and is effective for years beginning after December 15, 2019.2018. Early adoption is permitted. The Company is still inevaluating the process of determining the effect that the adoption of ASU 2016-02 will have on the accompanying financial statements.
In March 2016, the Financial Accounting Standards Board ("FASB") issued accounting standards update 2016-09 which simplifies employee share-based payment accounting. This standard will simplify the income tax consequences, accounting for forfeitures and classification on the statement of cash flows. This standard is effective for fiscal years, and interim periods within those fiscal years, beginning after December 15, 2016, with early adoption permitted. The Company did not early adopt ASU 2016-09. This guidance will be effective forThe adoption of this amendment did not have a material impact on the Company inconsolidated financial statements of the first quarter of 2017.Company.
In January 2017, the FASB issued ASU No. 2017-01, Business Combinations – Clarifying the Definition of a business. ASU 201-012017-01 provides guidance to assist entities with evaluating whether transactions should be accounted for as acquisitions or dispositions of assets or businesses. The amendment is effective for fiscal years beginning after December 15, 2017, including interim periods within those fiscal years. The amendment should be applied prospectively with earlier application permitted as of the beginning of an interim or annual reporting period. The Companyguidance is stillnot expected to have a material impact in the process of determining the effect that the adoption of ASU 2017-01 will have on the accompanyingconsolidated financial statements.results.
In January 2017, the FASB issued ASU No. 2017-04, Intangibles – Goodwill and Other: Simplifying the test for Goodwill Impairment. ASU 201-042017-04 provides guidance to simplify the subsequent measure of goodwill by eliminating Step 2 from the goodwill impairment test. The amendment is effective for fiscal years beginning after December 15, 2019, including interim periods within those fiscal years. The amendment should be applied prospectively with earlier application permitted as of the beginning of an interim or annual reporting period after January 1, 2017. The Companyguidance is stillnot expected to have a material impact in the process of determining the effect that the adoption of ASU 2017-04 will have on the accompanyingconsolidated financial statements.results.
In February 2017, the FASB issued ASU No. 2017-06, Plan Accounting: Defined Benefit Pension Plans (Topic 960); Defined Contribution Pension Plans (Topic 962); Health and Welfare Benefit Plans (Topic 965): Employee Benefit Plan Master Trust Reporting. ASU 201-062017-06 provides guidance for reporting by an employee benefit plan for its interest in a master trust. The amendment is effective for fiscal years beginning after December 15, 2019, including interim periods within those fiscal years.
The amendment should be applied retrospectively with earlier application permitted as of the beginning of an interim or annual reporting period after December 15, 2018. The Company is still in the process of determining the effect that the adoption of ASU 2017-06 will have on the accompanying financial statements.
12. Financial Instruments and Fair Value Measurements
Financial Risk Management Objectives and Policies
In March 2017, the FASB issued ASU No. 2017-07, Compensation — Retirement Benefits (Topic 715): Improving the Presentation of Net Periodic Pension Cost and Net Periodic Postretirement Benefit Cost. ASU 2017-07 provides guidance to update and primarily improve the presentation of net periodic pension cost and net periodic postretirement benefit cost reporting. The amendment is effective for fiscal years beginning after December 15, 2017, including interim periods within those fiscal years. The amendment should be applied retrospectively with earlier application permitted as of the beginning of an interim or annual reporting period after December 15, 2017. The Company is still in the process of determining the effect that the adoption of ASU 2017-07 will have on the accompanying financial statements.
65
The Eastern Company
Notes to Consolidated Financial Statements (continued)
12. FINANCIAL INSTRUMENTS AND FAIR VALUE MEASUREMENTS (continued)
The Company has implemented all new accounting pronouncements that are in effect and that could impact its consolidated financial statements and does not believe that there are any other new accounting pronouncements that have been issued, but are not yet effective, that might have a material impact on the consolidated financial statements of the Company.
The Company is exposed primarily to credit, interest rate and currency exchange rate risks which arise in the normal course of business.
Credit Risk
Credit risk is the potential financial loss resulting from the failure of a customer or counterparty to settle its financial and contractual obligations to the Company, as and when they become due. The primary credit risk for the Company is its accounts receivable accounts.due from customers. The Company has established credit limits for customers and monitors their balances to mitigate itsthe risk of loss. AtAs of December 31, 201630, 2017 and January 2,December 31, 2016, there were no significant concentrations of credit risk. No single customer represented more than 10% of totalthe Company's net accounts receivable as of December 30, 2017 or at December 31, 2016 and January 2, 2016. The maximum exposure to credit risk is primarily represented by the carrying amount of the Company’sCompany's accounts receivable.
Interest Rate Risk
Currency Exchange Rate Risk
The Company’sCompany's currency exposure is concentrated in the Canadian dollar, Mexican peso, New Taiwan dollar, Chinese RMB and the Hong Kong dollar. Because of the Company’sCompany's limited exposure to any single foreign market, any exchange gains or losses have not been material and are not expected to be material in the future. As a result, the Company does not attempt to mitigate its foreign currency exposure through the acquisition of any speculative or leveraged financial instruments.
Fair Value Measurements
Assets and liabilities that require fair value measurement are recorded at fair value using market and income valuation approaches and considering the Company’sCompany's and counterparty’scounterparty's credit risk. The Company uses the market approach and the income approach
to value assets and liabilities as appropriate. There were noThe assets or liabilities requiring fair value measurementmeasurements on December 31, 2016.30, 2017 are as follows:
| Fair Value | Level 1 | Level 2 | Level 3 | |||||||||||||
Financial Receivable Interest rate swap | $ | 67,350 | $ | — | $ | 67,350 | $ | — | ||||||||
| Total assets | $ | 67,350 | $ | — | $ | 67,350 | $ | — | ||||||||
The Company's interest rate swap is not an exchange-traded instrument. However, it is valued based on observable inputs for similar liabilities and accordingly is classified as Level 2. The amount of the interest rate swap is included in other accrued assets.
66
The Eastern Company
Notes to Consolidated Financial Statements (continued)
13. Selected Quarterly Financial Information (Unaudited)
| 2017 | ||||||||||||||||||||
| First | Second | Third | Fourth | Year | ||||||||||||||||
| Net sales | $ | 36,043,295 | $ | 58,044,743 | $ | 56,007,937 | $ | 54,143,638 | $ | 204,239,613 | ||||||||||
| Gross margin | 8,744,579 | 15,513,994 | 11,949,531 | 13,842,715 | 50,050,819 | |||||||||||||||
| Engineering expenses | 630,411 | 1,682,887 | 1,848,861 | 1,460,670 | 5,622,829 | |||||||||||||||
Selling and administrative expenses | 5,877,968 | 11,344,223 | 6,527,029 | 8,402,069 | 32,151,289 | |||||||||||||||
| Net (loss)/income | 1,517,141 | 1,466,402 | 2,230,481 | (168,769 | ) | 5,045,255 | ||||||||||||||
| Net (loss)/income per share: | ||||||||||||||||||||
| Basic | $ | .24 | $ | .23 | $ | .36 | $ | (.03 | ) | $ | .81 | |||||||||
| Diluted | $ | .24 | $ | .23 | $ | .35 | $ | (.03 | ) | $ | .80 | |||||||||
| Weighted average shares outstanding: | ||||||||||||||||||||
| Basic | 6,256,496 | 6,258,467 | 6,259,872 | 6,261,737 | 6,259,139 | |||||||||||||||
| Diluted | 6,256,496 | 6,285,339 | 6,296,551 | 6,297,371 | 6,294,773 | |||||||||||||||
| 2016 | ||||||||||||||||||||
| First | Second | Third | Fourth | Year | ||||||||||||||||
| Net sales | $ | 33,101,657 | $ | 36,883,312 | $ | 33,478,347 | $ | 34,144,942 | $ | 137,608,258 | ||||||||||
| Gross margin | 6,908,308 | 9,202,180 | 9,372,742 | 10,862,980 | 36,346,210 | |||||||||||||||
| Engineering expenses | 594,538 | 733,009 | 663,704 | 577,056 | 2,568,307 | |||||||||||||||
Selling and administrative expenses | 5,352,906 | 5,363,303 | 5,444,924 | 6,480,898 | 22,642,031 | |||||||||||||||
| Net income | 648,073 | 2,087,837 | 2,400,064 | 2,649,349 | 7,785,323 | |||||||||||||||
| Net income per share: | ||||||||||||||||||||
| Basic | $ | .10 | $ | .33 | $ | .38 | $ | .42 | $ | 1.25 | ||||||||||
| Diluted | $ | .10 | $ | .33 | $ | .38 | $ | .42 | $ | 1.25 | ||||||||||
| Weighted average shares outstanding: | ||||||||||||||||||||
| Basic | 6,248,222 | 6,250,610 | 6,252,681 | 6,254,605 | 6,251,535 | |||||||||||||||
| Diluted | 6,248,222 | 6,250,610 | 6,252,681 | 6,254,605 | 6,251,535 | |||||||||||||||
Fiscal 2017 and 2016 consisted of four 13 week quarters totaling 52 weeks for the year.
14. Revenue Recognition
In 2014, the FASB issued guidance on revenue recognition, with final amendments issued in 2016. The guidance provides for a five-step model to determine the revenue recognized for the transfer of goods or services to customers that reflects the expected entitled consideration in exchange for those goods or services. It also provides clarification for principal versus agent considerations and identifying performance obligations. In addition, the FASB introduced practical expedients related to disclosures of remaining performance obligations, as well as other amendments related to guidance on collectability, non-cash consideration and the presentation of sales and other similar taxes. Financial statement disclosures required under the guidance will enable users to understand the nature, amount, timing, judgments and uncertainty of revenue and cash flows relating to customer contracts.
67
The Eastern Company
Notes to Consolidated Financial Statements (continued)
14. Selected Quarterly Financial Information (Unaudited)REVENUE RECOGNION (continued)
| 2016 | ||||||||||||||||
| First | Second | Third | Fourth | Year | ||||||||||||
| Net sales | $ | 33,101,657 | $ | 36,883,312 | $ | 33,478,347 | $ | 34,144,942 | $ | 137,608,258 | ||||||
| Gross margin | 6,420,446 | 8,601,603 | 8,852,878 | 10,417,944 | 34,292,871 | |||||||||||
Selling and administrative expenses | 5,459,582 | 5,495,735 | 5,588,764 | 6,612,918 | 23,156,999 | |||||||||||
| Net income | 648,073 | 2,087,837 | 2,400,064 | 2,649,349 | 7,785,323 | |||||||||||
| Net income per share: | ||||||||||||||||
| Basic | $ | .10 | $ | .33 | $ | .38 | $ | .42 | $ | 1.25 | ||||||
| Diluted | $ | .10 | $ | .33 | $ | .38 | $ | .42 | $ | 1.25 | ||||||
| Weighted average shares outstanding: | ||||||||||||||||
| Basic | 6,248,222 | 6,250,610 | 6,252,681 | 6,254,605 | 6,251,535 | |||||||||||
| Diluted | 6,248,222 | 6,250,610 | 6,252,681 | 6,254,605 | 6,251,535 | |||||||||||
| 2015 | ||||||||||||||||
| First | Second | Third | Fourth | Year | ||||||||||||
| Net sales | $ | 36,876,842 | $ | 37,037697 | $ | 36,239,500 | $ | 34,413,912 | $ | 144,567,951 | ||||||
| Gross margin | 7,335,178 | 7,912,161 | 9,033,843 | 8,100,044 | 32,381,226 | |||||||||||
Selling and administrative expenses | 5,963,695 | 7,056,139 | 5,584,222 | 5,749,422 | 24,353,498 | |||||||||||
| Net (loss)/income | 873,951 | 584,594 | 2,527,722 | 1,740,776 | 5,727,043 | |||||||||||
| Net (loss)/income per share: | ||||||||||||||||
| Basic | $ | .14 | $ | .09 | $ | .41 | $ | .28 | $ | .92 | ||||||
| Diluted | $ | .14 | $ | .09 | $ | .41 | $ | .28 | $ | .92 | ||||||
| Weighted average shares outstanding: | ||||||||||||||||
| Basic | 6,244,088 | 6,244,051 | 6,245,099 | 6,246,571 | 6,245,057 | |||||||||||
| Diluted | 6,244,088 | 6,244,051 | 6,245,099 | 6,246,571 | 6,245,057 | |||||||||||
new requirements to our revenue contracts. We are substantially complete with our contract and business process reviews and implemented changes to our controls to support recognition and disclosures under the new guidance. Based on the foregoing, we currently do not expect this guidance to have a material impact on our financial statements or disclosures.
68
Report of Independent Registered Public Accounting Firm
To the Board of Directors and Shareholders of
The Eastern Company
Naugatuck, Connecticut
Opinion on the Financial Statements
We have audited the accompanying consolidated balance sheets of The Eastern Company (the Company) as of December 31, 201630, 2017 and January 2,December 31, 2016, and the related consolidated statements of income, comprehensive income, stockholders’stockholders' equity, and cash flows for each of the years in the three-year period ended December 31, 2016. The Company’s management is responsible for these consolidated financial statements. Our responsibility is30, 2017, and the related notes and schedules (collectively referred to express an opinion on these consolidated financial statements based on our audits.
statements). In our opinion, the consolidated financial statements referred to above present fairly, in all material respects, the financial position of the Company as of December 31, 201630, 2017 and January 2,December 31, 2016, and the results of its operations and its cash flows for each of the years in the three-year period ended December 31, 2016,30, 2017, in conformity with accounting principles generally accepted in the United States of America.
We also have audited, in accordance with the standards of the Public Company Accounting Oversight Board (United States) (PCAOB), the Company’sCompany's internal control over financial reporting as of December 31, 2016,30, 2017, based on criteria established in Internal Control—Integrated Framework (2013) issued by the Committee of Sponsoring Organizations of the Treadway Commission (COSO), and our report dated March 15, 2017,2018 expressed an unqualified opinion.
Basis for Opinion
These financial statements are the responsibility of the Company's management. Our responsibility is to express an opinion on the Company's financial statements based on our audits. We are a public accounting firm registered with the PCAOB and are required to be independent with respect to the Company in accordance with the U.S. federal securities laws and the applicable rules and regulations of the Securities and Exchange Commission and the PCAOB.
We conducted our audits in accordance with the standards of the PCAOB. Those standards require that we plan and perform the audits to obtain reasonable assurance about whether the financial statements are free of material misstatement, whether due to error or fraud. Our audits included performing procedures to assess the risks of material misstatement of the financial statements, whether due to error or fraud, and performing procedures that respond to those risks. Such procedures included examining, on a test basis, evidence regarding the amounts and disclosures in the financial statements. Our audits also included evaluating the accounting principles used and significant estimates made by management, as well as evaluating the overall presentation of the financial statements. We believe that our audits provide a reasonable basis for our opinion.
/s/Fiondella, Milone & LaSaracina LLPLLC
Fiondella, Milone & LaSaracina LLP
LLC
LLC
We have served as the Company's auditor since 2009.
Glastonbury, Connecticut
March 15, 20172018
69
None.
Evaluation of Disclosure Controls and Procedures
As of the end of the fiscal year ended December 31, 2016,30, 2017, the Company carried out an evaluation, under the supervision and with the participation of the Company’sCompany's management, including the Chief Executive Officer (the “CEO”), Chief Operating Officer (“COO”"CEO") and Chief Financial Officer (the “CFO”"CFO"), of the effectiveness of the design and operation of the Company’sCompany's disclosure controls and procedures pursuant to Exchange Act Rule 240.13a-15. As defined in Exchange Act Rules 240.13a-15(e) and 240.15d-15(e), “the"the term disclosure controls and procedures means controls and other procedures of an issuer that are designed to ensure that information required to be disclosed by the issuer in the reports that it files or submits under the Exchange Act (15 U.S.C. 78a et seq.) is recorded, processed, summarized and reported, within the time periods specified in the Commission'sSEC's rules and forms. Disclosure controls and procedures include, without limitation, controls and procedures designed to ensure that information required to be disclosed by an issuer in the reports that it files or submits under the Exchange Act is accumulated and communicated to the issuer's management, including its principal executive and principal financial officers, or persons performing similar functions, as appropriate to allow timely decisions regarding required disclosure.”" Based upon that evaluation, the CEO COO and CFO concluded that the Company’sCompany's current disclosure controls and procedures were effective as of the December 31, 201630, 2017 evaluation date.
The Company believes that a controls system, no matter how well designed and operated, cannot provide absolute assurance that the objectives of the controls system are met, and no evaluation of controls can provide absolute assurance that all control issues and instances of fraud, if any, within a company have been detected. The Company’sCompany's disclosure controls and procedures are designed to provide reasonable assurance of achieving their objectives, and the CEO COO and CFO have concluded that these controls and procedures are effective at the “reasonable assurance”"reasonable assurance" level.
The Company’sCompany's management is responsible for establishing and maintaining adequate internal control over financial reporting, as such term is defined in Exchange Act Rules 240.13a-15(f) and 240.15d-15(f)., Under the supervision and with the participation of our management, including theour CEO COO and CFO, we conducted an evaluation of the effectiveness of our internal control over financial reporting based on the framework in Internal Control -– Integrated Frameworkissued in 2013 by the Committee of Sponsoring Organizations of the Treadway Commission (COSO).Commission. Based on our evaluation under thethis framework, in Internal Control — Integrated Framework, our management concluded that our internal control over financial reporting was effective as of December 31, 2016.
Changes in Internal Control over Financial Reporting
70
Report of Independent Registered Public Accounting Firm
To the Board of Directors and Shareholders of
The Eastern Company
Naugatuck, Connecticut
Opinion on Internal Control over Financial Reporting
We have audited The Eastern Company’sCompany's (the Company)Company's) internal control over financial reporting as of December 31, 2016,30, 2017, based on criteria established in Internal Control—Integrated Framework (2013) issued by the Committee of Sponsoring Organizations of the Treadway Commission (COSO). In our opinion, the Company maintained, in all material respects, effective internal control over financial reporting as of December 30, 2017, based on criteria established in Internal Control—Integrated Framework (2013) issued by COSO.
We also have audited, in accordance with the standards of the Public Company Accounting Oversight Board (United States) (PCAOB), the consolidated balance sheets and the related consolidated statements of income, comprehensive income, stockholders' equity, and cash flows of the Company, and our report dated March 15, 2018, expressed an unqualified opinion.
Basis for Opinion
The Company’sCompany's management is responsible for maintaining effective internal control over financial reporting, and for its assessment of the effectiveness of internal control over financial reporting, included in the accompanying Management’sManagement's Report on Internal Control over Financial Reporting under Item 9A. Our responsibility is to express an opinion on the Company’sCompany's internal control over financial reporting based on our audit.
We are a public accounting firm registered with the PCAOB and are required to be independent with respect to the Company in accordance with the U.S. federal securities laws and the applicable rules and regulations of the Securities and Exchange Commission and the PCAOB.
We conducted our audit in accordance with the standards of the Public Company Accounting Oversight Board (United States).PCAOB. Those standards require that we plan and perform the audit to obtain reasonable assurance about whether effective internal control over financial reporting was maintained in all material respects. Our audit of internal control over financial reporting included obtaining an understanding of internal control over financial reporting, assessing the risk that a material weakness exists, and testing and evaluating the design and operating effectiveness of internal control based on the assessed risk. Our audit also included performing such other procedures as we considered necessary in the circumstances. We believe that our audit provides a reasonable basis for our opinion.
Definition and Limitations of Internal Control over Financial Reporting
A company’scompany's internal control over financial reporting is a process designed to provide reasonable assurance regarding the reliability of financial reporting and the preparation of financial statements for external purposes in accordance with generally accepted accounting principles. A company’scompany's internal control over financial reporting includes those policies and procedures that (1) pertain to the maintenance of records that, in reasonable detail, accurately and fairly reflect the transactions and dispositions of the assets of the company; (2) provide reasonable assurance that transactions are recorded as necessary to permit preparation of financial statements in accordance with generally accepted accounting principles, and that receipts and expenditures of the company are being made only in accordance with authorizations of management and directors of the company; and (3) provide reasonable assurance regarding prevention or timely detection of unauthorized acquisition, use, or disposition of the company’scompany's assets that could have a material effect on the financial statements.
Because of its inherent limitations, internal control over financial reporting may not prevent or detect misstatements. Also, projections of any evaluation of effectiveness to future periods are subject to the risk that controls may become inadequate because of changes in conditions, or that the degree of compliance with the policies or procedures may deteriorate.
/s/Fiondella, Milone & LaSaracina LLPLLC
Fiondella, Milone & LaSaracina LLP
LaSarcina LLC
LaSarcina LLC
Glastonbury, Connecticut
March 15, 20172018
71
None.
The Registrant’sCompany's definitive proxy statement (“("Proxy Statement”Statement") for the 20172018 Annual Meeting of Shareholders, which is incorporated herein by reference, will be filed with the SEC pursuant to Regulation 14A not later than 120 days after December 31, 2016.30, 2017.
The information concerning directors is incorporated herein by reference to ourthe Company's Proxy Statement under the captions “Item"Item No. 1 – Election of Directors”Directors" and “Director"Director Compensation in Fiscal 2016”Year 2017".
The information concerning ourthe Company's executive officers is incorporated herein by reference to ourthe Company's Proxy Statement under the captions “Compensation"Compensation Discussion and Analysis”Analysis", “Compensation"Compensation Committee Report”Report", “Compensation"Compensation Committee Interlocks and Insider Participation”Participation", “Executive Compensation”"Executive Compensation", “Stock Options”"Stock Options", “Options"Options Exercised in Fiscal 2016”2017", “Outstanding"Outstanding Equity Awards at Fiscal 2016 Year-End”2017 Year-End", and “Termination"Termination of Employment and Change in Control Arrangements”Arrangements". The Registrant’sCompany's only Named Executive Officers are August M. Vlak, President and Chief Executive Officer, Angelo M. Labbadia, Vice President and Chief Operating Officer and John L. Sullivan III, Vice President and Chief Financial Officer.Officer and Angelo M. Labbadia, Vice President and Group Vice President. Our executive officers, as such term is defined in Rule 3b-7 of the Exchange Act, consist of August M. Vlak, , President and Chief Executive Officer, John L. Sullivan III, Vice President and Chief Financial Officer and Angelo M. Labbadia, Vice President and Group Vice President.
The information concerning ourthe Company's Audit Committee is incorporated herein by reference to ourthe Company's Proxy Statement under the captions “Audit"Audit Committee Financial Expert”Expert", “Report"Report of the Audit Committee”Committee" and “The"The Board of Directors and Committees”Committees". The Audit Committee Charter is also available on the Company’sCompany's website athttp://www.easterncompany.comby clicking on Corporate Governance.
The information concerning compliance with Section 16(a) of the Securities Exchange Act is incorporated herein by reference to our Proxy Statement under the caption “Section"Section 16(a) Beneficial Ownership Reporting Compliance”Compliance".
The Company’sCompany's Board of Directors has adopted a Code of Business Conduct and Ethics that applies to ourthe Company's Chief Executive Officer, Chief Operating Officer, Chief Financial Officer and the Company’sCompany's other financial professionals. The Code of Business Conduct and Ethics is available on the Company’sCompany's website at http://www.easterncompany.com by clicking on Corporate Governance.
Information concerning director and executive compensation is incorporated herein by reference to portions of the Company’sCompany's Proxy Statement to be filed with the SEC pursuant to Regulation 14A not later than 120 days after December 31, 2016,30, 2017 under the captions “Director"Director Compensation in Fiscal 2016”Year 2017", “Compensation"Compensation Discussion and Analysis”Analysis", “Compensation"Compensation Committee Report”Report", “Compensation"Compensation Committee Interlocks and Insider Participation”Participation", “Executive Compensation”"Executive Compensation", “Stock Options”"Stock Options", “Options"Options Exercised in Fiscal 2016”Year 2017", “Outstanding"Outstanding Equity Awards at Fiscal 2016 Year-End”2017 Year-End", “Termination"Termination of Employment and Change in Control Arrangements”Arrangements", and “Risk"Risk Assessment of Compensation Policies and Practices”Practices". The Compensation Committee of the Board of Directors operates under the Compensation Committee Charter, which can be found on the Company’sCompany's website at http://www.easterncompany.com by clicking on Corporate Governance.
72
| ITEM 12 | SECURITY OWNERSHIP OF CERTAIN BENEFICIAL OWNERS AND MANAGEMENT AND RELATED STOCKHOLDER MATTERS |
Security ownership of certain beneficial owners and management:
| (a) | Information concerning security ownership of certain beneficial owners is incorporated herein by reference to the Company's Proxy Statement to be filed with the SEC pursuant to Regulation 14A not later than 120 days after December |
| (b) | Information concerning security ownership of management is incorporated herein by reference to the Company's Proxy Statement to be filed with the SEC pursuant to Regulation 14A not later than 120 days after December |
| (c) | Changes in Control |
None.
Information regarding certain relationships and related transactions is incorporated herein by reference to ourthe Company's Proxy Statement to be filed with the SEC pursuant to Regulation 14A not later than 120 days after December 31, 201630, 2017 under the caption “Policies"Policies and Procedures Concerning Related Persons Transactions”Transactions".
Information regarding director independence is incorporated herein by reference to ourthe Company's Proxy Statement to be filed with the SEC pursuant to Regulation 14A not later than 120 days after December 31, 201630, 2017 under the captions “Item"Item No.1 – Election of Directors”Directors" and “The"The Board of Directors and Committees”Committees".
Information concerning principal accountant fees and services is incorporated herein by reference to ourthe Company's Proxy Statement to be filed with the SEC pursuant to Regulation 14A not later than 120 days after December 31, 201630, 2017 under the caption “Item"Item No. 3 – Ratification of Appointment of Independent Registered Public Accounting Firm”Firm".
(a)Documents filed as part of this report:Form 10-K:
| (1) | Financial statements | |||
| Consolidated Balance Sheets — December 30, 2017 and December 31, 2016…………… | 28. | |||
| Consolidated Statements of Income — Fiscal years ended December 30, 2017, | ||||
| December 31, | 30. | |||
| Consolidated Statements of Comprehensive Income — Fiscal years ended | ||||
| December 30, 2017, December 31, 2016 and January 2, | 30. | |||
| Consolidated Statements of | ||||
| December 30, 2017, December 31, 2016 and January 2, | 31. | |||
| Consolidated Statements of Cash | ||||
| December 31, | 32. | |||
| Notes to Consolidated Financial Statements………………………………………………… | 33. | |||
| Report of Independent Registered Public Accounting Firm…………………………………. | 57. | |||
73
(2)Financial Statement Schedules
Schedule II — Valuation and qualifying accounts ................................................................................. 64.
begins on page [64] of this Form 10-K. Schedules other than that listed above have been omitted because the required information is contained in the financial statements and notes thereto, or because such schedules are not required or applicable.
| Exhibit No. | Description | |
| 2.1 | Securities Purchase Agreement, dated April 3, 2017, by |
| 3.1 | Restated Certificate of Incorporation, dated August 4, 1991 (filed herewith). | |
| 3.2 | Certificate of Amendment to the |
| 3.4 | Amendment to the Company's Amended and Restated By-Laws, dated April 27, 2016 (incorporated herein by reference to Exhibit 3.1 to the Company's Current Report on Form 8-K (SEC File No. 001-35383) filed on April 29, 2016). | |
| 10.1* | Change in Control Agreement, dated as of January 1, 2015, between the Company and Angelo M. Labbadia (incorporated by reference to Exhibit 10.F to the Company's Annual Report on Form 10-K (SEC File No. 001-35383), filed on March 15, 2016). | |
| 10.2* | Change in Control Agreement, dated as of January 1, 2015, between the Company and John L. Sullivan III (incorporated herein by reference to Exhibit 99 to the Company's Current Report on Form 8-K (SEC File No. 001-35383), filed on March 3, 2015). | |
| 10.3* | Amended and Restated Employment Agreement, dated as of January 1, 2018, between the Company and August M. Vlak (incorporated herein by reference to Exhibit 10.1 to the Company's Current Report on Form 8-K (SEC File No. 001-35383), filed January 22, 2018). | |
| 10.4* | The Company's Directors' Fee Program, effective as of October 1, 1996 (incorporated herein by reference to the Company's Registration Statement on Form S-8, as amended (SEC File No. 333-21351) filed on February 7, 1997). | |
| 10.5* | The Company's 2010 Executive Stock Incentive Plan, effective July 20, 2010 (incorporated herein by reference to Exhibit 4a to the Company's Registration Statement on Form S-8 (SEC File No. 333-169169), filed on September 2, 2010). | |
| 23 | Consent of Fiondella, Milone & LaSaracina LLP (filed herewith). | |
| 31 | Rule 13a-14(a) Certification of Chief Executive Officer and Chief Financial Officer of the Company in accordance with Section 302 of the Sarbanes-Oxley Act of 2002 (filed herewith). |
| 32 | Section 1350 Certification of Chief Executive Officer and Chief Financial Officer of the Company in accordance with Section 906 of the Sarbanes-Oxley Act of 2002 (filed herewith). |
| Exhibit No. | Description | |
| 99 | Letter to our shareholders from the Annual Report 2017 (filed herewith). | |
| 101 | The following materials from the Company's Annual Report on Form 10-K for the year ended December 30, 2017, formatted in Extensible Business Reporting Language (XBRL): (i) the Consolidated Balance Sheets as of December 30, 2017 and December 31, 2016; (ii) the Consolidated Statements of Income for the fiscal years ended December 30, 2017, December 31, 2016 and January 2, 2016; (iii) the Consolidated Statements of Comprehensive Income for the fiscal years ended December 30, 2017, December 31, 2016 and January 2, 2016; (iv) the Consolidated Statements of Shareholders' Equity for the fiscal years ended December 30, 2017, December 31, 2016 and January 2, 2016; (v) the Consolidated Statements of Cash Flows for the fiscal years ended December 30, 2017, December 31, 2016 and January 2, 2016; and (vi) the Notes to the Consolidated Financial Statements (filed herewith). |
* Management contract, compensatory plan or arrangement.
** Exhibits to this Form 10-K listed but not included herein will be provided upon written request sent to the Company's executive offices.
74
The Eastern Company and Subsidiaries
Schedule II – Valuation and Qualifying accounts
| COL. A | COL. B | COL. C | COL. D | COL. E | COL. B | COL. C | COL. D | COL. E | ||
| ADDITIONS | ADDITIONS | |||||||||
| Description | Balance at Beginning of Period | (1) Charged to Costs and Expenses | (2) Charged to Other Accounts-Describe | Deductions – Describe | Balance at End of Period | Balance at Beginning of Period | (1) Charged to Costs and Expenses | (2) Charged to Other Accounts-Describe | Deductions – Describe | Balance at End of Period |
Fiscal year ended December 30, 2017: Deducted from asset accounts: Allowance for doubtful accounts | $430,000 | $ 87,000 | $ 64,000 | $ 111,000 (a) | $470,000 | |||||
Fiscal year ended December 31, 2016: Deducted from asset accounts: Allowance for doubtful accounts | $450,000 | $ 0 | $ 20,000 (a) | $430,000 | $450,000 | $ 0 | $ 20,000 (a) | $430,000 | ||
Fiscal year ended January 2, 2016: Deducted from asset accounts: Allowance for doubtful accounts | $414,000 | $ 52,144 | $ 16,144 (a) | $450,000 | $414,000 | $ 52,000 | $ 16,000 (a) | $450,000 | ||
Fiscal year ended January 3, 2015: Deducted from asset accounts: Allowance for doubtful accounts | $410,000 | $ 71,927 | $ 67,927 (a) | $414,000 | ||||||
(a) Uncollectible accounts written off, net of recoveries.
75
Pursuant to the requirements of Section 13 or 15(d) of the Securities Exchange Act of 1934, the Registrant has duly caused this report to be signed on its behalf by the undersigned, thereunto duly authorized.
| Dated: March 15, | THE EASTERN COMPANY |
By /s/ John L. Sullivan III John L. Sullivan III Vice President and Chief Financial Officer |
Pursuant to the requirements of the Securities Exchange Act of 1934, this report has been signed below by the following persons on behalf of the Registrant and in the capacities and on the dates indicated.
/s/ August M. Vlak | March 15, | |
August M. Vlak President and Chief Executive Officer | ||
/s/ John L. Sullivan III | March 15, | |
John L. Sullivan III Vice President and Chief Financial Officer | ||
/s/ | March 15, | |
Chairman of the Board | ||
/s/ Fredrick D. DiSanto | March 15, | |
Fredrick D. DiSanto Director | ||
/s/ John W. Everets | March 15, | |
John W. Everets Director | ||
/s/ Charles W. Henry | March 15, | |
Charles W. Henry Director | ||
/s/ Michael A. McManus | March 15, | |
Michael A. McManus Director | ||
76